1 DMAIC Problem Solving Process Prior to this Lecture: Please Review Case Study – “Life of a Mortgage Loan”

Welcome message from author
This document is posted to help you gain knowledge. Please leave a comment to let me know what you think about it! Share it to your friends and learn new things together.
Transcript

1
DMAIC Problem Solving Process
Prior to this Lecture: Please Review Case Study –“Life of a Mortgage Loan”
2
Topics
I. Problem Solving Methodsn Six Sigma Process: DMAIC
II. Applying DMAIC
III. Selection of tools and methods
IV. Case Study – “Life of a Mortgage Loan”

3
I. Problem Solving Methods
n Most companies find it useful to utilize a generic problem-solving process to successfully execute improvement projects.
n Some commonly used processes:n Six Sigma: DMAIC ~ Define – Measure – Analyze –
Improve – Control n TQM: PDCA ~ Plan – Do – Check – Actn TQM: Storyboardsn Red X Strategyn Engineering Method
4
DMAIC Problem Solving Method
n DMAIC (“deh-MAY-ihk”)n Define – identify improvement opportunity.n Measure – measure current state of process.n Analyze – identify causes of variation/ defects. n Improve – develop and implement solutions.n Control – install controls to prevent future defects.
n Like many other methods, DMAIC provides a robust structure to problem solving.
5
D M A I C Methodn Define
n Define customers and their requirements.n Define project boundaries (project scope).n Create a Process Map (e.g., flow chart) of the
process to be improved.n Identify project support people (operators,
engineers, supervisors, finance)n Obtain commitment from your supervisor to free up
resources and block off time to work on projects.n Rule of thumb: budget 2x expected time.
6
D M A I C Methodn Measure
n OBSERVE THE PROCESS.n Create process maps (flow charts), paying close attention to
critical-to-quality processes and value-added (VA) vs. non-value added (NVA) tasks.
n Collect data and assess “Current State of the Process”n Current State Measures: Yield, Defects Per Million (DPM), or (DPMO)
Opportunities, Lead-time, Process-time, cost
n Develop data collection plan (identify key variables)n Assess measurement system or data collection abilityn Identify Quality Targets or Desired Level of Improvement for
Metrics
7
Measure Phase – Key Elements
n Six Sigma Reports Typically Include:n Quantification of Current Performance Level
n Example: Current Order Process time <= 15 days n Description of Key Process Input and Output Variables
to be examinedn Validation evidence of measurement system(s) to be
used to collect datan Identification of Target Performance Level
n Example: Target Order Process Time <= 7 days
8
D M A I C Method
n Analyze –n Identify gaps between current performance level and targets
(goals).n Identify sources of variation / causes of defects or
nonconformities.n Identify the “vital few” key process input variables that affect
key outputs (“Find the knobs”).n Use simple analysis tools first; apply complex tools as
necessary. Be careful of too much data.n This course is intended to help you “Expand your Toolbox”
9
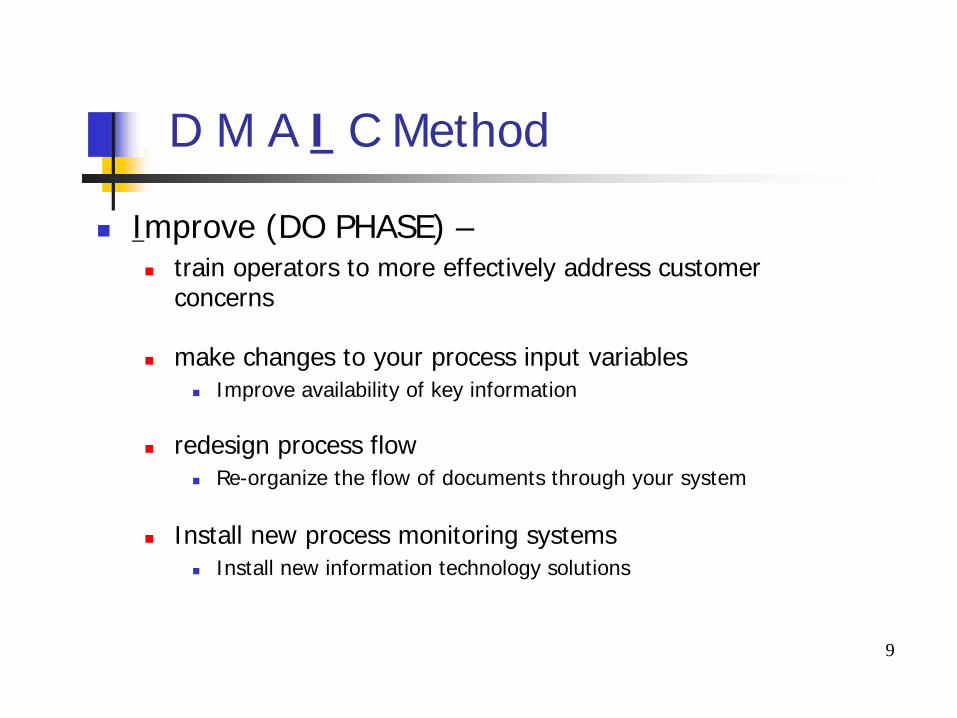
D M A I C Method
n Improve (DO PHASE) –n train operators to more effectively address customer
concerns
n make changes to your process input variablesn Improve availability of key information
n redesign process flown Re-organize the flow of documents through your system
n Install new process monitoring systemsn Install new information technology solutions
10
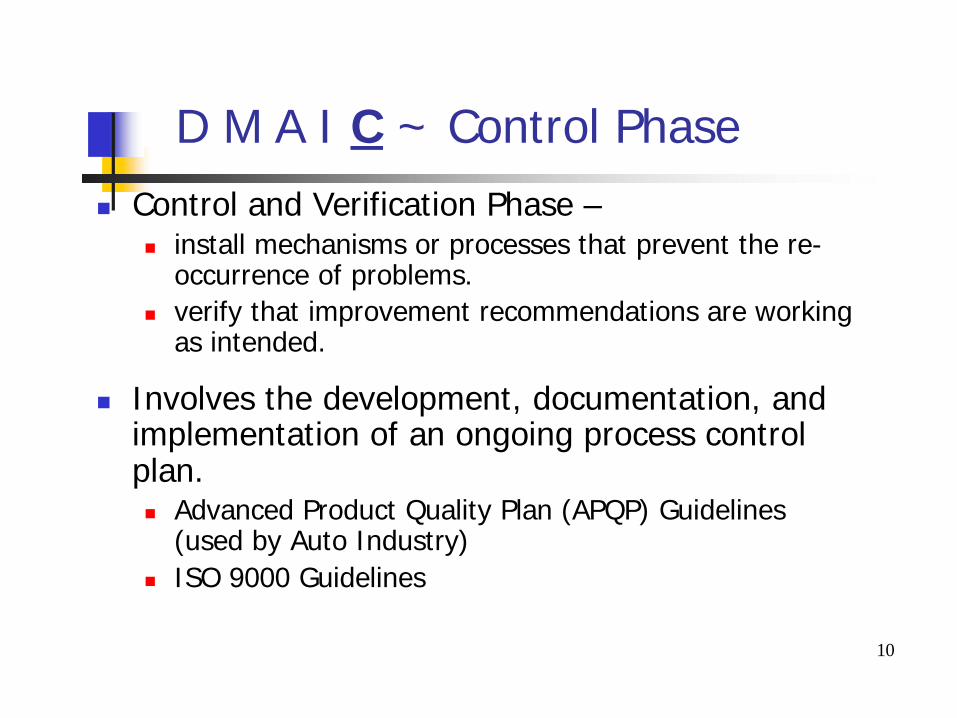
D M A I C ~ Control Phase
n Control and Verification Phase –n install mechanisms or processes that prevent the re-
occurrence of problems.n verify that improvement recommendations are working
as intended.
n Involves the development, documentation, and implementation of an ongoing process control plan. n Advanced Product Quality Plan (APQP) Guidelines
(used by Auto Industry)n ISO 9000 Guidelines
11
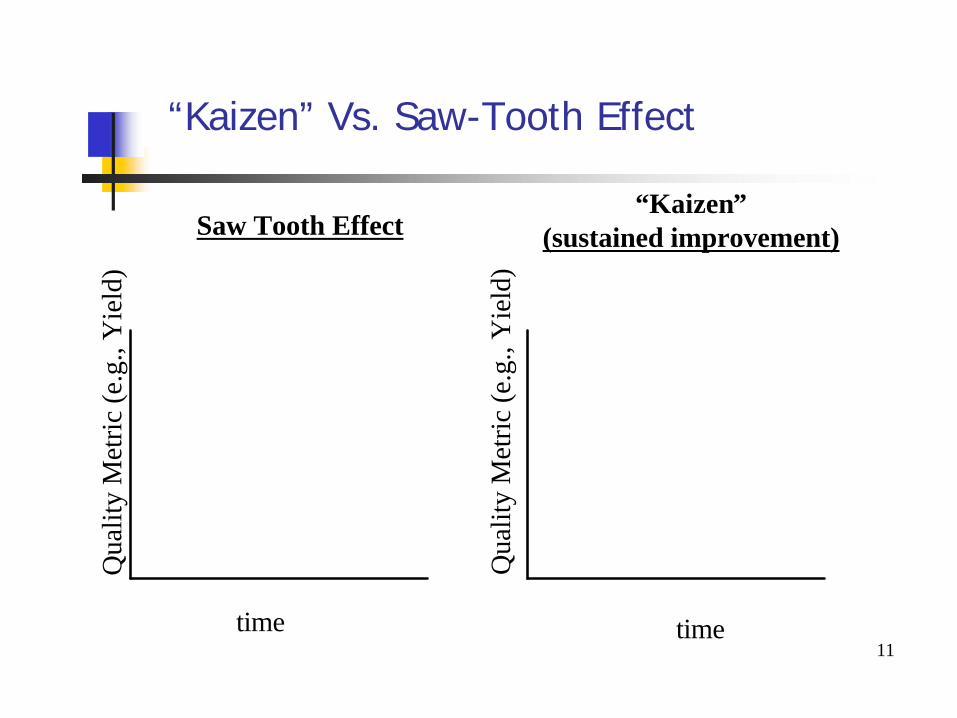
“Kaizen” Vs. Saw-Tooth EffectQ
ualit
y M
etric
(e.g
., Y
ield
)
Qua
lity
Met
ric (e
.g.,
Yie
ld)
time time
Saw Tooth Effect“Kaizen”
(sustained improvement)

12
“Kaizen” Vs. Saw-Tooth EffectQ
ualit
y M
etric
(e.g
., Y
ield
)
Qua
lity
Met
ric (e
.g.,
Yie
ld)
time time
Saw Tooth Effect“Kaizen”
(sustained improvement)
Lack of SustainedImprovement
13
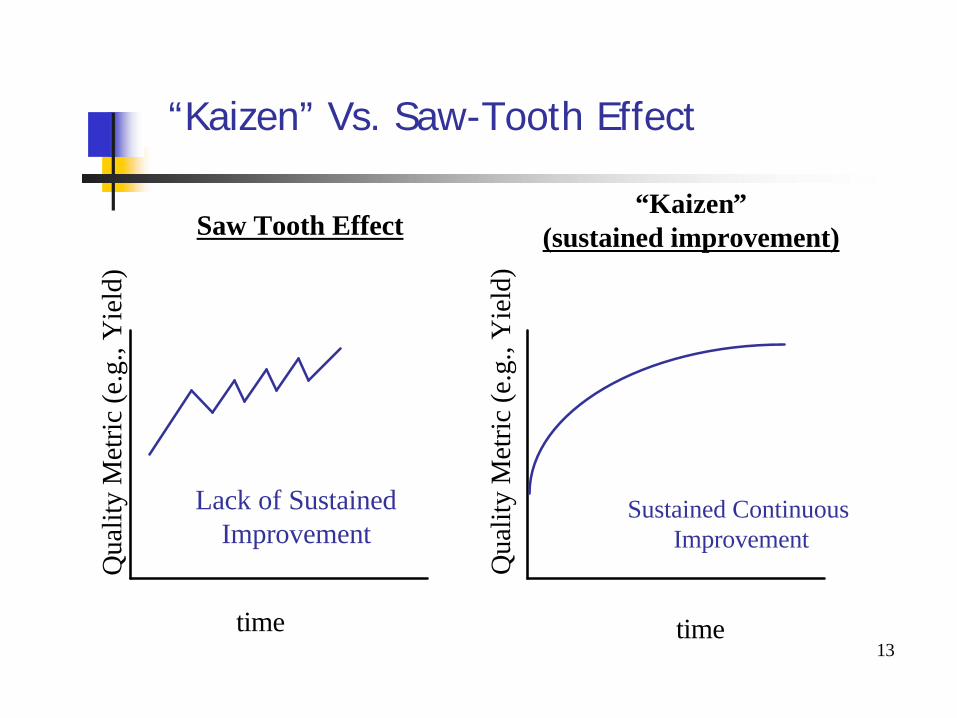
“Kaizen” Vs. Saw-Tooth EffectQ
ualit
y M
etric
(e.g
., Y
ield
)
Qua
lity
Met
ric (e
.g.,
Yie
ld)
time time
Saw Tooth Effect“Kaizen”
(sustained improvement)
Lack of SustainedImprovement
Sustained Continuous Improvement
14
II. Applying DMAICn Six sigma methods have proven effective for
both:n Process Improvement ~ resolving current problems.n Process Design / Redesign ~ preventing problems
from occurring (“Design for Six Sigma”). n For re-design, many advocate DMADV
(Define-Measure-Analyze-Design-Verify)
n Both applications involve:1) identifying relationships between process outputs (Y’s)
and process inputs (X’s) 2) Controlling, minimizing, or managing the variation in
the X’s to improve the performance of the Y’s
15
Types of Problemsn Sporadic Problems – exist when unexpected
changes in normal process operations occur (special cause variation).n Typical Solution: bring process back to normal
operating level and maintain control.
n Chronic Problems – exist when processes normally operate at an unacceptable level of common cause variation.n Typical Solution: fundamentally change/ re-design
the process. NOTE: Solving these problems often have a greater impact !!.
16
DMAIC: Basic Execution Stepsn Identify a critical process output variable (KPOV).
n From current performance data, QFD exercise, FMEA exercise, or Operations Analysis (bottleneck analysis).
n Assess the current state of your process n Measure DPM/DPMO, Processing Timen Describe existing data (Use Descriptive Statistics, Stratification
Analysis, Distribution Analysis: Normal, Exponential)n Identify key input variables that might affect outputsn Analyze input-output (X,Y) relationships (approach based on type
of data available)n Draw conclusions from the data analysis and make
recommendations.n Implement the improvement suggestion and Verify results.n Establish a control plan to prevent problem from reoccurring.
17
III. Selection of Tools and Six Sigma Analysis Method
n The selection of analysis tools and type of Six Sigma process analysis used depends largely on:n Type of Data you collect or have
n Qualitative Data and Quantitative Data
n Data Collection ApproachA. Observational StudyB. Designed Experiment
n Single Variable Experiment (e.g., Control Vs. Test Group)
n Multi-Variable Design of Experiment
18
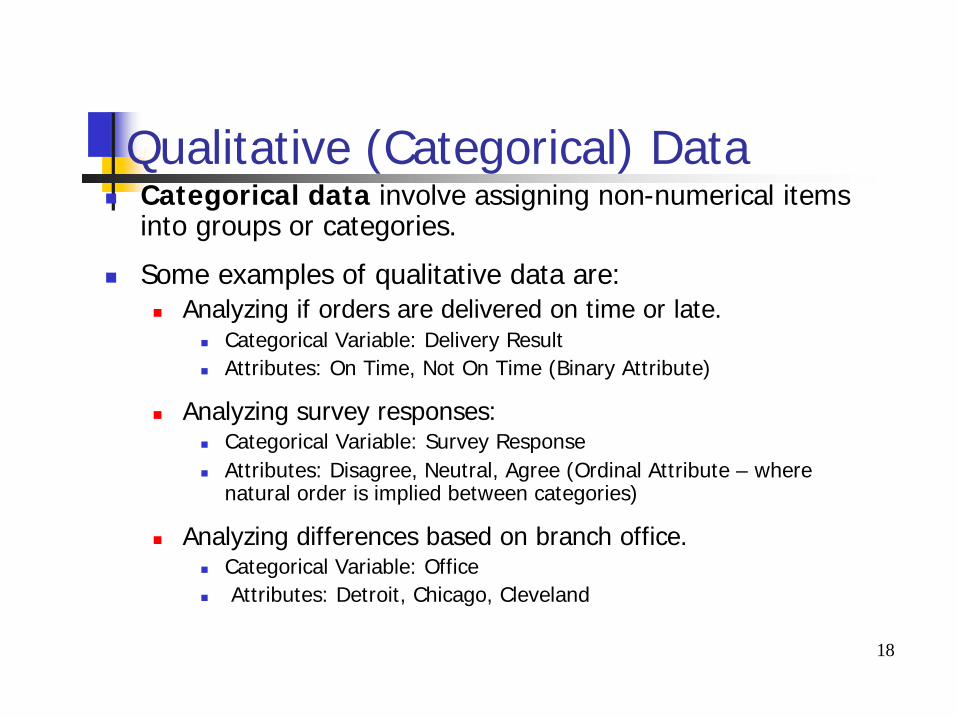
Qualitative (Categorical) Datan Categorical data involve assigning non-numerical items
into groups or categories.
n Some examples of qualitative data are:n Analyzing if orders are delivered on time or late.
n Categorical Variable: Delivery Resultn Attributes: On Time, Not On Time (Binary Attribute)
n Analyzing survey responses: n Categorical Variable: Survey Responsen Attributes: Disagree, Neutral, Agree (Ordinal Attribute – where
natural order is implied between categories)
n Analyzing differences based on branch office. n Categorical Variable: Office n Attributes: Detroit, Chicago, Cleveland
19
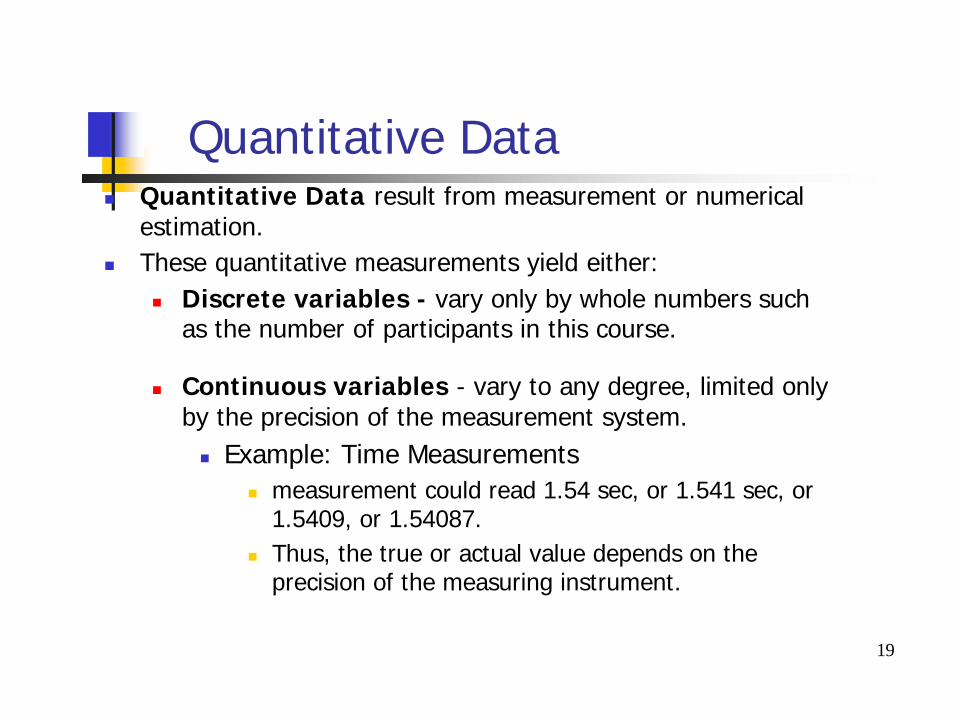
Quantitative Datan Quantitative Data result from measurement or numerical
estimation. n These quantitative measurements yield either:
n Discrete variables - vary only by whole numbers such as the number of participants in this course.
n Continuous variables - vary to any degree, limited only by the precision of the measurement system. n Example: Time Measurements
n measurement could read 1.54 sec, or 1.541 sec, or 1.5409, or 1.54087.
n Thus, the true or actual value depends on the precision of the measuring instrument.
20
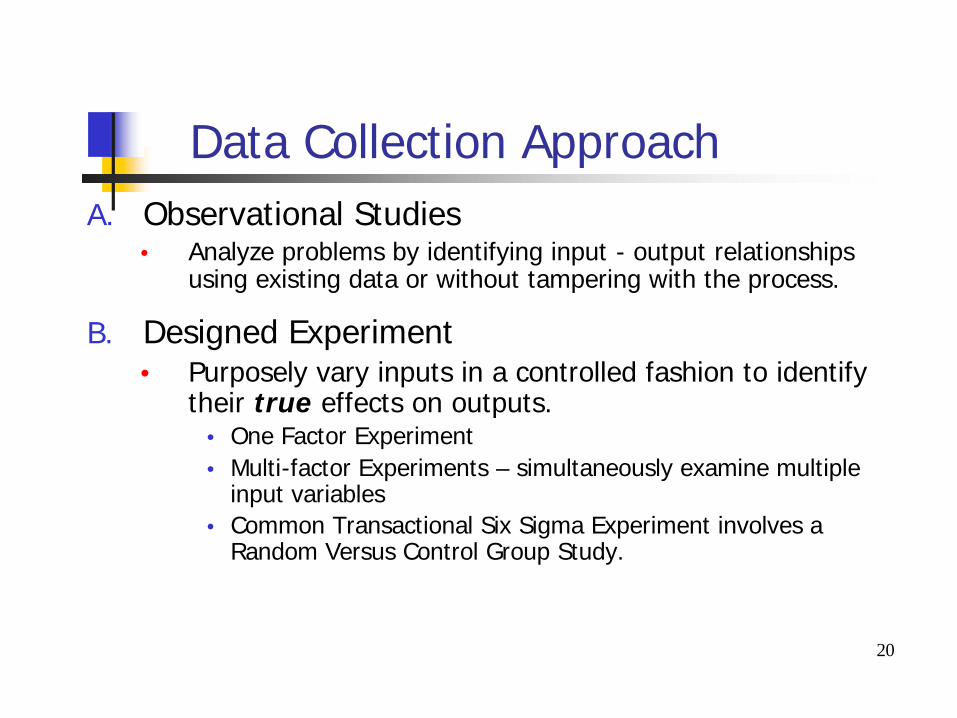
Data Collection ApproachA. Observational Studies
• Analyze problems by identifying input - output relationships using existing data or without tampering with the process.
B. Designed Experiment• Purposely vary inputs in a controlled fashion to identify
their true effects on outputs.• One Factor Experiment • Multi-factor Experiments – simultaneously examine multiple
input variables • Common Transactional Six Sigma Experiment involves a
Random Versus Control Group Study.
21
Random Vs. Control Group Experiment
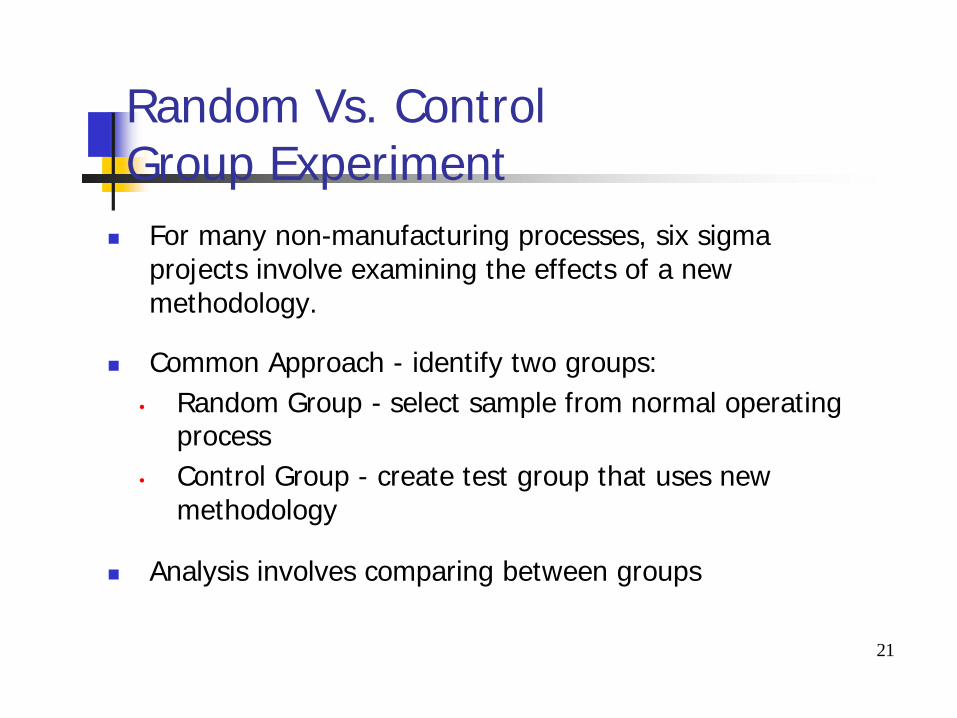
n For many non-manufacturing processes, six sigma projects involve examining the effects of a new methodology.
n Common Approach - identify two groups:• Random Group - select sample from normal operating
process• Control Group - create test group that uses new
methodology
n Analysis involves comparing between groups
22
Tuition Reimbursement Project
n Project Example - company was concerned with the effectiveness of tuition reimbursement process.
n Projected involved testing a control vs. test group to determine how tuition reimbursement affected years of service, job satisfaction, and job performance.
n Random Group – set of randomly selected employeesn Control Group – employees using tuition reimbursement
process
n Findings
23
IV. Case Study – “Life of a Mortgage Loan”
n Reference: “Life of a Mortgage Loan” Case Study, P Hammett.
n We will use this Case Study to examine how a Six Sigma project might be executed.
24
Define the Opportunity
n Identify an improvement opportunity with an emphasis on increasing customer satisfaction and/or business profitability.
Def
ine
Mea
sure
Ana
lyze
Im
prov
e Co
ntro
l

25
Define the Opportunity
n Identify an improvement opportunity with an emphasis on increasing customer satisfaction and/or business profitability.
Def
ine
Mea
sure
Ana
lyze
Im
prov
e Co
ntro
l
Reduce the number of loans with low fees.Reduce the time to process a loan.Reduce the customer turndown rate.
26
Measure Current State
n Identify potential output variable(s) to analyze.
n What metrics you might use to assess the current state of this process. (What additional information might you need?)
Def
ine
Mea
sure
Anal
yze
Impr
ove
Cont
rol
27
Measure Current State
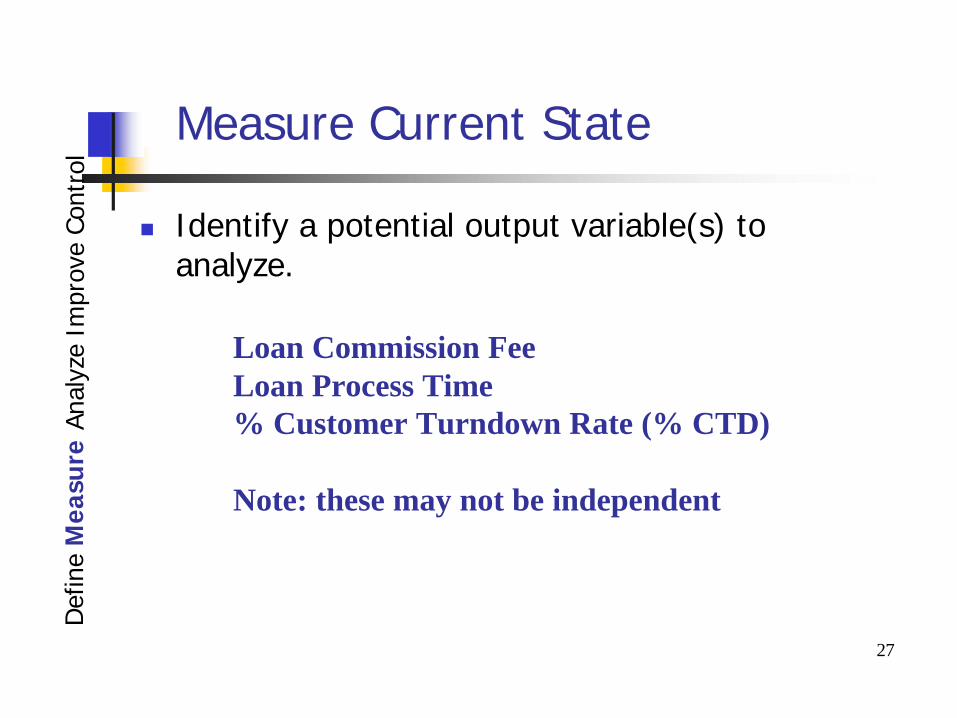
n Identify a potential output variable(s) to analyze.
Def
ine
Mea
sure
Anal
yze
Impr
ove
Cont
rol
Loan Commission FeeLoan Process Time% Customer Turndown Rate (% CTD)
Note: these may not be independent
28
Analyze the Problem
n For your output(s), identify some potential causes (inputs) to analyze?
Def
ine
Mea
sure
An
alyz
eIm
prov
e Co
ntro
l

29
Analyze the Problem
n For your output(s), identify some potential causes (inputs) to analyze?
Def
ine
Mea
sure
An
alyz
eIm
prov
e Co
ntro
l
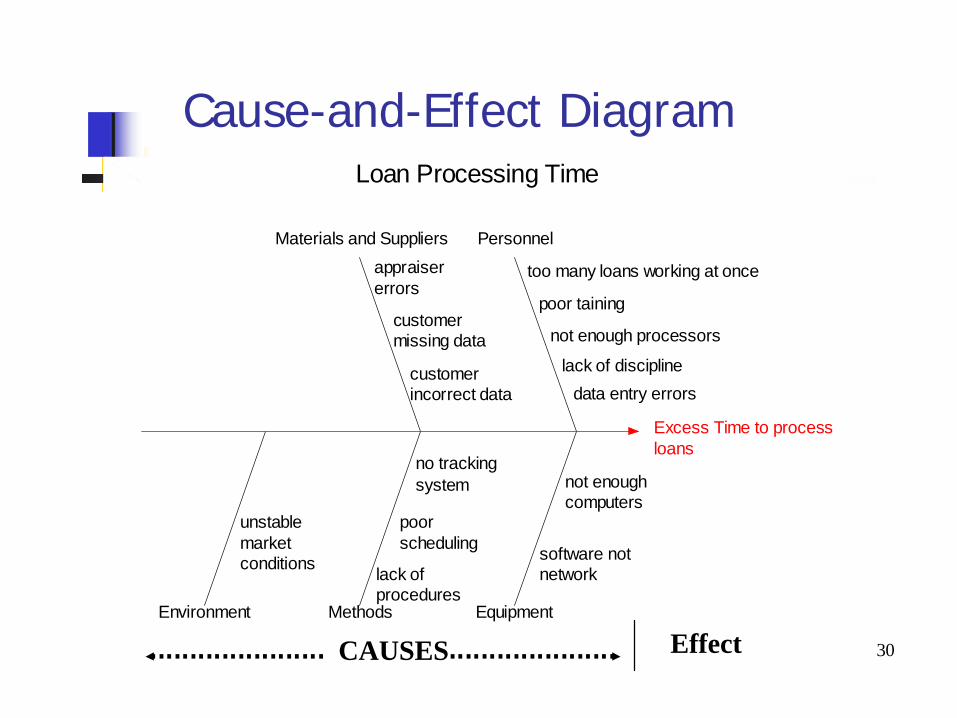
Possible Inputs that could explain long process time:• errors by loan officers setting up loans• insufficient processing staff• excess time in underwriting
30
loansExcess Time to process
conditionsmarketunstable
systemno tracking
schedulingpoor
procedureslack of
incorrect datacustomer
missing datacustomer
errorsappraiser
computersnot enough
networksoftware not
data entry errors
lack of discipline
not enough processors
poor taining
too many loans working at once
Personnel
Equipment
Materials and Suppliers
Methods
Measurements
Environment
Loan Processing Time
Cause-and-Effect Diagram
CAUSES Effect
31
Loan Process Time Analysis by Key Task
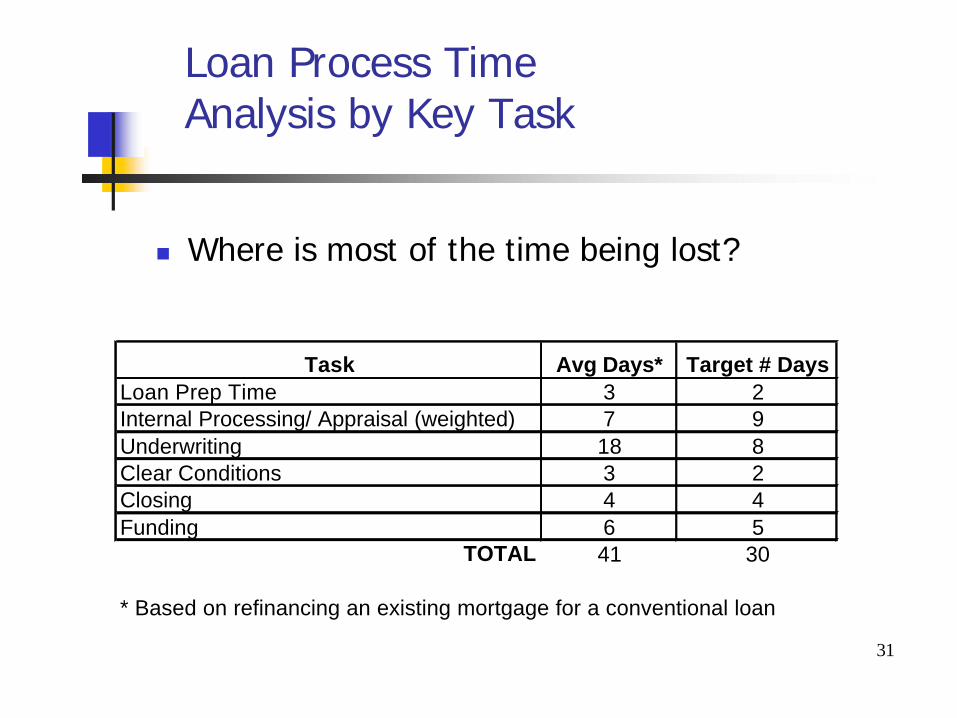
n Where is most of the time being lost?
Task Avg Days* Target # DaysLoan Prep Time 3 2Internal Processing/ Appraisal (weighted) 7 9Underwriting 18 8Clear Conditions 3 2Closing 4 4Funding 6 5
TOTAL 41 30
* Based on refinancing an existing mortgage for a conventional loan
32
Causes and Symptoms
n Is Underwriting the cause for long process time or a symptom of another problem?

33
Improve
n Based on the available information, what changes might you make to improve this process?
Def
ine
Mea
sure
Ana
lyze
Im
pro
veCo
ntro
l
34
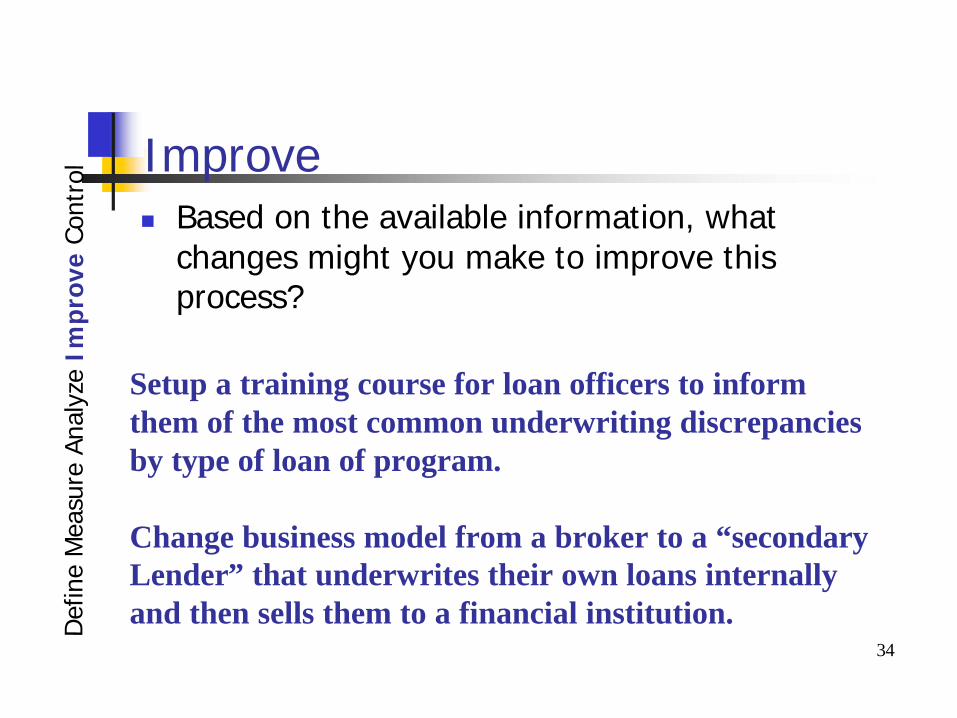
Improven Based on the available information, what
changes might you make to improve this process?
Def
ine
Mea
sure
Ana
lyze
Im
pro
veCo
ntro
l
Setup a training course for loan officers to informthem of the most common underwriting discrepanciesby type of loan of program.
Change business model from a broker to a “secondaryLender” that underwrites their own loans internally and then sells them to a financial institution.
35
Control
n What are some possible control mechanisms for this process?
Def
ine
Mea
sure
Ana
lyze
Im
prov
e C
on
tro
l
36
Control
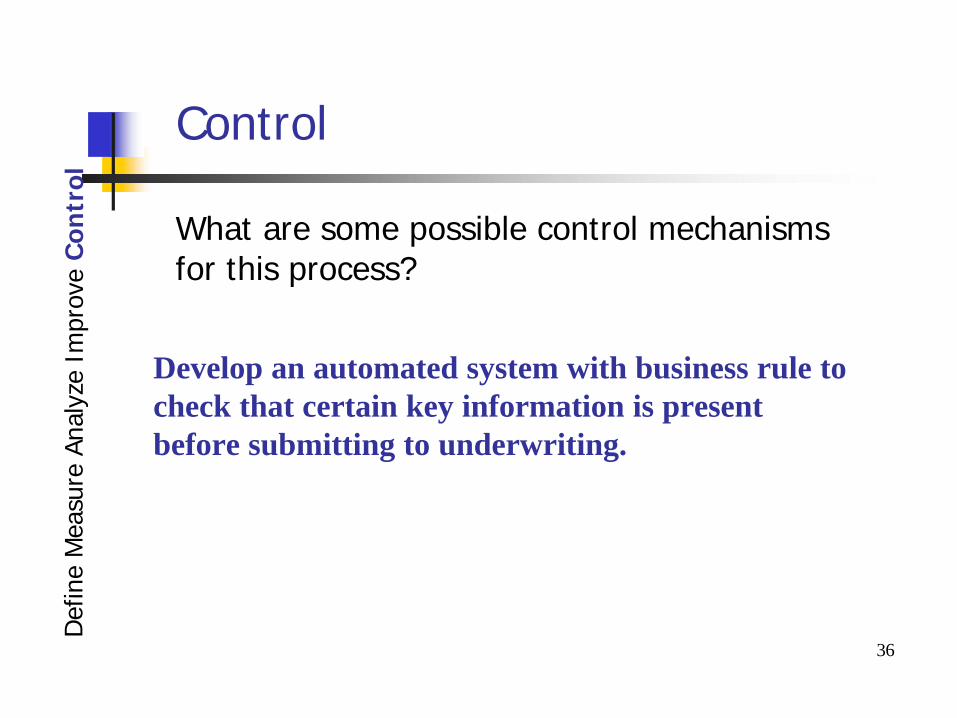
n What are some possible control mechanisms for this process?
Def
ine
Mea
sure
Ana
lyze
Im
prov
e C
on
tro
l
Develop an automated system with business rule to check that certain key information is present before submitting to underwriting.
Related Documents