ANALYSIS OF ANNUAL REPORT (2009-10) GROUP 3 ABHIJEET KUMAR 29 ADITYA KEDIA 51 AMIT KUMAR 79 ANUJ 76 HARMANJEET SINGH 77 MANISH NARULA 41 VINEET RANJAN 74

Welcome message from author
This document is posted to help you gain knowledge. Please leave a comment to let me know what you think about it! Share it to your friends and learn new things together.
Transcript

8/8/2019 DLF_2009-10 Annual Report
http://slidepdf.com/reader/full/dlf2009-10-annual-report 1/54

8/8/2019 DLF_2009-10 Annual Report
http://slidepdf.com/reader/full/dlf2009-10-annual-report 2/54
Real Estate Sector: An Overview
The real estate sector is of great importance in a
developing country like India.
An estimated shortage of 26.53 million houses
during the Eleventh Five Year Plan (2007-12)
provides a big investment opportunity.
India leads the pack of top real estate
investment markets in Asia for 2010, accordingto a study by PricewaterhouseCoopers (PwC)
and Urban Land Institute.

8/8/2019 DLF_2009-10 Annual Report
http://slidepdf.com/reader/full/dlf2009-10-annual-report 3/54
DLF: An Overview
DLF- Delhi Land And Finance
India¶s biggest real estate developer
BUILDING INDIA- Mission and vision of company
Founded as Raisina Cold Storage and Ice Company
Current chairman- Mr. Kushal Pal Singh ± world¶s richestproperty developer- world¶s 98th richest man according toforbes

8/8/2019 DLF_2009-10 Annual Report
http://slidepdf.com/reader/full/dlf2009-10-annual-report 4/54

8/8/2019 DLF_2009-10 Annual Report
http://slidepdf.com/reader/full/dlf2009-10-annual-report 5/54
Major milestones

8/8/2019 DLF_2009-10 Annual Report
http://slidepdf.com/reader/full/dlf2009-10-annual-report 6/54
Balance Sheet

8/8/2019 DLF_2009-10 Annual Report
http://slidepdf.com/reader/full/dlf2009-10-annual-report 7/54

8/8/2019 DLF_2009-10 Annual Report
http://slidepdf.com/reader/full/dlf2009-10-annual-report 8/54
Cash Flow
2010 (Rs. Cr.) 2009 (Rs. Cr.)
Cash flow from Operating Activities (A) 39,524 1,36,586
Cash flow from Investing Activities (B) (2,41,999) (1,15,117)
Cash flow from Financing Activities (C) 1,43,494 (43,754)
Net increase/ decrease of cash and cash equivalents
(A+B+C)
(58,980) (22,284)
Cash and cash equivalents at the beginning 75,940 98,224
Cash and cash equivalents at the close 16,960 75,940

8/8/2019 DLF_2009-10 Annual Report
http://slidepdf.com/reader/full/dlf2009-10-annual-report 9/54
Implications
Cash flow from Operating Activities shows a decrease because
of a rise in debtors and decrease in overall current liabilities.
Cash flow from Investing Activities shows an outflow of cash
because the company sees a lot of scope to invest post
recession. It has started investing in its subsidiaries and has
several projects in hand.
Cash flow from Financing Activities shows and increase in cash
due to the company taking long term loans.

8/8/2019 DLF_2009-10 Annual Report
http://slidepdf.com/reader/full/dlf2009-10-annual-report 10/54
Capital Structure

8/8/2019 DLF_2009-10 Annual Report
http://slidepdf.com/reader/full/dlf2009-10-annual-report 11/54

8/8/2019 DLF_2009-10 Annual Report
http://slidepdf.com/reader/full/dlf2009-10-annual-report 12/54
Economic Ratios

8/8/2019 DLF_2009-10 Annual Report
http://slidepdf.com/reader/full/dlf2009-10-annual-report 13/54
DEB T EQUITY RATIO
The company paid a debt of Rs. 5633 as
against a mandatory payment of Rs. 3549
The Average Cost of D
ebt stood at 10.5% ason 31st March 2010.
The Debt Equity Ratio lowered from o.78 in
2008-2009 to 0.53 in 2009-2010.

8/8/2019 DLF_2009-10 Annual Report
http://slidepdf.com/reader/full/dlf2009-10-annual-report 14/54
The company has set a target for Rs. 250 bn
of core assets disinvestment for the next 6
quarters.
It has done Rs. 29 Bn in Q1FY11.
Key for the company to cut its debt burden.
DLF is also replacing short term loans with
long term loans which do not affect the debtand also have a lower interest rate.

8/8/2019 DLF_2009-10 Annual Report
http://slidepdf.com/reader/full/dlf2009-10-annual-report 15/54
DLF, is making a quick exit from hospitality
sector by selling off its 97% stake from a
luxurious hotel group µAman Resorts¶.
Main motive of DLF is to become debt free
8/8/2019 DLF_2009-10 Annual Report
http://slidepdf.com/reader/full/dlf2009-10-annual-report 16/54
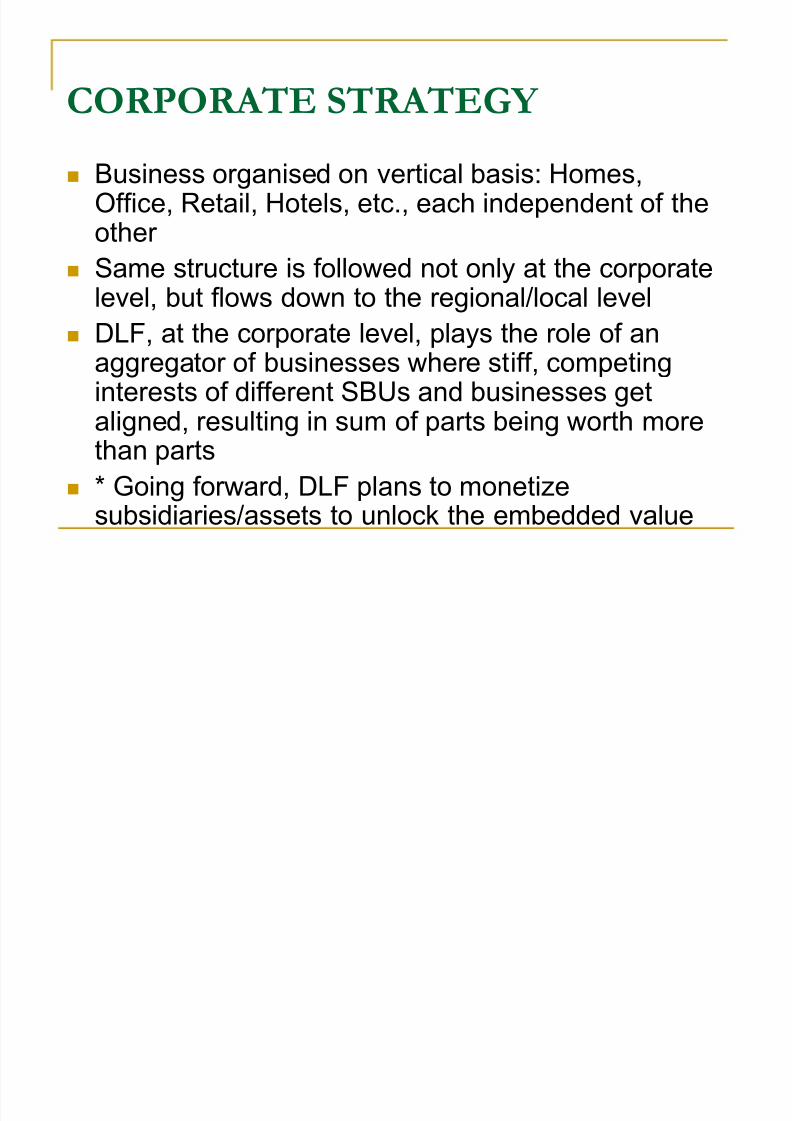
CORPORATE STRATEGY
Business organised on vertical basis: Homes,Office, Retail, Hotels, etc., each independent of theother
Same structure is followed not only at the corporatelevel, but flows down to the regional/local level
DLF, at the corporate level, plays the role of anaggregator of businesses where stiff, competinginterests of different SBUs and businesses get
aligned, resulting in sum of parts being worth morethan parts
* Going forward, DLF plans to monetizesubsidiaries/assets to unlock the embedded value

8/8/2019 DLF_2009-10 Annual Report
http://slidepdf.com/reader/full/dlf2009-10-annual-report 17/54
Corporate Strategy ( Continued)
* With core businesses reaching stable operating performance,focus is to aggressively ramp up new businesses like hotels,infrastructure, SEZs, etc.
Key focus on execution of projects ±with current levels reaching
a run rate of 62 msf across businesses (excluding Hotels) * DLF will look into making small µpure¶investments in non-real
estate businesses, with target ROI of more than 20%
The compensation structure within the mid / senior levelempolyees allows for participation in the success of variousprojects/businesses
Base salary ±30% with a 70% variable component linked to theKPAs, overall through stock options.

8/8/2019 DLF_2009-10 Annual Report
http://slidepdf.com/reader/full/dlf2009-10-annual-report 18/54

8/8/2019 DLF_2009-10 Annual Report
http://slidepdf.com/reader/full/dlf2009-10-annual-report 19/54
Land Resource as on 31-March-2008 (Mn SqFt)
Segment Total Super
metros
Metro
s
Tier I Tier II
Office 164 64 70 26 5
Retail 92 33 36 14 9
Super Luxury 4 4 0 0 0
Luxury 41 33 6 1 0
Mid income/Plots/Villas 432 113 231 73 16
Hotel/Convention centres 18 4 2 10 2
Grand Total 751 251 345 123 32
% 33% 46% 16% 4%

8/8/2019 DLF_2009-10 Annual Report
http://slidepdf.com/reader/full/dlf2009-10-annual-report 20/54

8/8/2019 DLF_2009-10 Annual Report
http://slidepdf.com/reader/full/dlf2009-10-annual-report 21/54

8/8/2019 DLF_2009-10 Annual Report
http://slidepdf.com/reader/full/dlf2009-10-annual-report 22/54
L ARGE INTEGRATED TOWNSHIPS
DLF pioneered development of large integratedtownships decades ago with the development of the3,000 acre DLF City, Gurgaon.
Townships include residential, commercial and retailproperties in a modern city infrastructure, completewith schools, hospitals, hotels, shopping malls andrecreational hubs
DLF has inked JV with Nakheel LLC of the UAE,
who have to their credit the development of ThePalms and Al Burj, among other outstandingarchitectural projects

8/8/2019 DLF_2009-10 Annual Report
http://slidepdf.com/reader/full/dlf2009-10-annual-report 23/54
L ARGE INTEGRATED TOWNSHIPS
BidadiTownship: An integrated township spread over 9,168 acres onthe outskirts of Bangalore with potential value creation of approx. Rs50,000 crore (approx USD 12.5 billion).Work to start by mid 2008.
ShivajiMarg: Acquisition of SwatantraBharatMill, along with pre-ownedlands, will have a development potential of approx. 10 msf with potentialvalue creation in excess of Rs 12,000 crore (approx USD 3 billion)
New Gurgaon: A 4,000 acres township falling in the new masterplanfor Gurgaon, with all segments of residential, commercial and retail
Dankuni, Kolkata: 5,000 acres of township on the western outskirts of Kolkata
South Maharshtra: Acquisition of land started for building a high-endresort city for holiday and luxurious lifestyle

8/8/2019 DLF_2009-10 Annual Report
http://slidepdf.com/reader/full/dlf2009-10-annual-report 24/54
OFFICE
India forms an important part of growth strategy for every major multinational worldwide
Entry of multinationals has grown by over 300% inlast two years alone leading to huge demand for
office space Demand for IT/ITES services (expected to grow at
15-20% CAGR over FY2010-16)
Indian corporatesgetting increasingly dynamiccreating huge demand for quality office space
Total commercial real estate demand likely to be ~450-530 msf by FY 2011.

8/8/2019 DLF_2009-10 Annual Report
http://slidepdf.com/reader/full/dlf2009-10-annual-report 25/54

8/8/2019 DLF_2009-10 Annual Report
http://slidepdf.com/reader/full/dlf2009-10-annual-report 26/54
DLF and RETAIL
10-year annual target delivery of 8 mnsq ft every year.
Given the scarcity of quality organized retail, DLF enjoys thebenefits of a portfolio of premium locations across the countryand rush by large retailers
DLF envisages to introduce a new retail infrastructure to cater tothe need for shopping malls and commercial centresacross alsegments and all places in India
DLF has plans for delivering 1 msf of luxury malls, 4 msf of shopping malls and 3 msf of neighborhood malls annually
Current developable land resource earmarked for retail standsat92 msf
All major retail players, including new entrants pitch aggressivelyfor space in DLF Malls
11msf under construction

8/8/2019 DLF_2009-10 Annual Report
http://slidepdf.com/reader/full/dlf2009-10-annual-report 27/54
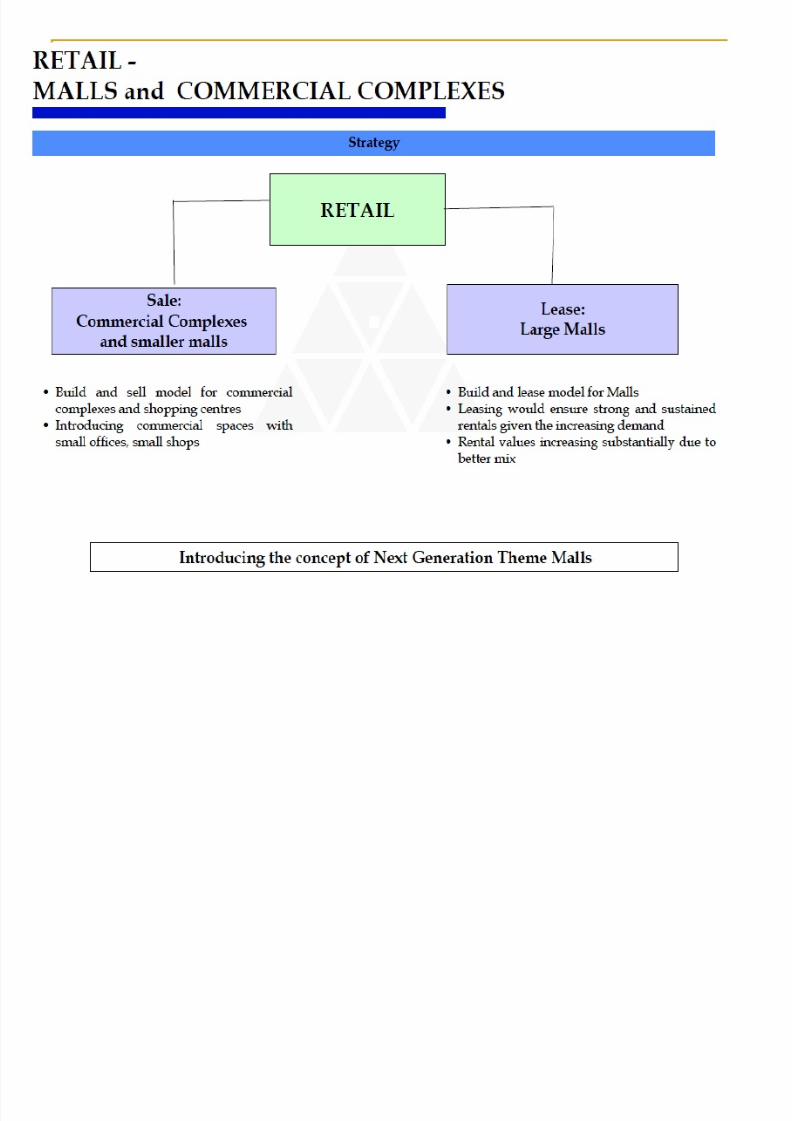
RETAIL MA LLS & COMMERCIA L COMPLEXES
Modern retail formats in India command just 3% of
total retail market, much lower than developed
markets (US ±85% share) and even Asian countries(Malaysia ±55%, Thailand ±40%, China 20%)
Organized retail segment in India is expected to
grow at a rate of 25% to 30% over the next 5 years.
Organized retailing would require around 350-400msf of retail real estate in India by FY 2016.
8/8/2019 DLF_2009-10 Annual Report
http://slidepdf.com/reader/full/dlf2009-10-annual-report 28/54
8/8/2019 DLF_2009-10 Annual Report
http://slidepdf.com/reader/full/dlf2009-10-annual-report 29/54
8/8/2019 DLF_2009-10 Annual Report
http://slidepdf.com/reader/full/dlf2009-10-annual-report 30/54
DLF AND SEZ
DLF India has proposed SEZ in many parts inIndia like Amritsar, Ludhiana, Gurgaon and Ambala.
DLF SEZs have targeted the IT Sector;however, DLF Townships have been on theagenda of DLF Universal
DLF Universal has announced plans to rope
in major partnerships to develop the SpecialEconomic Zones in Chennai and Coimbatore.

8/8/2019 DLF_2009-10 Annual Report
http://slidepdf.com/reader/full/dlf2009-10-annual-report 31/54
Wind Power Projects by DLF
DLF group is the largest owner of wind power plants inIndia with an installed capacity of 228.7 MW.
DLF has initiated its wind power portfolio in March2008. Currently the group owns wind farms in the
states of Gujarat (150 MW), Rajasthan (34.5 MW),Tamil nadu (33MW), and Karnataka (11.2 MW).
These projects reduce about 4.7 tonne of CO2emissions on annual basis.
The wind power projects in the states of Gujarat and
Karnataka are already registered for carbon credits atUNFCCC and generating over 3 Lakh CERs (CertifiedEmission Reductions) annually.
8/8/2019 DLF_2009-10 Annual Report
http://slidepdf.com/reader/full/dlf2009-10-annual-report 32/54
Wind Power Project Locations
150 MW wind power project in Kutch,
Gujarat.
11.2 MW wind power project in Gadag,
Karnataka.
33 MW wind power project in Osisan and
Ratan Ka Baas, Rajasthan.
34.5 MW wind power project in Elavanthi andPanapatti, Tamilnadu.

8/8/2019 DLF_2009-10 Annual Report
http://slidepdf.com/reader/full/dlf2009-10-annual-report 33/54
DLF AND ITSSUBSID AIRES

8/8/2019 DLF_2009-10 Annual Report
http://slidepdf.com/reader/full/dlf2009-10-annual-report 34/54
Reasons why companies may have
subsidaires?
Risk
Acquisition Regulation
Territoriality
Taxation
8/8/2019 DLF_2009-10 Annual Report
http://slidepdf.com/reader/full/dlf2009-10-annual-report 35/54
M AJOR SUBSID AIRES
DLF BRANDS
DLF ASSETS
DLF HOME
DEVELOPERS LT
D.
DLF CYBER CIY DEVELOPERS LTD.
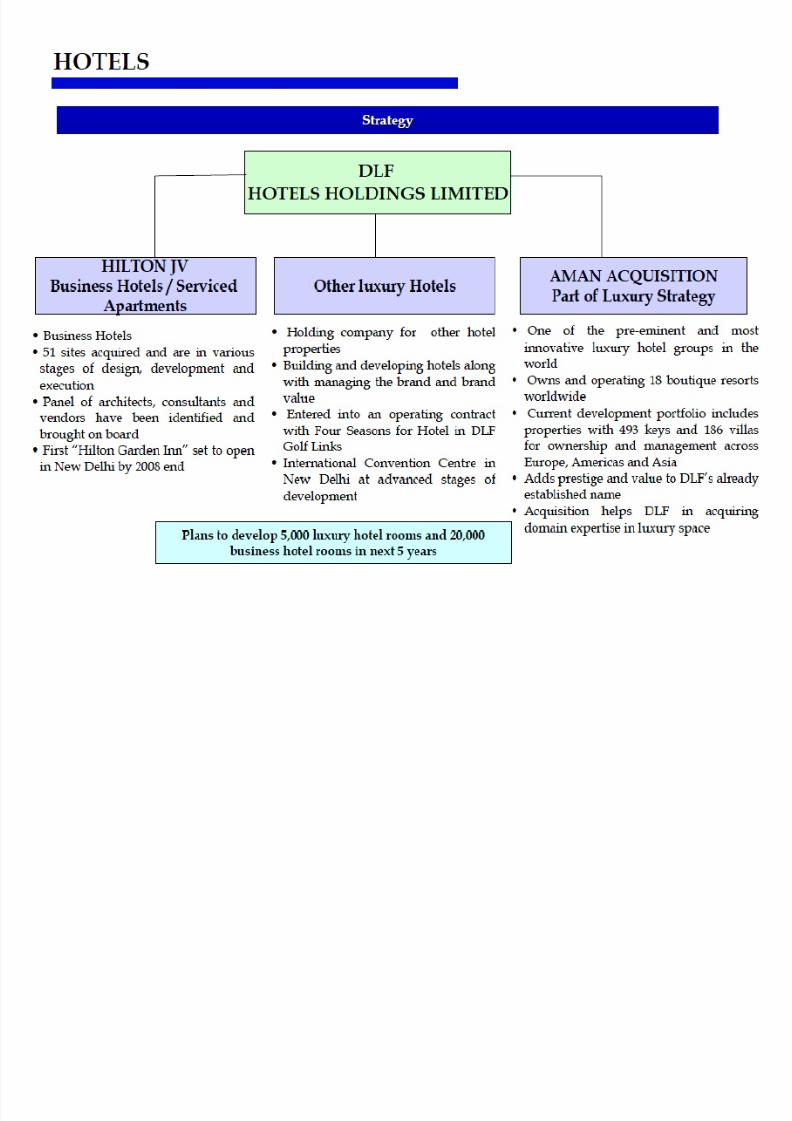
DLF HOTEL HOLDINGS LTD.
DLF INFO PARK DEVELOPERS(CHENNAI)
LTD.
CARAF BUILDERS AND CONSTRUCTIONS
PVT. LTD.

8/8/2019 DLF_2009-10 Annual Report
http://slidepdf.com/reader/full/dlf2009-10-annual-report 36/54
COMPETITION

8/8/2019 DLF_2009-10 Annual Report
http://slidepdf.com/reader/full/dlf2009-10-annual-report 37/54
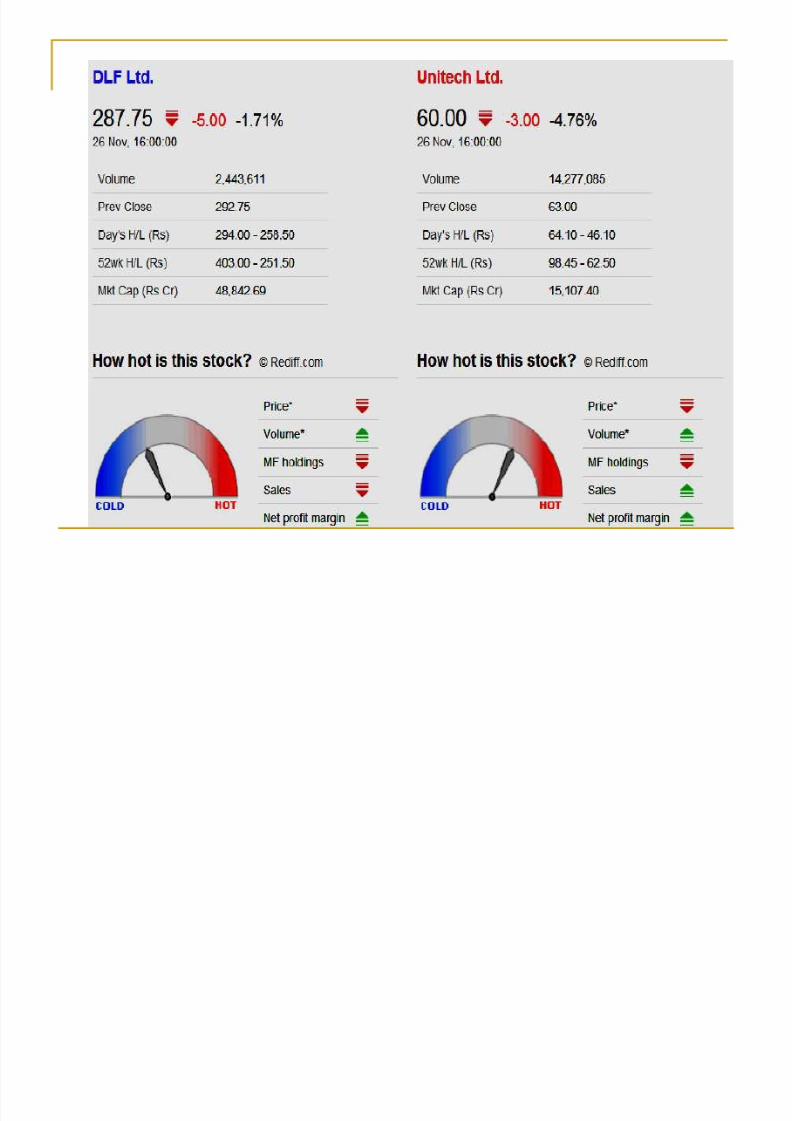
DLF VS. UNITECH
UNITECH CLAIMS TO BE INDIA¶S SECOND
LARGEST REAL-ESTATE INVESMENT
COMPANY - 10,538 CRORE RUPEES
TOTAL ASSETS (MARCH 2010)
DIVERSIFYING INTO TELECOMS IN
COOPERATION WITH NORWAY¶S
TELENOR GROUP ENVISION FOR 50% GROWTH PER YEAR
SINCE 2008
8/8/2019 DLF_2009-10 Annual Report
http://slidepdf.com/reader/full/dlf2009-10-annual-report 38/54

8/8/2019 DLF_2009-10 Annual Report
http://slidepdf.com/reader/full/dlf2009-10-annual-report 39/54

8/8/2019 DLF_2009-10 Annual Report
http://slidepdf.com/reader/full/dlf2009-10-annual-report 40/54

8/8/2019 DLF_2009-10 Annual Report
http://slidepdf.com/reader/full/dlf2009-10-annual-report 41/54
8/8/2019 DLF_2009-10 Annual Report
http://slidepdf.com/reader/full/dlf2009-10-annual-report 42/54
DLF SH ARE PRICE
The stock has underperformed in comparison
with the broader indices and is expected to
improve.
We believe that the current bullish
consolidation could lead to a potential upside
up to the levels of Rs 430 and above.
As the market stabilizes there are chances of growth.

8/8/2019 DLF_2009-10 Annual Report
http://slidepdf.com/reader/full/dlf2009-10-annual-report 43/54
Recession and its Impact
Credit freeze stemming from the collapse of Lehman Brothers prompted investors andspeculators to withdraw investments from this
sector Property developers, who raised funds
through external sources, were left strandedwith minimal cash flows and huge debt
obligations surfacing in the near term.

8/8/2019 DLF_2009-10 Annual Report
http://slidepdf.com/reader/full/dlf2009-10-annual-report 44/54
Recession and its Impact
The company¶s net profit for 2008-09 dipped over 41percent to Rs.4,629 crore from Rs.6,176 crore earnedthe previous year.
DLF is the market leader in this sector with net profit of 1547 cr.
It was way lower than its last year profit by more than1000 cr.
It also delayed a buyback of INR 1,100 crore as a resultof liquidity crunch.

8/8/2019 DLF_2009-10 Annual Report
http://slidepdf.com/reader/full/dlf2009-10-annual-report 45/54
Recession and its Impact
It was well supported by the timely launch of IPL.
The share of this co. touched the all time highof 1727 in feb. 2008. but in the year 2008-09it was high at 446.90 and low at 124.15.
Its present market capital is Rs 74,704.46crore.

8/8/2019 DLF_2009-10 Annual Report
http://slidepdf.com/reader/full/dlf2009-10-annual-report 46/54
SWOT Analysis
Strength Weakness
Opportunities Threats
8/8/2019 DLF_2009-10 Annual Report
http://slidepdf.com/reader/full/dlf2009-10-annual-report 47/54
Strengths Brand name and reputation: DLF retains internationally and nationally
renowned architectural, construction and consulting firms for its projects.
Extensive land reserves: The Company recognizes that extensive land
reserves are the most important resource for a real estate developer.
Scale of Operations: The Company¶s size allows it to benefit from
economies of scale. DLF is able to purchase large plots of land from
multiple sellers, thus enabling it to aggregate land at lower prices.
A tradition of innovation: DLF has a tradition of innovation in the Indian
real estate market. It is one of the first developers to anticipate the need
for townships on the outskirts of fast growing cities and is generallycredited with the growth of Gurgaon.
Experienced and dedicated management: The Company has an
experienced, highly qualified and dedicated management team.

8/8/2019 DLF_2009-10 Annual Report
http://slidepdf.com/reader/full/dlf2009-10-annual-report 48/54
Weakness
No parallel products to support during times of bad economy
Macroeconomic risks:
Any weaker-than-expected GDP growth for the domestic economy
could negatively affect sentiment of buyers, leading to elusive demand,which could render sales and earnings estimates for DLF unrealizable
Real risk of decline in property prices, and concentration in
Gurgaon
NCR region still accounts for 42% of the development area for thecompany, thus exposing it to significant price movements in the regions

8/8/2019 DLF_2009-10 Annual Report
http://slidepdf.com/reader/full/dlf2009-10-annual-report 49/54
Opportunities
Expansion of business in other parts of India
It can invest more in Power generation projectslike Hydroelectric or Wind power
Investment in raw material ± Backward Vertical
Integration

8/8/2019 DLF_2009-10 Annual Report
http://slidepdf.com/reader/full/dlf2009-10-annual-report 50/54
Threats
Competitors may try to get more market share through improved
techniques
New rivals Bombay Dyeing, Golden Tobacco and Century Textiles. There has
been a precedent with groups like Tata, Mahindra and Godrej having turned
developers. The Tata group has Tata Housing and Tata Realty while
Mahindras venture is called Mahindra Lifespace Developers. Godrejs venturegoes by the name of Godrej Properties.

8/8/2019 DLF_2009-10 Annual Report
http://slidepdf.com/reader/full/dlf2009-10-annual-report 51/54
FUTURE PROJEC TS
1. India's largest Exhibition and Convention Centre to be built by DLF in Sector
24, DWARKA, NEW DELHI by 2010.
2. Mall of India is an under-construction shopping mall in Gurgoan, India- area
of 4,500,000-square-foot (418,100 m2)- the largest mall ever built in India-
one of the largest in the world- estimated cost $ 298 million( 1500 crore
INR).
3. DLF Corporate Greens -located next to NH 8, in the upcoming Sector 74A,
Gurgaon -Spread over sprawling 25 acres-the project is to be developed on
the lines of district centre comprising premium Commercial , Retail and IT
spaces.
4. DLF Plaza Lucknow - catering to office, retail, leisure, entertainment
requirements- also internationally acclaimed Hilton Garden Inn hotel- area
of 69677 sq mts (approx)- will have 2 levels of basement parking to
accommodate approx 800 cars-24 hour security surveillance- equipped
with modern fire fighting systems.

8/8/2019 DLF_2009-10 Annual Report
http://slidepdf.com/reader/full/dlf2009-10-annual-report 52/54
CONCLUSION
India¶s largest real estate company in terms of revenues,earnings, market capitalisation and developable area with a 62-year track record of sustained growth, customer satisfaction andinnovation
Low risk due to multiple businesses and segments withinbusinesses, across geographies
All earnings enablers in place ±high quality / high value ³zoned´land resource in super metros & metros and motivated teams atlocal level to execute projects
CRISIL upgraded the rating from µA+ with a negative outlook¶ toµA+ with a stable outlook

8/8/2019 DLF_2009-10 Annual Report
http://slidepdf.com/reader/full/dlf2009-10-annual-report 53/54
Businesses (Commercial, retail & luxury homes) which contribute
more than 80% of long term value are at stable operating
platform Stupendous response to the launch of µmid-income homes¶±
strong validation of strategy
Set to change the hospitality landscape in India-
On way to set up 20,000 business hotel rooms in the next 5
years in partnership with Hilton
Acquisition of domain expertise & assets with buy-out of
Aman Resorts business
Only developer with the experience of setting up of large
townships

8/8/2019 DLF_2009-10 Annual Report
http://slidepdf.com/reader/full/dlf2009-10-annual-report 54/54
THANK YOU
Related Documents