Project: Increase the Restaurant Service Speed & Efficiency in Sheraton Imperial Kuala Lumpur Hotel through Six Sigma Djana Kazic

Welcome message from author
This document is posted to help you gain knowledge. Please leave a comment to let me know what you think about it! Share it to your friends and learn new things together.
Transcript

Project: Increase the Restaurant Service Speed & Efficiency
in Sheraton Imperial Kuala Lumpur Hotel through Six Sigma
Djana Kazic

What is Six Sigma?
Six Sigma can be defined as:
• A symbol of quality
• A statistical measure of the performance of a process or a product
(3.4 defects per million opportunities)
• A goal that reaches near perfection for performance improvement
• A system of management to achieve lasting business leadership
Sigma level Number of Defects Percent defective
1 691,462 69%
2 308,538 31%
3 66,807 6.7%
4 6,210 0.62%
5 233 0.023%
6 3.4 0.00034%
7 0.019 0.0000019%
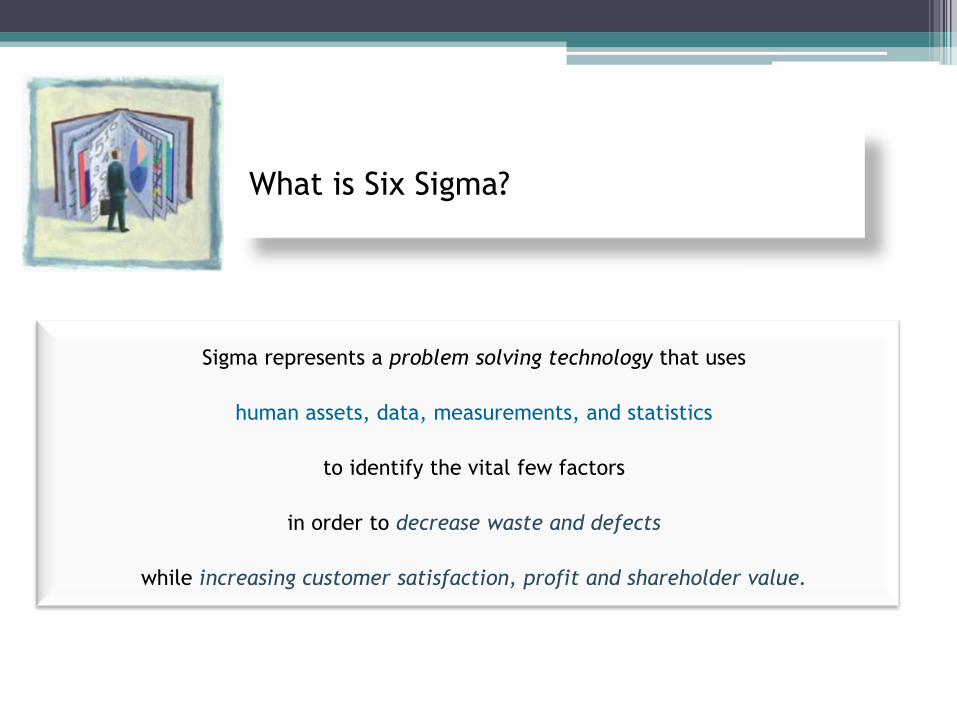
What is Six Sigma?
Sigma represents a problem solving technology that uses
human assets, data, measurements, and statistics
to identify the vital few factors
in order to decrease waste and defects
while increasing customer satisfaction, profit and shareholder value.

Instrument of quality control
What makes Six Sigma different from other quality improvement initiatives?
• Focus on achieving measurable and quantifiable financial returns
• Strong and passionate leadership
• Integration of the human elements and process elements
• Utilization of the tools and techniques for fixing problems in business processes

Six Sigma roles
Green belt – to assist black belts part-time
Executive leaders – to commit and to promote
throughout the organization
Champions – to fight for the cause
of black belts and remove barriers
Master black belts – serve as trainer, mentor and guide
Black belt – to work full time on projects
Black belts
Green belts
Champions

3 ways of doing Six Sigma
Define
Measure
Analyse
Improve
Control
Define
Measure
Analyse
Design
Verify
DMAIC
DMADV
Process management
Plan
DoCheck
Act
Deming

DMAIC
Tools
Tools
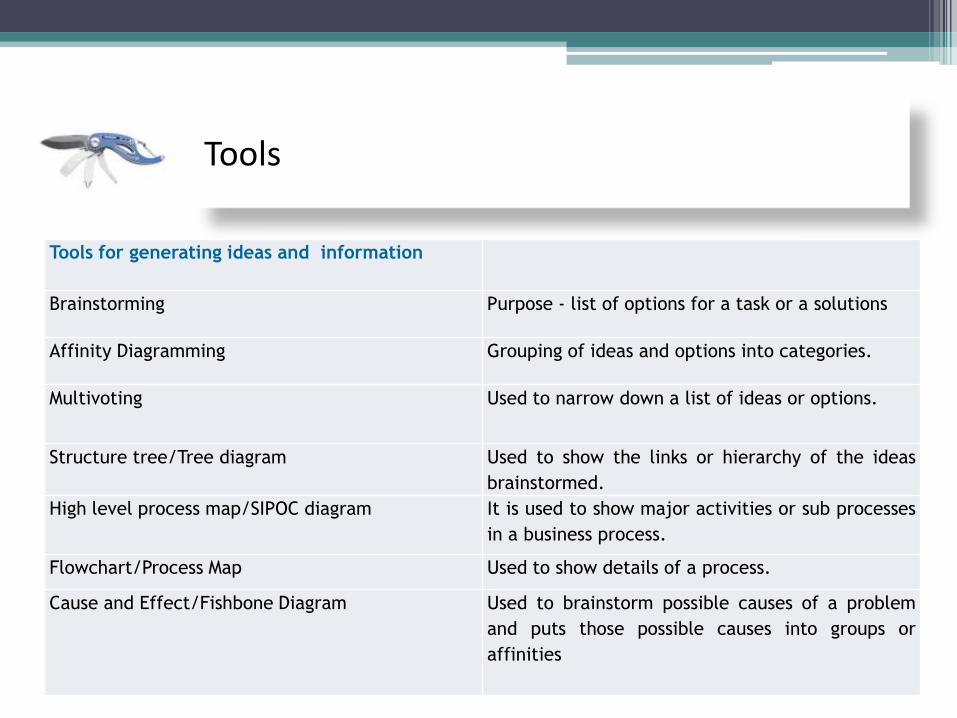
Tools for generating ideas and information
Brainstorming Purpose - list of options for a task or a solutions
Affinity Diagramming Grouping of ideas and options into categories.
Multivoting Used to narrow down a list of ideas or options.
Structure tree/Tree diagram Used to show the links or hierarchy of the ideas
brainstormed.
High level process map/SIPOC diagram It is used to show major activities or sub processes
in a business process.
Flowchart/Process Map Used to show details of a process.
Cause and Effect/Fishbone Diagram Used to brainstorm possible causes of a problem
and puts those possible causes into groups or
affinities

Tools
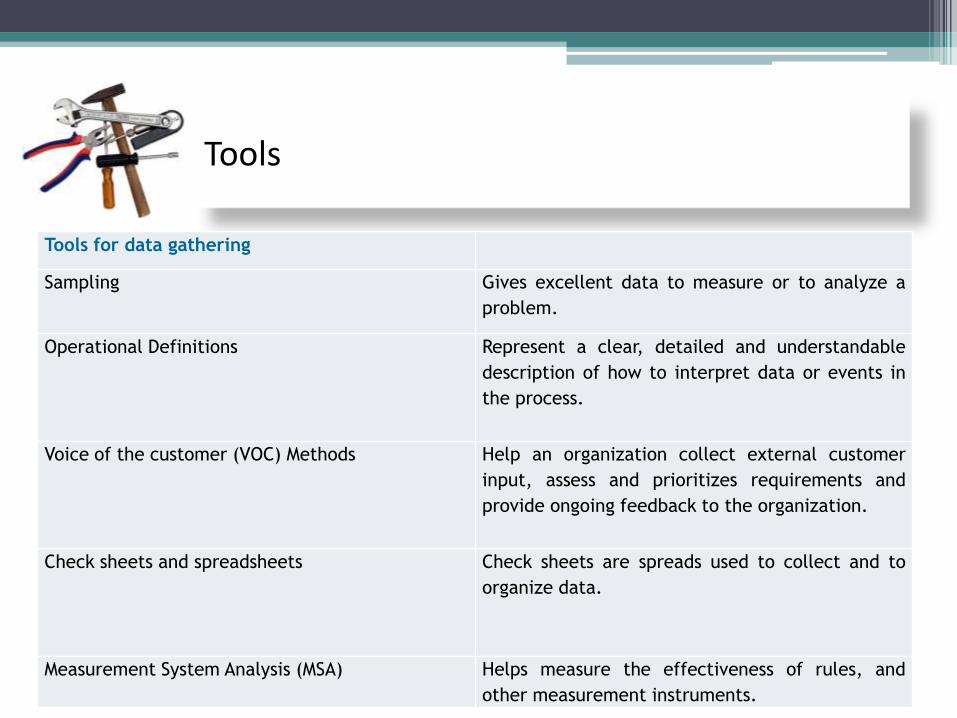
Tools
Tools for data gathering
Sampling Gives excellent data to measure or to analyze a
problem.
Operational Definitions Represent a clear, detailed and understandable
description of how to interpret data or events in
the process.
Voice of the customer (VOC) Methods Help an organization collect external customer
input, assess and prioritizes requirements and
provide ongoing feedback to the organization.
Check sheets and spreadsheets Check sheets are spreads used to collect and to
organize data.
Measurement System Analysis (MSA) Helps measure the effectiveness of rules, and
other measurement instruments.

Tools
Tools for process and data analysis
Process-flow analysis The team starts to scrutinize the process for
redundancies, unnecessary decision points and so on.
Value and non value added analysis In this analysis each step in a detailed process map is
assessed on its real value to external customers.
Charts and graphs: Pareto chart – 80:20
Histogram (Frequency Plot) – shows the distribution
of data over a range: size, age, cost, length of time,
weight and so on.
Run (Trend) Chart – show how things are changing
over time.
Scatter Plot (Correlation) Diagram – looks for direct
relationships between two factors in a process
usually to see if they are correlated, meaning that
the change in one is linked to the change in the
other.

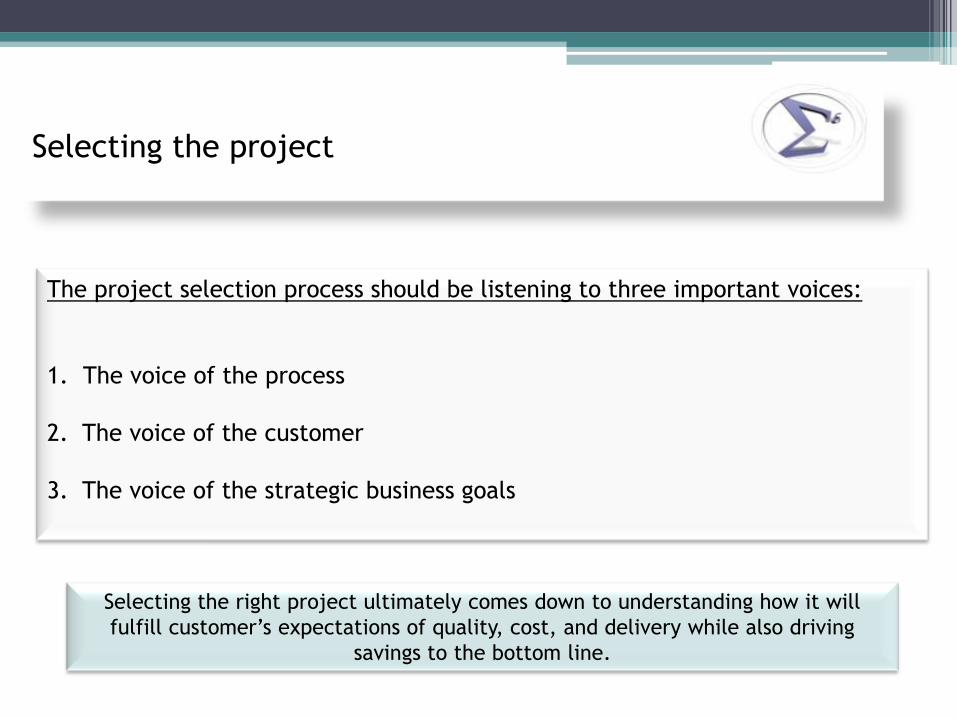
Selecting the project
The project selection process should be listening to three important voices:
1. The voice of the process
2. The voice of the customer
3. The voice of the strategic business goals
Selecting the right project ultimately comes down to understanding how it will
fulfill customer’s expectations of quality, cost, and delivery while also driving
savings to the bottom line.

Selecting the project
A clear, well-selected, well-defined project
+ a well trained team
+ a committed Champion
= good, fast results for customers!
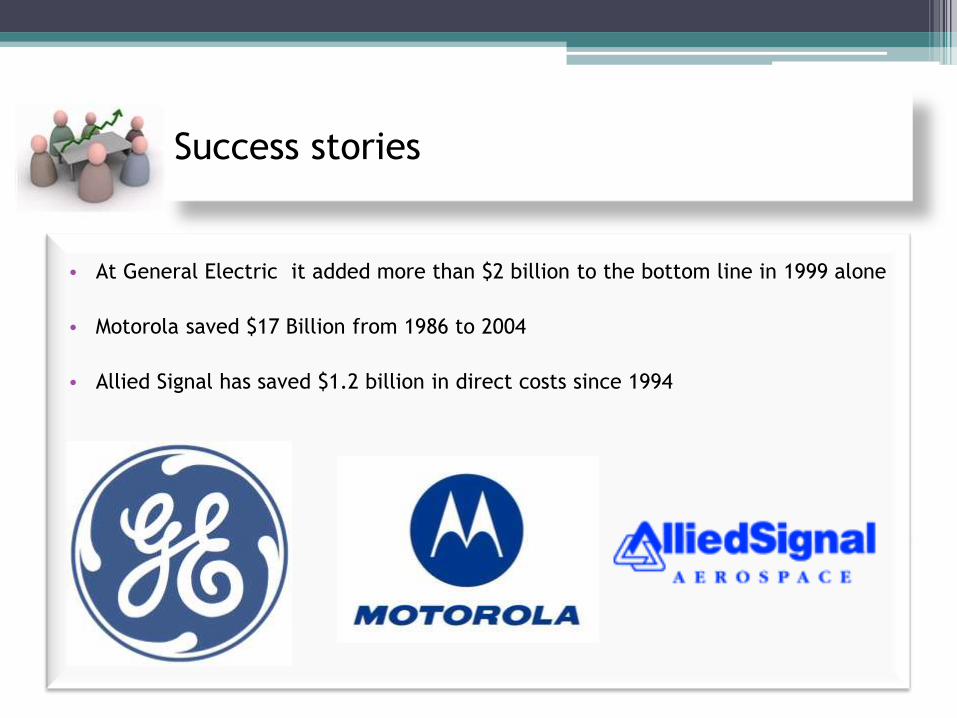
Success stories
• At General Electric it added more than $2 billion to the bottom line in 1999 alone
• Motorola saved $17 Billion from 1986 to 2004
• Allied Signal has saved $1.2 billion in direct costs since 1994

Six Sigma in the service industry

Service sector & Six Sigma
Service offerings are experienced much faster than products. Once service is
delivered, the customer experiences it and expresses satisfaction or
dissatisfaction.
Manufacturing Inputs Service Inputs
Material Information
Machine Tools/Systems
Method Approach
Technical skills Inter-personal skills
Quality measurements Time measurements
Physical environment Work environment


Why the Service Sector Feels That Six Sigma Is Not For Them
1. Six Sigma is a manufacturing tool
2. The fear of metrics

Define
Measure
Analyse
Improve
Control
DMAIC

Limitations to Six Sigma
• The challenge of having quality data available
• Solutions driven by the data are expensive
• Only a small part of the solution is implemented at the end
• The prioritization of projects in many service-oriented companies is still based on
pure subjective judgment
• Non-standardization procedures in the certification of black belts, green belts, etc.
• The start-up cost for can require significant investment

Advantages to Six Sigma
• Increased understanding of customer needs and expectations
• Improved knowledge across the organization on tools for problem solving
• Reduced variability in service performance
• Improved cross-functional teamwork across the entire organization
• Financial benefits, productivity, and customer satisfaction

Starwood


Six Sigma Journey at Starwood
Challenges Accomplishment
2001 Post Sept 11, Six Sigma associated with cost
cutting
Perceived as a separate group
Benefit calculation not well defined
Projects with limited transferability
Program launched – great talent in new roles
People trained
First projects begin delivering benefits to P&L
2002-3 More projects launched and improvement tracked
People trained, processes mapped and measured
Projects benefit to P&L
2004-6 Greater demand for Six Sigma involvement in
many projects
Six Sigma way of working advances at a
different pace in different parts of the
organization
Strong alignment with senior leadership priorities
Program delivers material impact to EBITDA
margins
Growing number of Best Practices

Sheraton Imperial Kuala Lumpur Hotel

Competitors report, October 2009
Month AVAIL RMS AVAIL RMS RMS SOLD OCC% ADR REVENUE REVPAR ACT MKT SHR
REVPAR
RANK
Sheraton Imperial
KL 385 4.620 4.240 91.77 282.62 1,198.292.00 259.37 23.51% 3
Shangri-la 662 7.944 3.099 39.01 489.25 1,516,148.55 190.85 17.19% 5
JW Marriot 561 6.732 6.732 71.99 369.25 1,789,568.17 265.83 26.88% 2
Le Meridien KL 420 5.040 5.040 79.75 348.70 1,401,580.81 278.09 22.29% 1
Ritz Carlton 251 3.012 3.012 60.66 421.15 769,447.62 255.46 10.13% 4

Competitors report, October 2009
YEAR TO DATE NBR RMS AVAIL RMS RMS SOLD OCC% ADR REVENUE REVPAR ACT MKT SHR REVPAR RANK
Sheraton Imperial
KL 385 109.725 72.894 66.43 315.46 22,995,154.39 209.57 20.23% 4
Shangri-la 662 188.670 63.975 33.91 499.19 31,935,286.25 169.27 17.75% 5
JW Marriot 561 159.885 101.909 63.74 386.31 39,368,816.94 246.23 28.28% 2
Le Meridien KL 420 119.700 78.077 65.23 347.29 27,115,486.50 226.53 21.66% 3
Ritz Carlton 251 71.535 43.550 60.88 446.64 19,451,099.20 271.91 12.08% 1

Project goal:
To increase the GSI score from YTD08 (Year to Day 2008)
of 7.88 to 8.15 YTD09 within 3 months from September to November
Essence

Service composite
The service composite is based
on the following elements:
• The staff cared for me (20%)
• The staff helped me feel welcome
throughout the stay (20%)
• Responsiveness of staff to my
needs (20%)
• Knowledge of staff (20%)
• Staff friendliness (20%)
1.jan 1.feb 1.march 1.apr 1 may 1 june 1 july 1 august
7
8
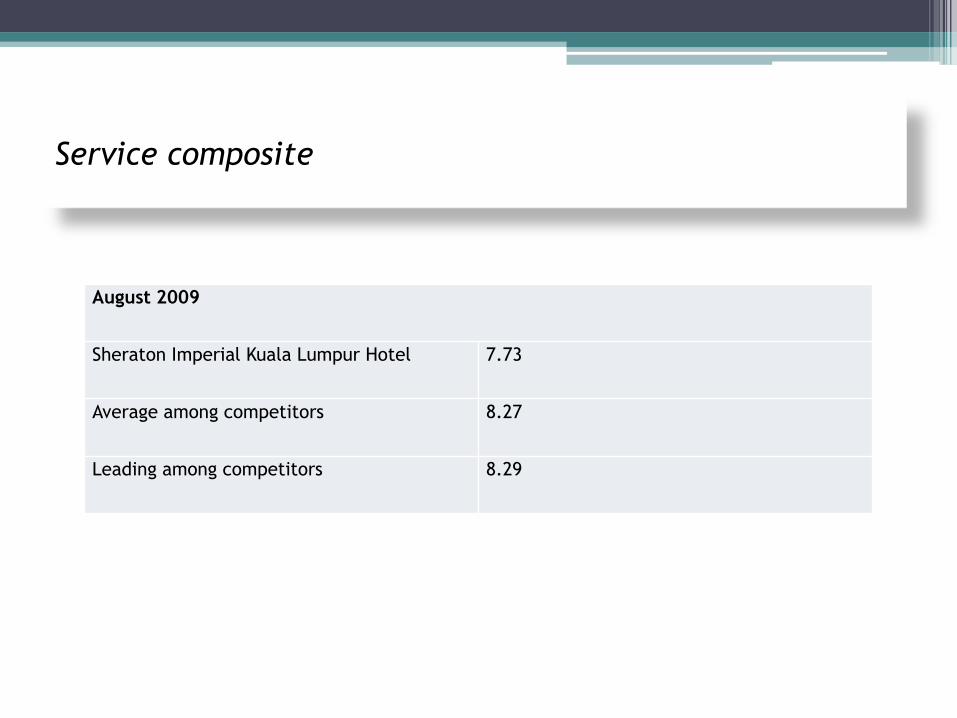
Service composite
August 2009
Sheraton Imperial Kuala Lumpur Hotel 7.73
Average among competitors 8.27
Leading among competitors 8.29
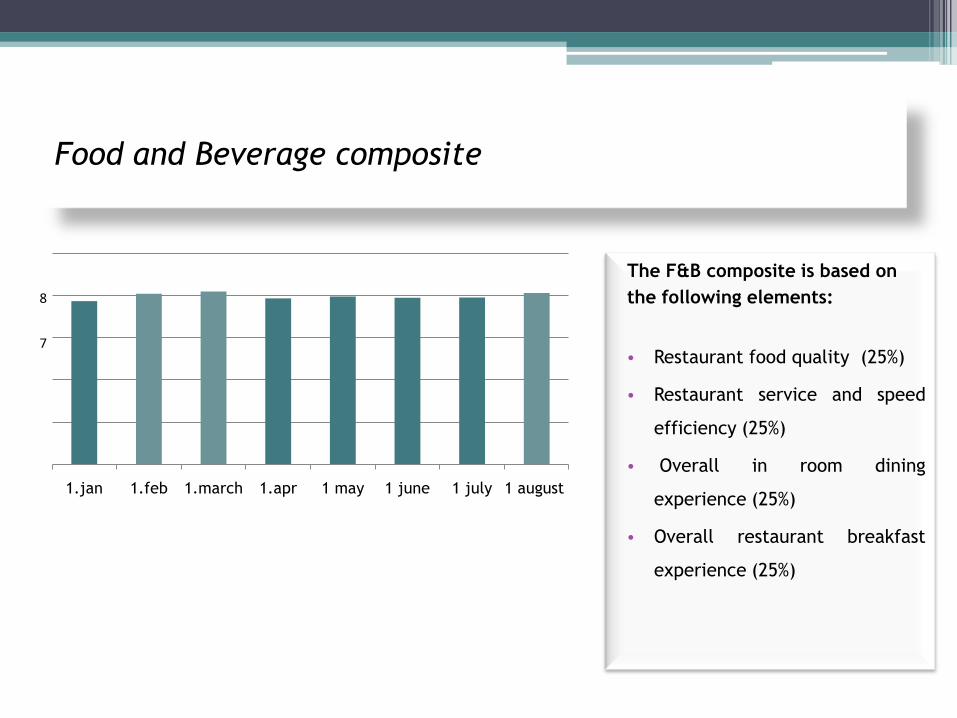
Food and Beverage composite
The F&B composite is based on
the following elements:
• Restaurant food quality (25%)
• Restaurant service and speed
efficiency (25%)
• Overall in room dining
experience (25%)
• Overall restaurant breakfast
experience (25%)
1.jan 1.feb 1.march 1.apr 1 may 1 june 1 july 1 august
7
8

Food and Beverage composite
August 2009
Sheraton Imperial Kuala Lumpur Hotel 8.14
Average among competitors 7.82
Leading among competitors 7.88
August 2009 Sheraton Imperial
Kuala Lumpur Hotel
Average among
competitors
Leading among
competitors
Restaurant food quality 8.30 7.79 7.88
Restaurant service and speed
efficiency
7.99 7.83 7.88
Overall in room dining experience 8.18 7.87 7.91
Overall restaurant breakfast
experience
8.11 7.77 7.82

Essence
Position , September 2009 Number
F&B Operational manager 1
Assistant manager 1
Captain 3
Waiters/Waitresses 12
Bartender 3Essence,
September 2009
Number of employees
Level 1 associate 32%
Level 2 associate 55%
Level 3 associate 13%

PEOPLE1. Associates are not being introduced to the whole picture of operations – start work immediately2. No proper and consistent follow-up among associates 3. Lack of teamwork4. No interest to find and learn new things5. Short of manning 6. Performance punishment – the more you know the more you are assigned with additional tasks7. Guests enter the restaurant all the time – congestion 8. Managers did not communicate well enough on a lot of issues 9. Managers did not give feedback on performance regularly10. Work only, no extra development activities11. Lack of trained associates
METHODS
1. Associates are assigned one specific task in their daily work routine
2. Manager did not consistency coach and observed the performance of associates
ENVIRONMENT
1. Economic downturn
2. Qulity of candidates in KL
MATERIALS
EQUIPMENT

Action plan
Action Plan
1. To embark & comply to the training system
2. To send managers to learn Train the Trainer workshop & Coaching Skills
3. To discuss with associates on performance feedback
4. To add fun and cheerful activities for associates
5. To assess the current practice of the Level 1 competencies trained by semi mystery shopper
6. To discuss with every associate on their performance feedback every month
7. To monitor progress & results from time to time & present rewards in December 2009

TAO – Training Activity Outline
TAO Topic Time
1 Service sequence 30 minutes
2 Communication during service 15 minutes
3 Control and order stock 30 minutes
4 Dealing with special guests 15 minutes
5 Departing guests 15 minutes
6 Dinner service 30 minutes
7 Handling complaints 15 minutes
8 Filling out captains orders 15 minutes
9 Procedure in order taking 30 minutes
10 Presentaion of bill 15 minutes
11 Seating guests 15 minutes
12 Folding and unfolding napkin 15 minutes
13 Food store requisition 15 minutes
14 Greeting/Welcoming guests 30 minutes
15 Grooming standards 30 minutes

Diamond model
(Brainstorming model – Restaurant Speed & Efficiency)
Solutions:
• 1. To have periodical sessions of knowledge on the whole operations of the restaurant / F&B
• 2. To train & coach associates, supervisors & managers regularly
• 3. To use the training system effectively
• 4. To build team spirit & strengthen team interaction among associates
• 5. To develop associates interest to learn & acquire new things / information
• 6. To balance the approach from being too performance focus to being a learning focus – avoid
performance punishment & over pressured associates
• 7. To find a system to ensure associates are assigned with multiple tasks in a day
• 8. To select the right & competent people to join, although the salary might be better
• 9. To give performance feedback (by managers) to associates regularly
• 10. To add in order fun & interesting activities to do while working
• 11. To appoint a dedicated F&B service trainer backed by F&B manager

Operational Excellence represents a philosophy of leadership, teamwork and problem solving
resulting in continuous improvement throughout the organization by focusing on the needs of
the customer, empowering employees, and optimizing existing activities in the process.

Thank you!
Related Documents