econstor www.econstor.eu Der Open-Access-Publikationsserver der ZBW – Leibniz-Informationszentrum Wirtschaft The Open Access Publication Server of the ZBW – Leibniz Information Centre for Economics Nutzungsbedingungen: Die ZBW räumt Ihnen als Nutzerin/Nutzer das unentgeltliche, räumlich unbeschränkte und zeitlich auf die Dauer des Schutzrechts beschränkte einfache Recht ein, das ausgewählte Werk im Rahmen der unter → http://www.econstor.eu/dspace/Nutzungsbedingungen nachzulesenden vollständigen Nutzungsbedingungen zu vervielfältigen, mit denen die Nutzerin/der Nutzer sich durch die erste Nutzung einverstanden erklärt. Terms of use: The ZBW grants you, the user, the non-exclusive right to use the selected work free of charge, territorially unrestricted and within the time limit of the term of the property rights according to the terms specified at → http://www.econstor.eu/dspace/Nutzungsbedingungen By the first use of the selected work the user agrees and declares to comply with these terms of use. zbw Leibniz-Informationszentrum Wirtschaft Leibniz Information Centre for Economics Andres, Christian; Betzer, André; van den Bongard, Inga; Haesner, Christian; Theissen, Erik Working Paper Dividend announcements reconsidered: Dividend changes versus dividend surprises CFR Working Paper, No. 12-03 Provided in Cooperation with: Centre for Financial Research (CFR), University of Cologne Suggested Citation: Andres, Christian; Betzer, André; van den Bongard, Inga; Haesner, Christian; Theissen, Erik (2012) : Dividend announcements reconsidered: Dividend changes versus dividend surprises, CFR Working Paper, No. 12-03 This Version is available at: http://hdl.handle.net/10419/59511

Welcome message from author
This document is posted to help you gain knowledge. Please leave a comment to let me know what you think about it! Share it to your friends and learn new things together.
Transcript
econstor www.econstor.eu
Der Open-Access-Publikationsserver der ZBW – Leibniz-Informationszentrum WirtschaftThe Open Access Publication Server of the ZBW – Leibniz Information Centre for Economics
Nutzungsbedingungen:Die ZBW räumt Ihnen als Nutzerin/Nutzer das unentgeltliche,räumlich unbeschränkte und zeitlich auf die Dauer des Schutzrechtsbeschränkte einfache Recht ein, das ausgewählte Werk im Rahmender unter→ http://www.econstor.eu/dspace/Nutzungsbedingungennachzulesenden vollständigen Nutzungsbedingungen zuvervielfältigen, mit denen die Nutzerin/der Nutzer sich durch dieerste Nutzung einverstanden erklärt.
Terms of use:The ZBW grants you, the user, the non-exclusive right to usethe selected work free of charge, territorially unrestricted andwithin the time limit of the term of the property rights accordingto the terms specified at→ http://www.econstor.eu/dspace/NutzungsbedingungenBy the first use of the selected work the user agrees anddeclares to comply with these terms of use.
zbw Leibniz-Informationszentrum WirtschaftLeibniz Information Centre for Economics
Andres, Christian; Betzer, André; van den Bongard, Inga; Haesner, Christian;Theissen, Erik
Working Paper
Dividend announcements reconsidered: Dividendchanges versus dividend surprises
CFR Working Paper, No. 12-03
Provided in Cooperation with:Centre for Financial Research (CFR), University of Cologne
Suggested Citation: Andres, Christian; Betzer, André; van den Bongard, Inga; Haesner,Christian; Theissen, Erik (2012) : Dividend announcements reconsidered: Dividend changesversus dividend surprises, CFR Working Paper, No. 12-03
This Version is available at:http://hdl.handle.net/10419/59511

CFR CFR CFR CFR Working Paper NO. Working Paper NO. Working Paper NO. Working Paper NO. 12121212----00003333
Dividend Announcements Reconsidered:Dividend Announcements Reconsidered:Dividend Announcements Reconsidered:Dividend Announcements Reconsidered:
Dividend Changes versus Dividend Changes versus Dividend Changes versus Dividend Changes versus Dividend SurprisesDividend SurprisesDividend SurprisesDividend Surprises
C. Andres • A. Betzer • I. van den C. Andres • A. Betzer • I. van den C. Andres • A. Betzer • I. van den C. Andres • A. Betzer • I. van den
Bongard • C. Haesner • E. TheissenBongard • C. Haesner • E. TheissenBongard • C. Haesner • E. TheissenBongard • C. Haesner • E. Theissen
Dividend Announcements Reconsidered:
Dividend Changes versus Dividend Surprises*
Christian Andres, WHU – Otto Beisheim School of Management
André Betzer, BUW – Schumpeter School of Business and Economics
Inga van den Bongard, University of Mannheim
Christian Haesner, WHU – Otto Beisheim School of Management
Erik Theissen, University of Mannheim and Centre for Financial Research, Cologne
ABSTRACT
This paper reconsiders the issue of share price reactions to dividend announcements. Previous
papers rely almost exclusively on a naive dividend model in which the dividend change is
used as a proxy for the dividend surprise. We use the difference between the actual dividend
and the analyst consensus forecast as obtained from I/B/E/S as a proxy for the dividend
surprise. Using data from Germany, we find significant share price reactions after dividend
announcements. Once we control for analysts‘ expectations, the dividend change loses
explanatory power. Our results thus suggest that the naive model should be abandoned. We
use panel methods to analyze the determinants of the share price reactions and find evidence
in favor of the cash flow signaling hypothesis and dividend clientele effects. We further find
that the price reaction to dividend surprises is related to the ownership structure of the firm.
The results do not support the free cash flow hypothesis.
JEL Classification: G35, G34
Keywords: Dividend Announcements; Market Efficiency; Ownership Structure;
Agency Theory
* We thank participants of the 17th annual meeting of the German Finance Association and seminar
participants at the universities of Porto and Luxembourg.
1
1 Introduction
Dividend policy is one of the most intensely researched topics in corporate finance. And yet,
we do not know exactly why firms pay dividends. Most existing theories imply that dividend
announcements convey information and, consequently, affect share prices. A large number of
empirical studies have been conducted in order to discriminate among the competing theories.
The most common approach is to estimate the share price reaction to dividend announcements
in an event study and then relate it to an appropriate set of explanatory variables.
If markets are efficient, share prices will only react to surprises in dividend announcements.
Therefore, a model of expected dividends is required. Most previous papers use a naive
model, where the change in the dividend is taken to be the dividend surprise.1 Some papers
use a dividend estimate obtained from a Lintner (1956) model,2 derive dividend surprises
from option prices,3 or use ad hoc specifications.
4 A natural estimate of the expected dividend
is the average analyst dividend forecast. While using analyst forecasts as a proxy for market
expectations is a standard procedure in the earnings announcement literature (e.g., O'Brien,
1988; Battalio and Mendenhall, 2005), a similar approach has hardly been used in the
dividend announcement literature.5 This is likely due to the fact that I/B/E/S provides data on
dividend forecasts only since a few years.
1 See, e.g., Aharony and Swary (1980), Bernheim and Wantz (1995), Yoon and Starks (1995), Amihud and
Murgia (1997), Gerke et al. (1997) and Gurgul et al. (2003). 2 See, e.g., Watts (1973) and Amihud and Li (2006).
3 Bar-Yosef and Sarig (1992).
4 An example is Gugler and Yurtoglu (2003), who look at firms that increase dividends even though earnings
decrease. 5 We are aware of only four papers that use analyst dividend forecasts in the context of share price reactions to
dividend announcements. All four papers use data from only one analyst firm (Value Line). Fuller (2003)
analyzes the relation between informed trading and dividend signaling. Woolridge (1983) tests the cash flow
signaling hypothesis but does not consider the free cash flow hypothesis (which had not yet been formulated at
the time), nor does he analyze the relation between share price reaction and ownership structure. Leftwich and
Zmijewski (1994) analyze the contemporaneous announcement of earnings and dividends. Bar-Yosef and Sarig
(1992) compare Value Line forecast to an estimate of dividend surprises obtained from option prices. Ofer and
Siegel (1987) and Lang and Litzenberger (1989) investigate changes in analysts‘ earnings forecasts following the
announcement of dividend changes. They do not use data on analyst dividend forecasts, however.
2
In the present paper, we make three contributions to the literature. First, we model dividend
surprises by relating the actual dividend announcement to the average analyst dividend
forecast provided by I/B/E/S.6 Second, we compare the performance of the naive model to
that of our approach. This allows us to assess the accuracy of the naive model relative to that
of an analysts‘ expectations–based approach. Third, in an attempt to discriminate among the
major theoretical explanations of corporate dividend policy, we estimate panel models in
which we relate the share price reaction after the dividend announcement to characteristics of
the firm. When doing so, we classify events into good-news events and bad-news events, both
according to the dividend surprise and the dividend change. Comparing the results allows us
to analyze whether a classification based on our model yields different conclusions than a
classification based on the naive model. We further improve on the methodology of previous
papers by using a random effects panel model instead of pooled OLS.7
In our analysis, we use data from Germany. German data have several advantages. Since
German firms pay dividends once a year, changes in dividends potentially convey more
information than changes in quarterly dividends. The German corporate governance system is
characterized by concentrated share ownership (Franks and Mayer, 2001; Becht and
Boehmer, 2001; Andres, 2008) and weak minority shareholder protection (La Porta et al.,
2000). Given these characteristics conflicts between large and small shareholders may be
relevant for the payout policy of German firms, and for the market reaction to dividend
announcements. Therefore, the ownership structure and other specific features are taken into
account in our empirical analysis.8
6 Brown et al. (2008) have shown that I/B/E/S dividend forecasts are an accurate estimate of the actual dividend
as evidenced by a low forecast error. 7 An alternative to panel estimation is the Fama and MacBeth (1973) procedure, which is used by Amihud and Li
(2006). 8 Some of the institutional features of the German market warrant a closer discussion, which we will return to
when we describe our data.
3
The two most popular theories explaining dividend policy are the cash flow signaling
hypothesis (Bhattacharya, 1979; Miller and Rock, 1985) and the free cash flow hypothesis
(Easterbrook, 1984; Jensen, 1986). The cash flow signaling hypothesis states that managers
use dividend announcements to signal their private information regarding the future cash
flows of the firm. The driving forces behind the free cash flow hypothesis are informational
asymmetries and conflicts of interest between managers and shareholders. Whereas these
conflicts may be prevalent in countries with relatively dispersed ownership such as the U.S.,
they may be less important in countries with concentrated ownership such as Germany.
In firms with concentrated ownership managers are limited in their ability to act at their own
discretion. Large shareholders have both the incentive and the ability to curb managerial
freedom to dispose of free cash flows. Therefore, the monitoring function of large
shareholders makes the classical manager-shareholder conflict less severe. However, conflicts
of interest between large and small shareholders may arise instead (La Porta et al., 2000). In
such a setting, a dividend increase may be interpreted as a signal by which large shareholders
commit not to expropriate minority shareholders. This is the rent extraction hypothesis first
formulated by Gugler and Yurtoglu (2003). It complements (rather than substitutes) the cash
flow signaling and free cash flow hypotheses.
Our results can be summarized as follows. We find that the accuracy of the naive approach is
low when compared to our approach of measuring the dividend surprise by the error in
analysts‘ expectations. Out of more than 500 dividend increases in our sample, less than half
actually constitute a positive surprise. The remaining dividend increases either constitute no-
news events (that is, the dividend increase had been anticipated) or even negative surprises
(analysts had forecasted a larger dividend increase). The results for unchanged dividends and
dividend decreases are less pronounced but point in the same direction. As one would expect
in an efficient market, share prices react to the surprise in the dividend announcement, not to
4
the dividend change per se. When we regress the cumulative abnormal return after a dividend
announcement on the dividend change and our measure of the dividend surprise, we find that
the dividend surprise is highly significant while the dividend change is insignificant. We thus
conclude that our approach of measuring the dividend surprise by the error in analysts‘
expectations outperforms the naive model.
These results still hold when we control for the surprise in earnings announcements, which
are often made together with dividend announcements. Interestingly, we find that dividend
announcements are, if anything, more informative than earnings announcements. Our
regressions aimed at discriminating among competing theoretical explanations of dividend
policy confirm the importance of using dividend surprises instead of dividend changes. We
find that classifying dividend announcements into positive and negative announcements
according to the dividend surprise yields results that are different from those obtained from a
classification by dividend changes. Our regression results provide support for the cash flow
signaling hypothesis and dividend clientele effects. We further find that the price reaction to
dividend surprises is related to the ownership structure of the firm in a non-linear way. Our
results do not support the free cash flow hypothesis. This is in line with our argument that
manager-shareholder conflicts are less important in a country with concentrated ownership.
Our results have important implications for future research on payout policy. They imply that,
whenever data on analyst dividend forecasts are available, the naive constant dividend model
should be abandoned in favor of an estimate of dividend surprises that is based on analyst
forecasts. Our finding that dividend surprises are, if anything, more informative than earnings
surprises suggests that both variables should be used jointly whenever a firm announces
earnings and dividends simultaneously.
The remainder of the paper is organized as follows. The next section develops our hypotheses.
Section 3 describes our sample selection procedure and presents descriptive statistics. Section
5
4 presents the event study results and Section 5 provides the results of our multivariate panel
regressions. Section 6 concludes.
2 Hypotheses
It is a stylized fact that dividend announcements convey information to market participants.
However, in an informationally efficient market, only the unexpected part of the dividend
announcement is informative. Thus, every analysis of the share price reaction to dividend
announcements must rely on a model for expected dividends. The large majority of previous
empirical studies use a naive model that considers dividend changes as dividend surprises.
This model is based on the implicit assumption that market participants expect unchanged
dividends. Although models of payout policy, such as Lintner (1956) or Fama and Babiak
(1968), suggest that firms smooth their dividends, the very same models predict that earnings
changes translate into dividend changes. If firms pay dividends each quarter, the expected
dividend change is typically small. In this case, the previous dividend may be a reasonable
proxy for the market's expectations of the next dividend. However, when firms pay dividends
only once a year (as is the case in Germany and many other countries), this is much less likely
to be the case. In our analysis we therefore use the average of analysts‘ forecasted dividends
as provided by I/B/E/S as a proxy for the market expectations. We believe that the resulting
estimate of the dividend surprise outperforms the naive model. This yields our first
hypothesis:
H1: Share prices react to the dividend surprise, defined as the difference between the actual
dividend announcement and the average analyst forecast as provided by I/B/E/S. The
dividend change (defined as the actual dividend announcement minus the previous dividend)
has no explanatory power for the share price reaction once we control for the dividend
surprise.
6
We sort all dividend announcements into three categories based on our dividend surprise
measure. If the difference between the actual dividend announcement and the mean analyst
forecast is larger than +5% (smaller than -5%) the announcement is classified as good news
(bad news). If the actual announcement is within ±5% of the analyst forecast, we classify the
announcement as no news. This procedure follows Campbell et al. (1997).9 In our
implementation of the naive model, we classify dividend changes of more than +5% (more
than -5%) as dividend increases (dividend decreases). Dividend changes of less than 5% are
treated as unchanged dividends. Note that there may be cases in which an unchanged dividend
or even a dividend increase is bad news. This will be the case whenever market participants
expected an even higher dividend increase.
Dividend and earnings announcements are often made simultaneously. In our panel model we
deal with this by including the earnings surprise (defined as the difference between the actual
earnings figure and analysts‘ expectations obtained from I/B/E/S) as a control variable. This
specification allows us to test whether the dividend surprise or the earnings surprise is more
informative.
Our first hypothesis states that share prices react to the dividend surprise. However, the
magnitude of the dividend surprise is not the only determinant of the share price reaction. The
cash flow signaling hypothesis, the free cash flow hypothesis, the monitoring hypothesis and
the rent extraction hypothesis all argue that dividends serve as signaling and / or monitoring
devices and they all predict that the magnitude of the price reaction to a dividend
announcement will depend on certain characteristics of the firm.
The cash flow signaling hypothesis states that managers (or large shareholders who
effectively control managers) use dividends to signal their private information regarding the
9 Campbell et al. (1997) analyze the impact that earnings announcements have on the firm‘s stock price. They
also employ three categories but they classify an announcement as good (bad) news if the deviation of the actual
earnings from the expected earnings is larger than 2.5% (smaller than -2.5%). As a robustness test, we reclassify
all observations based on the 2.5% threshold. All regression results are qualitatively similar.
7
future cash flows of the firm (Bhattacharya, 1979; Miller and Rock, 1985). Signaling
information to (small) investors via dividend announcements is of greater importance for
smaller firms because smaller firms are usually not adequately covered by financial analysts,
resulting in a larger degree of information asymmetries. Therefore, we hypothesize:
H2: The informational role of dividend announcements is more important in smaller firms,
which are covered by fewer analysts. Hence, the magnitude of the share price reaction is
decreasing in firm size and the number of analysts following the firm.
This hypothesis has been confirmed by, among others, Eddy and Seifert (1988), Yoon and
Starks (1995) and Amihud and Li (2006) for the U.S. market. Using German data, Gugler and
Yurtoglu (2003) do not find a statistically significant relationship between firm size and
dividend announcement returns. We employ the number of analysts covering a firm as our
proxy for the degree of informational asymmetries. Alternatively, we use firm size, measured
by the logarithm of the market value of equity 14 days prior to the dividend announcement.
Because these two variables are highly correlated, we do not include them simultaneously.
The free cash flow hypothesis is based on the presumption that managers will invest cash
available to them even when there are no investment opportunities with positive net present
value (Easterbrook, 1984; Jensen, 1986). Dividend payments decrease the level of free cash
flow and can therefore serve to mitigate the overinvestment problem. Consequently, when
firms with ample free cash flow and / or poor investment opportunities (as indicated by
Tobin's Q ) increase their dividend payout, this signals lower agency costs.
H3a: Firms with higher free cash flows experience a larger price appreciation (drop) after a
positive (negative) dividend surprise.
H3b: Firms with poor investment opportunities as measured by Tobin’s Q experience a larger
price appreciation (drop) after a positive (negative) dividend surprise.
8
Lang and Litzenberger (1989) were the first to test the free cash hypothesis using data from
the U.S. market. Their results support the hypothesis. Gugler and Yurtoglu (2003) use data
from Germany and confirm the results of Lang and Litzenberger. The evidence is far from
unanimous, however. Yoon and Starks (1995), using a larger U.S. sample than Lang and
Litzenberger (1989), find no evidence to support the free cash flow hypothesis. They argue
that the stronger price appreciation after dividend increases of firms with Q less than unity is
due to the characteristics of these firms. They show that firms with Q less than unity are
smaller, have a higher dividend change and exhibit a higher dividend yield. After controlling
for these characteristics, they find no systematic relation between the price reaction to
dividend announcements and Tobin's Q. We also include these control variables in our panel
regressions. We further include the firm's leverage ratio as a control variable because debt
also mitigates the overinvestment problem associated with free cash flow and can be regarded
as a substitute for high payout levels.
The free cash flow hypothesis is based on the agency conflict between managers and
shareholders. Blockholders have strong incentives to monitor managers. Therefore, the
existence of a large shareholder may alleviate the classical agency problem. However, in
firms with powerful blockholders, additional conflicts of interest may emerge between large
and small shareholders as the former may have an incentive to expropriate the latter, for
example by tunneling (Bebchuk, 1999). In line with this argument, several studies indicate a
non-linear impact of block-ownership on firms‘ agency costs (Morck et al., 1988; McConnell
and Servaes, 1990; Miguel et al., 2004). These non-linearities imply that, to a certain point,
monitoring by large blockholders reduces agency costs by aligning the incentives of managers
and shareholders. This suggests that there will be less need to use dividends to signal reduced
agency conflicts. However, higher levels of control open up the possibility for large
shareholders to abuse their position by acting in their own interest rather than in the interest of
all shareholders (Shleifer and Vishny, 1997). As dividends are distributed among shareholders
9
in proportion to their cash flow rights, an increase in dividends reduces the resources that
large shareholders can potentially divert. Consequently, a dividend increase signals a
reduction of potential agency conflicts between small and large shareholders. This is the rent
extraction hypothesis first formulated by Gugler and Yurtoglu (2003).
Combining the previous arguments yields the prediction of a non-linear relation between
ownership concentration and the share price reaction to dividend announcements. At low
levels of ownership concentration the monitoring effect dominates. An increase in ownership
concentration aligns the incentives of managers and shareholders. Consequently there is less
need to use dividends to signal lower agency costs. At high levels of ownership concentration
the rent extraction effect kicks in. Potential conflicts of interest between small and large
shareholders become important, and dividends can be used as a device to signal that large
shareholders abstain from expropriating minority shareholders. We thus expect a j-shaped or
u-shaped relation between ownership concentration and the share price reaction to dividend
announcements. Higher ownership concentration results in a smaller price reaction, but at a
decreasing rate. The relation becomes positive when the rent extraction effect becomes
stronger than the monitoring effect.
H4: The relation between ownership concentration and the share price reaction to dividend
announcements is non-linear and follows a j-shape or u-shape.
Common measures of the ownership structure are the shares of the voting rights held by the
largest and the second largest shareholder (e.g. Gugler and Yurtoglu 2003). However, the
simplicity of these measures comes at a cost. A simple example illustrates the problems that
may arise. Assume a decision has to be taken by simple majority vote. Assume that the largest
shareholder owns 60 percent of the votes and the second-largest shareholder owns 10 percent.
As the largest shareholder already holds a majority stake, his position cannot be contested and
the voting rights of the second largest shareholder will effectively be irrelevant in every

10
majority decision. The situation is different if the largest shareholder owns less than 50
percent of the votes. Consider a firm with three shareholders, two holding 45 percent each and
a third holding 10 percent of the votes. Here, any shareholder is able to potentially form a
winning coalition. This means that each shareholder holds the same power, even though the
disparity in voting rights is substantial. It becomes apparent that the mere share of voting
rights does not necessarily reflect the power that those votes actually possess. How much
power a shareholder has to affect the firm's decisions does not only depend on his own voting
stake, but depends crucially on the distribution of voting rights among all shareholders.
Hence, methods to determine voting power and control contestability need to consider the
entire ownership structure. Therefore, we employ the Shapley-Shubik (1954) index to identify
a shareholder‘s voting power.10
The index measures a shareholder‘s relative importance as her
ability to change a voting coalition from a losing to a winning one, given the distribution of
voting rights. Put simply, it attributes each shareholder a power index reflecting the
probability that she is pivotal in determining the outcome of a cooperative game. We calculate
Shapley-Shubik values using quotas of both 25 and 50 percent. We also use 25% because
according to the German Stock Corporation Act (Aktiengesetz), a stake of 25% provides a
blocking minority and allows holders of voting shares to veto specific important decisions
such as the issuance of new shares, dismissal of directors or amendments to the articles of
incorporation. During our sample period, only shareholdings of more than 5% had to be
registered with the German Financial Supervisory Authority. Therefore, the information about
firm ownership is necessarily incomplete and assumptions must be made about the
undisclosed holdings. One way would be to consider the entirety of unknown shareholding as
powerless and to rescale the voting stakes of large shareholders to 100 percent. Instead of
ignoring these stakes, we interpret unobserved voting rights in the sense of an oceanic game
10
We thank an anonymous referee for suggesting this measure.
11
(Shapiro and Shapley, 1978), i.e. there is a small number of large shareholders and an ―ocean‖
of shareholders with very small voting stakes.
Finally, the price reaction to dividend announcements may be related to the preferences of the
shareholders of a firm. A firm that offers a high dividend yield is likely to have shareholders
with a (potentially tax-induced) preference for dividend payouts. As these shareholders value
dividends highly, the price reaction to dividend announcements should be stronger (dividend
clientele effect; Bajaj and Vijh, 1990).
H5: Share prices react more strongly to dividend surprises in firms with higher dividend
yields.
3 Data and Descriptive Statistics
The initial sample for our analysis consists of all 150 firms included in the DAX, MDAX, or
SDAX11
indices as of December 31, 2002. Our sample period covers the years 1996-2006.
German firms pay and announce dividends on a yearly basis. Therefore, our sample
potentially consists of 1,650 firm-year observations. Data on dividend announcements are
obtained from Reuters newswires. We exclude 312 firm-year observations because we were
unable to identify the exact dividend announcement date. Following Amihud and Li (2006)
we exclude firms in the financial services sector (122 firm-year observations). In addition,
firm-years in which a firm had a ―control agreement‖12
in place (7 firm-years), or years in
which firms acted as either acquirer or target in an M&A transaction (11 firm-years) are also
11
The DAX (largest firms), MDAX (mid caps) and SDAX (smaller caps) are calculated by Deutsche Börse AG.
They do not include "new economy" firms. We do not include these firms because a) most of them went public
only in the hot issue market at the end of the 1990s, and b) many of these firms did not pay dividends. We note
that the three indices alluded to above comprise about one third of the listed firms in Germany. Most firms that
are not covered are very small and have insufficient analyst coverage to be included in our analysis. 12
Control agreements are defined as agreements between a company and its parent company and take the form
of either Profit and Loss Agreements (Gewinnabführungsvertrag) or Subordination of Management Agreements
(Beherrschungsvertrag).
12
dropped from the sample. All accounting data items and share price data are obtained from
the Thompson Financial Datastream database. 31 firm-year observations are excluded
because of missing data items.
As already noted, we keep observations where dividend and earnings announcements are
made on the same date. In order to control for the information conveyed by the earnings
announcement, we include the earnings surprise as a control variable in our panel regressions.
However, there are 65 cases in which other potentially value-relevant information (e.g.,
restructurings, changes in the composition of the board) is released on the same day as the
earnings announcement. We exclude these observations from the sample. This reduces the
size of our sample to 1,102 firm-year observations.
A major contribution of our paper is the use of dividend forecasts provided by Institutional
Brokers‘ Estimate System (I/B/E/S) as a proxy for the market‘s dividend expectations.13
We
use the arithmetic mean (the median is used in a robustness check) of the final forecasts made
by the analysts following a firm prior to the announcement of the dividend payment.14
We
only include firm-years that are covered by at least two analysts. This requirement leads to the
exclusion of another 181 firm-year observations and reduces our final sample to 921
observations.15
Some of our sample firms (21 firms in 2002) have issued multiple share classes, usually
common shares that carry a voting right along with non-voting preference shares.16
In these
13
To address the objection of Ljungqvist et al. (2009) that downloads from the I/B/E/S database may have been
subject to errors before 2008, we check our data for consistency using a very recent download from the I/B/E/S
database for a subsample and find no systematic bias in our data. 14
In 93% of our observations, the consensus estimate refers to the last month before the dividend payment was
announced. In 63 cases (6.8%), we use earlier forecast data (up to three months). Observations are excluded
when no analyst forecasts were available for the three months preceding the dividend announcement. 15
It should be noted that the requirement that a firm be covered by at least two analysts results in the exclusion
of those firms where informational asymmetries are supposedly most pronounced. This might introduce selection
bias. 16
The only exception is Siemens AG, where preference shares are endowed with six times the voting rights of
ordinary shares (from 1920 until 1998). Voting and cash flow rights of Siemens AG are adjusted accordingly.
13
cases, we only include one class of shares in our sample.17
A closer look at these firms reveals
that dividends on common shares usually change along with dividends on preference shares, a
finding that confirms the observation of Goergen et al. (2005) regarding German firms during
the period from 1984 to 1993.
We include special dividends in our dividends per share measure. It has been pointed out in
the literature (see, e.g., Goergen et al., 2005; Andres et al., 2009) that special dividends
frequently reflect permanent changes in dividends rather than transitory increases. However,
large one-off payments (Sonderausschüttungen) - which are associated with special
anniversaries or the sale of subsidiaries - are excluded. This procedure is also in line with
previous studies on the dividend policy of German firms, such as Behm and Zimmermann
(1993), Goergen et al. (2005) and Andres et al. (2009).
Hypothesis 4 predicts that the ownership structure of a firm is a potential determinant of the
share price reaction to a dividend surprise. We therefore collect data on ownership structures
from the Hoppenstedt Aktienführer.18
All holdings of ordinary shares and preference shares in
excess of 5% are recorded on an annual basis.19
From the ownership data collected, we
calculate the voting power of the largest and second largest shareholder as their respective
Shapley-Shubik values.
Table 1 presents summary statistics for the final sample. In Panel A we report separate figures
for firms that increased, decreased, and maintained their dividends. We consider a dividend
change of less than 5% as an unchanged dividend since many of these small changes reflect
rounding errors (due, for example, to the conversion from Deutsche Mark to Euro). The 5%
17
The most common case is that the voting shares are privately held while the non-voting shares are listed. In
these cases, the I/B/E/S database only contains forecasts for the dividend of the non-voting shares. 18
This is a yearly publication that provides in-depth information about all listed German corporations. 19
During our sample period, shareholdings of more than 5% must be registered with the German Financial
Supervisory Authority (BaFin, see §21 of the German Securities Trading Act (Wertpapierhandelsgesetz)).
Shareholdings of less than 5% - even when reported in Hoppenstedt - are excluded for reasons of data
consistency.
14
threshold should be viewed in the context of the average magnitude of dividend changes in
Germany. Andres et al. (2009) document an average dividend increase (cut) of 36% (30%) for
a sample of 220 German firms for the period 1984-2005. Therefore, we consider the 5%
threshold - though much larger than the 0.5% threshold employed by Amihud and Li (2006)
for their U.S. sample - to be reasonable.
In 521 out of the 921 firm-year observations (56.5%), firms increase their dividends (18 of
these cases (3.5%) are dividend initiations). Another 312 observations (33.9%) are associated
with maintained dividends. We observe only 88 (9.6%) dividend cuts.20
Among these, 33
cases (or 37.5% of the dividend cuts) are dividend omissions.
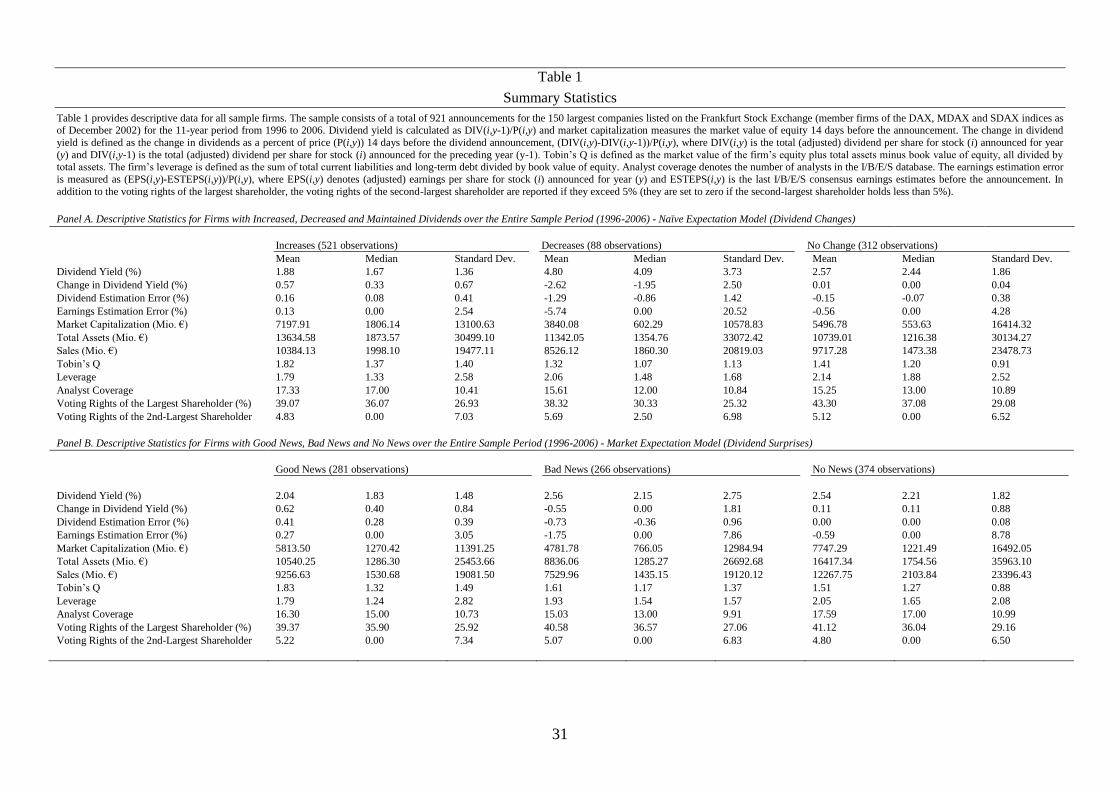
Panel A of Table 1 shows that firms that increase their dividends differ substantially from
firms that maintain or decrease dividend payments. With an average leverage ratio21
of 1.79,
they are less heavily leveraged than firms that decrease (2.06) or maintain (2.14) their
dividends. In addition, they exhibit higher Tobin‘s Q values22
(1.82 compared to 1.32 for
firms that cut dividends, and 1.41 for firms that maintain dividends) and a much lower
average dividend yield23
(1.88% as compared to 4.80% for decreased and 2.57% for
maintained dividends), suggesting that firms that increase dividends tend to be growth stocks.
On the other hand, firms that increase dividends are slightly larger than firms in the other two
subgroups, both in terms of total assets and in terms of sales. With respect to ownership
structure, our sample confirms one of the stylized facts of the German corporate governance
20
Compared to Gugler and Yurtoglu (2003), we observe a slightly higher number of dividend increases and less
dividend decreased. In their sample (from 1992 through 1998), 43.8% of the announcements are classified as
dividend increases, 36.8% as unchanged dividends, and 19.4% as dividend cuts. 21
Leverage is defined as the sum of total current liabilities and long-term debt divided by the book value of
equity. 22
Tobin‘s Q is defined as the market value of equity (including preference shares wherever appropriate) plus
total assets minus book value of equity, divided by the book value of total assets. 23
The dividend yield (DIV_Y) is defined as DIV(i,t-1) / P(i,t), where DIV (i,t-1) is the dividend per share of firm
(i) in year t-1, and P(i,t) is the split adjusted share price 14 days before the dividend is announced in year t. This
definition follows the procedure suggested in Amihud and Murgia (1997).
15
system, namely, the high degree of ownership concentration. On average, about 45% of the
voting shares are held by the two largest shareholders.
(Insert Table 1 about here)
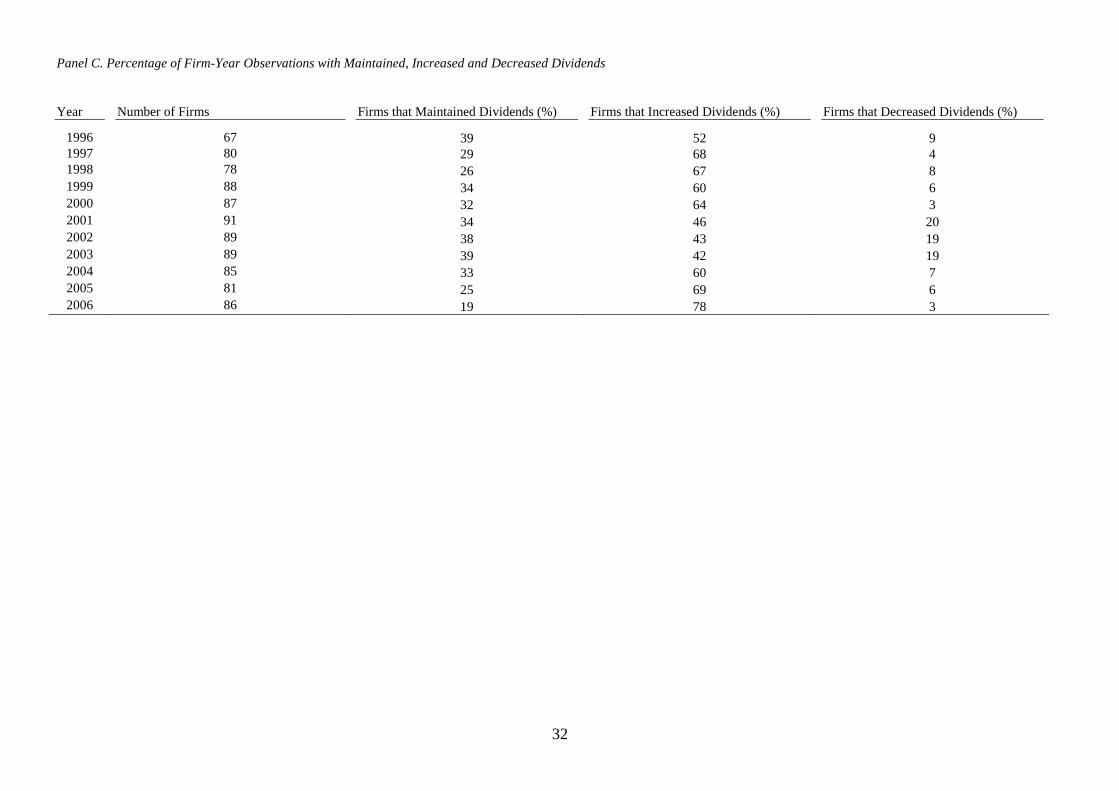
The percentage of firm-year observations with increased, decreased, and maintained
dividends over the sample period is documented in Panel C of Table 1. The distribution of
dividend increases, dividend cuts and unchanged dividends in our sample mirrors the trend
observed in other recent empirical studies (see, e.g., Julio and Ikenberry, 2004). With the
exception of 1996 an 1997, the percentage of firms that increase dividends declines gradually,
reaching a low of 42% in 2003, before taking a sharp turn upward in 2004. In line with a poor
economic environment following the burst of the technology bubble, the proportion of
dividend-cutting firms is significantly higher during the years 2001-2003. In sum, our 11-year
sample period covers an economic boom period, followed by a recession, which is then
followed by a second upswing.
The classification into dividend increases, decreases and maintained dividends conforms to
the naive expectations model. However, we argue that using analyst forecasts to classify
events into good news (positive surprise), bad news (negative surprise) and no news events is
preferable because only the unexpected component of an announcement should trigger a share
price reaction. Following Campbell et al. (1997) we define dividend announcements as good
news (bad news) if the announcement is more than 5% above (below) the dividend expected
by analysts. Announcements that lie within a 10% range around the expected dividend are

16
classified as no news.24
Our proxy for the market's dividend expectations is the average of (at
least two) analyst forecasts in the month preceding the dividend announcement.25
Our sample consists of 281 good news events (as compared to 521 dividend increases), 266
bad news events (as compared to 88 dividend reductions) and 374 no news events (as
compared to 312 cases with an unchanged dividend). These numbers already illustrate that the
naive model results in a classification that is very different from that obtained when taking
market expectations into account.
Descriptive statistics for the good news, bad news and no news events are provided in Panel B
of Table 1. Even though the numbers are slightly different from those in Panel A, the
qualitative results are similar. Good news events are associated with lower leverage ratios,
higher values of Tobin's Q and lower dividend yields. Good news firms are also larger in
terms of total assets and sales as compared to bad news and no news firms.
4 Event Study Results and Univariate Analysis
We measure the stock price reaction to the announcement of dividend payments using
standard event-study methodology. Based on the market model (Brown and Warner, 1985),
the abnormal return εit for firm i on day t is calculated as
mtiiitit RR ˆˆ , (1)
where Rit is the return of firm i on day t, and Rmt is the return on the CDAX, our proxy for the
market portfolio,26
on day t. The coefficients ˆi and ˆ
i are OLS estimates obtained from
regressions of firm i‘s daily returns on the CDAX return over the estimation window running
24
As mentioned above, we change the bandwidth of the no news category to 5% (i.e. dividend announcements
are classified as good news (bad news) if the announcement is more than 2.5% above (below) the dividend
expected by analysts) to test the robustness of the results. All coefficient estimates and significance levels are
similar to the results reported in the paper. 25
As a robustness test, we also use the median of analyst forecasts and re-estimate all regressions using the
median-based classification into good news, bad news, and no news. The results are not reported (but available
on request) as they are qualitatively similar. 26
The CDAX is a broad, value-weighted German index and comprises about 350 firms.
17
from t = -121 to t = - 2 (relative to the announcement day t = 0). We use two measures of
abnormal returns: the average abnormal return on the announcement day, AAR0, and the
cumulative average abnormal return, CAAR-1;1, measured over a three-day period centered on
the event day. The statistical tests are based on the standardized cross-sectional t-statistic
proposed by Boehmer et al. (1991) and the rank test of Corrado (1989).
Table 2 reports the event study results. In Panel A, all announcements are first classified
according to the naive model into three groups: dividend increases, decreases and unchanged
dividends. These groups are then subdivided into good news, bad news, and no news events,
based on the dividend surprise (as defined above). We do not report results for two subgroups
with ten observations or less.
The results in Panel A show that share prices increase after the announcement of a dividend
increase. The average abnormal return on the announcement day, AAR0, is significantly
positive at 0.70%. The cumulative abnormal return over a three-day window, CAAR-1;1, is
also positive and highly significant at 1.13%. When we subdivide the dividend increases into
good news, bad news and no news events, it becomes obvious that an increase in dividends
does not necessarily imply good news for market participants. Out of 521 dividend increases,
only about 48% (248) are in fact positive surprises, i.e. positive deviations from the analysts‘
expectations. In cases in which market participants expected an even higher increase (cases in
which the announcement represents bad news in spite of an increased dividend) we observe
an announcement day return of -0.10% and a CAAR-1;1 of 0.10% (both statistically
insignificant).
Dividend decreases trigger a significantly negative share price reaction on the event day. The
AR0 amounts to -0.86%. The three-day CAAR-1;1 is also negative at -0.30%, but is
insignificant. In both cases the share price reactions are more pronounced when the dividend
18
decrease represents bad news. In the other two cases (dividend reductions that are good news
or no news) the number of observations is too small to report reliable results.
The average abnormal return for announcements of an unchanged dividend is positive and
weakly significant at 0.22%. The three-day CAAR-1;1 is positive and significant at 0.65%. A
closer look at the three subcategories reveals that the positive announcement return for
unchanged dividends is driven by a highly significant return of 2.24% for announcements in
which a maintained dividend is a positive surprise for market participants. This result
confirms hypothesis 1, which states that market expectations play an important role in share
price reactions to dividend announcements.
(Insert Table 2 about here)
Panel B of Table 2 shows the results that we obtain when we first sort by the dividend
surprise and then subdivide into dividend increases, reductions and maintained dividends.
Abnormal returns are highest for dividend announcements that constitute good news for
market participants, with an average announcement day return of 0.95% and a three-day
CAAR-1;1 of 1.59% (both highly significant). Bad news announcements are associated with a
significantly negative announcement day abnormal return. The three-day cumulative
abnormal return, however, is slightly positive but insignificant. Surprisingly, we find that no
news events are associated with significantly positive abnormal returns. These are slightly
larger when the no news event is a dividend increase.
The results presented in Table 2 imply that sorting by dividend changes and dividend
surprises yields different results. Admittedly, however, the results are somewhat less clear-cut
than one might have hoped. In particular, the finding that no-news events are associated with
positive abnormal returns is surprising. A possible explanation for this result is that the
descriptive statistics presented thus far do not control for earnings announcements that are

19
often made on the same day as dividend announcements. We return to this issue when we
present the results of our panel estimation in the next section.
5 Panel Analysis
The descriptive analysis in the previous section shows that market expectations are an
important determinant of the share price reaction to dividend announcements. It is natural to
ask whether the dividend change has explanatory power for the abnormal return once we
control for the dividend surprise. In order to answer this question we estimate three panel
models. We use the random effects estimator, which is favored over the less efficient fixed
effects estimator based on a Hausman test.27
The first model is the baseline specification. The dependent variable is the three-day
CAAR-1;1. The explanatory variables are year and industry dummies (results not reported) and
a measure of the dividend change, namely, the change in the dividend yield. It is defined as
the current minus last year‘s dividend per share, standardized by the split-adjusted stock price
14 days before the dividend is announced. The coefficient on the change in the dividend yield
is positive and significant. Thus, when we do not control for the dividend surprise we find that
the cumulative abnormal returns are significantly related to the magnitude of the dividend
change.
In model 2 we replace the change in the dividend yield with the dividend surprise, defined as
dividend per share minus the estimated dividend per share (based on the last I/B/E/S
consensus forecast prior to the announcement), both divided by the split-adjusted stock price
14 days before the dividend is announced. The dividend surprise yields a highly significant
coefficient that has twice the magnitude of the coefficient on the change in dividend yield in
model 1.
27
The main conclusions of our study do not change if the fixed effects estimator or the OLS estimator is used
instead.
20
(Insert Table 3 about here)
Model 3 includes both variables. The coefficient estimate for the dividend surprise is
statistically significant at the 1% level, whereas the coefficient estimate for the dividend
change is insignificant. We can thus conclude that dividend surprises, not dividend changes,
drive the cumulative abnormal returns.28
As noted previously, dividends and earnings are often announced simultaneously. In order to
disentangle the effects that dividend and earnings announcements have on share prices, we
estimate model 4, which includes the earnings surprise as an additional independent variable.
It is defined as the difference between the actual earnings per share and the I/B/E/S consensus
forecast, standardized by the stock price 14 days before the dividend announcement. The
variable is set to zero when no earnings announcement was made on the event date.29
Neither
the change in the dividend yield nor the earnings surprise has explanatory power for the
abnormal returns. The dividend surprise, on the other hand, is positively and significantly
related to the CAARs. These results stand in contrast to those reported in Leftwich and
Zmijewski (1994). Based on a sample of contemporaneous quarterly earnings and dividend
announcements these authors conclude that earnings announcements provide information
beyond that provided by dividend announcements. A possible reason for the different findings
is the fact that U.S. firms announce both dividends and earnings each quarter. German firms,
on the other hand, make dividend announcements only once a year, but often announce
earnings on a quarterly basis (although there is no legal requirement to do so). Consequently,
the relative information content of dividend announcements as compared to earnings
announcements may be higher in Germany than in the U.S. We further note that the
28
As a robustness check, we include long-term volatility in our models to control for information asymmetry
between managers and shareholders. In line with Amihud and Li (2006), long-term volatility is measured by the
standard deviation of monthly returns in the 24 months priot to the month of the dividend announcement. Re-
estimating our panel models including this measure, we obtain very similar results. 29
We re-estimate model 4 and include only those cases in which a dividend and an earnings announcement are
made on the same day. The results are virtually identical, and are therefore omitted.
21
regressions shown in Table 3 do not control for other variables which may affect the CARs.
They may thus suffer from omitted variables bias. Table 4 later in the paper shows the results
of regressions that include additional explanatory variables.
These results corroborate hypothesis 1. They allow two conclusions. First, they suggest that
studies of dividend announcements should take market expectations into account and thus
should consider dividend surprises rather than dividend changes. Second, the results imply
that, in cases in which earnings announcements and dividend announcements are made on the
same day, share prices react to the dividend announcement, not to the earnings
announcement.30
In the next step we extend the set of independent variables in order to test hypotheses 2, 3, 4,
and 5. We include the dividend surprise and the earnings surprise as control variables. The
number of analysts following is used as a proxy for the degree of informational asymmetry.
The cash flow signaling hypothesis (hypothesis 2) predicts a lower share price reaction if
informational asymmetries are less pronounced. In order to test the free cash flow hypothesis
(hypotheses 3a and 3b) we include three variables. The first is the ratio of free cash flow31
to
sales for the previous financial year. The second variable is the natural logarithm of Tobin's
Q. This variable is intended to identify firms without profitable investment opportunities. We
expect a positive (negative) coefficient on the free cash flow variable (hypothesis 3a) and a
negative (positive) coefficient on Tobin‘s Q (hypothesis 3b) for good news (bad news)
announcements. We further include the leverage ratio as the free cash flow hypothesis
suggests that dividends and debt serve as substitutes.
30
We note that, at least in the first years of our sample period, many firms are still using German accounting
standards rather than IAS/IFRS or US-GAAP. It would be interesting to explore whether the lack of a share price
reaction to earnings announcement is due to the specific characteristics of German accounting standards. An
investigation of this issue is, however, beyond the scope of this paper. 31
The free cash flow is defined as EBIT + depreciation - taxes + delta def. taxes - minority interest - interest -
dividends + extra items.

22
Hypothesis 4 predicts that ownership structure matters. As explained in section 2 we expect a
j-shaped or u-shaped relationship between the voting power of the largest shareholder and the
announcement returns. At low levels, increasing voting power reflects the shareholders
increasing ability and willingness to monitor. At higher levels, voting power allows to extract
rents at the cost of the remaining (minority) shareholders. In order to capture this potential
non-linearity, we include the Shapley-Shubik value of the largest shareholder as well as its
squared value.
We also include the Shapley-Shubik value of the second largest shareholder. We hypothesize
that larger values thereof reflect the ability of the second largest shareholder to exert a
controlling influence on the first shareholder. Consequently, a positive (negative) dividend
surprise provides a weaker signal on reduced (increased) agency conflicts and hence weakens
the market reaction.
Finally, to capture a possible clientele effect, we include the dividend yield as independent
variable (hypothesis 5). We expect a positive (negative) coefficient on this variable for good
news (bad news) announcements. Our regression models further include year and industry
dummies (results not reported). For some of the variables, we expect opposing signs for good
news and bad news announcements. To provide an example, when share prices of larger firms
react less strongly to dividend surprises, we expect a negative relation between firm size and
the magnitude of the CAARs for good news announcements, but a positive relation for bad
news announcements. We therefore estimate separate models for good news announcements
and bad news announcements. The no news announcements are excluded from the analysis.
To ensure that our results can be compared to those of previous studies, we repeat the analysis
using the subsamples of dividend increases and decreases instead of the good news and bad
news subsamples.
23
Tables 4a and 4b present the results for all four specifications. The tables differ in the way we
calculate the Shapley-Shubik index. In table 4a, we use a quota of 25%, whereas in table 4b,
the quota is set to 50%. Considering the good news subsample first, we confirm our earlier
result that the CAARs are positively related to dividend surprises. This confirms hypothesis 1.
However, with the additional explanatory variables included, the earnings surprise now also
has explanatory power.
The negative coefficient on the number of analysts is consistent with cash flow signaling
(hypothesis 2). Informational asymmetries are more pronounced in firms followed by fewer
analysts.32
Therefore, dividend announcements made by these firms convey more
information.
The free-cash-flow-to-sales ratio, Tobin's Q and the leverage ratio are all not significantly
different from zero.33
Thus, we do not find support for the free cash flow hypothesis
(hypotheses 3a and 3b). This is in line with the findings of Yoon and Starks (1995).
Our predictions with respect to the relationship between abnormal returns and the voting
power of the largest shareholder find empirical support. Consistent with the monitoring effect
the coefficient on the Shapley-Shubik value for the largest shareholder is negative. This
implies that increases in the voting power of the largest shareholder are associated with a
weaker price reaction to dividend news. The coefficient on the squared Shapley-Shubik value
is positive. This is consistent with the rent extraction hypothesis. At high levels of voting
power the largest shareholder has the power to expropriate minority shareholders. She can use
dividend announcements to signal that she abstains from such rent-extracting activities. This
signaling role for dividend announcements results in a stronger share price reaction which
32
Using the market value of equity rather than the number of analysts yields qualitatively similar results (not
reported). 33
We also estimate a model that includes an interaction term between free cash flow and Tobin's Q. The
coefficient estimate of the interaction term is insignificant.
24
counterbalances the negative impact due to the monitoring effect. The Shapley-Shubik value
for the second largest shareholder is never significant.
The positive coefficient on the dividend yield is consistent with the existence of dividend
clientele effects. Firms with higher dividend yields have shareholders who value dividends
more highly. Consequently, the share price reacts more strongly to dividend news.
(Insert Tables 4a and 4b about here)
In column 2 we consider dividend increases instead of good news events. Despite the much
larger number of observations, this specification yields lower explanatory power. Both the
coefficients on the number of analysts and on the Shapley-Shubik values of the largest
shareholder lose significance. Thus, a categorization based on the naive dividend expectations
model may lead to different conclusions. While the results of model 1 – the "good news"
model – support the cash flow signaling, monitoring and rent extraction hypothesis, the
results of model 2 – the naive model – do not. Given our previous results, which clearly
favored dividend surprises over dividend changes, we conclude that, whenever data on analyst
dividend forecast are available, the naive model should be abandoned in favor of a model that
takes market expectations into account.
In the bad news sample, the dividend surprise is again positively related to the CAARs, as
expected. However, in contrast to the good news sample, the earnings surprise has no
additional explanatory power. All other variables are insignificant. Thus, we find no support
for any of the theories when we consider bad news events. This conclusion does not change
when we consider dividend reductions instead. The insignificant results may in part be due to
the small number of observations in the bad news and dividend decrease samples. To put
these results further into perspective, we wish to note that many related papers do not even
present results for dividend decreases (see, e.g., Bernheim and Wantz, 1995; Amihud and Li,
25
2006). Bernheim and Wantz (1995) argue that market reactions to dividend cuts are likely to
be driven by fundamentally different processes compared to reactions to dividend increases.
To summarize, our analysis shows that share prices react to dividend surprises, not to
dividend changes. With regard to the good news subsample, we document a number of further
results. We find a negative relation between the number of analysts and the CAARs after
positive dividend surprises, consistent with the cash flow signaling hypothesis. In addition,
we also find supporting evidence for a dividend clientele effect and we document a significant
and non-linear relation between the price reaction to dividend surprises and the ownership
structure of the firm. These results are consistent with both the monitoring and the rent
extraction hypotheses. We do not find evidence in favor of the free cash flow hypothesis.
6 Conclusion
It is a stylized fact that share prices react to dividend announcements. In an efficient market,
however, we should expect that only unanticipated dividend changes trigger a share price
reaction. A natural estimate of the surprise in the announcement is the difference between the
actual dividend and the analyst consensus forecast. Such a procedure is standard in the
earnings announcement literature, but has rarely been applied in the dividend announcement
literature, most likely because of a lack of appropriate data.
In this paper we try to fill this gap in the literature. We analyze dividend announcements
made by German firms in the period from 1996 to 2006. We perform a standard event study
and then use random effects panel models to analyze the determinants of the cumulative
abnormal returns. The results show that share prices react to the surprise in the dividend
announcement, not to a dividend change per se. Our results also suggest that, when dividend
and earnings announcements are made on the same day, the dividend surprise has, if anything,
higher explanatory power for the share price reaction than the earnings surprise.
26
We estimate panel regressions to discriminate between several popular hypotheses that aim to
explain the price reaction to dividend announcements: the cash flow signaling hypothesis, the
free cash flow hypothesis, the monitoring and rent extraction hypothesis and dividend
clientele effects. When analyzing positive dividend surprises we find evidence in favor of the
cash flow signaling hypothesis and dividend clientele effects. We further document a non-
linear relation between the cumulative abnormal returns and the ownership structure of the
firm which is consistent with the monitoring and rent extraction hypotheses. The free cash
flow hypothesis receives no support. The results of the panel analysis are different when we
consider dividend changes rather than dividend surprises. Most importantly, results of the
naive model based on dividend changes do support neither the dividend signaling hypothesis
nor the monitoring or rent extraction hypothesis. We therefore conclude that the naive model
may yield misleading results. Our results thus suggest that future research on dividend
announcements should make use of the analyst forecast data that are now readily available.
27
References
Aharony, J. and I. Swary (1980), ‗Quarterly Dividend and Earnings Announcements and
Stockholders‘ Return: An Empirical Analysis‘, The Journal of Finance, Vol. 35, No.
1, pp. 1–12.
Amihud, Y. and K. Li (2006), ‗The Declining Information Content of Dividend
Announcements and the Effects of Institutional Holdings‘, The Journal of Financial
and Quantitative Analysis, Vol. 41, No. 3, pp. 637–60.
——— and M. Murgia (1997), ‗Dividends, Taxes, and Signaling: Evidence from Germany‘,
The Journal of Finance, Vol. 52, No. 1, pp. 397–408.
Andres, C. (2008), ‗Large Shareholders and Firm Performance: An Empirical Examination of
Founding-Family Ownership‘, The Journal of Corporate Finance, Vol. 14, No. 4, pp.
431–45.
———, A. Betzer, M. Goergen and L. Renneboog (2009), ‗Dividend Policy of German
Firms: A Panel Data Analysis of Partial Adjustment Models‘, The Journal of
Empirical Finance, Vol. 16, No. 2, pp. 175–87.
Bajaj, M. and A. Vijh (1990), ‗Dividend Clienteles and the Information Content of Dividend
Changes‘, The Journal of Financial Economics, Vol. 26, No. 2, pp. 193–219.
Bar-Yosef, S. and O. Sarig (1992), ‗Dividend Surprises Inferred from Option and Stock
Prices‘, The Journal of Finance, Vol. 47, No. 4, pp. 1623-40.
Battalio, R. and R. Mendenhall (2005), ‗Earnings Expectations, Investor Trade Size, and
Anomalous Returns around Earnings Announcements‘, The Journal of Financial
Economics, Vol. 77, No. 2, pp. 289–319.
Bebchuk, L. (1999), ‗A Rent-Protection Theory of Corporate Ownership and Control‘, NBER
Working Paper 7203 (Harvard Law School).
Becht, M. and E. Boehmer (2001), ‗Ownership and Voting Power in Germany‘, in M. Becht
and E. Boehmer (eds.), The Control of Corporate Europe (Oxford University Press),
pp. 128–53.
28
Behm, U. and H. Zimmermann (1993), ‗The Empirical Relationship Between Dividends and
Earnings in Germany‘, Zeitschrift für Wirtschafts- und Sozialwissenschaften, Vol.
113, No. 2, pp. 225–54.
Bernheim, B.D. and A. Wantz (1995), ‘A Tax-Based Test of the Dividend Signaling
Hypothesis‘, American Economic Review, Vol. 85, No. 3, pp. 532–51.
Bhattacharya, S. (1979), ‗Imperfect Information, Dividend Policy, and the ‗Bird in the Hand‘
Fallacy‘, Bell Journal of Economics, Vol. 10, No. 1, pp. 259–70.
Boehmer, E., J. Musumeci and A. Poulsen (1991), ‗Event-Study Methodology under
Conditions of Event-Induced Variance‘, The Journal of Financial Economics, Vol. 30,
No. 2, pp. 253–72.
Brown, P., J.C.Y. How and P. Verhoeven (2008), ‗The Accuracy of Analysts‘ Dividend
Forecasts around the World‘, The Pacific-Basin Finance Journal, Vol. 16, No. 4, pp.
411–35.
Brown, S.J. and J.B. Warner (1985), ‗Using Daily Stock Returns: The Case of Event Studies‘,
The Journal of Financial Economics, Vol. 14, No. 1, pp. 3–31.
Campbell, J.Y., A.W. Lo and A.C. MacKinley (1997), ‗The Econometrics of Financial
Markets‘, Princeton University Press (New Jersey).
Corrado, C.J. (1989), ‗A Nonparametric Test for Abnormal Security-Price Performance in
Event Studies‘, The Journal of Financial Economics, Vol. 23, No. 2, pp. 385–95.
De Miguel, A., J. Pindado and C. De la Torre (2004), ‗Ownership Structure and Firm Value:
New Evidence from Spain, Strategic Management Journal, Vol. 25, No. 12, pp.1199–
1207.
Easterbrook, F.H. (1984), ‗Two Agency-Cost Explanation of Dividends‘, The American
Economic Review, Vol. 74, No. 4, pp. 650–59.
Eddy, A. and B. Seifert (1988), ‗Firm Size and Dividend Announcements‘, The Journal of
Financial Research, Vol. 11, No. 4, pp. 295–302.
Fama, E. and H. Babiak (1968), ‗Dividend Policy: An Empirical Analysis‘, The Journal of the
American Statistical Association, Vol. 63, No. 324, pp. 1132–61.
29
——— and J. MacBeth (1973), ‗Risk, Return, and Equilibrium: Empirical Tests‘, The
Journal of Political Economy, Vol. 81, No. 3, pp. 607–36.
Franks, J. and C. Mayer (2001), ‗Ownership and Control of German Corporations‘, Review of
Financial Studies, Vol. 14, No. 4, pp. 943–77.
Fuller, K. (2003), ‗The Impact of Informed Trading on Dividend Signaling: A Theoretical and
Empirical Examination‘, The Journal of Corporate Finance, Vol. 9, No. 4, pp. 386–
407.
Gerke, W., M. Oerke and A. Sentner (1997), ‗Der Informationsgehalt von
Dividendenänderungen auf dem deutschen Aktienmarkt‗, Die Betriebswirtschaft, Vol.
57, No. 6, pp. 810–22.
Goergen, M., L. Renneboog and L.C. da Silva (2005), ‗When Do German Firms Change
Their Dividends?‘, The Journal of Corporate Finance, Vol. 11, Nos. 1&2, pp. 375–99.
Gugler, K. and B.B. Yurtoglu (2003), ‗Corporate Governance and Dividend Pay-Out Policy
in Germany‘, European Economic Review, Vol. 47, No. 4, pp. 731–58.
Gurgul, H., R. Mestel and C. Schleicher (2003), ‗Stock Market Reactions to Dividend
Announcements: Empirical Evidence from the Austrian Stock Market‘, Financial
Markets and Portfolio Management, Vol. 17, No. 3, pp. 332–50.
Jensen, M (1986), ‗Agency Costs of Free Cash Flow, Corporate Finance, and the Market for
Takeovers‘, American Economic Review, Vol. 76, No. 2, pp. 323–29.
Julio, B. and D.L. Ikenberry (2004), ‗Reappearing Dividends‘, The Journal of Applied
Corporate Finance, Vol. 16, No. 4, pp. 89–100.
La Porta, R., F. Lopez de Silanes, A. Shleifer and R. Vishny (2000), ‗Investor Protection and
Corporate Governance‘, The Journal of Financial Economics, Vol. 58, Nos. 1&2, pp.
3–29.
Lang, L.H.P. and R.H. Litzenberger (1989), ‗Dividend Announcements: Cash Flow
Signalling versus Free Cash Flow Hypothesis?‘, The Journal of Financial Economics,
Vol. 24, No. 1, pp. 181–91.
Leftwich, R. and M. Zmijewski (1994), ‗Contemporaneous Announcements of Dividends and
Earnings‘, Journal of Accounting, Auditing and Finance, Vol. 9, No. 4, pp. 725-62.
30
Lintner, J. (1956), ‗Distribution of Incomes of Corporations Among Dividends, Retained
Earnings, and Taxes‘, The American Economic Review, Vol. 46, No. 2, pp. 97–113.
Ljungqvist, A., C. Malloy and F. Marston (2009), ‗Rewriting history‘, The Journal of
Finance, Vol. 64, No. 4, pp. 1935–60.
McConnell, J.J. and H. Servaes (1990), ‗Additional Evidence on Equity Ownership and
Corporate Value‘, Journal of Financial Economics, Vol. 27, No. 2, pp. 595-612.
Miller, M. and K. Rock (1985), ‗Dividend Policy under Asymmetric Information‘, The
Journal of Finance, Vol. 40, No. 4, pp. 1031–51.
Morck, R., A. Shleifer and R.W. Vishny (1997), ‗Management Ownership and Market
Valuation‘, Journal of Financial Economics, Vol. 20, pp. 293-315.
O'Brien, P. (1988), ‗Analysts' Forecasts as Earnings Expectations‘, Journal of Accounting and
Economics, Vol. 10, No. 1, pp. 55-83.
Ofer, A. and R. Siegel (1987), ‗Corporate Financial Policy, Information, and Market
Expectations: An Empirical Investigation of Dividends‘, The Journal of Finance, Vol.
42, No. 4, pp. 889–911.
Shapiro, N.Z. and L.S. Shapley (1978), ‗Values of Large Games, I: A Limit Theorem‘,
Mathematics of Operations Research, Vol.3, No.1, pp. 1-9.
Shapley, L.S. and M. Shubik (1954), ‗A Method for Evaluating the Distribution of Power in a
Committee System, The American Political Science Review, Vol. 48, No. 3, pp. 787-
792.
Shleifer, A. and R.W. Vishny (1997), ‗A Survey of Corporate Governance‘, The Journal of
Finance, Vol. 52, No. 2, pp. 737-783.
da Silva, L.C., M. Goergen and L. Renneboog (2004), ‗Dividend Policy and Corporate
Governance‘, Oxford University Press (Oxford).Watts, R. (1973), ‗The Information
Content of Dividends‘, The Journal of Business, Vol. 46, No. 2, pp. 191–211.
Woolridge, J.R. (1983), ‗Dividend Changes and Security Prices‘, The Journal of Finance,
Vol. 38, No. 5, pp. 1607–15.
Yoon, P.S. and L.T. Starks (1995), ‗Signaling, Investment Opportunities, and Dividend
Announcements‘, Review of Financial Studies, Vol. 8, No. 4, pp. 995–1018.
31
Table 1
Summary Statistics
Table 1 provides descriptive data for all sample firms. The sample consists of a total of 921 announcements for the 150 largest companies listed on the Frankfurt Stock Exchange (member firms of the DAX, MDAX and SDAX indices as of December 2002) for the 11-year period from 1996 to 2006. Dividend yield is calculated as DIV(i,y-1)/P(i,y) and market capitalization measures the market value of equity 14 days before the announcement. The change in dividend
yield is defined as the change in dividends as a percent of price (P(i,y)) 14 days before the dividend announcement, (DIV(i,y)-DIV(i,y-1))/P(i,y), where DIV(i,y) is the total (adjusted) dividend per share for stock (i) announced for year
(y) and DIV(i,y-1) is the total (adjusted) dividend per share for stock (i) announced for the preceding year (y-1). Tobin‘s Q is defined as the market value of the firm‘s equity plus total assets minus book value of equity, all divided by total assets. The firm‘s leverage is defined as the sum of total current liabilities and long-term debt divided by book value of equity. Analyst coverage denotes the number of analysts in the I/B/E/S database. The earnings estimation error
is measured as (EPS(i,y)-ESTEPS(i,y))/P(i,y), where EPS(i,y) denotes (adjusted) earnings per share for stock (i) announced for year (y) and ESTEPS(i,y) is the last I/B/E/S consensus earnings estimates before the announcement. In
addition to the voting rights of the largest shareholder, the voting rights of the second-largest shareholder are reported if they exceed 5% (they are set to zero if the second-largest shareholder holds less than 5%).
Panel A. Descriptive Statistics for Firms with Increased, Decreased and Maintained Dividends over the Entire Sample Period (1996-2006) - Naïve Expectation Model (Dividend Changes)
Increases (521 observations) Decreases (88 observations) No Change (312 observations)
Mean Median Standard Dev. Mean Median Standard Dev. Mean Median Standard Dev.
Dividend Yield (%) 1.88 1.67 1.36 4.80 4.09 3.73 2.57 2.44 1.86
Change in Dividend Yield (%) 0.57 0.33 0.67 -2.62 -1.95 2.50 0.01 0.00 0.04
Dividend Estimation Error (%) 0.16 0.08 0.41 -1.29 -0.86 1.42 -0.15 -0.07 0.38
Earnings Estimation Error (%) 0.13 0.00 2.54 -5.74 0.00 20.52 -0.56 0.00 4.28
Market Capitalization (Mio. €) 7197.91 1806.14 13100.63 3840.08 602.29 10578.83 5496.78 553.63 16414.32
Total Assets (Mio. €) 13634.58 1873.57 30499.10 11342.05 1354.76 33072.42 10739.01 1216.38 30134.27
Sales (Mio. €) 10384.13 1998.10 19477.11 8526.12 1860.30 20819.03 9717.28 1473.38 23478.73
Tobin‘s Q 1.82 1.37 1.40 1.32 1.07 1.13 1.41 1.20 0.91
Leverage 1.79 1.33 2.58 2.06 1.48 1.68 2.14 1.88 2.52
Analyst Coverage 17.33 17.00 10.41 15.61 12.00 10.84 15.25 13.00 10.89
Voting Rights of the Largest Shareholder (%) 39.07 36.07 26.93 38.32 30.33 25.32 43.30 37.08 29.08
Voting Rights of the 2nd-Largest Shareholder (%)
4.83 0.00 7.03 5.69 2.50 6.98 5.12 0.00 6.52
Panel B. Descriptive Statistics for Firms with Good News, Bad News and No News over the Entire Sample Period (1996-2006) - Market Expectation Model (Dividend Surprises)
Good News (281 observations) Bad News (266 observations) No News (374 observations)
Dividend Yield (%) 2.04 1.83 1.48 2.56 2.15 2.75 2.54 2.21 1.82
Change in Dividend Yield (%) 0.62 0.40 0.84 -0.55 0.00 1.81 0.11 0.11 0.88
Dividend Estimation Error (%) 0.41 0.28 0.39 -0.73 -0.36 0.96 0.00 0.00 0.08
Earnings Estimation Error (%) 0.27 0.00 3.05 -1.75 0.00 7.86 -0.59 0.00 8.78
Market Capitalization (Mio. €) 5813.50 1270.42 11391.25 4781.78 766.05 12984.94 7747.29 1221.49 16492.05
Total Assets (Mio. €) 10540.25 1286.30 25453.66 8836.06 1285.27 26692.68 16417.34 1754.56 35963.10
Sales (Mio. €) 9256.63 1530.68 19081.50 7529.96 1435.15 19120.12 12267.75 2103.84 23396.43
Tobin‘s Q 1.83 1.32 1.49 1.61 1.17 1.37 1.51 1.27 0.88
Leverage 1.79 1.24 2.82 1.93 1.54 1.57 2.05 1.65 2.08
Analyst Coverage 16.30 15.00 10.73 15.03 13.00 9.91 17.59 17.00 10.99
Voting Rights of the Largest Shareholder (%) 39.37 35.90 25.92 40.58 36.57 27.06 41.12 36.04 29.16
Voting Rights of the 2nd-Largest Shareholder
(%)
5.22 0.00 7.34 5.07 0.00 6.83 4.80 0.00 6.50
32
Panel C. Percentage of Firm-Year Observations with Maintained, Increased and Decreased Dividends
Year
Number of Firms
Firms that Maintained Dividends (%)
Firms that Increased Dividends (%)
Firms that Decreased Dividends (%)
1996 67 39 52 9
1997 80 29 68 4
1998 78 26 67 8
1999 88 34 60 6
2000 87 32 64 3
2001 91 34 46 20
2002 89 38 43 19
2003 89 39 42 19
2004 85 33 60 7
2005 81 25 69 6
2006 86 19 78 3
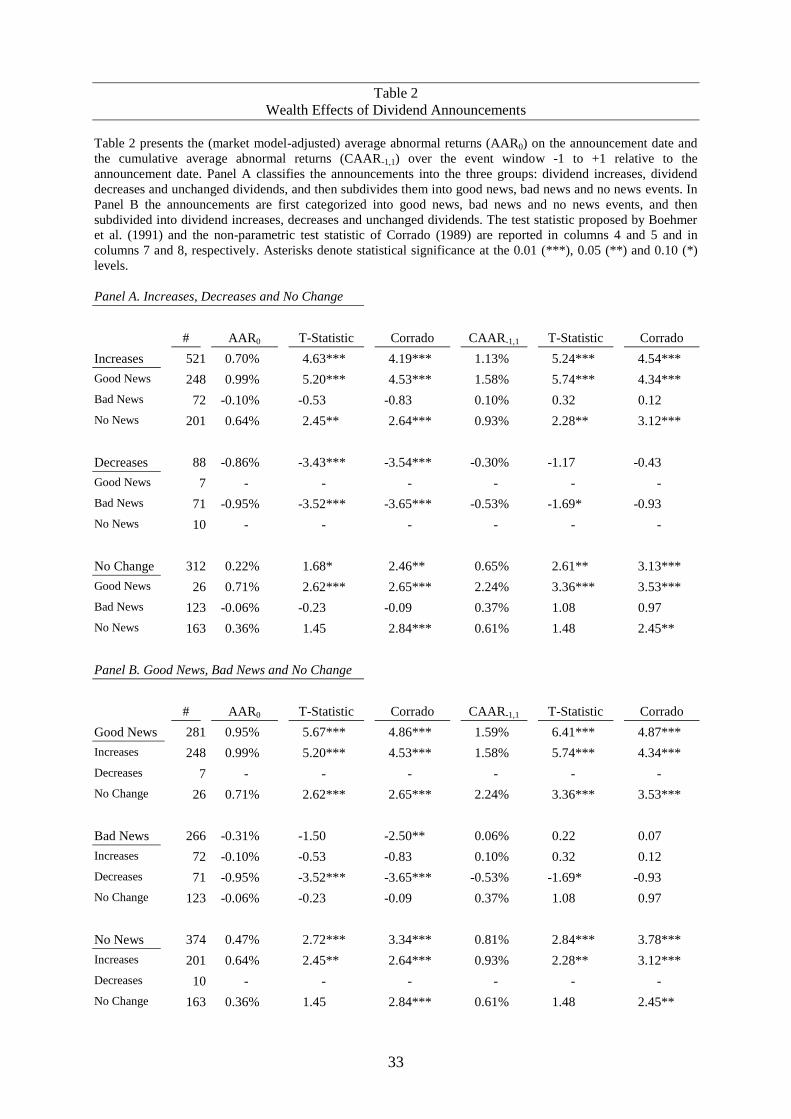
33
Table 2
Wealth Effects of Dividend Announcements
Table 2 presents the (market model-adjusted) average abnormal returns (AAR0) on the announcement date and
the cumulative average abnormal returns (CAAR-1,1) over the event window -1 to +1 relative to the
announcement date. Panel A classifies the announcements into the three groups: dividend increases, dividend
decreases and unchanged dividends, and then subdivides them into good news, bad news and no news events. In
Panel B the announcements are first categorized into good news, bad news and no news events, and then
subdivided into dividend increases, decreases and unchanged dividends. The test statistic proposed by Boehmer
et al. (1991) and the non-parametric test statistic of Corrado (1989) are reported in columns 4 and 5 and in
columns 7 and 8, respectively. Asterisks denote statistical significance at the 0.01 (***), 0.05 (**) and 0.10 (*)
levels.
Panel A. Increases, Decreases and No Change
# AAR0 T-Statistic Corrado CAAR-1,1 T-Statistic Corrado
Increases 521 0.70% 4.63*** 4.19*** 1.13% 5.24*** 4.54***
Good News 248 0.99% 5.20*** 4.53*** 1.58% 5.74*** 4.34***
Bad News 72 -0.10% -0.53 -0.83 0.10% 0.32 0.12
No News 201 0.64% 2.45** 2.64*** 0.93% 2.28** 3.12***
Decreases 88 -0.86% -3.43*** -3.54*** -0.30% -1.17 -0.43
Good News 7 - - - - - -
Bad News 71 -0.95% -3.52*** -3.65*** -0.53% -1.69* -0.93
No News 10 - - - - - -
No Change 312 0.22% 1.68* 2.46** 0.65% 2.61** 3.13***
Good News 26 0.71% 2.62*** 2.65*** 2.24% 3.36*** 3.53***
Bad News 123 -0.06% -0.23 -0.09 0.37% 1.08 0.97
No News 163 0.36% 1.45 2.84*** 0.61% 1.48 2.45**
Panel B. Good News, Bad News and No Change
# AAR0 T-Statistic Corrado CAAR-1,1 T-Statistic Corrado
Good News 281 0.95% 5.67*** 4.86*** 1.59% 6.41*** 4.87***
Increases 248 0.99% 5.20*** 4.53*** 1.58% 5.74*** 4.34***
Decreases 7 - - - - - -
No Change 26 0.71% 2.62*** 2.65*** 2.24% 3.36*** 3.53***
Bad News 266 -0.31% -1.50 -2.50** 0.06% 0.22 0.07
Increases 72 -0.10% -0.53 -0.83 0.10% 0.32 0.12
Decreases 71 -0.95% -3.52*** -3.65*** -0.53% -1.69* -0.93
No Change 123 -0.06% -0.23 -0.09 0.37% 1.08 0.97
No News 374 0.47% 2.72*** 3.34*** 0.81% 2.84*** 3.78***
Increases 201 0.64% 2.45** 2.64*** 0.93% 2.28** 3.12***
Decreases 10 - - - - - -
No Change 163 0.36% 1.45 2.84*** 0.61% 1.48 2.45**
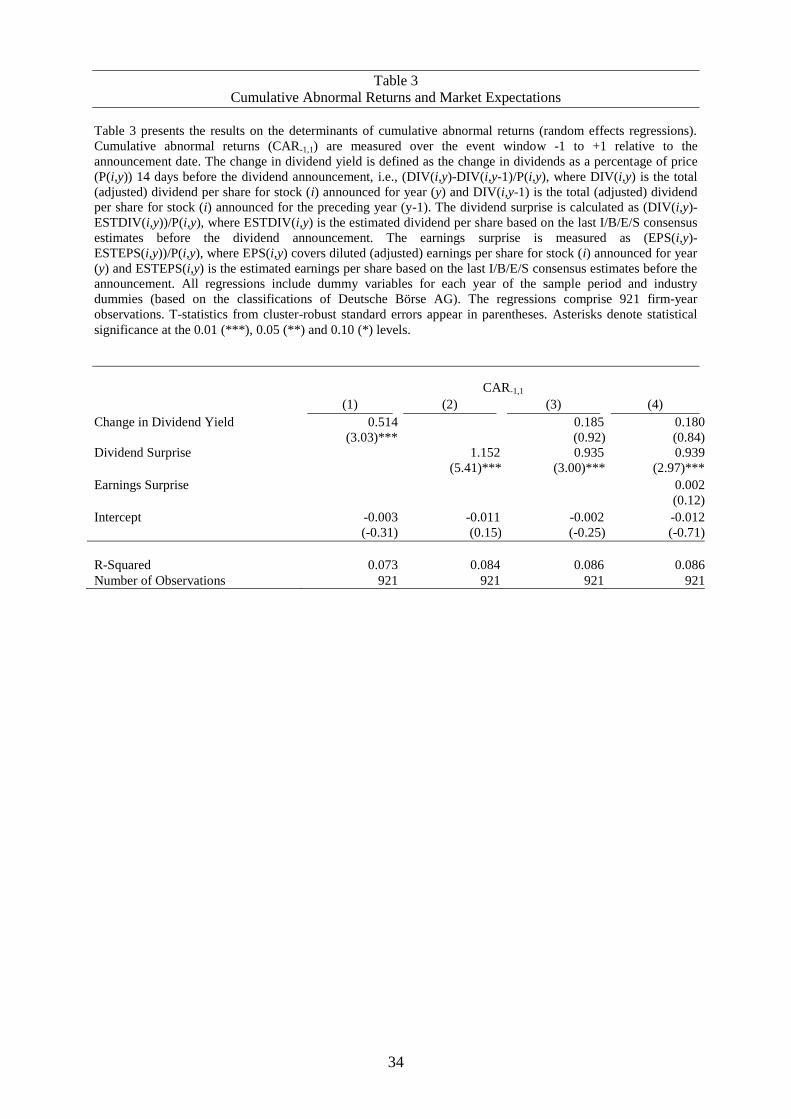
34
Table 3
Cumulative Abnormal Returns and Market Expectations
Table 3 presents the results on the determinants of cumulative abnormal returns (random effects regressions).
Cumulative abnormal returns (CAR-1,1) are measured over the event window -1 to +1 relative to the
announcement date. The change in dividend yield is defined as the change in dividends as a percentage of price
(P(i,y)) 14 days before the dividend announcement, i.e., (DIV(i,y)-DIV(i,y-1)/P(i,y), where DIV(i,y) is the total
(adjusted) dividend per share for stock (i) announced for year (y) and DIV(i,y-1) is the total (adjusted) dividend
per share for stock (i) announced for the preceding year (y-1). The dividend surprise is calculated as (DIV(i,y)-
ESTDIV(i,y))/P(i,y), where ESTDIV(i,y) is the estimated dividend per share based on the last I/B/E/S consensus
estimates before the dividend announcement. The earnings surprise is measured as (EPS(i,y)-
ESTEPS(i,y))/P(i,y), where EPS(i,y) covers diluted (adjusted) earnings per share for stock (i) announced for year
(y) and ESTEPS(i,y) is the estimated earnings per share based on the last I/B/E/S consensus estimates before the
announcement. All regressions include dummy variables for each year of the sample period and industry
dummies (based on the classifications of Deutsche Börse AG). The regressions comprise 921 firm-year
observations. T-statistics from cluster-robust standard errors appear in parentheses. Asterisks denote statistical
significance at the 0.01 (***), 0.05 (**) and 0.10 (*) levels.
CAR-1,1
(1) (2) (3) (4)
Change in Dividend Yield 0.514
(3.03)***
0.185
(0.92)
0.180
(0.84)
Dividend Surprise 1.152
(5.41)***
0.935
(3.00)***
0.939
(2.97)***
Earnings Surprise 0.002
(0.12)
Intercept -0.003
(-0.31)
-0.011
(0.15)
-0.002
(-0.25)
-0.012
(-0.71)
R-Squared 0.073 0.084 0.086 0.086
Number of Observations
921 921 921 921
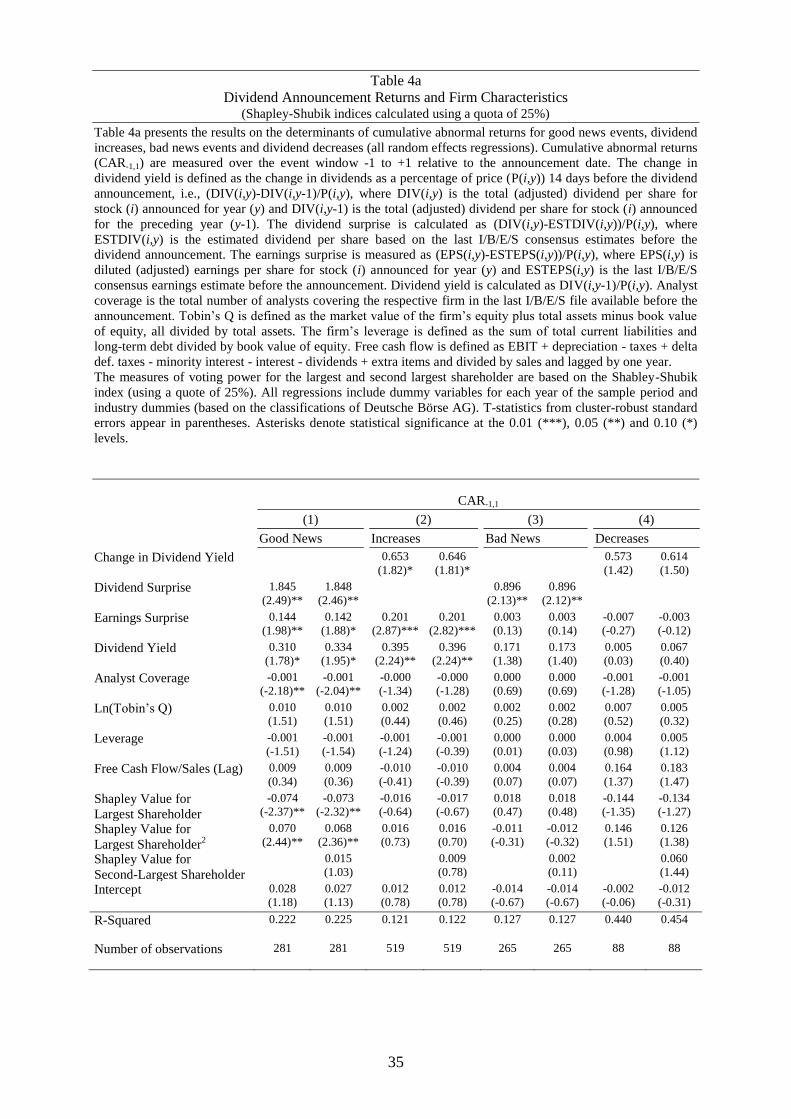
35
Table 4a
Dividend Announcement Returns and Firm Characteristics (Shapley-Shubik indices calculated using a quota of 25%)
Table 4a presents the results on the determinants of cumulative abnormal returns for good news events, dividend
increases, bad news events and dividend decreases (all random effects regressions). Cumulative abnormal returns
(CAR-1,1) are measured over the event window -1 to +1 relative to the announcement date. The change in
dividend yield is defined as the change in dividends as a percentage of price (P(i,y)) 14 days before the dividend
announcement, i.e., (DIV(i,y)-DIV(i,y-1)/P(i,y), where DIV(i,y) is the total (adjusted) dividend per share for
stock (i) announced for year (y) and DIV(i,y-1) is the total (adjusted) dividend per share for stock (i) announced
for the preceding year (y-1). The dividend surprise is calculated as (DIV(i,y)-ESTDIV(i,y))/P(i,y), where
ESTDIV(i,y) is the estimated dividend per share based on the last I/B/E/S consensus estimates before the
dividend announcement. The earnings surprise is measured as (EPS(i,y)-ESTEPS(i,y))/P(i,y), where EPS(i,y) is
diluted (adjusted) earnings per share for stock (i) announced for year (y) and ESTEPS(i,y) is the last I/B/E/S
consensus earnings estimate before the announcement. Dividend yield is calculated as DIV(i,y-1)/P(i,y). Analyst
coverage is the total number of analysts covering the respective firm in the last I/B/E/S file available before the
announcement. Tobin‘s Q is defined as the market value of the firm‘s equity plus total assets minus book value
of equity, all divided by total assets. The firm‘s leverage is defined as the sum of total current liabilities and
long-term debt divided by book value of equity. Free cash flow is defined as EBIT + depreciation - taxes + delta
def. taxes - minority interest - interest - dividends + extra items and divided by sales and lagged by one year.
The measures of voting power for the largest and second largest shareholder are based on the Shabley-Shubik
index (using a quote of 25%). All regressions include dummy variables for each year of the sample period and
industry dummies (based on the classifications of Deutsche Börse AG). T-statistics from cluster-robust standard
errors appear in parentheses. Asterisks denote statistical significance at the 0.01 (***), 0.05 (**) and 0.10 (*)
levels.
CAR-1,1
(1) (2) (3) (4)
Good News Increases Bad News Decreases
Change in Dividend Yield 0.653
(1.82)*
0.646
(1.81)*
0.573
(1.42)
0.614
(1.50)
Dividend Surprise 1.845
(2.49)**
1.848
(2.46)**
0.896
(2.13)**
0.896
(2.12)**
Earnings Surprise 0.144
(1.98)**
0.142
(1.88)*
0.201
(2.87)***
0.201
(2.82)***
0.003
(0.13)
0.003
(0.14)
-0.007
(-0.27)
-0.003
(-0.12)
Dividend Yield 0.310
(1.78)*
0.334
(1.95)*
0.395
(2.24)**
0.396
(2.24)**
0.171
(1.38)
0.173
(1.40)
0.005
(0.03)
0.067
(0.40)
Analyst Coverage -0.001
(-2.18)**
-0.001
(-2.04)**
-0.000
(-1.34)
-0.000
(-1.28)
0.000
(0.69)
0.000
(0.69)
-0.001
(-1.28)
-0.001
(-1.05)
Ln(Tobin‘s Q) 0.010
(1.51)
0.010
(1.51)
0.002
(0.44)
0.002
(0.46)
0.002
(0.25)
0.002
(0.28)
0.007
(0.52)
0.005
(0.32)
Leverage -0.001
(-1.51)
-0.001
(-1.54)
-0.001
(-1.24)
-0.001
(-0.39)
0.000
(0.01)
0.000
(0.03)
0.004
(0.98)
0.005
(1.12)
Free Cash Flow/Sales (Lag) 0.009
(0.34)
0.009
(0.36)
-0.010
(-0.41)
-0.010
(-0.39)
0.004
(0.07)
0.004
(0.07)
0.164
(1.37)
0.183
(1.47)
Shapley Value for
Largest Shareholder
-0.074
(-2.37)**
-0.073
(-2.32)**
-0.016
(-0.64)
-0.017
(-0.67)
0.018
(0.47)
0.018
(0.48)
-0.144
(-1.35)
-0.134
(-1.27)
Shapley Value for
Largest Shareholder2
0.070
(2.44)**
0.068
(2.36)**
0.016
(0.73)
0.016
(0.70)
-0.011
(-0.31)
-0.012
(-0.32)
0.146
(1.51)
0.126
(1.38)
Shapley Value for
Second-Largest Shareholder
0.015
(1.03)
0.009
(0.78)
0.002
(0.11)
0.060
(1.44)
Intercept 0.028
(1.18)
0.027
(1.13)
0.012
(0.78)
0.012
(0.78)
-0.014
(-0.67)
-0.014
(-0.67)
-0.002
(-0.06)
-0.012
(-0.31)
R-Squared 0.222 0.225 0.121 0.122 0.127 0.127 0.440 0.454
Number of observations 281 281 519 519 265 265 88 88
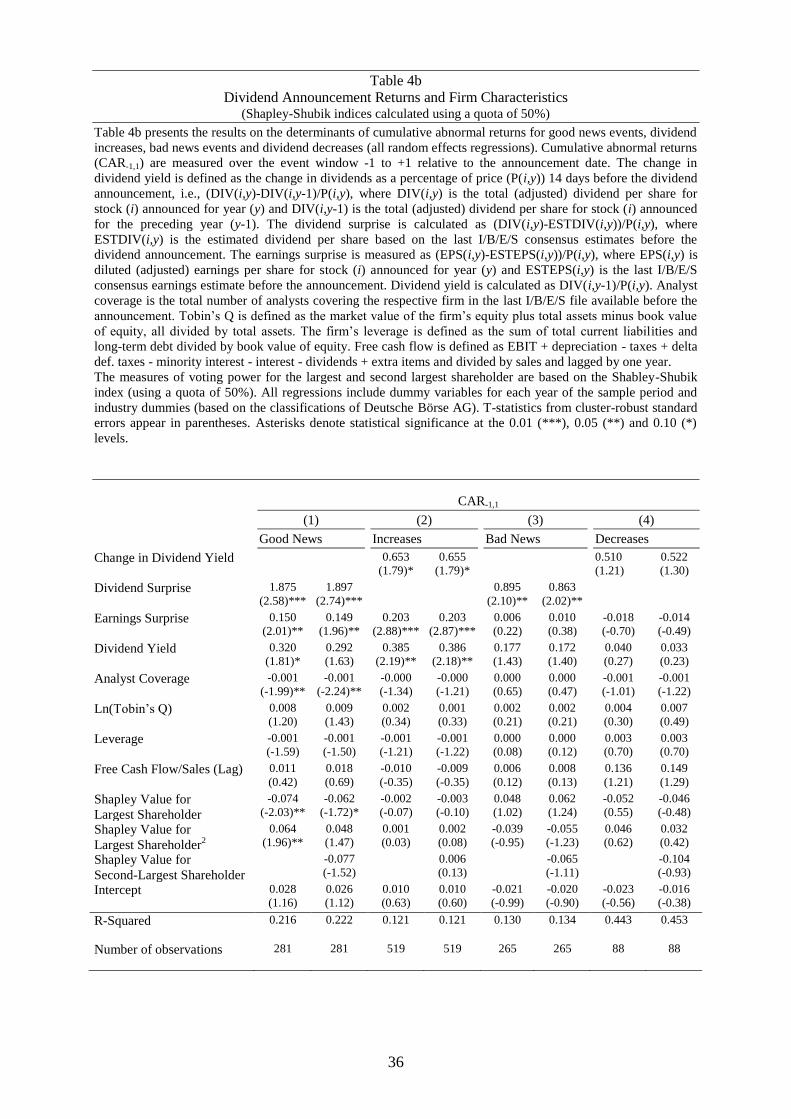
36
Table 4b
Dividend Announcement Returns and Firm Characteristics (Shapley-Shubik indices calculated using a quota of 50%)
Table 4b presents the results on the determinants of cumulative abnormal returns for good news events, dividend
increases, bad news events and dividend decreases (all random effects regressions). Cumulative abnormal returns
(CAR-1,1) are measured over the event window -1 to +1 relative to the announcement date. The change in
dividend yield is defined as the change in dividends as a percentage of price (P(i,y)) 14 days before the dividend
announcement, i.e., (DIV(i,y)-DIV(i,y-1)/P(i,y), where DIV(i,y) is the total (adjusted) dividend per share for
stock (i) announced for year (y) and DIV(i,y-1) is the total (adjusted) dividend per share for stock (i) announced
for the preceding year (y-1). The dividend surprise is calculated as (DIV(i,y)-ESTDIV(i,y))/P(i,y), where
ESTDIV(i,y) is the estimated dividend per share based on the last I/B/E/S consensus estimates before the
dividend announcement. The earnings surprise is measured as (EPS(i,y)-ESTEPS(i,y))/P(i,y), where EPS(i,y) is
diluted (adjusted) earnings per share for stock (i) announced for year (y) and ESTEPS(i,y) is the last I/B/E/S
consensus earnings estimate before the announcement. Dividend yield is calculated as DIV(i,y-1)/P(i,y). Analyst
coverage is the total number of analysts covering the respective firm in the last I/B/E/S file available before the
announcement. Tobin‘s Q is defined as the market value of the firm‘s equity plus total assets minus book value
of equity, all divided by total assets. The firm‘s leverage is defined as the sum of total current liabilities and
long-term debt divided by book value of equity. Free cash flow is defined as EBIT + depreciation - taxes + delta
def. taxes - minority interest - interest - dividends + extra items and divided by sales and lagged by one year.
The measures of voting power for the largest and second largest shareholder are based on the Shabley-Shubik
index (using a quota of 50%). All regressions include dummy variables for each year of the sample period and
industry dummies (based on the classifications of Deutsche Börse AG). T-statistics from cluster-robust standard
errors appear in parentheses. Asterisks denote statistical significance at the 0.01 (***), 0.05 (**) and 0.10 (*)
levels.
CAR-1,1
(1) (2) (3) (4)
Good News Increases Bad News Decreases
Change in Dividend Yield 0.653
(1.79)*
0.655
(1.79)*
0.510
(1.21)
0.522
(1.30)
Dividend Surprise 1.875
(2.58)***
1.897
(2.74)***
0.895
(2.10)**
0.863
(2.02)**
Earnings Surprise 0.150
(2.01)**
0.149
(1.96)**
0.203
(2.88)***
0.203
(2.87)***
0.006
(0.22)
0.010
(0.38)
-0.018
(-0.70)
-0.014
(-0.49)
Dividend Yield 0.320
(1.81)*
0.292
(1.63)
0.385
(2.19)**
0.386
(2.18)**
0.177
(1.43)
0.172
(1.40)
0.040
(0.27)
0.033
(0.23)
Analyst Coverage -0.001
(-1.99)**
-0.001
(-2.24)**
-0.000
(-1.34)
-0.000
(-1.21)
0.000
(0.65)
0.000
(0.47)
-0.001
(-1.01)
-0.001
(-1.22)
Ln(Tobin‘s Q) 0.008
(1.20)
0.009
(1.43)
0.002
(0.34)
0.001
(0.33)
0.002
(0.21)
0.002
(0.21)
0.004
(0.30)
0.007
(0.49)
Leverage -0.001
(-1.59)
-0.001
(-1.50)
-0.001
(-1.21)
-0.001
(-1.22)
0.000
(0.08)
0.000
(0.12)
0.003
(0.70)
0.003
(0.70)
Free Cash Flow/Sales (Lag) 0.011
(0.42)
0.018
(0.69)
-0.010
(-0.35)
-0.009
(-0.35)
0.006
(0.12)
0.008
(0.13)
0.136
(1.21)
0.149
(1.29)
Shapley Value for
Largest Shareholder
-0.074
(-2.03)**
-0.062
(-1.72)*
-0.002
(-0.07)
-0.003
(-0.10)
0.048
(1.02)
0.062
(1.24)
-0.052
(0.55)
-0.046
(-0.48)
Shapley Value for
Largest Shareholder2
0.064
(1.96)**
0.048
(1.47)
0.001
(0.03)
0.002
(0.08)
-0.039
(-0.95)
-0.055
(-1.23)
0.046
(0.62)
0.032
(0.42)
Shapley Value for
Second-Largest Shareholder
-0.077
(-1.52)
0.006
(0.13)
-0.065
(-1.11)
-0.104
(-0.93)
Intercept 0.028
(1.16)
0.026
(1.12)
0.010
(0.63)
0.010
(0.60)
-0.021
(-0.99)
-0.020
(-0.90)
-0.023
(-0.56)
-0.016
(-0.38)
R-Squared 0.216 0.222 0.121 0.121 0.130 0.134 0.443 0.453
Number of observations 281 281 519 519 265 265 88 88

CFR WCFR WCFR WCFR Working orking orking orking Paper SPaper SPaper SPaper Serieserieserieseries
Centre for Financial ResearchCentre for Financial ResearchCentre for Financial ResearchCentre for Financial Research CologneCologneCologneCologne
CFR Working Papers are available for download from www.cfrwww.cfrwww.cfrwww.cfr----cologne.decologne.decologne.decologne.de. Hardcopies can be ordered from: Centre for Financial Research (CFR), Albertus Magnus Platz, 50923 Koeln, Germany. 2012201220122012 No. Author(s) Title
12-03 C. Andres, A. Betzer, I.
van den Bongard, C. Haesner, E. Theissen
Dividend Announcements Reconsidered: Dividend Changes versus Dividend Surprises
12-02 C. Andres, E. Fernau, E. Theissen
Is It Better To Say Goodbye? When Former Executives Set Executive Pay
12-01 L. Andreu, A. Pütz Are Two Business Degrees Better Than One?
Evidence from Mutual Fund Managers' Education 2011201120112011 No. Author(s) Title
11-16 V. Agarwal, J.-P. Gómez,
R. Priestley Management Compensation and Market Timing under Portfolio Constraints
11-15 T. Dimpfl, S. Jank Can Internet Search Queries Help to Predict Stock Market
Volatility? 11-14 P. Gomber,
U. Schweickert, E. Theissen
Liquidity Dynamics in an Electronic Open Limit Order Book: An Event Study Approach
11-13 D. Hess, S. Orbe Irrationality or Efficiency of Macroeconomic Survey Forecasts?
Implications from the Anchoring Bias Test 11-12 D. Hess, P. Immenkötter Optimal Leverage, its Benefits, and the Business Cycle 11-11 N. Heinrichs, D. Hess,
C. Homburg, M. Lorenz, S. Sievers
Extended Dividend, Cash Flow and Residual Income Valuation Models – Accounting for Deviations from Ideal Conditions
11-10 A. Kempf, O. Korn, S. Saßning
Portfolio Optimization using Forward - Looking Information
11-09 V. Agarwal, S. Ray Determinants and Implications of Fee Changes in the Hedge Fund Industry
11-08 G. Cici, L.-F. Palacios On the Use of Options by Mutual Funds: Do They Know What They Are Doing?

11-07 V. Agarwal, G. D. Gay, L. Ling
Performance inconsistency in mutual funds: An investigation of window-dressing behavior
11-06 N. Hautsch, D. Hess, D. Veredas
The Impact of Macroeconomic News on Quote Adjustments, Noise, and Informational Volatility
11-05 G. Cici The Prevalence of the Disposition Effect in Mutual Funds' Trades
11-04 S. Jank Mutual Fund Flows, Expected Returns and the Real Economy
11-03 G.Fellner, E.Theissen
Short Sale Constraints, Divergence of Opinion and Asset Value: Evidence from the Laboratory
11-02 S.Jank Are There Disadvantaged Clienteles in Mutual Funds?
11-01 V. Agarwal, C. Meneghetti The Role of Hedge Funds as Primary Lenders 2010201020102010 No. Author(s) Title
10-20
G. Cici, S. Gibson, J.J. Merrick Jr.
Missing the Marks? Dispersion in Corporate Bond Valuations Across Mutual Funds
10-19 J. Hengelbrock,
E. Theissen, C. Westheide Market Response to Investor Sentiment
10-18 G. Cici, S. Gibson The Performance of Corporate-Bond Mutual Funds:
Evidence Based on Security-Level Holdings
10-17 D. Hess, D. Kreutzmann,
O. Pucker Projected Earnings Accuracy and the Profitability of Stock Recommendations
10-16 S. Jank, M. Wedow Sturm und Drang in Money Market Funds: When Money Market Funds Cease to Be Narrow
10-15 G. Cici, A. Kempf, A. Puetz
The Valuation of Hedge Funds’ Equity Positions
10-14 J. Grammig, S. Jank Creative Destruction and Asset Prices
10-13 S. Jank, M. Wedow Purchase and Redemption Decisions of Mutual Fund Investors and the Role of Fund Families
10-12 S. Artmann, P. Finter, A. Kempf, S. Koch, E. Theissen
The Cross-Section of German Stock Returns: New Data and New Evidence
10-11 M. Chesney, A. Kempf The Value of Tradeability
10-10 S. Frey, P. Herbst The Influence of Buy-side Analysts on Mutual Fund Trading
10-09 V. Agarwal, W. Jiang, Y. Tang, B. Yang
Uncovering Hedge Fund Skill from the Portfolio Holdings They Hide
10-08 V. Agarwal, V. Fos, W. Jiang
Inferring Reporting Biases in Hedge Fund Databases from Hedge Fund Equity Holdings
10-07 V. Agarwal, G. Bakshi, J. Huij
Do Higher-Moment Equity Risks Explain Hedge Fund Returns?
10-06 J. Grammig, F. J. Peter Tell-Tale Tails
10-05 K. Drachter, A. Kempf Höhe, Struktur und Determinanten der Managervergütung- Eine Analyse der Fondsbranche in Deutschland
10-04 J. Fang, A. Kempf, Fund Manager Allocation

M. Trapp
10-03 P. Finter, A. Niessen-Ruenzi, S. Ruenzi
The Impact of Investor Sentiment on the German Stock Market
10-02 D. Hunter, E. Kandel, S. Kandel, R. Wermers
Endogenous Benchmarks
10-01
S. Artmann, P. Finter, A. Kempf
Determinants of Expected Stock Returns: Large Sample Evidence from the German Market
2009200920092009 No. Author(s) Title
09-17
E. Theissen
Price Discovery in Spot and Futures Markets: A Reconsideration
09-16 M. Trapp Trading the Bond-CDS Basis – The Role of Credit Risk and Liquidity
09-15 A. Betzer, J. Gider, D.Metzger, E. Theissen
Strategic Trading and Trade Reporting by Corporate Insiders
09-14 A. Kempf, O. Korn, M. Uhrig-Homburg
The Term Structure of Illiquidity Premia
09-13 W. Bühler, M. Trapp Time-Varying Credit Risk and Liquidity Premia in Bond and CDS Markets
09-12 W. Bühler, M. Trapp
Explaining the Bond-CDS Basis – The Role of Credit Risk and Liquidity
09-11 S. J. Taylor, P. K. Yadav, Y. Zhang
Cross-sectional analysis of risk-neutral skewness
09-10 A. Kempf, C. Merkle, A. Niessen
Low Risk and High Return - How Emotions Shape Expectations on the Stock Market
09-09 V. Fotak, V. Raman, P. K. Yadav
Naked Short Selling: The Emperor`s New Clothes?
09-08 F. Bardong, S.M. Bartram, P.K. Yadav
Informed Trading, Information Asymmetry and Pricing of Information Risk: Empirical Evidence from the NYSE
09-07 S. J. Taylor , P. K. Yadav, Y. Zhang
The information content of implied volatilities and model-free volatility expectations: Evidence from options written on individual stocks
09-06 S. Frey, P. Sandas The Impact of Iceberg Orders in Limit Order Books
09-05 H. Beltran-Lopez, P. Giot, J. Grammig
Commonalities in the Order Book
09-04 J. Fang, S. Ruenzi Rapid Trading bei deutschen Aktienfonds: Evidenz aus einer großen deutschen Fondsgesellschaft
09-03 A. Banegas, B. Gillen, A. Timmermann, R. Wermers
The Performance of European Equity Mutual Funds
09-02 J. Grammig, A. Schrimpf, M. Schuppli
Long-Horizon Consumption Risk and the Cross-Section of Returns: New Tests and International Evidence
09-01 O. Korn, P. Koziol The Term Structure of Currency Hedge Ratios

2008200820082008 No. Author(s) Title
08-12
U. Bonenkamp, C. Homburg, A. Kempf
Fundamental Information in Technical Trading Strategies
08-11 O. Korn Risk Management with Default-risky Forwards
08-10 J. Grammig, F.J. Peter International Price Discovery in the Presence of Market Microstructure Effects
08-09 C. M. Kuhnen, A. Niessen Public Opinion and Executive Compensation
08-08 A. Pütz, S. Ruenzi Overconfidence among Professional Investors: Evidence from Mutual Fund Managers
08-07 P. Osthoff What matters to SRI investors?
08-06 A. Betzer, E. Theissen Sooner Or Later: Delays in Trade Reporting by Corporate Insiders
08-05 P. Linge, E. Theissen Determinanten der Aktionärspräsenz auf
Hauptversammlungen deutscher Aktiengesellschaften 08-04 N. Hautsch, D. Hess,
C. Müller
Price Adjustment to News with Uncertain Precision
08-03 D. Hess, H. Huang, A. Niessen
How Do Commodity Futures Respond to Macroeconomic News?
08-02 R. Chakrabarti, W. Megginson, P. Yadav
Corporate Governance in India
08-01 C. Andres, E. Theissen Setting a Fox to Keep the Geese - Does the Comply-or-Explain Principle Work?
2007200720072007 No. Author(s) Title
07-16
M. Bär, A. Niessen, S. Ruenzi
The Impact of Work Group Diversity on Performance: Large Sample Evidence from the Mutual Fund Industry
07-15 A. Niessen, S. Ruenzi Political Connectedness and Firm Performance: Evidence From Germany
07-14 O. Korn Hedging Price Risk when Payment Dates are Uncertain
07-13 A. Kempf, P. Osthoff SRI Funds: Nomen est Omen
07-12 J. Grammig, E. Theissen, O. Wuensche
Time and Price Impact of a Trade: A Structural Approach
07-11 V. Agarwal, J. R. Kale On the Relative Performance of Multi-Strategy and Funds of Hedge Funds
07-10 M. Kasch-Haroutounian, E. Theissen
Competition Between Exchanges: Euronext versus Xetra
07-09 V. Agarwal, N. D. Daniel, N. Y. Naik
Do hedge funds manage their reported returns?
07-08 N. C. Brown, K. D. Wei, R. Wermers
Analyst Recommendations, Mutual Fund Herding, and Overreaction in Stock Prices
07-07 A. Betzer, E. Theissen Insider Trading and Corporate Governance: The Case of Germany
07-06 V. Agarwal, L. Wang Transaction Costs and Value Premium

07-05 J. Grammig, A. Schrimpf Asset Pricing with a Reference Level of Consumption: New Evidence from the Cross-Section of Stock Returns
07-04 V. Agarwal, N.M. Boyson, N.Y. Naik
Hedge Funds for retail investors? An examination of hedged mutual funds
07-03 D. Hess, A. Niessen The Early News Catches the Attention: On the Relative Price Impact of Similar Economic Indicators
07-02 A. Kempf, S. Ruenzi, T. Thiele
Employment Risk, Compensation Incentives and Managerial Risk Taking - Evidence from the Mutual Fund Industry -
07-01 M. Hagemeister, A. Kempf CAPM und erwartete Renditen: Eine Untersuchung auf Basis der Erwartung von Marktteilnehmern
2006200620062006 No. Author(s) Title
06-13
S. Čeljo-Hörhager, A. Niessen
How do Self-fulfilling Prophecies affect Financial Ratings? - An experimental study
06-12 R. Wermers, Y. Wu, J. Zechner
Portfolio Performance, Discount Dynamics, and the Turnover of Closed-End Fund Managers
06-11 U. v. Lilienfeld-Toal, S. Ruenzi
Why Managers Hold Shares of Their Firm: An Empirical Analysis
06-10 A. Kempf, P. Osthoff The Effect of Socially Responsible Investing on Portfolio Performance
06-09 R. Wermers, T. Yao, J. Zhao
The Investment Value of Mutual Fund Portfolio Disclosure
06-08 M. Hoffmann, B. Kempa The Poole Analysis in the New Open Economy Macroeconomic Framework
06-07 K. Drachter, A. Kempf, M. Wagner
Decision Processes in German Mutual Fund Companies: Evidence from a Telephone Survey
06-06 J.P. Krahnen, F.A. Schmid, E. Theissen
Investment Performance and Market Share: A Study of the German Mutual Fund Industry
06-05 S. Ber, S. Ruenzi On the Usability of Synthetic Measures of Mutual Fund Net-Flows
06-04 A. Kempf, D. Mayston Liquidity Commonality Beyond Best Prices
06-03 O. Korn, C. Koziol Bond Portfolio Optimization: A Risk-Return Approach
06-02 O. Scaillet, L. Barras, R. Wermers
False Discoveries in Mutual Fund Performance: Measuring Luck in Estimated Alphas
06-01 A. Niessen, S. Ruenzi Sex Matters: Gender Differences in a Professional Setting 2005200520052005 No. Author(s) Title
05-16
E. Theissen
An Analysis of Private Investors´ Stock Market Return Forecasts
05-15 T. Foucault, S. Moinas, E. Theissen
Does Anonymity Matter in Electronic Limit Order Markets
05-14 R. Kosowski, A. Timmermann, R. Wermers, H. White
Can Mutual Fund „Stars“ Really Pick Stocks? New Evidence from a Bootstrap Analysis
05-13 D. Avramov, R. Wermers Investing in Mutual Funds when Returns are Predictable
05-12 K. Griese, A. Kempf Liquiditätsdynamik am deutschen Aktienmarkt

05-11 S. Ber, A. Kempf, S. Ruenzi
Determinanten der Mittelzuflüsse bei deutschen Aktienfonds
05-10 M. Bär, A. Kempf, S. Ruenzi
Is a Team Different From the Sum of Its Parts? Evidence from Mutual Fund Managers
05-09 M. Hoffmann Saving, Investment and the Net Foreign Asset Position
05-08 S. Ruenzi Mutual Fund Growth in Standard and Specialist Market Segments
05-07 A. Kempf, S. Ruenzi Status Quo Bias and the Number of Alternatives - An Empirical Illustration from the Mutual Fund Industry
05-06 J. Grammig, E. Theissen Is Best Really Better? Internalization of Orders in an Open Limit Order Book
05-05 H. Beltran, J. Grammig,
A.J. Menkveld Understanding the Limit Order Book: Conditioning on Trade Informativeness
05-04 M. Hoffmann Compensating Wages under different Exchange rate Regimes
05-03 M. Hoffmann Fixed versus Flexible Exchange Rates: Evidence from Developing Countries
05-02 A. Kempf, C. Memmel On the Estimation of the Global Minimum Variance Portfolio
05-01 S. Frey, J. Grammig Liquidity supply and adverse selection in a pure limit order book market
2004200420042004 No. Author(s) Title
04-10
N. Hautsch, D. Hess
Bayesian Learning in Financial Markets – Testing for the Relevance of Information Precision in Price Discovery
04-09 A. Kempf, K. Kreuzberg Portfolio Disclosure, Portfolio Selection and Mutual Fund Performance Evaluation
04-08 N.F. Carline, S.C. Linn, P.K. Yadav
Operating performance changes associated with corporate mergers and the role of corporate governance
04-07 J.J. Merrick, Jr., N.Y. Naik, P.K. Yadav
Strategic Trading Behaviour and Price Distortion in a Manipulated Market: Anatomy of a Squeeze
04-06 N.Y. Naik, P.K. Yadav Trading Costs of Public Investors with Obligatory and Voluntary Market-Making: Evidence from Market Reforms
04-05 A. Kempf, S. Ruenzi Family Matters: Rankings Within Fund Families and Fund Inflows
04-04 V. Agarwal, N.D. Daniel, N.Y. Naik
Role of Managerial Incentives and Discretion in Hedge Fund Performance
04-03 V. Agarwal, W.H. Fung, J.C. Loon, N.Y. Naik
Risk and Return in Convertible Arbitrage: Evidence from the Convertible Bond Market
04-02 A. Kempf, S. Ruenzi Tournaments in Mutual Fund Families
04-01 I. Chowdhury, M. Hoffmann, A. Schabert
Inflation Dynamics and the Cost Channel of Monetary Transmission

Cfr/University of cologne
Albertus-Magnus-Platz
D-50923 Cologne
Fon +49(0)221-470-6995
Fax +49(0)221-470-3992
Related Documents