1 DIVERSITY – WOMEN IN MARITIME A look into female representation in the Australian maritime industry.

Welcome message from author
This document is posted to help you gain knowledge. Please leave a comment to let me know what you think about it! Share it to your friends and learn new things together.
Transcript

1
DIVERSITY – WOMEN IN MARITIME
A look into female representation in the Australian maritime industry.

2
2020 Diversity – Women in Maritime Report disclaimer and copyright statement
Disclaimer
The information, statements, statistics and commentary (together the ‘Information’) contained in this report are based on information provided in 2019 by the respondents of the surveys, referenced sources and the industry knowledge of Maritime Industry Australia Ltd (MIAL). MIAL has based this report on information received from 2019 survey respondents, on the basis that such information is accurate and complete. MIAL makes no warranty as to the accuracy of the Information although has used its best endeavours in providing it. The Information contained in this report has not been subject to any external audit. MIAL may update, amend or supplement this document at any time.
The material in this publication is of the nature of general comment only and does not represent professional advice. It is not intended to provide specific advice or guidance, and it should not be relied on as the basis for any decision to take action or not take action on any matter covered by the Information. To the maximum extent permitted by law, MIAL accepts no responsibility or liability for any damage, loss or expense howsoever incurred as a result of the reliance on the Information contained herein.
Copyright
© 2020 Maritime Industry Australia Ltd (MIAL). All rights reserved.
Except as permitted under the Australian Copyright Act 1968 (for example, a fair dealing for the purposes of study, research, criticism or review), no part of this report may be reproduced, distributed, stored in a retrieval system, communicated or transmitted in any form or by any means without prior written permission.
For permission requests, please contact Maritime Industry Australia Ltd:
Head Office: 473 St Kilda Road, Melbourne 3004
Postal Address: 473 St Kilda Road, Melbourne 3004
Phone: +61 3 9647 6000
Email: [email protected]
Attribution
Use of all or part of this report must include the following attribution: 2020 Diversity – Women in Maritime Report - Maritime Industry Australia Ltd 2020.

3
Executive Summary
MIAL’s Seafaring Skills Census quantified the concern of industry after it showed that the Australian maritime sector has a projected shortage of 560+ seafarers by 2023.1 It also highlighted the low level of female representation in roles where seafaring skills are considered essential.
In order to assess the work being done within maritime organisations to address gender diversity, MIAL undertook a further survey focused specifically on that issue. The survey was structured to capture hard data as well as the views and opinions of both employers and employees. The purpose of these surveys was for MIAL to gather information relating to gender diversity in the Australian maritime industry and gain insight into how organisations working within the industry promote diversity.
In total, there were 157 responses from a very broad cross-section of Australia’s maritime industry. This comprised of 26 for the HR Manager/Business Owner Survey and 131 for the Employee Survey. As noted above, both quantitative and qualitative data was captured with the qualitative responses providing valuable insights not able to be captured in a quantitative form.
This report identifies that in many areas there is tremendous alignment between companies and employees in recognising the importance of gender diversity and equality in the workplace, as well as in organisational strategy, but there are also areas where there is a disconnect between what companies say they are doing and what employees experience (such as initiatives to promote gender diversity in daily work practices). Some key findings are shown on the following page and also include:
• The number of females in leadership roles within organisations is low overall, particularly in higher level leadership roles;
• Both smaller organisations and larger organisations have higher female representation in their workforce compared to other organisational sizes;
• The defence industry is strong in its employment of females in younger age brackets in both seagoing and shore-based roles, which increases the gender diversity input across the breadth of the maritime industry;
• Without the defence industry, the representation of females within seagoing roles in particular is very low;
• Organisations largely don’t incorporate gender diversity strategies in recruitment processes; • The biggest barriers to entry identified by both employees and organisations is work/life balance
and unconscious bias; and • Gender diversity is considered a barrier to career progression by a minority of respondents.
The independent data and comments obtained across the breadth of the Australian maritime sector contained in this report provides valuable insights against which individual organisations can test their own systems and processes, and from which the sector as a whole can target future initiatives.
1 Maritime Industry Australia Ltd, 2018 Seafaring Skills Census Report, 2019, p. 5.

4

5
Contents Executive Summary ................................................................................................................................................... 3
Introduction ............................................................................................................................................................... 6
Methodology ............................................................................................................................................................. 6
Response Rate and Response Error ........................................................................................................................... 7
1. Survey Respondents .......................................................................................................................................... 8
2. Workforce Statistics ........................................................................................................................................ 11
Female representation ......................................................................................................................................... 11
Leadership ............................................................................................................................................................ 13
Women Employed in Shore-based Roles.............................................................................................................. 14
Seagoing roles ...................................................................................................................................................... 16
Age Profile............................................................................................................................................................ 16
3. Company Strategy and Policy .......................................................................................................................... 18
Gender equality ................................................................................................................................................... 19
Wage equality ...................................................................................................................................................... 19
4. Initiatives to Promote Gender Diversity .......................................................................................................... 22
5. Recruitment ..................................................................................................................................................... 27
6. Culture ............................................................................................................................................................. 30
7. Barriers to entry in the industry ...................................................................................................................... 33
Acknowledgements ................................................................................................................................................. 36
References ............................................................................................................................................................... 37

6
Introduction MIAL’s Seafaring Skills Census (Census) quantified the concern of industry after it showed that the Australian maritime sector has a projected shortage of 560+ seafarers by 2023.2 It also highlighted the low level of female representation in roles within the industry where experience as a seafarer is required.
The Australian labour market is highly gender-segregated by industry and occupation, a pattern that has persisted over the past two decades.3 This is true for maritime where only five percent of Australian seafarers captured in the Census were female, with the number of female ex-seafarers working ashore from the Census totalling only three percent.4
According to Workplace Gender Equality Agency, in 2018-19 women comprised forty seven percent of all employed persons in Australia.5 There is therefore an untapped potential for the industry in terms of attracting women to work within the maritime sector. But this is not just a local issue or potential.
Women currently represent only one percent of all seafarers worldwide, with the issue being at the forefront of the International Labour Organization (ILO) which recommends action and social dialogue by governments, shipowners and seafarers on this matter.6 The International Maritime Organization (IMO) also highlights the importance of gender equality in the industry with “Empowering Women in the Maritime Community” as the theme of World Maritime Day in 2019.
Australian businesses in the maritime sector have made great strides in increasing female participation. Many maritime businesses embrace the benefits of gender diversity within the workplace, bringing national productivity and competitiveness, as well as leading to improved financial performance, market share, retention, innovation, safety, group performance, access to talent and productivity for individual businesses.7 The maritime industry is traditionally a male dominated workforce but anecdotally, workplaces within the maritime industry with greater gender diversity report superior workplace culture.
Methodology In order to assess the work being done within organisations to address gender diversity, MIAL drafted two sets of questions; the first was directed to HR management (or business owners to account for the small businesses who may not have an HR representative) to gain their perspectives, the second was aimed at employees of organisations to reflect on their perspectives on the steps taken by organisations where they work. The purpose of these surveys was for MIAL to gather information relating to gender diversity in the Australian maritime industry and gain insight into how organisations work within the industry to promote diversity.
2 Maritime Industry Australia Ltd, loc. cit. 3 Workplace Gender Equality Agency, ‘Gender segregation in Australia’s workforce’, 2019, https://www.wgea.gov.au/sites/default/files/documents/18_04_Industrial_segregation.pdf, (accessed 29 November 2019). 4 Maritime Industry Australia Ltd, op. cit., p. 33. 5 Workplace Gender Equality Agency, Gender workplace statistics at a glance 2018-19 [website], https://www.wgea.gov.au/data/fact-sheets/gender-workplace-statistics-at-a-glance, (accessed 29 November 2019). 6 International Labour Organization, Note on the Proceedings: Sectoral meeting on the Recruitment and Retention of Seafarers and the Promotion of Opportunities for Women Seafarers, International Labour Office, Sectoral Policies Department, Geneva, ILO, First Edition, 2019, pp. 3 and 32. 7 Diversity Council Australia, Business case - gender [website], https://www.dca.org.au/topics/gender/business-case-gender, (accessed 7 February 2020).

7
For both the Employee and HR Manager / Business Owner Surveys, a core set of questions was prepared by MIAL, for answering by all respondents. The aim was to gather information from a diverse range of organisations within different sub-sectors who operate or work within the Australian maritime industry. Quantitative data was sought to review the statistical breakdown, but qualitative data was also sought to provide further insight.
The surveys were launched via an online platform on 29 October 2019 and responses closed on 15 November 2019. The survey was distributed via MIAL’s contact list and via LinkedIn. Organisations were encouraged to share the survey links amongst their networks.
In providing this report, analysis of the data from received responses was rounded up or down as appropriate, in order to present information in a digestible manner. Where survey responses were repetitious between questions, responses were grouped. There was also a reasonable volume of qualitative data provided in the commentary accompanying the various data sets that provides insights and further explanations/understanding not able to be captured in a quantitative form.
Note, responses from the HR Manager/Business Owner Survey (Organisation Respondents) are reflected in blue whilst the Employee Survey results are reflected in green throughout the report.
Response Rate and Response Error
In total, there were 157 responses from a cross-section of Australia’s maritime industry. This comprised of 26 for the HR Manager/Business Owner Survey and 131 for the Employee Survey.
A majority of sub-sectors in the industry are represented in the data captured.
To improve accuracy in responses, in both surveys questions were linked so that, for example, when an affirmative response was selected to one question, it lead to the next question but where it was negative, that respondent skipped the irrelevant questions relating to the affirmative option. For the HR Manager/Business Owner survey, statistical responses were linked so that there was minimal room for error and minimising contradicting responses from the one respondent, which would have otherwise compromised the data.
Out of 131 respondents for the Employee Survey, four were identified as not being in Australia and therefore their responses were removed from the analysis in this report.

8
1. Survey Respondents
Organisation (HR Manager/Business Owner) Survey
n = 26 Organisations
Note: Organisations were asked to select the most appropriate option; only one category per respondent could be selected.
Organisation Respondents were from a range of sectors per Figure 1, with ship owner/operator reflecting the largest pool of respondents.
n = 26 Organisations
Note: Organisations could select multiple options.
1, 1%2, 3%
3, 4%4, 5%4, 5%
5, 7%6, 8%
7, 10%7, 10%
11, 15%11, 15%
12, 16%
Other (Transport Safety Investigations) Search and rescue
Education Regulation
Commuter transport (mass transit ferries etc.) Oil and gas terminal operators (onshore & offshore)
Tourism (cruise sector etc.) Government (government departments, Defence)
Industry support services (professional services, suppliers) Ports and harbor service
Blue water (cargo, dry bulk, tanker) Offshore
Figure 2: Sectors the Organisation Respondents are involved in
Defence, 1, 4%Marine surveyor, 1, 4%
Marine pilot, 1, 4%
Ship build/repair/ maintenance, 1, 4%
Oil and gas operator, 1, 4%
Port/harbor services, 2, 8%
Professional service provider, 2, 8%
Other (Industry Association & Ferry
Operator), 2, 8%Crewing agent/manager/labour
hire, 3, 11%
Government department, 3,
11%
Ship Owner/operator, 9, 34%
Figure 1: How would you describe your organisation?

9
Note in Figure 2, “offshore” includes oil and gas exploration and extraction, offshore support services, construction and production ancillary services; “ports and harbor service” includes harbour masters, towage, pilotage, dredging; “regulation” includes AMSA, ASTSB, classification society and marine surveyors.
Responses for the Organisation Survey were received from a range of organisational sizes. This enabled a data comparison across a range of organisational sizes.
n = 26 Organisations
Note: Organisations were asked to include staff they employ directly, excluding indirect employment such as contractors.
Employee Survey
One hundred and thirty one (131) individuals completed the Employee Survey. One hundred and twenty four (124) Employees disclosed their gender, with a majority being male.
n = 124 Employees
1-15 employees, 23%, 6
16-100 employees, 27%, 7
101-500 employees, 38%, 10
501-1,000 employees, 4%, 1
Over 1,000 employees, 8%, 2
Figure 3: How many people does your organisation currently employ in total in Australia?
Male, 73, 59%
Female, 51, 41%
Figure 4: Gender breakdown of Respondents from Employee Survey

10
n = 127 Employees
Under ‘Other’, Respondents noted specifically they were from marine catering services, mining, shipping facilitator, harbor towage and terminal, coatings manufacturer, charterer, ship management company and transport.
Data was also sought from Respondent Employees to understand why they chose to work in the maritime industry with a pattern of responses grouped per below:
n = 127 Employees
Employee Respondents were also asked whether they have considered leaving the industry. Fifty two (38%) of Employee Respondents have considered leaving the maritime industry. Of these, 17 (33%) Employee Respondents were female.
1%2%
3%5%5%5%5%5%
4%8%
10%23%
26%
Crewing agent/manager/labour hire companyEducation provider
Marine surveyorDefence
Safety regulatorMarine pilot
Ship building/repair/maintenance servicesProfessional service provider
Oil and gas operatorOther
Government departmentShip Owner/operatorPort/harbor services
Figure 5: How would you describe your business or organisation?
3%1%
2%2%2%
5%6%
20%21%
39%
Other reason not identifiedAfter hearing about it at a school careers expo
Family connectionCommenced at RAN
MoneyChance/coincidence
Applied for a position which happened to be in maritimePursued due to personal interest
Knew someone who worked in the industrySpecialised work & happened to work at a maritime organisation
Figure 6: Reasons why Respondent Employees are in the maritime industry

11
2. Workforce Statistics
This section explores data obtained from Organisation Respondents on their total employee numbers, female representation within their workforce, female leadership figures and age breakdown of their workforce. Such statistics were not sought from the Employee Survey.
Female representation
“Australia’s maritime activity is as diverse and challenging as anywhere in the world. Our island nation is reliant upon having professional maritime expertise available and to do
that we need to ensure that we are drawing from the largest pool to select the best people to employ in the industry.”
- Teresa Lloyd, MIAL CEO, 26 September 20198
Figure 7 represents the spread of Respondent Organisations per number of employees. For example, only two of the Respondent Organisations have over 1,000 employees.
8 Maritime Industry Australia Ltd, ‘World Maritime Day – Empowering women in the maritime community’, Media Release, 26 September 2019.
n = 26 organisations
1-15 employees, 23%(6)
16-100 employees, 27% (7)
101-500 employees, 38% (10)
501-1,000 employees, 4% (1)
Over 1,000 employees, 8% (2)
Figure 7: How many people does your organisation currently employ in total in Australia?

12
n=26 organisations
Figure 8 reflects the median percentage of females employed by the Respondent Organisations per organisational size. Note, the median figure of each category was calculated rather than an average to reflect a more accurate sample (noting there were some outliers). 9 Figure 8 shows that the two ends of the scale, that is, smaller organisations with 1-15 employees as well as organisations with over 1,000 employees, have higher representation of female employees in their organisations compared to the other organisational sizes.
n = 26 Organisations
Figure 9 also shows the spread of female representation within the sectors identified in the survey. The maritime skills traditionally acquired at sea and required in marine pilotage, seafarers within ship owner/operators and ports and harbour services reflect a lower female cohort, but other sectors such as oil and gas operator and ferry operator reflect higher female representation. This indicates that women are, across various sectors, being employed in some traditionally male-oriented roles, with some sectors progressing towards gender diversity.
9 For example, for the seven organisations who had between 16-100 employees, one organisation had a 48% female representation, while another in this category had only 4% female representation.
1-15 employees, 35%
16-100 employees, 16%101-500
employees, 19%
501-1,000 employees, 4%
Over 1,000 employees, 34%
Figure 8: Median percentage of females per organisational size
4%5%
8%19%
23%29%
33%33%
46%50%
53%75%
Marine pilotCrewing agent/manager/labour hire company
Ship Owner/operatorPort/harbor services
DefenceShip building/repair/maintenance services
Professional service providerGovernment department
Oil and gas operatorMarine surveyor
Ferry OperatorIndustry association
Figure 9: Sector comparison of median female representation

13
Leadership
“I think that over time as more and more women enter the industry and grow their careers in the industry that we will see more women in leadership roles.”
- Respondent from Employee Survey
n = 26 Organisations
The majority of Respondent Organisations identified as having between one and five leadership roles occupied by women. A gap in the statistics is that the 26 Respondent Organisations were not asked how many leadership roles there are in these organisations in total, so no comparison could be drawn from that perspective.
n = 26 Organisations
Note: Organisations could select more than one option. Thirty nine leadership roles were identified, plus five ‘other’ leadership roles.
Out of the 26 Respondent Organisations in the HR Manager/Business Owner Survey, 44 senior leadership roles were identified as occupied by women. While not a conclusive indication that women are occupying a high number
23%
54%
12%
4%
0%
4%
4%
Zero
At least 1 to 5
Between 6 and 10
Between 100 and 250
Between 251 and 500
Between 501 and 1000
Over 1000
Percentage of leadership roles identified by Organisations
Num
ber o
f rol
es
Figure 10: Number of females in leadership roles
11%
11%
5%
5%
14%
14%
14%
27%
Other
None are in leadership roles
CEO
COO
CFO
General Manager/Managing Director
Technical expert
Senior management
Figure 11: Leadership roles occupied by women

14
of leadership roles available within each organisation, it does demonstrate that there are female leaders working in the maritime industry.
Under “Other”, leadership roles identified included Chief Officer, Managing Partner/Director, General Counsel, Service Manager, Sales Lead and Ship’s Captain. The five organisations who selected the option “None are in leadership roles” were from the following sectors: Ship Owner/Operator, Marine Pilotage and Government Authority.
Note that more generally in Australia, there has been a substantial increase in the proportion of females in the male dominated Manager occupation in Australia’s workforce (up from 28.3% in 1998 to 36.18% in 2018).10 This indicates that gender diversity is a broader issue across the country in workplaces generally, and not just in maritime.
“More women in key decision making positions delivers better company performance, greater productivity and greater profitability….the association between women in leadership and business performance is causal. Despite this, on average women remain under-represented in senior management.”
- Workplace Gender Equality Agency11
Women Employed in Shore-based Roles
All Respondent Organisations said their organisations employ females in shore-based roles. Note, 62% of Respondent Organisations said they employ females in seagoing roles. Where female staff are employed, they generally work in shore-based roles (notwithstanding that some organisations also employ seagoing roles).
n = 26 Organisations
Note: Organisations could select more than one answer.
The most common shore-based roles women are employed in within maritime businesses are Finance and Administration. This aligns with the gender segregation analysis of Australia’s workforce by the Workplace Gender
10 Workplace Gender Equality Agency loc. cit., Gender segregation in Australia’s workforce. 11 Workplace Gender Equality Agency, Gender Equity Insights series [website], https://www.wgea.gov.au/data/wgea-research/gender-equity-insights-series, (accessed 24 June 2020).
2%2%
4%5%
7%7%
8%8%
12%13%
17%17%
OtherAll of the above
Board levelLegal
RecruitmentCrewing
CommunicationsTechnical
Human ResourcesManagement
AdministrativeFinance
Figure 12: Types of shore-based roles in which women are employed

15
Equality Agency which shows that in 2018, 75.6% of female employees were employed in the ‘female-dominated’ occupation of clerical and administrative occupations.12 ‘Other’ roles in the Survey were noted as Customer Service roles and HSEQ. Two Organisation Respondents noted that they employ women in all of the above listed shore-based roles.
n = 26 Organisations
Note: Median percentage calculated based on each organisation's identified sector.
For the Organisation Respondents who noted they employ women in their business, a follow up question was asked as to how many employ women in shore-based roles.
Each relevant Organisation Respondent was grouped per their sector to identify the number of shore-based roles occupied by women. Figure 13 indicates, for example, that of the total women employed in the Oil and Gas Operator sector, 90% of those women are in shore-based roles. Interestingly, of the total female staff in the Defence sector, only 33% of those females occupy shore-based roles such that a majority of their female employees occupy seagoing roles (refer to Figure 15). Note, the median was calculated to consider the outliers. Also note that some of the sectors above who have 100% shore-based roles occupied by women are unlikely to employ individuals in seagoing roles.
12 Workplace Gender Equality Agency, loc. cit. Gender segregation in Australia’s workforce.
50%
33%
66%
69%
90%
100%
100%
100%
100%
100%
100%
Crewing agent/manager/labour hire company
Defence
Ferry Operator
Ship owner/operator
Oil and gas operator
Marine Surveyor
Government department
Port/harbor services
Professional service provider
Industry association
Ship building/repair/maintenance services
Figure 13: Out of the total female employees, how many are in shore-based roles?

16
Seagoing roles
n = 16 Organisations
Note: Organisations could select more than one answer.
Where Respondent Organisations indicated that they do employ women in seagoing roles, under ‘Other’ roles in Figure 14, Organisation Respondents noted females in seagoing roles included Cook, production role and Marine Pilot, with ‘no females in seagoing roles’ also noted. Ratings are the most common type of seagoing role in which women are employed; this aligns with the findings of the Seafaring Skills Census, with Ratings being the top percentage of female seafarers.13
Age Profile
n = 26 Organisations (shore-based figures) and 16 Organisations (seagoing figures)
Note: Figure 15 reflects the total sum of responses from each organisation.
13 Maritime Industry Australia Ltd, loc. cit.
19%
3%
10%
29%
3%
10%
6%
10%
10%
Other
All of the above
Hotel or guest staff
Ratings
Junior engineer
Junior deck officer
Senior engineer
Senior deck officer
Master
Figure 14: What types of seagoing roles are women in your organisation employed in?
522396
247 175 136 104 54 16 13 3 2
1322
746
304
71 7 3 3 1 1 0 0
Up to25 years
26-30years
31-35years
36-40years
41-45years
46-50years
51-55years
56-60years
61-65years
66-70years
Over 70years
Figure 15: Age brackets for female employees in all Respondent Organisations
Shore-based Seagoing

17
n = 25 Organisations (shore-based figures) and 15 Organisations (seagoing figures)
Figure 15 reflects that Respondent Organisations have significant representation in the younger age brackets, particularly for seagoing roles. Note, the figures from the Respondent Organisations of the Defence sector was removed from Figure 16 to examine the skew. Figures 15 and 16 reflect that the Defence industry is strong in its employment of females in younger age brackets in seagoing and shore-based roles, which increases the gender diversity input across the breadth of the maritime industry. It also shows that young females are entering the industry via the Defence industry. Comparing this to the Census, there is an aging workforce both at sea and ex-seafarers working ashore, with only 5% female seafarers and 3% female ex-seafarers working ashore.14
14 Maritime Industry Australia Ltd, loc. cit.
21
7182
76 78
64
42
16 133 2
158 9 11 7 3 3 1 1 0 0
Up to25 years
26-30years
31-35years
36-40years
41-45years
46-50years
51-55years
56-60years
61-65years
66-70years
Over 70years
Figure 16: Age brackets for female employees excluding Defence sector
Shore-based Seagoing

18
3. Company Strategy and Policy
This section evaluates data in relation to Organisation Respondents’ strategy and priority for including gender diversity and equality in organisational policy. It also analyses Employees’ perspectives on whether these matters
are seen as priorities for their organisations.
n = 26 Organisations and 127 Employees
The Respondent Organisations who selected ‘yes’ per Figure 17 were from a variety of organisational sizes, with a majority of those with 101 to 500 employees. All of the Respondent Organisations with over 1000 employees noted that diversity is a priority of their strategy.
Of the Respondent Organisations who selected ‘no’, diversity is not a value or priority in their organisations’ strategies, they highlighted that recruitment is based on merit, they are an equal opportunity employer with no quotas, and their capacity to target and recruit is limited by organisational size; these Respondent Organisations were or of sizes with 1-15 employees or 16-100 employees, which indicates that the smaller organisations may be said to have less of a focus on diversity as part of their strategy. Half of the Respondent Organisations who selected ‘no’ or ‘not sure’ were Ship Owner/Operators.
81%
9%
10%
69%
19%
12%
Yes
No
Note sure
Figure 17: Perspectives on whether diversity is a stated value or priority area of organisational
strategy
HR Manager / Business Owner Employees

19
Gender equality
n = 26 Organisations and 125 Employees
An overwhelming majority of Employees’ and Respondent Organisations’ perspectives are closely aligned in recognising that their organisations do have a company policy on gender equality in place, as reflected in Figure 18.
Of the 23% of Respondent Organisations which said their organisation does not have a policy or strategy in place for gender equality, the top reason for this was because of insufficient resources or expertise, followed by ‘it’s not a priority’. Another reason noted this policy as being under current development. The Respondent Organisations noted that a Discrimination /Harassment Policy and Recruitment Policy are the most common instruments which reference gender equality.
Twenty four per cent of Employee Respondents said that gender equality is something talked about quite often. Of the Employee Respondents who said their organisation does not have a policy or strategy in place for gender equality, they noted that diversity as a priority area is not evident in actions and they also refer to unconscious bias as an issue.
Wage equality
“An organisational commitment to correct like-for-like pay gaps is three times as effective in reducing overall gender pay gaps when combined with a
commitment to report pay outcomes to the executive or company board.”
- Workplace Gender Equality Agency15
15 Workplace Gender Equality Agency, loc. cit. Gender Equity Insights series.
82%
5%
13%
77%
23%
Yes
No
Not sure
Figure 18: Is there a company policy on gender equality?
HR Manager / Business Owner Employees

20
The 15% of Respondent Organisations (at Figure 19) which said they have a policy or formal strategy in place to address wage inequality ranged from a cohort of 1-15 employees to over 1,000 employees, showing that it is not necessarily the larger organisations with typically more resources that have a focus on wage inequality. Of these organisations, their policy/formal strategy includes gender pay equity objectives such as:
• To achieve gender equality and be transparent about salary bands; • To ensure no gender bias occurs at any point in the remuneration review or performance assessment
process; and • To ensure managers are held accountable for pay equity outcomes.
The 15% of Organisation Respondents (four organisations) who have undertaken pay gap audits were from a Government Department, Oil and Gas Operator, Professional Service Provider and a Ship Owner/Operator. Each
n = 26 Organisations
n = 26 Organisations

21
of these Organisation Respondents ranged from organisations who employ 80 through to 3,000 employees, representing that size of the organisation also does not necessarily have an impact on this.
n = 26 Organisations

22
4. Initiatives to Promote Gender Diversity This section analyses the organisations’ commitment to promoting gender diversity and equality by reviewing
initiatives, programs, training and flexibility from perspectives of both the Respondent Organisations and Employees.
n = 26 Organisations and 127 Employees
The 58% (15) of Organisation Respondents who said there are initiatives in place to promote diversity at Figure 22 were from a variety of sectors, namely Crewing Agent/Manager/Labour Hire Company, Government Department, Ship Owner/Operator, Defence, Professional Service Provider and Port/Harbor Services. These Respondent Organisations were a variety of sizes, showing that organisational size does not necessarily have an impact on whether an organisation focuses on gender diversity initiatives. Employee Respondents were somewhat aligned with their understanding, with the main difference being more Employees are ‘not sure’ of whether such initiatives are in place compared to Organisation Respondents. This is not surprising given that HR and business owners are usually the ones pursuing these types of initiatives.
A survey, Change at Work, by the Diversity Council last year found only one in four diversity programs was meeting its intended goals….That’s because many,
including mentoring and unconscious bias training, were not well structured, and failed to follow change management principles or set clear goals.
- Article from The Australian Business Review16
16 C. Fox (2020) ‘Gender, race and the corporate balance sheet’, The Australian Business Review, 17 June 2020, https://www.theaustralian.com.au/business/the-deal-magazine/gender-race-and-the-corporate-balance-sheet/news-story/40dca5a1dec1ecc41804a2e66defe1b1, (accessed 24 June 2020).
26%
31%
43%
4%
38%
58%
Not sure
No
Yes
Figure 22: Are there any initiatives in place to promote diversity in daily work practices?
HR Manager / Business Owner Employees

23
n = 15 Organisations and 58 Employees
Note, respondents could select more than one option.
Figure 23 shows that Organisation Respondents and Employee Respondents are mostly aligned as to their understanding of the initiatives and programs in place (and/or available) that promote or increase diversity at their organisations. Of the 44% of Employee Respondents who said initiatives are in place, ‘Other’ was noted as development of a diversity and inclusion policy and introduction of gender quotas.
Four Respondent Organisations selected ‘Other’ and noted that these initiatives were not applicable given they have a majority female staff already, small organisational size impacts this, and they do not have many female candidates who apply. This indicates that the industry or roles advertised may not be attractive to women in the first place or there may be other barriers, not that organisations don’t want to employ them. It was noted that the use of recruitment services did not make a difference in terms of receiving female applicants for jobs.
n = 58 Employees
1%
5%7%
8%
9%
16%
16%18%
20%
2%
10%
3%
10%
14%
10%
21%
19%
Other
All of the above
Collaboration with organisations promoting diversity
Publish diversity and inclusion targets
Mentoring programs
Training / Workshops / Seminars
Special events to promote diversity and inclusion
Flexible working patterns
Policy on parental leave and return to work
Figure 23: What initiatives / programs are in place to promote or increase diversity?
HR Manager / Business Owner Employees
79% of employees (n=57) said that
these initiatives are effective.

24
Although a majority of Respondent Employees have noted that they have participated in such initiatives to promote or increase diversity at Figure 24, there is still a question to be asked about why 28% said they haven’t.
Employee Respondents were asked to consider what their organisation could do better to promote/increase diversity from their perspective. Around 28% of 112 Employees who responded to this question noted that their organisation is already doing enough to promote or increase gender diversity, and some also noted that focus should be on the person with the requisite competency and skills, rather than a focus on gender. However, of the Employee Respondents who provided qualitative responses to this question, the following patterns emerged from 50% of the 112 respondents, demonstrating that some organisations have more work to do:
• Increase training and encourage discussion, understanding and benefit of gender diversity; • Advertise and promote the industry for women, for example to high school students; • Actively promote diversity objectives throughout the organisation and with contractors; • Employ more women in technical/specialist roles, particularly where they are qualified and require
further mentoring or experience; • Develop policy positions and implement these in the organisation, set up working groups and actively
demonstrate the values of an organisation on the ground, not just refer to the policy on paper.
This suggests that more needs to be done to educate and promote internal values and gender diversity as a concept, including its benefits, to increase gender diversity and inclusion within organisations. Other Employee views expressed that appointment to a role should be based on competency and availability, not because of diversity targets (which depends on who actually applies for positions as for many, the number of male candidates outweighs female candidates).
Some Employee Respondents also noted that unions have low involvement in promoting gender diversity balance and the legacy of a male dominated workforce is still present; more needs to be done to break this stigma. Other Employee suggestions were to educate men from different cultural backgrounds on acceptable ways of communicating with women in Australia and to also consider targeted training on unconscious bias, buddy systems for new female entrants and including gender diversity and unconscious bias in induction procedures.
n = 15 Organisations (who noted they do currently have initiatives in place)
Note: Organisations could select more than one option.
12%
12%
4%
15%
15%
15%
19%
None
All of the above
Training / Workshops / Seminars
Collaboration with organisations promoting diversity
Male Champions of Change
Diversity & Inclusion working group or committee
Mentoring programs
Figure 25: What additional initiatives or programs do you think could promote/increase diversity in your
organisation?

25
n = 26 Organisations and 125 Employees
The Employee Respondents and Organisation Respondents presented similar results in respect of training per Figure 26, with a clear majority (minimum 70%) noting that training for bullying, harassment and discrimination is rolled out at their organisation.
For the four Organisation Respondents (15%) that said training wasn’t rolled out, it was noted that small organisational size impacts the need to conduct training (i.e. with small numbers it is not necessary), the policy is relied on and/or enforced instead, or that it was just not necessary in general. A majority of these organisations were small businesses (under 15 employees) with fairly balanced female representation.
Seventy three per cent (19) of the 26 Organisation Respondents noted that their training for bullying, harassment and discrimination is rolled out across the entire workforce.
As to whether organisations engage third party providers to deliver training or other initiatives, out of 15 Organisations who responded to this question, a majority (60%) of Organisation Respondents said no, with 27% saying they do, and 13% unsure.
n = 26 Organisations
9%
21%
70%
12%
15%
73%
Not sure
No
Yes
Figure 26: Is training conducted to recognise, resolve and prevent bullying, harassment and/or discrimination in the workplace?
HR Manager/Business Owner Employee
4%
8%
9%
13%
17%
19%
30%
None
Regular training for all employees (e.g. yearly)
All of the above
Face-to-face training
Online training
Ad hoc training for employees
Onboarding process for new employees
Figure 27: How does your organisation conduct training to recognise, resolve and prevent bullying, harassment and/or
discrimination?
26
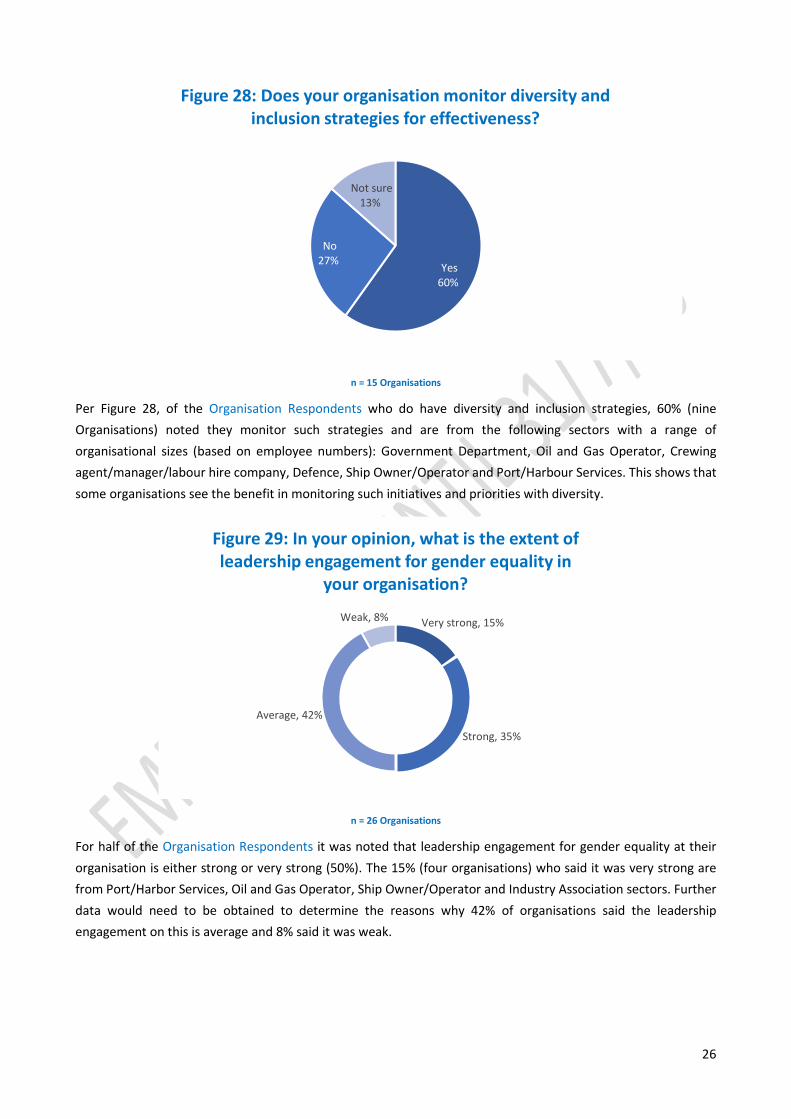
n = 15 Organisations
Per Figure 28, of the Organisation Respondents who do have diversity and inclusion strategies, 60% (nine Organisations) noted they monitor such strategies and are from the following sectors with a range of organisational sizes (based on employee numbers): Government Department, Oil and Gas Operator, Crewing agent/manager/labour hire company, Defence, Ship Owner/Operator and Port/Harbour Services. This shows that some organisations see the benefit in monitoring such initiatives and priorities with diversity.
n = 26 Organisations
For half of the Organisation Respondents it was noted that leadership engagement for gender equality at their organisation is either strong or very strong (50%). The 15% (four organisations) who said it was very strong are from Port/Harbor Services, Oil and Gas Operator, Ship Owner/Operator and Industry Association sectors. Further data would need to be obtained to determine the reasons why 42% of organisations said the leadership engagement on this is average and 8% said it was weak.
Yes60%
No27%
Not sure13%
Figure 28: Does your organisation monitor diversity and inclusion strategies for effectiveness?
Very strong, 15%
Strong, 35%
Average, 42%
Weak, 8%
Figure 29: In your opinion, what is the extent of leadership engagement for gender equality in
your organisation?

27
5. Recruitment
This section analyses how Respondent Organisations focus on strategies to attract women in their recruitment processes, as well as in scholarships or cadetships. Employees were not asked their perspective on this.
“The Maritime Industry needs to have a coordinated approach to improving not only gender diversity, but general diversity to improve our industry's image and outcomes. Diversity makes business sense, but organisations
can’t just approach this issue alone”
- Respondent from Employee Survey
n = 26 Organisations
More than half of the Organisation Respondents (14 organisations; 54%) per Figure 30 said they do not have a diversity strategy in their recruitment process. Of the ten organisations (38%) which said they do, they range from Crewing agent/manager/labour hire company, Government Department, Oil and Gas Operator, Defence, Ship Owner/Operator and Port/Harbor Services sectors. The results here demonstrate that there is room for improvement with internal recruitment processes in focusing on diversifying the workforce throughout the recruitment phase.
“As an Indigenous woman working in HR, this is something I am very interested in. It is important that there are opportunities for all, regardless
of background. It is important that the conversation takes place, between all people.”
- Respondent from Employee Survey
Yes, 38%
No, 54%
Not sure, 8%
Figure 30: Does your organisation have gender diversity strategies in its recruitment process,
particularly for women in maritime?

28
n = 10 Organisations
Note: Respondent Organisations could select more than one option. Only those ten organisations who said they have diversity strategies in place per the previous question responded to this question.
Of the ten Respondent Organisations (38%) who said they implement gender diversity strategies in their recruitment processes, eight (80%) say these measures have been effective. For the 54% of Respondent Organisations who said they do not have diversity strategies in place in their recruitment process, Respondents were invited to provide qualitative responses. The reasons articulated were:
• Not relevant/not necessary and focus is on the most qualified and experienced candidate available; • Small size of the organisation means formal strategies are not currently necessary; • Lack of available internal resources; • Informal strategies are relied upon to engage with women through their network and via organisations
such as WISTA; and • Given the market has a higher percentage of males (generally there are little, if any, eligible female
candidates) and given the current economic climate, a diversity strategy has not been a strong focus.
“To reiterate, close your eyes. Choose on merit, but also recognise that women may (or may not) need a boost, due to historical
suppression.”
- Respondent from Employee Survey
6%
3%
6%
12%
12%
15%
21%
24%
All of the above
Other (Focus on achieving gender balanced shortlists)
Quotas to hire a certain number of female employees
Promotion of jobs at specific networking events
Recruiters/managers undergo training re unconscious bias
Using key words or terms in job ads
Promote flexibile work hours in the job ad
Gender neutral language in job ads
Figure 31: What type of diversity strategies have been implemented in the recruitment process?

29
n = 26 Organisations
A majority of Organisation Respondents (73% or 19 organisations) do not offer scholarships, cadetships or graduate programs specifically for women. Of the six Organisations that do, two employ between 1-15 employees, and the remainder were of organisational sizes ranging between 101-500 employees and over 1,000 employees. Organisational size therefore does not seem to have an impact on whether such scholarships are offered.
None73%
1 to 515%
5 to 104%
More than 104%
Not sure4%
Figure 32: How many scholarships, cadetships or graduate programs are offered specifically for
women at the organisation?

30
6. Culture
This section explores the culture of organisations from perspectives of the Organisations.
“There is a cultural difference between how gender diversity and equity are discussed from our head office … compared to current Australian
standards. Our business needs to put more effort into progressing Australia further from its current position, rather than waiting for less
female friendly cultures to catch up.”
- Respondent from Employee Survey
n = 26 Organisations
Of the minority Organisation Respondents (four out of 26, or 15%) which indicated that in their view, their organisation’s workplace culture does not embrace diversity and inclusion of women, they were from sectors of Marine Surveyor, Ship Owner/Operator and Port/Harbor Services, with a majority having between 16-100 employees and one between 501-1,000 employees.
Yes, 85%
No, 15%

31
n = 26 Organisations
A majority of Organisation Respondents noted their organisation employs measures to ensure diversity in daily work practices (per Figure 34). For those that said they do not, it was noted via qualitative responses that it is not relevant with a majority female organisation, it’s not a priority nor is it necessary, diversity is promoted but it is difficult to ensure and there are difficulties with resourcing, funding and systems necessary to enact this.
n = 14 Organisations.
Fourteen organisations provided responses to this question based on their affirmative response to the previous question.
It is acknowledged that for employees working at sea, some measures may not be possible (e.g. working from home). No other measures were identified by the Respondents beyond Figure 35.
Yes, 54%No, 27%
Not sure, 19%
Figure 34: Does your organisation employ measures to ensure diversity in daily work practices?
26%
6%
13%
16%
19%
19%
All of the above
Paid parental leave (for both parents)
Return to work for staff who have been onparental leave
Work from home arrangements
Flexible work hours
Carer’s leave
Figure 35: What type of measures does your organisation employ to ensure diversity in daily
work practices?

32
n = 14 Organisations.
Fourteen organisations provided responses to this question based on their affirmative response to the previous questions.
A vast majority of Organisation Respondents consider the measures listed in Figure 35 to be effective. Of the one Respondent who said these measures have not been effective, they noted that the measures do not address underlying drivers on lack of gender diversity, including cultural considerations, lack of available female candidates and management attitudes.
Yes, 79%
No, 7%
Not sure, 14%
Figure 36: Have these measures been effective?

33
7. Barriers to entry in the industry
This section explores perspectives on barriers to entry into the industry.
“Operating, commanding and preparing our modern high tech Navy for the full spectrum of contingency operations demands a modern team-based workforce that leverages the full
contribution of every member - regardless of race, gender or religion.
Some of our traditional settings, behaviours and practices have acted as barriers which prevented women from reaching their potential.
Removing these barriers inherently increases Navy’s ability to leverage the full potential of our entire workforce - maximising our capability to defend Australia and our national
interests.”
- RADM Mark Hammond, AM, RAN, Deputy Chief of Navy, 02 July 2020
Note, respondents could select more than one option.
Unconscious bias17 and work/life balance were the most common barriers identified for barriers to entry for females into the maritime industry by both Employee Respondents and Organisation Respondents (per Figure 37). Five Organisation Respondents noted that all of the listed options were barriers for women and in response to ‘Other’ barriers to entry, Organisation Respondents noted that lack of knowledge and a lack of promotion of maritime careers in early years (schools) targeted at women creates a barrier, as well as the fact that there are not many female applicants with shipping experience. Being an industry that lacks appeal to many women was also noted.
17 An example of unconscious bias included in the survey was ‘a general perception that women can’t do the same as men’. Per Australian National University, Unconscious bias, 2015, cited in Australian Public Service Commission, Unconscious bias, 2018, [website] https://www.apsc.gov.au/unconscious-bias (accessed 23 June 2020),“unconscious or hidden bias…[is]…'a normal human prejudice' about people or groups of people. It happens automatically and is triggered by our making quick assessments of people and situations based on our own background, culture and personal experiences. Often people refer to 'first impressions' and intuitions about others, which are ways of expressing unconscious bias. Unconscious bias is considered to be outside our control though we can take steps to mitigate its effects”.
10%
11%
12%
18%
22%
27%
11%
9%
16%
16%
21%
19%
Lack of career development
Other
Low number of scholarships and subsidies for seafaring courses
Not enough jobs in the market
Unconscious bias (a general perception that women can’t do the same as men)
Work/life balance
Figure 37: Biggest barriers to entry for females into the maritime industry
HR Manager / Business Owner Employee

34
From an Employee perspective, ‘Other’ barriers noted by Employee Respondents were a lack of awareness as a career option (most prevalent), discomfort of working in a largely male-dominated environment, perception of barriers being in place, life at sea is not attractive, and it presents a choice between career and family.
n = 125 Employees and 26 Organisations
Figure 38 shows that Employees and Organisations are mostly aligned as to whether diversity is a barrier to progression (e.g. for some roles, men are more likely to obtain a position over women), with a vast majority noting gender is not a barrier. However, a substantial percentage of Employee Respondents, 28%, still believe that gender is a barrier to progression. These Employees were from industries including Port/Harbour Services, Professional Service Provider, Ship Owner/Operator and Government Department, and a majority of those respondents were female.
n = 26 Organisations
Interestingly, a substantial percentage of Organisation Respondents noted that working at sea versus working in other roles do not present different barriers for women. For the Organisation Respondents, the following patterns of qualitative responses were noted in respect of why there are different barriers (‘yes’ responses):
28%
72%
12%
88%
Yes
No
Figure 38: Perspectives on whether diversity is a barrier to employee progression
HR Manager / Business Owner Employee
Yes, 58%
No, 42%
Figure 39: In your opinion, are there different barriers for women working at sea compared to women
working other roles?

35
• The maritime industry is traditionally very male dominated; • Work life balance, family / social challenges, onboard facilities and long swings; • For international shipping challenges with cultural differences and the slow pace of change, but less so in
domestic shipping; • Perception that women aren't suited to the lifestyle or job requirements; and • Historic bias against women at sea.

36
Acknowledgements
MIAL wishes to thank all the organisation representatives and individuals who took the time to complete the surveys. Their input has provided constructive data and outlooks from their different perspectives that have contributed to the compilation of the Diversity – Women in Maritime report.
MIAL also acknowledges the contributions made by MIAL members in highlighting their interest in exploring and addressing the gender imbalance and the opportunity this presents, as well as those who provided feedback into the preparation of the survey questions. MIAL also thanks its members and other organisations who have provided photos for inclusion throughout the report.
The independent data and comments obtained across the breadth of the Australian maritime sector contained in this report provides valuable insights and MIAL looks forward to supporting and exploring ways in which the industry can improve on the breadth of gender diversity in the Australian maritime industry from here.

37
References
Australian National University, Unconscious bias, 2015, cited in Australian Public Service Commission, Unconscious bias, 2018, [website] https://www.apsc.gov.au/unconscious-bias (accessed 23 June 2020).
C. Fox (2020) ‘Gender, race and the corporate balance sheet’, The Australian Business Review, 17 June 2020, https://www.theaustralian.com.au/business/the-deal-magazine/gender-race-and-the-corporate-balance-sheet/news-story/40dca5a1dec1ecc41804a2e66defe1b1 (accessed 24 June 2020).
Diversity Council Australia, Business case - gender [website], https://www.dca.org.au/topics/gender/business-case-gender, (accessed 7 February 2020).
International Labour Organization, Note on the Proceedings: Sectoral meeting on the Recruitment and Retention of Seafarers and the Promotion of Opportunities for Women Seafarers, International Labour Office, Sectoral Policies Department, Geneva, ILO, First Edition, 2019, pp. 3 and 32.
Maritime Industry Australia Ltd, 2018 Seafaring Skills Census Report, 2019, p. 5.
Maritime Industry Australia Ltd, ‘World Maritime Day – Empowering women in the maritime community’, Media Release, 26 September 2019.
Workplace Gender Equality Agency, Gender Equity Insights series [website], https://www.wgea.gov.au/data/wgea-research/gender-equity-insights-series, (accessed 24 June 2020).
Workplace Gender Equality Agency, ‘Gender segregation in Australia’s workforce’, 2019, https://www.wgea.gov.au/sites/default/files/documents/18_04_Industrial_segregation.pdf, (accessed 29 November 2019).
Workplace Gender Equality Agency, Gender workplace statistics at a glance 2018-19 [website], https://www.wgea.gov.au/data/fact-sheets/gender-workplace-statistics-at-a-glance, (accessed 29 November 2019).
Related Documents