ANNUAL REPORT AND ACCOUNTS 2015 AGRICULTURE | FOOD | ENGINEERING DIVERSITY STRENGTHENS PERFORMANCE

Welcome message from author
This document is posted to help you gain knowledge. Please leave a comment to let me know what you think about it! Share it to your friends and learn new things together.
Transcript

CA
RR
’S G
RO
UP
PLC
AN
NU
AL R
EP
OR
T AN
D A
CC
OU
NTS
20
15
Old Croft, Stanwix, Carlisle CA3 9BAwww.carrsgroup.com
ANNUAL REPORT AND ACCOUNTS
2015
AGRICULTURE | FOOD | ENGINEERINGDIVERSITY STRENGTHENS PERFORMANCE
STRATEGIC REPORT
THEGROUP
STRATEGIC REPORT1 Highlights2 Group at a Glance4 Chairman’s Statement6 Group Strategy7 Divisional Highlights8 Strategy in Action10 Chief Executive’s Review15 Risk Management18 Financial Review20 Key Performance Indicators21 The Board22 Corporate Responsibility
CONTENTS
CORPORATE GOVERNANCE25 Corporate Governance Report28 Audit Committee Report30 Remuneration Committee Report36 Nominations Committee Report37 Directors’ Report
FINANCIAL STATEMENTS40 Independent Auditors’ Report to the Members of Carr’s Group plc44 Consolidated Income Statement45 Consolidated and Company Statements of Comprehensive Income 46 Consolidated and Company Balance Sheets47 Consolidated Statement of Changes in Equity48 Company Statement of Changes in Equity49 Consolidated and Company Statements of Cash Flows50 Principal Accounting Policies55 Notes to the Financial Statements92 Five Year Statement94 Directory of Operations96 Registered Office and Advisers
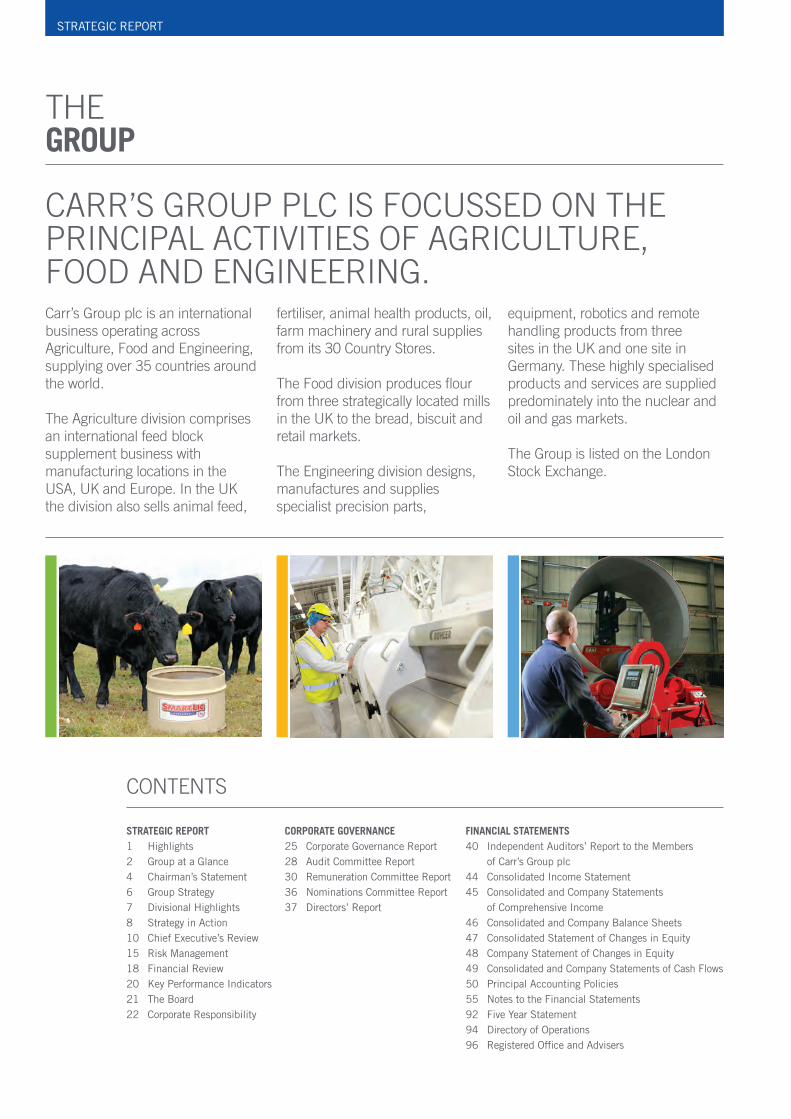
CARR’S GROUP PLC IS FOCUSSED ON THE PRINCIPAL ACTIVITIES OF AGRICULTURE, FOOD AND ENGINEERING.Carr’s Group plc is an international business operating across Agriculture, Food and Engineering, supplying over 35 countries around the world.
The Agriculture division comprises an international feed block supplement business with manufacturing locations in the USA, UK and Europe. In the UK the division also sells animal feed,
fertiliser, animal health products, oil, farm machinery and rural supplies from its 30 Country Stores.
The Food division produces flour from three strategically located mills in the UK to the bread, biscuit and retail markets.
The Engineering division designs, manufactures and supplies specialist precision parts,
equipment, robotics and remote handling products from three sites in the UK and one site in Germany. These highly specialised products and services are supplied predominately into the nuclear and oil and gas markets.
The Group is listed on the London Stock Exchange.
Designed and produced by corporateprm, Edinburgh and London. www.corporateprm.co.uk

01CARR’S GROUP PLCANNUAL REPORT AND ACCOUNTS 2015
STR
ATEG
IC R
EPO
RT
CO
RPO
RATE
GO
VER
NAN
CE
FINAN
CIA
L STATE
MEN
TS
View this report onlinewww.carrsgroup.com
FINANCIALHIGHLIGHTS
2015HIGHLIGHTS
FURTHER INVESTMENT INOUR RETAIL NETWORK
CREATION OF ENGINEERING DESIGN DEPARTMENT
EARNINGS PER SHARE**
* restated for IAS 19 Revised** restated for the effect of the 10:1 share split in January 2015
8.8% UP FROM 2014 3.7p
DIVIDEND PER SHARE**
3.7p
3.4p
3.2p
2.9p
2.6p
2015
2014
2013
2012
2011
4.7% UP FROM 201413.4p
5.5% UP FROM 2014£17.5m
PROFIT BEFORE TAX
4.1% DOWN FROM 2014 £411.6m
REVENUE
12.8
p
13.4
p
12.4
p
9.8p
7.7p
2014
2015
2013
*
2012
2011
£16.
6m
£17.
5m
£15.
4m
£13.
1m
£10.
0m
2014
2015
2013
*
2012
2011
£429
.0m
£468
.1m
£404
.1m
£373
.3m
£411
.6m
2014
2013
2012
2011
2015
AGRICULTURE DIVISION ACQUISITIONS

02 CARR’S GROUP PLCANNUAL REPORT AND ACCOUNTS 2015
STRATEGIC REPORT
GROUP AT A GLANCE:STRENGTH THROUGH DIVERSITY
AGRICULTUREOVERVIEW AND MARKETS
FOODOVERVIEW AND MARKETS
ENGINEERINGOVERVIEW AND MARKETS
The Agriculture division develops and supplies a range of branded innovative animal nutrition products into the livestock industries as well as servicing the UK farming and rural communities through a network of retail stores and fuel businesses.
Carr’s develops and manufactures branded molasses-based feed supplements, in the form of high and low moisture feed blocks, which enrich the diet of all types of farm animals.
Operational LocationsThe division’s products are manufactured in the USA, Germany and the UK, which are sold through a vast distributor network across the UK, Europe, New Zealand and North America.
Customer BaseLeading livestock farmers across the globe in the dairy, beef, sheep, pig and equine sectors.
The Food division supplies bakeries, food manufacturers and multiples across the UK, using the latest milling technologies and sourcing the best wheat either from the UK or overseas.
Carr’s works with its customers to meet their changing requirements in a constantly changing marketplace; developing commercial strategies in response to increasingly volatile commodity markets.
Operational LocationsThe division operates from two strategically located dockside sites in the UK, on the coast at Silloth in Cumbria and at the state-of-the-art site at Kirkcaldy in Fife, as well as a third mill at Maldon in Essex.
Customer BaseFood manufacturers and retailers, which use bulk and bagged flour as well as ethnic and artisanal flour products.
The Engineering division designs and manufactures bespoke equipment for use in the nuclear, oil and gas, and petrochemical industries. Products include manipulators, robotics, specialist fabrication and precision machining.
Carr’s is focussed on the design and manufacture of pressure vessels and steel fabrications together with specialist remote handling technology, robotics and radiation protection equipment for use in environments inaccessible to humans. Operational LocationsThe division is based in a number of key locations across the UK and in Germany, distributing to clients around the world including Europe, North and South America, Russia, Australia, Japan and South Africa.
Customer BaseKey players across the worldwide nuclear, research, oil and gas, and petrochemical industries.
Carr’s is an international group focussed on developing innovative solutions for our global customers. The Group’s distribution network spans over 35 countries worldwide, and the geographic and divisional diversity lies at the centre of our strategy. The Group consists of three divisions operating in markets that offer growth prospects, delivering products and services to the global agri-food and energy sectors. Our diverse geographic and divisional exposure provides strength in an increasingly volatile global economic environment.
REVENUE
£297.7mOPERATING PROFIT
£11.2m
REVENUE
£80.3mOPERATING PROFIT
£3.1mEMPLOYEES TOTAL: 605 EMPLOYEES TOTAL: 169
REVENUE
£33.5mOPERATING PROFIT
£3.3mEMPLOYEES TOTAL: 302
435 170 139 30 258 44

03CARR’S GROUP PLCANNUAL REPORT AND ACCOUNTS 2015
STR
ATEG
IC R
EPO
RT
CO
RPO
RATE
GO
VER
NAN
CE
FINAN
CIA
L STATE
MEN
TS
JAPAN
SOUTH AFRICA
MAURITIUS
ARGENTINA
NEW ZEALAND
AUSTRALIA
CANADA
SOUTH KOREA
TURKEY
CYPRUS
KAZAKHSTAN
QATARUNITED ARABEMIRATES
KUWAIT
ICELAND RUSSIA
CHINA
TAIWAN
INDONESIA
GERMANY
USA
UK
FRANCE
BELGIUM
SWITZERLAND
NETHERLANDS
CZECH REPUBLIC
POLAND
SWEDENNORWAY
AUSTRIA
UK
GERMANY
IRELAND
SPAINPORTUGAL
FRANCE SWITZERLAND
NETHERLANDS
CZECH REPUBLIC
SLOVAKIA
POLAND
ESTONIA
FINLAND SWEDEN
NORWAY
BELGIUM
ITALY
DENMARK
AUSTRIA
UK
GERMANYROMANIA
SERBIA
HUNGARY
UKRAINE
LITHUANIA
LATVIA
GREECE
INTERNATIONALDISTRIBUTION
Our Engineering and Agriculture divisions distribute to customers all over the world.
UKLOCATIONS
AGRICULTUREEUROPEAN DISTRIBUTION
HEAD OFFICE
AGRICULTURE
FOOD
ENGINEERING
ENGINEERINGEUROPEAN DISTRIBUTION

04 CARR’S GROUP PLCANNUAL REPORT AND ACCOUNTS 2015
STRATEGIC REPORT
STRATEGIC DELIVERY I am pleased to report that the Group has delivered another record year of profit before tax. This is particularly encouraging given the challenging market backdrop across all three of our divisions. Achieving this performance is testament to the management team and employees of the Group and the Board would like to thank everyone involved for their dedication and continuing to strive for excellence.
CHRIS HOLMESCHAIRMAN
“The Group’s diversity, both geographic and operational, has driven performance, with another year of record profit.”
CHAIRMAN’SSTATEMENT
Revenue for the year fell by 4.1% to £411.6 million (2014: £429.0 million). Profit before tax was up 5.5% to £17.5 million (2014: £16.6 million). This comprised an 8.8% increase in Agriculture profit before tax to £10.4 million (2014: £9.6 million), a 6.3% increase in Food profit before tax to £2.4 million (2014: £2.3 million), and a 16.7% reduction in Engineering profit before tax to £3.1 million (2014: £3.7 million).
Basic earnings per share were up by 4.7% to 13.4 pence per share (2014 restated: 12.8 pence), with fully diluted earnings per share of 12.9 pence (2014 restated: 12.3 pence) and adjusted earnings per share, excluding non-recurring items and amortisation of intangibles of 13.6 pence (2014 restated: 13.1 pence). Net debt decreased slightly to £24.4 million (2014: 24.6 million).
05CARR’S GROUP PLCANNUAL REPORT AND ACCOUNTS 2015
STR
ATEG
IC R
EPO
RT
CO
RPO
RATE
GO
VER
NAN
CE
FINAN
CIA
L STATE
MEN
TS
In addition, on 10 September 2015 it was announced that Robert Heygate had decided to stand down from the Board after 25 years’ service, with effect from April 2016. I would like to take this opportunity to thank Bob, for his contribution, dedication, enthusiasm, and support during his time with Carr’s.
OUTLOOKIn the year ahead we expect the headwinds seen across all three divisions to continue. However, we remain confident that the Group’s diversity and resilient business model positions us well to make further progress in 2016. We will continue to build on our success and invest for the future across the Group, both in the UK and internationally. We expect our innovative approach, in particular the development of new products, to continue to differentiate us from the competition and we will remain alert to suitable complementary acquisitions. This, alongside plans to develop existing businesses organically, ensures the Group is well placed in the medium term.
CHRIS HOLMESChairman11 November 2015
CHANGE OF NAMEAt a General Meeting on 8 April 2015 the shareholders approved the change of Company name from Carr’s Milling Industries PLC to Carr’s Group plc with the change effective on 9 April 2015.
ARTICLES OF ASSOCIATIONAs a result of the change of name to Carr’s Group plc the Board have reviewed the Articles of Association and have asked the Company’s solicitor to amend the Articles in line with minor regulatory changes and best practice. The resolution to adopt the new Articles will be proposed at the AGM on 5 January 2016, and a copy of the Articles will be enclosed with the notice of the AGM.
SHARESAVE SCHEMEThe Carr’s Milling Industries Sharesave Scheme 2006 expires in 2016 so no further options may be granted to employees under the scheme. Therefore a replacement, Carr’s Group Sharesave Scheme 2016, incorporating the old scheme and updates necessary for changes in legislation, has been drafted and a resolution to adopt the replacement scheme will be proposed at the AGM on 5 January 2016. A copy of the main terms of the replacement scheme will be enclosed with the notice of the AGM.
DIVIDENDThe Board is proposing a 8.8% increase in the final dividend to 1.85 pence per ordinary share, which together with the two interim dividends, each of 0.925 pence per ordinary share paid on 15 May and 9 October 2015, make a total of 3.7 pence per share for the year (2014 restated: 3.4p), representing an increase of 8.8%. The final dividend, if approved by the Shareholders, will be paid on 15 January 2016 to Shareholders on the register at close of business on 18 December 2015, and the shares will go ex-dividend on 17 December 2015.
THE BOARD During the year, John Worby was appointed as a Non-Executive Director of the Board, taking over as Senior Independent Director and Audit Committee Chairman from Alistair Wannop and Robert Heygate respectively. John’s experience in FTSE 250 companies Fidessa plc, Genus plc, Cranswick plc and Uniq plc, coupled with his financial and sector experience, enhances the Board’s expertise. Since the year-end the Board has been further strengthened with the appointment of Non-Executive Director Ian Wood, who has extensive experience in the engineering and energy sectors, working currently for Centrica plc.
In Agriculture, the business continued to build on the momentum established in previous years, with our retail operations expanding into new territories through both acquisitions and organic growth. Our geographic presence and relevance of our product offering will be key to supporting farming customers, given the tough market climate they face over the forthcoming year.
Our international feedblock business has performed well, with a key strength of the business being our geographic reach. In the UK, lower farm incomes, coupled with excellent quality forage, resulted in reduced demand. However, in the USA we have seen a significant uplift in demand on the back of the rebuilding of beef herds together with favourable weather conditions. We continue to invest heavily in the R&D of these products both in the UK and internationally to drive future growth.
The Food division has delivered further growth despite changes in the consumer market having an adverse impact on our customers, which is expected to continue into the current financial year. Our continuing excellent customer service across all three mills ensures we are well placed to face these challenges and ensure the needs of our customers are surpassed.
It has been a tough year for our Engineering division, with a combination of the depressed oil price and the impact of a complicated factory move affecting our precision engineering business, Chirton Engineering. Additionally, reduced activity in the nuclear sector in Japan and economic sanctions with Russia impacted Wälischmiller. However, we have continued to invest across the division in order to build for the future and to benefit from the expected increase in demand from the UK nuclear sector.
GOVERNANCEThe Board is mindful of the UK Corporate Governance Code and takes its responsibilities very seriously. It continues to strive to comply with all areas of the Code and a full report on Corporate Governance can be found on pages 25 to 27. All Directors will be standing for election at the Annual General Meeting (AGM) on 5 January 2016.
SHARE SPLITThe Company’s shares split 10:1 on 14 January 2015 following shareholder approval. This reduced the nominal value of the ordinary shares to 2.5 pence each, and was undertaken to primarily improve the liquidity of the Company’s shares.

06 CARR’S GROUP PLCANNUAL REPORT AND ACCOUNTS 2015
STRATEGIC REPORT
To be recognised as a truly international business at the forefront of technology and innovation
Seen and recognised as leaders in innovation
Acquisition strategy for growth and joint ventures with
strategic purpose
Investment in assets to ensure long term competitive advantage
Investing in people that will shape the business in ten years’ time
TECHNOLOG
Y
I
NVE
STMENT
AGRICULTURE
FOOD ENGINEERING
ADDE
D VA
LUE
PEOPLEACQUIS
ITIO
NS
GROUPSTRATEGY
VISION
07CARR’S GROUP PLCANNUAL REPORT AND ACCOUNTS 2015
STR
ATEG
IC R
EPO
RT
CO
RPO
RATE
GO
VER
NAN
CE
FINAN
CIA
L STATE
MEN
TS
BUSINESSSTRATEGIES
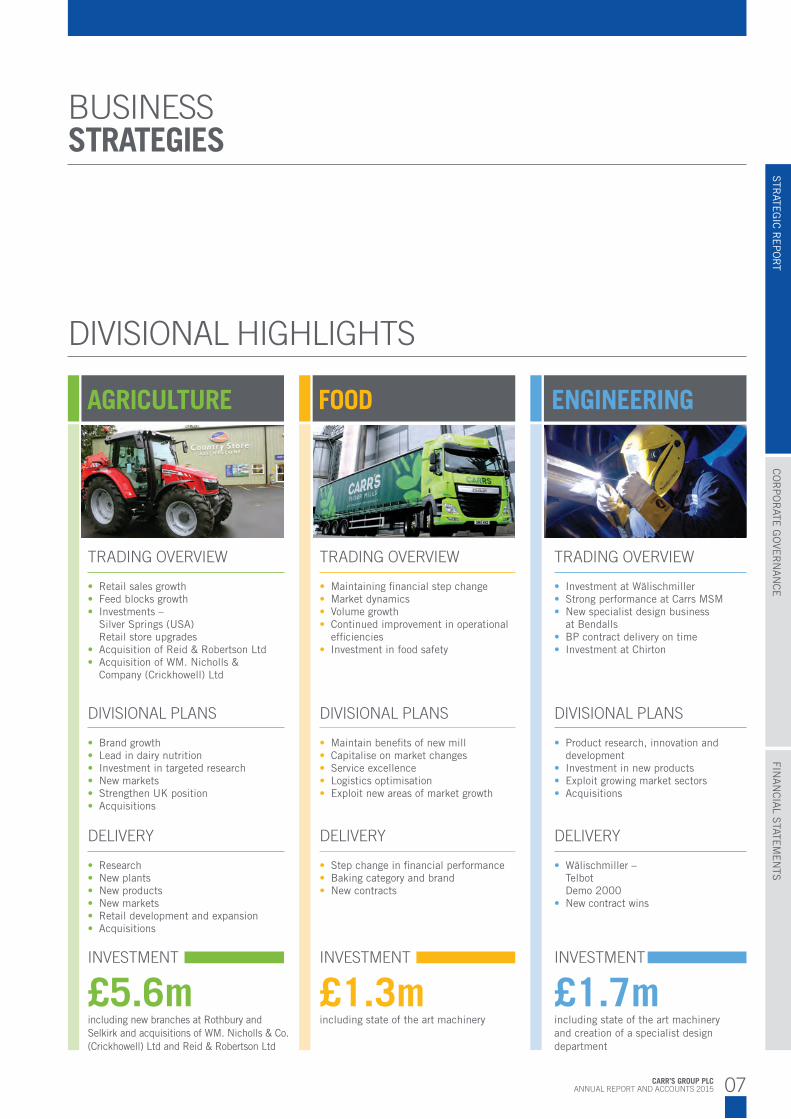
DIVISIONAL HIGHLIGHTS
AGRICULTURE FOOD ENGINEERING
TRADING OVERVIEW
• Investment at Wälischmiller• Strong performance at Carrs MSM• New specialist design business
at Bendalls • BP contract delivery on time• Investment at Chirton
DIVISIONAL PLANS
• Product research, innovation and development
• Investment in new products• Exploit growing market sectors• Acquisitions
DELIVERY
• Wälischmiller – Telbot Demo 2000
• New contract wins
INVESTMENT
£1.7mincluding state of the art machinery and creation of a specialist design department
TRADING OVERVIEW
• Retail sales growth• Feed blocks growth• Investments –
Silver Springs (USA) Retail store upgrades
• Acquisition of Reid & Robertson Ltd• Acquisition of WM. Nicholls &
Company (Crickhowell) Ltd
DIVISIONAL PLANS
• Brand growth• Lead in dairy nutrition• Investment in targeted research• New markets• Strengthen UK position• Acquisitions
DELIVERY
• Research• New plants• New products• New markets• Retail development and expansion• Acquisitions
INVESTMENT
£5.6mincluding new branches at Rothbury and Selkirk and acquisitions of WM. Nicholls & Co. (Crickhowell) Ltd and Reid & Robertson Ltd
TRADING OVERVIEW
• Maintaining financial step change• Market dynamics• Volume growth• Continued improvement in operational
efficiencies• Investment in food safety
DIVISIONAL PLANS
• Maintain benefits of new mill• Capitalise on market changes• Service excellence• Logistics optimisation• Exploit new areas of market growth
DELIVERY
• Step change in financial performance• Baking category and brand• New contracts
INVESTMENT
£1.3mincluding state of the art machinery
08 CARR’S GROUP PLCANNUAL REPORT AND ACCOUNTS 2015
STRATEGIC REPORT
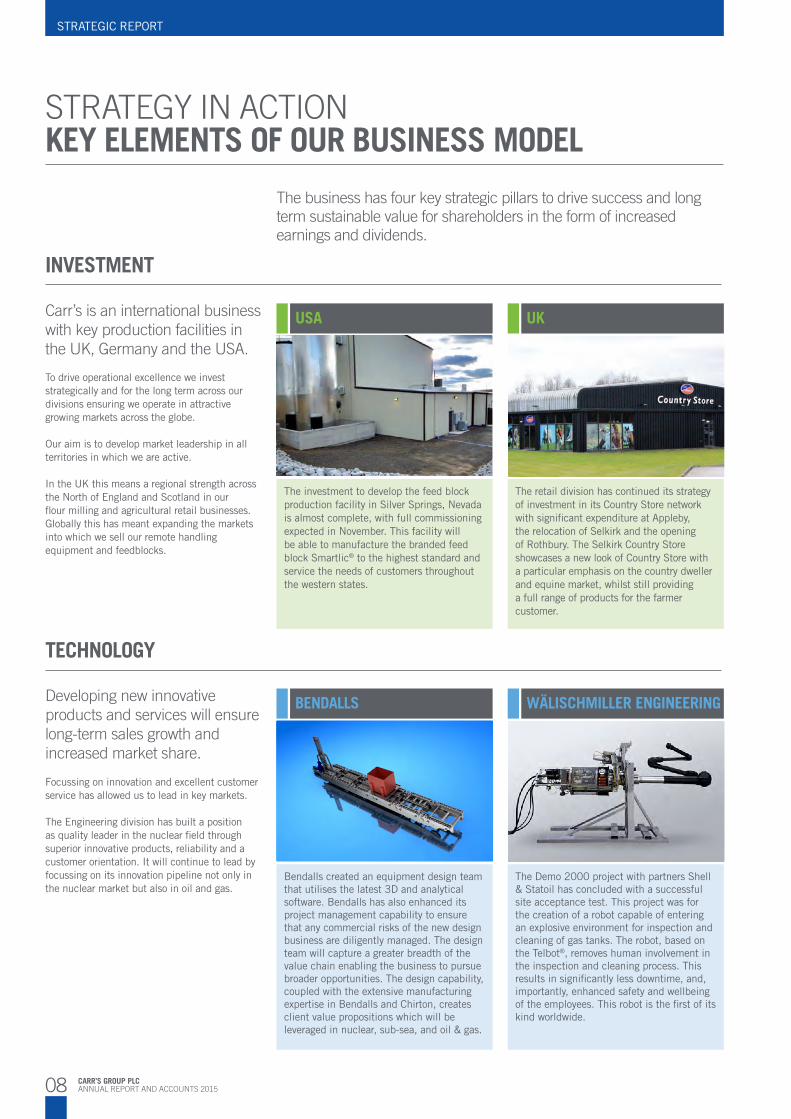
The business has four key strategic pillars to drive success and long term sustainable value for shareholders in the form of increased earnings and dividends.
STRATEGY IN ACTIONKEY ELEMENTS OF OUR BUSINESS MODEL
TECHNOLOGY
Developing new innovative products and services will ensure long-term sales growth and increased market share.
Focussing on innovation and excellent customer service has allowed us to lead in key markets.
The Engineering division has built a position as quality leader in the nuclear field through superior innovative products, reliability and a customer orientation. It will continue to lead by focussing on its innovation pipeline not only in the nuclear market but also in oil and gas.
Bendalls created an equipment design team that utilises the latest 3D and analytical software. Bendalls has also enhanced its project management capability to ensure that any commercial risks of the new design business are diligently managed. The design team will capture a greater breadth of the value chain enabling the business to pursue broader opportunities. The design capability, coupled with the extensive manufacturing expertise in Bendalls and Chirton, creates client value propositions which will be leveraged in nuclear, sub-sea, and oil & gas.
The Demo 2000 project with partners Shell & Statoil has concluded with a successful site acceptance test. This project was for the creation of a robot capable of entering an explosive environment for inspection and cleaning of gas tanks. The robot, based on the Telbot®, removes human involvement in the inspection and cleaning process. This results in significantly less downtime, and, importantly, enhanced safety and wellbeing of the employees. This robot is the first of its kind worldwide.
BENDALLS WÄLISCHMILLER ENGINEERING
INVESTMENT
Carr’s is an international business with key production facilities in the UK, Germany and the USA.
To drive operational excellence we invest strategically and for the long term across our divisions ensuring we operate in attractive growing markets across the globe.
Our aim is to develop market leadership in all territories in which we are active.
In the UK this means a regional strength across the North of England and Scotland in our flour milling and agricultural retail businesses. Globally this has meant expanding the markets into which we sell our remote handling equipment and feedblocks.
The investment to develop the feed block production facility in Silver Springs, Nevada is almost complete, with full commissioning expected in November. This facility will be able to manufacture the branded feed block Smartlic® to the highest standard and service the needs of customers throughout the western states.
The retail division has continued its strategy of investment in its Country Store network with significant expenditure at Appleby, the relocation of Selkirk and the opening of Rothbury. The Selkirk Country Store showcases a new look of Country Store with a particular emphasis on the country dweller and equine market, whilst still providing a full range of products for the farmer customer.
USA UK
09CARR’S GROUP PLCANNUAL REPORT AND ACCOUNTS 2015
STR
ATEG
IC R
EPO
RT
CO
RPO
RATE
GO
VER
NAN
CE
FINAN
CIA
L STATE
MEN
TS
ACQUISITIONS
PEOPLE
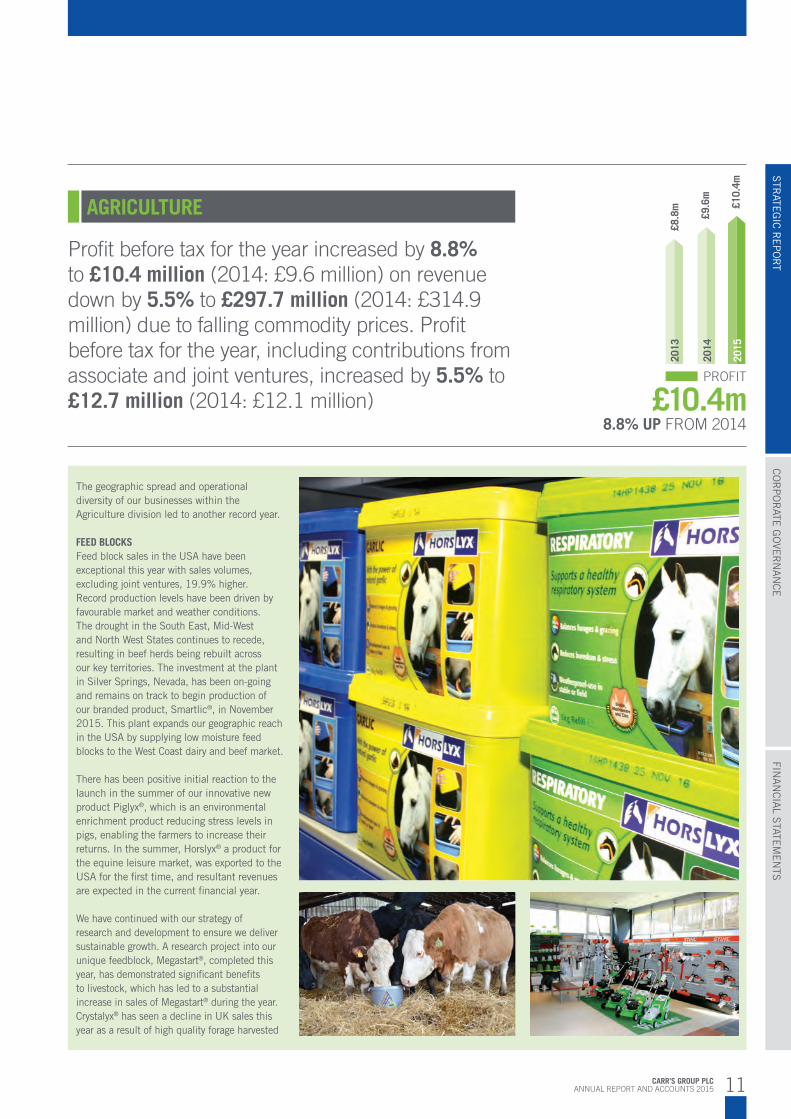
During the year Carr’s has created an apprentice exchange programme, which will commence in the winter of 2015 and will operate in the Carrs Engineering division. The programme will allow selected apprentices to visit and work at Wälischmiller, Bendalls, and Chirton, gaining insight into the different areas within these multifaceted businesses.
This initiative has been developed and led by Claudia Reich, the Managing Director of Wälischmiller, located in Germany. It will provide a great opportunity for the apprentices to broaden their knowledge of our Engineering division and its operational capability whilst building confidence and cultural diversity. This is an exciting investment in our future talent pipeline, and one which will improve the capability and integration of our Engineering division.
FUTURE PIPELINE
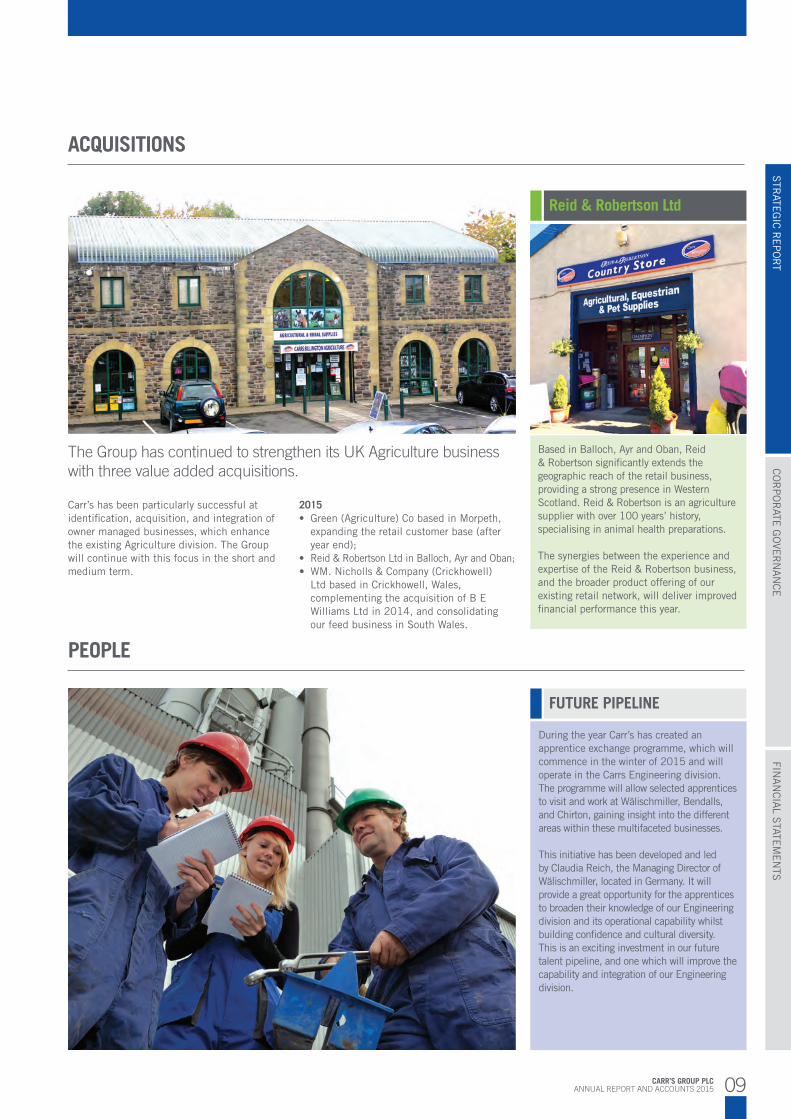
Carr’s has been particularly successful at identification, acquisition, and integration of owner managed businesses, which enhance the existing Agriculture division. The Group will continue with this focus in the short and medium term.
2015 • Green (Agriculture) Co based in Morpeth,
expanding the retail customer base (after year end);
• Reid&RobertsonLtdinBalloch,AyrandOban;• WM.Nicholls&Company(Crickhowell)
Ltd based in Crickhowell, Wales, complementing the acquisition of B E Williams Ltd in 2014, and consolidating our feed business in South Wales.
The Group has continued to strengthen its UK Agriculture business with three value added acquisitions.
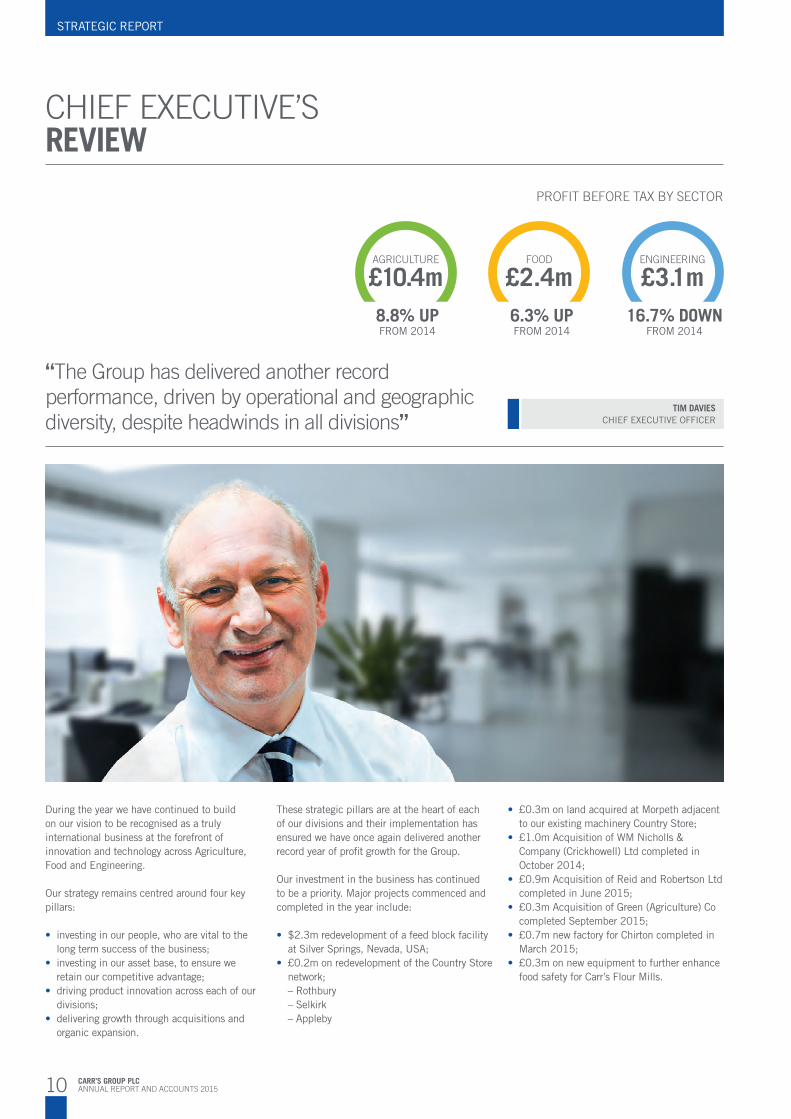
Reid & Robertson Ltd
Based in Balloch, Ayr and Oban, Reid & Robertson significantly extends the geographic reach of the retail business, providing a strong presence in Western Scotland. Reid & Robertson is an agriculture supplier with over 100 years’ history, specialising in animal health preparations.
The synergies between the experience and expertise of the Reid & Robertson business, and the broader product offering of our existing retail network, will deliver improved financial performance this year.
10 CARR’S GROUP PLCANNUAL REPORT AND ACCOUNTS 2015
STRATEGIC REPORT
During the year we have continued to build on our vision to be recognised as a truly international business at the forefront of innovation and technology across Agriculture, Food and Engineering.
Our strategy remains centred around four key pillars:
• investing in our people, who are vital to the long term success of the business;
• investing in our asset base, to ensure we retain our competitive advantage;
• driving product innovation across each of our divisions;
• delivering growth through acquisitions and organic expansion.
These strategic pillars are at the heart of each of our divisions and their implementation has ensured we have once again delivered another record year of profit growth for the Group.
Our investment in the business has continued to be a priority. Major projects commenced and completed in the year include:
• $2.3m redevelopment of a feed block facility at Silver Springs, Nevada, USA;
• £0.2m on redevelopment of the Country Store network; – Rothbury – Selkirk – Appleby
TIM DAVIESCHIEF EXECUTIVE OFFICER
CHIEF EXECUTIVE’SREVIEW
• £0.3m on land acquired at Morpeth adjacent to our existing machinery Country Store;
• £1.0m Acquisition of WM Nicholls & Company (Crickhowell) Ltd completed in October 2014;
• £0.9m Acquisition of Reid and Robertson Ltd completed in June 2015;
• £0.3m Acquisition of Green (Agriculture) Co completed September 2015;
• £0.7m new factory for Chirton completed in March 2015;
• £0.3m on new equipment to further enhance food safety for Carr’s Flour Mills.
PROFIT BEFORE TAX BY SECTOR
AGRICULTURE
£10.4mFOOD
£2.4mENGINEERING
£3.1m8.8% UPFROM 2014
6.3% UPFROM 2014
16.7% DOWNFROM 2014
“The Group has delivered another record performance, driven by operational and geographic diversity, despite headwinds in all divisions”
11CARR’S GROUP PLCANNUAL REPORT AND ACCOUNTS 2015
STR
ATEG
IC R
EPO
RT
CO
RPO
RATE
GO
VER
NAN
CE
FINAN
CIA
L STATE
MEN
TS
The geographic spread and operational diversity of our businesses within the Agriculture division led to another record year.
FEED BLOCKSFeed block sales in the USA have been exceptional this year with sales volumes, excluding joint ventures, 19.9% higher. Record production levels have been driven by favourable market and weather conditions. The drought in the South East, Mid-West and North West States continues to recede, resulting in beef herds being rebuilt across our key territories. The investment at the plant in Silver Springs, Nevada, has been on-going and remains on track to begin production of our branded product, Smartlic®, in November 2015. This plant expands our geographic reach in the USA by supplying low moisture feed blocks to the West Coast dairy and beef market.
There has been positive initial reaction to the launch in the summer of our innovative new product Piglyx®, which is an environmental enrichment product reducing stress levels in pigs, enabling the farmers to increase their returns. In the summer, Horslyx® a product for the equine leisure market, was exported to the USA for the first time, and resultant revenues are expected in the current financial year.
We have continued with our strategy of research and development to ensure we deliver sustainable growth. A research project into our unique feedblock, Megastart®, completed this year, has demonstrated significant benefits to livestock, which has led to a substantial increase in sales of Megastart® during the year. Crystalyx® has seen a decline in UK sales this year as a result of high quality forage harvested
Profit before tax for the year increased by 8.8% to £10.4 million (2014: £9.6 million) on revenue down by 5.5% to £297.7 million (2014: £314.9 million) due to falling commodity prices. Profit before tax for the year, including contributions from associate and joint ventures, increased by 5.5% to £12.7 million (2014: £12.1 million)
AGRICULTURE
8.8% UP FROM 2014 £10.4m
PROFIT
£10.
4m
£9.6
m
£8.8
m
2015
2014
2013
12 CARR’S GROUP PLCANNUAL REPORT AND ACCOUNTS 2015
STRATEGIC REPORT
CHIEF EXECUTIVE’SREVIEW CONTINUED
local community. With organic growth and acquisitions, we now have 30 Country Stores in our network with a further 5 livestock market locations.
Our integrated oil distribution business has also surpassed expectations this year with increased sales of 4.4%, despite the benign weather and increased competition. This is due to investment in our fleet, increased presence across our regions, and our emphasis on customer service.
The acquisition of WM. Nicholls & Company (Crickhowell) Ltd in October 2014 together with the previous year’s acquisition of B E Williams Ltd further developed our strategy for our feed business in South Wales.
We have combined these businesses into a central administration location in Brecon, whilst maintaining a presence in Sennybridge in the short term. The UK feed market is currently suffering from pricing pressure due to falling farm incomes, and the impact of increased manufacturing activity in our geographic markets has intensified competition. Despite this, our feed business performed well with total feed volumes up 4.1% year on year.
While we remain cognisant of the uncertainty facing the UK agriculture sector, we believe that our strong regional presence, technical expertise, and diverse product offering provides a solid platform to service our customers’ needs through the next financial year and beyond.
during 2014, and declining farm incomes. We continue our commitment to our international growth strategy with Crystalyx®, and have employed personnel in Brazil to develop this potential market. On-farm trials of Crystalyx® are due to commence in Brazil by the end of 2015.
RETAILThe strategy for growing our retail business delivered results exceeding expectations, with sales 8.6% higher year on year, a third consecutive record year. Like for like sales, excluding the impact of additional stores also increased by 5.3%. Our presence in strategic locations, coupled with the diverse retail offering, further strengthened our business. With a new Country Store at Rothbury, and redeveloped facilities in Appleby, Wigton, and Selkirk, we continue our commitment to, and investment in, servicing both the agricultural and rural communities. In addition to organic growth, in June 2015 we undertook the strategic acquisition of Reid and Robertson Ltd, an agricultural merchant business specialising in veterinary medicines, based at Balloch, Ayr, and Oban in Scotland. This expands our geographic reach in Scotland, and provides access to a new customer base for our existing product offering. Since the year-end we have acquired Green (Agriculture) Co., an agricultural merchant business based in Morpeth, near our existing machinery Country Store. This acquisition strengthens the Country Store network in Northumberland and enhances the services offered to the
AminoMax®
AminoMax®, the patented animal bypass protein product for dairy cows, manufactured at Watertown, New York State, USA, and Lancaster, UK recorded flat worldwide sales this year, predominantly as a result of the fall in farm incomes due to the declining farm-gate milk price. The falling soya and canola commodity prices, and continuing pressures on farm incomes, are expected to have an adverse impact on AminoMax® sales in the forthcoming year. However, we are continuing with research and development to extend this innovative product range.
Market ConditionsFarmer confidence has been adversely affected this year and it is anticipated this will continue in the medium term, as a direct result of the significant decline in the farm-gate milk price, both in the UK and internationally. Many of our farming customers are starting to modify their spending in reaction to the ongoing uncertainty in the UK agriculture market, and are postponing sizable capital investments until they have further market visibility. Once again, UK farmers benefited from a mild winter and benign spring, resulting in lower costs of production, which provided some respite from market conditions. We continue to support our farming customers in choosing the appropriate strategy to enable them to navigate a path through these difficult markets.

13CARR’S GROUP PLCANNUAL REPORT AND ACCOUNTS 2015
STR
ATEG
IC R
EPO
RT
CO
RPO
RATE
GO
VER
NAN
CE
FINAN
CIA
L STATE
MEN
TS
commercial benefits derived from increased customer confidence in our ability to produce quality flour, milled to the highest standards of product integrity.
The wheat harvest in summer 2014 was relatively normal at just over 16 million tonnes, however there were inconsistencies in quality. Our versatility with regard to wheat sourcing and mill processing meant that we were well positioned to respond to the changing market dynamics. The 2015 harvest has been large and consistent in quality and the position of our three mills enables us to benefit from this exceptional harvest.
We have enjoyed strong growth in the Food division this year with sales volumes 4.6% higher than last year. Through the year our reputation for customer service, quality and technical expertise has resulted in important new business wins. The growth in the division’s sales volumes follows last year’s step change in operating performance, which was driven by the commissioning of our state of the art mill at Kirkcaldy. We have continued our investment programme with the installation of cutting edge equipment at our other mills, which ensures we remain ahead of our customers’ ever-increasing demands, particularly in the need for food safety. The ongoing investment supports the
Changes in the retail landscape and consumers’ shopping habits are impacting the whole food supply chain, including the bakery sector.
In the current financial year, ending August 2016, it is anticipated that these headwinds will persist. This challenging backdrop will in part be off-set by our investment in technology, high standards of customer service, and our on-going commitment to operational efficiencies throughout our three mills which, over the medium term, leaves us well placed to handle these changing markets.
Profit before tax for the year increased 6.3% from £2.3 million to £2.4 million in this financial year on revenue down by 7.8% to £80.3 million (2014: £87.1 million) driven by falling commodity prices
FOOD
6.3% UP FROM 2014 £2.4m
PROFIT
£2.4
m
£2.3
m
£0.6
m
2015
2014
2013

14 CARR’S GROUP PLCANNUAL REPORT AND ACCOUNTS 2015
STRATEGIC REPORT
2015
2014
2013
macro-economic pressure resulting from the funding and political issues faced in Russia and Japan, which is expected to continue through 2016. There are signs of increased activity in the UK nuclear market, with delivery of two power manipulators to Dounreay, Scotland expected by the end of 2015, and the successful completion of a remote handling project for Sellafield, with further orders through to 2017 being received after the year-end.
Bendalls, one of our two manufacturing businesses, is also benefiting from the increased activity in the UK nuclear market with multiple new framework agreements being awarded by Sellafield, operational through 2016-2019. We invested in the organic growth of the business through the creation of a new design department in 2015, which has been awarded its first contract from Sellafield for the design of a skip conveyor system. The BP Shah Deniz project, for the manufacture of 33 pressure vessels for the gas pipeline in Azerbaijan, has been successfully delivered in accordance with the agreed timeline, with one vessel to be delivered in spring 2016, as previously announced.
Chirton has had a difficult trading year due to the decline in the oil price and the impact of a complicated move to new factory premises in March 2015. The delay in moving to the new factory caused a greater level of disruption than expected, and issues commissioning new equipment resulted in extra costs and more lost production time than planned. This has adversely affected results in the short term. The low oil price has had a direct impact on Chirton’s oil exploration customers, and as a result management have taken the decision to accelerate Chirton’s entry into the nuclear
2015 has been a year in which we have invested in the future growth of our Engineering division. Our Engineering business operates in high value markets and within two distinct areas, manufacturing and remote handling. During the year there has been increased collaboration throughout the division with joint bids being submitted and parts being manufactured internally for the remote handling businesses.
Our remote handling businesses have met expectations in this difficult market, and performed well this year. In particular, Carrs MSM has had an excellent year, and this is expected to continue with Life of Plant contract and other significant contracts to the nuclear sector being delivered in the current financial year.
Wälischmiller had a successful site acceptance test for the Demo 2000 Telbot® project in Norway. This project removes the need for human inspection of oil and gas tanks and improving safety reducing the time needed to shut down the plant by up to 700 man hours per tank. In addition, operating within a UK led engineering consortium, Wälischmiller has also been awarded a contract for the design and supply of robotic remote handling equipment for ITER with potential sales due for delivery between 2017 and 2020. ITER is the international collaboration for the creation of an experimental fusion reactor based in France.
Wälischmiller has also invested in state of the art machinery, development of a new showroom, and a marketing programme in the USA. This will help offset the continuing
market. To facilitate this, it is working closely with our other Engineering businesses, taking advantage of the sector expertise, to ensure that cross selling opportunities are maximised. During the year, Chirton commenced selling engineered parts for our remote handling operations, and this is set to continue through the next financial year.
TIM DAVIESChief Executive Officer11 November 2015
Profit before tax for the year fell by 16.7% to £3.1 million (2014: £3.7 million) on revenue up by 24.8% to £33.5 million (2014: £26.9 million)
ENGINEERING
CHIEF EXECUTIVE’SREVIEW CONTINUED
16.7% DOWN FROM 2014 £3.1m
PROFIT
£3.1
m£3.7
m£4.2
m

15CARR’S GROUP PLCANNUAL REPORT AND ACCOUNTS 2015
STR
ATEG
IC R
EPO
RT
CO
RPO
RATE
GO
VER
NAN
CE
FINAN
CIA
L STATE
MEN
TS
RISKMANAGEMENT
OUR RISK APPETITE AND APPROACH TO RISK MANAGEMENT
Our success as a Group depends on the ability to identify and maximise the opportunities generated by our businesses and the markets in which we operate. In doing so, we continue to develop an embedded approach to risk management which puts risk and opportunity assessment at the heart of our strategy.
KEY RISKS
DESCRIPTION OF THE RISK WHAT WE ARE DOING TO MANAGE THE RISK
SafetyThe safety of our employees, contractors and suppliers and the communities in which we operate is paramount. We must operate within local laws, regulations, rules, and ordinances relating to health, safety, and the environment, including emissions.
We have Health and Safety policies that apply to all facilities, with dedicated staff to ensure they are embedded within our culture and regularly measured and assessed. This includes an annual compliance programme, which reports monthly to the Executive Directors, highlighting any issues that require action, including training needs. Regular training in this area is also provided to key personnel in the Group’s locations.
Business ContinuityThe operation of manufacturing plants involves many risks that could cause a temporary or permanent stoppage in production and could have a material adverse effect on the Group.
The Group has Business Continuity arrangements in place to enable continuity of supply, as quickly as practicable, of product to customers in the event of a natural disaster or major equipment or plant failure. A programme of insurance is also in place to protect against the cost of major business interruptions.
PeoplePerformance, knowledge, and skills of employees are central to the success of the Group. We must attract, integrate, and retain the talent required to fulfil our strategic growth ambitions. Inability to retain key knowledge, and adequately plan for succession could have a negative impact on the Group’s performance.
The Group has remuneration policies designed to attract, retain and reward employees with the ability and experience to execute the Group’s strategy.
Management development programmes are in place, alongside detailed succession planning across the Group. Succession plans for senior roles are reviewed by the Nominations Committee annually.
The Group adopts a risk profile aligned to our vision to be recognised as a truly international business at the forefront of technology and innovation. Our available capital and resources are applied to underpin our four strategic pillars: people, investment, innovation, and growth through acquisition and organically.
Our approach to risk management is designed to provide reasonable assurance that our assets are safeguarded. The risks facing the business are assessed and, where possible, mitigated. All relevant information is reported to and reviewed by the Board.
ORGANISATION AND PROCESSThe Board assumes overall responsibility for the management of risk and for reviewing the effectiveness of the Group’s risk management and internal control systems.
The Board has established a clear organisational structure with well-defined accountabilities for the principal risks the Group faces in the short, medium, and long term, across all divisions. This is overseen by the Executive Directors,
who have an active responsibility for focusing on the principal areas of risk to the Group. The Board reviews these risk areas, including consideration of environmental, social, and governance matters, and retains responsibility for determining the nature and extent of the risks that the Group is prepared to undertake.
The Group operates a risk management framework whereby for each of our principal risks we detail our assessment of the risk, the controls we have in place, who is responsible for managing the risk, as well as any further mitigating actions required. Further development work on the risk management framework and system is planned for 2015/16. This will further strengthen risk management and will lead to an overall increase in the amount of time the Board allocates to the discussion of risk.
BOARD’S ASSESSMENT OF COMPLIANCE WITH THE RISK MANAGEMENT FRAMEWORKSThe Board, advised by the Audit Committee, review the effectiveness of the company’s risk management and internal control systems at
least annually. Details of the activities of the Audit Committee in relation to this can be found in the Audit Committee Report on pages 28 to 29. There is a more regular discussion of risks affecting the business as and when required at each Board meeting.
PRINCIPAL RISK FACTORSOur business is subject to a variety of risks and uncertainties. On the following pages we have identified the risks we regard as most relevant to our Group and performance at this time. These may change as the Group develops over the year. We have commented on mitigating actions that we believe help us manage these risks. However, we may not be successful in deploying some or all of these mitigating actions. If the circumstances in these risks occur or are not successfully mitigated, our cash flow, operating results, financial position, business and reputation could be materially adversely affected.
16 CARR’S GROUP PLCANNUAL REPORT AND ACCOUNTS 2015
STRATEGIC REPORT
DESCRIPTION OF THE RISK WHAT WE ARE DOING TO MANAGE THE RISK
Commodity CostsMargins may be affected by fluctuations in crop prices due to factors such as harvest and weather conditions, crop disease, crop yields, alternative crops, and by-product values.
In some cases, due to the basis for pricing in sales contracts, or due to competitive markets, we may not be able to pass on to customers the full amount of raw material price increases or higher energy, freight or other operating costs.
The Group has a number of strategies in place to manage this risk. These include:
•strategiclongtermrelationshipswithsuppliers;•multiple-sourcesuppliersforkeyingredients;•rawmaterialandforwardenergypurchasingpoliciestoprovidesecurity
of supply and cost;•theuseofderivativeswheremostbeneficialtohedgeexposureto
movements in future prices of commodities; and•closemonitoringofcontractexecutiontoensuresupplyiswithin
agreed terms.
Product Innovation RiskOur commercial success depends, in part, on innovation and then obtaining and maintaining trademark and patent protection on certain products and technology.
Failure to innovate could have an adverse effect on our business. We must also successfully defend trademarks and patents against third-party challenges or infringements.
The Group invests heavily in research and development to innovate across its businesses. For new innovations, there is an organised and secure process for identifying and recording innovations, trade secrets, and potentially patentable ideas.
The Group has an in-house Legal Counsel to monitor and oversee this risk, supported by expert intellectual property lawyers in multiple jurisdictions.
Strategic PartnersThe Group has a number of strategic partners, particularly in the Agriculture division, who are involved either as joint venture partners or significant minority shareholders. A successful working relationship with these partners in paramount to those businesses’ success.
Close working relationships are maintained with all the Group’s strategic partners. This includes regular meetings, both formally and informally, and close involvement in the setting and monitoring of strategy for those businesses. In addition, arrangements are appropriately documented in contracts and legal agreements.
TreasuryWe are exposed to a variety of financial risks in relation to treasury.
The Group must ensure that it has an adequate level of facilities to provide sufficient funding to operate its businesses and to develop growth opportunities.
Changes to the value of currencies can fluctuate widely and could have a significant impact on a division’s results. Furthermore, because the Group has international businesses it is subject to exchange risks in the translation of the underlying net assets and earnings of its foreign subsidiaries.
The level of facilities are regularly reviewed by the Group Finance Director, and these are also regularly reported to and discussed by the Board.
The Group operates a treasury policy of hedging all significant transactional currency exposures. Additionally, translational hedging instruments are used to limit the potential impact of fluctuating currencies on reported earnings from foreign subsidiaries.
For interest rate risk on floating rate debt, we maintain a mix of fixed rate debt, primarily finance lease, and floating rate debt. These levels are monitored and assessed against forecast changes in interest rates and forward guidance from interest rate setting authorities.
Non-compliance with Legislation and RegulationThe Group operates in diverse markets and therefore is exposed to a range of constantly changing legislation and regulation. We must comply with, and understand, all regulation and legislation, and be able to make correct interpretations for our diverse Group. Any breach could have a financial impact and damage our reputation.
The Group is committed to complying with the laws and regulations of the countries in which we operate.
In-house Legal Counsel provides immediate legal knowledge and understanding to the Board and management, and this is supplemented by external legal advisers assisting with monitoring external changes in legislation and advising accordingly.
We have a tax risk framework, including a tax strategy and code of conduct, which sets out our approach to managing global tax risks.
The Group also maintains policies in areas such as antitrust, money laundering and bribery laws. A whistleblowing policy and procedure is also in place.
RISKMANAGEMENT CONTINUED

17CARR’S GROUP PLCANNUAL REPORT AND ACCOUNTS 2015
STR
ATEG
IC R
EPO
RT
CO
RPO
RATE
GO
VER
NAN
CE
FINAN
CIA
L STATE
MEN
TS
DESCRIPTION OF THE RISK WHAT WE ARE DOING TO MANAGE THE RISK
AcquisitionsThe Group is acquisitive and is therefore exposed to the possibility of acquiring a company based on inaccurate information, unrealistic synergies and financial benefits, and inappropriate deal structure. Failure to effectively integrate acquired businesses could also undermine any expected synergies.
A thorough and careful due diligence process is undertaken, utilising relevant skilled internal personnel, as well as external expertise when required. Individual businesses and Group resources are used to analyse potential synergies and financial benefits. Consideration is given to the composition and skills of the management team of the acquired company and support and relevant training is provided by Group personnel to ensure a successful integration. The deal structure is reviewed on a case by case basis.
Post-acquisition reviews are also undertaken to identify any areas for improvement in future transactions.
Customer DemandChanges in customer demand, be that retail or commercial customers, caused by economic factors could result in a fall in demand for the Group’s product offering, resulting in a significant loss of revenue.
The Group operates in diverse worldwide markets, which provide resilience for the Group against difficulties faced by any one market or economy. The businesses are managed flexibly to react to changing demands in their own sector.
Reliance on Key CustomersSome businesses within the Group have a significant proportion of their revenue generated from a small number of key customers. A loss of a number of these customers could adversely affect the performance of a division and in turn the Group.
The businesses have established good long term relationships with key customers to ensure that demands and expectations are met. The Group is constantly investing in its businesses to ensure that they are able to satisfy customer needs and are market leaders.
The Group is continually working on identifying new markets, products, and opportunities to expand the customer base of all its businesses.
Political Instability Disruption to business activity as a result of political instability in one of our key markets, particularly in our Engineering business, could impact sales into that market.
The wide geographic spread of the Group’s operations and customer base diminishes the impact of any one market on the results of the Group as a whole.
Reliance on Key IngredientsOur feed block business relies on a key ingredient of molasses. Should there be volatility in the molasses market or should a crop disaster result in little to no global harvest it could adversely affect the Group’s performance.
Our feed block businesses acquire molasses from a variety of sources worldwide and therefore there is no over reliance on any one producer. The molasses market is international and therefore it is unlikely that molasses could not be sourced from an alternative location should any one harvest be adversely impacted by a natural disaster. In addition, research is underway to establish alternative ingredients to molasses.
Defined Benefit Pension SchemeThe Group operates one active defined benefit pension scheme. The funding of the scheme could be adversely affected by a number of factors including: investment returns, interest rate fluctuations, and members’ longevity. Changes in all or some of these inputs could increase the cost to the Group of funding this scheme in the future.
The scheme closed to new members in 2001. The Group has made significant contributions to the deficit over a number of years and the Group and the Trustees monitor the performance regularly and take investment and actuarial advice when required. In addition, the Group is currently consulting with affected employees and the Trustees to cease future accrual in the scheme from 31 December 2015.
18 CARR’S GROUP PLCANNUAL REPORT AND ACCOUNTS 2015
STRATEGIC REPORT
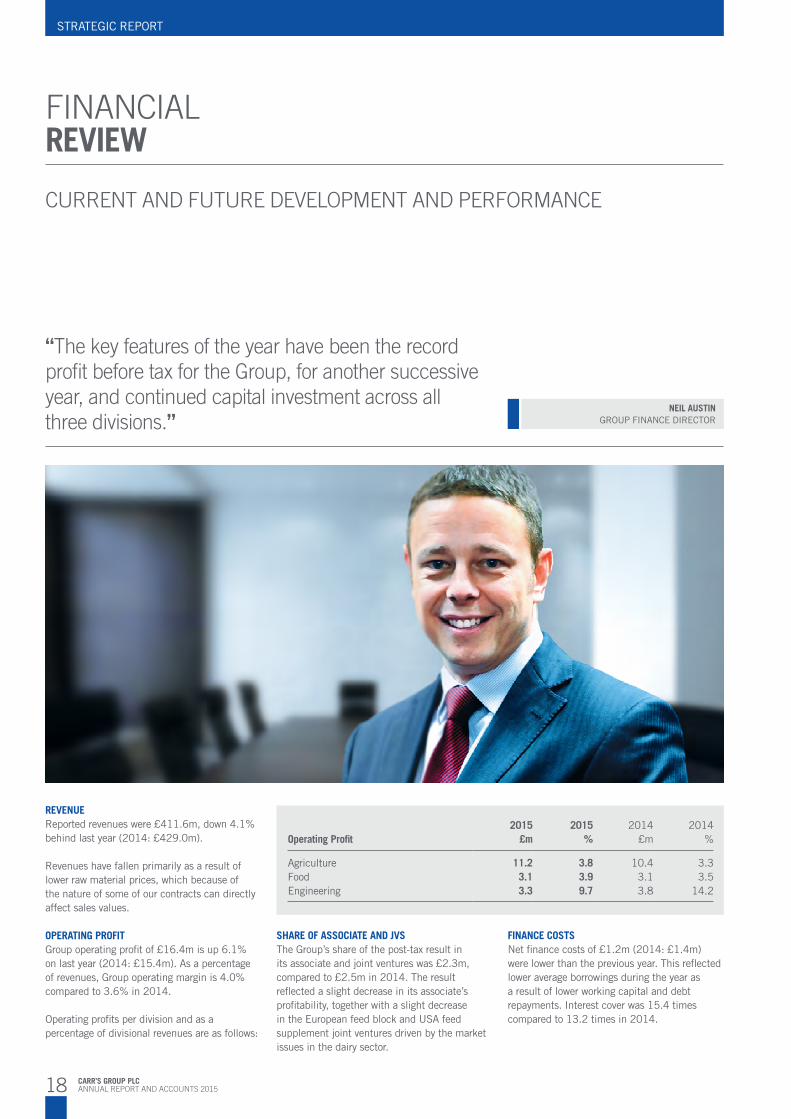
NEIL AUSTINGROUP FINANCE DIRECTOR
“The key features of the year have been the record profit before tax for the Group, for another successive year, and continued capital investment across all three divisions.”
FINANCIALREVIEW
CURRENT AND FUTURE DEVELOPMENT AND PERFORMANCE
REVENUEReported revenues were £411.6m, down 4.1% behind last year (2014: £429.0m).
Revenues have fallen primarily as a result of lower raw material prices, which because of the nature of some of our contracts can directly affect sales values.
OPERATING PROFITGroup operating profit of £16.4m is up 6.1% on last year (2014: £15.4m). As a percentage of revenues, Group operating margin is 4.0% compared to 3.6% in 2014.
Operating profits per division and as a percentage of divisional revenues are as follows:
SHARE OF ASSOCIATE AND JVSThe Group’s share of the post-tax result in its associate and joint ventures was £2.3m, compared to £2.5m in 2014. The result reflected a slight decrease in its associate’s profitability, together with a slight decrease in the European feed block and USA feed supplement joint ventures driven by the market issues in the dairy sector.
FINANCE COSTSNet finance costs of £1.2m (2014: £1.4m) were lower than the previous year. This reflected lower average borrowings during the year as a result of lower working capital and debt repayments. Interest cover was 15.4 times compared to 13.2 times in 2014.
Operating Profit2015
£m2015
%2014
£m2014
%
AgricultureFoodEngineering
11.23.13.3
3.83.99.7
10.43.13.8
3.33.5
14.2

19CARR’S GROUP PLCANNUAL REPORT AND ACCOUNTS 2015
STR
ATEG
IC R
EPO
RT
CO
RPO
RATE
GO
VER
NAN
CE
FINAN
CIA
L STATE
MEN
TS
PROFIT BEFORE TAXProfit before tax at £17.5m was 5.5% higher than in the previous year (2014: £16.6m).
TAXATIONThe Group’s effective tax charge on profit from activities after net finance costs and excluding profits from associate and joint ventures was 24.9% (2014: 26.0%). A reconciliation of the actual total tax charge to the standard rate of corporation tax in the UK of 20.58% is given in note 6 to the financial statements.
EARNINGS PER SHAREThe profit attributable to the equity holders of the Company amounted to £12.0m (2014: £11.4m), and basic earnings per share was 13.4p (2014 restated: 12.8p), an increase of 4.7%.
Adjusted earnings per share of 13.6p (2014 restated: 13.1p), is calculated by dividing the profit attributable to equity holders for the period, before non-recurring items and amortisation of intangible assets, by the weighted average number of shares in issue during the period.
ACQUISITIONSOn 20 October 2014 the Group acquired the entire issued share capital of WM. Nicholls & Company (Crickhowell) Limited, an agricultural merchant, for a net cash consideration of £1.0 million.
On 12 June 2015, the entire issued share capital of Reid and Robertson Limited, also an agricultural merchant, was acquired by the Group. The cash consideration was £0.9 million.Both of these acquisitions combined generated goodwill of £1.1 million.
CASH FLOW AND NET DEBTOur net debt has decreased slightly over the year, due to cash generated from operating activities exceeding cash spend on acquisitions and capital expenditure.
A free cash flow of £7.6 million was generated in the year, representing a decrease of 31.2% on the previous year.
During the year loans in our Agriculture division were consolidated with RBS and an additional £2.0m revolving credit facility provided for ongoing acquisition activity.
Headroom against existing facilities was £19.0m at the year end. Other than the Group’s overdraft, which is renewable annually, the majority of the Group’s existing facilities are due for renewal in June 2019. An additional £5.0 million of facilities was agreed after the year.
PENSIONSThe Group operates its current pension arrangements on a defined benefit and defined contribution basis. The defined benefit section is closed to new members and has 40 active members, 80 deferred members and 227 current pensioners. The scheme received £2.3 million during the year in additional contributions from the Group in accordance with the 2011 actuarial valuation as agreed between the Company and the Trustees.
The triennial actuarial valuation as at 31 December 2014 was undertaken in the year and the results showed that the agreed recovery plan was on target and, all else being equal, recovery payments would not be required after 31 December 2015.
The valuation on an IAS 19 accounting basis showed a surplus before the related deferred tax liability in the scheme at 29 August 2015 of £1.8m (2014: £2.1m). Actuarial losses of £2.8m (2014: gains of £3.2m) have been recognised in the Consolidated Statement of Comprehensive Income.
The Group and the Trustees continue to work together to introduce ways of de-risking the defined benefit scheme to provide less volatility in the scheme’s assets and liabilities in the future. Several initiatives were introduced during the year.
NEIL AUSTINGroup Finance Director11 November 2015
Cash flow and net debt
£’000
Operating profitDepreciation and profit on disposalAmortisation
EBITDA (excluding associate and joint ventures)Increase in inventoriesDecrease in receivablesDecrease in payablesOtherNet operating cash flowNet interestTaxationCash flow from operationsMaintenance capital expenditure net of disposal proceedsFree cash flow
Expansionary capital expenditure net of disposal proceedsAcquisitionsDividendsLoans and finance leases received/paidOther
Decrease in cash and cash equivalents
Opening cash equivalentsCash and cash equivalents at the end of the year
Opening net debt
Decrease in cash and cash equivalentsNet decrease in borrowings
Closing net debt
16,3755,053
208
21,636(967)320
(3,237)(2,625)15,127(1,186)(3,965)
9,976(2,350)
7,626
(3,158)(1,749)(3,110)(2,352)1,993
(750)
17,02516,275
24,609
750(946)
24,413

20 CARR’S GROUP PLCANNUAL REPORT AND ACCOUNTS 2015
STRATEGIC REPORT
2015
£7.6
m
2014
£11.
1m
2013
-£1
.8m
KEY PERFORMANCEINDICATORS
We monitor our performance against the strategy by means of key performance indicators (‘KPIs’):
* restated for IAS 19 Revised
2015
2015
2015
2015
4.0%
13.3
%(4
.4)%
17.9
%
2014
2014
2014
2014
3.7%
11.7
%(8
.9)%
18.8
%
2013
*20
13*
2013
*20
132.
9%10
.4%
14.6
%19
.7%
(4.4)% Comments Revenues are monitored by the Board, although because of the nature of our businesses it is not, by itself, an indicator of performance. Our volume driven businesses are all subject to significant raw material price variations, the majority of which are passed through to selling prices. Hence falling raw material prices are expected to lead to falling revenues.
Definition Year on year increase/(decrease) in sales revenue excluding the impact of acquisitions and disposals.
UNDERLYING SALES GROWTH/DECLINE
13.3% Comments Gross margin is a reflection on how successfully we have managed raw material price volatility in our markets, together with how successful we have been in pricing in other areas of our business in competitive markets. Our gross margin grew to 13.3% in the current year, which highlights how we continue to manage input price volatility.
Definition Gross profit as a percentage of sales revenue.
GROSS MARGIN
4.0% Comments The adjusted Group operating margin reflects the gross margin achieved, which is described above, but also indicates the efficiency of our operations from both an administrative and distribution perspective. The growth in margin to 4.0% relates to both of these aspects.
Definition Operating profit before non-recurring items and amortisation, as a percentage of revenue.
ADJUSTED GROUP OPERATING MARGIN
£7.6m Comments This KPI indicates how much cash is available for the Group to utilise for expansionary capital investment, paying dividends, or financing/repaying borrowings. The reduction in the year is predominantly due to working capital changes across the business.
Definition Cash generated from operating activities, less maintenance capital expenditure.
FREE CASH FLOW
17.9% CommentsReturn on net assets reduced slightly by 0.9% this year. The Group’s asset base continues to increase reflecting the investment made in facilities and infrastructure, for the long term.
DefinitionProfit before tax, non-recurring items and amortisation as a percentage of net assets.
RETURN ON NET ASSETS
Financial Review Pages 18 to 19
Financial Review Pages 18 to 19
Financial Review Pages 18 to 19
Financial Review Pages 18 to 19
Financial Review Pages 18 to 19

21CARR’S GROUP PLCANNUAL REPORT AND ACCOUNTS 2015
STR
ATEG
IC R
EPO
RT
CO
RPO
RATE
GO
VER
NAN
CE
FINAN
CIA
L STATE
MEN
TS
THEBOARD
1 TIM DAVIES Chief Executive OfficerTim joined Carr’s in March 2013 as Chief Executive. Tim was formerly the Group Managing Director at Openfield. Prior to this, he progressed from Sales Director to Managing Director of Grainfarmers plc in 2005. He subsequently led the successful merger of Grainfarmers plc and Centaur Grain Ltd in 2008, forming Openfield, the largest farmer-owned grain marketing business in the UK. Tim continued in his role as Group Managing Director until 2013. He has been a Director of the Agricultural Industries Confederation since 2003.
2 NEIL AUSTINGroup Finance DirectorNeil joined Carr’s in January 2013 and became Group Finance Director in April 2013. Neil was formerly a Director at PwC, having joined as a graduate in their Newcastle office in 1997. He was appointed as a Director of the Newcastle office in 2007 with lead responsibility for part of the Assurance practice, and has experience with FTSE 350 companies and multi-nationals.
3 CHRIS HOLMESBoard ChairmanNominations Committee ChairmanChris joined Carr’s in 1991 as the Managing Director of the Agriculture business, having previously worked for J Bibby & Sons. Chris was appointed Chief Executive in 1994, and remained in that role until he was appointed Chairman in 2013. He commenced as Chairman of Carlisle Youth Zone in 2013 and is a Non-Executive Director of Break 90 Limited.
4 ROBERT HEYGATENon-Executive DirectorRobert joined Carr’s as a Non-Executive Director in 1991. He is the joint Managing Director of Heygate & Sons Ltd, the UK’s largest independent flour milling company, which is also engaged in animal feed compounding and other agricultural activities.
5 ALISTAIR WANNOPRemuneration Committee ChairmanAlistair was appointed a Non-Executive Director in 2005. Alistair has been the Chairman of both the County NFU and the MAFF northern regional advisory panel. He has served as a Director of The English Farming and Food Partnership, Rural Regeneration Cumbria, and Cumbria Vision. Alistair is a fellow of the Royal Agricultural Society of England.
6 JOHN WORBYSenior Independent DirectorAudit Committee ChairmanJohn was appointed a Non-Executive Director in April 2015. John is currently a Non-Executive Director of Fidessa plc and Senior Independent Director of Connect Group plc. John was previously the Finance Director of Genus and a Non-Executive Director of Cranswick plc. John is a chartered accountant and a member of the Financial Reporting Review Panel.
7 IAN WOODNon-Executive DirectorIan was appointed to the Board on 1 October 2015. He is the Commercial Director, International Business Development in Centrica (previously British Gas) and has held a number of positions with the Company, covering various aspects of the business including engineering, customer services, industrial and commercial marketing, and energy trading within the UK, Continental Europe and North America.
8 KATIE SINCLAIRCompany SecretaryKatie was appointed Counsel and Assistant Company Secretary in 2010. She became Company Secretary in January 2013, whilst maintaining her role as Counsel. Katie is a solicitor and has worked with FTSE and NASDAQ companies, and has a breadth of experience in corporate, commercial and employment matters. She is an Associate of the Chartered Institute of Secretaries.
1 2 3 4
5 6 7 8

22 CARR’S GROUP PLCANNUAL REPORT AND ACCOUNTS 2015
STRATEGIC REPORT
The Group maintains its emphasis on ensuring it operates with ethical responsibility and remains committed to all aspects of corporate social responsibility.
PEOPLEPeople are fundamental to every business and our employees are critical to the successful delivery of our strategic objectives; one of the four key pillars being “investing in people, who are vital to the long term success of the business”.
Our values of trust, respect, and integrity run throughout all our businesses. Our high levels of teamwork and co-operation are a major contributing factor to our success. We remain committed to employee engagement throughout the Group, and employees are kept up-to-date with the Group’s performance and development through regular briefing notes.
We have continued to assess the development needs and opportunities across the business, to support our short, medium and longer term objectives.
This year our senior team have assessed leadership development throughout the Group and in November 2016 the first leadership programme commences, with participants from across all three divisions. This is an exciting addition to our training programme. Management and supervisory development has been taking place throughout the year with specific focus on areas such as sales and customer service.
Identifying talent and people development will remain key priorities for us going forward. We remain committed to providing a working environment that:• isconsistentandfair;• isfreefromdiscrimination;• aidsdevelopmentandskills;• supportsemployeeengagement.
SharesaveThe Group operates a sharesave scheme, in which currently all UK based employees are entitled to participate. The Group recognises that the scheme is a well-established method of employee engagement, facilitating ownership in the Group.
Equal opportunitiesThe Group is committed to an active equal opportunities policy promoting an environment free from discrimination, harassment and victimisation, where everyone will receive equal treatment regardless of gender, colour, ethnic or national origin, disability, age, marital status, sexual orientation or religion. All decisions relating to employment practices will be objective, free from bias and based solely upon work criteria and individual merit. The Group is responsive to the needs of its employees, customers and the community at large. We are an organisation which uses everyone’s talents and abilities and where diversity is valued.
Employees with disabilitiesIt is our policy that people with disabilities should have full and fair consideration for all vacancies. We remain committed to
maintaining the current open, fair and non-discriminatory recruitment process operated throughout the Group, and seek to have full engagement with any employee who becomes disabled during their employment.
The Group employs, 1,101 people. The split is as follows:
846 Men 255 Women
Senior Managers and Executives, male and female:
13 Men 4 Women
23%
77%
76%
24%
CORPORATERESPONSIBILITY
ONGOING COMMITMENT TO CORPORATE RESPONSIBILITY

23CARR’S GROUP PLCANNUAL REPORT AND ACCOUNTS 2015
STR
ATEG
IC R
EPO
RT
CO
RPO
RATE
GO
VER
NAN
CE
FINAN
CIA
L STATE
MEN
TS
HEALTH & SAFETYThe Group is committed to the maintenance of high standards of health and safety for all its employees, visitors, customers, suppliers and others who may be affected by its business activities. There is also recognition of the need to continually improve safety performance.
Health and safety is reviewed regularly at Board level and is a standing Board meeting agenda item. This enables review of accident statistics, auditing activity and other initiatives as well as ensuring the Board are alerted to key risk management and legislative changes. The Board also endorses an ongoing programme of safety improvements.
This year an Executive Health and Safety Committee was formed, comprising the Cheif Executive Officer, Group Finance Director and Group Risk Manager, which meets monthly in advance of the monthly Board meetings. This formalises the previous meeting arrangements in order to make them more in line with the recommendations of the Institute of Directors and HSE.
The Group has repeated the extremely successful IOSH accredited Managing Safety training course for UK staff. In addition to the Group training plan, each Division also runs their own annual training programmes focusing in depth on the business needs. The Group has also focussed upon the management of road risk, with a Company car driver training initiative and the issue of a Company car drivers’ handbook.
The Group Risk Manager continuously monitors safety performance across all Group businesses, to ensure there is a high standard of health and safety management, with an annual audit plan undertaken across the Group.
Despite this proactive approach to safety management, the overall number of accidents across the UK Group companies was 51, a slight increase on the 48 recorded in 2014. However it should be recognised these figures include recently acquired businesses and an increase in employee numbers, without which the figure for 2015 would have reduced to 45. The number of RIDDOR reportable injuries has reduced down to 6, from 7 in 2014, and the number of days lost resulting from RIDDOR reportable injuries decreased 29% from 166 in 2014 to 118 this year.
The Board is committed to improving standards of health and safety and remains confident that the procedures adopted across the Group, coupled with the culture of the employees, will achieve this.
SUSTAINABILITY The Group remain committed to reducing carbon emissions, and increasing sustainable energy consumption. During the year the in-house data and monitoring system was expanded to encompass all UK and overseas subsidiary companies. Additional data collection and monitoring is now operational for all elements of environmental performance:• Energyandcarbongeneration• Waterutilisation• Wastegenerationandrecycling• Transportfuels
The new data and monitoring system was launched in the spring of 2015 and sets benchmark targets for improvements to all Group operations.
Our Engineering division is leading the way for the Group with several sites utilising green renewable grid supplied electricity. In addition, the new Chirton Engineering factory site, opened early in 2015, is the first site operation across the Group to be completely green, utilising green electricity and bio-mass heating.
During 2015 the Group undertook a full Energy Audit in accordance with the mandatory Energy
Savings Opportunity Scheme. The full Audit Report detailing potential further energy/carbon reduction opportunities is due to be completed and presented to the Directors in early November 2015.
Carbon Generation ReportThe Group does not generate any additional greenhouse gases other than C02 from the utilisation of grid supplied electricity and natural gas.
The energy intensive operations of the Food division and UK feedblock business continue to be in receipt of Climate Change Discount Agreements in exchange for target carbon reductions.
Due to changes in the qualifying status for entry into the CRC Scheme the Group were able to withdraw from the second phase of the scheme.
Detailed below is the C02 generation for all of the Group’s subsidiary companies comparing actual volume against previous year. It should be noted that this does not include transport C02 generated for the period 2014/15, this is detailed separately below.
Division CO2 Tonnes 2013/14 CO2 Tonnes 2014/15
Food 15,666 14,256UK Agriculture 4,349 4,277USA Agriculture 6,986 7,052Engineering 797 821Sub Total 27,798 26,406Total Transport —* 5,038Total 27,798 31,444
* Transport data was not collected for 2013/2014
GROUP CARBON C02 GENERATION 2013/14 v 2014/15

24 CARR’S GROUP PLCANNUAL REPORT AND ACCOUNTS 2015
STRATEGIC REPORT
CORPORATERESPONSIBILITY CONTINUED
During the year the Group created a Cumbria Community Foundation Fund, which has been established with an initial sum of £35,000. This Fund enables charitable groups to support rural communities, disadvantaged individuals, and young people, throughout Cumbria.
The Fund supports activities that promote life skills with the intention of raising aspirations, enabling people to fulfil their potential. It also aims to provide support to farming communities and improve knowledge of countryside matters.
We maintain our relationship with Carlisle Youth Zone, which serves the social, recreational and emotional needs of young people in the Carlisle area.
We strive to ensure that our community work reflects our broader responsibilities as a Group operational throughout the UK, Germany and USA.
Electricity and Gas Utilisation
Annual UK Group Electricity Consumption for 2014/15 32,345,551 Kwh Group Overseas Electricity Consumption for 2014/15 7,667,445 KwhAnnual UK Group Gas Consumption for 2014/15 9,215,234 KwhGroup Overseas Gas Consumption for 2014/15 6,356.002 KwhTotal Other Fossil Fuel Consumption for 2014/15 1,844,355 Kwh
Transport FuelsDuring 2014/15 the Carr’s Group utilised 1,880,166 litres of Diesel Fuel for Own Fleet Vehicles and Company Cars throughout its UK operations.
The C02 generated from this fuel consumption during 2014/15 is 5,038 tonnes.
CARR’S GROUP PLC TOTAL ENERGY BY DIVISION
C02 conversion factors, as approved by the Department of Energy. Fuel and energy use are based on direct measurement verified through purchase invoices for the vast majority of our sites. In certain instances, an exceptionally small number of invoices were not available, therefore it has been necessary to estimate energy and fuel usage.
Environmental Compliance Across the Group there have been no breaches of environmental legislation. The large manufacturing sites continue to operate within the emission levels set by the UK Environment Agency and current permit conditions, and constant monitoring is undertaken.
Waste recycling data has been collected over the year enabling the Group to set targets for reduction in waste and increased recycling, where possible, across the Group for this current year.
We maintain our promotion of the culture of environmental and sustainability awareness and encourage all employees to reduce waste and improve energy efficiency.
COMMUNITYInteracting with and supporting the communities in which we operate continues to be important to the Group. Support takes many forms from donations and sponsorship to volunteering and mentoring.
Our employees take part in a variety of community interactions as well as the Group’s involvement in a variety of charities and sponsorships.
The Group and the BBSRC (Biotechnology and Bioscience Research Council) continue to jointly fund the four year PhD scholar at Lancaster University. The PhD student is researching wheat root systems so as to be able to identify wheat varieties which are suited to drought conditions.
Food USA Agriculture Total Transport UK Agriculture Engineering
Total C02 generated by the GroupCombining the C02 generated through operations and fuel consumption the total Group C02 Generation for the year is 31,444 tonnes. On a like for like basis this resulted in an annual decrease of C02 emissions of 5%.
Intensity MatrixDue to the diverse nature of the operations of the Group it was decided that people were the best measure for the intensity matrix. The 2014/15 intensity matrix is 29 C02 tonnes per employee being 31,444 C02 tonnes/1,101 employees.
The C02 emissions data is reported in metric tonnes. The C02 emissions data has been calculated on the basis of measured energy and fuel use multiplied by relevant
22% USAAgriculture
45% Food
16% TotalTransport
3% Engineering14% UK Agriculture
25CARR’S GROUP PLCANNUAL REPORT AND ACCOUNTS 2015
STR
ATEG
IC R
EPO
RT
CO
RPO
RATE
GO
VER
NAN
CE
FINAN
CIA
L STATE
MEN
TS
CHRIS HOLMESCHAIRMAN
“Achieving the highest standards of corporate governance remains exceptionally important to the Board.”
CORPORATEGOVERNANCE REPORT
CHAIRMAN’S OVERVIEWI value the openness, mutual respect and trust of the Board. It is through this, coupled with the expertise, range of perspectives and probative questioning, that the Board is able to assess future opportunities, anticipate risks and build a sustainable business.
Carr’s approach to governance is outlined in the following report, which describes how it integrates the main principles of the 2012 UK Corporate Governance Code.
The corporate governance of the Company is continuously being reviewed as the Company develops, to ensure that the stakeholders’ interests are always aligned with the Company.
CHRIS HOLMESChairman11 November 2015
Statement by the Directors on compliance with the provisions of the UK Corporate Governance Code 2012.
UK CORPORATE GOVERNANCE CODEThe UK Corporate Governance Code dated September 2012 (‘the Code’) issued by the Financial Reporting Council is applicable to listed companies, and sets out standards of good practice in relation to issues such as:
• Boardcompositionandeffectiveness;• theroleofBoardcommittees;• riskmanagement;• remuneration;• relationshipswithshareholders.
John Worby, who commenced on 1 April 2015 and is both the Audit Committee Chairman and Senior Independent Director. John Worby is a former Finance Director and therefore complies with the Code’s requirements regarding having relevant financial experience. After the period end the Company appointed a new independent Non-Executive Director, Ian Wood, who commenced on 1 October 2015.
THE BOARDThe Directors have a collective duty to promote the long term success of the Company for its shareholders. In determining long-term strategy and objectives of the Group, the Board is mindful of its duties and responsibilities to shareholders as well as employees and other stakeholders. The Board reviews management and financial performance and monitors strategic delivery and achievement of business objectives, resulting in promoting the vision of the Group.
The powers of the Directors are set out in the Company’s Articles of Association. In addition, the Directors have responsibilities and duties under legislation, in particular the Companies Act 2006.
During the year ended 29 August 2015, the Board comprised of two Executive Directors, a Chairman, and three Non-Executive Directors (John Worby from 1 April 2015). There is a Company Secretary to the Board. The biographies of the Board including the newly appointed Non-Executive Director Ian Wood can be found on page 21.
The Board met 11 times during the year. In addition to the regular scheduled meetings throughout the year, unscheduled supplementary meetings may also take place as and when necessary, although during this financial year there was no reason to hold an unscheduled meeting. Directors who are unable to attend a
We are required to state how we have applied the principles contained in the Code and disclose whether we have complied with the provisions of the Code during the year. The Board consider that the Company has, during the year ended 29 August 2015, complied with the requirements of the Code other than with the following:
• B.1.1. Chris Holmes was the Chief Executive Officer and proceeded immediately to Chairman and therefore does not meet the independence criteria for a Chairman. However, the Group believed that the substantial in-depth knowledge of Chris Holmes was invaluable to the business and it was therefore in the best interests of the shareholders for him to have a continuing role with the Group. Clear division of responsibilities with the Chief Executive ensure there is no conflict, as set out on page 26.
• B.1.1. The Board considers Robert Heygate as independent, notwithstanding his longstanding position on the Board and his substantial shareholding. Robert Heygate has a wealth of knowledge in the flour milling industry which the Board values, and despite being a Non-Executive Director for 24 years, he has always continued to question with the impartiality expected of a Non-Executive Director. In addition, his shareholding aligns his interests with the other shareholders. Robert Heygate on 10 September 2015 confirmed his intention to stand down from the Board in April 2016.
• B.2.1,B.2.2,B.2.4.ANominationsCommittee was created within the financial year to 29 August 2015, and its terms of reference are available on the Company’s website www.carrsgroup.com.
The Company is aware of its ongoing corporate governance obligations and appointed a new independent Non-Executive Director,
26 CARR’S GROUP PLCANNUAL REPORT AND ACCOUNTS 2015
CORPORATE GOVERNANCE
particular meeting receive relevant briefing papers and are given the opportunity to discuss any issues with the Chairman, the Chief Executive or the Group Finance Director. During this year Robert Heygate and Alistair Wannop were unable to attend one Board meeting each, there were no other Director absences during the year.
To enable the Directors of the Board to carry out their responsibilities all Directors have full and timely access to all relevant information. The Board has a schedule of matters for its discussion, which is reviewed against best practice. A summary is shown below and a full schedule is available on the Company’s website.
The Board is responsible for:
• theGroup’sstrategy;• acquisitionsanddivestmentpolicy;• corporategovernance,riskandenvironment
policy and management;• approvalofbudgets;• generaltreasurypolicy;• majorcapitalexpenditureprojects;• dividendpolicy;• monitoringtheGroup’sprofitandcashflow
performance.
The Board has delegated authority to the Audit, Remuneration, and Nomination Committees to carry out certain tasks as defined in their written terms of reference approved by the Board; these are also available on the Company website.
The UK Corporate Governance Code stipulates that there should be a clear division of responsibility between the running of the Board and Executive responsibilities for running the Company.
The Chairman was responsible for:
• settingtheBoardagenda;• theleadershipoftheBoardandensuringits
effectiveness on all aspects of its role;• providingstrategicinsightfromhislong
business experience in the industry and with the Company;
• providingasoundingboardfortheChiefExecutive on key business decisions and challenging proposals where appropriate.
The Chief Executive was responsible for:
• theday-to-daymanagementoftheGroup’sbusiness;
• leadingthebusinessandtherestofthemanagement team in accordance with the strategy agreed by the Board;
• leadingthedevelopmentoftheGroup’sstrategy with input from the rest of the Board;
• leadingthemanagementteamintheimplementation of the Group’s strategy;
• bringingmattersofparticularsignificanceto the Chairman for discussion and consideration by the Board if appropriate.
ElectionsThe Company’s Articles of Association provide that one third of the Directors retire by rotation each year at the AGM, however, in line with it best practice the Company requires all the Directors to retire annually.
Attendance & AgendaIn advance of all Board meetings the Directors are supplied with detailed and comprehensive papers covering the Group’s strategy and operations. Members of the executive management team can attend and make presentations as appropriate at meetings of the
Board. The Company Secretary is responsible to the Board for the timeliness and quality of information.
Details of the number of meetings of, and members’ attendance at, the Board, Audit Remuneration and Nomination Committees during the period are set out in the table below.
Support Directors can obtain independent professional advice at the Company’s expense in performance of their duties as Directors. None of the Directors obtained independent professional advice in the period under review. All Directors have access to the advice and the services of the Company Secretary. In addition to these formal roles, the Non-Executive Directors have access to senior management of the business either by telephone or via involvement at informal meetings.
DIRECTORS’ CONFLICTS OF INTERESTThe Companies Act 2006 and the Company’s Articles of Association require the Board to consider any potential conflicts of interest. The Board has a policy and procedures for managing and, where appropriate, authorising actual or potential conflicts of interest. Under those procedures, Directors are required to declare all directorships or other appointments to organisations that are not part of the Group and which could result in actual or potential conflicts of interest, as well as other situations which could result in a potential conflict of interest.
The Board is required to review Directors’ actual or potential conflicts of interest at least annually. Directors are required to disclose proposed new appointments to the Chairman before taking them on, to ensure that any potential conflicts of interest can be identified and addressed appropriately. Any potential conflicts of interest in relation to proposed Directors are considered by the Board prior to their appointment. In this financial year there have been no declared conflicts of interest.
The Board’s time can be grouped in to six key areas as outlined below. A portion of their time is also spent on administrative matters.
Strategy Setting strategic targets. Reviewing potential acquisitions.Research and technology.
Risk Group’s risk and internal control framework.
Governance Legal updates and new disclosure requirements.Internal Board review.Succession planning.
Finance Oversight of the financial performance of the Group and of the preparation and management of the financial statements.Dividend policy.Pensions strategy.
Stakeholder engagement
AGM and other shareholder feedback.Investor calls, meetings and roadshows.
Safety Health & Safety monthly updates and management.
BoardAudit
CommitteeRemuneration
CommitteeNominationCommittee
No. of meetings
Chris HolmesRobert HeygateAlistair WannopJohn Worby**Neil AustinTim Davies
11
1110104
1111
3
323233
3
33302*1*
2
22201*1*
* part of the meetings by invitation
** attended all meetings since his appointment
Meetings Attendance
CORPORATEGOVERNANCE REPORT CONTINUED

27CARR’S GROUP PLCANNUAL REPORT AND ACCOUNTS 2015
STR
ATEG
IC R
EPO
RT
CO
RPO
RATE
GO
VER
NAN
CE
FINAN
CIA
L STATE
MEN
TS
BOARD EVALUATION The Board conducted an internal evaluation, building on the external evaluation in 2013, which found that the Board was operating effectively. Improvements have been implemented throughout the year, with new action points set out for the forthcoming year. The Board will undertake an externally facilitated evaluation in the financial year ending 2016.
The Chairman appraised the individual performance of the Directors and the Non-Executives met and appraised the performance of the Chairman.
BOARD COMMITTEESAudit CommitteeThe Audit Committee’s key function is to review the effectiveness of the Company’s financial reporting and performance of the external auditor.
The Audit Committee comprised of four Non-Executive Directors, John Worby (Chairman), Chris Holmes, Robert Heygate and Alistair Wannop. Since the year-end Ian Wood has joined the Audit Committee. The Board considers that the Committee meets the main requirements of the Code for a company of Carr’s size. The work, responsibilities and governance of the Audit Committee are set out on pages 28 to 29. The Chair of the Audit Committee will be available at the AGM to answer any shareholder questions on the Committee and its activities.
Remuneration CommitteeDuring the year the Remuneration Committee comprised of Alistair Wannop (Chairman), Chris Holmes, Robert Heygate, and John Worby. Since the year-end Ian Wood has joined the Remuneration Committee. The work, responsibilities and governance of the Remuneration Committee are set out on pages 30 to 35. The Chair of the Committee will be available at the AGM to answer any shareholder questions on the Committee and its activities.
Nomination CommitteeDuring the year the Nomination Committee comprised of Chris Holmes (Chairman), Alistair Wannop, Robert Heygate, and John Worby. Since the year-end Ian Wood has joined the Nomination Committee. The work, responsibilities and governance of the Nomination Committee are set out on page 36. The Chair of the Committee will be available at the AGM to answer any shareholder questions on the Committee and its activities.
Relations with ShareholdersThe Board recognises and values the importance of good communications with all shareholders. The Group maintains dialogue with institutional shareholders and analysts, and hosts presentations on the preliminary and interim results. Shareholders have access to the Company’s website at www.carrsgroup.com.
We engage with our shareholders through our regular communications. Significant matters relating to trading or development of the business are disseminated to the market by way of Stock Exchange announcements. We announce our financial results on a six monthly basis with all shareholders receiving a summary full year statement, a half year statement, and we produce trading updates during the year. All reports and updates are made available on our website.
The AGM provides all shareholders with the opportunity to develop further their understanding of the Company. It is the principal forum for all the Directors to engage in dialogue with private investors. All shareholders are given the opportunity to raise questions on any matter at the meeting. The Group aims to send notices of AGMs to shareholders at least 20 working days before the meeting, as required by the Code, and it is the Company’s practice to indicate the proxy voting results on all resolutions at the meetings. Following the AGM the voting results for each resolution are published and are available on the Company’s website.
FAIR, BALANCED AND UNDERSTANDABLEThe Directors have also reviewed the financial statements and taken as a whole consider them to be fair, balanced and understandable, and provide the information necessary for shareholders to assess the Company’s performance, business model and strategy.
GOING CONCERNThe Directors have prepared the accounts on a going concern basis, having satisfied themselves from a review of internal budgets and forecasts and current bank facilities that the Group has adequate resources to continue in operational existence for the foreseeable future.
SHARE SPLITAt the AGM on 13 January 2015 the Shareholders voted approving the split of the Company’s shares 10 for 1, and the subdivision of the shares took place on 14 January 2015.
CHANGE OF NAMEAt a General Meeting on 8 April 2015 the Shareholders voted approving the change of Company name from Carr’s Milling Industries PLC to Carr’s Group plc, with the change effective on 9 April 2015.
INTERNAL CONTROLThe Board of Directors has overall responsibility for the Group’s systems of internal control and for reviewing its effectiveness, including: financial, operational and compliance controls and risk management, which safeguard the shareholders’ investment and the Group’s assets. Such a system can only provide reasonable and not absolute assurance
against material misstatement or loss, as it is designed to manage rather than eliminate the risk of failure to achieve business objectives.
The Board of Directors is not aware of any significant losses caused by breaches of internal control in the year.
The Group operates within a clearly defined organisational structure with established responsibilities, authorities and reporting lines to the Board. The organisational structure has been designed in order to plan, execute, monitor and control the Group’s objectives effectively and to ensure that internal control becomes embedded in the operations. The Board confirms that the key on-going processes and features of the Group’s internal risk based control system, which accord with the Turnbull guidance, have been fully operative throughout the year and up to the date of the Annual Report being approved. These include: a process to identify and evaluate business risk; a strong control environment; an information and communication process; a monitoring system and a regular Board review for effectiveness. The Group Finance Director is responsible for overseeing the Group’s internal controls.
The Group’s internal controls systems cover controls over the financial reporting process, including monthly reporting from subsidiaries, its associate and joint ventures. This reporting is subject to detailed review by the Chief Executive and the Group Finance Director and detailed validation by the Group finance team, and forms the basis for information presented to and reviewed by the Board. All monthly reporting is prepared in line with Group accounting policies, which are reviewed annually and are also subject to review by the external auditors.
The management of the Group’s businesses identified the key business risks within their operations, considered the financial implications and assessed the effectiveness of the control processes in place to mitigate these risks. The Board reviewed a summary of the findings and this, along with direct involvement in the strategies of the businesses, investment appraisal and budgeting process, enabled the Board to report on the effectiveness of internal control. A summary of the risk management framework and key risks to the business are set out on pages 15 to 17.
By order of the Board
KATIE SINCLAIRCompany SecretaryCarlisleCA3 9BA11 November 2015
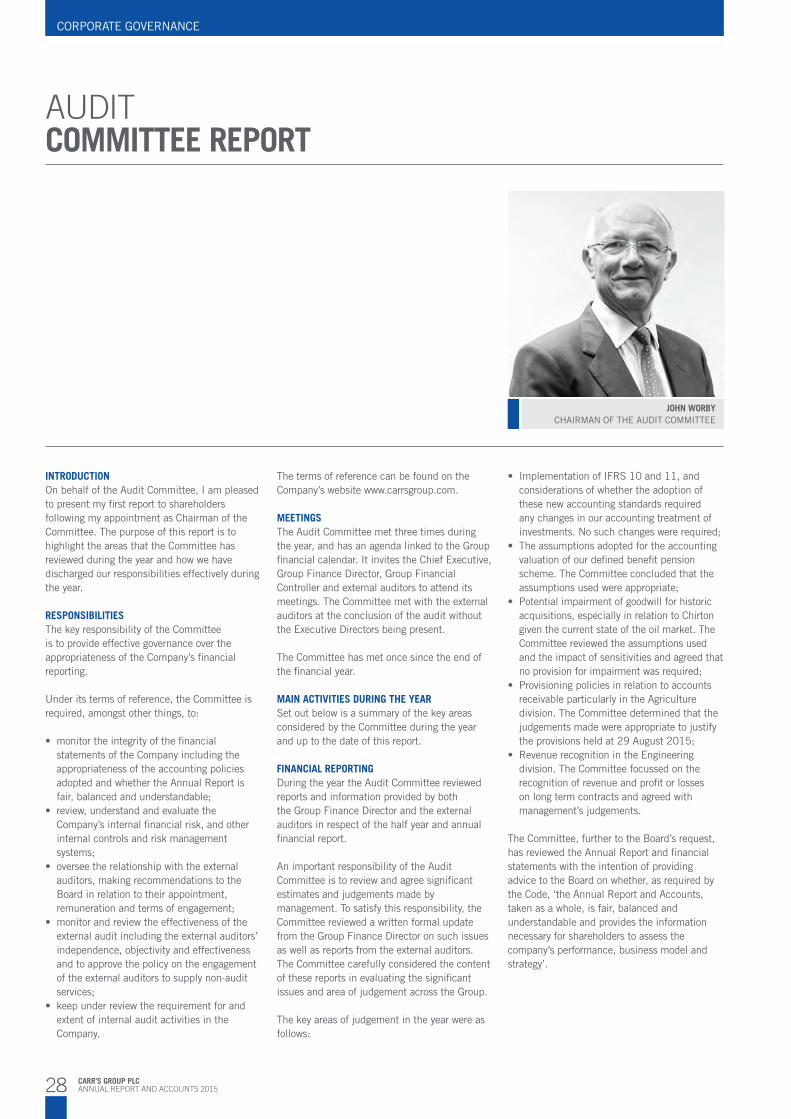
28 CARR’S GROUP PLCANNUAL REPORT AND ACCOUNTS 2015
CORPORATE GOVERNANCE
AUDITCOMMITTEE REPORT
JOHN WORBYCHAIRMAN OF THE AUDIT COMMITTEE
INTRODUCTIONOn behalf of the Audit Committee, I am pleased to present my first report to shareholders following my appointment as Chairman of the Committee. The purpose of this report is to highlight the areas that the Committee has reviewed during the year and how we have discharged our responsibilities effectively during the year.
RESPONSIBILITIESThe key responsibility of the Committee is to provide effective governance over the appropriateness of the Company’s financial reporting.
Under its terms of reference, the Committee is required, amongst other things, to:
• monitortheintegrityofthefinancialstatements of the Company including the appropriateness of the accounting policies adopted and whether the Annual Report is fair, balanced and understandable;
• review,understandandevaluatetheCompany’s internal financial risk, and other internal controls and risk management systems;
• overseetherelationshipwiththeexternalauditors, making recommendations to the Board in relation to their appointment, remuneration and terms of engagement;
• monitorandreviewtheeffectivenessoftheexternal audit including the external auditors’ independence, objectivity and effectiveness and to approve the policy on the engagement of the external auditors to supply non-audit services;
• keepunderreviewtherequirementforandextent of internal audit activities in the Company.
• ImplementationofIFRS10and11,andconsiderations of whether the adoption of these new accounting standards required any changes in our accounting treatment of investments. No such changes were required;
• Theassumptionsadoptedfortheaccountingvaluation of our defined benefit pension scheme. The Committee concluded that the assumptions used were appropriate;
• Potential impairment of goodwill for historic acquisitions, especially in relation to Chirton given the current state of the oil market. The Committee reviewed the assumptions used and the impact of sensitivities and agreed that no provision for impairment was required;
• Provisioningpoliciesinrelationtoaccountsreceivable particularly in the Agriculture division. The Committee determined that the judgements made were appropriate to justify the provisions held at 29 August 2015;
• RevenuerecognitionintheEngineeringdivision. The Committee focussed on the recognition of revenue and profit or losses on long term contracts and agreed with management’s judgements.
The Committee, further to the Board’s request, has reviewed the Annual Report and financial statements with the intention of providing advice to the Board on whether, as required by the Code, ‘the Annual Report and Accounts, taken as a whole, is fair, balanced and understandable and provides the information necessary for shareholders to assess the company’s performance, business model and strategy’.
The terms of reference can be found on the Company’s website www.carrsgroup.com.
MEETINGSThe Audit Committee met three times during the year, and has an agenda linked to the Group financial calendar. It invites the Chief Executive, Group Finance Director, Group Financial Controller and external auditors to attend its meetings. The Committee met with the external auditors at the conclusion of the audit without the Executive Directors being present.
The Committee has met once since the end of the financial year.
MAIN ACTIVITIES DURING THE YEARSet out below is a summary of the key areas considered by the Committee during the year and up to the date of this report.
FINANCIAL REPORTINGDuring the year the Audit Committee reviewed reports and information provided by both the Group Finance Director and the external auditors in respect of the half year and annual financial report.
An important responsibility of the Audit Committee is to review and agree significant estimates and judgements made by management. To satisfy this responsibility, the Committee reviewed a written formal update from the Group Finance Director on such issues as well as reports from the external auditors. The Committee carefully considered the content of these reports in evaluating the significant issues and area of judgement across the Group.
The key areas of judgement in the year were as follows:
29CARR’S GROUP PLCANNUAL REPORT AND ACCOUNTS 2015
STR
ATEG
IC R
EPO
RT
CO
RPO
RATE
GO
VER
NAN
CE
FINAN
CIA
L STATE
MEN
TS
To make this assessment, the Committee reviewed a report prepared by the Group Finance Director outlining the key matters worthy of consideration. We also considered the KPIs included in the Strategic Report (see page 20) and concluded that, whilst they were appropriate for our shareholders’ understanding of the performance, position and future prospects of the business, there could be inclusion of additional non-financial KPIs. These will continue to be developed over the forthcoming financial year. In addition, the committee also considered and was satisfied that all the key events and issues which have been reported to the Board in the CEO’s monthly report during the year, both good and bad, have been adequately referenced or reflected within the Annual Report.
INTERNAL CONTROL AND RISK MANAGEMENTDuring the year the Committee reviewed the Group’s internal control and risk management systems.
The Committee also reviewed current risk management activities and management’s plans to further enhance risk management within the Group as further explained on pages 15 to 17 of the Annual Report.
In the light of this work, the Committee reported to the Board that it had reviewed and was satisfied with the effectiveness of the Company’s internal control and risk management systems.
EXTERNAL AUDITThe Audit Committee is responsible for recommendations for the appointment, reappointment or removal of external auditors and for approval of their remuneration.
PricewaterhouseCoopers LLP (PwC) and its predecessor firms have been the Auditor for Carr’s Group plc since the Company first listed on the London Stock Exchange in 1972. The Audit Committee assesses annually the qualification, expertise and independence of the auditors and the effectiveness of the audit process.
Subject to the ongoing satisfactory performance of the external auditors, the Committee expects to carry out a tendering process for the 2019 year end following the conclusion of the five year term of the current audit partner.
Following approval by shareholders to re-appoint PwC at last year’s AGM, the Audit Committee reviewed and approved the terms of engagement and remuneration of the external auditors.
AUDIT EFFECTIVENESSThe effectiveness of the external audit process is dependent on appropriate audit risk identification at the start of the audit cycle. PwC present their detailed audit plan to us each year identifying their assessment of these key risks.
Our assessment of the effectiveness and quality of the audit process and addressing these key risks is formed by, amongst other things, the reporting from the auditors and also seeking feedback from management on the audit process.
The Committee remain satisfied with PwC’s performance and is of the view that there is nothing of concern that would impact the effectiveness of the external audit process.
AUDITOR INDEPENDENCEThe Group meets its obligations for maintaining an appropriate relationship with the external auditors through the Audit Committee, whose terms of reference include an obligation to consider and keep under review the degree of work undertaken by the external auditor other than the statutory audit, to ensure such objectivity and independence is safeguarded.
In accordance with the Auditing Practices Board Ethical Standards, PwC has to implement rules and requirements which include that none of their employees working on our audit can hold any shares in Carr’s. PwC is also required to tell us about any significant facts and matters that may reasonably be thought to bear on their independence or on the objectivity of the lead partner and the audit team. The lead partner in the audit team must change every five years.
The Audit Committee reviewed and approved the non-audit services policy, the objective of which is to ensure that the provision of such services does not impair, or is not perceived to impair, the external auditors’ independence or objectivity. The policy imposes guidance on the areas of work that the external auditors may be asked to undertake and those assignments where the external auditors should not be involved. There is a further category of services for which a case-by-case decision is necessary.
In order to ensure that the policy is effective and the level of non-audit fees is kept under review, major work to be awarded to the audit firm must be agreed in advance by the Audit Committee Chairman. For the 2015 financial year end, the non-audit to audit services ratio was 0.41. Note 3 on page 57 provides further detail on non-audit service fees.
Taking into account our findings in relation to the effectiveness of the audit process and in relation to the independence of PwC, the Committee is satisfied that PwC continues to be independent, and free from any conflicting interest with the Group. As a result, the Committee has recommended to the Board that PwC be proposed for reappointment at the forthcoming AGM in January 2016.
INTERNAL AUDITConsideration was given to whether there should be a formal internal audit function within the Group. The Committee agreed that in view of the current size of the Group and the absence of any significant control issues having arisen, no such internal audit function was required. The Committee has however recommended that this be reviewed in the year ahead given the increasing spread of the Group’s activities.
The Committee also reviewed the Committee’s terms of reference and its effectiveness.
As Chairman of the Committee, I will be available at the AGM to respond to any shareholder questions that might be raised on the Committee’s activities.
JOHN WORBYChairman of the Audit Committee11 November 2015
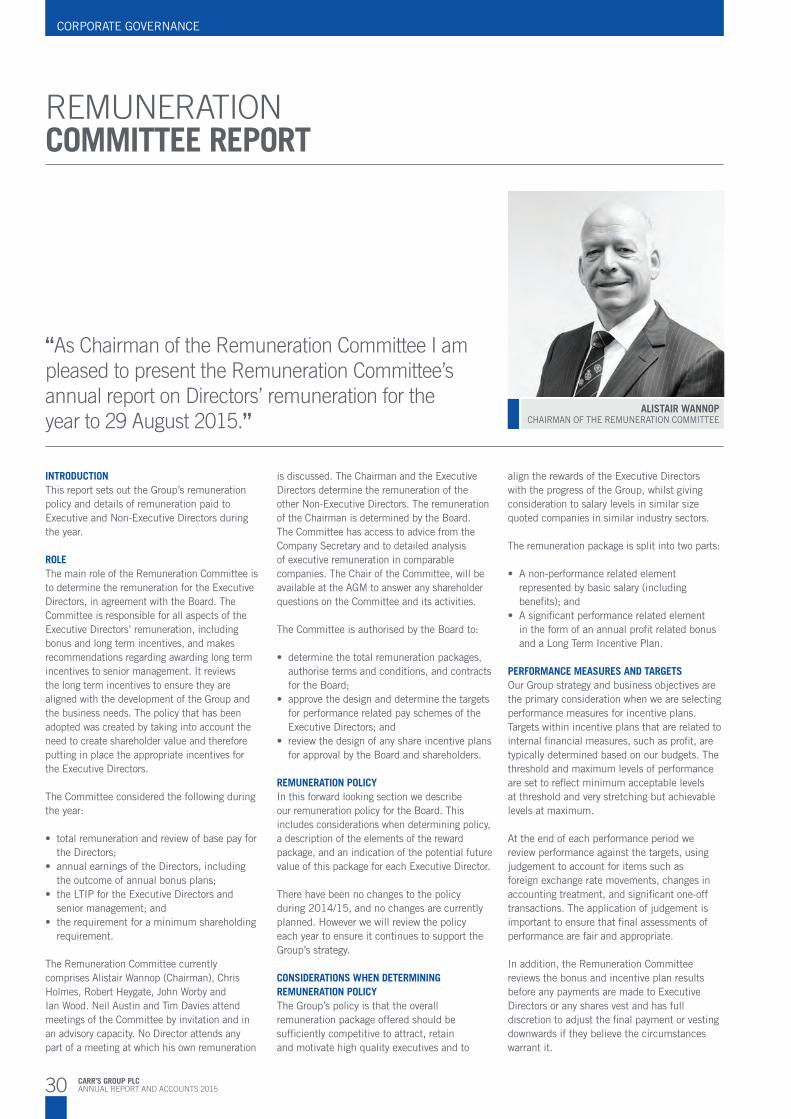
30 CARR’S GROUP PLCANNUAL REPORT AND ACCOUNTS 2015
CORPORATE GOVERNANCE
REMUNERATIONCOMMITTEE REPORT
ALISTAIR WANNOPCHAIRMAN OF THE REMUNERATION COMMITTEE
“As Chairman of the Remuneration Committee I am pleased to present the Remuneration Committee’s annual report on Directors’ remuneration for the year to 29 August 2015.”
INTRODUCTIONThis report sets out the Group’s remuneration policy and details of remuneration paid to Executive and Non-Executive Directors during the year.
ROLEThe main role of the Remuneration Committee is to determine the remuneration for the Executive Directors, in agreement with the Board. The Committee is responsible for all aspects of the Executive Directors’ remuneration, including bonus and long term incentives, and makes recommendations regarding awarding long term incentives to senior management. It reviews the long term incentives to ensure they are aligned with the development of the Group and the business needs. The policy that has been adopted was created by taking into account the need to create shareholder value and therefore putting in place the appropriate incentives for the Executive Directors.
The Committee considered the following during the year:
•totalremunerationandreviewofbasepayforthe Directors;
•annualearningsoftheDirectors,includingthe outcome of annual bonus plans;
•theLTIPfortheExecutiveDirectorsandsenior management; and
•therequirementforaminimumshareholdingrequirement.
The Remuneration Committee currently comprises Alistair Wannop (Chairman), Chris Holmes, Robert Heygate, John Worby and Ian Wood. Neil Austin and Tim Davies attend meetings of the Committee by invitation and in an advisory capacity. No Director attends any part of a meeting at which his own remuneration
align the rewards of the Executive Directors with the progress of the Group, whilst giving consideration to salary levels in similar size quoted companies in similar industry sectors.
The remuneration package is split into two parts:
•Anon-performancerelatedelementrepresented by basic salary (including benefits); and
•Asignificantperformancerelatedelementin the form of an annual profit related bonus and a Long Term Incentive Plan.
PERFORMANCE MEASURES AND TARGETSOur Group strategy and business objectives are the primary consideration when we are selecting performance measures for incentive plans. Targets within incentive plans that are related to internal financial measures, such as profit, are typically determined based on our budgets. The threshold and maximum levels of performance are set to reflect minimum acceptable levels at threshold and very stretching but achievable levels at maximum.
At the end of each performance period we review performance against the targets, using judgement to account for items such as foreign exchange rate movements, changes in accounting treatment, and significant one-off transactions. The application of judgement is important to ensure that final assessments of performance are fair and appropriate.
In addition, the Remuneration Committee reviews the bonus and incentive plan results before any payments are made to Executive Directors or any shares vest and has full discretion to adjust the final payment or vesting downwards if they believe the circumstances warrant it.
is discussed. The Chairman and the Executive Directors determine the remuneration of the other Non-Executive Directors. The remuneration of the Chairman is determined by the Board. The Committee has access to advice from the Company Secretary and to detailed analysis of executive remuneration in comparable companies. The Chair of the Committee, will be available at the AGM to answer any shareholder questions on the Committee and its activities.
The Committee is authorised by the Board to:
•determinethetotalremunerationpackages,authorise terms and conditions, and contracts for the Board;
•approvethedesignanddeterminethetargetsfor performance related pay schemes of the Executive Directors; and
•reviewthedesignofanyshareincentiveplansfor approval by the Board and shareholders.
REMUNERATION POLICYIn this forward looking section we describe our remuneration policy for the Board. This includes considerations when determining policy, a description of the elements of the reward package, and an indication of the potential future value of this package for each Executive Director.
There have been no changes to the policy during 2014/15, and no changes are currently planned. However we will review the policy each year to ensure it continues to support the Group’s strategy.
CONSIDERATIONS WHEN DETERMINING REMUNERATION POLICY The Group’s policy is that the overall remuneration package offered should be sufficiently competitive to attract, retain and motivate high quality executives and to

31CARR’S GROUP PLCANNUAL REPORT AND ACCOUNTS 2015
STR
ATEG
IC R
EPO
RT
CO
RPO
RATE
GO
VER
NAN
CE
FINAN
CIA
L STATE
MEN
TS
ELEMENT
PURPOSE AND LINK TO STRATEGY POLICY AND APPROACH OPPORTUNITY
CHANGE OF POLICY VERSUS 2014?
Base salary To attract and retain the best talent.
Salaries are reviewed annually and fixed for 12 months commencing 1 September. The decision is influenced by:
•levelofskill,experienceandscopeofresponsibilitiesofindividual;•businessperformance,economicclimateandmarketconditions;•increaseselsewhereintheGroup;and•externalcomparatorgroups(usedforreferencepurposesonly).
Base salary increases are applied in line with the outcome of the annual review.
No.
Pension To remain competitive in the market place.
Executive Directors are entitled to participate in a defined contribution pension arrangement.
Company contributions are 15% of base salary.
15% of base salary.
No.
Benefits To aid retention and remain competitive in the market place.
These include permanent health insurance, private medical insurance and life assurance. Relocation benefits may also be provided in the case of recruitment of a new Executive Director.
Market rate determines value.
No.
Annual cash bonus
Designed to reward delivery of key strategic priorities during the year.
Bonus levels and appropriateness of performance measures and weighting are reviewed annually to ensure they continue to support our strategy. Performance is measured against stretching profit related targets, and is usually paid in November each year for performance in the previous financial year. The bonuses payable are capped at a maximum of 100% of base salary.
Maximum of 100% of base salary.
No.
Save As You Earn (SAYE)
To encourage employee involvement and encourage greater shareholder alignment.
A SAYE scheme is available to eligible staff, including Executive Directors. Currently there is a 3 year and a 5 year scheme in operation.
N/A No.
Long Term Incentive Plan (LTIP)
To motivate and incentivise delivery of sustained performance over the longer term, and to support and encourage greater shareholder alignment.
Award levels and vesting are reviewed annually to ensure they continue to support the Group’s strategy. Awards are capped at the equivalent of 100% of base salary at the date of award.
Three awards have been made, one maturing in 2015, one in 2016 and one in 2017. For the 2015 maturing award, the amount vesting will be based on average growth of adjusted EPS over the three year period 2013 – 2015. A minimum average annual growth of 7% is required to vest 25% of the award with a sliding scale arrangement up to 10% average annual growth to vest 100% of the award. For the 2016 and 2017 maturing awards, which are also based on three year performance periods, a minimum average annual growth in adjusted EPS of 3% is required to vest 25%, with a sliding scale up to 100% vesting at an annual average growth of 10%.
Maximum of 100% of base salary.
No.
REMUNERATION POLICY TABLE
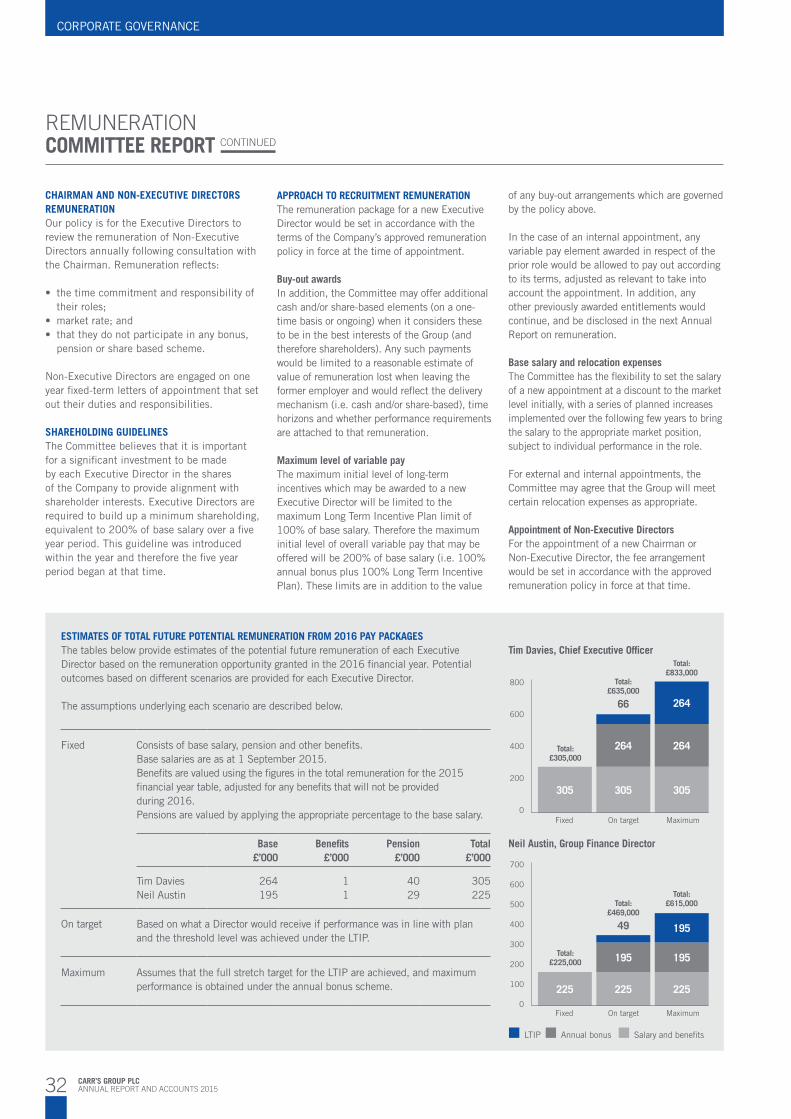
32 CARR’S GROUP PLCANNUAL REPORT AND ACCOUNTS 2015
CORPORATE GOVERNANCE
CHAIRMAN AND NON-EXECUTIVE DIRECTORS REMUNERATIONOur policy is for the Executive Directors to review the remuneration of Non-Executive Directors annually following consultation with the Chairman. Remuneration reflects:
• thetimecommitmentandresponsibilityoftheir roles;
• marketrate;and• thattheydonotparticipateinanybonus,
pension or share based scheme.
Non-Executive Directors are engaged on one year fixed-term letters of appointment that set out their duties and responsibilities.
SHAREHOLDING GUIDELINESThe Committee believes that it is important for a significant investment to be made by each Executive Director in the shares of the Company to provide alignment with shareholder interests. Executive Directors are required to build up a minimum shareholding, equivalent to 200% of base salary over a five year period. This guideline was introduced within the year and therefore the five year period began at that time.
APPROACH TO RECRUITMENT REMUNERATIONThe remuneration package for a new Executive Director would be set in accordance with the terms of the Company’s approved remuneration policy in force at the time of appointment.
Buy-out awardsIn addition, the Committee may offer additional cash and/or share-based elements (on a one-time basis or ongoing) when it considers these to be in the best interests of the Group (and therefore shareholders). Any such payments would be limited to a reasonable estimate of value of remuneration lost when leaving the former employer and would reflect the delivery mechanism (i.e. cash and/or share-based), time horizons and whether performance requirements are attached to that remuneration.
Maximum level of variable payThe maximum initial level of long-term incentives which may be awarded to a new Executive Director will be limited to the maximum Long Term Incentive Plan limit of 100% of base salary. Therefore the maximum initial level of overall variable pay that may be offered will be 200% of base salary (i.e. 100% annual bonus plus 100% Long Term Incentive Plan). These limits are in addition to the value
of any buy-out arrangements which are governed by the policy above.
In the case of an internal appointment, any variable pay element awarded in respect of the prior role would be allowed to pay out according to its terms, adjusted as relevant to take into account the appointment. In addition, any other previously awarded entitlements would continue, and be disclosed in the next Annual Report on remuneration.
Base salary and relocation expensesThe Committee has the flexibility to set the salary of a new appointment at a discount to the market level initially, with a series of planned increases implemented over the following few years to bring the salary to the appropriate market position, subject to individual performance in the role.
For external and internal appointments, the Committee may agree that the Group will meet certain relocation expenses as appropriate.
Appointment of Non-Executive DirectorsFor the appointment of a new Chairman or Non-Executive Director, the fee arrangement would be set in accordance with the approved remuneration policy in force at that time.
ESTIMATES OF TOTAL FUTURE POTENTIAL REMUNERATION FROM 2016 PAY PACKAGESThe tables below provide estimates of the potential future remuneration of each Executive Director based on the remuneration opportunity granted in the 2016 financial year. Potential outcomes based on different scenarios are provided for each Executive Director.
The assumptions underlying each scenario are described below.
Fixed Consists of base salary, pension and other benefits.Base salaries are as at 1 September 2015.Benefits are valued using the figures in the total remuneration for the 2015 financial year table, adjusted for any benefits that will not be provided during 2016.Pensions are valued by applying the appropriate percentage to the base salary.
Base £’000
Benefits £’000
Pension £’000
Total £’000
Tim DaviesNeil Austin
264195
11
4029
305225
On target Based on what a Director would receive if performance was in line with plan and the threshold level was achieved under the LTIP.
Maximum Assumes that the full stretch target for the LTIP are achieved, and maximum performance is obtained under the annual bonus scheme.
Tim Davies, Chief Executive Officer
Neil Austin, Group Finance Director
LTIP Annual bonus Salary and benefits
700
600
500
400
300
200
100
0Fixed On target Maximum
800
600
400
200
0Fixed On target Maximum
Total:£833,000
Total:£615,000
Total:£635,000
66
Total:£469,000
49
Total:£305,000
Total:£225,000
305
264
264
305 305
264
225
195
225225
195
195
REMUNERATION COMMITTEE REPORT CONTINUED
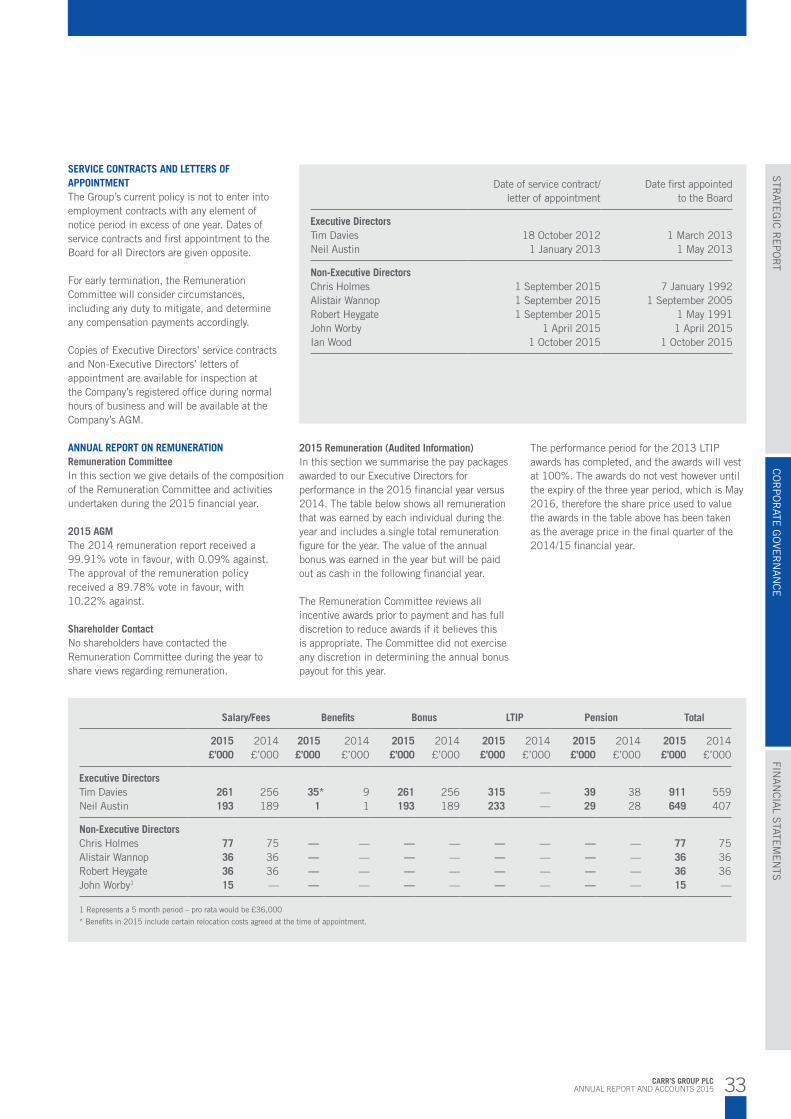
33CARR’S GROUP PLCANNUAL REPORT AND ACCOUNTS 2015
STR
ATEG
IC R
EPO
RT
CO
RPO
RATE
GO
VER
NAN
CE
FINAN
CIA
L STATE
MEN
TS
SERVICE CONTRACTS AND LETTERS OF APPOINTMENTThe Group’s current policy is not to enter into employment contracts with any element of notice period in excess of one year. Dates of service contracts and first appointment to the Board for all Directors are given opposite.
For early termination, the Remuneration Committee will consider circumstances, including any duty to mitigate, and determine any compensation payments accordingly.
Copies of Executive Directors’ service contracts and Non-Executive Directors’ letters of appointment are available for inspection at the Company’s registered office during normal hours of business and will be available at the Company’s AGM.
ANNUAL REPORT ON REMUNERATIONRemuneration CommitteeIn this section we give details of the composition of the Remuneration Committee and activities undertaken during the 2015 financial year.
2015 AGMThe 2014 remuneration report received a 99.91% vote in favour, with 0.09% against. The approval of the remuneration policy received a 89.78% vote in favour, with 10.22% against.
Shareholder ContactNo shareholders have contacted the Remuneration Committee during the year to share views regarding remuneration.
Date of service contract/letter of appointment
Date first appointedto the Board
Executive DirectorsTim DaviesNeil Austin
18 October 20121 January 2013
1 March 20131 May 2013
Non-Executive DirectorsChris HolmesAlistair WannopRobert HeygateJohn WorbyIan Wood
1 September 20151 September 20151 September 2015
1 April 20151 October 2015
7 January 19921 September 2005
1 May 19911 April 2015
1 October 2015
Salary/Fees Benefits Bonus LTIP Pension Total
2015£’000
2014£’000
2015£’000
2014£’000
2015£’000
2014£’000
2015£’000
2014£’000
2015£’000
2014£’000
2015£’000
2014£’000
Executive DirectorsTim DaviesNeil Austin
261193
256189
35*1
91
261193
256189
315233
——
3929
3828
911649
559407
Non-Executive DirectorsChris HolmesAlistair WannopRobert HeygateJohn Worby1
77363615
753636—
— — — —
————
————
————
————
————
————
————
77363615
753636—
1 Represents a 5 month period – pro rata would be £36,000
* Benefits in 2015 include certain relocation costs agreed at the time of appointment.
2015 Remuneration (Audited Information)In this section we summarise the pay packages awarded to our Executive Directors for performance in the 2015 financial year versus 2014. The table below shows all remuneration that was earned by each individual during the year and includes a single total remuneration figure for the year. The value of the annual bonus was earned in the year but will be paid out as cash in the following financial year.
The Remuneration Committee reviews all incentive awards prior to payment and has full discretion to reduce awards if it believes this is appropriate. The Committee did not exercise any discretion in determining the annual bonus payout for this year.
The performance period for the 2013 LTIP awards has completed, and the awards will vest at 100%. The awards do not vest however until the expiry of the three year period, which is May 2016, therefore the share price used to value the awards in the table above has been taken as the average price in the final quarter of the 2014/15 financial year.

34 CARR’S GROUP PLCANNUAL REPORT AND ACCOUNTS 2015
CORPORATE GOVERNANCE
2015 ANNUAL BONUS PAYOUTThe annual bonus is payable based on adjusted profit before tax (‘PBT’) performance of different parts of the Group, and an element payable based on total Group performance. If the Group target is achieved, regardless of individual divisional performance, then the maximum bonus is payable. Adjusted PBT is calculated as reported PBT after adding back or deducting any one-off items outside of normal trading that were not anticipated at the time the performance targets were set, such as acquisition related costs.
The targets are split between the different aspects of the Group as follows:
AgricultureFoodEngineeringGroup
20%20%20%40%
In the 2015 financial year the adjusted PBT target for the Group was set at £17.62m for maximum payout. An adjusted PBT in excess of this was achieved, therefore the maximum bonus was awarded.
LONG TERM INCENTIVE PLAN AWARDS DURING THE YEARThe 2015 long-term awards were in line with the remuneration policy as disclosed in our 2014 remuneration report. The performance conditions are based on annual average growth in adjusted EPS over a three year period.
Average annual growth %310
% vesting25
100
Nothing is payable below 3%, and a sliding scale operates between this and the maximum available.
ALL EMPLOYEE SHARE PLANSThe Executive Directors are also eligible to participate in the UK all-employee plans.
The CMI Sharesave Scheme 2006 is a HM Revenue & Customs (‘HMRC’) approved scheme open to all staff permanently employed in a UK Group company as of the eligibility date. Options under the plan are granted at a 20% discount to market value. Executive Directors’ participation is included in the option table later in this report.
FIVE YEAR HISTORICAL TSR PERFORMANCE
Carr’s Group plc FTSE All-Share Price IndexSource: Thomson Datastream
400
350
300
250
200
150
100
50
0
31/0
8/10
30/1
1/10
28/0
2/11
31/0
5/11
31/0
8/11
30/1
1/11
29/0
2/12
31/0
5/12
31/0
8/12
30/1
1/12
28/0
2/13
31/0
5/13
31/0
8/13
30/1
1/13
28/0
2/14
31/0
5/14
31/0
8/14
30/1
1/14
28/0
2/15
31/0
5/15
31/0
8/15
REMUNERATION COMMITTEE REPORT CONTINUED

35CARR’S GROUP PLCANNUAL REPORT AND ACCOUNTS 2015
STR
ATEG
IC R
EPO
RT
CO
RPO
RATE
GO
VER
NAN
CE
FINAN
CIA
L STATE
MEN
TS
DIRECTORS’ INTERESTS IN THE SHARES OF THE COMPANY (AUDITED INFORMATION)A summary of interests in shares and scheme interests of the Directors who served during the year is given opposite.
PERFORMANCE SHARES (AUDITED INFORMATION)The maximum number of outstanding shares that have been awarded to Directors under the LTIP are currently as follows:
CHANGE IN CHIEF EXECUTIVE’S REMUNERATIONIn the table opposite we show the percentage change in the Chief Executive’s remuneration between 2014 and 2015 financial years compared to the other employees.
RELATIVE SPEND ON PAYThe table shows the relative importance of spend on pay compared to distributions to shareholders.
ASSESSING PAY AND PERFORMANCEIn the table opposite we summarise the Chief Executive’s single remuneration figure over the past 5 years, as well as how variable pay plans have paid out in relation to the maximum opportunity.
Total number of interests in shares Unvested LTIP
SAYE (unvested without performance
conditions)
Executive DirectorsTim DaviesNeil Austin
20,00020,000
315,620233,560
2,9584,933
Non-Executive DirectorsChris HolmesAlistair WannopBob HeygateJohn Worby
1,252,50022,610
372,25025,000
————
————
2012/13 award 2013/14 award 2014/15 award
Tim DaviesNeil Austin
190,110140,680
152,260112,670
163,360120,890
Tim Davies Other employees
Base payBenefitsAnnual bonus
2.0%289.0%
2.0%
2.0%0%
2.0%
2015£’000
2014£’000 % change
Employee costsDividends paid to shareholders
39,1483,110
35,7552,912
9.5%6.8%
2011Chris
Holmes£’000
2012Chris
Holmes£’000
2013Tim
Davies£’000
2014Tim
Davies£’000
2015Tim
Davies£’000
Single figure of total remunerationAnnual variable element (actual award versus maximum opportunity)Long-term incentive (vesting versus maximum opportunity)
845
100%
N/A
573
100%
N/A
2831
100%
N/A
559
100%
N/A
596
100%
100%
1 Represents a 6 month period – pro rata would be £566,000
By order of the Board
ALISTAIR WANNOP Chairman of the Remuneration Committee11 November 2015
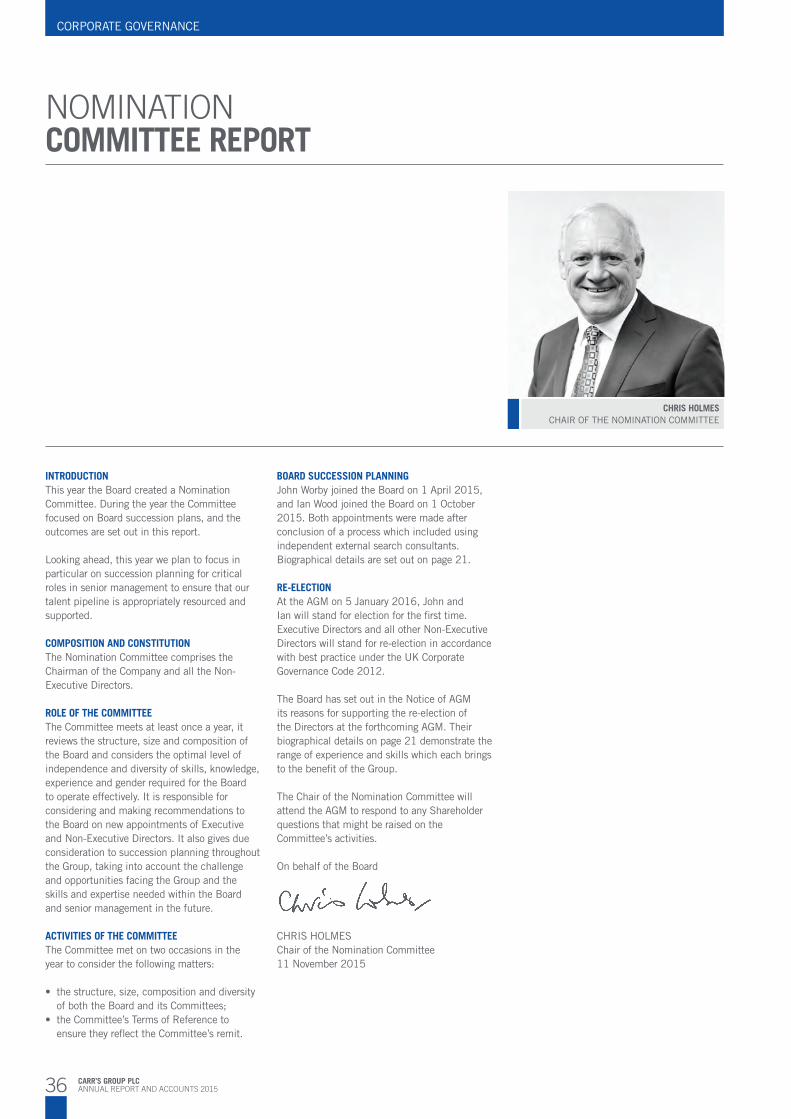
36 CARR’S GROUP PLCANNUAL REPORT AND ACCOUNTS 2015
CORPORATE GOVERNANCE
NOMINATION COMMITTEE REPORT
INTRODUCTIONThis year the Board created a Nomination Committee. During the year the Committee focused on Board succession plans, and the outcomes are set out in this report.
Looking ahead, this year we plan to focus in particular on succession planning for critical roles in senior management to ensure that our talent pipeline is appropriately resourced and supported.
COMPOSITION AND CONSTITUTIONThe Nomination Committee comprises the Chairman of the Company and all the Non-Executive Directors.
ROLE OF THE COMMITTEEThe Committee meets at least once a year, it reviews the structure, size and composition of the Board and considers the optimal level of independence and diversity of skills, knowledge, experience and gender required for the Board to operate effectively. It is responsible for considering and making recommendations to the Board on new appointments of Executive and Non-Executive Directors. It also gives due consideration to succession planning throughout the Group, taking into account the challenge and opportunities facing the Group and the skills and expertise needed within the Board and senior management in the future.
ACTIVITIES OF THE COMMITTEEThe Committee met on two occasions in the year to consider the following matters:
• thestructure,size,compositionanddiversityof both the Board and its Committees;
• theCommittee’sTermsofReferencetoensure they reflect the Committee’s remit.
BOARD SUCCESSION PLANNINGJohn Worby joined the Board on 1 April 2015, and Ian Wood joined the Board on 1 October 2015. Both appointments were made after conclusion of a process which included using independent external search consultants. Biographical details are set out on page 21.
RE-ELECTIONAt the AGM on 5 January 2016, John and Ian will stand for election for the first time. Executive Directors and all other Non-Executive Directors will stand for re-election in accordance with best practice under the UK Corporate Governance Code 2012.
The Board has set out in the Notice of AGM its reasons for supporting the re-election of the Directors at the forthcoming AGM. Their biographical details on page 21 demonstrate the range of experience and skills which each brings to the benefit of the Group.
The Chair of the Nomination Committee will attend the AGM to respond to any Shareholder questions that might be raised on the Committee’s activities.
On behalf of the Board
CHRIS HOLMESChair of the Nomination Committee11 November 2015
CHRIS HOLMESCHAIR OF THE NOMINATION COMMITTEE
37CARR’S GROUP PLCANNUAL REPORT AND ACCOUNTS 2015
STR
ATEG
IC R
EPO
RT
CO
RPO
RATE
GO
VER
NAN
CE
FINAN
CIA
L STATE
MEN
TS
DIRECTORS’ REPORT
THE DIRECTORS SUBMIT THEIR REPORT AND THE AUDITED ACCOUNTS OF THE COMPANY FOR THE YEAR ENDED 29 AUGUST 2015.
The Company is a public limited company incorporated and domiciled in England and Wales whose shares are listed and traded on the London Stock Exchange. The address of its registered office is Old Croft, Stanwix, Carlisle, CA3 9BA.
RESULTS AND DIVIDENDSA review of the results can be found on pages 18 to 19.
2015 2014*
First Interim dividend per share paid on 15 May 2015Second Interim dividend per share paid on 9 October 2015Final dividend per share proposed
0.925p
0.925p
1.85p
0.85p
0.85p
1.70p
*restated due to 10:1 share split on 14 January 2015.
Subject to approval at the AGM, the final dividend will be paid on 15 January 2016 to members on the register at the close of business on 18 December 2015. Shares will be ex-dividend on 17 December 2015.
The Group profit from continuing activities before taxation was £17.5 million (2014: £16.6 million). After taxation charge of £3.8 million (2014: £3.7 million), the profit for the year is £13.7 million (2014: £12.9 million).
PENSIONSEstimates of the amount and timing of future funding obligations for the Group’s pension plans are based on various assumptions including, among other things, the actual and projected market performance of the pension plan assets, future long-term corporate bond yields, longevity of members and statutory requirements. The Group continued to make monthly payments to reduce the Group’s pension fund deficit, totalling
Group contributed £43,920 (2014: £41,000) in the UK for charitable purposes. Further details have been included with the Corporate Responsibility statement on page 24. There were no political donations during the year (2014: £Nil).
INVESTMENT PROPERTIESThe market value of the Group’s investment properties at 29 August 2015 exceeded their net book amount by approximately 429,000. The previous valuation in July 2011 for the majority of the investment properties was undertaken by independent, professionally qualified valuers. The Directors have reviewed the valuations and are satisfied there are no significant changes to the assumptions and the valuations.
SHARE CAPITALThe Company has a single class of share capital which is divided into Ordinary Shares of £0.025 each. The movement in the share capital during the year is detailed in note 25 to the financial statements.
In January 2015 the Company’s shareholders approved the split of the Company’s shares 10:1, which reduced the nominal value of the ordinary shares to 2.5 pence each.
At the last AGM the Directors received authority from the shareholders to:
Allot Shares – this gives Directors the authority to allot authorised but unissued shares and maintains the flexibility in respect of the Company’s financing arrangements. The nominal value of ordinary shares which the Directors may allot in the period up to the next AGM to be held on 5 January 2016, is limited to £737,865 which is equal to 33% of the nominal value of the issued share capital on 12 November 2014.
£2.3 million in the year, which are scheduled to end on 31 December 2015.
The Group continually reviews this risk and takes action to mitigate where possible. In addition, while the Group is consulted by the Trustees on the investment strategies of its pension plans, the Group has no direct control over these matters as the Trustees are directly responsible for the strategy.
Details of the Group’s pension plans are in note 24 in the Notes to the Financial Statements.
EMPLOYMENT POLICIES AND EMPLOYEESThe Company is committed to its employees and further details on the Company’s policies and commitment can be found in the Corporate Responsibility Report on pages 22 to 24.
ENVIRONMENTThe Company’s report on sustainability including carbon footprint and energy usage is on pages 23 and 24.
ACQUISITIONSOn 20 October 2014 Carrs Billington Agriculture (Sales) Ltd acquired the entire issued share capital of WM. Nicholls & Company (Crickhowell) Ltd, an agricultural merchant based in Crickhowell, Wales. For the cash consideration payable see note 27 on page 85.
On 12 June 2015, Carrs Billington Agriculture (Sales) Ltd acquired the entire issued share capital of Reid & Robertson Ltd, an agricultural merchant based in Balloch, Ayr and Oban, Scotland. For the cash consideration payable see note 27 on page 85.
POLITICAL AND CHARITABLE DONATIONSDuring the period ended 29 August 2015 the

38 CARR’S GROUP PLCANNUAL REPORT AND ACCOUNTS 2015
CORPORATE GOVERNANCE
The directors do not have any present intention of exercising this authority other than in connection with the issue of ordinary shares in respect of the Company’s share option plans. This authority will expire at the end of the AGM to be held on 5 January 2016.
Disapplication of rights of pre-emption – this disapplies rights of pre-emption on the allotment of shares by the Company and the sale by the Company of treasury shares. The authority will allow the Directors to allot equity securities for cash pursuant to the authority to allot shares mentioned above, and to sell treasury shares for cash, on a pro rata basis to existing shareholders (but subject to any exclusion or arrangements as the Directors consider necessary or expedient in relation to fractional entitlements, any legal, regulatory or practical problems or costs under the laws or regulations of any overseas territory or the requirements of any regulatory body or stock exchange) and otherwise on a pro rata basis up to an aggregate nominal amount of £111,798, representing 5% of the Company’s issued share capital as at 12 November 2014. This authority will expire at the end of the AGM to be held on 5 January 2016.
To buy own shares – this authority allows the Company to buy its own shares in the market, as permitted under the Articles of Association of the Company, up to a limit of 10% of the Company’s issued share capital. The price to be paid for any share must not be less than 0.25p, being the nominal value of a share, and must not exceed 105% of the average middle market quotations for the ordinary shares of the Company as derived from the London Stock Exchange Daily Official List for the 5 business days immediately preceding the day on which the ordinary shares are purchased. The Directors have no immediate plans to exercise the powers of the Company to purchase its own shares and undertaken that the authority would only be exercised if the Directors were satisfied that a purchase would result in an increase in expected earnings per share and was in the best interests of the Company at the time.
This authority will expire at the end of the AGM to be held on 5 January 2016. The Directors would consider holding any of its own shares that it purchases pursuant to this authority as treasury shares.
The interests of the Directors, as defined by the Companies Act 2006, in the ordinary shares of the Company, other than in respect of options to acquire ordinary shares (which are detailed in the analysis of options included in the Directors’ Remuneration Report on pages 30 to 35), are as follows:
RIGHTS AND OBLIGATIONS ATTACHING TO SHARESIn a general meeting of the Company, subject to the provisions of the Articles of Association and to any special rights or restrictions as to voting attached to any class of shares in the Company (of which they are none), the holders of the Ordinary Shares are entitled to one vote in a poll for every Ordinary Share held. No member shall be entitled to vote at any general meeting or class meeting in respect of any shares held if any call or other sum then payable in respect of that share remains unpaid. Currently all issued shares are fully paid.
Full details of the deadlines for exercising voting rights in respect of the resolutions to be considered at the AGM to be held on 5 January 2016 are set out in the Notice of AGM.
Subject to the provisions of the Companies Act 2006, the Company may, by ordinary resolution, declare a dividend to be paid to the members, but no dividend shall exceed the amount recommended by the Board. The Board may pay interim dividends, and also any fixed rate dividend, whenever the financial position of the Company, in the opinion of the Board, justifies its payment. All dividends shall be apportioned and paid pro rata according to the amounts paid up on the shares.
MAJOR SHAREHOLDERSThe Company has been informed of the following interests at 11 November 2015 in the 89,820,680 ordinary shares of the Company, as required by the Companies Act 2006:
Interest of the Directors
At 29 August 2015Ordinary
Shares
At 30 August 2014Ordinary
Shares
Tim DaviesNeil AustinChris HolmesRobert HeygateAlistair WannopJohn Worby
20,00020,000
1,252,500372,25022,61025,000
10,000*10,000*
1,252,500*372,250*22,610*
0
*restated due to 10:1 share split on 14 January 2015.
All the above interests are beneficial. There have been no other changes to the above interests in the period from 29 August 2015 to 11 November 2015.
Major Shareholders
Number of shares% of issued share
capital
Heygate & Sons Limited*T W G CharltonGoldman Sachs Securities (Nominees) Ltd (ILSEG)Rathbone Nominees LimitedHSBC Global Custody Nominee (UK) Limited
12,652,8705,100,0004,335,9403,644,9502,968,940
14.15.684.834.063.31
* Robert Heygate is a director of Heygate & Sons Ltd.
DIRECTORS’ REPORT CONTINUED
39CARR’S GROUP PLCANNUAL REPORT AND ACCOUNTS 2015
STR
ATEG
IC R
EPO
RT
CO
RPO
RATE
GO
VER
NAN
CE
FINAN
CIA
L STATE
MEN
TS
CHANGE OF CONTROLThere are no agreements that the Company considers significant and to which the Company is party that would take effect, alter or terminate upon change of control of the Company following a takeover bid, other than the following:
• TheCompanyispartytoanumberofbanking agreements which upon a change of control of the Company are terminable by the bank immediately.
DIRECTORS’ RESPONSIBILITIESThe Directors are responsible for preparing the Annual Report, the Directors’ Remuneration Report and the Financial Statements in accordance with applicable law and regulations.
RESPONSIBILITY FOR PREPARING FINANCIAL STATEMENTSCompany law requires the Directors to prepare financial statements for each financial period. Under that law the Directors have elected to prepare the Group and parent Company financial statements in accordance with International Financial Reporting Standards (IFRSs) as adopted by the European Union. Under company law the Directors must not approve the Financial Statements unless they are satisfied that they give a true and fair view of the state of affairs of the Group and the Company and of the profit or loss of the Group for that period. In preparing those Financial Statements, the Directors are required to:
• selectsuitableaccountingpoliciesandthenapply them consistently;
• makejudgementsandaccountingestimatesthat are reasonable and prudent;
• statewhetherapplicableIFRSsasadoptedby the European Union have been followed, subject to any material departures disclosed and explained in the financial statements;
•preparethefinancialstatementsonthegoingconcern basis, unless it is inappropriate to presume that the Company will continue in business.
The Directors are responsible for keeping adequate accounting records that are sufficient to show and explain the Company’s transactions and disclose with reasonable accuracy at any time the financial position of the Company and of the Group and enable them to ensure that the Financial Statements and Directors’ Remuneration Report comply with the Companies Act 2006 and, as regards the Group Financial Statements, Article 4 of the IAS Regulation. They are also responsible
for safeguarding the assets of the Company and the Group and hence for taking reasonable steps for the prevention and detection of fraud and other irregularities.
The Directors are responsible for the maintenance and integrity of the Company website. Legislation in the United Kingdom governing the preparation and dissemination of Financial Statements may differ from legislation in other jurisdictions.
DIRECTORS’ STATEMENT AS TO DISCLOSURE OF INFORMATION TO AUDITORSThe Directors who were members of the Board at the time of approving the Directors’ Report are listed on page 21. Having made enquiries of fellow Directors each of these Directors, at the date of this report, confirms that:
• heisawarethereisnorelevantauditinformation of which the Company’s auditors are unaware; and
• hehastakenallthestepsthatheoughtto have taken as a Director in order to make himself aware of any relevant audit information and to establish that the Company’s auditors are aware of that information.
RESPONSIBILITY STATEMENTEach of the Directors, whose names and functions are listed on page 21 confirm that, to the best of their knowledge:
• theGroupFinancialStatements,whichhavebeen prepared in accordance with IFRSs as adopted by the EU, give a true and fair view of the assets, liabilities, financial position and profit of the Group;
• theChiefExecutive’sReviewincludesafairreview of the development and performance of the business and the position of the Group; and
• theRiskManagementreviewprovidesa description of the principal risks and uncertainties that the Company faces.
By Order of the Board
KATIE SINCLAIRCompany Secretary11 November 2015

40 CARR’S GROUP PLCANNUAL REPORT AND ACCOUNTS 2015
FINANCIAL STATEMENTS
INDEPENDENT AUDITORS’ REPORTTO THE MEMBERS OF CARR’S GROUP PLCREPORT ON THE FINANCIAL STATEMENTSOur opinionIn our opinion:• Carr’s Group plc’s Group financial statements
and Company financial statements (the “financial statements”) give a true and fair view of the state of the Group’s and of the Company’s affairs as at 29 August 2015 and of the Group’s profit and the Group’s and the Company’s cash flows for the year then ended;
• theGroupfinancialstatementshavebeenproperly prepared in accordance with International Financial Reporting Standards (“IFRSs”) as adopted by the European Union;
• theCompanyfinancialstatementshavebeenproperly prepared in accordance with IFRSs as adopted by the European Union and as applied in accordance with the provisions of the Companies Act 2006; and
Overview •OverallGroupmateriality:£875,000whichrepresents5%ofprofitbeforetax.
•Auditofcompletefinancialinformationoftwofinanciallysignificantreportingunitsandthree
significant risk reporting units.•Specifiedauditproceduresoverfourotherreportingunits.•ReportingunitslocatedinUK,USAandGermanyvisited.
•Fraudriskinrevenuerecognition.•Definedbenefitpensionschemesurplus.•Receivableprovisioning.
Materiality
Audit scope
Area of focus
• thefinancialstatementshavebeenpreparedin accordance with the requirements of the Companies Act 2006 and, as regards the Group financial statements, Article 4 of the IAS Regulation.
What we have auditedThe financial statements, included within the Annual Report and Accounts (the “Annual Report”), comprise:• theConsolidatedandCompanyBalance
Sheets as at 29 August 2015;• theConsolidatedIncomeStatementand
Consolidated and Company Statements of Comprehensive Income for the year then ended;
• theConsolidatedStatementofChangesinEquity for the year then ended;
• theCompanyStatementofChangesinEquityfor the year then ended;
• theConsolidatedandCompanyStatementsofCash Flows for the year then ended;
• thePrincipalAccountingPolicies;and• theNotestotheFinancialStatements,which
include other explanatory information.
Certain required disclosures have been presented elsewhere in the Annual Report, rather than in the notes to the financial statements. These are cross-referenced from the financial statements and are identified as audited.
The financial reporting framework that has been applied in the preparation of the financial statements is applicable law and IFRSs as adopted by the European Union and, as regards the Company financial statements, as applied in accordance with the provisions of the Companies Act 2006.
The scope of our audit and our areas of focusWe conducted our audit in accordance with International Standards on Auditing (UK and Ireland) (“ISAs (UK & Ireland)”).
We designed our audit by determining materiality and assessing the risks of material misstatement in the financial statements. In particular, we looked at where the Directors made subjective judgements, for example in respect of significant accounting estimates that
involved making assumptions and considering future events that are inherently uncertain. As in all of our audits we also addressed the risk of management override of internal controls, including evaluating whether there was evidence of bias by the directors that represented a risk of material misstatement due to fraud.
The risks of material misstatement that had the greatest effect on our audit, including the allocation of our resources and effort, are
identified as “areas of focus” in the table below. We have also set out how we tailored our audit to address these specific areas in order to provide an opinion on the financial statements as a whole, and any comments we make on the results of our procedures should be read in this context. This is not a complete list of all risks identified by our audit.
OUR AUDIT APPROACH
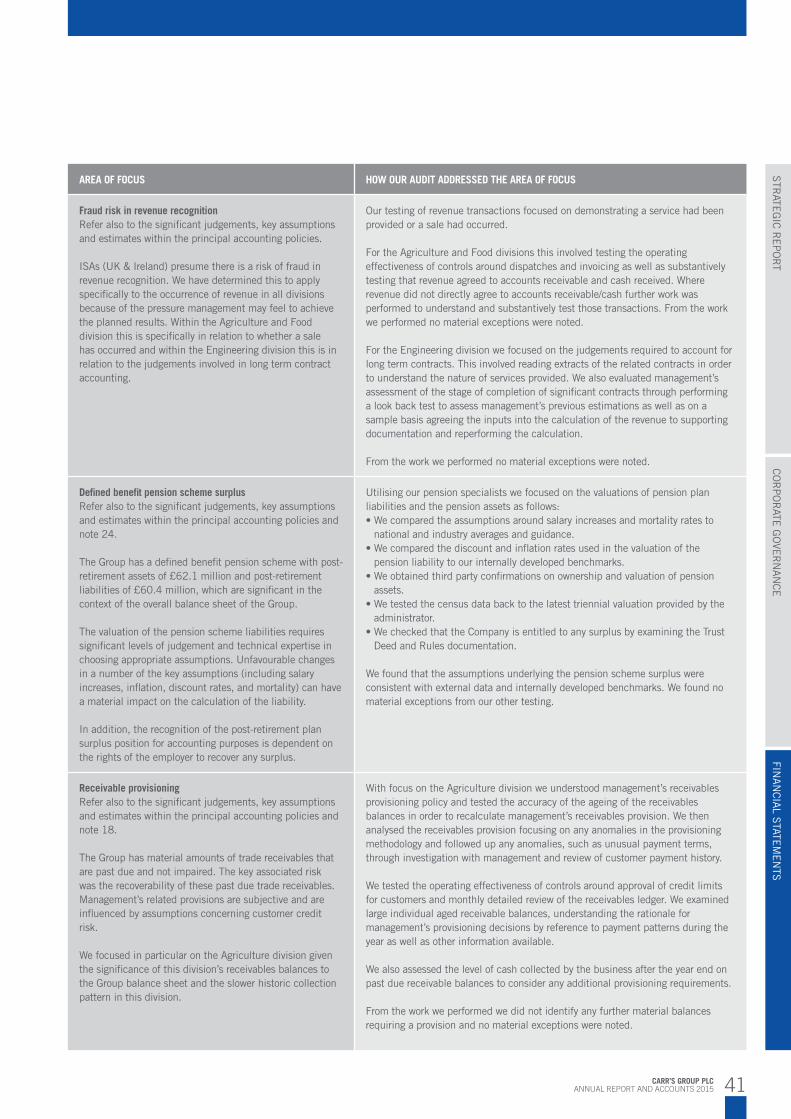
41CARR’S GROUP PLCANNUAL REPORT AND ACCOUNTS 2015
STR
ATEG
IC R
EPO
RT
CO
RPO
RATE
GO
VER
NAN
CE
FINAN
CIA
L STATE
MEN
TS
AREA OF FOCUS HOW OUR AUDIT ADDRESSED THE AREA OF FOCUS
Fraud risk in revenue recognitionRefer also to the significant judgements, key assumptions and estimates within the principal accounting policies.
ISAs (UK & Ireland) presume there is a risk of fraud in revenue recognition. We have determined this to apply specifically to the occurrence of revenue in all divisions because of the pressure management may feel to achieve the planned results. Within the Agriculture and Food division this is specifically in relation to whether a sale has occurred and within the Engineering division this is in relation to the judgements involved in long term contract accounting.
Our testing of revenue transactions focused on demonstrating a service had been provided or a sale had occurred.
For the Agriculture and Food divisions this involved testing the operating effectiveness of controls around dispatches and invoicing as well as substantively testing that revenue agreed to accounts receivable and cash received. Where revenue did not directly agree to accounts receivable/cash further work was performed to understand and substantively test those transactions. From the work we performed no material exceptions were noted.
For the Engineering division we focused on the judgements required to account for long term contracts. This involved reading extracts of the related contracts in order to understand the nature of services provided. We also evaluated management’s assessment of the stage of completion of significant contracts through performing a look back test to assess management’s previous estimations as well as on a sample basis agreeing the inputs into the calculation of the revenue to supporting documentation and reperforming the calculation.
From the work we performed no material exceptions were noted.
Defined benefit pension scheme surplusRefer also to the significant judgements, key assumptions and estimates within the principal accounting policies and note 24.
The Group has a defined benefit pension scheme with post-retirement assets of £62.1 million and post-retirement liabilities of £60.4 million, which are significant in the context of the overall balance sheet of the Group.
The valuation of the pension scheme liabilities requires significant levels of judgement and technical expertise in choosing appropriate assumptions. Unfavourable changes in a number of the key assumptions (including salary increases, inflation, discount rates, and mortality) can have a material impact on the calculation of the liability.
In addition, the recognition of the post-retirement plan surplus position for accounting purposes is dependent on the rights of the employer to recover any surplus.
Utilising our pension specialists we focused on the valuations of pension plan liabilities and the pension assets as follows:•Wecomparedtheassumptionsaroundsalaryincreasesandmortalityratesto
national and industry averages and guidance.•Wecomparedthediscountandinflationratesusedinthevaluationofthe
pension liability to our internally developed benchmarks.•Weobtainedthirdpartyconfirmationsonownershipandvaluationofpension
assets.•Wetestedthecensusdatabacktothelatesttriennialvaluationprovidedbythe
administrator.•WecheckedthattheCompanyisentitledtoanysurplusbyexaminingtheTrust
Deed and Rules documentation.
We found that the assumptions underlying the pension scheme surplus were consistent with external data and internally developed benchmarks. We found no material exceptions from our other testing.
Receivable provisioningRefer also to the significant judgements, key assumptions and estimates within the principal accounting policies and note 18.
The Group has material amounts of trade receivables that are past due and not impaired. The key associated risk was the recoverability of these past due trade receivables. Management’s related provisions are subjective and are influenced by assumptions concerning customer credit risk.
We focused in particular on the Agriculture division given the significance of this division’s receivables balances to the Group balance sheet and the slower historic collection pattern in this division.
With focus on the Agriculture division we understood management’s receivables provisioning policy and tested the accuracy of the ageing of the receivables balances in order to recalculate management’s receivables provision. We then analysed the receivables provision focusing on any anomalies in the provisioning methodology and followed up any anomalies, such as unusual payment terms, through investigation with management and review of customer payment history.
We tested the operating effectiveness of controls around approval of credit limits for customers and monthly detailed review of the receivables ledger. We examined large individual aged receivable balances, understanding the rationale for management’s provisioning decisions by reference to payment patterns during the year as well as other information available.
We also assessed the level of cash collected by the business after the year end on past due receivable balances to consider any additional provisioning requirements.
From the work we performed we did not identify any further material balances requiring a provision and no material exceptions were noted.

42 CARR’S GROUP PLCANNUAL REPORT AND ACCOUNTS 2015
FINANCIAL STATEMENTS
Overall Group materiality
£875,000 (2014: £830,000).
How we determined it
5% of profit before tax.
Rationale for benchmark applied
We believe that profit before tax is the primary measure used by the shareholders in assessing the performance of the Group, and is a generally accepted auditing benchmark.
Reporting unit materiality
For each reporting unit in our audit scope, we allocated a materiality that was less than our overall Group materiality. The range of materiality allocated across reporting units was between £111,000 and £800,000.
How we tailored the audit scopeWe tailored the scope of our audit to ensure that we performed enough work to be able to give an opinion on the financial statements as a whole, taking into account the geographic structure of the Group, the accounting processes and controls, and the industry in which the Group operates. The Group is structured in three business divisions, Agriculture, Food and Engineering. The Group financial statements are a consolidation of 16 reporting units, comprising the Group’s operating businesses within these business divisions. The Group operates mainly in the UK but has a global presence particularly in the USA and Germany.
Within the Agriculture division significant operations include subsidiaries Carrs Billington Agriculture (Sales) Limited and Carrs Agriculture Limited as well as an associate Carrs Billington Agriculture (Operations) Limited all located within the UK. Within Food the largest operation is Carr’s Flour Mills Limited again located in the UK. Finally within the Engineering division Wälischmiller Engineering GmbH, located in Germany, is the largest operation.
The Group also has centralised functions such as a treasury function and a payroll function which includes the pension scheme administration, all performed by the Company.
We identified five reporting units, being those named above within the Agriculture and Food divisions alongside the Company, which in our view required an audit of their complete financial information. Two of these reporting units were deemed financially significant and the other three were selected for particular risk characteristics, which included coverage of the risks relating to pension assumptions and fraud in revenue recognition, and of the profit from the associate.
Specific audit procedures on certain balances and transactions were performed on four further reporting units, including those based in the USA and Germany, in order to gain coverage of individually material financial statement line items.
The Senior Statutory Auditor visited six of the nine reporting units located in both the UK and in Germany. For another two he attended the clearance meeting, one of which was via conference call in respect of the associate Carrs Billington Agriculture (Operations) Limited which was audited by another firm operating under our instruction. The final reporting unit based in the US was visited by a senior member of the audit team.
statements were signed. As part of our audit we have concluded that the Directors’ use of the going concern basis in preparing the financial statements is appropriate.
However, because not all future events or conditions can be predicted, these statements are not a guarantee as to the Group’s and Company’s ability to continue as a going concern.
OTHER REQUIRED REPORTINGConsistency of other information
Companies Act 2006 opinionsIn our opinion:• theinformationgivenintheStrategicReport
and the Directors’ Report for the financial year for which the financial statements are prepared is consistent with the financial statements; and
These nine reporting units accounted for 88% of Group revenue and 63% of Group profit before tax.
MaterialityThe scope of our audit was influenced by our application of materiality. We set certain quantitative thresholds for materiality. These, together with qualitative considerations, helped us to determine the scope of our audit and the nature, timing and extent of our audit procedures on the individual financial statement line items and disclosures and in evaluating the effect of misstatements, both individually and on the financial statements as a whole.
Based on our professional judgement, we determined materiality for the financial statements as a whole as follows:
We agreed with the Audit Committee that we would report to them misstatements identified during our audit above £44,000 (2014: £42,000) as well as misstatements below that amount that, in our view, warranted reporting for qualitative reasons.
Going concernUnder the Listing Rules we are required to review the Directors’ statement, set out on page 27, in relation to going concern. We have nothing to report having performed our review.
As noted in the Directors’ statement, the Directors have concluded that it is appropriate to prepare the financial statements using the going concern basis of accounting. The going concern basis presumes that the Group and Company have adequate resources to remain in operation, and that the Directors intend them to do so, for at least one year from the date the financial
• theinformationgivenintheCorporateGovernance Statement set out on pages 25 to 27 with respect to internal control and risk management systems and about share capital structures is consistent with the financial statements.
INDEPENDENT AUDITORS’ REPORTTO THE MEMBERS OF CARR’S GROUP PLC CONTINUED

43CARR’S GROUP PLCANNUAL REPORT AND ACCOUNTS 2015
STR
ATEG
IC R
EPO
RT
CO
RPO
RATE
GO
VER
NAN
CE
FINAN
CIA
L STATE
MEN
TS
ISAs (UK & Ireland) reportingUnder ISAs (UK & Ireland) we are required to report to you if, in our opinion:
• InformationintheAnnualReportis: − materially inconsistent with the information in the audited financial statements; or − apparently materially incorrect based on, or materially inconsistent with, our knowledge of the Group and Company
acquired in the course of performing our audit; or − otherwise misleading.
We have no exceptions to report.
• the statement given by the Directors on page 27, in accordance with provision C.1.1 of the UK Corporate Governance Code (the ‘Code’), that they consider the Annual Report taken as a whole to be fair, balanced and understandable and provides the information necessary for members to assess the Group’s and Company’s performance, business model and strategy is materially inconsistent with our knowledge of the Group and Company acquired in the course of performing our audit.
We have no exceptions to report.
• thesectionoftheAnnualReportonpages28to29,asrequiredbyprovisionC.3.8oftheCode,describingtheworkofthe Audit Committee does not appropriately address matters communicated by us to the Audit Committee.
We have no exceptions to report.
Adequacy of accounting records and information and explanations receivedUnder the Companies Act 2006 we are required to report to you if, in our opinion:• wehavenotreceivedalltheinformationand
explanations we require for our audit; or• adequateaccountingrecordshavenotbeen
kept by the Company, or returns adequate for our audit have not been received from branches not visited by us; or
• theCompanyfinancialstatementsandthepart of the Directors’ Remuneration Report to be audited are not in agreement with the accounting records and returns.
We have no exceptions to report arising from this responsibility.
Directors’ remunerationDirectors’ Remuneration Report – Companies Act 2006 opinionIn our opinion, the part of the Directors’ Remuneration Report to be audited has been properly prepared in accordance with the Companies Act 2006.
Other Companies Act 2006 reportingUnder the Companies Act 2006 we are required to report to you if, in our opinion, certain disclosures of Directors’ remuneration specified by law are not made. We have no exceptions to report arising from this responsibility.
Corporate Governance StatementUnder the Companies Act 2006 we are required to report to you if, in our opinion, a Corporate Governance Statement has not been prepared by the Company. We have no exceptions to report arising from this responsibility.
Under the Listing Rules we are required to review the part of the Corporate Governance
Statement relating to ten provisions of the Code. We have nothing to report having performed our review.
RESPONSIBILITIES FOR THE FINANCIAL STATEMENTS AND THE AUDITOur responsibilities and those of the DirectorsAs explained more fully in the Directors’ Responsibilities set out on page 39, the Directors are responsible for the preparation of the financial statements and for being satisfied that they give a true and fair view.
Our responsibility is to audit and express an opinion on the financial statements in accordance with applicable law and ISAs (UK & Ireland). Those standards require us to comply with the Auditing Practices Board’s Ethical Standards for Auditors.
This report, including the opinions, has been prepared for and only for the Company’s members as a body in accordance with Chapter 3 of Part 16 of the Companies Act 2006 and for no other purpose. We do not, in giving these opinions, accept or assume responsibility for any other purpose or to any other person to whom this report is shown or into whose hands it may come save where expressly agreed by our prior consent in writing.
What an audit of financial statements involvesAn audit involves obtaining evidence about the amounts and disclosures in the financial statements sufficient to give reasonable assurance that the financial statements are free from material misstatement, whether caused by fraud or error. This includes an assessment of: • whethertheaccountingpoliciesare
appropriate to the Group’s and the Company’s circumstances and have been consistently applied and adequately disclosed;
• thereasonablenessofsignificantaccountingestimates made by the Directors; and
• theoverallpresentationofthefinancialstatements.
We primarily focus our work in these areas by assessing the Directors’ judgements against available evidence, forming our own judgements, and evaluating the disclosures in the financial statements.
We test and examine information, using sampling and other auditing techniques, to the extent we consider necessary to provide a reasonable basis for us to draw conclusions. We obtain audit evidence through testing the effectiveness of controls, substantive procedures or a combination of both.
In addition, we read all the financial and non-financial information in the Annual Report to identify material inconsistencies with the audited financial statements and to identify any information that is apparently materially incorrect based on, or materially inconsistent with, the knowledge acquired by us in the course of performing the audit. If we become aware of any apparent material misstatements or inconsistencies we consider the implications for our report.
BILL MACLEOD (Senior Statutory Auditor)for and on behalf of PricewaterhouseCoopers LLPChartered Accountants and Statutory AuditorsNewcastle upon Tyne11 November 2015
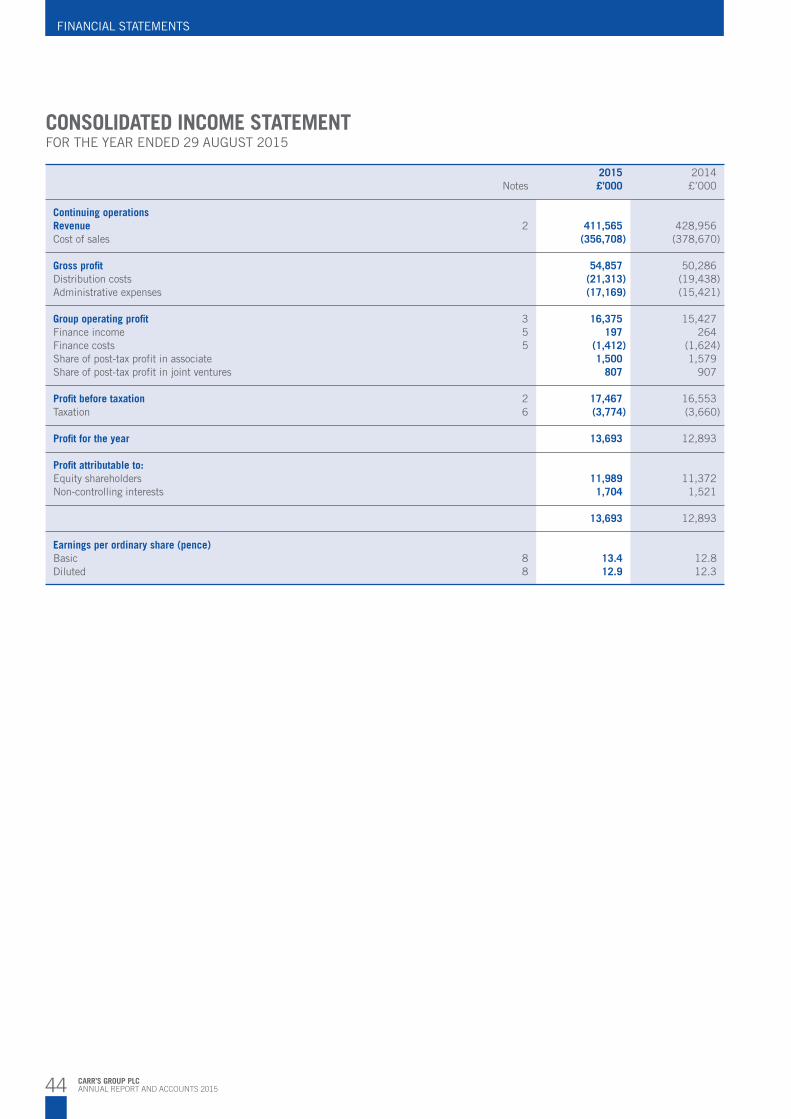
44 CARR’S GROUP PLCANNUAL REPORT AND ACCOUNTS 2015
FINANCIAL STATEMENTS
2015 2014 Notes £’000 £’000
Continuing operations Revenue 2 411,565 428,956Cost of sales (356,708) (378,670)
Gross profit 54,857 50,286Distribution costs (21,313) (19,438)Administrative expenses (17,169) (15,421)
Group operating profit 3 16,375 15,427Finance income 5 197 264Finance costs 5 (1,412) (1,624)Share of post-tax profit in associate 1,500 1,579Share of post-tax profit in joint ventures 807 907
Profit before taxation 2 17,467 16,553Taxation 6 (3,774) (3,660)
Profit for the year 13,693 12,893
Profit attributable to:Equity shareholders 11,989 11,372Non-controlling interests 1,704 1,521
13,693 12,893
Earnings per ordinary share (pence) Basic 8 13.4 12.8 Diluted 8 12.9 12.3
CONSOLIDATED INCOME STATEMENTFOR THE YEAR ENDED 29 AUGUST 2015

45CARR’S GROUP PLCANNUAL REPORT AND ACCOUNTS 2015
STR
ATEG
IC R
EPO
RT
CO
RPO
RATE
GO
VER
NAN
CE
FINAN
CIA
L STATE
MEN
TS
Group Company 2015 2014 2015 2014 Notes £’000 £’000 £’000 £’000
Profit for the year 13,693 12,893 2,870 2,021
Other comprehensive income/(expense)
Items that may be reclassified subsequently to profit or loss:Foreign exchange translation gains/(losses) arising on translation of overseas subsidiaries 20 (950) — —
Items that will not be reclassified subsequently to profit or loss:Actuarial (losses)/gains on retirement benefit obligation: – Group 24 (2,848) 3,209 (2,848) 3,209 – Share of associate 70 (619) — —
Taxation credit/(charge) on actuarial (losses)/gains on retirement benefit obligation: – Group 16 570 (642) 570 (642) – Share of associate (14) 124 — —
Other comprehensive (expense)/income for the year, net of tax (2,202) 1,122 (2,278) 2,567
Total comprehensive income for the year 11,491 14,015 592 4,588
Total comprehensive income attributable to:Equity shareholders 9,787 12,494 592 4,588Non-controlling interests 1,704 1,521 — —
11,491 14,015 592 4,588
CONSOLIDATED AND COMPANY STATEMENTS OF COMPREHENSIVE INCOME FOR THE YEAR ENDED 29 AUGUST 2015

46 CARR’S GROUP PLCANNUAL REPORT AND ACCOUNTS 2015
FINANCIAL STATEMENTS
Group Company 2015 2014 2015 2014 Notes £’000 £’000 £’000 £’000
AssetsNon-current assets Goodwill 9 10,849 9,798 — —Other intangible assets 9 448 499 — —Property, plant and equipment 10 58,385 56,626 — —Investment property 11 636 656 — —Investment in subsidiary undertakings 12,15 — — 12,205 12,755Investment in associate 12,13 8,439 6,883 245 245Interest in joint ventures 12,14 5,012 4,836 272 272Other investments 12 79 77 — —Financial assets – Non-current receivables 18 50 501 — 500Retirement benefit asset 24 1,767 2,056 1,767 2,056Deferred tax assets 16 861 1,507 3 3
86,526 83,439 14,492 15,831
Current assetsInventories 17 35,031 33,315 — —Trade and other receivables 18 64,454 63,623 36,845 33,812Current tax assets 19 839 47 1,564 1,192Financial assets– Derivative financial instruments 23 50 — 30 —– Cash and cash equivalents 20 16,488 17,268 8,973 8,822
116,862 114,253 47,412 43,826
Total assets 203,388 197,692 61,904 59,657
LiabilitiesCurrent liabilitiesFinancial liabilities – Borrowings 22 (15,157) (19,688) (690) (1,553)– Derivative financial instruments 23 (72) (15) — —Trade and other payables 21 (54,496) (54,236) (1,915) (1,302)Current tax liabilities (472) (1,631) — —
(70,197) (75,570) (2,605) (2,855)
Non-current liabilitiesFinancial liabilities– Borrowings 22 (25,744) (22,189) (16,414) (12,047)Deferred tax liabilities 16 (4,184) (4,111) (353) (412)Other non-current liabilities 21 (4,300) (5,995) — —
(34,228) (32,295) (16,767) (12,459)
Total liabilities (104,425) (107,865) (19,372) (15,314)
Net assets 98,963 89,827 42,532 44,343
Shareholders’ equityShare capital 25 2,244 2,235 2,244 2,235Share premium 8,615 8,453 8,615 8,453Equity compensation reserve 1,138 640 1,239 699Foreign exchange reserve (515) (535) — —Other reserve 862 875 — —Retained earnings 74,706 67,996 30,434 32,956
Total shareholders’ equity 87,050 79,664 42,532 44,343Non-controlling interests 11,913 10,163 — —
Total equity 98,963 89,827 42,532 44,343
The financial statements set out on pages 44 to 91 were approved by the Board on 11 November 2015 and signed on its behalf by:
Tim J Davies Neil Austin
CONSOLIDATED AND COMPANY BALANCE SHEETSAS AT 29 AUGUST 2015

47CARR’S GROUP PLCANNUAL REPORT AND ACCOUNTS 2015
STR
ATEG
IC R
EPO
RT
CO
RPO
RATE
GO
VER
NAN
CE
FINAN
CIA
L STATE
MEN
TS
Equity Foreign Total Non- Share Share Compensation Exchange Other Retained Shareholders’ controlling Total Capital Premium Reserve Reserve Reserve Earnings Equity Interests Equity £’000 £’000 £’000 £’000 £’000 £’000 £’000 £’000 £’000
At 1 September 2013 2,223 8,183 326 415 888 57,396 69,431 8,610 78,041
Profit for the year — — — — — 11,372 11,372 1,521 12,893Other comprehensive (expense)/income — — — (950) — 2,072 1,122 — 1,122
Total comprehensive (expense)/income — — — (950) — 13,444 12,494 1,521 14,015Dividends paid — — — — — (2,912) (2,912) — (2,912)Equity settled share- based payment transactions, net of tax — — 314 — — 55 369 32 401Allotment of shares 12 270 — — — — 282 — 282Transfer — — — — (13) 13 — — —
At 30 August 2014 2,235 8,453 640 (535) 875 67,996 79,664 10,163 89,827
At 31 August 2014 2,235 8,453 640 (535) 875 67,996 79,664 10,163 89,827
Profit for the year — — — — — 11,989 11,989 1,704 13,693Other comprehensive income/(expense) — — — 20 — (2,222) (2,202) — (2,202)
Total comprehensive income/(expense) — — — 20 — 9,767 9,787 1,704 11,491Dividends paid — — — — — (3,110) (3,110) — (3,110)Equity settled share- based payment transactions, net of tax — — 498 — — 40 538 46 584Allotment of shares 9 162 — — — — 171 — 171Transfer — — — — (13) 13 — — —
At 29 August 2015 2,244 8,615 1,138 (515) 862 74,706 87,050 11,913 98,963
The equity compensation reserve reflects the cumulative accounting impact, at the balance sheet date, of the fair value of the share schemes over the vesting periods. The movement on the equity compensation reserve is taken through the consolidated income statement. During the year £40,000 (2014: £55,000) was transferred from the equity compensation reserve to retained earnings in respect of options exercised in the year.
The Group has opted to use previous revaluations of property made under UK GAAP as deemed cost. On adoption of IFRS the revaluation reserve was reclassified to other reserves.
CONSOLIDATED STATEMENT OF CHANGES IN EQUITYFOR THE YEAR ENDED 29 AUGUST 2015
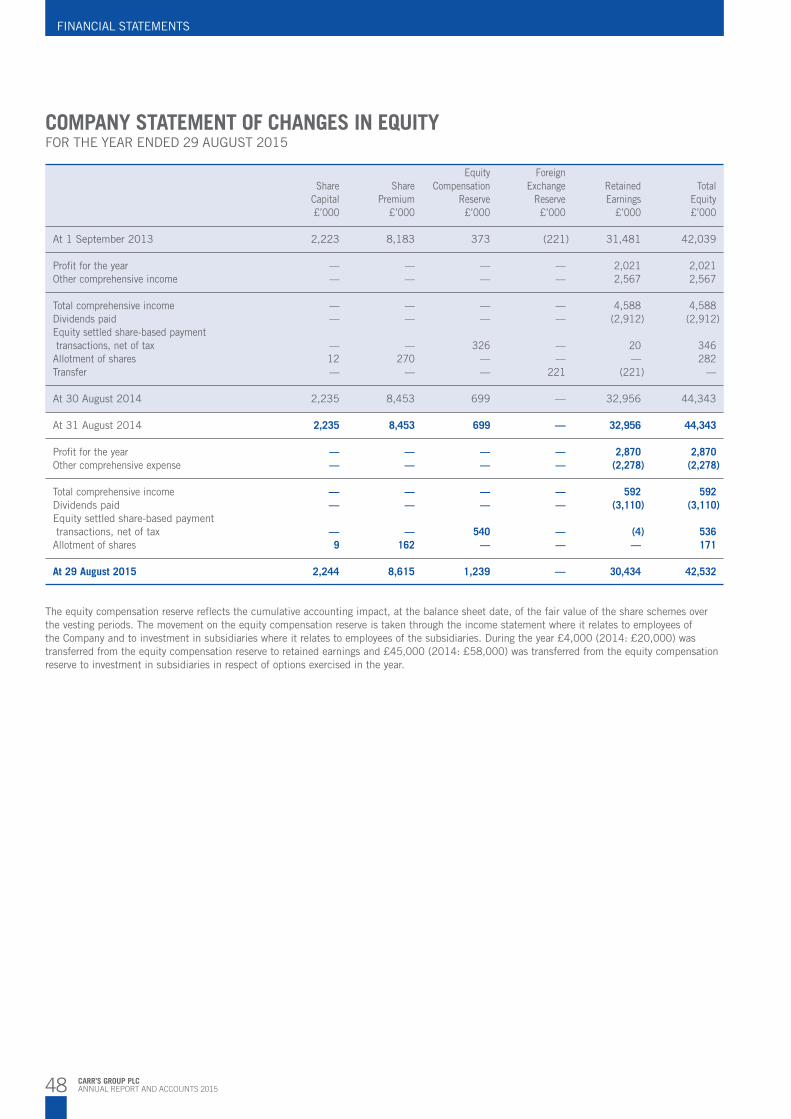
48 CARR’S GROUP PLCANNUAL REPORT AND ACCOUNTS 2015
FINANCIAL STATEMENTS
Equity Foreign Share Share Compensation Exchange Retained Total Capital Premium Reserve Reserve Earnings Equity £’000 £’000 £’000 £’000 £’000 £’000
At 1 September 2013 2,223 8,183 373 (221) 31,481 42,039
Profit for the year — — — — 2,021 2,021Other comprehensive income — — — — 2,567 2,567
Total comprehensive income — — — — 4,588 4,588Dividends paid — — — — (2,912) (2,912)Equity settled share-based payment transactions, net of tax — — 326 — 20 346Allotment of shares 12 270 — — — 282Transfer — — — 221 (221) —
At 30 August 2014 2,235 8,453 699 — 32,956 44,343
At 31 August 2014 2,235 8,453 699 — 32,956 44,343
Profit for the year — — — — 2,870 2,870Other comprehensive expense — — — — (2,278) (2,278)
Total comprehensive income — — — — 592 592Dividends paid — — — — (3,110) (3,110)Equity settled share-based payment transactions, net of tax — — 540 — (4) 536Allotment of shares 9 162 — — — 171
At 29 August 2015 2,244 8,615 1,239 — 30,434 42,532
The equity compensation reserve reflects the cumulative accounting impact, at the balance sheet date, of the fair value of the share schemes over the vesting periods. The movement on the equity compensation reserve is taken through the income statement where it relates to employees of the Company and to investment in subsidiaries where it relates to employees of the subsidiaries. During the year £4,000 (2014: £20,000) was transferred from the equity compensation reserve to retained earnings and £45,000 (2014: £58,000) was transferred from the equity compensation reserve to investment in subsidiaries in respect of options exercised in the year.
COMPANY STATEMENT OF CHANGES IN EQUITYFOR THE YEAR ENDED 29 AUGUST 2015
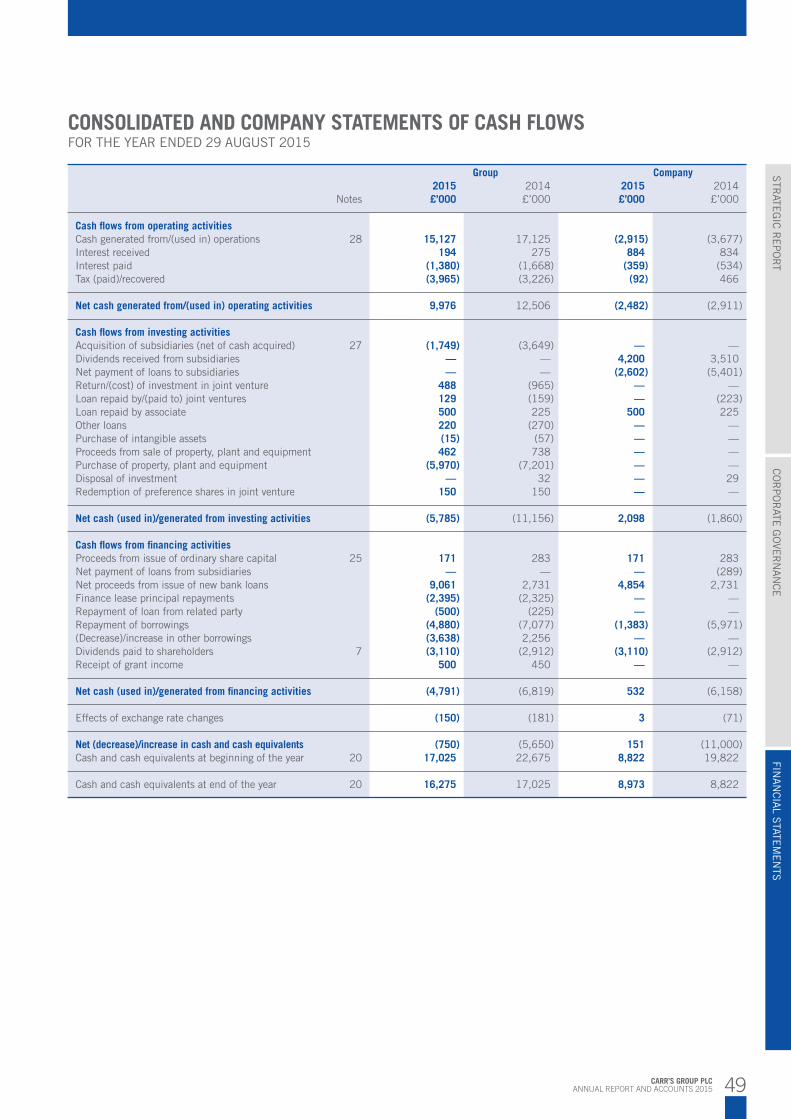
49CARR’S GROUP PLCANNUAL REPORT AND ACCOUNTS 2015
STR
ATEG
IC R
EPO
RT
CO
RPO
RATE
GO
VER
NAN
CE
FINAN
CIA
L STATE
MEN
TS
Group Company 2015 2014 2015 2014 Notes £’000 £’000 £’000 £’000
Cash flows from operating activitiesCash generated from/(used in) operations 28 15,127 17,125 (2,915) (3,677)Interest received 194 275 884 834Interest paid (1,380) (1,668) (359) (534)Tax (paid)/recovered (3,965) (3,226) (92) 466
Net cash generated from/(used in) operating activities 9,976 12,506 (2,482) (2,911)
Cash flows from investing activitiesAcquisition of subsidiaries (net of cash acquired) 27 (1,749) (3,649) — —Dividends received from subsidiaries — — 4,200 3,510Net payment of loans to subsidiaries — — (2,602) (5,401)Return/(cost) of investment in joint venture 488 (965) — —Loan repaid by/(paid to) joint ventures 129 (159) — (223)Loan repaid by associate 500 225 500 225Other loans 220 (270) — —Purchase of intangible assets (15) (57) — —Proceeds from sale of property, plant and equipment 462 738 — —Purchase of property, plant and equipment (5,970) (7,201) — —Disposal of investment — 32 — 29Redemption of preference shares in joint venture 150 150 — —
Net cash (used in)/generated from investing activities (5,785) (11,156) 2,098 (1,860)
Cash flows from financing activitiesProceeds from issue of ordinary share capital 25 171 283 171 283Net payment of loans from subsidiaries — — — (289)Net proceeds from issue of new bank loans 9,061 2,731 4,854 2,731Finance lease principal repayments (2,395) (2,325) — —Repayment of loan from related party (500) (225) — —Repayment of borrowings (4,880) (7,077) (1,383) (5,971)(Decrease)/increase in other borrowings (3,638) 2,256 — —Dividends paid to shareholders 7 (3,110) (2,912) (3,110) (2,912)Receipt of grant income 500 450 — —
Net cash (used in)/generated from financing activities (4,791) (6,819) 532 (6,158)
Effects of exchange rate changes (150) (181) 3 (71)
Net (decrease)/increase in cash and cash equivalents (750) (5,650) 151 (11,000)Cash and cash equivalents at beginning of the year 20 17,025 22,675 8,822 19,822
Cash and cash equivalents at end of the year 20 16,275 17,025 8,973 8,822
CONSOLIDATED AND COMPANY STATEMENTS OF CASH FLOWSFOR THE YEAR ENDED 29 AUGUST 2015
50 CARR’S GROUP PLCANNUAL REPORT AND ACCOUNTS 2015
FINANCIAL STATEMENTS
PRINCIPAL ACCOUNTING POLICIES
BASIS OF ACCOUNTINGThe consolidated financial statements are prepared on a going concern basis in accordance with International Financial Reporting Standards (IFRSs) and International Financial Reporting Standards Interpretation Committee (IFRS IC) interpretations endorsed by the European Union (EU) and with those parts of the Companies Act 2006 applicable to companies reporting under IFRS.
The Company is a public limited company incorporated and domiciled in England and Wales whose shares are listed and traded on the London Stock Exchange. The address of its registered office is Old Croft, Stanwix, Carlisle, CA3 9BA.
The preparation of financial statements in conformity with generally accepted accounting principles requires the use of estimates and assumptions that affect the reported amounts of assets and liabilities at the date of the financial statements and the reported amounts of revenues and expenses during the reporting year. Although these estimates are based on management’s best knowledge of the amount, event or actions, actual results ultimately may differ materially from the estimates.
Accounting policies have been applied consistently, other than where new policies have been adopted.
The consolidated financial statements are prepared under the historic cost convention as modified by the revaluation of financial assets and financial liabilities (including derivative financial instruments) at fair value through profit or loss.
BASIS OF CONSOLIDATIONThe consolidated financial statements comprise Carr’s Group plc and all its subsidiaries, together with the Group’s share of the results of its associate and joint ventures. The financial information of the subsidiaries, associate and joint ventures is prepared as of the same reporting date and consolidated using consistent accounting policies. Group inter-company balances and transactions, including any unrealised profits arising from Group inter-company transactions, are eliminated in full. Profits and losses on transactions with the associate and joint ventures are recognised in the consolidated income statement.
Results of subsidiary undertakings acquired during the current and prior financial year were included in the financial statements from the effective date of control. The separable net assets, both tangible and intangible, of the acquired subsidiary undertakings were incorporated into the financial statements on the basis of the fair value as at the effective date of the Group acquiring control.
IFRS 10 introduces a new definition of control which could affect whether an entity is consolidated into the Group accounts. An investor controls an investee when it is exposed, or has right, to variable returns from its involvement with the investee and has the ability to affect those returns through its power over the investee. Control requires power over the investee, exposure, or rights, to variable returns and the ability to use power to affect returns.
Subsidiaries are entities that meet the new definition of control. Subsidiaries are consolidated from the date on which control is transferred to the Group and are included until the date on which the Group ceases to control them.
Associates are entities over which the Group has significant influence but not control, generally accompanied by a share of between 20% and 50% of the voting rights. Joint ventures are entities over which the Group has joint control, established by contractual agreement. Investments in associates and joint ventures are accounted for using the equity method. The Group’s share of its associate and joint ventures’ post-tax
profits or losses are recognised in the income statement, and its share of movement in reserves is recognised in reserves. The cumulative movements are adjusted against the carrying amount of the investment. The Group’s investment in associate and joint ventures includes any goodwill arising on acquisition. If the Group’s share of losses in an associate or joint venture equals or exceeds its investment in the associate or joint venture, the Group does not recognise further losses, unless it has incurred obligations or made payments on behalf of the associate or joint venture.
All subsidiaries are accounted for by applying the purchase method. The cost of a business combination is measured as the aggregate of the fair values, at the acquisition date, of the assets given, liabilities incurred or assumed, and equity instruments issued by the Group. The identifiable assets, liabilities and contingent liabilities of the acquiree are measured initially at fair value at the acquisition date, irrespective of the extent of any non-controlling interest. The excess of the cost of the business combination over the Group’s interest in the net fair value of the identifiable assets, liabilities and contingent liabilities is recognised as goodwill.
Acquisition related costs are expensed to the consolidated income statement in the year they are incurred.
The Group applies a policy of treating transactions with non-controlling interests as transactions with parties external to the Group.
EMPLOYEE SHARE TRUSTIFRS 10 requires that the Group consolidate a structured entity where the substance of the relationship between the parties indicates that the Group controls the entity. The employee share trust sponsored by the Group falls within this category of structured entity and has been accounted for as if it were, in substance, a subsidiary.
CURRENCY TRANSLATIONThe financial statements for the Group’s subsidiaries, associate and joint ventures are prepared using their functional currency. The functional currency is the currency of the primary economic environment in which an entity operates. The presentation currency of the Group is Sterling.
Foreign currency transactions are translated into the functional currency using exchange rates prevailing at the dates of the transactions. Exchange differences resulting from the settlement of such transactions and from the translation, at exchange rates ruling at the balance sheet date, of monetary assets and liabilities denominated in currencies other than the functional currency are recognised in the consolidated income statement.
The balance sheets of foreign operations are translated into sterling using the exchange rate at the balance sheet date and the income statements are translated into sterling using the average exchange rate for the year. Where this average is not a reasonable approximation of the cumulative effect of the rates prevailing on the transaction dates, the exchange rate on the transaction date is used. Exchange differences arising are recognised as a separate component of shareholders’ equity. On disposal of a foreign operation any cumulative exchange differences held in shareholders’ equity are transferred to the consolidated income statement.
REVENUE RECOGNITIONRevenue from the sale of goods or services is measured at the fair value of the consideration, net of rebates and excluding value added tax. Revenue from the sale of goods or services is recognised when the Group has transferred the significant risks and rewards of ownership of the goods to the buyer, when the amount of revenue can be measured reliably and when it is probable that the economic benefits associated with the transaction will flow to the Group. Inter segmental transactions are on an arm’s length basis.
51CARR’S GROUP PLCANNUAL REPORT AND ACCOUNTS 2015
STR
ATEG
IC R
EPO
RT
CO
RPO
RATE
GO
VER
NAN
CE
FINAN
CIA
L STATE
MEN
TS
In respect of construction contracts, revenue is calculated on the basis of the stage of completion and the total sales value of each contract.
The stage of completion is determined as the proportion that contract costs incurred for work performed to date bear to the total estimated total contract costs. No profit is recognised until a contract is at least 30% complete. Amounts invoiced for work completed are deducted from the selling price, while amounts invoiced in excess of work completed are recognised as current liabilities.
Where it is probable that contract costs will exceed total contract revenue the expected loss is recognised immediately as an expense in the consolidated income statement.
RETIREMENT BENEFIT OBLIGATIONSThe Group participates in two defined benefit pension schemes, Carr’s Group Pension Scheme and Carrs Billington Agriculture Pension Scheme. The Group also offers various defined contribution schemes to its employees.
The assets of the above named schemes are held separately from those of the Group and are invested with independent investment managers.
Contributions to defined contribution schemes are charged to the consolidated income statement in the year to which they relate.The asset/(obligation) recognised in the consolidated balance sheet at the year end in respect of defined benefit pension schemes is the present value of the defined benefit obligation at the balance sheet date less the fair value of scheme assets. Independent actuaries calculate the defined benefit asset/(obligation) annually using the projected unit credit method. The present value of the defined benefit obligation is determined by discounting the estimated future cash outflows using interest rates of high-quality corporate bonds that are denominated in the currency in which the benefits will be paid, and that have terms to maturity approximating to the terms of the related pension liability.
The service costs, including pension scheme administrative costs are included in operating profit in the consolidated income statement.
A charge is made within operating profit which represents a net interest amount that is calculated by applying the discount rate at the beginning of the year to the net defined benefit asset/(obligation) at the beginning of the year. The net interest amount also takes into account changes to the net asset/(obligation) during the year.
Actuarial gains and losses arising from experience adjustments and changes in actuarial assumptions are recognised in the consolidated statement of comprehensive income. The pension schemes’ deficits or surpluses, to the extent that they are considered recoverable, are recognised in full on the consolidated balance sheet.
IFRIC 14 confirms that where a company has an unconditional right to a refund of surplus from a defined benefit pension plan during the lifetime of that plan or when it winds it up, and where there is expected to be surplus assets, there is no limit on the asset the Company can show on its balance sheet. At 29 August 2015 and 30 August 2014 the consolidated balance sheet recognises the full surplus on the Carr’s Group defined benefit pension scheme.
The Group’s share of the deficit in the Carrs Billington Agriculture Pension Scheme is recognised through its investment in associate.
SHARE BASED PAYMENTSThe Group issues equity-settled share-based payments to certain employees. Equity-settled share-based payments are measured at fair value at the date of the grant. The fair value determined at the grant date
of the equity-settled share-based payments is expensed on a straight-line basis over the vesting period, based on the Group’s estimate of shares that will eventually vest.
Fair value is measured by use of a valuation model. The expected life used in the model has been adjusted, based on management’s best estimate, for the effects of non-transferability, exercise restrictions and behavioural considerations.
At each balance sheet date the Group revises its estimate of the number of options that are expected to vest. Changes to the fair value recognised as a result of this are charged or credited to the consolidated income statement with a corresponding adjustment to the equity compensation reserve.
INTERESTInterest is recognised in the consolidated income statement on an accruals basis using the effective interest method.
BORROWING COSTSGeneral and specific borrowing costs directly attributable to the acquisition, construction or production of qualifying assets, which are assets that necessarily take a substantial period of time to get ready for their intended use or sale, are added to the cost of those assets, until such time as the assets are substantially ready for their intended use or sale.
All other borrowing costs are recognised in the consolidated income statement in the year in which they are incurred.
OPERATING SEGMENTSIFRS 8 requires operating segments to be identified on the basis of internal financial information about components of the Group that are regularly reviewed by the Chief Operating Decision Maker (‘CODM’) to allocate resources to the segments and to assess their performance. The CODM has been identified as the Executive Directors.
The CODM considers the business from a product/services perspective. Operating segments have been identified as Agriculture, Food and Engineering.
NON-RECURRING ITEMSNon-recurring items that are material by size and/or by nature are presented within their relevant income statement category. Items that management consider fall into this category are disclosed within a note to the financial statements. The separate disclosure of non-recurring items helps provide a better indication of the Group’s underlying business performance. Events which may give rise to non-recurring items include, but are not limited to, gains or losses on the disposal of businesses, derivative gains or losses in respect of capital expenditure, gains or losses on the disposal of properties, gains or losses on the disposal of material investments, the restructuring of businesses, the integration of new businesses, acquisition related costs and asset impairments.
GOODWILLGoodwill arises on the acquisition of subsidiaries and represents the excess of the consideration transferred over the Group’s interest in the net fair value of the net identifiable assets, liabilities and contingent liabilities of the acquiree and the fair value of the non-controlling interest in the acquiree.

52 CARR’S GROUP PLCANNUAL REPORT AND ACCOUNTS 2015
FINANCIAL STATEMENTS
PRINCIPAL ACCOUNTING POLICIES CONTINUED
For the purpose of impairment testing, goodwill acquired in a business combination is allocated to each of the CGUs, or groups of CGUs, that is expected to benefit from the synergies of the combination. Each unit or group of units to which the goodwill is allocated represents the lowest level within the entity at which the goodwill is monitored for internal management purposes. Goodwill is monitored at the operating segment level.
Goodwill impairment reviews are undertaken annually or more frequently if events or changes in circumstances indicate a potential impairment. The carrying value of goodwill is compared to the recoverable amount, which is the higher of value in use and the fair value less costs of disposal. Any impairment is recognised immediately as an expense and is not subsequently reversed.
Goodwill written off to reserves under UK GAAP prior to 31 August 1998 has not been reinstated and would not form part of the gain or loss on the disposal of a business.
OTHER INTANGIBLE ASSETSOther intangible assets are carried at cost less accumulated amortisation and accumulated impairment losses. Amortisation commences when assets are available for use. The expected useful lives, over which the assets are amortised, are generally as follows:
Customer relationships 1 – 5 yearsBrands 15 – 20 yearsKnow-how 5 yearsPatents and trademarks contractual lifeSoftware 3 – 10 years
Customer relationships and brands are amortised in line with the profit and income streams they are respectively expected to generate over their expected useful life.
Know-how, patents, trademarks and software are amortised on a straight-line basis.
The cost of intangible assets acquired in a business combination is the fair value at the acquisition date. The cost of separately acquired intangible assets comprises the purchase price and any directly attributable costs of preparing the assets for use.
RESEARCH AND DEVELOPMENT COSTSAll research costs are recognised in the consolidated income statement as incurred. Development costs are recognised as an asset only to the extent that specific recognition criteria, as set out in IAS38 ‘Intangible assets’, relevant to the proposed application are met and the amount recognised is recoverable through future economic benefits.
PROPERTY, PLANT AND EQUIPMENTProperty, plant and equipment is carried at cost less accumulated depreciation and accumulated impairment losses. Cost comprises purchase price and directly attributable costs.
Freehold land and assets in the course of construction are not depreciated. For all other property, plant and equipment, depreciation is calculated on a straight-line basis to allocate cost less residual values of the assets over their estimated useful lives as follows:
Freehold buildings up to 50 yearsLeasehold buildings shorter of 50 years or lease termPlant and equipment 3 to 20 years
Residual values and useful lives are reviewed, and adjusted if appropriate, at each financial year-end.
Assets not fully constructed at the balance sheet date are classified as assets in the course of construction. When construction is complete these assets are reclassified to the appropriate heading within property, plant and equipment. Depreciation commences when the asset is ready for use.
The cost of maintenance, repairs and minor equipment is charged to the consolidated income statement as incurred; the cost of major renovations and improvements is capitalised.
Gains and losses on disposals are determined by comparing the proceeds with the carrying amount and are recognised within the consolidated income statement.
INVESTMENT PROPERTYInvestment properties are properties held for long-term rental yields. Investment properties are carried in the balance sheet at cost less accumulated depreciation. Freehold land is not depreciated. For all other investment property, depreciation is calculated on a straight-line basis to allocate cost less residual values of the assets over their estimated useful lives as follows:
Freehold buildings up to 50 years
The cost of maintenance, repairs and minor equipment is charged to the consolidated income statement as incurred; the cost of major renovations and improvements is capitalised.
Gains and losses on disposals are determined by comparing the proceeds with the carrying amount and are recognised within the consolidated income statement.
IMPAIRMENT OF NON-FINANCIAL ASSETSNon-financial assets are reviewed for impairment where there are any events or changes in circumstances that would indicate potential impairment. In addition, at each reporting date, the Group assesses whether there is any indication that goodwill may be impaired. Where an indicator of impairment exists, the Group makes an estimate of recoverable amount. Where the carrying amount of an asset exceeds its recoverable amount the asset is written down to its recoverable amount. Recoverable amount is the higher of fair value less costs to sell and value in use and is deemed for an individual asset. If the asset does not generate cash flows that are largely independent of those from other assets or groups of assets, the recoverable amount of the cash generating unit to which the asset belongs is determined. Discount rates reflecting the asset specific risks and the time value of money are used for the value in use calculation.
INVENTORIESInventories are stated at the lower of cost and net realisable value. Cost comprises direct materials and, where applicable, direct labour costs and those overheads that have been incurred in bringing the inventories to their present location and condition. Where appropriate, cost is calculated on a specific identification basis. Otherwise inventories are valued using the first-in first-out method.
Net realisable value represents the estimated selling price less all estimated costs to completion and costs to be incurred in marketing, selling and distribution.
Provision has been made, where necessary, for slow moving, obsolete and defective inventories.
Contract work in progress is measured at the selling price of the work performed at the balance sheet date. The selling price is measured by reference to the stage of completion at the balance sheet date and total expected income from the contract work.

53CARR’S GROUP PLCANNUAL REPORT AND ACCOUNTS 2015
STR
ATEG
IC R
EPO
RT
CO
RPO
RATE
GO
VER
NAN
CE
FINAN
CIA
L STATE
MEN
TS
Progress payments received are deducted from the value of work in progress except to the extent that payments on account exceed the value of work in progress on any contract where the excess is included in trade and other payables.
CASH AND CASH EQUIVALENTSCash and cash equivalents for the purposes of the consolidated statement of cash flows comprise cash at bank and in hand, money market deposits and other short term highly liquid investments with original maturities of three months or less and bank overdrafts. Bank overdrafts are presented in borrowings within current liabilities in the consolidated balance sheet.
GRANTSGrants received on capital expenditure are recorded as deferred income and taken to the consolidated income statement in equal annual instalments over the expected useful lives of the assets concerned.
Revenue grants and contributions are taken to the consolidated income statement in the year to which they apply.
LEASESLeases are classified as finance leases at inception where substantially all of the risks and rewards of ownership are transferred to the Group. Assets classified as finance leases are capitalised on the consolidated balance sheet and are depreciated over the shorter of the useful life of the asset and the term of the lease. The interest element of the rental obligations is charged to the consolidated income statement over the period of the lease using the actuarial method.
Rentals paid under operating leases are charged to the consolidated income statement on a straight-line basis over the term of the lease. Leasehold land is normally classified as an operating lease. Payments made to acquire leasehold land are included in prepayments at cost and are amortised over the life of the lease. Any incentives to enter into operating leases are recognised as a reduction of rental expense over the lease term on a straight-line basis.
TAXThe tax charge comprises current tax and deferred tax.
The current tax charge represents an estimate of the amounts payable to tax authorities in respect of the Group’s taxable profits.
Deferred tax is provided in full, using the liability method, on temporary differences arising between the tax base of assets and liabilities and their carrying amounts in the consolidated financial statements. Deferred tax arising from initial recognition of an asset or liability in a transaction, other than a business combination, that at the time of the transaction affects neither accounting nor taxable profit or loss, is not recognised. Deferred tax is measured using tax rates that have been enacted or substantively enacted by the balance sheet date and are expected to apply when the asset is realised or the liability is settled.
Deferred tax assets are recognised to the extent that it is probable that future taxable profit will be available against which the temporary differences can be utilised.
Deferred tax is provided on temporary differences arising on investments in subsidiaries, associates and joint ventures, except where the Group is able to control the timing of the reversal of the temporary difference and it is probable that the temporary difference will not reverse in the foreseeable future.
Tax is recognised in the consolidated income statement, unless the tax relates to items recognised directly in shareholders’ equity, in which case the tax is recognised directly in shareholders’ equity through the consolidated statement of comprehensive income.
DIVIDENDSFinal equity dividends to the shareholders of the Company are recognised in the year that they are approved by the shareholders. Interim equity dividends are recognised in the year that they are paid.
Dividends receivable are recognised in the period in which they are received.
FINANCIAL INSTRUMENTSFinancial assets and liabilities are recognised on the Group’s consolidated balance sheet when the Group becomes a party to the contractual provisions of the instrument.
Trade receivables Trade receivables are recognised initially at fair value and subsequently measured at amortised cost using the effective interest method, less provision for impairment. A provision for impairment of trade receivables is established when there is objective evidence that the Group will not be able to collect all amounts due according to the original terms of the receivables. Significant financial difficulties of the debtor, probability that the debtor will enter bankruptcy or financial reorganisation, and default or delinquency in payments are considered indicators that the trade receivable is impaired. The amount of the provision is the difference between the asset’s carrying amount and the present value of estimated future cash flows, discounted at the original effective interest rate. The carrying amount of the asset is reduced through the use of a provision for impairment, and the amount of the loss is recognised in the consolidated income statement. The provision is utilised when a trade receivable is uncollectible.
InvestmentsInvestments are initially measured at cost, including transaction costs.
Equity investments that do not have a quoted market price in an active market and whose fair value cannot be reliably measured by other means are held at cost.
Financial liabilities and equityFinancial liabilities and equity instruments are classified according to the substance of the contractual arrangements entered into.
An equity instrument is any contract that evidences a residual interest in the assets of the Group after deducting all of its liabilities.
Bank borrowingsInterest-bearing loans and overdrafts are recognised initially at fair value net of direct issue costs and are subsequently stated at amortised cost. Finance charges, including premiums payable on settlement or redemption and direct issue costs, are accounted for on an effective interest method and are added to the carrying amount of the instrument to the extent that they are not settled in the year in which they arise.
Trade payablesTrade payables are recognised initially at fair value and subsequently measured at amortised cost using the effective interest method.
Equity instrumentsEquity instruments issued by the Company are recorded at the proceeds received, net of direct issue costs.
54 CARR’S GROUP PLCANNUAL REPORT AND ACCOUNTS 2015
FINANCIAL STATEMENTS
Derivative financial instruments and hedging activitiesThe Group primarily uses forward foreign currency contracts, options and currency swaps to manage its exposures to fluctuating foreign exchange rates. These instruments are initially recognised at fair value and are subsequently re-measured at their fair value at each balance sheet date.
The Group’s policy is to hedge its international assets and it has designated foreign currency borrowings as a hedge against net investment in foreign operations. The portion of the gain or loss on an instrument used to hedge a net investment in a foreign operation that is determined as an effective hedge is recognised directly in equity. The gain or loss on any ineffective portion of the hedge is recognised immediately in the consolidated income statement.
NEW STANDARDS AND INTERPRETATIONSFrom 31 August 2014 the following became effective and were adopted by the Group:
IFRS 10 ‘Consolidated financial statements’IFRS 11 ‘Joint arrangements’IFRS 12 ‘Disclosures of interests in other entities’Amendments to IFRS 10, 11 and 12 on transition guidanceIAS 27 (revised 2011) ‘Separate financial statements’IAS 28 (revised 2011) ‘Associates and joint ventures’Amendments to IFRS 10, IFRS 12 and IAS 27 on consolidation for investment entitiesAmendments to IAS 32 on Financial instruments asset and liability offsettingAmendments to IAS 36 ‘Impairment of assets’ on recoverable amount disclosuresAmendments to IAS 39 ‘Financial instruments: Recognition and measurement’ on novation of derivatives and hedge accountingIFRIC 21 ‘Levies’
The adoption of these standards and interpretations has had no impact on the Group’s profit for the year or equity.
NEW STANDARDS, AMENDMENTS AND INTERPRETATIONS ISSUED BUT NOT YET EFFECTIVE AND NOT EARLY ADOPTEDIFRS 9 ‘Financial instruments’Amendments to IFRS 10 ‘Consolidated financial statements’ and IAS 28 ‘Investments in associates and joint ventures’Amendment to IFRS 10 and IAS 28 on investment entities applying the consolidation exemption Amendment to IFRS 11 ‘Joint arrangements’ on acquisition of an interest in a joint operation IFRS 14 ‘Regulatory deferral accounts’IFRS 15 ‘Revenue from contracts with customers’Amendment to IAS 1 ‘Presentation of financial statements’ on the disclosure initiativeAmendment to IAS 16 ‘Property, plant and equipment’ and IAS 38 ‘Intangible assets’ on depreciation and amortisationAmendment to IAS 16 ‘Property, plant and equipment’ and IAS 41 ‘Agriculture’ regarding bearer plantsAmendment to IAS 19 regarding defined benefit plansAmendments to IAS 27, ‘Separate financial statements’ on the equity methodAnnual improvements to IFRSs 2012, 2013 and 2014
It is considered that the above standards and amendments will not have a significant effect on the results or net assets of the Group.
SIGNIFICANT JUDGEMENTS, KEY ASSUMPTIONS AND ESTIMATESApplication of certain Group accounting policies requires management to make judgements, assumptions and estimates concerning the future as detailed below.
Valuation of pension obligationsThe valuation of the Group’s defined benefit pension scheme is determined each year following advice from a qualifying independent actuary and can fluctuate based on a number of external factors. Such factors include the major assumptions as shown in the table in note 24 and actual returns on scheme assets compared to those predicted in the previous scheme valuation.
Valuation of share-based paymentsThe fair value of share-based payments is determined using valuation models and is charged to the consolidated income statement over the vesting period.
The valuation models require certain assumptions to be made as shown in the tables in note 26. Estimations of vesting and satisfaction of performance criteria are required to determine fair value.
Impairment of goodwillThe carrying value of goodwill must be assessed for impairment annually, or more frequently if there are indications that goodwill might be impaired. This requires an estimation of the value in use of the cash generating units to which goodwill is allocated. Value in use is dependent on estimations of future cash flows from the cash generating unit and the use of an appropriate discount rate to discount those cash flows to their present value.
No impairment has been identified in the year (note 9).
Revenue recognition on construction contractsUnder long term contracts, the Group recognises revenue and profits based on the percentage completion method. This requires management to make an assessment of the overall profitability and the stage of completion of the entire contract in order to determine the level of revenue and profit to recognise.
Provision for impairment of trade receivablesThe financial statements include a provision for impairment of trade receivables (note 18) that is based on management’s estimation of recoverability. There is a risk that the provision will not match the trade receivables that ultimately prove to be irrecoverable.
Valuation of derivative financial instrumentsThe fair value of derivative financial instruments (note 23) is determined using market factors at the year end over which management have no control. Such factors include the estimation of future currency exchange rates. In addition the fair value of such instruments is affected by the global economic environment and financial institution pricing structures.
PRINCIPAL ACCOUNTING POLICIES CONTINUED

55CARR’S GROUP PLCANNUAL REPORT AND ACCOUNTS 2015
STR
ATEG
IC R
EPO
RT
CO
RPO
RATE
GO
VER
NAN
CE
FINAN
CIA
L STATE
MEN
TS
NOTES TO THE FINANCIAL STATEMENTS
1 The Company has taken advantage of the exemption, under section 408 of the Companies Act 2006, from presenting its own income statement. The profit after tax for the year dealt with in the accounts of the Company was £2,870,000 (2014: £2,021,000).
2 Segmental information The chief operating decision maker (“CODM”) has been identified as the Executive Directors. Management has identified the operating segments based on internal financial information reviewed by the CODM. The CODM considers the business from a product/services perspective. Operating segments have been identified as Agriculture, Food and Engineering. Operating segments have not been aggregated for the purpose of determining reportable segments.
Agriculture aims to provide for all farming requirements. It derives its revenue from the sale of animal feed and feed blocks together with retail sales of farm equipment, fuels and farm consumables.
Food derives its revenues from the milling of wheat into flour. Customers range from the larger companies, bread and biscuit manufacturers and supermarkets, to smaller owner managed bakeries.
Engineering derives its revenues from the design and manufacture of remote handling equipment for use in research and nuclear industries. In addition the UK business is involved in precision machining and the design and manufacture of pressure vessels for the oil, petrochemical and gas industry. Performance is assessed using profit before taxation. For internal purposes profit before taxation is measured in a manner consistent with that in the financial statements, with the exception of material non-recurring items, which are excluded. Inter-segmental transactions are all undertaken on an arm’s length basis.
Adjustments to segmental information and amounts classified as ‘other’ represents non-reportable segments and consolidation adjustments.
As segment liabilities are not reviewed by the CODM they are not required to be disclosed under IFRS 8. The Group has operations in the UK and overseas. In accordance with IFRS 8, entity wide disclosures based on the geography of operations is also presented. The geographical analysis of revenue is presented by revenue origin. The segmental information for the year ended 29 August 2015 is as follows:
Agriculture Food Engineering Other Group £’000 £’000 £’000 £’000 £’000
Total segment revenue 297,811 80,280 33,588 47 411,726Inter segment revenue (115) — (46) — (161)
Revenue from external customers 297,696 80,280 33,542 47 411,565
EBITDA1 13,557 4,995 4,201 (1,117) 21,636
Depreciation of property, plant and equipment (2,259) (1,860) (815) (125) (5,059)Depreciation of investment property — (4) — (16) (20)Profit/(loss) on the disposal of property, plant and equipment 50 12 (24) (12) 26Amortisation of intangible assets (100) (15) (93) — (208)
Operating profit/(loss) 11,248 3,128 3,269 (1,270) 16,375Finance income 49 1 2 145 197Finance costs (865) (695) (180) 328 (1,412)
10,432 2,434 3,091 (797)2 15,160Share of post-tax profit of associate 1,500 — — — 1,500Share of post-tax profit of joint ventures 807 — — — 807
Profit/(loss) before taxation 12,739 2,434 3,091 (797) 17,467
1 Earnings before interest, tax, depreciation and amortisation (and before profit/(loss) on the disposal of property, plant and equipment)
2 Includes Head Office net expense of £(663,000) and retirement benefit charge of £(120,000)

56 CARR’S GROUP PLCANNUAL REPORT AND ACCOUNTS 2015
FINANCIAL STATEMENTS
NOTES TO THE FINANCIAL STATEMENTS CONTINUED
2 Segmental information (continued)Assets
Agriculture Food Engineering Other Group £’000 £’000 £’000 £’000 £’000
Segment gross assets 106,193 42,977 33,964 20,254 203,388
The segmental information for the year ended 30 August 2014 is as follows:
Agriculture Food Engineering Other Group £’000 £’000 £’000 £’000 £’000
Total segment revenue 315,019 87,107 26,939 47 429,112Inter segment revenue (94) (1) (61) — (156)
Revenue from external customers 314,925 87,106 26,878 47 428,956
EBITDA1 12,563 4,955 4,618 (1,719) 20,417 Depreciation of property, plant and equipment (2,215) (1,856) (690) (121) (4,882)Depreciation of investment property — (4) — (15) (19)Profit/(loss) on the disposal of property, plant and equipment 102 (6) 8 — 104Amortisation of intangible assets (56) (17) (120) — (193)
Operating profit/(loss) 10,394 3,072 3,816 (1,855) 15,427Finance income 88 2 3 171 264Finance costs (897) (784) (107) 164 (1,624)
9,585 2,290 3,712 (1,520)3 14,067Share of post-tax profit of associate 1,579 — — — 1,579Share of post-tax profit of joint ventures 907 — — — 907
Profit/(loss) before taxation 12,071 2,290 3,712 (1,520) 16,553
3 Includes Head Office net expense of £(753,000) and retirement benefit charge of £(687,000)
Assets
Agriculture Food Engineering Other Group £’000 £’000 £’000 £’000 £’000
Segment gross assets 101,203 44,485 31,822 20,182 197,692
Entity wide disclosuresRevenues from external customers are derived from the sale of products by individual business segment. The breakdown of revenue by business segment is provided above.
Revenues from external customers:
2015 2014 £’000 £’000
UK 368,007 391,581 Europe 13,759 14,137USA 29,799 23,238
411,565 428,956

57CARR’S GROUP PLCANNUAL REPORT AND ACCOUNTS 2015
STR
ATEG
IC R
EPO
RT
CO
RPO
RATE
GO
VER
NAN
CE
FINAN
CIA
L STATE
MEN
TS
2 Segmental information (continued)Non-current assets excluding deferred tax assets:
2015 2014 UK Europe USA Total UK Europe USA Total £’000 £’000 £’000 £’000 £’000 £’000 £’000 £’000
Goodwill 10,520 313 16 10,849 9,470 313 15 9,798Other intangible assets 173 245 30 448 107 351 41 499 Property, plant and equipment 48,256 6,009 4,120 58,385 47,620 6,580 2,426 56,626Investment property 636 — — 636 656 — — 656 Investment in associate 8,439 — — 8,439 6,883 — — 6,883Interest in joint ventures 1,748 2,097 1,167 5,012 1,738 1,953 1,145 4,836 Other investments 61 — 18 79 61 — 16 77Non-current receivables 50 — — 50 501 — — 501 Retirement benefit asset 1,767 — — 1,767 2,056 — — 2,056
71,650 8,664 5,351 85,665 69,092 9,197 3,643 81,932
Major customersThere are no revenues from transactions with individual customers which amount to ten percent or more of Group revenue.
3 Group operating profit
2015 2014 £’000 £’000
Group operating profit is stated after (crediting)/charging:Amortisation of grants (120) (54)Profit on disposal of property, plant and equipment (26) (104)Depreciation of property, plant and equipment 5,059 4,882Depreciation of owned investment property 20 19Amortisation of intangible assets 208 193Foreign exchange losses/(gains) 50 (52)Derivative financial instruments losses 7 9Operating lease charges 1,077 897Auditors’ remuneration:Audit services (Company £15,300; 2014: £15,000) 75 74The auditing of accounts of subsidiaries of the Company pursuant to legislation (including overseas) 136 131
Total audit services 211 205
Taxation compliance services 33 30Other taxation advisory services 35 45Other non-audit services 19 69
Total non-audit services 87 144
Included within Group operating profit is the following in respect of investment property leased to, and occupied by, external parties:Rental income (54) (54)Operating expenses 64 58
10 4

58 CARR’S GROUP PLCANNUAL REPORT AND ACCOUNTS 2015
FINANCIAL STATEMENTS
NOTES TO THE FINANCIAL STATEMENTS CONTINUED
4 Staff costs
2015 2014Group £’000 £’000
Wages and salaries 33,010 29,674 Social security costs 3,536 3,292Other pension costs 2,018 2,388Share based payments 584 401
39,148 35,755
Included within other pension costs is £120,000 (2014: £687,000) in respect of the defined benefit pension scheme.
The average monthly number of employees, including Directors, during the year was made up as follows:
2015 2014Group Number Number
Sales, office and management 566 542Manufacture and distribution 491 423
1,057 965
Key management are considered to be the Directors of the Group.
Full details of the Directors’ emoluments, pension benefits and share options are given in the Remuneration Committee Report on pages 30 to 35.
5 Finance income and finance costs
2015 2014 £’000 £’000
Finance income
Bank interest 187 246Other interest 10 18
Total finance income 197 264
Finance costs
Interest payable on bank overdrafts (190) (219)Interest payable on bank loans and other borrowings (763) (901)Interest payable on finance leases (389) (428)Other interest (70) (76)
Total finance costs (1,412) (1,624)

59CARR’S GROUP PLCANNUAL REPORT AND ACCOUNTS 2015
STR
ATEG
IC R
EPO
RT
CO
RPO
RATE
GO
VER
NAN
CE
FINAN
CIA
L STATE
MEN
TS
6 Taxation
(a) Analysis of the charge in the year
2015 2014 £’000 £’000
Current tax:UK corporation tax Current year 1,736 1,480 Adjustment in respect of prior years 114 238Foreign tax Current year 621 1,722 Adjustment in respect of prior years (33) 98
Group current tax 2,438 3,538
Deferred tax: Origination and reversal of timing differences Current year 1,293 362 Adjustment in respect of prior years 43 (240)
Group deferred tax (note 16) 1,336 122
Tax on profit from ordinary activities 3,774 3,660
(b) Factors affecting tax charge for the yearThe tax assessed for the year is higher (2014: lower) than the rate of corporation tax in the UK of 20.58% (2014: 22.17%). The differences are explained below:
2015 2014 £’000 £’000
Profit before taxation 17,467 16,553
Tax at 20.58% (2014: 22.17%) 3,595 3,670Effects of: Tax effect of share of profit in associate and joint ventures (475) (551) Tax effect of expenses that are not allowable in determining taxable profit 154 75 Tax effect of non-taxable income (92) — Effects of different tax rates of foreign subsidiaries 478 420 Effects of changes in tax rates (16) (57) Adjustment in respect of prior years 124 96 Other 6 7
Total tax charge for the year 3,774 3,660
(c) Factors affecting future tax chargesThe main rate of UK corporation tax was reduced from 21% to 20% from 1 April 2015. This was substantively enacted prior to the year end. UK deferred tax balances at 29 August 2015 have been calculated using a tax rate of 20%.
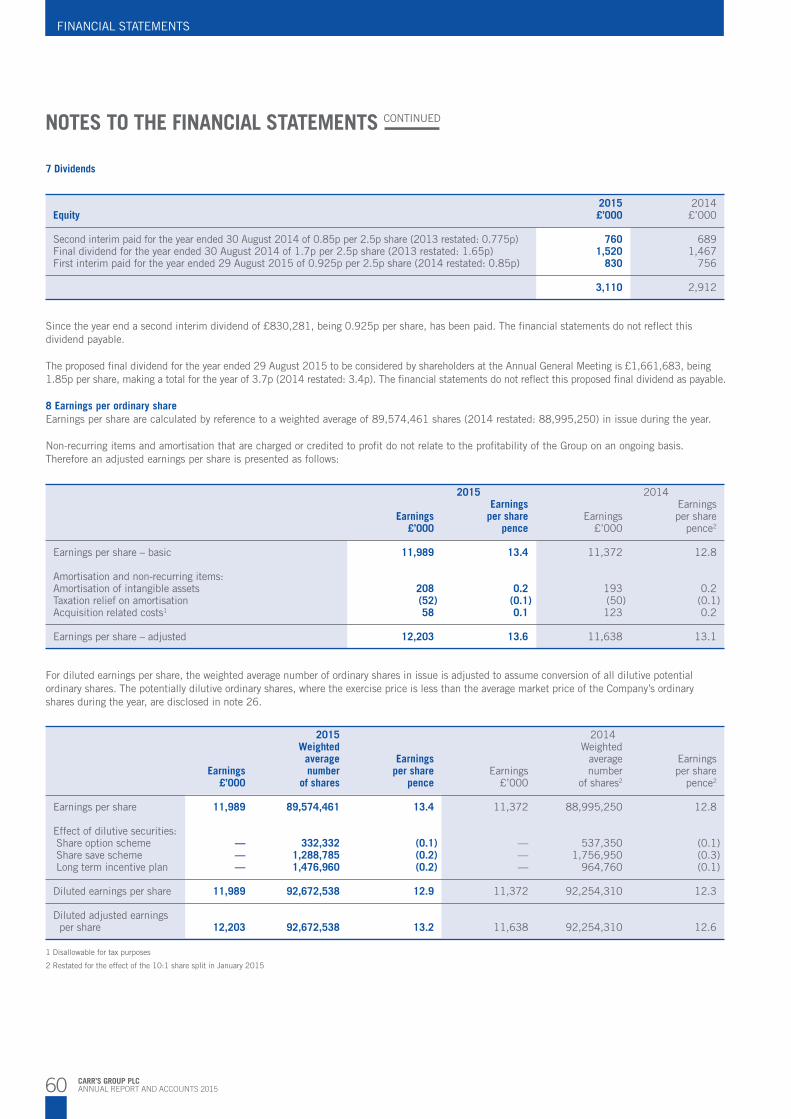
60 CARR’S GROUP PLCANNUAL REPORT AND ACCOUNTS 2015
FINANCIAL STATEMENTS
NOTES TO THE FINANCIAL STATEMENTS CONTINUED
2015 2014 Earnings Earnings Earnings per share Earnings per share £’000 pence £’000 pence2
Earnings per share – basic 11,989 13.4 11,372 12.8 Amortisation and non-recurring items: Amortisation of intangible assets 208 0.2 193 0.2Taxation relief on amortisation (52) (0.1) (50) (0.1)Acquisition related costs1 58 0.1 123 0.2
Earnings per share – adjusted 12,203 13.6 11,638 13.1
For diluted earnings per share, the weighted average number of ordinary shares in issue is adjusted to assume conversion of all dilutive potential ordinary shares. The potentially dilutive ordinary shares, where the exercise price is less than the average market price of the Company’s ordinary shares during the year, are disclosed in note 26.
2015 2014 Weighted Weighted average Earnings average Earnings Earnings number per share Earnings number per share £’000 of shares pence £’000 of shares2 pence2
Earnings per share 11,989 89,574,461 13.4 11,372 88,995,250 12.8 Effect of dilutive securities: Share option scheme — 332,332 (0.1) — 537,350 (0.1) Share save scheme — 1,288,785 (0.2) — 1,756,950 (0.3) Long term incentive plan — 1,476,960 (0.2) — 964,760 (0.1)
Diluted earnings per share 11,989 92,672,538 12.9 11,372 92,254,310 12.3
Diluted adjusted earnings per share 12,203 92,672,538 13.2 11,638 92,254,310 12.6
1 Disallowable for tax purposes
2 Restated for the effect of the 10:1 share split in January 2015
2015 2014Equity £’000 £’000
Second interim paid for the year ended 30 August 2014 of 0.85p per 2.5p share (2013 restated: 0.775p) 760 689Final dividend for the year ended 30 August 2014 of 1.7p per 2.5p share (2013 restated: 1.65p) 1,520 1,467First interim paid for the year ended 29 August 2015 of 0.925p per 2.5p share (2014 restated: 0.85p) 830 756
3,110 2,912
Since the year end a second interim dividend of £830,281, being 0.925p per share, has been paid. The financial statements do not reflect this dividend payable.
The proposed final dividend for the year ended 29 August 2015 to be considered by shareholders at the Annual General Meeting is £1,661,683, being 1.85p per share, making a total for the year of 3.7p (2014 restated: 3.4p). The financial statements do not reflect this proposed final dividend as payable.
8 Earnings per ordinary shareEarnings per share are calculated by reference to a weighted average of 89,574,461 shares (2014 restated: 88,995,250) in issue during the year.
Non-recurring items and amortisation that are charged or credited to profit do not relate to the profitability of the Group on an ongoing basis. Therefore an adjusted earnings per share is presented as follows:
7 Dividends

61CARR’S GROUP PLCANNUAL REPORT AND ACCOUNTS 2015
STR
ATEG
IC R
EPO
RT
CO
RPO
RATE
GO
VER
NAN
CE
FINAN
CIA
L STATE
MEN
TS
Customer Patents and Goodwill relationships Brands Know-how trademarks Software TotalGroup £’000 £’000 £’000 £’000 £’000 £’000 £’000
Cost At 1 September 2013 5,540 3,158 612 240 153 577 10,280Exchange differences (2) — (18) — (11) (41) (72)Subsidiaries acquired 4,585 51 — — — — 4,636Additions — — — — 3 54 57
At 30 August 2014 10,123 3,209 594 240 145 590 14,901Exchange differences 1 — (16) — 13 (40) (42)Subsidiaries acquired 1,050 162 — — — — 1,212Additions — — — — 5 10 15
At 29 August 2015 11,174 3,371 578 240 163 560 16,086
Accumulated amortisation and impairmentAt 1 September 2013 325 3,158 310 240 107 310 4,450Exchange differences — — (6) — (7) (26) (39)Charge for the year — 51 33 — 5 104 193
At 30 August 2014 325 3,209 337 240 105 388 4,604Exchange differences — — (6) — 9 (26) (23)Charge for the year — 81 30 — 19 78 208
At 29 August 2015 325 3,290 361 240 133 440 4,789
Net book amountAt 31 August 2013 5,215 — 302 — 46 267 5,830
At 30 August 2014 9,798 — 257 — 40 202 10,297
At 29 August 2015 10,849 81 217 — 30 120 11,297
During the year goodwill of £1,050,000 arose on acquisitions (note 27).
During the prior year goodwill totalling £4,585,000 arose on the acquisitions of Chirton Engineering Limited and B.E. Williams Limited. Goodwill represented the excess of the consideration paid over the Group’s interest in the net fair value of the net identifiable assets, liabilities and contingent liabilities acquired.
For the purpose of impairment testing, goodwill acquired in a business combination is allocated to cash generating units that are expected to benefit from the synergies of the combination.
9 Goodwill and other intangible assets

62 CARR’S GROUP PLCANNUAL REPORT AND ACCOUNTS 2015
FINANCIAL STATEMENTS
NOTES TO THE FINANCIAL STATEMENTS CONTINUED
29 August 30 August 2015 2014 £’000 £’000
Carrs Billington Agriculture (Sales) Limited 195 195Carrs Billington Agriculture (Sales) Limited – Johnstone Wallace Oils profit centre 781 781Carrs Billington Agriculture (Sales) Limited – Borders profit centre 264 264Carrs Billington Agriculture (Sales) Limited – Wooler profit centre 369 369Carrs Billington Agriculture (Sales) Limited – Safe at Work profit centre 568 568 Carrs Billington Agriculture (Sales) Limited – Laycocks profit centre 125 125Carrs Billington Agriculture (Sales) Limited – Williams profit centre 359 359Carrs Billington Agriculture (Sales) Limited – Nicholls profit centre 267 —Carrs Billington Agriculture (Sales) Limited – Reid and Robertson profit centre 783 —Carrs Agriculture Limited – Scotmin profit centre 2,068 2,068Animal Feed Supplement, Inc. – Silver Springs profit centre 15 14Wälischmiller Engineering GmbH 313 313Carrs Engineering Limited – Bendalls Engineering profit centre 516 516Carrs Engineering Limited – Chirton profit centre 4,226 4,226
10,849 9,798
Goodwill is tested annually for impairment, or more frequently if there are indications that goodwill might be impaired. Goodwill is tested for impairment by estimating future cash flows from the cash generating units to which goodwill has been allocated and discounting these cash flows to their present value. Each unit or group of units to which goodwill is allocated represents the lowest level within the entity at which the goodwill is monitored for internal management purposes. Goodwill is monitored at operating segment level. The key assumptions in this calculation are in respect of discount rates used and the change in cash flows. Management estimates discount rates using pre-tax rates that reflect current market assessments of the time value of money and the risks specific to the cash generating units.
Cash flows are estimated using the most recent budget information for the year to August 2016, which has been approved by the Board and forecast information for the four years to August 2020 based on medium term business plans and an assumption for long term growth of between 1-3% excluding inflation. The pre-tax discount rate used to discount the forecast cash flows for all cash generating units is 7.73% - 12.76% (2014: 5.97% - 11.41%).
The Directors consider the assumptions adopted in calculating the cash flows to be consistent with historical performance and to be reasonable given current market conditions.
Significant headroom exists in each of the cash generating units and, based on the stress testing performed, reasonable possible changes in the assumptions would not cause the carrying amount of the cash generating units to equal or to exceed their recoverable amount. Given the current state of the oil market the Directors placed particular attention to the impairment review on the carrying value of goodwill relating to the Chirton profit centre. The Directors reviewed the assumptions used and the impact of sensitivities and agreed that no provision for impairment was required.
Amortisation and impairment charges are recognised within administrative expenses.
There is no goodwill or intangible assets in the Company (2014: none).
9 Goodwill and other intangible assets (continued)The carrying value of goodwill has been allocated to the following cash generating units:

63CARR’S GROUP PLCANNUAL REPORT AND ACCOUNTS 2015
STR
ATEG
IC R
EPO
RT
CO
RPO
RATE
GO
VER
NAN
CE
FINAN
CIA
L STATE
MEN
TS
10 Property, plant and equipment
Assets in the Land and Plant and course of buildings equipment construction TotalGroup £’000 £’000 £’000 £’000
CostAt 1 September 2013 32,138 67,680 506 100,324Exchange differences (402) (501) (12) (915)Subsidiaries acquired — 1,963 — 1,963Additions 3,656 3,252 1,134 8,042Disposals (85) (1,253) — (1,338)Reclassifications 154 871 (1,025) —
At 30 August 2014 35,461 72,012 603 108,076Exchange differences (198) 300 (2) 100Subsidiaries acquired 14 178 — 192Additions 710 4,410 2,143 7,263Disposals (51) (1,419) — (1,470)Reclassifications 133 175 (308) —
At 29 August 2015 36,069 75,656 2,436 114,161
Accumulated depreciationAt 1 September 2013 6,408 40,848 — 47,256Exchange differences (56) (312) — (368)Subsidiaries acquired — 822 — 822Charge for the year 730 4,152 — 4,882Disposals (85) (1,057) — (1,142)Reclassifications (16) 16 — —
At 30 August 2014 6,981 44,469 — 51,450Exchange differences 42 301 — 343Subsidiaries acquired 14 60 — 74Charge for the year 817 4,242 — 5,059Disposals (14) (1,136) — (1,150)
At 29 August 2015 7,840 47,936 — 55,776
Net book amountAt 31 August 2013 25,730 26,832 506 53,068
At 30 August 2014 28,480 27,543 603 56,626
At 29 August 2015 28,229 27,720 2,436 58,385
Freehold land amounting to £3,569,135 (2014: £3,322,460) has not been depreciated.
The net book amount of plant and equipment includes £12,261,842 (2014: £12,722,306) in respect of assets held under finance leases. This consists of cost of £16,603,001 (2014: £16,260,825) less accumulated depreciation of £4,341,159 (2014: £3,538,519).
The Group’s bankers hold legal charges over certain properties.

64 CARR’S GROUP PLCANNUAL REPORT AND ACCOUNTS 2015
FINANCIAL STATEMENTS
NOTES TO THE FINANCIAL STATEMENTS CONTINUED
10 Property, plant and equipment (continued)
Depreciation is recognised within the Consolidated Income Statement as shown below:
2015 2014 £’000 £’000
Cost of sales 4,373 4,246Distribution costs 76 92Administrative expenses 610 544
5,059 4,882
The Company has no property, plant and equipment (2014: none).
11 Investment property
TotalGroup £’000
CostAt 1 September 2013, 31 August 2014 and 29 August 2015 922
Accumulated depreciationAt 31 August 2013 247Charge for the year 19
At 30 August 2014 266Charge for the year 20
At 29 August 2015 286
Net book amountAt 31 August 2013 675
At 30 August 2014 656
At 29 August 2015 636
Included within investment property are properties occupied by life tenants. The net book amount of these properties at 29 August 2015 is £145,000 (2014: £150,000).
The fair value of investment properties at 29 August 2015 is £1,065,000 (2014: £1,065,000). Investment properties were valued by independent professionally qualified valuers in 2011. The Directors have reviewed the valuations and are satisfied there are no significant changes to the assumptions and the valuations. The Directors have therefore not sought updated professional valuations at 29 August 2015.
There is no investment property in the Company (2014: none).

65CARR’S GROUP PLCANNUAL REPORT AND ACCOUNTS 2015
STR
ATEG
IC R
EPO
RT
CO
RPO
RATE
GO
VER
NAN
CE
FINAN
CIA
L STATE
MEN
TS
Joint Other Associate ventures investments TotalGroup £’000 £’000 £’000 £’000
CostAt 1 September 2013 7,024 3,299 81 10,404Exchange difference — (143) (1) (144)Subsidiaries acquired — — 10 10Additions — 965 — 965Disposals — — (4) (4)Redemption of preference shares — (150) — (150)Reclassification (1,225) — — (1,225)Share of post-tax profit 1,579 907 — 2,486Share of losses recognised directly in equity (495) (42) — (537)
At 30 August 2014 6,883 4,836 86 11,805Exchange difference — (71) 2 (69)Return of capital invested — (488) — (488)Redemption of preference shares — (150) — (150)Share of post-tax profit 1,500 807 — 2,307Share of gains recognised directly in equity 56 78 — 134
At 29 August 2015 8,439 5,012 88 13,539
Accumulated provision for impairment At 1 September 2013, 30 August 2014 and 29 August 2015 — — 9 9
Net book amountAt 31 August 2013 7,024 3,299 72 10,395
At 30 August 2014 6,883 4,836 77 11,796
At 29 August 2015 8,439 5,012 79 13,530
During the prior year £1,225,000 was reclassified to receivables. At the prior year end £1,000,000 of this receivable was outstanding. £500,000 was included within current receivables and £500,000 was included within non-current receivables. At 29 August 2015 £500,000 of this receivable is outstanding and is included within current receivables.
Other investments comprise shares in several private limited companies. These investments have been classified as unquoted investments for which fair value cannot be reliably measured and are held at cost less accumulated impairment.
12 Investments

66 CARR’S GROUP PLCANNUAL REPORT AND ACCOUNTS 2015
FINANCIAL STATEMENTS
NOTES TO THE FINANCIAL STATEMENTS CONTINUED
12 Investments (continued)
Proportion of shares held Ordinary Country of Country of Name % incorporation operation Activity
Carrs Billington Agriculture (Operations) Limited 49 England UK Manufacture of animal feed
The Group does not have the ability to control the financial and operating policies of Carrs Billington Agriculture (Operations) Limited. The Group has a 49% shareholding and a 43% representation on the Board of Directors of this associate.
Associates are accounted for using the equity method.
At the year end the associate had capital commitments of £187,000 (2014: £nil). No contingent liabilities exist within the associate.
The aggregate amounts relating to the associate, of which the Group recognises 49% in the net investment in associate, are:
2015 2014 £’000 £’000
Total assets 34,199 33,244Total liabilities (16,977) (19,197) Revenues 105,162 113,984Profit after tax 3,061 3,223
Shares in Joint subsidiaries Associate ventures TotalCompany £’000 £’000 £’000 £’000
CostAt 1 September 2013 18,028 1,470 272 19,770 Share based payment expense in respect of employees of subsidiary undertakings 114 — — 114Reclassification — (1,225) — (1,225)
At 30 August 2014 18,142 245 272 18,659Recapitalisation 74 — — 74Share based payment expense in respect of employees of subsidiary undertakings 222 — — 222
At 29 August 2015 18,438 245 272 18,955
Accumulated provision for impairmentAt 1 September 2013 5,381 — — 5,381Disposals 6 — — 6
At 30 August 2014 5,387 — — 5,387Impairment in the year 846 — — 846
At 29 August 2015 6,233 — — 6,233
Net book amountAt 31 August 2013 12,647 1,470 272 14,389
At 30 August 2014 12,755 245 272 13,272
At 29 August 2015 12,205 245 272 12,722
During the prior year £1,225,000 was reclassified to receivables. At the prior year end £1,000,000 of this receivable was outstanding. £500,000 was included within current receivables and £500,000 was included within non-current receivables. At 29 August 2015 £500,000 of this receivable is outstanding and is included within current receivables.
13 Investment in associateThe associated undertaking at 29 August 2015 is:
Group and Company
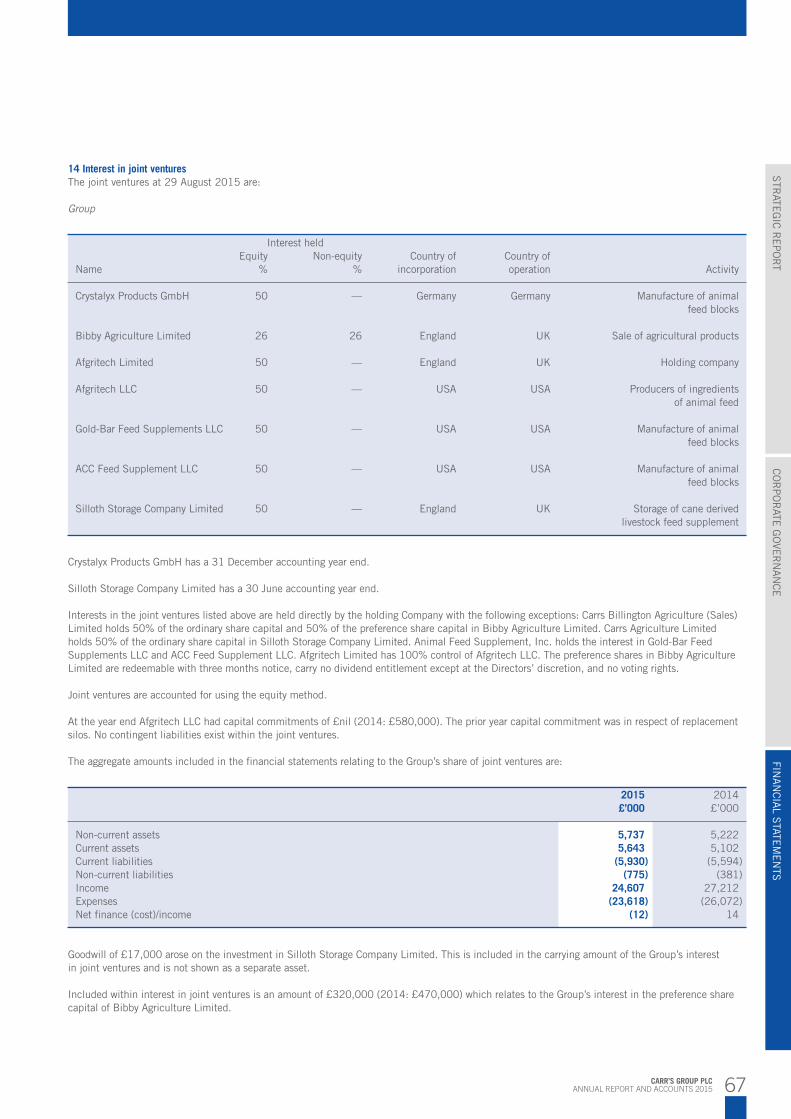
67CARR’S GROUP PLCANNUAL REPORT AND ACCOUNTS 2015
STR
ATEG
IC R
EPO
RT
CO
RPO
RATE
GO
VER
NAN
CE
FINAN
CIA
L STATE
MEN
TS
14 Interest in joint venturesThe joint ventures at 29 August 2015 are:
Group
Interest held Equity Non-equity Country of Country of Name % % incorporation operation Activity
Crystalyx Products GmbH 50 — Germany Germany Manufacture of animal feed blocks
Bibby Agriculture Limited 26 26 England UK Sale of agricultural products
Afgritech Limited 50 — England UK Holding company
Afgritech LLC 50 — USA USA Producers of ingredients of animal feed
Gold-Bar Feed Supplements LLC 50 — USA USA Manufacture of animal feed blocks
ACC Feed Supplement LLC 50 — USA USA Manufacture of animal feed blocks
Silloth Storage Company Limited 50 — England UK Storage of cane derived livestock feed supplement
Crystalyx Products GmbH has a 31 December accounting year end.
Silloth Storage Company Limited has a 30 June accounting year end.
Interests in the joint ventures listed above are held directly by the holding Company with the following exceptions: Carrs Billington Agriculture (Sales) Limited holds 50% of the ordinary share capital and 50% of the preference share capital in Bibby Agriculture Limited. Carrs Agriculture Limited holds 50% of the ordinary share capital in Silloth Storage Company Limited. Animal Feed Supplement, Inc. holds the interest in Gold-Bar Feed Supplements LLC and ACC Feed Supplement LLC. Afgritech Limited has 100% control of Afgritech LLC. The preference shares in Bibby Agriculture Limited are redeemable with three months notice, carry no dividend entitlement except at the Directors’ discretion, and no voting rights.
Joint ventures are accounted for using the equity method.
At the year end Afgritech LLC had capital commitments of £nil (2014: £580,000). The prior year capital commitment was in respect of replacement silos. No contingent liabilities exist within the joint ventures.
The aggregate amounts included in the financial statements relating to the Group’s share of joint ventures are:
2015 2014 £’000 £’000
Non-current assets 5,737 5,222Current assets 5,643 5,102Current liabilities (5,930) (5,594)Non-current liabilities (775) (381)Income 24,607 27,212Expenses (23,618) (26,072)Net finance (cost)/income (12) 14
Goodwill of £17,000 arose on the investment in Silloth Storage Company Limited. This is included in the carrying amount of the Group’s interest in joint ventures and is not shown as a separate asset. Included within interest in joint ventures is an amount of £320,000 (2014: £470,000) which relates to the Group’s interest in the preference share capital of Bibby Agriculture Limited.

68 CARR’S GROUP PLCANNUAL REPORT AND ACCOUNTS 2015
FINANCIAL STATEMENTS
NOTES TO THE FINANCIAL STATEMENTS CONTINUED
Proportion of shares held Ordinary Country of Country of Name % incorporation operation Activity
Carrs Agriculture Limited 100 England UK Manufacture of animal feed/mineral blocks and ingredients of animal feedCarrs Billington Agriculture (Sales) Limited 51 England UK Agricultural retailers Animal Feed Supplement, Inc. 100 USA USA Manufacture of animal feed blocks Horslyx LLC 100 USA USA Distributor of animal feed blocks Carr’s Flour Mills Limited 100 England UK Flour milling Carrs Engineering Limited 100 England UK Engineering Wälischmiller Engineering GmbH 100 Germany Germany EngineeringB.R.B. Trust Limited 100 England UK Financial services Carrs Properties Limited 100 England UK Property holding
15 Investment in subsidiary undertakings
Dormant subsidiaries are listed on page 96.
Investments in the subsidiaries listed above are held directly by the Company with the following exceptions: Carrs Engineering Limited holds 100% of the ordinary share capital in Wälischmiller Engineering GmbH and Carrs Agriculture Limited holds 100% of the investment in Horslyx LLC.
16 Deferred tax assets and liabilitiesDeferred tax assets and liabilities are attributable to the following:
Assets Liabilities Net 2015 2014 2015 2014 2015 2014Group £’000 £’000 £’000 £’000 £’000 £’000
Accelerated tax depreciation — — (2,996) (2,932) (2,996) (2,932)Employee benefits — — (353) (412) (353) (412)Other 861 1,507 (835) (767) 26 740
Tax assets/(liabilities) 861 1,507 (4,184) (4,111) (3,323) (2,604)
Movement in deferred tax during the year
At At 31 August Exchange In respect of Recognised Recognised 29 August 2014 differences acquisitions in income in equity 2015 £’000 £’000 £’000 £’000 £’000 £’000
Assets:Other 1,507 118 (32) (732) — 861
1,507 118 (32) (732) — 861
Liabilities:Accelerated tax depreciation (2,932) (10) (39) (15) — (2,996)Employee benefits (412) — — (511) 570 (353) Other (767) 10 — (78) — (835)
(4,111) — (39) (604) 570 (4,184)
Net liabilities (2,604) 118 (71) (1,336) 570 (3,323)
Other deferred tax assets and liabilities includes deferred tax on short term timing differences, rolled over capital gains, trading losses, capital losses, business combinations and overseas deferred tax.

69CARR’S GROUP PLCANNUAL REPORT AND ACCOUNTS 2015
STR
ATEG
IC R
EPO
RT
CO
RPO
RATE
GO
VER
NAN
CE
FINAN
CIA
L STATE
MEN
TS
16 Deferred tax assets and liabilities (continued)
Movement in deferred tax during the prior year
Assets Liabilities Net 2015 2014 2015 2014 2015 2014Company £’000 £’000 £’000 £’000 £’000 £’000
Accelerated tax depreciation 3 3 — — 3 3Employee benefits — — (353) (412) (353) (412)
Tax assets/(liabilities) 3 3 (353) (412) (350) (409)
Movement in deferred tax during the year
At At 1 September Exchange In respect of Recognised Recognised 30 August 2013 differences acquisitions in income in equity 2014 £’000 £’000 £’000 £’000 £’000 £’000
Assets:Employee benefits 654 — — (654) — —Other 1,390 (91) (10) 218 — 1,507
2,044 (91) (10) (436) — 1,507
Liabilities:Accelerated tax depreciation (2,964) 8 (198) 222 — (2,932)Employee benefits — — — 230 (642) (412)Other (801) 12 160 (138) — (767)
(3,765) 20 (38) 314 (642) (4,111)
Net liabilities (1,721) (71) (48) (122) (642) (2,604)
At At 31 August Recognised Recognised 29 August 2014 in income in equity 2015 £’000 £’000 £’000 £’000
Assets:Accelerated tax depreciation 3 — — 3
Liabilities:Employee benefits (412) (511) 570 (353)
Net liabilities (409) (511) 570 (350)
Movement in deferred tax during the prior year
At At 1 September Recognised Recognised 30 August 2013 in income in equity 2014 £’000 £’000 £’000 £’000
Assets:Accelerated tax depreciation 1 2 — 3Employee benefits 654 (654) — —
655 (652) — 3
Liabilities:Employee benefits — 230 (642) (412)
— 230 (642) (412)
Net liabilities 655 (422) (642) (409)
Tax of £133,000 (2014: £133,000) in respect of tax losses has not been recognised as a deferred tax asset in the Group balance sheet.
Tax of £43,000 (2014: £43,000) in respect of tax losses has not been recognised as a deferred tax asset in the Company balance sheet.
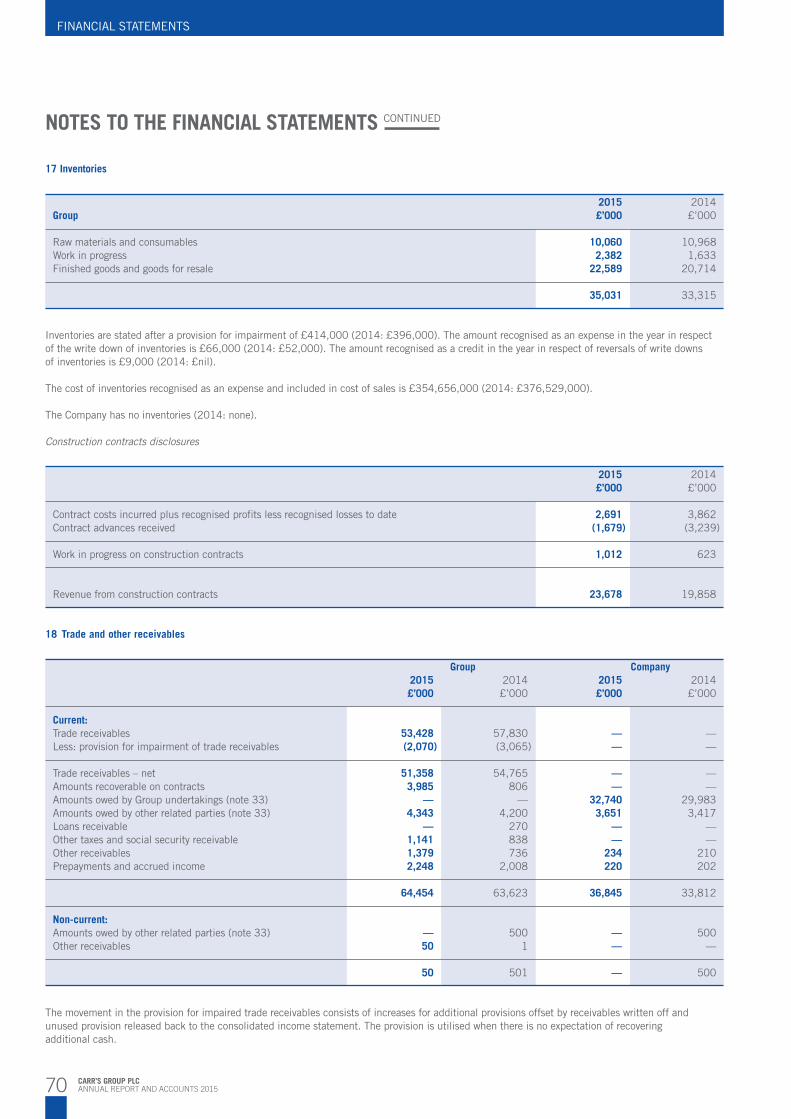
70 CARR’S GROUP PLCANNUAL REPORT AND ACCOUNTS 2015
FINANCIAL STATEMENTS
NOTES TO THE FINANCIAL STATEMENTS CONTINUED
17 Inventories
2015 2014Group £’000 £’000
Raw materials and consumables 10,060 10,968 Work in progress 2,382 1,633Finished goods and goods for resale 22,589 20,714
35,031 33,315
Inventories are stated after a provision for impairment of £414,000 (2014: £396,000). The amount recognised as an expense in the year in respect of the write down of inventories is £66,000 (2014: £52,000). The amount recognised as a credit in the year in respect of reversals of write downs of inventories is £9,000 (2014: £nil).
The cost of inventories recognised as an expense and included in cost of sales is £354,656,000 (2014: £376,529,000).
The Company has no inventories (2014: none).
Construction contracts disclosures
Group Company 2015 2014 2015 2014 £’000 £’000 £’000 £’000
Current:Trade receivables 53,428 57,830 — —Less: provision for impairment of trade receivables (2,070) (3,065) — —
Trade receivables – net 51,358 54,765 — —Amounts recoverable on contracts 3,985 806 — —Amounts owed by Group undertakings (note 33) — — 32,740 29,983Amounts owed by other related parties (note 33) 4,343 4,200 3,651 3,417Loans receivable — 270 — —Other taxes and social security receivable 1,141 838 — —Other receivables 1,379 736 234 210Prepayments and accrued income 2,248 2,008 220 202
64,454 63,623 36,845 33,812
Non-current:Amounts owed by other related parties (note 33) — 500 — 500Other receivables 50 1 — —
50 501 — 500
The movement in the provision for impaired trade receivables consists of increases for additional provisions offset by receivables written off and unused provision released back to the consolidated income statement. The provision is utilised when there is no expectation of recovering additional cash.
2015 2014 £’000 £’000
Contract costs incurred plus recognised profits less recognised losses to date 2,691 3,862 Contract advances received (1,679) (3,239)
Work in progress on construction contracts 1,012 623
Revenue from construction contracts 23,678 19,858
18 Trade and other receivables

71CARR’S GROUP PLCANNUAL REPORT AND ACCOUNTS 2015
STR
ATEG
IC R
EPO
RT
CO
RPO
RATE
GO
VER
NAN
CE
FINAN
CIA
L STATE
MEN
TS
18 Trade and other receivables (continued)During the year a credit of £307,000 (2014: £17,000) has been recognised within administrative expenses in the consolidated income statement in respect of the movement in provision for impairment of trade receivables.
No impairment of other receivables has been recognised in the current or preceding year.
Interest bearing, non-trading amounts owed by Group undertakings carry interest at Bank of England base rate + 2.50%, 4.50% or 4.88%. Such amounts are unsecured and repayable on demand.
Group Company 2015 2014 2015 2014 £’000 £’000 £’000 £’000
The carrying value of trade receivables are denominated in the following currencies:
Sterling 47,443 50,812 — —US Dollar 630 413 — —Euro 2,937 3,540 — —New Zealand Dollar 348 — — —
51,358 54,765 — —
19 Current tax assets
Group Company 2015 2014 2015 2014 £’000 £’000 £’000 £’000
Corporation tax recoverable 839 47 1,256 639Group taxation relief — — 308 553
839 47 1,564 1,192
2015 2014 Past due but Past due but Gross Impairment not impaired Gross Impairment not impaired £’000 £’000 £’000 £’000 £’000 £’000
The ageing of trade receivables is as follows: Not past due 35,236 (123) N/A 40,529 (359) N/APast due 0 – 30 days 6,800 (82) 6,718 7,187 (221) 6,966Past due 31 – 60 days 3,724 (110) 3,614 1,921 (109) 1,812Past due 61 – 90 days 2,667 (104) 2,563 2,367 (321) 2,046Past due 91 – 120 days 1,282 (83) 1,199 1,702 (246) 1,456Past 121 days 3,719 (1,568) 2,151 4,124 (1,809) 2,315
53,428 (2,070) 16,245 57,830 (3,065) 14,595
The Company has no trade receivables (2014: none). The credit quality of customers is assessed at subsidiary and Group level, taking into account their financial positions, past experiences and other relevant factors. Individual customer credit limits are imposed based on these factors. It is Group policy that overdue accounts are reviewed monthly at divisional management meetings to mitigate exposure to credit risk and are provided for where appropriate. The maximum exposure to credit risk at the year end is the carrying value, net of provision for impairment, of each receivable. The Group and Company do not hold any significant collateral as security (2014: none).

72 CARR’S GROUP PLCANNUAL REPORT AND ACCOUNTS 2015
FINANCIAL STATEMENTS
NOTES TO THE FINANCIAL STATEMENTS CONTINUED
20 Cash and cash equivalents and bank overdrafts
Group Company 2015 2014 2015 2014 £’000 £’000 £’000 £’000
Cash and cash equivalents per the balance sheet 16,488 17,268 8,973 8,822Bank overdrafts (note 22) (213) (243) — —
Cash and cash equivalents per the statement of cash flows 16,275 17,025 8,973 8,822
21 Trade and other payables
Group Company 2015 2014 2015 2014 £’000 £’000 £’000 £’000
Current:Trade payables 20,655 20,808 — —Payments on account 1,279 3,027 — —Amounts owed to Group undertakings (note 33) — — 27 29Amounts owed to other related parties (note 33) 18,045 16,072 1 2Other taxes and social security payable 1,162 1,175 683 447Deferred employee incentive plan 2,324 2,217 — —Other payables 5,836 6,978 241 203Accruals and deferred income 5,195 3,959 963 621
54,496 54,236 1,915 1,302
Non-current:Deferred employee incentive plan — 1,973 — —Contingent consideration 2,394 2,394 — —Accruals and deferred income 1,906 1,628 — —
4,300 5,995 — —
Amounts owed to Group undertakings and other related parties are interest free, unsecured and repayable on demand.
The contingent consideration of £2,394,000 on the acquisition of Chirton Engineering Limited in year ended 2014 remains potentially payable subjectto certain earnings criteria being met. As at 29 August 2015 this criteria was not met and therefore none of this contingent consideration is payablewithin one year of the balance sheet date. The earliest that any consideration may fall due would be subsequent to year end 2016.
Included within accruals and deferred income is the following in respect of government grants:
Group Company 2015 2014 2015 2014 £’000 £’000 £’000 £’000
At the beginning of the year 1,628 1,180 — —Subsidiaries acquired — 52 — —Received in the year 500 450 — —Amortisation in the year (120) (54) — —
At the end of the year 2,008 1,628 — —
Included within: Current liabilities 102 — — — Non-current liabilities 1,906 1,628 — —
2,008 1,628 — —
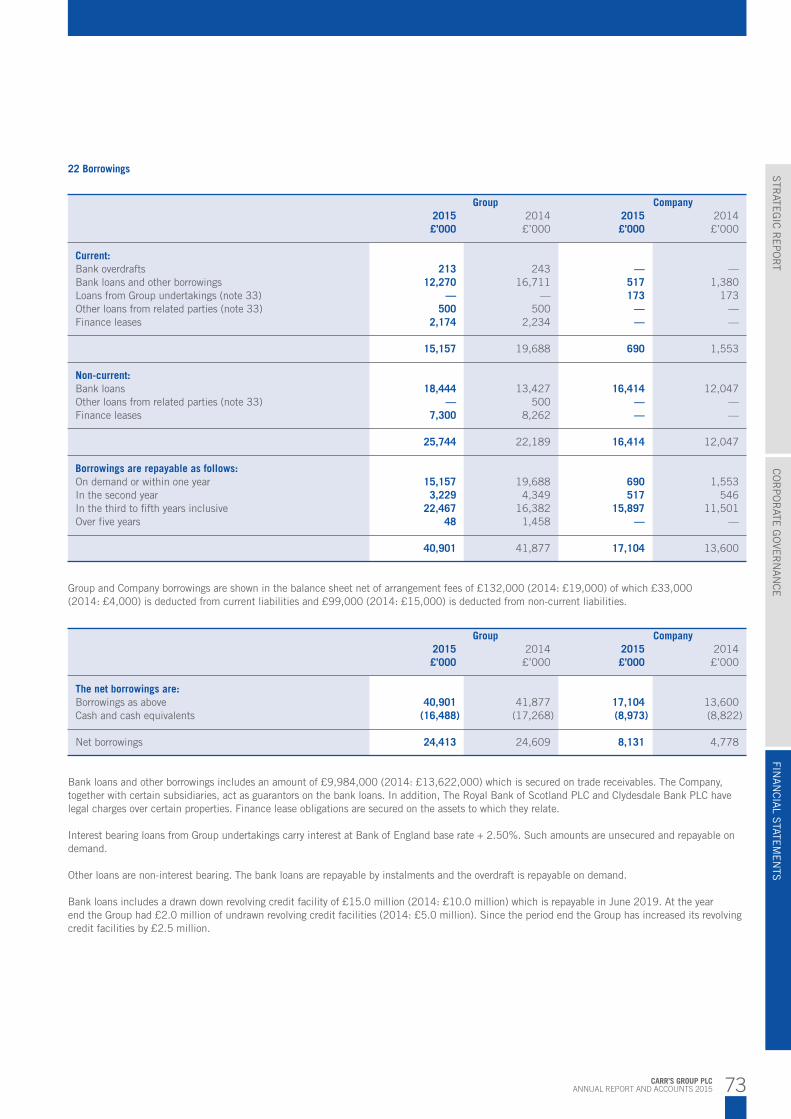
73CARR’S GROUP PLCANNUAL REPORT AND ACCOUNTS 2015
STR
ATEG
IC R
EPO
RT
CO
RPO
RATE
GO
VER
NAN
CE
FINAN
CIA
L STATE
MEN
TS
22 Borrowings
Group Company 2015 2014 2015 2014 £’000 £’000 £’000 £’000
The net borrowings are:Borrowings as above 40,901 41,877 17,104 13,600Cash and cash equivalents (16,488) (17,268) (8,973) (8,822)
Net borrowings 24,413 24,609 8,131 4,778
Bank loans and other borrowings includes an amount of £9,984,000 (2014: £13,622,000) which is secured on trade receivables. The Company, together with certain subsidiaries, act as guarantors on the bank loans. In addition, The Royal Bank of Scotland PLC and Clydesdale Bank PLC have legal charges over certain properties. Finance lease obligations are secured on the assets to which they relate.
Interest bearing loans from Group undertakings carry interest at Bank of England base rate + 2.50%. Such amounts are unsecured and repayable on demand.
Other loans are non-interest bearing. The bank loans are repayable by instalments and the overdraft is repayable on demand.
Bank loans includes a drawn down revolving credit facility of £15.0 million (2014: £10.0 million) which is repayable in June 2019. At the year end the Group had £2.0 million of undrawn revolving credit facilities (2014: £5.0 million). Since the period end the Group has increased its revolving credit facilities by £2.5 million.
Group Company 2015 2014 2015 2014 £’000 £’000 £’000 £’000
Current:Bank overdrafts 213 243 — —Bank loans and other borrowings 12,270 16,711 517 1,380Loans from Group undertakings (note 33) — — 173 173Other loans from related parties (note 33) 500 500 — —Finance leases 2,174 2,234 — —
15,157 19,688 690 1,553
Non-current:Bank loans 18,444 13,427 16,414 12,047Other loans from related parties (note 33) — 500 — —Finance leases 7,300 8,262 — —
25,744 22,189 16,414 12,047
Borrowings are repayable as follows:On demand or within one year 15,157 19,688 690 1,553In the second year 3,229 4,349 517 546In the third to fifth years inclusive 22,467 16,382 15,897 11,501Over five years 48 1,458 — —
40,901 41,877 17,104 13,600
Group and Company borrowings are shown in the balance sheet net of arrangement fees of £132,000 (2014: £19,000) of which £33,000 (2014: £4,000) is deducted from current liabilities and £99,000 (2014: £15,000) is deducted from non-current liabilities.
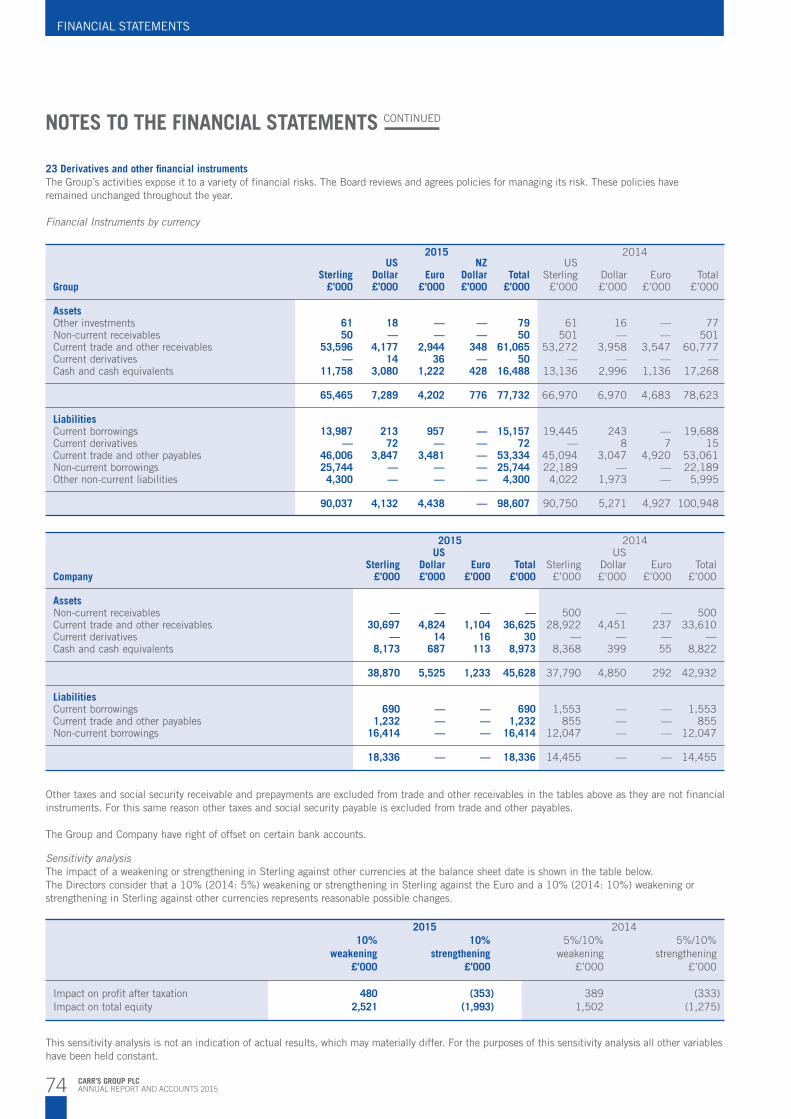
74 CARR’S GROUP PLCANNUAL REPORT AND ACCOUNTS 2015
FINANCIAL STATEMENTS
NOTES TO THE FINANCIAL STATEMENTS CONTINUED
23 Derivatives and other financial instruments The Group’s activities expose it to a variety of financial risks. The Board reviews and agrees policies for managing its risk. These policies have remained unchanged throughout the year.
Financial Instruments by currency 2015 2014 US NZ US Sterling Dollar Euro Dollar Total Sterling Dollar Euro Total
Group £’000 £’000 £’000 £’000 £’000 £’000 £’000 £’000 £’000
Assets Other investments 61 18 — — 79 61 16 — 77Non-current receivables 50 — — — 50 501 — — 501Current trade and other receivables 53,596 4,177 2,944 348 61,065 53,272 3,958 3,547 60,777Current derivatives — 14 36 — 50 — — — —Cash and cash equivalents 11,758 3,080 1,222 428 16,488 13,136 2,996 1,136 17,268
65,465 7,289 4,202 776 77,732 66,970 6,970 4,683 78,623
Liabilities Current borrowings 13,987 213 957 — 15,157 19,445 243 — 19,688Current derivatives — 72 — — 72 — 8 7 15Current trade and other payables 46,006 3,847 3,481 — 53,334 45,094 3,047 4,920 53,061Non-current borrowings 25,744 — — — 25,744 22,189 — — 22,189Other non-current liabilities 4,300 — — — 4,300 4,022 1,973 — 5,995
90,037 4,132 4,438 — 98,607 90,750 5,271 4,927 100,948
2015 2014 US US Sterling Dollar Euro Total Sterling Dollar Euro Total
Company £’000 £’000 £’000 £’000 £’000 £’000 £’000 £’000
Assets Non-current receivables — — — — 500 — — 500Current trade and other receivables 30,697 4,824 1,104 36,625 28,922 4,451 237 33,610Current derivatives — 14 16 30 — — — —Cash and cash equivalents 8,173 687 113 8,973 8,368 399 55 8,822
38,870 5,525 1,233 45,628 37,790 4,850 292 42,932
Liabilities Current borrowings 690 — — 690 1,553 — — 1,553Current trade and other payables 1,232 — — 1,232 855 — — 855Non-current borrowings 16,414 — — 16,414 12,047 — — 12,047
18,336 — — 18,336 14,455 — — 14,455
Other taxes and social security receivable and prepayments are excluded from trade and other receivables in the tables above as they are not financial instruments. For this same reason other taxes and social security payable is excluded from trade and other payables.
The Group and Company have right of offset on certain bank accounts.
Sensitivity analysis The impact of a weakening or strengthening in Sterling against other currencies at the balance sheet date is shown in the table below. The Directors consider that a 10% (2014: 5%) weakening or strengthening in Sterling against the Euro and a 10% (2014: 10%) weakening or strengthening in Sterling against other currencies represents reasonable possible changes.
2015 2014 10% 10% 5%/10% 5%/10% weakening strengthening weakening strengthening £’000 £’000 £’000 £’000
Impact on profit after taxation 480 (353) 389 (333)Impact on total equity 2,521 (1,993) 1,502 (1,275)
This sensitivity analysis is not an indication of actual results, which may materially differ. For the purposes of this sensitivity analysis all other variables have been held constant.
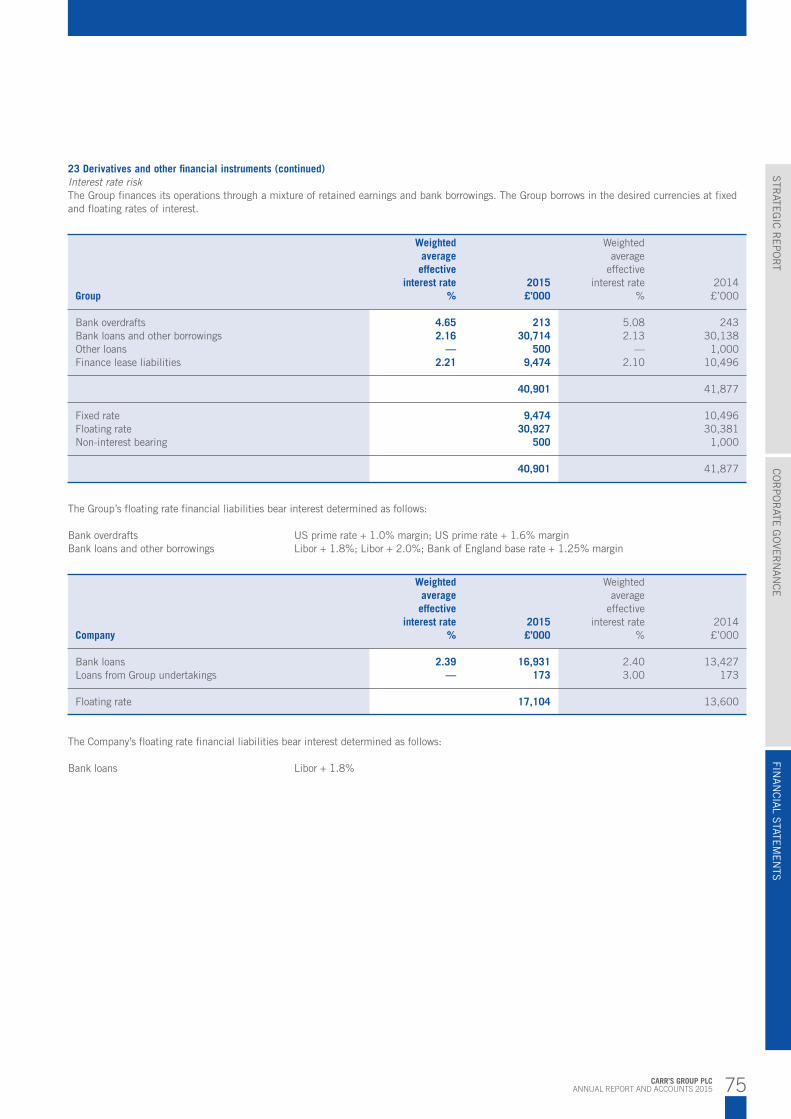
75CARR’S GROUP PLCANNUAL REPORT AND ACCOUNTS 2015
STR
ATEG
IC R
EPO
RT
CO
RPO
RATE
GO
VER
NAN
CE
FINAN
CIA
L STATE
MEN
TS
23 Derivatives and other financial instruments (continued)Interest rate risk The Group finances its operations through a mixture of retained earnings and bank borrowings. The Group borrows in the desired currencies at fixed and floating rates of interest.
Weighted Weighted average average effective effective interest rate 2015 interest rate 2014Group % £’000 % £’000
Bank overdrafts 4.65 213 5.08 243Bank loans and other borrowings 2.16 30,714 2.13 30,138Other loans — 500 — 1,000Finance lease liabilities 2.21 9,474 2.10 10,496
40,901 41,877
Fixed rate 9,474 10,496Floating rate 30,927 30,381Non-interest bearing 500 1,000
40,901 41,877
The Group’s floating rate financial liabilities bear interest determined as follows:
Bank overdrafts US prime rate + 1.0% margin; US prime rate + 1.6% margin Bank loans and other borrowings Libor + 1.8%; Libor + 2.0%; Bank of England base rate + 1.25% margin
Weighted Weighted average average effective effective interest rate 2015 interest rate 2014Company % £’000 % £’000
Bank loans 2.39 16,931 2.40 13,427Loans from Group undertakings — 173 3.00 173
Floating rate 17,104 13,600
The Company’s floating rate financial liabilities bear interest determined as follows: Bank loans Libor + 1.8%

76 CARR’S GROUP PLCANNUAL REPORT AND ACCOUNTS 2015
FINANCIAL STATEMENTS
NOTES TO THE FINANCIAL STATEMENTS CONTINUED
23 Derivatives and other financial instruments (continued)Sensitivity analysis The impact of a decrease or increase in interest rates during the year is shown in the table below. The Directors consider that a 1% movement in interest rates represents reasonable possible changes.
2015 2014 1% decrease 1% increase 1% decrease 1% increase £’000 £’000 £’000 £’000
Impact on profit after taxation 383 (383) 312 (312)Impact on total equity 383 (383) 312 (312)
This sensitivity analysis is not an indication of actual results, which may materially differ. For the purposes of this sensitivity analysis all other variables have been held constant.
Liquidity risk The Group’s policy throughout the year has been to maintain a mix of short and medium term borrowings. Short-term flexibility is achieved by overdraft facilities. In addition it is the Group’s policy to maintain committed undrawn facilities in order to provide flexibility in the management of the Group’s liquidity.
The tables below analyse the Group and Company’s financial liabilities which will be settled on a net basis into relevant maturity groupings based on the remaining period at the balance sheet date to the contractual maturity date. The amounts disclosed in the tables are the contractual undiscounted cash flows which have been calculated using spot rates at the relevant balance sheet date.
2015 2014 Within One to Two to Over Within One to Two to Over one two five five one two five five Total year years years years Total year years years years
Group £’000 £’000 £’000 £’000 £’000 £’000 £’000 £’000 £’000 £’000
Bank overdrafts 213 213 — — — 243 243 — — —Bank loans and other borrowings 32,445 12,768 1,793 17,884 — 31,530 17,068 2,227 12,235 —Other loans 500 500 — — — 1,000 500 500 — —Finance lease liabilities 10,338 2,482 2,131 5,666 59 11,590 2,602 2,196 5,312 1,480Derivatives 72 72 — — — 15 15 — — —Trade and other payables 53,334 53,334 — — — 53,061 53,061 — — —Other non-current liabilities 4,300 120 2,514 1,666 — 5,995 — 4,367 1,628 —
101,202 69,489 6,438 25,216 59 103,434 73,489 9,290 19,175 1,480
2015 2014 Within One to Two to Within One to Two to one two five one two five Total year years years Total year years years
Company £’000 £’000 £’000 £’000 £’000 £’000 £’000 £’000
Bank loans 18,533 952 939 16,642 13,427 1,380 546 11,501Loans from Group undertakings 173 173 — — 173 173 — —Trade and other payables 1,232 1,232 — — 855 855 — —
19,938 2,357 939 16,642 14,455 2,408 546 11,501
Trade and other payables in the tables above exclude other taxes and social security which do not meet the definition of financial liabilities under IFRS 7.

77CARR’S GROUP PLCANNUAL REPORT AND ACCOUNTS 2015
STR
ATEG
IC R
EPO
RT
CO
RPO
RATE
GO
VER
NAN
CE
FINAN
CIA
L STATE
MEN
TS
Repayment profile 2015 2014 2015 2014Group £’000 £’000 £’000 £’000
Amount payable: Within one year 2,482 2,602 2,174 2,234In the second year 2,131 2,196 1,900 1,923In the third to fifth years inclusive 5,666 5,312 5,352 4,881Over five years 59 1,480 48 1,458
10,338 11,590 9,474 10,496
Less: future finance charges (864) (1,094) Present value of lease obligations 9,474 10,496
The Company has no finance lease obligations (2014: none).
Borrowing facilities The Group has various undrawn facilities. The undrawn facilities available at 29 August 2015, in respect of which all conditions precedent had beenmet, were as follows:
23 Derivatives and other financial instruments (continued)Future minimum lease payments of finance leases
2015 2014 Floating rate Floating rate £’000 £’000
Expiring in one year or less 17,007 12,449Expiring within two and five years inclusive 2,000 5,000
19,007 17,449
The Company’s overdraft is within a Group facility and it is therefore not possible to determine the Company’s undrawn facilities at the balance sheet date.
Capital risk management The Group’s objectives when managing capital are to safeguard the Group’s ability to continue as a going concern in order to provide returns for shareholders and benefits for other stakeholders and to maintain an efficient capital structure to optimise the cost of capital. In order to maintain or adjust the capital structure, the Group may adjust the amount of dividends paid to shareholders, return capital to shareholders, issue new shares or sell assets to reduce debt.
The Group monitors capital on the basis of the gearing ratio. This ratio is calculated as net debt divided by total equity. Net debt is calculated as total borrowings (including current and non-current borrowings) as shown in the consolidated balance sheet less cash and cash equivalents. Total equity is as shown in the consolidated balance sheet.
At 29 August 2015 the Group had net debt of £24.4 million (2014: £24.6 million) and gearing of 24.7% (2014: 27.4%).
The Group monitors cash balances and net debt on a daily basis to ensure adequate headroom exists on banking facilities and that it is compliant with banking covenants.
Fair value hierarchyIFRS 13 requires financial instruments that are measured at fair value to be classified according to the valuation technique used:
Level 1 – quoted prices (unadjusted) in active markets for identical assets or liabilitiesLevel 2 – inputs, other than Level 1 inputs, that are observable for the asset or liability, either directly (i.e., as prices) or indirectly (i.e., derived from prices) Level 3 – unobservable inputs
All derivative financial instruments are measured at fair value using Level 2 inputs. There were no transfers between levels in the above hierarchy in either the current or prior year.
The Group holds shares in several private limited companies. These have been classified as unquoted investments for which fair value cannot be reliably measured and are held at cost less accumulated impairment. Had fair value been applied this financial asset would have been Level 3.
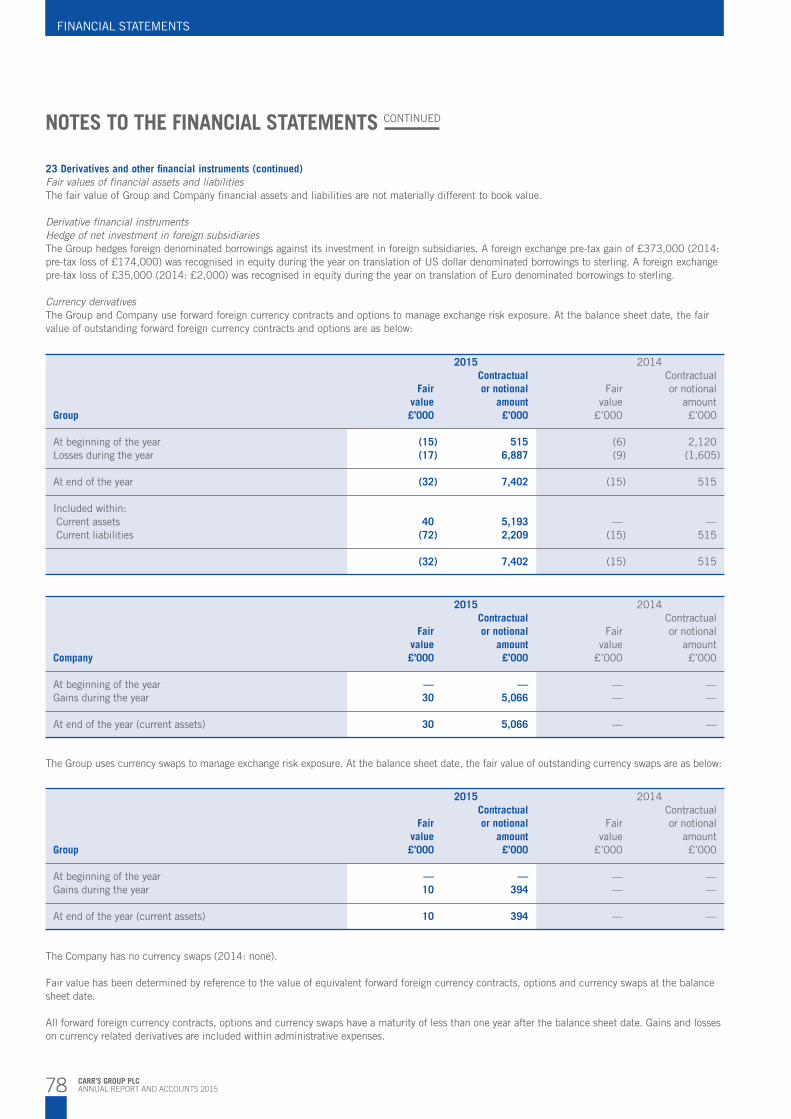
78 CARR’S GROUP PLCANNUAL REPORT AND ACCOUNTS 2015
FINANCIAL STATEMENTS
NOTES TO THE FINANCIAL STATEMENTS CONTINUED
23 Derivatives and other financial instruments (continued)Fair values of financial assets and liabilitiesThe fair value of Group and Company financial assets and liabilities are not materially different to book value.
Derivative financial instruments Hedge of net investment in foreign subsidiariesThe Group hedges foreign denominated borrowings against its investment in foreign subsidiaries. A foreign exchange pre-tax gain of £373,000 (2014: pre-tax loss of £174,000) was recognised in equity during the year on translation of US dollar denominated borrowings to sterling. A foreign exchange pre-tax loss of £35,000 (2014: £2,000) was recognised in equity during the year on translation of Euro denominated borrowings to sterling.
Currency derivatives The Group and Company use forward foreign currency contracts and options to manage exchange risk exposure. At the balance sheet date, the fair value of outstanding forward foreign currency contracts and options are as below:
2015 2014 Contractual Contractual Fair or notional Fair or notional value amount value amountGroup £’000 £’000 £’000 £’000
At beginning of the year (15) 515 (6) 2,120Losses during the year (17) 6,887 (9) (1,605)
At end of the year (32) 7,402 (15) 515
Included within: Current assets 40 5,193 — — Current liabilities (72) 2,209 (15) 515
(32) 7,402 (15) 515
2015 2014 Contractual Contractual Fair or notional Fair or notional value amount value amountGroup £’000 £’000 £’000 £’000
At beginning of the year — — — —Gains during the year 10 394 — —
At end of the year (current assets) 10 394 — —
The Company has no currency swaps (2014: none).
Fair value has been determined by reference to the value of equivalent forward foreign currency contracts, options and currency swaps at the balance sheet date.
All forward foreign currency contracts, options and currency swaps have a maturity of less than one year after the balance sheet date. Gains and losses on currency related derivatives are included within administrative expenses.
2015 2014 Contractual Contractual Fair or notional Fair or notional value amount value amountCompany £’000 £’000 £’000 £’000
At beginning of the year — — — —Gains during the year 30 5,066 — —
At end of the year (current assets) 30 5,066 — —
The Group uses currency swaps to manage exchange risk exposure. At the balance sheet date, the fair value of outstanding currency swaps are as below:
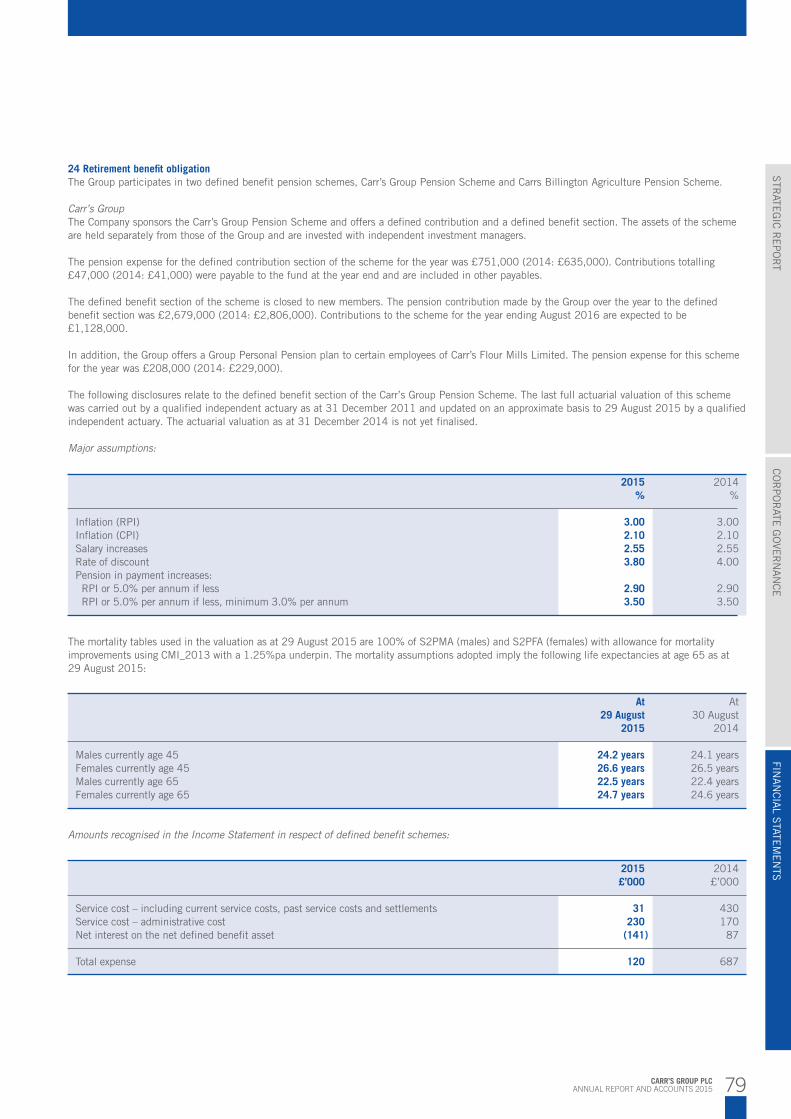
79CARR’S GROUP PLCANNUAL REPORT AND ACCOUNTS 2015
STR
ATEG
IC R
EPO
RT
CO
RPO
RATE
GO
VER
NAN
CE
FINAN
CIA
L STATE
MEN
TS
24 Retirement benefit obligationThe Group participates in two defined benefit pension schemes, Carr’s Group Pension Scheme and Carrs Billington Agriculture Pension Scheme.
Carr’s GroupThe Company sponsors the Carr’s Group Pension Scheme and offers a defined contribution and a defined benefit section. The assets of the scheme are held separately from those of the Group and are invested with independent investment managers.
The pension expense for the defined contribution section of the scheme for the year was £751,000 (2014: £635,000). Contributions totalling £47,000 (2014: £41,000) were payable to the fund at the year end and are included in other payables.
The defined benefit section of the scheme is closed to new members. The pension contribution made by the Group over the year to the defined benefit section was £2,679,000 (2014: £2,806,000). Contributions to the scheme for the year ending August 2016 are expected to be £1,128,000.
In addition, the Group offers a Group Personal Pension plan to certain employees of Carr’s Flour Mills Limited. The pension expense for this scheme for the year was £208,000 (2014: £229,000).
The following disclosures relate to the defined benefit section of the Carr’s Group Pension Scheme. The last full actuarial valuation of this scheme was carried out by a qualified independent actuary as at 31 December 2011 and updated on an approximate basis to 29 August 2015 by a qualified independent actuary. The actuarial valuation as at 31 December 2014 is not yet finalised.
Major assumptions:
2015 2014 % %
Inflation (RPI) 3.00 3.00Inflation (CPI) 2.10 2.10Salary increases 2.55 2.55Rate of discount 3.80 4.00Pension in payment increases: RPI or 5.0% per annum if less 2.90 2.90 RPI or 5.0% per annum if less, minimum 3.0% per annum 3.50 3.50
The mortality tables used in the valuation as at 29 August 2015 are 100% of S2PMA (males) and S2PFA (females) with allowance for mortality improvements using CMI_2013 with a 1.25%pa underpin. The mortality assumptions adopted imply the following life expectancies at age 65 as at 29 August 2015:
At At 29 August 30 August 2015 2014
Males currently age 45 24.2 years 24.1 yearsFemales currently age 45 26.6 years 26.5 yearsMales currently age 65 22.5 years 22.4 yearsFemales currently age 65 24.7 years 24.6 years
Amounts recognised in the Income Statement in respect of defined benefit schemes:
2015 2014 £’000 £’000
Service cost – including current service costs, past service costs and settlements 31 430Service cost – administrative cost 230 170Net interest on the net defined benefit asset (141) 87
Total expense 120 687
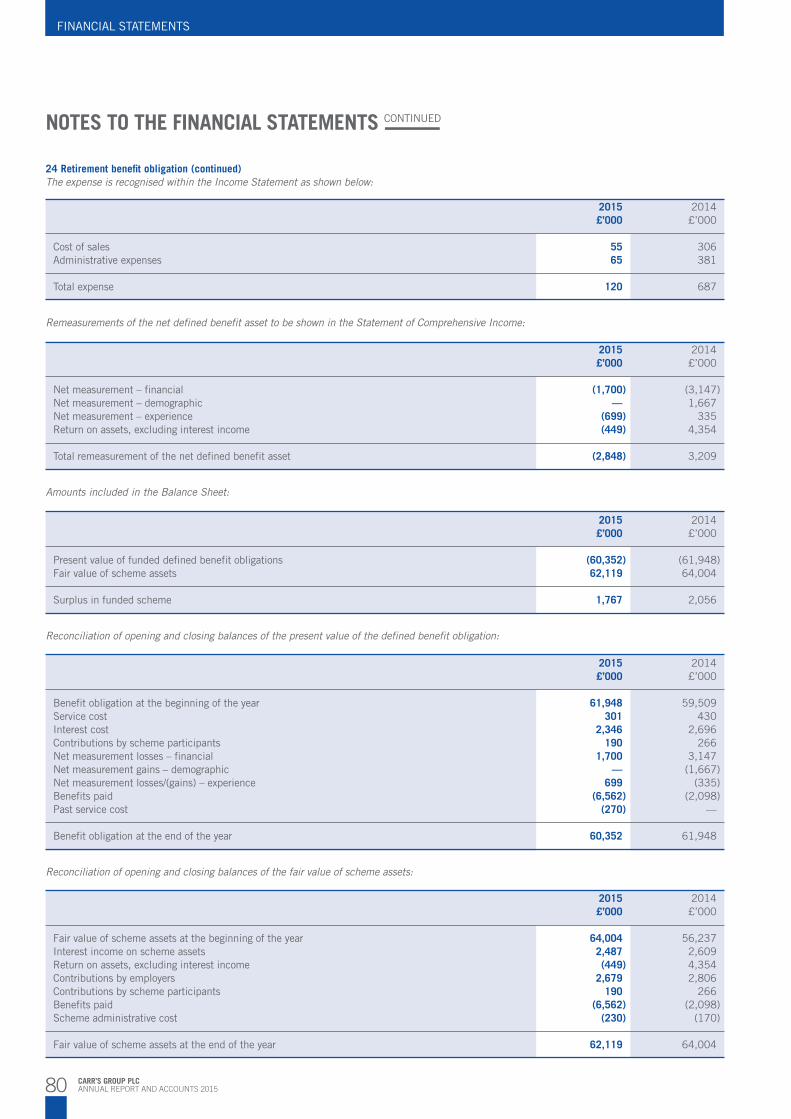
80 CARR’S GROUP PLCANNUAL REPORT AND ACCOUNTS 2015
FINANCIAL STATEMENTS
NOTES TO THE FINANCIAL STATEMENTS CONTINUED
24 Retirement benefit obligation (continued)The expense is recognised within the Income Statement as shown below:
2015 2014 £’000 £’000
Cost of sales 55 306 Administrative expenses 65 381
Total expense 120 687
Remeasurements of the net defined benefit asset to be shown in the Statement of Comprehensive Income:
2015 2014 £’000 £’000
Present value of funded defined benefit obligations (60,352) (61,948)Fair value of scheme assets 62,119 64,004
Surplus in funded scheme 1,767 2,056
Reconciliation of opening and closing balances of the present value of the defined benefit obligation:
2015 2014 £’000 £’000
Net measurement – financial (1,700) (3,147)Net measurement – demographic — 1,667Net measurement – experience (699) 335Return on assets, excluding interest income (449) 4,354
Total remeasurement of the net defined benefit asset (2,848) 3,209
Amounts included in the Balance Sheet:
2015 2014 £’000 £’000
Benefit obligation at the beginning of the year 61,948 59,509Service cost 301 430Interest cost 2,346 2,696Contributions by scheme participants 190 266Net measurement losses – financial 1,700 3,147Net measurement gains – demographic — (1,667)Net measurement losses/(gains) – experience 699 (335)Benefits paid (6,562) (2,098)Past service cost (270) —
Benefit obligation at the end of the year 60,352 61,948
Reconciliation of opening and closing balances of the fair value of scheme assets:
2015 2014 £’000 £’000
Fair value of scheme assets at the beginning of the year 64,004 56,237Interest income on scheme assets 2,487 2,609Return on assets, excluding interest income (449) 4,354Contributions by employers 2,679 2,806Contributions by scheme participants 190 266Benefits paid (6,562) (2,098)Scheme administrative cost (230) (170)
Fair value of scheme assets at the end of the year 62,119 64,004

81CARR’S GROUP PLCANNUAL REPORT AND ACCOUNTS 2015
STR
ATEG
IC R
EPO
RT
CO
RPO
RATE
GO
VER
NAN
CE
FINAN
CIA
L STATE
MEN
TS
24 Retirement benefit obligation (continued)Analysis of the scheme assets and actual return:
Fair value of assets 2015 2014 £’000 £’000
Equity instruments 28,476 32,524Debt instruments 27,177 26,276Property 5,637 5,038Other assets 829 166 62,119 64,004
Actual return on scheme assets 2,038 6,963
Sensitivity analysisA sensitivity analysis of the principal assumptions used to measure the scheme liabilities:
Impact on scheme Change in liabilities assumption 29 August 2015
Discount rate Increase by 0.25% Decrease by £2.2 millionRate of inflation Increase by 0.25% Increase by £1.7 millionAssumed life expectancy at age 65 Increase by 1 year Increase by £1.9 million
Extrapolation or combination of the sensitivity analysis beyond the ranges shown may not be appropriate.
Characteristics of the Scheme and the risks associated with the Schemea) Information about the characteristics of the Scheme
i. The Scheme provides pensions in retirement and death benefits to members. Pension benefits are linked to member’s final salary at retirement and their length of service.
ii. The Plan is a registered scheme under UK legislation and is contracted out of the State Second Pension.
The plan is subject to the scheme funding requirements outlined in UK legislation. The scheme funding valuation of the Scheme as at 31 December 2011 revealed a deficit of £9.9 million. In the recovery plan dated August 2012 the Employer agreed to pay contributions of £195,000 per month with the view to eliminating the shortfall by 31 December 2015.
In line with previous years there is no additional liability recognised on the balance sheet as a result of the recovery plan dated August 2012.
iii. The Scheme was established under trust and is governed by the Scheme’s trust deed and rules dated June 2008. The Trustees are responsible for the operation and the governance of the Scheme, including making decisions regarding the Scheme’s funding and investment strategy in conjunction with the Employer.
b) Information about risks of the Scheme to the Employer
In general, the risk to the Employer is that the assumptions underlying the disclosures, or the the calculation of contribution requirements are not borne out in practice and the cost to the Employer is higher than expected. This could result in higher contributions required from the Employer and a higher deficit disclosed. This may also impact the Employer’s ability to grant discretionary benefits or other enhancements to members.
i. The return on the Scheme’s assets being lower than assumed, resulting in an unaffordable increase in the required Employer contribution rate.
ii. Falls in asset values (particularly equities) not being matched by similar falls in the value of liabilities.
iii. Unanticipated future changes in mortality patterns leading to an increase in the Scheme’s liabilities. Future mortality rates cannot be predicted with certainty. This is especially so bearing in mind that the youngest Scheme members could be expected to still be alive in 50 years or more and it is not possible to reliably predict what medical advances may or may not have occurred by this time. The average duration of the Scheme’s liabilities is approximately 16 years.
iv. The potential exercise (by members or others) of options against the Scheme for example taking early retirement or exchanging a portion of pension for a cash lump sum.

82 CARR’S GROUP PLCANNUAL REPORT AND ACCOUNTS 2015
FINANCIAL STATEMENTS
NOTES TO THE FINANCIAL STATEMENTS CONTINUED
24 Retirement benefit obligation (continued)Carrs Billington AgricultureCarrs Billington Agriculture (Sales) Limited, one of the Group’s subsidiary undertakings, is a participating employer of the Carrs Billington Agriculture Pension Scheme, another funded defined benefit scheme. On 30 November 2007, following consultation with the active members, the Company and Trustees agreed to close the scheme to future service accrual. The most recent actuarial assessment of the scheme was at 31 December 2012.
The pension contribution made by Carrs Billington Agriculture (Sales) Limited over the year to the Carrs Billington Agriculture Pension Scheme was £nil (2014: £nil).
It is not possible to identify the underlying share of the pension scheme assets and liabilities that relate to the Group. At inception in June 2000 approximately 50% of the assets and liabilities of the pension scheme related to the Group and under IFRS approximately 50% of the assets and liabilities are included in the Group’s financial statements through the investment in associate, which is the sponsoring employer of the scheme.
Details and disclosures in respect of the scheme are provided in the financial statements of Carrs Billington Agriculture (Operations) Limited which are publicly available.
Carrs Billington Agriculture (Sales) Limited offers a Group Personal Pension Plan to its employees and the pension expense for this plan in the year was £451,000 (2014: £414,000).
During the year contributions were also payable to a defined contribution pension scheme for certain employees of Carrs Billington Agriculture (Sales) Limited. The pension expense for this scheme for the year was £32,000 (2014: £23,000).
25 Share capital
2015 2015 2014 2014Group and Company Shares £’000 Shares1 £’000
Authorised: Ordinary shares of 2.5p each 140,000,000 3,500 140,000,000 3,500
Allotted and fully paid ordinary shares of 2.5p each: At start of the year 89,401,900 2,235 88,902,300 2,223 Allotment of shares 358,190 9 499,600 12
At end of the year 89,760,090 2,244 89,401,900 2,235
1 Restated for the effect of the 10:1 share split in January 2015
The consideration received on the allotment of shares during the year was £171,000 (2014: £283,000).
For details of share based payment schemes see note 26.
Since the year end there was a further allotment of 60,590 shares with a nominal value of £1,515 due to the exercise of share options.
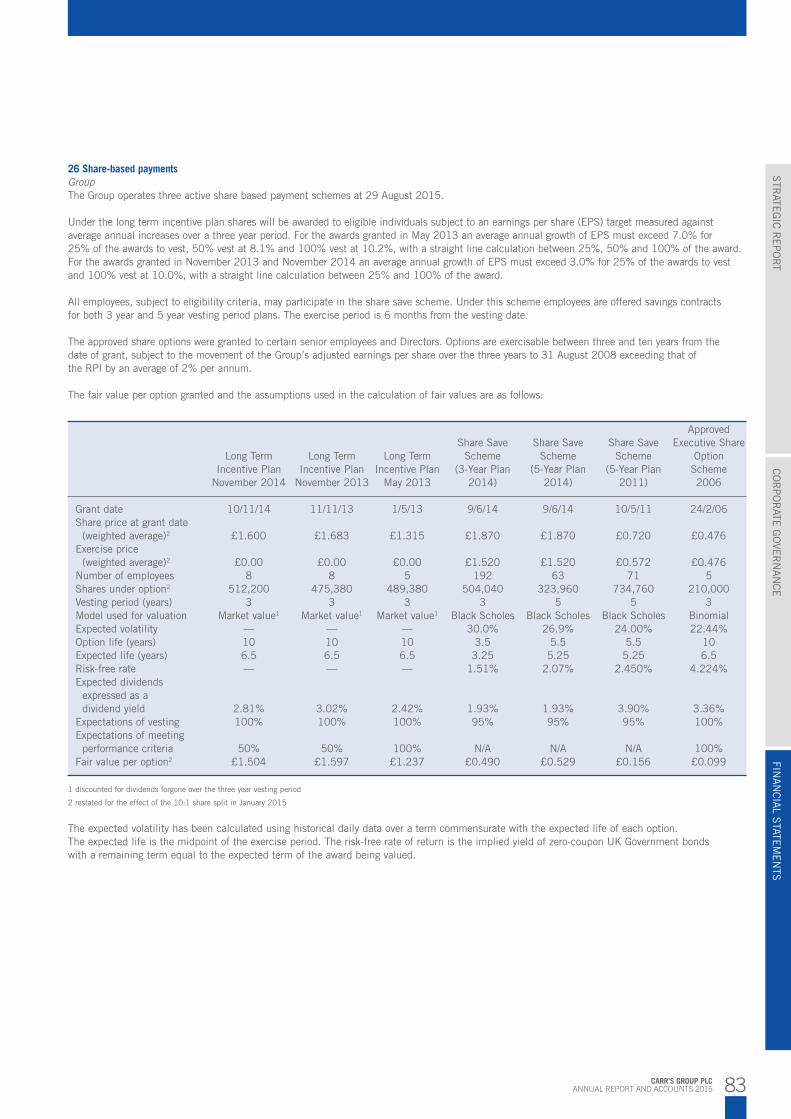
83CARR’S GROUP PLCANNUAL REPORT AND ACCOUNTS 2015
STR
ATEG
IC R
EPO
RT
CO
RPO
RATE
GO
VER
NAN
CE
FINAN
CIA
L STATE
MEN
TS
26 Share-based payments GroupThe Group operates three active share based payment schemes at 29 August 2015.
Under the long term incentive plan shares will be awarded to eligible individuals subject to an earnings per share (EPS) target measured against average annual increases over a three year period. For the awards granted in May 2013 an average annual growth of EPS must exceed 7.0% for 25% of the awards to vest, 50% vest at 8.1% and 100% vest at 10.2%, with a straight line calculation between 25%, 50% and 100% of the award. For the awards granted in November 2013 and November 2014 an average annual growth of EPS must exceed 3.0% for 25% of the awards to vest and 100% vest at 10.0%, with a straight line calculation between 25% and 100% of the award.
All employees, subject to eligibility criteria, may participate in the share save scheme. Under this scheme employees are offered savings contracts for both 3 year and 5 year vesting period plans. The exercise period is 6 months from the vesting date.
The approved share options were granted to certain senior employees and Directors. Options are exercisable between three and ten years from the date of grant, subject to the movement of the Group’s adjusted earnings per share over the three years to 31 August 2008 exceeding that of the RPI by an average of 2% per annum.
The fair value per option granted and the assumptions used in the calculation of fair values are as follows:
Approved Share Save Share Save Share Save Executive Share Long Term Long Term Long Term Scheme Scheme Scheme Option Incentive Plan Incentive Plan Incentive Plan (3-Year Plan (5-Year Plan (5-Year Plan Scheme November 2014 November 2013 May 2013 2014) 2014) 2011) 2006
Grant date 10/11/14 11/11/13 1/5/13 9/6/14 9/6/14 10/5/11 24/2/06Share price at grant date (weighted average)2 £1.600 £1.683 £1.315 £1.870 £1.870 £0.720 £0.476Exercise price (weighted average)2 £0.00 £0.00 £0.00 £1.520 £1.520 £0.572 £0.476Number of employees 8 8 5 192 63 71 5Shares under option2 512,200 475,380 489,380 504,040 323,960 734,760 210,000Vesting period (years) 3 3 3 3 5 5 3Model used for valuation Market value1 Market value1 Market value1 Black Scholes Black Scholes Black Scholes BinomialExpected volatility — — — 30.0% 26.9% 24.00% 22.44%Option life (years) 10 10 10 3.5 5.5 5.5 10Expected life (years) 6.5 6.5 6.5 3.25 5.25 5.25 6.5Risk-free rate — — — 1.51% 2.07% 2.450% 4.224%Expected dividends expressed as a dividend yield 2.81% 3.02% 2.42% 1.93% 1.93% 3.90% 3.36%Expectations of vesting 100% 100% 100% 95% 95% 95% 100%Expectations of meeting performance criteria 50% 50% 100% N/A N/A N/A 100%Fair value per option2 £1.504 £1.597 £1.237 £0.490 £0.529 £0.156 £0.099
1 discounted for dividends forgone over the three year vesting period
2 restated for the effect of the 10:1 share split in January 2015
The expected volatility has been calculated using historical daily data over a term commensurate with the expected life of each option. The expected life is the midpoint of the exercise period. The risk-free rate of return is the implied yield of zero-coupon UK Government bonds with a remaining term equal to the expected term of the award being valued.
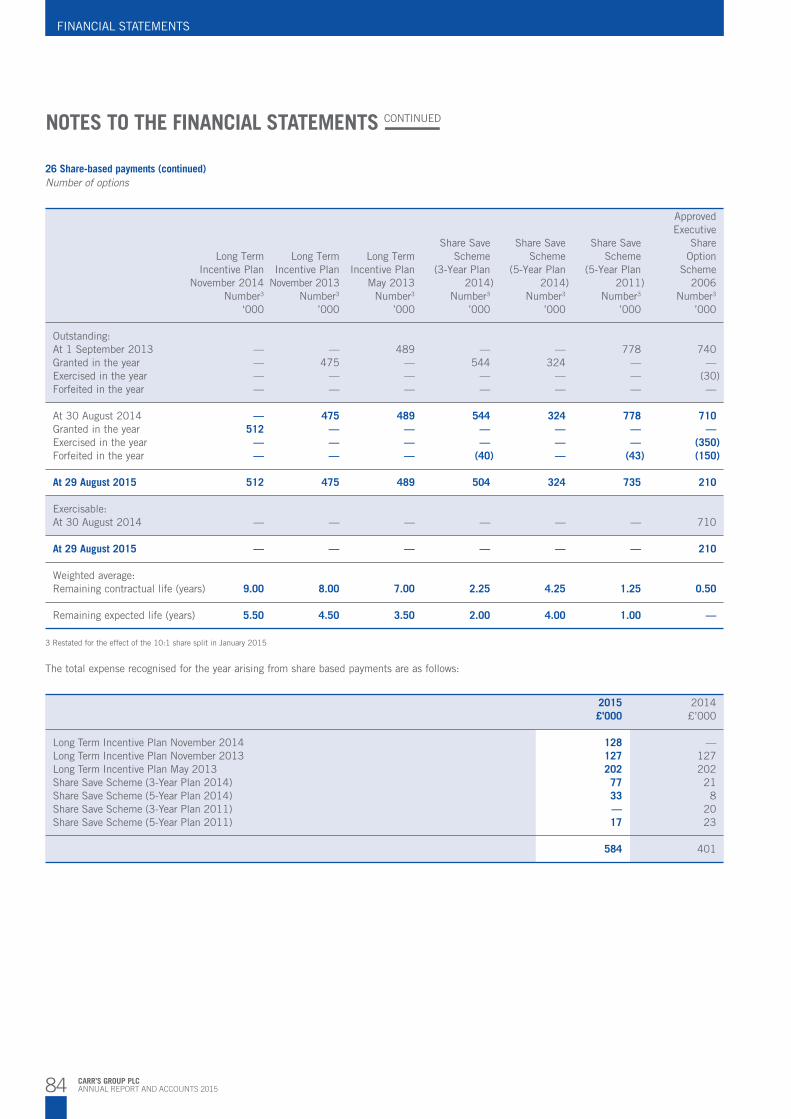
84 CARR’S GROUP PLCANNUAL REPORT AND ACCOUNTS 2015
FINANCIAL STATEMENTS
NOTES TO THE FINANCIAL STATEMENTS CONTINUED
26 Share-based payments (continued)Number of options
Approved Executive Share Save Share Save Share Save Share Long Term Long Term Long Term Scheme Scheme Scheme Option Incentive Plan Incentive Plan Incentive Plan (3-Year Plan (5-Year Plan (5-Year Plan Scheme November 2014 November 2013 May 2013 2014) 2014) 2011) 2006 Number3 Number3 Number3 Number3 Number3 Number3 Number3
‘000 ’000 ’000 ’000 ’000 ’000 ’000
Outstanding: At 1 September 2013 — — 489 — — 778 740 Granted in the year — 475 — 544 324 — — Exercised in the year — — — — — — (30)Forfeited in the year — — — — — — —
At 30 August 2014 — 475 489 544 324 778 710Granted in the year 512 — — — — — —Exercised in the year — — — — — — (350)Forfeited in the year — — — (40) — (43) (150)
At 29 August 2015 512 475 489 504 324 735 210
Exercisable: At 30 August 2014 — — — — — — 710
At 29 August 2015 — — — — — — 210
Weighted average: Remaining contractual life (years) 9.00 8.00 7.00 2.25 4.25 1.25 0.50
Remaining expected life (years) 5.50 4.50 3.50 2.00 4.00 1.00 —
3 Restated for the effect of the 10:1 share split in January 2015
The total expense recognised for the year arising from share based payments are as follows:
2015 2014 £’000 £’000
Long Term Incentive Plan November 2014 128 —Long Term Incentive Plan November 2013 127 127 Long Term Incentive Plan May 2013 202 202Share Save Scheme (3-Year Plan 2014) 77 21Share Save Scheme (5-Year Plan 2014) 33 8Share Save Scheme (3-Year Plan 2011) — 20Share Save Scheme (5-Year Plan 2011) 17 23
584 401

85CARR’S GROUP PLCANNUAL REPORT AND ACCOUNTS 2015
STR
ATEG
IC R
EPO
RT
CO
RPO
RATE
GO
VER
NAN
CE
FINAN
CIA
L STATE
MEN
TS
2015 2014 £’000 £’000
Long Term Incentive Plan November 2014 84 —Long Term Incentive Plan November 2013 83 83 Long Term Incentive May Plan 2013 137 137Share Save Scheme (3-Year Plan 2014) 11 3 Share Save Scheme (5-Year Plan 2014) 1 —Share Save Scheme (3-Year Plan 2011) — 5Share Save Scheme (5-Year Plan 2011) 1 1
317 229
Share based payments awarded to employees of subsidiary undertakings and recognised as an investment in subsidiary undertakings in the Company are as follows:
2015 2014 £’000 £’000
Long Term Incentive Plan November 2014 45 —Long Term Incentive Plan November 2013 88 44Long Term Incentive Plan May 2013 195 130Share Save Scheme (3-Year Plan 2014) 83 18Share Save Scheme (5-Year Plan 2014) 39 8Share Save Scheme (3-Year Plan 2011) — 1Share Save Scheme (5-Year Plan 2011) 87 74Approved Executive Share Option Scheme 2006 21 64
Total carrying amount of investments 558 339
27 AcquisitionsWM. Nicholls & Company (Crickhowell) LimitedOn 20 October 2014 Carrs Billington Agriculture (Sales) Limited acquired the entire issued share capital of WM. Nicholls & Company (Crickhowell) Limited. As a condition of this acquisition the assets and liabilities not required by the Group were sold back to the vendor. The net cash consideration for this entire transaction was £1,030,000.
The principal activity of WM. Nicholls & Company (Crickhowell) Limited is that of an agricultural merchant.
The primary reason for the business combination was the expansion of the existing agriculture business.
Reid and Robertson LimitedOn 12 June 2015 Carrs Billington Agriculture (Sales) Limited acquired the entire issued share capital of Reid and Robertson Limited for cash consideration of £869,000.
The principal activity of Reid and Robertson Limited is that of an agricultural merchant.
The primary reason for the business combination was the expansion of the existing agriculture business.
Chirton Engineering LimitedIn the prior year Carrs Engineering Limited acquired the entire issued share capital of Chirton Engineering Limited for cash consideration of £5,300,000. £2,394,000 of this was contingent consideration and is payable subject to certain growth criteria being met subsequent to the acquisition.
The principal activity of Chirton Engineering Limited is that of precision engineering.
The primary reason for the business combination was that the acquired business complimented the existing engineering business enabling a wider set of skills to be offered to customers.
B.E. Williams LimitedIn the prior year Carrs Billington Agriculture (Sales) Limited acquired the entire issued share capital of B.E. Williams Limited for cash consideration of £1,096,000.
The principal activity of B.E. Williams Limited is that of the supply and haulage of agricultural feed.
The primary reason for the business combination was that the acquired business complimented the existing agriculture business.
26 Share-based payments (continued)CompanyThe movement in the number of outstanding options under the share schemes for the company is not shown as it is immaterial and disclosure would be excessively lengthy.
The total expense recognised for the year arising from share based payments are as follows:

86 CARR’S GROUP PLCANNUAL REPORT AND ACCOUNTS 2015
FINANCIAL STATEMENTS
NOTES TO THE FINANCIAL STATEMENTS CONTINUED
27 Acquisitions (continued)All of the above purchases have been accounted for as acquisitions. Given the size of the acquisitions no separate disclosure has been presented on the face of the consolidated income statement as the impact would not be material.
Aggregate disclosures The total goodwill arising from acquisitions in the year amounts to £1,050,000 (2014: £4,585,000). Goodwill, in both the current and prior year, represents the excess of the consideration paid over the Group’s interests in the net fair value of the net identifiable assets, liabilities and contingent liabilities acquired. The following aggregated amounts have been recognised within the consolidated income statement in respect of acquisitions made in the year:
2015 2014 £’000 £’000
Revenue 3,589 2,312Profit before taxation 85 129
There were no other recognised gains and losses other than the profit shown above.
Acquisition related costs amounted to £58,000 (2014: £123,000), which have been recognised within administrative expenses in the consolidated income statement.
The aggregate assets and liabilities recognised in the acquisition accounting are set out below:
2015 2014 Fair value Fair value £’000 £’000
Intangible assets 162 51Property, plant and equipment 118 1,141 Investment — 10Inventories 549 677Receivables 1,493 1,390 Assets held for resale 116 439 Cash at bank 150 222 Payables (1,431) (1,468)Finance Leases (37) (555)Grants — (52) Taxation – Current (200) 4 – Deferred (71) (48)
Net assets acquired 849 1,811 Goodwill 1,050 4,585
1,899 6,396
Satisfied by: Cash consideration 1,899 4,002Contingent consideration — 2,394
Total consideration 1,899 6,396
Intangible assets represents the fair value of customer relationships of WM. Nicholls & Company (Crickhowell) Limited and Reid and Robertson Limited. The fair value exercise on the acquisition of Chirton Engineering Limited in the prior year resulted in no significant intangible assets being identified other than the value of employees, which is not permitted to be recognised on the balance sheet.
Assets held for resale were sold before the year end.
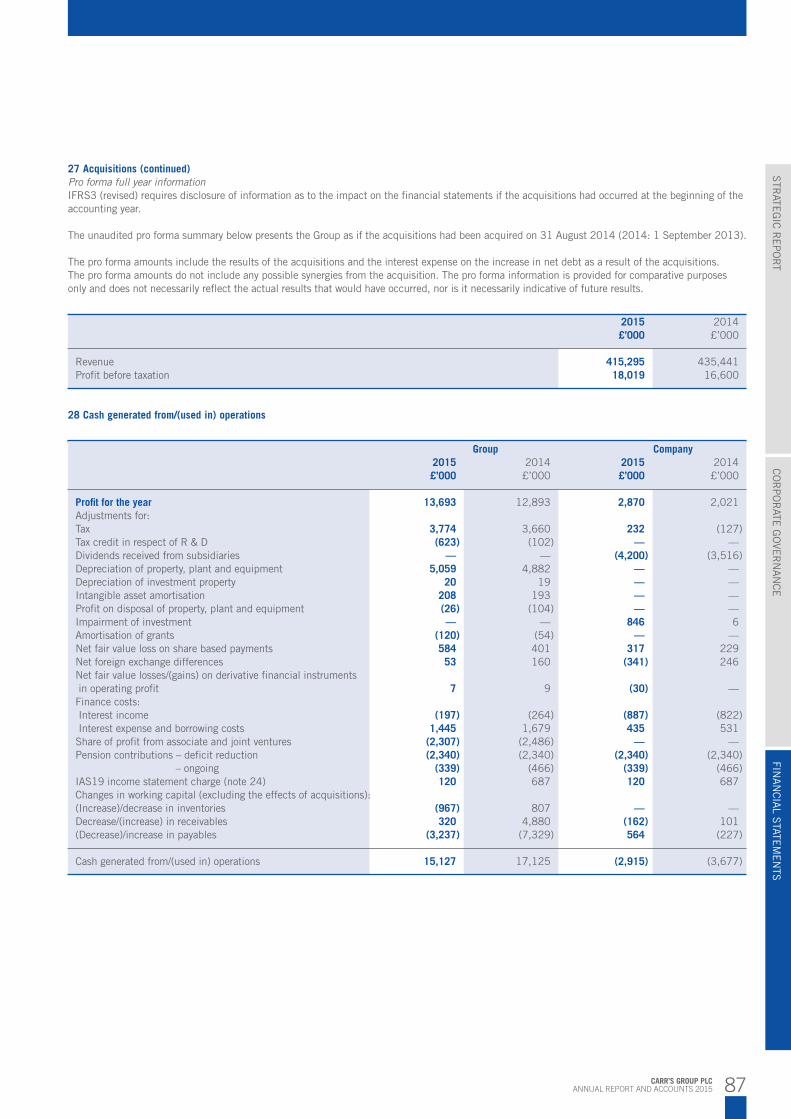
87CARR’S GROUP PLCANNUAL REPORT AND ACCOUNTS 2015
STR
ATEG
IC R
EPO
RT
CO
RPO
RATE
GO
VER
NAN
CE
FINAN
CIA
L STATE
MEN
TS
27 Acquisitions (continued)Pro forma full year informationIFRS3 (revised) requires disclosure of information as to the impact on the financial statements if the acquisitions had occurred at the beginning of the accounting year.
The unaudited pro forma summary below presents the Group as if the acquisitions had been acquired on 31 August 2014 (2014: 1 September 2013).
The pro forma amounts include the results of the acquisitions and the interest expense on the increase in net debt as a result of the acquisitions. The pro forma amounts do not include any possible synergies from the acquisition. The pro forma information is provided for comparative purposes only and does not necessarily reflect the actual results that would have occurred, nor is it necessarily indicative of future results.
2015 2014 £’000 £’000
Revenue 415,295 435,441Profit before taxation 18,019 16,600
28 Cash generated from/(used in) operations
Group Company 2015 2014 2015 2014 £’000 £’000 £’000 £’000
Profit for the year 13,693 12,893 2,870 2,021Adjustments for:Tax 3,774 3,660 232 (127)Tax credit in respect of R & D (623) (102) — —Dividends received from subsidiaries — — (4,200) (3,516)Depreciation of property, plant and equipment 5,059 4,882 — —Depreciation of investment property 20 19 — —Intangible asset amortisation 208 193 — —Profit on disposal of property, plant and equipment (26) (104) — —Impairment of investment — — 846 6Amortisation of grants (120) (54) — —Net fair value loss on share based payments 584 401 317 229Net foreign exchange differences 53 160 (341) 246Net fair value losses/(gains) on derivative financial instruments in operating profit 7 9 (30) —Finance costs: Interest income (197) (264) (887) (822) Interest expense and borrowing costs 1,445 1,679 435 531Share of profit from associate and joint ventures (2,307) (2,486) — —Pension contributions – deficit reduction (2,340) (2,340) (2,340) (2,340) – ongoing (339) (466) (339) (466)IAS19 income statement charge (note 24) 120 687 120 687Changes in working capital (excluding the effects of acquisitions):(Increase)/decrease in inventories (967) 807 — —Decrease/(increase) in receivables 320 4,880 (162) 101(Decrease)/increase in payables (3,237) (7,329) 564 (227)
Cash generated from/(used in) operations 15,127 17,125 (2,915) (3,677)
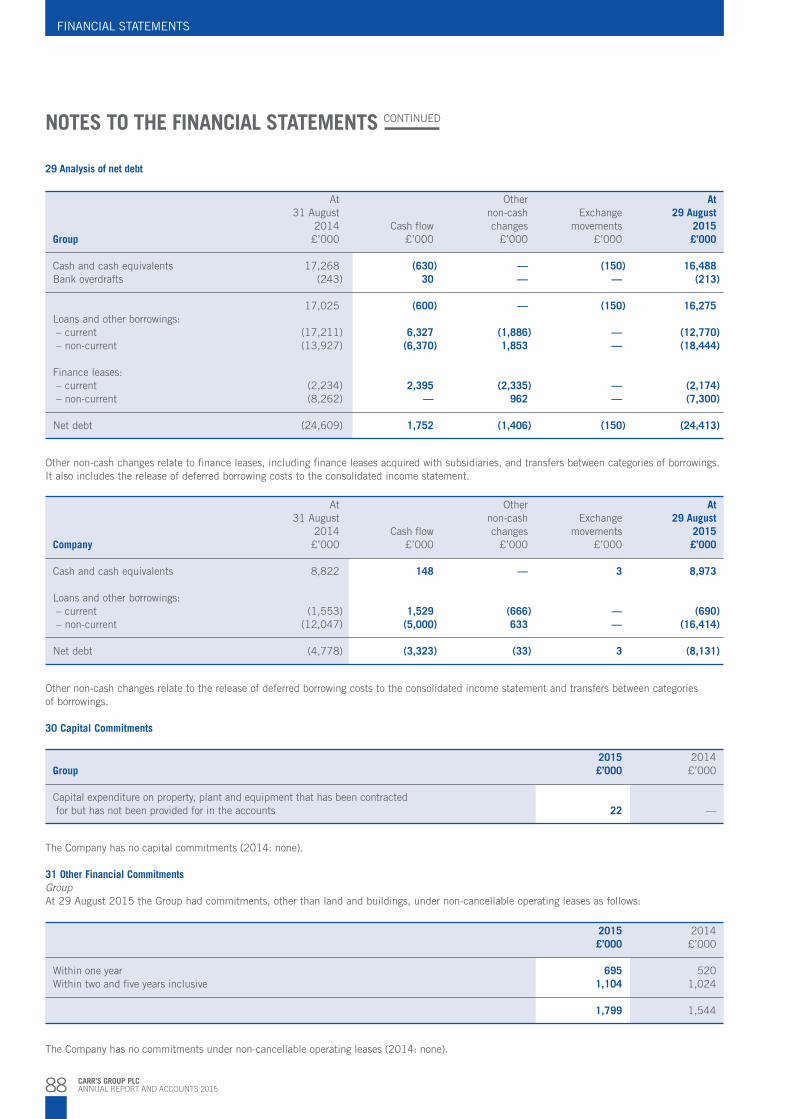
88 CARR’S GROUP PLCANNUAL REPORT AND ACCOUNTS 2015
FINANCIAL STATEMENTS
NOTES TO THE FINANCIAL STATEMENTS CONTINUED
29 Analysis of net debt
At Other At 31 August non-cash Exchange 29 August 2014 Cash flow changes movements 2015Group £’000 £’000 £’000 £’000 £’000
Cash and cash equivalents 17,268 (630) — (150) 16,488Bank overdrafts (243) 30 — — (213)
17,025 (600) — (150) 16,275Loans and other borrowings: – current (17,211) 6,327 (1,886) — (12,770) – non-current (13,927) (6,370) 1,853 — (18,444) Finance leases: – current (2,234) 2,395 (2,335) — (2,174) – non-current (8,262) — 962 — (7,300)
Net debt (24,609) 1,752 (1,406) (150) (24,413)
Other non-cash changes relate to finance leases, including finance leases acquired with subsidiaries, and transfers between categories of borrowings. It also includes the release of deferred borrowing costs to the consolidated income statement.
At Other At 31 August non-cash Exchange 29 August 2014 Cash flow changes movements 2015Company £’000 £’000 £’000 £’000 £’000
Cash and cash equivalents 8,822 148 — 3 8,973
Loans and other borrowings: – current (1,553) 1,529 (666) — (690) – non-current (12,047) (5,000) 633 — (16,414)
Net debt (4,778) (3,323) (33) 3 (8,131)
Other non-cash changes relate to the release of deferred borrowing costs to the consolidated income statement and transfers between categories of borrowings.
30 Capital Commitments
2015 2014Group £’000 £’000
Capital expenditure on property, plant and equipment that has been contracted for but has not been provided for in the accounts 22 —
The Company has no capital commitments (2014: none).
31 Other Financial Commitments GroupAt 29 August 2015 the Group had commitments, other than land and buildings, under non-cancellable operating leases as follows:
2015 2014 £’000 £’000
Within one year 695 520Within two and five years inclusive 1,104 1,024
1,799 1,544
The Company has no commitments under non-cancellable operating leases (2014: none).

89CARR’S GROUP PLCANNUAL REPORT AND ACCOUNTS 2015
STR
ATEG
IC R
EPO
RT
CO
RPO
RATE
GO
VER
NAN
CE
FINAN
CIA
L STATE
MEN
TS
32 Financial guarantees The Company, together with certain subsidiary undertakings, has entered into a guarantee with Clydesdale Bank PLC in respect of the Group loans, overdraft, asset finance and guarantee facilities with that bank, which at 29 August 2015 amounted to £8,152,000 (2014: £10,609,000). Certain subsidiary undertakings utilise guarantee facilities with financial institutions which include their own bankers. These financial institutions in the normal course of business enter into certain specific guarantees with some of the subsidiaries’ customers. All these guarantees allow the financial institutions to have recourse to the subsidiaries if a guarantee is enforced. The total outstanding of such guarantees at 29 August 2015 was £1,453,000 (2014: £1,267,000).
The Company has provided specific guarantees to certain customers of a subsidiary. These are in place to guarantee the completion of the contract in any event. At 29 August 2015 the contracts under guarantee that have still to be completed and delivered have a total contract value of £9,521,000 (2014: £8,430,000).
The Company has provided a guarantee over the lease of a premises occupied by a subsidiary. The guarantee is in respect of prompt and full payment of rents due throughout the term of the lease. As at 29 August 2015 the cumulative rent payable over the remaining term of the lease is £1,494,000 (2014: £nil).
The Company has entered into a guarantee with the Trustees of the Carrs Billington Agriculture Pension Scheme in respect of the punctual payment of obligations due to the pension scheme by the participating employers of the scheme. The Company’s total liability shall not exceed £1,500,000 (2014: £1,500,000).
The Group and Company does not expect any of the above guarantees to be called in.
33 Related parties Group and CompanyIdentity of related partiesThe Group has a related party relationship with its subsidiaries, associate and joint ventures and with its Directors. The balances and transactions shown below were all undertaken on an arm’s length basis in the normal course of business.
Transactions with key management personnelKey management personnel are considered to be the Directors and their remuneration is disclosed within the Remuneration Committee Report.
Group Company 2015 2014 2015 2014 £’000 £’000 £’000 £’000
Balances reported in the Balance Sheet
Amounts owed by businesses controlled by key management personnel (in a trading capacity): Trade receivables 109 84 — —
Transactions reported in the Income Statement
Revenue 204 329 — —

90 CARR’S GROUP PLCANNUAL REPORT AND ACCOUNTS 2015
FINANCIAL STATEMENTS
NOTES TO THE FINANCIAL STATEMENTS CONTINUED
33 Related parties (continued)Transactions with subsidiaries
Company 2015 2014 £’000 £’000
Balances reported in the Balance Sheet
Amounts owed by subsidiary undertakings:Loans 32,602 29,869Other receivables 138 114
32,740 29,983
Amounts owed to subsidiary undertakings:Loans (173) (173)Other payables (27) (29)
(200) (202)
Transactions reported in the Income Statement
Management charges receivable 2,520 2,351Dividends received 4,200 3,516Interest receivable 744 652Interest payable — (2)
Transactions with associate
Group Company 2015 2014 2015 2014 £’000 £’000 £’000 £’000
Balances reported in the Balance Sheet
Amounts owed by associate:Non-current receivables — 500 — 500Trade and other receivables 623 619 555 522
623 1,119 555 1,022
Amounts owed to associate:Trade and other payables (18,036) (16,067) (1) (2)
Transactions reported in the Income Statement
Revenue 967 1,148 — —Rental income 19 19 — —Management charges receivable 91 107 44 58Management charges payable (189) (149) (8) —Purchases (92,235) (98,526) — —
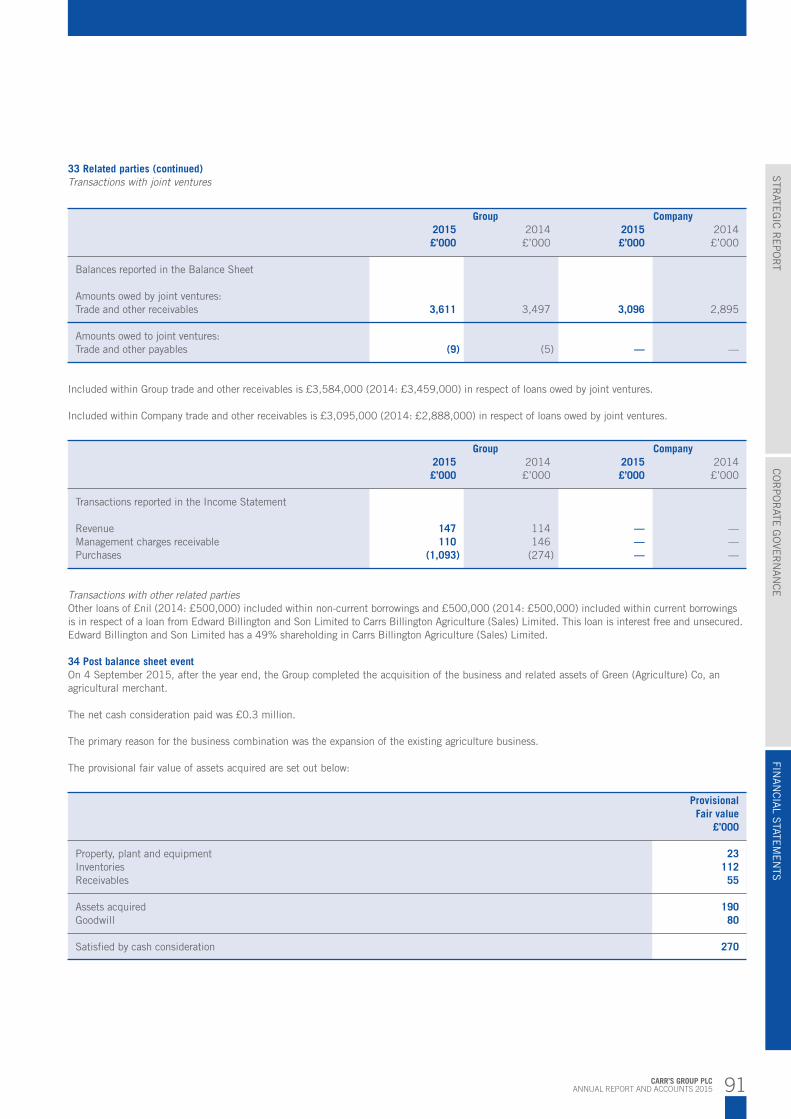
91CARR’S GROUP PLCANNUAL REPORT AND ACCOUNTS 2015
STR
ATEG
IC R
EPO
RT
CO
RPO
RATE
GO
VER
NAN
CE
FINAN
CIA
L STATE
MEN
TS
Group Company 2015 2014 2015 2014 £’000 £’000 £’000 £’000
Transactions reported in the Income Statement Revenue 147 114 — —Management charges receivable 110 146 — —Purchases (1,093) (274) — —
Transactions with other related partiesOther loans of £nil (2014: £500,000) included within non-current borrowings and £500,000 (2014: £500,000) included within current borrowings is in respect of a loan from Edward Billington and Son Limited to Carrs Billington Agriculture (Sales) Limited. This loan is interest free and unsecured. Edward Billington and Son Limited has a 49% shareholding in Carrs Billington Agriculture (Sales) Limited.
34 Post balance sheet eventOn 4 September 2015, after the year end, the Group completed the acquisition of the business and related assets of Green (Agriculture) Co, an agricultural merchant.
The net cash consideration paid was £0.3 million.
The primary reason for the business combination was the expansion of the existing agriculture business.
The provisional fair value of assets acquired are set out below:
Provisional Fair value £’000
Property, plant and equipment 23Inventories 112Receivables 55
Assets acquired 190Goodwill 80
Satisfied by cash consideration 270
33 Related parties (continued) Transactions with joint ventures
Group Company 2015 2014 2015 2014 £’000 £’000 £’000 £’000
Balances reported in the Balance Sheet
Amounts owed by joint ventures:Trade and other receivables 3,611 3,497 3,096 2,895
Amounts owed to joint ventures:Trade and other payables (9) (5) — —
Included within Group trade and other receivables is £3,584,000 (2014: £3,459,000) in respect of loans owed by joint ventures.
Included within Company trade and other receivables is £3,095,000 (2014: £2,888,000) in respect of loans owed by joint ventures.

92 CARR’S GROUP PLCANNUAL REPORT AND ACCOUNTS 2015
FINANCIAL STATEMENTS
FIVE YEAR STATEMENT
(Restated)1
Continuing operations 2011 2012 2013 2014 2015Revenue and Results £’000 £’000 £’000 £’000 £’000
Revenue 373,318 404,058 468,083 428,956 411,565
Group operating profit 9,156 12,071 13,337 15,427 16,375
Analysed as:Operating profit before non-recurring items and amortisation 10,387 12,517 13,353 15,743 16,641Non-recurring items and amortisation (1,231) (446) (16) (316) (266)
Group operating profit 9,156 12,071 13,337 15,427 16,375
Profit on the disposal of property and investment — 282 — — —Finance income 410 673 513 264 197Finance costs (1,332) (1,348) (1,318) (1,624) (1,412)Share of post-tax profit in associate and joint ventures 1,776 1,381 2,819 2,486 2,307
Profit before taxation 10,010 13,059 15,351 16,553 17,467Taxation (1,973) (2,954) (3,036) (3,660) (3,774)
Profit for the year from continuing operations 8,037 10,105 12,315 12,893 13,693
Profit/(loss) for the year from discontinued operations 16,598 (202) — — —
Profit for the year 24,635 9,903 12,315 12,893 13,693
Ratios (continuing operations)Operating margin (excluding non-recurring items and amortisation) 2.8% 3.1% 2.9% 3.7% 4.0%Return on net assets (excluding non-recurring items and amortisation) 17.9% 19.9% 19.7% 18.8% 17.9%Earnings per share – basic2 7.7p 9.8p 12.4p 12.8p 13.4p – adjusted2 8.8p 10.2p 12.4p 13.1p 13.6pDividends per ordinary share2 2.6p 2.9p 3.2p 3.4p 3.7p
1 Restated for IAS 19 revised
2 Restated for the effect of the 10:1 share split in January 2015
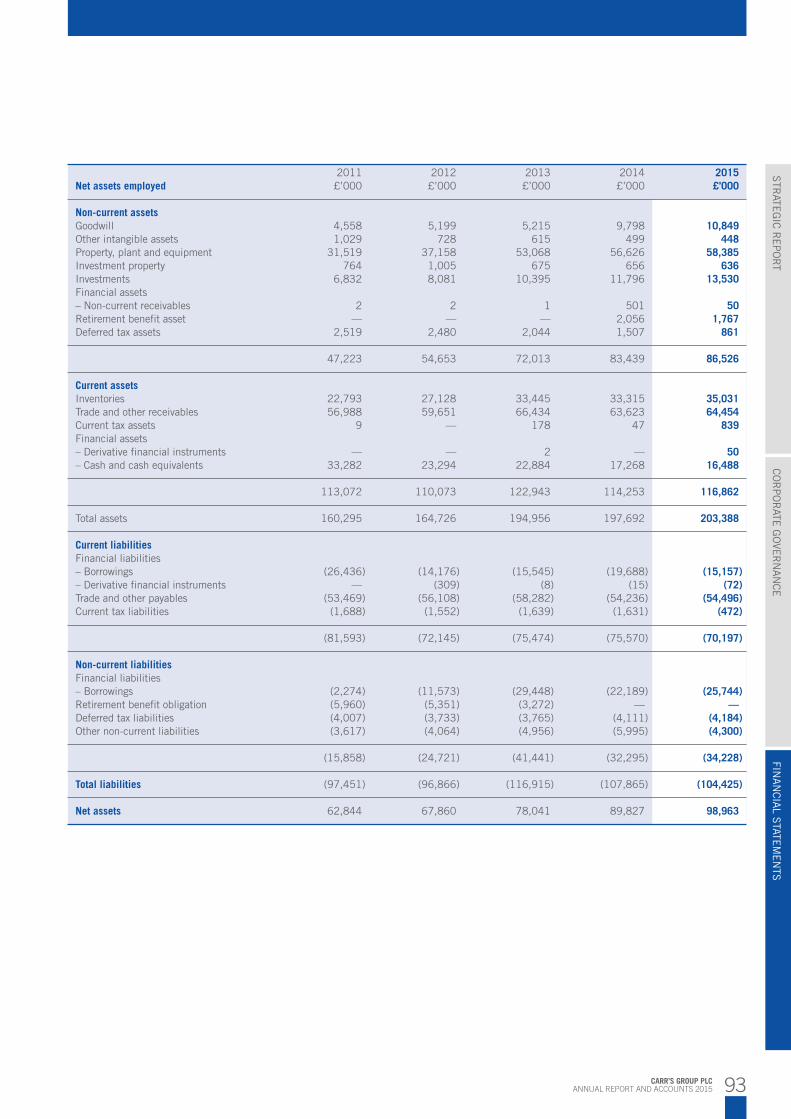
93CARR’S GROUP PLCANNUAL REPORT AND ACCOUNTS 2015
STR
ATEG
IC R
EPO
RT
CO
RPO
RATE
GO
VER
NAN
CE
FINAN
CIA
L STATE
MEN
TS
2011 2012 2013 2014 2015Net assets employed £’000 £’000 £’000 £’000 £’000
Non-current assetsGoodwill 4,558 5,199 5,215 9,798 10,849Other intangible assets 1,029 728 615 499 448Property, plant and equipment 31,519 37,158 53,068 56,626 58,385Investment property 764 1,005 675 656 636Investments 6,832 8,081 10,395 11,796 13,530Financial assets– Non-current receivables 2 2 1 501 50Retirement benefit asset — — — 2,056 1,767Deferred tax assets 2,519 2,480 2,044 1,507 861
47,223 54,653 72,013 83,439 86,526
Current assetsInventories 22,793 27,128 33,445 33,315 35,031Trade and other receivables 56,988 59,651 66,434 63,623 64,454Current tax assets 9 — 178 47 839Financial assets– Derivative financial instruments — — 2 — 50– Cash and cash equivalents 33,282 23,294 22,884 17,268 16,488
113,072 110,073 122,943 114,253 116,862
Total assets 160,295 164,726 194,956 197,692 203,388
Current liabilitiesFinancial liabilities– Borrowings (26,436) (14,176) (15,545) (19,688) (15,157)– Derivative financial instruments — (309) (8) (15) (72)Trade and other payables (53,469) (56,108) (58,282) (54,236) (54,496)Current tax liabilities (1,688) (1,552) (1,639) (1,631) (472)
(81,593) (72,145) (75,474) (75,570) (70,197) Non-current liabilitiesFinancial liabilities– Borrowings (2,274) (11,573) (29,448) (22,189) (25,744)Retirement benefit obligation (5,960) (5,351) (3,272) — —Deferred tax liabilities (4,007) (3,733) (3,765) (4,111) (4,184)Other non-current liabilities (3,617) (4,064) (4,956) (5,995) (4,300)
(15,858) (24,721) (41,441) (32,295) (34,228)
Total liabilities (97,451) (96,866) (116,915) (107,865) (104,425)
Net assets 62,844 67,860 78,041 89,827 98,963

94 CARR’S GROUP PLCANNUAL REPORT AND ACCOUNTS 2015
FINANCIAL STATEMENTS
Carr’s Group plc Old Croft, Stanwix, Carlisle, Cumbria CA3 9BA Tel: 01228 554600 Fax: 01228 554601 Website: www.carrsgroup.com
Animal Feed Supplement, Inc East Highway 212, PO Box 188, Belle Fourche, South Dakota 57717 USA Tel: 001 605 892 3421 Fax: 001 605 892 3473
Animal Feed Supplement, Inc PO Box 105, 101 Roanoke Avenue, Poteau, Oklahoma 74953 USA Tel: 001 918 647 8133 Fax: 001 918 647 7318
Animal Feed Supplement, Inc PO Box 569, 1700 US 50 East,Silver Springs, Nevada 89429 Tel: 001 775 577 2002 Fax: 001 775 577 4625
Caltech Solway Mills, Silloth, Wigton, Cumbria CA7 4AJ Tel: 016973 32592 Fax: 016973 32339
Scotmin13 Whitfield Drive, Heathfield Ind Est, Ayr KA8 9RX Tel: 01292 280 909 Fax: 01292 280 919
Aminomax Old Croft, Stanwix, Carlisle Tel: 01228 554 600 Fax: 01228 554 601
Horslyx LLC810 Waterman Drive, Watertown New York 13601, USA Tel: 001 315 785 3625Fax: 001 315 785 3627
Gold-Bar Feed Supplements LLC*783 Eagle Boulevard, Shelbyville,TN 37160, USATel: 001 877 618 6455Fax: 001 877 618 6489
Crystalyx Products GmbH* Am Stau 199-203, 26122, Oldenburg, Germany Tel: 00 49 441 2188 92142 Fax: 00 49 441 2188 92177
ACC Feed Supplement LLC* 5101 Harbor Drive,Sioux City, Iowa 51111 Tel: 001 712 255 6927 Fax: 001 712 252 4845
Carrs Billington Agriculture (Operations)** Parkhill Road, Kingstown Ind Est, Carlisle CA3 0EX Tel: 01228 529 021 Fax: 01228 554 397
Carrs Billington Agriculture (Operations)** Lansil Way, Lancaster LA1 3QYTel: 01524 597 200 Fax: 01524 597 229
Carrs Billington Agriculture (Operations)** High Mill, Langwathby, Penrith CA10 1NBTel: 01768 889 800 Fax: 01768 889 887
Carrs Billington Agriculture (Operations)** Cold Meece, Stone ST15 0QWTel: 01785 760 535 Fax: 01785 760 888
Carrs Billington Agriculture (Sales), Annan Annan Business Park, Annan, Dumfriesshire DG12 6TZTel: 01461 202 772 Fax: 01461 202 712
Carrs Billington Agriculture (Sales), ApplebyCrosscroft Industrial Estate, Appleby, Cumbria CA16 6HXTel: 01768 352 999
Carrs Billington Agriculture (Sales), AskriggUredale Mill, Askrigg, Leyburn, North Yorkshire DL8 7HZTel: 01969 650 229Fax: 01969 650 770
Carrs Billington Agriculture (Sales), Barnard Castle Montalbo Road, Barnard Castle, Co Durham DL12 8ED Tel: 01833 637 537 Fax: 01833 638 010
Carrs Billington Agriculture (Sales), BakewellUnit 4-6, Kingfisher Building,Buxton Road, Bakewell,Derbyshire DE45 1GZTel: 01629 814 126Fax: 01629 814 804
Carrs Billington Agriculture (Sales), Berwick upon Tweed 29 Northumberland Road,Berwick upon Tweed,Northumberland TD15 2AS Tel: 01289 307 245 Fax: 01289 305 727
Carrs Billington Agriculture (Sales), BreconWarren Road Stores, Warren Road, Brecon, Powys, LD3 8FFTel: 01874 623470
Carrs Billington Agriculture (Sales), Brock Brockholes Way, Claughton Trading Estate, Lancaster Old Road, Claughton on Brock, Preston PR3 0PZ Tel: 01995 643 200 Fax: 01995 643 220
Carrs Billington Agriculture (Sales), Carlisle Montgomery Way, Rosehill Estate, Carlisle CA1 2UY Tel: 01228 520 212 Fax: 01228 817 800
Carrs Billington Agriculture (Sales), Cockermouth Unit 5, Lakeland Agricultural Centre, Cockermouth CA13 0QQ Tel: 01900 824 105 Fax: 01900 826 860
Carrs Billington Agriculture (Sales), Gisburn Pendle Mill, Mill Lane, Gisburn, Clitheroe, Lancashire BB7 4LN Tel: 01200 445 491Fax: 01200 445 305
Carrs Billington Agriculture (Sales), Hawes Burtersett Road, Hawes, North Yorkshire DL8 3NP Tel: 01969 667 334 Fax: 01969 667 335
Carrs Billington Agriculture (Sales), Hexham Tyne Mills Industrial Estate, Hexham, Northumberland NE46 1XL Tel: 01434 605 371 Fax: 01434 608 938
Carrs Billington Agriculture (Sales), Jedburgh Mounthooly, Crailing,Jedburgh, TD8 6TJ Tel: 01835 850 250 Fax: 01835 850 748
Carrs Billington Agriculture (Sales), Kendal Unit 1, J36, Rural Auction Centre, Crooklands, Kendal, Cumbria LA7 7FPTel: 01539 566 035Fax: 01539 566 042
Carrs Billington Agriculture (Sales), Leek Macclesfield Road, Leek, Staffordshire ST13 8NR Tel: 01538 383 277Fax: 01538 385 731
Carrs Billington Agriculture (Sales), Malton 31 Horsemarket, Malton,North Yorkshire YO17 7NBTel: 01653 600 328Fax: 01653 690 338
Carrs Billington Agriculture (Sales), Milnathort Stirling Road, Milnathort, Kinross KY13 9UZ Tel: 01577 862 381 Fax: 01577 863 057
Carrs Billington Agriculture (Sales), Morpeth 20c Coopies Lane Industrial Estate, Morpeth, Northumberland NE61 6JN Tel: 01670 503 930 Fax: 01670 504 404 Carrs Billington Agriculture (Sales), Morpeth (Greens)Old Station Buildings, Coopies Lane, Morpeth, Northumberland, NE61 2SLTel: 01670 518474/84
Carrs Billington Agriculture (Sales), PenrithHaweswater Road, Penrith Industrial Estate, Penrith,Cumbria CA11 9EHTel: 01768 862 160Fax: 01768 899 345
Carrs Billington Agriculture (Sales), Perth 17/18 Arran Place, Arran Road, Perth PH1 3RN Tel: 01738 643 022Fax: 01738 442 122
Carrs Billington Agriculture (Sales), RothburyThe Store, Coquet View, Rothbury, Morpeth, Northumberland, NE64 7RZTel: 01669 621150
Carrs Billington Agriculture (Sales), SelkirkThe Former Baxter’s Unit, Dunsdale Haugh,Selkirk, Selkirkshire, TD7 5EFTel: 01750 720 734
DIRECTORY OF OPERATIONS

95CARR’S GROUP PLCANNUAL REPORT AND ACCOUNTS 2015
STR
ATEG
IC R
EPO
RT
CO
RPO
RATE
GO
VER
NAN
CE
FINAN
CIA
L STATE
MEN
TS
Carrs Billington Agriculture (Sales), Settle Unit 6, The Sidings Industrial Estate, Settle, North Yorkshire BD24 9RP Tel: 01729 825 812 Fax: 01729 825 812
Carrs Billington Agriculture (Sales), Skipton Skipton Auction Mart, Gargrave Road, Skipton, North Yorkshire BD23 1UDTel: 01756 792 166Fax: 01756 701 008
Carrs Billington Agriculture(Sales), SpennymoorSouthend Works, Byers Green,Spennymoor, Co. Durham,DL16 7NLTel: 01388 662 266Fax: 01388 603 743
Carrs Billington Agriculture(Sales), StirlingStirling Agricultural Centre,Stirling FK9 4RNTel: 01786 474 826Fax: 01786 472 933
Carrs Billington Agriculture (Sales), WigtonHopes Auction Co Ltd., Skye Road, Wigton, Cumbria, CA7 9NSTel: 016973 45874
Carrs Billington Agriculture(Sales), WoolerBridge End, South Road,Wooler, Northumberland,NE71 6QETel: 01668 281 567Fax: 01668 283 453
Reid & Robertson, a division of Carrs Billington Agriculture (Sales)Ballagan, Stirling Road, Balloch, G83 8LYTel: 01389 752800
WorkwareKingstown Broadway,Kingstown Industrial Estate,Carlisle CA3 0HATel: 01228 591 091Fax: 01228 590 026
Wallace Oils, CarlisleKingstown Broadway,Kingstown Industrial Estate,Carlisle CA3 0HATel: 01228 534 342Fax: 01228 590 820
Johnstone Wallace Fuels,Castle DouglasAbercromby Industrial Park,Castle Douglas, Dumfriesshire,DG7 1BA
Johnstone Wallace Fuels,DumfriesDargavel Stores, Lockerbie Road,Dumfries, Dumfriesshire DG1 3PGTel: 01387 750 747Fax: 01387 750 747
Johnstone Wallace Fuels,StranraerDroughduil, Dunragit,Stranraer DG9 8QATel: 01581 400 356Fax: 01581 400 356
Afgritech LLC*810 Waterman Drive, Watertown,New York 13601, USATel: 001 315 785 3625Fax: 001 315 785 3627
Bibby Agriculture*Priory House, Priory Street,Carmarthen SA31 1NETel: 01267 232 041Fax: 01267 232 374
Bibby Agriculture*1A Network House,Badgers Way,Oxon Business Park,Shrewsbury, Shropshire,SY3 5ABTel: 01743 237 890Fax: 01743 351 552
BendallsBrunthill Road,Kingstown Industrial Estate,Carlisle CA3 0EHTel: 01228 526 246Fax: 01228 525 634
R HindKingstown Broadway,Kingstown Industrial Estate,Carlisle CA3 0HATel: 01228 523 647Fax: 01228 512 712
Carrs MSMUnit 1 Spitfire Way, Hunts Rise,South Marston Park, Swindon,Wiltshire SN3 4TXTel: 01793 824 891Fax: 01793 824 894
Chirton EngineeringUnit 4A, High Flatworth, Tyne Tunnel Trading Estate,North Shields, Tyne & Wear, NE29 7SWTel: 0191 296 2020
Wälischmiller EngineeringGmbHSchießstattweg 16, 88677Markdorf, GermanyTel: 0049 7544 95140Fax: 0049 7544 951499
Carr’s Flour, SillothSolway Mills, Silloth, Wigton,Cumbria CA7 4AJTel: 01697 333 700Fax: 01697 332 543
Carr’s Flour, MaldonStation Road, Maldon,Essex CM9 4LQTel: 01621 852 696Fax: 01621 854 525
Carr’s Flour, ScotlandEast Bridge, Kirkcaldy,Fife KY1 2SRTel: 01592 267 191Fax: 01592 641 805
Silloth Storage Company*Station Road, Silloth,Wigton, Cumbria, CA7 4JQ
* joint venture company** associate company
96 CARR’S GROUP PLCANNUAL REPORT AND ACCOUNTS 2015
FINANCIAL STATEMENTS
REGISTERED OFFICE AND ADVISERS
DORMANT SUBSIDIARIES
Registered and LocatedEngland & WalesEngland & WalesScotlandEngland & WalesEngland & WalesScotlandEngland & WalesEngland & WalesEngland & WalesEngland & WalesEngland & WalesEngland & WalesEngland & WalesEngland & WalesEngland & WalesIrelandEngland & WalesScotlandScotlandEngland & WalesEngland & WalesScotlandEngland & WalesEngland & WalesEngland & WalesScotlandScotlandEngland & WalesScotlandEngland & WalesEngland & Wales
Company NameA C Burn LimitedB. E. Williams LimitedBowie & Aram Limited Caltech Biotechnology LimitedCarrs Animal Feed Supplements LimitedCarrs Blends LimitedCarrs Feeds LimitedCarrs Fertilisers Limited Carrs Foodtech Limited Carr’s International Industries LimitedCarr’s Milling Industries LimitedCarrs Milling LimitedCarrs Natural Feeds Limited Chirton Engineering LimitedForsyths of (Wooler) Limited George Shackleton & Sons LimitedGreens Flour Mills Limited J M Raine Limited Johnstone Fuels and Lubricants LimitedNorthern Feeds Solutions LimitedR Hind LimitedReid and Robertson Limited Robert Hutchison Limited Robertsons (Bakers) Limited Safe at Work LimitedScotmin Nutrition Limited Scotphos LimitedWalischmiller Solutions Limited Wallace Oils Holdings Limited Wallace Oils LimitedWM. Nicholls & Company (Crickhowell) Limited
Financial Adviser and BrokerInvestec Bank (UK) Limited2 Gresham Street,London,EC2V 7QP
Financial and Corporate PR AdvisersPowerscourt1 Tudor Street,London,EC4Y 0AH
SolicitorsHill Dickinson LLP1 St Paul’s Square,Liverpool,L3 9SJ
RegistrarsCapita RegistrarsThe Registry,34 Beckenham Road,Beckenham,Kent,BR3 4TU
Registered OfficeCarr’s Group plcOld Croft, Stanwix,Carlisle,CA3 9BARegistered No. 98221
Chartered Accountants and Statutory AuditorsPricewaterhouseCoopers LLPCentral Square South,Orchard Street,Newcastle upon Tyne,NE1 3AZ
BankersClydesdale Bank PLC82 English Street,Carlisle,CA3 8HP
The Royal Bank of Scotland PLC37 Lowther Street,Carlisle,CA3 8EL
1 100% owned by Carrs Billington Agriculture (Sales) Limited which is a 51% subsidiary of Carr’s Group plc.
Ownership 100% 51%1
100% 100% 100% 100% 51%1
100% 100% 100% 100% 100% 100% 100% 51%1
100% 100% 51%1
51%1
100% 100% 51%1
100% 96% 51%1
100% 100% 100% 51%1
51%1
51%1

STRATEGIC REPORT
THEGROUP
STRATEGIC REPORT1 Highlights2 Group at a Glance4 Chairman’s Statement6 Group Strategy7 Divisional Highlights8 Strategy in Action10 Chief Executive’s Review15 Risk Management18 Financial Review20 Key Performance Indicators21 The Board22 Corporate Responsibility
CONTENTS
CORPORATE GOVERNANCE25 Corporate Governance Report28 Audit Committee Report30 Remuneration Committee Report36 Nominations Committee Report37 Directors’ Report
FINANCIAL STATEMENTS40 Independent Auditors’ Report to the Members of Carr’s Group plc44 Consolidated Income Statement45 Consolidated and Company Statements of Comprehensive Income 46 Consolidated and Company Balance Sheets47 Consolidated Statement of Changes in Equity48 Company Statement of Changes in Equity49 Consolidated and Company Statements of Cash Flows50 Principal Accounting Policies55 Notes to the Financial Statements92 Five Year Statement94 Directory of Operations96 Registered Office and Advisers
CARR’S GROUP PLC IS FOCUSSED ON THE PRINCIPAL ACTIVITIES OF AGRICULTURE, FOOD AND ENGINEERING.Carr’s Group plc is an international business operating across Agriculture, Food and Engineering, supplying over 35 countries around the world.
The Agriculture division comprises an international feed block supplement business with manufacturing locations in the USA, UK and Europe. In the UK the division also sells animal feed,
fertiliser, animal health products, oil, farm machinery and rural supplies from its 30 Country Stores.
The Food division produces flour from three strategically located mills in the UK to the bread, biscuit and retail markets.
The Engineering division designs, manufactures and supplies specialist precision parts,
equipment, robotics and remote handling products from three sites in the UK and one site in Germany. These highly specialised products and services are supplied predominately into the nuclear and oil and gas markets.
The Group is listed on the London Stock Exchange.
Designed and produced by corporateprm, Edinburgh and London. www.corporateprm.co.uk

CA
RR
’S G
RO
UP
PLC
AN
NU
AL R
EP
OR
T AN
D A
CC
OU
NTS
20
15
Old Croft, Stanwix, Carlisle CA3 9BAwww.carrsgroup.com
ANNUAL REPORT AND ACCOUNTS
2015
AGRICULTURE | FOOD | ENGINEERINGDIVERSITY STRENGTHENS PERFORMANCE
Related Documents