WATER BODIES IN EUROPE Diversity of European seagrass indicators: patterns within and across regions Nu ´ ria Marba ` • Dorte Krause-Jensen • Teresa Alcoverro • Sebastian Birk • Are Pedersen • Joao M. Neto • Sotiris Orfanidis • Joxe M. Garmendia • In ˜igo Muxika • Angel Borja • Kristina Dencheva • Carlos M. Duarte Received: 7 May 2012 / Accepted: 24 November 2012 / Published online: 21 December 2012 Ó Springer Science+Business Media Dordrecht 2012 Abstract Seagrasses are key components of coastal marine ecosystems and many monitoring programmes worldwide assess seagrass health and apply seagrasses as indicators of environmental status. This study aims at identifying the diversity and characteristics of seagrass indicators in use within and across European ecoregions in order to provide an overview of seagrass monitoring effort in Europe. We identified 49 seagrass indicators used in 42 monitoring programmes and including a total of 51 metrics. The seagrass metrics represented 6 broad categories covering different seagrass organizational levels and spatial scales. The large diversity is particularly striking considering that the pan-European Water Framework Directive sets common demands for the presence and abundance of seagrasses and related disturbance-sensitive species. The diversity of indicators reduces the possibility to provide pan-European overviews of the status of Guest editors: C. K. Feld, A. Borja, L. Carvalho & D. Hering / Water bodies in Europe: integrative systems to assess ecological status and recovery N. Marba `(&) Á C. M. Duarte Department of Global Change Research, IMEDEA (CSIC-UIB), Institut Mediterrani d’Estudis Avanc ¸ats, Miquel Marque `s 21, 07190 Esporles, Illes Balears, Spain e-mail: [email protected] D. Krause-Jensen National Environmental Research Institute, Department of Marine Ecology, Aarhus University, Frederiksborgvej 399, 4000 Roskilde, Denmark T. Alcoverro Department of Marine Ecology, Centre d’Estudis Avanc ¸ats de Blanes (CEAB-CSIC), C/Acce ´s a la Cala St. Francesc, 14, 17300 Blanes, Girona, Spain S. Birk Department of Applied Zoology/Hydrobiology, University of Duisburg-Essen, Universita ¨tstraße 5, 45117 Essen, Germany A. Pedersen NIVA, Gaustadalle ´en 21, 0349 Oslo, Norway J. M. Neto Department of Life Sciences, IMAR—Institute of Marine Research (CMA), University of Coimbra, Largo Marque ˆs Pombal, 3004-517 Coimbra, Portugal S. Orfanidis National Agricultural Research Foundation, Fisheries Research Institute, 640 07 Nea Peramos, Kavala, Greece J. M. Garmendia Á I. Muxika Á A. Borja AZTI-Tecnalia, Herrera Kaia, Portualdea s/n, 20110 Pasaia, Spain K. Dencheva Institute of Oceanology, Bulgarian Academy of Sciences, P.O. Box 152, 9000 Varna, Bulgaria C. M. Duarte UWA Oceans Institute, The University of Western Australia, 35 Stirling Highway, Crawley, WA 6009, Australia 123 Hydrobiologia (2013) 704:265–278 DOI 10.1007/s10750-012-1403-7

Welcome message from author
This document is posted to help you gain knowledge. Please leave a comment to let me know what you think about it! Share it to your friends and learn new things together.
Transcript

WATER BODIES IN EUROPE
Diversity of European seagrass indicators: patternswithin and across regions
Nuria Marba • Dorte Krause-Jensen • Teresa Alcoverro • Sebastian Birk •
Are Pedersen • Joao M. Neto • Sotiris Orfanidis • Joxe M. Garmendia •
Inigo Muxika • Angel Borja • Kristina Dencheva • Carlos M. Duarte
Received: 7 May 2012 / Accepted: 24 November 2012 / Published online: 21 December 2012
� Springer Science+Business Media Dordrecht 2012
Abstract Seagrasses are key components of coastal
marine ecosystems and many monitoring programmes
worldwide assess seagrass health and apply seagrasses
as indicators of environmental status. This study aims
at identifying the diversity and characteristics of
seagrass indicators in use within and across European
ecoregions in order to provide an overview of seagrass
monitoring effort in Europe. We identified 49 seagrass
indicators used in 42 monitoring programmes and
including a total of 51 metrics. The seagrass metrics
represented 6 broad categories covering different
seagrass organizational levels and spatial scales. The
large diversity is particularly striking considering that
the pan-European Water Framework Directive sets
common demands for the presence and abundance of
seagrasses and related disturbance-sensitive species.
The diversity of indicators reduces the possibility to
provide pan-European overviews of the status ofGuest editors: C. K. Feld, A. Borja, L. Carvalho & D. Hering /
Water bodies in Europe: integrative systems to assess
ecological status and recovery
N. Marba (&) � C. M. Duarte
Department of Global Change Research, IMEDEA
(CSIC-UIB), Institut Mediterrani d’Estudis Avancats,
Miquel Marques 21, 07190 Esporles, Illes Balears, Spain
e-mail: [email protected]
D. Krause-Jensen
National Environmental Research Institute, Department of
Marine Ecology, Aarhus University, Frederiksborgvej
399, 4000 Roskilde, Denmark
T. Alcoverro
Department of Marine Ecology, Centre d’Estudis
Avancats de Blanes (CEAB-CSIC), C/Acces a la Cala St.
Francesc, 14, 17300 Blanes, Girona, Spain
S. Birk
Department of Applied Zoology/Hydrobiology,
University of Duisburg-Essen, Universitatstraße 5,
45117 Essen, Germany
A. Pedersen
NIVA, Gaustadalleen 21, 0349 Oslo, Norway
J. M. Neto
Department of Life Sciences, IMAR—Institute of Marine
Research (CMA), University of Coimbra, Largo Marques
Pombal, 3004-517 Coimbra, Portugal
S. Orfanidis
National Agricultural Research Foundation, Fisheries
Research Institute, 640 07 Nea Peramos, Kavala, Greece
J. M. Garmendia � I. Muxika � A. Borja
AZTI-Tecnalia, Herrera Kaia, Portualdea s/n,
20110 Pasaia, Spain
K. Dencheva
Institute of Oceanology, Bulgarian Academy of Sciences,
P.O. Box 152, 9000 Varna, Bulgaria
C. M. Duarte
UWA Oceans Institute, The University of Western
Australia, 35 Stirling Highway, Crawley, WA 6009,
Australia
123
Hydrobiologia (2013) 704:265–278
DOI 10.1007/s10750-012-1403-7

seagrass ecosystems. The diversity can be partially
justified by differences in species, differences in
habitat conditions and associated communities but
also seems to be determined by tradition. Within each
European region, we strongly encourage the evalua-
tion of seagrass indicator–pressure responses and
quantification of the uncertainty of classification
associated to the indicator in order to identify the
most effective seagrass indicators for assessing eco-
logical quality of coastal and transitional water bodies.
Keywords Monitoring � Zostera marina � Zostera
noltii � Cymodocea nodosa � Posidonia oceanica �European Water Framework Directive � Metrics
Introduction
Global human population has doubled during the
second half of the twentieth century (Cohen, 1995)
now exceeding 7 billion people. Twenty-three percent
of human population inhabits areas located within
100 km from the ocean with the highest population
density occurring within the closest 10 km (Nicholls
& Small, 2002). The rapid growth of the human
population in the coastal zone is transforming both
coastal land and marine environments. Natural eco-
systems are being replaced by urban areas, artificial
structures (e.g., harbors and dikes) and infrastructures
to produce resources (e.g., food, freshwater, energy).
Inputs of nutrients, organic matter and contaminants to
the coastal zone have also increased worldwide
(Nixon & Fulweiler, 2009). As a result, there is a
widespread deterioration of coastal environmental
quality, evidenced by a decrease of water transpar-
ency, coastal eutrophication and coastal erosion and
coastal key ecosystems, such as seagrass meadows, are
declining at an alarming rate (0.9% year-1, Waycott
et al., 2009).
Seagrass meadows are the dominant marine eco-
system of sandy coastal areas, extending from the
tropics to the poles except in Antarctica. Seagrasses
encompass about 60 species of clonal angiosperms
adapted to life in the sea (Hemminga & Duarte, 2000).
Four seagrass species occur in European waters,
including the small, fast growing and short lived
Zostera noltii, which is the most ubiquitous, Z. marina,
dominant in most European seas but rare in the
Mediterranean, Cymodocea nodosa, occurring in the
Mediterranean and the southern NE Atlantic, and the
large, slow growing and long lived Posidonia
oceanica, endemic to the Mediterranean (den Hartog,
1970; Hemminga & Duarte, 2000). Seagrasses are
present from the intertidal or shallow subtidal
(Z. noltii) down to 5-15 meters depth in North
European waters (Z. marina) and to 40 m in clear
Mediterranean waters (C. nodosa and P. oceanica)
along the European coastline (Duarte et al., 2007).
Because of the key ecological services they provide
to the coastal zone, seagrass meadows rank amongst
the most valuable ecosystems in the biosphere
(Costanza et al., 1997). They are highly productive,
influence the structural complexity of habitats,
enhance biodiversity, play important roles in global
carbon and nutrient cycling, stabilize water flow and
promote sedimentation, thereby reducing particle
loads in the water as well as coastal erosion (Jones
et al., 1994; Hemminga & Duarte, 2000; Orth et al.,
2006). Since seagrass meadows are experiencing
global declines (e.g., Short & Wyllie-Echeverria,
1996; Duarte et al., 2008; Waycott et al., 2009) and
because recovery, at least for the slow growing
species, may be irreversible at human-time scales
(Hemminga & Duarte, 2000), monitoring programmes
aiming at assessing seagrass health and success of
coastal restoration efforts are proliferating worldwide
(e.g., Orth et al., 2006; Short et al., 2006). The high
sensitivity of seagrasses to environmental deteriora-
tion (e.g., decline of water transparency, eutrophica-
tion, erosion, warming) and the widespread
geographical distribution of these plants also make
seagrasses useful ‘‘miner’s canaries’’ of coastal dete-
rioration (Orth et al., 2006). Indeed, several policies
aiming at improving marine ecological quality
[Europe: Water Framework Directive (WFD, 2000/60/
EC) and the Marine Strategy Framework Directive
(MSFD, 2008/56/EC); USA: Clean Water Act (CWA),
National Estuary Programme (www.epa.gov/nep)] use
seagrasses as indicators to assess ecosystem quality
(Borja et al., 2008, 2012). For instance, the European
WFD defines ‘‘good ecological status’’ of coastal
waters with respect to seagrasses, other angiosperms
and macroalgae as a situation where ‘‘most disturbance
sensitive macroalgal and angiosperm taxa associated
with undisturbed conditions are present and the level of
266 Hydrobiologia (2013) 704:265–278
123

macroalgal cover and angiosperm abundance shows
slight signs of disturbance’’.
Monitoring programmes use a wide repertoire of
indicators to evaluate the status of seagrass meadows,
representing different structural and functional levels
and different spatial scales; including meadow distri-
bution and extent, abundance, shoot characteristics,
chemical composition of the plants, and process rates
such as growth or population dynamics (e.g., Borum
et al., 2004; Lopez y Royo et al., 2010). Often, indicators
of other brackish angiosperms, macroalgae and fauna
present in seagrass communities are also considered.
Monitoring programmes currently conducted in Europe
in compliance with the WFD, as well as aiming at
assessing conservation status of these endangered
ecosystems, comprise a selected set of seagrass indica-
tors that may vary across species and, hence, regions.
Here, we examine European seagrass monitoring
programmes and review the diversity and character-
istics of indicators in use in seagrass monitoring
programmes within and across European ecoregions.
We do so by compiling the seagrass indicators
available to assess ecological quality of European
coastal waters and conservation status of European
seagrass meadows.
Methods
We searched the literature and monitoring pro-
grammes to identify indicators used in European
seagrass monitoring programmes to assess the eco-
logical status of seagrass meadows and coastal envi-
ronmental quality in the 4 European ecoregions: The
North East Atlantic, the Baltic, the Mediterranean and
the Black seas. We extracted information on seagrass
indicators used in the WFD from the survey conducted
by the EU-project WISER (Birk et al., 2010). We
supplemented the database by searching the scientific
and the grey literature and through further communi-
cation with national experts on seagrass monitoring.
We used the following terminology: ‘‘Programme’’
refers to a seagrass monitoring programme in a
specific area (e.g. ‘‘Monitoring programme of conser-
vation status of P. oceanica in Murcia’’). Each
programme includes one or more ‘‘indicators’’, repre-
senting a single ‘‘metric’’ or a composite of metrics
(‘‘an index’’). The term ‘‘metric’’ is here used in a
broad sense encompassing the term ‘‘parameter’’. For
example ‘‘seagrass depth limit’’ is a metric that uses
the average level of the parameter ‘‘seagrass depth
limit’’ in an assessment of water quality. Similarly
‘‘density’’ or ‘‘aboveground biomass’’ are metrics that
use the average level of the parameters ‘‘density’’ and
‘‘biomass’’ at a given water depth, and the metric
‘‘Cymoskew’’ uses the skewness of the distribution of
the parameter ‘‘shoot length’’ in the assessment of
ecological status. An ‘‘index’’ is composed of several
metrics, collapsing various metrics of the seagrass
meadow onto a single value. For example, the indicator
‘‘POMI’’ (Posidonia oceanica monitoring index, Ro-
mero et al., 2007) is an index composed of up to 14
different seagrass metrics, while ‘‘Seagrass depth
limit’’ is an indicator composed of just one metric.
For each monitoring programme we allocated each
of the metrics composing the seagrass indicators
to one of the following categories: ‘‘Distribution’’,
‘‘Abundance’’, ‘‘Shoot characteristics’’, ‘‘Processes’’,
‘‘Chemical constituents’’, and ‘‘Associated flora and
fauna’’ (Table 1). The category ‘‘Associated flora and
fauna’’ was only considered in the cases when the
research programme also included at least an indicator
of a seagrass component.
Metrics sharing a large degree of commonality
were described in common terms. For instance, some
programmes express the abundance of sensitive spe-
cies as cover and other as biomass and we used the
general term ‘‘sensitive species abundance’’ (Table 1)
to represent both. Metrics describing maximum depth
limits and depth limits of a specific percentage cover
were also grouped as one (i.e. ‘‘depth limit’’, Table 1).
Moreover, all metrics describing species composition,
species number or community structure grouped
under the common term ‘‘Diversity’’. The Portuguese
intertidal seagrass index (Neto et al. unpublished)
represents a special case as it includes ‘‘species
composition’’ as a metric even though Z. noltii is the
only seagrass potentially present, so in this case
‘‘diversity’’ covers information on the presence or the
absence of this species only. This grouping of metrics
implied that our compilation represents a minimum
estimate of the total number of European seagrass
metrics in use. However, the number of metrics
contained in individual indicators is not affected by the
groupings, except in the case of the Swedish index
‘‘Multispecies maximum depth index’’ and the Ger-
man index ‘‘Balcosis’’. The ‘‘Multispecies maximum
depth index’’ combines the depth limit of a selection of
Hydrobiologia (2013) 704:265–278 267
123

species of which Z. marina makes part in few areas, but
rather than listing depth limits the entire selection of
species as individual metrics, we included only ‘‘sea-
grass depth limit’’ and ‘‘depth limit of selected species’’.
We also underestimate the number of metrics in the
German indicator ‘‘Balcosis’’ because we grouped the
metrics ‘‘opportunist proportion in the seagrass zone’’
and ‘‘opportunist proportion in the red algae zone’’ into
the metric ‘‘tolerant species proportion’’.
Some monitoring programmes collect samples of
more metrics than are used in the indicators, but our
compilation does not list such additional metrics.
For example, we listed the 14 metrics that poten-
tially make part of POMI, but did not list the depth
limit and depth limit type of P. oceanica, which is
not used to calculate the POMI index even though it
is assessed every 2–3 years, e.g., along the Catalan
coast. The 14 potential POMI metrics are sometimes
reduced to 7–9 metrics actually used but, as the
selection may vary between areas and over time, we
listed those used at least in one survey by the
research programme.
Results
Quantification of seagrass monitoring programmes
and indicators
We identified 42 monitoring programmes of European
seagrass meadows aiming at evaluating seagrass
Table 1 List of categories of European seagrass indicators
(in bold) and the metrics contained in them
Distribution
Depth limit
Depth limit type
Area
Abundance
Shoot density
Cover
Aboveground biomass
Above/belowgr. biomass
Dead matte cover
Shoot characteristics
Shoot biomass
Shoot leaf area
No. of leaves per shoot
Leaf width
Leaf length skewness
Leaf necrosis
Broken leaves
Plagiotrophic rhizomes
Processes
Leaf production
Rhizome production
Rhizome elongation
Change in density
Shoot recruitment
Shoot mortality
Flowering
Shoot burial, rhizome baring
Herbivore pressure
Chemical constituents
Rhizome N
Rhizome P
Rhizome d15N
Rhizomes d34S
Rhizome sucrose
Rhizome Cu
Rhizome Pb
Rhizome Zn
Associated flora and fauna
Diversity—soft bot. sp.
Diversity—macroalgae
Diversity—all flora
Tolerant sp. proportion
Tolerant sp. abundance
Sensitive sp. proportion
Table 1 continued
Sensitive sp. abundance
Tolerant species area
Vegetation abundance
Fucus abundance
Furcellaria proportion
Invasive sp. presence
Epiphyte N
Epiphyte biomass
Depth limit—Fucus
Depth limit—Characeans
Depth limit—selected sp.
Macrofauna abundance
The first five categories relate directly to the seagrasses while
the last category relate to the entire community
268 Hydrobiologia (2013) 704:265–278
123
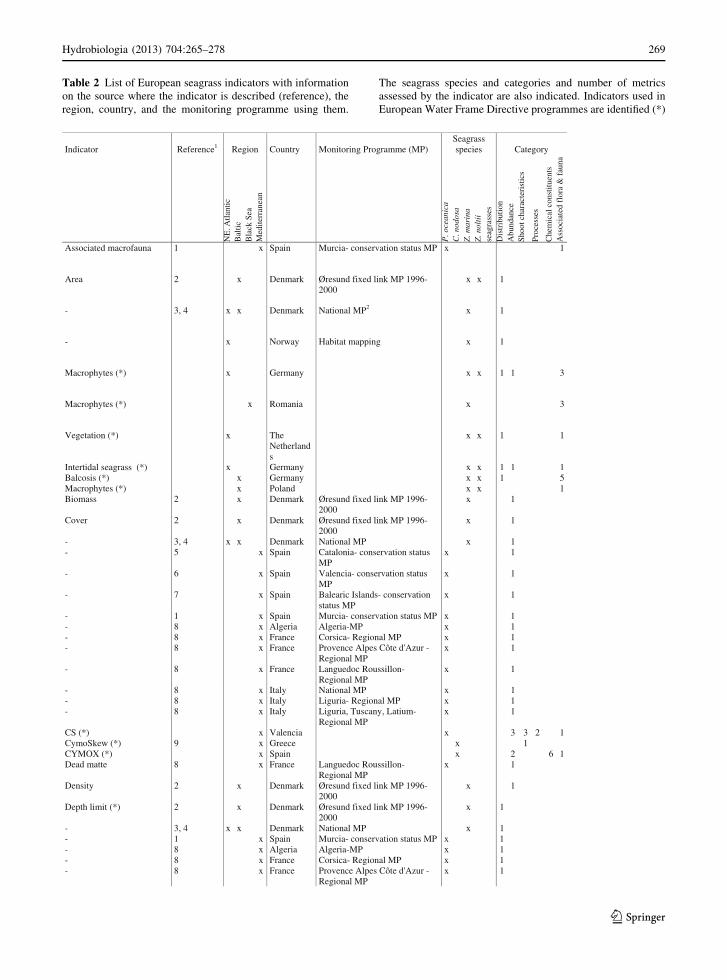
Table 2 List of European seagrass indicators with information
on the source where the indicator is described (reference), the
region, country, and the monitoring programme using them.
The seagrass species and categories and number of metrics
assessed by the indicator are also indicated. Indicators used in
European Water Frame Directive programmes are identified (*)
Indicator Reference1 Region Country Monitoring Programme (MP) Seagrass species Category
NE
. Atla
ntic
B
altic
B
lack
Sea
M
edite
rran
ean
P. o
cean
ica
C. n
odos
a Z
. mar
ina
Z. n
olti
i se
agra
sses
D
istr
ibut
ion
Abu
ndan
ce
Shoo
t cha
ract
eris
tics
Proc
esse
s
Che
mic
al c
onst
ituen
ts
Ass
ocia
ted
flor
a &
fau
na
Associated macrofauna 1 x Spain Murcia- conservation status MP x 1
Area 2 x Denmark Øresund fixed link MP 1996-2000
x x 1
,3- 4 x x Denmark National MP2 x 1
- x Norway Habitat mapping x
Macrophytes (*) x Germany
Macrophytes (*) x Romania x 3
Vegetation (*) x The Netherlands
1
Intertidal seagrass (*) x Germany Balcosis (*) x Germany 5Macrophytes (*) x Poland 1Biomass
2000 Cover
2000 - -
MP -
MP -
status MP - - - -
Regional MP -
Regional MP - - -
Regional MP CS (*) CymoSkew (*) CYMOX (*) Dead matte
Regional MP Density
2000 Depth limit (*)
2000 - - - - -
2 x Denmark Øresund fixed link MP 1996-
2 x Denmark Øresund fixed link MP 1996-
3, 4 x x Denmark National MP 5 x Spain Catalonia- conservation status
6 x Spain Valencia- conservation status
7 x Spain Balearic Islands- conservation
8 x Algeria Algeria-MP
8 x France Provence Alpes Côte d'Azur -
8 x France Languedoc Roussillon-
8 x Italy National MP
8 x Italy Liguria, Tuscany, Latium-
x Valencia9 x Greece
x Spain8 x France Languedoc Roussillon-
2 x Denmark Øresund fixed link MP 1996-
2 x Denmark Øresund fixed link MP 1996-
3, 4 x x Denmark National MP
8 x Algeria Algeria-MP
8 x France Provence Alpes Côte d'Azur - Regional MP
1
x x 1 1 3
x x 1
x x 1 1 1x x 1x xx 1
x 1
x 1x 1
x 1
x 1
1 x Spain Murcia- conservation status MP x 1x 1
8 x France Corsica- Regional MP x 1x 1
x 1
x 18 x Italy Liguria- Regional MP x 1
x 1
x 3 3 2 1x 1x 2 6 1
x 1
x 1
x 1
x 11 x Spain Murcia- conservation status MP x 1
x 18 x France Corsica- Regional MP x 1
x 1
Hydrobiologia (2013) 704:265–278 269
123

Table 2 continued
Indicator Reference1 Region Country Monitoring Programme (MP) Seagrass species Category
NE
. Atla
ntic
B
altic
B
lack
Sea
M
edite
rran
ean
P. o
cean
ica
C. n
odos
a Z
. mar
ina
Z. n
olti
i se
agra
sses
D
istr
ibut
ion
Abu
ndan
ce
Shoo
t cha
ract
eris
tics
Proc
esse
s
Che
mic
al c
onst
ituen
ts
Ass
ocia
ted
flor
a &
fau
na
- Regional MP
x 1
- x 1- -
Regional MP x 1
- x 1 1
- -
Regional MP x 1
8 x France Languedoc Roussillon-
8 x Italy National MP8 x Italy Liguria- Regional MP x 18 x Italy Liguria, Tuscany, Latium-
x Norway Habitat mappingDepth limit type 8 x Algeria Algeria-MP
8 x France Corsica- Regional MP x 18 x France Provence Alpes Côte d'Azur -
- Regional MP
- - -
Regional MP EEI (*) x Slovenia 2- (*) x Greece 2EEI & S/W x Bulgaria 2Elbo (*) x Germany
1Phytobenthos Index (*) x Estonia National MP Exclame (*) x France 4
pain Valencia- conservation status MP
Intertidal seagrass (*) x Ireland Leaf area - - -
Regional MP Leaf necrosis -
Regional MP
-
8 x Italy Liguria- Regional MP x 1
Flowering intensity 1 x Spain Murcia- conservation status MP x 1
8 x France Corsica- Regional MP x 1
8 x France Corsica- Regional MP x 1- -
Regional MP
8 x France Languedoc Roussillon- x 1
8 x Italy National MP x 1
8 x Italy Liguria, Tuscany, Latium- x 1
? x x
xx x 1 2
Epiphyte biomass 8 x Algeria Algeria-MP xx x 1 2
x
Global seagrass density 6 x S x 2
x x 1 1 18 x Algeria Algeria-MP x 1
8 x Italy National MP x 18 x Italy Liguria, Tuscany, Latium- x 1
8 x Italy National MP x 18 x Italy Liguria, Tuscany, Latium- x 1
Leaf production 8 x Algeria Algeria-MP x 1
8 x Italy National MP x 18 x Italy Liguria, Tuscany, Latium- x 1
Leaf tips lost (Coefficient A) - - -
Regional MP E-MaQI and R-MaQI (*) 3Multispecies maximum depth index (*)
1xxnedewSx01
- - -
Regional MP
8 x Italy National MP x 18 x Italy Liguria, Tuscany, Latium- x 1
x x x x1
No. of leaves per shoot 8 x Algeria Algeria-MP x 1
8 x Italy National MP x 18 x Italy Liguria, Tuscany, Latium- x 1
Plagiotrophic rhizomes 8 x Algeria Algeria-MP x 1
8 x Algeria Algeria-MP x 1
8 x France Corsica- Regional MP x 1
x Italy
8 x France Corsica- Regional MP x 1
270 Hydrobiologia (2013) 704:265–278
123
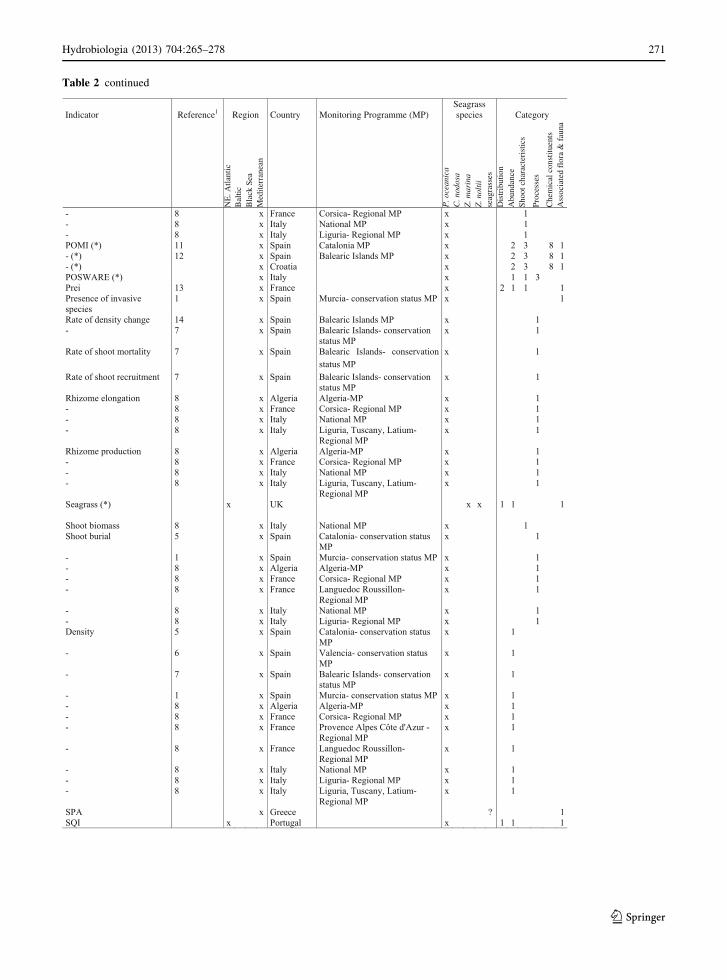
Table 2 continued
Indicator Reference1 Region Country Monitoring Programme (MP) Seagrass species Category
NE
. Atla
ntic
B
altic
B
lack
Sea
M
edite
rran
ean
P. o
cean
ica
C. n
odos
a Z
. mar
ina
Z. n
olti
i se
agra
sses
D
istr
ibut
ion
Abu
ndan
ce
Shoo
t cha
ract
eris
tics
Proc
esse
s
Che
mic
al c
onst
ituen
ts
Ass
ocia
ted
flor
a &
fau
na
- - - POMI (*) - (*) - (*)
Prei Presence of invasive species
- status MP
8 x Italy National MP x 1
11 x Spain Catalonia MP x 2 3 8 112 x Spain Balearic Islands MP x 2 3 8 1
x Croatia x 2 3 8 1POSWARE (*) x Italy x 1 1 3
13 x France x 2 1 1 1
Rate of density change 14 x Spain Balearic Islands MP x 17 x Spain Balearic Islands- conservation x 1
Rate of shoot mortality 7
8 x France Corsica- Regional MP x 1
8 x Italy Liguria- Regional MP x 1
1 x Spain Murcia- conservation status MP x 1
x Spain Balearic Islands- conservation x 1status MP
status MP
- - -
Regional MP
- - -
Regional MP Seagrass (*)
Shoot burial talonia- conservation status MP
- - - -
Regional MP - - Density lonia- conservation status
MP -
MP
Rate of shoot recruitment 7 x Spain Balearic Islands- conservation x 1
Rhizome elongation 8 x Algeria Algeria-MP x 1
8 x Italy National MP x 18 x Italy Liguria, Tuscany, Latium- x 1
Rhizome production 8 x Algeria Algeria-MP x 1
8 x Italy National MP x 18 x Italy Liguria, Tuscany, Latium- x 1
x x 1 1 1
Shoot biomass 8 x Italy National MP x 15 x Spain Ca x 1
8 x Algeria Algeria-MP x 1
8 x France Languedoc Roussillon- x 1
8 x Italy National MP x 1
5 x Spain Cata x 1
6 x Spain Valencia- conservation status x 1
-
8 x France Corsica- Regional MP x 1
8 x France Corsica- Regional MP x 1
x UK
1 x Spain Murcia- conservation status MP x 1
8 x France Corsica- Regional MP x 1
8 x Italy Liguria- Regional MP x 1
7 x Spain Balearic Islands- conservation x 1status MP
- - - -
Regional MP -
Regional MP - - -
Regional MP SPA ? 1SQI
8 x Algeria Algeria-MP x 1
8 x France Provence Alpes Côte d'Azur - x 1
8 x France Languedoc Roussillon- x 1
8 x Italy National MP x 1
8
1 x Spain Murcia- conservation status MP x 1
8 x France Corsica- Regional MP x 1
8 x Italy Liguria- Regional MP x 1x Italy Liguria, Tuscany, Latium- x 1
x Greecex Portugal x 1 1 1
Hydrobiologia (2013) 704:265–278 271
123

health (11 programmes), assessing coastal quality (28
programmes) or both (3 programmes, Table 2). The
monitoring programmes span across the four Euro-
pean ecoregions, the North East Atlantic, the Baltic,
the Mediterranean and the Black seas, and involve the
four European seagrass species. However, the moni-
toring effort, in terms of number of programmes,
allocated to Z. nolti, Z. marina, and P. oceanica
meadows is six to eightfold greater than that to
C. nodosa (Table 2). The European seagrass monitor-
ing programmes examine a total of 49 indicators of
seagrass health (Table 2), but only 25 of them are
monitored in P. oceanica, 19 in Z. marina, 12 in
Z. noltii, and 3 in C. nodosa (Table 2).
Metrics included in seagrass indicators
The seagrass indicators identified included a total of
51 metrics representing a wide range of structural and
functional aspects of seagrass ecosystems, which we
grouped in six different categories (Table 1). Five
categories relate directly to seagrasses while one
relates to the flora and fauna associated with the
seagrasses. The seagrass categories consider structural
aspects ranging from large-scale distribution patterns
in entire coastal areas and smaller scale abundance
patterns in individual seagrass meadows to character-
istics of individual shoots, as well as process and rates
of change at shoot or meadow scale and plant chemical
constituents. The category representing the associated
flora and fauna characterizes diversity aspects based
on species or functional groups (e.g., tolerant versus
sensitive species, the presence of epiphytes) as well as
distribution and abundance patterns of species asso-
ciated with the seagrasses (e.g., depth limits of other
angiosperms or macroalgae).
The 49 seagrass indicators of the various Euro-
pean monitoring programmes include from 1 to 14
metrics each. Seagrass indicators based on just one
metric are by far the most common, accounting for
61% of the indicators in use (Fig. 1). These only
describe a limited aspect of the seagrass ecosystem,
but seagrass monitoring programmes often quantify
several indicators together and thereby provide a
more complete description of the ecosystem. The
multi-metric indicators (indices), on the other hand,
cover up to four metric categories each and thereby
synthesize several aspects of the ecosystem in one
estimate (Table 2).
The top-three seagrass metrics mostly used in
Europe, as evaluated based on the number of moni-
toring programmes using them are shoot density
(included in 24 programmes) and cover (included in
18 programmes) both belonging to the category
‘‘abundance’’, and depth limit (included in 16 pro-
grammes) belonging to the category ‘‘distribution’’
(Fig. 2). In addition, the metric ‘‘Change in density’’,
which is included in 2 programmes also relies on
measurements of shoot density.
The most monitored seagrass category is ‘‘Abun-
dance’’ (included in 47 programmes) closely fol-
lowed by ‘‘Distribution’’ and ‘‘Shoot characteristics’’
(included in 33 and 34 programmes, respectively),
while ‘‘Processes’’ and ‘‘Chemical constituents’’ are
slightly less frequently monitored (included in 29 and
Table 2 continued
a (1) Ruiz-Fernandez et al., 2009; (2) Krause-Jensen et al., 2001a; (3) http://www.naturstyrelsen.dk/Naturbeskyttelse/
National_naturbeskyttelse/Overvaagning_af_vand_og_natur/NOVANA/; (4) Krause-Jensen et al., 2001b; (5) Sanchez-Rosas &
Olivella-Prats, 2009; (6) Codina-Soler et al., 2009; (7) Alvarez et al., 2009; (8) Lopez y Royo et al., 2010; (9) Orfanidis et al., 2009;
(10) Swedish Environmental Protection Agency, 2008; (11) Romero et al., 2007; (12) Baron et al. 2007; (13) Gobert et al., 2009; (14)
Marba et al., 2005b Since 2004 the monitoring programme has been reduced to only include area surveys in one area (the Wadden Sea) and not to
include associated measurements of biomass and shoot density any longer
0
10
20
30
1 2 3 4 5 6 7 8 9 10 11 12 13 14
No.
of i
ndic
ator
s
No. of metrics in indicator
Fig. 1 Number of seagrass indicators containing a given
number of metrics
272 Hydrobiologia (2013) 704:265–278
123

30 programmes, respectively) (Fig. 2). The associated
flora and fauna is also a very commonly monitored
category (included in 45 programmes) (Fig. 2). While
the categories ‘‘Distribution’’ and ‘‘Abundance’’ are
among the most monitored categories and also include
the top-three metrics, the remaining categories
0
10
20
30N
o. o
f p
rog
ram
s
Distribution33 programs
0
10
20
30
No
. of
pro
gra
ms
Processes29 programs
0
10
20
30
No
. of
pro
gra
ms
Abundance47 programs
0
10
20
30
No
. of
pro
gra
ms
Chemical constituents30 programs
0
10
20
30
No
. of
pro
gra
ms
Shoot characteristics34 programs
0
10
20
30
No
. of
pro
gra
ms
Associated flora and fauna45 programs
Fig. 2 Number of seagrass monitoring programmes which
monitors metrics within each of the categories ‘‘Distribution’’,
‘‘Abundance’’, ‘‘Shoot characteristics’’, ‘‘Processes’’, ‘‘Chemical
constituents’’, and ‘‘Associated flora and fauna’’. Each metric is
counted for each time a different programme includes it
Hydrobiologia (2013) 704:265–278 273
123

encompass multiple metrics, each of which is only
infrequently (\10 times) included in monitoring
programmes.
Seagrass metrics across regions
The diversity of seagrass metrics in use is high within
as well as between regions (Fig. 3). ‘‘Associated flora
and fauna’’ is the only category spanning across all
regions. The metric categories ‘‘Distribution’’ and
‘‘Abundance’’ are represented in all regions except the
Black Sea and are thereby the most ubiquitous of the
categories relating directly to seagrasses. By contrast
the seagrass categories ‘‘Shoot characteristics’’, ‘‘Pro-
cesses’’, and ‘‘chemical constituents’’ are only used in
the Mediterranean Sea, where they make part of
several P. oceanica and C. nodosa indicators.
In fact, monitoring programmes in the Mediterra-
nean include by far the largest diversity in seagrass
indicators and is the only region where the full range of
metric categories is assessed. Seagrass monitoring
programmes of the North East Atlantic region and the
Baltic Sea encompass three metric categories, while
those of the Black Sea encompass just one category
(Fig. 3).
Discussion
Our compilation demonstrates that European coun-
tries allocate substantial effort to monitor the
seagrass meadows fringing their coasts. The imple-
mentation of the European WFD since year 2000
has been a key driver increasing seagrass monitoring
effort in Europe, since most (66%) programmes
have been initiated in order to comply with WFD
(Table 2). The substantial effort invested in moni-
toring coastal ecological status through seagrass
health reflects both the high intrinsic conservation
value of seagrasses and their role as ‘‘miner’s
canaries’’ of coastal ecological quality.
European seagrass monitoring programmes apply a
wide diversity of indicators. The 42 monitoring
programmes compiled here include a total of 49
seagrass indicators based on a total of 51 seagrass
metrics used either alone or in various combinations of
up to 14 metrics per indicator. The actual diversity of
metrics is even larger since we grouped metrics with
commonalities and many metrics represent specific
water depths that may differ among areas and mon-
itoring programmes. The metrics in use span across six
broad categories covering various seagrass organiza-
tional levels and spatial scales ranging from square
centimeters to hectares. The set of seagrass indicators
quantified by the individual programmes varies within
and across regions. Similarly, the inclusion of seagrass
indicators from different categories in European
programmes is not restricted to programmes monitor-
ing seagrass health but also observed in many of them
aiming to comply with the European Water Frame-
work Directive (WFD), despite the WFD only requests
to define the ecological status of the water body
according with the presence and abundance of seag-
rasses and related disturbance-sensitive species.
The variability in the selection of seagrass metrics
between regions is to some extent due to the uneven
distribution along European coasts of seagrass flora
and, hence, to the differences in dynamics and
longevity of the species. Thus, the fact that the
endemic slow-growing and long-lived P. oceanica is
the dominant seagrass species in the Mediterranean,
whereas the faster growing and shorter-lived Z. noltii
and Z. marina are the dominant species growing in the
rest of European coasts, may be a major reason for the
particularly marked difference in seagrass metrics
applied in the Mediterranean when compared with
0
10
20
30
40
50
60
No.
of
met
rics
mon
itore
d
NEA
BALTIC
BLACK
MED
Fig. 3 Number of metrics monitored by seagrass monitoring
programmes in different regions: the NE Atlantic Sea (NEA),
the Baltic Sea (BALTIC), the Black Sea (BLACK), and the
Mediterranean Sea (MED). Metrics are grouped by category and
counted for each time a different programme includes it. Three
metrics are counted twice, since they are included in monitoring
programmes in the Baltic Sea as well as in the NE Atlantic Sea
274 Hydrobiologia (2013) 704:265–278
123

those in other European programmes. The slow
dynamics of P. oceanica implies that classic indicators
such as shoot density, biomass, or coverage may not be
sensitive enough, because of inherent patchiness, to
reliably infer whether the meadows show only slight
signs of disturbance as required by the WFD and
seagrass conservation programmes. Once a decline in
these parameters is sufficiently large to be detected in
P. oceanica meadows, there is a considerable risk that
the seagrass meadow has already undergone serious
damage that may not be reversible within reasonable
time scales (e.g., Marba et al., 2005). In assessments of
the status of P. oceanica meadows, the classic
abundance indicators are therefore often supple-
mented with additional metrics belonging to other
categories such as ‘‘Processes’’, ‘‘Chemical constitu-
ents’’, and ‘‘Shoot characteristics’’ which may respond
faster to disturbance and thereby can be early warning
indicators for seagrass deterioration. Indeed, metrics
from these three additional categories are regularly
measured only in Mediterranean monitoring pro-
grammes (Fig. 3; Table 2). Similarly, Giovannetti
et al. (2010) have proposed to use the epiphyte
community on P. oceanica leaves as early warning
indicators of deterioration of water quality in Medi-
terranean monitoring programmes.
The use of different metrics within and across
regions can also be attributable to different hydro-
graphic and habitat conditions such as water transpar-
ency, substratum type, salinity and tidal range, which
lead to the development different communities of
benthic flora. The Baltic, the NE Atlantic and the
Black seas, for example, often support mixed com-
munities of seagrasses and macroalgae in shallow
areas where hard substrate is scattered on the sandy sea
floor, and the large tidal range of the NE Atlantic
further supports intertidal in addition to subtidal
vegetation. The diversity of angiosperms is also
stimulated in the low saline areas of the Baltic Sea
where brackish water plants of the genera Ruppia,
Zannichellia and Potamogeton as well as Characeans
often mix with populations of Zostera. Such mixed
communities of angiosperms and macroalgae is in
contrast with the dominance of monospecific seagrass
meadows including a minor representation of macro-
algae in the marine flora of the Mediterranean.
Differences in habitat characteristics and vegetation
communities may, therefore, partially explain why the
Mediterranean has relatively fewer indicators (12%)
of the category ‘‘Associated flora and fauna’’ com-
pared to the Baltic Sea (48%), the NE Atlantic Sea
(33%), and the Black Sea (100%).
The use of different seagrass indicators within as
well as between regions also reflects scientific tradi-
tions and local knowledge, so that the choice of
indicator in a given country is connected with the
accumulated knowledge and available time series of
seagrass data. This component of the diversity of
seagrass indicators applied in European monitoring
programmes is, of course, to some extent connected
with the reasons discussed above. However, within
regions having similar seagrass species, habitat con-
ditions and benthic flora communities the tradition
component may be particularly important in explain-
ing differences in the choice of seagrass indicators.
Within European marine eco-regions this component
may act as a barrier to adopt common monitoring
methods and metrics. The scientific tradition compo-
nent should be strongest in countries and regions with
multiple institutions involved in seagrass research. In
contrast, areas with fewer and newer seagrass research
institutions and/or a more central organization of the
monitoring effort should carry less historical weight
and should be more flexible in the choice of metrics.
The numerous and long-living seagrass research
institutions in the Mediterranean countries in combi-
nation with a local organization of the monitoring
effort may help explain the high diversity of seagrass
indicators when compared with the Baltic Sea, the NE
Atlantic, and the Black Sea (Table 2), where the
diversity in seagrass research institutions is smaller
and monitoring efforts probably tend to be more
centrally organized. In addition, many countries
around the Baltic Sea and in the NE Atlantic region
only recently initiated a monitoring effort on seag-
rasses, and indicators are being developed through
communication with neighboring countries (e.g.,
Denmark) having a longer tradition in seagrass
research.
The large diversity in seagrass indicators applied
within and between regions complicates and reduces
the possibility to provide large-scale overviews of the
status of European seagrass meadows since a common
metric is lacking. The WFD, however, demands that
evaluation of ecological status based on biological
quality elements such as seagrasses and other benthic
flora must be comparable within given types of water
bodies and much effort has accordingly been allocated
Hydrobiologia (2013) 704:265–278 275
123

to the intercalibration of the various seagrass indica-
tors within regions (Lopez y Royo et al., 2011). This
study has been and still is being conducted through
geographical intercalibration groups (GIGs, i.e.,
within regions) of the WFD though with variable
success due to limited overlap of applied indicators
between areas.
If the diversity in seagrass indicators used across
European monitoring programs is justifiable and
scientifically sound, the differences within eco-
regions may not be always the case, and there is
potential to reduce the diversity of metrics into
common standards. This standardization of monitor-
ing metrics should follow the principle of parsimony,
and follow from the critical evaluation and test of the
strengths and limitations of the range of available
indicators. This evaluation can be conducted by (1)
testing the strength of the individual indicators with
respect to their sensitivity to reflect the responses to
pressures, (2) analyzing the robustness of the indicator
to uncertainty due to sampling, within-site variability,
interannual variability, etc., connected with the mea-
surement and with the associated evaluation of
ecological status, and (3) considering whether the
sampling is destructive or not. Such an evaluation
would form a sound basis for selecting the best set of
indicators for a given region to achieve the goals of the
monitoring programme. Intercalibration exercises
being conducted within European eco-regions, the
need to examine indicator–pressure–response rela-
tionships in order to comply with European WFD as
well the growing efforts aiming at quantifying the
uncertainty associated to the indicators (Bennet et al.,
2011; Balsby et al., 2012; Mascaro et al., 2012a, b) are
certainly contributing towards the standardization of
monitoring metrics.
Documentation of the pressure–response relation-
ships for the various seagrass indicators is limited and
largely based on spatial relationships (e.g., Krause-
Jensen et al. 2008) rather than temporal relationships
describing the response of indicators to a change in the
pressure over time (but see Borja et al., 2010).
Responses to pressures over time may differ consid-
erably from responses along spatial gradients in
pressures. The pathways of responses to an increase
in pressure such as eutrophication may also differ from
those of a release of pressure, such as oligotrophica-
tion, because alternative stable states, hysteresis
effects, and/or changing baselines may play important
roles (Scheffer & Carpenter, 2003; Duarte et al., 2009;
Carstensen et al., 2011). The uncertainty connected
with a given indicator also provides important infor-
mation on the probability that the indicator be
sensitive to a change in pressure, but this type of
information is also very limited at present.
In conclusion, the compilation of indicators of
seagrass health provided here demonstrates a large
variability in seagrass indicators within and across
European ecoregions. This variability reflects the
broad interest for documenting the status of these
valuable ecosystems and highlights the potential for
using seagrasses as indicators of ecological status in
the European coastal zone. However, the large diver-
sity of indicators applied and their limited overlap
across regions limits the possibility to provide pan-
European overviews of the status of seagrass ecosys-
tems. The diversity of indicators can be partially
justified by differences in species and associated time
scales of responses as well as by differences in habitat
conditions and associated community types but also
seems to be determined by scientific traditions. We
encourage an evaluation of the performance of
seagrass indicators on the basis of their responses to
pressures in space and, particularly, time and their
associated uncertainty in order to identify the most
suitable indicators that should conform the standards
of monitoring for specific coastal European eco-
regions.
Acknowledgments This study was funded by the European
project WISER (Water bodies in Europe: Integrative Systems to
assess Ecological status and Recovery; funded under the 7th EU
Framework Programmeme, Theme 6 (Environment including
Climate Change), Contract No.: 226273), and the COST Action
(Seagrass productivity: from genes to ecosystem management;
COST Action ES0906). We thank an anonymous reviewer and
L.R. Carvalho for useful comments on the ms.
References
Alvarez, E., M. Cerda, A. Frau & A. M. Grau, 2009. Seguimi-
ento de la red de vigilancia de las praderas de Posidonia
oceanica en Baleares (2002–2007). In Diputacion Alicante
(ed.), Posidonia oceanica Redes de seguimiento y estado
de conservacion en el mediterraneo espanol. Ingra Impre-
sores, Alicante: 70–91.
Balsby, T. J. S., J. Carstensen & D. Krause-Jensen, 2012.
Sources of uncertainty in estimation of eelgrass depth
limits. Hydrobiologia. doi:10.1007/s10750-012-1374-8.
276 Hydrobiologia (2013) 704:265–278
123

Baron, A., F. Orozco, C. M. Duarte, N. Marba & A. Tovar-
Sanchez, 2007. Estudi d’implementacio de la directiva
marc de l’aigua a Balears: avaluacio de la qualitat ambi-
ental de les masses d’aigua costaneres utilitzant indicadors
i ındex biologics. Element biologic de qualitat: Posidonia
oceanica. Report for the Agencia Balear de l’Aigua,
Balearic Government, Spain: 77 pp.
Bennet, S., G. Roca, J. Romero & T. Alcoverro, 2011. Eco-
logical status of seagrass ecosystems: an uncertainty
analysis of meadow classification based on the Posidonia
multivariate index (POMI). Marine Pollution Bulletin 62:
1616–1621.
Birk, S., J. Strackbein, & D. Hering, 2010. WISER methods
database. Version: October 2010. [Available at http://www.
wiser.eu/programmeme-and-results/data-and-guidelines/
method-database/].
Borja, A., S. B. Bricker, D. M. Dauer, N. T. Demetriades, J.
G. Ferreira, A. T. Forbes, P. Hutchings, X. Jia, R. Kench-
ington, J. C. Marques & C. Zhu, 2008. Overview of inte-
grative tools and methods in assessing ecological integrity
in estuarine and coastal systems worldwide. Marine Pol-
lution Bulletin 56: 1519–1537.
Borja, A., D. Dauer, M. Elliott & C. Simenstad, 2010. Medium-
and long-term recovery of estuarine and coastal ecosys-
tems: patterns, rates and restoration effectiveness. Estuar-
ies and Coasts 33: 1249–1260.
Borja, A., A. Basset, S. Bricker, J.-C. Dauvin, M. Elliott, T.
Harrison, J. C. Marques, S. Weisberg & R. West, 2012.
Classifying ecological quality and integrity of estuaries. In
E. Wolanski & D. McLusky (eds), Chapter 1.9 within the
Treatise on Estuarine and Coastal Science. Elsevier, Wal-
tham: 125–162.
Borum, J., C. M. Duarte, D. Krause-Jensen & T. M. Greve,
2004. European seagrasses: an introduction to monitoring
and Management. The M&MS Project. ISBN: 87-89143-
21-3. http://www.seagrasses.org.
Carstensen, J., M. Sanchez-Camacho, C. M. Duarte, D. Krause-
Jensen & N. Marba, 2011. Connecting the dots: responses
of coastal ecosystems to changing nutrient concentrations.
Environmental Science and Technology 45: 9122–9132.
Codina-Soler, A., M. Montero-Jimenez, S. V. Jimenez-Gut-
ierrez, J. Martınez-Vidal, J. E. Guillen-Nieto & G. Soler-
Capdepon, 2009. Red de control de las praderas de Posi-
donia oceanica en la Comunidad Valenciana. In Diputacion
Alicante (ed.), Posidonia oceanica Redes de seguimiento y
estado de conservacion en el mediterraneo espanol. Ingra
Impresores, Alicante: 50–69.
Cohen, J. E., 1995. How many people can the earth support?.
W. W. Norton & Company, New York: 532 pp.
Costanza, R., R. d’Argue, R. de Groot, S. Farber, M. Grasso, B.
Hannon, K. Limburg, S. Naeem, R. V. O’Neill, J. Paruelo,
R. G. Raskin, P. Sutton & M. van den Belt, 1997. The value
of the world’s ecosystem services and natural capital.
Nature 387: 253–260.
Den Hartog, C. 1970. The seagrasses of the world. North-Hol-
land Publ., Amsterdam: 275.
Duarte, C. M., N. Marba, D. Krause-Jensen & M. Sanchez-
Camacho, 2007. Testing the predictive power of seagrass
depth limit models. Estuaries and Coasts 30: 652–656.
Duarte, C. M., W. C. Dennison, R. J. W. Orth & T. J. B. Car-
ruthers, 2008. The charisma of coastal ecosystems:
addressing the imbalance. Estuaries and Coasts 31:
233–238.
Duarte, C. M., D. J. Conley, J. Carstensen & M. Sanchez-
Camacho, 2009. Return to Neverland: shifting baselines
affect eutrophication restoration targets. Estuaries and
Coasts 32: 29–36.
Giovannetti, E., M. Montefalcone, C. Morri, C. N. Bianchi & G.
Albertelli, 2010. Early warning response of Posidoniaoceanica epiphyte community to environmental alterations
(Ligurian Sea, NW Mediterranean). Marine Pollution
Bulletin 60: 1031–1039.
Gobert, S., S. Sartoretto, V. Rico-Raimondino, B. Andral, A.
Chery, P. Lejeune & P. Boissery, 2009. Assessment of the
ecological status of Mediterranean French coastal waters as
required by the water framework directive using the Pos-idonia oceanica rapid easy index: PREI. Mar. Pol. Bull. 58:
1727–1733.
Hemminga, M. A. & C. M. Duarte, 2000. Seagrass ecology.
Cambridge University Press, Cambridge: 312.
Jones, C. G., J. H. Lawton & M. Shachak, 1994. Organisms as
ecosystem engineers. Oikos 69: 373–386.
Krause-Jensen, D., A. L. Middelboe, P. B. Christensen, M.
B. Rasmussen & P. Hollebeek, 2001a. The authorities’
control and monitoring programmeme for the fixed link
across Øresund. Benthic vegetation. Status report 2000.
Semac JV on behalf of Ministry of Environment and
Energy, Copenhagen. ISBN 87-90595-43-2: 115 pp.
Krause-Jensen, D., J. S. Laursen, A. L. Middelboe & M. Stj-
ernholm, 2001b. NOVA-Teknisk anvisning for marin
overvagning, Chap. 12 (In Danish). National Environ-
mental Research Institute, Denmark. http://www.dmu.dk/
myndighedsbetjening/overvaagning/fagdatacentre/fdc
marintny/tekniskeanvisningernovana20042010/.
Krause-Jensen, D., S. Sagert, H. Schubert & C. Bostrom, 2008.
Empirical relationships linking distribution and abundance
of marine vegetation to eutrophication. Ecological Indi-
cators 8: 515–529.
Lopez y Royo, C., G. Pergent, C. Pergent-Martini & G. Casazza,
2010. Seagrass (Posidonia oceanica) monitoring in wes-
tern Mediterranean: implications for management and
conservation. Environmental Monitoring and Assessment.
doi:10.1007/s10661-009-1284-z.
Lopez y Royo, C., G. Pergent, T. Alcoverro, M. C. Buia, G.
Casazza, B. Martınez-Crego, M. Perez, F. Silvestre & J.
Romero, 2011. The seagrass Posidonia oceanica as indi-
cator of coastal water quality: experimental intercalibration
of classification systems. Ecological Indicators 11:
557–563.
Marba, N., C. M. Duarte, E. Dıaz-Almela, J. Terrados, E.
Alvarez, R. Martınez, R. Santiago, E. Gacia & A. M. Grau,
2005. Direct evidence of imbalanced seagrass (Posidoniaoceanica) shoot population dynamics along the Spanish
Mediterranean. Estuaries 28: 51–60.
Mascaro, O., S. Bennet, N. Marba, V. Nikolic, J. Romero, C.
M. Duarte & T. Alcoverro, 2012a. Uncertainty analysis
along the ecological quality status of water bodies: the
response of the Posidonia oceanica multivariate index
(POMI) in three Mediterranean regions. Marine Pollution
Bulletin 64: 926–931.
Mascaro, O., T. Alcoverro, K. Dencheva, D. Krause-Jensen, N.
Marba, I. Muxika, J. Neto, V. Nikolic, S. Orfanidis, A.
Hydrobiologia (2013) 704:265–278 277
123

Pedersen, M. Perez, J. Romero, 2012b. Exploring the
robustness of macrophyte-based classification methods to
assess the ecological status of coastal and transitional
ecosystems under the Water Framework Directive. Hyd-
robiologia. doi:10.1007/s10750-012-1426-0.
Nicholls, R. J. & C. Small, 2002. Improved estimates of coastal
population and exposure to hazards released. EOS Trans-
actions 83: 301–305.
Nixon S. & R. W. Fulweiler, 2009. Nutrient Pollution, Eutro-
phication, and the Degradation of Coastal Marine Eco-
systems. In Duarte, C. M. (ed.), Global Loss of Coastal
Habitats—Rates, Causes and Consequences, 1st edn.
Fundacion BBVA, Bilbao, Spain: 184 pp.
Orfanidis, S., V. Papathanasiou, S. Gounaris & T. H. Theodosiu,
2009. Size distribution approaches for monitoring and
conservation of coastal Cymodocea habitats. Aquatic
Conservation. doi:10.1002/aqc.1069.
Orth, R. J., T. J. B. Carruthers, W. C. Dennison, C. M. Duarte, J.
W. Fourqurean, K. L. Heck Jr, A. R. Hughes, G. A. Kend-
rick, W. J. Kenworthy, S. Olyarnik, F. T. Short, M. Way-
cott & S. L. Williams, 2006. A global crisis for seagrass
ecosystems. BioScience 56: 987–996.
Romero, J., B. Martınez-Crego, T. Alcoverro & M. Perez, 2007.
A multivariate index based on the seagrass Posidoniaoceanica (POMI) to assess ecological status of coastal
waters under the water framework directive (WFD). Mar-
ine Pollution Bulletin 55: 196–204.
Ruiz-Fernandez, J. M., R. Garcıa-Munoz, M. Garcıa-Martınez,
L. Marın-Guirao, J. M. Sandoval-Gil, J. Seron-Aguirre, A.
Ramos-Segura & J. Gavilan-Alonso, 2009. Red de
seguimiento de Posidonia oceanica en la region de Murcia.
In Diputacion Alicante (ed.), Posidonia oceanica Redes de
seguimiento y estado de conservacion en el mediterraneo
espanol. Ingra Impresores, Alicante: 92–113.
Sanchez-Rosas, J. & I. Olivella-Prats, 2009. La red de vigilancia
de la calidad biologica de las fanerogamas marinas en el
litoral catalan. In Alicante, D. (ed.), Posidonia oceanicaRedes de seguimiento y estado de conservacion en el
mediterraneo espanol. Ingra Impresores, Alicante: 26–49.
Scheffer, M. & S. Carpenter, 2003. Catastrophic regime shifts in
ecosystems: linking theory to observation. Trends in
Ecology & Evolution 18: 648–656.
Short, F. T. & S. Wyllie-Echeverria, 1996. Natural and human-
induced disturbance of seagrasses. Environment and Con-
servation 23: 17–27.
Short, F. T., E. W. Koch, J. C. Creed, K. M. Magalhaes, E.
Fernandez & J. L. Gaeckle, 2006. SeagrassNet monitoring
across the Americas: case studies of seagrass decline.
Marine Ecology 27: 277–289.
Swedish Environmental Protection Agency, 2008. Naturvards-
verkets foreskrifter och allmanna rad om klassificering och
miljokvalitetsnormer avseende ytvatten. http://swedishepa.
com/Documents/foreskrifter/nfs2008/nfs_2008_01.pdf.
Waycott, M., C. M. Duarte, T. J. B. Cattuthers, R. J. Orth, W.
C. Dennison, S. Olayarnik, A. Calladine, J. W. Fourqurean,
K. L. Heck, A. R. Hughes, G. A. Kendrick, W. J. Ken-
worthy, F. T. Short & S. L. Williams, 2009. Accelerating
loss of seagrasses across the globe threatens coastal eco-
systems. Proceedings of the National Academy of Sciences
of the United States of America 106: 12377–12381.
278 Hydrobiologia (2013) 704:265–278
123
Related Documents