Systems/Circuits Diverse Thalamocortical Short-Term Plasticity Elicited by Ongoing Stimulation Marta Díaz-Quesada, 1 * Francisco J. Martini, 1 * Giovanni Ferrati, 1 Ingrid Bureau, 2 and Miguel Maravall 1 1 Instituto de Neurociencias de Alicante, Universidad Miguel Herna ´ndez de Elche-Consejo Superior de Investigaciones Científicas, Campus de San Juan, 03550 Sant Joan d’Alacant, Spain, and 2 INSERM U901, Institut de Neurobiologie de la Me ´diterrane ´e, 13273 Marseille, France To produce sensation, neuronal pathways must transmit and process stimulus patterns that unfold over time. This behavior is deter- mined by short-term synaptic plasticity (STP), which shapes the temporal filtering properties of synapses in a pathway. We explored STP variability across thalamocortical (TC) synapses, measuring whole-cell responses to stimulation of TC fibers in layer 4 neurons of mouse barrel cortex in vitro. As expected, STP during stimulation from rest was dominated by depression. However, STP during ongoing stimulation was strikingly diverse across TC connections. Diversity took the form of variable tuning to the latest interstimulus interval: some connections responded weakly to shorter intervals, while other connections were facilitated. These behaviors did not cluster into categories but formed a continuum. Diverse tuning did not require disynaptic inhibition. Hence, monosynaptic excitatory lemniscal TC connections onto layer 4 do not behave uniformly during ongoing stimulation. Each connection responds differentially to particular stimulation intervals, enriching the ability of the pathway to convey complex, temporally fluctuating information. Introduction We experience the world in both space and time. In the rodent somatosensory system, the spatial relationship between individ- ual whiskers is preserved in a series of well studied topographical maps that occur at each stage of the projection from the periphery to the cortex (Petersen, 2007). However, whisker-mediated dis- crimination of tactile stimuli relies on temporal as well as spatial cues. During sensory exploration, the stimulus features that can be exploited to permit detection and identification are translated into the form of an intermittent temporal pattern of fluctuations in whisker motion. For example, whisker motion generated dur- ing natural exploration of textures is characterized by intermit- tent “stick-slip” events arriving at irregular intervals (Arabzadeh et al., 2005; Lottem and Azouz, 2008, 2009; Ritt et al., 2008; Wolfe et al., 2008; Jadhav et al., 2009; Jadhav and Feldman, 2010; Morita et al., 2011). These events can successfully activate neurons throughout the pathway from the whiskers up to the barrel cortex (Arabzadeh et al., 2005; Jadhav et al., 2009; Lottem and Azouz, 2009). Moreover, barrel cortex neurons respond differentially to irregular and regular whisker stimulation (Lak et al., 2008, 2010), indicating that differences in temporal stimulation pattern are read and discriminated centrally. In the somatosensory, visual and auditory systems, sensory information is transmitted to the cortex via thalamocortical (TC) synapses. Moment-to-moment changes in the size and reliability of these connections, termed short-term synaptic plasticity (STP), shape the dynamics of information flow into the cortex during ongoing stimulation. STP depends on stimulus frequency and therefore endows synapses with particular temporal or spec- tral filtering properties (Fortune and Rose, 2001; Abbott and Re- gehr, 2004; Buonomano and Maass, 2009). Specifically, the synapses mediating the principal “driver” pathway between TC neurons and excitatory neurons in layer 4 display STP dominated by strong depression when stimulated from rest (Stratford et al., 1996; Gil et al., 1997, 1999; Chung et al., 2002; Bruno and Sak- mann, 2006; Sherman and Guillery, 2006). However, sensory in- formation is typically delivered to the cortex on top of a background of other spontaneous and evoked activity. The degree of TC synaptic depression depends on the level of prior activity (Castro-Alamancos and Oldford, 2002; Castro- Alamancos, 2004; Boudreau and Ferster, 2005; Reig et al., 2006), and this may dramatically alter the transfer of informa- tion to the cortex. Here we evaluated the short-term dynamics of different TC connections during ongoing stimulation by recording responses in layer 4 neurons to both regular and irregular stimulation of thalamic fibers. STP during ongoing stimulation was highly het- Received June 9, 2013; revised Oct. 18, 2013; accepted Nov. 19, 2013. Author contributions: M.D.-Q., F.J.M., and M.M. designed research; M.D.-Q., F.J.M., G.F., and I.B. performed research; F.J.M. and M.M. contributed unpublished reagents/analytic tools; M.D.-Q., F.J.M., G.F., and M.M. analyzed data; F.J.M. and M.M. wrote the paper. This research was supported by grants from the Spanish Ministry of Science and Innovation (BFU2008-03017/BFI and BFU2011-23049, cofunded by the European Regional Development Fund; Consolider Program CSD2007- 00023); the Valencia Regional Government (ACOMP2010/199 and PROMETEO/2011/086); the Spanish National Research Council (CSIC); and the European Commission FP7 (IRG 200405 and ITN Marie Curie SyMBaD, grant agree- ment 238608). M.D.-Q. was supported by an I3P fellowship from the CSIC. We thank M.C. Castellanos for help with statistics; A. Faire ´n and C. Gil for advice on slice orientation; A. Valero Paternain for experimental advice; and M.E. Diamond, K.M. Franks, J. Lerma, and R.S. Petersen for critical reading of previous versions of the manuscript. *M.D.-Q. and F.J.M. contributed equally to this work. The authors declare no competing financial interests. Correspondence should be addressed to Miguel Maravall or Francisco J. Martini, Instituto de Neurociencias de Alicante UMH-CSIC, Campus de San Juan, Apartado 18, 03550 Sant Joan d’Alacant, Spain, E-mail: [email protected] or [email protected]. M. Díaz-Quesada’s present address: Brain Institute, University of Utah, 36 South Wasatch Drive, Salt Lake City, UT 84112. F.J. Martini’s present address: Biozentrum, University of Basel, Klingelbergstrasse 50/70, 4056 Basel, Switzerland. DOI:10.1523/JNEUROSCI.2441-13.2014 Copyright © 2014 the authors 0270-6474/14/340515-12$15.00/0 The Journal of Neuroscience, January 8, 2014 • 34(2):515–526 • 515

Welcome message from author
This document is posted to help you gain knowledge. Please leave a comment to let me know what you think about it! Share it to your friends and learn new things together.
Transcript

Systems/Circuits
Diverse Thalamocortical Short-Term Plasticity Elicited byOngoing Stimulation
Marta Díaz-Quesada,1* Francisco J. Martini,1* Giovanni Ferrati,1 Ingrid Bureau,2 and Miguel Maravall1
1Instituto de Neurociencias de Alicante, Universidad Miguel Hernandez de Elche-Consejo Superior de Investigaciones Científicas, Campus de San Juan,03550 Sant Joan d’Alacant, Spain, and 2INSERM U901, Institut de Neurobiologie de la Mediterranee, 13273 Marseille, France
To produce sensation, neuronal pathways must transmit and process stimulus patterns that unfold over time. This behavior is deter-mined by short-term synaptic plasticity (STP), which shapes the temporal filtering properties of synapses in a pathway. We explored STPvariability across thalamocortical (TC) synapses, measuring whole-cell responses to stimulation of TC fibers in layer 4 neurons of mousebarrel cortex in vitro. As expected, STP during stimulation from rest was dominated by depression. However, STP during ongoingstimulation was strikingly diverse across TC connections. Diversity took the form of variable tuning to the latest interstimulus interval:some connections responded weakly to shorter intervals, while other connections were facilitated. These behaviors did not cluster intocategories but formed a continuum. Diverse tuning did not require disynaptic inhibition. Hence, monosynaptic excitatory lemniscal TCconnections onto layer 4 do not behave uniformly during ongoing stimulation. Each connection responds differentially to particularstimulation intervals, enriching the ability of the pathway to convey complex, temporally fluctuating information.
IntroductionWe experience the world in both space and time. In the rodentsomatosensory system, the spatial relationship between individ-ual whiskers is preserved in a series of well studied topographicalmaps that occur at each stage of the projection from the peripheryto the cortex (Petersen, 2007). However, whisker-mediated dis-crimination of tactile stimuli relies on temporal as well as spatialcues. During sensory exploration, the stimulus features that canbe exploited to permit detection and identification are translatedinto the form of an intermittent temporal pattern of fluctuationsin whisker motion. For example, whisker motion generated dur-ing natural exploration of textures is characterized by intermit-tent “stick-slip” events arriving at irregular intervals (Arabzadehet al., 2005; Lottem and Azouz, 2008, 2009; Ritt et al., 2008; Wolfe
et al., 2008; Jadhav et al., 2009; Jadhav and Feldman, 2010; Moritaet al., 2011). These events can successfully activate neuronsthroughout the pathway from the whiskers up to the barrel cortex(Arabzadeh et al., 2005; Jadhav et al., 2009; Lottem and Azouz,2009). Moreover, barrel cortex neurons respond differentially toirregular and regular whisker stimulation (Lak et al., 2008, 2010),indicating that differences in temporal stimulation pattern areread and discriminated centrally.
In the somatosensory, visual and auditory systems, sensoryinformation is transmitted to the cortex via thalamocortical (TC)synapses. Moment-to-moment changes in the size and reliabilityof these connections, termed short-term synaptic plasticity(STP), shape the dynamics of information flow into the cortexduring ongoing stimulation. STP depends on stimulus frequencyand therefore endows synapses with particular temporal or spec-tral filtering properties (Fortune and Rose, 2001; Abbott and Re-gehr, 2004; Buonomano and Maass, 2009). Specifically, thesynapses mediating the principal “driver” pathway between TCneurons and excitatory neurons in layer 4 display STP dominatedby strong depression when stimulated from rest (Stratford et al.,1996; Gil et al., 1997, 1999; Chung et al., 2002; Bruno and Sak-mann, 2006; Sherman and Guillery, 2006). However, sensory in-formation is typically delivered to the cortex on top of abackground of other spontaneous and evoked activity. Thedegree of TC synaptic depression depends on the level of prioractivity (Castro-Alamancos and Oldford, 2002; Castro-Alamancos, 2004; Boudreau and Ferster, 2005; Reig et al.,2006), and this may dramatically alter the transfer of informa-tion to the cortex.
Here we evaluated the short-term dynamics of different TCconnections during ongoing stimulation by recording responsesin layer 4 neurons to both regular and irregular stimulation ofthalamic fibers. STP during ongoing stimulation was highly het-
Received June 9, 2013; revised Oct. 18, 2013; accepted Nov. 19, 2013.Author contributions: M.D.-Q., F.J.M., and M.M. designed research; M.D.-Q., F.J.M., G.F., and I.B. performed
research; F.J.M. and M.M. contributed unpublished reagents/analytic tools; M.D.-Q., F.J.M., G.F., and M.M. analyzeddata; F.J.M. and M.M. wrote the paper.
This research was supported by grants from the Spanish Ministry of Science and Innovation (BFU2008-03017/BFIand BFU2011-23049, cofunded by the European Regional Development Fund; Consolider Program CSD2007-00023); the Valencia Regional Government (ACOMP2010/199 and PROMETEO/2011/086); the Spanish NationalResearch Council (CSIC); and the European Commission FP7 (IRG 200405 and ITN Marie Curie SyMBaD, grant agree-ment 238608). M.D.-Q. was supported by an I3P fellowship from the CSIC. We thank M.C. Castellanos for help withstatistics; A. Fairen and C. Gil for advice on slice orientation; A. Valero Paternain for experimental advice; and M.E.Diamond, K.M. Franks, J. Lerma, and R.S. Petersen for critical reading of previous versions of the manuscript.
*M.D.-Q. and F.J.M. contributed equally to this work.The authors declare no competing financial interests.Correspondence should be addressed to Miguel Maravall or Francisco J. Martini, Instituto de Neurociencias de
Alicante UMH-CSIC, Campus de San Juan, Apartado 18, 03550 Sant Joan d’Alacant, Spain, E-mail:[email protected] or [email protected].
M. Díaz-Quesada’s present address: Brain Institute, University of Utah, 36 South Wasatch Drive, Salt Lake City, UT84112.
F.J. Martini’s present address: Biozentrum, University of Basel, Klingelbergstrasse 50/70, 4056 Basel,Switzerland.
DOI:10.1523/JNEUROSCI.2441-13.2014Copyright © 2014 the authors 0270-6474/14/340515-12$15.00/0
The Journal of Neuroscience, January 8, 2014 • 34(2):515–526 • 515
erogeneous across connections, a diversity that could largely beexplained by variable tuning to single interstimulus intervals(ISIs). Our data suggest that the population of TC connectionsfrom the ventral posterior medial (VPM) thalamic nucleus tolayer 4 neurons routes sensory information selectively, withdifferent subgroups of connections responding to differentintervals.
Materials and MethodsSlice preparation. All procedures complied with national and EuropeanUnion policies for the care and use of animals in research. TC slices(Agmon and Connors, 1991) were obtained from mice between 14 and25 postnatal days of age, later than the critical period for TC synapticplasticity (Crair and Malenka, 1995) and the period when sensory re-sponses have been described as facilitating (Borgdorff et al., 2007).C57BL/6 and ICR mouse strains were used; the results were equivalentand were pooled together. Mice were of either sex. Slices (350 �m thick-ness) were prepared following conventional methods (Díaz-Quesadaand Maravall, 2008). Briefly, after killing the animal, the brain was re-moved and placed in ice-cold cutting solution bubbled with carbogen(95% O2, 5% CO2) and containing the following (in mM): 110 Cl-choline, 25 NaHCO3, 25 D-glucose, 11.6 Na-aspartate, 7 MgSO4, 3.1Na-pyruvate, 2.5 KCl, 1.25 NaH2PO4, and 0.5 CaCl2. The brain was splitat the midline, and each hemisphere glued to a custom-made wedge at aslope of 50°. Usually, only one TC slice was obtained from each hemi-sphere. To verify the origins of TC inputs onto layer 4 neurons in slices atthis cutting angle, we conducted a separate set of experiments recordingsynaptic responses to glutamate uncaging with laser-scanning photo-stimulation (n � 8). This method, which does not stimulate fibers ofpassage, found that thalamic inputs onto layer 4 neurons originated spe-cifically within the VPM nucleus (Fig. 1B–D). As a control, we recordedinputs to layer 5A neurons and found that they originated within theposteromedial (PoM) complex (data not shown).
Slices were cut on a vibratome (Integraslice 7550M; Campden Instru-ments) and were transferred to a chamber containing artificial CSF(ACSF) continuously perfused with carbogen. They were then incubatedin ACSF at 34°C for �30 min before recording and then kept at roomtemperature until used. We used two ACSF solutions. Most results (Figs.2, 3, 4, 5, 6, 7, 8) were collected using a “low-calcium concentration”(low-[Ca 2�]) solution containing the following (in mM): 127 NaCl, 25NaHCO3, 25 D-glucose, 2.5 KCl, 1.25 NaH2PO4, 2 MgCl2, and 1 CaCl2.This gave a [Ca 2�] closer to physiological values than conventionalACSFs for in vitro recording. To examine the effects of [Ca 2�] on STPdiversity (Fig. 6) and allow comparison with other in vitro studies, we alsoused a solution with the following modified concentrations (in mM): 2CaCl2 and 1 MgCl2. All chemicals were obtained from Sigma-Aldrichunless otherwise noted.
Recordings. Patch electrodes were pulled from borosilicate glass (3– 6M�; outer diameter, 1.5 mm; inner diameter, 0.86 mm; Harvard Appa-ratus and WPI) and were filled with an internal solution containing thefollowing (in mM): 130 K-methylsulfonate, 10 Na-phosphocreatine, 10HEPES, 4 MgCl2, 4 Na2-ATP, 3 Na-ascorbate, and 0.4 Na2-GTP, pH 7.33,287–303 mOsm. Alexa Fluor 594 (Invitrogen) or DNDS (4,4�-dinitros-tilbene-2,2�-disulfonate; Tocris Bioscience) were added to the internalsolution in subsets of experiments. Recordings were performed at roomtemperature (24°C) or at 32–34°C.
Neurons were visualized with infrared differential interference con-trast optics and patched using whole-cell methods. Recordings were notcorrected for liquid junction potential. Neurons were classified accord-ing to their response to depolarizing square pulses of 500 ms durationand increasing intensity. Only neurons with the regular spiking pheno-type (McCormick et al., 1985) were included in the analyzed dataset.Input resistance was in the range 150 –500 M�, and access resistance was�10% of input resistance; recordings were discarded if access resistancewas unstable or the resting membrane potential drifted by �10 mV. Datawere acquired with an Axon Multiclamp 700-B amplifier (MolecularDevices), filtered at 4 –10 kHz, and sampled at 20 kHz (PCI 6040-E;
National Instruments) under the control of software custom written inMatlab (MathWorks; Pologruto et al., 2003).
Electrical stimulation. TC fibers were stimulated with a Pt-Ir concentricbipolar electrode (FHC; outer pole diameter, 200 �m; inner pole diam-eter, 25 �m) connected to a stimulus isolator (Iso Flex; A.M.P.I.). Allstimuli were generated in Matlab.
Because we wanted to quantify the net impact of a connection uponthe postsynaptic neuron (i.e., the effect caused on the cortical neuron bya presynaptic spike), we concentrated on analyzing postsynaptic poten-tials (PSPs) in current-clamp. Stimulation amplitude was determinedbased on the minimal stimulation approach (Fig. 2A; Raastad et al., 1992;Stratford et al., 1996; Gil et al., 1997, 1999), as follows. We applied singledepolarizing square current pulses of 0.1 ms duration; amplitude wasgradually increased until a clear PSP was seen in a fraction of trials.Slightly lowering stimulus amplitude led to complete response failure;slightly increasing amplitude caused an increase in response reliabilitywith no observed change in latency, magnitude, or shape (Fig. 2A). Weset the final magnitude at the latter level, such that response failures totemporally isolated single stimuli were not observed over �10 repeti-tions. This approach ensured that failures of stimulation were negligiblewhile the number of stimulated fibers was kept low (putatively �1). Wedid not observe any systematic difference in the occurrence of stimula-tion failures across depressing or facilitating synapses. In all synapses,fluctuations in success probability were anticorrelated, such that a failuretended to follow a successful synaptic event and vice versa, even at the
Figure 1. TC slice configuration and the origin of TC inputs to layer 4. A, TC slice configura-tion. bc, Barrel cortex; th, thalamus; h, hippocampus; str, striatum. Asterisks indicate typicalsites for recording (red) and stimulation (blue). Scale bar, 1 mm. B, Top, Mean EPSC responses tolaser-scanning photostimulation of 16 sites within a grid placed over the thalamic region of anexample slice. Each trace depicts the average response at one stimulation site. The green rect-angle demarcates the clearest synaptic inputs. Bottom, Color-coded input map for the full grid(18 18 sites); same example slice as in the top panel. The small green rectangle representsthe region of origin of the clearest inputs (same as the green rectangle in the top panel). C,Thalamic stimulation region and region of origin of clearest inputs relative to VPM and PoM,same example slice as B. Large green square depicts full photostimulation grid from B, bottom,1350 �m on the side; the small rectangle is the region of origin of clearest inputs, as in B. Scalebar, 500 �m. D, The thalamic stimulation region (large square) and the region of origin ofclearest inputs (small polygon) for a layer 4 recording in a different slice. Thalamic inputs to layer4 neurons originate in VPM. Scale bar, 500 �m.
516 • J. Neurosci., January 8, 2014 • 34(2):515–526 Díaz-Quesada, Martini et al. • Diversity of Thalamocortical Dynamics

shortest stimulus intervals. Moreover, any drift in measured successprobability during the experiment resulted in the elimination of the re-cording from the dataset. Stimulus amplitudes were 1–15 �A, toward thelower end of previously reported thresholds for TC activation and anorder of magnitude lower than thresholds for antidromic activation of
Figure 2. Diverse TC short-term plasticity elicited during ongoing stimulation. A, Protocolfor setting stimulus amplitude. There was a clear distinction between failed and successful trials(with PSPs evoked at fixed latency). Stimulus amplitude was set at the minimum level that gaveno stimulation failures. B, Example TC connection depresses under regular stimulation fromrest. The stimulus train (st.) is shown at the bottom. C, Depression from rest to steady state (SS),computed for each recording as the ratio of steady-state PSP divided by initial PSP (also termedadaptation ratio), across the population (n � 38). D, Diverse behavior of two example connec-tions after a switch from steady-state regular stimulation to an irregular train with identicalaverage frequency (stimulation pattern shown at bottom). Inset shows magnified PSPs of con-nection 2 immediately after switch; different colors correspond to successive PSPs. Both syn-apses depressed following stimulation from rest. E, Responses of one connection to an irregularpattern after switching during ongoing activity, compared with responses of the same
4
connection to the same pattern initiated from rest (after a pause of �5 s). Normalized, Re-sponses normalized to first PSP peak in the pattern. Response facilitation became evident afterprior depression. F, Top, Average normalized responses to short pulses in an identical irregularpattern, presented from rest or from steady state. PSP responses to the second and third stimuliin the pattern are averaged together and then normalized to the first PSP peak (as in E). Errorbars indicate SEM (n � 38). Bottom, Scatter plot of normalized responses to short pulses in thesame pattern from rest or after steady state (same data as top). Dashed line indicates identity.Prior depression enhanced facilitation. G, Diverse plasticity of PSP peaks across different con-nections. Stimulation was with a 42-pulse regular–irregular sequence as in D; plot begins atstimulus 14 in the sequence, while transition to the irregular train occurs at stimulus 22 (dashedline). Each row represents one connection (n � 38). For each connection, PSP peak magnitudeis normalized to its value at steady state (left side of plot: s.s. � 1). Recordings (rows) areordered from the smallest (top) to the largest (bottom) relative facilitation after the switch fromregular to irregular stimulation.
Figure 3. Population analysis of STP diversity. A, Tuning curve showing dependence of PSP mag-nitude on ISI for a connection whose responses are smaller for short ISIs. Black, Responses to irregularstimulus; blue (single data point), responses to regular stimulus; red, linear fit to initial (short-interval)part of tuning curve. Error bars indicate SEM. B, Tuning curve for a connection whose responses arelarger for short ISIs. Note the similarity of black and blue values in both A and B, indicating tuningunaffected by whether the interval is within a regular or irregular train. C, Facilitation index (relativeresponse after switch from regular to irregular stimulation) plotted against TCS across the population.Index is normalized such that 1 � no increase compared with steady state.
Díaz-Quesada, Martini et al. • Diversity of Thalamocortical Dynamics J. Neurosci., January 8, 2014 • 34(2):515–526 • 517

corticothalamic neurons (Rose and Metherate, 2001). After setting thestimulus amplitude as above, we checked that repetitive stimulation con-tinued to produce successful responses with unchanging latency andstereotypical shape throughout the train. Response characteristics re-mained stable over the course of the experiment; otherwise, the recordingwas discarded.
Stimulation protocols consisted of sequences resulting from the com-bination of regular and irregular pulse trains. In the main protocol (Fig.
2), a regular train was followed by an irregular train, both with the sameaverage frequency (4.59 Hz) and duration (21 pulses, 4.36 s). While theregular train had a constant ISI, the irregular train consisted of pulses atdifferent interspersed intervals in the range 13– 806 ms. A single specificirregular train was used, extracted from a recording of whisker-evokedaction potential activity in the VPM thalamic nucleus of a urethane-anesthetized rat (Petersen et al., 2008). Each sequence (9 s long) wasrepeated 10 –15 times per recording; each trial lasted 10 s, includingperiods of silence during which baseline properties were monitored. Ad-ditionally, there was a stimulation pause between trials 5 s (trial startcorresponded to condition “from rest”). A further set of recordings (Fig.4) used stimulation protocols consisting of sequences of regular stimuli,with a train of 21 pulses at 4.59 Hz followed either by another train at thesame frequency or a train at 2 or 12 Hz. All protocols were applied withthe same stimulation intensity, which was determined as describedabove.
Inhibitory blockade. A set of experiments was performed with theGABAA antagonist DNDS added to the recording pipette. To verify theeffect of DNDS, we performed separate voltage-clamp experiments andmeasured the reversal potential of evoked TC synaptic currents 12 msafter the stimulus (Fig. 5A). In these experiments, TC EPSCs reversed atthe glutamatergic reversal potential (0 mV) rather than at the hyperpo-larized potential found in the absence of DNDS (n � 3). DNDS concen-tration was 0.5 mM (n � 16) or 1 mM (n � 9): no effect of varying theconcentration was observed ( p � 0.49, two-dimensional Kolmogorov–Smirnov test), so experiments with different concentrations were pooledtogether.
Photostimulation recordings. For recordings involving mapping of syn-aptic inputs via laser-scanning photostimulation of caged glutamate,standard ACSF was modified with the following concentrations (in mM):0.2 MNI-caged glutamate (Tocris Bioscience); 0.005 D,L-3[()-2-carboxypiperazine-4-yl]-propyl-1-phosphonic acid, an antagonist ofNMDA receptors; 4 CaCl2; and 4 MgCl2. Recordings were performed atroom temperature. Neurons were patched under visual guidance usingborosilicate electrodes (4 – 6 M�) filled with intracellular solution con-taining the following (in mM): 128 K-methylsulfate, 4 MgCl2, 10 HEPES,1 EGTA, 4 Na2ATP, 0.4 Na2GTP, 10 Na-phosphocreatine, and 3 ascorbicacid, pH 7.25. Recordings were performed in voltage-clamp mode, fil-tered at 5 kHz, and sampled at 10 kHz. Cells were clamped at �70 mV,near the reversal potential of inhibitory currents (Bureau et al., 2008), toisolate the excitatory component of synaptic responses. Focal photolysisof caged glutamate was accomplished with a 2 ms, 20 mW pulse of a UVlaser (DPSS Lasers) through a 4 objective. Connections between tha-lamic neurons and the recorded cell in cortex were detected at sites wherestimulation evoked EPSCs. Spiking in thalamic cells occurred only whenglutamate was uncaged near their cell bodies, at a mean distance of �40�m from the soma (Bureau et al., 2006). The stimulus pattern consistedof 324 positions on an 18 18 grid (75 �m spacing). Software for controland acquisition was written in Matlab (Suter et al., 2010). Synaptic inputmaps for individual neurons were constructed by computing the meancurrent amplitude, averaged over a 50 ms time window beginning 6 msafter the UV stimulus for each location. These responses were used tobuild an input map for each cell (Fig. 1B–D).
Histology. A subset of neurons recorded with Alexa Fluor 594 in thepatch pipette was histologically processed and recovered. After whole-cell recording, the slice was fixed (4% paraformaldehyde in PBS; pH 7.3)at room temperature for 2 h. Slices were then rinsed 3 10 min in PBS,dried, and coverslipped in a solution of Mowiol (EMD Biosciences) withN-propyl gallate. Confocal stacks �80 �m thick were acquired usingoil-immersion 20 – 40 objectives in an inverted microscope (TCS SL;Leica). Serial optical sections were set at 0.5 �m intervals. Images wereprocessed using ImageJ (NIH, http://rsb.info.nih.gov/ij/). Stacks wereviewed after maximal projection onto two dimensions.
Analysis. To compute PSP amplitude, we searched for the first mem-brane potential peak in the window extending from 0.5 to 12 ms after thestimulation pulse, averaged the membrane potential over five data sam-ples (from �0.1 to 0.1 ms relative to the raw peak), and subtracted abaseline averaged over 2 ms immediately preceding the stimulationpulse. This short baseline effectively compensated for depolarization
Figure 4. Diversity of STP under regular stimulation. A, Example responses to the differentforms of stimulus sequence: regular stimulation with or without a switch to a different fre-quency (indicated above each trace) and regular-irregular stimulation. All responses are fromthe same recording. Stimulus patterns are shown under each trace. B, Comparison of initial andsteady-state responses across the population recorded with regular stimulation (n � 24). Eachconnected pair of points (colored line) corresponds to one recording. For all connections, theresponse at steady state was smaller than the response from rest. C, Tuning curves for allrecordings with regular stimulation at three different frequencies. Responses are normalized tothe steady-state value at 4.59 Hz. Tuning was diverse, with a different slope for each neuron. D,Facilitation index (i.e., the relative response after the switch from regular to irregular stimula-tion) plotted against TCS obtained for regular stimulation, for all recordings. norm., Normalized;st., stimulus train; SS, steady state.
518 • J. Neurosci., January 8, 2014 • 34(2):515–526 Díaz-Quesada, Martini et al. • Diversity of Thalamocortical Dynamics
caused by earlier PSPs. Stimulus artifacts were previously removed fromthe baseline period by median filtering. Mean PSP amplitude was com-puted for each stimulus in the train.
To compute the steady-state response level, we considered PSPsevoked during regular stimulation. We discarded the first five PSPs (i.e.,approximately the first second of stimulation) and computed the meansteady-state PSP amplitude by averaging over all remaining PSPs evokedduring regular stimulation. Steady-state depression (Fig. 2C) was evalu-ated by taking the ratio of the steady-state PSP amplitude to the averagePSP amplitude in response to the first pulse in the train (also sometimesreferred to as the “adaptation ratio” in the literature). Ratios �1 indi-cated depression. We computed a facilitation index to measure the rela-tive response upon switching from regular to irregular trains duringongoing stimulation, as follows. First, we averaged the PSP amplitudesevoked by the second and third pulses after the switch to irregular stim-
ulation, to reduce the dependence on a single,specific interval value. Then, we obtained thefacilitation index as the ratio of this quantity tothe steady-state PSP amplitude just before theswitch.
Tuning curves for each synaptic connectionwere computed by plotting PSP magnitude as afunction of the previous ISI. After constructingthe tuning curve for irregular stimulation, atuning curve slope (TCS; Fig. 3) was fit by lin-ear regression to the initial part of the tuningcurve (including only intervals shorter than theregular interval, 218 ms), to the late part ofthe curve (intervals longer than regular), or tothe full curve. All three possibilities pro-duced a significant negative correlation be-tween the resulting TCS and the facilitationindex (described above), but the fits based onthe initial part of the tuning curve gave thetightest empirical correlation. Hence, we pres-ent results for the initial (fastest timescale,�218 ms) part of the curve. TCSs for regularstimulation (Fig. 4) were fit by linear regressionto the curve from 2 to 12 Hz.
All analyses except for part of the statisticaltesting were conducted in Matlab (Math-Works). Statistical testing of diversity in theTCS and facilitation index variables across themain dataset was designed as follows. Usingrestricted maximum likelihood, we fit eachvariable (TCS, facilitation index) to a linearmixed-effects model with temperature and ex-tracellular [Ca 2�] as fixed effects and age as arandom effect. This analysis was programmedin the R language. The analysis indicated a sig-nificant effect of [Ca 2�] on TCS ( p � 0.018),although not on facilitation index ( p � 0.085).Because of this dependence of TCS on [Ca 2�],we divided the dataset into a group for each[Ca 2�] and conducted the remaining non-parametric (Spearman) correlation analysesseparately for each group. Results are first pre-sented for the [Ca 2�] � 1 mM group (Fig. 3C),and then compared for different [Ca 2�] andtemperatures (Fig. 6).
ResultsOngoing stimulation evokes diversethalamocortical short-term plasticityTo examine the effect of ongoing stimula-tion of afferent TC synapses, we performedwhole-cell patch-clamp recordings of PSPsfrom visually identified regular spiking neu-rons located within layer 4 barrels in mouse
TC slices (Fig. 1; animals of at least 2 postnatal weeks of age). Wefocused on PSPs recorded in current-clamp mode, rather than onpostsynaptic currents, to quantify the net impact of connectionsupon the postsynaptic neuron.
We first measured STP evoked by repetitive stimulation be-gun from rest (Fig. 2). We stimulated TC fibers with an extracel-lular electrode. To restrict stimulation to a reduced number offibers (putatively down to a single fiber), we used a protocoladapted from minimal stimulation, setting the stimulus magni-tude such that a temporally isolated single stimulus evoked asuccessful response in the majority of trials, clearly distinguish-able from failures (Fig. 2A). We verified that at this stimulationmagnitude, successful PSPs maintained their stereotypical shape
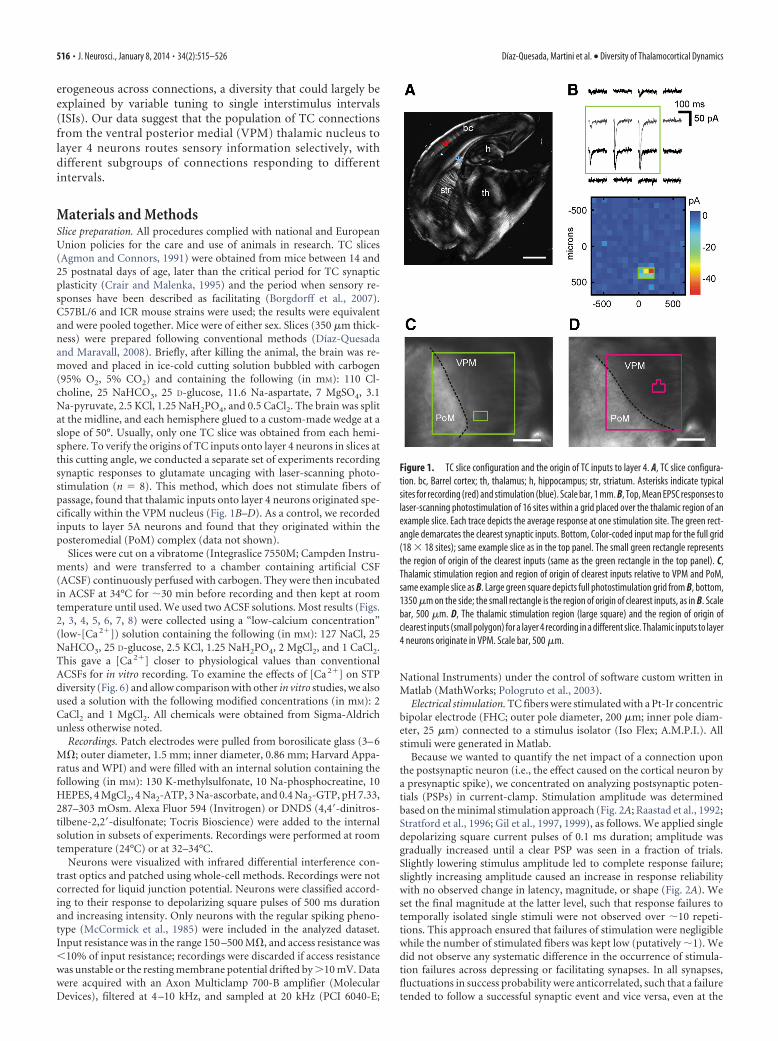
Figure 5. Negligible effect of inhibitory blockade on STP diversity. A, Verification of DNDS-mediated block of inhibition. I–Vcurves constructed from EPSC responses in voltage-clamp from two different neurons in the same slice, without (black) and with(green) DNDS in the internal solution. The slight difference in holding potential (Vh) among points at each nominal holdingpotential is caused by correction for the voltage drop across the series resistance. Note absence of synaptic response at the reversalpotential for excitation (�0 mV) with DNDS. B, Facilitation index plotted against TCS for experiments with and without DNDS inthe recording pipette (control, n � 22; DNDS, n � 25). Note the similarity between the two distributions.
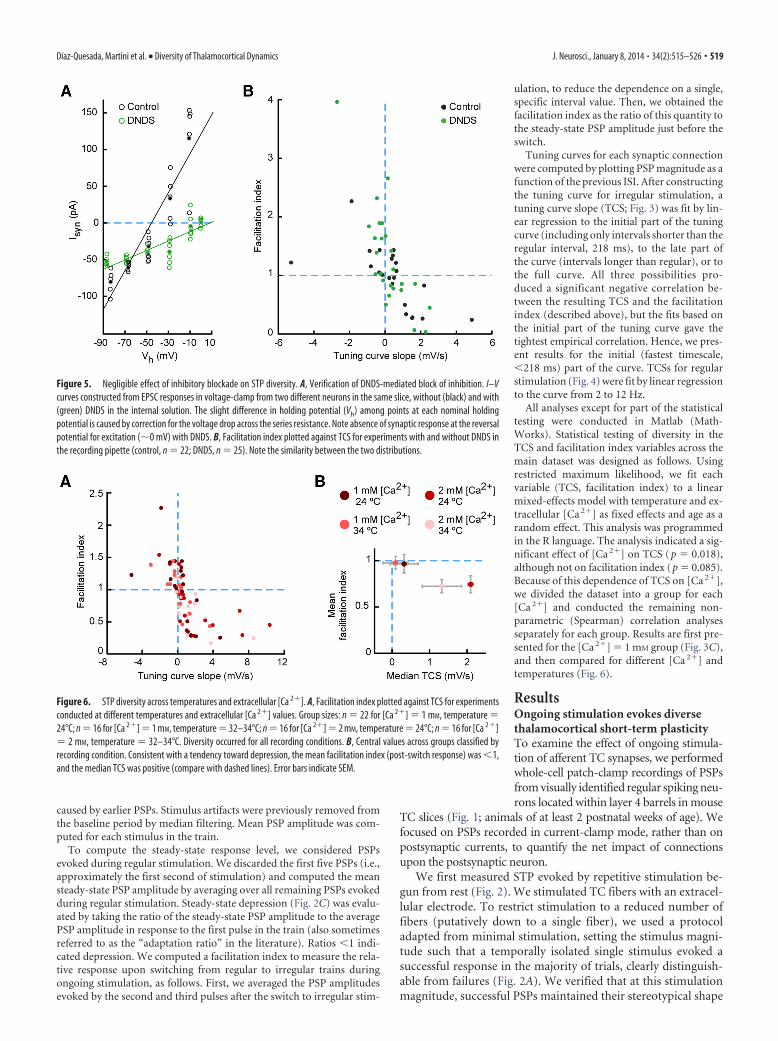
Figure 6. STP diversity across temperatures and extracellular [Ca 2�]. A, Facilitation index plotted against TCS for experimentsconducted at different temperatures and extracellular [Ca 2�] values. Group sizes: n � 22 for [Ca 2�] � 1 mM, temperature �24°C; n � 16 for [Ca 2�] � 1 mM, temperature � 32–34°C; n � 16 for [Ca 2�] � 2 mM, temperature � 24°C; n � 16 for [Ca 2�]� 2 mM, temperature � 32–34°C. Diversity occurred for all recording conditions. B, Central values across groups classified byrecording condition. Consistent with a tendency toward depression, the mean facilitation index (post-switch response) was �1,and the median TCS was positive (compare with dashed lines). Error bars indicate SEM.
Díaz-Quesada, Martini et al. • Diversity of Thalamocortical Dynamics J. Neurosci., January 8, 2014 • 34(2):515–526 • 519

throughout a train of repetitive stimula-tion, suggesting that the fibers contribut-ing to the response remained stable;stimulation settings are further detailed inthe Electrical stimulation section of Mate-rials and Methods. Under these condi-tions, the distribution of peak amplitudesof PSP responses to temporally isolatedstimuli was between 0.70 –7.92 mV (me-dian, 2.22 mV), consistent with earlier invitro work using minimal stimulationprotocols in rat and cat (Stratford et al.,1996; Gil et al., 1999). In the following,“connection” refers to the single fiber orsmall number of fibers excited by thisstimulation protocol.
An example response to a stimulustrain started from rest can be seen in Fig-ure 2B. In this example, stimulation oc-curred at regular (periodic) intervals(frequency, 4.59 Hz). Under stimulationat this frequency, all connections dis-played net depression from rest to steadystate (Fig. 2C), consistent with the litera-ture on TC STPs; the exact amount of de-pression varied from connection toconnection. Depression always reachedsteady state earlier than 1 s after beginningstimulation, which again is in line withearlier work performed under similarconditions (Gil et al., 1999; Gabernet etal., 2005).
A more surprising behavior occurredwhen STP was examined during ongoingstimulation, once responses had reachedsteady state. After several seconds of stim-ulation, we switched to a stimulus se-quence with irregularly spaced intervalsbut with mean frequency matched to thatof the earlier regular sequence (i.e., theaverage interval was unchanged). Thisswitch in the pattern of ongoing stimula-tion caused different connections to re-spond in remarkably different ways (Fig.2D). The transition from the regular to theirregular pattern—which, notably, inter-spersed long and short intervals (i.e., lowand high instantaneous frequencies)—provided evidence that some connectionsresponded more to long intervals andwere more depressed after short intervals (Fig. 2D, connection 1),consistent with STP dominated by depression. However, otherconnections had an enhanced response to short intervals, effec-tively acting as spike burst detectors (Fig. 2D, connection 2).
We emphasize that these differences in STP between connec-tions during irregular stimulation appeared when stimulatingfrom a predepressed steady state. All connections had previouslyreached depression upon regular stimulation from rest. This sug-gested that the facilitated response to short intervals evoked insome connections after switching to irregular stimulation mightdepend on the fact that the switch occurred upon a backgroundof ongoing stimulation (i.e., prior predepression or conditioningmight be required). Indeed, the exact same irregular stimulus
train presented from rest produced different dynamics comparedwith when it was presented from steady state, after prior stimu-lation (Fig. 2E). The relative response to the short intervals in thetrain (obtained by normalizing to the first response in the train)was much larger after switching from regular to irregular stimu-lation than after initiating irregular stimulation from rest (Fig.2F; p � 7.2 10�12, paired t test; n � 38 recordings). Therefore,relative facilitation to short intervals required preconditioning.
To better visualize the range of STP diversity across connec-tions, we plotted the sequence of PSP response peaks for a popu-lation of n � 38 recordings, focusing on responses beginning wellinto the steady state (starting from stimulus 14 in the train; Fig.2G). The plot shows that different connections responded most
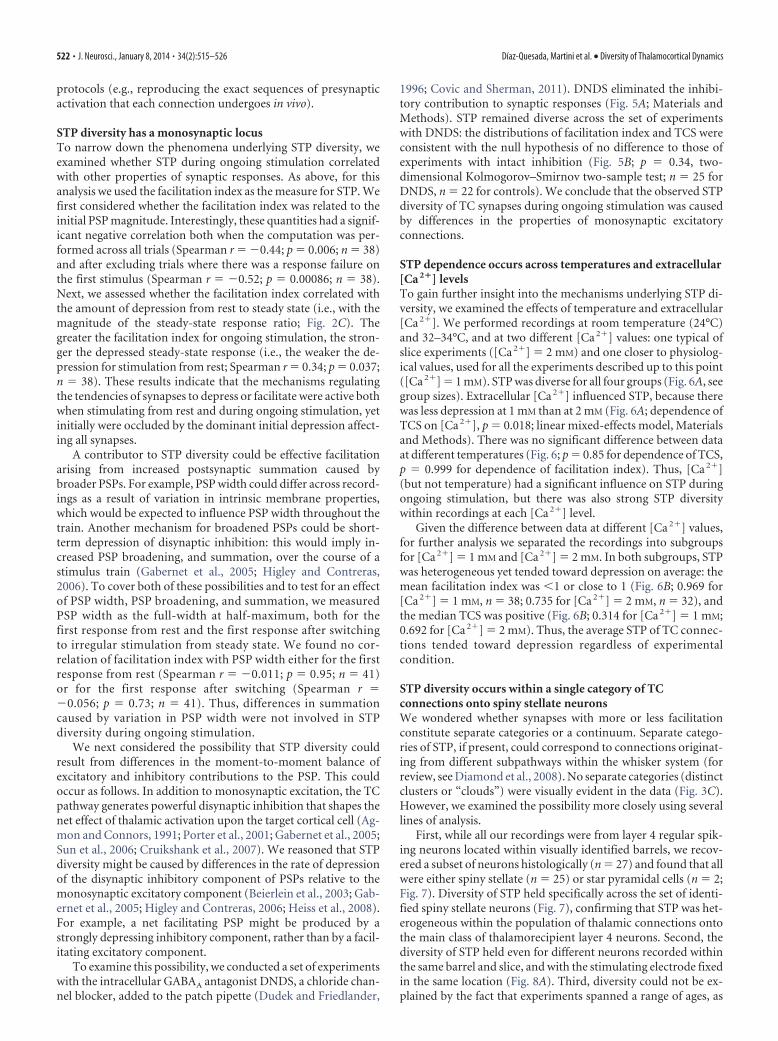
Figure 7. Diverse STP within recovered neurons. A, C, Two examples of spiny stellate neurons, fixed, recovered and observedunder fluorescent microscopy. Arrowheads indicate somata of recorded neurons. Scale bar, 100 �m. B, D, Corresponding ISI tuningcurves (black) and TCS (red). E, Facilitation index (i.e., the relative response after the switch from regular to irregular stimulation)plotted against TCS for the subset of recovered neurons. Note the considerable diversity within the population of identified spinystellate neurons (n � 25).
520 • J. Neurosci., January 8, 2014 • 34(2):515–526 Díaz-Quesada, Martini et al. • Diversity of Thalamocortical Dynamics

strongly at different moments in the irregular stimulation pat-tern. A few connections even reached their maximum magnitudelate in the sequence rather than at the onset of stimulation fromrest (data not shown). Thus, TC synaptic populations did notbehave with uniform dynamics. Rather, ongoing stimulationbrought out STP that was highly heterogeneous across connec-tions: each connection responded preferentially, and thereforecontributed most strongly to TC information transfer, at partic-ular times.
STP for each connection is predicted by tuning to thelatest intervalThe data presented above establish that each connection re-sponded in a unique manner to irregular stimulation startedfrom steady state. We wondered whether this response was pre-dicted by the tuning of PSP responses to instantaneous ISIs: inother words, whether STP depended only on the most recentactivity. Alternatively, the state of STP could depend on contex-tual, longer-timescale properties of an overall stimulus pattern(e.g., the overall irregular or regular nature of the pattern). Togain insight into this issue, for each connection we constructed atuning curve by plotting PSP magnitude as a function of thepreceding ISI during irregular stimulation (Fig. 3A,B). We con-sidered only PSPs evoked once steady state was reached, discard-ing the first few responses from rest (see Materials and Methods).We computed the slope of the tuning curve by linear regression(over the range of intervals up to 218 ms, which gave the bestempirical results; Materials and Methods). This TCS provided asimple measure of whether a connection tended to respond moreto shorter or to longer ISIs. Connections with smaller responsesto short intervals (i.e., to high instantaneous frequencies) hadpositive TCSs (Fig. 3A), while connections with larger responsesto short intervals had negative TCSs (Fig. 3B). We emphasize thatthis simple quantification of response tuning disregards effectson timescales longer than a single ISI.
We next computed the normalized response of each connec-tion after switching from regular to irregular stimulation (here-after referred to as the “facilitation index”). To obtain thefacilitation index, we divided the average PSP amplitude evokedfor the first two intervals after the switch by the steady-state PSPamplitude just before the switch (Materials and Methods): theindex was �1 when the mean response amplitude was reducedafter the switch and �1 when amplitude was increased after theswitch.
To compare the behaviors of different connections, we plottedthe facilitation index of each connection against its TCS (Fig. 3C).
This plot showed two principal results. First, there was substan-tial diversity across the population both in the facilitation indexand in the TCS. Second, the two quantities had a strong negativecorrelation (Fig. 3C; Spearman r � �0.74; p � 10�7; n � 38).Because TCS was computed from single-interval PSP tuningcurves, this strong negative correlation implies that r 2 � 55% ofthe variation in facilitation index across the population was ex-plained by the dependence of PSP magnitude on the single mostrecent ISI. Moreover, as mentioned, the single-ISI TCS was com-puted based on the range of intervals from 0 to 218 ms (Materialsand Methods). Hence, the variability in STP evoked after switch-ing to irregular stimulation could be predicted largely by instan-taneous interval-by-interval tuning on a fast timescale of up to�200 ms. In sum, despite its simplicity, the single-interval TCSdescription did a remarkably good job of capturing STP behaviorduring ongoing stimulation across the population.
STP diversity occurs under regular and irregular stimulationThe wide range of intervals present in irregular stimulus trainshelped to bring out the diversity of STP: each connection re-sponded preferentially to a particular subset of intervals within anirregular train (Fig. 3). However, this did not imply that irregularstimulation is required to trigger diverse STP. We hypothesizedthat, instead, diversity might also emerge during ongoing regularstimulation at different frequencies. To test this, we performed anew set of experiments where the first part of the stimulus train,which elicited initial depression from rest, had the same fre-quency as before (4.59 Hz), but the second part of the train was aregular sequence at either the same frequency (4.59 Hz) or at alower or higher frequency (2 or 12 Hz). Thus, at a certain timeafter the first part of the stimulus train, stimulation frequencycould increase, decrease, or remain unchanged (Fig. 4A).
As expected from the earlier dataset (Fig. 2C), all connectionsin the new experiments were depressed from stimulus onset tosteady state (Fig. 4B). Once depression to steady state was com-plete and the switch to the second part of the stimulus trainoccurred, connections displayed variable tuning. Some connec-tions responded more strongly to long intervals (lower fre-quency), while others responded more to shorter intervals(higher frequency; Fig. 4C). This suggested that tuning curvesconstructed under regular stimulation might also capture STPdiversity. To verify this, in each of the new experiments we mea-sured responses to trials where we switched from regular to irreg-ular stimulation, and computed the corresponding facilitationindex, as described above. We then plotted the facilitation indexof each connection (computed for irregular stimulation) againstits TCS (computed from the tuning curve to regular stimulation;Fig. 4D). The correlation between facilitation index and regularTCS was strong (Spearman r � �0.48; p � 0.019; n � 24). Thus,the diverse STP demonstrated by irregular stimulation also oc-curred during regular stimulation, and behavior during regularstimulation could predict behavior under irregular stimulation(Kandaswamy et al., 2010). Moreover, responses to a given inter-val under irregular stimulation matched those under regularstimulation (Fig. 3A,B, black and blue plots), suggesting thattuning was little affected by the regular or irregular context.
That responses during irregular stimulation were predicted bytuning to regular stimulation supports the notion that STP be-havior during ongoing stimulation was largely governed bymechanisms acting on the timescale of a single ISI, rather than bymechanisms dependent on longer timescales (e.g., the overallregular or irregular nature of the stimulus pattern). As a conse-quence, characterizing STP did not require a larger set of stimulus
Figure 8. STP diversity across conditions. A, Values for three sets of neurons (one quartet,one triplet, and one pair), each recorded within the same barrel in a slice, with the stimulatingelectrode fixed in position. B, Absence of correlation between facilitation index and age. Facil-itation index plotted against postnatal age.
Díaz-Quesada, Martini et al. • Diversity of Thalamocortical Dynamics J. Neurosci., January 8, 2014 • 34(2):515–526 • 521
protocols (e.g., reproducing the exact sequences of presynapticactivation that each connection undergoes in vivo).
STP diversity has a monosynaptic locusTo narrow down the phenomena underlying STP diversity, weexamined whether STP during ongoing stimulation correlatedwith other properties of synaptic responses. As above, for thisanalysis we used the facilitation index as the measure for STP. Wefirst considered whether the facilitation index was related to theinitial PSP magnitude. Interestingly, these quantities had a signif-icant negative correlation both when the computation was per-formed across all trials (Spearman r � �0.44; p � 0.006; n � 38)and after excluding trials where there was a response failure onthe first stimulus (Spearman r � �0.52; p � 0.00086; n � 38).Next, we assessed whether the facilitation index correlated withthe amount of depression from rest to steady state (i.e., with themagnitude of the steady-state response ratio; Fig. 2C). Thegreater the facilitation index for ongoing stimulation, the stron-ger the depressed steady-state response (i.e., the weaker the de-pression for stimulation from rest; Spearman r � 0.34; p � 0.037;n � 38). These results indicate that the mechanisms regulatingthe tendencies of synapses to depress or facilitate were active bothwhen stimulating from rest and during ongoing stimulation, yetinitially were occluded by the dominant initial depression affect-ing all synapses.
A contributor to STP diversity could be effective facilitationarising from increased postsynaptic summation caused bybroader PSPs. For example, PSP width could differ across record-ings as a result of variation in intrinsic membrane properties,which would be expected to influence PSP width throughout thetrain. Another mechanism for broadened PSPs could be short-term depression of disynaptic inhibition: this would imply in-creased PSP broadening, and summation, over the course of astimulus train (Gabernet et al., 2005; Higley and Contreras,2006). To cover both of these possibilities and to test for an effectof PSP width, PSP broadening, and summation, we measuredPSP width as the full-width at half-maximum, both for thefirst response from rest and the first response after switchingto irregular stimulation from steady state. We found no cor-relation of facilitation index with PSP width either for the firstresponse from rest (Spearman r � �0.011; p � 0.95; n � 41)or for the first response after switching (Spearman r ��0.056; p � 0.73; n � 41). Thus, differences in summationcaused by variation in PSP width were not involved in STPdiversity during ongoing stimulation.
We next considered the possibility that STP diversity couldresult from differences in the moment-to-moment balance ofexcitatory and inhibitory contributions to the PSP. This couldoccur as follows. In addition to monosynaptic excitation, the TCpathway generates powerful disynaptic inhibition that shapes thenet effect of thalamic activation upon the target cortical cell (Ag-mon and Connors, 1991; Porter et al., 2001; Gabernet et al., 2005;Sun et al., 2006; Cruikshank et al., 2007). We reasoned that STPdiversity might be caused by differences in the rate of depressionof the disynaptic inhibitory component of PSPs relative to themonosynaptic excitatory component (Beierlein et al., 2003; Gab-ernet et al., 2005; Higley and Contreras, 2006; Heiss et al., 2008).For example, a net facilitating PSP might be produced by astrongly depressing inhibitory component, rather than by a facil-itating excitatory component.
To examine this possibility, we conducted a set of experimentswith the intracellular GABAA antagonist DNDS, a chloride chan-nel blocker, added to the patch pipette (Dudek and Friedlander,
1996; Covic and Sherman, 2011). DNDS eliminated the inhibi-tory contribution to synaptic responses (Fig. 5A; Materials andMethods). STP remained diverse across the set of experimentswith DNDS: the distributions of facilitation index and TCS wereconsistent with the null hypothesis of no difference to those ofexperiments with intact inhibition (Fig. 5B; p � 0.34, two-dimensional Kolmogorov–Smirnov two-sample test; n � 25 forDNDS, n � 22 for controls). We conclude that the observed STPdiversity of TC synapses during ongoing stimulation was causedby differences in the properties of monosynaptic excitatoryconnections.
STP dependence occurs across temperatures and extracellular[Ca 2�] levelsTo gain further insight into the mechanisms underlying STP di-versity, we examined the effects of temperature and extracellular[Ca 2�]. We performed recordings at room temperature (24°C)and 32–34°C, and at two different [Ca 2�] values: one typical ofslice experiments ([Ca 2�] � 2 mM) and one closer to physiolog-ical values, used for all the experiments described up to this point([Ca 2�] � 1 mM). STP was diverse for all four groups (Fig. 6A, seegroup sizes). Extracellular [Ca 2�] influenced STP, because therewas less depression at 1 mM than at 2 mM (Fig. 6A; dependence ofTCS on [Ca 2�], p � 0.018; linear mixed-effects model, Materialsand Methods). There was no significant difference between dataat different temperatures (Fig. 6; p � 0.85 for dependence of TCS,p � 0.999 for dependence of facilitation index). Thus, [Ca 2�](but not temperature) had a significant influence on STP duringongoing stimulation, but there was also strong STP diversitywithin recordings at each [Ca 2�] level.
Given the difference between data at different [Ca 2�] values,for further analysis we separated the recordings into subgroupsfor [Ca 2�] � 1 mM and [Ca 2�] � 2 mM. In both subgroups, STPwas heterogeneous yet tended toward depression on average: themean facilitation index was �1 or close to 1 (Fig. 6B; 0.969 for[Ca 2�] � 1 mM, n � 38; 0.735 for [Ca 2�] � 2 mM, n � 32), andthe median TCS was positive (Fig. 6B; 0.314 for [Ca 2�] � 1 mM;0.692 for [Ca 2�] � 2 mM). Thus, the average STP of TC connec-tions tended toward depression regardless of experimentalcondition.
STP diversity occurs within a single category of TCconnections onto spiny stellate neuronsWe wondered whether synapses with more or less facilitationconstitute separate categories or a continuum. Separate catego-ries of STP, if present, could correspond to connections originat-ing from different subpathways within the whisker system (forreview, see Diamond et al., 2008). No separate categories (distinctclusters or “clouds”) were visually evident in the data (Fig. 3C).However, we examined the possibility more closely using severallines of analysis.
First, while all our recordings were from layer 4 regular spik-ing neurons located within visually identified barrels, we recov-ered a subset of neurons histologically (n � 27) and found that allwere either spiny stellate (n � 25) or star pyramidal cells (n � 2;Fig. 7). Diversity of STP held specifically across the set of identi-fied spiny stellate neurons (Fig. 7), confirming that STP was het-erogeneous within the population of thalamic connections ontothe main class of thalamorecipient layer 4 neurons. Second, thediversity of STP held even for different neurons recorded withinthe same barrel and slice, and with the stimulating electrode fixedin the same location (Fig. 8A). Third, diversity could not be ex-plained by the fact that experiments spanned a range of ages, as
522 • J. Neurosci., January 8, 2014 • 34(2):515–526 Díaz-Quesada, Martini et al. • Diversity of Thalamocortical Dynamics

STP did not depend on postnatal age (p � 0.73 for effect on TCS;p � 0.76 for effect on relative post-switch response; linear mixed-effects model; Fig. 8B).
In summary, these data are consistent with the existence of acontinuum of STP diversity within the population of lemniscalTC inputs, and specifically within inputs onto spiny stellateneurons.
DiscussionTC synapses are commonly treated as a uniform population withhomogeneous STP. Our results reveal that lemniscal TC connec-tions respond with diverse STP when new stimuli arrive against abackground of ongoing activity. These data indicate a continuumof STP behaviors within monosynaptic TC connections ontospiny stellate neurons. This implies that the dynamic behavior ofTC synapses as a population is not well described by the mean ofthe population. Moreover, the effectiveness of an individual TCconnection is not well described by a single static “weight” inresponse to a temporally isolated stimulus: its short-term dy-namic behavior must be considered as well (Buonomano andMaass, 2009).
Our data show that STP variability is a monosynaptic prop-erty. The overall tendency toward short-term facilitation or de-pression during ongoing stimulation varied with extracellular[Ca 2�], suggesting dependence on presynaptic mechanisms (Fig.6). Moreover, response facilitation was apparent only after “pre-depression” (i.e., after the dominant depression component ob-served from rest had reached steady state; Fig. 2E–G; Galarretaand Hestrin, 2000; Beck et al., 2005; Muller et al., 2010). Thisbehavior cannot be explained by models of synaptic dynamicsbased on uniform resource depletion; rather, additional mecha-nisms are required (Beck et al., 2005; Kandaswamy et al., 2010;Muller et al., 2010). Preliminary work suggests that classicmultiple-component models (Abbott et al., 1997; Tsodyks andMarkram, 1997; Varela et al., 1997; Markram et al., 1998; Kan-daswamy et al., 2010) can capture the STP diversity measuredduring ongoing stimulation, while an additional component isnecessary to fit the dominant depression occurring from rest
(H. Kato, C. Mirasso, and M. Maravall,unpublished observations).
Our results indicate that TC short-term dynamics tend toward depression onaverage. First, all connections were de-pressed by stimulation from rest (Fig.2B,C). Second, after a switch to irregularstimulation containing shorter intervals,responses were reduced on average, re-gardless of temperature and [Ca 2�] (Fig.6B). Finally, the median TCS was positive(i.e., with greater depression at shorter in-tervals; Fig. 6B). This overall behavioragrees with earlier findings that the aver-age TC connection does not facilitate(Stratford et al., 1996) and that short-term depression tends to dominate whensynapses are pooled together (Swadlow etal., 2002; Stoelzel et al., 2009). While con-sistent with these results, our data revealimportant diversity around the averagebehavior.
Experimental considerationsLayer 4 neurons receive collateral inputsfrom corticothalamic neurons in layer 6,
which can be antidromically activated by thalamic stimulationand evoke longer-latency, facilitating responses (Ferster andLindstrom, 1985; White and Keller, 1987; Staiger et al., 1996;Stratford et al., 1996; Zhang and Deschenes, 1997; Rose and Me-therate, 2001; Beierlein et al., 2003). We wondered whether facil-itating PSPs in our data corresponded to corticothalamic axons.However, we found no significant difference in response latencybetween depressing and facilitating connections (data notshown); neither did connections cluster into separate categories,as expected for TC versus corticothalamic responses (Fig. 3C;Beierlein et al., 2003). Moreover, we used only stimulus ampli-tudes at the lower end of published TC activation thresholds, anorder of magnitude lower than thresholds for corticothalamicactivation (Materials and Methods; Rose and Metherate, 2001).This makes it unlikely that our data were contaminated by corti-cothalamic responses.
While our protocol was designed to stimulate only one or areduced number of fibers, it is conceivable that repetitive stimu-lation, especially after short intervals, could recruit additionalfibers and lead to apparent response facilitation occurring differ-entially in different synapses. Several arguments indicate a negli-gible effect of this confound. First, PSP shape was maintainedstereotypically during the stimulus train. Second, responses ofconnections to short intervals facilitated much more weakly dur-ing stimulation from rest than during ongoing stimulation, evenwhen the stimulation patterns were identical and thus equallylikely to recruit additional fibers (Fig. 2E–G). Third, a tuningcurve with the appearance of facilitation but caused by multiple-fiber recruitment would look like a depressing (positive TCS)tuning curve but with a stepwise increase added on for the short-est intervals, because the effect of recruiting additional fiberswould be a sudden enhancement of the response at those inter-vals. Conversely, we found that facilitating STP correlated withtuning curves whose overall slope was negative (Figs. 3C, 6).Fourth, facilitating tuning curves were present under regularstimulation (Fig. 4C), not just under irregular stimulation, whichhad a greater presence of short intervals that could potentially
Figure 9. STP diversity can enrich information transmission in the TC pathway. The schematic shows different TC neuronswithin a VPM population (at left). These can encode distinct stimulus features and therefore respond at different times (reflectedin the trains of PSPs corresponding to synaptic inputs from the three colored neurons). The green and blue neurons encode similarstimulus features and tend to respond in greater synchrony, while the red neuron tends to respond at different times. All threeconnect to a cortical neuron, at right. At certain moments, TC connections from both the green and blue neurons are strong enoughto permit the downstream cell to selectively detect synchrony across those neurons (black arrows). Information about the value ofthe stimulus features encoded by the green and blue neurons is specifically transmitted at those times. However, at other momentsdifferences in STP across the connections (the connection from the green neuron depresses more than the blue), combined withslight differences in spike timing, can lead to a switch in the subset of neurons whose partial synchrony can be detected: now, thesubset includes either the green or the blue neuron together with others. For example, the white arrow indicates a time when thegreen, blue, and red neurons fire together but only the blue and red connections are strong enough to affect the activation of thedownstream cell. At this time, it is the value of the features encoded by the blue and red neurons that is transmitted.
Díaz-Quesada, Martini et al. • Diversity of Thalamocortical Dynamics J. Neurosci., January 8, 2014 • 34(2):515–526 • 523

enhance recruitment. Importantly, tuning curves constructedfrom regular stimulation predicted responses to irregular stimu-lation (Fig. 4D).
It is possible that we inadvertently stimulated multiple fibersinstead of single fibers throughout the train. If so, this caused anunderestimation of STP diversity, as each measured responsepooled (and therefore averaged) the behavior of several singlesynapses. In sum, the observed presence of facilitating synapsescannot be explained by additional recruitment of TC axons athigher frequencies or inadvertent stimulation of multiple fibers.
STP diversity in neural pathwaysSTP diversity also exists in other synaptic pathways. Differentcomponents of STP cause depression or facilitation acting overvarious timescales (Zucker and Regehr, 2002). Each class of syn-apse expresses a distinct combination of components, resultingin a characteristic net STP (Dittman et al., 2000), which is depen-dent both on presynaptic and postsynaptic neuron type (Thom-son, 1997; Markram et al., 1998; Reyes et al., 1998; Thomson andLamy, 2007; Williams and Atkinson, 2007). However, significantvariability can occur within each class (Rosenmund et al., 1993;Dobrunz and Stevens, 1997; Murthy et al., 1997; Losonczy et al.,2002). STP can even differ across connections made by one neu-ron onto several postsynaptic neurons of a single type (Markramet al., 1998). In some populations, STP variability tends to clusteraccording to the postsynaptic cell, suggesting regulation of plas-ticity at the single-cell level (Yang and Xu-Friedman, 2012).Moreover, synaptic dynamics confer particular temporal filteringproperties to each postsynaptic neuron: different neurons havedistinct tuning to interspike intervals (Carlson, 2009; George etal., 2011). The present study is, to our knowledge, the first char-acterization of STP diversity in a TC pathway, where it can haveprofound consequences for sensory coding at the populationlevel.
Functional implicationsOne consequence of our findings follows from the “prede-pressed” condition of TC synapses during activated states(Castro-Alamancos and Oldford, 2002; Castro-Alamancos, 2004;Boudreau and Ferster, 2005). This condition appears to be causedby prior activity rather than state-dependent modulation andmay be comparable to the steady state reported here (Stoelzel etal., 2009). Hence, the onset of whisker sensory input while in thepredepressed condition may be similar to the switch to irregularstimulation in our main protocol (Fig. 2). Our results suggest thatthe subset of TC synapses with greater facilitation could act asprivileged channels for detecting such sudden stimulus changes.
That a given temporal stimulus pattern facilitates some syn-apses while depressing others implies a second consequence forsensory coding: different TC synapses are strong at distinct timesduring ongoing activity (Fig. 2G). The subset of synapses provid-ing the strongest sensory input will vary from moment to mo-ment, directing information selectively (Buonomano andMerzenich, 1995; Buonomano et al., 1997; Buonomano, 2000;Buonomano and Maass, 2009). Different TC synapses providedistinct sensory messages, because different VPM neurons en-code different stimulus properties (e.g., whisker velocity or whis-ker acceleration; Petersen et al., 2008). Consequently, at onemoment the TC connection contributing the strongest weight toa cortical neuron could originate, for example, from a VPM cellrepresenting whisker velocity, while at another moment the maincontributor could represent acceleration (Fig. 9).
Neurons are sensitive detectors of small changes in synchronyacross their afferent population (Rossant et al., 2011; Brette,2012). STP diversity could refine this capacity by focusing theselectivity of a postsynaptic neuron for partial synchrony onto thegroup of inputs whose connections are currently strongest. Thisis particularly relevant for the transfer of sensory informationfrom VPM to cortex, because VPM populations display stimulus-dependent changes in synchrony (Temereanca et al., 2008). SinceVPM neurons encode distinct stimulus features (Petersen et al.,2008), different groups of neurons become coactivated at differ-ent times, depending on the patterns present in the stimulus (Baleet al., 2011). Changes in synchrony therefore contribute to sen-sory encoding. STP diversity could help thalamorecipient cellsfocus on detecting differential synchrony within the subset ofafferents that projects strong inputs at a given time (Fig. 9).
Cell-level regulation of STPOur data indicate that TC synapses could constitute differentinformation channels (Fig. 2G). It is possible that STP is specifi-cally regulated at the presynaptic or postsynaptic cell level. If, forexample, STP properties cluster presynaptically, all TC synapsesprojecting from a particular neuron will have similar dynamics.STP could also cluster postsynaptically (Yang and Xu-Friedman,2012), rendering each cortical neuron sensitive to specific inter-vals. Whether STP is regulated on a cell-to-cell basis is an impor-tant issue for future exploration. In any case, the STP expressedby any synapse is likely to depend on its history of usage and thusbe specific to some extent (Sippy et al., 2003; Cheetham et al.,2007; Branco et al., 2008; Pfister et al., 2010; Carvalho andBuonomano, 2011; Yang and Xu-Friedman, 2012).
ReferencesAbbott LF, Regehr WG (2004) Synaptic computation. Nature 431:796 – 803.
CrossRef MedlineAbbott LF, Varela JA, Sen K, Nelson SB (1997) Synaptic depression and
cortical gain control. Science 275:220 –224. MedlineAgmon A, Connors BW (1991) Thalamocortical responses of mouse so-
matosensory (barrel) cortex in vitro. Neuroscience 41:365–379. CrossRefMedline
Arabzadeh E, Zorzin E, Diamond ME (2005) Neuronal encoding of texturein the whisker sensory pathway. PLoS Biol 3:e17. CrossRef Medline
Bale MR, Ince RAA, Santagata G, Petersen RS (2011) Population coding oftexture-induced whisker motion in the ventroposterior medial nucleus ofthe thalamus. Soc Neurosci Abstr 37:704.14.
Beck O, Chistiakova M, Obermayer K, Volgushev M (2005) Adaptation atsynaptic connections to layer 2/3 pyramidal cells in rat visual cortex.J Neurophysiol 94:363–376. CrossRef Medline
Beierlein M, Gibson JR, Connors BW (2003) Two dynamically distinct in-hibitory networks in layer 4 of the neocortex. J Neurophysiol 90:2987–3000. CrossRef Medline
Borgdorff AJ, Poulet JF, Petersen CC (2007) Facilitating sensory responsesin developing mouse somatosensory barrel cortex. J Neurophysiol 97:2992–3003. CrossRef Medline
Boudreau CE, Ferster D (2005) Short-term depression in thalamocorticalsynapses of cat primary visual cortex. J Neurosci 25:7179 –7190. CrossRefMedline
Branco T, Staras K, Darcy KJ, Goda Y (2008) Local dendritic activity setsrelease probability at hippocampal synapses. Neuron 59:475– 485.CrossRef Medline
Brette R (2012) Computing with neural synchrony. PLoS Comput Biol8:e1002561. CrossRef Medline
Bruno RM, Sakmann B (2006) Cortex is driven by weak but synchronouslyactive thalamocortical synapses. Science 312:1622–1627. CrossRefMedline
Buonomano DV (2000) Decoding temporal information: a model based onshort-term synaptic plasticity. J Neurosci 20:1129 –1141. Medline
Buonomano DV, Maass W (2009) State-dependent computations: spatio-
524 • J. Neurosci., January 8, 2014 • 34(2):515–526 Díaz-Quesada, Martini et al. • Diversity of Thalamocortical Dynamics

temporal processing in cortical networks. Nat Rev Neurosci 10:113–125.CrossRef Medline
Buonomano DV, Merzenich MM (1995) Temporal information trans-formed into a spatial code by a neural network with realistic properties.Science 267:1028 –1030. CrossRef Medline
Buonomano DV, Hickmott PW, Merzenich MM (1997) Context-sensitivesynaptic plasticity and temporal-to-spatial transformations in hippocam-pal slices. Proc Natl Acad Sci U S A 94:10403–10408. CrossRef Medline
Bureau I, von Saint Paul F, Svoboda K (2006) Interdigitated paralemniscaland lemniscal pathways in the mouse barrel cortex. PLoS Biol 4:e382.CrossRef Medline
Bureau I, Shepherd GM, Svoboda K (2008) Circuit and plasticity defects inthe developing somatosensory cortex of FMR1 knock-out mice. J Neuro-sci 28:5178 –5188. CrossRef Medline
Carlson BA (2009) Temporal-pattern recognition by single neurons in asensory pathway devoted to social communication behavior. J Neurosci29:9417–9428. CrossRef Medline
Carvalho TP, Buonomano DV (2011) A novel learning rule for long-termplasticity of short-term synaptic plasticity enhances temporal processing.Front Integr Neurosci 5:20. CrossRef Medline
Castro-Alamancos MA (2004) Absence of rapid sensory adaptation in neo-cortex during information processing states. Neuron 41:455– 464.CrossRef Medline
Castro-Alamancos MA, Oldford E (2002) Cortical sensory suppression dur-ing arousal is due to the activity-dependent depression of thalamocorticalsynapses. J Physiol 541:319 –331. CrossRef Medline
Cheetham CE, Hammond MS, Edwards CE, Finnerty GT (2007) Sensoryexperience alters cortical connectivity and synaptic function site specifi-cally. J Neurosci 27:3456 –3465. CrossRef Medline
Chung S, Li X, Nelson SB (2002) Short-term depression at thalamocorticalsynapses contributes to rapid adaptation of cortical sensory responses invivo. Neuron 34:437– 446. CrossRef Medline
Covic EN, Sherman SM (2011) Synaptic properties of connections betweenthe primary and secondary auditory cortices in mice. Cereb Cortex 21:2425–2441. CrossRef Medline
Crair MC, Malenka RC (1995) A critical period for long-term potentiationat thalamocortical synapses. Nature 375:325–328. CrossRef Medline
Cruikshank SJ, Lewis TJ, Connors BW (2007) Synaptic basis for intensethalamocortical activation of feedforward inhibitory cells in neocortex.Nat Neurosci 10:462– 468. CrossRef Medline
Diamond ME, von Heimendahl M, Knutsen PM, Kleinfeld D, Ahissar E(2008) “Where” and “what” in the whisker sensorimotor system. Nat RevNeurosci 9:601– 612. CrossRef Medline
Díaz-Quesada M, Maravall M (2008) Intrinsic mechanisms for adaptivegain rescaling in barrel cortex. J Neurosci 28:696 –710. CrossRef Medline
Dittman JS, Kreitzer AC, Regehr WG (2000) Interplay between facilitation,depression, and residual calcium at three presynaptic terminals. J Neuro-sci 20:1374 –1385. Medline
Dobrunz LE, Stevens CF (1997) Heterogeneity of release probability, facili-tation, and depletion at central synapses. Neuron 18:995–1008. CrossRefMedline
Dudek SM, Friedlander MJ (1996) Intracellular blockade of inhibitory syn-aptic responses in visual cortical layer IV neurons. J Neurophysiol 75:2167–2173. Medline
Ferster D, Lindstrom S (1985) Synaptic excitation of neurones in area 17 ofthe cat by intracortical axon collaterals of cortico-geniculate cells.J Physiol 367:233–252. Medline
Fortune ES, Rose GJ (2001) Short-term synaptic plasticity as a temporalfilter. Trends Neurosci 24:381–385. CrossRef Medline
Gabernet L, Jadhav SP, Feldman DE, Carandini M, Scanziani M (2005) So-matosensory integration controlled by dynamic thalamocortical feed-forward inhibition. Neuron 48:315–327. CrossRef Medline
Galarreta M, Hestrin S (2000) Burst firing induces a rebound of synapticstrength at unitary neocortical synapses. J Neurophysiol 83:621– 624.Medline
George AA, Lyons-Warren AM, Ma X, Carlson BA (2011) A diversity ofsynaptic filters are created by temporal summation of excitation and in-hibition. J Neurosci 31:14721–14734. CrossRef Medline
Gil Z, Connors BW, Amitai Y (1997) Differential regulation of neocorticalsynapses by neuromodulators and activity. Neuron 19:679 – 686.CrossRef Medline
Gil Z, Connors BW, Amitai Y (1999) Efficacy of thalamocortical and intra-
cortical synaptic connections: quanta, innervation, and reliability. Neu-ron 23:385–397. CrossRef Medline
Heiss JE, Katz Y, Ganmor E, Lampl I (2008) Shift in the balance betweenexcitation and inhibition during sensory adaptation of S1 neurons. J Neu-rosci 28:13320 –13330. CrossRef Medline
Higley MJ, Contreras D (2006) Balanced excitation and inhibition deter-mine spike timing during frequency adaptation. J Neurosci 26:448 – 457.CrossRef Medline
Jadhav SP, Feldman DE (2010) Texture coding in the whisker system. CurrOpin Neurobiol 20:313–318. CrossRef Medline
Jadhav SP, Wolfe J, Feldman DE (2009) Sparse temporal coding of elemen-tary tactile features during active whisker sensation. Nat Neurosci 12:792–800. CrossRef Medline
Kandaswamy U, Deng PY, Stevens CF, Klyachko VA (2010) The role ofpresynaptic dynamics in processing of natural spike trains in hippocam-pal synapses. J Neurosci 30:15904 –15914. CrossRef Medline
Lak A, Arabzadeh E, Diamond ME (2008) Enhanced response of neurons inrat somatosensory cortex to stimuli containing temporal noise. CerebCortex 18:1085–1093. CrossRef Medline
Lak A, Arabzadeh E, Harris JA, Diamond ME (2010) Correlated physiolog-ical and perceptual effects of noise in a tactile stimulus. Proc Natl Acad SciU S A 107:7981–7986. CrossRef Medline
Losonczy A, Zhang L, Shigemoto R, Somogyi P, Nusser Z (2002) Cell typedependence and variability in the short-term plasticity of EPSCs in iden-tified mouse hippocampal interneurones. J Physiol 542:193–210.CrossRef Medline
Lottem E, Azouz R (2008) Dynamic translation of surface coarseness intowhisker vibrations. J Neurophysiol 100:2852–2865. CrossRef Medline
Lottem E, Azouz R (2009) Mechanisms of tactile information transmissionthrough whisker vibrations. J Neurosci 29:11686 –11697. CrossRefMedline
Markram H, Wang Y, Tsodyks M (1998) Differential signaling via the sameaxon of neocortical pyramidal neurons. Proc Natl Acad Sci U S A 95:5323–5328. CrossRef Medline
McCormick DA, Connors BW, Lighthall JW, Prince DA (1985) Compara-tive electrophysiology of pyramidal and sparsely spiny stellate neurons ofthe neocortex. J Neurophysiol 54:782– 806. Medline
Morita T, Kang H, Wolfe J, Jadhav SP, Feldman DE (2011) Psychometriccurve and behavioral strategies for whisker-based texture discriminationin rats. PLoS One 6:e20437. CrossRef Medline
Muller M, Goutman JD, Kochubey O, Schneggenburger R (2010) Interac-tion between facilitation and depression at a large CNS synapse revealsmechanisms of short-term plasticity. J Neurosci 30:2007–2016. CrossRefMedline
Murthy VN, Sejnowski TJ, Stevens CF (1997) Heterogeneous release prop-erties of visualized individual hippocampal synapses. Neuron 18:599 –612. CrossRef Medline
Petersen CC (2007) The functional organization of the barrel cortex. Neu-ron 56:339 –355. CrossRef Medline
Petersen RS, Brambilla M, Bale MR, Alenda A, Panzeri S, Montemurro MA,Maravall M (2008) Diverse and temporally precise kinetic feature selec-tivity in the VPm thalamic nucleus. Neuron 60:890 –903. CrossRefMedline
Pfister JP, Dayan P, Lengyel M (2010) Synapses with short-term plasticityare optimal estimators of presynaptic membrane potentials. Nat Neurosci13:1271–1275. CrossRef Medline
Pologruto TA, Sabatini BL, Svoboda K (2003) ScanImage: flexible softwarefor operating laser scanning microscopes. Biomed Eng Online 2:13.CrossRef Medline
Porter JT, Johnson CK, Agmon A (2001) Diverse types of interneurons gen-erate thalamus-evoked feedforward inhibition in the mouse barrel cortex.J Neurosci 21:2699 –2710. Medline
Raastad M, Storm JF, Andersen P (1992) Putative single quantum and singlefibre excitatory postsynaptic currents show similar amplitude range andvariability in rat hippocampal slices. Eur J Neurosci 4:113–117. CrossRefMedline
Reig R, Gallego R, Nowak LG, Sanchez-Vives MV (2006) Impact of corticalnetwork activity on short-term synaptic depression. Cereb Cortex 16:688 – 695. CrossRef Medline
Reyes A, Lujan R, Rozov A, Burnashev N, Somogyi P, Sakmann B (1998)Target-cell-specific facilitation and depression in neocortical circuits. NatNeurosci 1:279 –285. CrossRef Medline
Díaz-Quesada, Martini et al. • Diversity of Thalamocortical Dynamics J. Neurosci., January 8, 2014 • 34(2):515–526 • 525

Ritt JT, Andermann ML, Moore CI (2008) Embodied information process-ing: vibrissa mechanics and texture features shape micromotions in ac-tively sensing rats. Neuron 57:599 – 613. CrossRef Medline
Rose HJ, Metherate R (2001) Thalamic stimulation largely elicits ortho-dromic, rather than antidromic, cortical activation in an auditorythalamocortical slice. Neuroscience 106:331–340. CrossRef Medline
Rosenmund C, Clements JD, Westbrook GL (1993) Nonuniform probabil-ity of glutamate release at a hippocampal synapse. Science 262:754 –757.CrossRef Medline
Rossant C, Leijon S, Magnusson AK, Brette R (2011) Sensitivity of noisyneurons to coincident inputs. J Neurosci 31:17193–17206. CrossRefMedline
Sherman SM, Guillery RW (2006) Exploring the thalamus and its role incortical function. Cambridge, MA: MIT.
Sippy T, Cruz-Martín A, Jeromin A, Schweizer FE (2003) Acute changes inshort-term plasticity at synapses with elevated levels of neuronal calciumsensor-1. Nat Neurosci 6:1031–1038. CrossRef Medline
Staiger JF, Zilles K, Freund TF (1996) Recurrent axon collaterals of cortico-thalamic projection neurons in rat primary somatosensory cortex con-tribute to excitatory and inhibitory feedback-loops. Anat Embryol (Berl)194:533–543. Medline
Stoelzel CR, Bereshpolova Y, Swadlow HA (2009) Stability of thalamocor-tical synaptic transmission across awake brain states. J Neurosci 29:6851–6859. CrossRef Medline
Stratford KJ, Tarczy-Hornoch K, Martin KA, Bannister NJ, Jack JJ (1996)Excitatory synaptic inputs to spiny stellate cells in cat visual cortex. Nature382:258 –261. CrossRef Medline
Sun QQ, Huguenard JR, Prince DA (2006) Barrel cortex microcircuits:thalamocortical feedforward inhibition in spiny stellate cells is mediatedby a small number of fast-spiking interneurons. J Neurosci 26:1219 –1230.CrossRef Medline
Suter BA, O’Connor T, Iyer V, Petreanu LT, Hooks BM, Kiritani T, Svoboda K,Shepherd GM (2010) Ephus: multipurpose data acquisition software forneuroscience experiments. Front Neural Circuits 4:100. CrossRef Medline
Swadlow HA, Gusev AG, Bezdudnaya T (2002) Activation of a cortical col-umn by a thalamocortical impulse. J Neurosci 22:7766 –7773. Medline
Temereanca S, Brown EN, Simons DJ (2008) Rapid changes in thalamicfiring synchrony during repetitive whisker stimulation. J Neurosci 28:11153–11164. CrossRef Medline
Thomson AM (1997) Activity-dependent properties of synaptic transmis-sion at two classes of connections made by rat neocortical pyramidalaxons in vitro. J Physiol 502:131–147. CrossRef Medline
Thomson AM, Lamy C (2007) Functional maps of neocortical local cir-cuitry. Front Neurosci 1:19 – 42. CrossRef Medline
Tsodyks MV, Markram H (1997) The neural code between neocortical py-ramidal neurons depends on neurotransmitter release probability. ProcNatl Acad Sci U S A 94:719 –723. CrossRef Medline
Varela JA, Sen K, Gibson J, Fost J, Abbott LF, Nelson SB (1997) A quantita-tive description of short-term plasticity at excitatory synapses in layer 2/3of rat primary visual cortex. J Neurosci 17:7926 –7940. Medline
White EL, Keller A (1987) Intrinsic circuitry involving the local axon collat-erals of corticothalamic projection cells in mouse SmI cortex. J CompNeurol 262:13–26. CrossRef Medline
Williams SR, Atkinson SE (2007) Pathway-specific use-dependent dynam-ics of excitatory synaptic transmission in rat intracortical circuits.J Physiol 585:759 –777. CrossRef Medline
Wolfe J, Hill DN, Pahlavan S, Drew PJ, Kleinfeld D, Feldman DE (2008)Texture coding in the rat whisker system: slip-stick versus differentialresonance. PLoS Biol 6:e215. CrossRef Medline
Yang H, Xu-Friedman MA (2012) Emergence of coordinated plasticity inthe cochlear nucleus and cerebellum. J Neurosci 32:7862–7868. CrossRefMedline
Zhang ZW, Deschenes M (1997) Intracortical axonal projections of laminaVI cells of the primary somatosensory cortex in the rat: a single-cell label-ing study. J Neurosci 17:6365– 6379. Medline
Zucker RS, Regehr WG (2002) Short-term synaptic plasticity. Annu RevPhysiol 64:355– 405. CrossRef Medline
526 • J. Neurosci., January 8, 2014 • 34(2):515–526 Díaz-Quesada, Martini et al. • Diversity of Thalamocortical Dynamics
Related Documents