Universitat Polit` ecnica de Val` encia Departament de Sistemes Inform` atics i Computaci´o Diverse Contributions to Implicit Human-Computer Interaction by Luis A. Leiva A thesis submitted in fulfillment for the degree of Doctor of Philosophy in Computer Science supervised by Prof. Roberto Viv´ o and Prof. Enrique Vidal November 8, 2012

Welcome message from author
This document is posted to help you gain knowledge. Please leave a comment to let me know what you think about it! Share it to your friends and learn new things together.
Transcript

Universitat Politecnica de ValenciaDepartament de Sistemes Informatics i Computacio
Diverse Contributions to ImplicitHuman-Computer Interaction
by Luis A. Leiva
A thesis submitted in fulfillment for the
degree of Doctor of Philosophy in Computer Science
supervised by
Prof. Roberto Vivo and Prof. Enrique Vidal
November 8, 2012

PhD ThesisAvailable online at http://personales.upv.es/luileito/phd/.
Typesetted in LATEX (actually a mixture of TEX and LATEX2ε).Cover design by Luis A. Leiva. Iceberg photography c© Ralph A. Clevenger(http://www.ralphclevenger.com, reproduced with permission).
Most parts of this work were supported by the Spanish Ministry of Science andEducation (MEC/MICINN) under the research programme MIPRCV: “Con-solider Ingenio 2010” (CSD2007-00018). Other parts have been also supportedby the project TIN2009-14103-C03-03 and CasMaCat Project 287576 (FP7ICT-2011.4.2).
http://creativecommons.org/licenses/by/3.0/You are free to share (copy, distribute and transmit the work) and remix (adapt) thecontents of this document under the following condition: You must attribute the workin the manner specified by the author or licensor (but not in any way that suggeststhat they endorse you or your use of the work).

Board Committee
Member, Reviewer . . . . . . . . . . . . . . . . . . . . . . . . . . . . . . . . . . . . . . . . . . . . . . . . . . . . . . . . . .
Prof. Albrecht SchmidtUniversitat Stuttgart
Member, Reviewer . . . . . . . . . . . . . . . . . . . . . . . . . . . . . . . . . . . . . . . . . . . . . . . . . . . . . . . . . .
Prof. Antonio KrugerUniversitat des Saarlandes
Member, Reviewer . . . . . . . . . . . . . . . . . . . . . . . . . . . . . . . . . . . . . . . . . . . . . . . . . . . . . . . . . .
Dr. Toni GranollersUniversitat de Lleida
President . . . . . . . . . . . . . . . . . . . . . . . . . . . . . . . . . . . . . . . . . . . . . . . . . . . . . . . . . . . . . . . . . . .
Prof. Filiberto PlaUniversitat Jaume I
Secretary . . . . . . . . . . . . . . . . . . . . . . . . . . . . . . . . . . . . . . . . . . . . . . . . . . . . . . . . . . . . . . . . . . .
Dr. M. Carmen JuanUniversitat Politecnica de Valencia
Valencia, November 8, 2012


Abstract / Resumen / Resum
While interacting with computer applications, we submit an important amountof information unconsciously. By studying these implicit interactions we canbetter understand what characteristics of user interfaces add benefit (or not),thus deriving design implications for future systems.
The main advantage of processing implicit input data from the user is that everyinteraction with the system can contribute to enhance its utility. Additionally,such an input removes the cost of having to interrupt the user to submit explicitinformation that can be little related to the purpose of using the system. Onthe contrary, sometimes implicit interactions do not provide clear and concretedata. As such, how this source of information is managed deserves a specialattention.
This research is two-fold: 1) to apply new perspectives both to the design andthe development of tools that can take advantage from user’s implicit inter-actions, and 2) provide researchers with a series of evaluation methodologiesof interactive systems that are ruled by such implicit input methods. Fivescenarios are discussed to illustrate the feasibility and suitability of this the-sis framework. Empirical results with real users show that tapping implicitinteractions is a useful asset to enhance computer systems in a variety of ways.
Al interactuar con aplicaciones informaticas, proporcionamos inconscientementeuna cantidad importante de informacion. Mediante el estudio de estas interac-ciones implıcitas es posible entender que caracterısticas de la interfaz de usuarioson beneficiosas (o no), derivando ası en implicaciones para el diseno de futurossistemas interactivos.
La principal ventaja de procesar datos de entrada implıcitos del usuario esque cualquier interaccion con el sistema puede contribuir a mejorar su utilidad.Ademas, dichos datos eliminan el coste de tener que interrumpir al usuario paraque envıe informacion explıcitamente sobre un tema que en principio no tienepor que guardar relacion con la propia intencion de utilizar el sistema. Porel contrario, en ocasiones las interacciones implıcitas no proporcionan datosclaros y concretos. Por ello, hay que prestar especial atencion a la manera degestionar esta fuente de informacion.
El proposito de esta investigacion es doble: 1) aplicar una nueva vision tanto aldiseno como al desarrollo de aplicaciones que puedan aprovechar consecuente-mente a las interacciones implıcitas del usuario, y 2) proporcionar una seriede metodologıas para la evaluacion de dichos sistemas interactivos. Cinco esce-narios sirven para ilustrar la viabilidad y la adecuacion del marco de trabajo de

iv
la tesis. Resultados empıricos con usuarios reales demuestran que aprovecharla interaccion implıcita es un medio tanto adecuado como conveniente paramejorar de multiples maneras los sistemas interactivos.
Quan interactuem amb aplicacions informatiques, proporcionem inconscientmentuna quantitat important d’informacio. Mitjancant l’estudi d’aquestes interaccionsimplıcites es possible entendre quines caracterıstiques de la interfıcie d’usuari sonbeneficioses (o no), i derivar aixı en implicacions per al disseny de futurs sistemesinteractius.
El principal avantatge de processar dades d’entrada implıcites de l’usuari es quequalsevol interaccio amb el sistema pot contribuir a millorar la seua utilitat. Ames a mes, aquestes dades eliminen el cost d’haver d’interrompre l’usuari perqueenvie informacio explıcitament sobre un tema que en principi no te per que guardarrelacio amb la propia intencio d’utilitzar el sistema. No obstant aixo, a vegades lesinteraccions implıcites no proporcionen dades clares i precises. Per tant, cal prestarespecial atencio a la manera de gestionar aquesta font d’informacio.
El proposit d’aquesta investigacio es doble: 1) aplicar una nova visio al disseny ial desenvolupament alhora d’aplicacions que puguen reaccionar consequentment ales interaccions implıcites de l’usuari, i 2) proporcionar una serie de metodologiesper l’avaluacio d’aquests sistemes interactius. Cinc escenaris il·lustren la viabilitati l’adequacio del marc de treball de la tesi. Resultats empırics amb usuaris realsdemostren que aprofitar les interaccions implıcites es un mitja adequat i convenientalhora per a millorar de multiples maneres els sistemes interactius.

Keywords


AcknowledgmentsYa han pasado 5 anos desde que inicie mi andadura por el mundo de la in-vestigacion, al matricularme en el programa de doctorado que ha dado lugara esta tesis. Unas cuantas publicaciones y un sinfın de anecdotas dan buenaparte de una breve pero intensa trajectoria predoctoral que he tenido la suertede completar. En verdad me considero afortunado al respecto por una largaserie de razones, de las cuales comentare a continuacion aquellas que consideroespecialmente relevantes.
En primer lugar, me considero afortunado por haber tenido de directores detesis no uno sino dos catedraticos de la talla de Roberto Vivo y Enrique Vidal.He de agradecer a Roberto por haber depositado su confianza en mi desdeel primer momento en que le propuse hacer el DEA bajo su tutela. Me hadado un margen de maniobra sin precedentes que me ha permitido evolucionarfavorablemente como investigador. Por supuesto tambien he de agradecer aEnrique por darme la oportunidad de trabajar en el grupo PRHLT, lo que hasupuesto y sigue suponiendo un apasionante reto profesional. Es una suertetenerlo como co-director del grupo—junto con Francisco Casacuberta, otrapersona de la que uno solo puede hablar bien.
Desde aquı, mi mas sincero agradecimiento a toda la gente con la que he tenidola oportunidad de trabajar durante todo este tiempo. En especial, quieroagradecer a las siguientes personas por haberme permitido participar en eldesarrollo de unos novedosos prototipos: Veronica Romero (CATTI), DanielOrtiz (IMT), Ricardo Sanchez (IPP), Mauricio Villegas y Roberto Paredes(RISE) y Alejandro Toselli (KWS). Mencion de honor para Vicent Alabau,cuya creatividad y buen hacer parecen no tener lımites. Hemos compartidomuy buenos momentos, y sobre todo numerosas y fructıferas discusiones quese han materializado en importantes publicaciones conjuntas.
Tambien quiero mencionar al resto de mis companeros del ITI/DSIC, porquegracias a ellos el dıa a dıa en el entorno de trabajo es mas que reconfortante. Asıde repente me vienen a la mente Jesus Gonzalez, Nico Serrano, Elsa Cubel, An-tonio Lagarda, Esperanza Donat, German Sanchis, Jesus Andres, Jorge Civera,Jose Ramon “maestro” Navarro y las nuevas generaciones: Paco Alvaro, DaniMartın-Albo, Vicent Bosch, Mercedes Garcıa, Joan Albert y Miguel del Agua,entre otros. A los que se me olvidan, quedan agradecidos por extension ;)
I would also like to thank the primary reviewers of this thesis: AlbrechtSchmidt, Antonio Kruger and Toni Granollers, who accepted without hesi-tation to review and join the board committee on the defense day. I have toadmit that Albrecht has played inadvertently an important role in this thesis.Thanks to his research work, I started to get interested in the topic of thethesis. But also he introduced me to Antonio Kruger, whom I shared a greatstay with at the DFKI, together with the people from IRL. I would also liketo thank the secondary reviewers: Fabio Paterno, Antti Oulasvirta and Nuria

viii
Oliver. Althought they did not get the chance to actually review this thesis, Ihave been lucky enough to enjoy their support. And of course, I must thankthe rest of the board committee: Filiberto Pla (president), Mari Carmen Juan(secretary) and the alternate members Jose Miguel Benedı and Miguel Chover.
Por supuesto, quiero agradecer a mis amigos y a mi familia, en especial a mispadres y a mi hermana, porque la distancia geografica que nos separa no haevitado que me sigan dando todo su apoyo incondicional. Por ultimo, y no porello menos importante (¡ni mucho menos!) quiero agradecer muy especialmentea Bea Alonso por su infinita paciencia, sobre todo en los ultimos tramos de latesis. Ella es ahora mismo una de las personas mas importantes en mi vida. Aella le dedico esta tesis.
Luis A. LeivaNovember 8, 2012

Contents
Board Committee i
Abstract / Resumen / Resum iii
Keywords v
Acknowledgments vii
Nomenclature xiii
1 Introduction 1
1.1 Preamble: On User Behavior 2
1.1.1 Historical Background 2
1.2 Implicit Interaction 3
1.2.1 Putting It All Together 6
1.3 Aims and Goals of the Thesis 6
1.3.1 Organization and Contributions 7
1.3.2 Importance and Application Fields 8
1.4 Thesis Overview 9
1.4.1 Interactive Usability Evaluation 9
1.4.2 Behavioral Clustering 10
1.4.3 Human Multitasking 10
1.4.4 Adaptive User Interfaces 10
1.4.5 Interactive Pattern Recognition 11
Bibliography of Chapter 1 11
2 Interactive Usability Evaluation 15
2.1 Introduction 16
2.1.1 Lowering Usability Costs 17
2.2 Related Work 17
2.3 Simple Mouse Tracking 19
2.3.1 Overview of smt2 19
2.3.2 Introducing smt2ǫ 19
2.3.3 Architecture 20
2.3.4 Logging Users’ Interactions 21
2.3.5 Video Synthesis 22
ix

x Contents
2.3.6 Interacting with the Data 23
2.4 Applications 24
2.5 A Case Study 26
2.5.1 Qualitative Results 26
2.5.2 Quantitative Results 27
2.5.3 Limitations 28
2.6 Conclusions and Future Work 29
2.6.1 Some Notes on Privacy 30
Bibliography of Chapter 2 30
3 Behavioral Clustering 33
3.1 Introduction 34
3.1.1 Background 34
3.2 Revisiting the K-means Algorithm 35
3.2.1 Sequential Clustering 36
3.2.2 Warped K-Means 38
3.3 Evaluation 41
3.3.1 Clustering Browsing Interactions 42
3.3.2 Classifying Human Actions 47
3.4 Conclusions and Future Work 53
Bibliography of Chapter 3 54
4 Human Multitasking 57
4.1 Introduction 58
4.1.1 Preliminaries 58
4.1.2 The Costs of Attention Shifts 59
4.1.3 Strategies to Ease Multitasking 60
4.2 MouseHints 62
4.3 Evaluation 64
4.3.1 Results 65
4.4 Discussion 67
4.5 Conclusions and Future Work 69
Bibliography of Chapter 4 69
5 Adaptive User Interfaces 73
5.1 Introduction 74
5.2 Related Work 75
5.3 ACE: An Adaptive CSS Engine 76
5.3.1 Rationale 76
5.3.2 Overview 77
5.3.3 Adaptation Protocol 79
5.3.4 Implementation 79

Contents xi
5.3.5 Interaction Scoring Scheme 80
5.4 Fostering Creativity 81
5.5 Evaluation 83
5.6 Discussion 84
5.7 Conclusions and Future Work 86
Bibliography of Chapter 5 87
6 Interactive Pattern Recognition 89
6.1 Introduction 90
6.1.1 IPR Framework Overview 91
6.1.2 Interaction Protocol 92
6.2 IPR Systems Overview 93
6.2.1 Structured Input 93
6.2.2 Desultory Input 95
6.3 Evaluation 96
6.3.1 Interactive Handwritten Transcription 96
6.3.2 Interactive Machine Translation 100
6.3.3 Interactive Image Retrieval 104
6.4 Conclusions and Future Work 110
Bibliography of Chapter 6 111
7 General Conclusions 113
7.1 Summary 113
7.2 Future Outlook 114
Additional References 115
A Research Dissemination 117
List of Publications 118
List of Figures 121
List of Tables 123
Index 125


Nomenclature
ACE Adaptive CSS EngineAJAX Asynchronous Javascript And XMLAPI Application Programming InterfaceCSS Cascading Style SheetDOM Document Object ModelHCI Human-Computer InteractionHMM Hidden Markov ModelHTML HyperText Markup LanguageHTR Handwritten Text RecognitionHTTP HyperText Transfer ProtocolIDL Interface Definition LanguageIGP Interactive Grammatical ParsingIHT Interactive Handwritten TranscriptionIMT Interactive Machine TranslationIPR Interactive Pattern RecognitionJS JavaScriptJSON JavaScript Object NotationMT Machine TranslationNLP Natural Language ProcessingNN Nearest-NeighborPOI Probability Of ImprovementPR Pattern RecognitionRISE Relevant Image Search EngineSQE Sum of Quadratic ErrorsSUS System Usability ScaleTS Trace SegmentationUI User InterfaceWER Word Error RateWSR Word Stroke RateXML eXtensible Markup LanguageXUL XML UI Language
xiii


“ You can discover more about a person in an
hour of play than in a year of conversation.”Plato, 427–347 BC


Chapter 1
Introduction
Understanding how users behave has been (and certainly is) a longstandingsubject of study in a really wide range of disciplines in science. Often, behaviorneeds to be measured, usually by directly asking the users. When interactingwith computers, though, the intention of the user is mostly hidden. Whatis more, direct user feedback is notoriously unreliable most of the time. Forinstance, feedback regarding feelings, opinions, threats, etc. is strongly biasedtoward an individual perception; and hence it is hardly generalizable.
Fortunately, despite of the heterogeneity and dynamism inherent in user be-havior, some actions are common to many individuals, and hence they can berecognized automatically. This kind of information can provide useful hintswhen designing interactive systems, which is the foremost motivation of thisthesis, as discussed in this chapter.
Chapter Outline1.1 Preamble: On User Behavior 2
1.2 Implicit Interaction 3
1.3 Aims and Goals of the Thesis 6
1.4 Thesis Overview 9
Bibliography of Chapter 1 11
1

2 Chapter 1. Introduction
1.1 Preamble: On User Behavior
Behavior refers to the actions or reactions of an object or organism, usuallyin relation to the environment. Behavior can be (sub)conscious, (c)overt, and(in)voluntary. In Human-Computer Interaction (HCI), behavior is the collec-tion of responses exhibited by people, which are influenced by a diversity offactors; e.g., culture, attitudes, emotions, values, and/or genetics.
According to humanism, each individual has a different behavior. Observationsabout individual differences can thus inform the design of interfaces that aretailored to suit specific needs [Hwang et al., 2004]. Nevertheless, humans oftenshow certain behaviors recurrently. In fact, some actions can be recognizedautomatically and therefore can provide useful hints when designing interactivesystems. For example, when browsing a web page, if many users highlight thesame text paragraph and copy it, then that text is supposed to be interesting,and hence the webmaster could consider giving it more prominence, e.g., bytypesetting it in boldface.
Additionally, user behavior is not static but rather dynamic per se: prefer-ences and attitudes change frequently over time. This fact can easily invalidatemethods or theories that were developed not so many time ago, because ofthe temporary dependence of the evaluations that once supported them—forinstance, think of the findings on electronic mail usage analysis reported thirtyyears ago by Hersh [1982]. Instead, measuring natural behavior gives a muchmore accurate picture of a user’s immediate experience rather than asking himafter a task is complete [Hernandez, 2007]. This way, behavioral (or biometricor interaction-based) measurements are theoretically more accurate than re-lying on explicit user feedback. They are indeed theoretically more accuratebecause, similar to everyday life body language, a certain behavior does notindicate always and universally the same inner state [Gellner et al., 2004]. So,depending on the task or its context, we can safely rely on this kind of measuresor, on the contrary, acknowledge their limitations and combine them with otherdata sources.
1.1.1 Historical Background
According to behaviorism, behavior can be studied in a systematic and ob-servable manner with no consideration of internal mental states [Cherry, 2006].So, intentions are evidenced by exertions: users first focus and then executeactions. But, can behavior be measured? If not, then it could not be scientifi-cally analyzed. Fortunately, this is not the case. In fact, instrumentation, i.e.,automatic recording of user behavior within a system, has a long history inpsychology. Its use in simple systems such as operant chambers (c.f. the Skin-ner box) helped to advance the study of animal (and, later, human) learning,revealing new patterns of behavior. Instrumentation was a key milestone in

1.2. Implicit Interaction 3
HCI, since the field draws on cognitive psychology at its theoretical base. Overthe last 25 years researchers have used instrumentation to better understandusers and, consequently, to improve applications [Kim et al., 2008]. Computersare now found in most aspects of our daily life, and for some it is hard to evenimagine a world without them.
Today, user interfaces (UIs) are one of the main value-added competitive ad-vantages of computer applications, as both hardware and basic software becomecommodities. People no longer are willing to accept products with poorly de-signed UIs. So much so that notions of software products have been revisitedwith generalized psychology and physiology concepts in mind. For example, thestandard ISO/TR 16982:2002 addresses technical issues related to human fac-tors and ergonomics, to the extent necessary to allow managers to understandtheir relevance and importance in the design process as a whole.
Interaction design is often associated with the design of UIs in a variety ofmedia, but focuses on the aspects of the interface that define and present itsbehavior over time, with a focus on developing the system to respond to theuser experience and not the other way around. Designing interactive systems isabout designing technology to maximize aspects of the interaction toward somegoal [Bongard, 2010]. Interactivity, however, is not limited to technological sys-tems. People have been interacting with each other as long as humans havebeen a species [Sinclair, 2011]. Therefore, interaction design can be applied tothe development of any software solution, such as services and events. Ulti-mately, the design process must balance technical functionality and aestheticsto create a system that is not only operational but also usable and adaptable tochanging user needs. Therefore, it is necessary to consider a multidisciplinarypoint of view to understand the role of human beings in computer science.
Finally, to close this very succinct historical context1, we should mention thecontributions to HCI of notable organizations such as the Interaction DesignFoundation and ACM SIGCHI in USA or AIPO in Spain. Organizations likethese are providing an international discussion forum through conferences, pub-lications, workshops, courses and tutorials, websites, email discussion groups,and other services. For many of us, HCI is therefore enjoying a privilegedposition compared to other fields in computer science.
1.2 Implicit Interaction
Often, in HCI, behavior needs to be measured. Otherwise, how could we figureout if an application is really being used as intended? It is clear that user feed-back is invaluable and, as such, usually behavioral data are gathered by directlyasking the users. When interacting with computers, though, the intention ofthe user is mostly hidden [Hofgesang, 2006]. The activation of automatic goals,
1[Carroll, 2009] is a must-read in this regard.

4 Chapter 1. Introduction
and the physical traits of stimuli in our environment all influence our thoughtsand behavior considerably, and often without our awareness.
What is more, direct user feedback is notoriously unreliable most of the time.For instance, feedback regarding feelings, opinions, threats, etc. is stronglybiased toward an individual perception; and hence it is hardly generalizable—unless the size of the user sample is fairly substantial, of course, which is rarelythe case in HCI studies (see, e.g., [Henze, 2011] for a quantitative comparison).Moreover, this kind of feedback must be acquired through some in-lab basedmethods, e.g., surveys, usability tests, cognitive walkthroughs, etc., and there-fore requires to invest both time and money, which are often finite resourcesthat eventually should be optimized.
In addition, to learn a user’s interests reliably, intelligent systems need a signifi-cant amount of training data from the user. The cost of obtaining such trainingdata is often prohibitive because the user must directly label each training in-stance, and few users are willing to do so [Goecks and Shavlik, 2000; Zigorisand Zhang, 2006]. Meanwhile, users expect a system to work reasonably wellas soon as they first use the system. Thus, it is supposed that systems shouldwork well initially with less (or none) explicit user feedback.
The social psychologist John A. Barg (1955–) stated that one of the functionsof consciousness is to select behaviors that can be automated and become uncon-scious. In this context, researchers have elucidated new ways of expanding thisnotion to computers. As such, many different definitions (that largely overlapeach other) have been independently proposed worldwide and thus are diffuselyspread in the literature. For instance, implicit interaction is related to someextent to the following terms:
• Ubiquitous Computing [Weiser, 1993]
• Calm Technology [Weiser and Brown, 1996]
• Proactive Computing [Tennenhouse, 2000]
• Ambient Intelligence [Hansmann, 2003]
• Attentive Interface [Vertegaal, 2003]
• Perceptual Interface [Wilson and Oliver, 2005]
In the literature, implicit interaction is found to be cited, among others, as:
• Untold Feedback [Tan and Teo, 1998]
• Subsymbolic Behavior [Hofmann et al., 2006]
• Subconscious Awareness [Yoneki, 2006]
• Passive Actions [Grimes et al., 2007]
• Implicit Intentions [Kitayama et al., 2008]
Consequently, as pointed out by Oulasvirta and Salovaara [2004], the topic nowseems to be in a state of conceptual balkanization, and it is difficult to get an

1.2. Implicit Interaction 5
overall grasp of the field. This fact poses an additional difficulty when definingthe topic precisely. From my research, however, I would probably recommend(as being most adequate) the definition of Schmidt [2000]:
An action performed by the user that is not primarily aimed to interactwith a computerized system but which such a system understands as input.
Implicit interactions are thus those actions that the user performs with little (orno) awareness. And, unsurprisingly, humans have an abundance of experiencewith implicit interactions; we successfully employ them in a daily basis withoutconscious thought. For example, we laugh when someone tells a joke that welike. In doing so, we are communicating to that person that we appreciate sucha joke. Humans constantly exchange information about their environment, andso can do computers. Figure 1.1 depicts a framework that summarizes quitewell a modern view of implicit interactions in HCI.
Figure 1.1: The implicit interaction framework [Ju and Leifer, 2008]. c© MassachusettsInstitute of Technology. Reproduced with permission.
As previously pointed out, the concept of implicit interaction is somewhathistorically related to the ubiquitous computing (et al.) mantra: “the mostprofound technologies are those that disappear” [Weiser, 1999]. However, im-plicit interaction has a subtle but fundamental differentiation factor: is the userwho takes the initiative to interact with the system. Therefore, ultimately therole of implicit interaction consist in leveraging as much information as possiblederived from a natural user input, without requiring the user to be aware ofthe data the system needs to operate. This definitely has the capacity to makecomputers more useful and tailored to our needs.

6 Chapter 1. Introduction
1.2.1 Putting It All Together
The increasing use of technology—especially concerning to mobile devices andthe Web—is changing our daily lives, not only in the way we communicate witheach other or share information, but also how we relate to the environment.This entails new opportunities to transfer knowledge from one domain to an-other, by understanding that: a) implicit interactions offer a valuable sourceof information, and b) they can help to better manage user expectations.
By unobtrusively observing the user behavior we are able to learn functionsof value. We can collect automatically generated training samples during anormal use, allowing for a collection of large datasets if deployed over the Web.This is interesting for many reasons. First, typical interactions with an ap-plication can involve many impasses, depending on the expertise of the usertoward the application. Second, if such an application is intended to be usedby an unknown user population, then it is very likely to involve ill-structuredgoals and tasks, and substantial influences from the content that is encounteredwhile interacting [Card et al., 2001]. Third, classical approaches have relied onvery simple measures such as time spent on a task or average number of clicksalone. These measures do not, however, provide any trace of the moment-by-moment cognition that occurs between regular interactions. If we are interestedin developing detailed models of such cognition—for instance, to better under-stand how people’s goals evolve, how people perceive and process the contentsof an application, how and why they make decisions, and so on—then progresswill be accelerated by having more detailed data of that cognition [Card et al.,2001].
Implicit interaction, as observed, requires no training and provides context foractions. As such, a wise knowledge of the limits, capabilities, and potentialof implicit interaction in HCI provides an interesting theoretical basis for asystematic approach to analyzing, optimizing, and enhancing computer appli-cations.
1.3 Aims and Goals of the Thesis
The central hypothesis of this research work is that 1) there is a lot of in-formation inherently encoded in user interactions, which 2) can be measuredand from which it is possible to extract meaningful knowledge, and therefore3) can be leveraged in a wide spectrum of applications and tasks. Virtuallyevery chapter of the thesis is devoted to this notion, aiming to answer the samequestion: How can implicit interaction be of help in computing systems?
Other questions we try to answer include the following2. How can we exploitthe potential of computer-based support to augment our daily activities? How
2See also http://www.ercim.eu/EU-NSF/DC.pdf

1.3. Aims and Goals of the Thesis 7
can we build systems in the face of uncertainty and partial knowledge? Whendo we try to predict the user and when do we let the user choose? How do weconvey the system boundaries to the user?
This thesis is approached with a double-fold intent: a) researching on whatcharacteristics can be inferred or leveraged from how users behave when inter-acting with computers, and b) deriving applications and implications to improvethe utility of the systems that are meant to be used by people in a regular ba-sis. There is a challenge, thus, in the way we can exploit this potential, inorder to rethink how current technology may drive the dynamic environmentof interactive systems. Through an exploratory research well beyond the clas-sical (now interdisciplinary3) scope of HCI, this thesis will try to expand thebody of knowledge on implicit interaction to related communities that rely tosome extent on the user intervention, such as Cognitive Science, Infographics,Interactive Pattern Recognition, or Visual Design communities. This way, byexploring the role of implicit interactions in different domains and from dif-ferent perspectives, not only a global vision of their importance is acquired;but specific solutions and working perspectives are proposed, discussed, andevaluated at different levels of understanding, depending on the specific taskand the available resources. To do so, every chapter of this thesis has beenconceived as a self-contained unit that in turn relates to the central topic ofthe thesis: the role of implicit interaction in HCI.
1.3.1 Organization and Contributions
This work has been divided into five illustrative scenarios, each one correspond-ing to a main chapter of this thesis, which are indeed the main contributions ofthe author to the field of implicit interaction. A brief overview of them is nowadvanced, although the reader can find a more detailed description in ‘ThesisOverview’ on page 9.
Chapter 2 showcases what probably is the most direct application to begindealing with implicit interactions: visualization. An open source tool to under-stand browsing behavior is thoroughly described, providing also a real-worldcase study as an evidence of its utility. Most parts of this tool have been usedto build other systems that helped to achieve the goals of this thesis. Chap-ter 3 presents a methodology designed to model the user in context, i.e., tofind homogeneous groups of what a priori are different interaction behaviors,and also to automatically identify outliers. In addition, a novel revisitationof the K-means algorithm is presented to classify human actions in an unsu-pervised way. Chapter 4 discusses the problems when the focus of interactionchanges from application to application, either unconsciously (e.g., a pop-upnotification) or on purpose (e.g., multitasking). A technique to regain con-text is introduced in the domain of parallel browsing, and some directions are
3According to A. Oulasvirta, HCI has become so absurdly diverse and multi-multi-disciplinary that it is more aptly called hyper-disciplinary.

8 Chapter 1. Introduction
given to extend the same notion to mobile and desktop applications. Chap-ter 5 provides a novel approach to automatically redesign interface widgets.An appealing feature of such approach is that the method operates unobtru-sively for both the user and the application structure. Although this is stillongoing work, with about a year of existence, the motivation of the techniquehas been empirically validated. Chapter 6 discusses the role of implicit in-teractions in Interactive Pattern Recognition applications, where the systemand the user are expected to collaborate seamlessly. Four applications are ex-amined: handwriting transcription, machine translation, grammatical parsing,and image retrieval. Finally, Chapter 7 wraps up the general conclusions of thethesis, remarking the main implications for design when implicit interaction isconsidered, and stating possible directions for further research. Last but notleast, Appendix A enumerates the publications derived from this thesis.
1.3.2 Importance and Application Fields
Software applications in general and interactive systems in particular implysomewhat the understanding of their users. As previously discussed in Sec-tion 1.2, virtually any user-driven system can gain some benefit from implicitinteraction analysis. Just to name a few of the possible application fields:
Usabiliy Testing Both remote and in-lab usability experiments are the pri-mary source to evaluate the success of computer applications. Here, im-plicit interaction can help to unobtrusively analyze natural behaviors.
Data Mining If the experiments depicted above are, e.g., deployed over theWeb, one can obtain vast quantities of data samples and perform readilyprospective studies.
Performance Evaluation Related to the previous examples, a baseline con-trol sample could be compared to a variety of test samples in real time,without interfering with the user experience.
Interface Analysis Determine which elements in the layout do attract theuser interaction the most; again, without asking the users on purpose.
Gesture Recognition Use implicit features to convey meaning when drawinga picture (e.g., identify symmetries) or when handwriting (automaticallyisolate words or characters).
Usage Elicitation On the Web, spider bots behavior may greatly distort hu-man usage patterns, hence it is critical to deal only with interaction datafrom real users.
Interaction Research Understanding human movement is a key factor toimprove input devices as well as envision novel interaction techniques.

1.4. Thesis Overview 9
Behavior Prediction Usage data can presage not only how interfaces arelikely to be used, but also which elements add value (or not) to theapplication.
Information Visualization Visualizing what users have done is a great aidto understand exactly how users behave and perform actions.
Biometrics Model behavior according to the usage of mouse, keyboard, eye-gaze, or other input devices for identifying users unequivocally.
Collaborative Filtering Discover usage profiles, involving the collaborationamong multiple methods, viewpoints, data sources, and so on.
User Modeling Acquire information about a user (or a group of users) so asto be able to adapt their behavior to that user (or that group).
Multimodal Interfaces Leverage additional feedback signals that sometimesare unconsciously submitted to improve the utility of the system.
Self-Adapting UIs Use interaction data for re-arranging layout elements basedon how users interact with them.
1.4 Thesis Overview
The following sections below introduce the contents that shall be later cov-ered in the chapters of the thesis. It is worth mentioning that all systemsdeveloped in the context of this thesis are either web-based or closely relatedto the Web. The main reason is because currently people use web browsersmore than any other class of desktop software on a daily basis. This situa-tion has created a previously unparalleled level of user experience in a softwareniche [Edmonds, 2003]. Moreover, regarding to test new research methods andtechniques, three reasons back up the need for driving research through web-based systems: 1) the initial development time can be shorter, so the systemis available to users earlier, 2) continuous improvement is possible, withouthaving to update or reinstall software, and 3) real-world usage data can beobtained during the application life cycle.
1.4.1 Interactive Usability Evaluation
Besides conventional features such as performance and robustness, usabilityis now recognized as an important quality attribute in software development.Traditionally, usability is investigated in controlled laboratory conditions, byrecruiting a (hopefully representative) user sample and often performing videorecordings and surveys that are later reviewed. This requires an importantinvestment in time and money, not to mention that processing user interactiondata is, at a minimum, cumbersome. This chapter discusses the role of implicit

10 Chapter 1. Introduction
interaction when performing usability tests on websites; concretely, a) whichkind of data can be gathered by observing the overt behavior of users, withoutrelying on explicit feedback, b) how this data can be presented to the usabilityevaluator, and c) which questions can be answered by inspecting such data.
1.4.2 Behavioral Clustering
Behavioral clustering is a broad term that refers to the task of automaticallylabeling and classifying user behavior. Overall, clustering is a relevant methodto identify sub-populations in a dataset, so that they can be represented bymore compact structures for, e.g., classification and retrieval purposes. Tothis end, implicit interaction can provide current clustering methods with ad-ditional information. First, on the Web, fine-grained interactions can revealvaluable information (e.g., related to cursor movements, hesitations, etc.) thatis not available in typical access logs. Second, in a general context, user be-havior has an intrinsic sequential nature, which is not considered on currentclustering analysis, that can be exploited to simplify the structure of the data.This chapter proposes two approaches to solve both drawbacks: 1) a novelmethodology to model websites, i.e., finding interaction profiles according tohow users behave while browsing, and 2) a novel clustering algorithm to dealwith sequentially distributed data, whose suitability is illustrated in a humanaction recognition task.
1.4.3 Human Multitasking
We use different applications to multi-task the activities we do every day, evenwhen browsing the Web; e.g. it is not unusual having multiple tabs or browserinstances open at a time. People thus may cognitively coordinate simultaneoustasks through multiple windows or multi-tabbing, having many applicationsopen at the same time and switching between them in any order. This chapteraddresses how to reduce the overall cognitive load involved in switching amongmultiple windows during the course of typical information work. The chapterprovides directions for designing mobile applications, where interrupted tasksusually have a high resumption cost. A method was implemented to illustratea means to assist web browsing: using mouse movements as an indicator ofattention, a browser plugin highlights the most recently interacted item aswell as displaying (part of) the mouse path. An empirical study shows thatthis technique can help the user to resume and complete browsing tasks morequickly.
1.4.4 Adaptive User Interfaces
Adaptive systems accommodate the UI to the user, but doing so automaticallyis a non-trivial problem. Adaptation should be predictable, transparent, and

Bibliography of Chapter 1 11
discreet, so that changes introduced to the UI do not confuse the user. Also,adaptation should not interfere with the structure of the application. Thischapter presents a general framework to restyle UI widgets, in order to adaptthem to the user behavior. The value of this methodology comes from the factthat it is suited to any application language or toolkit supporting structureddata hierarchies and style sheets. As discussed, an explicit end user interventionis not required, and changes are gradually applied so that they are not intrusivefor the user. The method is also extended as a technique to foster creativity,by suggesting redesign examples to the UI developer.
1.4.5 Interactive Pattern Recognition
Mining implicit data from user interactions provides research with a series ofinteresting opportunities in order to create technology that adapts to the dy-namic environment of interactive systems. This chapter presents an iterativeprocess to produce a user-desired result, in which the system initially proposesan automatic output, which is partially corrected by the user, which the sys-tem then uses to suggest a suitable hypothesis. Such iterative (and interactiveand predictive) paradigm is the core of the MIPRCV project, a Spanish con-sortium of 10 universities and 7 research groups, which the author has beeninvolved with since 2009. The main contribution of the author to the projecthas been the development (and later evaluation with real users) of interactivesystems that implement the aforementioned paradigm, namely: 1) InteractiveHandwritten Transcription, 2) Interactive Machine Translation, 3) InteractiveGrammatical Parsing, and 4) Interactive Image Retrieval. According to user-simulated experiments and a series of real-world evaluations4, results suggestthat this paradigm can substantially reduce the human effort needed to producea high-quality output.
Bibliography of Chapter 1
J. Bongard. Class notes on Human Computer Interaction. Available at http://cs.uvm.
edu/~jbongard/2012_HCI/CS228_Class_02.pdf, 2010. Retrieved July 12, 2012.
S. K. Card, P. L. Pirolli, M. V. D. Wege, J. B. Morrison, R. W. Reeder, P. K.
Schraedley, and J. Boshart. Information scent as a driver of web behavior graphs:Results of a protocol analysis method for web usability. In Proceedings of the SIGCHIconference on Human factors in computing systems (CHI), pp. 498–505, 2001.
J. M. Carroll. Encyclopedia of Human-Computer Interaction, chap. Human ComputerInteraction (HCI). The Interaction Design Foundation, 2009.
K. Cherry. What is behaviorism? Available at http://psychology.about.com/od/
behavioralpsychology/f/behaviorism.htm, 2006. Retrieved July 27, 2012.
A. Edmonds. Uzilla: A new tool for web usability testing. Behavior Research Methods,Instruments, & Computers, 35(2):194–201, 2003.
4Excepting Grammatical Parsing, all prototypes were empirically tested with real users.

12 Bibliography of Chapter 1
M. Gellner, P. Forbrig, and M. Nelius. Results of mousemap-based usability evaluations– towards automating analyses of behavioral aspects. In Proceedings of the 8th ERCIMWorkshop UI4ALL: “User interfaces for all”, 2004.
J. Goecks and J. Shavlik. Learning users’ interests by unobtrusively observing their normalbehavior. In Proceedings of the 5th International Conference on Intelligent User Interfaces(IUI), pp. 129–132, 2000.
C. Grimes, D. Tang, and D. M. Russell. Query logs alone are not enough. In Workshop onQuery Log Analysis at the 18th International Conference on World Wide Web (WWW),2007.
U. Hansmann. Pervasive Computing: The Mobile World. Springer, 2nd edition, 2003.
N. Henze. Analysis of user studies at MobileHCI 2011. Available at http://nhenze.net/
?p=865, 2011. Retrieved October 2, 2011.
T. Hernandez. But what does it all mean? understanding eye-tracking results. Availableat http://eyetools.com/articles, 2007. Retrieved November 8, 2009.
H. M. Hersh. Electronic mail usage analysis. In Proceedings of the 1982 conference onHuman Factors in Computing Systems (CHI), pp. 278–280, 1982.
P. I. Hofgesang. Methodology for preprocessing and evaluating the time spent on webpages. In Proceedings of the 2006 IEEE/WIC/ACM International Conference on WebIntelligence (WI), pp. 218–225, 2006.
K. Hofmann, C. Reed, and H. Holz. Unobtrusive data collection for web-based socialnavigation. In Proceedings of the 4th International Conference on Adaptive Hypermediaand Adaptive Web-Based Systems, 2006.
F. Hwang, S. Keates, P. Langdon, and J. Clarkson. Mouse movements of motion-impaired users: A submovement analysis. In Proceedings of the 6th International ACMSIGACCESS Conference on Computers and Accessibility (ASSETS), pp. 102–109, 2004.
W. Ju and L. Leifer. The design of implicit interactions: Making interactive systems lessobnoxious. Design Issues, 24(3):72–84, 2008.
J. H. Kim, D. V. Gunn, E. Schuh, B. C. Phillips, R. J. Pagulayan, and D. Wixon.Tracking real-time user experience (TRUE): A comprehensive instrumentation solutionfor complex systems. In Proceedings of the 26th annual SIGCHI Conference on HumanFactors in Computing Systems (CHI), pp. 443–452, 2008.
D. Kitayama, T. Teratani, and K. Sumiya. Digital map restructuring method based on im-plicit intentions extracted from users’ operations. In Proceedings of the 2nd InternationalConference on Ubiquitous Information Management and Communication (ICUIMC), pp.45–53, 2008.
A. Oulasvirta and A. Salovaara. A cognitive meta-analysis of design approaches tointerruptions in intelligent environments. In Proceedings of Extended Abstracts on Humanfactors in computing systems (CHI EA), pp. 1155–1158, 2004.
A. Schmidt. Implicit human-computer interaction through context. Personal and UbiquitousComputing, 4(2):191–199, 2000.
K. Sinclair. Creating interactions in building automation. Available at http://www.
automatedbuildings.com/news/aug11/columns/110725014808emc.html, 2011. RetrievedOctober 2, 2011.

Bibliography of Chapter 1 13
A.-H. Tan and C. Teo. Learning user profiles for personalized information dissemination.In Proceedings of the International Joint Conference on Neural Networks (IJCNN), pp.183–188, 1998.
D. Tennenhouse. Proactive computing. Communications of the ACM, 43(5):43–50, 2000.
R. Vertegaal. Attentive user interfaces. Communications of the ACM, 46(3):31–33, 2003.Editorial note.
M. Weiser. Some computer science issues in ubiquitous computing. Communications of theACM, 36(7):74–84, 1993.
M. Weiser. The computer for the 21st century. Mobile Computing and CommunicationsReview, 3(3):3–11, 1999.
M. Weiser and J. S. Brown. The coming age of calm technology, 1996.
A. Wilson and N. Oliver. Multimodal sensing for explicit and implicit interaction. In Pro-ceedings of the 11th International Conference on Human-Computer Interaction (HCII),2005.
E. Yoneki. Sentient future competition: Ambient intelligence by collaborative eye tracking.In Proceedings of the European Workshop on Wireless Sensor Networks (EWSN), 2006.
P. Zigoris and Y. Zhang. Bayesian adaptive user profiling with explicit & implicit feedback.In Proceedings of the 15th ACM International Conference on Information and KnowledgeManagement (CIKM), pp. 397–404, 2006.


Chapter 2
Interactive Usability Evaluation
Besides conventional features such as performance and robustness, usabilityis now recognized as an important quality attribute in software development.Traditionally, usability is investigated in controlled laboratory conditions, byrecruiting a (hopefully representative) user sample and often performing videorecordings and surveys that are later reviewed. This requires an importantinvestment in time and money, not to mention that processing user interactiondata is, at a minimum, cumbersome.
This chapter discusses the role of implicit interactions when performing us-ability tests on websites; concretely, a) which kind of data can be gatheredby observing the overt behavior of users, without relying on explicit feedback,b) how this data can be presented to the usability evaluator, and c) whichquestions can be answered by inspecting such data.
Chapter Outline2.1 Introduction 16
2.2 Related Work 17
2.3 Simple Mouse Tracking 19
2.4 Applications 24
2.5 A Case Study 26
2.6 Conclusions and Future Work 29
Bibliography of Chapter 2 30
15
16 Chapter 2. Interactive Usability Evaluation
2.1 Introduction
Determining how UIs are operated has aroused historically a lot of interest inmany research fields such as product design and software engineering. For in-stance, detecting areas of interest or misused layout spaces, time to complete atask, etc. In a typical usability evaluation study, it is important for practition-ers to record what was observed, in addition to why such behavior occurred,and modify the application according to the results, if needed. Observingthe overt behavior of users provides useful information to investigate usabilityproblems. Based on live observations, or analyses of video tapes, an evaluatorconstructs a problem list from the difficulties the users have accomplishing thetasks [Jacobsen et al., 1998]. However, video data is time-consuming to processby human beings [Daniel and Chen, 2003]. Analyzing video has traditionallyinvolved a human-intensive procedure of recruiting users and observing theiractivity in a controlled lab environment. Such an approach is known to becostly (e.g., equipment, personnel, etc.) and rapid prototyping sometimes re-quires just preliminary studies. What is more, software applications usuallyhave a life cycle extending well beyond the first release. Problems like thesehave led to consider alternate approaches. Concretely, in the field of web ap-plications, remote activity tracking systems are today one of the main sourcesto evaluate the UI and analyze user behavior.
Processing user interaction data is thus, at a minimum, cumbersome. Fortu-nately, today there is a vast array of tools that can facilitate this task to theresearcher. For instance, state-of-the-art usability systems employ client-sidelogging software, which include mouse and keyboard tracking, since these inputdevices are ubiquitous; therefore neither specific hardware nor special settingsare required to collect interaction data remotely. The rationale that justifiesthese remote logging methods lies on the fact that there is a strong correlationto how likely a user will look at web pages [Chen et al., 2001; Huang et al.,2012; Mueller and Lockerd, 2001], and hence a mouse can tell us the user’sintent and interests most of the time.
Modern cursor tracking systems usually support replaying the user interac-tions in the form of mouse tracks, a video-like visualization scheme, to allowresearchers to easily inspect what is going on behind such interactions; e.g.,How many of the users did actually click on the “Buy” button? In which orderdid the user fill in the form fields? Do users ever scroll the web page? If so, howfar exactly? Nonetheless, traditional online video inspection has not benefitedfrom the full capabilities of hypermedia and interactive techniques. We believethat mixing both channels is likely to better assist the usability practitioner.Therefore, our proposal is enhancing hypervideo technology to build a usefulinspection tool for web tracking. Section 2.3 describes extensively the proposedsystem.

2.2. Related Work 17
2.1.1 Lowering Usability Costs
Assessing the allocation of visual attention with conventional methods likeclick analysis, questionnaires, or simply by asking subjects where they havepaid attention to, are limited to those processes which are part of consciousreflection and alive control. Relying exclusively on such methods will lead to amajor validity problem, because attentional processes do not solely depend onuser awareness. They are often driven beyond such awareness, and thereforeare not reportable [Schiessl et al., 2003].
The eye movement is available as an indication of the user’s goal before shecould actuate any other input device [Jacob and Karn, 2003]. Unfortunately,an eye tracker is a very expensive hardware that requires exceptional calibra-tion and needs to be operated in a laboratory with a small user sample, beingnot accessible to everyone [Nielsen, 2004]. Also, it has been shown that ob-servers do not necessarily attend to what they are looking at and they do notnecessarily look at what they are attending to [Toet, 2006]. On the contrary,measuring cursor activity is cheaper and quite affordable, since it does not re-quire additional hardware, and enables remote data collecting. Moreover, inmodern UIs, pointing devices such as pens, mice, trackpoints and touchpads,are ubiquitous [Ruiz et al., 2008]. Where there is a web browser, there is amouse cursor [Chen et al., 2001].
Cursor tracking offers a series of interesting advantages when compared totraditional usability tools. According to Arroyo et al. [2006]: 1) It can be massdeployed, allowing for large datasets. 2) It is able to reach typical users andfirst time visitors in their natural environment. 3) It can continuously test livesites, offering insight information as new content is deployed. 4) And mostimportantly, it is transparent to the users, so no experimenter bias or noveltyeffects are introduced, allowing users to navigate as they would normally do.One can argue that mouse movements are noisy, but also eye movements—actually even when looking at a point. Furthermore, the eye has higher errorrate than the mouse, i.e., the coordinates reported by an eye tracker are oftenless accurate than those reported by most manual input devices. Finally, aneye tacker is an always-on device (which leads to the Midas Touch problem1),so distinguishing between intentional selection and simple inspection is morechallenging with eye-gaze based devices.
2.2 Related Work
Automatic recording of user behavior within a system (also known as instru-mentation) to develop and test theories has a rich history in psychology andUI design. One methodology that has recently begun to show promise withinthe HCI field is automated tracking or event logging to better understand user
1Eyes are never “off”, so every gaze has the potential to activate an unintended command.

18 Chapter 2. Interactive Usability Evaluation
behavior. While users are interacting with an application, the system logs allUI events in the background. This event logging strategy enables the usabilitypractitioner to automatically record specific behaviors and compute traditionalusability metrics of interest (e.g., time to completion, UI errors, and so on) moreaccurately. Without these tools, these measurements would require researchersto meticulously hand-code behaviors of interest [Kim et al., 2008].
Mueller and Lockerd [2001] set a precedent in client-side tracking, presentingpreliminary research on mouse behavior trends and user modeling. Arroyoet al. [2006] introduced the concept of collaborative filtering (that is, workingwith aggregated users’ data), and the idea of using a web-based proxy to trackexternal websites. Finally, Atterer et al. [2006] developed an advanced HTTPproxy that tracked the user’s every move, being able to map mouse coordinatesto DOM elements. Beyond the usefulness of these systems, only Atterer et al.[2006] could track complex Ajax websites, and visualization was solely theprimary focus of Arroyo et al. [2006], although it was limited to an imageoverlaid on top the HTML pages. We argue that incorporating time-relatedinformation may enhance human interaction understanding, to replay exactlyhow users interact on a website. For instance, hesitations on a text paragraphmay indicate interest about that content; or moving the mouse straight toa link of interest would show familiarity with the page. To this end, thisis where video capabilities come into play, which, to some extent, have beenlately implemented in industry systems.
Amongst the popular commercial systems at present, ClickTale2, UserFly3, andLuckyOrange4 are deeply oriented to web analytics, with limited support for(non-interactive) visualizations. On the other hand, Mpathy5 and Clixpy6 aremore visualization centered, but they use Flash sockets to transmit data, andso they only would work for users having the Flash plugin installed. Therefore,depending on the target audience of the website, it could lead to missing ahuge fraction of the visitors that could provide valuable insights about theirbrowsing experience. Finally, other approaches for visualizing user’s activityare DOM based (Tag tracker7), or heatmap based (CrazyEgg8).
Basically, commercial systems work as “hosted solutions”, i.e., a software-as-a-service delivery model. These systems require the webmaster to insert atracking script in the pages to be targeted. Then such a tracking script trans-mits the data back to the commercial server(s). Eventually, registered userscan review the tracking logs at an administration area or “admin site” providedby the commercial system.
2http://clicktale.com3http://userfly.com4http://luckyorange.com5http://m-pathy.com6http://clixpy.com7http://otterplus.com/mps8http://crazyegg.com

2.3. Simple Mouse Tracking 19
2.3 Simple Mouse Tracking
Having looked at the literature, there are still some niches that are not fullycovered by current tools. Mainly, there is no possibility to visualize the behaviorof simultaneous users at the same time, and no system does report metricsrelated to user-centered data. These facts motivated the development of a newtool which, besides incorporating most of the state-of-the-art features, differssignificantly from previous work, as stated in the next section. Now we shalldescribe smt2 [Leiva and Vivo, 2012], our previous work, and how it differsfrom current systems. Then, we introduce a new version, smt2ǫ, and show howit differs specifically from smt2. Our tool is released as open source software,and can be downloaded and inspected at http://smt2.googlecode.com.
2.3.1 Overview of smt2
First of all, an important feature of our previous work regarding to state-of-the-art web tracking systems is the ability of compositing multiple interactionlogs into a single hypervideo. This feature has been proved to be useful inassessing qualitatively the usability of websites, and also to discover commonusage patterns by simply inspecting the visualizations (see Section 2.4).
Secondly, another important feature of smt2 is the generation of user and pagemodels based on the automatic analysis of collected logs. In this regard, wedid not find any related tracking system that would perform implicit featureextraction from users’ interaction data; i.e., interaction metrics inherently en-coded in cursor trajectories. We believe that this is a promising line of research,and currently is gaining attention from other authors; e.g., Guo and Agichtein[2010]; Huang et al. [2011].
Thirdly, the recording approach used in smt2 is different regarding the onesdescribed in current industry systems. Concretely, we perform a discretizationin time of user interactions, following a simple event logging strategy togetherwith the polling technique; i.e., taking a snapshot of the cursor status (mainlycoordinates, clicks, and interacted elements) at a regular interval rate. Thisway, smt2 tracks the user actions as they were exactly performed, allowingalso to modify the speed at which movies can be replayed.
2.3.2 Introducing smt2ǫ
Regarding tracking capabilities, smt2ǫ behaves almost identically as its pre-decessor, with the notable exception that smt2ǫ features LZW compression totransmit the logged data, saving thus bandwidth. The actual improvementsmade to smt2 that eventually derived in smt2ǫ are focused on the server side.
To begin, our current effort goes toward interactive hypervideo synthesis fromuser browsing behavior. However, unlike conventional hypervideo, smt2ǫ is

20 Chapter 2. Interactive Usability Evaluation
aimed to build full interactive movies from remotely logged data. Furthermore,current hypervideo technology itself is limited to clickable anchors [Smith andStotts, 2002]. smt2 augmented this technology with interactive infographics,i.e., a series of information layers that are rendered at runtime and provide theviewer with additional information. For instance, hovering over a click markdisplays a tooltip showing the cursor coordinates, or hovering over a hesitationmark displays the amount of time the cursor was motionless.
smt2ǫ extends this hypervideo technology with: 1. hyperfragments: videoscan be linked to specific start/end parts, and 2. hypernotes: HTML-basedannotations that point to specific video parts. These novel improvements areconvenient in a tracking visualization scenario for a series of reasons. First,hyperfragments allow the viewer to select a portion of the video that may beof particular interest. Hyperfragments can be specified either with a startingor an ending timecode. This lets viewers quickly access desired informationwithout having to watch the entire replay. Second, hypernotes allow the viewerto comment on the video at a specific point in time; e.g., to point out somevideo details or to let co-workers know that such video has been reviewed.When a hypernote is created, the viewer can click later on a note icon onthe timeline that will seek the replay to the time indicated by the hypernote(Figure 2.3a). This provides viewers with indexing capabilities that can beextended to content searching. Fourth, the content of hypernotes is HTML,which enables rich-formatted text and insertion of links and images. Thiscapability opens a new door to how visualizations can be later processed; e.g.,it would be feasible to build narratives that summarize a user session.
In addition, smt2ǫ features two installation modes: as an all-in-one solution(when website and admin site are both placed in the same server) and as ahosted service (website and admin site are both placed in different servers).smt2 was limited in this regard, since to allow cross-domain communication,every website would require at least PHP support to forward the requeststo the storage server (i.e., the admin site). With smt2ǫ, however, the onlyrequirement for a website to be tracked is inserting a single line of JavaScriptcode, as other commercial systems do, so potentially any website can use it.
Finally, smt2ǫ features page classification according to user behavior in realtime, by automatically mining the generated user and page models. The inclu-sion of this functionality was motivated by the fact that the viewer may findit useful to discover common interaction profiles as well as to easily identifyoutliers [Leiva, 2011] as new users access the website.
2.3.3 Architecture
As described below, smt2ǫ is composed of three fundamental parts: record-ing, management, and visualization. On the server side, any web server (e.g.,Apache, LightHTTPd, or IIS) supporting PHP and MySQL is able to run both

2.3. Simple Mouse Tracking 21
the admin site and the visualization application. The technology used to cre-ate such an interactive movies is a mixture of PHP (to query the database),HTML (to overlay the tracking data on top of it), JavaScript (to prepare theaforementioned tracking data), and ActionScript (to build the hypervideos).
Figure 2.1: System architecture for acquiring users’ activity and synthesizing interactivehypervideos.
2.3.4 Logging Users’ Interactions
Every lower-level action can be recognized automatically, since the trackingscript relies on the DOM event propagation model. We use the UNIPEN for-mat [Guyon et al., 1994]—a popular scheme for handwriting data exchange andrecognizer benchmarks—to store the mouse coordinates. This way, it is possi-ble to re-compose the user activity in a reasonable fashion and to extract usefulinteraction semantics. While the user is browsing pages as she would normallydo, an Ajax script logs the interaction data in the background. Tracking isperformed in a transparent way for the users, either silently or by asking theirconsent.
It is worth pointing out that our strategy for transmitting the logged data donot rely on performing a server request each time a browser event is detected, asmost tracking systems do. Instead, we store the data in a buffer, and we flush itat time-regular intervals. Doing so allows to reduce dramatically the number ofHTTP requests to the web server, and hence lowering the overhead. Moreover,tracking can be continuous (default behavior) or intermittent (i.e., trackingstops/resumes on blur/focus events), letting the webmaster decide which oper-ation mode is best suited to their needs. For instance, if an eye tracker is goingto be used together with our system, then it is preferable to use continuousrecording, in order to keep mouse and eye coordinate streams synchronized.

22 Chapter 2. Interactive Usability Evaluation
<script type="text/javascript">
smt2.record (
fps: 24,
recTime: 3600,
disabled: Math.round(Math.random ()),
warn: true
);
</script >
Figure 2.2: A working example ofinserted tracking code. Here we setthe registration frequency to 24 fpsand establish a maximum recordingtimeout of 1 hour. We also setrandom sampling for user selection,and ask consent to the chosen usersfor monitoring their browsing activity(they must agree to start recording).
On the contrary, if the system is used on its own then the webmaster may wantto save storage space in the database by enabling intermittent recording.
Another interesting logging feature is that the system can be invoked manually,if one have administrative rights to modify files in the web server, but it alsocan fetch external websites by using a PHP proxy that automatically inserts therequired tracking code (Figure 2.2). We also take into account the user agentstring to cache an exact copy of the page as it was originally requested, toavoid rendering differences due to different CSS being applied (e.g., on mobiledevices compared to desktop computers). Additionally, it is possible to storeinteraction data from different domains in a single database, provided that eachdomain and the database are under the webmaster control.
2.3.5 Video Synthesis
The process to create an interactive hypervideo is composed of four main tasks:1) mining, 2) encoding, 3) rendering, and 4) event dispatching. First, we querythe database with the information that the viewer provides. Creating this kindof movies by using web technologies allows adding interactive information toon-screen visualizations, ranging from basic to more advanced playbacks. Forexample, she might request to visualize a single browsing session. The systemwill then retrieve the subsequent logs to make a video that will replay all trackssequentially. On the contrary, though, the viewer might want to filter logs byoperating system and page URL, in which case she uses a data mining form. Inthis case, data are retrieved according to the indicated filtering options, and logswill be merged into a single hypervideo when replaying (Figure 2.3). Differentmouse trajectories will be normalized according to the original viewport ofthe user’s browser and the current viewport of the viewer’s browser. Thenormalization consists of a non-uniform affine mapping (either by scaling ortranslating the coordinates, depending on the type of layout: namely fixed,centered, or liquid). Then, a cached copy of the browsed page and the above-mentioned interaction data are bundled in a hypermedia player. This way,movies can be replayed within any web browser.

2.3. Simple Mouse Tracking 23
(a) (b)
(c) (d)
Figure 2.3: Some examples of our hypervideo visualization tool. [2.3a] single session withembedded media player. [2.3b] Replaying users’ trails simultaneously, highlighting theaverage mouse track, and overlaying direction arrows. [2.3c] clusters of mouse movements,displaying also masked areas of activity. [2.3d] Dynamic heatmaps of mouse coordinatesand clicks.
2.3.6 Interacting with the Data
On the server side, a multi-user admin site manages and delivers the hyper-videos, allowing the viewer to customize a series of visualization options (Fig-ure 2.3). The viewer can toggle different information layers interactively whileshe visualizes the videos by means of a control panel (Figure 2.4).
Automatic analysis of interaction features is also feasible for mining patternswithin the admin site, since collected data are readily available in the database.This way, besides explicit metadata that is assigned to content, implicit knowl-edge can help to get a better picture on the nature of such content (see Sec-tion 2.5). Concretely, the metrics that smt2ǫ computes for a given web pageare described as follows.
Time Browsing time (in seconds) spent on the page.
Clicks Number of issued mouse clicks.

24 Chapter 2. Interactive Usability Evaluation
Figure 2.4: A draggable controlpanel is the main link betweenthe viewer and the synthesized hy-pervideos. One can manipulatedifferent visualization possibilities,which will be applied at runtime.
Activity Fraction of browsing time in which the cursor was moving, definedin [0, 1]. (0: no movements at all, 1: otherwise).
Length Cumulated sum (in px) of cursor distances.
Distance Average euclidean distance (in px) between coordinates.
Entry/exit points The first and last mouse coordinates, respectively.
Centroid Geometric center of all coordinates.
Amplitude Difference (in px) between maximum and minimum coordinates.
Scroll reach Percentage that informs how far did the user scrolled the page,defined in [0, 1]. (0: no scroll at all, 1: scroll reached the bottom of thepage).
2.4 Applications
The following is a succinct list for illustrating the pragmatic utility of oursystem. We hope that the reader will be able to find other questions answeredby examining other visualization marks.
• Where do users hesitate? How much? We followed the notion ofdwell time introduced by Muller-Tomfelde [2007], i.e., the time span thatpeople remain nearly motionless during pointing at objects. Dwell timesare usually associated with ambiguous states of mind [Arroyo et al., 2006],possibly due to a thinking or cognitive learning process. In smt2ǫ dwelltimes are displayed as circles with a radius proportional to the time in whichthe mouse does not move (Figure 2.5a). The system takes care of extremelylarge values of dwell times, by limiting the circle radii to a quarter of theviewport size.
• Do users perform drag&drop operations? How? Users perform dragand drop to select HTML content, or also to download an image to theirdesktop or to a file manager window. At a higher level, a web application

2.4. Applications 25
(a) (b) (c)
Figure 2.5: Combining visualization possibilities. [2.5a] Displaying hesitations (circles)and clicks (small crosses). [2.5b] Displaying entry/Exit coordinates (cursor bitmaps),motion centroids (big crosses), drag&drop activity (shaded fog), and interacted DOMelements. [2.5c] Analyzing a decision process; the user rearranged items in a list. Smallcircles represent dwell times. Hovered DOM elements are labeled based on frequency(percentage of browsing time), including a blue color gradient (100% blue: most hovereditems). The same scheme is used to analyze clicked items, but using the red palette.
can support rearranging widgets to customize their layout, or also by addingobjects to a list to be processed. Since we are using the UNIPEN format toencode each pair of mouse coordinates, the status of the click button can beeasily represented, so smt2ǫ provides a specific visualization type for thesecases (e.g., Figure 2.5b).
• Which elements is the user actually interacting with? Thanks to thebubbling phase of JavaScript events, whenever a mouse event is dispatched(e.g., mousemove, mouseover) the tracking script traverses the DOM hierar-chy to find if there is an element that relates to the event. Each trackinglog holds a list of interacted DOM elements, sorted by time frequency (Fig-ure 2.5c), so such list can be inspected either quantitatively (by looking atthe numbers) or qualitatively (by looking at the colors). This visualizationcan be helpful to answer related questions, such as if the users go straight tothe content or whether the mouse hovered over a link without clicking.
• Which areas of the page do concentrate most of the interaction? Toanswer this question, a K-means clustering of the coordinates is performedeach time a mouse track ends replaying. So, focusing on the clustered areasallows to visually notice where users are performing most of their actions.Each cluster is represented by a circle with a radius proportional to the clus-ter population (Figure 2.3c). This visualization layer is notably appropriatewhen tracking data are rendered as a static image.
• Do different mouse tracks correlate? The viewer can select the ‘timecharts’ option from the control panel (Figure 2.4) and compare multipletracks simultaneously (see Figure 2.6). The coordinates are normalized in

26 Chapter 2. Interactive Usability Evaluation
(a) Normalized coordinates against time (b) Interactive 3D visualization
Figure 2.6: Time charts visualization. Bold line is the averaged mouse track, taking intoaccount the selected users. The 3D view allows rotating the axes with 3 sliders (one foreach direction), zooming, and projecting the lines in the YZ, XZ, and XY planes.
width and height according to the available chart size, to avoid possible visualbiases.
• What is the persistence of the page? In this case, a 3D visualizationmight be useful (Figure 2.6b). The 3D chart renders the evolution of each pairof cursor coordinates x, y along the z axis, and provides simple interactivecontrols to ease further inspection. This way, for a given page, the viewercan observe at a glance the duration of each visit and how do they relate tothe rest of them.
2.5 A Case Study
Here we provide empirical evidence for the efficacy of smt2ǫ as a usabilityinspection tool. To test the system in a real-world scenario, the system waspresented to a team of five graphic designers that were not usability experts.They wanted to redesign a corporative website, and they all used the tool forone month. One of them assumed the super administrator role, and the restof them were assigned to the admin group. Thus, everyone could access to alladmin sections without several restrictions; e.g., the difference between a userin the admin group and the super administrator is that admin users neithercan download nor delete tracking logs, create user roles, or dump the databasefrom the admin site.
2.5.1 Qualitative Results
Designers ran an informal usability test on their own. They configured smt2ǫas indicated in Figure 2.2, and gathered a representative user sample (near5000 logs) in two weeks. Potential problems could be identified when visu-ally inspecting the hypervideos, either for single users or by aggregating thelogs from commonly browsed pages. Designers noticed that some areas of thehome layout were causing confusion to most users; e.g., people hesitated overthe main menu until deciding to click a navigational item. Designers could

2.5. A Case Study 27
also view that much of the interaction with the site was concentrated aroundthe header section. Consequently, the team introduced some modifications tothe web interface and gathered near 1000 logs in five days. This way, theycould compare the generated interactions to previous data. Such updates hadnotable repercussions specially for first-time visitors (faster trajectories, lessclicks overall). Figure 2.7 shows the appearance of the website before and aftermanually introducing the design updates. The reader can find more details ofthis study in [Leiva and Vivo, 2008].
(a) (b)
Figure 2.7: Website as it was designed initially (2.7a) and the redesigned layout (2.7b).
Overall, designers found the system very helpful. The main advantages sug-gested were being able to reproduce exactly what users did in a web page,and the speed with which a redesign could be verified. Concretely, the vi-sualization layers (Figure 2.4) that the team found most useful were: mousepath, dwell times, clicks, direction & distances, and active areas. Designersalso reported that there were two layers they found not relevant: path centroidand drag&drop/selections, mainly because 1) the centroid was perceived as animprecise indicator of the user interaction (i.e., designers stated that it washard to derive meaningful conclusions by looking just at a single point on thescreen) and 2) only a few users performed drag&drop operations in the website.Designers liked the option of being able to switch to a static representation,specially when working with a large number of aggregated tracking logs.
2.5.2 Quantitative Results
Additionally, we asked permission to the team to download their gatheredtracking logs for an offline study. They provided us with 4803 XML files. Weprocessed them to build regression models of user activity and to create inter-action profiles. We were able to predict with 71% of accuracy the expectedtime on a page based on the amount of mouse motion. Among other inter-esting findings, we noticed that the temporal evolution of mouse movements

28 Chapter 2. Interactive Usability Evaluation
follows a log-linear curve. This showed up that, instead of the idiosyncratic dis-tinction between active (exploratory) and passive (lurker) users, there exists awide continuum of in-between behaviors. More details of the above mentionedexperiment can be found in [Leiva and Vivo, 2008].
Additionally, we used cursor data for a behavioral clustering experiment, whichis detailed in Chapter 3. Eventually, 95% over all browsed pages could beexplained by looking at 3 meaningful profiles. Designers could then review thepages belonging to each profile, focusing on the identified behaviors, and couldcontinue iterating over the design-develop-test process. Similar experiments onthis behavioral clustering methodology can be found in [Buscher et al., 2012;Leiva, 2011].
2.5.3 Limitations
Web-based activity tracking systems have inherent limitations, and of coursesmt2ǫ is no exception to this rule. Although measuring page-level interactionsis cheaper and enables remote data collecting at large, the main drawbackwe have found is that assessing the allocation of visual attention based oninteraction data alone is a non-trivial task. For instance, while it is commonlyagreed that “a mouse cursor can tell us more” [Chen et al., 2001], Huang et al.[2011, 2012] have demonstrated that browsing time and user behavior havenotable repercussions on gaze and mouse cursor alignment. Also, it has beenshown that users do not necessarily attend to what they are looking at, and theydo not necessarily look at what they are attending to [Toet, 2006]. Therefore,the usability practitioner should be aware of these facts before considering usinga web tracking system, depending on the task that would be assessed or thecontext of their study.
On the other hand, our tool was designed to handle a limited number of simul-taneous user sessions in the same hypervideo. One may note that if the systemwere used to show data from, say, 10000 concurrent users, then we believe thevideo visualization would not be much meaningful. Suffice to say it could bedone, but at the cost of increasing the cognitive overload for the viewer (sincevisually inspecting too many users at the same time can be stressful), and onlylimited by the processing power of his computer. In this situation, aggregateddata would work much better if rendered as a single image—discarding thus thetemporal information but retaining interactivity for the viewer. This way, itis still possible to visually infer time-based properties such as mouse velocities(for instance, by looking at the ‘directions & distances’ layer, Figure 2.4).
Additionally, besides the fact that our tool normalizes the mouse coordinatesto avoid possible visual biases while replaying the hypervideos, we noticed thatsometimes the visualization is not perfectly accurate, partly due to JavaScriptrounding errors, partly due to discrepancies between how browsers renderCSS. These browser discrepancies can be greatly minimized by using a reset

2.6. Conclusions and Future Work 29
stylesheet on the web page. On the contrary, higher discrepancies are expectedwhen the user access from a mobile device and the viewer uses a desktop com-puter. We are currently investigating different methods that would tackle thisproblem, which is common to all web-based tracking systems, and for whichthere is no trivial solution. For instance, the system could use the mobile useragent to fetch the page that the user visited, but it could happen that thepage had changed since that visit, or even that it no longer exists. The sameargument applies to the stylesheets of that page. Therefore, a more techni-cally advanced approach should be taken into consideration, such as cachingall assets for each user visits, at the cost of increasing the storage space.
2.6 Conclusions and Future Work
To better understand user behavior on the Web, modern tracking systemsshould rely on the browsing capabilities of the users, instead of the traditionalserver access logs. However, this approach has a clear trade-off, as moving tothe client side involves having to process much more data. We believe thatoffering such data processed as a hypervideo can be considered as a promisingidea and a specially helpful approach for assessing the usability of websites.
This article has described the design and implementation of smt2ǫ, a web-based system for automatically gathering, mining, selecting, and visualizingbrowsing data in an interactive hypermedia presentation, either as a video oras a static visualization. The tracking system collects fine-grained informationabout user behavior, and allows viewers to control what they watch, when, andhow, by selecting diverse types of infographics.
We have reported the main differences between our tool and previous web track-ing systems, including the state of the art and highlighting our contributionsto the field. We have shown the value of enhancing video visualizations withinteractive techniques to present the viewer with complex information quicklyand clearly. We have also described a real-world usage scenario proving thatour system is a feasible and realistic implementation.
Tracking page-level browsing activity with smt2ǫ requires no real effort fromthe user, other than standard usage. It also requires no training and providescontext for actions. Armed with this awareness, one may conduct both qualita-tive and quantitative studies, being able to complement existing methodologieson web browsing and human behavior. Therefore, we believe that smt2ǫ isready to extend its scope to a broader, interdisciplinary audience.
One of our priorities for future work is working on scalability and performancelimits especially concerning high-recording speeds. We also plan to enrich thesystem with other types of behavior analysis, for instance working with eye-tracking data, as hinted in the previous section, since user interaction is inher-ently multimodal.

30 Bibliography of Chapter 2
2.6.1 Some Notes on Privacy
Monitoring the user interactions at a fine-grained level can be very useful tohelp shaping a more usable website, or making it more appropriate to thebehavior of their users. However, as in other web tracking applications, thiswork raises privacy concerns. We are interested in understanding web browsingbehavior, but we also want the user to be respected, so we designed the smt2ǫsystem with that notion in mind.
First, we believe logging keystrokes could be employed for unfair purposes, de-pending on the uses that one could derive from this tool. For that reason, werejected to log raw keystroke data and track only keyboard events instead, with-out registering the associated character codes. Second, we believe users shouldnot be monitored without their consent. This is a webmaster’s responsibility,but not doing so could be considered unethical in some countries. Therefore werecommend to ask always the user before tracking takes place. Furthermore,once a user has agreed to track, we advocate for asking her consent again aftera prudential amount of time (e.g., a few hours, until the end of the browsingsession, or when a tracking campaign finalizes). Third, we believe logged datashould be stored in a server the webmaster owns, and not in one she cannotcontrol. At least, it should be possible to let users access their (raw) data. Weencourage commercial tracking systems to do so, since chances are there andcurrent web technologies can support it. Finally, unlike most analytics pack-ages that track other sites users have visited or the searches they have made,we do not collect other information than basic browser events derived fromnormal usage at the site where smt2ǫ is included. This way, we try to avoidan illegitimate abuse of our system (e.g., without advising at all that users arebeing tracked or hijacking submitted form data). Above all, the ethical use ofcomputers should be above any functionality or feature.
Bibliography of Chapter 2
E. Arroyo, T. Selker, and W. Wei. Usability tool for analysis of web designs using mousetracks. In Proceedings of Extended Abstracts on Human Factors in Computing Systems(CHI EA), pp. 484–489, 2006.
R. Atterer, M. Wnuk, and A. Schmidt. Knowing the user’s every move – user activitytracking for website usability evaluation and implicit interaction. In Proceedings of the15th International Conference on World Wide Web (WWW), pp. 203–212, 2006.
G. Buscher, R. W. White, S. Dumais, and J. Huang. Large-scale analysis of individualand task differences in search result page examination strategies. In Proceedings of the fifthACM international conference on Web search and data mining (WSDM), pp. 373–382,2012.
M.-C. Chen, J. R. Anderson, and M.-H. Sohn. What can a mouse cursor tell us more? cor-relation of eye/mouse movements on web browsing. In Proceedings of Extended Abstractson Human Factors in Computing Systems (CHI EA), pp. 281–282, 2001.

Bibliography of Chapter 2 31
G. Daniel and M. Chen. Video visualization. In Proceedings of the 14th IEEE Visualization(VIS), pp. 409–416, 2003.
Q. Guo and E. Agichtein. Ready to buy or just browsing? detecting web searcher goalsfrom interaction data. In Proceedings of SIGIR, pp. 130–137, 2010.
I. Guyon, L. Schomaker, R. Plamondon, M. Liberman, and S. Janet. UNIPEN projectof on-line data exchange and recognizer benchmarks. In Proceedings of the InternationalConference on Pattern Recognition (ICPR), pp. 29–33, 1994.
J. Huang, R. W. White, and S. Dumais. No clicks, no problem: Using cursor movementsto understand and improve search. In Proceedings of the SIGCHI conference on Humanfactors in computing systems (CHI), pp. 1225–1234, 2011.
J. Huang, R. W. White, and G. Buscher. User see, user point: Gaze and cursor alignmentin web search. In Proceedings of the annual Conference on Human Factors in ComputingSystems (CHI), pp. 1341–1350, 2012.
R. J. Jacob and K. S. Karn. Eye Tracking in Human-Computer Interaction and UsabilityResearch: Ready to Deliver the Promises, chap. Section Comentary, pp. 573–605. ElsevierScience, 2003.
N. E. Jacobsen, M. Hertzum, and B. E. John. The evaluator effect in usability tests. InCHI 98 conference summary on Human factors in computing systems, pp. 255–256, 1998.
J. H. Kim, D. V. Gunn, E. Schuh, B. C. Phillips, R. J. Pagulayan, and D. Wixon.Tracking real-time user experience (TRUE): A comprehensive instrumentation solutionfor complex systems. In Proceedings of the 26th annual SIGCHI Conference on HumanFactors in Computing Systems (CHI), pp. 443–452, 2008.
L. A. Leiva. Mining the browsing context: Discovering interaction profiles via behavioralclustering. In Adjunct Proceedings of the 19th conference on User Modeling, Adaptation,and Personalization (UMAP), pp. 31–33, 2011.
L. A. Leiva and R. Vivo. A gesture inference methodology for user evaluation based onmouse activity tracking. In Proceedings of Interfaces and Human-Computer Interaction(IHCI), pp. 58–67, 2008.
L. A. Leiva and R. Vivo. Interactive hypervideo visualization for browsing behavior anal-ysis. In Proceedings of the 21st international conference companion on World Wide Web(WWW), pp. 381–384, 2012.
F. Mueller and A. Lockerd. Cheese: Tracking mouse movement activity on websites,a tool for user modeling. In Proceedings of Extended Abstracts on Human Factors inComputing Systems (CHI EA), pp. 279–280, 2001.
C. Muller-Tomfelde. Dwell-based pointing in applications of human computer interaction.In Proceedings of the IFIP Conference on Human-Computer Interaction (INTERACT),pp. 560–573, 2007.
J. Nielsen. Capturing thoughts, capturing minds? from think aloud to participatory anal-ysis. Available at http://openarchive.cbs.dk/bitstream/handle/10398/6501/14-2004.pdf, 2004. Retrieved November 8, 2009.
J. Ruiz, D. Tausky, A. Bunt, E. Lank, and R. Mann. Analyzing the kinematics of bivariatepointing. In Proceedings of Graphics Interface (GI), pp. 251–258, 2008.
M. Schiessl, S. Duda, A. Tholke, and R. Fischer. Eye tracking and its application inusability and media research. MMI Interaktiv, 6(1):41–50, 2003.

32 Bibliography of Chapter 2
J. Smith and D. Stotts. An extensible object tracking architecture for hyperlinking in real-time and stored video streams. Tech. Report 02-017, Univ. North Caroline and ChapelHill, 2002.
A. Toet. Gaze directed displays as an enabling technology for attention aware systems.Computers in Human Behavior, 22(4):615–647, 2006.

Chapter 3
Behavioral Clustering
Behavioral clustering is a broad term that refers to the task of automaticallylabeling and classifying user behavior. In a general context, clustering allowsto identify sub-populations in a dataset, so that they can be represented bymore compact structures for, e.g., classification and retrieval purposes. To thisend, implicit interaction can provide current clustering methods with additionalinformation. For instance, on the Web, clustering is usually deployed by usinga single data source, which is often browsing usage information derived fromserver access logs. However, when it comes to getting deep information aboutuser behavior, this representation is inadequate in such a dynamic environment.
In this chapter, two opportunities are identified to enhance behavioral cluster-ing through implicit interaction research. First, fine-grained interactions canreveal valuable information that is not available in typical access logs; e.g.,cursor movements, hesitations before clicking, etc. Second, user behavior hasan intrinsic sequential nature, which is not considered on current clusteringanalysis, that can be exploited to simplify the structure of the data. There-fore, we propose two approaches for both opportunities: 1) a novel method-ology to model the website, i.e., finding interaction profiles according to howusers behave while browsing, and 2) a novel clustering algorithm to deal withsequentially-distributed data, whose suitability is illustrated in a human actionrecognition task.
Chapter Outline3.1 Introduction 34
3.2 Revisiting the K-means Algorithm 35
3.3 Evaluation 41
3.4 Conclusions and Future Work 53
Bibliography of Chapter 3 54
33

34 Chapter 3. Behavioral Clustering
3.1 Introduction
A pervasive problem in science is to construct meaningful classifications ofobserved phenomena. Clustering can be seen as a compression technique tosimplify the structure of the data, so that original objects can be representedby more compact structures that are better tailored for classification, storage,and retrieval purposes. The motivation to using these simplified structurescan be as elemental as reducing the number of data samples to save space inlarge databases, such as web access logs, to more complex applications, such asdetecting actions in hours of sensor data. The importance and interdisciplinarynature of clustering is evident through its vast literature; c.f. [Jain, 2010; Jainet al., 1999].
Two broad categories of clustering can be distinguished. In the first one, wehave data from known groups as well as observations from entities whose groupmembership is unknown initially and has to be determined through the analysisof the data. On the other hand, the groups are themselves unknown a prioriand the primary purpose of data analysis is to determine the groupings fromthe data, so that entities within the same group are in some sense more similarthan those that belong to different groups. The latter category is the one weare tackling in this chapter.
We explore two novel approaches to (unsupervised) behavioral clustering, witha special emphasis on web page classification and human action recognition.On the one hand, in the context of page classification, currently the task ofclustering web pages is approached in a similar way for both web documentsand plain text documents. Even if it is known that web pages contain richerand implicit information associated to them [Poblete and Baeza-Yates, 2008],like the interactions that users perform while browsing. Thus, when facinga finer-grained understanding of user behavior and document analysis, serveranalytics are anything but accurate, being necessary to move toward the clientside. As pointed out later, the first core contribution of this chapter is focusedon this task.
On the other hand, the task of detecting actions from user behavior is not aneasy one. Actions (or activities) are sequential by definition, and, while thereare many works that solve sequential supervised machine learning problems(e.g. [Dietterich, 2002]), the unsupervised case had remained posing new chal-lenges in the research community for years (e.g. [Trahanias and Skordalakis,1989]). The second core contribution of this chapter consists in solving thisproblem.
3.1.1 Background
Cluster analysis provides an unsupervised classification scheme to efficientlyorganize large datasets [Duda et al., 2001]. Additionally, cluster analysis can

3.2. Revisiting the K-means Algorithm 35
supply a means for assessing dimensionality [Agrawal et al., 1998] or identifyingoutliers [Leiva, 2011]. The fundamental data clustering problem may be definedas discovering “natural” groups, or clubbing similar objects together.
In this chapter, data clustering is seen as a data partitioning problem [Dubes,1993; MacQueen, 1967; Yu, 2005] as opposed to the hierarchical approach [Fra-ley, 1996; Murtagh, 1984; Ward, 1963], since we are interested in a partition ofthe data and not in a structure (dendrogram) thereof.
Partitional clustering divides a dataset X = x1, . . . ,xn of n d-dimensionalfeature vectors into a set
∏
= C1, . . . , Ck of k disjoint homogeneous classeswith 1 < k ≪ n. It is worth pointing out that the task of finding the optimumpartition is formidable even for a computer, since this is an NP-hard problem.For example, if k = 3, we need to look at 3n−1 combinations. One way totackle this problem is to define a criterion function that measures the qualityof the clustering partition and then find a partition
∏∗that extremizes such a
criterion function.
The most popular algorithm for partitional clustering in scientific and indus-trial applications is by far the K-means (or C-means) algorithm, which can beconsidered as a simplified case of Expectation-Maximization (EM) clustering,and is described in the next section.
3.2 Revisiting the K-means Algorithm
The K-means algorithm is known for its simplicity, relative robustness, andfast convergence to local minima. K-means, including its multiple variantssuch as Fuzzy C-Means [Dunn, 1973], K-Medoids [Kaufman and Rousseeuw,1990], etc., is based on the firm foundation of variance analysis. It requiresthe number of clusters k to be an input parameter, which is tightly coupled tothe nature of the involved task, though there are many studies for choosing kautomatically [Bezdek and Pal, 1998; Davies and Bouldin, 1979; Dunn, 1974;Hamerly and Elkan, 2001; Hubert and Arabie, 1985; Milligigan and Cooper,1985; Sugar, 1998; Tibshirani et al., 2001]. The rough but usual approach is totry clustering with several values of k and choose the one that contributes mostto the minimization criterion. Nonetheless, a simple rule of thumb is settingthe number of clusters to [Mardia et al., 1979]:
k ≈ (n/2)1/2 (3.1)
The criterion function that K-means tries to minimize is the Sum of QuadraticErrors (SQE), denoted simply as Energy or J in the literature, which empha-sizes the local structure of the data [Veenman et al., 2002]:

36 Chapter 3. Behavioral Clustering
J =
k∑
j=1
Hj (3.2)
whereHj =
∑
x∈Cj
‖ x− µj ‖2 (3.3)
represents the heterogeneity (or distortion) of cluster Cj , and
µj =1
nj
∑
x∈Cj
x (3.4)
is the cluster mean, with nj = |Cj | being the number of samples in such cluster.
The most common implementation of this algorithm, generally attributed toLloyd [1982], uses a minimum distance criterion, where in each iteration allsamples are assigned to their closest cluster mean and convergence is achievedwhen the assignments no longer change. There exists, however, a more inter-esting version, often attributed to Duda and Hart [1973], which uses a sample-by-sample iterative optimization refinement scheme. At each step, the SQEis evaluated and the considered sample is reallocated to a different cluster ifand only if that reassignment decreases J . Clearly, such a greedy optimizationguarantees that the resulting partition corresponds always to a local minimumof the SQE. This refined version is explained as follows.
The variation in the SQE produced when moving a sample x from cluster j tocluster l can be obtained in a single computational step as [Duda et al., 2001]:
∆J(x, j, l) =nl
nl + 1‖ x− µl ‖
2 −nj
nj − 1‖ x− µj ‖
2 (3.5)
If this increment is negative, the new means, µ′j , µ
′l and the SQE, J ′, can then
be incrementally computed as follows [Duda et al., 2001]:
µ′j = µj −
x− µj
nj − 1
µ′l = µl +
x− µl
nl + 1(3.6)
J ′ = J +∆J(x, j, l)
3.2.1 Sequential Clustering
When clustering sequential data there exists a strong constraint, often relatedto time, that can be exploited to a great advantage. Nonetheless, by ignoringthis constraint, classical clustering techniques fail to cope with the underlying

3.2. Revisiting the K-means Algorithm 37
sequential data structure, as illustrated in Figure 3.1. What is more, previousresearch on sequential data clustering considered the objects to cluster as wholedata sequences or previously determined subsequences thereof; c.f., Guralnikand Karypis [2001]; Lee et al. [2007]. Instead, we are interested in discoveringsubtrajectories within a single trajectory, so that we can obtain a simplified datastructure preserving the underlying data sequentiality. From this point of view,approaches based on Hidden Markov Models (HMMs) have been proposed;e.g., [Bashir et al., 2007]. The downside of HMMs, however, is that they requirecomplex training, and also can be prohibitive if processing power is a restriction,e.g., working on mobile devices. As such, we propose here a closed-form solutionhaving a low computational cost in terms of performance, which translatesto really fast convergence times, and provides consistent results in terms ofaccuracy: each run for a given number of classes always yields the same (well-formed) sequential clustering configuration.
(a) (b)
(c) (d)
(e) (f)
Figure 3.1: A 2D example. An arbitrary shape (3.1a) is digitized (3.1b) and reduced to5 elemental units. Classical clustering algorithms do not deal with temporal informationand, therefore, resulting units are ill-defined (3.1c), leading to an inconsistent configuration(3.1d). Our approach, however, provides a simple framework to easily cope with thesequentiality of the data (3.1e, 3.1f).
If the data in a dataset X are sequentially given, it can be said that such datadescribe a trace or trajectory in the d-dimensional vector space where samplesare represented:
X = x1, . . . ,xn (3.7)

38 Chapter 3. Behavioral Clustering
We define a sequential clustering into k classes as the mapping
b : 1, . . . , k 7→ 1, . . . , n
where bj is the (left) boundary of cluster j; i.e., the index of the first samplein that cluster. See Figure 3.2 for a graphical example.
Using this convenient notation, the j-th (sequential) cluster ofX can be writtenas follows:
Cj = xbj,xbj+1, . . . ,xbj+nj−1 (3.8)
where nj can now be trivially computed as
nj = bj+1 − bj (3.9)
This way, (3.3) and (3.4) can be rewritten as
Hj =
bj+1−1∑
i=bj
‖ xi − µj ‖2 (3.10)
µj =1
nj
bj+1−1∑
i=bj
xi (3.11)
and (3.5) and (3.6) can be directly used as such with this new formulation.
3.2.2 Warped K-Means
We propose a novel algorithm namedWarped K-Means (WKM), inspired by theidea that the original data structure is delusively distorted, or “unfolded” (seeFigure 3.2) to cope with the sequentiality restrictions. Our proposal is based onthe trace segmentation (TS) technique for partition initialization (Figure 3.3),followed by a K-means-like optimization procedure (Figure 3.4).
As in classical K-means, WKM reallocates samples based on the analysis ofeffects on the objective function J , caused by moving a sample from its currentcluster to a potentially better one. But now a hard sequentiality constraintis imposed. The first half of samples in cluster j are only allowed to move tocluster j−1, and, respectively, the last half of samples are only allowed to moveto cluster j + 1. A sample will be reallocated if and only if the correspondingSQE increment is beneficial (i.e., negative). This process is iterated until notransfers are performed.
Because of this constraint, along with the sequential ordering of samples withineach cluster, typically only the samples close to the cluster boundaries getreallocated. To take advantage of this observation, we introduce an optionalparameter δ ∈ [0, 1] which allows us to fine-tune the WKM behavior and at the

3.2. Revisiting the K-means Algorithm 39
same time achieve further reductions in computational cost. It allows testingonly those samples that are more or less close to cluster boundaries. In theextreme case of δ = 0 the algorithm is conservative: all samples in a clusterare visited to see if they should be reallocated. In the other extreme, if δ = 1WKM is optimistic: only the boundary and the last sample in each cluster willbe checked. In general, the effect of δ is illustrated in Figure 3.2.
C1 C2 C3 C5
δb1 b2 b3 b4 b5
C4
Figure 3.2: The basis of WKM. The algorithm provides an optional parameter δ whichspecifies the maximum amount of samples that will be inspected in each iteration. Thisway, if δ = 1 only two samples are considered per iteration, while if δ = 0 full search iscarried out.
In sum, three key features differentiate our approach from other K-means basedalgorithms: initialization, visiting order, and sequentiality constraints.
Algorithm: TS Boundary Initialization
Input: Trajectory X = x1, . . . ,xn; No. Clusters k ≥ 2Output: Boundaries b1, . . . , bk
L1 = 0for i = 2 to n do // Accumulated trace length
Li = Li−1 + ‖ xi − xi−1 ‖λ = Ln
k// Segment length
i = 1for j = 1 to k do
while λ (j − 1) > Li do // Interpolate
i++bj = i // Define boundaries
Figure 3.3: Boundaries initialization. Each boundary is evenly allocated according toa piecewise linear interpolation on accumulated distances, resulting in a non-linearly dis-tributed boundary allocation.
Algorithm Overview
In each cluster j, the samples close to its boundary bj are first visited tosee if they can be advantageously reallocated to the previous cluster, j − 1(“reallocate backwards” loop). Then, the samples close to the boundary ofthe next cluster, j + 1, are similarly considered (“reallocate forwards” loop).It is worth noting that with δ < 1 the proportion of samples processed ineach backward or forward sequential chunk is typically less than the numbercorresponding to the given value of δ. This is because the reallocation process

40 Chapter 3. Behavioral Clustering
Algorithm: WKM
Input: Trajectory X; No. Clusters k ≥ 2 [; Proportion δ = 0.0]Output: Boundaries b1, . . . , bk; Centroids µ1, . . . ,µk; Distortion J
Initialize boundaries b1, . . . , bk // Use TS (Figure 3.3)
for j = 1 to k do
Compute µj , nj , J // Use Eq. (3.2), (3.9), (3.10), and (3.11)
repeat
transfers = false
for j = 1 to k do
if j > 1 then // Reallocate backwards 1st half
first = bj ; last = first+ ⌊nj
2(1− δ)⌋
for i = first up to last do
if nj−1 > 1 and ∆J(xi, j, j − 1) < 0 then
transfers = true
bj += 1; nj += 1; nj−1 −= 1Update µj , µj−1, J // According to Eq. (3.6)
else breakif j < k then // Reallocate forwards 2nd half
last = bj+1 − 1; first = last− ⌊nj
2(1− δ)⌋
for i = last down to first do
if nj > 1 and ∆J(xi, j, j + 1) < 0 then
transfers = true
bj+1 −= 1; nj −= 1; nj+1 += 1Update µj , µj+1, J // According to Eq. (3.6)
else breakuntil ¬transfers
Figure 3.4: Warped K-Means. A sample x ∈ Cj is only allowed to move either to clusterCj−1 or Cj+1. If a move proves advantageous, that is, the increment in SQE is negative,the sample is reallocated and the two cluster means involved in such a reallocation areincrementally recomputed according to (3.6). Otherwise, the next cluster is inspected, inorder to preserve the clustering sequentiality.
is aborted as soon as the SQE does not improve for that chunk, in order topreserve the sequentiality of our clustering procedure.
Note also that if some samples are reallocated during the forward processingof cluster j, then we do not need to re-check them in the backward processingof cluster j + 1. This is easily verifiable with an auxiliary variable that storesthe index of the last reallocated sample. This detail, however, is not shown inthe WKM pseudo-code for the sake of clarity.
The computational cost of a complete iteration of WKM over the whole se-quence X, depends on the number of samples n, the sample vector dimensiond, and the number of clusters k. As previously discussed, it can also depend onthe value of δ. On the one hand, if δ = 1, the complexity of WKM is reduced toΘ(kd) per iteration, in comparison to Θ(nkd) in the case of classical K-means.

3.3. Evaluation 41
~x1
~xn
(a)
c11 c12
ck1
ck2
(b) (c) (d)
Figure 3.5: Graphical overview of Figure 3.4 for k = 3 clusters. [3.5a] Key pointsidentification: the first and last key points always match the first and last data points(x1 and xn). [3.5b] Initial segmentation: crosses mark the k segments’ middle points.[3.5c] Point visiting order for reallocation: notice that chunks c11 and ckn do not needto be inspected. [3.5d] Final clustering configuration: circles represent each segment’scentroid.
On the other hand, if δ = 0, the best- and worst-case complexities are Ω(kd)and O(nd), respectively. Therefore, for all values of δ and in all cases, eachiteration of WKM is expected to be (much) faster than conventional K-meansalgorithms. Moreover, according to empirical observations, the convergencetends to require less iterations than such classical K-means algorithms.
Overall, the main advantages of our proposal can be summarized as follows:
• Consistent results: It always guarantees the convergence to a goodlocal minimum, i.e., a low distorted partition of the original dataset thatpreserves sequence ordering.
• Robust solution: Each run for a given k always yields the same clus-tering configuration—thanks to the initialization algorithm and the min-imization criterion for sample reallocation.
• Low computational cost: Much lower than that of classical K-meansalgorithms since, instead of the usual all-against-all search strategy, weonly need to check two clusters in each step.
• No extra mandatory parameters: Our solution requires the sameinput data and parameters as in K-means, though an optional δ thresholdcan be specified to tune both the algorithm behavior and its cost.
As discussed by Leiva and Vidal [2011], the WKM algorithm is also suitablefor online learning tasks over large datasets, due to the following facts: 1) thecomputational cost of updating the centroids is independent of the number ofsamples and 2) the final partition can be updated while new samples arrivewithout affecting too much the previous data structure.
3.3 Evaluation
In this section we evaluate behavioral clustering on two different tasks: webpage classification and action recognition. In the former task, we are interested

42 Chapter 3. Behavioral Clustering
in describing a website by how users interact within their contents. To thisend, a classical clustering methodology is intuitively quite useful: differentpages that trigger different behaviors should lie in different clusters, while pageswith similar interactions are likely to be assigned to the same cluster. Inthe latter task, we are interested in characterizing human actions from rawsensor data. To this end, we look for data compression methods to reduce thenumber of samples for later action recognition. Here, a clustering methodologymight also be quite useful, although preserving data sequentiality is of utmostimportance—something that classical clustering methods fail to achieve.
Notice that the goal of the page classification task is to describe the websiteas a whole, so there is no need to preserve data sequentiality. However, thegoal of the action recognition task is to discover the most informative numberof elementary samples that define a human action. Therefore, in this case itis clear that a better outcome is expected if we employ our WKM algorithminstead of classical methods.
3.3.1 Clustering Browsing Interactions
In the same way as web clustering engines organize search results by topic ordocument relevance, our method aims to organize websites by users’ interac-tion semantics. Such semantics of interaction are characterized by a series ofmetrics (16 in total), which are computed by our mouse tracking tool and weredescribed in Section 2.3.6, say, 1D metrics: browsing time, number of clicks,motion activity, and path length; and 2D metrics (with X and Y components):distance, range, entry point, exit point, centroid, and scroll reach. We hy-pothesize that if such metrics are consistent, they should generate clusters of(approximately) same precision for a given typology of pages. In addition, it isimportant to remark that metrics should be normalized. For instance, time andscrolling are often reported as relevant metrics [Claypool et al., 2001; Holuband Bielikova, 2010]. However, it is clear that longer/bigger pages will requireboth more time and scrolling, and hence they could lead to misleading resultsif one does not consider data normalization. Usually whitening the data (i.e.,ensuring a distribution of each metric with mean 0 and variance 1) may beenough.
Method
We gathered interaction data for approximately a month on three informationalwebsites (Figure 3.6), i.e., they are dedicated to the purpose of providing infor-mation to the users (like, e.g., news portals or corporate blogs). Most websitescould fit in this type of website to some extent, so evaluating our approach onthis typology should ensure a broad generalization scope. The characteristicsof each corpus are summarized in Table 3.1.

3.3. Evaluation 43
(a) OTH (habitat trends) (b) NM (rice company) (c) LAKQ (social club)
Figure 3.6: Example screenshots from the corresponding websites of each evaluateddataset (see also Table 3.1).
Codename Size (MB) # Logs # URLs
OTH 25.5 4803 63NM 33.5 5601 43
LAKQ 7.4 1232 28
Table 3.1: Overview of evaluated datasets (see also Figure 3.6).
Procedure
Users were selected by random sampling, which means that only a fraction ofall visitors (with equal probability of selection) was collected. We set a trackingfrequency of 24 fps. Each interaction log was stored in a MySQL database andthen exported in XML format. Logs were modeled as normalized interaction-based 16-d feature vectors (see Section 3.3.1). We took into account visitsthat lasted 0.5 hours at most, in order to discard bogus or spurious logs be-forehand. Then, we applied the classical K-means algorithm to automaticallygroup the logs in each corpus, using random convex combination as initializa-tion method [Leiva and Vidal, 2010] to accelerate convergence. The optimalnumber of clusters for each corpus was determined as the marginally less dis-torted grouping in terms of the SQE, which is proportional to the intra-cluster(or within-class) variance; see, e.g., Figure 3.7. Once we had each log assignedto a cluster, we extracted the mean and standard deviation for the trackedinteraction features, for later comparison and further analysis.
Results
To illustrate the usefulness of the proposed framework we start by describingthe profiles found in the OTH corpus. Table 3.2 summarizes the clusteringresults for this dataset. Then we discuss the main observations that relate tothe other evaluated corpora.

44 Chapter 3. Behavioral Clustering
2 6 10 14 18
2
4
6
8
·109
6
k = 6
# Clusters (k)
SQE
(∝intra-cluster
variance)
Figure 3.7: Clustering the OTHdataset. The intra-cluster vari-ance (or energy, or SQE) decreaseswith increasing number of classesk. However, at some point themarginal gain will be smaller. In-tuitively, this can be chosen as thenumber of clusters that better sum-marizes the dataset.
Cluster # Population % Energy (SQE) % Variance
2 698 14 3.6·108 16 5.1·105
3 1347 28 4.7·108 22 3.5·105
6 2220 46 5.4·108 25 2.4·105
Avg. Total 4748 100 2.1·109 100 4.5·105
Table 3.2: Clusters found in the OTH dataset. Outliers were classified into three clusters(#1, #4, and #5), not reported here because they all represent near 10% of samplepopulation.
Profiles in OTH corpus According to the ‘elbow’ criterion1 (Figure 3.7), wefound k = 6 to be the number of classes that better summarizes this dataset.However, three cluster were identified as outliers, which accounted for near10% of the population. So actually we found three meaningful groups in thisdataset. This fact reinforced the idea of using behavioral clustering for isolatingsub-populations. Looking at these outliers we found that logs belonging tothese clusters had unusual behaviors; e.g., 11.5 clicks on average (SD = 19.5),extremely long cursor trajectories of 12797.4 px (3130.9), and so on.
Pages in cluster #6 concentrated the biggest sub-population (46% of the data).We found short-term sessions of M = 30 s (SD = 132.9) with “one-click” brows-ing patterns of 1.1 clicks (0.6). Scrolling reached 40% (20) of the users’ browserviewport and mouse range comprised 181.8 px (128.9) and 120.7 px (105.6) inhorizontal and vertical axes, respectively. Thus, logs belonging to this clustercould be classified as “basic presence” pages, supporting somehow the evidenceof the typology of the tracked pages (i.e., an informational website).
1In the literature, it is also mentioned as the ‘gap statistic’ [Tibshirani et al., 2001].

3.3. Evaluation 45
Figure 3.8: Clustering LAKQand NM datasets, following thesame criterion depicted in Fig-ure 3.7. We identified 5 and 6clusters to be the most informativenumber of classes to describe thepages in each dataset, respectively.
2 6 10 14 180
0.5
1
1.5·1010
k = 6
5
# Clusters (k)
SQE
(∝intra-cluster
variance)
LAKQ
NM
The population of cluster #3 was the least dispersed overall (16% of energy).In-page interactions lasted 45.7 s (125.96), issuing 1.5 clicks (1.6) per session onaverage. Pages belonging to this group were found to be browsed by relativelyactive users, e.g., mouse distance: 7.1 px (6.7), mouse motion: 16% (13),vertical scroll of 65% (23). Therefore, we hypothesize that these pages were bethe most familiar for the users. Although we do not have such ground truthdata to back up this claim.
Pages in cluster #2 showed metrics related to cluster #3, with similar power-law distributions. However, users in this cluster spent more browsing time,which was also more dispersed overall: 1.3 min (3.5), and clicked more: 2.33(2.34). Pages were scrolled considerably more than the half of their browser’sviewport: 76% (22). Together with the rest of considered metrics, this fact ledus to conclude that pages in this cluster were the most interesting for the users.
Profiles in NM and LAKQ corpora Instead of performing a detailedanalysis of each cluster found akin the OTH corpus as described above, weshall depict some interesting observations.
Cluster Population % Energy (SQE) % Variance
1 159 13 2.5·108 15 1.6·106
4 632 53 4.1·108 24 6.4·105
5 346 29 4.5·108 27 1.3·106
Avg. Total 1178 100 1.6·109 100 1.3·106
Table 3.3: Clusters found in the LAKQ dataset. Two outliers (clusters #2 and #3) wereidentified.
Regarding Table 3.3, the biggest cluster (#4, 53% of the data) was surprisingly

46 Chapter 3. Behavioral Clustering
not the most distorted overall. We observed that all meaningful clusters foundwere more or less similar in terms of dispersion, which is a convenient feature ofK-means. What is specially interesting, however, is that vertical scrolling oftenoverpassed 100% of the browser viewport. Taking also into account the mouseranges, centroids, and entry/exit coordinates in these groups, we speculate thatmost visitors were using (moderately) large displays. This hypothesis was thenverified by observing that the average screen resolution was 1208.9 (203.5) x860.7 (118.8) px.
Cluster Population % Energy (SQE) % Variance
2 1697 30 8.9·108 26 5.2·105
3 968 17 5.8·108 17 6.1·105
6 2132 38 9.1·108 26 4.2·105
Avg. Total 5557 100 3.4·109 100 6.1·105
Table 3.4: Clusters found in the NM dataset. Three outliers (clusters #1, #4, and #5)were identified.
As observed in Table 3.4, similar to the OTH dataset, we found three clus-ters (#2) in the NM dataset that were clear outliers. Again, we remark theusefulness of using behavioral clustering for isolating sub-populations in largedatasets. On the other hand, though, the remaining clusters showed moreconsistent behaviors, comprising between 17% and 26% of the overall clusterenergy. Overall, it was interesting to observe that the proposed metrics leadclassical clustering to find the same number of classes as in the previouslystudied datasets. We elaborate more on this below.
Discussion
Our study threw some interesting suggestions. First, using this clusteringframework allows to focus on a small number of groups to describe the vastmajority of the pages of a website. For instance, in the OTH corpus the 3 mainclusters found represent 95% of the browsed pages. Similarly, by looking at thesame number of clusters, we can explain 89% and 93% of the pages in LAKQand NM datasets, respectively. Second, as previously commented, our methodallows to describe web pages in a completely different way, i.e., from the userinteractions’ point of view, instead of the usual structure/content/usage triad.This knowledge has an interesting potential to be used to compare cross-sitebrowsing behaviors, or predict interest of non-browsed pages. Third, using theinformation implicitly embedded in user’s interactions may help webmastersto redesign the most important pages, in terms of in-page interactions. Thisway, if individual personalization is not possible, users could browse the site atthe same performance level to a greater or a lesser extent. Fourth, we found

3.3. Evaluation 47
that the user sample we tracked at each website was often a mixture of dis-tributions. This evidence encourages to be cautious in using logging tools orintuitions that assume a normal distribution for all users.
As observed, exploiting the browsing context from user behavior may serveas a useful complement to current web mining techniques. Further suitabilityof this work relates to any system that taps knowledge about the user, e.g.:information retrieval, relevance feedback, document organization, or usage in-ference, just to name a few. Armed with this awareness, one could carry outnovel research studies on user modeling and related applications.
3.3.2 Classifying Human Actions
In this case, we chose a straightforward classification task to test the WKMalgorithm in isolation. We wanted to test how data sequentiality may affectthe performance of a recognizer. To this end, we used the Localization Data forPerson Activity dataset [Kaluza et al., 2010] form the UCI Machine LearningRepository [Asuncion and Newman, 2007]. In this corpus, 164860 data pointswere captured from 5 people wearing 5 active RFID tags (both ankles, belt,and chest). Up to 11 human actions were represented as a time series of x,y,zcoordinates of such 5 body parts.
Note that, while there is an important number of works tackling the problemof classifying human actions, we chose this corpus to show the capabilities ofWKM as a simple and accurate compression tool for a complex, real-world task.To this end, each human action is represented as a vector of a fixed number of“elementary actions”, where each elementary action is, in turn, a cluster meanvector obtained by clustering the original sequence of action samples (x,y,zcoordinates). Once each action is represented as a fixed dimension vector, manysimple classifiers can be adequately used, among which we chose the well-knownNearest-Neighbor (NN) classifier.
Method
To characterize each activity, the x,y,z coordinates of all sensors were merged
into a single 12-dimensional feature vector sample x = (x1, y1, z1, . . . , x4, y4, z4)T.
So a trajectory was defined as the sequence X = x1, . . . ,xn, where n is thenumber of samples in X.
Unfortunately, the dataset did not include the same number of instances persensor. Therefore some of the composed trajectories had extremely differentnumber of 12-dimensional vectors (e.g., some had just two vectors and othershad more than 800). We needed thus to build a more comparable dataset; so,while composing each trajectory we verified that it had at least 10 samples.

48 Chapter 3. Behavioral Clustering
Eventually we obtained 125 trajectories of 162 samples on average (SD=138.6),belonging to one of the following 5 classes: ‘falling’, ‘lying’, ‘on-all-fours’, ‘sit-ting’, and ‘walking’. There were 25 trajectories per class. The features of thedataset used in the experiments are depicted in Table 3.5.
Trajectories 125Mean samples per trajectory 162Dimension of sample vectors 12Classes (actions) 5Number of trajectories per class 25
Table 3.5: Features of the dataset used in the WKM experiments.
Vector Representation We ran our implementation of WKM to clustereach trajectory into a variable number of segments (k ∈ 2, 4, . . . , 20) andwith different cluster proportions (δ ∈ 0, 0.2, . . . , 1). We also comparedWKM with two well-known versions of K-means: the classical Duda&Hart ’salgorithm [Duda and Hart, 1973] and the popular Lloyd ’s version [Lloyd, 1982],using both random and TS initializations. When initializing randomly we per-formed up to 5 times each experiment, in order to mitigate the effects of chance,and computed the average values.
The cluster means obtained by k-clustering each action data sequence werestacked into a 3 · 4 · k dimensional feature vector, i.e., a 12 k-dimensional vec-tor. For those trajectories with less samples than the desired number of seg-ments, (i.e., when k > n) we used singleton clusters instead (i.e., k = n) andthe missing dimensions were filled with zeros. As we will see below, this facthad clear repercussions when classifying some trajectories with k > 10 (tenwas the minimum number of vectors in all trajectories), specially in terms ofclassification error.
Nearest Neighbor Classifier The simple and well-known 1-NN classifierwith Euclidean distance was adopted to classify vector-represented action tra-jectories. As previously pointed out, each class was represented by a numberof prototype trajectories. Each test trajectory was classified into the class ofits nearest neighbor prototype.
In these experiments, we employed the C++ ANN library [Mount and Arya,1998] for NN searching, with its basic, exact search option. Given the relativelysmall number of available trajectories overall, we adopted the leaving-one-outtraining and testing procedure.
Results
The first experiment was aimed at studying the behavior of different algorithmswhen minimizing SQE and increasing the number of clusters. Results are shown

3.3. Evaluation 49
in Figure 3.9. As expected, in all cases SQE decreases monotonically withincreasing number of clusters. It is interesting to note that K-means algorithmsachieve a (slightly) lower SQE than WKM, which is explained by the lack ofsequentiality restrictions, that otherwise WKM imposes on the data.
In the next experiment we studied the ability of different clustering algorithmsto behave as data preprocessors, in order to obtain simplified vector-representedtrajectories for classification purposes. We considered the case when a sensortrajectory is segmented into just one single cluster (k = 1) as the baseline; thatis, each trajectory is represented by a 12-dimensional vector corresponding tothe average of all its trajectory samples. In that case, the classification error wasas low as 9.6%, which is reasonable given the nature of the activities involved(e.g., the position of “lying” and “sitting” should differ greatly at least in theaverage z coordinate of each sensor).
Results for other values of k are shown in Figure 3.10. As expected, certainsegmentations performed better than others for each algorithm, but a partic-ularly adequate number of elementary actions seems to be 6 in most cases.Interestingly, WKM is the method that better puts this fact forward. We ob-served that accuracy degraded noticeably for k > 10, to the point that fork = 20 error rates were above 50% for all classifiers—for the reason explainedin Section 3.3.2. Also, as observed, the randomly initialized versions were theworst performers.
In order to better understand the impact of the δ threshold of WKM, werepeated the previous experiment for different values of this threshold. Fig-ure 3.11 shows the influence of δ in the recognition accuracy. We see that bytuning this parameter WKM results can be further improved, with a best resultof 3.2% error rate for six elementary actions. Finally, regarding the computa-tional cost of each algorithm, as shown in Figure 3.12, WKM behaves muchbetter than its peers.
Table 3.6 summarizes the results discussed so far. Classical K-means algo-rithms do not help overcoming the trivial baseline (just one cluster). In con-trast, WKM achieved a recognition accuracy of 97%, which represents a 66%improvement over the baseline. WKM is borderline statistically significantlybetter than all compared methods [χ2
(7,N=125) = 4.44, p = .07]. Most inter-estingly, the improvements introduced by WKM are achieved along a hugecomputational cost reduction (more than one order of magnitude) with respectto K-means algorithms. We can conclude that WKM was the best performeramong its peers, and that results confirmed our expectations.
Discussion
As can be observed in the figures, WKM gives very competitive error rates at alow computational cost. Therefore, our experimental results show that WKM is

50 Chapter 3. Behavioral Clustering
2 4 6 8 10 12
0
0.2
0.4
·103
# Segments
SQE
Lloyd random Lloyd TS
Duda&Hart random Duda&Hart TS
WKM (δ = 0) WKM (δ = 1)
Figure 3.9: Sum of squared er-rors against number of segments.Each value is averaged for alltrajectories (activity × person ×
trial). As expected, the segmen-tations achieved by WKM havehigher distortion than those ofclassical K-means, since the for-mer imposes a strong sequentialrestriction, while the latter doesnot.
2 4 6 8 10 12
0
10
20
30
40
# Segments
%Classification
Error
Lloyd random Lloyd TS
Duda&Hart random Duda&Hart TS
WKM (δ = 0) WKM (δ = 1)
Figure 3.10: We performedvariations to three alternativesfor clustering trajectories: TheDuda&Hart ’s algorithm and theLloyd version, using both ran-dom initialization and trace seg-mentation, and the WKM algo-rithm using two extreme distor-tion thresholds.

3.3. Evaluation 51
Figure 3.11: WKM classificationerror. We used different δ thresh-olds for each tested number of seg-ments. The best accuracy wasachieved when using k = 6 for allthreshold values.
2 4 6 8 10 12
0
10
20
# Segments
%ClassificationError
δ = 0.0 δ = 0.2 δ = 0.4
δ = 0.6 δ = 0.8 δ = 1.0
Figure 3.12: Computationalcost against number of segments.Cost is estimated as number oftimes Eq. (3.5) is executed. ForLloyd versions, cost was com-puted as the number of timeseach algorithm tested if clustermeans did change.
2 4 6 8 10 12
0
0.5
1
1.5·103
# Segments
Com
putation
alCost
Lloyd random Lloyd TS
Duda&Hart random Duda&Hart TS
WKM (δ = 0) WKM (δ = 1)

52 Chapter 3. Behavioral Clustering
Algorithm Best k % Error Cost
Baseline 1 9.6 —
Lloyd random 2 9.8 796Lloyd TS 6 11.2 1080
Duda&Hart random 2 10.6 448Duda&Hart TS 6 9.6 778
WKM δ = 0.0 6 5.6 54WKM δ = 0.8 6 3.2 71WKM δ = 1.0 6 4.0 135
Table 3.6: Summary of sequential clustering results. Bold value indicates that it is thebest result among all methods being compared.
an interesting approach for lowering both classification error and computationalcost regarding to using other comparable clustering alternatives.
It is worth pointing out that all algorithms initialized with TS allow to find the“natural” number of classes. However, as shown in Figure 3.10, for WKM thisnumber in turn corresponds to the lowest classification error rate in all cases(see also Table 3.6).
Additionally, we have shown that WKM ensures monotonic improvement andfinite assignments in a sequential fashion, which translates to convergence to agood local minimum in which trajectory segments are well-defined. This canbe leveraged in some interesting applications, as we shall expose as follows.
Online Handwriting Our clustering technique can be used as a preprocess-ing step for online text recognition. As illustrated in Figure 3.1, the obtained(well-formed) segments capture pen-stroke regularities which can be advanta-geously exploited by existing handwritten recognition approaches to increasecharacter recognition accuracy [Leiva and Vidal, 2012].
Eye/Mouse Tracking This algorithm entails a reliable contribution to clus-tering eye movements on aggregated data; e.g., both heatmaps and areas ofinterets (AOIs) are computed by distance-based clusters, and therefore theydo not distinguish between long-time fixations of a single person or short-timefixations of a group of people.
Motion Segmentation The storage and transmission of motion trackingcontent is a problem due to their tremendous size and the noise caused byimperfections in the capture process. Thus, one could use our method for amore compact representation of these (large) data.

3.4. Conclusions and Future Work 53
In general, any discipline that would handle ordered data sequences could ben-efit from our approach; e.g., human motion classification from surveillancecameras or automatic video key frame extraction.
3.4 Conclusions and Future Work
This chapter has covered behavioral clustering, a broad term that refers tothe task of automatically labeling and classifying user behavior, which wasevaluated on two different tasks with a series of real-world datasets.
In the first task we were able to discover “hidden” profiles on websites, ac-cording to how users behave while browsing. We have demonstrated that thistechnique can be used to organize and describe websites from the user interac-tions’ point of view. This technique can also be used as a measure of similaritybetween web pages, to evaluate their design in an automated fashion, or to dis-cover outliers. We believe that this work opens a new door to novel approacheson web behavior studies.
Lines of future work regarding web page classification according to (implicit)interaction metrics include inferring behavior of non-browsed pages and findingrelated websites based on user interactions. The metrics we used for clusteringare related to cursor activity, because cursor data are easy to collect and nospecial instrumentation is required on client side. However, user interactionis inherently multimodal. Thus, other related input signals such as eye move-ments could (and should) be taken into consideration, and be incorporated tomore sophisticated web profiles. This way, one may complement studies ofquantitative/qualitative nature, improving thus the usability and usefulness ofwebsites, and being able to extend this methodology to related fields such asweb applications or software products.
In the second task, we have presented a novel revisitation of the K-means algo-rithm, specially suited for sequentially distributed data. We have successfullyused this approach to automatically identify human actions derived from rawsensor data. By taking into account that data are sequentially given, our pro-posal, WKM, behaves much better than classical clustering algorithms. Oneobvious reason why using a cluster representation may have advantages overworking with raw sensor data is the evident size reduction, which in turn mayenhance the ease of storage, transmission, analysis, and indexing. Moreover,extending this notion to the analysis of trajectories reverts in another signifi-cant advantage: having a good and compact representation of a data sequencemakes it more invariant to noise or distortions in such data. This fact has beenbacked up by our experimental results, lowering both classification error andcomputational cost regarding to using other comparable clustering alternatives.
As stated in this chapter, a critical step for (adequately) clustering sequentialdata with WKM is the initialization of segment boundaries. We used the TS

54 Bibliography of Chapter 3
technique, although other algorithms that ensure a sequential distribution maybe also helpful. For instance, we could use an equispaced boundary initializa-tion instead. Future work will be focused on removing the (optional) δ param-eter from the algorithm, and instead learning automatically the best value fora given cluster configuration. Further research on WKM will be leaned towardan optimum procedure of choosing the number of clusters. We hope that ourwork may encourage researchers and practitioners to apply this algorithm to awealth of new problems and/or domains.
Bibliography of Chapter 3
R. Agrawal, J. Gehrke, D. Gunopulos, and P. Raghavan. Automatic subspace clusteringof high dimensional data for data mining applications. In Proceedings of the 1998 ACMSIGMOD international conference on Management of data, pp. 94–105, 1998.
A. Asuncion and D. J. Newman. UCI machine learning repository, 2007. Available athttp://www.ics.uci.edu/~mlearn/MLRepository.html.
F. I. Bashir, A. A. Khokhar, and D. Schonfeld. Object trajectory-based activity clas-sification and recognition using Hidden Markov Models. IEEE Transactions on ImageProcessing, pp. 1912–1919, 2007.
J. C. Bezdek and N. R. Pal. Some new indexes of cluster validity. IEEE Transactions onSystem, Man and Cybernetics, 28(3):301–315, 1998.
M. Claypool, P. Le, M. Wased, and D. Brown. Implicit interest indicators. In Proceedingsof the 6th international conference on Intelligent user interfaces (IUI), pp. 33–40, 2001.
D. L. Davies and D. W. Bouldin. A cluster separation measure. IEEE Transactions onPattern Analysis and Machine Intelligence, 1(4):224–227, 1979.
T. G. Dietterich. Machine learning for sequential data: A review. In Proceedings ofthe Joint IAPR International Workshop on Structural, Syntactic, and Statistical PatternRecognition, pp. 15–30, 2002.
R. Dubes. Handbook of Pattern Recognition & Computer Vision, chap. Cluster analysis andrelated issues, pp. 3–32. World Scientific Publishing Co., Inc., 1993.
R. O. Duda and P. E. Hart. Pattern Classification and Scene Analysis. John Wiley &Sons, 1973.
R. O. Duda, P. E. Hart, and D. G. Stork. Pattern Classification, chap. UnsupervisedLearning and Clustering, pp. 517–599. John Wiley & Sons, 2001.
J. C. Dunn. A fuzzy relative of the ISODATA process and its use in detecting compactwell-separated clusters. Journal of Cybernetics, 3:32–57, 1973.
J. C. Dunn. A cluster separation measure. Journal of Cybernetics, 4:95–104, 1974.
C. Fraley. Algorithms for model-based gaussian hierarchical clustering. Tech. Report 311,Department of Statistics, University of Washington, 1996.
V. Guralnik and G. Karypis. A scalable algorithm for clustering sequential data. InProceedings of IEEE International Conference on Data Mining, pp. 179–186, 2001.

Bibliography of Chapter 3 55
G. Hamerly and C. Elkan. Learning the k in k-means. In Proceedings of the seventeenthannual conference on neural information processing systems (NIPS), pp. 281–288, 2001.
M. Holub and M. Bielikova. Estimation of user interest in visited web page. In Proceedingsof the 19th international conference on World wide web (WWW), pp. 1111–1112, 2010.
L. Hubert and P. Arabie. Comparing partitions. Journal of Classification, 2(1):193–218,1985.
A. K. Jain. Data clustering: 50 years beyond K-means. Pattern Recognition Letters, 31(8):651–666, 2010.
A. K. Jain, M. N. Murty, and P. J. Flynn. Data clustering: A review. ACM ComputingSurveys, 31(3):1–60, 1999.
B. Kaluza, V. Mirchevska, E. Dovgan, M. Lustrek, and M. Gams. An agent-based ap-proach to care in independent living. In Proceedings of the International Joint Conferenceon Ambient Intelligence (AmI), pp. 177–186, 2010.
L. Kaufman and P. Rousseeuw. Finding Groups in Data: An Introduction to ClusterAnalysis. John Wiley & Sons, 1990.
J.-G. Lee, J. Han, and K.-Y. Whang. Trajectory clustering: a partition-and-group frame-work. In Proceedings of the 2007 ACM SIGMOD international conference on Managementof data (SIGMOD), pp. 593–604, 2007.
L. A. Leiva. Mining the browsing context: Discovering interaction profiles via behavioralclustering. In Adjunct Proceedings of the 19th conference on User Modeling, Adaptation,and Personalization (UMAP), pp. 31–33, 2011.
L. A. Leiva and E. Vidal. Assessing users’ interactions for clustering web documents:a pragmatic approach. In Proceedings of the 21st ACM conference on Hypertext andHypermedia (HT), pp. 277–278, 2010.
L. A. Leiva and E. Vidal. Revisiting the K-means algorithm for fast trajectory segmen-tation. In Proceedings of the 38th International Conference on Computer Graphics andInteractive Techniques (SIGGRAPH), 2011.
L. A. Leiva and E. Vidal. Simple, fast, and accurate clustering of data sequences. InProceedings of the 17th international conference on Intelligent User Interfaces (IUI), pp.309–310, 2012.
S. Lloyd. Least squares quantization in PCM. IEEE Transations on Information Theory,28(2):129–137, 1982.
J. MacQueen. Some methods for classification and analysis of multivariate observations. InProceedings of the Fifth Berkeley Symposium on Mathematical Statistics and Probability,pp. 281–297, 1967.
K. V. Mardia, J. T. Kent, and J. M. Bibby. Multivariate Analysis. Academic Press, 1979.
G. W. Milligigan and M. C. Cooper. An examination of procedures for determining thenumber of clusters in a data set. Psychometrika, 50(2):159–179, 1985.
D. Mount and S. Arya. ANN: library for approximate nearest neighbor searching, 1998.Available at http://www.cs.umd.edu/~mount/ANN/.
F. Murtagh. A survey of recent advances in hierarchical clustering algorithms which usecluster centers. Computing Journal, 26(1):354–359, 1984.

56 Bibliography of Chapter 3
B. Poblete and R. Baeza-Yates. Query-sets: Using implicit feedback and query patternsto organize web documents. In Proceedings of the 17th International Conference on WorldWide Web (WWW), pp. 41–50, 2008.
C. Sugar. Techniques for Clustering and Classification with Applications to Medical Prob-lems. PhD thesis, Department of Statistics, Stanford University, 1998.
R. Tibshirani, G. Walther, and T. Hastie. Estimating the number of clusters in a dataset via the gap statistic. Journal of the Royal Statistical Society. Series B (StatisticalMethodology), 63(2):411–423, 2001.
P. Trahanias and E. Skordalakis. An efficient sequential clustering method. PatternRecognition, 22(4):449–453, 1989.
C. J. Veenman, M. J. T. Reinders, and E. L. Baker. A maximum variance clusteralgorithm. IEEE Transactions on Pattern Analysis and Machine Intelligence, 24(9):1273–1280, 2002.
J. H. Ward. Hierarchical grouping to optimize an objective function. Journal of AmericanStatistics Association, 58(301):235–244, 1963.
J. Yu. General C-means clustering model. IEEE Transactions on Pattern Analysis andMachine Intelligence, 27(8):1197–1211, 2005.

Chapter 4
Human Multitasking
Multitasking takes place when someone tries to handle more than one taskat the same time, switch from one task to another, or perform different tasksin (rapid) succession. Multitasking allows thus to coordinate multiple taskscognitively, with the downside of redirecting the focus of attention away fromthe primary task and, like external interruptions, leading to disruptive shiftsin thinking.
In this chapter we discuss the need to support multitasking while interactingwith computers, with a clear focus on web browsing. We present MouseHints,a tool that aims to minimize the negative effects of interruptions on mem-ory. By leveraging implicit interactions and using a combination of very basicinfographics, the tool draws the user attention to the location of previouslyinteracted areas on the screen. This way, we provide a method for adaptivememory cues that can facilitate task resumption.
Chapter Outline4.1 Introduction 58
4.2 MouseHints 62
4.3 Evaluation 64
4.4 Discussion 67
4.5 Conclusions and Future Work 69
Bibliography of Chapter 4 69
57

58 Chapter 4. Human Multitasking
4.1 Introduction
We now use the Web to multi-task the activities we do every day, to the extentthat it is not unusual to see users with a dozen applications and browser in-stances open at a time; e.g., sharing pictures, listening to music, or shopping,just to name a few. Computers can display more tasks and more informationthan we can handle, and attention remains a finite resource [Fong, 2008].
Understanding how people browse the Web has been historically a subject ofresearch, see, e.g., [Adar et al., 2009; Byrne et al., 1999]. Spink et al. [2004]reported that a single browsing session may consist of seeking information onsingle or multiple topics, and switch between tasks. Viermetz et al. [2006] no-ticed that the effect of viewing a website and branching the focus onto differentwindows was an increasingly popular web viewing methodology. Moreover, thetabbed browsing feature has boosted the acceptance of such a web viewingbehavior. In fact, according to Dubroy and Balakrishnan [2010], tab switchingis the second-most frequent action that people perform in their browser, afterlink clicking. This is interesting, because up to now it is been assumed that theprimary thing that people do in their browser is clicking on links. And this maystill be true (for some people), but tab switching is a close second. This meansthat the browser is used for navigation, but also as a task-management tool.People thus may cognitively coordinate multiple tasks through multi-tabbing,having many pages open at the same time and switching between them in anyorder.
Web browsing activities can be defined as high-level tasks, that is, users pursuean abstract or general concept (e.g., buy a book, learn to play a musical instru-ment, check the weather, etc.) and, to accomplish such a goal, tasks usuallyinvolve multiple steps or sub-rutines. Unfortunately, while we often maintainhigh level definitions of tasks in our minds, computer systems seldom sup-port them [Humm, 2007]. Most UIs for switching between tasks require visualsearches of candidates, namely placeholders—e.g., headlines, text paragraphs,or images—to retain spatial information about the UI and thus cognitively easenavigation as well as task resumption (see Section 4.2).
4.1.1 Preliminaries
Multitasking takes place when someone tries to perform two tasks simultane-ously, switch from one task to another, or perform two or more tasks in (rapid)succession [APA, 2006]. Konig et al. [2005] refer to multitasking as the abilityto accomplish multiple task goals in the same time span by engaging in frequentswitches between individual tasks.
One may note that multitasking can involve, by definition, attentional branch-ing between multiple tasks, both in the physical and the digital world; e.g.,reading a book may require an online dictionary to search certain words and,

4.1. Introduction 59
possibly, consulting some of the (interesting) book references on a search en-gine. The downside of multitasking is that the focus of attention is redirectedaway from their primary task and, as Hembrooke and Gay [2003] stated, ourability to engage in simultaneous task is, at best, limited, and at worst, virtuallyimpossible.
Tabbed Interfaces
A tabbed interface is one that allows multiple documents to be contained withina single window, using tabs as a navigational widget for switching between setsof documents. That being said, there is a fuzzy boundary for distinguishingbetween a tabbed interface and an operating system taskbar, in the sense thatboth allow to group application instances and switch between them. From thisdefinition, it is clear that one can interchange both “documents” and “window”by “pages” and “browser”, respectively, to refer more precisely to the Webdomain. Today all major web browsers feature a tabbed interface, so thisfigure is expected to be well understood by users worldwide.
Parallel Browsing
By providing tabs, web browsers have started supporting parallel browsing,allowing users to engage multiple concurrent pages simultaneously [Dubroyand Balakrishnan, 2010]. The current active tab is a foreground task and thusit has the user attention, while other tabs or windows may be loading in thebackground or contain information that is not yet needed [Huang and White,2010]. Typical browsing flow may then be interrupted by tab switches to visitpages in other tabs. However, the notion of switching between sets of pages canbe augmented to switching also between sets of (other) desktop applications.For example, when browsing for research purposes it is usual having also openeda PDF viewer, a file explorer, and a text editor; and alternate between themduring the course of the browsing session. These activities, besides of notbeing explicit features of parallel browsing, may however influence our browsingbehavior and therefore they should be taken into account. The effect of parallelbrowsing suggests that the user focus can no longer be simply seen as thedifference in time between two successive page requests.
4.1.2 The Costs of Attention Shifts
There is a long history in the literature examining the allocation of attentionalresources (e.g., Hansen [1991]; Janzen and Vicente [1998]; Ma and Kaber [2006];McFarlane [1999]). Cutrell et al. [2000] summarized the field by outlining im-plications for design and discussing the perceived difficulty of switching backto tasks. Mark et al. [2005] discovered that more than a half of goal-orientedsessions are interrupted regularly by activities such as co-worker conversations,virus scanner pop-ups and instant messages. Iqbal and co-authors developed

60 Chapter 4. Human Multitasking
tools for supporting interruption management by notification cues [Iqbal andBailey, 2007], as well as detecting and differentiating breakpoints during taskexecution [Iqbal and Horvitz, 2007]. They found that task suspensions mayresult in more than two hours of time until resumption. Users are susceptibleto overload, making thus user attention and workflow both delicate and diffi-cult to maintain, especially when interruptions occur or work is divided acrosssessions [Humm, 2007].
Memory is highly selective, and the selection processes are determined by theinterplay between task processing demands and UI design [Oulasvirta, 2004].Interruptions lead to disruptive shifts in thinking, and understanding the hid-den costs of multitasking may help people to choose strategies that boost theirefficiency, such as the approaches we present in the next section or, dependingon the application domain, related work like [Ashdown et al., 2005; Kern et al.,2010].
The findings that multitasking over different types of tasks can reduce pro-ductivity [Rubinstein et al., 2001] is further supported by the single channeltheory, which suggests that the ability of humans to perform concurrent mentaloperations is limited by the capacity of a central mechanism [Kahneman, 1973;Schweickert and Boggs, 1984]. Therefore, multitasking may seem efficient ata first glance but it may actually take more time in the end and lends itselfto more errors. Multitasking has been also studied on mobile devices [Karlsonet al., 2010; Leiva et al., 2012; Oulasvirta et al., 2005]. Concretely, Leiva et al.[2012] looked into the cost of mobile application interruptions on task comple-tion time at scale and “in the wild”. They found that unintended interruptionscaused by incoming phone calls can delay completion of a task by up to 4 timesin comparison to when the user was not interrupted.
Returning to the Web domain, with the ubiquitous use of tabbed browsers,keeping multiple pages open in the same browser window has become possi-ble, being an efficient alternative to switching between browser application in-stances [Gupta, 2009]. Although switch costs may be relatively small here [Mayrand Kliegl, 2000], sometimes just a few tenths of a second per switch, they canadd up to large amounts when people switch repeatedly back and forth betweentasks [APA, 2006]. What is more, often the greater the number of tabs or ap-plications open at once, the higher the user’s cognitive overload. To cope withthis issue, we propose leveraging implicit interactions to guide visual searchand therefore try to speed up the resumption of (browsing) tasks.
4.1.3 Strategies to Ease Multitasking
A clear approach to reach these goals is helping the user regain the contextof the deferred application when it is resumed. Some authors, e.g., Johnson[2010], suggested to give pertinent visual cues as a help for easing the recoveryfrom the interruption. Iqbal and Horvitz [2007] offered two directions in this

4.1. Introduction 61
regard: reminding users of unfinished tasks and assisting them in efficientlyrecalling task context. In addition, we suggest either helping the user to main-tain the context while switching to another application, or to support regainingcontext when returning to the interrupted application. In general, inspired byprevious approaches of the interruptions community, we can distinguish be-tween preventive (preparing the user for being interrupted, c.f. Trafton et al.[2003]) and curative (supporting the user after being interrupted, c.f. Iqbaland Horvitz [2007]) strategies.
Preventive: Preparation for Being Interrupted
This strategy states that, when a task interruption occurs, the user should beprepared to leave the current task. For instance, on mobile applications, whena incoming phone call occurs, the caller usually waits on the line for someseconds. Postponing the call a bit more (say, 500 ms) might provide time togive the user an auditory/visual/haptic signal that soon the phone applicationwill pop-up [Leiva et al., 2012]. This way, the user would be able to save amental state and keep in mind the recently interrupted application before heis interrupted.
In a similar vein, on desktop applications, notifications often appear at thecorner of the screen, causing the user to move the focus of attention to thenotification. Based on the previous idea, highlighting the window decorationsmight also provide the user with the possibility to take a subconscious snapshotof his most recent action before switching the current task.
Curative: Guidance for Going Back into Tasks
In this case, the user has been interrupted and as such there is no chanceto provide feedback to leave the current task. Then, when the user resumesthe previously interrupted application, she has to reallocate cognitive resources,which becomes increasingly difficult if the resource demands were high to beginwith [Iqbal and Horvitz, 2007].
Therefore, this strategy states that the user should be given some help to beable to immediately (and easily) continue with the previous task. This canbe achieved by automatically leaving a visual on-screen cue such that the usercould remember at any time to which task she is switching back. For example,the system can show the last focus of interaction, in order to guide the userto the screen position before the interruption took place (see, e.g., Figure 4.1).Alternatively, when returning to the interrupted application, the system couldreplay the last N milliseconds of UI interactions, to give a hint of what she wasdoing before the interruption.

62 Chapter 4. Human Multitasking
Figure 4.1: A usual approach foreasing attention shifts in tabbed in-terfaces (in this case, a text editor).The last edited line is automaticallymarked by highlighting the text back-ground, so when the user switchesback to the current tab she can realizefaster where she left writing.
4.2 MouseHints
Kern et al. [2010] showed that some users, in order to keep track of where theywere, tended to use the mouse cursor as a marker or to highlight the last lineof a text paragraph. A similar approach is implemented in some text editors(see Figure 4.1). We exploit this notion in web browsing to remove the need ofhaving to explicitly find a placeholder and/or actively manipulate it, withoutrequiring additional hardware or any special setting.
System Basis Only one web page and a corresponding tab representing itcan be active at the same time in a browser window. Tapping this fact, oursystem tracks in the background the mouse activity in the current tab. Uponswitching such a tab back, the system “hints” a subset of the last cursor move-ments (30 seconds by default), highlighting the last interacted element and thelast cursor position (see Figure 4.2). Then, the rendered layer fades out in 500ms (Figure 4.3).
User-System Interaction Protocol When the user selects a browser tab,a focus event is triggered and MouseHints records the position of the cursorevery time she moves the mouse. When the user switches to another tab, twobrowser events are fired sequentially: a blur event from the old tab and afocus event from the new (now current) tab. MouseHints thus stops recordingin the old tab and begins to track the activity in the current tab. When theuser switches back to a previously visited tab, mouse data are overlaid on topof the HTML content. One may note that if the user switches to a desktopapplication, only a blur event can be detected. However, when switchingback to the web browser, a focus event will be triggered, therefore enablingMouseHints again.
Implementation MouseHints was developed as a Firefox extension sincesuch browser has a powerful mechanism that made it relatively easy to code andtest. The browser interface was structured in XUL (XML UI Language). Boththe logic and tracking algorithms were both written entirely in JavaScript. Thevisualization was coded in HTML5 throughout the canvas element, supportedsince version 1.5 of that browser.

4.2. MouseHints 63
(a) Original test page.
(b) Raw trajectory (c) Digest
(d) Clustering (e) DOM history
Figure 4.2: Visualization options for displaying the same mouse track. The right-most(green) circle represents the last cursor position, while smaller (red) circles represent mouseclicks. The bounding box of the last interacted HTML element is also highlighted. [4.2a]Original page, with no overlays. [4.2b] Event-based visualization. [4.2c] Velocity-thresholdidentification. [4.2d] WKM algorithm. [4.2e] An n-best list of hovering frequency.
Visualization We decided to represent the mouse cursor trail in a reason-able fashion while unobtrusively highlighting the last interacted HTML ele-ment. We developed a generic DOM selector that translated the mouse activ-ity (e.g., hovering, clicking) into CSS selectors, so that the system could drawthe corresponding bounding box of such interacted elements. Additionally, weimplemented four different mouse path visualization options:
1. The raw mouse trail (Figure 4.2b).
2. A “digest” of the original trajectory (Figure 4.2c).
3. Clusters of mouse coordinates (Figure 4.2d).
4. A DOM-only visualization (Figure 4.2e).

64 Chapter 4. Human Multitasking
Figure 4.3: Visualization example. The overlay fades out in 500 ms, allowing for regularinteraction with the page.
4.3 Evaluation
In order to evaluate our tool, we showed the visualization options (Section 4.2)to 6 participants and let them vote which one they preferred. The optionthat most people selected was number 2, so we used it for the test. Ourhypothesis was that using MouseHints should benefit the users in terms ofvisual orientation in parallel browsing, i.e., faster task resumption and workcompletion by having the mouse interactions as a visual remainder.
Participants 36 unpaid volunteers (11 females) were recruited via email ade-vertising. They were told to participate remotely in a study that would measuretheir reaction times while browsing. All of them were regular computer usersaccustomed to using browser tabs, aged 19 to 45 (M=25.5).
Apparatus We developed two Firefox extensions: the MouseHints applica-tion and a very basic logging system with the routines of the study. Half ofthe participants were asked to install both extensions on their computer. Theother half of the users, who were not aware of the existence of MouseHints,installed the logging extension.
Design A between-subjects design was employed, with half of the subjectsperforming the tasks in only one condition (18 in the control group and 18in the experimental group, respectively). The outcome measures were tasksuccess, time for task resumption, and time for task completion.
Procedure Each user performed two tasks, which were common to bothgroups. Each task took them about 5 minutes to perform in average, as it wasdependent on each participant’s browsing capabilities. The evaluation was doneremotely, to allow subjects to browse in their own working environments. Thetasks consisted of searching information for different topics (to mitigate possiblelearning effects between tasks); e.g., “what is the minimum number of face turnsneeded to solve a Rubik’s Cube?” or “find the name of the last chapter of thebook entitled El Quijote”. Participants had to interrupt normal navigation

4.3. Evaluation 65
flow to play a popular game1 in a dedicated browser tab. Such a game, despitebeing quite straightforward, required a lot of visual attention: the user hadto click the last-born circle on each level (Figure 4.4). The conditions werebrowsing in a normal environment (control), and with the help of MouseHints(experimental).
(a) Level 12
→
(b) Transition
→
(c) Level 13
Figure 4.4: While browsing, participants were eventually interrupted to play a game.
To measure how visual attention differed between both groups, at least twotabs had to be opened: one with the game and other with a regular web page.After a random delay between 20 to 40 seconds, the browser changed the focusof navigation from the current tab to the game tab, and users had to resumeplaying. After another delay, the browser changed the focus to another tab,which was randomly chosen from all opened tabs, to stress the users’ cognitiveload during the test. We measured the time for task resumption (first time tomove the mouse inside the page) and time for task completion (total browsingtime) for all opened tabs. Users were told to close their browser when a taskgoal was achieved—this allowed us to easily post-process their data.
In both conditions data were saved as timestamped event sequences in the localfile system. In order to preserve the user’s privacy, URLs were converted toMD5 hashes and data were stored in plain text format. This way, participantscould verify that their data were sufficiently anonymized, and could also reviewwhat kind of information the extension was gathering. Then they were askedto submit the log files via email.
4.3.1 Results
We report measures on the three areas suggested by the ISO 9241-11 standard:effectiveness (completion rates and errors), efficiency (time on task resumptionand completion), and satisfaction (subjective opinions on using the system).
Study on Effectiveness
We used a Pearson’s chi-square test for this study. The nominal outcomes weretask success/failure, measured by assigning 1 point each time the goal wasachieved (based on the manual revision of user comments that were submitted
1http://tubegame.com/camera_mind.html

66 Chapter 4. Human Multitasking
Control Exp.
500
1,500
2,500
Mean task resumption (ms)
Control Exp.
2
4
6
Mean task completion (min)
Figure 4.5: Between-groups efficiency comparison. Error bars denote 95% confidenceintervals.
Study Condition M SD Mdn Min Max
Resumption (ms)Control 2248.31 1778.89 2363 720 6566Experimental 788.11 371.42 791.5 345 1647
Completion (min)Control 5.77 3.55 6.8 1.34 14.63Experimental 3.23 2.39 3.9 0.74 8.37
Table 4.1: Summary of efficiency results in both conditions.
by email). All participants excepting one user from the control group wereable to finish the assigned tasks, concluding that there were no statisticallysignificant differences in effectiveness between both groups (χ2
(1,N=36) = 1.09,
p = .29, two-tailed). This result was not surprising. In fact, MouseHints is justan interaction assistant and, as expected, the user’s success did not stronglydepend on using this system for achieving their goals.
Study on Efficiency
In this case we used a Kolmogorov-Smirnov test, since normality assumptionsdid not hold. The continuous outcomes were time for task resumption andtime for task completion. We used the median as central tendency measurefor reducing the influence of outliers. As predicted, participants were found tobe considerably faster in task resumption with MouseHints (Mdn = 791.5 ms)than without (Mdn = 2363 ms), D = 0.72, p < .001, two-sided hypothesis. Weachieved similar conclusions regarding task completion (Mdn = 3.9 minuteswith MouseHints; Mdn = 6.8 minutes without), D = 0.5, p < .05, two-sidedhypothesis.

4.4. Discussion 67
Study on Satisfaction
Participants from the experimental group submitted an online System UsabilityScale (SUS) questionnaire [Brooke, 1996] after finishing the study. A Likertscale, from 1 (strongly disagree) to 5 (totally agree), was used to rank tenquestions. SUS reported a composite measure of the overall usability of thesystem. The result was a score of 87.6, indicating that people indeed likedusing MouseHints. (SUS scores range between 0 and 100).
The form attached to the online questionnaire allowed users to submit freecomments and ideas. A frequently reported comment among participants inthe experimental group was that MouseHints was considered helpful. Moreover,participants often mentioned the advantage of saving time and easing taskresumption (12 users out of 18). Eight people liked the aid to memory of nothaving to remember what they previously did with the mouse in a page.
4.4 Discussion
Spink et al. [2004] raised the research question “how might multitasking besupported by web systems and interfaces?”. MouseHints is an attempt to do so,although many other implications derived from (possible) further developmentare envisioned in this section.
Implications for Web Browsers MouseHints uses browser events to de-tect task switching and also track user interactions. However, our client-sideimplementation could provide the user with additional analysis features. Con-sequently, the browser could work as a personal organizer, prioritizing andreordering tabs according to browsing usage. What is more, rather than onlydealing with explicit behavior information such as user history, web browserscould combine implicit interaction information of cursor data to suggest, e.g.,already visited URLs when typing in the address bar.
Implications for Search Engines and Websites MouseHints could alsohave a number of implications for search engine design, in particular for infer-ring user interest. Our approach is a standalone client-side (offline) solution.We argue however that, by enabling some kind of server-side communication,cursor data could be sent for further analysis. In a public setting, the aggrega-tion of other people’s interactions may provide a valuable asset. Consequently,we could deploy large-scale studies about (contextualized) user behavior re-motely, i.e., where the user is not physically present.
Furthermore, websites could also benefit from a rich understanding about theirusers. To date most theories on browsing behavior are based solely on thestudy of patterns from server’s access logs [Leiva and Vidal, 2010]. However,the context of actions is a key issue for describing the surrounding facts that

68 Chapter 4. Human Multitasking
add meaning to Web usage. Thus, combined with some analytic tools, webelieve that MouseHints could contribute to achieve this goal.
Implications for User Interfaces Humans have remarkable perceptualabilities that are greatly underutilized in most current interface designs. Userscan scan, recognize, and recall images rapidly, and can detect subtle changesin size, color, shape, movement, or texture [Schneiderman and Plaisant, 2005].The visual elements together with the faded animations used in MouseHintsserve as bottom-up stimuli that effectively capture user attention, improvingreaction times and motor responses. So, these concepts can be applied to abroad range of UIs that could benefit from a user interaction model. For in-stance, it would be possible to implement a MouseHints-like agent in a tabbedapplication or even in the window manager of the operating system. We believethat incorporating related visual cues in traditional UIs should help the userwhile multitasking.
Implications for Electronic Devices MouseHints could also be used onmobile phones or tablets, e.g., in situations where the user should halt anapplication because of a phone call or a push notification. Additionally, in ahigher level, one could implement our event detection method (Section 4.2)using accelerometer data, providing thus intelligent monitoring capabilities.For instance, it would allow mobile users to resume a game after leaving thedevice over a table because of an interruption.
Other Application Fields We believe this work is just a small thoughsignificant sample of the wide possibilities of tracking implicit interaction toease task switching. Some related applications that could be implementedbased on this technology include performance evaluation (e.g., compare motorskills or pointing abilities within a UI), user modeling (e.g., extract interactionfeatures from the raw data and characterize user profiles), or self-adapting UIs(e.g., employ interaction data for rearranging layout elements based on eachuser’s needs), among others.
Limitations First of all, participants performed tasks in an uncontrolledenvironment and without experimenter supervision. That could explain thevariability in the gathered data (see Table 4.1), maybe due to potential outsidedistractions, or also because some tabs could not be relevant to the assignedtask. Second, our approach is not suitable for the user that does not usethe mouse (or a similar pointing device) at all while browsing the Web. Inaddition, there are situations where the eye and the mouse are not in sync; andwe believe that our approach may not be much useful if such behavior happensfrequently. Clearly, users who move the pointing device according to theirfocus of attention may be the most benefited target from MouseHints. Third,gathered data comprised about ten minutes of task execution data for eachuser. It would be interesting nevertheless to evaluate the effects of MouseHintsin a large-scale study, where users will probably be more accustomed to the

4.5. Conclusions and Future Work 69
system. Finally, users can assist web browsing by using more advanced I/Odevices such as speech recognizers or eye trackers. Therefore, we encourageMouseHints to be used in combination with such systems, since we believethey all are complementary.
4.5 Conclusions and Future Work
We have presented MouseHints, a tool that aims to minimize the negativeeffects of interruptions while browsing, by providing adaptive memory cuesabout previous interactions and thus easing task resumption. MouseHints usesa combination of very basic infographics to draw user attention to the locationof previously interacted areas on screen.
This chapter has described both the basic ideas behind our motivation as wellas an implementation of this approach. Experimental results show that Mouse-Hints is a promising technique for guiding visual search on complex interfaces.We believe the concept behind MouseHints may be used in different contextsthat require multitasking and task switching, such as interacting with tradi-tional (windowed or tabbed) desktop applications and even with mobile de-vices or electronic products. Our system may also be useful for visually com-plex tasks, such as scanning a busy display or navigating infographics in largescreens.
Regarding the visualization of mouse trajectories, new strategies are beingdevised; concretely a hybrid method that incorporates clustering plus DOMhistory. This will be definitely a focus of future work.
Finally, MouseHints is by no means a supplement to any other methods to sup-port multitasking, but rather an encouraging complementary tool. We believethat other sources based on implicit interaction should be taken into account,such as eye-gaze data or head movements. This topic, as well as exploring novelapplications of MouseHints, will be considered for further research.
Bibliography of Chapter 4
E. Adar, J. Teevan, and S. T. Dumais. Resonance on the web: Web dynamics and revisi-tation patterns. In Proceedings of the 27th international conference on Human factors incomputing systems (CHI), pp. 1381–1390, 2009.
APA. Multitasking - switching costs. Available at http://www.apa.org/research/action/
multitask.aspx, 2006. Retrieved August 1, 2010.
M. Ashdown, K. Oka, and Y. Sato. Combining head tracking and mouse input for aGUI on multiple monitors. In Proceedings of extended abstracts on Human factors incomputing systems (CHI EA), pp. 1188–1191, 2005.
J. Brooke. SUS: A “quick and dirty” usability scale. In P. Jordan, B. Thomas, B. Weerd-
meester, and A. McClelland, editors, Usability Evaluation in Industry. Taylor andFrancis, 1996.

70 Bibliography of Chapter 4
M. D. Byrne, B. E. John, N. S. Wehrle, and D. C. Crow. The tangled web we wove: Ataskonomy of WWW use. In Proceedings of the SIGCHI conference on Human factors incomputing systems (CHI), pp. 544–551, 1999.
E. B. Cutrell, M. Czerwinski, and E. Horvitz. Effects of instant messaging interruptionson computing tasks. In Proceedings of extended abstracts on Human factors in computingsystems (CHI EA), pp. 99–100, 2000.
P. Dubroy and R. Balakrishnan. A study of tabbed browsing among mozilla firefoxusers. In Proceedings of the 28th international conference on Human factors in computingsystems (CHI), pp. 673–682, 2010.
D. Fong. Enhancing multitasking to enhance our minds. Available at http://daniellefong.com/2008/08/24/enhancing-multitasking-to-enhance-our-minds/, 2008. Retrieved Au-gust 1, 2010.
A. Gupta. Shiftbrowse: Context switch. Available at http://lcc.gatech.edu/%7Eagupta31/shiftbrowse/?p=33, 2009. Retrieved August 1, 2010.
C. M. Hansen. Allocation of attention in dual pursuit tracking. PhD thesis, StanfordUniversity, 1991.
H. A. Hembrooke and G. K. Gay. The laptop and the lecture: The effects of multitaskingin learning environments. Journal of Computing in Higher Education, 15(1):46–64, 2003.
J. Huang and R. W. White. Parallel browsing behavior on the web. In Proceedings of the21st ACM conference on Hypertext and hypermedia (HT), pp. 13–18, 2010.
K. Humm. Improving task switching interfaces. Tech. Report COSC460, University of Can-terbury, 2007.
S. T. Iqbal and B. P. Bailey. Understanding and developing models for detecting and dif-ferentiating breakpoints during interactive tasks. In Proceedings of the SIGCHI conferenceon Human factors in computing systems (CHI), pp. 697–706, 2007.
S. T. Iqbal and E. Horvitz. Disruption and recovery of computing tasks: field study,analysis, and directions. In Proceedings of the SIGCHI conference on Human factors incomputing systems (CHI), pp. 677–686, 2007.
M. E. Janzen and K. J. Vicente. Attention allocation within the abstraction hierarchy.International Journal of Human-Computer Studies, 48(4):521–545, 1998.
J. Johnson. Designing with the mind in mind. Morgan Kaufman, 2010.
D. Kahneman. Attention and Effort. Englewoods Cliffs, Prentice Hall, 1973.
A. K. Karlson, S. T. Iqbal, B. Meyers, G. Ramos, K. Lee, and J. C. Tang. Mobiletaskflow in context: A screenshot study of smartphone usage. In Proceedings of theSIGCHI conference on Human factors in computing systems (CHI), pp. 2009–2018, 2010.
D. Kern, P. Marshall, and A. Schmidt. Gazemarks: Gaze-based visual placeholders toease attention switching. In Proceedings of the 28th international conference on Humanfactors in computing systems (CHI), pp. 484–489, 2010.
C. Konig, M. Buhner, and G. Murling. Working memory, fluid intelligence, and attentionare predictors of multitasking performance, but polychronicity and extraversion are not.Human Performance, 18(3):234–266, 2005.
L. A. Leiva and E. Vidal. Assessing user’s interactions for clustering web documents:a pragmatic approach. In Proceedings of the 21st ACM conference on Hypertext andhypermedia (HT), pp. 277–278, 2010.

Bibliography of Chapter 4 71
L. A. Leiva, M. Bohmer, S. Gehring, and A. Kruger. Back to the app: The costs ofmobile application interruptions. In Proceedings of the 14th International Conference onHuman-Computer Interaction with Mobile Devices and Services (MobileHCI), pp. 291–294, 2012.
R. Ma and D. B. Kaber. Presence, workload and performance effects of synthetic environ-ment design factors. International Journal of Human-Computer Studies, 64(6):541–552,2006.
G. Mark, V. M. Gonzalez, and J. Harris. No task left behind? examining the natureof fragmented work. In Proceedings of the SIGCHI conference on Human factors incomputing systems (CHI), pp. 321–330, 2005.
U. Mayr and R. Kliegl. Task-set switching and long-term memory retrieval. Journal ofExperimental Psychology, 26(5):1124–1140, 2000.
D. C. McFarlane. Coordinating the interruption of people in human-computer interaction.In Proceedings of the IFIP Conference on Human-Computer Interaction (INTERACT),pp. 295–303, 1999.
A. Oulasvirta. Task-processing demands and memory in web interaction: A levels-of-processing approach. Interacting with Computers, 16(2):217–241, 2004.
A. Oulasvirta, S. Tamminen, V. Roto, and J. Kuorelahti. Interaction in 4-secondbursts: the fragmented nature of attentional resources in mobile HCI. In Proceedingsof the SIGCHI conference on Human factors in computing systems (CHI), pp. 919–928,2005.
J. S. Rubinstein, D. E. Meyer, and J. E. Evans. Executive control of cognitive processesin task switching. Journal of Experimental Psychology, 27(4):763–797, 2001.
B. Schneiderman and C. Plaisant. Designing the User Interface: Strategies for EffectiveHuman-Computer Interaction. Addison-Wesley, 4th edition, 2005.
R. Schweickert and G. J. Boggs. Models of central capacity and concurrency. Journal ofMathematical Psychology, 28(3):223–281, 1984.
A. Spink, M. Park, B. J. Jansen, and J. Pedersen. Multitasking during web searchsessions. Information Processing and Management: an International Journal, 42(1):264–275, 2004.
J. G. Trafton, E. M. Altmann, D. P. Brock, and F. E. Mintz. Preparing to resume aninterrupted task: effects of prospective goal encoding and retrospective rehearsal. Inter-national Journal of Human-Computer Studies, 58(5):583–603, 2003.
M. Viermetz, C. Stolz, V. Gedov, and M. Skubacz. Relevance and impact of tabbedbrowsing behavior on web usage mining. In Proceedings of the 2006 IEEE/WIC/ACMInternational Conference on Web Intelligence (WI), pp. 262–269, 2006.


Chapter 5
Adaptive User Interfaces
In computing systems, technology alone cannot survive without adequate userinterfaces. To maximize the benefits that usable interfaces bring to users, oftendevelopers try to target as many people as possible. However, attempting tocreate UIs by following the one-size-fits-all approach is doomed to fail if an ap-plication is intended to be exposed to an arbitrary audience—take for instanceweb pages or mobile applications. Therefore, we must look for automatedsolutions.
This chapter proposes a novel approach to automatic UI adaptation that lever-ages implicit interactions to weight the importance of the information suppliedwith estimated priorities in user activity. This way, by analyzing informationthat is submitted with little or no awareness (e.g., mouse movements, clicks,keystrokes), elements where users focus their interaction are incrementally mu-tated. While this is still a work in progress, preliminary results indicate thatthis method has an interesting potential to build self-adaptive UIs.
Chapter Outline5.1 Introduction 74
5.2 Related Work 75
5.3 ACE: An Adaptive CSS Engine 76
5.4 Fostering Creativity 81
5.5 Evaluation 83
5.6 Discussion 84
5.7 Conclusions and Future Work 86
Bibliography of Chapter 5 87
73

74 Chapter 5. Adaptive User Interfaces
5.1 Introduction
In computing systems, technology alone cannot survive without adequate userinterfaces. Personalization and customization have been widely promoted byUI design theories but seldom few of them are put into practice. The vast ma-jority of UIs are visually-oriented and assume that users do not have functionalimpairments of special requirements. Caveats, standards, and best practiceshave evolved on where to place layout widgets, navigation items, and body con-tent. As such, to maximize the benefits that usable interfaces bring to users,often developers try to target as many people as possible. However, attempt-ing to create UIs by following the one-size-fits-all approach is doomed to failif an application is intended to be exposed to an arbitrary audience. Take forinstance web pages or mobile applications, where, in addition, the range ofscreen sizes and the rendering possibilities are exceedingly large.
UI adaptation is about exploiting some features of the application and avoid-ing others. For instance, the mobile space has an incommensurable range ofdevices, and content often renders better when tailored to specific device char-acteristics. Another part of adaptation requires working around problems foundin specific parts of the UI; e.g., elements that may cause confusion or frustrationto first-time users and so on. A more drastic option is to build a separate UIfor each user, but a manual approach is impractical and definitely not scalable.Also, continuously performing usability tests to assess new changes committedon the application is very time-consuming. Therefore, we must seek automatedadaptation solutions.
Traditionally, UI adaptation techniques can personalize the layout presentation(e.g., modifying font sizes or applying some accessibility guidelines), but un-fortunately the changes they perform operate from a global perspective. Someproposals that involve active end user manipulation have been considered; e.g.,[Bolin et al., 2005]. Nonetheless, user-driven customization requires to performadditional activities beyond the main purpose of using the application. Someresearchers [Arroyo et al., 2006; Atterer et al., 2006; Claypool et al., 2001] havedemonstrated that every user interaction can contribute to enhance the utilityof the system, therefore alternative adaptation approaches without burdeningthe user can be derived. What is more, as stated by Gajos and Weld [2004], therendering of an interface should reflect the needs and usage patterns of theirusers. This work is inspired by these ideas.
We propose a novel approach that is based on implicit HCI to weight the im-portance of the information supplied with estimated priorities in user activity.This way, by leveraging information that is submitted with little or no aware-ness (e.g., mouse movements, clicks, keystrokes), elements (widgets from hereonwards) where users focus their interaction are incrementally mutated. Specif-ically, due to the fact that exertions are preceded by attention most of the time(see Section 1.1.1), the importance of an interaction toward a specific widget

5.2. Related Work 75
is measured as the proportion of UI-generated events on that widget betweenconsecutive sessions, as described in Section 5.3.
5.2 Related Work
The idea of adapting the UI of applications or even full websites according touser interactions is not new (see, e.g., [Zhang, 2007]). However, practical exam-ples have been too scarce so far. Despite considerable debate, automatic adap-tation of UIs remains a contentious area [Gajos et al., 2008]. Commonly citedissues with adaptive interfaces include lack of control, predictability, trans-parency, privacy, and trust [Findlater and McGrenere, 2008].
It is commonly agreed that adaptive systems should accommodate the UI tothe user, but also that doing so automatically is a non-trivial problem. Webelieve that adaptation should be both transparent and discreet, so that thechanges introduced to the UI do not confuse the user. We also believe thatadaptation should not interfere with the internal structure of the application.
Probably the major advances in the field of automatic adaptation of UIs arethe ones carried out by Gajos and co-authors [Gajos and Weld, 2004; Gajoset al., 2007, 2008], where adaptation is approached as an optimization problem.However, their experiments were performed on form-based layouts, by modelingwidget constraints, and choosing the best alternatives from a defined set ofUI elements (e.g., sliders, combo boxes, radio buttons, etc.). Other types ofapplications such as web pages are nevertheless a completely different matter.Their dynamic nature per se makes the automatic adaptation a challengingtask.
On the Web, with the exception of customizing font preferences, browsers donot provide end users with substantial control over how web pages are rendered.This way, researchers have proposed different approaches to layout adaptationthat mainly involve user’s manual work. Ivory and Hearst [2002] employedlearned statistical profiles of award-winning websites to suggest improvementsto existing designs; however, changes would be manually implemented. Tsandi-las and Schraefel [2003] introduced an adaptive link annotation technique, al-though it required the user to perform direct manipulation of a middlewareapplication. Notable approaches in this direction include the work of Bilaet al. [2007], where the user must actively modify the layout contents. Kurni-awan et al. [2006] proposed to override the visual tier of a web page with customstyle sheets, but unfortunately updates had to be performed by hand. Now thatweb standards have minimized browser inconsistencies, this approach can beautomatically exploited to automate the adaptation of web design (and otherapplications, as discussed later) without disrupting users’ interaction habits.

76 Chapter 5. Adaptive User Interfaces
(a) Original page (b) Automatically adapted design
Figure 5.1: An example of website design modifications. Changed parts are numbered inFigure 5.1b. ❶ headline text: font-size, padding-top; ❷ navigation menu: font-size; ❸
welcome paragraphs: font-size; ❹ ‘read more’ links: color; ❺ ‘online booking’ heading:color; ❻ submit button: font-weight; and ❼ ‘special menu’ div: margin-top.
5.3 ACE: An Adaptive CSS Engine
Our approach, being based on implicit interaction, allows to gather much usagedata without burdening the user. On the other hand, though, collected dataare potentially noisy and prone to some errors if not treated adequately. Forthat reason, the novelty of this approach is two-fold: 1) to let the webmasterdecide which elements are going to be adapted; and 2) to automatically applyslight modifications to the rendering of UI elements based on how the user hasinteracted with them. This way, the system will try to invisibly improve theuser-perceived performance toward a UI (Figure 5.1).
The main difference with other state-of-the-art interface adaptation techniquesis ours relies on the developer (or webmaster) control to accommodate theappearance of the UI (or page) to the users in a transparent way. This way,our approach aims to focus rather than distract the user.
5.3.1 Rationale
With the growing popularity of web-based applications, the Cascading StyleSheets (CSS) paradigm has been widely adopted by several programming envi-ronments beyond the browser. For instance, it is possible to use CSS in Java1,GTK+2, and Qt3. CSS allows attaching styles to the application, decoupling
1http://weblogs.java.net/blog/2008/07/17/introducing-java-css2http://gnomejournal.org/article/107/styling-gtk-with-css3http://doc.qt.nokia.com/4.3/stylesheet.html

5.3. ACE: An Adaptive CSS Engine 77
the data model and its presentation. This motivated us to develop ACE, anAdaptive CSS Engine in which adaptation operates by automatically overridingthe rendering of widgets, by simply modifying their CSS. The technique wasfirst introduced by Leiva [2011], and has been now reformulated to generalizeto structured applications (e.g., document object models and scene graphs).
5.3.2 Overview
ACE leverages implicit interactions to incrementally mutate the appearance ofinteracted widgets (e.g., DOM elements). The importance of an interactiontoward a specific widget is measured as the proportion of UI-generated eventson that widget between consecutive sessions. Implicit interaction is used thusas a proxy of user attention. The idea is to introduce ephemeral changes thatcan be easily incorporated and do not alter the UI design in a way that it mightconfuse the user [Leiva, 2011, 2012a].
ACE
elems evts
app
CSS
Developer User
XPath
Figure 5.2: Workflow diagram. ACE tracks elements indicated by the developer. Whenthe user access an application, UI events translate interacted elements into XPath notation(or a similar representation) for later storing. On returning to the application, the CSSproperties of such stored elements are restyled accorded to computed scores.
ACE was written as a completely self-contained JavaScript (JS) program thatrestyles numerical CSS properties, i.e., those related to:
• Dimensions (e.g., font-size, margin-top). These properties often dohave a unit of measure, e.g., 16px, 2.5em, or 20%, which is preserved oncethey are adapted.
• Colors (e.g., background-color, border-color). These properties dohave an hexadecimal representation,which is specified either by a key-word (e.g., "red") or by a numerical RGB specification (e.g., #RRGGBB orrgb(R,G,B)).
The main features of ACE are summarized in the following list:
• Does not require end user intervention.
• Supports desktop, touch, and mobile web clients.

78 Chapter 5. Adaptive User Interfaces
(a)
ACE.adapt("div a": ["font-size", "color"], ➊
"p ul" : ["font-weight, "margin"]);
➊
➊
DIV
STRONGLILI
H1 ULHR EM
P
INPUT INPUT
DIVIMG
A AAAA
PP LI LILI
UL
BODY
DIV DIV
DIV
(b) pattern: E F
ACE.adapt("div + a": ["font-size", "color"],"p + ul" : ["font-weight, "margin"] ➋
);
A AA
LI LILI
UL
BODY
DIV
➋DIV
A STRONGA LILI
H1 PP ULHR EM
P
DIV
DIV
INPUT INPUT
DIVIMG
(c) pattern: E + F
Figure 5.3: Original page design (5.3a) with an overlaid mouse behavior that may causedifferent adaptation possibilities, according to the following CSS combinator patterns:[5.3b] F elements that are descendants of E elements; [5.3c] F elements immediately pre-ceded by E elements; Top row : Sample JSON syntax. Middle: Corresponding pagechanges. Bottom row : DOM tree traversals, highlighting in bold the matched paths. Anycombination of CSS selectors is supported, e.g., "div + p.foo > span a:first-child".
• Any combination of CSS selectors can be used.
• Modifications are incrementally applied, ensuring that they are not in-trusive for the user.
• Adaptation can be performed once the DOM is parsed or the applicationis fully loaded, so that third party or JS-controlled modifications are also

5.3. ACE: An Adaptive CSS Engine 79
supported.
• Since the system has a user interaction history, it can populate adaptationto other widgets that share a similar structure.
5.3.3 Adaptation Protocol
Initially, the developer indicates which widgets and which properties can berestyled by the system, by means of straightforward JSON notation (see samplecode snippets in Figure 5.3). Later, when the application is loaded, eventlisteners will track such widgets in the background. While using the application,the system “learns” from user interactions, so that the next time the applicationis loaded, the visual appearance of the widgets the user has interacted most withis subtly modified. Finally, when the user leaves the application, interactiondata are serialized and stored into a local database. Figure 5.4 summarizes thearchitecture of this framework.
USER INTERFACE
JSON parser
event observer database
serializerwidget
CSS engine
interactionswidgetsApplication
Figure 5.4: System architecture. Adaptable widgets are indicated by the developer,which will be modified according to how users interact with the application.
5.3.4 Implementation
A very simple API was designed to invoke the system. ACE exposes two publicmethods: listen() and adapt(). The former allows the developer to prioritizethe importance of UI events (e.g., Should a mousemove event be assigned lowerpriority over a click event?). The latter takes two arguments (Figure 5.5): aconfiguration object and a context (the whole application by default).
Under the hood, the elements that were specified in the configuration objectas CSS selectors are retrieved by means of the querySelectorAll() methodor a similar alternative (depending on the programming language). Interactiondata are then classified into different event lists, e.g., hovered, typed, scrolled,or tapped elements; where each list member is composed of a serialized widgetrepresentation as a key (to allow retrieving them later on subsequent user visits,see bottom rows of Figure 5.3) and an interaction score as a value. The scoring

80 Chapter 5. Adaptive User Interfaces
interface ACE
void listen(Object eventList , Boolean keepOtherPriorities );
void adapt(Object config , Object context );
Figure 5.5: ACE’s API definition in Interface Description Language (IDL).
−1 1
ϑ ∝ ∆t
w
hoveringclicking
Figure 5.6: Weighting interactions ex-ample. Hovering is weighted according tow = tanh(λϑ), while clicking is weightedas w = sinh(λϑ). The parameter λ al-lows to tune the slope of both curves.
scheme is described in the next section. Basically, a score is proportional tothe number of browser-generated events, or, in other words, how many timesthe user has interacted with UI elements.
Finally, data are persistently stored on the client side by means of an abstrac-tion layer of different storage backends (e.g., localStorage, IndexedDB, orequivalents), so that the users’ privacy is completely under their control; e.g.,they may opt to configure their application or browser to restrict access to thestorage context, or automatically delete stored data after some time.
5.3.5 Interaction Scoring Scheme
As commented above, each interacted element is assigned a score s, whichdepends on the event type. For instance, mousemove events are triggered inmuch more quantity than mousedown or keyup events, and as such they shouldbe weighted accordingly. Let ni be the number of times an event of type i wasfired for a certain widget, and let N be the number of all fired events duringapplication usage. The assigned score for that event is
si = ζ(ni/N) (5.1)
where ζ(·) is a symmetric sigmoid function. The idea is to get scores follow anon-linear distribution, in order to ensure that adaptation is smoothly applied.
Note that if an element receives different types of interactions (e.g., an input
text field can listen to click, focus, or keydown events) then its scores needto be fused in order to compute a single value. ACE uses the weighted mean

5.4. Fostering Creativity 81
as a fusion scoring method:
s =
m∑
i=1
wisi with∑
wi = 1 (5.2)
where m is the number of computed scores for that element.
The value v of a CSS property is then modified based on the following stylefunction:
v = v(1 + s) (5.3)
On subsequent access to the UI, the new scores s′i and how they will affect theCSS properties are both updated as follows:
s′i = ζ(n′i/N)− si
v′ = v(1 + s′) (5.4)
According to equations (5.3) and (5.4), when a user loads an application forthe first time, elements are rendered as they were designed, as the system hasno information about previous interactions (si = 0 ∀i). Then, when returningto the application the system will react accordingly, i.e., modifying the valueof those CSS properties specified by the webmaster based on the amount ofuser’s interactions.
Given that scores are bounded to the interval (−1, 1), a score of, say, 0.05 for amargin-top property will be interpreted as “increasing by 5% the value of thetop margin.” Conversely, a score of −0.1 for a color property will be inter-preted as “decreasing by 10% (the contrast or saturation of) the font color.”This way, it is not possible to alter the visual properties significantly, sinceadaptations are incrementally applied. Event lists are the only user informa-tion stored in the local database.
5.4 Fostering Creativity
ACE also introduces an interesting framework to find inspirational examplesfor redesigning UIs. Typically, the primary purpose of prototyping tools isto provide feedback to define a design earlier, when there is inadequate infor-mation to choose one solution over another. However, once the design of anapplication or website leaves the testing phase and moves to production, ithardly ever gets substantially modified. Rather, it follows a cycle of subtle it-erative improvements. At this stage, surprisingly, few methods seldom supportincrementally revisiting different versions of the same solution.
In this line, some work has been done in generating design alternatives toassist the user in the design process, i.e., to get the “right design”, for instance,

82 Chapter 5. Adaptive User Interfaces
(a)(b)
Figure 5.7: Some redesign considerations. [5.7a] Widening the central column of a webpage allows the browser to display more information at a glance. [5.7b] Some parts of theUI can be altered according to its importance; e.g., changing the font sizes and colors ofheadings and text paragraphs.
Design Gallery [Marks et al., 1997], Side Views [Terry and Mynatt, 2002], orAdaptive Ideas [Lee et al., 2010]. However, there is little research toward toolsthat allow designers to explore design refinements, i.e., to get the “design right”.Traditionally, current techniques to suggest improvements to an existing designimply a manual implementation (see Section 5.2). What would be interesting,though, is being able to automate the process to a greater or a lesser extent. Inthis regard, Masson et al. [2010] proposed using interactive genetic algorithmsto add permutations to an existing design. The downside of this approachis that it relies on a user-task model and therefore it must be learned. Incontrast, we propose to use ACE, which is model-free, and lets all users takepart in the design process. However, instead of adapting a UI to an individual,the interactions of all users can be exploited to alter the design of an applicationor a whole website. Among other benefits, this may allow designers to:
1. Avoid having to recruit users for testing each time the application isupdated: what you see is what users do.
2. Discover visually what behavioral patterns are consensus.
3. Find inspirational examples, by looking at how the appearance of the UIgets modified over time.
If subtle design modifications are needed to refine an existing layout—as it oftenhappens when iterating over a design solution—then implicit user interactioncan be valuable to this end [Leiva, 2012b]. For instance, on websites, if allusers spend most of their browsing time on the home page ‘above the fold’, thedesigner could consider make wider the main body content, so that some partscould be accessed faster (Figure 5.7a). Similarly, if there is some paragraphthat is commonly selected, if would be interesting to make such text moreprominent, probably by increasing the font size or the color contrast, so thatin subsequent visits users could realize easily where is the popular information(Figure 5.7b).
We believe therefore that ACE can exploit the collective users’ behavior as aninspirational source for UI redesign. Implicit interactions can be gathered atscale on a daily basis, and without burdening the user. What is more, on the

5.5. Evaluation 83
Web, independent feedback is received from hundreds or thousands of remoteanonymous users rather than being produced and interpreted in a small groupor individuals working in isolation. This may help to achieve (hopefully) betterdesign decisions, since it is possible to empirically validate how users react toa particular design update; e.g., by carrying out A/B tests. Additionally, thishas the notable advantage that data acquisition and later processing can beboth completely automated.
5.5 Evaluation
In terms of system performance, ACE takes a few milliseconds to completethe adaptation process. A series of JavaScript benchmarks were performed onthe sample page shown in Figure 5.3 with different configuration objects andCSS properties. The machine was an i686 @ 2 GHz with 1 GB of RAM. Theadaptation code was executed 100 times and benchmark results were averaged.Concretely, for 10 items (that were specified by different CSS level 3 selectors4)having at most 5 properties each, in all tested browsers (Firefox 7, Chrome 15,Opera 11, Internet Explorer 9, and Dolphin 2.2) the average times were below20 ms, with standard deviations below 0.1 in all cases.
Regarding human evaluation, devising the most suitable evaluation methodis still not completely clear. As a preliminary approximation, an informalstudy involving 12 users was carried out, in which participants where told tofreely browse a mockup site (Figure 5.1) with the ACE system on an HTCDesire [Leiva, 2011]. At the end of the test, users answered three questions(see Figure 5.8); Q1: Do you think page elements are well laid out? Q2: Didyou notice any change on the page, regarding the first time you visited it?Q3: If so, did you find distracting those changes?
No
Yes
Q1 Q2 Q3
11/12 9/12 12/12
Figure 5.8: Results of the informal user questionnaire.
Overall, users’ acceptability toward the method was perceived as positive. Asobserved, nine of them did not notice the automatic modifications, and nonefound distracting those changes while browsing. The informal pilot study,although being not conclusive, revealed that this adaptation technique has aninteresting potential in building adaptive user interfaces.
4http://www.w3.org/TR/css3-selectors/

84 Chapter 5. Adaptive User Interfaces
Regarding using ACE as a source of creative redesign, previous informal meet-ings with web designers have shown that this tool is perceived as a usefulhelp [Leiva, 2012b]. People commented that they often want to determine howchanges to a few page elements will affect the final appearance of the website.ACE satisfies this need, by letting them to inspect how user behavior wouldinfluence CSS rendering. Moreover, automatic redesign frees the web designerfrom the need to know what changes are possible, or how they can be effec-tively performed. Also, design refinements can offer pragmatic value as wellas inspirational value. Figure 5.9 depicts some examples that this tool canproduce.
5.6 Discussion
Automatically mining implicit interactions for UI adaptation and redesign isa promising direction for future research. However, some work still remains tobe done.
First of all, we feel that evaluating this kind of adaptation strategy is quitechallenging, since no objective metrics can be consistently computed; e.g., inthe absence of labeled samples, we cannot apply well-known measures such asprecision and recall; and having to interrupt the normal navigation flow of usersto ask them to vote is certainly not an option. We strongly believe, though,that implicit interactions inherently encode performance. Thus, if an adapteddesign works better than a previous iteration, it should be reflected somehow inthe traces of movements, gestures, etc. Nevertheless, one needs to be cautiouswith this hypothesis, since learnability and familiarity with the UI could beintroducing a serious bias. Therefore, an immediate follow-up work will consistin carrying out a formal in-lab evaluation study.
On the other hand, since content is automatically generated, it is likely to beof less quality than human-generated content. Thus, we believe that it wouldbe interesting to assess the influence of such variations in layout design, oruse different evaluation viewpoints; e.g., measure the reduction of user effort,compare to other adaptive systems, etc.
ACE has some implications for participatory design as well, since it aims tocreate applications that are more appropriate to their users. As previouslycommented, this frees the UI designer from the need to know what changesare possible; but more importantly, it helps to determine how such changescan be effectively performed. Also, system suggestions are expected to offerpragmatic value as well as inspirational value to the designer. ACE also cancontribute to find “interaction agreements” between all users, which may beuseful to detect whether if a design works as expected; e.g., how designs changethrough time according to the heterogeneous behavior of the users. Addition-ally, non-experienced designers can gain insights about what is going on with

5.6. Discussion 85
(a)Originaldesign
(b)Movem
ents
+Click
s(c
)Red
esignsu
ggestion#1
(d)Red
esignsu
ggestion#2
Figure5.9:Red
esignex
amplesproducedbyACE,takinginto
accountmultiple
interactionlogsandoverridingafew
CSSru
les.

86 Chapter 5. Adaptive User Interfaces
their designs, from the user interactions’ point of view. This suggests implica-tions for design practices from which the HCI community may well be able tobenefit. Finally, collected data can be reused to support design decision mak-ing, or to improve understanding of how users interact at scale. Data can alsobe used for complementary analytics in traditional usability tests, or appliedto infer new knowledge for future users.
A known limitation of ACE is that currently it can adapt only those propertiesthat vary in a numerical range; e.g., max-height or padding. However, in afuture it is expected to be able to map semantic properties. For instance, toadapt the text-align property of a text paragraph one could use:
v =
"left" if s ∈ (−1,−0.5]
"center" if s ∈ (−0.5, 0.5)
"right" if s ∈ [0.5, 1)
Finally, redesign decisions are (by now) based on modifications of shape, posi-tion, and/or color attributes. Therefore, more advanced adaptation strategiessuch as re-arranging several page elements (beyond alignment) or inserting/re-moving content would require a technically more sophisticated approach.
All in all, this technology enables a straightforward means to invisibly enhancethe utility of regular applications and web pages; e.g., in terms of usability,accessibility, readability, interactivity, or performance. Systems like ACE mayallow applications to be flexible enough to meet different user needs, prefer-ences, and situations.
5.7 Conclusions and Future Work
Dynamic and continuously changing environments like the Web demand newmeans of building UIs that are aligned to the skills of the users. We have pre-sented an alternative to redesign interface widgets that operates unobtrusivelyfor both the user and the application structure. Substantial improvements canbe made at no cost, since the system is the only responsible of performing theadaptation, being delimited by the (implicit) user interactions and the restric-tions imposed by the developer, so that not all events affect all styling.
Finally, we believe that this work opens a door to a wealth of applications thatcan be developed by tracking the user activity and dynamically restyling theappearance of the UI in response. For instance, integrating ACE with an eye-tracker would provide a finer-grained and potentially more focused analysis ofuser interactions. Moreover, other biometric inputs such as electrocardiogramsignals would allow developers create “organic” UIs that are able to react tothe emotions of the users.

Bibliography of Chapter 5 87
Further research will pursue more ambitious results, such as inferring high-level behaviors from low-level events—for instance, reporting if a certain designcauses users to get lost or incites them to being more active.
Bibliography of Chapter 5
E. Arroyo, T. Selker, and W. Wei. Usability tool for analysis of web designs using mousetracks. In Proceedings of extended abstracts on Human factors in computing systems (CHIEA), pp. 484–489, 2006.
R. Atterer, M. Wnuk, and A. Schmidt. Knowing the user’s every move – user activitytracking for website usability evaluation and implicit interaction. In Proceedings of the15th international conference on World Wide Web (WWW), pp. 203–212, 2006.
N. Bila, T. Ronda, I. Mohomed, K. N. Truong, and E. de Lara. PageTailor: reusableend-user customization for the mobile web. In Proc. MobySys, pp. 16–29, 2007.
M. Bolin, M. Webber, P. Rha, T. Wilson, and R. C. Miller. Automation and cus-tomization of rendered web pages. In Proceedings of the 18th annual ACM symposium onUser interface software and technology (UIST), pp. 163–172, 2005.
M. Claypool, P. Le, M. Wased, and D. Brown. Implicit interest indicators. In Proceedingsof the 6th international conference on Intelligent user interfaces (IUI), pp. 33–40, 2001.
L. Findlater and J. McGrenere. Impact of screen size on performance, awareness, anduser satisfaction with adaptive graphical user interfaces. In Proceeding of the twenty-sixthannual SIGCHI conference on Human factors in computing systems (CHI), pp. 1247–1256, 2008.
K. Z. Gajos and D. S. Weld. SUPPLE: Automatically generating user interfaces. InProceedings of the 9th international conference on Intelligent user interfaces (IUI), pp.93–100, 2004.
K. Z. Gajos, J. O. Wobbrock, and D. S. Weld. Automatically generating user interfacesadapted to users’ motor and vision capabilities. In Proceedings of the 20th annual ACMsymposium on User interface software and technology (UIST), pp. 231–240, 2007.
K. Z. Gajos, K. Everitt, D. S. Tan, M. Czerwinski, and D. S. Weld. Predictability andaccuracy in adaptive user interfaces. In Proceeding of the twenty-sixth annual SIGCHIconference on Human factors in computing systems (CHI), pp. 1271–1274, 2008.
M. Y. Ivory and M. A. Hearst. Statistical profiles of highly-rated web sites. In Proceedingsof the SIGCHI conference on Human factors in computing systems (CHI), pp. 367–374,2002.
S. Kurniawan, A. King, D. Evans, and P. Blenkhorn. Personalising web page presentationfor older people. Interacting with Computers, 18(3):457–477, 2006.
B. Lee, S. Srivastava, R. Kumar, R. Brafman, and S. R. Klemmer. Designing with in-teractive example galleries. In Proceedings of the 28th international conference on Humanfactors in computing systems (CHI), pp. 2257–2266, 2010.
L. A. Leiva. Restyling website design via touch-based interactions. In Proceedings of the13th International Conference on Human Computer Interaction with Mobile Devices andServices (MobileHCI), pp. 91–94, 2011.

88 Bibliography of Chapter 5
L. A. Leiva. Interaction-based user interface redesign. In Proceedings of the 17th interna-tional conference on Intelligent User Interfaces (IUI), pp. 311–312, 2012a.
L. A. Leiva. Automatic web design refinements based on collective user behavior. In Pro-ceedings of the 2012 annual conference extended abstracts on Human factors in computingsystems (CHI EA), pp. 1607–1612, 2012b.
J. Marks, B. Andalman, P. A. Beardsley, W. Freeman, S. Gibson, J. Hodgins,
T. Kang, B. Mirtich, H. Pfister, W. Ruml, K. Ryall, J. Seims, and S. Shieber.Design galleries: A general approach to setting parameters for computer graphics andanimation. In Proceedings of the 24th annual conference on Computer graphics and in-teractive techniques (SIGGRAPH), pp. 389–400, 1997.
D. Masson, A. Demeure, and G. Calvary. Magellan, an evolutionary system to fosteruser interface design creativity. In Proceedings of the 2nd ACM SIGCHI symposium onEngineering interactive computing systems (EICS), pp. 87–92, 2010.
M. Terry and E. D. Mynatt. Side views: Persistent, on-demand previews for open-endedtasks. In Proceedings of the 15th annual ACM symposium on User interface software andtechnology (UIST), pp. 71–80, 2002.
T. Tsandilas and M. C. Schraefel. User-controlled link adaptation. In Proceedings of thefourteenth ACM conference on Hypertext and hypermedia (HT), pp. 152–160, 2003.
D. Zhang. Web content adaptation for mobile handheld devices. Communications of theACM, 50(2):75–79, 2007.

Chapter 6
Interactive Pattern Recognition
Lately, the paradigm for Pattern Recognition (PR) systems design is shiftingfrom the concept of full automation to schemes where the decision process isconditioned by human feedback. This is is motivated by the fact that manyapplications are expected to assist rather than replace human work; think forinstance of systems for medical diagnosis or traffic control.
In this chapter, as an alternative to reviewing (or post-editing) the automaticoutput of PR systems, an interactive approach is proposed, where the human isplaced “in the loop”. This scenario leads the system to being able to leverageimplicit information from user interactions, and use this information to im-prove its performance. Interactivity naturally entails multimodal operations,offering opportunities for even greater usability improvements. Multimodal-ity arises when additional feedback signals are non-deterministic and, conse-quently, need to be decoded. Finally, interactivity offers an ideal framework foradaptive learning, which is expected to lead to further improvements in bothperformance and usability.
Chapter Outline6.1 Introduction 90
6.2 IPR Systems Overview 93
6.3 Evaluation 96
6.4 Conclusions and Future Work 110
Bibliography of Chapter 6 111
89

90 Chapter 6. Interactive Pattern Recognition
6.1 Introduction
Novel interfaces with high cognitive capabilities is a hot research topic thataims at solving challenging application problems in our society of informationtechnology. The outstanding need for the development of such interactive sys-tems is clearly reflected, for instance, in the MIPRCV1 project, where thesecognitive capabilities are included as one of the priority research challenges.Placing Pattern Recognition (PR) within an HCI framework requires changesto the way we look at problems in these areas [Vidal et al., 2007]. ClassicalPR minimum-error performance criteria should be complemented with betterestimations of the amount of effort that the interactive process will demandfrom the user. As such, current existing PR techniques, which are intrinsicallygrounded on error-minimization algorithms, need to be revised and adapted tothe new, minimum human-effort performance criterion.
Mining implicit data from user interactions provides research with a series ofchallenges and opportunities in order to rethink how Interactive PR approaches(IPR for short) may drive the dynamic environment of interactive systems. Inthis context, implicit interaction entails three types of opportunities in IPR:
• Feedback information derived from the interaction process can be usedto significantly improve system performance.
• Interaction feedback signals are intrinsically multimodal, which meansthat we can study the synergy among different input modalities to en-hance overall system behavior and usability.
• Each interaction generally yields ground-truth data, which can be ad-vantageously used as valuable adaptive training data and tune systemperformance.
It should be noted that multimodal interaction may support two types of multi-modality [Toselli et al., 2011]. One corresponds to the input signal itself, whichcan be a complex mixture of different data types, ranging, e.g., from conven-tional keystrokes to audio and video data streams. The other type, more subtlebut also important, is derived from the often different nature of input and feed-back signals. It is this second type the one that makes both multimodality andimplicit interaction an inherent feature of human behavior.
Overall, the IPR framework proposes a radically different approach to correctthe errors committed by a PR system. This approach is characterized by hu-man and machine being tied up in a much closer loop than usually. Thatis, the user gets involved not only after the system has completed the pro-duction of its final recognition result, but also during the recognition process
1http://miprcv.iti.upv.es

6.1. Introduction 91
itself. This way, errors can be avoided beforehand and correction costs canbe dramatically reduced. Historically, this interactive-predictive approach wasproposed by the so-called conversation theory from cybernetics, in which thesystem constructs its knowledge by means of a series of user interactions [Pask,1975]. Currently, the Machine Learning community has renamed this approachto corrective feedback [Culotta et al., 2006], since every time the user amendsan error, the system reacts by modifying the resulting hypothesis.
6.1.1 IPR Framework Overview
The IPR framework (Figure 6.1) is explained as follows [Vidal et al., 2007]:
• X is the system’s input domain; i.e., the domain where input stimuli,observations, signals, or data come from.
• H is a theoretically infinite set of possible system outputs, results, orhypotheses. h ∈ H is a hypothesis which the system derives from acertain input x ∈ X .
• F is the domain were feedback signals come from. f(h, x), or just f ∈ Fis a specific feedback signal which the user provides as a response to thesystem hypothesis h.
• M is any model which the system uses to derive its hypotheses.
x h
h
f
x
Multimodal
Interactive System
Batch
Training
feedback
Training
Adaptive
x h f
M
. . .(x , h)
2
(x , h)1
Figure 6.1: The IPR framework [Vidal et al., 2007]. Reproduced with permission.

92 Chapter 6. Interactive Pattern Recognition
Assume for simplicity that both the input x and the feedback f are unimodal.Interaction leads to the following modality fusion problem2:
h = argmaxh
Pr(h|x, f) = argmaxh
Pr(x, f |h) · Pr(h) (6.1)
In many applications x and f can be assumed to be independent given h. Thisallows for a naıve Bayes decomposition:
h ≈ argmaxh
PMX(x|h) · PMF
(f |h) · PMH(h) (6.2)
Then, independent models, MX , MF and MH, can now be estimated sep-arately for the input components and for the prior hypotheses distribution,respectively. This way, the resulting search problem accounts for the jointoptimization of the conditional probability product.
6.1.2 Interaction Protocol
In the context of this thesis, the IPR framework has been successfully appliedto four different IPR systems, where implicit interaction plays a crucial role:1) Handwritten Transcription, 2) Machine Translation, 3) Grammatical Pars-ing, and 4) Image Retrieval. Indeed, the role of implicit interaction is crucialbecause the user can interact with an IPR system in an unimaginable numberof ways. As such, the range of interaction possibilities has to be delimited orpredicted in some way, so that the system can take maximum advantage of theexpected user feedback. This leads to the creation of a user model, also knownas an interaction protocol.
Depending on the application and the input modalities involved, very differenttypes of protocols can be assumed for the user to interact with the system in acomfortable and productive way. But the chosen protocols must also allow anefficient implementation, because interactive processing is generally highly de-manding in terms of response times [Toselli et al., 2011]. Eventually, the designof an efficient interaction protocol and an adequate UI are the most sensibledesign tasks for an IPR application. Concretely, once a specific interactionprotocol is defined, it should be possible to apply decision theory in order tomodel the expected interaction effort of such protocol in terms of an adequateloss function. This would allow to search for a corresponding decision functionthat minimizes the loss; i.e., the expected interaction effort.
Within the two general types of interaction protocols identified in IPR [Toselliet al., 2011], we will focus in the passive protocol, that is, where the systemrequires human feedback to emit a hypothesis. This focus is motivated by the
2True probabilities are denoted as Pr(·), while PM(·) or just P (·) denote probabilitiescomputed with some model M.

6.2. IPR Systems Overview 93
fact that it is a suitable scenario in which the system can take advantage ofimplicit interactions to a great extent. In contrast, under the active protocol itis the system, rather than the human, which is in charge of making the relevantdecisions about the need of supervising errors. Clearly, this scenario is not asadvantageous as the previous one to illustrate the role of implicit interactionsin IPR.
In general, the way of interacting with an IPR system following a passiveprotocol is described as follows:
1. The system automatically proposes a draft of the output of the task; e.g.,a text transcription or a collection of images.
2. The user then validates the parts of the output which is error-free; e.g.,indicating the correct prefix in a text-oriented task or selecting thoseimages considered as relevant in image retrieval.
3. The system then suggests a suitable, new extended consolidated hypoth-esis based on the previously validated parts and implicit information de-rived from user feedback.
4. Steps 2 and 3 are iterated until a final, perfect output is produced.
In the following sections we delineate a series of real-world implementations ofthe MIPR framework.
6.2 IPR Systems Overview
The following prototypes are focused on an interactive-predictive strategy, fullyintegrating the user knowledge into the PR process. The prototypes have beenclassified into two categories, depending whether the user feedback comes in theform of structured input or not. The former category includes three examples ofNatural Language Processing (NLP) systems, where the order in which errorsare corrected is determinant for the system. The latter category includes as anexample an image retrieval system, where the user feedback comes in the formof desultory input , i.e., the order is not determinant for the system.
It is worth pointing out that these prototypes were not intended to be production-ready applications. Rather, they were developed to provide an intuitive inter-face which aims at showing the functionality of an IPR system in general, aswell as illustrating the role of implicit interaction in particular.
6.2.1 Structured Input
In these systems, the user validates the longest prefix of the system hypothesis(e.g., a text transcription, a speech utterance, etc.) which is error-free. Such a

94 Chapter 6. Interactive Pattern Recognition
validation can be performed by using, e.g., a keyboard, a computer mouse, atouchscreen, a microphone, or an e-pen. Once the first error is corrected, thesystem predicts the most probable continuation of the partial input. This newextended hypothesis is strongly based on the previously validated prefix andthe decoding of the corrections submitted by the user—for instance, if an e-penwas used to write down a word, those pen strokes must be decoded. For thesake of simplicity, let us assume in this subsection that the system is producingtext-based hypotheses; for instance, transcriptions, translations, or parse trees.
As observed, under this protocol, the user is asked to correct the first errorfound. Then, the system can make the reasonable assumption that the useris reading the text form left to right (or vice versa for right-to-left languages,such as Arabic). With this assumption, the search process of the next (best)hypothesis is constrained to a smaller subset of words regarding the initialhypothesis, which allows the system to make a better prediction. Moreover,this assumption allows to automate the evaluation of these IPR systems, bysimulating a user that will perform a series of error amendments in an orderedsequence.
However, the role of implicit HCI has much to offer to this protocol, as thesystem can place a series of (safe) constraints to improve its hypotheses evenfurther. For instance, some editing operations are expected to be performed bythe user beyond simple word substitution, e.g., insertion, deletion, or rejection(Figure 6.2). More specifically, when the user is going to insert (or delete)a word, the system can assume that the word at the right of the insertion(or deletion) is correct. This constrains to an even smaller subset of wordsregarding the previous hypothesis, and therefore it is expected that the nextprediction will be much better, since the system has more information that isimplicitly validated. Going further, to replace an incorrect word the user needsto place the cursor over a text field and then start typing the corrected word.Nevertheless, this information about cursor placement can be leveraged to emitthe next hypothesis before the user starts typing, offering thus a (hopefully)better proposal, if not the one the user had in mind.
(a) Delete (b) Insert (c) Reject
Figure 6.2: Examples of editing operations in IPR systems. By deleting or inserting aword, the system can assume that the neighboring words are implicitly correct, allowingthus for a better prediction in the next hypothesis. By making a rejection, though, thesystem can only assume that the word at the left is correct.

6.2. IPR Systems Overview 95
Figure 6.3: Interactive Handwritten Transcription prototype, an example of structuredinput. Some word-level editing operations that can be performed are substitution (shownin the image), insertion (6.2a), deletion (6.2b), or rejection (6.2c). In this example, thesystem assumes that the first 3 words plus the first 2 characters of the edited word arecorrect. This information is used to 1) decode the submitted pen strokes and 2) predicta suitable continuation of the implicitly validated segment: “happen just after this fish· · · ”. Prototype available at http://cat.iti.upv.es/iht/.
Figure 6.4: Interactive Machine Translation prototype, another example of structuredinput. Here, the system predicts a new hypothesis when the cursor is positioned over anerroneous character, before the user starts typing. As in Figure 6.3, the text at the left ofthe cursor is considered to be correct. Available at http://cat.iti.upv.es/imt/.
6.2.2 Desultory Input
As in the previous passive protocol, here the user is expected to supervisethe system hypotheses in order to achieve a high-quality result. However, inthis case the user can perform the amendments in a desultory order. Thisis especially useful when the elements of the output do not have a particularhierarchy. Many different scenarios can fall under this category. However, herewe analyze the case of information retrieval, where the user initially submits anatural language description of an object she is looking for.
Under this protocol, the system outputs a set of objects matching the submittedquery, so the user can select which ones fit her needs and which do not. Thesystem then tries to fill the set with new objects taking into account the userpreferences from the previous iterations. The procedure stops when the userchooses not to reject any further object from the set. The goal is to obtainsuch a set in the minimum number of interactions.
In image retrieval this protocol is known as relevance feedback , since the usertypically categorizes the presented images into two (sometimes three) classes:relevant and non-relevant (and neutral in some cases). The role of implicitinteraction in this scenario is particularly useful to unburden the user fromhaving to think whether a particular image should be classified as non-relevantor neutral. As such, it is much easier for the user just to indicate which images

96 Chapter 6. Interactive Pattern Recognition
Figure 6.5: Interactive Grammatical Parsing prototype, an example of two-dimensionalstructured input. The same editing operations presented in Figure 6.2 can be performed.Tree visiting order is left-to-right depth-first, so resulting nodes at the left of (and above)the cursor are considered to be correct. Available at http://cat.iti.upv.es/ipp/.
are relevant. The system then classifies the rest of presented images into non-relevant, e.g., if they are very different to the ones the user has selected, or intoneutral otherwise. Moreover, this strategy allows to automate the evaluation ofthese image retrieval systems, by simulating a user that will select only imagesconsidered as relevant in each iteration with the system.
Again, the role of implicit HCI has much to offer to this protocol, as the systemcan take some initiative derived from user input to improve its hypotheses evenfurther. For instance, using metadata from the presented images, it is possibleto suggest a textual query that would allow the user to retrieve better imagesfrom scratch. In addition, the system can present a tag cloud to provide theuser with a gist of the current set of images. Furthermore, when clicking on atag, the system can refine the original query by adding the respective tag (orrelated information thereof) to the query.
6.3 Evaluation
Here we will focus on the evaluation of the IPR framework with real users. TheIPR literature uses test-set-based estimates of user effort reduction, but onlya few researchers have conducted controlled lab studies to verify whether theIPR framework proves to be superior to current baselines techniques [Alabauet al., 2012; Leiva et al., 2011a,b]. From the four applications previously exam-ined, we will focus on three of them, which are the most mature technologiesimplemented so far.
6.3.1 Interactive Handwritten Transcription
The goal of this evaluation was aimed at improving Handwritten Text Recog-nition (HTR) technology. An Interactive Handwriting Transcription (IHT)system was used on a real-world task, and compared to a manual approach as

6.3. Evaluation 97
(a) Query refinement suggestion (b) TagCloud based suggestion
Figure 6.6: Interactive Image Retrieval prototype, an example of desultory input. Theuser must select which images are relevant, in no particular order, and the system willmark the rest as non-relevant or neutral; depending on the considered image features.Moreover, this information can be used to make suggestions to the user, e.g., as a refinedquery (6.6a) or as a tag cloud (6.6b), which may help to disambiguate intent or to retrievehopefully better images. Available at http://risenet.iti.upv.es/.
baseline. We compiled a test corpus from a 19th century handwritten docu-ment identified as “Cristo Salvador” (CS), which was kindly provided by theBiblioteca Valenciana Digital3.
Participants Fourteen users from our Computer Science department volun-teered to cooperate, aged 28 to 61 (M=37.3). Most of them were knowledgeablewith handwriting transcription tasks, although none was a transcriber expert.One user could not finish the evaluation, so the end user sample was 13 subjects(3 females).
Assessment Measures We used two well-known objective test-set-basedmeasures: word error rate (WER)4 and word stroke ratio (WSR)5, both nor-malized by the number of words in the reference transcription. We also mea-sured the time needed to transcribe completely each page with each HTR sys-tem. Additionally, we measured the probability of improvement (POI), whichestimates if a system is a priori better than another for a given user [Bisaniand Ney, 2004].
Design We carried out a within-subjects repeated measures design. Wetested two conditions: transcribing a page with the manual and the IHT sys-tem, taking into account that each one was tested twice—to compensate theabove-mentioned learnability bias. We used the (non-parametric) two-sampleKolmogorov-Smirnov test, since normality assumptions did not hold.
3http://bv2.gva.es/4WER is the minimum number of editing operations to achieve the target transcription.5WSR is the number of interactions needed to achieve the target transcription.

98 Chapter 6. Interactive Pattern Recognition
Apparatus We modified an IHT web-based prototype [Romero et al., 2009]to carry out the field study. We implemented two HTR engines to assist thedocument transcription on the same UI. In addition, a logging mechanism wasembedded into the web application. It allowed us to register all user interactionsat a fine-grained level of detail (e.g., keyboard and mouse events, client/servermessages exchanging, etc.). Then, interaction log files were reported in XMLformat for later postprocessing.
Procedure Participants accessed the web-based application via a specialURL that was sent to them by email. In order to familiarize with the UI,users informally tested each transcription engine with some test pages, differ-ent from the ones reserved for the real test. Then, people transcribed the twouser-test pages with both transcription engines. These pages were selected ac-cording to their WER and WSR values, which were close to the median valuesof the test-set. To avoid possible biases due to human learnability, the firstpage (#45) was initially transcribed with the manual engine first; then theorder was inverted for the second page (#46). Finally, participants filled outan online System Usability Scale (SUS) questionnaire [Brooke, 1996] for bothsystems. Such an online form included a text field to allow users submit freecomments and ideas about their testing experience, as well as insights aboutpossible enhancements and/or related applicability.
Results
In sum, we can assert that regarding effectiveness there are no significant dif-ferences, as expected, i.e., users can achieve their goals with any of the testedsystems. However, in terms of efficiency the IHT system is the better choice.Regarding to user satisfaction, IHT again seems to be the most preferableoption.
Quantitative Analysis Table 6.1 summarizes the main findings. We mustemphasize that the daily use of any system designed to assist handwriting tran-scription would involve not having seen previously any of the pages (i.e., userswould usually read a page once and at the same time they would transcribe it).Therefore, IHT seems to be slightly better than a manual approach in termsof WER, and clearly superior in terms of WSR.
Analysis of Task Completion Time We observed that, overall, there areno differences in transcription times [D = 0.16, p = .75, n.s.]. In general, thesystem used in second place always achieved the best time, because the useralready knew the text. The remarkable result is that when the user reads apage in first place the chosen engine is not determinant, because one mustspend time to accustom to the writing style, interpreting the calligraphy, etc.In this case the POI of IHT with respect to the manual engine is 53%.

6.3. Evaluation 99
System Time WER WSR
OverallManual 11.1 (3.5) 8.6 (8.2) 97.8 (6.0)IHT 10.3 (3.7) 6.5 (3.7) 30.4 (6.1)
Page 45Manual 12.8 (3.5) 12.8 (9.5) 97.3 (7.0)IHT 8.6 (3.2) 7.0 (4.1) 28.6 (4.1)
Page 46Manual 9.4 (2.9) 4.1 (2.0) 98.4 (4.6)IHT 12.0 (3.4) 6.0 (3.3) 32.1 (7.1)
Table 6.1: Mean (and SD) per page for the measured variables: time (in minutes), WER(in %), and WSR (%).
Analysis of WER Overall, IHT performs better regarding WER [D = 0.11,p = .99, n.s.]. Although the differences are not statistically significant, theinteresting observation is that IHT is the most stable of the systems—evenbetter than when using the manual engine on an already read page. We mustrecall that the more stable in WER a system is, the fewer residual errors areexpected and therefore a high quality transcription is guaranteed. In this case,considering the first time that the user reads a page, the POI of the IHT engineover the manual engine is 69%.
Analysis of WSR Interestingly, the WSR when using the manual enginewas below 100%, since there are inherent errors (some users were unable toread all lines correctly). This means that some users wrote less words in theirfinal transcriptions than they really should have to when using the manualengine. In both conditions IHT was the best performer, and differences werefound to be statistically significant [D = 1, p < .001]. The POI of the IHTengine regarding the manual engine is 100%. This means that the numberof words a user must write and/or correct under the IHT paradigm is alwaysmuch lower than with a manual system. Additionally, this fact increases theprobability of achieving a high-quality final transcription, since users performfewer interactions and are prone thus to less errors.
Qualitative Analysis Regarding user subjectivity, the SUS scores could beconsidered normally distributed. Thus, a Welch two-sample t-test was em-ployed to measure the differences between both groups. We observed a tendencyin favor to IHT [t(22) = 0.25, p = .80, n.s.], since users generally appreciatethe guidance of the IHT system to suggest partial predictions, considering thedifficulty of the task proposed in the field study.
Limitations of the Study First, taking into account that our participantswere not experts in transcribing ancient documents, a dispersed behavior wasexpected (i.e., some users were considerably faster/slower than others). Second,the pages were really deteriorated, making more difficult the reading for theusers. For that reason, there is a strong difference between the first time that

100 Chapter 6. Interactive Pattern Recognition
Manual IHT
60
65
70
75
80SUSscore
Figure 6.7: User satisfaction, ac-cording to the SUS questionnaire.Error bars denote 95% confidenceintervals.
a user had to transcribe a page and subsequent attempts. Third, most of theparticipants had never faced neither any of the implemented engines nor theweb UI before the study, so it is expected a learning curve prior to using suchsystems in a daily basis. Finally, a simplified starting level would minimize thiseffect for the task; however we tried to select a scenario as close as possible toa realistic setting.
Evaluation Discussion
Despite of the above mentioned limitations, there is a comprehensible tendencyto choose the IHT paradigm over the manual system. Additionally, as observed,the probability of improvement of an IHT engine over manual transcriptionrevealed that the interactive-predictive paradigm worked better for all users.
The advantage of IHT over traditional HTR post-editing approaches goes be-yond the good estimates of human effort reductions achieved. When difficulttranscription tasks with high post-editing effort are considered, expert usersgenerally refuse to post-edit conventional HTR output [Toselli et al., 2009]. Incontrast, the proposed interactive approach constitutes a much more naturalway of producing correct texts. With an adequate user interface, IHT lets theuser be dynamically in command: if predictions are not good enough, then theuser simply keeps typing at her own pace; otherwise, she can accept (partial)predictions, thereby saving both thinking and typing effort.
6.3.2 Interactive Machine Translation
The goal of this evaluation was aimed to assess a Machine Translation (MT)system that is based on the IPR framework (IMT for short), and compare itto a state-of-the-art post-editing (PE) MT system. Translating manually fromscratch was not considered, since this practice is being increasingly displaced byassistive technologies at present. Indeed, PE of MT systems is found frequentlyin a professional translation workflow [TT2, 2001].
Initially, we modified an IMT web-based prototype [Ortiz-Martınez et al., 2010]to carry out the evaluation. We targeted specific IMT features, e.g., confidence

6.3. Evaluation 101
measures in translated words or click-based operations. We will refer to thissystem as the advanced version (IMT-AV).
Evaluation of an Advanced Version
In addition to IMT-AV, a post-editing version of the prototype (PE-AV) wasdeveloped to make a fair comparison with state-of-the-art PE systems. PE-AV used the same interface as IMT-AV, but the IMT engine was replaced byautocompletion-only capabilities, as it is found in popular text editors.
Participants A group of 10 users (3 females) aged 26–43 from our researchgroup volunteered to perform the evaluation as non-professional translators.They were proficient in Spanish and had an advanced knowledge of English.While none of them had worked with IMT systems before, all knew the theo-retical foundations of the technology.
Assessment Measures Both systems were evaluated on the basis of theISO 9241-11 standard (ergonomics of human-computer interaction). Three as-pects were considered: efficiency, effectiveness, and user satisfaction. For theformer, we computed the average time in seconds that took to complete eachtranslation. For the second, we evaluated the BLEU6 against the reference anda crossed multi-BLEU among users’ translations. For the latter, we formu-lated 10 questions inspired by the system usability scale (SUS) questionnaire.Users would answer the questions in a 5-point Likert scale (1: strongly disagree,5: strongly agree), plus a text area to submit free-form comments.
Apparatus Since participants were Spanish natives, we decided to performtranslations from English to Spanish. We chose a medium-sized corpus, the EUcorpus, typically used in IMT [Barrachina et al., 2009], which consists of around200K sentences from legal documents. We built a glossary for each source wordby using the 5-best target words from a word-based translation model. Weexpected this would cover the lack of knowledge for our non-expert translatorstoward this particular task. In addition, a set of 9 keyboard shortcuts wasdesigned, aiming to simulate a real translation scenario.
Furthermore, autocompletion was added to PE-AV, i.e., words with more than3 characters were autocompleted using a task-dependent word list. In addition,IMT-AV was set up to predict at character level interactions. We disabledcomplementary features for the evaluation to focus on basic IMT.
Procedure Three disjoint sentence sets (C1, C2, C3) were randomly selectedfrom the test dataset. Each set consisted of 20 sentence pairs and kept the se-quentiality of the original text. Sentences longer that 40 words were discarded.C3 was used in a warm up session, where users gained experience with theIMT system (5–10 min per user on average) before carrying out the actual
6BLEU is a standard measure of the quality of machine-translated text.

102 Chapter 6. Interactive Pattern Recognition
PE-AV IMT-AV
Avg. time (s) 62 (SD=51) 67 (SD=65)
BLEU 40.7 (13.4) 41.5 (13.5)Crossed BLEU 77.4 (4.5) 78.9 (4.8)
User Satisfaction 2.5 (1.2) 2.1 (1.2)
Table 6.2: Summary of the results for the first test.
evaluation. Then, C1 and C2 were evaluated by two user groups (G1, G2) ina counterbalanced fashion: G1 evaluated C1 on PE-AV and C2 on IMT-AV,while G2 did C1 on IMT-AV and C2 in PE-AV.
Results Although results were not strongly conclusive (there were no statis-tical differences between groups), some trends were observed. First, time spentper sentence (efficiency) on average in IMT was higher than in PE (67 vs. 62 s).However, effectiveness was slightly higher for IMT in BLEU with respect to thereference sentence (41.5 vs. 40.7) and with respect to a cross-validation withother user translations (78.9 vs. 77.4). This suggested that the IMT systemhelped to achieve more consistent and standardized translations.
Finally, users perceived the PE system to be more adequate than the IMTsystem, although global scores were 2.5 for PE and 2.1 for IMT, which suggestedthat users were not very comfortable with none of the systems (Likert scoreswere comprised between 1 and 5). IMT failed to succeed in questions regardingthe system being easy to use, consistent, and reliable. This was corroboratedby the submitted comments.
Users complained about having too many shortcuts and available edit opera-tions, some operations not working as expected, and some annoying commonmistakes regarding predictions of the IMT engine (e.g., inserting a whitespaceinstead of completing a word, which would be interpreted as two different wordsby the UI). One user stated that the PE system “was much better than the[IMT] predictive tool”. Regarding PE, users mainly questioned the usefulnessof the autocompletion feature.
Evaluation of a Simplified Version
Results from the first evaluation were quite disappointing. Not only partici-pants took more time to complete the evaluation with IMT-AV, but they alsoperceived that IMT-AV was more cumbersome and unreliable than PE-AV.However, we still observed that IMT-AV had been occasionally beneficial, andprobably the bloated UI was the cause for IMT to fail. Thus, we developed asimplified version of the original prototype (IMT-SV).

6.3. Evaluation 103
Participants Fifteen participants aged 23–34 from university English courses(levels B2 and C1 from the Common European Framework of Reference forLanguages) were paid to perform the evaluation (5 euro each). A special priceof 20 euro was given to the participant who would contribute with the mostuseful comments about both prototypes. It was found that, by following thismethod, participants were more verbose when it came to reporting feedback.
Apparatus In this case, the editing interface was presented as a simple textarea. In addition, the editing operations were simplified to allow only wordsubstitutions and single-click rejections. Besides, we expected that the sim-plification of the interface logic would reduce some of the programming bugsthat bothered users in the first evaluation. The PE interface was simplified thesame way (PE-SV). Furthermore, the autocompletion feature was improved tosupport n-grams of arbitrary length. A different set of sentences (C1′, C2′,C3′) was randomly extracted from the EU corpus.
Procedure To avoid possible bias regarding which system was being used,sentences were presented in random order, and engine type was hidden toparticipants. As a consequence, users could not evaluate each system indepen-dently. Therefore, a reduced questionnaire with just two questions was shownon a per-sentence basis. Q1 asked if system suggestions were useful. Q2 askedif the system was cumbersome to use overall. A text area for submitting free-form comments was also included in the UI.
Results Still with no statistical significance, we found that IMT was per-ceived now better than PE. First, interacting with IMT-SV was more efficientthan with PE-SV on average (55 s vs. 69 s). The number of interactions wasalso lower (79 vs. 94). Concerning user satisfaction, IMT-SV was perceivedas more helpful (3.5 vs. 3.1) but also slightly more cumbersome (3.1 vs. 2.9).However, in this case differences were narrower. On the other hand, IMT-SVreceived 16 positive comments whereas PE received only 5. Regarding negativecomments, IMT-SV accounted for 35 items and PE-SV 31 items. While thenumber of negative comments is similar, there was an important difference re-garding positive ones. Finally, user complaints of IMT-SV can be summarizedin the following items: a) system suggestions changed too often, offering verydifferent solutions on each keystroke; b) while correcting one mistake, subse-quent words that were correct were changed by a worse suggestion; c) systemsuggestions did not keep gender, number, and tense concordance; d) if the usergoes back in the sentence and performs a correction, some parts of the sentencealready corrected were not preserved on subsequent system suggestions.
Evaluation Discussion
Our initial UI performed poorly when tested with real users. However, whenthe UI design was adapted to user expectations, results were encouraging. Notethat in both cases the same IMT engine was evaluated under the hood. This

104 Chapter 6. Interactive Pattern Recognition
PE-SV IMT-SV
Avg. time (s) 69 (SD=42) 55 (SD=37)
No. interactions 94 (60) 79 (55)
Q1 (Likert scale) 3.1 (1.2) 3.5 (1.1)Q2 (Likert scale) 2.9 (1.2) 3.1 (1.3)
Table 6.3: Summary of the results for the second test.
fact remarks the importance of an adequate UI design when evaluating a highlyinteractive system as IMT.
In sum, the following issues should be addressed in IMT: 1) user correctionsshould not be modified, since that causes frustration; 2) system hypothesesshould not change dramatically between interactions, in order to avoid confus-ing the user; 3) the system should produce a new hypothesis only when it issure that it improves the previous one.
6.3.3 Interactive Image Retrieval
In this scenario, it is desirable to retrieve as much precise images as possiblein a few feedback iterations. To this end, Paredes et al. [2008] demonstratedthat implicitly validating non-selected images as non-relevant is a safe andconvenient assumption. Experiments on the well-known Corel/Wang datasetrevealed that this method was able to retrieve 94.5% of the relevant images injust 2 iterations.
However, in an image retrieval system, there are generally available many dif-ferent types of image features, and also there are textual features, such asmetadata, annotations provided by users, or text surrounding the images fromwhere they appear. Adequately leveraging all this available information is amajor goal in order to obtain the best performance possible. In this sectionwe study two approaches to achieve this goal: 1) how to combine textual andvisual information by using relevance feedback, and 2) how to present thisinformation to the user in a way that it may improve retrieval results.
Evaluation of Multimodal Fusion
We opted for late fusion as a fusion method of visual and textual features,since it is simple and easy to integrate in our previously developed prototype,a Relevant Image Search Engine (RISE) [Segarra et al., 2011]. Since onlytwo modalities are considered, an α ∈ [0, 1] parameter is set to assign animportance weight to visual image descriptors. This allowed us to implement alinear combination of both features and let the system decide the best rankingof images according to:

6.3. Evaluation 105
Rα(x) = αRv + (1− α)Rt (6.3)
This way, when α = 0, only textual features are considered (i.e., textual modal-ity, Rt); while α = 1 means that only visual features are considered (i.e., visualmodality, Rv). Clearly, α should not be kept fixed for a given system, since itis known that in general some queries will perform better with visual informa-tion, or the other way around, and leaving this task to the user is too muchburden. Hence, to deal with this dynamically variable weighting, we proposeto take advantage of information derived from relevance feedback and solve anoptimization problem: the system will try to rank relevant and non-relevantimages as far as possible, also placing the relevant images in the top positions.We named this approach dynamic linear fusion.
To evaluate this approach, we manually labeled a subset of 21 queries with 200images each from the RISE image database [Villegas and Paredes, 2012]. Thereader may consult [Toselli et al., 2011] for a brief description of each query,together with their respective images.
Instead of recruiting users, as usual, we decided to do a preliminary evaluationfirst, which would eventually lead to a lab study in case results were promising.For consistency with the default RISE UI (Figure 6.6), we simulated a userwho wants to retrieve N = 10 images, which were shown at a time. So, ineach iteration, the user would see 10 images and judge which were relevant.Visual features were comprised of color histograms, while textual features werecomprised of automatic image annotations (extracted from the web pages whereimages were located). Results are shown in Figure 6.8.
Evaluation Discussion Figure 6.8a shows the evolution of retrieval accuracywith the successive interaction steps for different retrieval strategies. As wesuspected, both pure text and visual retrieval alone are worse performers. Afterone interaction step, the dynamic linear fusion approach performs better onaverage. The best fusion combination is just an upper bound, and therefore inpractice it is unreachable.
It can be observed in Figure 6.8b that the system quickly gains accuracy withthe progression of user interaction steps. That is, the more the informationknown about what is considered relevant in previous steps, the better it canpredict the best fusion parameter α for the current step. In the first step, thereis a clearly ascendant slope toward the visual strategy, achieving high precisionwhen full visual search is used. However, in the following iterations the bestprecision is not obtained on the extremes, which shows the importance of havinga dynamic user/query-adaptative α to achieve always the best precision.
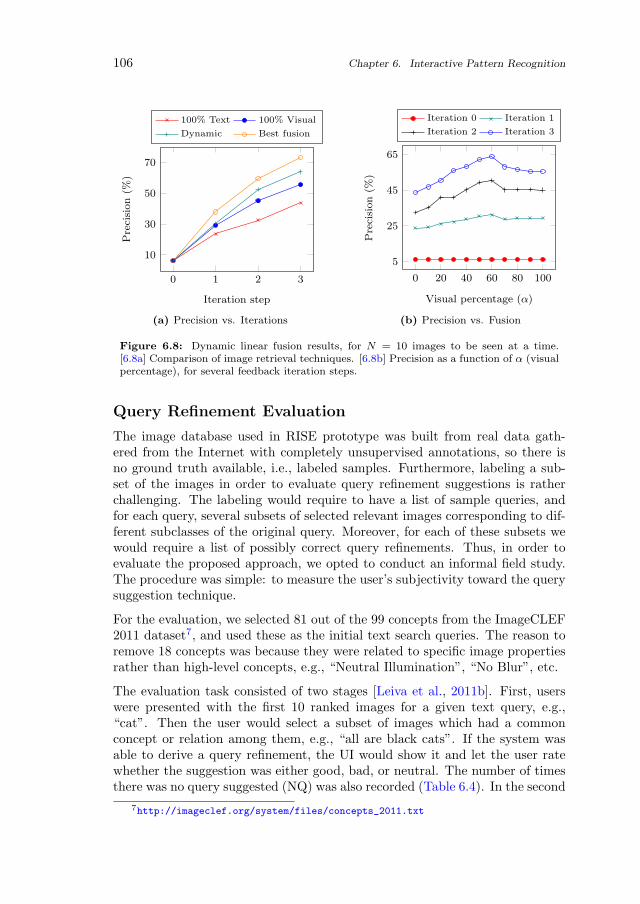
106 Chapter 6. Interactive Pattern Recognition
0 1 2 3
10
30
50
70
Iteration step
Precision(%
)100% Text 100% Visual
Dynamic Best fusion
(a) Precision vs. Iterations
0 20 40 60 80 100
5
25
45
65
Visual percentage (α)
Precision(%
)
Iteration 0 Iteration 1
Iteration 2 Iteration 3
(b) Precision vs. Fusion
Figure 6.8: Dynamic linear fusion results, for N = 10 images to be seen at a time.[6.8a] Comparison of image retrieval techniques. [6.8b] Precision as a function of α (visualpercentage), for several feedback iteration steps.
Query Refinement Evaluation
The image database used in RISE prototype was built from real data gath-ered from the Internet with completely unsupervised annotations, so there isno ground truth available, i.e., labeled samples. Furthermore, labeling a sub-set of the images in order to evaluate query refinement suggestions is ratherchallenging. The labeling would require to have a list of sample queries, andfor each query, several subsets of selected relevant images corresponding to dif-ferent subclasses of the original query. Moreover, for each of these subsets wewould require a list of possibly correct query refinements. Thus, in order toevaluate the proposed approach, we opted to conduct an informal field study.The procedure was simple: to measure the user’s subjectivity toward the querysuggestion technique.
For the evaluation, we selected 81 out of the 99 concepts from the ImageCLEF2011 dataset7, and used these as the initial text search queries. The reason toremove 18 concepts was because they were related to specific image propertiesrather than high-level concepts, e.g., “Neutral Illumination”, “No Blur”, etc.
The evaluation task consisted of two stages [Leiva et al., 2011b]. First, userswere presented with the first 10 ranked images for a given text query, e.g.,“cat”. Then the user would select a subset of images which had a commonconcept or relation among them, e.g., “all are black cats”. If the system wasable to derive a query refinement, the UI would show it and let the user ratewhether the suggestion was either good, bad, or neutral. The number of timesthere was no query suggested (NQ) was also recorded (Table 6.4). In the second
7http://imageclef.org/system/files/concepts_2011.txt

6.3. Evaluation 107
stage of the evaluation, users were presented with the images after following thequery suggestion, and they had to mark all of the images considered relevantto the concept they had in mind when selecting the images in the first stage ofthe evaluation. This two-stage process was repeated for all subsets of relatedimages the user could identify. Three people from our department took partin the evaluation. Results are presented in Figure 6.9 and Tables 6.4 and 6.5,respectively.
1 2 3
0
20
40
60
# Selected
%Ratings
Bad Neutral Good
(a) Stage 1: query ratings.
1 2 3
0
20
40
60
# Selected
%RelevantIm
ages
Bad Neutral Good
(b) Stage 2: retrieved images.
Figure 6.9: Query refinement evaluation results. [6.9a] Average rating of suggestedqueries against number of initially selected images. [6.9b] Percentage of images consideredas relevant after following the query suggestions against number of initially selected images.
# selected # samples Bad Neutral Good NQ
1 194 35 42 106 112 74 11 13 29 213 24 2 4 6 12>3 30 0 0 3 27
Overall 322 48 59 144 71
Table 6.4: Results for stage 1 of query refinement evaluation, showing absolute ratingsfor suggested query refinements.
Evaluation Discussion Regarding the first stage of the evaluation, the firstthing to note is that, as more images are selected, it is less probable that thesystem will suggest a query (see Table 6.4). This is understandable, since it isless likely that there will be common terms to all selected images. Moreover,terms associated to each image completely depend on the web pages where theimage appears, thus not all images will be well annotated. Nonetheless, mostof the suggested queries were rated as being good, which indicates that thisapproach of deriving suggestions based on selected (relevant) images can bequite useful.

108 Chapter 6. Interactive Pattern Recognition
# selected # ratings Bad Neutral Good
1 183 1.5 (1.5) 4 (3) 4.3 (3)2 53 0.9 (1.4) 4.8 (3.2) 5.1 (3.3)3 12 0 (0) 4.8 (4.8) 5.8 (2.8)>3 3 0 (0) 0 (0) 9.6 (0.5)
Overall 226 1.3 (1.5) 4.3 (3.2) 4.7 (3.2)
Table 6.5: Results for stage 2 of query refinement evaluation, showing mean (and stan-dard deviation) values of the number of relevant images retrieved after following suggestedqueries.
Regarding the second stage of the evaluation, as expected, query suggestionswhich were rated as being good or neutral retrieved more relevant images thanbad query suggestions (see Figure 6.9b). This is convenient, since it is unlikelythat a user will use a suggestion considered to be bad. A particular behaviorthat was also observed is that performance tends to be better for suggestionsthat were derived using more selected (relevant) images. Then, overall, asmore images are selected, it is less likely that the system will suggest a query;however if there is a suggestion it tends to be a better one.
Another observation from the evaluation was that suggestion quality dependshighly on the particular query. There are some queries where images presentedto the user clearly belong to different subgroups, which, if selected, most of thetime a query will be suggested that relates to that subgroup. An example of aquery that provides good suggestions was shown in Figure 6.6.
Tag Cloud Evaluation
In the same way as in query refinement evaluation, obtaining labeled data tobe able to assess tag cloud suggestions is rather difficult. Thus, to performthe evaluation, we conducted again an informal field study, using the samedatabase used in RISE prototype.
Fourteen users aged 31.42 (SD=5.34) were recruited via email advertising toparticipate in the evaluation study. They were told to assess the relevance ofthe N = 10 top scored tags suggested in the cloud for a series of queries (12queries per person on average).
The list of queries was compiled by merging two lists from ImageCLEF 2012:Photo Annotation and Retrieval. Concretely, we merged concepts from ‘Large-scale annotation using general Web data’ subtask8 and queries used in ‘Visualconcept detection, annotation, and retrieval using Flickr photos’ subtask9. Thefinal list comprised 164 search queries in total.
8http://imageclef.org/2012/photo-flickr9http://imageclef.org/2012/photo-web

6.3. Evaluation 109
1 2 3 4 5 6 7 8 9 10
0
5
10
15
20
25
Tag rank position
%Relevanttags
(a) Relevance vs. Tag position
1 2 3 4 5 6 7 8 90
10
20
30
40
# Selected images
%Relevanttags
(b) Relevance vs. Selected images
Figure 6.10: Evaluation results of the tag cloud, with 95% confidence intervals.
While evaluating each query, participants had to follow their given list of queriesand select a subset of images for different subtopics from the presented set of 10images. Participants had no restrictions on subtopic selection, e.g., a subtopiccould have an arbitrary number of images, no minimum or maximum subtopicsper query were imposed, etc.
Whenever a relevant image was selected from the presented set, a list of 10tags was displayed in order of relevance (most relevant tags at the beginningof the list, in a left-to-right order). A check box was attached to each tag, sothat users could mark whether the tag was considered relevant to the subtopicor not.
It is worth pointing out that no tag cloud in the strict sense was displayed, buta text-only tag list sorted by relevance, since we wanted to avoid any possiblevisual bias in the study. Figure 6.10 shows the evaluation results.
Evaluation Discussion Users reported that sometimes tags were found tobe really useful and beneficial for the current query, but also sometimes theywere found to be meaningless. This fact is explained by the noise due to theimage indexing procedure, which was completely unsupervised and thereforethe cloud may contain irrelevant tags for a particular query. This can beobserved in Figure 6.10a, where each bar represents the average percentage ofrelevant tags (normalized by the number of selected relevant tags) given therank position of each tag. Nonetheless, as expected, tags in the first positionsof the cloud tended to be perceived more often as relevant. Differences betweenthe first ranked tag and the other tags are statistically significant.
A study by Bateman et al. [2008] reported that tags with a larger numberof characters tended to be selected less often. We investigated whether thiscould be observed in our study as well. We computed the tag length ratio asthe division of the average length of selected tags by the average length of all

110 Chapter 6. Interactive Pattern Recognition
suggested tags, and obtained 1.03 (SD=0.16), which means that selected tagswere around the average tag length overall. Furthermore, only 10% of the timea user chose a tag that had more than a 1.1 of tag length ratio. This suggestedthat the length of a tag was not determinant to assess its relevance toward aparticular query, but also that users did not choose neither shorter or longertags overall.
Figure 6.10b depicts the proportion of relevant tags according to the numberof selected images. As observed, relevance differences between tags presentedwhen selecting #1 or #2 images with respect to the rest of selections werefound to be statistically significant. Similar conclusions to those observed inthe query suggestion evaluation were derived: 1) as more images are selected,the overview the tag cloud provides about such a set of images tends to bemore general; and 2) the quality of the tags depends highly on the particularquery.
As observed, therefore, when a single image is selected, nearly half of the tagsare considered as relevant, since the tag cloud is specifically tailored to such asingle selection. Then, this proportion falls dramatically as more images areselected. This suggests that when many images are selected, a new strategyfor generating tag clouds should be devised. Nonetheless, on average, 21.49%(SD=10) of the presented tags were considered as relevant at any time.
All in all, our study indicates that the tag cloud approach supports its intendedgoal, i.e., impression formation about a particular set of relevant images. Fur-thermore, the tag cloud provides the user with more options to refine the initial(textual) query. As such, we believe that a tag cloud has more potential than aquery refinement suggestion, at least in an interactive image retrieval scenario.
6.4 Conclusions and Future Work
The IPR framework proposes a radically different approach to correct the errorscommitted by a PR system. This approach is characterized by human andmachine being tied up in a much closer loop than usually. This way, errors canbe avoided beforehand and correction costs can be dramatically reduced. Wehave characterized the interaction protocol that rules the IPR framework, andhave introduced a series of prototypes that successfully illustrate it.
The literature had reported good experimental results in simulated-user sce-narios, where IPR is focused on optimizing some automatic metric. However,user productivity is strongly related to how users interact with the IPR systemand other UI concerns. For instance, in the NLP applications introduced inthis chapter, a hypothesis that changes on every keystroke might obtain bet-ter automatic results, whereas user productivity may decrease because of thecognitive effort needed to process those changes. Therefore, the current IPRframework should be revised in order to optimize further these NLP systems

Bibliography of Chapter 6 111
toward the user. In this regard, we have suggested some approaches, such asavoid modifying any user-submitted correction by any means, or deriving anew hypothesis only when the system is sure that it will improve the previousone.
Regarding IPR systems that deal with desultory user input, we have shownthat implicit interaction can notably improve system performance. We havepresented a series of image retrieval strategies to illustrate this fact, such as1) rethinking the classical retrieval protocol, in which users must indicate whichimages are relevant and non-relevant, to a much simpler one in which thesystem can assume that non-selected images are not relevant; 2) combiningmultimodal information from selected images to provide better results; 3) usingthis multimodal information to provide the user with optional suggestions,either in the form of a refined query suggestion or a tag cloud.
We have demonstrated that the techniques presented so far are both suitableand convenient. Each technique is based on a probabilistic model to handle userinteraction, which allows IPR systems to take the lead in coordinating differentuser feedback signals. We hope these considerations will guide researchers tofuture developments that can have a significant impact both on academia andindustry.
Bibliography of Chapter 6
V. Alabau, L. A. Leiva, D. Ortiz-Martınez, and F. Casacuberta. User evaluation ofinteractive machine translation systems. In Proceedings of the European Association forMachine Translation (EAMT), pp. 20–23, 2012.
S. Barrachina, O. Bender, F. Casacuberta, J. Civera, E. Cubel, S. Khadivi, A. L.
Lagarda, H. Ney, J. Tomas, E. Vidal, and J. M. Vilar. Statistical approaches tocomputer-assisted translation. Computational Linguistics, 35(1):3–28, 2009.
S. Bateman, C. Gutwin, and M. Nacenta. Seeing things in the clouds: the effect of visualfeatures on tag cloud selections. In Proceedings of the nineteenth ACM conference onHypertext and hypermedia (HT), pp. 193–202, 2008.
M. Bisani and H. Ney. Bootstrap estimates for confidence intervals in ASR performanceevaluation. In Proceedings of the IEEE International Conference on Acoustics, Speech,and Signal Processing (ICASSP), pp. 409–12, 2004.
J. Brooke. SUS: A “quick and dirty” usability scale. In P. Jordan, B. Thomas, B. Weerd-
meester, and A. McClelland, editors, Usability Evaluation in Industry. Taylor andFrancis, 1996.
A. Culotta, T. Kristjansson, A. McCallum, and P. Viola. Corrective feedback andpersistent learning for information extraction. Artificial Intelligence, 170(14–15):1101–1122, 2006.
L. A. Leiva, V. Romero, A. H. Toselli, and E. Vidal. Evaluating an interactive-predictiveparadigm on handwriting transcription: A case study and lessons learned. In Proceedingsof the 35th Annual IEEE Computer Software and Applications Conference (COMPSAC),pp. 610–617, 2011a.

112 Bibliography of Chapter 6
L. A. Leiva, M. Villegas, and R. Paredes. Query refinement suggestion in multimodalinteractive image retrieval. In Proceedings of the 13th International Conference on Mul-timodal Interaction (ICMI), pp. 311–314, 2011b.
D. Ortiz-Martınez, L. A. Leiva, V. Alabau, and F. Casacuberta. Interactive machinetranslation using a web-based architecture. In Proceedings of the 16th International Con-ference on Intelligent User Interfaces (IUI), pp. 423–425, 2010.
R. Paredes, T. Deselaers, and E. Vidal. A probabilistic model for user relevance feedbackon image retrieval. In Proceedings of the 5th international workshop on Machine Learningfor Multimodal Interaction (MLMI), pp. 260–271, 2008.
G. Pask. Conversation, cognition and learning: A cybernetic theory and methodology. El-sevier Science, 1975.
V. Romero, L. A. Leiva, A. H. Toselli, and E. Vidal. Interactive multimodal transcriptionof text images using a web-based demo system. In Proceedings of the 15th InternationalConference on Intelligent User Interfaces (IUI), pp. 477–478, 2009.
F. M. Segarra, L. A. Leiva, and R. Paredes. A relevant image search engine with latefusion: Mixing the roles of textual and visual descriptors. In Proceedings of the 16thInternational Conference on Intelligent User Interfaces (IUI), pp. 455–456, 2011.
A. H. Toselli, V. Romero, M. Pastor, and E. Vidal. Multimodal interactive transcriptionof text images. Pattern Recognition, 43(5):1814–1825, 2009.
A. H. Toselli, E. Vidal, and F. Casacuberta, editors. Multimodal Interactive PatternRecognition and Applications. Springer, 1st edition, 2011.
TT2. TransType2 - computer assisted translation. project technical annex, 2001. InformationSociety Technologies (IST) Programme, IST-2001-32091.
E. Vidal, L. Rodrıguez, F. Casacuberta, and I. Garcıa-Varea. Interactive patternrecognition. In Proceedings of the 4th Joint Workshop on Multimodal Interaction andRelated Machine Learning Algorithms, pp. 60–71, 2007.
M. Villegas and R. Paredes. Image-text dataset generation for image annotation andretrieval. In II Congreso Espanol de Recuperacion de Informacion (CERI), pp. 115–120,2012.
Chapter 7
General Conclusions
The work presented in this thesis has focused on the topic of implicit interac-tion in HCI. An implicit interaction is an action a user performs with little (orno) awareness but which a computerized system can understand as input. Assuch, the role of implicit interaction consists in leveraging as much informationas possible derived from a natural user input, without requiring the user to beaware of the data the system needs to operate, i.e., in a completely transpar-ent procedure. By leveraging these implicit interactions, we can increase therichness of communication and make it possible to produce more useful applica-tions and/or services. Implicit interaction can be considered as a consequenceof ubiquitous computing, with the notable difference that is the user who takesthe initiative to interact with the system. Implicit interaction, therefore, en-ables the ability to serve a person’s information (or interaction) needs withoutbecoming a burden. Finally, implicit interaction requires no training and pro-vides context for actions. As such, it sets an interesting theoretical basis for asystematic approach to analyzing, optimizing, and enhancing a wide variety ofcomputer applications.
7.1 Summary
Five chapters have illustrated the value of implicit interaction in a series ofscenarios, namely activity tracking and video visualization (Chapter 2), behav-ioral clustering (Chapter 3), multitasking and task interruptions (Chapter 4),UI adaptation and redesign (Chapter 5), and interactive pattern recognition(Chapter 6). The main contributions of this thesis, thus, include:
1. A tracking plus hypervideo tool to understand user behavior throughimplicit interactions.
2. A method to classify web pages according to implicit interactions, to-gether with a novel algorithm for clustering sequential data.
113

114 Chapter 7. General Conclusions
3. A method to ease multitasking that is based on implicit interaction cuesas a visual remainder.
4. A method to transparently adapt a UI to the capabilities of the user (ora group of users) by mining implicit interactions.
5. A series of prototypes that implement a novel IPR framework that isguided by implicit interaction principles.
In sum, virtually any application can benefit from an implicit HCI framework.The main advantages include:
• Every user interaction may contribute to enhance system utility.
• Implicit interactions are a useful complementary tier.
• Implicit interactions can be gathered for free, without burdening the user.
• Implicit interactions are valuable to understand how people interact withcomputers.
Finally, the main drawbacks of dealing with implicit interactions can be sum-marized as follow:
• Implicit interactions do not provide always clear information.
• Some assumptions need to be made.
7.2 Future Outlook
While this thesis has researched implicit interaction in the context of web-basedHCI applications, we have just barely scratched the surface when it comes toexploiting its truly potential. Invisible (or pervasive) computing is already allaround us, making computers that fit the human environment and not the otherway round [Kaushik, 2012]. Implicit interaction can only help to contribute inthis regard by providing novel sources of perception and interpretations of theusers within their computers and devices.
Tennenhouse [2000] claimed that, over the past 40 years, computer science hasaddressed only about 2% of the world’s computing requirements. As stated byCadez et al. [2003], arguably one of the great challenges in the coming centurywill be the understanding of human behavior in the context of “digital envi-ronments”. In such a context, implicit interaction is certainly an importantstarting point. Devices that have (sometimes very limited) perceptional capa-bilities have already started the shift from explicit HCI toward a more implicitinteraction with machines [Schmidt, 2000]. This being so, implicit interaction

Additional References 115
will definitely gain more interest in HCI research, to make computers moreuseful and tailored to our needs.
It is clear that explicit interaction will continue having a primary presence insoftware applications, and that implicit interaction will be used as an additionalsource of (otherwise valuable) information. Nonetheless, probably in a (not sofar) future, desires and intentions would be enough to get computers to act onour behalf.
Additional References
I. Cadez, D. Heckerman, C. Meek, P. Smyth, and S. White. Model-based clustering andvisualization of navigation patterns on a web site. Data Mining and Knowledge Discovery,7(4):399–424, 2003.
P. Kaushik. Ubiquitous computing: Blurring the mind and machine gap. Availableat http://www.huffingtonpost.co.uk/preetam-kaushik/ubiquitous-computing-blur_
b_1520173.html, 2012. Retrieved July 23, 2012.
A. Schmidt. Implicit human-computer interaction through context. Personal and UbiquitousComputing, 4(2):191–199, 2000.
D. Tennenhouse. Proactive computing. Communications of the ACM, 43(5):43–50, 2000.


Appendix A
Research Dissemination
One of the high-level goals of this thesis is to promote dissemination of itsresearch results and the technologies discussed so far, in order to contribute tothe body of knowledge both in academia and industry.
With respect to dissemination amongst the scientific community, to date, thisthesis has generated +30 publications, most of which have been presented intop-tier venues1. To sum up, these contributions include:
• 23 conference papers,
• 3 journal papers,
• 3 workshop papers,
• 3 book chapters, and
• 2 research awards plus 1 mention.
Regarding dissemination amongst the industry, the contributions of this thesisinclude:
• 4 technology transfer projects, and
• 3 issued patents2.
Moreover, most of our results have been disseminated through videos, demon-strations, informational brochures, and informative articles in the news andpress. Some of the prototypes have been awarded in national and internationalcompetitions, and others have raised the interest of some ICT companies. This
1Conference rankings and acceptance rates are reported for the year of publication.2Not listed here because of pending status.
117

118 List of Publications
shows a clear awareness from the society to start embracing these novel tech-nologies. Furthermore, almost all developed prototypes are now part of thecatalogue of technology supply at our university: the CARTA programme3.
Finally, a number of follow-up activities should be performed, among which wehighlight: technology watch, search for additional funding sources, deploy R&Dmanagement activities, and establish strategic alliances. It is expected that, inthe medium term, these strategies will lead to novel emerging technologies andmore tech transfer projects related to a greater or a lesser extent to this thesis.
List of Publications
V. Alabau, J. M. Benedı, F. Casacuberta, L. A. Leiva, D. Ortiz-Martınez, V. Romero,
J. A. Sanchez, R. Sanchez-Saez, A. Toselli, and E. Vidal. CAT-API frameworkprototypes. In Workshops on Database and Expert Systems Applications (DEXA), pp.264–265, 2010a.
V. Alabau, F. Casacuberta, L. A. Leiva, D. Ortiz-Martınez, and G. Sanchis-Trilles.Sistema web para la traduccion automatica interactiva. In Actas del XI Congreso Inter-nacional de Interaccion Persona Ordenador (INTERACCION), pp. 47–56, 2010b. 37%acceptance.
V. Alabau, L. A. Leiva, D. Ortiz-Martınez, and F. Casacuberta. User evaluation ofinteractive machine translation systems. In Proceedings of the European Association forMachine Translation (EAMT), pp. 20–23, 2012. CORE: B. 54% acceptance.
L. A. Leiva. MouseHints: Easing task switching in parallel browsing. In Proceedings of the2011 annual conference extended abstracts on Human factors in computing systems (CHIEA), pp. 1957–1962, 2011a. CORE: A. 42% acceptance.
L. A. Leiva. Mining the browsing context: Discovering interaction profiles via behavioralclustering. In Adjunct Proceedings of the 19th conference on User Modeling, Adaptation,and Personalization (UMAP), pp. 31–33, 2011b. CORE: B. 20% acceptance.
L. A. Leiva. Restyling website design via touch-based interactions. In Proceedings of the13th International Conference on Human-Computer Interaction with Mobile Devices andServices (MobileHCI), pp. 599–604, 2011c. CORE: A. 23% acceptance.
L. A. Leiva. Interaction-based user interface redesign. In Proceedings of the 17th interna-tional conference on Intelligent User Interfaces (IUI), pp. 311–312, 2012a. CORE: A.23% acceptance.
L. A. Leiva. ACE: An adaptive CSS engine for web pages and web-based applications. InProceedings of the WWW Dev Track, 2012b. CORE: A. 45% acceptance.
L. A. Leiva. Automatic web design refinements based on collective user behavior. In Pro-ceedings of the 2012 annual conference extended abstracts on Human factors in computingsystems (CHI EA), pp. 1607–1612, 2012c. CORE: A. 45% acceptance.
L. A. Leiva and V. Alabau. Multimodal Interactive Handwritten Text Transcription, chap.A Web-based Demonstrator of Interactive Multimodal Transcription. World ScientificPublishing, 2012.
3http://www.upv.es/carta/

List of Publications 119
L. A. Leiva and E. Vidal. Assessing user’s interactions for clustering web documents:a pragmatic approach. In Proceedings of the 21st ACM conference on Hypertext andhypermedia, pp. 277–278, 2010. CORE: A. 35% acceptance.
L. A. Leiva and E. Vidal. Revisiting the K-means algorithm for fast trajectory segmen-tation. In Proceedings of the 38th International Conference on Computer Graphics andInteractive Techniques (SIGGRAPH), p. 86, 2011. CORE: A. 19% acceptance. [ACMSRC semi-finalist award].
L. A. Leiva and E. Vidal. Simple, fast, and accurate clustering of data sequences. InProceedings of the 17th international conference on Intelligent User Interfaces (IUI), pp.309–310, 2012. CORE: A. 23% acceptance.
L. A. Leiva and R. Vivo. (smt) Real time mouse tracking registration and visualization toolfor usability evaluation on websites. In Proceedings of the IADIS International Conferenceon WWW/Internet, pp. 187–192, 2007a.
L. A. Leiva and R. Vivo. (smt) Herramienta de registro y visualizacion de mouse trackingen tiempo real para evaluacion de usabilidad en sitios web. Novatica, 189(1):53–60, 2007b.
L. A. Leiva and R. Vivo. A gesture inference methodology for user evaluation based onmouse activity tracking. In Proceedings of Interfaces and Human Computer Interaction(IHCI), pp. 58–67, 2008.
L. A. Leiva and R. Vivo. Interactive hypervideo visualization for browsing behavior anal-ysis. In Proceedings of the 21st international conference companion on World Wide Web(WWW), pp. 381–384, 2012. CORE: A. 45% acceptance.
L. A. Leiva, D. Ortiz-Martınez, E. Cubel, G. Sanchis, V. Romero, R. Sanchez-Saez,
V. Alabau, A. H. Toselli, J. A. Sanchez, J. M. Benedı, E. Vidal, and F. Casacu-
berta. Nuevas tecnologıas interactivo-predictivas multimodales para el procesamiento delenguaje natural sobre internet. Valencia IDEA research competition, ICT category, 2010.[Accesit award].
L. A. Leiva, V. Alabau, V. Romero, F. M. Segarra, R. Sanchez-Saez, D. Ortiz-
Martınez, L. Rodrıguez, and N. Serrano. Multimodal Interactive Pattern Recognitionand Applications, chap. Prototypes and Demonstrators. Springer, 2011a.
L. A. Leiva, V. Romero, A. H. Toselli, and E. Vidal. Evaluating an interactive-predictiveparadigm on handwriting transcription: A case study and lessons learned. In Proceedingsof the 35th Annual IEEE Computer Software and Applications Conference (COMPSAC),pp. 610–617, 2011b. CORE: B. 20% acceptance.
L. A. Leiva, M. Villegas, and R. Paredes. Query refinement suggestion in multimodalinteractive image retrieval. In Proceedings of the 13th International Conference on Mul-timodal Interaction (ICMI), pp. 311–314, 2011c. CORE: B. 39% acceptance.
L. A. Leiva, M. Bohmer, S. Gehring, and A. Kruger. Back to the app: The costs ofmobile application interruptions. In Proceedings of the 14th International Conference onHuman-Computer Interaction with Mobile Devices and Services (MobileHCI), pp. 291–294, 2012. CORE: A. 25% acceptance.
D. Ortiz-Martınez, L. A. Leiva, V. Alabau, and F. Casacuberta. Interactive machinetranslation using a web-based architecture. In Proceedings of the 16th International Con-ference on Intelligent User Interfaces (IUI), pp. 423–425, 2010. CORE: A. 30% accep-tance.

120 List of Publications
D. Ortiz-Martınez, L. A. Leiva, V. Alabau, I. Garcıa-Varea, and F. Casacuberta.An interactive machine translation system with online learning. In Proceedings of the49th Annual Meeting of the Association for Computational Linguistics: Human LanguageTechnologies (ACL-HLT), pp. 68–73, 2011. CORE: A. 52% acceptance.
V. Romero, L. A. Leiva, V. Alabau, A. H. Toselli, and E. Vidal. A web-based demoto interactive multimodal transcription of historic text images. In Proceedings of the 13thEuropean Conference on Digital Libraries (ECDL), volume 5714 of LNCS, pp. 459–460.Springer-Verlag, 2009a. CORE: A. 21.7% acceptance. [Best demo award].
V. Romero, L. A. Leiva, A. H. Toselli, and E. Vidal. Interactive multimodal transcriptionof text images using a web-based demo system. In Proceedings of the 15th InternationalConference on Intelligent User Interfaces (IUI), pp. 477–478, 2009b. CORE: A. 29%acceptance.
R. Sanchez-Saez, L. A. Leiva, J. A. Sanchez, and J. M. Benedı. Interactive predictiveparsing using a web-based architecture. In Proceedings of the 11th Annual Conference ofthe North American Chapter of the Association for Computational Linguistics (NAACL),pp. 37–40, 2010a. CORE: A. 35% acceptance.
R. Sanchez-Saez, L. A. Leiva, J. A. Sanchez, and J. M. Benedı. IPP-Ann: An interactivetool for probabilistic parsing. In Workshops on Database and Expert Systems Applications(DEXA), pp. 255–259, 2010b.
R. Sanchez-Saez, L. A. Leiva, J. A. Sanchez, and J. M. Benedı. Seamless tree binarizationfor interactive predictive parsing. In Proceedings of VI Jornadas en Tecnologıa del Habla(FALA), pp. 47–50, 2010c.
R. Sanchez-Saez, L. A. Leiva, J. A. Sanchez, and J. M. Benedı. Interactive predictiveparsing framework for the spanish language. Sociedad Espanola para el Procesamiento delLenguaje Natural, 45(1):121–128, 2010d.
F. M. Segarra, L. A. Leiva, and R. Paredes. A relevant image search engine with latefusion: Mixing the roles of textual and visual descriptors. In Proceedings of the 16th Inter-national Conference on Intelligent User Interfaces (IUI), pp. 455–456, 2011. CORE: A.44% acceptance.
M. Villegas, L. A. Leiva, and R. Paredes. Multimodal Interaction in Image and VideoApplications, chap. Interactive Image Retrieval based on Relevance Feedback. Springer,2012. In press.

List of Figures
1.1 The implicit interaction framework 5
2.1 System architecture 21
2.2 Tracking code 22
2.3 Some hypervideo visualization examples 23
2.4 Control panel 24
2.5 Combining visualizations 25
2.6 Time charts visualization 26
2.7 Website redesign 27
3.1 A 2D example 37
3.2 The basis of WKM 39
3.3 Boundaries initialization 39
3.4 The WKM algorithm 40
3.5 Graphical overview of WKM 41
3.6 Screenshots of evaluated websites 43
3.7 Clustering the OTH dataset 44
3.8 Clustering LAKQ and NM datasets 45
3.9 Sum of squared errors against number of segments 50
3.10 Classification error comparison 50
3.11 WKM classification error 51
3.12 Computational cost against number of clusters 51
4.1 Easing attention shifts in tabbed interfaces 62
4.2 Visualization options 63
4.3 Visualization example 64
4.4 Interruption game 65
4.5 Between-groups efficiency comparison 66
121

122 List of Figures
5.1 An example of automatic web design modifications 76
5.2 Workflow diagram 77
5.3 Redesign examples 78
5.4 System architecture 79
5.5 ACE’s API definition 80
5.6 Weighting interactions example 80
5.7 Some redesign considerations 82
5.8 Questionnaire results 83
5.9 Automatic redesign examples 85
6.1 The IPR framework 91
6.2 Examples of editing operations in IPR systems 94
6.3 Interactive Handwritten Transcription prototype 95
6.4 Interactive Machine Translation prototype 95
6.5 Interactive Grammatical Parsing prototype 96
6.6 Examples of editing operations in IPR systems 97
6.7 IHT user satisfaction results 100
6.8 Dynamic linear fusion results 106
6.9 Query refinement evaluation results 107
6.10 TagCloud evaluation results 109

List of Tables
3.1 Overview of evaluated datasets 43
3.2 Clusters found in the OTH dataset 44
3.3 Clusters found in the LAKQ dataset 45
3.4 Clusters found in the NM dataset 46
3.5 Dataset used in WKM experiments 48
3.6 Summary of sequential clustering results 52
4.1 Summary of efficiency results 66
6.1 IHT results 99
6.2 IMT results, part 1 102
6.3 IMT results, part 2 104
6.4 Query refinement evaluation results, part 1 107
6.5 Query refinement evaluation results, part 2 108
123


Index
AACE, 68
API, 71adaptation, 66
automatic, 67admin site, 16Ajax, 16ambient intelligence, 4attentive interface 4
Bbehavior, 2
dynamic, 2prediction, 9
behaviorism, 2biometrics, 9BLEU, 91boundary, 33browsing
branching, 52parallel, 53tabbed, 52
Ccalm technology, 4clustering, 30
behavioral, 30incremental, 32partitional, 31sequential, 32
cognitive science, 7
collaborative filtering, 9conversation theory, 81CSS, 68
Ddata mining, 8DOM, 16, 23, 69dwell time, 22
Eevaluation
performance, 8
Ffeedback
corrective, 81relevance, 85user, 3
fusiondynamic, 95late, 94scoring, see scoring
Ggesture recognition, 8
HHCI, 2
125

126 Index
HMMs, 33HTR, 86humanism, 2hypermedia, 14
IIHT, 86implicit intentions, 4implicit interaction, 4IMT, 90infographics, 7, 18informational websites, 38input
desultory, 83structured, 83
instrumentation, 2, 15interaction
design, 3research, 8
interactive pattern recognition, 7interface analysis, 8interruption, 53IPR, 80ISO
16982:2002, 39241-11, 59, 91
JJSON, 70
KK-means, 31
Llogging, 14LZW compression, 17
Mmetrics, 21
Midas touch, 15MIPRCV, 80mockup, 75mouse tracks, 14MouseHints, 56multimodal
interaction, 80interfaces, 9
multitasking, 52curative, 54preventive, 54
NNearest-Neighbor, 43NLP, 83
Oone-size-fits-all, 66outlier, 40
Pparticipatory design, 77passive actions, 4pattern recognition, 80perceptual interface, 4POI, 87pointing devices, 15polling, 17privacy, 72proactive computing, 4
Rreallocation, 35redesign, 74RISE, 94
Sscoring, 72

Index 127
smt2, 17smt2e, 17SQE, 31subconscious awareness, 4subsymbolic behavior, 4subtrajectories, 32suggestion
query refinement, 96tag cloud, 98
SUS, 60, 88, 91
Ttrace, 33
segmentation, 34tracking
events, 16eye, 15mouse, 14
trajectory, 33
Uubiquitous computing, 4UI, 3
self-adapting, see adaptationUNIPEN, 19, 23untold feedback, 4usability
evaluation, 14studies, 14testing, 8
usage elicitation, 8user modeling, 9
Vvideo, 14
hyperfragments, 18hypernotes, 18hypervideo, 14, 17inspection, 14visualization, 14
visual design, 7
visualizationinteractive, 9
WWER, 87WKM, 34WSR, 87
XXUL, 56


About the Cover of this ThesisPerhaps the most famous image of an iceberg is the one produced in 1999 byRalph A. Clevenger, which actually is not a real image. As he pointed out ina personal communication:
The iceberg image is a composite image that I created many years ago,from four of my images, to illustrate the concept of the unseen portionof an iceberg. The two halves of the iceberg are 2 separate shots thatI took in Alaska and in Antarctica (neither is underwater). The onlyunderwater part is the background that I took off the coast of California.The sky is the last component. It took a lot of research on lighting andscale to get the iceberg to look real.
Some time later, the poster company Successories captioned the image as “TheEssence of Imagination”, with the following accompanying text: “What we caneasily see is only a small percentage of what is possible. Imagination is havingthe vision to see what is just below the surface; to picture that which is essential,but invisible to the eye”.
This image thus illustrates the concept of “what you see is not necessarily whatyou get”. For such a reason it was chosen for the cover of this thesis. Whenwe interact with someone we often just hear their words and see their (partial)behavior. It is like seeing only the tip of the iceberg: there is much more belowthe surface that we may not even be aware of. I often use this concept toillustrate the role of implicit interaction in HCI.

Related Documents