ORIGINAL PAPER Disturbance history, species diversity, and structural complexity of a temperate deciduous forest Jonathan D. Goode 1 • Carson R. Barefoot 1 • Justin L. Hart 1 • Daniel C. Dey 2 Received: 3 January 2018 / Accepted: 25 March 2018 Ó Northeast Forestry University and Springer-Verlag GmbH Germany, part of Springer Nature 2018 Abstract Stand structural complexity enhancement is an increasingly popular management objective, especially on public lands. Complex stand structures are hypothesized to support a relatively high degree of native forest diversity and be more resistant and resilient to disturbances. Com- plex structures are characterized by the presence of dead- wood and heterogeneity of tree-size classes and tree architecture. Relatively little is known about how discrete disturbance events affect structural complexity and com- positional diversity in Quercus-dominated stands at fine spatial scales (i.e. neighborhoods). We established 20 0.05 ha fixed-radius plots on the Sipsey Wilderness of William B. Bankhead National Forest in northern Alabama to quantify woody plant species composition and structure. Trees were mapped on each plot to quantify overstory structural complexity and compositional diversity. We extracted two cores from all canopy Quercus spp. C 5 cm diameter at breast height to quantify age, recruitment pul- ses, and reconstruct canopy disturbance history. Shannon species diversity in the sampled area was 1.75 for trees, 2.08 for saplings, and 1.69 for seedlings. Quercus alba had the greatest basal area, and Ostrya virginiana had the highest density. The stand exhibited a reverse J-shaped distribution with a q-factor of 1.72. The oldest Quercus dated to 1795, and the largest recruitment pulse occurred in the 1870s. The mean return interval for intermediate- severity disturbance was 38 years. Although we docu- mented no relationships between disturbance frequency and compositional diversity at the neighborhood scale (0.05 ha), less frequent disturbance was associated with higher structural complexity (r 2 = 0.258, p = 0.026) at the neighborhood scale. We suggest that localized disturbance increases species diversity and structural complexity, but these processes are manifest at the stand level and not at the neighborhood scale. We conclude that the spatial variability (i.e. size, shape, orientation, microsite condi- tions) is likely more influential on diversity and complexity than the temporal variation (frequency) of these processes at the neighborhood scale. Keywords Canopy gap Quercus (oak) Stand development Succession Abbreviations dbh Diameter at breast height ha Hectare H 0 Shannon–Weiner diversity index J Species evenness M i Species mingling index NOAA National Oceanic and Atmospheric Administration Project funding: The work was financially supported by a Joint Venture Agreement between the Northern Research Station, USDA Forest Service and the University of Alabama. The online version is available at http://www.springerlink.com Corresponding editor: Tao Xu. & Jonathan D. Goode [email protected] 1 Department of Geography, University of Alabama, Tuscaloosa, AL 35487, USA 2 Northern Research Station, USDA Forest Service, Columbia, MO 65211, USA 123 J. For. Res. https://doi.org/10.1007/s11676-018-0746-y

Welcome message from author
This document is posted to help you gain knowledge. Please leave a comment to let me know what you think about it! Share it to your friends and learn new things together.
Transcript

ORIGINAL PAPER
Disturbance history, species diversity, and structural complexityof a temperate deciduous forest
Jonathan D. Goode1 • Carson R. Barefoot1 • Justin L. Hart1 • Daniel C. Dey2
Received: 3 January 2018 / Accepted: 25 March 2018
� Northeast Forestry University and Springer-Verlag GmbH Germany, part of Springer Nature 2018
Abstract Stand structural complexity enhancement is an
increasingly popular management objective, especially on
public lands. Complex stand structures are hypothesized to
support a relatively high degree of native forest diversity
and be more resistant and resilient to disturbances. Com-
plex structures are characterized by the presence of dead-
wood and heterogeneity of tree-size classes and tree
architecture. Relatively little is known about how discrete
disturbance events affect structural complexity and com-
positional diversity in Quercus-dominated stands at fine
spatial scales (i.e. neighborhoods). We established 20
0.05 ha fixed-radius plots on the Sipsey Wilderness of
William B. Bankhead National Forest in northern Alabama
to quantify woody plant species composition and structure.
Trees were mapped on each plot to quantify overstory
structural complexity and compositional diversity. We
extracted two cores from all canopy Quercus spp. C 5 cm
diameter at breast height to quantify age, recruitment pul-
ses, and reconstruct canopy disturbance history. Shannon
species diversity in the sampled area was 1.75 for trees,
2.08 for saplings, and 1.69 for seedlings. Quercus alba had
the greatest basal area, and Ostrya virginiana had the
highest density. The stand exhibited a reverse J-shaped
distribution with a q-factor of 1.72. The oldest Quercus
dated to 1795, and the largest recruitment pulse occurred in
the 1870s. The mean return interval for intermediate-
severity disturbance was 38 years. Although we docu-
mented no relationships between disturbance frequency
and compositional diversity at the neighborhood scale
(0.05 ha), less frequent disturbance was associated with
higher structural complexity (r2 = 0.258, p = 0.026) at the
neighborhood scale. We suggest that localized disturbance
increases species diversity and structural complexity, but
these processes are manifest at the stand level and not at
the neighborhood scale. We conclude that the spatial
variability (i.e. size, shape, orientation, microsite condi-
tions) is likely more influential on diversity and complexity
than the temporal variation (frequency) of these processes
at the neighborhood scale.
Keywords Canopy gap � Quercus (oak) � Standdevelopment � Succession
Abbreviations
dbh Diameter at breast height
ha Hectare
H0 Shannon–Weiner diversity index
J Species evenness
Mi Species mingling index
NOAA National Oceanic and Atmospheric
Administration
Project funding: The work was financially supported by a Joint
Venture Agreement between the Northern Research Station, USDA
Forest Service and the University of Alabama.
The online version is available at http://www.springerlink.com
Corresponding editor: Tao Xu.
& Jonathan D. Goode
1 Department of Geography, University of Alabama,
Tuscaloosa, AL 35487, USA
2 Northern Research Station, USDA Forest Service, Columbia,
MO 65211, USA
123
J. For. Res.
https://doi.org/10.1007/s11676-018-0746-y
Introduction
Throughout the temperate zone of the United States, multi-
aged hardwood stands are often considered to be compo-
sitionally diverse and structurally complex (Tyrrell et al.
1998; Hale et al. 1999; McElhinny et al. 2005; Burrascano
et al. 2013; O’Hara 2014). Complex forest structures typ-
ically exhibit heterogeneity of tree size classes, tree
architecture, age structure, and the presence of deadwood
in variable stages of decay and modes of death (McElhinny
et al. 2005; Zenner and Peck 2018).
In this study, we define structural complexity as
heterogeneity of tree diameter and the vertical distribution
of foliage, as well as the presence of deadwood (McEl-
hinny et al. 2005). Linkages between canopy disturbance
events during stand development and their effects on
composition and structure have been analyzed at the stand
scale (e.g. Lorimer 1980; Nowacki and Abrams 1994; Hart
and Grissino-Mayer 2008; Hart et al. 2012; Ford et al.
2017). Gap- and intermediate-severity disturbances have
been found to increase the structural complexity of forests
through the establishment of new cohorts with variable
diameters and age classes. However, we know relatively
little about the relationships between canopy disturbance
events during development and compositional diversity
and structural complexity at fine spatial scales (i.e. at sub-
stand scales) (Zenner and Peck 2018).
Forest disturbances are typically classified along a
severity gradient based on spatial extent, magnitude, and
frequency and are broadly grouped into three categories:
catastrophic events (those that remove most overstory
individuals), gap-scale events (those that remove trees
individually or in small groups), and intermediate-severity
events (those that are not stand replacing, but exceed that
of gap-scale disturbances) (Oliver and Larson 1996;
Cowden et al. 2014). In most hardwood stands in the
temperate zone, the canopy disturbance regime is domi-
nated by gap-scale disturbances (Hart 2016). These events
reorganize canopy structure and the vertical distribution of
foliage and allow recruitment of additional species (Hart
and Grissino-Mayer 2009; Hardiman et al. 2011). Richards
and Hart (2011) found that 240 m2 was the threshold
beyond which canopy gaps typically closed from sub-
canopy height growth in mature Quercus stands on the
Cumberland Plateau.
By reconstructing the canopy disturbance history of a
stand, we can link spatially explicit disturbance events to
compositional and structural data to elucidate the rela-
tionships between canopy disturbance and stand conditions
at fine spatial resolutions. This information is useful to
improve our understanding of stand development and
successional patterns and processes, and to inform
silvicultural systems based on natural disturbances (Lor-
imer 1985; Coates and Burton 1997; Long 2009; O’Hara
2014).
Stand structural complexity enhancement is becoming
increasingly popular, especially on public lands (Keeton
2006; O’Hara 2014). Gap- and intermediate-severity forest
disturbances may increase structural complexity, and
enhanced structural complexity is hypothesized to increase
resistance and resilience to future perturbations, such as
intermediate-severity wind events (White and Pickett 1985;
Puettmann et al. 2009; O’Hara and Ramage 2013; Trotsiuk
et al. 2014). Disturbance also results in biotic and abiotic
legacies that depend on the spatial extent of the disturbance
event, ranging from micro- (i.e. pit and mound micro-
topgraphy) to landscape-scales (i.e. stand-age distribution)
(Jogiste et al. 2017).
Increasing structural heterogeneity results in variation in
tree species diversity, age, diameter, height, and vertical
stratification, which broadens ecosystem services such as
increased CO2 uptake, erosion control, and aesthetics
(Runkle 1981; Canham and Marks 1985; Phillips and Shure
1990; Richards and Hart 2011). Complex forest systems
are also hypothesized to be more efficient at harvesting
light than structurally homogenous forests, and therefore
may have higher net primary production and C sequestra-
tion (Duursma and Makela 2007; Hardiman et al. 2011).
Because of these benefits, interest in managing for struc-
tural complexity is increasing, but the mechanisms that
drive intra-stand structural complexity are still poorly
understood.
The purpose of this study was to investigate the distur-
bance and developmental history of an upland Quercus
stand and to examine neighborhood-scale relationships
between local canopy disturbance, woody plant diversity,
and structural complexity. The specific objectives of this
study were to: (1) quantify species composition and verti-
cal and horizontal stand structure in a mature Quercus
stand; (2) reconstruct canopy disturbance history; (3)
describe the compositional diversity and structural com-
plexity at the neighborhood scale; and (4) examine poten-
tial relationships between species diversity and structural
complexity metrics and known disturbance events. Our
results provide insight for managers that wish to promote
structural complexity in accord with natural disturbance
processes in hardwood stands.
Materials and methods
Study site
This study was conducted in the Sipsey Wilderness Area; a
10,085 ha reserve established in 1975, within the Bankhead
J. D. Goode et al.
123

National Forest in Winston and Lawrence Counties, Ala-
bama, United States. The reserve is situated on the Cum-
berland Plateau section of the Appalachian Plateau
physiographic province (Fenneman 1938) and the South-
western Appalachians (level III) ecoregion (Griffith et al.
2001). The study site is within the Central Hardwood
Forest Region (Fralish 2003). The region is geologically
composed of the Pennsylvanian Pottsville formation,
characterized by light gray, thick bedded to massive pebbly
quartzose sandstone with shale, siltstone and thin discon-
tinuous coal imbedded (GSA 2006). The topography is
strongly dissected with steep slopes and narrow ridges and
valleys so that it no longer resembles a tableland plateau
(Smalley 1979).
The regional climate is classified as humid-mesothermal
(Thornthwaite 1948). The last freeze generally occurs in
late-April and the first freeze occurs late-October with a
frost-free period between 160 and 200 days (Smalley
1979). Mean annual precipitation is 1401 mm with the
highest mean monthly precipitation of 154.8 mm in March
and the lowest mean monthly precipitation of 80.0 mm in
October (PRISM 2016). Mean annual temperature at the
study site is 16.0 �C with the highest mean monthly tem-
perature of 26.0 �C in July and the lowest mean monthly
temperature of 5.2 �C in January (PRISM 2016).
Braun (1950) described the region as a transition
between the Mixed Mesophytic Forests to the north and
mixed Quercus–Pinus Forests to the south. Zhang et al.
(1999) described 14 unique ecological communities in the
Sipsey Wilderness, and Quercus was the most dominant
and widespread genus and occurred in almost every com-
munity type. Ridges and upper slope positions are often
dominated by Pinus taeda and Pinus echinata. Hardwood
dominance typically increases with decreased slope posi-
tion and most mid-slopes are Quercus dominated. Lower
slope positions may support mesophytic species, such as
Fagus grandifolia, Liriodendron tulipifera, Magnolia
macrophylla, and Tsuga canadensis L. (Zhang et al. 1999;
Richards and Hart 2011; Parker and Hart 2014; Keasberry
et al. 2016).
For management purposes, the Sipsey Wilderness has
been divided into compartments and further subdivided
into stands in accordance with the guidelines of the US
Forest Service (USFS). Most Quercus alba stands in the
Sipsey Wilderness established between 1890 and 1905.
Prior to this, most of the BNF was harvested, and
approximately 40% of the land base was vacated farmland
(US Forest Service of Alabama 2003; Addor and Birkhoff
2004). The disturbance regime of these Q. alba stands is
characterized by frequent gap-scale disturbances, and less
frequent, intermediate-severity disturbances (Richards and
Hart 2011; Cox et al. 2016).
Field methods
We targeted a Q. alba stand in the Sipsey Wilderness that
had been utilized in prior research (Richards and Hart
2011; Cowden et al. 2014; White et al. 2015), but for which
the canopy disturbance regime was yet to be described. To
determine the stand description and location, USFS stand
boundaries were overlaid in ArcGIS v. 10.3 (ESRI 2011).
According to the USFS, the stand was dominated by Q.
alba and originated prior to 1900. The stand was ca. 70 ha.
Data were collected July–August 2016.
We established 20 fixed-radius plots that were 500-m2
(0.05 ha) in size. To ensure adequate spatial coverage to
ensure each sample plot was independent, plots were sys-
tematically placed 50 m apart along three transects, with
seven plots on two transects and six on another. Plot size
was chosen to analyze neighborhood-scale processes and
was ca. double the mean size of canopy gaps in this and
adjacent Quercus-dominated stands (Richards and Hart
2011). The spatial size of what constitutes neighborhood
scale varies in the literature, but our classification of
‘‘neighborhoods’’ was between the ranges of Frelich et al.
(1998) (10.0 m plot radius) and Boyden et al. (2012)
(16.1 m radius plots). Transect locations were determined
by choosing a starting point that was at least 50 m away
from any roadway or other anthropogenic feature that may
influence the composition and structure of the stand.
Coordinate pairs were input into a GPS as waypoints for
field navigation.
Trees were identified as live stems C 5 cm diameter at
breast height (dbh; 1.37 m from the ground). For all trees,
we recorded species, dbh, and crown class. These measures
were taken to quantify species composition and the vertical
and diameter structure of the stand. We recorded the dis-
tance and azimuth of each tree from plot center to generate
stem maps for horizontal structure metrics, using a Haglof
hypsometer and a sighting compass, respectively. Crown
classes were based on the amount of intercepted light and
were divided into four groups: dominant, co-dominant,
intermediate, or overtopped (Oliver and Larson 1996).
Saplings were identified as live stems[ 1 m in height,
but\ 5 cm in dbh within each 500-m2 plot. Saplings were
identified to species for composition and tallied for density.
Seedlings were identified as woody plants\ 1 m in height
and were inventoried in a 10-m2 nested subplot at plot
center. Deadwood (C 5 cm diameter) in each 500-m2 plot
was tallied and classified as a snag (standing dead trees
with crown fully intact), snapped stem, uprooted stem, or
log. Deadwood was assigned one of five decay classes,
following the guidelines of the Forest Inventory and
Analysis program of the USFS (FIA 2005), with ‘‘1’’
indicating least decayed, and ‘‘5’’ indicating most decayed.
Logs (without root plate) were measured for length and the
Disturbance history, species diversity, and structural complexity of a temperate deciduous…
123

diameter (C 5 cm) at the two ends of each individual
within the plot or at the point where the log intersected the
plot boundary. Uprooted stems (with root plate) were
measured for diameter 1.37 m above the root collar.
Deadwood lying outside of the plot was not included in the
volume measurements. The dbh of snags and snapped
stems was also measured.
All live stems C 20 cm dbh were cored with an incre-
ment borer to determine age and radial growth patterns. All
Quercus stems C 5 cm dbh were cored twice to determine
disturbance history via radial growth rate analysis
(Buchanan and Hart 2011). Each tree was cored at breast
height perpendicular to the slope to minimize the influence
of reaction wood.
Laboratory methods
Disturbance history
Tree core samples were air-dried and glued to wooden
mounts with the cells vertically aligned (Stokes and Smiley
1996). Each mount was sanded using a series of progres-
sively finer grit abrasives to reveal the cellular structure of
the wood surface (Orvis and Grissino-Mayer 2002). Once
processed, tree rings were dated to the calendar year of
formation. Pith estimators (Villalba and Veblen 1997) were
used to estimate inner dates on ring series that did not
contain pith but did show substantial ring curvature. Tree-
ring series from overstory (dominant and codominant,
sensu Oliver and Larson 1996) Quercus stems were used to
reconstruct disturbance history because ring boundaries are
clear, false and absent rings are uncommon, and the genus
has been used extensively for disturbance history recon-
structions (e.g. McCarthy and Bailey 1996; Nowacki and
Abrams 1997; Rubino and McCarthy 2004; Hart and
Grissino-Mayer 2008; Buchanan and Hart 2012).
To identify canopy disturbance events, raw ring-widths
of every overstory Quercus individual (n = 176 ring series)
were measured to the nearest 0.001 mm using a Velmex
measuring system (Velmex Incorporated 2009) interfaced
with the program Measure J2X (Voor Tech Consulting
2008). Each series was visually inspected and statistically
analyzed using COFECHA (Grissino-Mayer 2001), a pro-
gram that uses segmented time series correlation analysis
to ensure each ring is assigned the proper calendar year of
formation. Segments that fell below the predetermined
significance threshold (r = 0.32, p\ 0.01) were automati-
cally flagged by the program (Holmes 1983; Grissino-
Mayer 2001). Flagged series were re-inspected for possible
dating errors and dates were adjusted if necessary.
When we were certain that all tree-ring series were
accurately dated and each annual growth ring was mea-
sured, we used dendrochronological techniques to
determine the frequency, magnitude, and spatial extent of
canopy-disturbance events. The identification of release
episodes in radial growth patterns of canopy trees is the
most common dendrochronological technique to elucidate
canopy disturbance events (Lorimer 1980; Abrams and
Nowacki 1992; Fraver and White 2005; Hart et al. 2012).
We analyzed changes in raw ring-widths using a running
mean of the previous and subsequent 10 years. Release
events were identified as years where the mean annual
growth of the subsequent 10 years was C 50% (minor
release) or C 100% (major release) greater than the mean
annual growth for the prior 10 years (Lorimer and Frelich
1989), sustained for at least 1 year. This technique pro-
vides quantification of disturbances that are discrete and
localized at the neighborhood-scale, as well as canopy
disturbances that persist on the landscape for a longer
period and are theoretically larger in size. Intermediate-
severity disturbance events were identified as release
events detected in at least 25% of the plots (Nowacki and
Abrams 1997; Hart et al. 2015).
Compositional diversity and structural complexity
measures
Tree, sapling, and seedling layers were analyzed using
standard descriptors. For trees, we calculated density
(stems ha-1); relative density (contribution to total trees);
dominance (basal area, m2 ha-1); relative dominance
(contribution to total basal area); and relative importance
(sum of relative density and relative dominance) for each
species. All trees were placed into 5 cm dbh class bins to
assess the diameter distribution of the stand. Size class bins
of 5 cm dbh are most commonly used in structural analysis
(Nyland 2002), but histogram shapes must be interpreted
with caution because they are sensitive to size class interval
(Pond and Froese 2015).
Trees were grouped into four categories (Quercus-
Carya, Acer-Fagus, Ostrya virginiana, and ‘‘others’’)
based on shade tolerance and successional trends in the
Central Hardwood Forest Region (e.g. Rentch et al. 2003;
Cowden et al. 2014; Cox et al. 2016) to analyze dbh and
crown class distribution patterns. Canopy trees were
defined as dominant and co-dominant stems and sub-
canopy trees were defined as intermediate and overtopped
stems [based on Oliver and Larson (1996) crown classes].
For seedlings and saplings, we calculated relative density.
For all layers, we quantified species richness, Shannon
diversity (H0), and species evenness (J; Ludwig and Rey-
nolds 1988). Shannon diversity index is commonly used in
ecological data sets to characterize the diversity of species
in a community, to take into account the abundance and
evenness of each species. However, this index was not
originally intended for calculating the diversity of species
J. D. Goode et al.
123

(Spellerberg and Fedor 2003), and thus can be transformed
for other uses.
Species evenness is a measure of species-proportional
representation and ranges from zero to one, with zero
signifying no evenness and one signifying a complete
evenness. Volume of downed logs (no root plate) was
calculated using the method outlined by Fraver et al.
(2007). Volume of uprooted trees (root plate intact) was
calculated using species-specific allometric equations out-
lined by Woodall et al. (2011). Basal area was calculated
for all standing deadwood (snags and snaps).
CRANCOD (Pommerening 2012) was used to quantify
overstory compositional diversity and structural complex-
ity. CRANCOD produces nearest-neighbor summary
statistics and second-order characteristics using distance
and azimuth data. We ran CRANCOD on each individual
plot for neighborhood-scale complexity and all 20 plots
together for stand-wide complexity. Compositional diver-
sity indices were calculated using Mingling index (Mi) to
determine the degree of overstory species intermingling
and H0 to determine compositional diversity of species in
the overstory (Pommerening 2002).
The Mi describes the level of interspersion of species
within a stand based on the species of the four nearest
neighbors of each tree (Pommerening 2002; Kint et al.
2003; Saunders and Wagner 2008; Pastorella and Paletto
2013). Mi was calculated for each tree C 5 cm dbh and
automatically assigned values from 0 to 1 by the program
(0 for trees with the four nearest neighbors of the same
species, 1 for trees in which all four neighbors are of a
different species).
To quantify structural complexity, we calculated Mi and
H0 with dbh size classes on a 5 cm interval (i.e. each five
cm size class bin was analogous to a species) (Staudham-
mer and LeMay 2001). The treatment of edge trees can
affect the estimation of neighborhood indices such as Mi
(Pommerening and Stoyan 2006). For calculations of Mi,
we used the nearest neighbor 1 (NN1) edge correction
method because of our small sample size of trees per plot.
NN1 was chosen because buffer zones are difficult to
determine with a small sample size per plot (Pommerening
and Stoyan 2006). Instead of a fixed buffer, NN1 accounts
for the spatial arrangement of the trees nearest to plot edge.
Linking canopy history to compositional diversity
and structural complexity
To statistically compare the compositional diversity and
structural complexity measures with disturbance history,
we derived a metric for the return interval of canopy dis-
turbance for each plot. The return interval was calculated
as a ratio of the age of the oldest tree per plot by the
number of disturbance events on the plot. We used the
disturbance return ratio metric to statistically determine
how disturbance frequency correlated with pre-determined
diversity metrics. The four metrics used to test correlation
between canopy disturbance events and neighborhood-
level compositional and structural diversity were (1) tree
H0, (2) tree Mi, (3) dbh H0, and (4) dbh Mi.
To test for the assumptions of linear regression, we
tested for normality using the Shapiro-Wilkes test and
homoscedasticity using Levene’s test for equality of vari-
ances. We log transformed disturbance return ratio and tree
H0 to obtain normality in SPSS v.22 (IBM corporation
2013). Tree Mi, dbh H0, and dbh Mi were non-normal. We
ran linear regression analysis using disturbance-return ratio
and Pearson correlation for tree H0 and Spearman ranking
correlation for tree Mi, dbh H0, and dbh Mi. Because of the
lack of replications in this study, results from statistical
analysis should not be further extrapolated.
To quantify the environment in which each Quercus
stem was recruited into the canopy, each stem was cate-
gorized into one of three accession strategy classes: gap
origin with no subsequent release, gap origin followed by a
release, and understory origin followed by a release
(Rentch et al. 2003; Hart et al. 2012). Canopy recruitment
strategies were determined by comparing the average
growth of the first 20 years to the average of the subse-
quent 20 years (Nowacki and Abrams 1997). If the radial
growth of the first 20 years was less than that of the fol-
lowing 20 years, the tree was classified as establishing in
the understory. If the first 20 years exceeded the growth of
the subsequent 20-year period, the tree was classified as
establishing in a gap environment. Residence time in the
understory was calculated by the amount of time before the
first release event was experienced for each canopy tree.
Results
Species composition
We documented 599 trees ha-1 and basal area of
23.85 m2 ha-1. Species richness of trees was 38, J was
0.79 and H0 was 1.75. The most important species based on
relative importance was Q. alba (20%) followed by O.
virginiana (16%). The remaining species had a relative
importance under 10% beginning with F. grandifolia at 9%
and Acer saccharum at 6% (Table 1). The most important
genus was Quercus (33% total relative importance and
50% total relative dominance).
Quercus alba had the greatest basal area
(7.15 m2 ha-1). The quadratic mean diameter for Q. alba
was 40.7 cm, and the largest Q. alba stems was 70.5 cm
dbh. Fagus grandifolia was the second most dominant
species with a basal area of 2.44 m2 ha-1. The remaining
Disturbance history, species diversity, and structural complexity of a temperate deciduous…
123

species had dominance values under 2.002 ha-1 and rela-
tive dominance under 6%. Ostrya virginiana had a domi-
nance of 1.05 m2 ha-1 and a relative dominance of 4%.
Ostrya virginiana had the highest relative density with
163 stems ha-1 (27% relative density), nearly three times
as abundant as any other species. Quercus alba exhibited
the second highest relative density with 55 stems ha-1
(9%). Ostrya virginiana dbh ranged from 5.0 to 17.0 cm,
with 117 individuals (72% of all O. virginiana stems) in the
5–10 cm size class. Magnolia macrophylla (48 stems ha-1,
8%), F. grandifolia (45 stems ha-1, 8%), and Acer sac-
charum (41 stems ha-1, 7%) were the next three most
abundant species. These five species represented 59% of all
trees in the study area. No other species had more than 30
stems ha-1 or represented over 5% of total stems.
The canopy contained 131 trees ha-1 (dominant or
codominant crown class). Quercus spp. and Carya spp.
accounted for 67% of trees in canopy positions. The
Table 1 Density (stems ha-1) and dominance (m2 ha-1) of all live stems 5 cm dbh based on relative importance (relative density ? relative
dominance) in a Quercus stand on the Sipsey Wilderness, Alabama
Species Density (stems
ha-1)
Relative Density
(%)
Dominance
(m2 ha-1)
Relative dominance
(%)
Relative
importance
Quercus alba L. 55 9.2 7.154 30.0 39.2
Ostrya virginiana (Mill.) K.
Koch
163 27.2 1.050 4.4 31.6
Fagus grandifolia Ehrh. 45 7.5 2.437 10.2 17.7
Acer saccharum Marshall 41 6.8 1.091 4.6 11.4
Magnolia macrophylla Michx. 48 8.0 0.513 2.2 10.2
Quercus montana Willd. 18 3.0 0.951 4.0 7.0
Carya tomentosa (Lam.) Nutt. 14 2.3 0.999 4.2 6.5
Carya glabra (Mill.) Sweet 17 2.8 0.878 3.7 6.5
Quercus falcata Michx. 6 1.0 1.235 5.2 6.2
Cornus florida L. 29 4.8 0.166 0.7 5.5
Quercus coccinea Munchh. 4 0.7 1.114 4.7 5.3
Nyssa sylvatica Marshall 22 3.7 0.397 1.7 5.3
Fraxinus pennsylvanica
Marshall
12 2.0 0.775 3.2 5.3
Other spp.a 18 3.0 0.540 2.3 5.2
Quercus muehlenbergii
Engelm.
12 2.0 0.753 3.2 5.2
Liriodendron tulipifera L. 5 0.8 0.820 3.4 4.3
Carya ovata (Mill.) K. Koch 10 1.7 0.501 2.1 3.8
Ulmus rubra Muhl. 11 1.8 0.382 1.6 3.4
Oxydendrum arboreum (L.)
DC.
13 2.2 0.205 0.9 3.0
Tilia americana L. 7 1.2 0.387 1.6 2.8
Juniperus virginiana L. 4 0.7 0.383 1.6 2.3
Cercis canadensis L. 10 1.7 0.037 0.2 1.8
Quercus michauxii Nutt. 3 0.5 0.275 1.2 1.7
Acer rubrum L. 9 1.5 0.034 0.1 1.6
Quercus stellata Wangenh. 3 0.5 0.251 1.1 1.6
Pinus echinata Mill. 2 0.3 0.282 1.2 1.5
Pinus virginiana Mill. 6 1.0 0.120 0.5 1.5
Carpinus caroliniana Walter 8 1.3 0.022 0.1 1.4
Prunus serotina Ehrh. 4 0.7 0.109 0.5 1.1
Totals 599 100.00 23.861 100.0 200.0
aOther species include species that had an importance value of\ 1%. Species include Ulmus alata Michx., Quercus rubra L., Pinus taeda L.,
Sassafras albidum (Nutt.) Nees, Robinia psuedoacacia L., Celtis laevigata Wild., Acer negundo L., Juglans nigra L., Styrx grandifolia Aiton,
Castanea dentata (Marshal) Borkh, and Vibernum rufidulum Raf
J. D. Goode et al.
123

intermediate crown position contained 117 stems ha-1,
with the ‘‘others’’ category (n = 61) having the highest
abundance (Fig. 1). We documented 350 overtopped trees
ha-1 with O. virginiana composing 46% of overtopped
stems. In the Acer-Fagus taxonomic group, 20% of stems
were in canopy positions, while 80% were in sub-canopy
positions (intermediate or overtopped crown classes).
We also documented 3861 saplings ha-1 (Table 2).
Sapling species richness was 51, J was 0.73, and H0 was2.07. Ostrya virginiana and Acer rubrum had the highest
relative sapling abundances, representing 17 and 15% of all
saplings, respectively. Quercus spp. composed 77 saplings
ha-1, representing 2% of saplings. We documented 4500
seedlings ha-1. Seedling species richness was 45, J was
0.78, and H0 was 1.68, which was the lowest of the three
strata. Vibernum acerfolium composed 16% of seedling
stems ha-1, followed by O. virginiana (10%). Quercus spp.
composed 335 seedling stems ha-1, including 110 Q. alba
stems ha-1.
Stand structure
Tree diameter distribution exhibited a reverse J-shape from
small to large size classes, with the highest density of trees
in the 5 cm size class (Fig. 2). The Q factor for trees was
1.72. All taxonomic groups had stems in the smallest size
class. O. virginiana had the highest density of stems in the
5–10 cm size class with 116 stems but had no stems
[ 20 cm dbh. The diameter distributions of the Acer-Fa-
gus group and the ‘‘others’’ group both exhibited a reverse
J-shape. The Quercus-Carya group exhibited a unimodal
distribution, with the highest stem density in the 20–25 cm
size class. Only one tree (Q. alba) was C 70 cm dbh.
The oldest recorded tree (Carya tomentosa) established
in 1755 and had a dbh of 39.0 cm. The next oldest tree was
a Q. alba with an inner date of 1796 and a dbh of 45.0 cm.
Of the 99 trees that established before 1900 (17% of total
trees), 76% were either in the genus Quercus or Carya. Of
the 19 O. virginiana stems cored, the oldest had an inner
date of 1881 and a dbh of 12.9 cm, and the youngest dated
to 1990 and was 5.8 cm dbh. The tree with the largest dbh
(Q. alba, 70.5 cm dbh) established in 1825 followed by
another Q. alba with a dbh of 68.7 cm that established in
1918. The relationship between age and diameter was
r2 = 0.25 (p\ 0.001) for all trees in the Quercus genus,
r2 = 0.20 (p\ 0.01) for trees in the Carya genus, r2 = 0.35
(p\ 0.01) for trees in the Acer genus, r2 = 0.55
(p\ 0.001) for F. grandifolia, and r2 = 0.60 (p\ 0.001)
for O. virginiana (Fig. 3).
The biggest establishment pulse for Quercus and Carya
occurred in the 1870s and 1880s, with 42% of stems
establishing in this 20-year period (Fig. 3). Quercus
establishment started ca. 1800 and continued with declin-
ing establishment beginning in the early 1900s, corre-
sponding with establishment pulses of Acer spp. and F.
grandifolia. Acer saccharum had the largest establishment
pulses in the 1900s, and F. grandifolia experienced its
greatest establishment between 1870 and 1920. Ostrya
virginiana experienced its largest establishment pulse in
1950, but six individuals established in the 1930s. Ostrya
virginiana continued to show declining regeneration into
the 1990s.
Deadwood composition
We recorded 71 downed logs ha-1 and 35 uprooted stems
ha-1 that together had a total volume of 18.81 m3 ha-1.
Fig. 1 Crown class distributions per hectare by taxonomic group.
Crown classes are based on the amount of intercepted light
(overtopped, intermediate, codominant, dominant) (Oliver and Larson
1996). Note the broken y-axis in the ‘‘others’’ group. See Table 1 for
species in the ‘‘others’’ group
Disturbance history, species diversity, and structural complexity of a temperate deciduous…
123
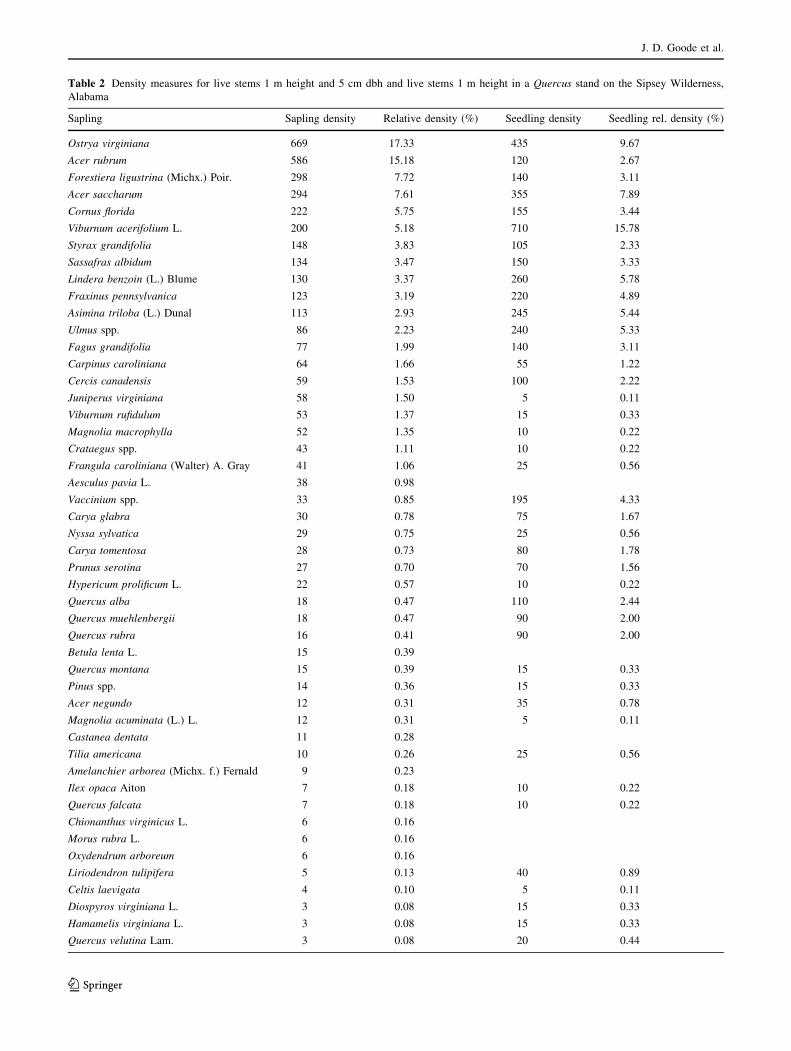
Table 2 Density measures for live stems 1 m height and 5 cm dbh and live stems 1 m height in a Quercus stand on the Sipsey Wilderness,
Alabama
Sapling Sapling density Relative density (%) Seedling density Seedling rel. density (%)
Ostrya virginiana 669 17.33 435 9.67
Acer rubrum 586 15.18 120 2.67
Forestiera ligustrina (Michx.) Poir. 298 7.72 140 3.11
Acer saccharum 294 7.61 355 7.89
Cornus florida 222 5.75 155 3.44
Viburnum acerifolium L. 200 5.18 710 15.78
Styrax grandifolia 148 3.83 105 2.33
Sassafras albidum 134 3.47 150 3.33
Lindera benzoin (L.) Blume 130 3.37 260 5.78
Fraxinus pennsylvanica 123 3.19 220 4.89
Asimina triloba (L.) Dunal 113 2.93 245 5.44
Ulmus spp. 86 2.23 240 5.33
Fagus grandifolia 77 1.99 140 3.11
Carpinus caroliniana 64 1.66 55 1.22
Cercis canadensis 59 1.53 100 2.22
Juniperus virginiana 58 1.50 5 0.11
Viburnum rufidulum 53 1.37 15 0.33
Magnolia macrophylla 52 1.35 10 0.22
Crataegus spp. 43 1.11 10 0.22
Frangula caroliniana (Walter) A. Gray 41 1.06 25 0.56
Aesculus pavia L. 38 0.98
Vaccinium spp. 33 0.85 195 4.33
Carya glabra 30 0.78 75 1.67
Nyssa sylvatica 29 0.75 25 0.56
Carya tomentosa 28 0.73 80 1.78
Prunus serotina 27 0.70 70 1.56
Hypericum prolificum L. 22 0.57 10 0.22
Quercus alba 18 0.47 110 2.44
Quercus muehlenbergii 18 0.47 90 2.00
Quercus rubra 16 0.41 90 2.00
Betula lenta L. 15 0.39
Quercus montana 15 0.39 15 0.33
Pinus spp. 14 0.36 15 0.33
Acer negundo 12 0.31 35 0.78
Magnolia acuminata (L.) L. 12 0.31 5 0.11
Castanea dentata 11 0.28
Tilia americana 10 0.26 25 0.56
Amelanchier arborea (Michx. f.) Fernald 9 0.23
Ilex opaca Aiton 7 0.18 10 0.22
Quercus falcata 7 0.18 10 0.22
Chionanthus virginicus L. 6 0.16
Morus rubra L. 6 0.16
Oxydendrum arboreum 6 0.16
Liriodendron tulipifera 5 0.13 40 0.89
Celtis laevigata 4 0.10 5 0.11
Diospyros virginiana L. 3 0.08 15 0.33
Hamamelis virginiana L. 3 0.08 15 0.33
Quercus velutina Lam. 3 0.08 20 0.44
J. D. Goode et al.
123

The majority of downed logs were in decay classes II
(n = 55) and III (n = 39), and decay class I and IV had 3
and 4 downed logs, respectively. We identified 20% of logs
to species and 22% to genus. The remaining 58% were
classified as hardwood or pine because they were in
advanced stages of decay and could not be identified to
species with confidence. Of the downed logs, 88% were
hardwood and 12% were pine (identified to lowest taxo-
nomic class possible).
We recorded 29 standing snapped stems and 3 snags. Of
the 32 snaps and snags recorded, 28 were in decay class II,
4 in decay class I, and 1 in decay class IV for a total basal
area of 1.41 m2, and dbh range of 11–45 cm. The highest
density of dead stems occurred in the 10–15 cm size class
(n = 9) with decreasing density in the larger size classes,
revealing a reverse J-shape. All dead stems were recorded
to lowest taxonomic class possible, with 72% identified to
species, 22% to genus, and the remaining 6% were iden-
tified as either hardwood or pine.
Canopy disturbance history
Of the 103 Quercus stems analyzed for age structure, 66
were in canopy dominant or co-dominant crown positions
and were used to reconstruct canopy disturbance history.
From the tree-ring series of these 66 individuals, we doc-
umented 96 release events, with 58 (88%) of the individ-
uals showing at least one release. Of the trees assessed, 36
(55%) exhibited two or more release events. The average
length of release was 8.0 ± 0.5 (SE) years. The longest
release occurred over a 22-year period in a Q. alba indi-
vidual. Of the 96 release events, 33 (34%) were classified
as major, and 63 (66%) were classified as minor. The mean
time before experiencing a release for understory origin-
gap release trees was 44.8 years. The mean interval
between release events for the sampled area was
2.4 years ± 0.4 (SE), years with consecutive releases were
common. Mean return interval of intermediate-severity
disturbance was 37.8 years ± 4.2 (SE).
We documented three intermediate-severity disturbance
events occurring from 1911 to 1913 (30% of plots),
1949–1951 (30% of plots), and 1962–1964 (25% of plots).
Two of four Quercus stems over 10 years old at the time
showed a release in the decade of 1850 (Fig. 4). A release
event was experienced by 26% of sampled trees in the 1910
decade. Between 1940 and 1960, 39% of trees at least
10 years old experienced a release (n = 26). The distribu-
tion of decadal release based on sample size showed a
sinusoidal pattern of decadal recruitment between 1900 and
2000 (Fig. 5).
Canopy Quercus stems exhibited three recruitment
strategies: gap origin-gap release, gap origin-no release,
and understory origin-gap release (Fig. 6). The understory
origin-gap release recruitment strategy was documented in
58% (n = 38) of dominant and codominant Quercus stems.
Of the dominant and codominant Quercus individuals, 30%
(n = 20) exhibited a gap origin-gap release recruitment
strategy. The gap origin-no release strategy was docu-
mented in 12% (n = 9) dominant and codominant Quercus
stems. The mean residence time in the understory was
44.8 years for gap origin-gap release trees and 26.9 years
for understory origin- gap release. The canopy Quercus
stems that established in an understory environment (58%)
resided for an average of 27 years before being released
into the canopy, whereas the canopy Quercus stems that
established in a gap (30%) resided for an average of
45 years before a subsequent canopy disturbance allowed
the stem to recruit into the canopy. The return interval for
intermediate-severity disturbance was 11 years greater than
the residence time for canopy trees that established in the
understory and 7 years less than the residence time for
canopy trees that established in a gap.
Linking canopy disturbance to compositional
diversity and structural complexity
Stand-wide species Mi was 0.77 with plot-scale values
ranging from 0.25 to 1.00. Stand-wide overstory H0 was
Table 2 continued
Sapling Sapling density Relative density (%) Seedling density Seedling rel. density (%)
Hydrangea quercifolia W. Bartram 2 0.05 15 0.33
Euonymus americanus L. 1 0.03
Fraxinus americana L. 1 0.03 20 0.44
Acer floridanum (Chapm.) Pax 5 0.11
Ligustrum sinense Lour. 10 0.22
Total 3861 100.00 4500 100.00
Disturbance history, species diversity, and structural complexity of a temperate deciduous…
123

1.77, with a plot-scale range of 0.59–2.27. Stand-wide dbh
Mi was 0.71, with plot-scale values ranging from 0.09 to
0.91. Stand-wide dbh H0 was 1.70, with plot dbh H0 valuesranging from 1.29 to 2.18 (Table 3). We found a significant
relationship between the log-transformed dbh size class H0
and log-transformed disturbance frequency using Pearson
correlation (r2 = 0.26, p = 0.03). All other metrics were
non-normal and yielded non-significant values (p[ 0.05)
for Spearman’s rank correlation with disturbance
frequency.
Fig. 2 Number of trees (C 5 cm dbh) per hectare for all species,
divided into four taxonomic groups in a Quercus stand on Sipsey
Wilderness, Alabama
Fig. 3 Diameter-age relationships for all cored trees in our 20 sample
plots in a Quercus stand on the Sipsey Wilderness, Alabama
J. D. Goode et al.
123

Discussion
Species composition
The most important tree genus was Quercus, however, it
was underrepresented in the sapling and seedling layers
relative to shade-tolerant species. The lack of Quercus and
the abundance of shade-tolerant species in the understory
(i.e. O. virginiana and A. saccharum) has been observed in
Quercus stands throughout the Central Hardwood Forest
Region of the United States (McCarthy et al. 2001;
Nowacki and Abrams 2008; McEwan et al. 2011; Hart
et al. 2012).
Indeed, one of the most pressing issues for the man-
agement of Quercus stands in the Central Hardwood Forest
Region is Quercus regeneration failure. Based on their
relative abundance, shade-tolerant species had the greatest
probability of recruiting from saplings to tree-size classes
under the current disturbance regime because of their
ability to persist in the understory until a gap-forming
disturbance (Hart and Grissino-Mayer 2009; Hart et al.
2012). In the 5–10 cm dbh size class, the abundance of O.
virginiana (39% of all such stems; nearly three times more
than any other species) and Acer spp. (18% of all such
stems) contributed to the lower diversity (H0) of trees rel-ative to saplings and seedlings. The sapling layer was the
most diverse (H0 = 2.08) and species rich (S = 51) stratum,
but it had the lowest evenness value (J = 0.73).
We attributed the richness of this layer to a diversity of
sexually mature trees in the stand and the relatively high
frequency of canopy disturbances, which may allow seed-
lings to recruit to [ 1 m in height. We attributed the
comparatively low evenness value to the abundance of O.
virginiana and A. rubrum as these two species composed
over 30% of all saplings. However, we also noted that
sapling-layer evenness, although lower than tree and
seedling strata, was still relatively high for upland Quercus
stands in the region (Hart and Grissino-Mayer 2008; Sch-
weitzer and Dey 2011). The lack of Quercus spp. in small
diameter size classes was likely a result of the abundance
of shade-tolerant individuals inhibiting the recruitment of
Quercus saplings.
Fig. 4 Decadal recruitment of trees in a Quercus stand on the Sipsey
Wilderness, Alabama
Fig. 5 Release to sample depth
ratio (%) by decade. Release
events were identified as years
where the mean annual growth
of the subsequent 10 years was
at least 50% greater than the
mean annual growth for the
prior 10 years. (Lorimer and
Frelich 1989). Sample depth is
trees at least 10 years old at the
time
Disturbance history, species diversity, and structural complexity of a temperate deciduous…
123

Stand structure
The diameter distribution for all Quercus spp. was uni-
modal, with the highest density of Quercus stems in the
20–25 cm size class. Similar results have been recorded in
other studies that also used 5 cm dbh size class bins (Hart
and Grissino-Mayer 2008; Hart et al. 2012, 2015), further
indicating that Quercus stems are failing to establish and
then recruit to larger size classes. We note that comparison
of categorical classification of diameter distributions
should be made with caution (Pond and Froese 2015). Only
110 Quercus seedlings ha-1 and 77 saplings ha-1 were
documented and combined with the lack of Quercus stems
in the small tree size classes, the results indicate Quercus
regeneration failure.
Although A. rubrum was not a common overstory spe-
cies, it was abundant in the sapling layer (669 stems ha-1).
Shade-tolerant stems (e.g. A. rubrum, O. virginiana)
revealed a reverse J-shaped diameter distribution, indicat-
ing regeneration and possible recruitment into canopy
positions following canopy disturbance. We noted a rela-
tively high density of O. virginiana, which was docu-
mented in other studies in the Sipsey Wilderness (Cowden
et al. 2014; White et al. 2015; Cox et al. 2016). Batista and
Platt (2003) noted relatively high canopy post-disturbance
densities of O. virginiana. Ostrya virginiana commonly
grows in mature stands under low-light conditions, and
rarely recruits to canopy positions (Metzger et al. 1990).
The ability of O. virginiana to persist in the sub-canopy
may inhibit certain species (notably Quercus spp.) from
regenerating. The establishment of O. virginiana and Acer
spp. could be a result of fire exclusion or changes in
grazing, or other land use, but that information is unknown.
The diameter distribution for stems C 5 cm resembled a
reverse J shape with a q-factor of 1.72, which was influ-
enced by 253 stems in the 5–10 cm dbh class, 2.26 times
the amount in the 10–15 cm size class. This change from
the smallest dbh size class to the next larger can partially
be credited to the abundance of O. virginiana, with 117
individuals in the 5–10 size class (46%). The q-factor in
our stand was similar to what has been reported in other
mulit-aged Quercus stands (Lowenstein et al. 2000; Rentch
2001). The pulse of individuals in the 35–40 cm size class
was credited to the abundance of Quercus and Carya in this
category [16 individuals out of the 26 (62%)].
Fig. 6 Line graphs of three different strategies of recruitment into the
canopy for trees in Sipsey Wilderness, Alabama. GOGR is gap origin-
gap release, GONR is gap origin-no release, and UOGR is understory
origin-gap release
Table 3 Plot-level summary
statistics of compositional
diversity and structural
complexity metrics
Composition Structure
Tree H0 Tree Mi Dbh H0 Dbh Mi BA Trees Plot-1
Mean 1.78 0.77 1.70 0.71 1.19 29.95
St. Dev. 0.40 0.17 0.21 0.20 0.30 6.37
Variance 0.16 0.03 0.04 0.04 0.09 40.58
Median 1.87 0.81 1.69 0.72 1.19 30.5
Max 2.27 1.00 2.18 0.91 1.85 39.0
Min 0.59 0.25 1.29 0.09 0.75 18.00
H0 Shannon diversity, Mi mingling index, BA basal area
J. D. Goode et al.
123

Deadwood structure
We documented a low density of snags relative to other
studies on the Cumberland Plateau in specific and Central
Hardwood Forest Region in general (McComb and Muller
1983; Parker 1989; Richards and Hart 2011; Hart et al.
2012). Of the 32 standing dead stems ha-1, 29 were
snapped and the remaining three were snags. Martin (1992)
suggested that characteristic old-growth forests typically
have at least 10 snags C 30 cm dbh ha-1; Parker (1989)
reported a range of 19–44 snags (C 30 cm dbh) ha-1. Hart
et al. (2012) documented 130 snags ha-1 C 5 cm dbh in an
old-growth Quercus forest on the Cumberland Plateau. Of
the 32 standing dead stems, we recorded four Q. alba, one
Pinus, and one Carya stem C 30 cm dbh, with the
remaining standing dead stems \ 30 cm dbh. Over half
(52%) of standing deadwood was in the genus Quercus,
representative of the dominant overstory genus.
Interestingly, McComb and Muller (1983) found that
snag densities were higher on secondary-growth sites rather
than old-growth sites on the Cumberland Plateau. Of the
three snags recorded, only one was representative of the
dominant overstory genus (a 24 cm dbh Q. montana). In
2011, an EF-1 tornado tracked through the Sipsey
Wilderness, producing wind speeds up to 153 kph and was
accompanied by fast straight-line winds (NOAA 2016).
This resulted in an intermediate-severity disturbance event
that may have removed snags from the canopy. Perhaps
some of the documented snapped stems were originally
snags that were snapped during this event. Over half of the
downed woody debris was identified as hardwood (58%)
and could not be identified further because of advanced
decay. Based on overstory composition, we speculate that a
relatively large component of the downed and decayed
hardwood stems was Quercus.
Canopy disturbance history
Only 11 of the canopy Quercus trees on our plots estab-
lished prior to 1850, and 145 established prior to land
acquisition in 1918. Of all stems that established before
1918, 59% were Quercus and 34% of such stems were Q.
alba. The decade with the largest recruitment of Quercus
was the 1870s. These stands initiated after timber har-
vesting and older trees were those that were not cut during
this event, likely because they were of low quality or too
small to be marketable at that time.
We acknowledge that inner dates may have been dif-
ferent if cores were extracted from nearer the root collar
rather than at breast height (Larsen and Johnson 1998).
However, the height of core extraction did not influence the
chronology for reconstructing the disturbance history. The
disturbance history reconstruction indicated that the
canopy disturbance regime for this stand was characterized
by infrequent intermediate-severity events superimposed
over frequent gap-scale events. Indeed, this disturbance
regime is characteristic of most Quercus stands in the
eastern United States (Hart and Cox 2017).
Of the 97 release events recorded, 78% were localized
events (i.e. asynchronous) likely involving the mortality of
a single tree or small cluster of canopy trees (Nowacki and
Abrams 1997; Hart et al. 2012), which influenced the
surrounding microenvironment only. The remaining 22%
were classed as intermediate-severity disturbance events
because of synchronous detection in multiple Quercus
individuals across the stand. These disturbances likely
consisted of a high frequency of small-canopy gaps
because the individuals that experienced a release were
spread throughout the stand (i.e. not geographically clus-
tered), with unaffected residual stems documented (Hart
2016).
Intermediate-severity disturbances were detected in the
years 1911, 1949, and 1962. The intermediate-severity
disturbances of 1949 directly altered stand structure and
provided enough light and growing space to be filled from
the understory (canopy tree recruitment) rather than being
filled by adjacent branching, commonly the case with the
more frequent yet smaller gap-scale disturbances (Richards
and Hart 2011), as evidenced by the individuals not
experiencing another release after 1949. The 1911 and
1962 intermediate-severity events likely resulted in
numerous smaller canopy gaps, evidenced by individuals
experiencing a release in years following the intermediate-
severity disturbance. These three events were not severe
enough to be stand-initiating, as evidenced by surviving
residual trees that did not experience releases. The mean
residence time for 98% (2% of Quercus established in the
understory and never experienced a release yet still made it
to the canopy) of canopy Quercus stems was 36 years,
similar to the 38-year return interval of intermediate-
severity disturbances.
As a result of the three intermediate-severity disturbance
events, 32% of sampled canopy Quercus stems ascended to
the canopy. We speculate that the 1911 intermediate-
severity disturbance event was caused by selective har-
vesting, which would have occurred prior to federal
acquisition in 1918. We are uncertain of the agents
responsible for the other intermediate-severity disturbance
events. However, we know that the region experienced
three tornado outbreaks in 1949, with one EF-4 tornado
approximately 100 km southeast of the stand, which may
have resulted in wind damage to the stand (NWS 2017). In
1948, two extratropical depressions tracked through west-
ern Mississippi and central Alabama, possibly resulting in
damaging winds that may have impacted the stand. The
1962 release event was likely caused by a localized
Disturbance history, species diversity, and structural complexity of a temperate deciduous…
123

disturbance that was not of sufficient severity to appear in
the NWS (2017) severe weather reports. Unknown for this
stand is the history of fire and grazing.
Fire is hypothesized to have been a common disturbance
process in Quercus stands of the eastern United States
(Nowacki and Abrams 2008). Prior to federal land acqui-
sition, European settlers may have burned this stand in
connection with grazing, and Quercus canopy dominance
may have been associated with these disturbances or land
uses. Regardless of the history, we know that fire has not
been a common disturbance agent since federal ownership
and we contend that the contemporary canopy disturbance
regime is analogous to that of earlier stages of stand
development.
Canopy disturbance, species diversity,
and structural complexity
One objective of this study was to determine if canopy gap
frequency influenced species diversity and structural
complexity at a fine spatial scale (i.e. neighborhood scale).
We found no significant relationships between plot-level
canopy disturbance frequency and compositional diversity.
We documented a high degree of variation in composi-
tional diversity at the neighborhood scale in relation to
canopy disturbance frequency. We suspect the composi-
tional H0 and Mi values were more likely influenced by the
stochastic spatial nature of gap-scale disturbances, rather
than the frequency of disturbance. We suggest that the
frequency of gap-scale disturbances does not necessarily
influence plot-level diversity, but rather stand-level
diversity.
The formation of a single canopy gap may not increase
alpha diversity, but at the stand level, the presence of
canopy gaps from a wide range of sizes and shapes formed
at different intervals across heterogenous site conditions
should increase gamma diversity (Hart and Grissino-Mayer
2009). Also, a release event detected in the radial growth
trends may have had a greater impact on microenviron-
mental conditions outside of our plots.
Conversely, diversity and complexity values may have
been influenced by canopy disturbances that occurred
outside, but adjacent to our plots and therefore unrecorded
in our radial growth analysis. At this latitude (ca. 34.5 N), a
gap located to the south of a plot may have allowed
increased light to reach the understory whereas, gaps that
formed in our plots may have increased insolation to the
north of the plot (Poulson and Platt 1989). The lack of high
compositional diversity in frequently disturbed plots could
also be attributed to the documented abundance of O.
virginiana and its ability to persist in the understory and
inhibit recruitment. Gap recruitment is often influenced by
species composition prior to formation rather than the
characteristics of the gap itself, which may cause compo-
sitional diversity from gaps to be variable because of the
patchy nature of propagule dispersion in many landscapes
(Midgley et al. 1995; Brown and Jennings 1998; Weber
et al. 2014).
The relationship between plot-level structural com-
plexity and disturbance frequency was more conclusive.
We documented a significant negative relationship between
structural complexity (dbh H0) and disturbance frequency.
We speculated this pattern was attributed to the presence of
large canopy trees and the presence of shade-tolerant stems
in sapling and small tree size classes. Large trees have a
greater probability of being removed in canopy disturbance
events (Peterson 2007; White et al. 2015; Cox et al. 2016)
and therefore, should be present on sites that have not
experienced canopy disturbance. Also, small and shade-
tolerant stems growing in neighborhoods with relatively
few canopy disturbances have had relatively few opportu-
nities to recruit to larger size classes.
Therefore, we speculate that a low frequency of canopy
disturbance in mature Quercus stands may increase struc-
tural complexity at the neighborhood scale by retention of
large canopy trees and suppression of small shade-tolerant
stems that would recruit to larger size classes following
canopy disturbance. In the understory re-initiation stage of
development, a high frequency of canopy disturbance at the
plot scale may actually reduce the range of tree size classes
by removing larger canopy trees that are more susceptible
to canopy disturbance and releasing small-sized stems.
However, we note that at the stand scale, the creation of
localized canopy disturbances should increase structural
complexity by creating a wide range of tree size classes and
horizontal and vertical arrangements of stems and foliage.
Although neighborhood-level complexity may decrease,
complexity between neighborhoods may increase which
would increase stand-level structural complexity (Hart and
Cox 2017).
Conclusions
The stand studied here was dominated by Q. alba and
established as the result of selective harvesting that
occurred prior to federal land acquisition in 1918. The
dominant overstory taxa (Quercus and Carya), established
starting in 1860, experienced the greatest establishment
pulse in the 1870s, with declining establishment until the
1920s. The disturbance regimes of most temperate decid-
uous forests are characterized by a high frequency of
localized and asynchronous gap-scale events, with inter-
mediate-severity disturbance events occurring every
20–50 years (Nowacki and Abrams 1997; Hart et al. 2012;
Hart and Cox 2017).
J. D. Goode et al.
123

We documented three intermediate-severity canopy
disturbance events that occurred in 1911, 1949, and 1962.
The return interval of these intermediate-severity events
was 38 years and the return interval of localized gap-scale
events was ca. 2 years. Our analysis linking disturbance
frequency to compositional diversity did not yield a sig-
nificant relationship. However, we did document a signif-
icant negative relationship between canopy disturbance
frequency and structural complexity (dbh H0) at the
neighborhood scale.
Based on these results, we speculate that a high fre-
quency of localized canopy disturbances may have mini-
mal influence on species diversity and may lower structural
complexity at the neighborhood scale. However, a high
frequency of localized canopy disturbances likely creates
heterogeneous structures and species composition at the
stand scale. Canopy gaps that vary in size, shape, and age
throughout a stand create a patchwork mosaic of neigh-
borhoods with variable structure and composition. Less
frequent disturbance allows shade-tolerant individuals to
persist in the understory and grow in a suppressed state,
allowing more structural variability between the canopy
and sub-canopy stems at the neighborhood scale.
Gap-scale disturbances are stochastic processes that
vary through space and time. We suggest that localized
disturbance increases species diversity and structural
complexity, but these processes are manifest at the stand
level and not at the neighborhood scale. The spatial vari-
ability (i.e. size, shape, orientation, and microsite condi-
tions) of these canopy gaps likely has a greater effect on
diversity and complexity than the frequency (temporal
variability) of these events at the neighborhood scale.
Increasingly, managers are interested in emulating natural
disturbance processes in silvicultural systems (Franklin
et al. 2007; Long 2009). Quercus stands in the Central
Hardwood Forest Region are often managed using an even-
aged system that treats entire stands uniformly. Our find-
ings, and those of other disturbance history studies in
Quercus stands, demonstrate that the disturbance regime is
characterized by a high frequency of gap-scale disturbance
with intermediate-severity canopy disturbances occurring
at 20–50 year intervals (Hart and Cox 2017).
Managers that wish to enhance native forest diversity,
maintain ecosystem functions, and promote stand resi-
liency using a natural disturbance-based silviculture
approach, may consider implementing even-aged treat-
ments in groups rather than uniformly through stands. The
return interval of harvest entries could be based upon the
return interval of natural intermediate-severity disturbances
in these systems (20–50 years). The group openings could
contain reserve trees at variable densities to emulate vari-
ability of natural disturbance. Group shelterwoods with
reserves at 20–50 year stand entries would seem to
resemble the disturbance regime that was documented in
this Q. alba stand and other Quercus stands in the Central
Hardwood Forest Region (Hart and Cox 2017).
A primary concern for mangers of Quercus stands
throughout the temperate zone is Quercus regeneration
failure. This is a widespread phenomenon that will have
direct and negative implications for a range of ecosystem
goods and services (Abrams and Nowacki 1992; Lorimer
1993; Nowacki and Abrams 2008; McEwan et al. 2011;
Dey 2014). Managers that wish to maintain Quercus in
stands with an abundance of shade-tolerant stems in the
seedling, sapling, and small-tree size classes may not be
able to adhere strictly to natural disturbance patterns in
their silvicultural systems. Indeed, canopy disturbance in
successional Quercus stands will likely serve to accelerate
succession toward mesophyte dominance without some
form of competition control.
Managers of Quercus stands in this condition might
focus harvest-created openings around patches of advanced
Quercus reproduction and consider intra-stand hetero-
geneity in species composition and structure. Regeneration
harvests should be timed in conjunction with competition-
reduction measures such as fire and/or herbicide applica-
tion (Schweitzer and Dey 2011; Hutchinson et al. 2012;
Brose et al. 2013). The use of herbicide, and perhaps fire,
may not have been historically part of the disturbance
regimes of Quercus stands, but in stands with an abundance
of shade-tolerant stems in the regeneration layer, these
treatments are likely needed to maintain Quercus
dominance.
Acknowledgements We thank Jonathan Kleinman and Scott Ford for
assistance in the field; the Bankhead National Forest staff for logis-
tical support; and Jonathan Kressuk and Raien Emery for assistance in
the lab.
Author’s contributions JDG, CRB, and JLH conceived and
designed the study. JDG and CRB led field data collection and data
analysis. JDG, CRB, JLH, and DCD wrote the paper.
References
Abrams MD, Nowacki GJ (1992) Historical variation in fire, oak
recruitment, and post-logging accelerates succession in central
Pennsylvania. J Torrey Bot Soc 119(1):19–28. https://doi.org/10.
2307/2996916
Addor ML, Birkhoff J (2004) Bankhead National Forest health &
restoration initiative: final report. NCSU Extension. https://
projects.ncsu.edu/nrli/decision-making/archive/documents/Bank
headFinalReport1.23.04.pdf
Batista WB, Platt WJ (2003) Tree population responses to hurricane
disturbance: syndromes in a south-eastern USA old-growth
forest. J Ecol 91(2):197–212
Boyden S, Montgomery R, Reich PB, Palik B (2012) Seeing the forest
for the heterogeneous trees: stand-scale resource distributions
emerge from tree-scale structure. Ecol Appl 22(5):1578–1588
Disturbance history, species diversity, and structural complexity of a temperate deciduous…
123

Braun EL (1950) Deciduous forests of eastern North America.
Deciduous forests of Eastern North America
Brose PH, Dey DC, Phillips RJ, Waldrop TA (2013) A meta-analysis
of the fire-oak hypothesis: does prescribed burning promote oak
reproduction in eastern North America. For Sci 59(3):322–334
Brown ND, Jennings S (1998) Gap-size niche differentiation by
tropical rainforest trees: a testable hypothesis or a broken-down
bandwagon. Dynamics of tropical communities. Blackwell,
Oxford, pp 79–94
Buchanan ML, Hart JL (2011) A methodological analysis of canopy
disturbance reconstructions using Quercus alba. Can J For Res
41(6):1359–1367. https://doi.org/10.1139/x11-057
Buchanan ML, Hart JL (2012) Canopy disturbance history of old-
growth Quercus alba sites in the eastern United States:
examination of long-term trends and broad-scale patterns. For
Ecol Manag 267:28–39. https://doi.org/10.1016/j.foreco.2011.
11.034
Burrascano S, Keeton WS, Sabatini FM, Blasi C (2013) Commonality
and variability in the structural attributes of moist temperate old-
growth forests: a global review. For Ecol Manag 291:458–479.
https://doi.org/10.1016/j.foreco.2012.11.020
Canham CD, Marks PL (1985) The response of woody plants to
disturbance patterns of establishment and growth. In: Pickett
STA, White PS (eds) The ecology of natural disturbance and
patch dynamics. Academic Press, San Diego, pp 197–216
Coates KD, Burton PJ (1997) A gap-based approach for development
of silvicultural systems to address ecosystem management
objectives. For Ecol Manag 99(3):337–354. https://doi.org/10.
1016/S0378-1127(97)00113-8
Cowden MM, Hart JL, Schweitzer CJ, Dey DC (2014) Effects of
intermediate-severity wind disturbance on composition, struc-
ture, and succession in Quercus stands: implications for natural
disturbance-based silviculture. For Ecol Manag 330:240–251.
https://doi.org/10.1016/j.foreco.2014.07.003
Cox LE, Hart JL, Dey DC, Schweitzer CJ (2016) Composition,
structure, and intra-stand spatial patterns along a disturbance
severity gradient in a Quercus stand. For Ecol Manag
381:305–317. https://doi.org/10.1016/j.foreco.2016.09.040
Dey DC (2014) Sustaining oak forests in eastern North America:
regeneration and recruitment, the pillars of sustainability. For Sci
60(5):926–942
Duursma RA, Makela A (2007) Summary models for light intercep-
tion and light-use efficiency of non-homogeneous canopies. Tree
Physiol 27(6):859–870. https://doi.org/10.1093/treephys/27.6.
859
ESRI (2011) ArcGIS Desktop: Release 10. Environmental Systems
Research Institute, Redlands
Fenneman NM (1938) Physiography of eastern United States.
McGraw-Hill Book Company Inc, New York
Ford SA, Kleinman JS, Hart JL (2017) Spatial patterns of canopy
disturbance, structure, and species composition in a multi-cohort
hardwood stand. Forests 8(3):93. https://doi.org/10.3390/
f8030093
Forest Inventory and Analysis (FIA) National Program (2005) 3.0
Phase 3 Field Guide Down Woody Materials, pp 1–38
Fralish JS (2003) The central hardwood forest: its boundaries and
physiographic provinces. In: Van Sambeek JW, Dawson JO,
Ponder F Jr., Loewenstein EF, Fralish JS (eds) Proceedings, 13th
Central Hardwood forest conference; 2002 April 1–3; Urbana,
IL. General Technical Report NC-234. US Department of
Agriculture, Forest Service, North Central Research Station,
St. Paul
Franklin JF, Mitchell RJ, Palik B (2007) Natural disturbance and
stand development principles for ecological forestry. US
Department of Agriculture, Forest Service, Northern Research
Station, Washington, p 44
Fraver S, White AS (2005) Identifying growth releases in den-
drochronological studies of forest disturbance. Can J For Res
35(7):1648–1656. https://doi.org/10.1139/x05-092
Fraver S, Ringvall A, Jonsson BG (2007) Refining volume estimates
of down woody debris. Can J For Res 37(3):627–633. https://doi.
org/10.1139/X06-269
Frelich LE, Sugita S, Reich PB, Davis MB, Friedman SK (1998)
Neighbourhood effects in forests: implications for within-stand
patch structure. J Ecol 86(1):149–161
Geological Survey of Alabama (GSA) (2006) Geologic map of
Alabama, digital version 1.0: Alabama Geological Survey
Special Map 220A [adapted from Szabo MW, Osborne WE,
Copeland CW, Neathery TL, (1988) Geologic map of Alabama
(1:250, 000): Alabama Geological Survey Special Map 220
Griffith GE, Omernik JM, Comstock JA, Lawrence S, Martin G,
Goddard A, Hulcher VJ, Foster T (2001) Ecoregions of Alabama
and Georgia (Color Poster with Map, Descriptive Text, Sum-
mary Tables, and Photographs; Map Scale 1:1,7000,000). US
Geological Survey, Reston
Grissino-Mayer HD (2001) Evaluating crossdating accuracy: a
manual and tutorial for the computer program COFECHA.
Tree-Ring Res 57:205–221
Hale CM, Pastor J, Rusterholz KA (1999) Comparison of structural
and compositional characteristics in old-growth and mature,
managed hardwood forests of Minnesota, USA. Can J For Res
29(10):1479–1489. https://doi.org/10.1139/x99-076
Hardiman BS, Bohrer G, Gough CM, Vogel CS, Curtis PS (2011) The
role of canopy structural complexity in wood net primary
production of a maturing northern deciduous forest. Ecology
92(9):1818–1827. https://doi.org/10.1890/10-2192.1
Hart JL (2016) Gap-scale disturbances in central hardwood forests
with implications for management. In: Greenberg CH, Collins
BS (eds) Natural disturbances and historic range of variation:
type, frequency, severity, and post-disturbance structure in
central hardwood forests USA. Springer, Basel
Hart JL, Cox LE (2017) Incorporating intermediate-severity distur-
bances in oak stand development. Forests 8(8):284. https://doi.
org/10.3390/f8080284
Hart JL, Grissino-Mayer HD (2008) Vegetation patterns and
dendroecology of a mixed hardwood forest on the Cumberland
Plateau: implications for stand development. For Ecol Manag
255(5):1960–1975. https://doi.org/10.1016/j.foreco.2007.12.018
Hart JL, Grissino-Mayer HD (2009) Gap-scale disturbance processes
in secondary hardwood stands on the Cumberland Plateau,
Tennessee, USA. Plant Ecol 201(1):131–146. https://doi.org/10.
1007/s11258-008-9488-9
Hart JL, Clark SL, Torreano SJ, Buchanan ML (2012) Composition,
structure, and dendroecology of an old-growth Quercus forest on
the tablelands of the Cumberland Plateau, USA. For Ecol Manag
266:11–24. https://doi.org/10.1016/j.foreco.2011.11.001
Hart JL, Cowden MM, Torreano SJ, Vestal PR (2015) Disturbance,
succession, and structural development of an upland hardwood
forest on the Interior Low Plateau, Tennessee. Nat Areas J
35(4):557–573. https://doi.org/10.3375/043.036.0102
Holmes RL (1983) Computer-assisted quality control in tree-ring
dating and measurement. Tree-ring Bull 43:69–78
Hutchinson TF, Long RP, Rebbeck J, Sutherland EK, Yaussy DA
(2012) Repeated prescribed fires alter gap-phase regeneration in
mixed-oak forests. Can J For Res 42(2):303–314
International Business Machines Corp (IBM). Released 2013. IBM
SPSS Statistics for Windows, Version 22.0. IBM Corp, Armonk
Jogiste K, Korjus H, Stanturf JA, Frelich LE, Baders E, Donis J,
Jansons A, Kangur A, Koster K, Laarmann D, Maaten T,
Marozas V, Metslaid M, Nigul K, Polyachenko O, Randveer T,
Vodde F (2017) Hemiboreal forest: natural disturbances and the
J. D. Goode et al.
123

importance of ecosystem legacies to management. Ecosphere.
https://doi.org/10.1002/ecs2.1706
Keasberry AM, Hart JL, Dey DC, Schweitzer CJ (2016) Spatial
patterns of irradiance and advanced reproduction along a canopy
disturbance severity gradient in an upland hardwood stand.
Forests 7(4):73. https://doi.org/10.3390/f7040073
Keeton WS (2006) Managing for late-successional/old-growth char-
acteristics in northern hardwood-conifer forests. For Ecol Manag
235(1):129–142. https://doi.org/10.1016/j.foreco.2006.08.005
Kint V, Van Meirvenne M, Nachtergale L, Geudens G, Lust N (2003)
Spatial methods for quantifying forest stand structure develop-
ment: a comparison between nearest-neighbor indices and
variogram analysis. For Sci 49(1):36–49
Larsen DR, Johnson PS (1998) Linking the ecology of natural oak
regeneration to silviculture. For Ecol Manag 106(1):1–7
Long JN (2009) Emulating natural disturbance regimes as a basis for
forest management: a North American view. For Ecol Manag
257(9):1868–1873. https://doi.org/10.1016/j.foreco.2008.12.019
Lorimer CG (1980) Age structure and disturbance history of a
southern Appalachian virgin forest. Ecology 61(5):1169–1184.
https://doi.org/10.2307/1936836
Lorimer CG (1985) Methodological considerations in the analysis of
forest disturbance history. Can J For Res 15(1):200–213. https://
doi.org/10.1139/x85-038
Lorimer CG (1993) Causes of the oak regeneration problem. In: Oak
regeneration: serious problems, practical recommendations.
USDA Forest Service General Technical Report SE-84, South-
eastern Forest Experiment Station, Asheville, NC, pp 14–39
Lorimer CH, Frelich LE (1989) A methodology for estimating canopy
disturbance frequency and intensity in dense temperate forests.
Can J For Res 19(5):651–663. https://doi.org/10.1139/x89-102
Lowenstein EF, Johnson PS, Garrett HE (2000) Age and diameter
structure of a managed uneven-aged oak forest. Can J For Res
30:1060–1070
Ludwig JA, Reynolds JF (1988) Statistical ecology: a primer on
methods and computing. Wiley, New York
Martin WH (1992) Characteristics of old-growth mixed mesophytic
forests. Nat Areas J 12(3):127
McCarthy BC, Bailey DR (1996) Composition, structure, and
disturbance history of Crabtree Woods: an old-growth forest f
western Maryland. Bull Torrey Bot Club 124(4):350–365.
https://doi.org/10.2307/2996783
McCarthy BC, Small CJ, RubinoDL (2001) Composition, structure and
dynamics of Dysart Woods, an old-growth mixed mesophytic
forest of southeastern Ohio. For Ecol Manag 140(2):193–213.
https://doi.org/10.1016/S0378-1127(00)00280-2
McComb WC, Muller RN (1983) Snag densities in old-growth and
second-growth Appalachian forests. J Wildl Manag
47(2):376–382. https://doi.org/10.2307/3808510
McElhinny C, Gibbons P, Brack C, Bauhus J (2005) Forest and
woodland stand structural complexity: its definition and mea-
surement. For Ecol Manag 218(1):1–24. https://doi.org/10.1016/
j.foreco.2005.08.034
McEwan RW, Dyer JM, Pederson N (2011) Multiple interacting
ecosystem drivers: toward an encompassing hypothesis of oak
forest dynamics across eastern North America. Ecography
34(2):234–256. https://doi.org/10.1111/j.1600-0587.2010.06390.x
Metzger FT, Burns RM, Honkala BH (1990) Ostrya virginiana (Mill.)
K. Koch. In: Burns RM, Honkala BH (eds) Silvics of North
America, vol 2. United States Department of Agriculture,
Washington, DC
Midgley JJ, Cameron MC, Bond WJ (1995) Gap characteristics and
replacement patterns in the Knysna Forest, South Africa. J Veg
Sci 6(1):29–36. https://doi.org/10.2307/3236253
National Oceanic and Atmospheric Administration (NOAA) Storm
Events Database—Event Details | National Centers for
Environmental Information (2016) Ncdc.noaa.gov. Retrieved
25 Aug 2017 from https://www.ncdc.noaa.gov/stormevents/
eventdetails.jsp?id=309220
National Weather Service (NWS) (2017) Alabama tornado database.
https://www.weather.gov/bmx/tornadodb_main. Accessed 21
Sept 2017
Nowacki GJ, Abrams MD (1994) Forest composition, structure, and
disturbance history of the Alan Seeger Natural Area, Huntington
County, Pennsylvania. Bull Torrey Bot Club 121(3):277–291.
https://doi.org/10.2307/2997182
Nowacki GJ, Abrams MD (1997) Radial growth averaging criteria for
reconstructing disturbance histories from presettlement-origin
oaks. Ecol Monogr 67(2):225–249. https://doi.org/10.1890/0012-
9615(1997)067
Nowacki GJ, Abrams MD (2008) The demise of fire and ‘‘mesoph-
ication’’ of forests in the eastern United States. Bioscience
58(2):123–138. https://doi.org/10.1641/B580207
Nyland RD (2002) Silviculture: concepts and applications. Waveland
Press Inc., Long Grove
O’Hara KL, Ramage BS (2013) Silviculture in an uncertain world:
Utilizing multi-aged management systems to integrate distur-
bance. Forestry 86(4):401–410. https://doi.org/10.1093/forestry/
cpt012
O’Hara KL (2014) Multiaged silviculture: managing for complex
forest stand structures. Oxford University Press, Oxford
Oliver CD, Larson BC (1996) Forest stand dynamics: updated edition.
Wiley, New York
Orvis KH, Grissino-Mayer HD (2002) Standardizing the reporting of
abrasive papers used to surface tree–ring samples. Tree-Ring Res
58(1/2):47–50
Parker GR (1989) Old–growth forests of the central hardwood region.
Nat Areas J 9(1):5–11
Parker RP, Hart JL (2014) Patterns of riparian and in–stream large
woody debris across a chronosequence of southern Appalachian
hardwood stands. Nat Areas J 34:65–78. https://doi.org/10.3375/
043.034.0108
Pastorella F, Paletto A (2013) Stand structure indices as tools to
support forest management: an application in Trentino forests
(Italy). J For Sci 59(4):159–168
Peterson CJ (2007) Consistent influence of tree diameter and species
on damage in nine eastern North America tornado blowdowns.
For Ecol Manag 250(1):96–108. https://doi.org/10.1016/j.foreco.
2007.03.013
Phillips DL, Shure DJ (1990) Patch size effects on early succession in
southern Appalachian forests. Ecology 71(1):204–212. https://
doi.org/10.2307/1940260
Pommerening A (2002) Approaches to quantifying forest structures.
Forestry 75(3):306–324. https://doi.org/10.1093/forestry/75.3.
305
Pommerening A (2012) CRANCOD: a program for the analysis and
reconstruction of spatial forest structure. Bern University of
Applied Sciences, Bern
Pommerening A, Stoyan D (2006) Edge–correction needs in
estimating indices of spatial forest structure. Can J For Res
36(7):1723–1739. https://doi.org/10.1139/x06-060
Pond NC, Froese RE (2015) Interpreting stand structure through
diameter distributions. For Sci 61(3):429–437
Poulson TL, Platt WJ (1989) Gap light regimes influence canopy tree
diversity. Ecology 70(3):553–555. https://doi.org/10.2307/
1940202
PRISM Climate Group (2016) http://www.prism.oregonstate.edu/.
Accessed 11 Nov 2016
Puettmann KJ, Coates KD, Messier C (2009) A critique of
silviculture: managing for complexity. Island Press, Washington,
p 38
Disturbance history, species diversity, and structural complexity of a temperate deciduous…
123
Rentch JS (2001) Stand dynamics and disturbance history of five oak–
dominated old–growth stands in the Unglaciated Appalachian
Plateau. Ph.D. Dissertation, West Virginia University,
Morgantown
Rentch JS, Fajvan MA, Hicks RR (2003) Oak establishment and
canopy accession strategies in five old–growth stands in the
central hardwood forest region. For Ecol Manag 184(1):285–297.
https://doi.org/10.1016/S0378-1127(03),00155-5
Richards JD, Hart JL (2011) Canopy gap dynamics and development
patterns in secondary Quercus stands on the Cumberland
Plateau, Alabama, USA. For Ecol Manag 262(12):2229–2239.
https://doi.org/10.1016/j.foreco.2011.08.015
Rubino DL, McCarthy BC (2004) Comparative analysis of dendroe-
cological methods used to assess disturbance events. Den-
drochronologia 21(3):97–115. https://doi.org/10.1078/1125.
7865.00047
Runkle JR (1981) Gap regeneration in some old-growth forests of the
eastern United States. Ecology 62(4):1041–1051. https://doi.org/
10.2307/1937003
Saunders MR, Wagner RG (2008) Long–term spatial and structural
dynamics in Acadian mixedwood stands managed under various
silvicultural systems. Can J For Res 38(3):498–517. https://doi.
org/10.1139/X07-155
Schweitzer CJ, Dey DC (2011) Forest structure, composition, and tree
diversity response to a gradient of regeneration harvests in the
mid–Cumberland Plateau escarpment region, USA. For Ecol
Manag 262(9):1729–1741. https://doi.org/10.1016/j.foreco.2011.
07.020
Smalley GW (1979) Classification and evaluation for forest sites on
the southern Cumberland Plateau. USDA, Forest Service,
Southern Forest Experiment Station, GTR SO–23, New Orleans
Spellerberg IF, Fedor PJ (2003) A tribute to Claude Shannon
(1916–2001) and a plea for more rigorous use of species
richness, species diversity and the ‘Shannon–Wiener’ Index.
Glob Ecol Biogeogr 12(3):177–179
Staudhammer CL, LeMay VM (2001) Introduction and evaluation of
possible indices of stand structural diversity. Can J For Res
31(7):1105–1115
Stokes MA, Smiley TL (1996) An introduction to Tree–ring Dating.
University of Arizona Press, Tucson
Thornthwaite CW (1948) An approach toward a rational classification
of climate. Geogr Rev 38(1):55–94. https://doi.org/10.2307/
210739
Trotsiuk V, Svoboda M, Janda P, Mikolas M, Bace R, Rejzek J,
Samonil P, Chaskovskyy O, Korol M, Myklush S (2014) A
mixed severity disturbance regime in the primary Picea abies
(L.) Karst. forests of the Ukrainian Carpathians. For Ecol Manag
334:144–153. https://doi.org/10.1016/j.foreco.2014.09.005
Tyrrell LE, Nowacki GJ, Buckley DS, Nauertz EA, Niese JN,
Rollinger JL, Zasada JC (1998) Information about old growth for
selected forest type groups in the eastern United States. US
Forest Service General Technical Report
US Forest Service of Alabama (2003) History of National Forests in
Alabama. http://www.southernregion.fs.fed.us/alabama/forests/
forest–history.htm
Velmex Inc. (2009) Velmex Measurement System
Villalba R, Veblen TT (1997) Improving estimates of total tree ages
based on increment core samples. Ecoscience 4(4):534–542
Voor Tech Consulting (2008) Measure J2X
Weber TA, Hart JL, Schweitzer CJ, Dey DC (2014) Influence of gap–
scale disturbance on developmental and successional pathways
in Quercus-Pinus stands. For Ecol Manag 331:60–70. https://doi.
org/10.1016/j.foreco.2014.08.006
White PS, Pickett STA (1985) Natural disturbance and patch
dynamics: An introduction. In: Pickett STA, White PS (eds)
The ecology and natural disturbance and patch dynamics.
Academic Press, Cambridge, pp 3–13
White SA, Hart JL, Schweitzer CJ, Dey DC (2015) Altered structural
development and accelerated succession from intermediate-scale
wind disturbance in Quercus stands on the Cumberland Plateau,
USA. For Ecol Manag 336:52–64. https://doi.org/10.1016/j.
foreco.2014.10.013
Woodall CW, Heath LS, Domke GM, Nichols MC (2011) Methods
and equations for estimating aboveground volume, biomass, and
carbon for trees in the US forest inventory; 2010
Zenner EK, Peck JE (2018) Floating neighborhoods reveal contribu-
tion of individual trees to high sub-stand scale heterogeneity. For
Ecol Manag 412:29–40. https://doi.org/10.1016/j.foreco.2018.
01.054
Zhang LJ, Oswald BP, Green TH (1999) Relationships between
overstory species and community classification of the Sipsey
Wilderness, Alabama. For Ecol Manag 114(2):337–383. https://
doi.org/10.1016/S0378-1127(98),00368-5
J. D. Goode et al.
123
Related Documents


