Skilling for the Future Skill Gap Assessment & Action Plan for Tamil Nadu District Skill Development Plan for Kanniyakumari November 2019 Tamil Nadu Skill Development Corporation, Integrated Employment Offices Campus (1st Floor) Thiru. Vi .Ka Industrial Estate, Guindy, Chennai-600 032

Welcome message from author
This document is posted to help you gain knowledge. Please leave a comment to let me know what you think about it! Share it to your friends and learn new things together.
Transcript
1
p
Skilling for the Future
Skill Gap Assessment & Action Plan for Tamil Nadu
District Skill Development Plan for Kanniyakumari
November 2019
Tamil Nadu Skill Development Corporation, Integrated Employment Offices Campus (1st Floor) Thiru. Vi .Ka Industrial Estate, Guindy, Chennai-600 032

2
3
Tamil Nadu Skill Development Corporation (TNSDC) Integrated Employment Offices Campus (1st Floor) Thiru. Vi .Ka Industrial Estate, Guindy, Chennai-600 032 T +044 2250 0107 E [email protected] W https://www.tnskill.tn.gov.in Published by TNSDC, Chennai Disclaimer The Report includes projections, forecasts and other predictive statements which are based on assumptions and expectations in the light of currently available information. These projections and forecasts are based on industry trends, circumstances and factors which involve risks, variables and uncertainties. TNSDC disclaims all warranties as to the accuracy, completeness or adequacy of such information. TNSDC and/or its Affiliates and its officers, directors and employees including the analysts/authors/advisors shall not be in any way responsible for any direct, indirect, special or consequential damages that may arise to any person from any inadvertent error in the information or judgement or opinion contained in the report nor do they take guarantee or assume liability for any omissions of the information contained therein. The projections and forecasts described in this report should be evaluated keeping in mind the fact that these are not scientifically proven to guarantee certain intended results and are not published as a warranty and do not carry any evidentiary value. Opinions expressed therein are current opinion as of the date appearing on the report only. Data may be subject to update and correction without notice. Every effort has been made to trace the owners of the copyright material included in this Report. The material in this publication is copyrighted. Reproduction or dissemination, directly or indirectly, either on paper or on electronic media, of the research data and report in any form is prohibited except with the written permission of TNSDC. The user should consult their own advisors before making use of any information or data contained in the report. The publishers would be grateful for any omissions brought to their notice for acknowledgement in future editions of the report

4

5
Acknowledgement
We extend our thanks to district officials of Kanniyakumari, youth, employers, industrial associations and
training service providers who participated in focus group discussions and surveys, for their support in
conducting research and drafting this report.

6
7
Table of Contents Executive Summary .......................................................................................................................................... 11
1. District Profile ....................................................................................................................................... 17
1.1 Demographic Profile ............................................................................................................................... 17
1.2 Economic Profile ..................................................................................................................................... 18
1.2.1 Sector wise Analysis ..................................................................................................................... 19
1.2.2 Investments and key economic drivers ......................................................................................... 22
1.3 Labour Market Profile ............................................................................................................................. 24
1.4 Education and Skill Development Profile ................................................................................................ 26
1.4.1 Education Profile ........................................................................................................................... 26
1.4.2 Vocational Education and Skill Development Profile .................................................................... 26
2. Youth Perspectives .............................................................................................................................. 29
2.1 Profile of Respondent Youth ................................................................................................................... 29
2.2 Respondent Status ................................................................................................................................. 30
2.3 Economic Activity of Respondents ......................................................................................................... 30
2.4 NEET Category Respondents ................................................................................................................ 32
2.5 Youth Aspiration ..................................................................................................................................... 32
2.6 Skill Training Preferences ....................................................................................................................... 36
3. Employers’ and Other Stakeholders’ Perspectives .......................................................................... 37
3.1 Employers’ Perspective .......................................................................................................................... 37
3.2 Other Stakeholders’ Perspective ............................................................................................................ 40
4. Skill Gap Analysis ................................................................................................................................ 43
5. Key Study Findings and Recommendations ..................................................................................... 44
5.1 District Action Plan ................................................................................................................................. 44
5.2 Key Recommendations........................................................................................................................... 57
Appendix -1 ........................................................................................................................................................ 59
A1. Methodology for Block Selection for Youth Aspiration survey ................................................................ 59
A2. Methodology for Present and Future Labour Demand – Supply and Gap Estimation ........................... 61
A3. Credit Outstanding by Occupation - Kanniyakumari .............................................................................. 63
A4. List of Stakeholders Consulted............................................................................................................... 64
8
List of Tables Table 1: Key Demographic Indicators– Kanniyakumari vs Tamil Nadu .............................................................. 17 Table 2 Sector wise- Annual Growth Rate in Kanniyakumari ............................................................................. 19 Table 3 Profile of Manufacturing Sector from ASI ............................................................................................... 20 Table 4 Existing Industrial Estate & Plants ......................................................................................................... 20 Table 5 LFPR and Unemployment Rate by Sex & Location ............................................................................... 24 Table 7 Institutions of Higher Education in Kanniyakumari District ..................................................................... 26 Table 8 Vocational Training under Short Term Skill Development Programs ..................................................... 27 Table 8 Vocational Training under Long Term Skill Development Programs (ITI) .............................................. 27 Table 10 Distribution of respondents across Monthly Income Categories by Education Level ........................... 31 Table 11 Education Qualification of Respondents and Employment Type ......................................................... 31 Table 12 NEET Category Respondents .............................................................................................................. 32 Table 13 Career Aspiration - Factors, Preparedness and Availability of Jobs .................................................... 33 Table 14 Career Aspiration – Challenges in pursuing desired career ................................................................. 33 Table 15 Key Requirements to enhance employability and steps to achieve aspirations ................................... 34 Table 16 Sectors aspired by respondents ........................................................................................................... 34 Table 17 Aspired monthly salary of respondents ................................................................................................ 35 Table 18 Preference for Work Location .............................................................................................................. 35 Table 19 Importance of different aspects of Skill Development .......................................................................... 36 Table 20 Sector wise coverage of Industries in Employer Survey ...................................................................... 37 Table 21 Modes and Challenges in Recruitment Process .................................................................................. 38 Table 22 Sector wise Incremental Demand for Skilled and Semi-Skilled Workers between 2019 and 2025...... 43

9
List of Figures Figure 1 Age-wise Population Pyramid of Kanniyakumari (2011 vs 2026) ......................................................... 18 Figure 2 Key Economic Indicators of Kanniyakumari District .............................................................................. 18 Figure 3 Sectoral Share of GVA (2012 & 2017) .................................................................................................. 19 Figure 4 Share of GVA by Industry of Origin (2016-17) ...................................................................................... 19 Figure 5 GVA of Agri and Allied Sectors (2016-17) ............................................................................................ 19 Figure 6 Crops by Share of Cultivated Area ....................................................................................................... 19 Figure 7 Industrial Sector GVA (2016-17) ........................................................................................................... 20 Figure 8 GVA of Services Sector (2016-17) ........................................................................................................ 21 Figure 9 Sector-wise growth of Credit off Take (2011-12-2016-17) - RBI ........................................................... 22 Figure 10 Key Labour Market Indicators ............................................................................................................. 24 Figure 11 Distribution of Working status by Qualification .................................................................................... 24 Figure 12 Sector-wise share of Employment ...................................................................................................... 25 Figure 13 Gross Enrolment Ratio - DISE ............................................................................................................ 26 Figure 14 Population Undergone Vocational Training – Labour Bureau ............................................................. 28 Figure 15 Respondent Profile of Youth Aspiration Survey .................................................................................. 29 Figure 16 Current Status of Respondent by Sex ................................................................................................ 30 Figure 17 Current Status of Respondent by Age Category ................................................................................. 30 Figure 18 Distribution of Respondents across Monthly Income Category across Sex ....................................... 31 Figure 19 Career Aspiration of Youth .................................................................................................................. 32 Figure 20 Sources for Job Information ................................................................................................................ 35 Figure 21 Perception on Counselling Services ................................................................................................... 35 Figure 22 Key requirements from career counselling ......................................................................................... 36 Figure 23 Distribution of Industries by Size ......................................................................................................... 37 Figure 24 Average distribution of workers by Sex ............................................................................................... 38 Figure 25 Distribution of workers by Skill Levels ................................................................................................. 38 Figure 26 Key causes of Attrition ........................................................................................................................ 38 Figure 27 Interest in working with the Govt. on Skill Development ..................................................................... 39 Figure 28 Map of Selected Blocks ...................................................................................................................... 60 Figure 29 Steps for Demand Estimation ............................................................................................................. 61 Figure 30 Steps for Supply Estimation ................................................................................................................ 62
10
List of Abbreviations
S.No Abbreviation Expanded Form
1. ASER Annual Status of Education Report
2. ASI Annual Survey of Industries
3. BFSI Banking Financial Services and Insurance Sector
4. BPL Below Poverty Line
5. DC MSME Development Commissioner, Ministry of Medium, Small and Micro Enterprises
6. DDU-SKY Deen Dayal Upadhyaya Grameen Kaushalya Yojana
7. DES Directorate of Economics and Statistics
8. DIC District Industries Centre
9. DISE District Information System for Education
10. GCC Gulf Cooperation Council
11. GDDP Gross District Domestic Product
12. GoTN Govt. of Tamil Nadu
13. GSDP Gross State Domestic Product
14. GSVA / GVA Gross State Value Added / Gross Value Added
15. ITI Industrial Training Institute
16. IT-ITES Information Technology and Information Technology Enabled Services
17. KADTISSIA Kanyakumari District Tiny and Small Scale Industries Association
18. LFPR Labour Force Participation Rate
19. Manuf. Manufacturing
20. NEET Not in Education, Employment or Training
21. NIC National Industrial Classification, 2008
22. NSDA National Skill Development Agency
23. NSDC National Skill Development Corporation
24. NSQF National Skills Qualification Framework
25. NULM National Urban Livelihood Mission
26. PMKVY Pradhan Mantri Kaushal Vikas Yojana
27. PSU Public Sector Undertaking
28. Pub. Admin. Public Administration (GDP Sector)
29. QP-NOS Qualification Pack – National Occupational Standards
30. SIPCOT State Industries Promotion Corporation of Tamil Nadu
31. SSC Sector Skill Council
32. TANSIDCO Tamil Nadu Small Industries Development Corporation
33. TIDCO Tamil Nadu Industrial Development Corporation
34. TN Tamil Nadu
35. TN-GIM Tamil Nadu Global Investors Meet
36. TNSDC Tamil Nadu Skill Development Corporation
37. TNWDC Tamil Nadu Women Development Corporation, the implementing agency of the
Tamil Nadu State Rural Livelihood Mission
38. Tr. & Tou. Trade and Tourism Sectors ( GDP Sector)
39. W / S Emp. Wage or Salary Employment
40. WPR Worker Population Ratio
11
Executive Summary Background: The Vision 2023 of Tamil Nadu envisages shaping its future by empowering the youth in the State, through imparting market relevant skill training; to become responsible and participating citizens who drive a new era of development, growth, and productivity. Tamil Nadu has formulated a State Youth Policy, which aims at reinforcing and accomplishing the broader objectives of ‘Vision Tamil Nadu 2023’. The policy focuses on upgrading the human capital of the State by building on the intellectual and creative potential of youth in various fields, thereby transforming Tamil Nadu into the innovation hub and knowledge capital of India. It also aims at enabling Tamil Nadu to collaborate with other States in the country and the rest of the world on multiple dimensions: increasing the flow of workforce and goods/services, enhancing the levels of exchange of ideas and culture, and facilitating the movement of people to and from Tamil Nadu for opportunities. To attain this objective the State envisages training and skilling of 20 million persons by 20231.
Tamil Nadu currently has the highest Gross Enrolment Ratio in Higher Education (48.6)2, among all the States in India. The State faces a mandate of developing and maintaining high quality human resources to deal with the evolving economy and ensuring social justice in the form of decent employment for its educated populace. Thus, it is essential to carefully analyse the industry demand, investment patterns, and youth aspirations and re-align policy/ programmatic initiatives in that direction. Thus, taking youth aspiration and industry growth potential is critical to be able to avoid labour demand-supply mismatch, and support overall development of the State.
Context for Present Study: In 2012, The National Skill Development Corporation commissioned a skill-gap assessment study for Tamil Nadu. The study covered 12 Districts, based on which an extrapolation was done for the remaining Districts. The study adopted a mix of secondary and primary research and relied largely on focus group discussions with various stakeholder groups such as youth, employers, industry associations, government officials, and skill training providers. Skill gaps were estimated for a period of 10 years, up to FY 2022. Given the rapid change in the state’s social and economic context, there was a need for a fresh assessment of the State’s skill ecosystem. There is also a need to understand the needs of the youth from diverse geographical backgrounds across the State, especially reaching out to economically backward regions. It is expected that a contemporary estimation, using both quantitative and qualitative analysis would reveal relevant insights and findings related to the demographic profile, socio-economic characteristics of the youth, emerging sectors and job roles, and the skill-sets in demand.
The Present Study: The Tamil Nadu Skill Development Corporation (TNSDC) has, through a competitive procurement process engaged PricewaterhouseCoopers Private Limited (PwC) to carry out “Skill Gap Assessment Study and Skill Development Action Plan for Tamil Nadu”. This is the first time such a comprehensive State-wide study taking into consideration 6 blocks from each District has been attempted in Tamil Nadu. The study aims at identifying sources for self and wage employment in all 32 Districts, estimating the sector-wise current and future labour demand (over the next six years) by industry, and assessing the overall the labour supply and estimating the existing and emerging skill gaps.
The Skill-Gap Assessment study offers insights into: (i) which skills are required to support the State’s economic growth, while also catering to the career aspirations of the youth; and (ii) how to design appropriate interventions that will enable active collaboration between various stakeholders for the common good. Workforce demand-projection for the upcoming years, disaggregated as skilled and semi-skilled workforce requirement has been estimated at the District level.
Methodology for Study: Mixed-method research design is adopted encompassing a blend of quantitative and qualitative data collection techniques, and desk research on secondary data sources. Structured into two phases, the first phase of the study comprised a comprehensive desk review of the State’s demography, economy, labour market, educational and skill development profile. The second phase of the study comprised the following:
1. Youth aspiration survey: a quantitative survey covering 360 youth in each District across the following groups – engaged in economic activity (self-employed, wage-employed, entrepreneurs), students in formal education, vocational and skill training institutions (Polytechnics, ITI), and those who fall under the Not in Education, Employment or Training (NEET) category. Six blocks in the District were covered viz. Thiruvattar, Rajakkamangalam, Thovalai, Melpuram, Agastiswaram, and Munchira.
2. Quantitative employer survey: covering 46 units in the District with adequate representation from Large, Medium, Small and Micro Industries across the key sectors defining the District economy.
1 Tamil Nadu Skill Development Corporation [https://www.tnskill.tn.gov.in/index.php/link/abouttnsdc] 2 All India Survey on Higher Education 2017-18
12
3. Focus Group Discussions (FGD’s) and stakeholder consultations across a wide group of stakeholders including, representatives from Industrial units (with additional focus on MSME sector), District-level Industry Associations across priority sectors, officials from various government departments, representatives from various higher education institutions, and training service providers. In all, interactions with more than 20 stakeholders have been conducted across the District.
Estimation of labour demand and supply were undertaken based on analysis of data from, the Census of India, State and District Gross Domestic Product from the Department of Economics and Statistics of Government of Tamil Nadu, data from the Reserve Bank of India and Reports from the National Sample Survey and the Bureau of Labour and Employment. Estimates were further refined based on data on investments, and developments in key sectors, including due consideration to emerging sectors and job roles. The sectors and job roles in demand have been organized into training projects, which are informed by the demand estimations, quantitative survey findings and qualitative consultations. Budgets have been estimated based on the cost categories as defined in the Common Cost Norms released by the Ministry of Skill Development and Entrepreneurship, Government of India. Key Findings:
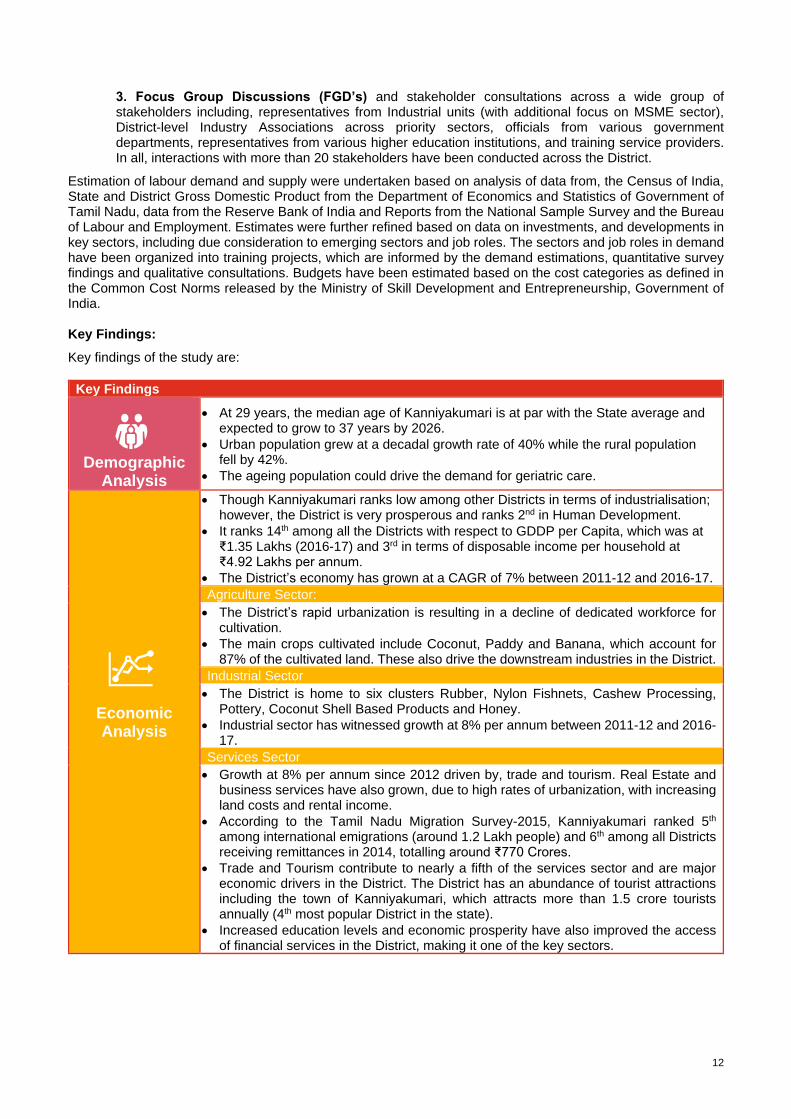
Key findings of the study are:
Key Findings
Demographic Analysis
• At 29 years, the median age of Kanniyakumari is at par with the State average and expected to grow to 37 years by 2026.
• Urban population grew at a decadal growth rate of 40% while the rural population fell by 42%.
• The ageing population could drive the demand for geriatric care.
Economic Analysis
• Though Kanniyakumari ranks low among other Districts in terms of industrialisation; however, the District is very prosperous and ranks 2nd in Human Development.
• It ranks 14th among all the Districts with respect to GDDP per Capita, which was at ₹1.35 Lakhs (2016-17) and 3rd in terms of disposable income per household at ₹4.92 Lakhs per annum.
• The District’s economy has grown at a CAGR of 7% between 2011-12 and 2016-17.
Agriculture Sector:
• The District’s rapid urbanization is resulting in a decline of dedicated workforce for cultivation.
• The main crops cultivated include Coconut, Paddy and Banana, which account for 87% of the cultivated land. These also drive the downstream industries in the District.
Industrial Sector
• The District is home to six clusters Rubber, Nylon Fishnets, Cashew Processing, Pottery, Coconut Shell Based Products and Honey.
• Industrial sector has witnessed growth at 8% per annum between 2011-12 and 2016-17.
Services Sector
• Growth at 8% per annum since 2012 driven by, trade and tourism. Real Estate and business services have also grown, due to high rates of urbanization, with increasing land costs and rental income.
• According to the Tamil Nadu Migration Survey-2015, Kanniyakumari ranked 5th among international emigrations (around 1.2 Lakh people) and 6th among all Districts receiving remittances in 2014, totalling around ₹770 Crores.
• Trade and Tourism contribute to nearly a fifth of the services sector and are major economic drivers in the District. The District has an abundance of tourist attractions including the town of Kanniyakumari, which attracts more than 1.5 crore tourists annually (4th most popular District in the state).
• Increased education levels and economic prosperity have also improved the access of financial services in the District, making it one of the key sectors.
13
Key Findings
Labour Market Analysis
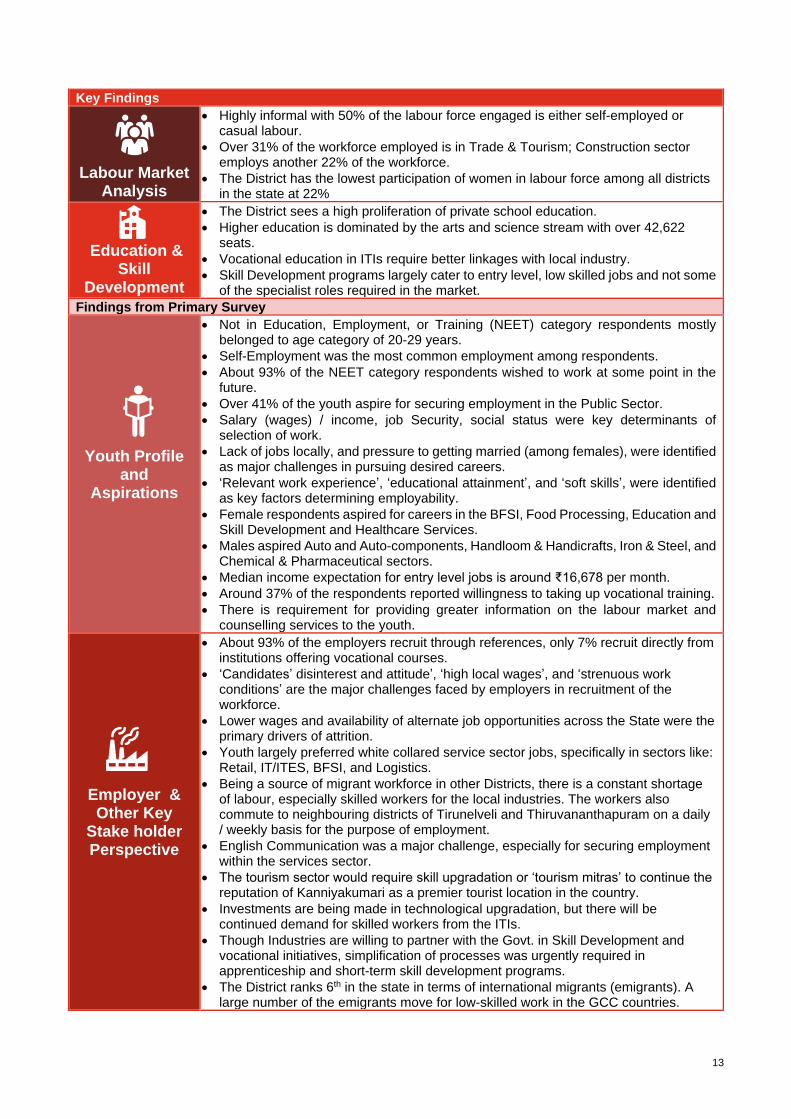
• Highly informal with 50% of the labour force engaged is either self-employed or casual labour.
• Over 31% of the workforce employed is in Trade & Tourism; Construction sector employs another 22% of the workforce.
• The District has the lowest participation of women in labour force among all districts in the state at 22%
Education & Skill
Development
• The District sees a high proliferation of private school education.
• Higher education is dominated by the arts and science stream with over 42,622 seats.
• Vocational education in ITIs require better linkages with local industry.
• Skill Development programs largely cater to entry level, low skilled jobs and not some of the specialist roles required in the market.
Findings from Primary Survey
Youth Profile and
Aspirations
• Not in Education, Employment, or Training (NEET) category respondents mostly belonged to age category of 20-29 years.
• Self-Employment was the most common employment among respondents.
• About 93% of the NEET category respondents wished to work at some point in the future.
• Over 41% of the youth aspire for securing employment in the Public Sector.
• Salary (wages) / income, job Security, social status were key determinants of selection of work.
• Lack of jobs locally, and pressure to getting married (among females), were identified as major challenges in pursuing desired careers.
• ‘Relevant work experience’, ‘educational attainment’, and ‘soft skills’, were identified as key factors determining employability.
• Female respondents aspired for careers in the BFSI, Food Processing, Education and Skill Development and Healthcare Services.
• Males aspired Auto and Auto-components, Handloom & Handicrafts, Iron & Steel, and Chemical & Pharmaceutical sectors.
• Median income expectation for entry level jobs is around ₹16,678 per month.
• Around 37% of the respondents reported willingness to taking up vocational training.
• There is requirement for providing greater information on the labour market and counselling services to the youth.
Employer & Other Key
Stake holder Perspective
• About 93% of the employers recruit through references, only 7% recruit directly from institutions offering vocational courses.
• ‘Candidates’ disinterest and attitude’, ‘high local wages’, and ‘strenuous work conditions’ are the major challenges faced by employers in recruitment of the workforce.
• Lower wages and availability of alternate job opportunities across the State were the primary drivers of attrition.
• Youth largely preferred white collared service sector jobs, specifically in sectors like: Retail, IT/ITES, BFSI, and Logistics.
• Being a source of migrant workforce in other Districts, there is a constant shortage of labour, especially skilled workers for the local industries. The workers also commute to neighbouring districts of Tirunelveli and Thiruvananthapuram on a daily / weekly basis for the purpose of employment.
• English Communication was a major challenge, especially for securing employment within the services sector.
• The tourism sector would require skill upgradation or ‘tourism mitras’ to continue the reputation of Kanniyakumari as a premier tourist location in the country.
• Investments are being made in technological upgradation, but there will be continued demand for skilled workers from the ITIs.
• Though Industries are willing to partner with the Govt. in Skill Development and vocational initiatives, simplification of processes was urgently required in apprenticeship and short-term skill development programs.
• The District ranks 6th in the state in terms of international migrants (emigrants). A large number of the emigrants move for low-skilled work in the GCC countries.
14
Key Findings
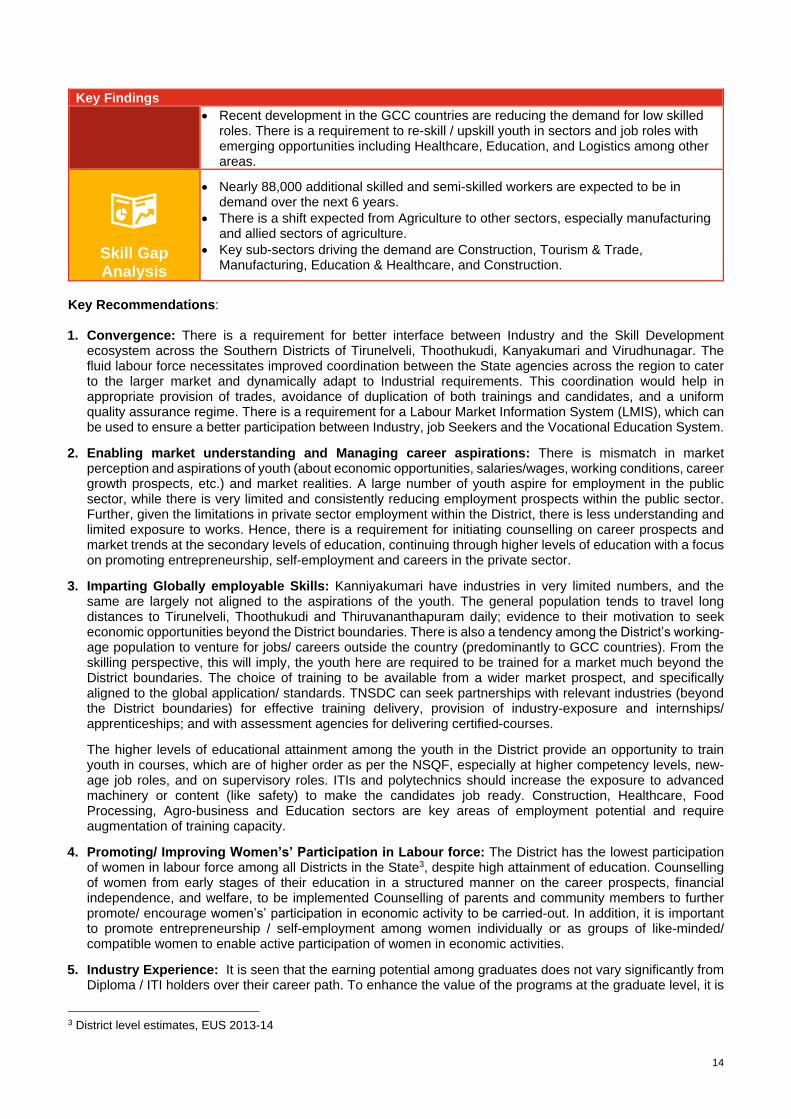
• Recent development in the GCC countries are reducing the demand for low skilled roles. There is a requirement to re-skill / upskill youth in sectors and job roles with emerging opportunities including Healthcare, Education, and Logistics among other areas.
Skill Gap Analysis
• Nearly 88,000 additional skilled and semi-skilled workers are expected to be in demand over the next 6 years.
• There is a shift expected from Agriculture to other sectors, especially manufacturing and allied sectors of agriculture.
• Key sub-sectors driving the demand are Construction, Tourism & Trade, Manufacturing, Education & Healthcare, and Construction.
Key Recommendations: 1. Convergence: There is a requirement for better interface between Industry and the Skill Development
ecosystem across the Southern Districts of Tirunelveli, Thoothukudi, Kanyakumari and Virudhunagar. The fluid labour force necessitates improved coordination between the State agencies across the region to cater to the larger market and dynamically adapt to Industrial requirements. This coordination would help in appropriate provision of trades, avoidance of duplication of both trainings and candidates, and a uniform quality assurance regime. There is a requirement for a Labour Market Information System (LMIS), which can be used to ensure a better participation between Industry, job Seekers and the Vocational Education System.
2. Enabling market understanding and Managing career aspirations: There is mismatch in market perception and aspirations of youth (about economic opportunities, salaries/wages, working conditions, career growth prospects, etc.) and market realities. A large number of youth aspire for employment in the public sector, while there is very limited and consistently reducing employment prospects within the public sector. Further, given the limitations in private sector employment within the District, there is less understanding and limited exposure to works. Hence, there is a requirement for initiating counselling on career prospects and market trends at the secondary levels of education, continuing through higher levels of education with a focus on promoting entrepreneurship, self-employment and careers in the private sector.
3. Imparting Globally employable Skills: Kanniyakumari have industries in very limited numbers, and the same are largely not aligned to the aspirations of the youth. The general population tends to travel long distances to Tirunelveli, Thoothukudi and Thiruvananthapuram daily; evidence to their motivation to seek economic opportunities beyond the District boundaries. There is also a tendency among the District’s working-age population to venture for jobs/ careers outside the country (predominantly to GCC countries). From the skilling perspective, this will imply, the youth here are required to be trained for a market much beyond the District boundaries. The choice of training to be available from a wider market prospect, and specifically aligned to the global application/ standards. TNSDC can seek partnerships with relevant industries (beyond the District boundaries) for effective training delivery, provision of industry-exposure and internships/ apprenticeships; and with assessment agencies for delivering certified-courses.
The higher levels of educational attainment among the youth in the District provide an opportunity to train youth in courses, which are of higher order as per the NSQF, especially at higher competency levels, new-age job roles, and on supervisory roles. ITIs and polytechnics should increase the exposure to advanced machinery or content (like safety) to make the candidates job ready. Construction, Healthcare, Food Processing, Agro-business and Education sectors are key areas of employment potential and require augmentation of training capacity.
4. Promoting/ Improving Women’s’ Participation in Labour force: The District has the lowest participation of women in labour force among all Districts in the State3, despite high attainment of education. Counselling of women from early stages of their education in a structured manner on the career prospects, financial independence, and welfare, to be implemented Counselling of parents and community members to further promote/ encourage women’s’ participation in economic activity to be carried-out. In addition, it is important to promote entrepreneurship / self-employment among women individually or as groups of like-minded/ compatible women to enable active participation of women in economic activities.
5. Industry Experience: It is seen that the earning potential among graduates does not vary significantly from Diploma / ITI holders over their career path. To enhance the value of the programs at the graduate level, it is
3 District level estimates, EUS 2013-14

15
necessary to strengthen the exposure to work environments among both technical and non-technical programs through mandatory hands-on training at appropriate organizations in the industrial and services sectors. In addition, it is necesssary to ensure trainers are also updated on the recent trends in the Industry through special training programs.
6. Augmenting Labour at MSMEs: MSMEs have highlighted the unavailability of local labour due to large-scale international, inter-state and intra-state migrations of skilled workers. The Apprenticeship scheme or wage subsidies on the lines of MGNREGA could be designed for supporting the local Industry to channelize labour towards them.
7. Fostering Traditional Sectors: There is considerable potential for value added products in Agro-based industries including Coir Mat Production, Jute Bags, and Banana related products. Pechiparai and other areas around Kulasekaram houses tribal population and would require additional focus in encouraging participation in labour force. Fishermen would require training in aquaculture and food processing to diversify their livelihood prospects and increase productivity.

16
17
1. District Profile
1.1 Demographic Profile
The District of Kanniyakumari is the southernmost District of mainland India. It is completely enclosed by the
Tirunelveli District (in the north and north-east), the Thiruvananthapuram District of Kerala (in the west and north-
west) and bound by the Lakshadweep Sea in the South. The rich cultural heritage, the geographical location and
diversity makes the District one of the most popular tourist centres in the Country. The District is headquartered
at Nagercoil. Among all Districts in the State, the District ranks first in literacy, and second in population density
and urbanization. It also tops the State in Human Development Index.4
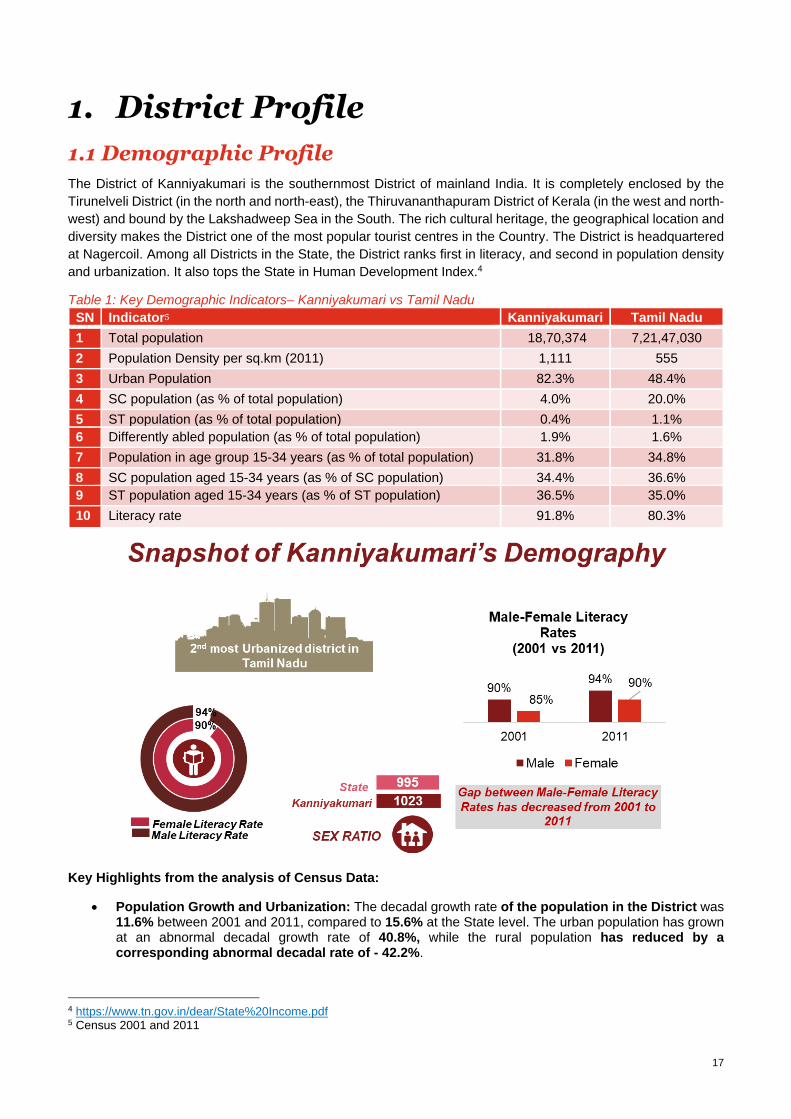
Table 1: Key Demographic Indicators– Kanniyakumari vs Tamil Nadu
SN Indicator5 Kanniyakumari Tamil Nadu
1 Total population 18,70,374 7,21,47,030
2 Population Density per sq.km (2011) 1,111 555
3 Urban Population 82.3% 48.4%
4 SC population (as % of total population) 4.0% 20.0%
5 ST population (as % of total population) 0.4% 1.1%
6 Differently abled population (as % of total population) 1.9% 1.6%
7 Population in age group 15-34 years (as % of total population) 31.8% 34.8%
8 SC population aged 15-34 years (as % of SC population) 34.4% 36.6%
9 ST population aged 15-34 years (as % of ST population) 36.5% 35.0%
10 Literacy rate 91.8% 80.3%
Key Highlights from the analysis of Census Data:
• Population Growth and Urbanization: The decadal growth rate of the population in the District was 11.6% between 2001 and 2011, compared to 15.6% at the State level. The urban population has grown at an abnormal decadal growth rate of 40.8%, while the rural population has reduced by a corresponding abnormal decadal rate of - 42.2%.
4 https://www.tn.gov.in/dear/State%20Income.pdf 5 Census 2001 and 2011
18
• Literacy: The disparity between male and female literacy rates reduced from 2001 to 2011. The literacy rate of male and female increased from 90.4% and 84.8% in 2001 to 93.7% and 89.9% respectively.
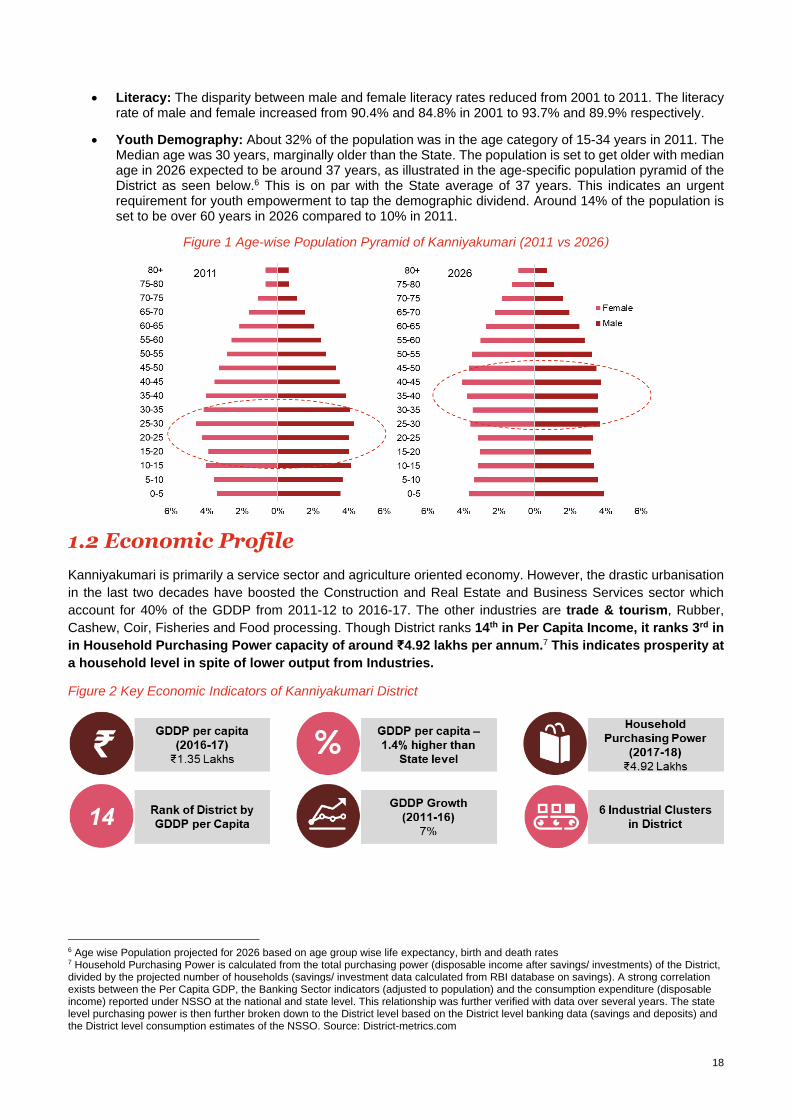
• Youth Demography: About 32% of the population was in the age category of 15-34 years in 2011. The Median age was 30 years, marginally older than the State. The population is set to get older with median age in 2026 expected to be around 37 years, as illustrated in the age-specific population pyramid of the District as seen below.6 This is on par with the State average of 37 years. This indicates an urgent requirement for youth empowerment to tap the demographic dividend. Around 14% of the population is set to be over 60 years in 2026 compared to 10% in 2011.
Figure 1 Age-wise Population Pyramid of Kanniyakumari (2011 vs 2026)
1.2 Economic Profile
Kanniyakumari is primarily a service sector and agriculture oriented economy. However, the drastic urbanisation
in the last two decades have boosted the Construction and Real Estate and Business Services sector which
account for 40% of the GDDP from 2011-12 to 2016-17. The other industries are trade & tourism, Rubber,
Cashew, Coir, Fisheries and Food processing. Though District ranks 14th in Per Capita Income, it ranks 3rd in
in Household Purchasing Power capacity of around ₹4.92 lakhs per annum.7 This indicates prosperity at
a household level in spite of lower output from Industries.
Figure 2 Key Economic Indicators of Kanniyakumari District
6 Age wise Population projected for 2026 based on age group wise life expectancy, birth and death rates 7 Household Purchasing Power is calculated from the total purchasing power (disposable income after savings/ investments) of the District, divided by the projected number of households (savings/ investment data calculated from RBI database on savings). A strong correlation exists between the Per Capita GDP, the Banking Sector indicators (adjusted to population) and the consumption expenditure (disposable income) reported under NSSO at the national and state level. This relationship was further verified with data over several years. The state level purchasing power is then further broken down to the District level based on the District level banking data (savings and deposits) and the District level consumption estimates of the NSSO. Source: District-metrics.com
19
1.2.1 Sector wise Analysis
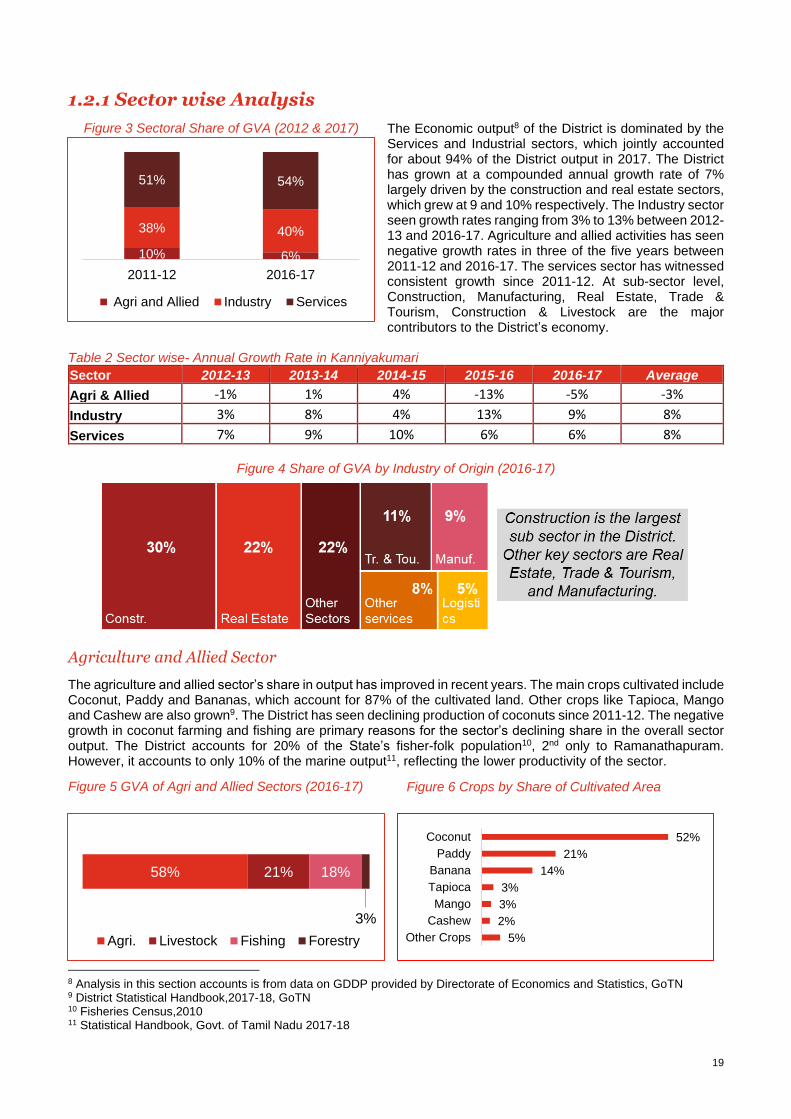
The Economic output8 of the District is dominated by the Services and Industrial sectors, which jointly accounted for about 94% of the District output in 2017. The District has grown at a compounded annual growth rate of 7% largely driven by the construction and real estate sectors, which grew at 9 and 10% respectively. The Industry sector seen growth rates ranging from 3% to 13% between 2012-13 and 2016-17. Agriculture and allied activities has seen negative growth rates in three of the five years between 2011-12 and 2016-17. The services sector has witnessed consistent growth since 2011-12. At sub-sector level, Construction, Manufacturing, Real Estate, Trade & Tourism, Construction & Livestock are the major contributors to the District’s economy.
Table 2 Sector wise- Annual Growth Rate in Kanniyakumari
Sector 2012-13 2013-14 2014-15 2015-16 2016-17 Average
Agri & Allied -1% 1% 4% -13% -5% -3%
Industry 3% 8% 4% 13% 9% 8%
Services 7% 9% 10% 6% 6% 8%
Figure 4 Share of GVA by Industry of Origin (2016-17)
Agriculture and Allied Sector
The agriculture and allied sector’s share in output has improved in recent years. The main crops cultivated include Coconut, Paddy and Bananas, which account for 87% of the cultivated land. Other crops like Tapioca, Mango and Cashew are also grown9. The District has seen declining production of coconuts since 2011-12. The negative growth in coconut farming and fishing are primary reasons for the sector’s declining share in the overall sector output. The District accounts for 20% of the State’s fisher-folk population10, 2nd only to Ramanathapuram. However, it accounts to only 10% of the marine output11, reflecting the lower productivity of the sector.
8 Analysis in this section accounts is from data on GDDP provided by Directorate of Economics and Statistics, GoTN 9 District Statistical Handbook,2017-18, GoTN 10 Fisheries Census,2010 11 Statistical Handbook, Govt. of Tamil Nadu 2017-18
Figure 3 Sectoral Share of GVA (2012 & 2017)
Figure 5 GVA of Agri and Allied Sectors (2016-17) Figure 6 Crops by Share of Cultivated Area
10% 6%
38% 40%
51% 54%
2011-12 2016-17
Agri and Allied Industry Services
58% 21% 18%
3%
Agri. Livestock Fishing Forestry
52%
21%
14%
3%
3%
2%
5%
Coconut
Paddy
Banana
Tapioca
Mango
Cashew
Other Crops

20
Industrial Sector
Construction accounts for 75% of the Industry sector’s
output. This has been fuelled by the rapid urbanization
in the District since the last decade. The key industries
are food products, textiles, rubber products, non-
metallic mineral products, and printing. According to the
Annual Survey of Industries, 2014-15, there were 694
registered units employing 31,481 persons. The District
has six MSME clusters viz. Rubber, Nylon Fishnets,
Cashew Processing, Pottery, Coconut Shell Based
Products and Honey. Traditional Industries include
Embroidery, Khadi, Lace, Beekeeping, Temple Car,
Reed Mats, and Palm Leaf Products.
Table 3 Profile of Manufacturing Sector from ASI
Industry No. of Units
No. of Employee
Share in total GVA
Share of Employment
Average workers per
unit
Food products 461 22,212 52% 71% 48
Other textiles 69 3,538 11% 11% 51
Rubber products 27 2,457 20% 8% 91
Non-metallic mineral products n.e.c. 19 670 2% 2% 35
Printing and service activities related to printing 14 577 9% 2% 41
Others 104 2,027 5% 6% 19
Total 694 31,481 100% 100% 45
Table 4 Existing Industrial Estate & Plants
S.No Name Industries
1. Tamil Nadu Small Industries Development Corporation Limited Industrial Estate
(TANSIDCO) – Konam, Nagercoil Fishnets, and Rubber
2. Tamil Nadu Small Industries Development Corporation Limited Industrial Estate
(TANSIDCO) – Kappukadu, Marthandam
Rubber Nylon Fishnets
Cashew Processing Pottery Coconut Shell based
Products
Honey Reed Mats Palm Leaf Products
Key Clusters and Traditional Industries
Figure 7 Industrial Sector GVA (2016-17)
75%
22%
3%
0%
Constr.
Manuf.
Utilities
Mining
21
Services Sector
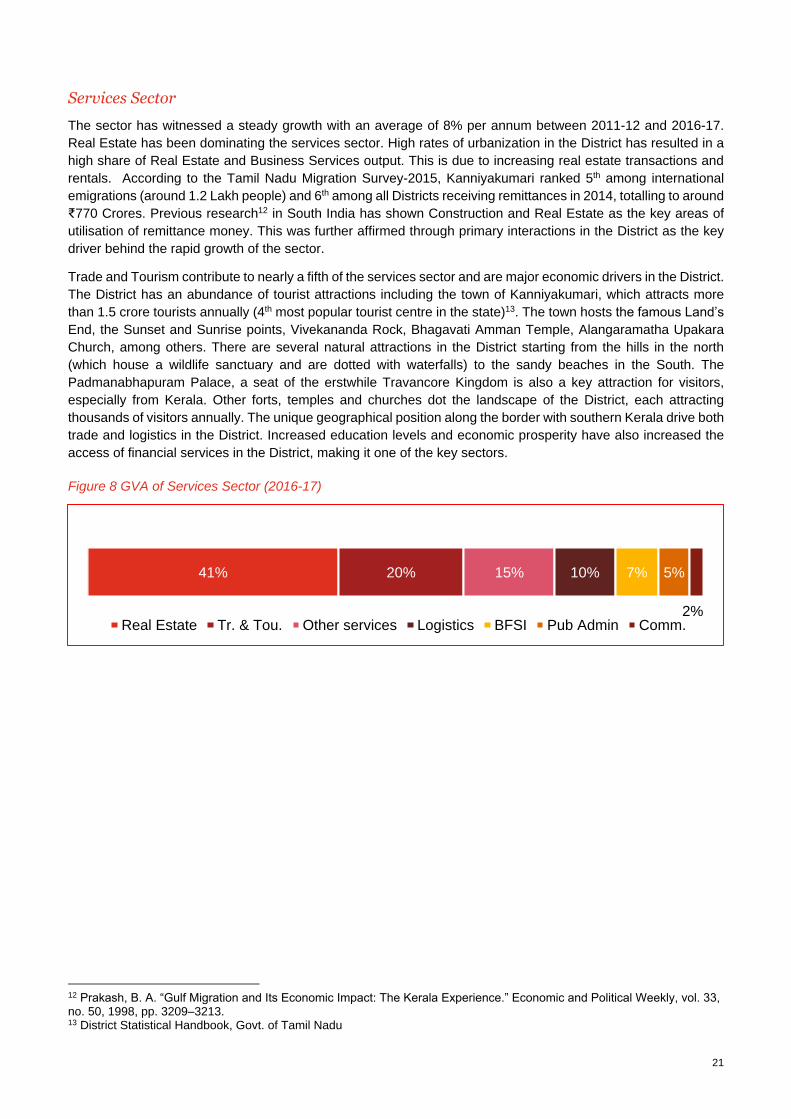
The sector has witnessed a steady growth with an average of 8% per annum between 2011-12 and 2016-17.
Real Estate has been dominating the services sector. High rates of urbanization in the District has resulted in a
high share of Real Estate and Business Services output. This is due to increasing real estate transactions and
rentals. According to the Tamil Nadu Migration Survey-2015, Kanniyakumari ranked 5th among international
emigrations (around 1.2 Lakh people) and 6th among all Districts receiving remittances in 2014, totalling to around
₹770 Crores. Previous research12 in South India has shown Construction and Real Estate as the key areas of
utilisation of remittance money. This was further affirmed through primary interactions in the District as the key
driver behind the rapid growth of the sector.
Trade and Tourism contribute to nearly a fifth of the services sector and are major economic drivers in the District.
The District has an abundance of tourist attractions including the town of Kanniyakumari, which attracts more
than 1.5 crore tourists annually (4th most popular tourist centre in the state)13. The town hosts the famous Land’s
End, the Sunset and Sunrise points, Vivekananda Rock, Bhagavati Amman Temple, Alangaramatha Upakara
Church, among others. There are several natural attractions in the District starting from the hills in the north
(which house a wildlife sanctuary and are dotted with waterfalls) to the sandy beaches in the South. The
Padmanabhapuram Palace, a seat of the erstwhile Travancore Kingdom is also a key attraction for visitors,
especially from Kerala. Other forts, temples and churches dot the landscape of the District, each attracting
thousands of visitors annually. The unique geographical position along the border with southern Kerala drive both
trade and logistics in the District. Increased education levels and economic prosperity have also increased the
access of financial services in the District, making it one of the key sectors.
Figure 8 GVA of Services Sector (2016-17)
12 Prakash, B. A. “Gulf Migration and Its Economic Impact: The Kerala Experience.” Economic and Political Weekly, vol. 33, no. 50, 1998, pp. 3209–3213. 13 District Statistical Handbook, Govt. of Tamil Nadu
41% 20% 15% 10% 7% 5%
2%Real Estate Tr. & Tou. Other services Logistics BFSI Pub Admin Comm.

22
1.2.2 Investments and key economic drivers
Figure 9 Sector-wise growth of Credit off Take (2011-12-2016-17) - RBI
According to the data collected from the RBI14, the District has seen recent growth in credit off take in Agriculture,
Industry, Finance, Transport, and Professional Services indicating higher business investments in the sectors.
Other key investments and sectors include
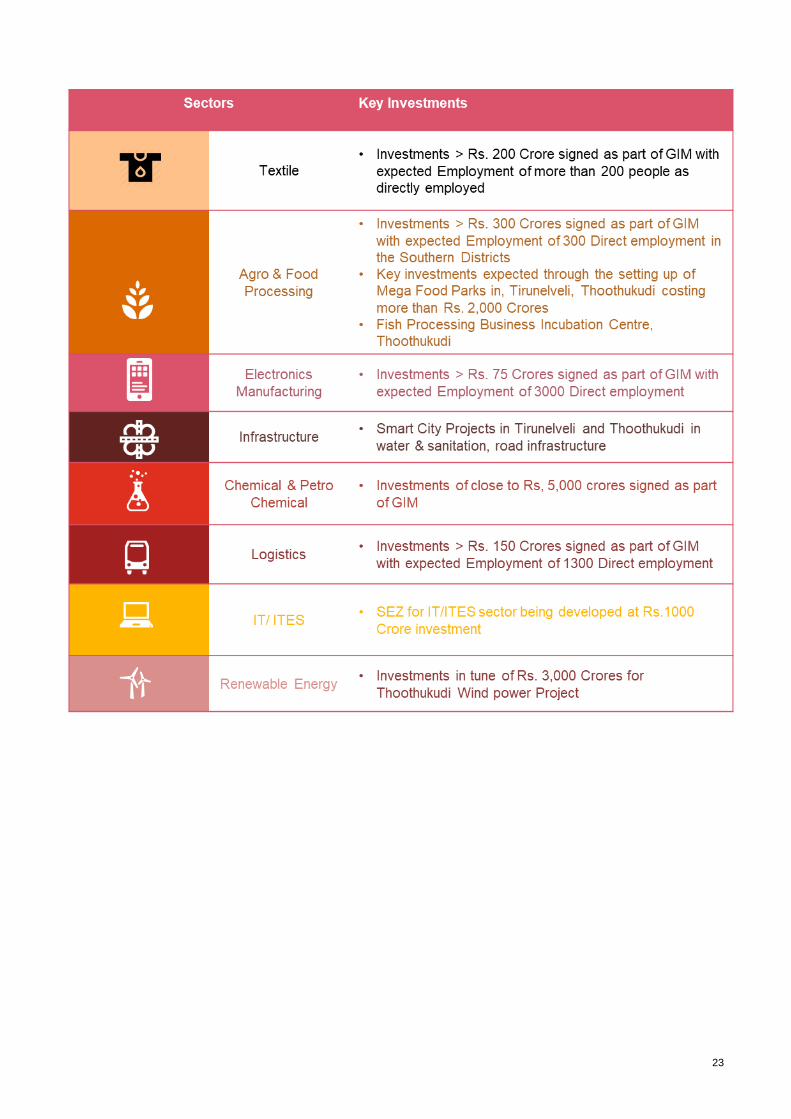
• According to TN-Global Investors Meet data, more than investments are expected in Chemical and
Petrochemicals, Textile, Food Processing and Electronic Manufacturing in the southern Districts.
• Tourism circuits are being developed under the ‘Swadesi Dardhan Scheme” including major uplifts to
temples and tourist locations.
• Proposed trans-shipping hub in Colachel.
• The first phase of the Chennai-Kanniyakumari Industrial Corridor project, as part of the larger East Coast
economic corridor is set to be initiated in Tirunelveli and Thoothukudi. This is are expected to increase
industrial and skill demand in Kanyakumari.
• Coconut Products Processing Park is on the anvil.
• In addition, investments in IT-ITES sector through the Technopark and in Ports and Logistics sector at
the upcoming Vizhinjam port in the neighbouring District of Thiruvananthapuram provide employment
opportunities for the youth of Kanniyakumari to tap.
A sector-wise analysis of the key investments in the southern Districts of Tamil Nadu15 and upcoming projects
have been listed below:
14 Geocrede.com 15 The Districts of Southern Tamil Nadu viz. Tirunelveli, Thoothukudi and Kanniyakumari are socially, and economically interlinked. The labour markets are fluid, with, workers often moving from one District to another, (a central location like Tirunelveli) for economic purposes on a daily / weekly basis. Hence, the investments have the potential to benefit the entire region apart from the District itself.
23
24
1.3 Labour Market Profile
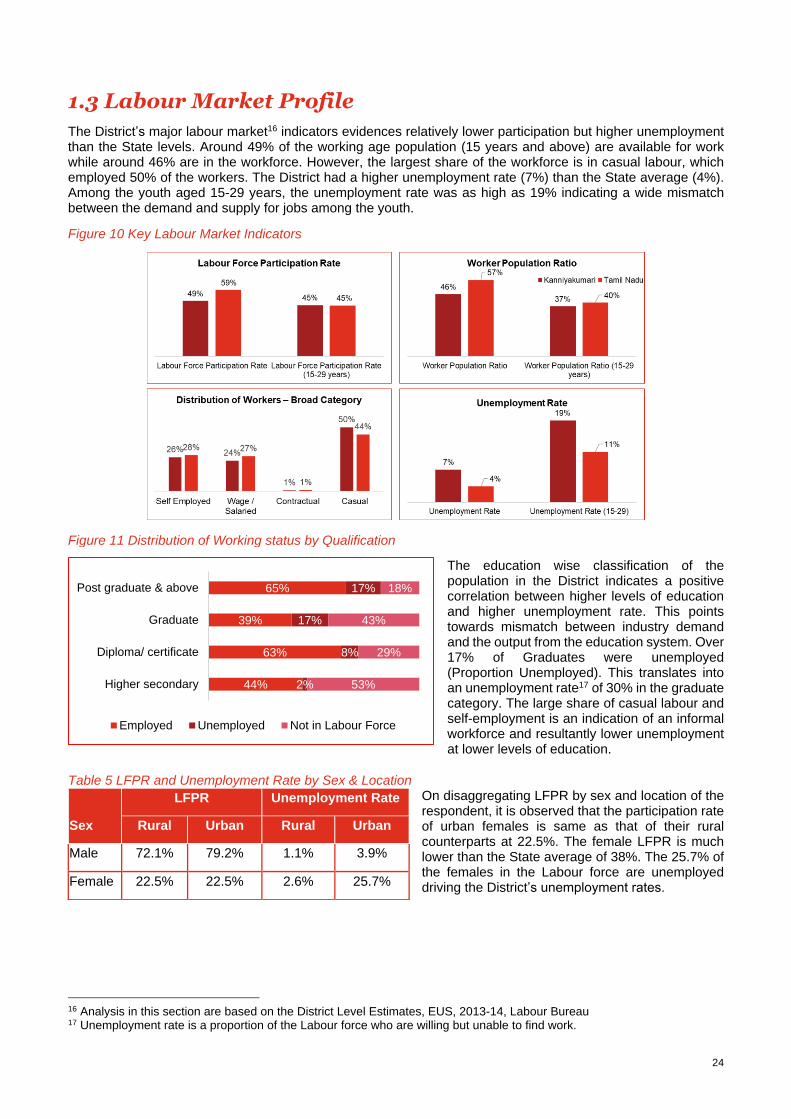
The District’s major labour market16 indicators evidences relatively lower participation but higher unemployment than the State levels. Around 49% of the working age population (15 years and above) are available for work while around 46% are in the workforce. However, the largest share of the workforce is in casual labour, which employed 50% of the workers. The District had a higher unemployment rate (7%) than the State average (4%). Among the youth aged 15-29 years, the unemployment rate was as high as 19% indicating a wide mismatch between the demand and supply for jobs among the youth.
Figure 10 Key Labour Market Indicators
The education wise classification of the population in the District indicates a positive correlation between higher levels of education and higher unemployment rate. This points towards mismatch between industry demand and the output from the education system. Over 17% of Graduates were unemployed (Proportion Unemployed). This translates into an unemployment rate17 of 30% in the graduate category. The large share of casual labour and self-employment is an indication of an informal workforce and resultantly lower unemployment at lower levels of education.
Table 5 LFPR and Unemployment Rate by Sex & Location On disaggregating LFPR by sex and location of the respondent, it is observed that the participation rate of urban females is same as that of their rural counterparts at 22.5%. The female LFPR is much lower than the State average of 38%. The 25.7% of the females in the Labour force are unemployed driving the District’s unemployment rates.
16 Analysis in this section are based on the District Level Estimates, EUS, 2013-14, Labour Bureau 17 Unemployment rate is a proportion of the Labour force who are willing but unable to find work.
Sex
LFPR Unemployment Rate
Rural Urban Rural Urban
Male 72.1% 79.2% 1.1% 3.9%
Female 22.5% 22.5% 2.6% 25.7%
Figure 11 Distribution of Working status by Qualification
44%
63%
39%
65%
2%
8%
17%
17%
53%
29%
43%
18%
Higher secondary
Diploma/ certificate
Graduate
Post graduate & above
Employed Unemployed Not in Labour Force
25
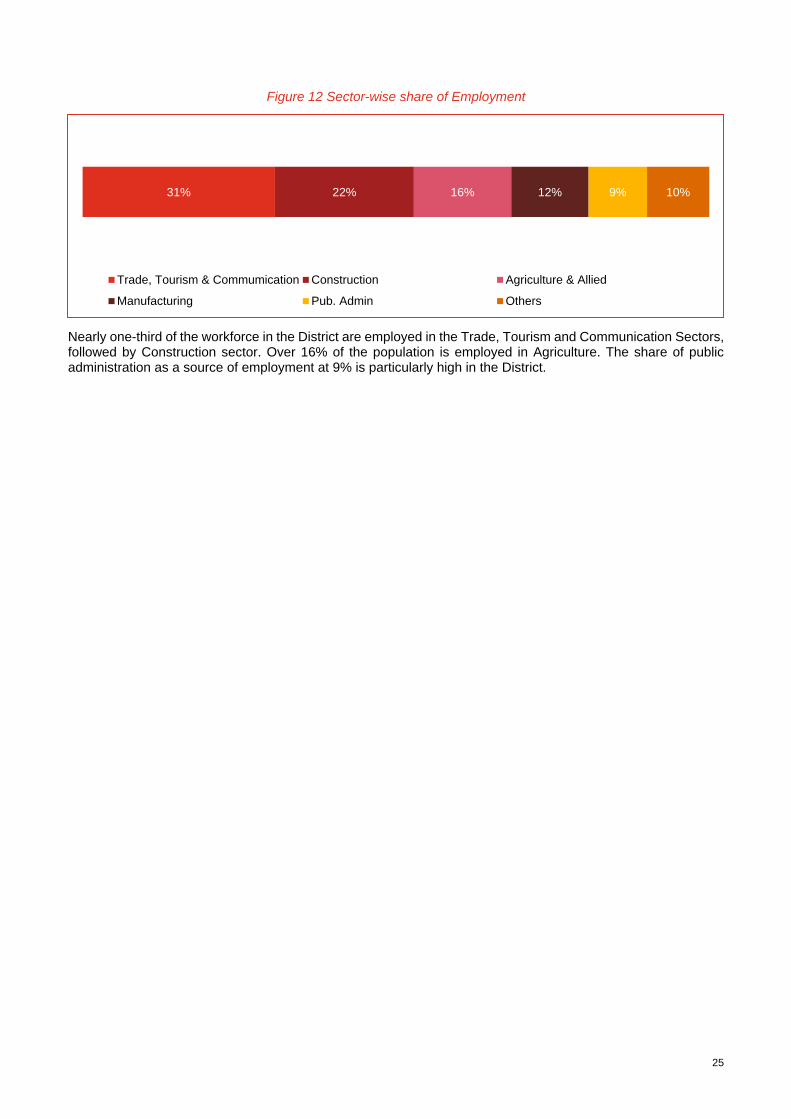
Figure 12 Sector-wise share of Employment
Nearly one-third of the workforce in the District are employed in the Trade, Tourism and Communication Sectors, followed by Construction sector. Over 16% of the population is employed in Agriculture. The share of public administration as a source of employment at 9% is particularly high in the District.
31% 22% 16% 12% 9% 10%
Trade, Tourism & Commumication Construction Agriculture & Allied
Manufacturing Pub. Admin Others
26
1.4 Education and Skill Development Profile
1.4.1 Education Profile
The southern Districts of the State outperform most other regions and are an important centre for education, having higher rates of literacy and education attainment compared to other parts of the State.
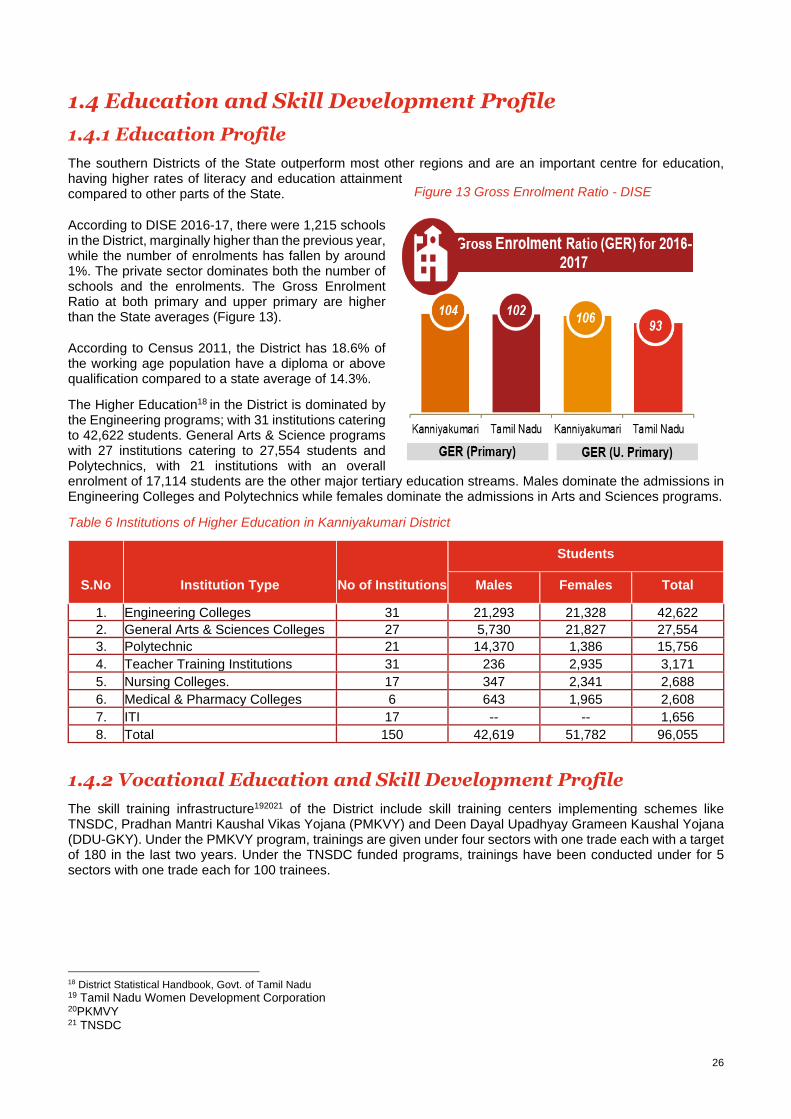
According to DISE 2016-17, there were 1,215 schools in the District, marginally higher than the previous year, while the number of enrolments has fallen by around 1%. The private sector dominates both the number of schools and the enrolments. The Gross Enrolment Ratio at both primary and upper primary are higher than the State averages (Figure 13).
According to Census 2011, the District has 18.6% of the working age population have a diploma or above qualification compared to a state average of 14.3%.
The Higher Education18 in the District is dominated by the Engineering programs; with 31 institutions catering to 42,622 students. General Arts & Science programs with 27 institutions catering to 27,554 students and Polytechnics, with 21 institutions with an overall enrolment of 17,114 students are the other major tertiary education streams. Males dominate the admissions in Engineering Colleges and Polytechnics while females dominate the admissions in Arts and Sciences programs.
Table 6 Institutions of Higher Education in Kanniyakumari District
S.No Institution Type No of Institutions
Students
Males Females Total
1. Engineering Colleges 31 21,293 21,328 42,622
2. General Arts & Sciences Colleges 27 5,730 21,827 27,554
3. Polytechnic 21 14,370 1,386 15,756
4. Teacher Training Institutions 31 236 2,935 3,171
5. Nursing Colleges. 17 347 2,341 2,688
6. Medical & Pharmacy Colleges 6 643 1,965 2,608
7. ITI 17 -- -- 1,656
8. Total 150 42,619 51,782 96,055
1.4.2 Vocational Education and Skill Development Profile
The skill training infrastructure192021 of the District include skill training centers implementing schemes like TNSDC, Pradhan Mantri Kaushal Vikas Yojana (PMKVY) and Deen Dayal Upadhyay Grameen Kaushal Yojana (DDU-GKY). Under the PMKVY program, trainings are given under four sectors with one trade each with a target of 180 in the last two years. Under the TNSDC funded programs, trainings have been conducted under for 5 sectors with one trade each for 100 trainees.
18 District Statistical Handbook, Govt. of Tamil Nadu 19 Tamil Nadu Women Development Corporation 20PKMVY 21 TNSDC
Figure 13 Gross Enrolment Ratio - DISE
27
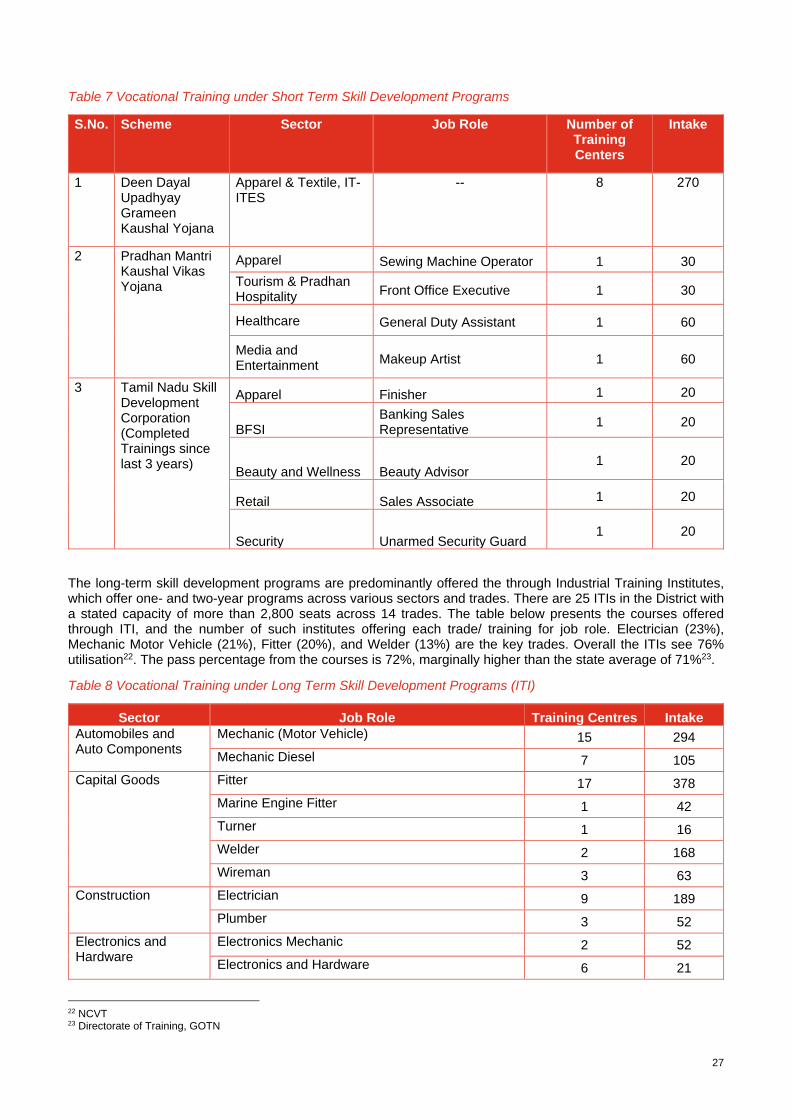
Table 7 Vocational Training under Short Term Skill Development Programs
S.No. Scheme Sector Job Role Number of Training Centers
Intake
1 Deen Dayal Upadhyay Grameen Kaushal Yojana
Apparel & Textile, IT-ITES
-- 8 270
2 Pradhan Mantri Kaushal Vikas Yojana
Apparel Sewing Machine Operator 1 30
Tourism & Pradhan Hospitality
Front Office Executive 1 30
Healthcare General Duty Assistant 1 60
Media and Entertainment
Makeup Artist 1 60
3 Tamil Nadu Skill Development Corporation (Completed Trainings since last 3 years)
Apparel Finisher 1 20
BFSI Banking Sales Representative
1 20
Beauty and Wellness Beauty Advisor 1 20
Retail Sales Associate 1 20
Security Unarmed Security Guard 1 20
The long-term skill development programs are predominantly offered the through Industrial Training Institutes, which offer one- and two-year programs across various sectors and trades. There are 25 ITIs in the District with a stated capacity of more than 2,800 seats across 14 trades. The table below presents the courses offered through ITI, and the number of such institutes offering each trade/ training for job role. Electrician (23%), Mechanic Motor Vehicle (21%), Fitter (20%), and Welder (13%) are the key trades. Overall the ITIs see 76% utilisation22. The pass percentage from the courses is 72%, marginally higher than the state average of 71%23.
Table 8 Vocational Training under Long Term Skill Development Programs (ITI)
Sector Job Role Training Centres Intake
Automobiles and Auto Components
Mechanic (Motor Vehicle) 15 294
Mechanic Diesel 7 105
Capital Goods Fitter 17 378
Marine Engine Fitter 1 42
Turner 1 16
Welder 2 168
Wireman 3 63
Construction Electrician 9 189
Plumber 3 52
Electronics and Hardware
Electronics Mechanic 2 52
Electronics and Hardware 6 21
22 NCVT 23 Directorate of Training, GOTN
28
Sector Job Role Training Centres Intake
Electroplater 1 52
IT/ ITeS Computer Operator and Programming Assistant 5 104
Desk Top Publishing Operator 1 52
Stenographer & Secretarial Assistant (English) 2 26
Textile and Apparel Dress Making 1 21
Fashion Design & Technology 1 21
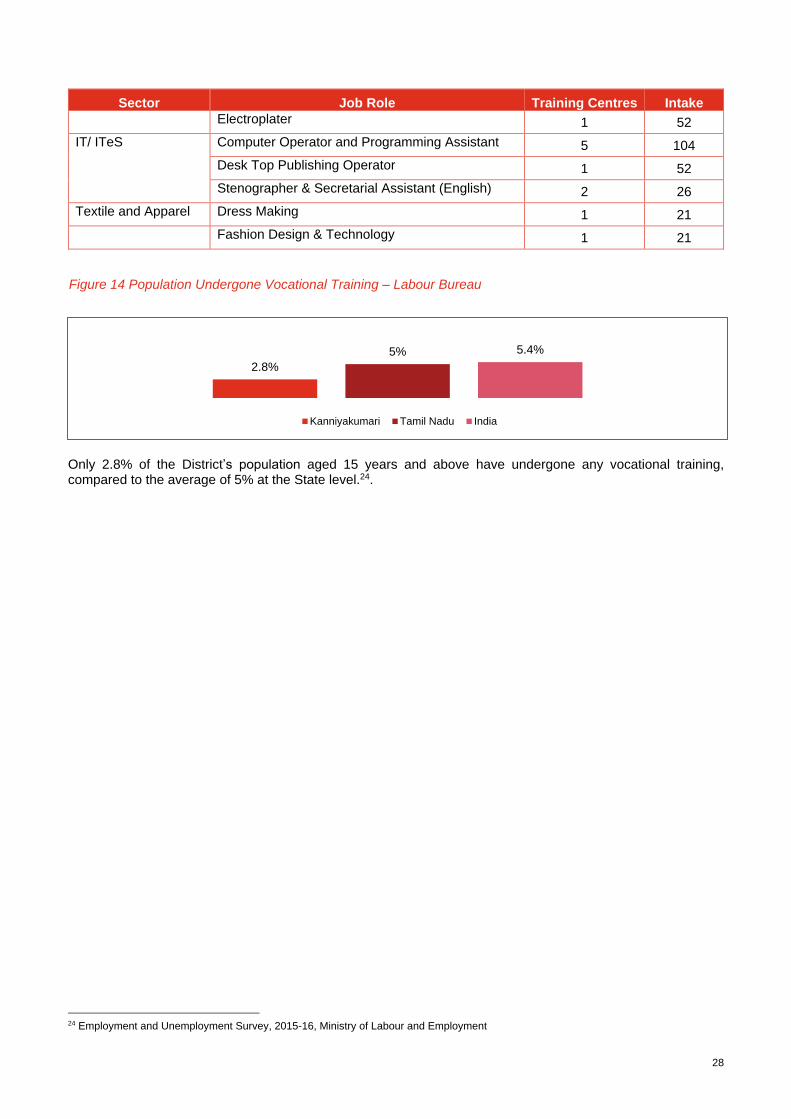
Only 2.8% of the District’s population aged 15 years and above have undergone any vocational training, compared to the average of 5% at the State level.24.
24 Employment and Unemployment Survey, 2015-16, Ministry of Labour and Employment
2.8%
5% 5.4%
Kanniyakumari Tamil Nadu India
Figure 14 Population Undergone Vocational Training – Labour Bureau
29
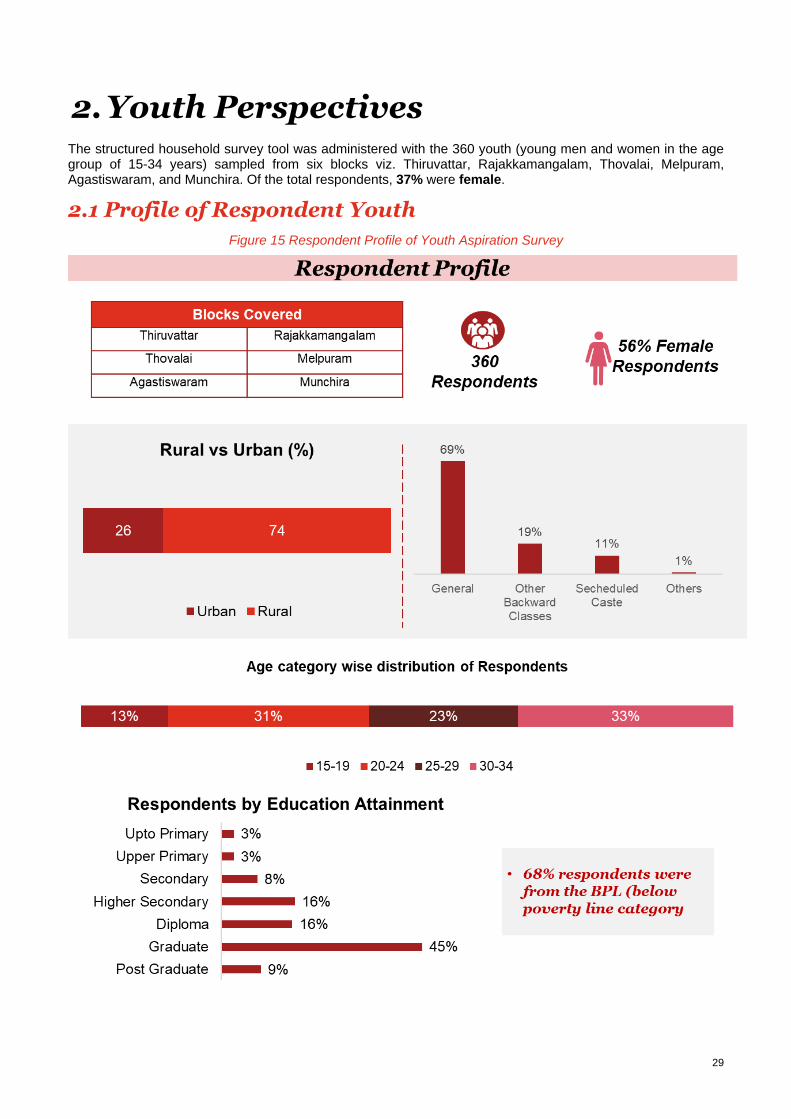
2. Youth Perspectives The structured household survey tool was administered with the 360 youth (young men and women in the age group of 15-34 years) sampled from six blocks viz. Thiruvattar, Rajakkamangalam, Thovalai, Melpuram, Agastiswaram, and Munchira. Of the total respondents, 37% were female.
2.1 Profile of Respondent Youth
Figure 15 Respondent Profile of Youth Aspiration Survey
30
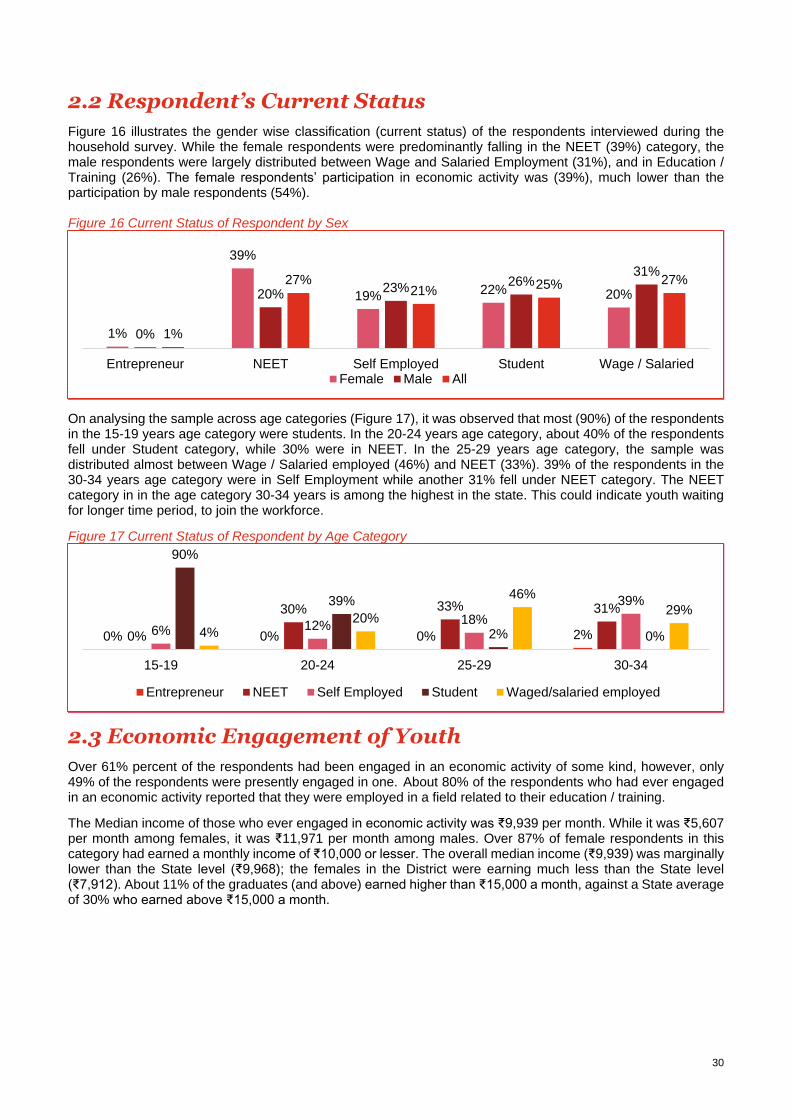
2.2 Respondent’s Current Status
Figure 16 illustrates the gender wise classification (current status) of the respondents interviewed during the household survey. While the female respondents were predominantly falling in the NEET (39%) category, the male respondents were largely distributed between Wage and Salaried Employment (31%), and in Education / Training (26%). The female respondents’ participation in economic activity was (39%), much lower than the participation by male respondents (54%). Figure 16 Current Status of Respondent by Sex
On analysing the sample across age categories (Figure 17), it was observed that most (90%) of the respondents in the 15-19 years age category were students. In the 20-24 years age category, about 40% of the respondents fell under Student category, while 30% were in NEET. In the 25-29 years age category, the sample was distributed almost between Wage / Salaried employed (46%) and NEET (33%). 39% of the respondents in the 30-34 years age category were in Self Employment while another 31% fell under NEET category. The NEET category in in the age category 30-34 years is among the highest in the state. This could indicate youth waiting for longer time period, to join the workforce.
Figure 17 Current Status of Respondent by Age Category
2.3 Economic Engagement of Youth
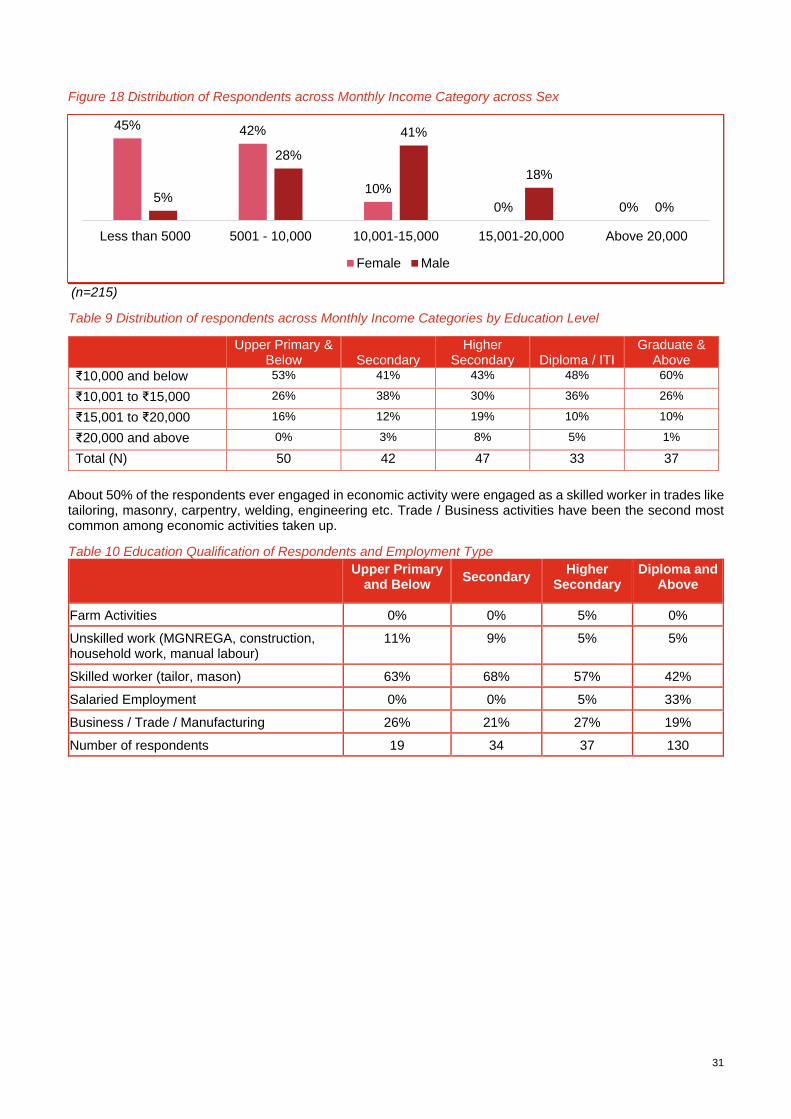
Over 61% percent of the respondents had been engaged in an economic activity of some kind, however, only 49% of the respondents were presently engaged in one. About 80% of the respondents who had ever engaged in an economic activity reported that they were employed in a field related to their education / training.
The Median income of those who ever engaged in economic activity was ₹9,939 per month. While it was ₹5,607 per month among females, it was ₹11,971 per month among males. Over 87% of female respondents in this category had earned a monthly income of ₹10,000 or lesser. The overall median income (₹9,939) was marginally lower than the State level (₹9,968); the females in the District were earning much less than the State level (₹7,912). About 11% of the graduates (and above) earned higher than ₹15,000 a month, against a State average of 30% who earned above ₹15,000 a month.
1%
39%
19%22% 20%
0%
20%23%
26%31%
1%
27%21%
25% 27%
Entrepreneur NEET Self Employed Student Wage / SalariedFemale Male All
0% 0% 0% 2%0%
30% 33% 31%
6% 12% 18%
39%
90%
39%
2% 0%4%20%
46%
29%
15-19 20-24 25-29 30-34
Entrepreneur NEET Self Employed Student Waged/salaried employed
31
Figure 18 Distribution of Respondents across Monthly Income Category across Sex
(n=215)
Table 9 Distribution of respondents across Monthly Income Categories by Education Level
Upper Primary & Below Secondary
Higher Secondary Diploma / ITI
Graduate & Above
₹10,000 and below 53% 41% 43% 48% 60%
₹10,001 to ₹15,000 26% 38% 30% 36% 26%
₹15,001 to ₹20,000 16% 12% 19% 10% 10%
₹20,000 and above 0% 3% 8% 5% 1%
Total (N) 50 42 47 33 37
About 50% of the respondents ever engaged in economic activity were engaged as a skilled worker in trades like tailoring, masonry, carpentry, welding, engineering etc. Trade / Business activities have been the second most common among economic activities taken up.
Table 10 Education Qualification of Respondents and Employment Type
Upper Primary and Below
Secondary Higher
Secondary Diploma and
Above
Farm Activities 0% 0% 5% 0%
Unskilled work (MGNREGA, construction, household work, manual labour)
11% 9% 5% 5%
Skilled worker (tailor, mason) 63% 68% 57% 42%
Salaried Employment 0% 0% 5% 33%
Business / Trade / Manufacturing 26% 21% 27% 19%
Number of respondents 19 34 37 130
45% 42%
10%
0% 0%5%
28%
41%
18%
0%
Less than 5000 5001 - 10,000 10,001-15,000 15,001-20,000 Above 20,000
Female Male
32
2.4 Youth under NEET Category
Around one-fourth of the respondents were from the NEET category. About 53% of the respondents in the NEET respondents were female. Nearly 63% of the NEET category respondents were in the 20-29 years age category. 63% of Males and 84% of females were in NEET category for more than a year, 53% of females had been in NEET category or more than 3 years.
92% of the Female respondents and almost 93% male respondents, wish to work in the future. 94% females and all the male respondents have been actively seeking work.
Table 11 NEET Category Respondents
Duration in NEET Category
Wish to Work
Female Male Total Female Male Total
Less than 6 months 2% 7% 4%
Yes 92% 93% 93%
6 months- 1 year 14% 27% 20% Total 51 45 96
1- 2 years 12% 29% 20% Actively Seeking Work
2- 3 years 20% 27% 23% Female Male Total
More than 3 years 53% 11% 33% Yes 94% 100% 97%
Total 51 45 96 Total 44 42 57
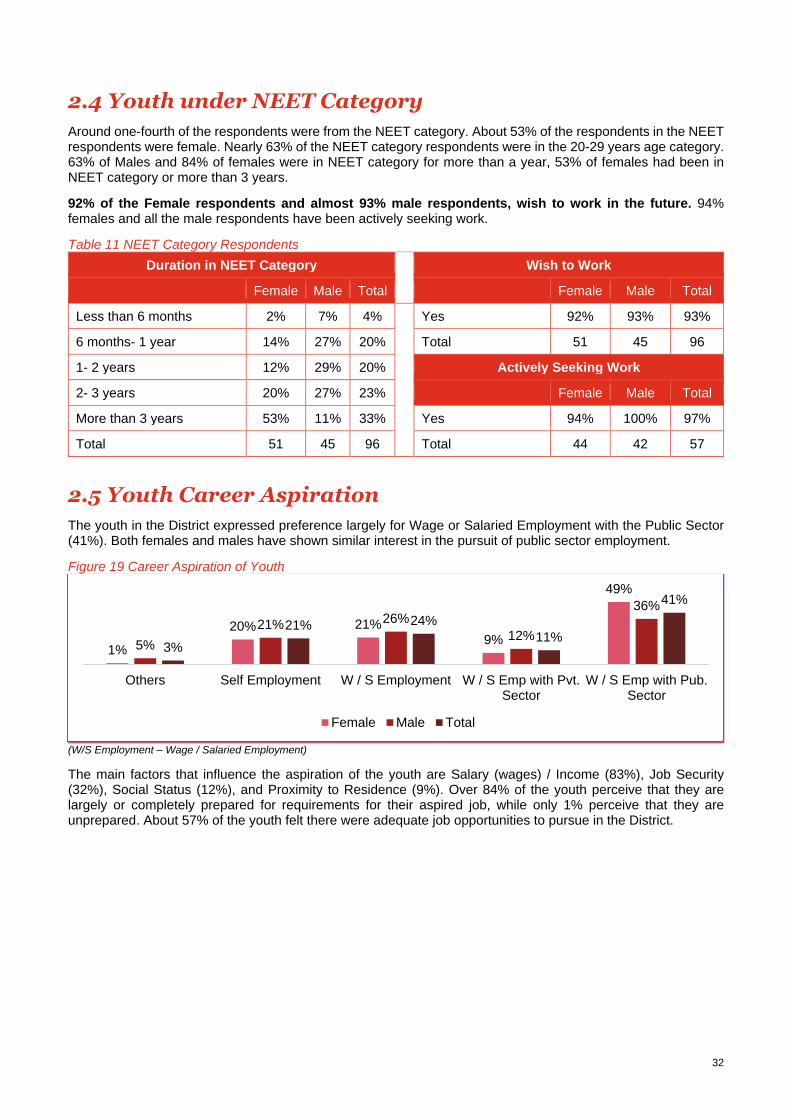
2.5 Youth Career Aspiration
The youth in the District expressed preference largely for Wage or Salaried Employment with the Public Sector (41%). Both females and males have shown similar interest in the pursuit of public sector employment.
Figure 19 Career Aspiration of Youth
(W/S Employment – Wage / Salaried Employment)
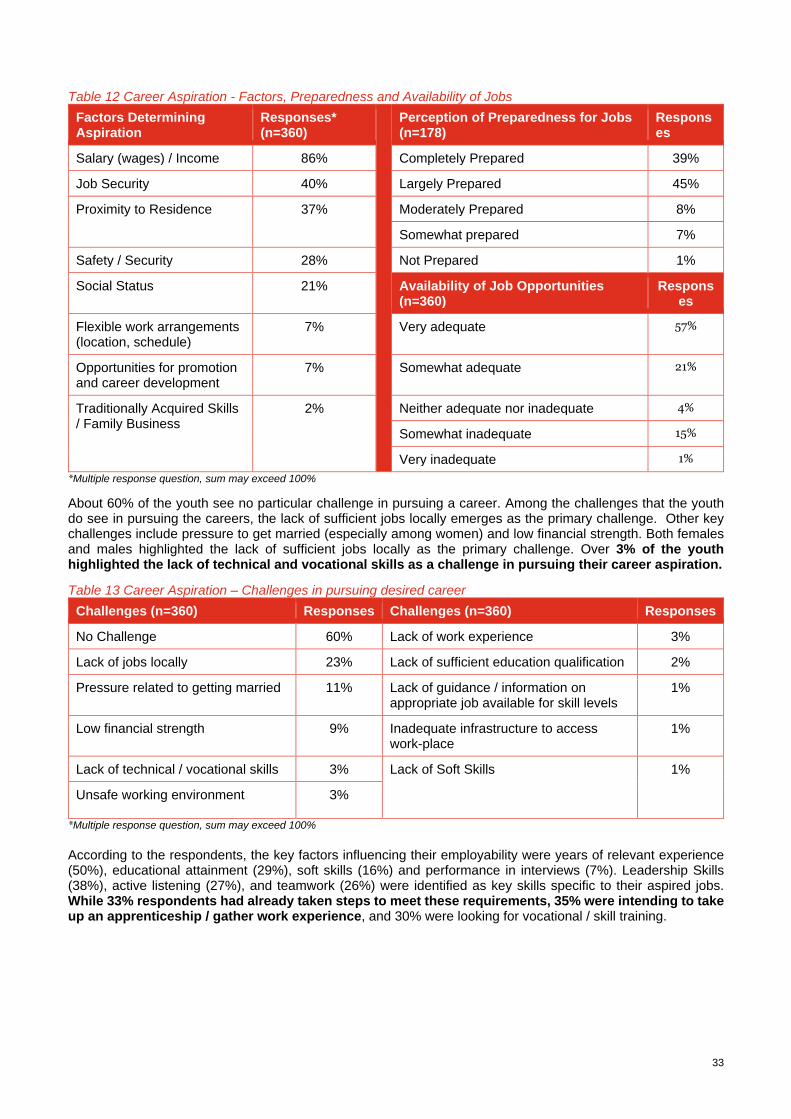
The main factors that influence the aspiration of the youth are Salary (wages) / Income (83%), Job Security (32%), Social Status (12%), and Proximity to Residence (9%). Over 84% of the youth perceive that they are largely or completely prepared for requirements for their aspired job, while only 1% perceive that they are unprepared. About 57% of the youth felt there were adequate job opportunities to pursue in the District.
1%
20% 21%9%
49%
5%
21% 26%
12%
36%
3%
21% 24%
11%
41%
Others Self Employment W / S Employment W / S Emp with Pvt.Sector
W / S Emp with Pub.Sector
Female Male Total
33
Table 12 Career Aspiration - Factors, Preparedness and Availability of Jobs
Factors Determining Aspiration
Responses* (n=360)
Perception of Preparedness for Jobs (n=178)
Responses
Salary (wages) / Income 86% Completely Prepared 39%
Job Security 40% Largely Prepared 45%
Proximity to Residence 37%
Moderately Prepared 8%
Somewhat prepared 7%
Safety / Security 28% Not Prepared 1%
Social Status 21% Availability of Job Opportunities (n=360)
Responses
Flexible work arrangements (location, schedule)
7% Very adequate 57%
Opportunities for promotion and career development
7% Somewhat adequate 21%
Traditionally Acquired Skills / Family Business
2% Neither adequate nor inadequate 4%
Somewhat inadequate 15%
Very inadequate 1%
*Multiple response question, sum may exceed 100%
About 60% of the youth see no particular challenge in pursuing a career. Among the challenges that the youth do see in pursuing the careers, the lack of sufficient jobs locally emerges as the primary challenge. Other key challenges include pressure to get married (especially among women) and low financial strength. Both females and males highlighted the lack of sufficient jobs locally as the primary challenge. Over 3% of the youth highlighted the lack of technical and vocational skills as a challenge in pursuing their career aspiration.
Table 13 Career Aspiration – Challenges in pursuing desired career
Challenges (n=360) Responses Challenges (n=360) Responses
No Challenge 60% Lack of work experience 3%
Lack of jobs locally 23% Lack of sufficient education qualification 2%
Pressure related to getting married 11% Lack of guidance / information on appropriate job available for skill levels
1%
Low financial strength 9% Inadequate infrastructure to access work-place
1%
Lack of technical / vocational skills 3% Lack of Soft Skills 1%
Unsafe working environment 3%
*Multiple response question, sum may exceed 100%
According to the respondents, the key factors influencing their employability were years of relevant experience (50%), educational attainment (29%), soft skills (16%) and performance in interviews (7%). Leadership Skills (38%), active listening (27%), and teamwork (26%) were identified as key skills specific to their aspired jobs. While 33% respondents had already taken steps to meet these requirements, 35% were intending to take up an apprenticeship / gather work experience, and 30% were looking for vocational / skill training.

34
Table 14 Key Requirements to enhance employability and steps to achieve aspirations
Key Requirements to enhance employability*
Requirements Responses Requirements Responses
Years of Relevant Work Experience 50% References 3%
Education attainment (level of education) 29% Relevant work experience in similar position or field
3%
Soft skills 7% Institution of Education / Skill Training
1%
Performance in Interviews 7%
Key Skills Required for desired job*
Leadership 38% Clear communication 15%
Active listening 27% Creativity, originality and initiative 9%
Team work 26% Time management 8%
Analytical thinking 19% Attention to detail 4%
Coordination Skills 16%
New Steps to achieve aspirations
Steps Responses Steps Responses
Apprenticeship / Gathering Work Experience
35% Vocational/ Skill Training 30%
Already Achieved 33% Continuing Education 7%
*Multiple response question, sum may exceed 100%, (n=360)
Female respondents aspired for careers in the BFSI, Food Processing, Education and Skill Development and Healthcare Services. Males aspired for careers at Auto and Auto-components, Handloom & Handicrafts, Iron & Steel, Chemical & Pharmaceutical sectors.
Table 15 Sectors aspired by respondents
Females Responses Males Responses
BFSI 30% Auto and Auto Components 13%
Building, Construction Industry 14% Handloom & Handicrafts 11%
Food Processing 12% Iron & Steel 11%
Education and Skill Development 8% Chemical & Pharmaceuticals 9%
Healthcare Services 7% Building, Construction Industry 8%
Agro-business 6% Others 8%
Gems & Jewellery 5% Furniture and Furnishing 6%
Handloom & Handicrafts 2% BFSI 5%
Furniture and Furnishing 2% Healthcare Services 5%
Others 9% Agro-Food Processing 4%
(n=360)
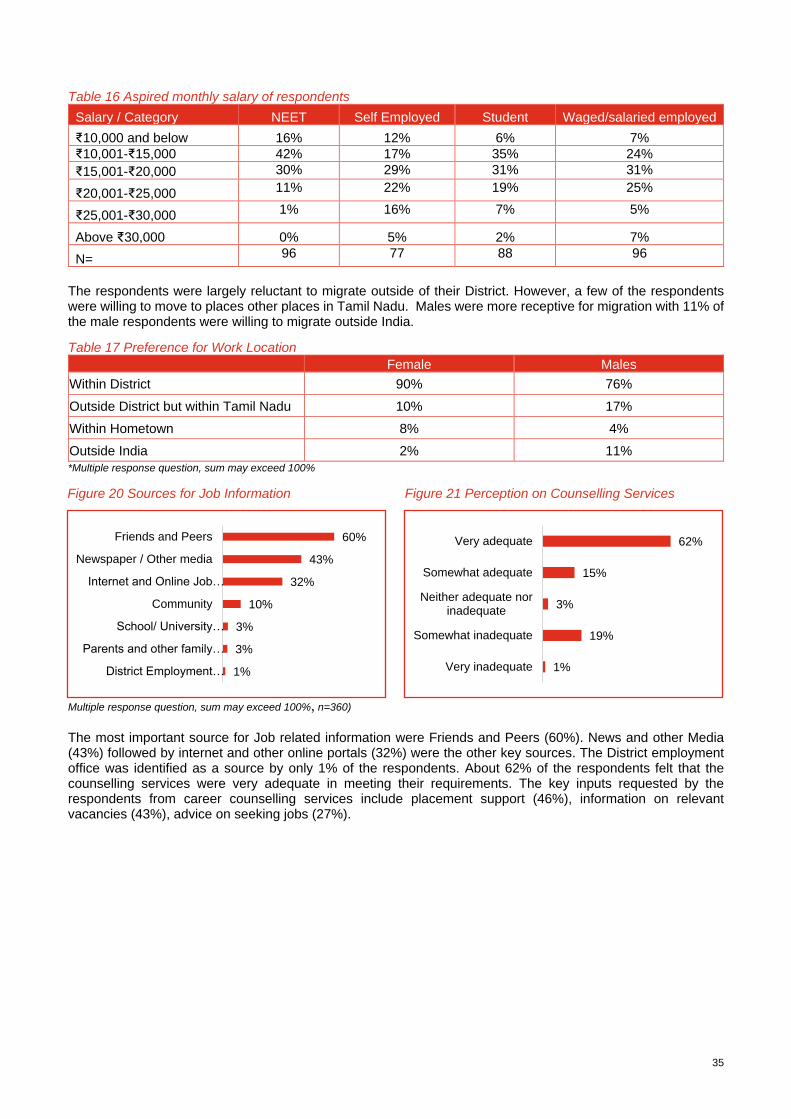
The median income expectation is around ₹16,678 per month. Around 11% of the respondents have expectations of monthly income greater than ₹20,000. Nearly 58% of the NEET category respondents were expecting a salary of below ₹15,000 per month.
35
Table 16 Aspired monthly salary of respondents
Salary / Category NEET Self Employed Student Waged/salaried employed
₹10,000 and below 16% 12% 6% 7%
₹10,001-₹15,000 42% 17% 35% 24%
₹15,001-₹20,000 30% 29% 31% 31%
₹20,001-₹25,000 11% 22% 19% 25%
₹25,001-₹30,000 1% 16% 7% 5%
Above ₹30,000 0% 5% 2% 7%
N= 96 77 88 96
The respondents were largely reluctant to migrate outside of their District. However, a few of the respondents were willing to move to places other places in Tamil Nadu. Males were more receptive for migration with 11% of the male respondents were willing to migrate outside India.
Table 17 Preference for Work Location
Female Males
Within District 90% 76%
Outside District but within Tamil Nadu 10% 17%
Within Hometown 8% 4%
Outside India 2% 11%
*Multiple response question, sum may exceed 100%
Multiple response question, sum may exceed 100%, n=360)
The most important source for Job related information were Friends and Peers (60%). News and other Media (43%) followed by internet and other online portals (32%) were the other key sources. The District employment office was identified as a source by only 1% of the respondents. About 62% of the respondents felt that the counselling services were very adequate in meeting their requirements. The key inputs requested by the respondents from career counselling services include placement support (46%), information on relevant vacancies (43%), advice on seeking jobs (27%).
1%
3%
3%
10%
32%
43%
60%
District Employment…
Parents and other family…
School/ University…
Community
Internet and Online Job…
Newspaper / Other media
Friends and Peers 62%
15%
3%
19%
1%
Very adequate
Somewhat adequate
Neither adequate norinadequate
Somewhat inadequate
Very inadequate
Figure 20 Sources for Job Information Figure 21 Perception on Counselling Services
36
Multiple response question, sum may exceed 100%, n=360)
2.6 Skill Training Preferences of Youth
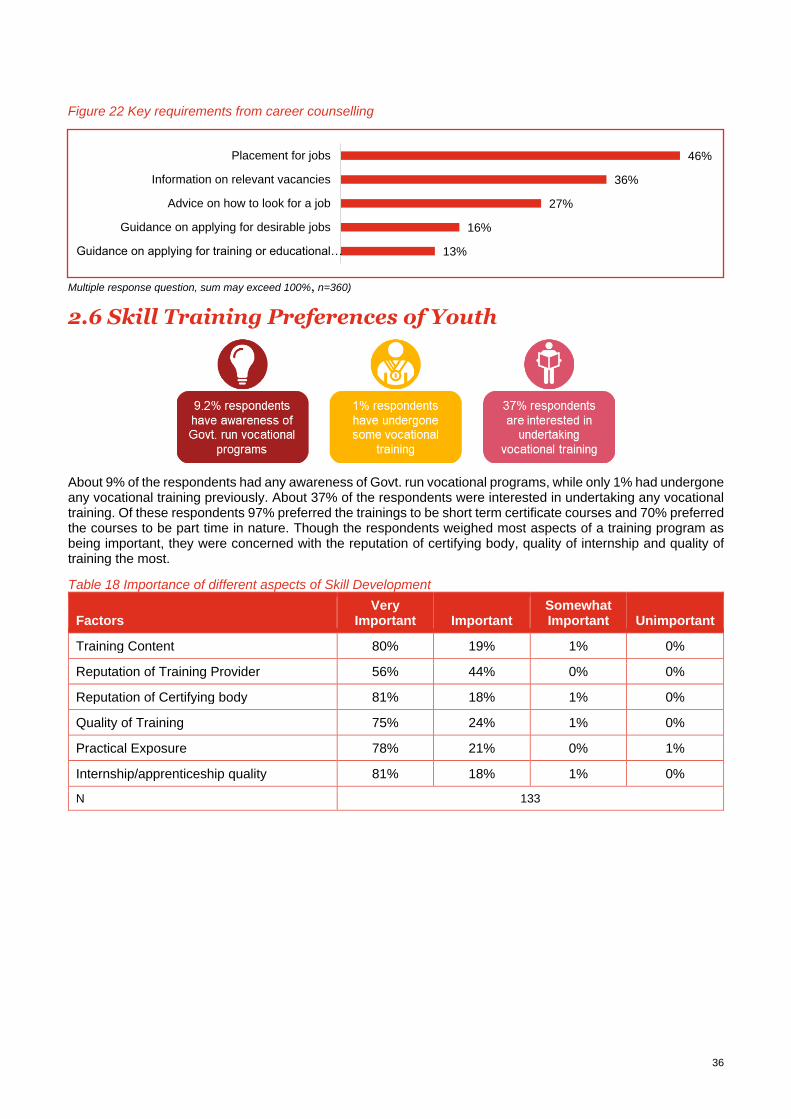
About 9% of the respondents had any awareness of Govt. run vocational programs, while only 1% had undergone any vocational training previously. About 37% of the respondents were interested in undertaking any vocational training. Of these respondents 97% preferred the trainings to be short term certificate courses and 70% preferred the courses to be part time in nature. Though the respondents weighed most aspects of a training program as being important, they were concerned with the reputation of certifying body, quality of internship and quality of training the most.
Table 18 Importance of different aspects of Skill Development
Factors Very
Important Important Somewhat Important Unimportant
Training Content 80% 19% 1% 0%
Reputation of Training Provider 56% 44% 0% 0%
Reputation of Certifying body 81% 18% 1% 0%
Quality of Training 75% 24% 1% 0%
Practical Exposure 78% 21% 0% 1%
Internship/apprenticeship quality 81% 18% 1% 0%
N 133
46%
36%
27%
16%
13%
Placement for jobs
Information on relevant vacancies
Advice on how to look for a job
Guidance on applying for desirable jobs
Guidance on applying for training or educational…
Figure 22 Key requirements from career counselling
37
3. Employers’ and Other Stakeholders’ Perspectives
3.1 Employers’ Perspective
The study covered employers, industrial associations and other key stakeholders to understand the demand side perspectives of skills. The information was collected through both quantitative survey and qualitative approaches including In-Depth interviews and focus group discussions.
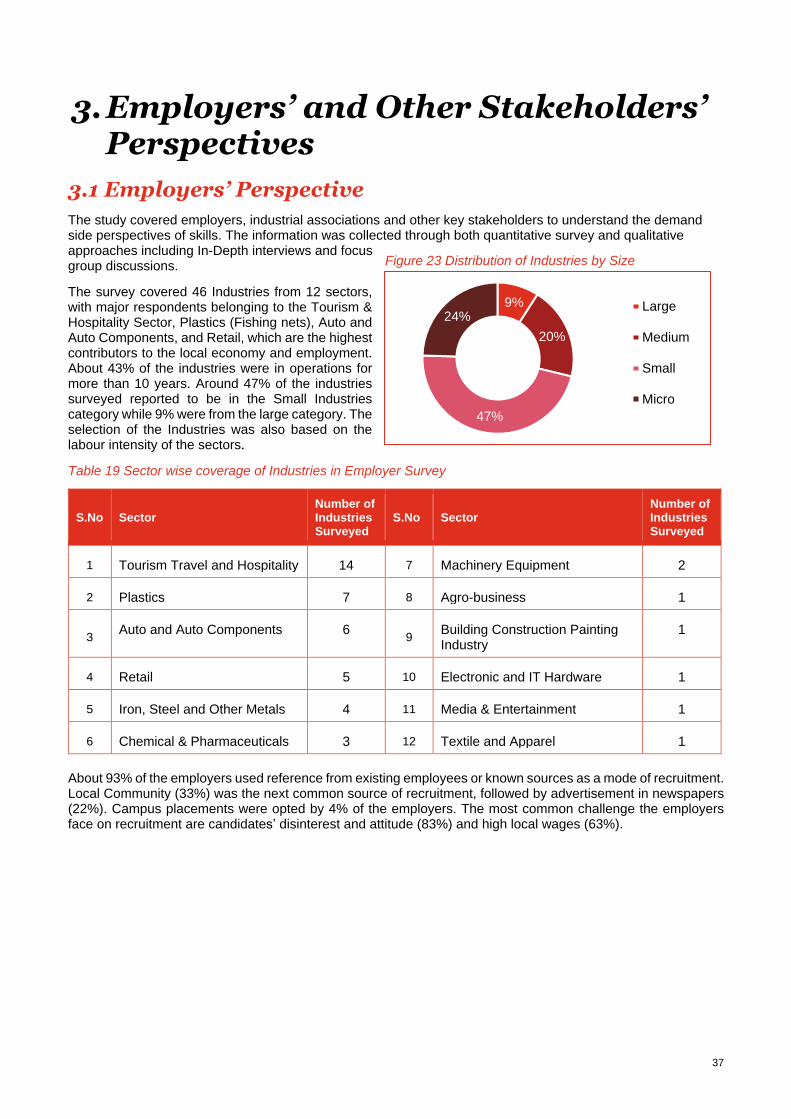
The survey covered 46 Industries from 12 sectors, with major respondents belonging to the Tourism & Hospitality Sector, Plastics (Fishing nets), Auto and Auto Components, and Retail, which are the highest contributors to the local economy and employment. About 43% of the industries were in operations for more than 10 years. Around 47% of the industries surveyed reported to be in the Small Industries category while 9% were from the large category. The selection of the Industries was also based on the labour intensity of the sectors.
Table 19 Sector wise coverage of Industries in Employer Survey
S.No Sector Number of Industries Surveyed
S.No Sector Number of Industries Surveyed
1 Tourism Travel and Hospitality 14 7 Machinery Equipment 2
2 Plastics 7 8 Agro-business 1
3 Auto and Auto Components 6
9 Building Construction Painting Industry
1
4 Retail 5 10 Electronic and IT Hardware 1
5 Iron, Steel and Other Metals 4 11 Media & Entertainment 1
6 Chemical & Pharmaceuticals 3 12 Textile and Apparel 1
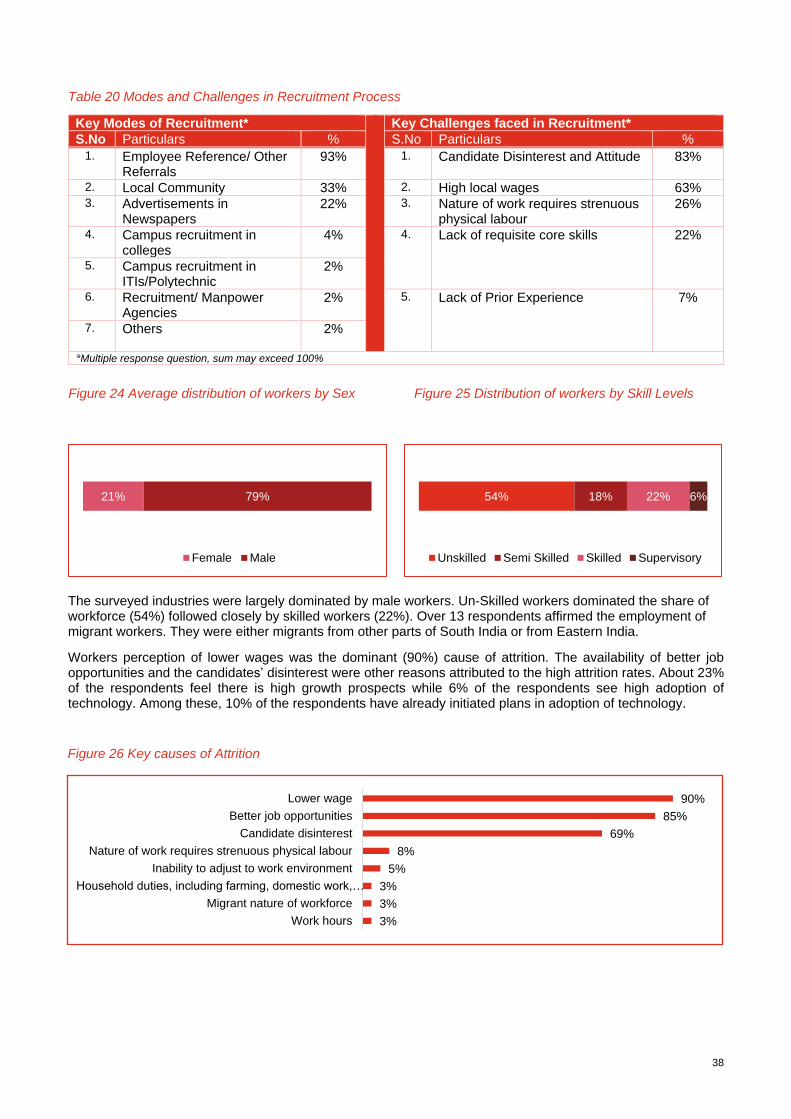
About 93% of the employers used reference from existing employees or known sources as a mode of recruitment. Local Community (33%) was the next common source of recruitment, followed by advertisement in newspapers (22%). Campus placements were opted by 4% of the employers. The most common challenge the employers face on recruitment are candidates’ disinterest and attitude (83%) and high local wages (63%).
Figure 23 Distribution of Industries by Size
9%
20%
47%
24%Large
Medium
Small
Micro
38
Table 20 Modes and Challenges in Recruitment Process
Key Modes of Recruitment* Key Challenges faced in Recruitment*
S.No Particulars % S.No Particulars %
1. Employee Reference/ Other Referrals
93% 1. Candidate Disinterest and Attitude 83%
2. Local Community 33% 2. High local wages 63%
3. Advertisements in Newspapers
22% 3. Nature of work requires strenuous physical labour
26%
4. Campus recruitment in colleges
4% 4. Lack of requisite core skills 22%
5. Campus recruitment in ITIs/Polytechnic
2%
6. Recruitment/ Manpower Agencies
2% 5. Lack of Prior Experience 7%
7. Others 2%
*Multiple response question, sum may exceed 100%
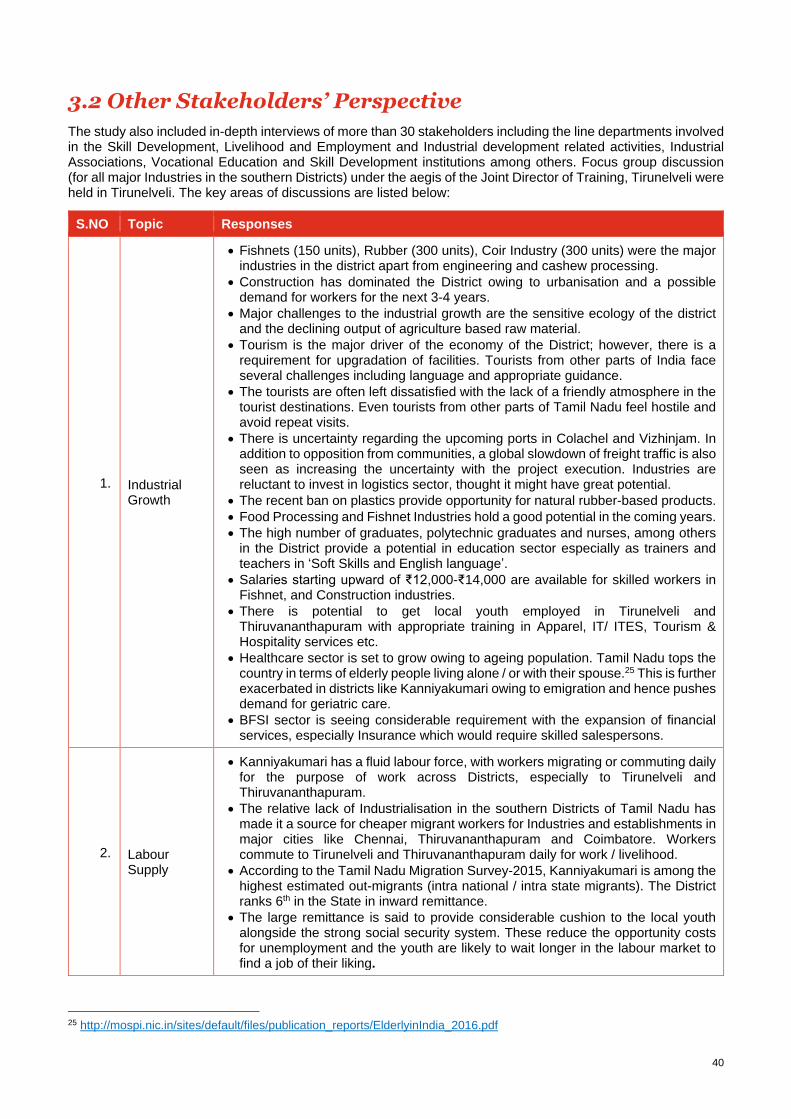
The surveyed industries were largely dominated by male workers. Un-Skilled workers dominated the share of workforce (54%) followed closely by skilled workers (22%). Over 13 respondents affirmed the employment of migrant workers. They were either migrants from other parts of South India or from Eastern India.
Workers perception of lower wages was the dominant (90%) cause of attrition. The availability of better job opportunities and the candidates’ disinterest were other reasons attributed to the high attrition rates. About 23% of the respondents feel there is high growth prospects while 6% of the respondents see high adoption of technology. Among these, 10% of the respondents have already initiated plans in adoption of technology.
54% 18% 22% 6%
Unskilled Semi Skilled Skilled Supervisory
Figure 25 Distribution of workers by Skill Levels
21% 79%
Female Male
Figure 24 Average distribution of workers by Sex
90%
85%
69%
8%
5%
3%
3%
3%
Lower wage
Better job opportunities
Candidate disinterest
Nature of work requires strenuous physical labour
Inability to adjust to work environment
Household duties, including farming, domestic work,…
Migrant nature of workforce
Work hours
Figure 26 Key causes of Attrition

39
Key Insights on Skill Development / Training
• 7 of the 46 respondents (15%) of the respondents were aware of any vocational programs run by the Govt.
• The highest awareness was about Apprenticeship Training Scheme (15%). There was low awareness about other schemes.
• Only 3 organizations had recruited from a vocational / skill training program in the previous 3 years.
• 38% of the respondents were key in working with the Govt. on Skill Development Programs.
32% 29% 38%
No Interest Moderately interested Very Interested
Figure 27 Interest in working with the Govt. on Skill Development
40
3.2 Other Stakeholders’ Perspective
The study also included in-depth interviews of more than 30 stakeholders including the line departments involved in the Skill Development, Livelihood and Employment and Industrial development related activities, Industrial Associations, Vocational Education and Skill Development institutions among others. Focus group discussion (for all major Industries in the southern Districts) under the aegis of the Joint Director of Training, Tirunelveli were held in Tirunelveli. The key areas of discussions are listed below:
S.NO Topic Responses
1. Industrial Growth
• Fishnets (150 units), Rubber (300 units), Coir Industry (300 units) were the major industries in the district apart from engineering and cashew processing.
• Construction has dominated the District owing to urbanisation and a possible demand for workers for the next 3-4 years.
• Major challenges to the industrial growth are the sensitive ecology of the district and the declining output of agriculture based raw material.
• Tourism is the major driver of the economy of the District; however, there is a requirement for upgradation of facilities. Tourists from other parts of India face several challenges including language and appropriate guidance.
• The tourists are often left dissatisfied with the lack of a friendly atmosphere in the tourist destinations. Even tourists from other parts of Tamil Nadu feel hostile and avoid repeat visits.
• There is uncertainty regarding the upcoming ports in Colachel and Vizhinjam. In addition to opposition from communities, a global slowdown of freight traffic is also seen as increasing the uncertainty with the project execution. Industries are reluctant to invest in logistics sector, thought it might have great potential.
• The recent ban on plastics provide opportunity for natural rubber-based products.
• Food Processing and Fishnet Industries hold a good potential in the coming years.
• The high number of graduates, polytechnic graduates and nurses, among others in the District provide a potential in education sector especially as trainers and teachers in ‘Soft Skills and English language’.
• Salaries starting upward of ₹12,000-₹14,000 are available for skilled workers in Fishnet, and Construction industries.
• There is potential to get local youth employed in Tirunelveli and Thiruvananthapuram with appropriate training in Apparel, IT/ ITES, Tourism & Hospitality services etc.
• Healthcare sector is set to grow owing to ageing population. Tamil Nadu tops the country in terms of elderly people living alone / or with their spouse.25 This is further exacerbated in districts like Kanniyakumari owing to emigration and hence pushes demand for geriatric care.
• BFSI sector is seeing considerable requirement with the expansion of financial services, especially Insurance which would require skilled salespersons.
2. Labour Supply
• Kanniyakumari has a fluid labour force, with workers migrating or commuting daily for the purpose of work across Districts, especially to Tirunelveli and Thiruvananthapuram.
• The relative lack of Industrialisation in the southern Districts of Tamil Nadu has made it a source for cheaper migrant workers for Industries and establishments in major cities like Chennai, Thiruvananthapuram and Coimbatore. Workers commute to Tirunelveli and Thiruvananthapuram daily for work / livelihood.
• According to the Tamil Nadu Migration Survey-2015, Kanniyakumari is among the highest estimated out-migrants (intra national / intra state migrants). The District ranks 6th in the State in inward remittance.
• The large remittance is said to provide considerable cushion to the local youth alongside the strong social security system. These reduce the opportunity costs for unemployment and the youth are likely to wait longer in the labour market to find a job of their liking.
25 http://mospi.nic.in/sites/default/files/publication_reports/ElderlyinIndia_2016.pdf
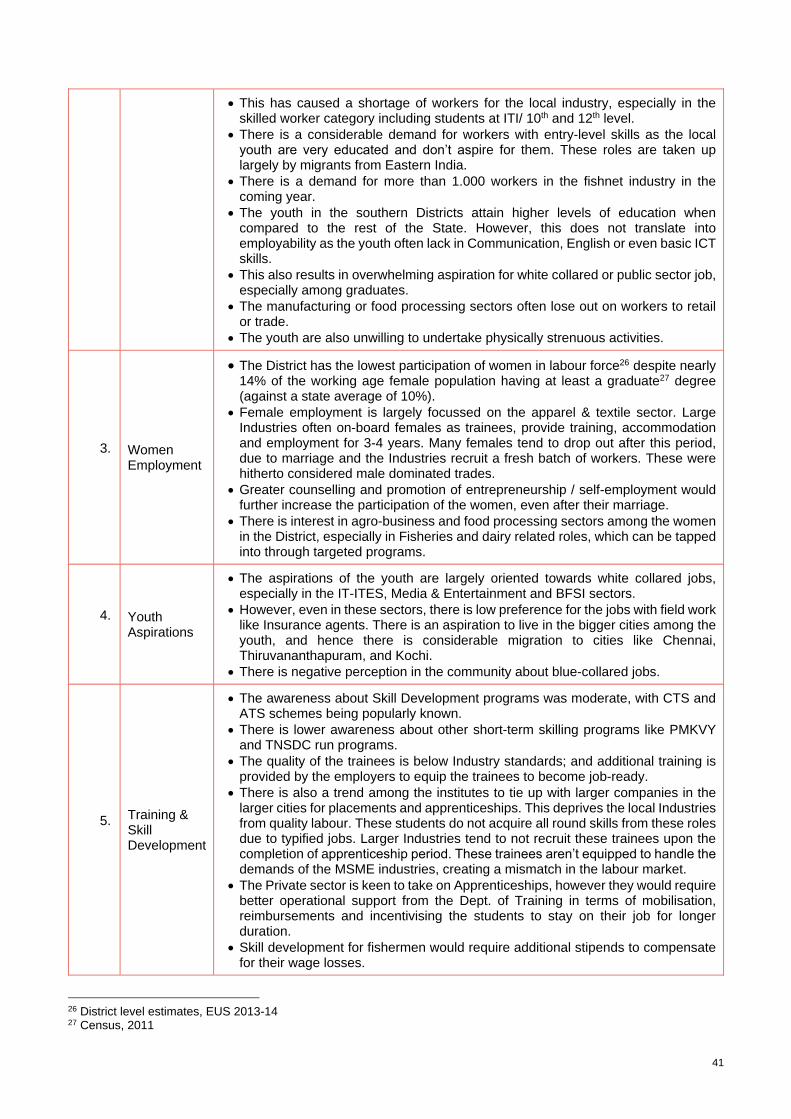
41
• This has caused a shortage of workers for the local industry, especially in the skilled worker category including students at ITI/ 10th and 12th level.
• There is a considerable demand for workers with entry-level skills as the local youth are very educated and don’t aspire for them. These roles are taken up largely by migrants from Eastern India.
• There is a demand for more than 1.000 workers in the fishnet industry in the coming year.
• The youth in the southern Districts attain higher levels of education when compared to the rest of the State. However, this does not translate into employability as the youth often lack in Communication, English or even basic ICT skills.
• This also results in overwhelming aspiration for white collared or public sector job, especially among graduates.
• The manufacturing or food processing sectors often lose out on workers to retail or trade.
• The youth are also unwilling to undertake physically strenuous activities.
3. Women Employment
• The District has the lowest participation of women in labour force26 despite nearly 14% of the working age female population having at least a graduate27 degree (against a state average of 10%).
• Female employment is largely focussed on the apparel & textile sector. Large Industries often on-board females as trainees, provide training, accommodation and employment for 3-4 years. Many females tend to drop out after this period, due to marriage and the Industries recruit a fresh batch of workers. These were hitherto considered male dominated trades.
• Greater counselling and promotion of entrepreneurship / self-employment would further increase the participation of the women, even after their marriage.
• There is interest in agro-business and food processing sectors among the women in the District, especially in Fisheries and dairy related roles, which can be tapped into through targeted programs.
4. Youth Aspirations
• The aspirations of the youth are largely oriented towards white collared jobs, especially in the IT-ITES, Media & Entertainment and BFSI sectors.
• However, even in these sectors, there is low preference for the jobs with field work like Insurance agents. There is an aspiration to live in the bigger cities among the youth, and hence there is considerable migration to cities like Chennai, Thiruvananthapuram, and Kochi.
• There is negative perception in the community about blue-collared jobs.
5. Training & Skill Development
• The awareness about Skill Development programs was moderate, with CTS and ATS schemes being popularly known.
• There is lower awareness about other short-term skilling programs like PMKVY and TNSDC run programs.
• The quality of the trainees is below Industry standards; and additional training is provided by the employers to equip the trainees to become job-ready.
• There is also a trend among the institutes to tie up with larger companies in the larger cities for placements and apprenticeships. This deprives the local Industries from quality labour. These students do not acquire all round skills from these roles due to typified jobs. Larger Industries tend to not recruit these trainees upon the completion of apprenticeship period. These trainees aren’t equipped to handle the demands of the MSME industries, creating a mismatch in the labour market.
• The Private sector is keen to take on Apprenticeships, however they would require better operational support from the Dept. of Training in terms of mobilisation, reimbursements and incentivising the students to stay on their job for longer duration.
• Skill development for fishermen would require additional stipends to compensate for their wage losses.
26 District level estimates, EUS 2013-14 27 Census, 2011
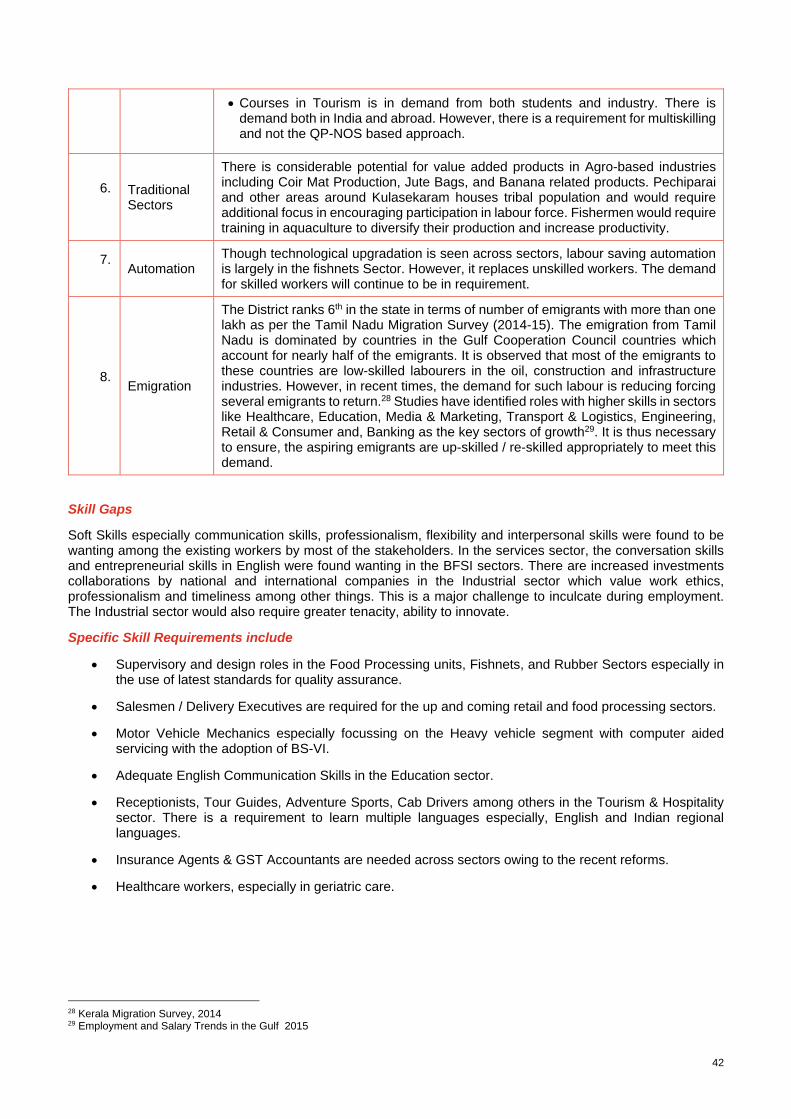
42
• Courses in Tourism is in demand from both students and industry. There is demand both in India and abroad. However, there is a requirement for multiskilling and not the QP-NOS based approach.
6. Traditional Sectors
There is considerable potential for value added products in Agro-based industries including Coir Mat Production, Jute Bags, and Banana related products. Pechiparai and other areas around Kulasekaram houses tribal population and would require additional focus in encouraging participation in labour force. Fishermen would require training in aquaculture to diversify their production and increase productivity.
7. Automation
Though technological upgradation is seen across sectors, labour saving automation is largely in the fishnets Sector. However, it replaces unskilled workers. The demand for skilled workers will continue to be in requirement.
8. Emigration
The District ranks 6th in the state in terms of number of emigrants with more than one lakh as per the Tamil Nadu Migration Survey (2014-15). The emigration from Tamil Nadu is dominated by countries in the Gulf Cooperation Council countries which account for nearly half of the emigrants. It is observed that most of the emigrants to these countries are low-skilled labourers in the oil, construction and infrastructure industries. However, in recent times, the demand for such labour is reducing forcing several emigrants to return.28 Studies have identified roles with higher skills in sectors like Healthcare, Education, Media & Marketing, Transport & Logistics, Engineering, Retail & Consumer and, Banking as the key sectors of growth29. It is thus necessary to ensure, the aspiring emigrants are up-skilled / re-skilled appropriately to meet this demand.
Skill Gaps
Soft Skills especially communication skills, professionalism, flexibility and interpersonal skills were found to be wanting among the existing workers by most of the stakeholders. In the services sector, the conversation skills and entrepreneurial skills in English were found wanting in the BFSI sectors. There are increased investments collaborations by national and international companies in the Industrial sector which value work ethics, professionalism and timeliness among other things. This is a major challenge to inculcate during employment. The Industrial sector would also require greater tenacity, ability to innovate.
Specific Skill Requirements include
• Supervisory and design roles in the Food Processing units, Fishnets, and Rubber Sectors especially in the use of latest standards for quality assurance.
• Salesmen / Delivery Executives are required for the up and coming retail and food processing sectors.
• Motor Vehicle Mechanics especially focussing on the Heavy vehicle segment with computer aided servicing with the adoption of BS-VI.
• Adequate English Communication Skills in the Education sector.
• Receptionists, Tour Guides, Adventure Sports, Cab Drivers among others in the Tourism & Hospitality sector. There is a requirement to learn multiple languages especially, English and Indian regional languages.
• Insurance Agents & GST Accountants are needed across sectors owing to the recent reforms.
• Healthcare workers, especially in geriatric care.
28 Kerala Migration Survey, 2014 29 Employment and Salary Trends in the Gulf 2015
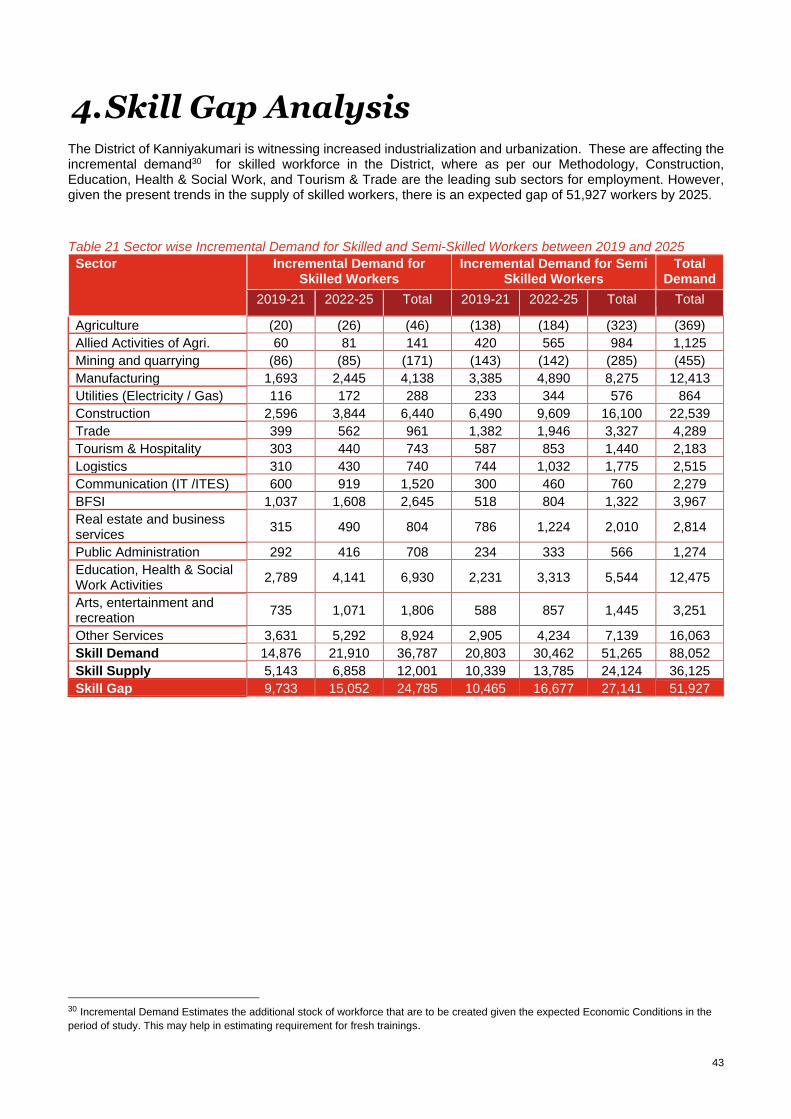
43
4. Skill Gap Analysis The District of Kanniyakumari is witnessing increased industrialization and urbanization. These are affecting the incremental demand30 for skilled workforce in the District, where as per our Methodology, Construction, Education, Health & Social Work, and Tourism & Trade are the leading sub sectors for employment. However, given the present trends in the supply of skilled workers, there is an expected gap of 51,927 workers by 2025.
Table 21 Sector wise Incremental Demand for Skilled and Semi-Skilled Workers between 2019 and 2025
Sector Incremental Demand for Skilled Workers
Incremental Demand for Semi Skilled Workers
Total Demand
2019-21 2022-25 Total 2019-21 2022-25 Total Total
Agriculture (20) (26) (46) (138) (184) (323) (369)
Allied Activities of Agri. 60 81 141 420 565 984 1,125
Mining and quarrying (86) (85) (171) (143) (142) (285) (455)
Manufacturing 1,693 2,445 4,138 3,385 4,890 8,275 12,413
Utilities (Electricity / Gas) 116 172 288 233 344 576 864
Construction 2,596 3,844 6,440 6,490 9,609 16,100 22,539
Trade 399 562 961 1,382 1,946 3,327 4,289
Tourism & Hospitality 303 440 743 587 853 1,440 2,183
Logistics 310 430 740 744 1,032 1,775 2,515
Communication (IT /ITES) 600 919 1,520 300 460 760 2,279
BFSI 1,037 1,608 2,645 518 804 1,322 3,967
Real estate and business services
315 490 804 786 1,224 2,010 2,814
Public Administration 292 416 708 234 333 566 1,274
Education, Health & Social Work Activities
2,789 4,141 6,930 2,231 3,313 5,544 12,475
Arts, entertainment and recreation
735 1,071 1,806 588 857 1,445 3,251
Other Services 3,631 5,292 8,924 2,905 4,234 7,139 16,063
Skill Demand 14,876 21,910 36,787 20,803 30,462 51,265 88,052
Skill Supply 5,143 6,858 12,001 10,339 13,785 24,124 36,125
Skill Gap 9,733 15,052 24,785 10,465 16,677 27,141 51,927
30 Incremental Demand Estimates the additional stock of workforce that are to be created given the expected Economic Conditions in the
period of study. This may help in estimating requirement for fresh trainings.
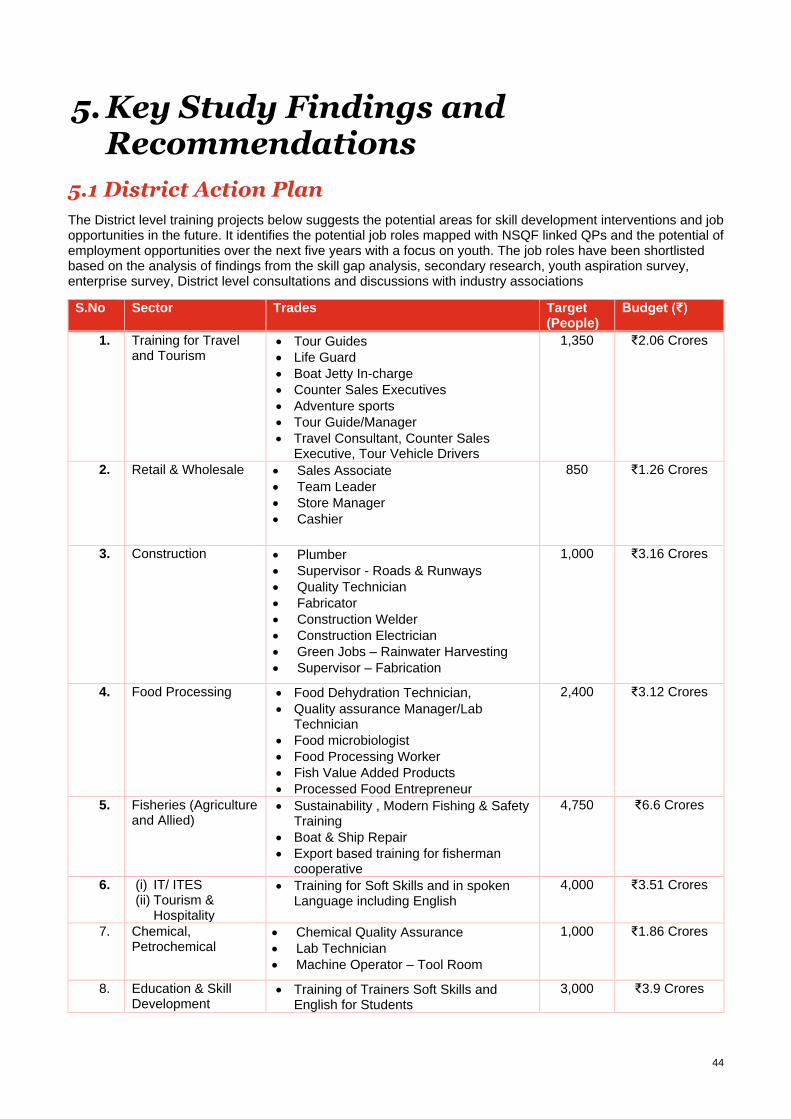
44
5. Key Study Findings and Recommendations
5.1 District Action Plan
The District level training projects below suggests the potential areas for skill development interventions and job opportunities in the future. It identifies the potential job roles mapped with NSQF linked QPs and the potential of employment opportunities over the next five years with a focus on youth. The job roles have been shortlisted based on the analysis of findings from the skill gap analysis, secondary research, youth aspiration survey, enterprise survey, District level consultations and discussions with industry associations
S.No Sector Trades Target (People)
Budget (₹)
1. Training for Travel and Tourism
• Tour Guides
• Life Guard
• Boat Jetty In-charge
• Counter Sales Executives
• Adventure sports
• Tour Guide/Manager
• Travel Consultant, Counter Sales Executive, Tour Vehicle Drivers
1,350 ₹2.06 Crores
2. Retail & Wholesale • Sales Associate
• Team Leader
• Store Manager
• Cashier
850 ₹1.26 Crores
3. Construction
• Plumber
• Supervisor - Roads & Runways
• Quality Technician
• Fabricator
• Construction Welder
• Construction Electrician
• Green Jobs – Rainwater Harvesting
• Supervisor – Fabrication
1,000 ₹3.16 Crores
4. Food Processing • Food Dehydration Technician,
• Quality assurance Manager/Lab Technician
• Food microbiologist
• Food Processing Worker
• Fish Value Added Products
• Processed Food Entrepreneur
2,400 ₹3.12 Crores
5. Fisheries (Agriculture and Allied)
• Sustainability , Modern Fishing & Safety Training
• Boat & Ship Repair
• Export based training for fisherman cooperative
4,750 ₹6.6 Crores
6. (i) IT/ ITES (ii) Tourism &
Hospitality
• Training for Soft Skills and in spoken Language including English
4,000 ₹3.51 Crores
7. Chemical, Petrochemical
• Chemical Quality Assurance
• Lab Technician
• Machine Operator – Tool Room
1,000 ₹1.86 Crores
8. Education & Skill Development
• Training of Trainers Soft Skills and English for Students
3,000 ₹3.9 Crores
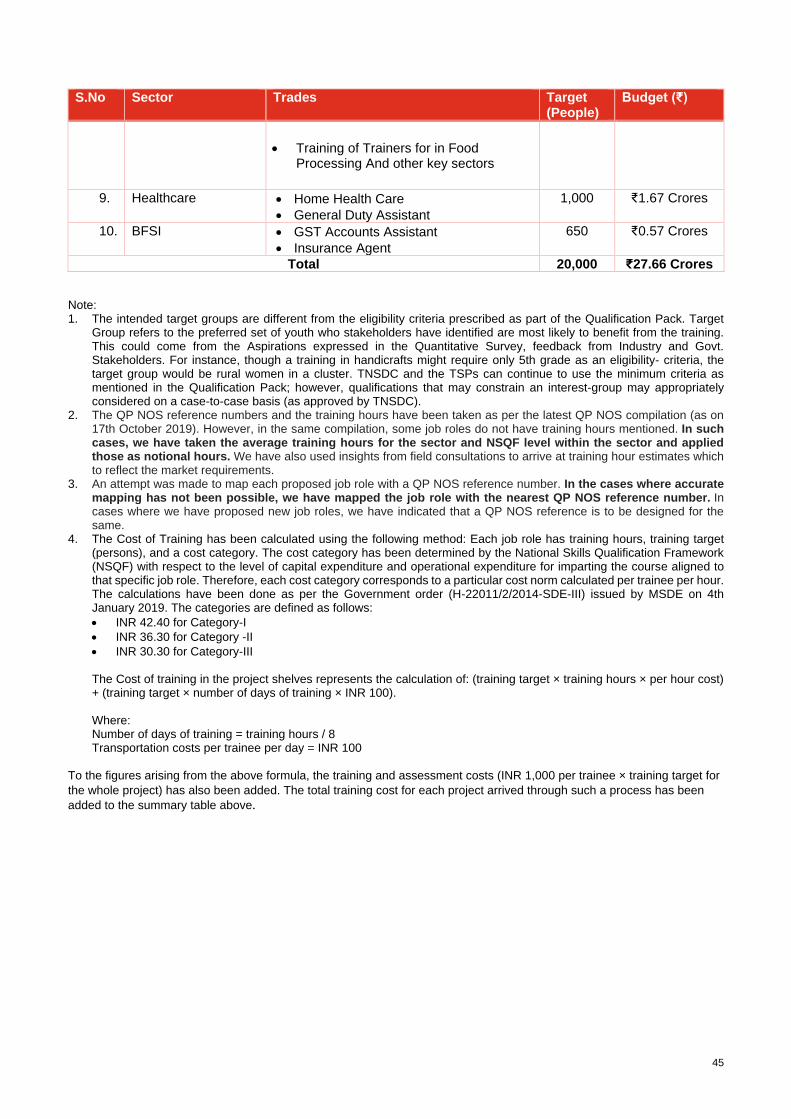
45
S.No Sector Trades Target (People)
Budget (₹)
• Training of Trainers for in Food Processing And other key sectors
9. Healthcare • Home Health Care
• General Duty Assistant
1,000 ₹1.67 Crores
10. BFSI • GST Accounts Assistant
• Insurance Agent
650 ₹0.57 Crores
Total 20,000 ₹27.66 Crores
Note: 1. The intended target groups are different from the eligibility criteria prescribed as part of the Qualification Pack. Target
Group refers to the preferred set of youth who stakeholders have identified are most likely to benefit from the training. This could come from the Aspirations expressed in the Quantitative Survey, feedback from Industry and Govt. Stakeholders. For instance, though a training in handicrafts might require only 5th grade as an eligibility- criteria, the target group would be rural women in a cluster. TNSDC and the TSPs can continue to use the minimum criteria as mentioned in the Qualification Pack; however, qualifications that may constrain an interest-group may appropriately considered on a case-to-case basis (as approved by TNSDC).
2. The QP NOS reference numbers and the training hours have been taken as per the latest QP NOS compilation (as on 17th October 2019). However, in the same compilation, some job roles do not have training hours mentioned. In such cases, we have taken the average training hours for the sector and NSQF level within the sector and applied those as notional hours. We have also used insights from field consultations to arrive at training hour estimates which to reflect the market requirements.
3. An attempt was made to map each proposed job role with a QP NOS reference number. In the cases where accurate mapping has not been possible, we have mapped the job role with the nearest QP NOS reference number. In cases where we have proposed new job roles, we have indicated that a QP NOS reference is to be designed for the same.
4. The Cost of Training has been calculated using the following method: Each job role has training hours, training target (persons), and a cost category. The cost category has been determined by the National Skills Qualification Framework (NSQF) with respect to the level of capital expenditure and operational expenditure for imparting the course aligned to that specific job role. Therefore, each cost category corresponds to a particular cost norm calculated per trainee per hour. The calculations have been done as per the Government order (H-22011/2/2014-SDE-III) issued by MSDE on 4th January 2019. The categories are defined as follows:
• INR 42.40 for Category-I
• INR 36.30 for Category -II
• INR 30.30 for Category-III The Cost of training in the project shelves represents the calculation of: (training target × training hours × per hour cost) + (training target × number of days of training × INR 100). Where: Number of days of training = training hours / 8 Transportation costs per trainee per day = INR 100
To the figures arising from the above formula, the training and assessment costs (INR 1,000 per trainee × training target for
the whole project) has also been added. The total training cost for each project arrived through such a process has been
added to the summary table above.
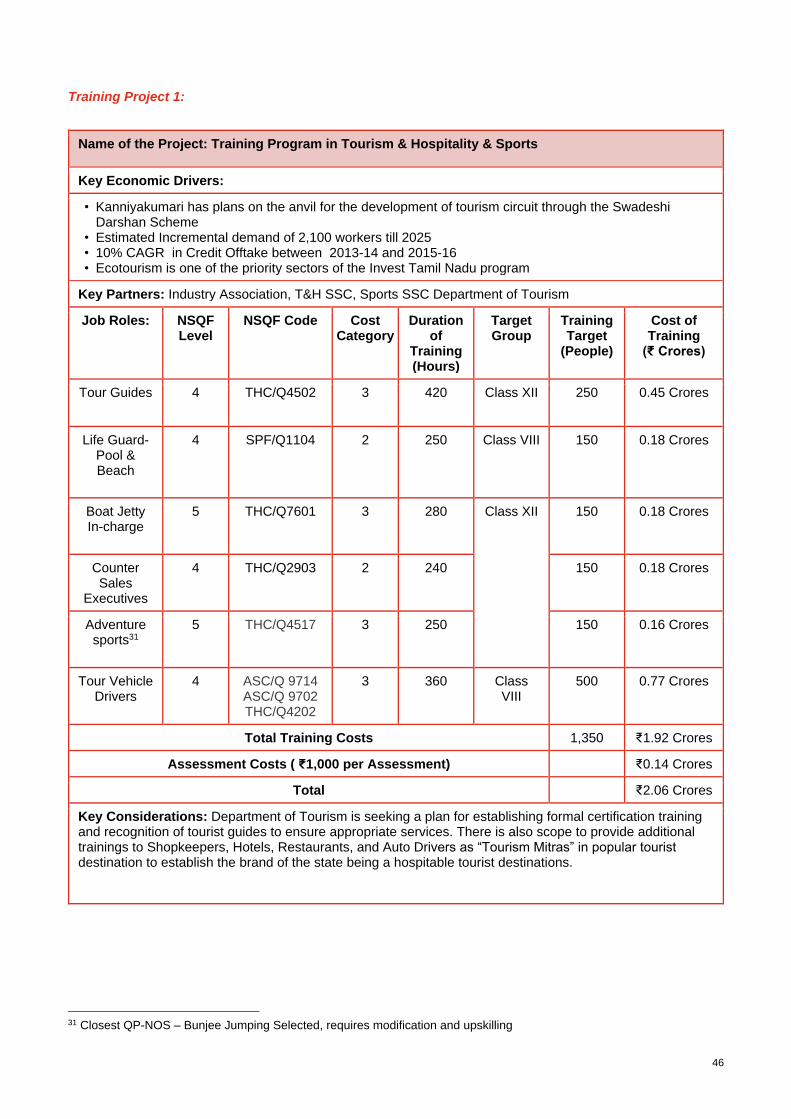
46
Training Project 1:
Name of the Project: Training Program in Tourism & Hospitality & Sports
Key Economic Drivers:
• Kanniyakumari has plans on the anvil for the development of tourism circuit through the Swadeshi Darshan Scheme
• Estimated Incremental demand of 2,100 workers till 2025 • 10% CAGR in Credit Offtake between 2013-14 and 2015-16 • Ecotourism is one of the priority sectors of the Invest Tamil Nadu program
Key Partners: Industry Association, T&H SSC, Sports SSC Department of Tourism
Job Roles: NSQF Level
NSQF Code Cost Category
Duration of
Training (Hours)
Target Group
Training Target
(People)
Cost of Training
(₹ Crores)
Tour Guides 4 THC/Q4502 3 420 Class XII 250 0.45 Crores
Life Guard-Pool & Beach
4 SPF/Q1104 2 250 Class VIII 150 0.18 Crores
Boat Jetty In-charge
5 THC/Q7601 3 280 Class XII
150 0.18 Crores
Counter Sales
Executives
4 THC/Q2903 2 240 150 0.18 Crores
Adventure sports31
5 THC/Q4517 3 250 150 0.16 Crores
Tour Vehicle Drivers
4 ASC/Q 9714 ASC/Q 9702 THC/Q4202
3 360 Class VIII
500 0.77 Crores
Total Training Costs 1,350 ₹1.92 Crores
Assessment Costs ( ₹1,000 per Assessment) ₹0.14 Crores
Total ₹2.06 Crores
Key Considerations: Department of Tourism is seeking a plan for establishing formal certification training and recognition of tourist guides to ensure appropriate services. There is also scope to provide additional trainings to Shopkeepers, Hotels, Restaurants, and Auto Drivers as “Tourism Mitras” in popular tourist destination to establish the brand of the state being a hospitable tourist destinations.
31 Closest QP-NOS – Bunjee Jumping Selected, requires modification and upskilling
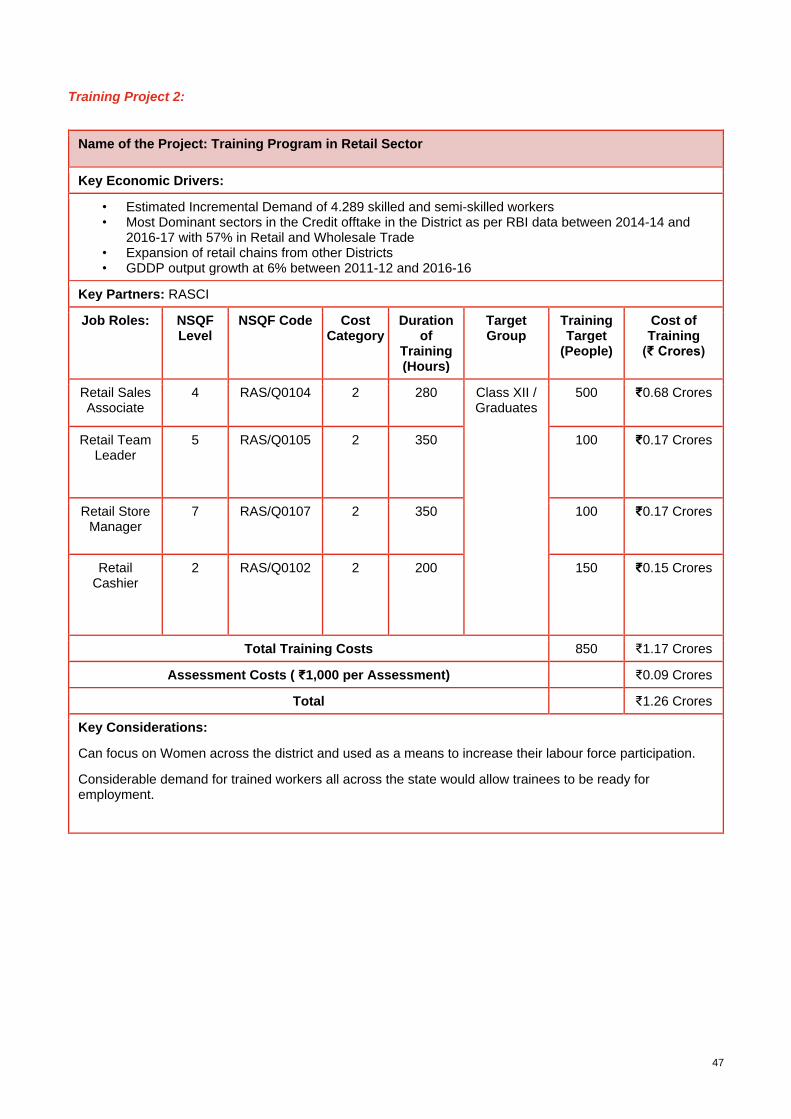
47
Training Project 2:
Name of the Project: Training Program in Retail Sector
Key Economic Drivers:
• Estimated Incremental Demand of 4.289 skilled and semi-skilled workers • Most Dominant sectors in the Credit offtake in the District as per RBI data between 2014-14 and
2016-17 with 57% in Retail and Wholesale Trade • Expansion of retail chains from other Districts • GDDP output growth at 6% between 2011-12 and 2016-16
Key Partners: RASCI
Job Roles: NSQF Level
NSQF Code Cost Category
Duration of
Training (Hours)
Target Group
Training Target
(People)
Cost of Training
(₹ Crores)
Retail Sales Associate
4 RAS/Q0104 2 280 Class XII / Graduates
500 ₹0.68 Crores
Retail Team Leader
5 RAS/Q0105 2 350 100 ₹0.17 Crores
Retail Store Manager
7 RAS/Q0107 2 350 100 ₹0.17 Crores
Retail Cashier
2 RAS/Q0102 2 200 150 ₹0.15 Crores
Total Training Costs 850 ₹1.17 Crores
Assessment Costs ( ₹1,000 per Assessment) ₹0.09 Crores
Total ₹1.26 Crores
Key Considerations:
Can focus on Women across the district and used as a means to increase their labour force participation.
Considerable demand for trained workers all across the state would allow trainees to be ready for employment.
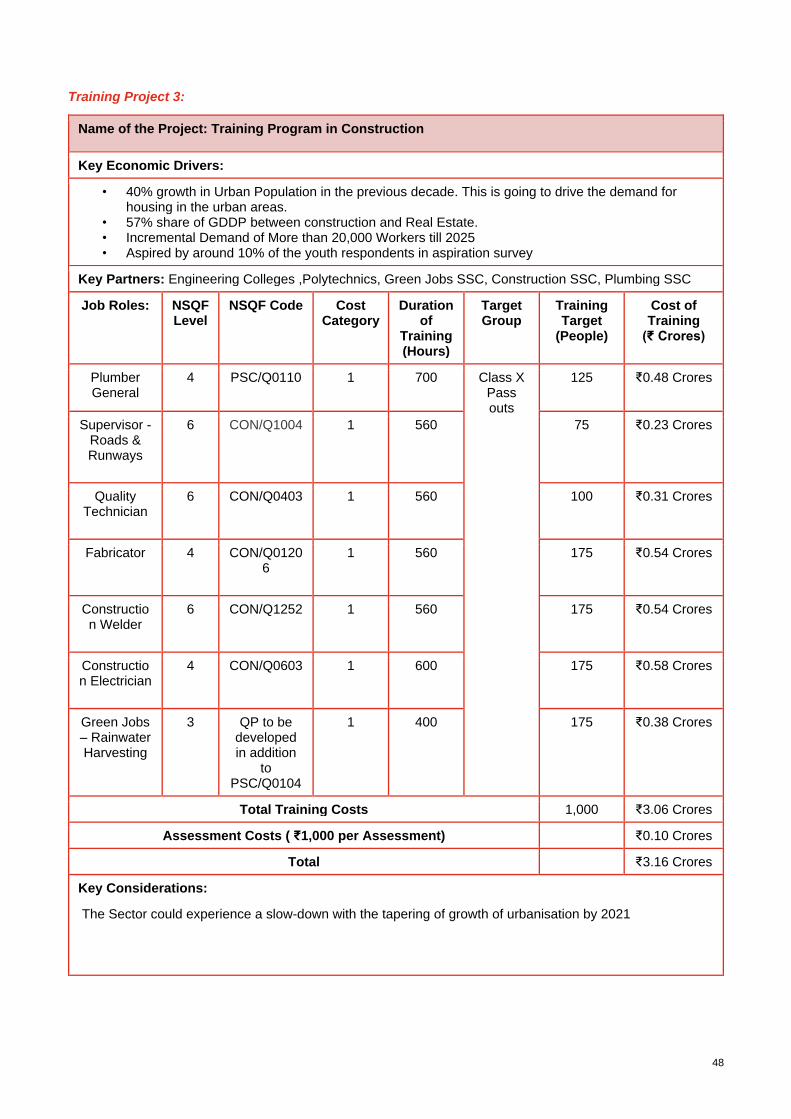
48
Training Project 3:
Name of the Project: Training Program in Construction
Key Economic Drivers:
• 40% growth in Urban Population in the previous decade. This is going to drive the demand for housing in the urban areas.
• 57% share of GDDP between construction and Real Estate. • Incremental Demand of More than 20,000 Workers till 2025 • Aspired by around 10% of the youth respondents in aspiration survey
Key Partners: Engineering Colleges ,Polytechnics, Green Jobs SSC, Construction SSC, Plumbing SSC
Job Roles: NSQF Level
NSQF Code Cost Category
Duration of
Training (Hours)
Target Group
Training Target
(People)
Cost of Training
(₹ Crores)
Plumber General
4 PSC/Q0110 1 700 Class X Pass outs
125 ₹0.48 Crores
Supervisor - Roads & Runways
6 CON/Q1004 1 560 75 ₹0.23 Crores
Quality Technician
6 CON/Q0403 1 560 100 ₹0.31 Crores
Fabricator 4 CON/Q01206
1 560 175 ₹0.54 Crores
Construction Welder
6 CON/Q1252 1 560 175 ₹0.54 Crores
Construction Electrician
4 CON/Q0603 1 600 175 ₹0.58 Crores
Green Jobs – Rainwater Harvesting
3 QP to be developed in addition
to PSC/Q0104
1 400 175 ₹0.38 Crores
Total Training Costs 1,000 ₹3.06 Crores
Assessment Costs ( ₹1,000 per Assessment) ₹0.10 Crores
Total ₹3.16 Crores
Key Considerations:
The Sector could experience a slow-down with the tapering of growth of urbanisation by 2021
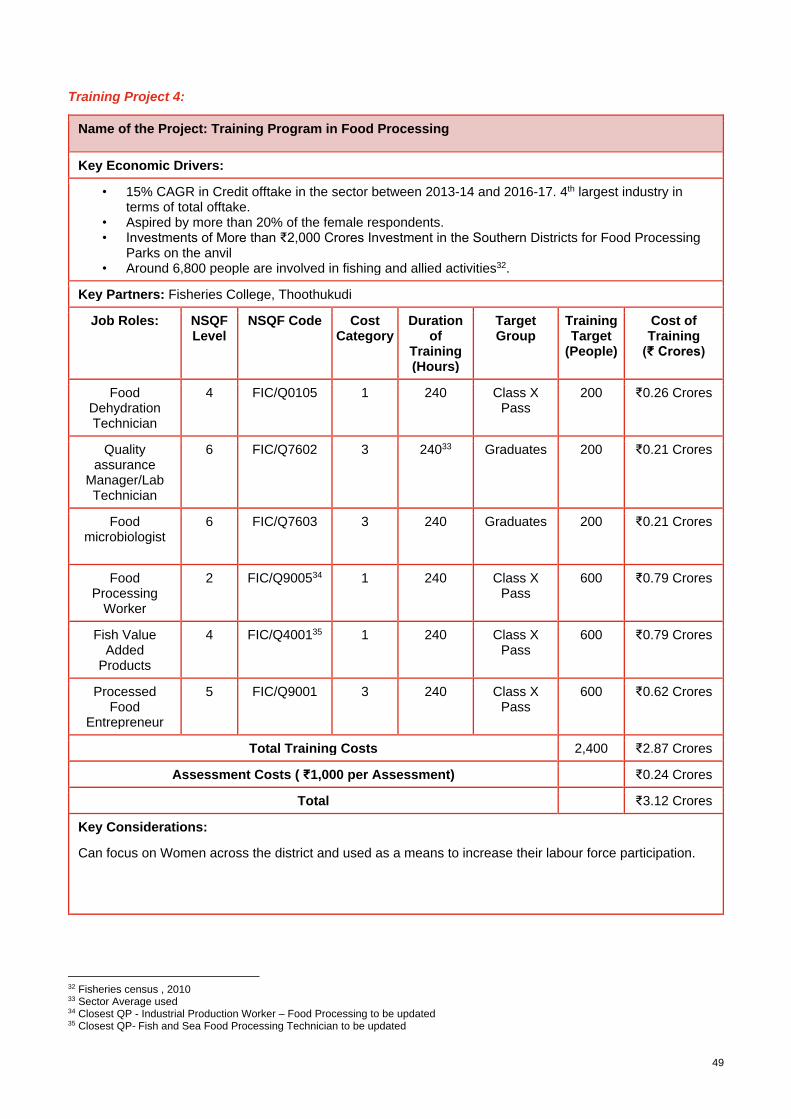
49
Training Project 4:
Name of the Project: Training Program in Food Processing
Key Economic Drivers:
• 15% CAGR in Credit offtake in the sector between 2013-14 and 2016-17. 4th largest industry in terms of total offtake.
• Aspired by more than 20% of the female respondents. • Investments of More than ₹2,000 Crores Investment in the Southern Districts for Food Processing
Parks on the anvil • Around 6,800 people are involved in fishing and allied activities32.
Key Partners: Fisheries College, Thoothukudi
Job Roles: NSQF Level
NSQF Code Cost Category
Duration of
Training (Hours)
Target Group
Training Target
(People)
Cost of Training
(₹ Crores)
Food Dehydration Technician
4 FIC/Q0105 1 240 Class X Pass
200
₹0.26 Crores
Quality assurance
Manager/Lab Technician
6 FIC/Q7602 3 24033 Graduates 200 ₹0.21 Crores
Food microbiologist
6 FIC/Q7603 3 240 Graduates 200 ₹0.21 Crores
Food Processing
Worker
2 FIC/Q900534 1 240 Class X Pass
600 ₹0.79 Crores
Fish Value Added
Products
4 FIC/Q400135 1 240 Class X Pass
600 ₹0.79 Crores
Processed Food
Entrepreneur
5 FIC/Q9001 3 240 Class X Pass
600 ₹0.62 Crores
Total Training Costs 2,400 ₹2.87 Crores
Assessment Costs ( ₹1,000 per Assessment) ₹0.24 Crores
Total ₹3.12 Crores
Key Considerations:
Can focus on Women across the district and used as a means to increase their labour force participation.
32 Fisheries census , 2010 33 Sector Average used 34 Closest QP - Industrial Production Worker – Food Processing to be updated 35 Closest QP- Fish and Sea Food Processing Technician to be updated
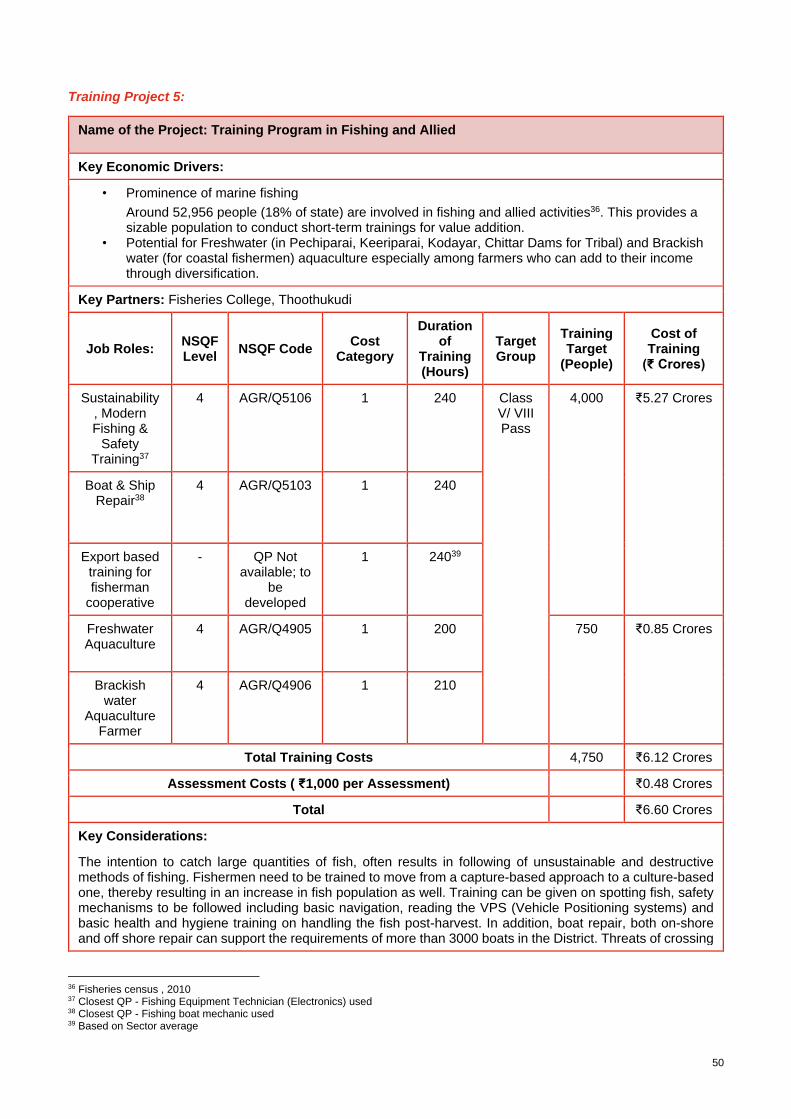
50
Training Project 5:
Name of the Project: Training Program in Fishing and Allied
Key Economic Drivers:
• Prominence of marine fishing
Around 52,956 people (18% of state) are involved in fishing and allied activities36. This provides a sizable population to conduct short-term trainings for value addition.
• Potential for Freshwater (in Pechiparai, Keeriparai, Kodayar, Chittar Dams for Tribal) and Brackish water (for coastal fishermen) aquaculture especially among farmers who can add to their income through diversification.
Key Partners: Fisheries College, Thoothukudi
Job Roles: NSQF Level
NSQF Code Cost
Category
Duration of
Training (Hours)
Target Group
Training Target
(People)
Cost of Training
(₹ Crores)
Sustainability , Modern Fishing &
Safety Training37
4 AGR/Q5106 1 240 Class V/ VIII Pass
4,000 ₹5.27 Crores
Boat & Ship Repair38
4 AGR/Q5103 1 240
Export based training for fisherman
cooperative
- QP Not available; to
be developed
1 24039
Freshwater Aquaculture
4 AGR/Q4905 1 200 750 ₹0.85 Crores
Brackish water
Aquaculture Farmer
4 AGR/Q4906 1 210
Total Training Costs 4,750 ₹6.12 Crores
Assessment Costs ( ₹1,000 per Assessment) ₹0.48 Crores
Total ₹6.60 Crores
Key Considerations:
The intention to catch large quantities of fish, often results in following of unsustainable and destructive methods of fishing. Fishermen need to be trained to move from a capture-based approach to a culture-based one, thereby resulting in an increase in fish population as well. Training can be given on spotting fish, safety mechanisms to be followed including basic navigation, reading the VPS (Vehicle Positioning systems) and basic health and hygiene training on handling the fish post-harvest. In addition, boat repair, both on-shore and off shore repair can support the requirements of more than 3000 boats in the District. Threats of crossing
36 Fisheries census , 2010 37 Closest QP - Fishing Equipment Technician (Electronics) used 38 Closest QP - Fishing boat mechanic used 39 Based on Sector average

51
international boundaries and borders are a constant issue in the northern blocks of the District. Training can include these aspects as well.
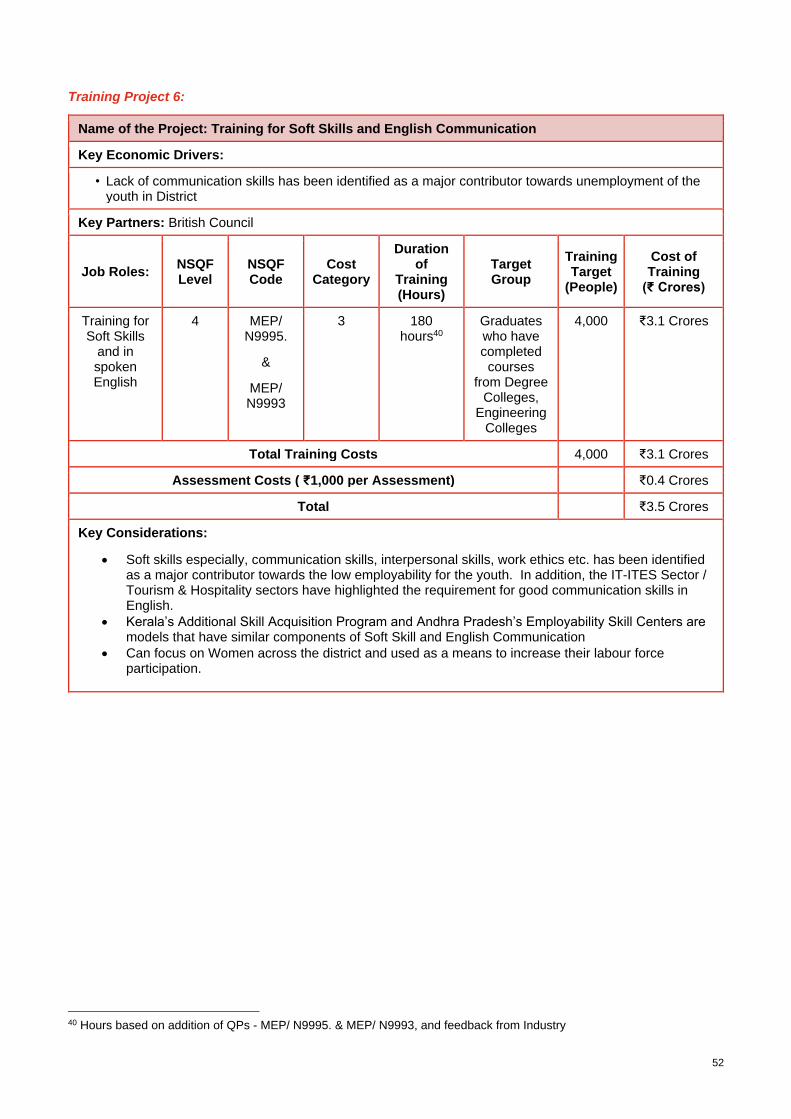
52
Training Project 6:
Name of the Project: Training for Soft Skills and English Communication
Key Economic Drivers:
• Lack of communication skills has been identified as a major contributor towards unemployment of the youth in District
Key Partners: British Council
Job Roles: NSQF Level
NSQF Code
Cost Category
Duration of
Training (Hours)
Target Group
Training Target
(People)
Cost of Training
(₹ Crores)
Training for Soft Skills
and in spoken English
4 MEP/ N9995.
&
MEP/ N9993
3 180 hours40
Graduates who have completed courses
from Degree Colleges,
Engineering Colleges
4,000 ₹3.1 Crores
Total Training Costs 4,000 ₹3.1 Crores
Assessment Costs ( ₹1,000 per Assessment) ₹0.4 Crores
Total ₹3.5 Crores
Key Considerations:
• Soft skills especially, communication skills, interpersonal skills, work ethics etc. has been identified as a major contributor towards the low employability for the youth. In addition, the IT-ITES Sector / Tourism & Hospitality sectors have highlighted the requirement for good communication skills in English.
• Kerala’s Additional Skill Acquisition Program and Andhra Pradesh’s Employability Skill Centers are models that have similar components of Soft Skill and English Communication
• Can focus on Women across the district and used as a means to increase their labour force participation.
40 Hours based on addition of QPs - MEP/ N9995. & MEP/ N9993, and feedback from Industry
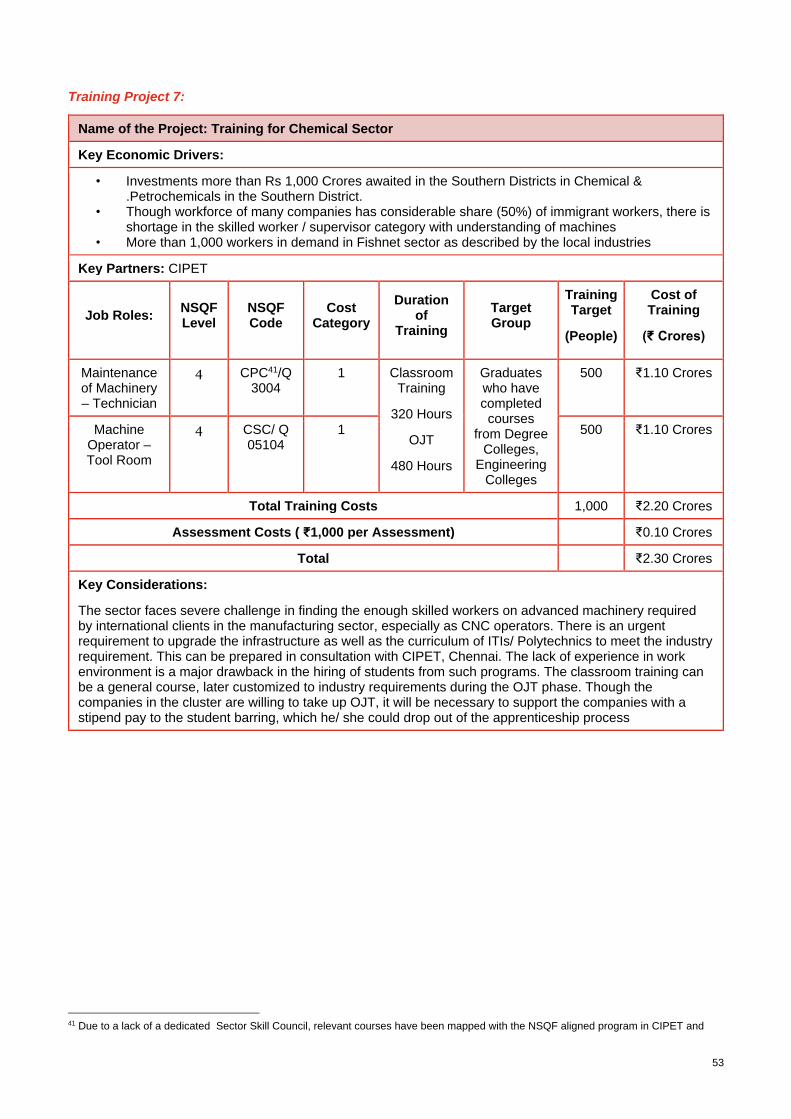
53
Training Project 7:
Name of the Project: Training for Chemical Sector
Key Economic Drivers:
• Investments more than Rs 1,000 Crores awaited in the Southern Districts in Chemical & .Petrochemicals in the Southern District.
• Though workforce of many companies has considerable share (50%) of immigrant workers, there is shortage in the skilled worker / supervisor category with understanding of machines
• More than 1,000 workers in demand in Fishnet sector as described by the local industries
Key Partners: CIPET
Job Roles: NSQF Level
NSQF Code
Cost Category
Duration of
Training
Target Group
Training Target
(People)
Cost of Training
(₹ Crores)
Maintenance of Machinery – Technician
4 CPC41/Q 3004
1 Classroom Training
320 Hours
OJT
480 Hours
Graduates who have completed courses
from Degree Colleges,
Engineering Colleges
500 ₹1.10 Crores
Machine Operator – Tool Room
4 CSC/ Q 05104
1 500 ₹1.10 Crores
Total Training Costs 1,000 ₹2.20 Crores
Assessment Costs ( ₹1,000 per Assessment) ₹0.10 Crores
Total ₹2.30 Crores
Key Considerations:
The sector faces severe challenge in finding the enough skilled workers on advanced machinery required by international clients in the manufacturing sector, especially as CNC operators. There is an urgent requirement to upgrade the infrastructure as well as the curriculum of ITIs/ Polytechnics to meet the industry requirement. This can be prepared in consultation with CIPET, Chennai. The lack of experience in work environment is a major drawback in the hiring of students from such programs. The classroom training can be a general course, later customized to industry requirements during the OJT phase. Though the companies in the cluster are willing to take up OJT, it will be necessary to support the companies with a stipend pay to the student barring, which he/ she could drop out of the apprenticeship process
41 Due to a lack of a dedicated Sector Skill Council, relevant courses have been mapped with the NSQF aligned program in CIPET and
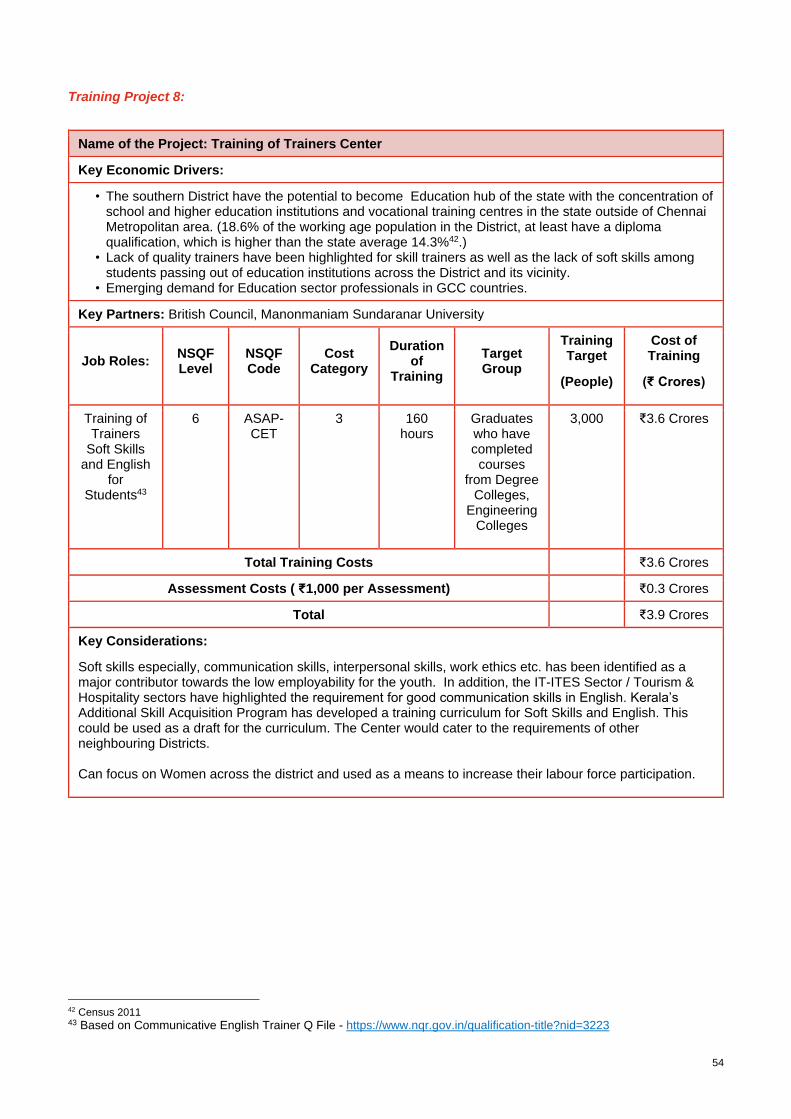
54
Training Project 8:
Name of the Project: Training of Trainers Center
Key Economic Drivers:
• The southern District have the potential to become Education hub of the state with the concentration of school and higher education institutions and vocational training centres in the state outside of Chennai Metropolitan area. (18.6% of the working age population in the District, at least have a diploma qualification, which is higher than the state average 14.3%42.)
• Lack of quality trainers have been highlighted for skill trainers as well as the lack of soft skills among students passing out of education institutions across the District and its vicinity.
• Emerging demand for Education sector professionals in GCC countries.
Key Partners: British Council, Manonmaniam Sundaranar University
Job Roles: NSQF Level
NSQF Code
Cost Category
Duration of
Training
Target Group
Training Target
(People)
Cost of Training
(₹ Crores)
Training of Trainers
Soft Skills and English
for Students43
6 ASAP- CET
3 160 hours
Graduates who have completed
courses from Degree
Colleges, Engineering
Colleges
3,000 ₹3.6 Crores
Total Training Costs ₹3.6 Crores
Assessment Costs ( ₹1,000 per Assessment) ₹0.3 Crores
Total ₹3.9 Crores
Key Considerations:
Soft skills especially, communication skills, interpersonal skills, work ethics etc. has been identified as a major contributor towards the low employability for the youth. In addition, the IT-ITES Sector / Tourism & Hospitality sectors have highlighted the requirement for good communication skills in English. Kerala’s Additional Skill Acquisition Program has developed a training curriculum for Soft Skills and English. This could be used as a draft for the curriculum. The Center would cater to the requirements of other neighbouring Districts. Can focus on Women across the district and used as a means to increase their labour force participation.
42 Census 2011 43 Based on Communicative English Trainer Q File - https://www.nqr.gov.in/qualification-title?nid=3223
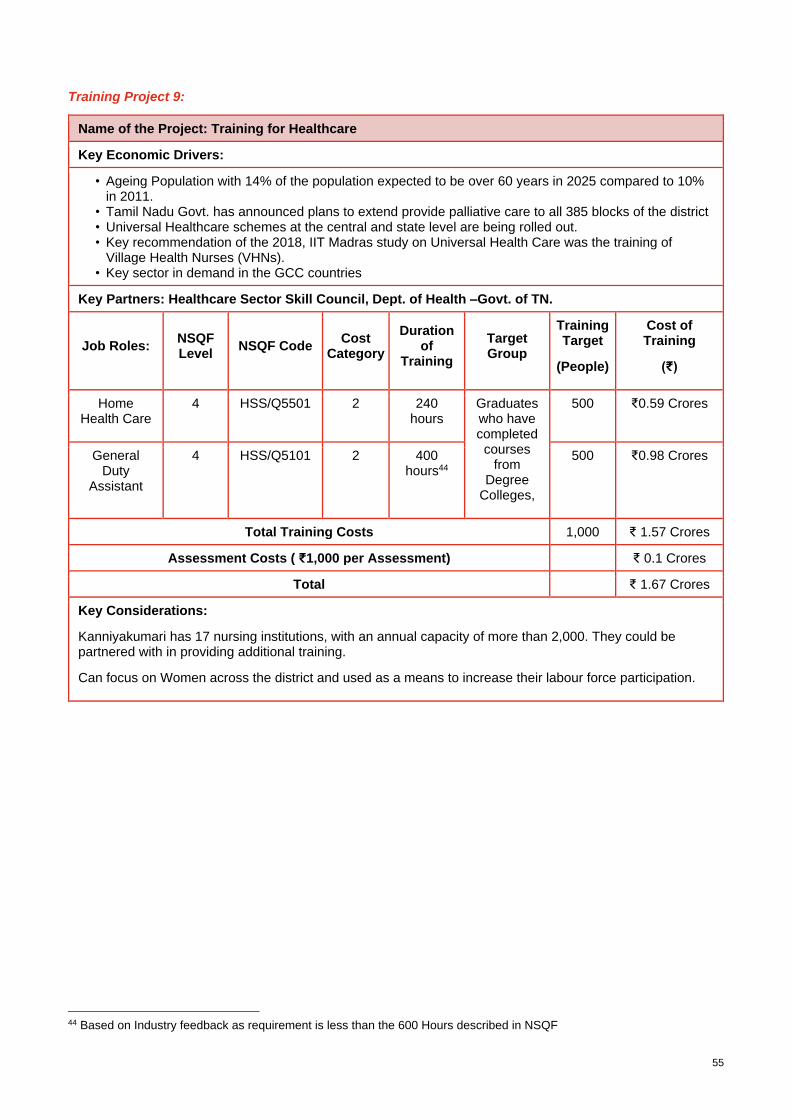
55
Training Project 9:
Name of the Project: Training for Healthcare
Key Economic Drivers:
• Ageing Population with 14% of the population expected to be over 60 years in 2025 compared to 10% in 2011.
• Tamil Nadu Govt. has announced plans to extend provide palliative care to all 385 blocks of the district • Universal Healthcare schemes at the central and state level are being rolled out. • Key recommendation of the 2018, IIT Madras study on Universal Health Care was the training of
Village Health Nurses (VHNs). • Key sector in demand in the GCC countries
Key Partners: Healthcare Sector Skill Council, Dept. of Health –Govt. of TN.
Job Roles: NSQF Level
NSQF Code Cost
Category
Duration of
Training
Target Group
Training Target
(People)
Cost of Training
(₹)
Home Health Care
4 HSS/Q5501 2 240 hours
Graduates who have completed courses
from Degree
Colleges,
500 ₹0.59 Crores
General Duty
Assistant
4 HSS/Q5101 2 400 hours44
500 ₹0.98 Crores
Total Training Costs 1,000 ₹ 1.57 Crores
Assessment Costs ( ₹1,000 per Assessment) ₹ 0.1 Crores
Total ₹ 1.67 Crores
Key Considerations:
Kanniyakumari has 17 nursing institutions, with an annual capacity of more than 2,000. They could be partnered with in providing additional training.
Can focus on Women across the district and used as a means to increase their labour force participation.
44 Based on Industry feedback as requirement is less than the 600 Hours described in NSQF
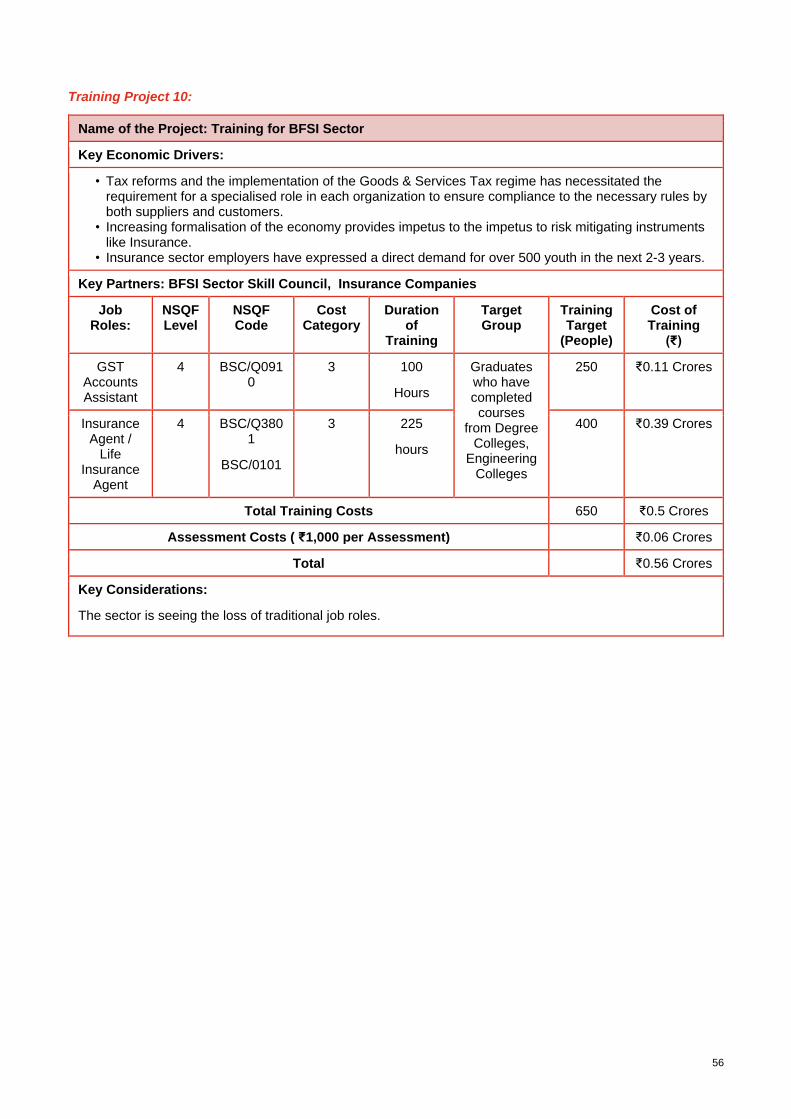
56
Training Project 10:
Name of the Project: Training for BFSI Sector
Key Economic Drivers:
• Tax reforms and the implementation of the Goods & Services Tax regime has necessitated the requirement for a specialised role in each organization to ensure compliance to the necessary rules by both suppliers and customers.
• Increasing formalisation of the economy provides impetus to the impetus to risk mitigating instruments like Insurance.
• Insurance sector employers have expressed a direct demand for over 500 youth in the next 2-3 years.
Key Partners: BFSI Sector Skill Council, Insurance Companies
Job Roles:
NSQF Level
NSQF Code
Cost Category
Duration of
Training
Target Group
Training Target
(People)
Cost of Training
(₹)
GST Accounts Assistant
4 BSC/Q0910
3 100
Hours
Graduates who have completed
courses from Degree
Colleges, Engineering
Colleges
250 ₹0.11 Crores
Insurance Agent /
Life Insurance
Agent
4 BSC/Q3801
BSC/0101
3 225
hours
400 ₹0.39 Crores
Total Training Costs 650 ₹0.5 Crores
Assessment Costs ( ₹1,000 per Assessment) ₹0.06 Crores
Total ₹0.56 Crores
Key Considerations:
The sector is seeing the loss of traditional job roles.
57
5.2 Key Recommendations
Recommendation on key interventions that needs to be taken up in order to foster the participation of youth in the economy are as follows:
Convergence:
There is an urgent need for several departments in the state engaged in Education, Vocational Education, Industrial Development, Agriculture and Allied activities, among others to converge their efforts. The parallel implementation of Skill trainings by several departments lead to the following (i) Misallocation of training capacity with multiple programs offering the same trades; (ii) Duplication of Beneficiaries without a de-duplicating mechanism like Aadhaar; and (iii) Dip in Quality Assurance owing to varied standards, target groups and monitoring frameworks. The interactions further revealed that, there is a coordination would be required at a larger scale across ecosystem across the Southern Districts of Tirunelveli, Thoothukudi, Kanniyakumari and Virudhunagar, owing to the fluid labour force actively commuting between towns for the purpose of work. The Institute Management Committees (IMCs) should be further strengthened apart from constituting necessary District and regional forums to dynamically adapt curriculum through Industrial feedback. There is a requirement for a Labour Market Information System (LMIS), which can be used to ensure a better participation between Industry, job Seekers and the Vocational Education System.
Enabling market understanding and Managing career aspirations: The youth aspire for white collared jobs. The aspired monthly income amongst youth was much higher than the prevailing wages youth engaged in economic activity presently earn. There is mismatch in market perception and aspirations of youth (about economic opportunities, salaries/wages, working conditions, career growth prospects, etc.) and market realities. A large number of youth aspire for employment in the public sector, while there is very limited and consistently reducing employment prospects within the public sector. Further, given the limitations in private sector employment within the District, there is less understanding and limited exposure to works. Hence, there is a requirement for initiating counselling on career prospects and market trends at the secondary levels of education, continuing through higher levels of education with a focus on promoting entrepreneurship, self-employment and careers in the private sector.
Imparting Globally employable Skills: Kanniyakumari have industries in very limited numbers, and the same are largely not aligned to the aspirations of the youth. The general population has a tendency to travel long distances to Tirunelveli, Thoothukudi and Thiruvananthapuram on a daily basis – which is evidence to the persons consistently seeking economic opportunities beyond the District boundaries. There is also tendency among the District’s working-age population to venture for jobs/ careers outside the country (predominantly to GCC countries). From the skilling perspective, this will mean that, the Youth of the District are required to be trained for a market much beyond the District boundaries. The choice of training to be available from a wider market prospect, and specifically aligned to the global application/ standards. TNSDC can seek partnerships with relevant industries (beyond the District boundaries) for effective training delivery, provision of industry-exposure and internships/ apprenticeships; and with assessment agencies for delivering certified-courses.
The higher levels of educational attainment among the youth in the District provide an opportunity to train youth in courses, which are of higher order as per the NSQF, especially at higher competency levels, new-age job roles, and on supervisory roles. ITIs and polytechnics, should increase the exposure to advanced machinery or content (like safety) to make the candidates job ready. Construction, Healthcare, Food Processing, Agro-business and Education sectors are key areas of employment potential and require augmentation of training capacity.
Promoting/ Improving Womens’ Participation in Labourforce: The District has the lowest participation of women in labour force among all Districts in the State45, despite high attainment of education. Counselling of women from early stages of their education in a structured manner on the career prospects, financial independence, and welfare, to be implemented Counselling of parents and community members to further promote/ encourage womens’ participation in economic activity to be carried-out. In addition, it is important to promote entrepreneurship / self-employment among women individually or as groups of like-minded/ compatible women to enable active participation of women in economic activities.
Industry Experience: It is seen that the earning potential among graduates does not vary significantly from Diploma / ITI holders over their career path. To enhance the value of the programs at the graduate level, it is necessary to strengthen the exposure to work environments among both technical and non-technical programs through mandatory hands-on training at appropriate organizations in the industrial and services sectors. English
45 District level estimates, EUS 2013-14
58
and ICT skills are to be given to Arts & Sciences students through an added skill program to improve their employability. In addition, it is necesssary to ensure trainers are also updated on the recent trends in the Industry through special training programs.
Augmenting Labour at MSMEs: MSMEs have highlighted the unavailability of local labour due to large-scale international, inter-state and intra-state migrations of skilled workers. The Apprenticeship scheme or wage subsidies on the lines of MGNREGA could be designed for supporting the local Industry to channelize labour towards them. Enhancement in the stipends or a hybrid model (based on the period of deployment or Government financial support or any other) to improve participation of MSMEs and balance the deployment at large units. The MSMEs have also faced operational constraints with attrition rates. It is suggested, that a Direct Benefit Transfer system, with direct incentives to the trainee to complete the training at the MSMEs be brought in as part of the design.
Fostering Traditional Sectors: There is considerable potential for value added products in Agro-based industries including Coir Mat Production, Jute Bags, and Banana related products. Pechiparai and other areas around Kulasekaram houses tribal population and would require additional focus in encouraging participation in labour force. Fishermen would require training in aquaculture and food processing to diversify their livelihood prospects and increase productivity.
59
Appendix -1
A1. Methodology for Block Selection for Youth Aspiration survey
Sampling Design for Youth Survey A total of 360 youth was surveyed in the District, which included youth in both self-employment and wage-employment, unemployed youth, youth on education system, and youth under NEET category to get a balanced representation of various socioeconomic and demographic characteristics of the population. 1. Students from educational and training institutions: The list of General arts/science/commerce colleges, engineering colleges, polytechnic colleges and Industrial Training Institutions was obtained. A list of educational institutions was randomly sampled from the list. Of the selected institutions, a list of randomly selected students were interviewed. 2. Household Level Survey: In the selected blocks, few villages and wards were randomly selected. After consultation with the head of the village/ward, a sample of households was selected. 3. Self – Employed Youth: To cover self – Employed Youth in the sample, a roster of beneficiaries from the Pradhan Mantri Employment Generation Programme (PMEGP) shall be randomly selected from the list, which will be obtained from the concerned authority at the District level. 4. Employed in the informal sector: The youth from unorganized sector were identified at the cluster-level after obtaining and examining the list of enterprises that are not registered and those workers were doing job-work type of activities. Selection of Block The block selection methodology involved the identification of blocks by categorizing them into High development, Medium development and Low development. The adjacent picture shows the blocks in Ariyalur selected for the survey. The methodology is explained below: To categorize blocks, the following data points were used.
• Count of MSME Clusters (based on DC-MSME Report)
• Number of SIDCO Industrial Estates
• Number of SIPCOT Industrial Estates
• Credit Outstanding, 2017-18 at Centre-level (Annual Data published by the Reserve Bank of India) The following weights were assigned post award of marks:
• MSME Cluster – 25%
• SIDCO Cluster – 25%
• SIPCOT Industrial Estate – 5%
• Annual Centre-level Credit Data – 45%
Based on the above weights, the total score of each block was calculated. The total score was capped at 100. To classify the block as High/Medium/Low, the total score was converted into percentile values and categorized into three groups – 0-33.33th percentile values, 33.33 to 66.67 percentile value and 66.67 to 100 percentile values. The percentile values are calculated with respect to each district as the base. Based on the percentile classification obtained, blocks were classified as follows:
• 0 to 33.33 percentile value: Low
• 33.33 to 66.67 percentile value: Medium
• 66.67 to 100 percentile values: High After deriving the above values for the blocks, two blocks are randomly selected from each category.
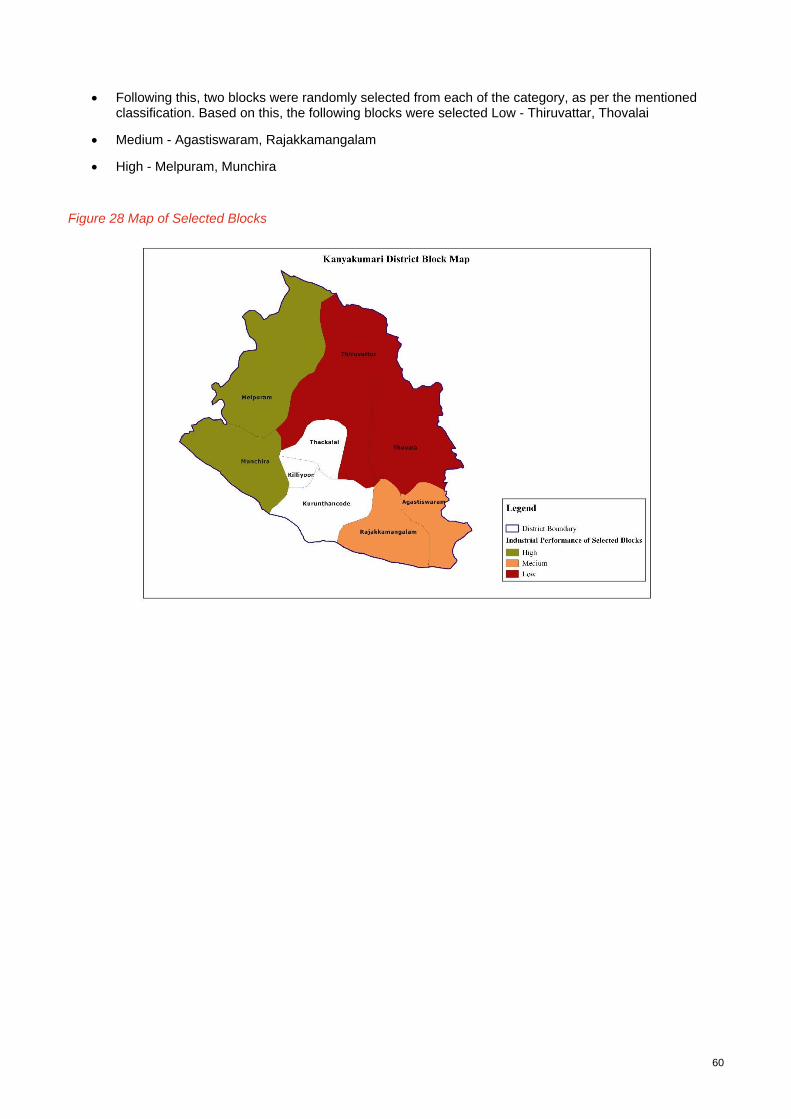
60
• Following this, two blocks were randomly selected from each of the category, as per the mentioned classification. Based on this, the following blocks were selected Low - Thiruvattar, Thovalai
• Medium - Agastiswaram, Rajakkamangalam
• High - Melpuram, Munchira
Figure 28 Map of Selected Blocks
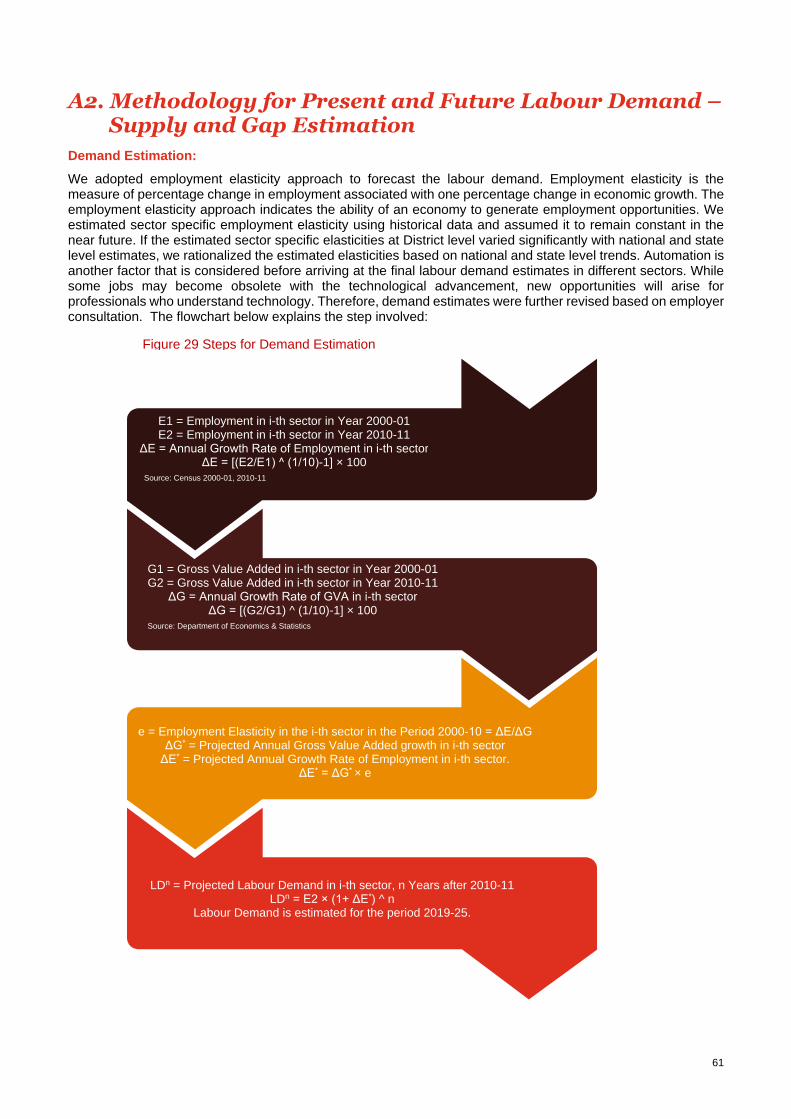
61
A2. Methodology for Present and Future Labour Demand – Supply and Gap Estimation
Demand Estimation:
We adopted employment elasticity approach to forecast the labour demand. Employment elasticity is the measure of percentage change in employment associated with one percentage change in economic growth. The employment elasticity approach indicates the ability of an economy to generate employment opportunities. We estimated sector specific employment elasticity using historical data and assumed it to remain constant in the near future. If the estimated sector specific elasticities at District level varied significantly with national and state level estimates, we rationalized the estimated elasticities based on national and state level trends. Automation is another factor that is considered before arriving at the final labour demand estimates in different sectors. While some jobs may become obsolete with the technological advancement, new opportunities will arise for professionals who understand technology. Therefore, demand estimates were further revised based on employer consultation. The flowchart below explains the step involved:
E1 = Employment in i-th sector in Year 2000-01 E2 = Employment in i-th sector in Year 2010-11
ΔE = Annual Growth Rate of Employment in i-th sector ΔE = [(E2/E1) ^ (1/10)-1] × 100
Source: Census 2000-01, 2010-11
G1 = Gross Value Added in i-th sector in Year 2000-01 G2 = Gross Value Added in i-th sector in Year 2010-11
ΔG = Annual Growth Rate of GVA in i-th sector ΔG = [(G2/G1) ^ (1/10)-1] × 100
Source: Department of Economics & Statistics
e = Employment Elasticity in the i-th sector in the Period 2000-10 = ΔE/ΔG ΔG* = Projected Annual Gross Value Added growth in i-th sector
ΔE* = Projected Annual Growth Rate of Employment in i-th sector. ΔE* = ΔG* × e
LDn = Projected Labour Demand in i-th sector, n Years after 2010-11 LDn = E2 × (1+ ΔE*) ^ n
Labour Demand is estimated for the period 2019-25.
Figure 29 Steps for Demand Estimation
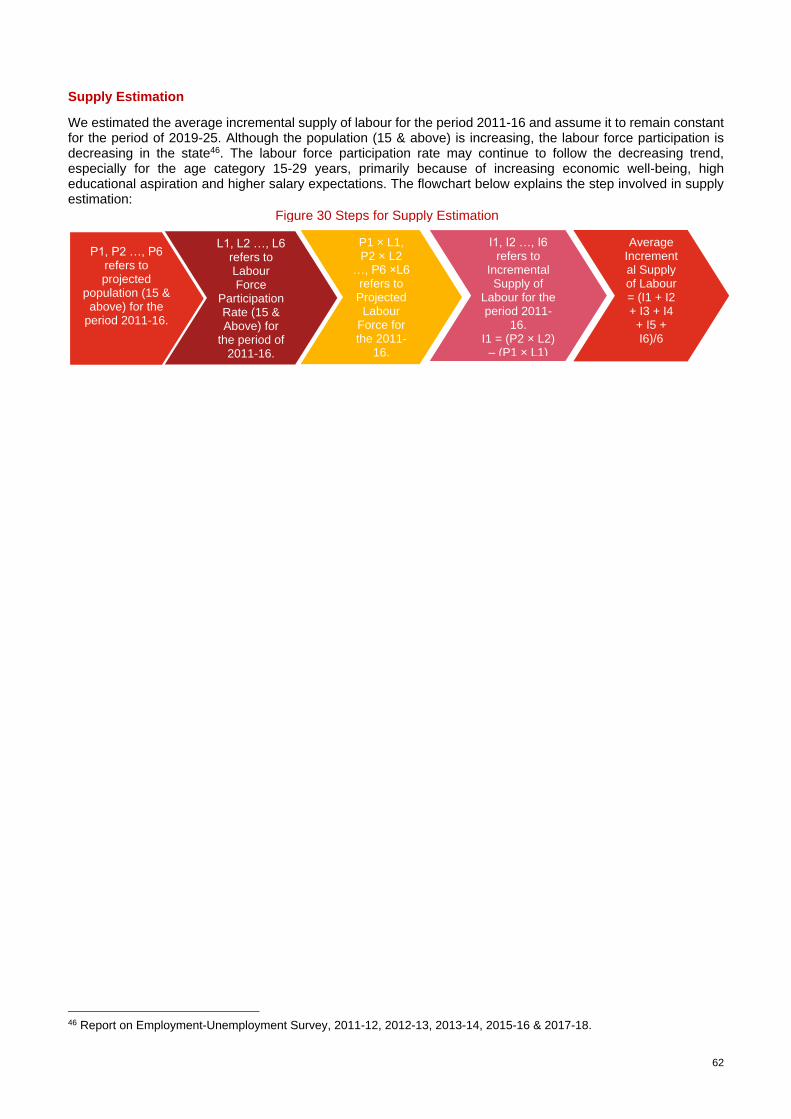
62
Supply Estimation
We estimated the average incremental supply of labour for the period 2011-16 and assume it to remain constant for the period of 2019-25. Although the population (15 & above) is increasing, the labour force participation is decreasing in the state46. The labour force participation rate may continue to follow the decreasing trend, especially for the age category 15-29 years, primarily because of increasing economic well-being, high educational aspiration and higher salary expectations. The flowchart below explains the step involved in supply estimation:
46 Report on Employment-Unemployment Survey, 2011-12, 2012-13, 2013-14, 2015-16 & 2017-18.
P1, P2 …, P6 refers to projected
population (15 & above) for the
period 2011-16.
L1, L2 …, L6 refers to Labour Force
Participation Rate (15 & Above) for
the period of 2011-16.
P1 × L1, P2 × L2
…, P6 ×L6 refers to
Projected Labour
Force for the 2011-
16.
I1, I2 …, I6 refers to
Incremental Supply of
Labour for the period 2011-
16. I1 = (P2 × L2)
– (P1 × L1)
Average Incremental Supply of Labour = (I1 + I2 + I3 + I4
+ I5 + I6)/6
Figure 30 Steps for Supply Estimation
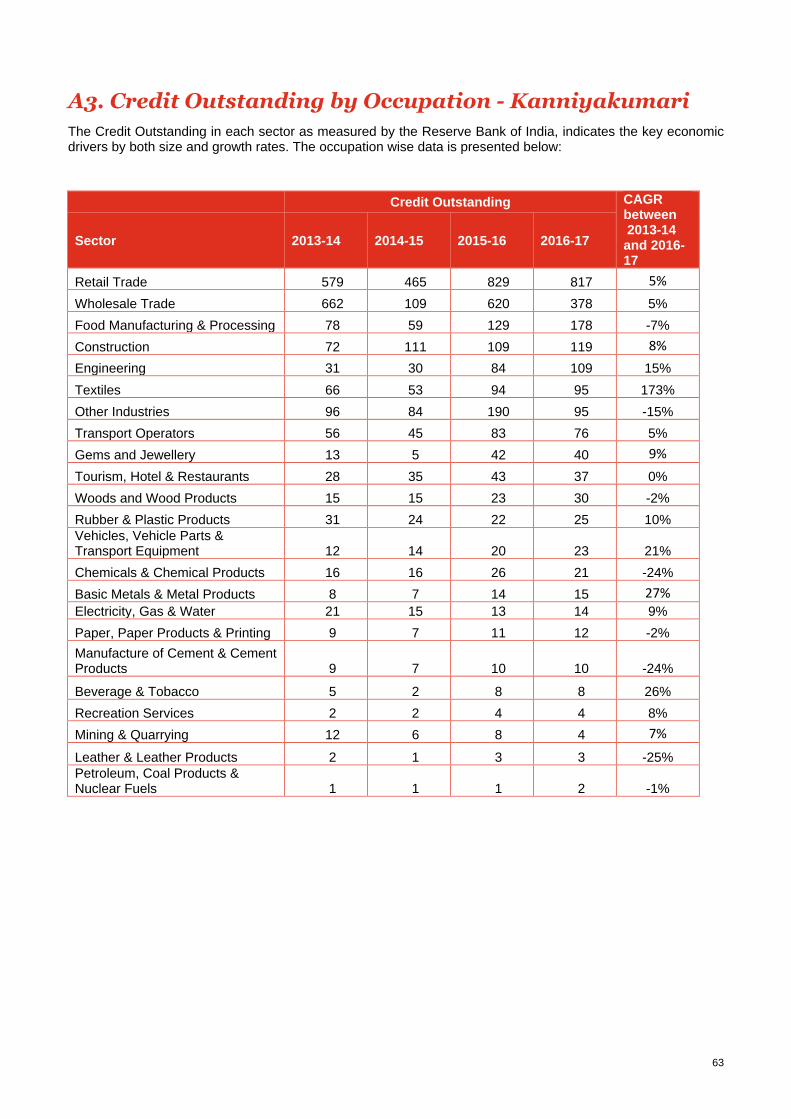
63
A3. Credit Outstanding by Occupation - Kanniyakumari
The Credit Outstanding in each sector as measured by the Reserve Bank of India, indicates the key economic drivers by both size and growth rates. The occupation wise data is presented below:
Credit Outstanding CAGR between 2013-14 and 2016-17
Sector 2013-14 2014-15 2015-16 2016-17
Retail Trade 579 465 829 817 5%
Wholesale Trade 662 109 620 378 5%
Food Manufacturing & Processing 78 59 129 178 -7%
Construction 72 111 109 119 8%
Engineering 31 30 84 109 15%
Textiles 66 53 94 95 173%
Other Industries 96 84 190 95 -15%
Transport Operators 56 45 83 76 5%
Gems and Jewellery 13 5 42 40 9%
Tourism, Hotel & Restaurants 28 35 43 37 0%
Woods and Wood Products 15 15 23 30 -2%
Rubber & Plastic Products 31 24 22 25 10%
Vehicles, Vehicle Parts & Transport Equipment 12 14 20 23 21%
Chemicals & Chemical Products 16 16 26 21 -24%
Basic Metals & Metal Products 8 7 14 15 27%
Electricity, Gas & Water 21 15 13 14 9%
Paper, Paper Products & Printing 9 7 11 12 -2%
Manufacture of Cement & Cement Products 9 7 10 10 -24%
Beverage & Tobacco 5 2 8 8 26%
Recreation Services 2 2 4 4 8%
Mining & Quarrying 12 6 8 4 7%
Leather & Leather Products 2 1 3 3 -25% Petroleum, Coal Products & Nuclear Fuels 1 1 1 2 -1%
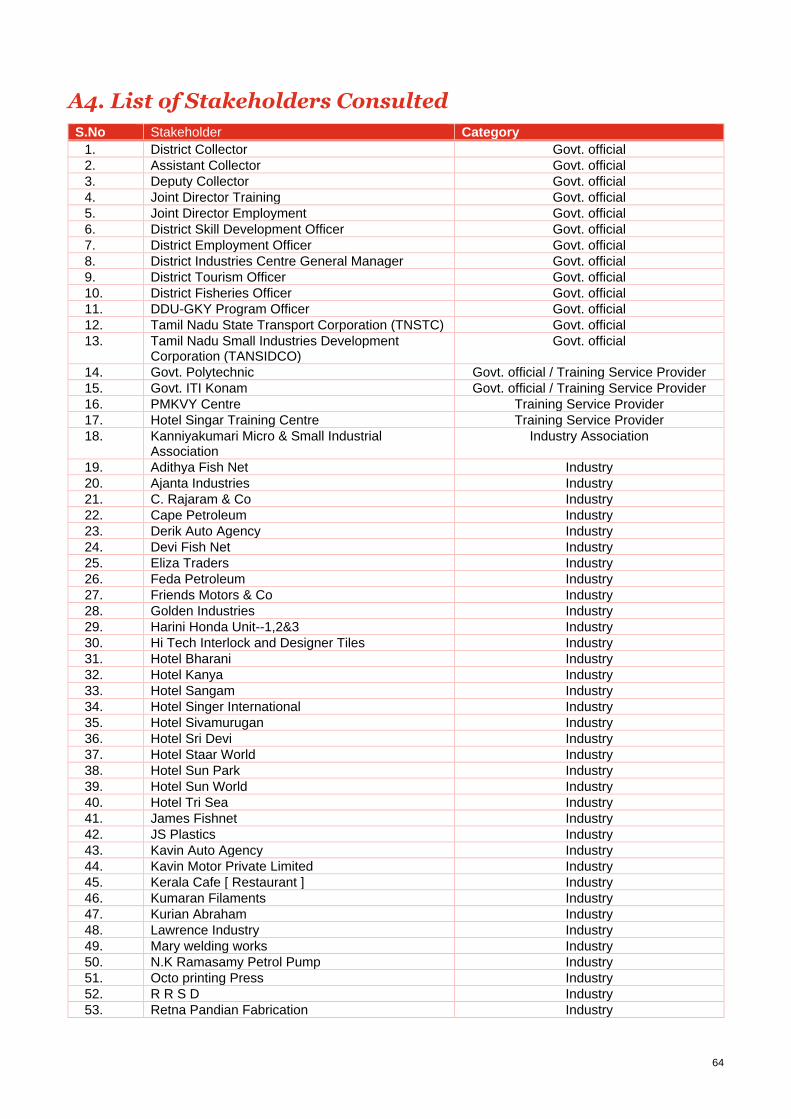
64
A4. List of Stakeholders Consulted
S.No Stakeholder Category
1. District Collector Govt. official
2. Assistant Collector Govt. official
3. Deputy Collector Govt. official
4. Joint Director Training Govt. official
5. Joint Director Employment Govt. official
6. District Skill Development Officer Govt. official
7. District Employment Officer Govt. official
8. District Industries Centre General Manager Govt. official
9. District Tourism Officer Govt. official
10. District Fisheries Officer Govt. official
11. DDU-GKY Program Officer Govt. official
12. Tamil Nadu State Transport Corporation (TNSTC) Govt. official
13. Tamil Nadu Small Industries Development Corporation (TANSIDCO)
Govt. official
14. Govt. Polytechnic Govt. official / Training Service Provider
15. Govt. ITI Konam Govt. official / Training Service Provider
16. PMKVY Centre Training Service Provider
17. Hotel Singar Training Centre Training Service Provider
18. Kanniyakumari Micro & Small Industrial Association
Industry Association
19. Adithya Fish Net Industry
20. Ajanta Industries Industry
21. C. Rajaram & Co Industry
22. Cape Petroleum Industry
23. Derik Auto Agency Industry
24. Devi Fish Net Industry
25. Eliza Traders Industry
26. Feda Petroleum Industry
27. Friends Motors & Co Industry
28. Golden Industries Industry
29. Harini Honda Unit--1,2&3 Industry
30. Hi Tech Interlock and Designer Tiles Industry
31. Hotel Bharani Industry
32. Hotel Kanya Industry
33. Hotel Sangam Industry
34. Hotel Singer International Industry
35. Hotel Sivamurugan Industry
36. Hotel Sri Devi Industry
37. Hotel Staar World Industry
38. Hotel Sun Park Industry
39. Hotel Sun World Industry
40. Hotel Tri Sea Industry
41. James Fishnet Industry
42. JS Plastics Industry
43. Kavin Auto Agency Industry
44. Kavin Motor Private Limited Industry
45. Kerala Cafe [ Restaurant ] Industry
46. Kumaran Filaments Industry
47. Kurian Abraham Industry
48. Lawrence Industry Industry
49. Mary welding works Industry
50. N.K Ramasamy Petrol Pump Industry
51. Octo printing Press Industry
52. R R S D Industry
53. Retna Pandian Fabrication Industry

65
S.No Stakeholder Category
54. S P Mechanical Industry
55. Sandhya industries Industry
56. Santha Bhavan [ RINN ] Industry
57. Sea Shore Hotel Industry
58. Sea Sun Residency Industry
59. Sirusthana & Siddharth Krish Industries Industry
60. SV industries Industry
61. Tino Engineering Industry
62. Vadantham industries Industry
63. Wild Fishnet Industry
64. Win Nissan Industry
Related Documents