BASELINE SURVEY IN THE MINORITY CONCENTRATED DISTRICTS OF U.P. (REPORT OF SIDDHARTH NAGAR DISTRICT) Sponsored by Ministry of Minority Affairs Government of India New Delhi Conducted by P.S. Garia Giri Institute of Development Studies Sector O, Aliganj Housing Scheme Lucknow-226 024 2008

Welcome message from author
This document is posted to help you gain knowledge. Please leave a comment to let me know what you think about it! Share it to your friends and learn new things together.
Transcript

BASELINE SURVEY IN THE MINORITY CONCENTRATED DISTRICTS OF U.P.
(REPORT OF SIDDHARTH NAGAR DISTRICT)
Sponsored by
Ministry of Minority Affairs Government of India
New Delhi
Conducted by
P.S. Garia
Giri Institute of Development Studies Sector O, Aliganj Housing Scheme
Lucknow-226 024
2008

CONTENTS
List of Tables ii-iii
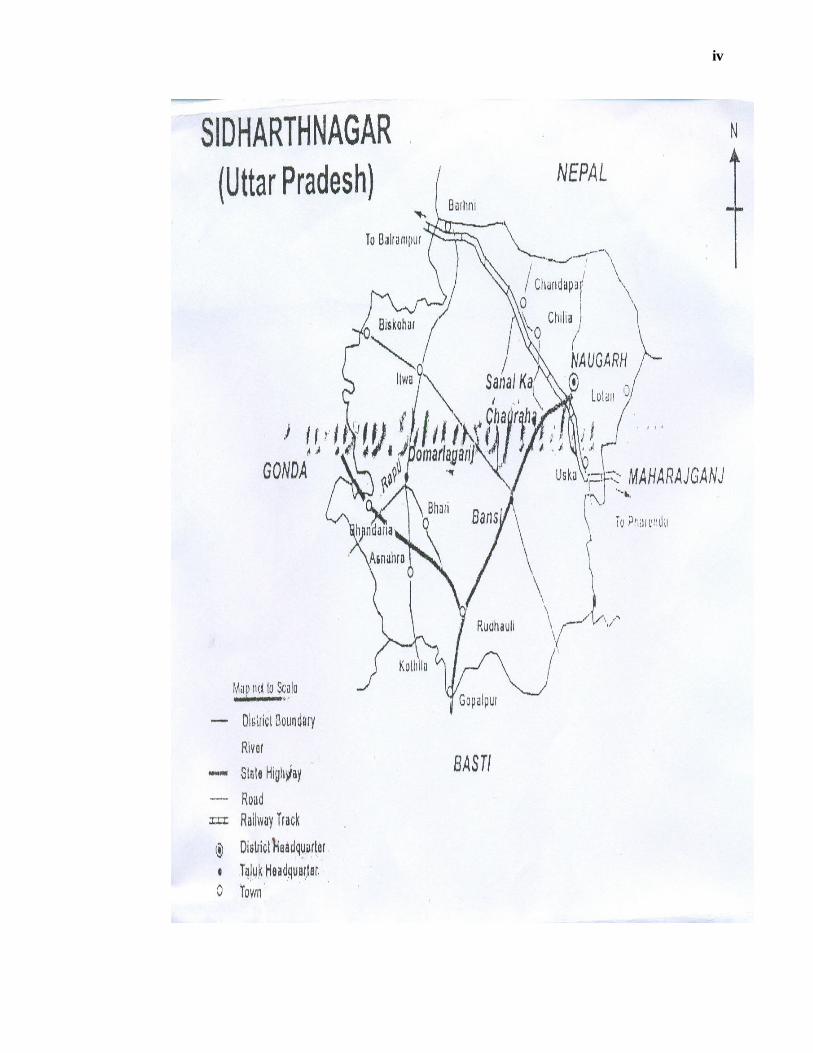
Map of Siddharth Nagar iv
Executive Summary v-ix
CHAPTER- I OUTLINE OF THE STUDY 1-3 CHAPTER- II SOCIO -ECONOMIC PROFILE OF DISTRICT 4-21 SIDDHARTH NAGAR CHAPTER-III SITUATION ANALYSIS OF THE SELECTED 22-38 VILLAGES OF SIDDHARTH NAGAR DISTRICT CHAPTER-IV ANALYSIS OF THE SOCIO -ECONOMIC CONDITIONS 39-67 OF HOUSEHOLDS ON A RELIGION WISE BASIS
Appendix I 68
ii
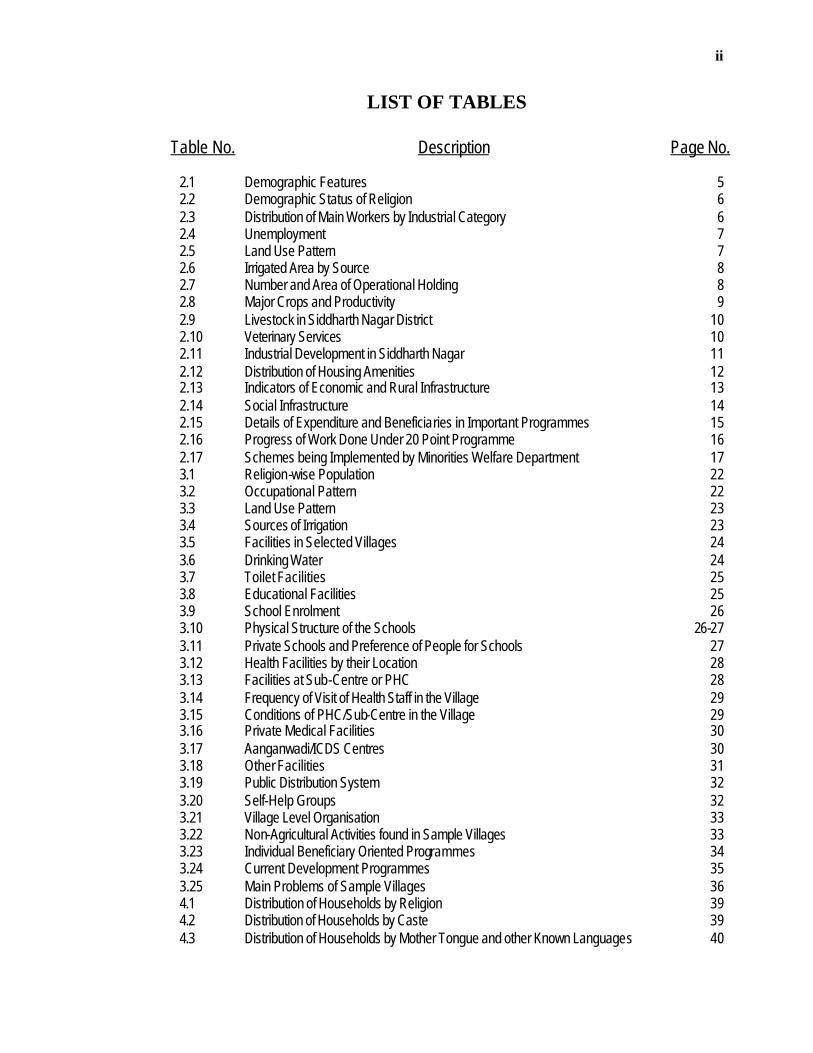
LIST OF TABLES
Table No. Description Page No.
2.1 Demographic Features 5 2.2 Demographic Status of Religion 6 2.3 Distribution of Main Workers by Industrial Category 6 2.4 Unemployment 7 2.5 Land Use Pattern 7 2.6 Irrigated Area by Source 8 2.7 Number and Area of Operational Holding 8 2.8 Major Crops and Productivity 9 2.9 Livestock in Siddharth Nagar District 10 2.10 Veterinary Services 10 2.11 Industrial Development in Siddharth Nagar 11 2.12 Distribution of Housing Amenities 12 2.13 Indicators of Economic and Rural Infrastructure 13 2.14 Social Infrastructure 14 2.15 Details of Expenditure and Beneficiaries in Important Programmes 15 2.16 Progress of Work Done Under 20 Point Programme 16 2.17 Schemes being Implemented by Minorities Welfare Department 17 3.1 Religion-wise Population 22 3.2 Occupational Pattern 22 3.3 Land Use Pattern 23 3.4 Sources of Irrigation 23 3.5 Facilities in Selected Villages 24 3.6 Drinking Water 24 3.7 Toilet Facilities 25 3.8 Educational Facilities 25 3.9 School Enrolment 26 3.10 Physical Structure of the Schools 26-27 3.11 Private Schools and Preference of People for Schools 27 3.12 Health Facilities by their Location 28 3.13 Facilities at Sub-Centre or PHC 28 3.14 Frequency of Visit of Health Staff in the Village 29 3.15 Conditions of PHC/Sub-Centre in the Village 29 3.16 Private Medical Facilities 30 3.17 Aanganwadi/ICDS Centres 30 3.18 Other Facilities 31 3.19 Public Distribution System 32 3.20 Self-Help Groups 32 3.21 Village Level Organisation 33 3.22 Non-Agricultural Activities found in Sample Villages 33 3.23 Individual Beneficiary Oriented Programmes 34 3.24 Current Development Programmes 35 3.25 Main Problems of Sample Villages 36 4.1 Distribution of Households by Religion 39 4.2 Distribution of Households by Caste 39 4.3 Distribution of Households by Mother Tongue and other Known Languages 40
iii
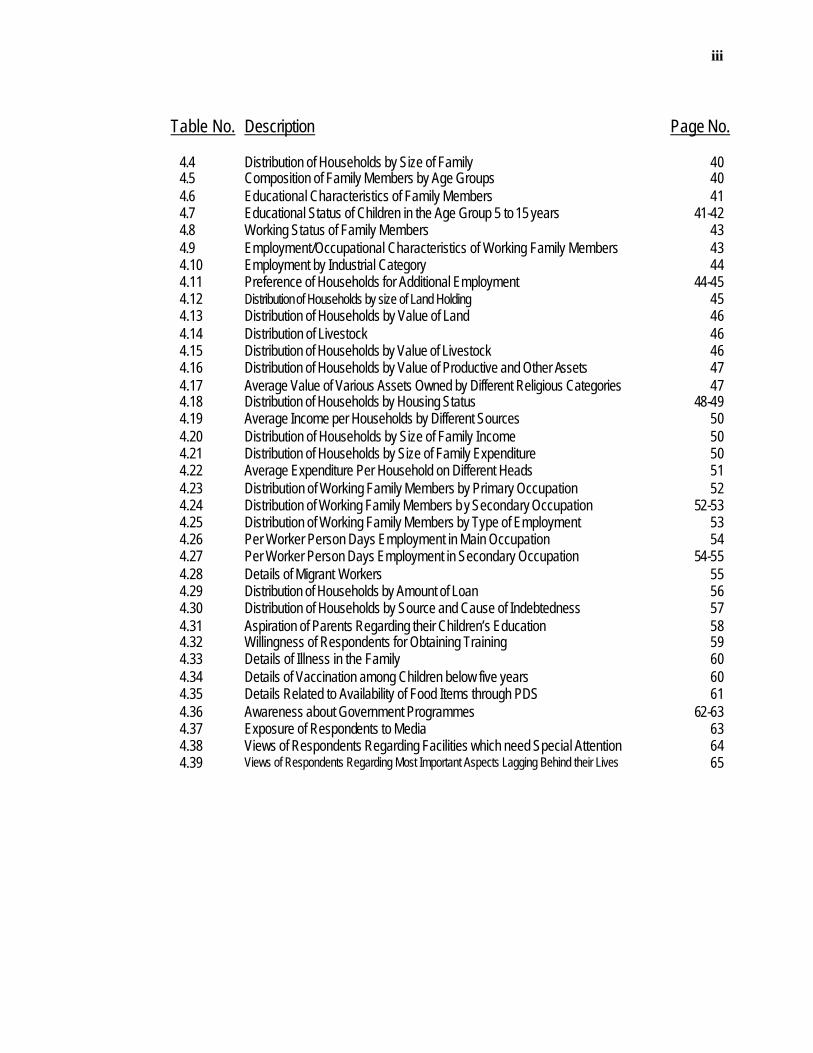
Table No. Description Page No.
4.4 Distribution of Households by Size of Family 40 4.5 Composition of Family Members by Age Groups 40 4.6 Educational Characteristics of Family Members 41 4.7 Educational Status of Children in the Age Group 5 to 15 years 41-42 4.8 Working Status of Family Members 43 4.9 Employment/Occupational Characteristics of Working Family Members 43 4.10 Employment by Industrial Category 44 4.11 Preference of Households for Additional Employment 44-45 4.12 Distribution of Households by size of Land Holding 45 4.13 Distribution of Households by Value of Land 46 4.14 Distribution of Livestock 46 4.15 Distribution of Households by Value of Livestock 46 4.16 Distribution of Households by Value of Productive and Other Assets 47 4.17 Average Value of Various Assets Owned by Different Religious Categories 47 4.18 Distribution of Households by Housing Status 48-49 4.19 Average Income per Households by Different Sources 50 4.20 Distribution of Households by Size of Family Income 50 4.21 Distribution of Households by Size of Family Expenditure 50 4.22 Average Expenditure Per Household on Different Heads 51 4.23 Distribution of Working Family Members by Primary Occupation 52 4.24 Distribution of Working Family Members b y Secondary Occupation 52-53 4.25 Distribution of Working Family Members by Type of Employment 53 4.26 Per Worker Person Days Employment in Main Occupation 54 4.27 Per Worker Person Days Employment in Secondary Occupation 54-55 4.28 Details of Migrant Workers 55 4.29 Distribution of Households by Amount of Loan 56 4.30 Distribution of Households by Source and Cause of Indebtedness 57 4.31 Aspiration of Parents Regarding their Children’s Education 58 4.32 Willingness of Respondents for Obtaining Training 59 4.33 Details of Illness in the Family 60 4.34 Details of Vaccination among Children below five years 60 4.35 Details Related to Availability of Food Items through PDS 61 4.36 Awareness about Government Programmes 62-63 4.37 Exposure of Respondents to Media 63 4.38 Views of Respondents Regarding Facilities which need Special Attention 64 4.39 Views of Respondents Regarding Most Important Aspects Lagging Behind their Lives 65
iv
v
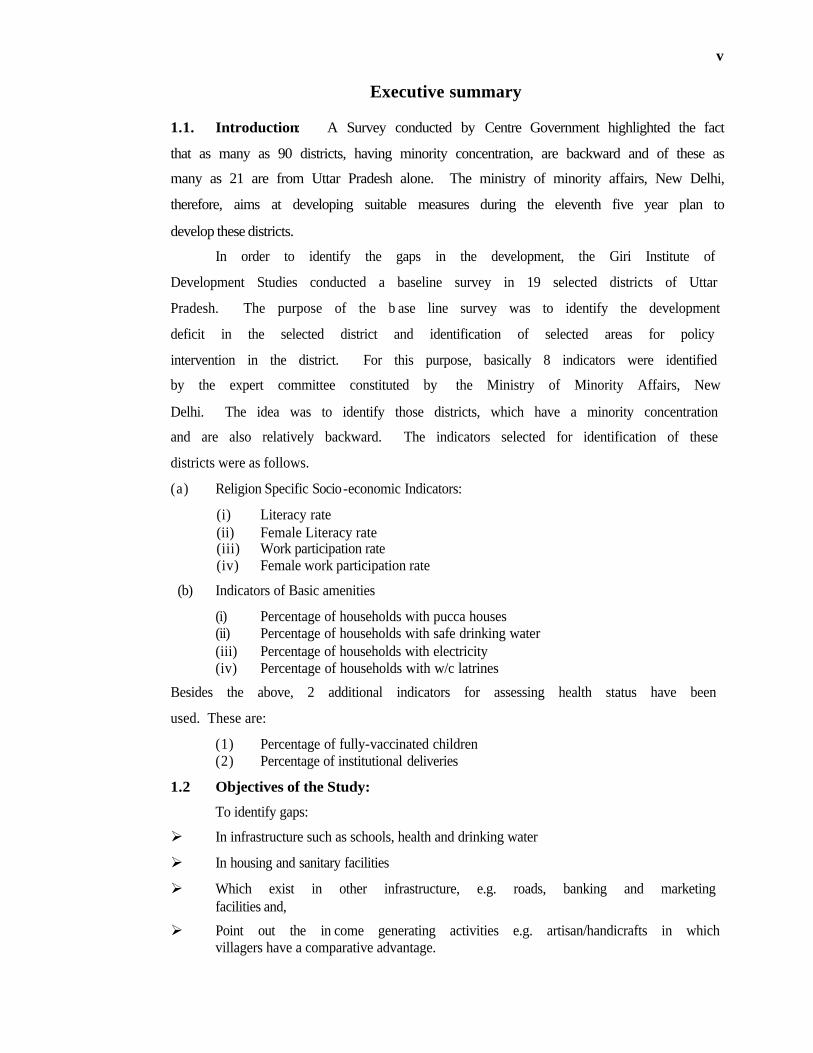
Executive summary 1.1. Introduction: A Survey conducted by Centre Government highlighted the fact
that as many as 90 districts, having minority concentration, are backward and of these as
many as 21 are from Uttar Pradesh alone. The ministry of minority affairs, New Delhi,
therefore, aims at developing suitable measures during the eleventh five year plan to
develop these districts.
In order to identify the gaps in the development, the Giri Institute of
Development Studies conducted a baseline survey in 19 selected districts of Uttar
Pradesh. The purpose of the b ase line survey was to identify the development
deficit in the selected district and identification of selected areas for policy
intervention in the district. For this purpose, basically 8 indicators were identified
by the expert committee constituted by the Ministry of Minority Affairs, New
Delhi. The idea was to identify those districts, which have a minority concentration
and are also relatively backward. The indicators selected for identification of these
districts were as follows.
(a) Religion Specific Socio-economic Indicators:
(i) Literacy rate (ii) Female Literacy rate (iii) Work participation rate (iv) Female work participation rate
(b) Indicators of Basic amenities
(i) Percentage of households with pucca houses (ii) Percentage of households with safe drinking water
(iii) Percentage of households with electricity (iv) Percentage of households with w/c latrines
Besides the above, 2 additional indicators for assessing health status have been
used. These are:
(1) Percentage of fully-vaccinated children (2) Percentage of institutional deliveries
1.2 Objectives of the Study:
To identify gaps:
Ø In infrastructure such as schools, health and drinking water
Ø In housing and sanitary facilities
Ø Which exist in other infrastructure, e.g. roads, banking and marketing facilities and,
Ø Point out the in come generating activities e.g. artisan/handicrafts in which villagers have a comparative advantage.

vi
1.3 Methodology, Sample Design and Tools:
The tehsils of each district were first classified into 3 strata by arranging
them in descending order of minori ty population in the 2001 population. Then 30
villages were selected from each district. A door to door survey conducted to do
the house listing in each village with a population upto 1200. In larger sized
villages two or three hamlets were selected. T he first was the one with highest
minority population and second or third any other hamlet of the village. Then from
each villages 30 households were selected in proportion to the religious categories
of people living in the village. Thus, a total 900 ho useholds were identified and
surveyed from each district. The study was undertaken at 3 levels.
(i) District profile using secondary information (ii) Village level using secondary information (iii) Household level using data generated from the field survey
1.4 Brief Profi le of Siddharth Nagar District:
As per census 2001 Siddharth Nagar district had a total population 20.40 lakh.
Agriculture is the main occupation of the residents of this district. Around 71.0 per cent of
main workers are engaged in agriculture as cultivators and agricultural labourers. Around
79.0 percent of reporting area comes under the plough. The main crops are Paddy, Wheat,
Arhar, Masoor and Sugarcane. The district is adversely affected with floods and water
logging during monsoon season and this damages the crops and human property.
With respect to industries, there were two registered factories but both were not
found functional. The district also has 2750 Khadi Gramodyog and 3192 small scale unit
employed 7637 and 9366 persons respectively. However, the exact number of functioning
units is not known.
Looking at infrastructure it is observed that the district is poorly connected by roads
and rail and roads are badly damaged.
As per the prescribed norms laid down for establishment of sub-centre, PHCs and
CHCs in the district, the district reflects a poor conditions and lags behind with respect to
medical facilities.
On the whole the economy of Siddharth Nagar is less developed, despite the fact it
has the potential to do much better.
vii
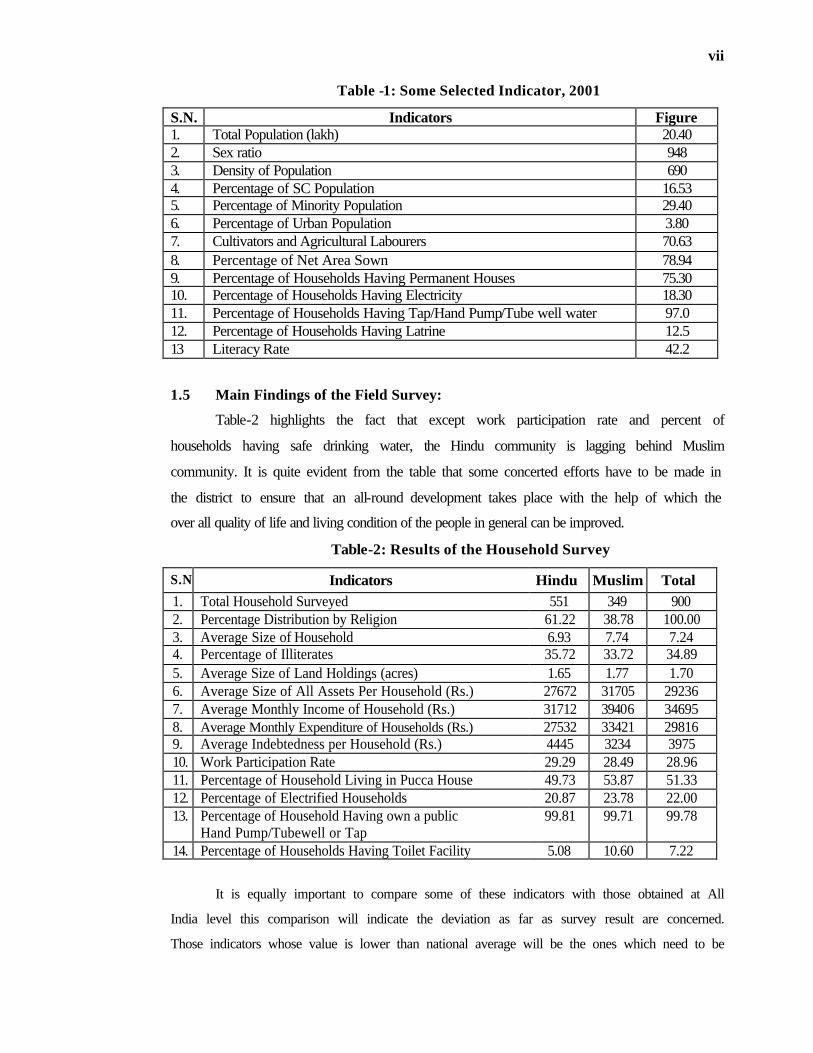
Table -1: Some Selected Indicator, 2001
S.N. Indicators Figure 1. Total Population (lakh) 20.40 2. Sex ratio 948 3. Density of Population 690 4. Percentage of SC Population 16.53 5. Percentage of Minority Population 29.40 6. Percentage of Urban Population 3.80 7. Cultivators and Agricultural Labourers 70.63 8. Percentage of Net Area Sown 78.94 9. Percentage of Households Having Permanent Houses 75.30 10. Percentage of Households Having Electricity 18.30 11. Percentage of Households Having Tap/Hand Pump/Tube well water 97.0 12. Percentage of Households Having Latrine 12.5 13 Literacy Rate 42.2
1.5 Main Findings of the Field Survey:
Table-2 highlights the fact that except work participation rate and percent of
households having safe drinking water, the Hindu community is lagging behind Muslim
community. It is quite evident from the table that some concerted efforts have to be made in
the district to ensure that an all-round development takes place with the help of which the
over all quality of life and living condition of the people in general can be improved.
Table-2: Results of the Household Survey
S.N Indicators Hindu Muslim Total 1. Total Household Surveyed 551 349 900 2. Percentage Distribution by Religion 61.22 38.78 100.00 3. Average Size of Household 6.93 7.74 7.24 4. Percentage of Illiterates 35.72 33.72 34.89 5. Average Size of Land Holdings (acres) 1.65 1.77 1.70 6. Average Size of All Assets Per Household (Rs.) 27672 31705 29236 7. Average Monthly Income of Household (Rs.) 31712 39406 34695 8. Average Monthly Expenditure of Households (Rs.) 27532 33421 29816 9. Average Indebtedness per Household (Rs.) 4445 3234 3975 10. Work Participation Rate 29.29 28.49 28.96 11. Percentage of Household Living in Pucca House 49.73 53.87 51.33 12. Percentage of Electrified Households 20.87 23.78 22.00 13. Percentage of Household Having own a public
Hand Pump/Tubewell or Tap 99.81 99.71 99.78
14. Percentage of Households Having Toilet Facility 5.08 10.60 7.22
It is equally important to compare some of these indicators with those obtained at All
India level this comparison will indicate the deviation as far as survey result are concerned.
Those indicators whose value is lower than national average will be the ones which need to be

viii
given priority because we will be making comparison between those indicators which had been
selected by the National Commission in the identification of 90 backward districts all over
India. This comparison is being presented with the help of Table 3.
Table -3: Development Deficits in Siddharth Nagar District of Uttar Pradesh
S.N. Indicators
Survey Result (2008)
All India
(2005)
Gap between All India &
District
Priority Ranking
I. Socio-economic Indicators 1. Rate of Literacy 50.9 67.3 -16.4 5 2. Rate of Female Literacy 38.7 57.1 -19.1 3 3. Work Participation Rate 28.9 38.0 -9.1 7 4. Female Work Participation Rate 12.9 21.5 -8.6 8 II. Basic Amenities Indicators 5. Percentage of Pucca Houses 51.3 59.4 -8.1 9 6. Percentage of Households with access
to safe drinking water 99.7 87.9 +11.8 10
7. Percentage of Electrified Households 22.0 39.2 -17.2 4 8. Percentage of Households with
Sanitation Facilities 17.4 67.9 -50.5 1
III. Health Indicators 9. Percentage of Full Vaccinated Children 32.7 43.5 -10.8 6 10. Percentage of Institutional Delivery 14.6 38.7 -24.1 2 Note : 1. Survey data of the district (col.1) pertains to rural area only, but all data (col.2) pertains to
total 2. Data in col.2 from sl.no.5-8 pertain to year 2005-06 from NFHS-3 and the rest of the data in
column 2 pertain to year 2004-05 from NSSO.
Keeping in mind some of the priority areas indicated in Table 3 and some major
findings of the survey highlighted in Table 2, the following aspects need to be given special
attention by planners and policy makers whenever a plan for development of the district is
attempted.
Ø The present status of households with sanitation facilities in Siddharth Nagar district
is miserably poor, when we compared it with All India figures. Therefore the
extension of sanitation facilities at the household level needs to be accorded top
most priority in the multi sectoral plan of the district.
Ø The sub-centre and PHCs need to be upgraded so that these institutions can provide
facilities to rural women in deliveries and other health services effectively. This will
reduce the dependence of rural people on Jhola Chap doctors or quacks, as is the
case presently.
Ø In our sample only around 24 per cent houses of Muslim and 21.0 per cent houses of
Hindus were electrified. The irregular supply of power is pointed out by our

ix
respondents as the main cause for their reluctance to take electric connections.
There is a need for topping up the existing rural electrification scheme.
Ø While going through the educational characteristic among the family members of
sample households it was found that among Hindus and Muslims about 36.0 per cent
and 34.0 per cent respectively were illiterate. Among Muslims as we go towards
higher classes the decline trend was seen in there educational level. The higher and
technical education situation also very poor in the district. Therefore it should be
increased at least district level. The district is in need of girl's schools and colleges
and ITIs and polytechnics for all children. In multi sectoral planning special
attention to be given to education so that literacy rate can be increased upto National
level
Ø All the villages should be properly linked through all weather roads for improving
road connectivity.
Ø The work participation rate in general and female in particular is low in the district
as compared to the national level. In this context women should be involved in
various developmental programmes being implemented by government departments.
Ø Since the landholding size is small, the cultivators can be educated to diversify there
activities where possible. Dairying, fruits like mango and banana cultivation,
mushroom cultivation, traditional crops like kala namak paddy and makhana and
singhara in water-logged areas should be promoted in the district.
Ø Commercial banks should provide loan to poorer section and the current amount of
loan provided by bank should be raised suitably.
Ø The Indira Awas Yojana needs to be extended to all BPL category because a large
section of BPL households yet to be covered under this scheme.
Ø In our entire survey around 40.0 per cent Hindu and around 43.0 per cent Muslim
households gave positive response for obtaining training. Thus the Government
should ensure that such training programmes be conducted on a regular basis. In
fact training should be compulsory before an individual is sanctioned term loan to
begin an enterprise.
Ø The problem related to PDS whether issuing of BPL cards or timely, adequate and
good quality of ration be ensured.
Ø The Minority Welfare Department is to perform its duties effectively, there should
be proper office, staff and other facilities so the head of department can implement
the minority related programmes.

CHAPTER I
OUTLINE OF THE STUDY I.1 About the Study According to the Census of India 2001, minorities constitute 19.5 per cent of the
total population of the country. Out of the total as many as 1381.9 lakhs or 14.4 per cent
alone were Muslims. The only other religious groups of some significance are Christians
(2.3 per cent) and Sikh (1.9 per cent). The others all have a share of below one per cent in
the total population. The dominance of Mohammadans becomes more prominent if we work
out their share in the total minority population which comes to almost 79 per cent. In the
case of Uttar Pradesh the overall share of the minority community is almost the same as
obtained at the National level. But the share of Muslims is much higher in the total
population (18.5 per cent). All other religious communities have a negligible share in the
total population of the State. In fact Muslims in the State account for around 95 per cent of
all the minorities taken together.
With the Minorities forming almost one-fifth of the total population it is but obvious
that they need to be adequately taken care of. The Ministry of Minority Affairs, New Delhi
has the responsibility to chalk out policies and programmes so that those who are
disadvantaged among this group are provided an opportunity for their upliftment. One of the
latest efforts in this direction has been in the form of constituting an expert Committee by
the Ministry to identify those districts which have a minority concentration and are also
relatively backward. The indicators selected for identification of these districts were as
follows:
(a) Religion-Specific Socio -Economic Indicators
(i) Literacy Rate (ii) Female Literacy Rate (iii) Work Participation Rate, and (iv) Female Work Participation Rate
(b) Indicators of Basic Amenities
(i) Percentage of Households with pucca walls (ii) Percentage of Households with safe drinking water (iii) Percentage of Households with electricity, and (iv) Percentage of Households with W/C latrines.
As many as 53 districts were found to have values below the National level average
for both sets of indicators while another 37 had values below the National average for one

2
or the other set of indicators. Thus a total of 90 districts from all over the country were
identified as being backward and having minority concentration. Of these as many as 21
(almost one-fourth) are in U.P. The Ministry aims at devising suitable policy measures
during the Eleventh Plan in order to develop these districts. The Ministry then identified
several institutions in different parts of the country to carry out a baseline survey of these
districts. The task of undertaking this study in the 21 districts of Uttar Pradesh was entrusted
to the Giri Institute of Development Studies, Lucknow.
I.2 Objectives of the Study :
The main objectives of the study are as follows:
(i) To conduct a gap analysis of availability of infrastructure such as schools, health and ICDS centers and drinking water supply;
(ii) To find out the gaps in housing and sanitary facilities;
(iii) Identification of income generating activities such as artisan/handicrafts in which villagers have a comparative advantage;
(iv) To identify the existing gaps in other infrastructural facilities such as roads, ITIs, banking and marketing facilities which will provide the missing links and act as a catalyst in the process of development of the district.
I.3 Methodology and Sample Design :
It was decided that 30 villages would be selected from each district. For village
selection the Tehsils of the district were first grouped into three strata in terms of minority
population after arranging them in descending order of minority population. The first
stratum consisted of 20 per cent of the Tehsils and the second and third stratum constituted
50 and 30 per cent Tehsils respectively. Tehsil was used for stratification because religion-
wise data is available in the 2001 census only upto the Tehsil level. The number of villages
selected from each stratum were directly proportional to the share of each stratum and were
selected as per the probability proportion to size with replacement method.
Once the villages were identified, house listing was conducted by door-to-door visit
in villages where total population was upto 1200. But in case of villages with higher
population the different hamlets were considered and two hamlets were selected. The first
hamlet was the one where concentration of minority population was highest and the other
hamlet was selected randomly.
From each village 30 households were selected by listing the households according
to their religion. Sample selected was in proportion to the population in each religious
category according to the systematic random sampling without replacement method.

3
In this way our total sample worked out to be as follows:
Total number of villages 30 Total number of households 900
I.4 Tools :
The study is taken up at three levels. One is the district profile. For this secondary
information was collected from Census records, Office of the District Statistics Officer,
Office of the CDO, Office of the Minority Welfare Officer, NABARD, etc. The second and
third level is the village and the household level. Even the village information has been
obtained from secondary sources like the Tehsil and Block Development Office. For the
household level, of course, we have used primary information obtained by conducting a
field survey of all the 30 villages selected for the study.
Three Schedules were developed for collecting District, Village and Household level
information.
The survey was initiated on 3 February 2008 and completed by 26 April 2008. The
names of villages surveyed by us in Siddharth Nagar district is as follows:
Strata Tehsil Name of the Village I
Bansi 1. Amomafi 2. Kodari khas 3. Charthari 4. Jiwa
5. Masaicha 6. Bankata
7. Karma
II
Naugarh Shohratgharh
1. Birdpur No.7 2. Bastiya 3. Madhubani 4. Rohudila 5. Jagdishpur Khurd 6. Khetawal Tiwari
7. Dum Dumwa 8. Sainua 9. Audahi 10. Jogibari 11. Chonar
12. Kapiya Khalasa
III Itwa Domariyaganj
1. Pat Khauli Mufi 2. Saurahwa Grant 3. Kathela Janubi 4. Bhadokhar Bhadokhari 5. Mudila Sonversa
6. Kalyaniya 7. Mubarakpur 8. Kurthi Deen 9. Bahariya 10. Kusmi 11. Judooniya
4
CHAPTER - II
SOCIO- ECONOMIC PROFILE OF DISTRICT SIDDHARTHNAGAR
2.1 Introduction :
The district lies between 270N and 27028’N latitude and 82045’E and 83010E
longitudes. The district is bordered on the north by Nepal on the east by Maharajganj
district, on the south by Basti and Sant Kabir Nagar districts and on the west by Balrampur
district. The district was carved out on December 29, 1988 by bifurcating Basti district. The
district was named after prince Siddharth the pre-enlightenment name of Buddha as he spent
his early years (till the age of 29 years) in Kapilvastu, which lies with in the territory of this
district. The district known for the ruins of the ancient capital of the Shakya Janapada,
Kapilvastu at Piprahwa, 22 km from the district headquarter Navgarh. According to census
2001 the area of Siddharth Nagar district was 2895 sq.km. The district falls in the Tarai belt
of the state with Rapti, Budhi Rapti, Banganga, Kuda and Ghoghi as the major rivers from
the administrative point of view the district Siddharth Nagar is divided in 5 tehsils, 14
development blocks, 1015 Gram Sabhas and 2314 inhabited villages.
2.2 Demographic Features of Siddharth Nagar District :
The district has a population of 2040085 at the census 2001 with a break up of
1047165 males and 992920 females. The sex ratio (i.e. number of females per 1000 males)
is 948 which is higher than the state average of 898. An average household consists of
about 7 persons. The population of the district grew at the rate of 26.08 per cent during
1991-2001 as against growth of 25.85 per cent of the state. The relative population growth
pressure in the district is higher as compared to the state. The density of population in the
district during 1991 was 489 persons per sq.km. but during 2001, 690 persons were living in
per sq.km. In the district Scheduled Caste population constitutes 16.53 per cent of the total
population of the district while schedule tribe population is almost negligible. the ratio of
schedule caste population decreased over the last decade but schedule tribe population
remains the same. The process of urbanization has been slow in the district only 4.8 per
cent population in the district lives in urban areas against 20.8 per cent in the state. It means
lesser the urbanization higher is the problem of unemployment and living conditions of the
poor (Table 2.1).

5
The literacy in the district is 42.02 per cent which is much lower than the state (71.9
per cent) average. Among males it is 56.66 per cent and among females 26.84 per cent. It
is the female literacy which is major cause of concern although it becomes more than
doubled in the decade but still lags behind the state average. In Siddharth Nagar district
38.06 per cent persons out of total population constitute the total work force which were
engaged in different activities in 2001. During 1991 this percentage was 36.7 per cent. The
male work participation rate has decreased from 52.40 per cent to 47.65 per cent during the
decade 1991-2001. The decline in the male worker ratio can be attributed to a rapid
increase in population growth whereas the corresponding job opportunities have not
increased proportionately. During the decade female work participation rate has increased
due to the definitional change in women workforce.
Table 2.1 : Demographic Features
Features 1991 2001 Geographical Area (Sq. Km.) No. of Tehsils No. of Blocks No. of Gram Sabha No. of Inhabited Villages Average size of the household
3495 4 14 -
2437 6.0
2895 5 14
1015 2314 6.6
Population Total Male Female Sex Ratio Density of Population Decadal Growth of Population SC Population (Percentage) ST Population (Percentage) Rural Population (Percentage) Urban Population (Percentage)
1707885 892981 814904
914 489 24.6 16.7 0.01 96.5 4.5
2040085 1047165 992920
948 690
26.08 16.53 0.01 96.2 4.8
Literacy (Percentage) Total Male Female
27.1 40.9 11.8
42.2 56.66 26.84
Work Participation Rate Persons Male Female
36.7 52.4 19.5
38.06 47.65 27.95
Source : 1. Census of India 1991 and 2001 2. Samajarthik Sameekshaya, Siddharth Nagar 2007
2.3 Demographic Status by Religion :
In Siddharth Nagar district mainly two religious categories namely Hindus and
Muslims were found in majority. Other religious categories were negligible in the total
population. According census 2001 the literacy rate of Hindu was lower in comparison to

6
other religious categories. The work participation rate of Muslim community was found
less than Hindus (See Table 2.2).
Table 2.2 : Demographic Status by Religion
Details Proportion Total Population Literacy Rate Work Participation Rate Religion Number Percentage Number Percentage Number Percentage
Hindu 1428543 70.02 574274 40.2 565703 39.6 Muslim 600336 29.4 284559 47.4 206516 34.4 Christian 1280 0.1 744 58.1 421 32.9 Sikh 1280 0.1 820 64.1 362 28.3 Buddhist 7930 0.4 5099 64.3 2799 35.3 Jain - - - - - - Others 716 0.0 465 65.0 155 21.7
Source : Census of India 2001 2.4 Employment Structure :
The economy of the district Siddharth Nagar is predominantly agriculture based.
Nearly 71.0 per cent of the population directly or indirectly depends on agriculture. It is
quite understandable in the district where rural population percentage is as high as about
96.0 per cent. Besides the 493431 main workers there were an additional 283056 marginal
workers as well. Thus the total workers estimated at 776487 out of which main workers
constituted 63.55 per cent. Table 1.3 shows that only 1.23 per cent workers in the district
were engaged in Industrial sector. It means the economy of Siddharth Nagar is less
diversified and adequate employment opportunities are not being generated in non
agriculture sector while there is over crowding in agriculture sector (Table 2.3).
Table 2.3 : Distribution of Workers (main) 2001 by Industrial Category
Category Numbers Percentage Cultivators 313001 40.46 Agricultural Labourers 101839 30.17 Workers in Household Industries 12583 1.23 Other Works 66008 8.54 Total Main Workers 493431 44.40 Source : Census of India, 2001
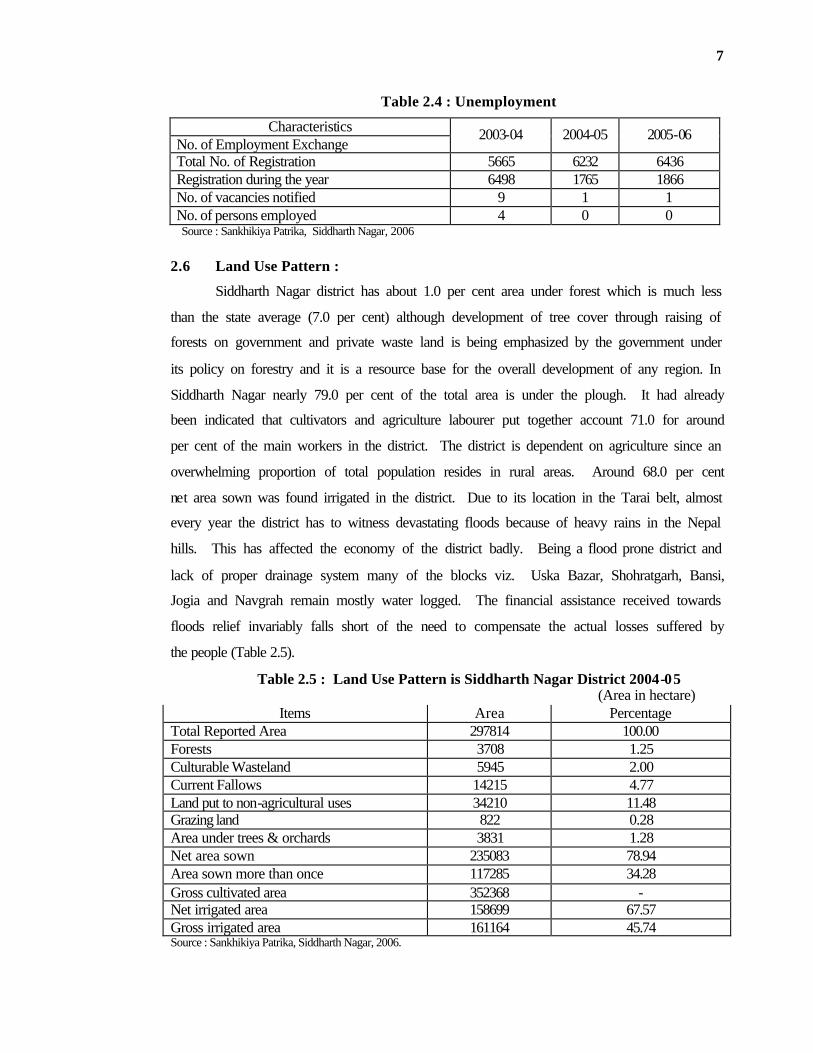
2.5 Unemployment Situation in Siddharth Nagar District :
Direct information on employments situation is not available for the district. The
provision of employment through employment exchange has been very dismal in the
district. Some idea of unemployment situation can be had from employment exchange,
details shown in Table 2.4. The Table shows that after the year 2003-04 no one had been
employed through employment exchange while one vacancy was notified in this period.
Around 2-6 thousand persons are getting themselves registered every year with employment
exchange but only 4 persons got the employment since last three years.
7
Table 2.4 : Unemployment
Characteristics No. of Employment Exchange
2003-04 2004-05 2005-06
Total No. of Registration 5665 6232 6436 Registration during the year 6498 1765 1866 No. of vacancies notified 9 1 1 No. of persons employed 4 0 0 Source : Sankhikiya Patrika, Siddharth Nagar, 2006
2.6 Land Use Pattern :
Siddharth Nagar district has about 1.0 per cent area under forest which is much less
than the state average (7.0 per cent) although development of tree cover through raising of
forests on government and private waste land is being emphasized by the government under
its policy on forestry and it is a resource base for the overall development of any region. In
Siddharth Nagar nearly 79.0 per cent of the total area is under the plough. It had already
been indicated that cultivators and agriculture labourer put together account 71.0 for around
per cent of the main workers in the district. The district is dependent on agriculture since an
overwhelming proportion of total population resides in rural areas. Around 68.0 per cent
net area sown was found irrigated in the district. Due to its location in the Tarai belt, almost
every year the district has to witness devastating floods because of heavy rains in the Nepal
hills. This has affected the economy of the district badly. Being a flood prone district and
lack of proper drainage system many of the blocks viz. Uska Bazar, Shohratgarh, Bansi,
Jogia and Navgrah remain mostly water logged. The financial assistance received towards
floods relief invariably falls short of the need to compensate the actual losses suffered by
the people (Table 2.5).
Table 2.5 : Land Use Pattern is Siddharth Nagar District 2004-05 (Area in hectare)
Items Area Percentage Total Reported Area 297814 100.00 Forests 3708 1.25 Culturable Wasteland 5945 2.00 Current Fallows 14215 4.77 Land put to non-agricultural uses 34210 11.48 Grazing land 822 0.28 Area under trees & orchards 3831 1.28 Net area sown 235083 78.94 Area sown more than once 117285 34.28 Gross cultivated area 352368 - Net irrigated area 158699 67.57 Gross irrigated area 161164 45.74 Source : Sankhikiya Patrika, Siddharth Nagar, 2006.

8
2.7 Irrigation by Source :
Table 2.6 shows different sources of irrigation in Siddharth Nagar district. If we see
irrigation on a source-wise basis the single most important source of irrigation is private
tube wells and they account for 79.46 per cent of the total irrigated area. The other sources
of some significance are canal and ponds whose contribution is around 9.0 and 8.0 per cent
respectively. Except for Navgarh and Shoratgarh blocks, where canal system exists, assured
irrigation is not existing in any of the other blocks. Further even in the existing canals,
because of poor maintenance water is unable to reach till the tail end.
Table 2.6 : Irrigated Area by Source 2004-05 (Area in hectare)
Source Area Percentage Canal 13975 8.81 Govt. Tube well 1824 1.15 Private tube well 123103 79.46 Wells 3623 2.28 Ponds 13167 8.30 Others 7 0.00 Total 158699 100.00 Source : Sankhikiya Patrika Siddharth Nagar, 2006.
2.8 Land Distribution :
The heavy pressure of population on land and its continuing fragmentation is
reflected in the small size of the average land holding (0.59 hectare) in the districts. The
other characteristics of the district is the heavy concentration of the cultivators in the lowest
land holding size (below 1.0 hectare, around 79.0 per cent cultivators are in this category).
However, between them they possess barely 24.96 per cent of the total area under land
holdings. The next lower land holding size is between 1-2 hectares and about 14.0 per cent
cultivators come in this category but they posses around 31.0 per cent of the total cultivated
land. We can understand that small size of holdings constitute a major constraint to
agriculture growth in the district (Table 2.7).
Table 2.7 : Number and Area of Operational Holding
Sl.No. Source Number Area 1. Less than 1 hectare 288569 (79.42) 53115 (24.96) 2. 1-2 hectare 47678 (14.12) 65060 (30.57) 4. 2-4 hectare 20329 (5.60) 53980 (25.37) 4. 4-10 hectare 6338 (1.74) 34578 (16.25) 5. 10 hectare and above 418 (0.12) 6069 (2.85) 6. Total 363332 (100.00) 212802 (100.00) Average Size of Holding -- (0.59)
Note : Figures in brackets shows percentage to total. Source : Sankhikiya Patrika Siddharth Nagar, 2006
9
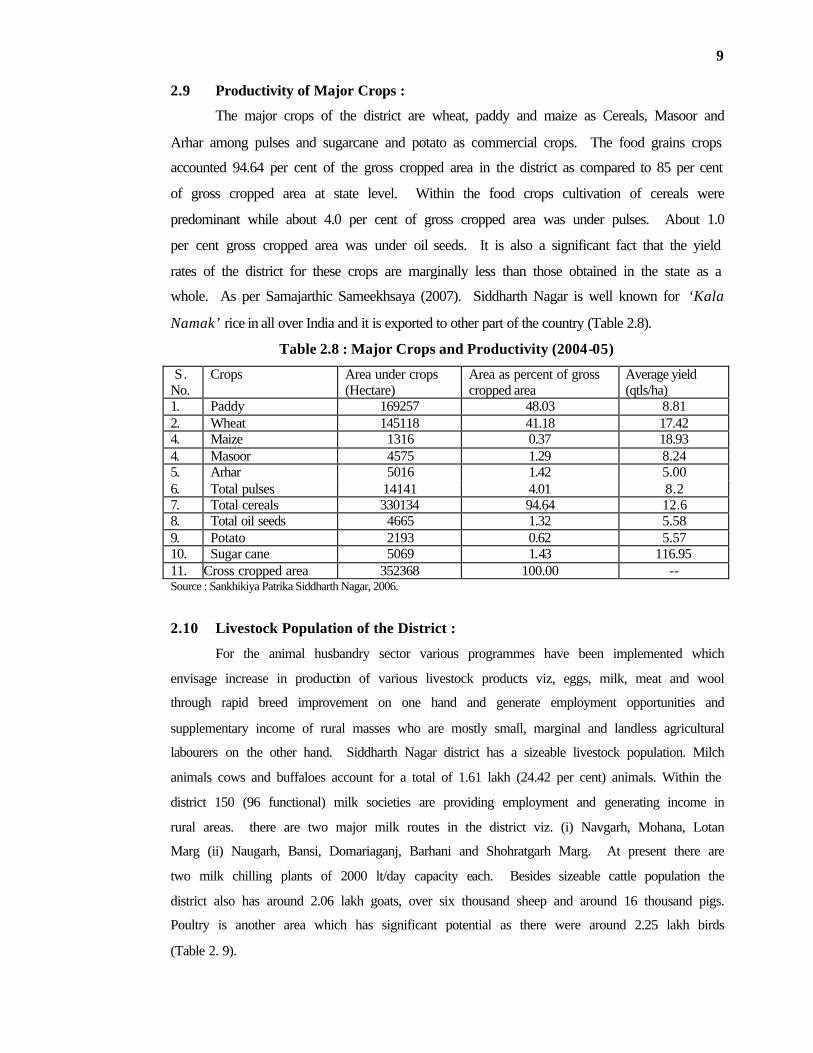
2.9 Productivity of Major Crops :
The major crops of the district are wheat, paddy and maize as Cereals, Masoor and
Arhar among pulses and sugarcane and potato as commercial crops. The food grains crops
accounted 94.64 per cent of the gross cropped area in the district as compared to 85 per cent
of gross cropped area at state level. Within the food crops cultivation of cereals were
predominant while about 4.0 per cent of gross cropped area was under pulses. About 1.0
per cent gross cropped area was under oil seeds. It is also a significant fact that the yield
rates of the district for these crops are marginally less than those obtained in the state as a
whole. As per Samajarthic Sameekhsaya (2007). Siddharth Nagar is well known for ‘Kala
Namak’ rice in all over India and it is exported to other part of the country (Table 2.8).
Table 2.8 : Major Crops and Productivity (2004-05)
S. No.
Crops Area under crops (Hectare)
Area as percent of gross cropped area
Average yield (qtls/ha)
1. Paddy 169257 48.03 8.81 2. Wheat 145118 41.18 17.42 4. Maize 1316 0.37 18.93 4. Masoor 4575 1.29 8.24 5. Arhar 5016 1.42 5.00 6. Total pulses 14141 4.01 8.2 7. Total cereals 330134 94.64 12.6 8. Total oil seeds 4665 1.32 5.58 9. Potato 2193 0.62 5.57 10. Sugar cane 5069 1.43 116.95 11. Cross cropped area 352368 100.00 -- Source : Sankhikiya Patrika Siddharth Nagar, 2006.
2.10 Livestock Population of the District :
For the animal husbandry sector various programmes have been implemented which
envisage increase in production of various livestock products viz, eggs, milk, meat and wool
through rapid breed improvement on one hand and generate employment opportunities and
supplementary income of rural masses who are mostly small, marginal and landless agricultural
labourers on the other hand. Siddharth Nagar district has a sizeable livestock population. Milch
animals cows and buffaloes account for a total of 1.61 lakh (24.42 per cent) animals. Within the
district 150 (96 functional) milk societies are providing employment and generating income in
rural areas. there are two major milk routes in the district viz. (i) Navgarh, Mohana, Lotan
Marg (ii) Naugarh, Bansi, Domariaganj, Barhani and Shohratgarh Marg. At present there are
two milk chilling plants of 2000 lt/day capacity each. Besides sizeable cattle population the
district also has around 2.06 lakh goats, over six thousand sheep and around 16 thousand pigs.
Poultry is another area which has significant potential as there were around 2.25 lakh birds
(Table 2. 9).

10
Table 2.9 : Livestock in Siddharth Nagar District
Sl.No. Type of Animal Number Percent 1. Draught Animals
Bullock Buffaloes
132490
920
19.24 0.13
2. Milch Animals Cows Buffaloes
82218 79065
11.94 11.48
4. Young Stock Cattle Buffaloes
86358 96968
12.54 11.18
4. Others Sheep Goats Horse Pigs Other Animals
6578
206863 159
16118 798
0.96 30.05 0.02 2.34 0.12
5. Total Livestock 688535 100.00 6. Poultry 225629 -- Source : Sankhikiya Patrika Siddharth Nagar, 2006.
To provide support to animal husbandry sector the district has 22 veterinary hospital,
35 livestock development centre, 23 artificial insemination centre and 3 pig development
centres respectively. Besides these services the dairy department provides seeds, barseem
and cattle feed at subsidized rate.
Table 2.10 : Veterinary Services
Items Numbers Veterinary Hospitals 22 Livestock Development Centre 35 Artificial Insemination Centre 23 Pig Development Centre 3
Source : Sankhikiya Patrika Siddharth Nagar, 2006
2.11 Industrial Development in Siddharth Nagar District:
The economy of Siddharth Nagar is predominantly agriculture based. However the non
farm sector has also assumed importance. Over the past couple of years, there is a growing
feeling that in addition to agriculture, it is important to promote the rural non farm sector such
as rural artisan, handloom/powerloom, village and cottage industries, sericulture, agro-industries
and small scale industries as an alternate strategy to develop the rural economy. There is an
urgent need to halt the trend of migration from villages to the towns and cities. Special
attention can be paid to provide effective avenues of income generation to the rural population
and make the rural economy more self sufficient and vibrant through promoting non-farm sector

11
activities. As per the available data there were 2 registered units in Siddharth Nagar district but
both were not found functional.
The Khadi Gramodyog Organisation facilitates small entrepreneurs to set up units of
various types and the figure of 2005-06 indicate that a total of 2750 units existed in the district
with a total employment of 7637 persons. Besides the Khadi Gramodyog units there are 3192
small units employing 9366 persons. In all khadi and small scale units are providing
employment to 17003 persons in the district. However, there are no records to indicate the
actual number of units which are actually working (Table 2.11).
Table 2.11 : Industrial Development in Siddharth Nagar Sl.No. Details Number
1. Registered Factories (2002-03) Units No. of Units Working
2 nil
2. Khadi and Small Scale Units No. of Khadi units (2005-06) Employment in Khadi Units No. of Small Scale Units 2005-06 Employment in Small Scale Units] Employment in Khadi and Small Scale Units
2750 7637 3192 9366 17003
Source : Sankhikiya Patrika Siddharth Nagar, 2006.
2.12 Housing Amenities in Siddharth Nagar District :
Table 2.12 shows the housing amenities in Siddharth Nagar district. The Table
shows that in the district as a whole around 75.0 per cent households reside in permanent
houses. The housing condition is better in urban area in comparison to rural areas. Poor
condition of the people of Siddharth Nagar can be seen from the fact that around 27.0 per
cent households live in one room and around 34.0 per cent in two rooms. In this connection
the situation is almost similar both in rural and urban areas.
As far as drinking water is concerned the maximum number of household (around
64.0 per cent) obtain water from hand pump. The next important source of drinking water
is tap water. Around 34.0 per cent of rural and around 49.0 per cent urban households are
availing this facility. Firewood is the main source of cooking in the district. Around 44.0
per cent rural and 51.0 per cent urban households depends on firewood for cooking. The
next source of cooking is cow dung cakes and crops residue (around 39.09 per cent and
around 15.3 per cent) in rural areas. In the urban areas situation is much different because
after firewood LPG and Kerosene are two other important source of cooking while their
contribution in rural areas is around 1.0 per cent. Around 18.0 per cent households using
electricity for lighting purposes (around 16.0 in rural & around 69.0 per cent in urban area)
in the district but in rural areas kerosene (84.0 per cent) is the main source of lighting (Table
2.12).

12
Table 2.12: Distribution of Housing Amenities Percentage Distribution of Households Amenity
Rural Urban Total Total No. of Households 300496 10994 311490 Type of House Permanent Semi permanent Serviceable Non serviceable Un classifiable
74.9 15.8 5.9 4.4 0.0
82.2 8.4 1.9 1.5 0.5
75.3 15.6 5.8 4.3 0.0
No. of Dwelling rooms One room Two rooms Three rooms Four rooms Five rooms No exclusive room
19.2 19.7 7.9 4.4 2.6 2.1
20.0 19.6 9.5 5.1 4.7 2.1
26.8 32.9 17.6 10.2 10.5 2.1
Source of Drinking Water Tap Handpump Tubewell Well River/canal Any other
32.7 64.6 --
2.9 0.0 0.3
48.8 50.7 4.5 1.3 0.0 0.6
34.1 64.6 0.3 2.8 0.0 0.5
Source of cooking Firewood Crop residue Cow dung cake Kerosene LPG Any other
42.7 15.3 38.8 0.8 1.2 0.5
50.5 8.4 4.3
14.7 20.7 0.0
44.0 15.1 37.7 1.3 1.9 0.8
Source of Lighting Electricity Kerosene Solar Energy Other Oil Any other No lighting
16.4 84.0 0.4 0.0 0.1 0.1
69.1 30.2 0.3 0.1 0.1 0.2
18.3 81.2 0.3 0.0 0.1 0.1
Source : Census of India, 2001 Uttar Pradesh distribution of housing amenities.
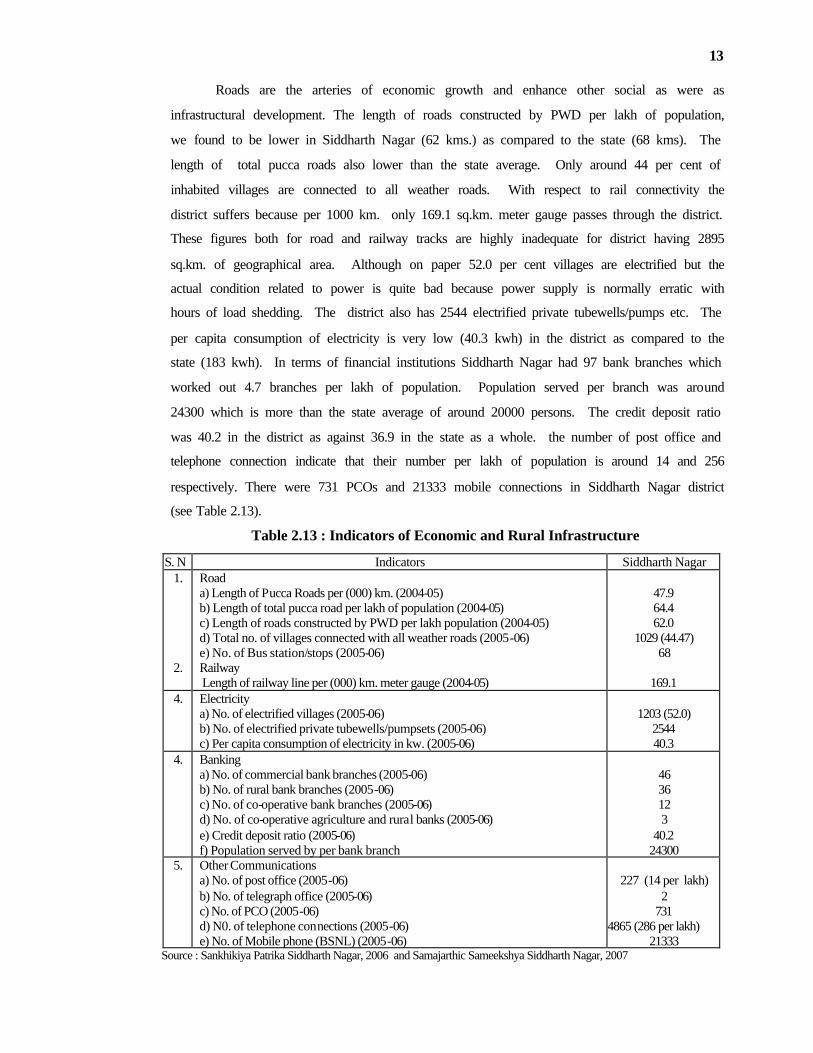
2.13 Economic and Rural Infrastructure :
Infrastructure is an index of development of a state or a district. Infrastructure
comprises all those activities and facilities which help to sustain the growth in production
and income generation in the economy. Better rural infrastructure has two effects; to
strengthen the foundation of agriculture which is the pace setter for promotion of economic
growth and better wealth and physical conditions of the rural population. Lack of sufficient
sources of funds for the massive investment needs of the rural infrastructure, poor efficiency
in delivery of quality infrastructure services and improper and poor maintenance are some
of the problems associated with the provision of effective rural infrastructure.
13
Roads are the arteries of economic growth and enhance other social as were as
infrastructural development. The length of roads constructed by PWD per lakh of population,
we found to be lower in Siddharth Nagar (62 kms.) as compared to the state (68 kms). The
length of total pucca roads also lower than the state average. Only around 44 per cent of
inhabited villages are connected to all weather roads. With respect to rail connectivity the
district suffers because per 1000 km. only 169.1 sq.km. meter gauge passes through the district.
These figures both for road and railway tracks are highly inadequate for district having 2895
sq.km. of geographical area. Although on paper 52.0 per cent villages are electrified but the
actual condition related to power is quite bad because power supply is normally erratic with
hours of load shedding. The district also has 2544 electrified private tubewells/pumps etc. The
per capita consumption of electricity is very low (40.3 kwh) in the district as compared to the
state (183 kwh). In terms of financial institutions Siddharth Nagar had 97 bank branches which
worked out 4.7 branches per lakh of population. Population served per branch was around
24300 which is more than the state average of around 20000 persons. The credit deposit ratio
was 40.2 in the district as against 36.9 in the state as a whole. the number of post office and
telephone connection indicate that their number per lakh of population is around 14 and 256
respectively. There were 731 PCOs and 21333 mobile connections in Siddharth Nagar district
(see Table 2.13).
Table 2.13 : Indicators of Economic and Rural Infrastructure
S. N Indicators Siddharth Nagar 1. Road
a) Length of Pucca Roads per (000) km. (2004-05) b) Length of total pucca road per lakh of population (2004-05) c) Length of roads constructed by PWD per lakh population (2004-05) d) Total no. of villages connected with all weather roads (2005-06) e) No. of Bus station/stops (2005-06)
47.9 64.4 62.0
1029 (44.47) 68
2. Railway Length of railway line per (000) km. meter gauge (2004-05)
169.1
4. Electricity a) No. of electrified villages (2005-06) b) No. of electrified private tubewells/pumpsets (2005-06) c) Per capita consumption of electricity in kw. (2005-06)
1203 (52.0)
2544 40.3
4. Banking a) No. of commercial bank branches (2005-06) b) No. of rural bank branches (2005-06) c) No. of co-operative bank branches (2005-06) d) No. of co-operative agriculture and rural banks (2005-06) e) Credit deposit ratio (2005-06) f) Population served by per bank branch
46 36 12 3
40.2 24300
5. Other Communications a) No. of post office (2005-06) b) No. of telegraph office (2005-06) c) No. of PCO (2005-06) d) N0. of telephone connections (2005-06) e) No. of Mobile phone (BSNL) (2005-06)
227 (14 per lakh)
2 731
4865 (286 per lakh) 21333
Source : Sankhikiya Patrika Siddharth Nagar, 2006 and Samajarthic Sameekshya Siddharth Nagar, 2007
14
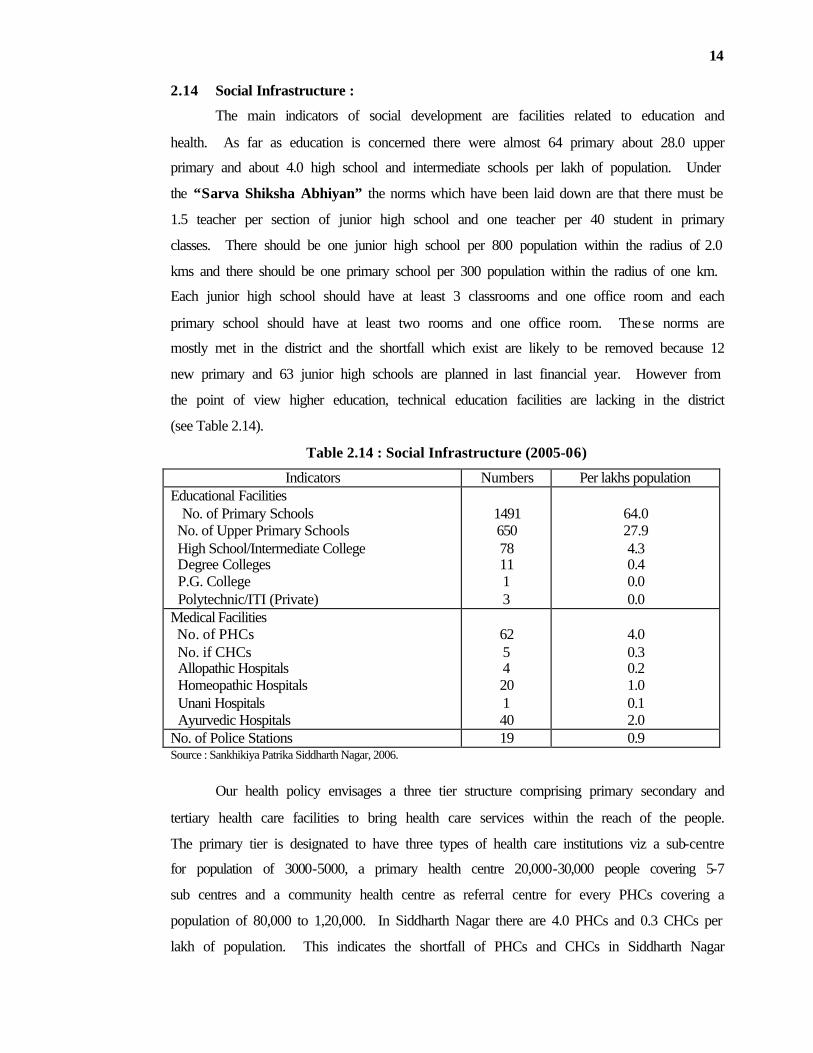
2.14 Social Infrastructure :
The main indicators of social development are facilities related to education and
health. As far as education is concerned there were almost 64 primary about 28.0 upper
primary and about 4.0 high school and intermediate schools per lakh of population. Under
the “Sarva Shiksha Abhiyan” the norms which have been laid down are that there must be
1.5 teacher per section of junior high school and one teacher per 40 student in primary
classes. There should be one junior high school per 800 population within the radius of 2.0
kms and there should be one primary school per 300 population within the radius of one km.
Each junior high school should have at least 3 classrooms and one office room and each
primary school should have at least two rooms and one office room. These norms are
mostly met in the district and the shortfall which exist are likely to be removed because 12
new primary and 63 junior high schools are planned in last financial year. However from
the point of view higher education, technical education facilities are lacking in the district
(see Table 2.14).
Table 2.14 : Social Infrastructure (2005-06)
Indicators Numbers Per lakhs population Educational Facilities No. of Primary Schools No. of Upper Primary Schools High School/Intermediate College Degree Colleges P.G. College Polytechnic/ITI (Private)
1491 650 78 11 1 3
64.0 27.9 4.3 0.4 0.0 0.0
Medical Facilities No. of PHCs No. if CHCs Allopathic Hospitals Homeopathic Hospitals Unani Hospitals Ayurvedic Hospitals
62 5 4 20 1 40
4.0 0.3 0.2 1.0 0.1 2.0
No. of Police Stations 19 0.9 Source : Sankhikiya Patrika Siddharth Nagar, 2006.
Our health policy envisages a three tier structure comprising primary secondary and
tertiary health care facilities to bring health care services within the reach of the people.
The primary tier is designated to have three types of health care institutions viz a sub-centre
for population of 3000-5000, a primary health centre 20,000-30,000 people covering 5-7
sub centres and a community health centre as referral centre for every PHCs covering a
population of 80,000 to 1,20,000. In Siddharth Nagar there are 4.0 PHCs and 0.3 CHCs per
lakh of population. This indicates the shortfall of PHCs and CHCs in Siddharth Nagar
15
district. As far as allopathic hospitals is concerned their number is barely 0.2 per lakh of
population in year 2005-06. Homeopathic hospitals and Unani hospitals are also one or less
than one per lakh of population which again reflects the poor condition of medical facilities
in the district. For social security purpose there is only 0.9 police station per lakh of
population in Siddharth Nagar district (see Table 2.14.).
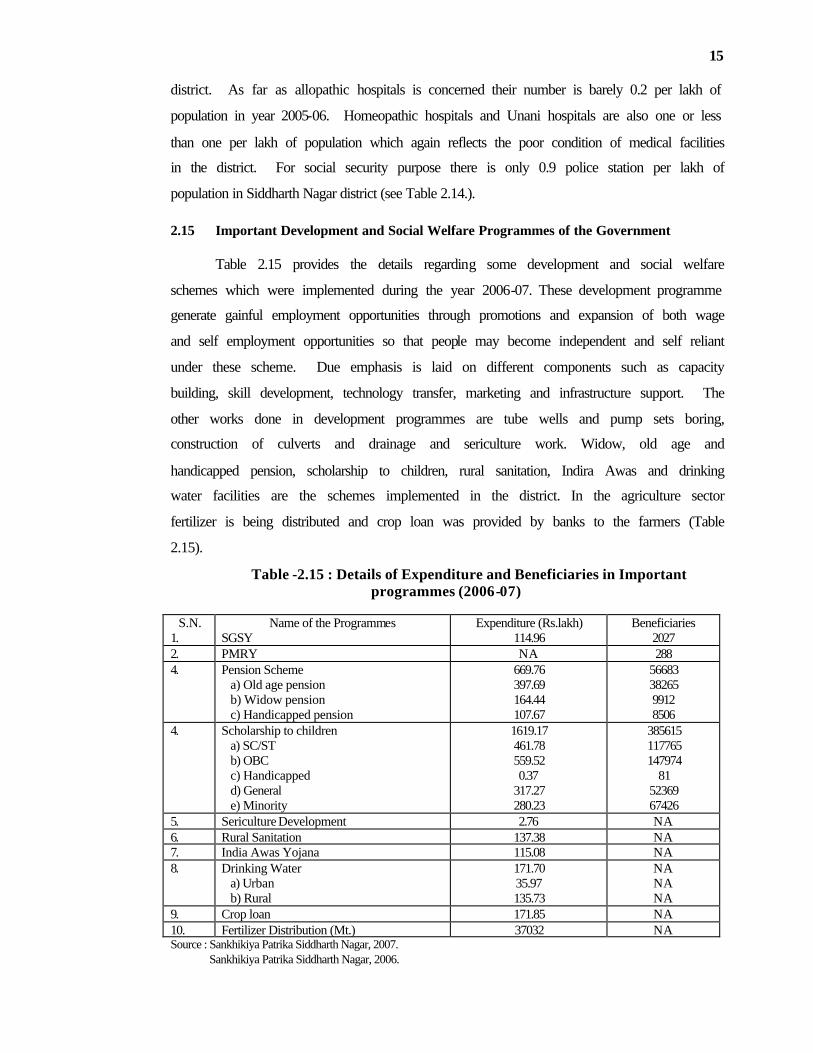
2.15 Important Development and Social Welfare Programmes of the Government
Table 2.15 provides the details regarding some development and social welfare
schemes which were implemented during the year 2006-07. These development programme
generate gainful employment opportunities through promotions and expansion of both wage
and self employment opportunities so that people may become independent and self reliant
under these scheme. Due emphasis is laid on different components such as capacity
building, skill development, technology transfer, marketing and infrastructure support. The
other works done in development programmes are tube wells and pump sets boring,
construction of culverts and drainage and sericulture work. Widow, old age and
handicapped pension, scholarship to children, rural sanitation, Indira Awas and drinking
water facilities are the schemes implemented in the district. In the agriculture sector
fertilizer is being distributed and crop loan was provided by banks to the farmers (Table
2.15).
Table -2.15 : Details of Expenditure and Beneficiaries in Important programmes (2006-07)
S.N. Name of the Programmes Expenditure (Rs.lakh) Beneficiaries 1. SGSY 114.96 2027 2. PMRY NA 288 4. Pension Scheme
a) Old age pension b) Widow pension c) Handicapped pension
669.76 397.69 164.44 107.67
56683 38265 9912 8506
4. Scholarship to children a) SC/ST b) OBC c) Handicapped d) General e) Minority
1619.17 461.78 559.52 0.37
317.27 280.23
385615 117765 147974
81 52369 67426
5. Sericulture Development 2.76 NA 6. Rural Sanitation 137.38 NA 7. India Awas Yojana 115.08 NA 8. Drinking Water
a) Urban b) Rural
171.70 35.97 135.73
NA NA NA
9. Crop loan 171.85 NA 10. Fertilizer Distribution (Mt.) 37032 NA Source : Sankhikiya Patrika Siddharth Nagar, 2007. Sankhikiya Patrika Siddharth Nagar, 2006.
16
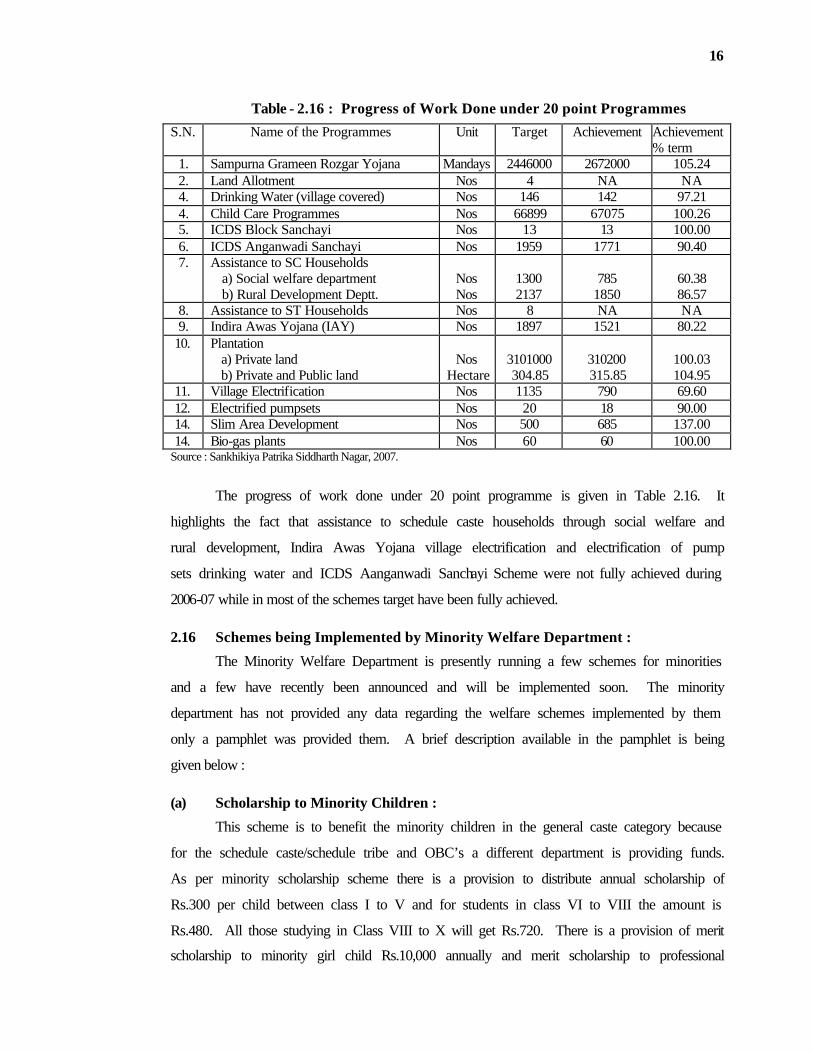
Table - 2.16 : Progress of Work Done under 20 point Programmes
S.N. Name of the Programmes Unit Target Achievement Achievement % term
1. Sampurna Grameen Rozgar Yojana Mandays 2446000 2672000 105.24 2. Land Allotment Nos 4 NA NA 4. Drinking Water (village covered) Nos 146 142 97.21 4. Child Care Programmes Nos 66899 67075 100.26 5. ICDS Block Sanchayi Nos 13 13 100.00 6. ICDS Anganwadi Sanchayi Nos 1959 1771 90.40 7. Assistance to SC Households
a) Social welfare department b) Rural Development Deptt.
Nos Nos
1300 2137
785
1850
60.38 86.57
8. Assistance to ST Households Nos 8 NA NA 9. Indira Awas Yojana (IAY) Nos 1897 1521 80.22
10. Plantation a) Private land b) Private and Public land
Nos
Hectare
3101000 304.85
310200 315.85
100.03 104.95
11. Village Electrification Nos 1135 790 69.60 12. Electrified pumpsets Nos 20 18 90.00 14. Slim Area Development Nos 500 685 137.00 14. Bio-gas plants Nos 60 60 100.00
Source : Sankhikiya Patrika Siddharth Nagar, 2007.
The progress of work done under 20 point programme is given in Table 2.16. It
highlights the fact that assistance to schedule caste households through social welfare and
rural development, Indira Awas Yojana village electrification and electrification of pump
sets drinking water and ICDS Aanganwadi Sanchayi Scheme were not fully achieved during
2006-07 while in most of the schemes target have been fully achieved.
2.16 Schemes being Implemented by Minority Welfare Department :
The Minority Welfare Department is presently running a few schemes for minorities
and a few have recently been announced and will be implemented soon. The minority
department has not provided any data regarding the welfare schemes implemented by them
only a pamphlet was provided them. A brief description available in the pamphlet is being
given below :
(a) Scholarship to Minority Children :
This scheme is to benefit the minority children in the general caste category because
for the schedule caste/schedule tribe and OBC’s a different department is providing funds.
As per minority scholarship scheme there is a provision to distribute annual scholarship of
Rs.300 per child between class I to V and for students in class VI to VIII the amount is
Rs.480. All those studying in Class VIII to X will get Rs.720. There is a provision of merit
scholarship to minority girl child Rs.10,000 annually and merit scholarship to professional

17
students studying in MBBS and Engineering classes and living in hostels. The minority
welfare department provides admission fee to the children whose parents annual income is
less than Rs. one lakh.
(b) Term Loan Scheme :
The term loan aims to facilitate individuals to take up activities of their preference
and become self employed. For some activities the maximum loan is Rs.25000 while for
others the upper limit is Rs.50,000. The repayment has to make in 5 years and the rate of
interest is 7 per cent. In Siddharth Nagar district during the financial year 2006-07, 38
beneficiaries were selected under term loan scheme. The type of activities which are
normally taken by these beneficiaries include setting up of small provisional/general
merchant shop, selling and repairing watches, tailoring, selling bangles, selling spare parts,
readymade garments and tent houses.
(c) Modernisation of Madarsa :
Under this scheme the department provides funds for the appointment of two
teachers in each Madarsa. One for teaching Hindi and English and the other for teaching
Maths and Science so that the student also learn these subjects and able to keep abreast with
those studying in Basic Shiksha Parishad or private schools. In the year 2006-07, 109
Madarsas were modernised and 17 Madarsa were recognised. In Siddharth Nagar district
15 Madarsas are also providing mini ITI training to the minority children. (see Table 2.17).
Table 2.17 : Scheme being implemented by Minority Welfare Department (2007-08)
S.N. Schemes Beneficiaries Amount 1. Scholarship Schemes
a) Class 1-5 (per child) b) Class 6-8 (per child) c) Class 8-10 (per child) d) Merit Scholarship to Minority girls (Above 10 class) e) Merit Scholarship to professional Minority student living in the hostels
NA NA NA NA NA
300.00 480.00 720.00
10,000.00 (each) 25,000.00 (each)
2. Admission fee to Minority Students NA 1.90 lakh 4. Mini ITI Training in Madarsa 15 NA 4. Modernization of Madarsa 109 217.56 (lakh) 5. Recognition of Madarsa 17 NA 6. Term Loan Scheme 38 NA
2.17 Potential, Problems and Possibilities of Development in the District :
(a) Agriculture and Allied Activities :
As earlier pointed out nearly 70 per cent of the population is directly or indirectly
dependent on agriculture. The other characteristics of the district is the heavy concentration

18
of the cultivators in lowest land holding size (below 1.0 hectare). Around 79.0 per cent
cultivators are in this category. During Monsoon season about 5 blocks namely, Uska
Bazaar, Shoharatgarh, Bansi, Jogia and Navgarh remain mostly water logged. This
adversely affects the economic condition of the people. There is immediate need to take
permanent flood control measures. Except for Navgarh and Shohratgarh blocks, where
canal system is existing, assured irrigation is not existing in any of the blocks. Further even
in existing canals because of poor maintenance, water is unable to reach till the tail end.
Therefore canal maintenance is the need of the hour. There is not much awareness about
land development related activities in the district. There exists potential for development of
watershed management under dry land farming. The water logged area can also be
effectively put to use. Cultivation of ‘Makhana and Singhara’ like crops can be thought off
in areas having water logging. Large numbers of smaller land holding are suitable for
taking up activities like vegetables and fruits cultivation. Agro economic conditions of the
district is also suitable for large scale production of mushrooms particularly seasonal
production of button mushrooms. In Bansi and Jogia blocks offer good potential for
growing Parwal. the Kala Namak rice is exported to different part of the country. There is
great potential of this rice by increasing the area under this crop. the district does not have
any facility to train farmers in various horticulture activities. There are neither proper
Mandi or fruit/vegetable processing unit in the district in the Government or private sector.
There is a need to strengthen the extension machinery in the district. Marketing is a weak
link in the district and is done directly by the farmers. The district is also climatically suited
for sericulture development. There is a need to set up a sugar mill in the district because
farmers sell their sugarcane to sugar mill in adjoining districts. Due to less capacity of these
mills farmers are using their sugar cane in making Gur or Khandsari.
(b) The Forest Wealth :
As has indicated earlier that Siddharth Nagar district has only 1.25 per cent forest
area. It is therefore desirable to take up commercial forestry seriously by growing more
Arjun, Sisam, Jamun, Eucalyptus and Babool. Teak has a potential only in those area which
are free of water logging. There is potential of Jatropha plantation under watershed
development, Bamboo cultivation under agro forestry and medicinal and aeronautic plants
under farm forestry programme.
(c) Dairy Development
Siddharth Nagar district has not been covered under the operation flood programme
of the state Government. However, it has favourable agro-climatic conditions, land
19
holdings and socio economic acceptability for the activity. The AMUL model has become
very popular in the district as a means of supportive economic activity besides agriculture.
There is a need of a milk-processing unit which would boost the dairy sector in the district.
The entrepreneurs may be motivated to take up dairy and breeding programmes on a
commercial basis. Financial institutions must show a positive attitude in supporting the
dairy projects. Marketing arrangement for sale and purchase of good breed animals, assured
regular supply of good quality of animals feed like burseem and need to increase proper
veterinary services should be ensured.
(d) Goats/Sheep/Pigs Rearing :
The agro-climatic situation in the district is conducive for goat and pig rearing.
These are being increasingly accepted as income generating activities. Further these are
mostly financed as subsidiary activities under Government sponsored programmes. All the
activities covered under this sector are mostly caste based hence offer potential in patches in
the entire district. However, this activity has not been taken up sound commercial lines
although the potential to develop it is very much present in the district. Through better
quality of sheep rearing woolen industry also can be developed.
(e) Fisheries :
The district has many reservoirs and lakes which are under the control of Fisheries
department, irrigation department and the forest department. There is a fish seed hatchery
at Bansi block with an annual seed production capacity of 40 lakh. Apart from this the
FFDA procures the fish seeds from the corporation’s seed farm located in Basti district.
Five private hatcheries are also producing seeds regularly in the district. The Fish Farmers
Development Agency (FFDA) the nodal department arranges for supply of seeds on
subsidised rates, training of fish farmers and extend subsidy to farmers who undertake the
activity. Considering the potential for fisheries and the fast pace of development in this
activity the FFDA Machinery needs to be strengthened to grieve a proper impetus to
develop pisciculture there is need to set up a cold storage for the fish. They could be taken
up by on public private participation (PPP) basis. Moreover, there is no plant producing
feed for fish and presently fish food is brought from outside the district. There is a need to
develop a Mandi for fish feed and marketing of fish. Banks should come forward to provide
credit to them on easy terms.
(f) The non-farm Sector :
Being predominantly an agricultural based economy the district has more potential
for agro based industries. Few industries having good potential in the district are furniture
20
work, washing soap, diesel engine repair, agriculture implements computer training centre,
chemical industries and plywood. Apart from this small industries like cardboard
manufacturing, massala making, cement jali, general engineering, plastics, steel boxes, ice
cream making, electric repair, ready made garments, cycle repair etc have potential in all the
blocks of the district. In order to encourage development of small scale industries the
District Industries Centre should conduct entrepreneur development and other programmes
on a regular basis for the prospective entrepreneur and create awareness among them about
the various units which can be set up in the area. The DIC can also involve banks in
training process to achieve better credit linkages. The khadi and village industry board
(KVIB) could also not promote the rural industries to the desirable extent. It is therefore
necessary that KVIB should also research the potential of khadi and village industries based
on local demand and raw material.
2.18 Infrastructure Development :
(a) Roads:
The roads connectivity of Siddharth Nagar district with other states is poor since
there is no national highway passing through it and even the state highways covered only
192 kms and around 44.0 per cent of the inhabited villages are connected with the all
weather roads. This therefore indicative of the fact that road infrastructure deserves special
attention by linking more villages by roads so that farmers can easily transport vegetables
and food grains within district and other part of the state.
(b) Rail :
Rail connectivity is also very poor since only 169 km of meter guage line pass
through the district. Development of transport net work both by road and rail becomes an
essential prerequisite for rapid development since developed transport network paves the
way for easy access to the market both for the raw material as well as finished product.
(c) Power Situation :
As has been indicated earlier around 79.0 per cent irrigation is done through private
tube wells and pump sets. Moreover, all the industries both big and small also require
power of good quality. As per Samajarthic Sameekshya 2007, during the year 2006-07 out
of the total electricity consumed in the district nearly 74.6 per cent was utilized for domestic
use and around 15.0 per cent in the agriculture sector. These two together accounted for
almost 89.0 per cent of the total electricity consumes. Therefore, the consumption in
industrial and tertiary sectors was barely around 11.0 per cent. Even the availability was
21
actually below the desired level. Like the state Siddharth Nagar is also suffering from an
acute power problem.
(d) Medical Facility :
If we go in accordance with the prescribed norms laid down for establishment of
PHC and CHC in the district, the district fares better than the state average in the matter of
PHCs. It is needed that more sub centre and CHCs should be opened according to state
government norms.
Thus the economy of Siddharth Nagar district is less diversified and adequate
employment opportunities are not being generated in non-agriculture sector, while there is
over crowding in the agriculture sector. On the other hand due to rapid growth of
population and labour force the demand for employment opportunities is increasing.
Accordingly some observations and suggestions which have been provided above will prove
useful in stepping up the economic development of the district and help in restoring parity
of Siddharth Nagar with other developed districts of the state.
22
CHAPTER - 3
SITUATION ANALYSIS OF THE SELECTED VILLAGES OF SIDDHARTH NAGAR DISTRICT
As indicated earlier our field survey was conducted in 30 villages spread over 5
Tehsils of Siddharth Nagar district. We will now try to analyze the socio-economic and
other situation of selected villages, as it existed at the time of our field survey.
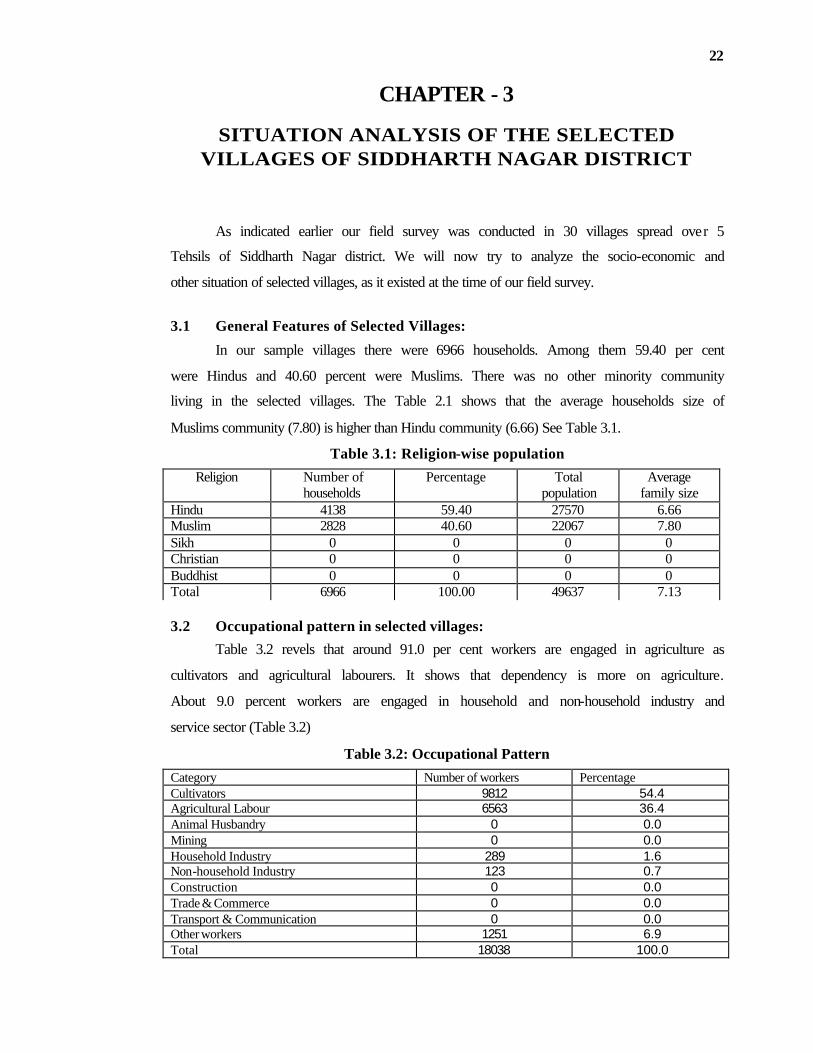
3.1 General Features of Selected Villages:
In our sample villages there were 6966 households. Among them 59.40 per cent
were Hindus and 40.60 percent were Muslims. There was no other minority community
living in the selected villages. The Table 2.1 shows that the average households size of
Muslims community (7.80) is higher than Hindu community (6.66) See Table 3.1.
Table 3.1: Religion-wise population
Religion Number of households
Percentage Total population
Average family size
Hindu 4138 59.40 27570 6.66 Muslim 2828 40.60 22067 7.80 Sikh 0 0 0 0 Christian 0 0 0 0 Buddhist 0 0 0 0 Total 6966 100.00 49637 7.13 3.2 Occupational pattern in selected villages:
Table 3.2 revels that around 91.0 per cent workers are engaged in agriculture as
cultivators and agricultural labourers. It shows that dependency is more on agriculture.
About 9.0 percent workers are engaged in household and non-household industry and
service sector (Table 3.2)
Table 3.2: Occupational Pattern
Category Number of workers Percentage Cultivators 9812 54.4 Agricultural Labour 6563 36.4 Animal Husbandry 0 0.0 Mining 0 0.0 Household Industry 289 1.6 Non-household Industry 123 0.7 Construction 0 0.0 Trade & Commerce 0 0.0 Transport & Communication 0 0.0 Other workers 1251 6.9 Total 18038 100.0
23
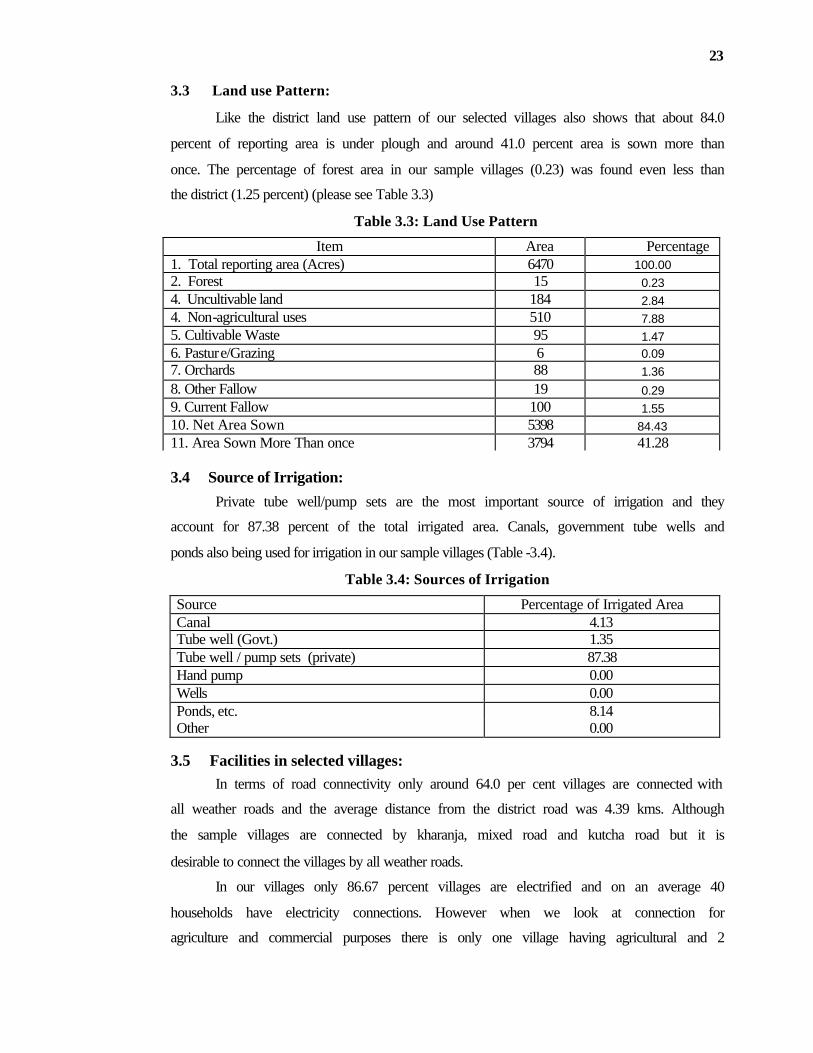
3.3 Land use Pattern:
Like the district land use pattern of our selected villages also shows that about 84.0
percent of reporting area is under plough and around 41.0 percent area is sown more than
once. The percentage of forest area in our sample villages (0.23) was found even less than
the district (1.25 percent) (please see Table 3.3)
Table 3.3: Land Use Pattern
Item Area Percentage 1. Total reporting area (Acres) 6470 100.00 2. Forest 15 0.23 4. Uncultivable land 184 2.84 4. Non-agricultural uses 510 7.88 5. Cultivable Waste 95 1.47 6. Pasture/Grazing 6 0.09 7. Orchards 88 1.36 8. Other Fallow 19 0.29 9. Current Fallow 100 1.55 10. Net Area Sown 5398 84.43 11. Area Sown More Than once 3794 41.28 3.4 Source of Irrigation:
Private tube well/pump sets are the most important source of irrigation and they
account for 87.38 percent of the total irrigated area. Canals, government tube wells and
ponds also being used for irrigation in our sample villages (Table -3.4).
Table 3.4: Sources of Irrigation
Source Percentage of Irrigated Area Canal 4.13 Tube well (Govt.) 1.35 Tube well / pump sets (private) 87.38 Hand pump 0.00 Wells 0.00 Ponds, etc. 8.14 Other 0.00
3.5 Facilities in selected villages:
In terms of road connectivity only around 64.0 per cent villages are connected with
all weather roads and the average distance from the district road was 4.39 kms. Although
the sample villages are connected by kharanja, mixed road and kutcha road but it is
desirable to connect the villages by all weather roads.
In our villages only 86.67 percent villages are electrified and on an average 40
households have electricity connections. However when we look at connection for
agriculture and commercial purposes there is only one village having agricultural and 2
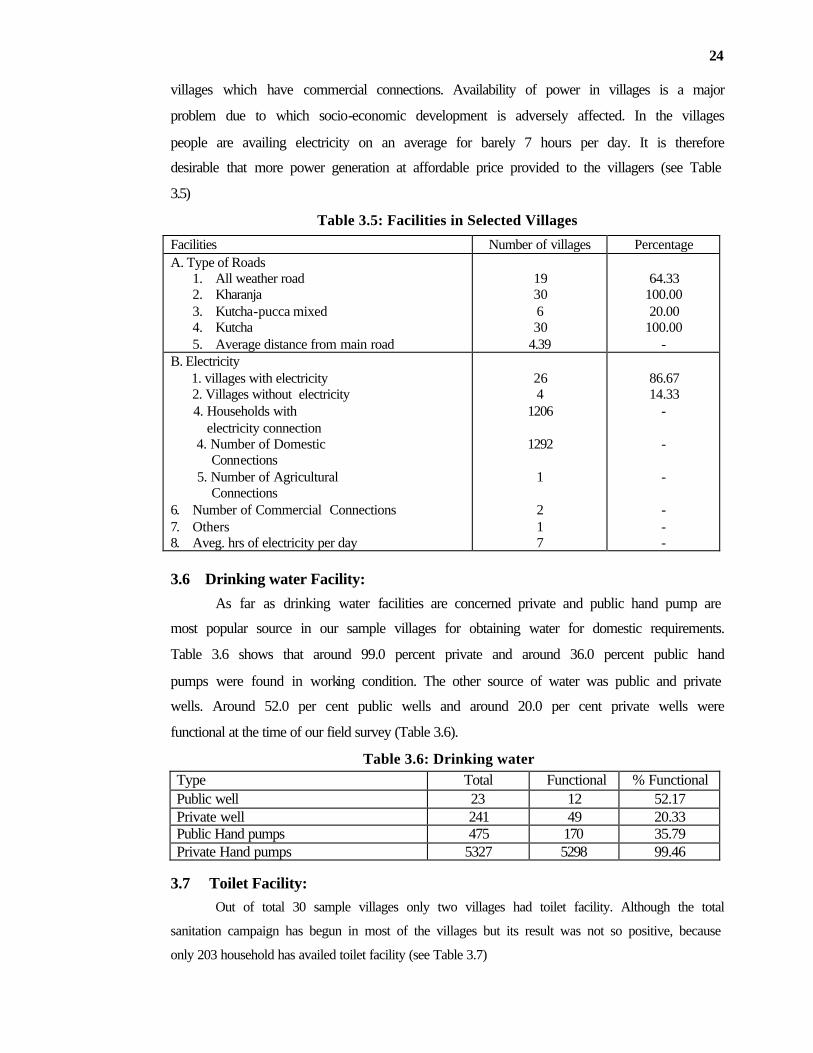
24
villages which have commercial connections. Availability of power in villages is a major
problem due to which socio-economic development is adversely affected. In the villages
people are availing electricity on an average for barely 7 hours per day. It is therefore
desirable that more power generation at affordable price provided to the villagers (see Table
3.5)
Table 3.5: Facilities in Selected Villages
Facilities Number of villages Percentage A. Type of Roads
1. All weather road 2. Kharanja 3. Kutcha-pucca mixed 4. Kutcha 5. Average distance from main road
19 30 6 30
4.39
64.33
100.00 20.00
100.00 -
B. Electricity 1. villages with electricity 2. Villages without electricity 4. Households with electricity connection 4. Number of Domestic Connections 5. Number of Agricultural Connections 6. Number of Commercial Connections 7. Others 8. Aveg. hrs of electricity per day
26 4
1206
1292
1
2 1 7
86.67 14.33
- - - - - -
3.6 Drinking water Facility:
As far as drinking water facilities are concerned private and public hand pump are
most popular source in our sample villages for obtaining water for domestic requirements.
Table 3.6 shows that around 99.0 percent private and around 36.0 percent public hand
pumps were found in working condition. The other source of water was public and private
wells. Around 52.0 per cent public wells and around 20.0 per cent private wells were
functional at the time of our field survey (Table 3.6).
Table 3.6: Drinking water
Type Total Functional % Functional Public well 23 12 52.17 Private well 241 49 20.33 Public Hand pumps 475 170 35.79 Private Hand pumps 5327 5298 99.46
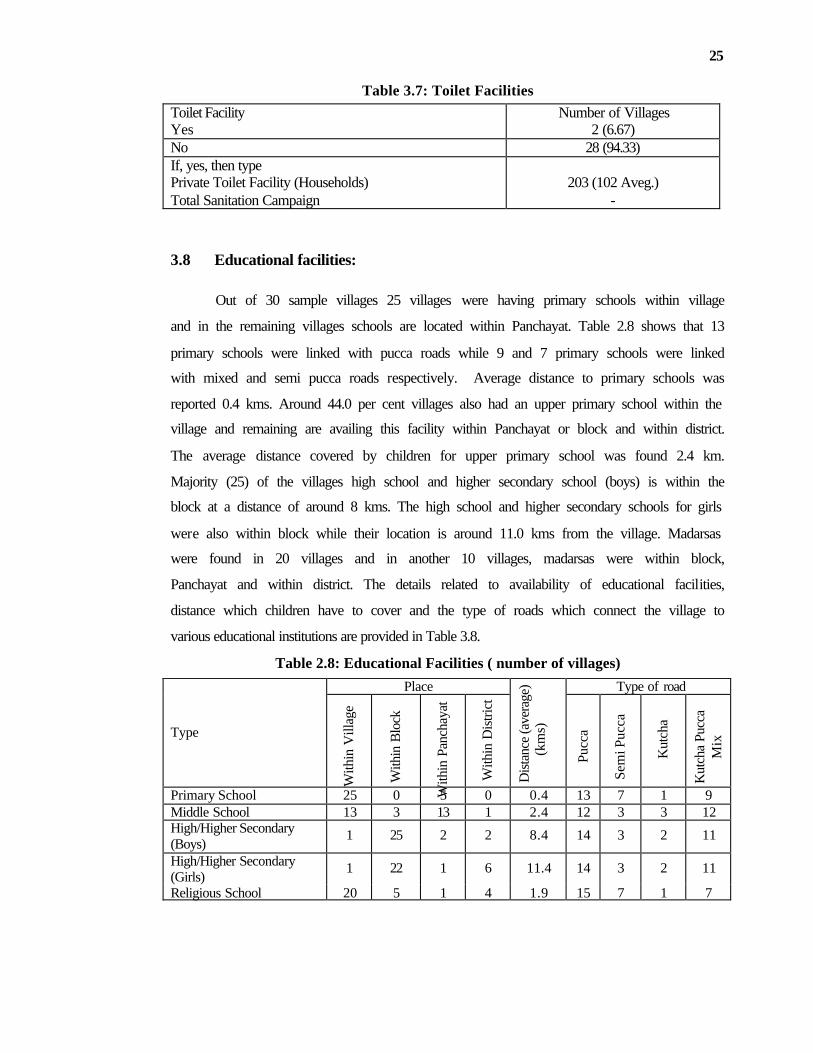
3.7 Toilet Facility:
Out of total 30 sample villages only two villages had toilet facility. Although the total
sanitation campaign has begun in most of the villages but its result was not so positive, because
only 203 household has availed toilet facility (see Table 3.7)
25
Table 3.7: Toilet Facilities
Toilet Facility Yes
Number of Villages 2 (6.67)
No 28 (94.33) If, yes, then type Private Toilet Facility (Households) Total Sanitation Campaign
203 (102 Aveg.)
-
3.8 Educational facilities:
Out of 30 sample villages 25 villages were having primary schools within village
and in the remaining villages schools are located within Panchayat. Table 2.8 shows that 13
primary schools were linked with pucca roads while 9 and 7 primary schools were linked
with mixed and semi pucca roads respectively. Average distance to primary schools was
reported 0.4 kms. Around 44.0 per cent villages also had an upper primary school within the
village and remaining are availing this facility within Panchayat or block and within district.
The average distance covered by children for upper primary school was found 2.4 km.
Majority (25) of the villages high school and higher secondary school (boys) is within the
block at a distance of around 8 kms. The high school and higher secondary schools for girls
were also within block while their location is around 11.0 kms from the village. Madarsas
were found in 20 villages and in another 10 villages, madarsas were within block,
Panchayat and within district. The details related to availability of educational facilities,
distance which children have to cover and the type of roads which connect the village to
various educational institutions are provided in Table 3.8.
Table 2.8: Educational Facilities ( number of villages)
Place Type of road
Type
With
in V
illag
e
With
in B
lock
With
in P
anch
ayat
With
in D
istri
ct
Dist
ance
(ave
rage
) (k
ms)
Pucc
a
Sem
i Puc
ca
Kut
cha
Kut
cha
Pucc
a M
ix
Primary School 25 0 5 0 0.4 13 7 1 9 Middle School 13 3 13 1 2.4 12 3 3 12 High/Higher Secondary (Boys)
1 25 2 2 8.4 14 3 2 11
High/Higher Secondary (Girls)
1 22 1 6 11.4 14 3 2 11
Religious School 20 5 1 4 1.9 15 7 1 7

26
3.9 Class-wise Average Enrolment:
The average enrolment of children on a sex wise basis and in different classes up to
the primary level are provided in Table 3.9. On an average there are 22 boys and 21 girls
per class in primary school.
Table 3.9: School Enrolment: (calculate average no.)
Class Boys Girls Class I 30 28 Class II 28 26 Class III 22 21 Class IV 17 17 Class V 15 14
3.10 Physical structure of schools:
If we look at the condition of school building and facilities available in them, it was
found that around 87.0 school had own building among them around 62.0 per cent school
had pucca building and 38.0 per cent had semi pucca school building. Out of 30 villages
four primary schools did not have a building. These schools are running in open space and
buildings are under construction. The floor of class rooms and the verandah having own
school building were cemented. Only 15.38 per cent of the school buildings were in a really
good condition. The condition of school building in one village was found very poor and in
7 villages school building condition was poor. Although 36.67 per cent classes are being
held in the class rooms but 20.0 per cent and 44.33 per cent classes are being held in
verandah and open space respectively just outside the school building. Around 77.0 per cent
school had useable blackboards and around 64.0 per cent had a playground. All schools are
providing tat-patti to the children. Including Shiksha Mitra there were 2.36 teachers per
school in our sample villages (Table 3.10).
Table 3.10: Physical Structure of the Schools
Details Number Percentage Schools with buildings Yes No Total
26 4 30
86.67 14.33
100.00 Type of Structure
1. Kutcha/thatch 2. Tile/tile 3. Semi pucca 4. Pucca
0 0 10 16
- -
38.46 61.54
Main Flooring Materials 1. Mud 2. Brick 3. Cement, stone, tile 4. others
0 0 26 0
- -
100.00 -

27
Condition of Building
1. Good 2. Satisfactory 3. Poor 4. Very bad
4 14 7 1
15.38 54.85 26.92 4.85
Where classes normally held 1. in the class room 2. In the Verandah 3. Open space
11 6 13
36.67 20.00 44.33
Does the school have useable blackboard Yes No
23 7
76.67 24.33
Does the school have playground Yes No
19 11
64.33 36.67
Seating facility provided to students 1. Tat-patti 2. Desk
30 0
100.00
- How may teachers are currently teaching classes (1-5) 2.36
3.11 Private schools and Preference of People for schools:
There were 31 private schools in our sample villages, some of which were upto 8th
class where 2443 students were enrolled. As per discussion with Pradhan, Panchayat members,
and head master of primary school run by Zilla Parishad, it was pointed out that only 50.0 per
cent parents were in favour of sending their children to the government school while around
17.0 per cent were in favor of their children being enrolled in a private school. About 33.00 per
cent parents did not have a firm opinion in this connection (Table 3.11).
Table 3.11: Private Schools and Preference of People for Schools (No.& calculate %)
Number of schools within the village 31 104.33 Up to the class level 8 - No. of students enrolled 2443 - Preference of the schools
1. Government 2. Private 3. Both
15 5 10
50.00 16.67 34.33
3.12 Health Services:
In order to avail health services people of almost all selected villages have to go to the
block head quarter. In fact even a sub-centre was found only in 8 villages and 3 were in same
Panchayat out of the 30 villages surveyed by us. Average distance of sub-centre around 4 km.
About 57.0 per cent villages have a pucca or semi pucca roads for reaching sub-centre. Around
80.0 per cent PHCs are located in block head quarter and people have to travel about 7 kms for
treatment in PHCs. Most of the CHCs are also located in block head quarters and people have to
travel approximately 12 kms for the treatment in CHCs. Other health facilities like Ayurvedic
hospitals, private doctors, family planning clinic and child care centre are mostly located in
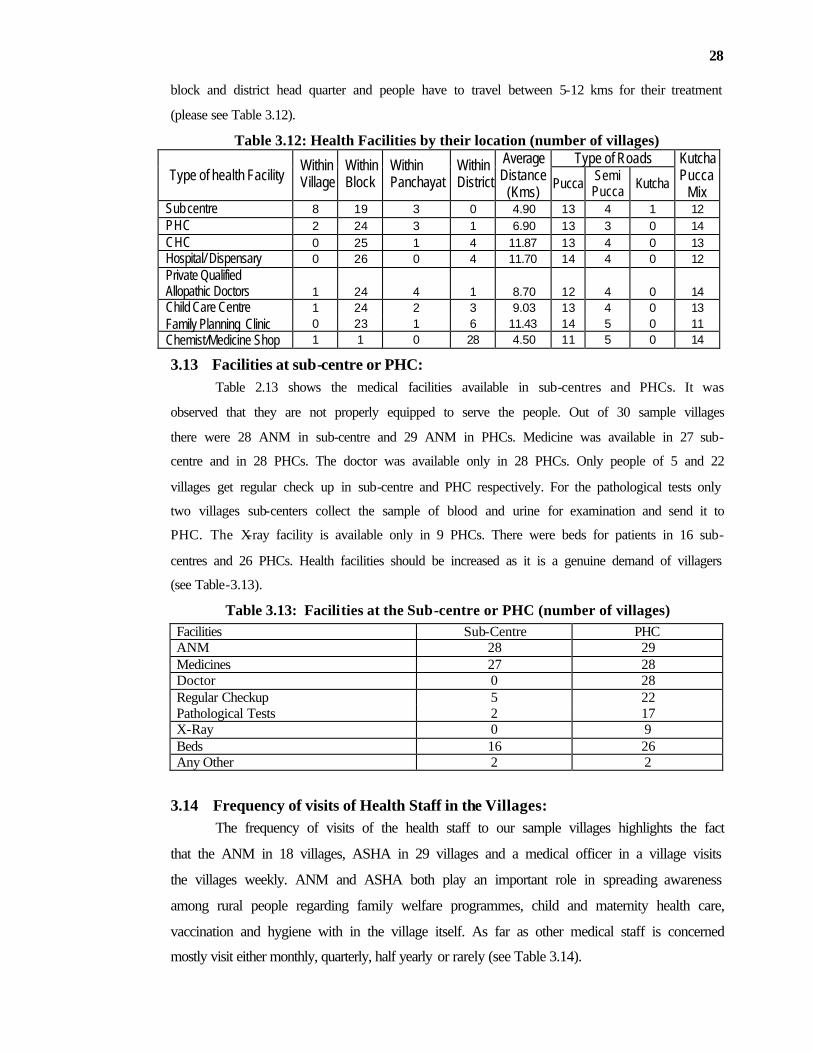
28
block and district head quarter and people have to travel between 5-12 kms for their treatment
(please see Table 3.12).
Table 3.12: Health Facilities by their location (number of villages) Type of Roads
Type of health Facility Within Village
Within Block
Within Panchayat
Within District
Average Distance
(Kms) Pucca Semi Pucca Kutcha
Kutcha Pucca
Mix Sub centre 8 19 3 0 4.90 13 4 1 12 PHC 2 24 3 1 6.90 13 3 0 14 CHC 0 25 1 4 11.87 13 4 0 13 Hospital/ Dispensary 0 26 0 4 11.70 14 4 0 12 Private Qualified Allopathic Doctors 1 24 4 1 8.70 12 4 0 14 Child Care Centre 1 24 2 3 9.03 13 4 0 13 Family Planning Clinic 0 23 1 6 11.43 14 5 0 11 Chemist/Medicine Shop 1 1 0 28 4.50 11 5 0 14
3.13 Facilities at sub-centre or PHC:
Table 2.13 shows the medical facilities available in sub-centres and PHCs. It was
observed that they are not properly equipped to serve the people. Out of 30 sample villages
there were 28 ANM in sub-centre and 29 ANM in PHCs. Medicine was available in 27 sub-
centre and in 28 PHCs. The doctor was available only in 28 PHCs. Only people of 5 and 22
villages get regular check up in sub-centre and PHC respectively. For the pathological tests only
two villages sub-centers collect the sample of blood and urine for examination and send it to
PHC. The X-ray facility is available only in 9 PHCs. There were beds for patients in 16 sub-
centres and 26 PHCs. Health facilities should be increased as it is a genuine demand of villagers
(see Table-3.13).
Table 3.13: Facilities at the Sub-centre or PHC (number of villages)
Facilities Sub-Centre PHC ANM 28 29 Medicines 27 28 Doctor 0 28 Regular Checkup 5 22 Pathological Tests 2 17 X-Ray 0 9 Beds 16 26 Any Other 2 2
3.14 Frequency of visits of Health Staff in the Villages:
The frequency of visits of the health staff to our sample villages highlights the fact
that the ANM in 18 villages, ASHA in 29 villages and a medical officer in a village visits
the villages weekly. ANM and ASHA both play an important role in spreading awareness
among rural people regarding family welfare programmes, child and maternity health care,
vaccination and hygiene with in the village itself. As far as other medical staff is concerned
mostly visit either monthly, quarterly, half yearly or rarely (see Table 3.14).
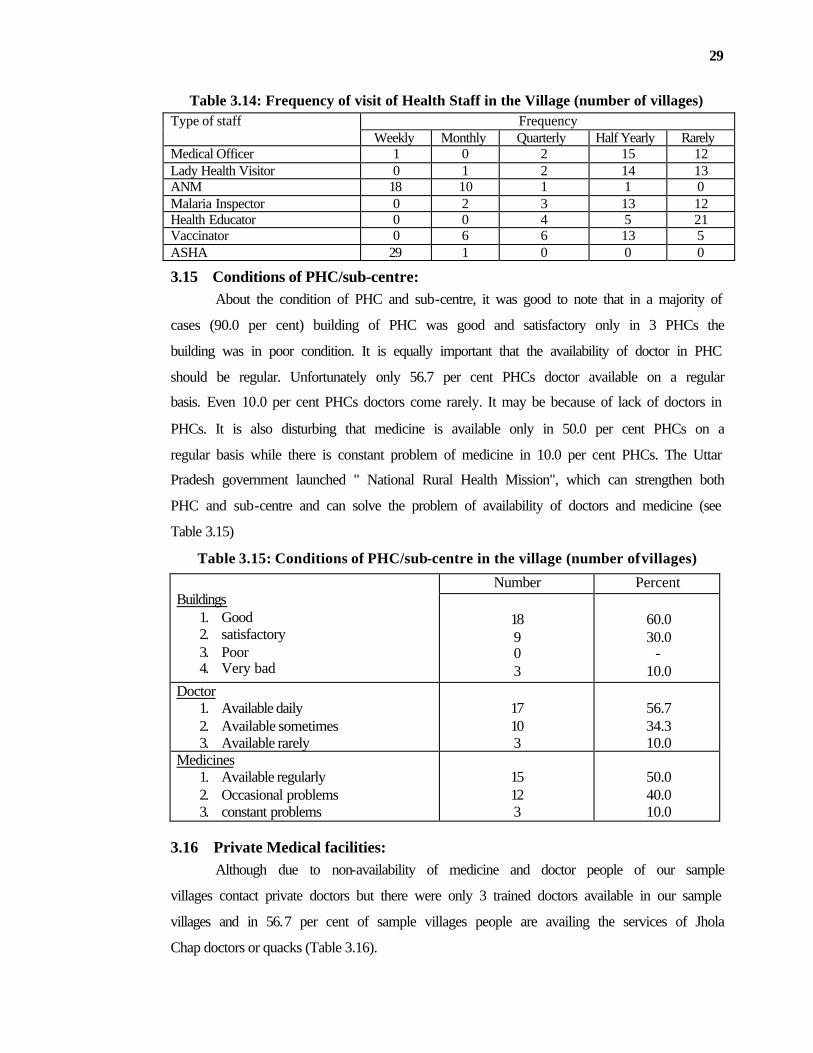
29
Table 3.14: Frequency of visit of Health Staff in the Village (number of villages)
Frequency Type of staff Weekly Monthly Quarterly Half Yearly Rarely
Medical Officer 1 0 2 15 12 Lady Health Visitor 0 1 2 14 13 ANM 18 10 1 1 0 Malaria Inspector 0 2 3 13 12 Health Educator 0 0 4 5 21 Vaccinator 0 6 6 13 5 ASHA 29 1 0 0 0
3.15 Conditions of PHC/sub-centre:
About the condition of PHC and sub-centre, it was good to note that in a majority of
cases (90.0 per cent) building of PHC was good and satisfactory only in 3 PHCs the
building was in poor condition. It is equally important that the availability of doctor in PHC
should be regular. Unfortunately only 56.7 per cent PHCs doctor available on a regular
basis. Even 10.0 per cent PHCs doctors come rarely. It may be because of lack of doctors in
PHCs. It is also disturbing that medicine is available only in 50.0 per cent PHCs on a
regular basis while there is constant problem of medicine in 10.0 per cent PHCs. The Uttar
Pradesh government launched " National Rural Health Mission", which can strengthen both
PHC and sub-centre and can solve the problem of availability of doctors and medicine (see
Table 3.15)
Table 3.15: Conditions of PHC/sub-centre in the village (number of villages)
Number Percent Buildings
1. Good 2. satisfactory 3. Poor 4. Very bad
18 9 0 3
60.0 30.0
- 10.0
Doctor 1. Available daily 2. Available sometimes 3. Available rarely
17 10 3
56.7 34.3 10.0
Medicines 1. Available regularly 2. Occasional problems 3. constant problems
15 12 3
50.0 40.0 10.0
3.16 Private Medical facilities:
Although due to non-availability of medicine and doctor people of our sample
villages contact private doctors but there were only 3 trained doctors available in our sample
villages and in 56.7 per cent of sample villages people are availing the services of Jhola
Chap doctors or quacks (Table 3.16).

30
Table 3.16: Private Medical Facilities (number of villages) Items Number of villages Availability of doctor Yes No
20 10
Type of doctor Allopathic Homeopathic Unani Ayurvedic Jhola type
2 0 0 1 17
3.17 Situation of Aanganwadi/CDS centre:
Aanganwadi centres are functioning in our all sample villages. Of these 22 are in
government building/primary school building, one in village Pradhan house, 5 in
Aanganwadi workers house and one in the house of a villager. The condition of about 74.0
per cent buildings of Aanganwadi centre were found good and satisfactory and remaining
were in poor condition. On an average around 27 mothers and 101 children benefited in the
month prior to our visit to the centre. In our sample villages around 4.0 per cent reported
that ICDS supervisors visit the centre weekly and around 78.0 per cent reported monthly
and around 18.0 per cent quarterly. In general there was satisfaction about the working of
Aanganwadi centres (Table 3.17)
Table 3.17: Aanganwadi/ICDS Centre Details Number
Place of House where located 1. Govt. Building 2. Private Building
22 8
If Pvt. Building then whose house located 1. Mukhiya House 2. Sarpanch house 3. other PRI representative 4. Aanganwadi workers 5. others
1 0 0 5 2
Condition of Buildings 1. Good 2. Satisfactory 3. Poor 4. Bad
8 14 8 0
Number of Mothers and Children visited/benefited during the last one month
1. Mother 2. Children
816 (27) 3049 (101)
Does the ICDS supervisor visit the centre 1. yes 2. No
If yes the: 1. Weekly 2. Monthly 3. Quarterly
28 2
1 22 5
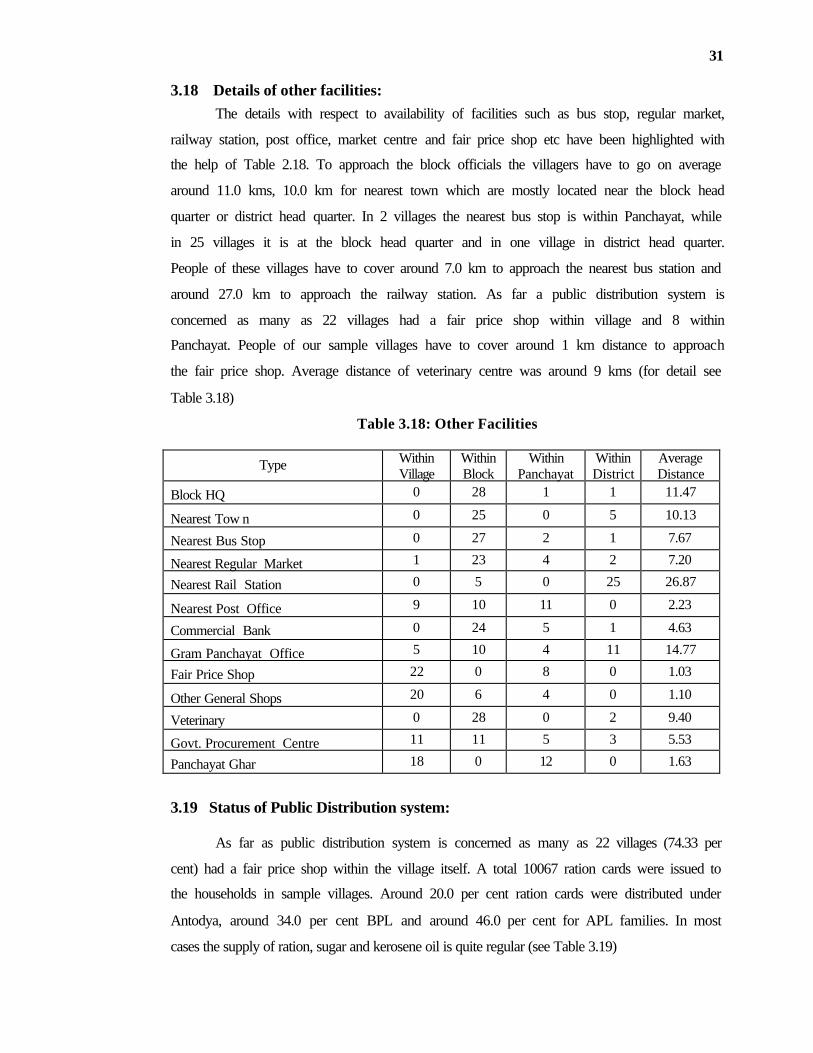
31
3.18 Details of other facilities:
The details with respect to availability of facilities such as bus stop, regular market,
railway station, post office, market centre and fair price shop etc have been highlighted with
the help of Table 2.18. To approach the block officials the villagers have to go on average
around 11.0 kms, 10.0 km for nearest town which are mostly located near the block head
quarter or district head quarter. In 2 villages the nearest bus stop is within Panchayat, while
in 25 villages it is at the block head quarter and in one village in district head quarter.
People of these villages have to cover around 7.0 km to approach the nearest bus station and
around 27.0 km to approach the railway station. As far a public distribution system is
concerned as many as 22 villages had a fair price shop within village and 8 within
Panchayat. People of our sample villages have to cover around 1 km distance to approach
the fair price shop. Average distance of veterinary centre was around 9 kms (for detail see
Table 3.18)
Table 3.18: Other Facilities
Type Within Village
Within Block
Within Panchayat
Within District
Average Distance
Block HQ 0 28 1 1 11.47
Nearest Tow n 0 25 0 5 10.13
Nearest Bus Stop 0 27 2 1 7.67
Nearest Regular Market 1 23 4 2 7.20
Nearest Rail Station 0 5 0 25 26.87
Nearest Post Office 9 10 11 0 2.23
Commercial Bank 0 24 5 1 4.63
Gram Panchayat Office 5 10 4 11 14.77
Fair Price Shop 22 0 8 0 1.03
Other General Shops 20 6 4 0 1.10
Veterinary 0 28 0 2 9.40
Govt. Procurement Centre 11 11 5 3 5.53
Panchayat Ghar 18 0 12 0 1.63
3.19 Status of Public Distribution system: As far as public distribution system is concerned as many as 22 villages (74.33 per
cent) had a fair price shop within the village itself. A total 10067 ration cards were issued to
the households in sample villages. Around 20.0 per cent ration cards were distributed under
Antodya, around 34.0 per cent BPL and around 46.0 per cent for APL families. In most
cases the supply of ration, sugar and kerosene oil is quite regular (see Table 3.19)
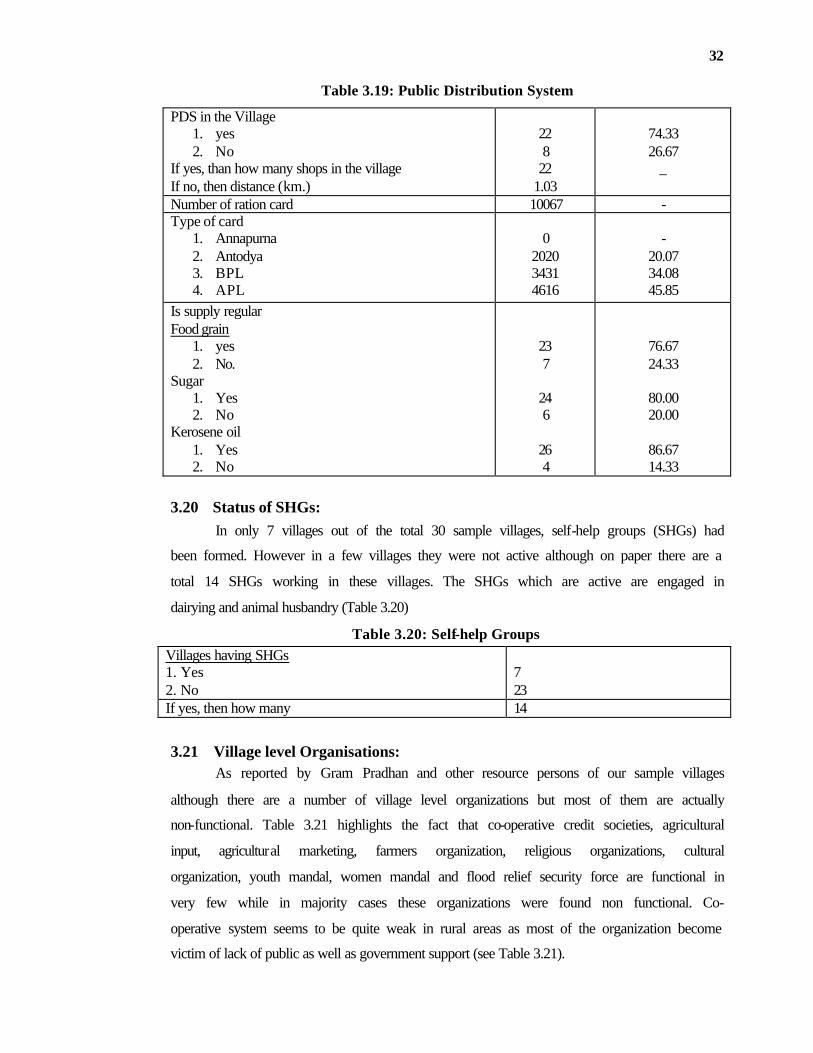
32
Table 3.19: Public Distribution System
PDS in the Village 1. yes 2. No
If yes, than how many shops in the village If no, then distance (km.)
22 8
22 1.03
74.33 26.67
_
Number of ration card 10067 - Type of card
1. Annapurna 2. Antodya 3. BPL 4. APL
0
2020 3431 4616
-
20.07 34.08 45.85
Is supply regular Food grain
1. yes 2. No.
Sugar 1. Yes 2. No
Kerosene oil 1. Yes 2. No
23 7
24 6
26 4
76.67 24.33
80.00 20.00
86.67 14.33
3.20 Status of SHGs:
In only 7 villages out of the total 30 sample villages, self-help groups (SHGs) had
been formed. However in a few villages they were not active although on paper there are a
total 14 SHGs working in these villages. The SHGs which are active are engaged in
dairying and animal husbandry (Table 3.20)
Table 3.20: Self-help Groups
Villages having SHGs 1. Yes 2. No
7 23
If yes, then how many 14
3.21 Village level Organisations:
As reported by Gram Pradhan and other resource persons of our sample villages
although there are a number of village level organizations but most of them are actually
non-functional. Table 3.21 highlights the fact that co-operative credit societies, agricultural
input, agricultural marketing, farmers organization, religious organizations, cultural
organization, youth mandal, women mandal and flood relief security force are functional in
very few while in majority cases these organizations were found non functional. Co-
operative system seems to be quite weak in rural areas as most of the organization become
victim of lack of public as well as government support (see Table 3.21).

33
Table - 3.21: Village Organization
Organization Functional Non-Functional
Average number of members
1. Cooperatives i. Credit 1 29 1 ii. Agricultural Inputs 3 27 34 iii. Production of Khadi 0 30 0 iv. Marketing 1 29 1 v. Dairy 0 30 0 vi. Others 0 30 0 2. Workers organizations/unions 0 30 0 4. Farmers organization 1 29 1 4. Voluntary Organizations 0 30 0 5. Religious/Caste organizations 1 29 1 6. Political Organizations 0 30 0 7. Cultural Organizations 2 28 2 8. Youth Mandal 2 28 3 9. Mahila Mandal 1 29 1 10. Flood Relief Village Security Force 4 26 2 11. Others 0 30 0
3.22 Non-Agricultural Activities Found in the Villages:
Among the non-agricultural activities which were found in our sample villages
dairying was the most popular and was being undertaken in as many as 23 villages and
involved around 281 households. The other activities include fisheries, rice, flour and oil
mills/ghanis and manufacturing of gur etc. Although, number of households presently
engaged in them is limited but there are definite indicators as to the type of activities which
may be promoted by DIC or the district rural development office in the district (Table 3.22).
Table 3.22: Non Agricultural activities found in sample villages:
Activity No of Villages Total H.H. involved 1. Dairying 23 281 2. Fishery 14 50 4. Palecer/Rice milling 5 8 4. Tailoring 2 4 5. Flour Mill/ Atta Chakki 7 8 6. Oil Ghani 2 2 7. Gur Manufacturing 1 2 HANDICRAFTS 8. Carpentry 1 3 9. Black Smith/Iron work 8 12 10. Pottery 2 10

34
3.23 Development Programmes being conducted in the Villages:
Individual beneficiary oriented programmes are shown in 3.24. Table highlights that
last year on an average about 9.1 person per village benefited under various development
programmes implemented by different government departments. It was found that
maximum number of beneficiary on a per village basis are found in NREGA scheme. About
27 individuals received employment from each village of these around 8 people were from
minority community. Old age pension is another important programme in our sample
villages which benefited around 25 individuals per village. Among them about 12
individuals belongs to minority community. Similarly under Gram Nidhi Yojana about 23
person in each village received benefits among them 10 person belonged to minority
community. Under Indira Awas Yojana about 5 persons benefited but only one person was a
Muslim. About 8 women in each village benefited under widow pension scheme. The
number of minority who figured in list was around 3 (For details see Table 2.23).
Table 3.23: Individual Beneficiary Oriented Programmes Programme Total % SC % Minority % Others % SGSY 129 4.30 73 2.43 21 0.70 35 1.17 NREGA 799 26.63 316 10.53 250 8.33 233 7.76 PMGSY 0 0 0 0 0 0 0 0 IAY 145 4.83 56 1.87 29 0.97 60 2.00 Others (Gram Nidhi) 688 22.93 306 10.20 78 2.60 304 10.13 Pension Scheme Old age pension scheme 739 24.63 163 5.43 218 7.27 358 11.93 Widow pension scheme 236 7.87 47 1.57 95 4.17 94 4.13
Total 2736 91.2 961 32.03 691 24.03 1084 36.13 We have also tried to find out the details regarding the current development
programmes being implemented in the villages. Details these programmes, such as activities
undertaken by them, total number of beneficiaries, funds allocated for each programme and
villagers views regarding these programmes are shown in Table 3.24.

35
Table 3.24: Current Development Programmes
Views about the
Programmes Programmes Activities
Undertaken Village
Covered
Total no of
beneficiaries
Fund Allocated (Rs Lakh)
Goo
d
Satis
fied
Not
goo
d
N.R.E.G.A. (i) Drainage Work (ii) Kharanja (iii) Road Construction (iv) Plantation work (v) Bridge/Puliya Construction
15 463 27.59 4 8 3
IAY (i) Construction of Houses 5 23 7.5 0 5 0 Scheme under 12th Finance Commission
(i) Drainage work (ii)Bridge/ pulia construction (iii) Kharanja
12 372 14.99 2 10
0
SGSY (i) Kharanja (ii) Drainage work
2 70 1.50 0 2 0
Gram Nidhi (i) Kharanja Construction (ii) Drainage work
10 432 14.03 3 7 0
6. DPRO (i) Toilet Construction 2 106 1.85 0 2 0
(a) NREGA:
This scheme is being implemented only in 15 sample villages. Around 31 persons
per village benefited and 27.59 lakhs were allocated under NREGA. The type of activities
undertaken were construction of drains, kharanja, roads, plantation and small bridges. In
around 20.0 per cent villages the feeling is that this programme is not good, however 80.0
per cent villagers give their views in favour of this programmes.
(b) Indira Awas Yojana:
Out of 30 villages, Indira Awas Yojana scheme was implemented only in 5 villages
and total beneficiaries covered were 24. The average funds allocated under IAY per village
worked out to Rs.1.5 Laks. All villages feel that IAY scheme is satisfactory and beneficial
for the poor people of the rural areas.
(c) Scheme under 12th finance commission:
This scheme was undertaken in 12 villages. The main activities undertaken under
this scheme were construction of drainage, pulia and kharanja work. Villagers of all sample
villages where this programme is implemented were satisfied with the programme.
(d) Sawarn Jayanti Gram Swarojgar Yojana (SGSY):
The programme was implemented only in 2 sample villages, drainage and kharanja
work undertaken in this scheme. Only 70 persons benefited by this scheme and they were
satisfied with this scheme.
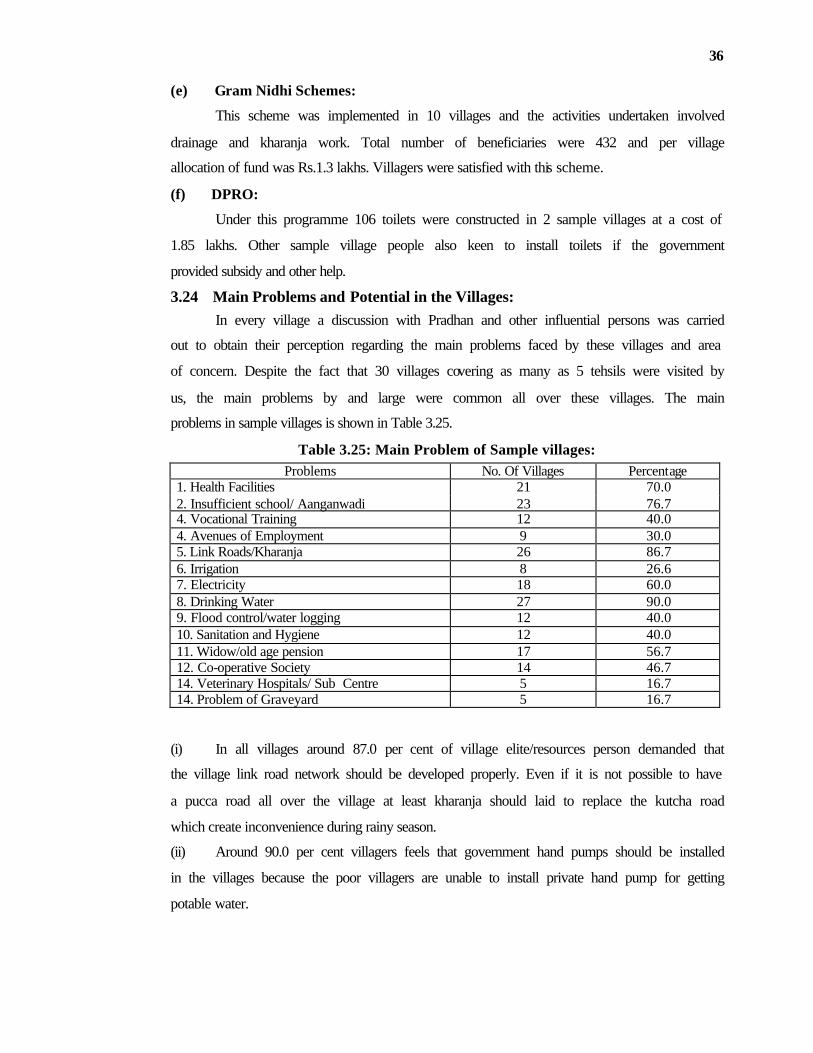
36
(e) Gram Nidhi Schemes:
This scheme was implemented in 10 villages and the activities undertaken involved
drainage and kharanja work. Total number of beneficiaries were 432 and per village
allocation of fund was Rs.1.3 lakhs. Villagers were satisfied with this scheme.
(f) DPRO:
Under this programme 106 toilets were constructed in 2 sample villages at a cost of
1.85 lakhs. Other sample village people also keen to install toilets if the government
provided subsidy and other help.
3.24 Main Problems and Potential in the Villages:
In every village a discussion with Pradhan and other influential persons was carried
out to obtain their perception regarding the main problems faced by these villages and area
of concern. Despite the fact that 30 villages covering as many as 5 tehsils were visited by
us, the main problems by and large were common all over these villages. The main
problems in sample villages is shown in Table 3.25.
Table 3.25: Main Problem of Sample villages:
Problems No. Of Villages Percentage 1. Health Facilities 21 70.0 2. Insufficient school/ Aanganwadi 23 76.7 4. Vocational Training 12 40.0 4. Avenues of Employment 9 30.0 5. Link Roads/Kharanja 26 86.7 6. Irrigation 8 26.6 7. Electricity 18 60.0 8. Drinking Water 27 90.0 9. Flood control/water logging 12 40.0 10. Sanitation and Hygiene 12 40.0 11. Widow/old age pension 17 56.7 12. Co-operative Society 14 46.7 14. Veterinary Hospitals/ Sub Centre 5 16.7 14. Problem of Graveyard 5 16.7
(i) In all villages around 87.0 per cent of village elite/resources person demanded that
the village link road network should be developed properly. Even if it is not possible to have
a pucca road all over the village at least kharanja should laid to replace the kutcha road
which create inconvenience during rainy season.
(ii) Around 90.0 per cent villagers feels that government hand pumps should be installed
in the villages because the poor villagers are unable to install private hand pump for getting
potable water.
37
(iii) In our sample around 77.0 per cent villages are still demanding primary, upper
primary and Aanganwadi centre in the villages. However government is opening primary
and upper primary school within 1 km and 2 km distance respectively.
(iv) The sub-centre and PHCs are not able to fulfill the needs of the people related to
medical care. Even the private practitioners in the village are quacks and Jhola Chap
doctors. On the whole the community is of the opinion that sub centre within all villages
and PHCs should be opened in the cluster of villages so that the villages can avail the
services of qualified ANMs and doctors.
(v) Around 60.0 per cent Pradhans reported that power supply in the village is very
irregular. The average daily power supply of 6-9 hours is insufficient to meet the
requirement of the people. For the development of agriculture and other small industries
regular and sufficient power supply is necessary in rural areas.
(vi) In our sample around 57.0 per cent Pradhan informed that some eligible widows and
old age persons are unable to avail the pension facility. Therefore pension should be
provided as per norms laid down by the government.
(vii) Around 57.0 per cent Pradhans feels that co-operative credit societies should be
strengthened so that the farmers can avail the fertilizer and crop loan easily.
(viii) Around 40.0 per cent Pradhans and resource persons informed that employment
avenues are negligible in the villages so rope and basket making, furniture manufacturing,
biscuit, pickles, papad, spices, candles, agarbatti and weaving and spinning work should be
encouraged among the villagers. Further Pradhan informed that more employment
generating development programmes should be implemented in the villages.
(ix) Around 40.0 per cent Pradhan informed that institutions offering technical education
such as ITI and polytechnics are located very far. More ITIs and polytechnics should be
opened and children willing to avail vocational training, scholarship should be provided to
them for this purpose. It is hoped that at least the minority community will be able to avail
the advantage of the latest central government scheme under which non refundable fee up to
Rs 20,000 per year will be subsidized by the government. Besides this the government will
also bear the hostel expenses of the student up to a maximum of Rs 10,000 per annum.
(x) Around 40.0 per cent village resource person are not satisfied with total sanitation
programme because majority of rural households do not have a toilet and ladies face great
inconvenience. Pradhans also informed that drainage system was not found in these
villages. Drainage and toilet construction through various development programmes will
prove helpful for the health of rural population.
38
(xi) Agriculture is the main source of employment in our sample villages but 27.0 per
cent Pradhans feel that there are lack of irrigation facilities so government tube wells should
be installed and coverage of canals should be increased because individual are unable to
install tube wells.
(xii) It was also pointed out by around 17.0 per cent Pradhan and other that the veterinary
services being provided need to be strengthened keeping in mind that many families are
engaged in dairy business while some are keeping goats and poultry.
(xiii) Around 40.0 per cent of our sample villages feel that flood controls measures should
be adopted as early as possible so that fertile land as well human life can be saved.
(xiv) Out of 30 sample villages resource persons of 5 villages informed that there is no
graveyard land within or near by village. They suggest that barren and uncultivable land
should be allotted for this purpose.
The village Pradhan and elite person also reported that BPL card should be provided
to all eligible households, more houses under Indira Awas, Panchayat Bhawan and
community Bhawan are also needed in the village for village panchayat meeting and other
social ceremonies.
The resource person, Pradhan and Panchayat members informed that there is
potential of ‘kala namak’, rice, parwal cultivation, dairy, poultry, agriculture and small
industries. The SHGs, NGO, KVIC, DIC, Banks and other departments should, therefore
come forward with honest efforts for the welfare of population of Siddharth Nagar.

39
CHAPTER-4
ANALYSIS OF THE SOCIO-ECONOMIC CONDITIONS OF HOUSEHOLDS ON A
RELIGION WISE BASIS
4.1 Demographic Features : As we covered 30 households per sample village and the total households covered
in our total sample were 900 . As already explained earlier the sample was drawn with the
specific intention of covering different religious categories in proportion to their share in
total population of the village. Out of 900 household covered by us around 61.0 per cents
(551 households) were Hindus and around 39.0 per cent (349 households) were Muslim.
No other minority communities were found in our sample villages (Table 4.1).
Table 4.1 Distribution of household by religion
Religion Number of Households Percentages
Hindu 551 61.22 Muslim 349 38.78 All Religions 900 100.00
Table 4.2 shows the distribution of households by their caste. The Table reveals that
around 26.0 per cent of our sample households belongs to OBC. The share of schedule
caste and schedule tribe categories was around 18.0 per cent and 1.0 per cent respectively.
Upper caste were found around 55.0 per cent (Table 4.2). All Muslim households belong to
either general or OBC category. No SC/ST were found in our sample.
Table 4.2 Distribution of Households by caste
Caste Number of Households Percentages
SC 165 18.33 ST 5 0.56 OBC 236 26.22 Upper Castes 494 54.89 Total 900 100.00
Table 4.3 shows the distribution of households by mother tongue and second known
language. Around 88.0 per cent households indicated that Hindi is their mother tongue.
Despite the fact that the composition of Muslim households in our total sample was around
39.0 per cent only around 12.0 per cent households have given Urdu as their mother tongue
(see Table 4.3.).
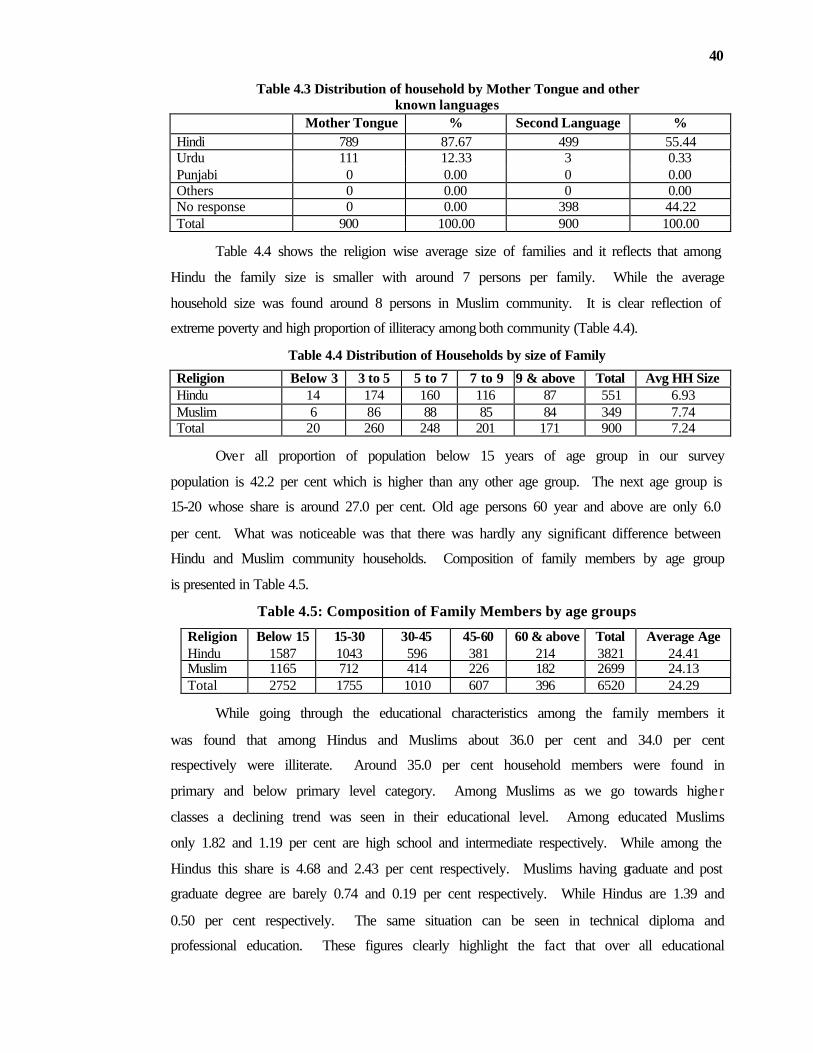
40
Table 4.3 Distribution of household by Mother Tongue and other known languages
Mother Tongue % Second Language % Hindi 789 87.67 499 55.44 Urdu 111 12.33 3 0.33 Punjabi 0 0.00 0 0.00 Others 0 0.00 0 0.00 No response 0 0.00 398 44.22 Total 900 100.00 900 100.00
Table 4.4 shows the religion wise average size of families and it reflects that among
Hindu the family size is smaller with around 7 persons per family. While the average
household size was found around 8 persons in Muslim community. It is clear reflection of
extreme poverty and high proportion of illiteracy among both community (Table 4.4).
Table 4.4 Distribution of Households by size of Family
Religion Below 3 3 to 5 5 to 7 7 to 9 9 & above Total Avg HH Size Hindu 14 174 160 116 87 551 6.93 Muslim 6 86 88 85 84 349 7.74 Total 20 260 248 201 171 900 7.24
Over all proportion of population below 15 years of age group in our survey
population is 42.2 per cent which is higher than any other age group. The next age group is
15-20 whose share is around 27.0 per cent. Old age persons 60 year and above are only 6.0
per cent. What was noticeable was that there was hardly any significant difference between
Hindu and Muslim community households. Composition of family members by age group
is presented in Table 4.5.
Table 4.5: Composition of Family Members by age groups
Religion Below 15 15-30 30-45 45-60 60 & above Total Average Age Hindu 1587 1043 596 381 214 3821 24.41 Muslim 1165 712 414 226 182 2699 24.13 Total 2752 1755 1010 607 396 6520 24.29
While going through the educational characteristics among the family members it
was found that among Hindus and Muslims about 36.0 per cent and 34.0 per cent
respectively were illiterate. Around 35.0 per cent household members were found in
primary and below primary level category. Among Muslims as we go towards higher
classes a declining trend was seen in their educational level. Among educated Muslims
only 1.82 and 1.19 per cent are high school and intermediate respectively. While among the
Hindus this share is 4.68 and 2.43 per cent respectively. Muslims having graduate and post
graduate degree are barely 0.74 and 0.19 per cent respectively. While Hindus are 1.39 and
0.50 per cent respectively. The same situation can be seen in technical diploma and
professional education. These figures clearly highlight the fact that over all educational

41
level are quite low and Muslim particularly are lagging behind the Hindu community in
terms of higher education (Table 4.6).
Table 4.6 : Educational Characteristics of family members
Level of Education Hindu % Muslim % Total % Illiterate 1365 35.72 910 34.72 2275 34.89 Below Primary 444 11.62 474 17.56 918 14.08 Primary 715 18.71 672 24.90 1387 21.27 Upper Primary 402 10.52 146 5.41 548 8.40 High School 179 4.68 49 1.82 228 4.50 Intermediate 93 2.43 32 1.19 125 1.92 Technical Diploma 10 0.26 3 0.11 13 0.20 Technical professional degree 4 0.10 1 0.04 5 0.08 graduate degree 53 1.39 20 0.74 73 1.12 post graduate 19 0.50 5 0.19 24 0.37 child 537 14.05 387 14.34 924 14.17 Total 3821 100.00 2699 100.00 6520 100.00
Educational status of the children in the age group 5-15 years shown in Table 4.7. It
is observed that out of total children (1741) in this category 113 children were not enrolled
in the educational Institutions. It is because their parents were of the opinion that they were
too young to be admitted in the school and schools are located at a long distances. Around
1.0 per cent were those who had left the schools by the time of our survey. Around 95.0 per
cent children attend school regularly and around 4.0 per cent were found irregular. Further
around 65.0 per cent children enrolled in government Parishadiya school followed by
around 26.0 per cent in Madarsas and about 9.0 per cent in private schools. It is the impact
of Sarva Shiksha Abhiyan that around 83.0 per cent children were attending school located
within 1.0 kilometer from the village. Around 74.0 per cent children study in Hindi
medium. Around 21.0 per cent Muslim and Hindu children are availing education in Urdu
as the medium of instruction. Around 1.0 per cent children are availing education in
English medium. The reason for dropouts which have been shown in Table 4.7 are mainly
their inability to afford the cost of education, work at home, marriage, distance of schools
and the compulsion to earn for the family (for detail please see Table 4.7).
Table 4.7: Education Status of Children 5 to 15 years
Hindu Muslim Total Total Children 1004 737 1741 school going children 932 696 1628 non school going children 72 41 113 Details of School Going Children Left after enrollment 5 9 14 Enrolled but irregular 34 33 67 Enrolled and regular 893 654 1547

42
Characteristics of enrolled children Class I 186 104 290 Class II 164 265 429 Class III 181 136 317 Class IV 119 94 213 Class V 115 52 167 Class VI 64 15 79 Class VII 49 15 64 Class VIII 37 12 49 Class IX 14 2 16 Class X 3 1 4 Type of School Govt 803 258 1061 Private 124 26 150 Madarsa 5 411 416 Missionary 0 0 0 Non formal 1 1 Distance of School Within 1 Km 723 626 1349 1-2 Kms 132 51 183 2-4 kms 50 8 58 4 and above 27 11 38 Medium of Instruction Hindi 871 327 1198 English 8 10 18 Hindi English Both 49 18 67 Urdu 4 341 345 Learning Minority Language Yes 11 456 467 No 921 240 1161 Reason for Dropout Work at home - 5 5 Need to earn 3 1 4 Far distance of School 2 2 4 Fees/Expenditure not afford 4 7 11 Marriage 2 3 5 Availing Government Assistance Yes 669 289 958 No 263 407 670
4.2 Work Status of Family Members :
The figure related to work status of family members shown in Table 4.8. The Table
shows that around 29.0 per cent persons in the total population are employed. Among
Hindu 29.29 per cent and among Muslims 28.49 per cent person were employed. The
unemployment figures are almost identical in both the religious group (Table 4.8).
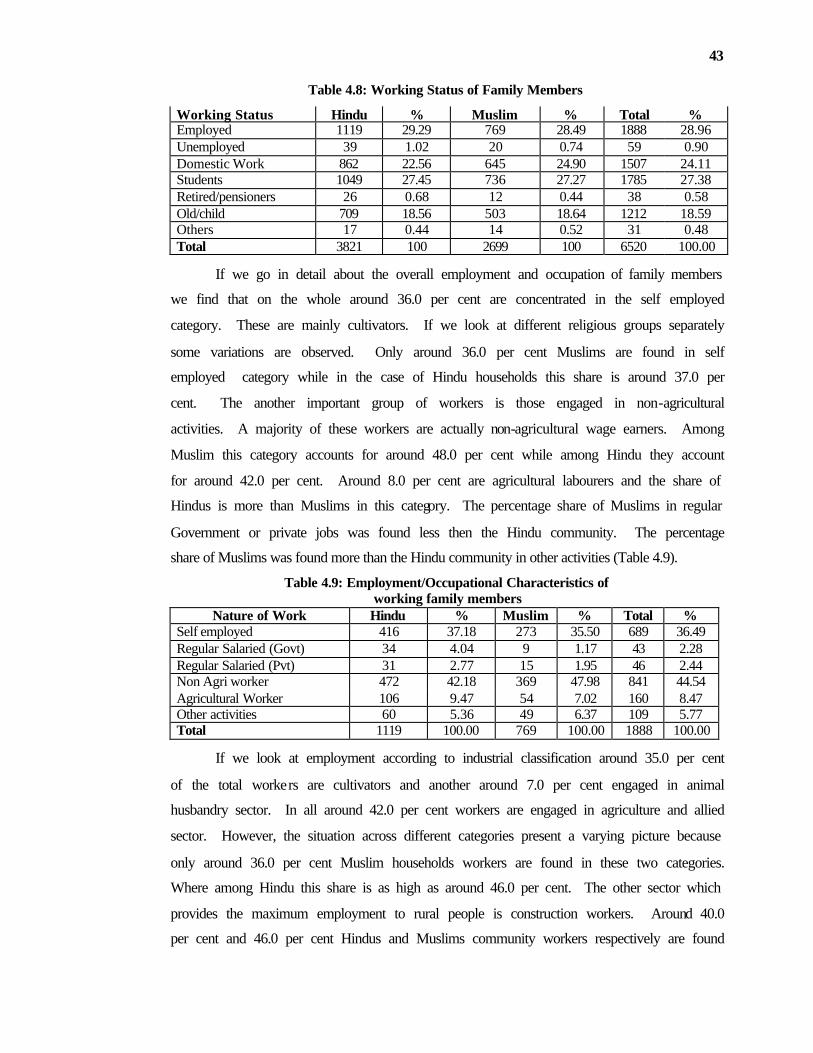
43
Table 4.8: Working Status of Family Members
Working Status Hindu % Muslim % Total % Employed 1119 29.29 769 28.49 1888 28.96 Unemployed 39 1.02 20 0.74 59 0.90 Domestic Work 862 22.56 645 24.90 1507 24.11 Students 1049 27.45 736 27.27 1785 27.38 Retired/pensioners 26 0.68 12 0.44 38 0.58 Old/child 709 18.56 503 18.64 1212 18.59 Others 17 0.44 14 0.52 31 0.48 Total 3821 100 2699 100 6520 100.00
If we go in detail about the overall employment and occupation of family members
we find that on the whole around 36.0 per cent are concentrated in the self employed
category. These are mainly cultivators. If we look at different religious groups separately
some variations are observed. Only around 36.0 per cent Muslims are found in self
employed category while in the case of Hindu households this share is around 37.0 per
cent. The another important group of workers is those engaged in non-agricultural
activities. A majority of these workers are actually non-agricultural wage earners. Among
Muslim this category accounts for around 48.0 per cent while among Hindu they account
for around 42.0 per cent. Around 8.0 per cent are agricultural labourers and the share of
Hindus is more than Muslims in this category. The percentage share of Muslims in regular
Government or private jobs was found less then the Hindu community. The percentage
share of Muslims was found more than the Hindu community in other activities (Table 4.9).
Table 4.9: Employment/Occupational Characteristics of working family members
Nature of Work Hindu % Muslim % Total % Self employed 416 37.18 273 35.50 689 36.49 Regular Salaried (Govt) 34 4.04 9 1.17 43 2.28 Regular Salaried (Pvt) 31 2.77 15 1.95 46 2.44 Non Agri worker 472 42.18 369 47.98 841 44.54 Agricultural Worker 106 9.47 54 7.02 160 8.47 Other activities 60 5.36 49 6.37 109 5.77 Total 1119 100.00 769 100.00 1888 100.00
If we look at employment according to industrial classification around 35.0 per cent
of the total workers are cultivators and another around 7.0 per cent engaged in animal
husbandry sector. In all around 42.0 per cent workers are engaged in agriculture and allied
sector. However, the situation across different categories present a varying picture because
only around 36.0 per cent Muslim households workers are found in these two categories.
Where among Hindu this share is as high as around 46.0 per cent. The other sector which
provides the maximum employment to rural people is construction workers. Around 40.0
per cent and 46.0 per cent Hindus and Muslims community workers respectively are found

44
engaged in this category. In manufacturing and trade and commerce more Muslims worker
were found than the Hindu community (see Table 4.10).
Table 4.10 Employment by industrial category
Category Hindu % Muslim % Total % Agriculture 436 38.96 222 28.87 658 34.85 Livestock 76 6.79 56 7.28 132 6.99 Fisheries 1 0.09 - 0.00 1 0.05 Forestry 1 0.09 1 0.13 2 0.11 Manufacturing 10 0.89 9 1.17 19 1.01 Construction 450 40.21 356 46.29 806 42.69 Trade and Commerce 48 4.29 66 8.58 114 6.04 Transport 15 1.34 6 0.78 21 1.11 Fin & admin services 1 0.09 0.00 1 0.05 Education health services 81 7.24 53 6.89 134 7.10 Grand Total 1119 100.00 769 100.00 18888 100.0
One of the enquiries made from the respondents was whether they or their household
members were on the look out of additional employment opportunities. Among all
households around 94.0 per cent expressed their keenness to take up additional work. We
had also asked them to indicate their preference regarding the activities in which they would
like to take up additional employment. Among both religious groups the activity to
received first preference was dairy activity. The second preference was business and third
is non-agricultural labourers. The fourth preference was given to industry and poultry
farming (for detail please see Table 4.11).
Table 4.11 Preferences of households for additional employment
Hindu % Muslim % Total % Searching employment 521 94.56 313 89.68 834 92.67 Not searching 30 5.44 36 10.32 66 7.33 Total 551 100.00 349 100.00 900 100.00 First Preferred Activity Dairy 226 44.38 65 20.77 291 34.89 Services 39 7.49 24 7.67 63 7.55 Others 30 5.76 17 5.43 47 5.64 Poultry 4 0.77 64 20.45 68 8.15 Piggery 7 1.34 1 0.32 8 0.96 Sheep/Goat 17 4.26 30 9.58 47 5.64 Fishery 4 0.77 6 1.92 10 1.20 Ag. Labour 7 1.34 8 2.56 15 1.80 Non Ag Labour 52 9.98 44 14.06 96 11.51 Industry 65 12.48 10 4.19 75 8.99 Business 70 14.44 44 14.06 114 14.67 Total 521 100.00 313 100.00 834 100.00

45
Second Preferred Activity Dairy 67 12.86 38 12.14 105 12.59 Services 12 2.30 5 1.60 17 2.04 Others 17 4.26 18 5.75 35 4.20 Poultry 7 1.34 31 9.90 38 4.56 Piggery 3 0.58 2 0.64 5 0.60 Sheep/Goat 49 9.40 74 24.64 123 14.75 Fishery 3 0.58 3 0.96 6 0.72 Ag. Labour 37 7.10 14 4.47 51 6.12 Non Ag Labour 60 11.52 38 12.14 98 11.75 Industry 109 20.92 21 6.71 130 15.59 Business 157 30.13 69 22.04 226 27.10 Total 521 100.00 313 100.00 834 100.00 Third Preferred Activity Dairy 76 14.59 32 10.22 108 12.95 Services 66 12.67 20 6.39 86 10.31 Others 27 5.18 11 4.51 38 4.56 Poultry 11 2.11 28 8.95 39 4.68 Piggery 15 2.88 2 0.64 17 2.04 Sheep/Goat 23 4.41 50 15.97 73 8.75 Fishery 5 0.96 3 0.96 8 0.96 Ag. Labour 21 4.03 9 2.88 30 4.60 Non Ag Labour 71 14.63 79 25.24 150 17.99 Industry 56 10.75 19 6.07 75 8.99 Business 150 28.79 60 19.17 210 25.18 Total 521 100.00 313 100.00 834 100.00
4.3 Land Holdings :
In our sample households landless households among Muslims are maximum 27.79 per
cent while 24.59 per cent Hindus are landless, but the average landholding size of Muslim
households was found slightly more than Hindu households (Table 4.12).
Table 4.12 Distribution of households by size of land holding
Size of Land Holding Hindu Muslim Total Landless 130 97 227 Below 1.0 167 102 269 1.00 to 2.50 177 106 283 2.50 to 5.00 63 27 90 5.00 to 7.50 4 9 13 7.50 to 10.00 5 6 11 10 and above 5 2 7 Total 551 349 900 Avg land per household (Acres) 1.65 1.77 1.70
Table 4.13 shows the distribution of households by value of their land. Average value
of land per owning households among Hindu is Rs.1.98 lakh while the average value of land
among Muslim land owning household is only Rs. 1.85 lakh (see Table 4.13).
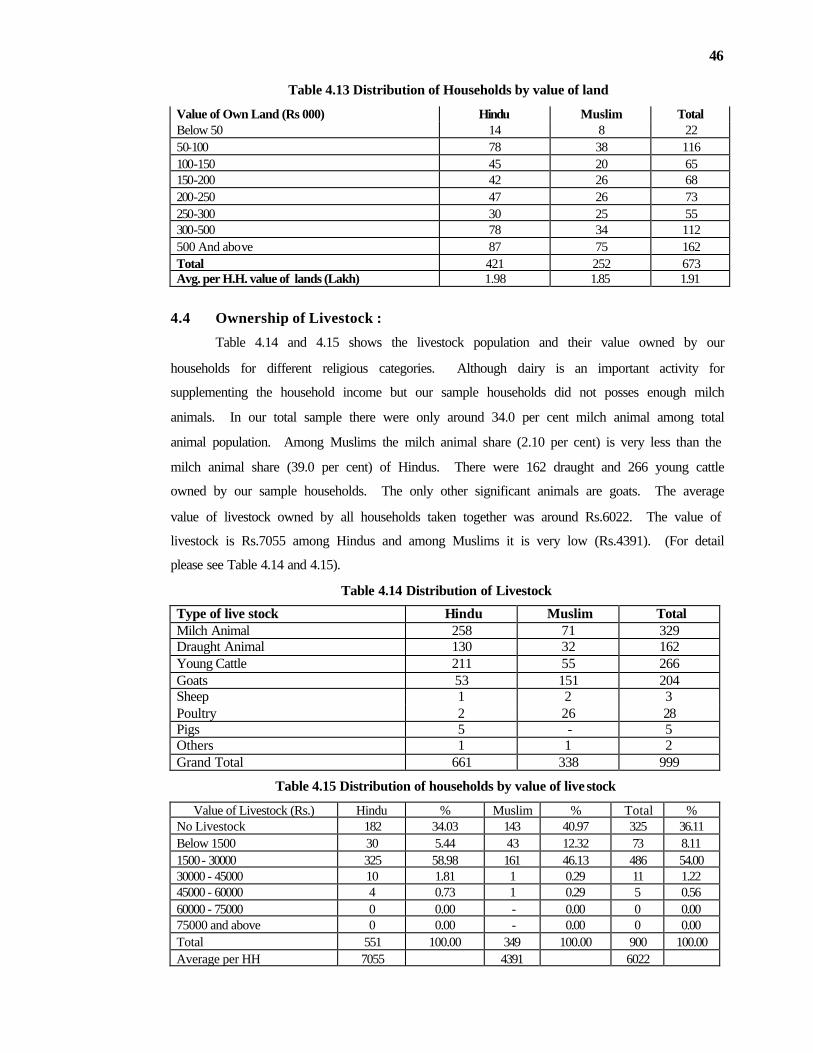
46
Table 4.13 Distribution of Households by value of land
Value of Own Land (Rs 000) Hindu Muslim Total Below 50 14 8 22 50-100 78 38 116 100-150 45 20 65 150-200 42 26 68 200-250 47 26 73 250-300 30 25 55 300-500 78 34 112 500 And above 87 75 162 Total 421 252 673 Avg. per H.H. value of lands (Lakh) 1.98 1.85 1.91
4.4 Ownership of Livestock :
Table 4.14 and 4.15 shows the livestock population and their value owned by our
households for different religious categories. Although dairy is an important activity for
supplementing the household income but our sample households did not posses enough milch
animals. In our total sample there were only around 34.0 per cent milch animal among total
animal population. Among Muslims the milch animal share (2.10 per cent) is very less than the
milch animal share (39.0 per cent) of Hindus. There were 162 draught and 266 young cattle
owned by our sample households. The only other significant animals are goats. The average
value of livestock owned by all households taken together was around Rs.6022. The value of
livestock is Rs.7055 among Hindus and among Muslims it is very low (Rs.4391). (For detail
please see Table 4.14 and 4.15).
Table 4.14 Distribution of Livestock
Type of live stock Hindu Muslim Total Milch Animal 258 71 329 Draught Animal 130 32 162 Young Cattle 211 55 266 Goats 53 151 204 Sheep 1 2 3 Poultry 2 26 28 Pigs 5 - 5 Others 1 1 2 Grand Total 661 338 999
Table 4.15 Distribution of households by value of live stock
Value of Livestock (Rs.) Hindu % Muslim % Total % No Livestock 182 34.03 143 40.97 325 36.11 Below 1500 30 5.44 43 12.32 73 8.11 1500 - 30000 325 58.98 161 46.13 486 54.00 30000 - 45000 10 1.81 1 0.29 11 1.22 45000 - 60000 4 0.73 1 0.29 5 0.56 60000 - 75000 0 0.00 - 0.00 0 0.00 75000 and above 0 0.00 - 0.00 0 0.00 Total 551 100.00 349 100.00 900 100.00 Average per HH 7055 4391 6022
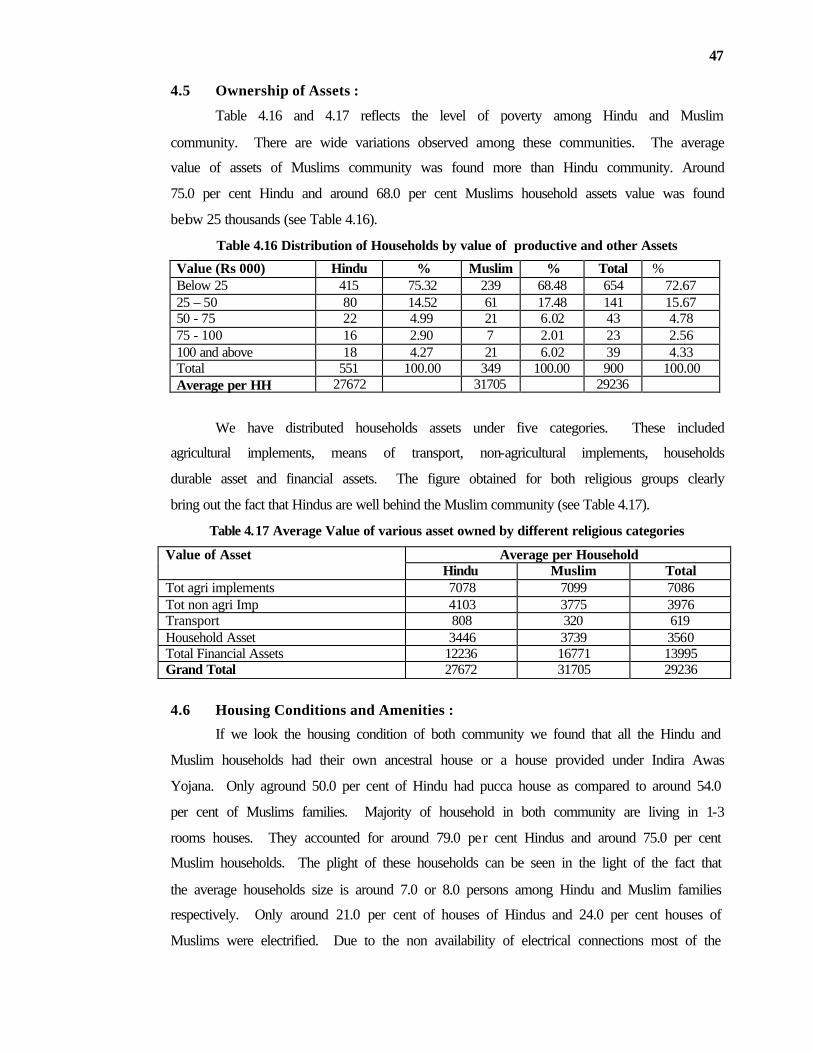
47
4.5 Ownership of Assets :
Table 4.16 and 4.17 reflects the level of poverty among Hindu and Muslim
community. There are wide variations observed among these communities. The average
value of assets of Muslims community was found more than Hindu community. Around
75.0 per cent Hindu and around 68.0 per cent Muslims household assets value was found
below 25 thousands (see Table 4.16).
Table 4.16 Distribution of Households by value of productive and other Assets
Value (Rs 000) Hindu % Muslim % Total % Below 25 415 75.32 239 68.48 654 72.67 25 – 50 80 14.52 61 17.48 141 15.67 50 - 75 22 4.99 21 6.02 43 4.78 75 - 100 16 2.90 7 2.01 23 2.56 100 and above 18 4.27 21 6.02 39 4.33 Total 551 100.00 349 100.00 900 100.00 Average per HH 27672 31705 29236
We have distributed households assets under five categories. These included
agricultural implements, means of transport, non-agricultural implements, households
durable asset and financial assets. The figure obtained for both religious groups clearly
bring out the fact that Hindus are well behind the Muslim community (see Table 4.17).
Table 4.17 Average Value of various asset owned by different religious categories
Average per Household Value of Asset Hindu Muslim Total Tot agri implements 7078 7099 7086 Tot non agri Imp 4103 3775 3976 Transport 808 320 619 Household Asset 3446 3739 3560 Total Financial Assets 12236 16771 13995 Grand Total 27672 31705 29236
4.6 Housing Conditions and Amenities :
If we look the housing condition of both community we found that all the Hindu and
Muslim households had their own ancestral house or a house provided under Indira Awas
Yojana. Only aground 50.0 per cent of Hindu had pucca house as compared to around 54.0
per cent of Muslims families. Majority of household in both community are living in 1-3
rooms houses. They accounted for around 79.0 per cent Hindus and around 75.0 per cent
Muslim households. The plight of these households can be seen in the light of the fact that
the average households size is around 7.0 or 8.0 persons among Hindu and Muslim families
respectively. Only around 21.0 per cent of houses of Hindus and 24.0 per cent houses of
Muslims were electrified. Due to the non availability of electrical connections most of the
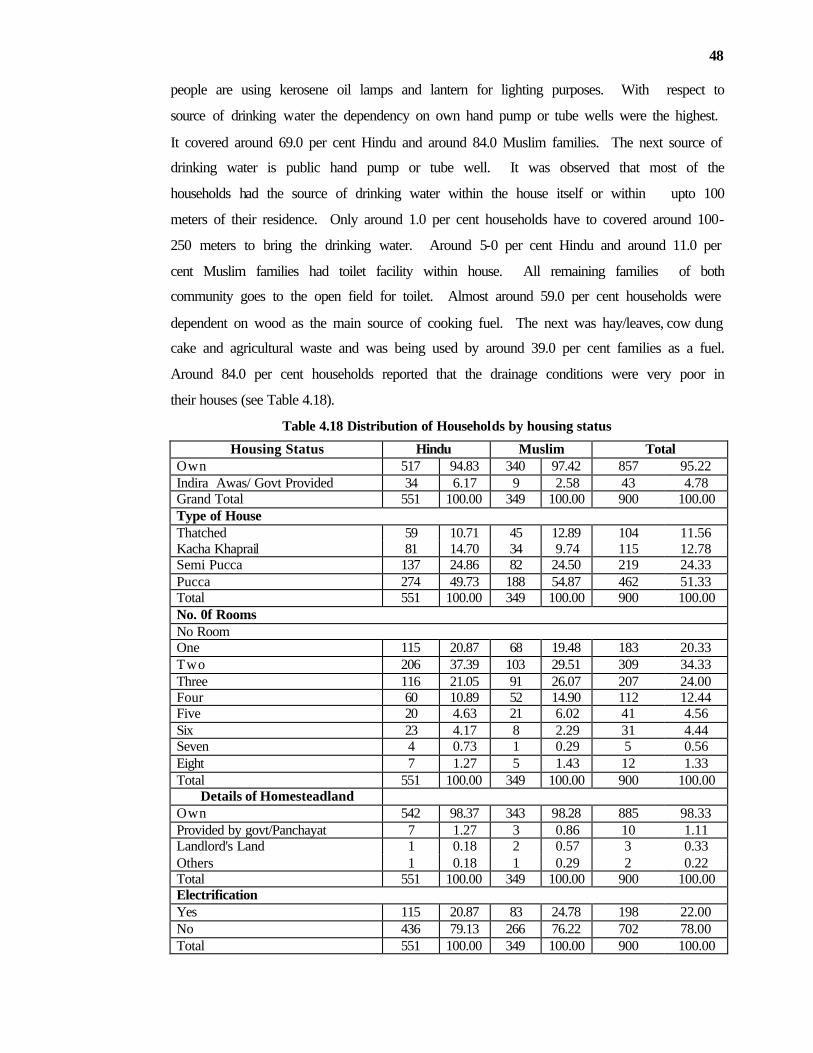
48
people are using kerosene oil lamps and lantern for lighting purposes. With respect to
source of drinking water the dependency on own hand pump or tube wells were the highest.
It covered around 69.0 per cent Hindu and around 84.0 Muslim families. The next source of
drinking water is public hand pump or tube well. It was observed that most of the
households had the source of drinking water within the house itself or within upto 100
meters of their residence. Only around 1.0 per cent households have to covered around 100-
250 meters to bring the drinking water. Around 5-0 per cent Hindu and around 11.0 per
cent Muslim families had toilet facility within house. All remaining families of both
community goes to the open field for toilet. Almost around 59.0 per cent households were
dependent on wood as the main source of cooking fuel. The next was hay/leaves, cow dung
cake and agricultural waste and was being used by around 39.0 per cent families as a fuel.
Around 84.0 per cent households reported that the drainage conditions were very poor in
their houses (see Table 4.18).
Table 4.18 Distribution of Households by housing status
Housing Status Hindu Muslim Total Own 517 94.83 340 97.42 857 95.22 Indira Awas/ Govt Provided 34 6.17 9 2.58 43 4.78 Grand Total 551 100.00 349 100.00 900 100.00 Type of House Thatched 59 10.71 45 12.89 104 11.56 Kacha Khaprail 81 14.70 34 9.74 115 12.78 Semi Pucca 137 24.86 82 24.50 219 24.33 Pucca 274 49.73 188 54.87 462 51.33 Total 551 100.00 349 100.00 900 100.00 No. 0f Rooms No Room One 115 20.87 68 19.48 183 20.33 Two 206 37.39 103 29.51 309 34.33 Three 116 21.05 91 26.07 207 24.00 Four 60 10.89 52 14.90 112 12.44 Five 20 4.63 21 6.02 41 4.56 Six 23 4.17 8 2.29 31 4.44 Seven 4 0.73 1 0.29 5 0.56 Eight 7 1.27 5 1.43 12 1.33 Total 551 100.00 349 100.00 900 100.00
Details of Homesteadland Own 542 98.37 343 98.28 885 98.33 Provided by govt/Panchayat 7 1.27 3 0.86 10 1.11 Landlord's Land 1 0.18 2 0.57 3 0.33 Others 1 0.18 1 0.29 2 0.22 Total 551 100.00 349 100.00 900 100.00 Electrification Yes 115 20.87 83 24.78 198 22.00 No 436 79.13 266 76.22 702 78.00 Total 551 100.00 349 100.00 900 100.00
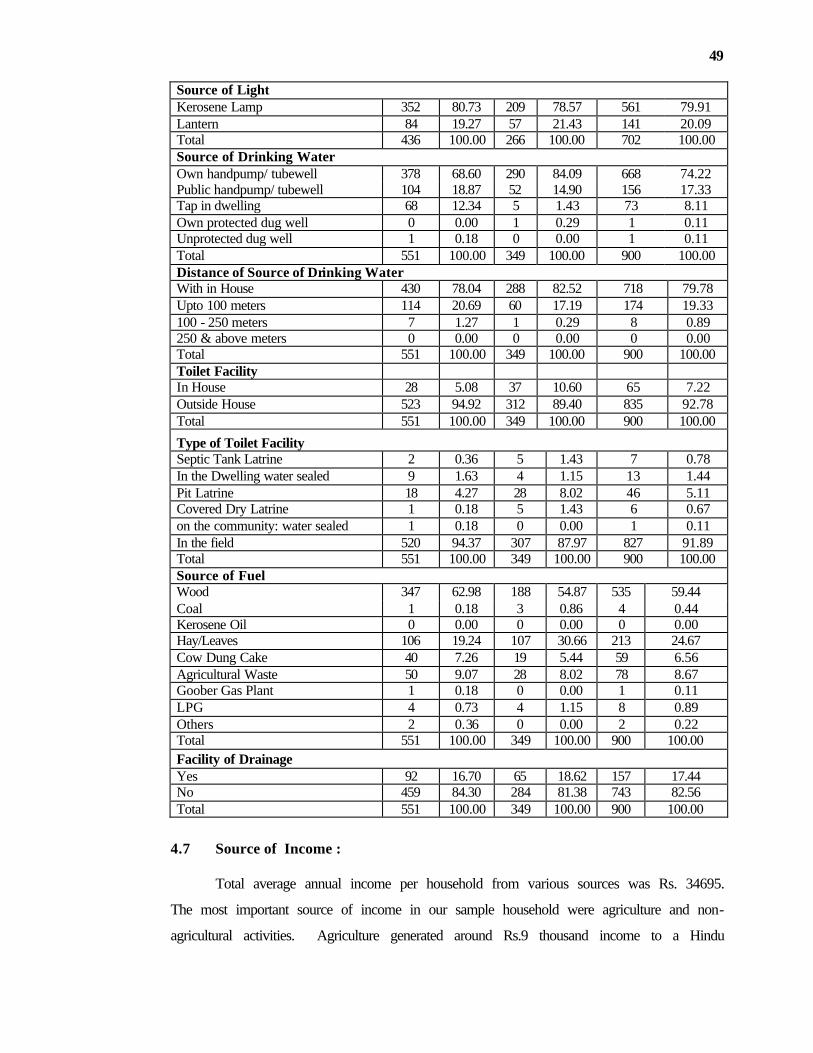
49
Source of Light Kerosene Lamp 352 80.73 209 78.57 561 79.91 Lantern 84 19.27 57 21.43 141 20.09 Total 436 100.00 266 100.00 702 100.00 Source of Drinking Water Own handpump/ tubewell 378 68.60 290 84.09 668 74.22 Public handpump/ tubewell 104 18.87 52 14.90 156 17.33 Tap in dwelling 68 12.34 5 1.43 73 8.11 Own protected dug well 0 0.00 1 0.29 1 0.11 Unprotected dug well 1 0.18 0 0.00 1 0.11 Total 551 100.00 349 100.00 900 100.00 Distance of Source of Drinking Water With in House 430 78.04 288 82.52 718 79.78 Upto 100 meters 114 20.69 60 17.19 174 19.33 100 - 250 meters 7 1.27 1 0.29 8 0.89 250 & above meters 0 0.00 0 0.00 0 0.00 Total 551 100.00 349 100.00 900 100.00 Toilet Facility In House 28 5.08 37 10.60 65 7.22 Outside House 523 94.92 312 89.40 835 92.78 Total 551 100.00 349 100.00 900 100.00
Type of Toilet Facility Septic Tank Latrine 2 0.36 5 1.43 7 0.78 In the Dwelling water sealed 9 1.63 4 1.15 13 1.44 Pit Latrine 18 4.27 28 8.02 46 5.11 Covered Dry Latrine 1 0.18 5 1.43 6 0.67 on the community: water sealed 1 0.18 0 0.00 1 0.11 In the field 520 94.37 307 87.97 827 91.89 Total 551 100.00 349 100.00 900 100.00 Source of Fuel Wood 347 62.98 188 54.87 535 59.44 Coal 1 0.18 3 0.86 4 0.44 Kerosene Oil 0 0.00 0 0.00 0 0.00 Hay/Leaves 106 19.24 107 30.66 213 24.67 Cow Dung Cake 40 7.26 19 5.44 59 6.56 Agricultural Waste 50 9.07 28 8.02 78 8.67 Goober Gas Plant 1 0.18 0 0.00 1 0.11 LPG 4 0.73 4 1.15 8 0.89 Others 2 0.36 0 0.00 2 0.22 Total 551 100.00 349 100.00 900 100.00 Facility of Drainage Yes 92 16.70 65 18.62 157 17.44 No 459 84.30 284 81.38 743 82.56 Total 551 100.00 349 100.00 900 100.00
4.7 Source of Income :
Total average annual income per household from various sources was Rs. 34695.
The most important source of income in our sample household were agriculture and non-
agricultural activities. Agriculture generated around Rs.9 thousand income to a Hindu
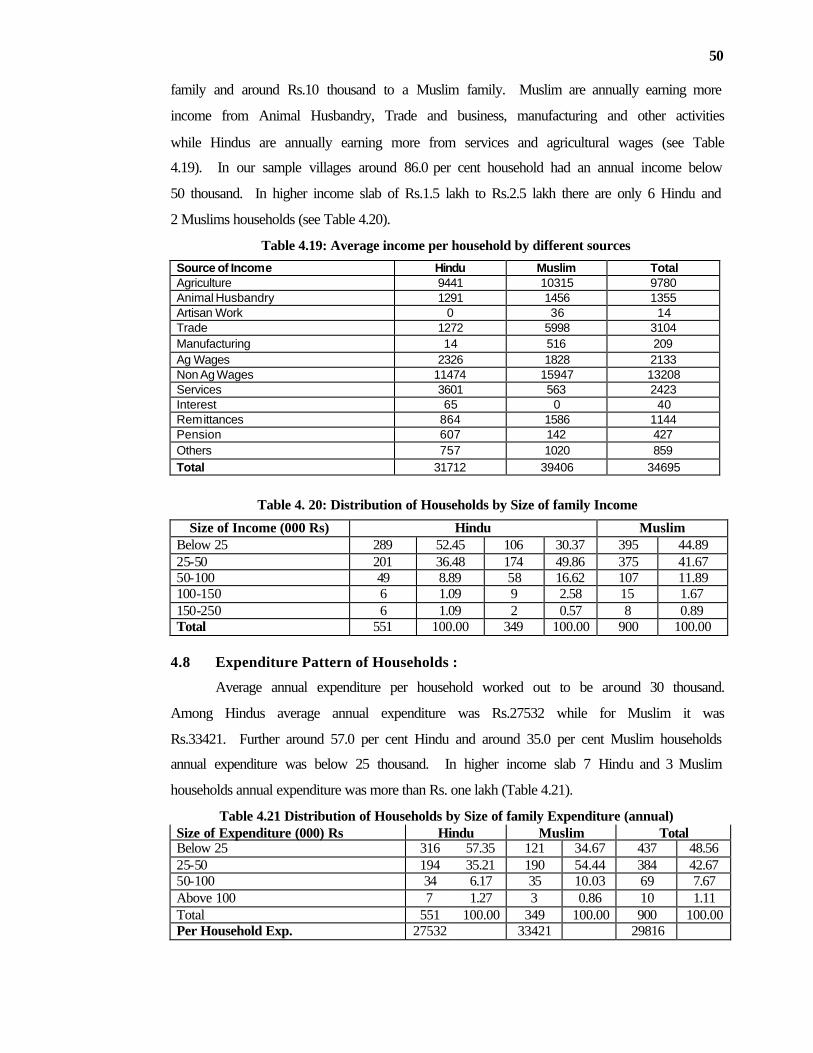
50
family and around Rs.10 thousand to a Muslim family. Muslim are annually earning more
income from Animal Husbandry, Trade and business, manufacturing and other activities
while Hindus are annually earning more from services and agricultural wages (see Table
4.19). In our sample villages around 86.0 per cent household had an annual income below
50 thousand. In higher income slab of Rs.1.5 lakh to Rs.2.5 lakh there are only 6 Hindu and
2 Muslims households (see Table 4.20).
Table 4.19: Average income per household by different sources
Source of Income Hindu Muslim Total Agriculture 9441 10315 9780 Animal Husbandry 1291 1456 1355 Artisan Work 0 36 14 Trade 1272 5998 3104 Manufacturing 14 516 209 Ag Wages 2326 1828 2133 Non Ag Wages 11474 15947 13208 Services 3601 563 2423 Interest 65 0 40 Remittances 864 1586 1144 Pension 607 142 427 Others 757 1020 859 Total 31712 39406 34695
Table 4. 20: Distribution of Households by Size of family Income
Size of Income (000 Rs) Hindu Muslim Below 25 289 52.45 106 30.37 395 44.89 25-50 201 36.48 174 49.86 375 41.67 50-100 49 8.89 58 16.62 107 11.89 100-150 6 1.09 9 2.58 15 1.67 150-250 6 1.09 2 0.57 8 0.89 Total 551 100.00 349 100.00 900 100.00
4.8 Expenditure Pattern of Households :
Average annual expenditure per household worked out to be around 30 thousand.
Among Hindus average annual expenditure was Rs.27532 while for Muslim it was
Rs.33421. Further around 57.0 per cent Hindu and around 35.0 per cent Muslim households
annual expenditure was below 25 thousand. In higher income slab 7 Hindu and 3 Muslim
households annual expenditure was more than Rs. one lakh (Table 4.21).
Table 4.21 Distribution of Households by Size of family Expenditure (annual) Size of Expenditure (000) Rs Hindu Muslim Total Below 25 316 57.35 121 34.67 437 48.56 25-50 194 35.21 190 54.44 384 42.67 50-100 34 6.17 35 10.03 69 7.67 Above 100 7 1.27 3 0.86 10 1.11 Total 551 100.00 349 100.00 900 100.00 Per Household Exp. 27532 33421 29816

51
The maximum expenditure was on cereals and pulses for both religious category. In
both community households share of expenditure on food grains is around 45.0 per cent.
Vegetables, clothes and medical care are also items which have a fair share in total
expenditure. Details of expenditure made on different items of expenditure are provided in
Table 4.22.
Table 4.22 Average expenditure per households on different heads
Heads of expenditure Hindu Muslim Total Cereal and Pulse Own Produced 7472 7916 7645 Purchased 5062 7282 5923 Vegetable, Meal, Milk, Spices, Sugar Own Produced 795 595 717 Purchased 2931 3357 3096 Clothes, Footwear, bedding 1849 2192 1982 Education 907 1002 944 Medical 1757 1951 1833 Festivals 989 1564 1212 Electricity, Gas and Fuel wood 555 784 644 Telephone 808 1062 906 House repairing 889 1193 1007 Payment of loans 242 308 268 Beedi, Cigarette, alcohol 638 774 691 Recreation 251 294 268 Marriage and other ceremonies 774 1118 907 Others 1612 2028 1773 Total 27532 33421 29816
4.9 Details of Workers and Their Occupation :
The primary occupation of majority of workers in all religious category (around
50.0) is manual labour. the next primary occupation is cultivation. In our total sample
around 29.0 per cent workers have cultivation as their primary occupation. the third
important primary occupation of the households found among both religious category is
animal husbandry. The fourth primary occupation for both the religious category is sale and
business. The other primary occupations of the households are less important in both
categories of households. Among males cultivation and manual labour remains the main
primary occupation, among females it is animal husbandry and manual labour. This is
almost similar for both the communities (see Table 4.23).

52
Table 4.23 Distribution of family members by their primary occupation
Total Hindu % Muslim % Total % Professional/Managerial & Admin. work 25 2.23 20 2.60 45 2.38 Clerk/Supervisor/Accountant 25 2.23 8 1.04 33 1.75 Sales/Business 40 4.57 81 10.53 121 6.41 Cultivator 347 31.01 203 26.40 550 29.13 Manual labour 568 50.76 371 48.24 939 49.74 Caste Occupation 28 2.50 15 1.95 43 2.28 Animal Husbandry 78 6.97 56 7.28 134 7.10 Others 8 0.71 15 1.95 23 1.22 Total 1119 100.00 769 100.00 1888 100.00 Men Professional/Managerial & Admin. work 17 1.66 19 2.69 36 2.08 Clerk/Supervisor/Accountant 21 2.04 7 0.99 28 1.61 Sales/Business 38 4.70 80 11.32 118 6.81 Cultivator 344 34.50 195 27.58 539 31.08 Manual labour 555 54.04 364 51.49 919 54.00 Caste Occupation 26 2.53 15 2.12 41 2.36 Animal Husbandry 18 1.75 12 1.70 30 1.73 Others 8 0.78 15 2.12 23 1.33 Total 1027 100.00 707 100.00 1734 100.00 Women Professional/Managerial & Admin. work 8 8.70 1 1.61 9 5.84 Clerk/Supervisor/Accountant 4 4.35 1 1.61 5 4.25 Sales/Business 2 2.17 1 1.61 3 1.95 Cultivator 3 4.26 8 12.90 11 7.14 Manual labour 13 14.13 7 11.29 20 12.99 Caste Occupation 2 2.17 0 0.00 2 1.30 Animal Husbandry 60 65.22 44 70.97 104 67.53 Others 0 0.00 0 0.00 0 0.00 Total 92 100.00 62 100.00 154 100.00
The main secondary occupation of working family members are also almost on
similar lines. The most important secondary occupations are cultivation, animal husbandry
and manual labour among both communities (see Table 2.24).
Table 4.24: Distribution of working family m embers by their Secondary occupation
Secondary Occupation Hindu % Muslim % Total % Total 1 0.20 1 0.33 2 0.25 Clerk/Supervisor/Accountant 1 0.20 0 0.00 1 0.12 Sales/Business 2 0.40 2 0.65 4 0.50 Cultivator 263 52.71 162 52.94 425 52.80 Manual labour 94 18.84 48 15.69 142 17.64 Caste Occupation 6 1.20 5 1.63 11 1.37 Animal Husbandry 132 26.45 86 28.10 218 27.08 Others 0 0.00 2 0.65 2 0.25 Total 499 100 306 100 805 100

53
Men Professional/Managerial & Admin. work 1 0.21 1 0.34 2 0.26 Clerk/Supervisor/Accountant 1 0.21 0 0.00 1 0.13 Sales/Business 2 0.42 2 0.68 4 0.52 Cultivator 252 52.83 156 54.06 408 52.92 Manual labour 92 19.29 45 15.31 137 17.77 Caste Occupation 6 1.26 4 1.36 10 1.30 Animal Husbandry 123 25.79 84 28.57 207 26.85 Others 0 0.00 2 0.68 2 0.26 Total 477 100 294 100 771 100.00 Women Professional/Managerial & Admin. work 0 0.00 0 0.00 0 0.00 Clerk/Supervisor/Accountant 0 0.00 0 0.00 0 0.00 Sales/Business 0 0.00 0 0.00 0 0.00 Cultivator 11 50.00 6 50.00 17 50.00 Manual labour 2 9.09 3 25.00 5 14.71 Caste Occupation 0 0.00 1 8.33 1 2.94 Animal Husbandry 9 40.91 2 16.67 11 32.35 Others 0 0.00 0 0.00 0 0.00 Total 22 100 12 100 34 100.00
As majority of workers are engaged in agriculture, manual labour and animal husbandry
the maximum concentration of workers is casual labour (52.86 per cent). The casual workers
account for around 54.0 per cent and 51.0 per cent of Hindu and Muslim respectively. the self
employed category accounts for around 37 per cent and around 36.0 per cent of Hindu and
Muslim respectively. Around 11.0 per cent workers in all religious categories were found as
regular workers (Table 4.25).
Table 4.25: Distribution of working family members by type of employment
Type of Employment Hindu % Muslim % Total % Total Self Employed 416 37.18 273 35.50 689 36.49 Regular 99 8.85 102 14.26 201 10.65 Casual 604 54.98 394 51.24 998 52.86 Total 1119 100.00 769 100.00 1888 100.00 Men Self Employed 351 34.18 224 31.68 575 34.16 Regular 87 8.47 100 14.14 187 10.78 Casual 589 57.35 383 54.17 972 56.06 Total 1027 100.00 707 100.00 1734 100.00 Women Self Employed 65 70.65 49 79.03 114 74.03 Regular 12 14.04 2 4.23 14 9.09 Casual 15 16.30 11 17.74 26 16.88 Total 92 100.00 62 100.00 154 100.00
In the main occupation over all average mandays employment workout to be 208 days
in a year. In our sample villages Hindus are availing 204 days and Muslim 215 days work in a
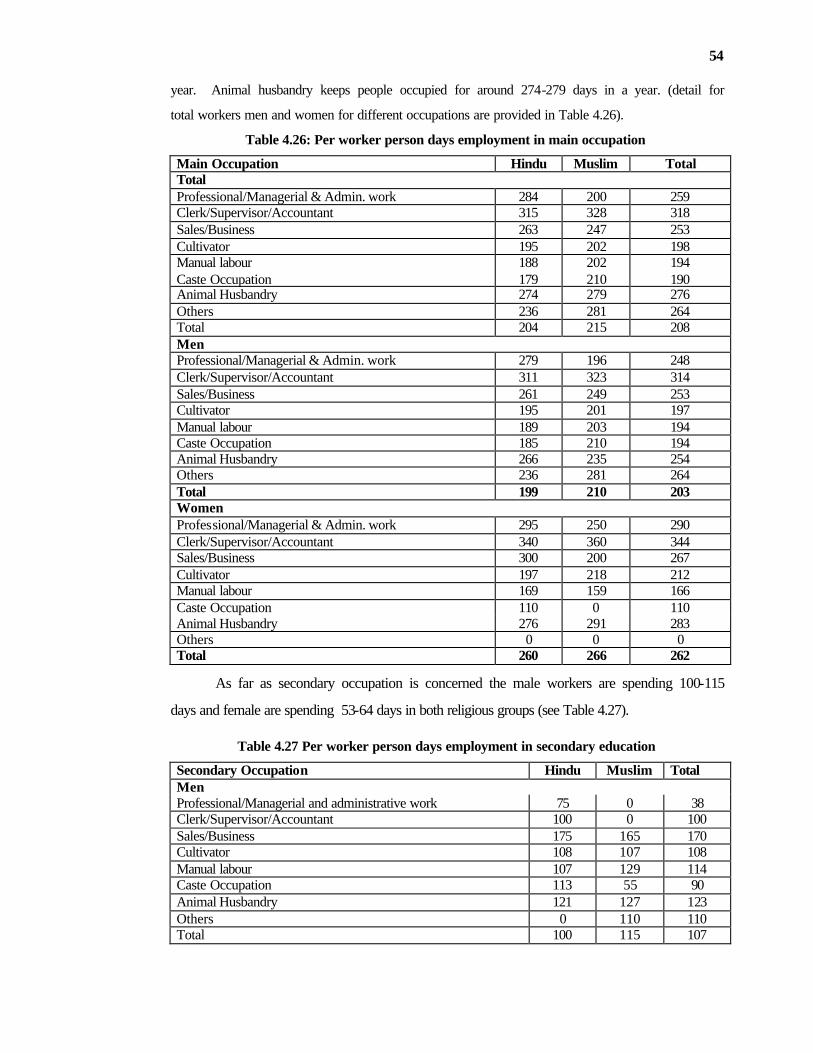
54
year. Animal husbandry keeps people occupied for around 274-279 days in a year. (detail for
total workers men and women for different occupations are provided in Table 4.26).
Table 4.26: Per worker person days employment in main occupation
Main Occupation Hindu Muslim Total Total Professional/Managerial & Admin. work 284 200 259 Clerk/Supervisor/Accountant 315 328 318 Sales/Business 263 247 253 Cultivator 195 202 198 Manual labour 188 202 194 Caste Occupation 179 210 190 Animal Husbandry 274 279 276 Others 236 281 264 Total 204 215 208 Men Professional/Managerial & Admin. work 279 196 248 Clerk/Supervisor/Accountant 311 323 314 Sales/Business 261 249 253 Cultivator 195 201 197 Manual labour 189 203 194 Caste Occupation 185 210 194 Animal Husbandry 266 235 254 Others 236 281 264 Total 199 210 203 Women Professional/Managerial & Admin. work 295 250 290 Clerk/Supervisor/Accountant 340 360 344 Sales/Business 300 200 267 Cultivator 197 218 212 Manual labour 169 159 166 Caste Occupation 110 0 110 Animal Husbandry 276 291 283 Others 0 0 0 Total 260 266 262
As far as secondary occupation is concerned the male workers are spending 100-115
days and female are spending 53-64 days in both religious groups (see Table 4.27).
Table 4.27 Per worker person days employment in secondary education
Secondary Occupation Hindu Muslim Total Men Professional/Managerial and administrative work 75 0 38 Clerk/Supervisor/Accountant 100 0 100 Sales/Business 175 165 170 Cultivator 108 107 108 Manual labour 107 129 114 Caste Occupation 113 55 90 Animal Husbandry 121 127 123 Others 0 110 110 Total 100 115 107
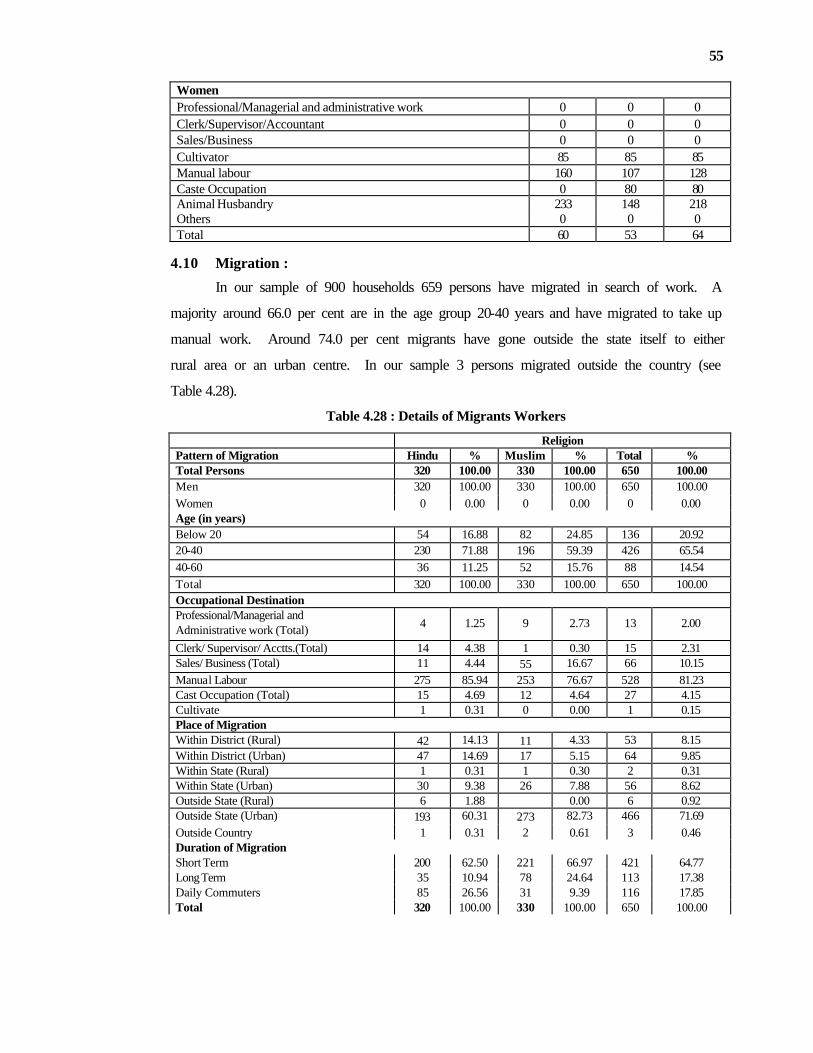
55
Women Professional/Managerial and administrative work 0 0 0 Clerk/Supervisor/Accountant 0 0 0 Sales/Business 0 0 0 Cultivator 85 85 85 Manual labour 160 107 128 Caste Occupation 0 80 80 Animal Husbandry 233 148 218 Others 0 0 0 Total 60 53 64
4.10 Migration :
In our sample of 900 households 659 persons have migrated in search of work. A
majority around 66.0 per cent are in the age group 20-40 years and have migrated to take up
manual work. Around 74.0 per cent migrants have gone outside the state itself to either
rural area or an urban centre. In our sample 3 persons migrated outside the country (see
Table 4.28).
Table 4.28 : Details of Migrants Workers
Religion Pattern of Migration Hindu % Muslim % Total % Total Persons 320 100.00 330 100.00 650 100.00 Men 320 100.00 330 100.00 650 100.00 Women 0 0.00 0 0.00 0 0.00 Age (in years) Below 20 54 16.88 82 24.85 136 20.92 20-40 230 71.88 196 59.39 426 65.54 40-60 36 11.25 52 15.76 88 14.54 Total 320 100.00 330 100.00 650 100.00 Occupational Destination Professional/Managerial and Administrative work (Total) 4 1.25 9 2.73 13 2.00
Clerk/ Supervisor/ Acctts.(Total) 14 4.38 1 0.30 15 2.31 Sales/ Business (Total) 11 4.44 55 16.67 66 10.15 Manual Labour 275 85.94 253 76.67 528 81.23 Cast Occupation (Total) 15 4.69 12 4.64 27 4.15 Cultivate 1 0.31 0 0.00 1 0.15 Place of Migration Within District (Rural) 42 14.13 11 4.33 53 8.15 Within District (Urban) 47 14.69 17 5.15 64 9.85 Within State (Rural) 1 0.31 1 0.30 2 0.31 Within State (Urban) 30 9.38 26 7.88 56 8.62 Outside State (Rural) 6 1.88 0.00 6 0.92 Outside State (Urban) 193 60.31 273 82.73 466 71.69 Outside Country 1 0.31 2 0.61 3 0.46 Duration of Migration Short Term 200 62.50 221 66.97 421 64.77 Long Term 35 10.94 78 24.64 113 17.38 Daily Commuters 85 26.56 31 9.39 116 17.85 Total 320 100.00 330 100.00 650 100.00

56
4.11 Indebtedness Among Households :
People keep requiring loan for various productive and unproductive purposes. The
incidence of loan becomes higher among households who have lower income level. Among
Hindus and Muslims community indebted households were around 35.0 per cent and around
36.0 per cent respectively. When we look average loan outstanding among both religious
groups it was found that highest amount of loan is outstanding (Rs.4445) in Hindu
households while in the case of Muslim this amount was only Rs.3234 (Table 4.29).
Table 4.29: Distribution of households by amount of loan
Religion Amount of loan outstanding (000 Rs) Hindu % Muslim % Total % Below 15 148 76.68 112 88.19 260 81.25 15-30 35 18.13 10 7.87 45 14.06 30-45 2 1.04 3 2.36 5 1.56 45-60 4 2.07 0 0.00 4 1.25 60-75 1 0.52 0 0.00 1 0.31 75-90 0 0.00 0 0.00 0 0.00 90 and above 3 1.55 2 1.57 5 1.56 Total H.H. 193 100.00 127 100.00 320 100.00 Per Household 4445 3234 3975
Table 4.30 provides an insight into the various factors, which compelled households
to take loan and also the source through which the loans were procured. The important
reasons taking loan in our sample household were consumption, agriculture, health, festival
or social ceremonies etc. Among Hindus and Muslims the signal most important reasons
for taking loan in our sample households is to meet the consumption expenditure and
around 32.0 per cent Hindus and 36.0 per cent Muslims indebted households have borrowed
money for this purpose. The next in importance is for agriculture purposes. These loans
have been taken for purchasing various agricultural implements and machinery used in
agricultural operations. Commercial Banks, Gramin Banks, Co-operative Banks or Co-
operative Societies and SHG are institutional source of loan while trader, money lenders,
land lords and relatives were non-institutional sources of loan in our sample households
(Table 4.30). As a result of the cumbersome procedure involved in obtaining loan and
because loans are not granted by financial institutions for all purposes, the reliance on non-
institutional sources is seen much higher.
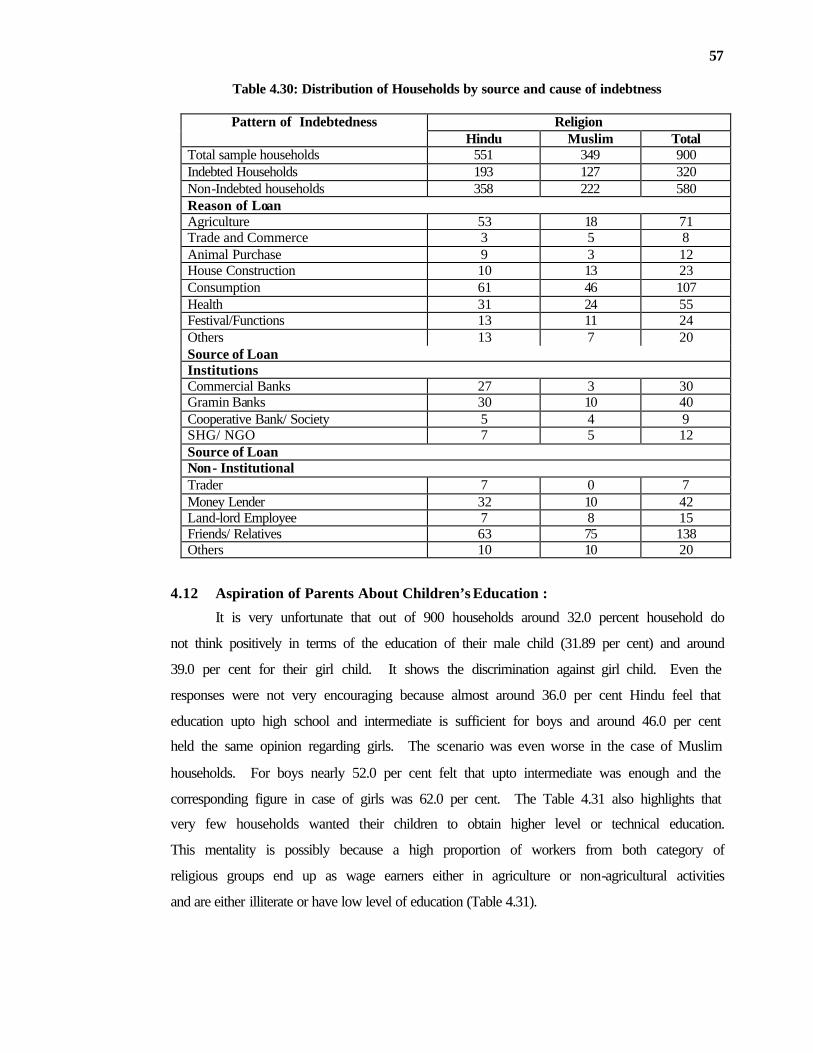
57
Table 4.30: Distribution of Households by source and cause of indebtness
Religion Pattern of Indebtedness Hindu Muslim Total
Total sample households 551 349 900 Indebted Households 193 127 320 Non-Indebted households 358 222 580 Reason of Loan Agriculture 53 18 71 Trade and Commerce 3 5 8 Animal Purchase 9 3 12 House Construction 10 13 23 Consumption 61 46 107 Health 31 24 55 Festival/Functions 13 11 24 Others 13 7 20 Source of Loan Institutions Commercial Banks 27 3 30 Gramin Banks 30 10 40 Cooperative Bank/ Society 5 4 9 SHG/ NGO 7 5 12 Source of Loan Non- Institutional Trader 7 0 7 Money Lender 32 10 42 Land-lord Employee 7 8 15 Friends/ Relatives 63 75 138 Others 10 10 20
4.12 Aspiration of Parents About Children’s Education :
It is very unfortunate that out of 900 households around 32.0 percent household do
not think positively in terms of the education of their male child (31.89 per cent) and around
39.0 per cent for their girl child. It shows the discrimination against girl child. Even the
responses were not very encouraging because almost around 36.0 per cent Hindu feel that
education upto high school and intermediate is sufficient for boys and around 46.0 per cent
held the same opinion regarding girls. The scenario was even worse in the case of Muslim
households. For boys nearly 52.0 per cent felt that upto intermediate was enough and the
corresponding figure in case of girls was 62.0 per cent. The Table 4.31 also highlights that
very few households wanted their children to obtain higher level or technical education.
This mentality is possibly because a high proportion of workers from both category of
religious groups end up as wage earners either in agriculture or non-agricultural activities
and are either illiterate or have low level of education (Table 4.31).
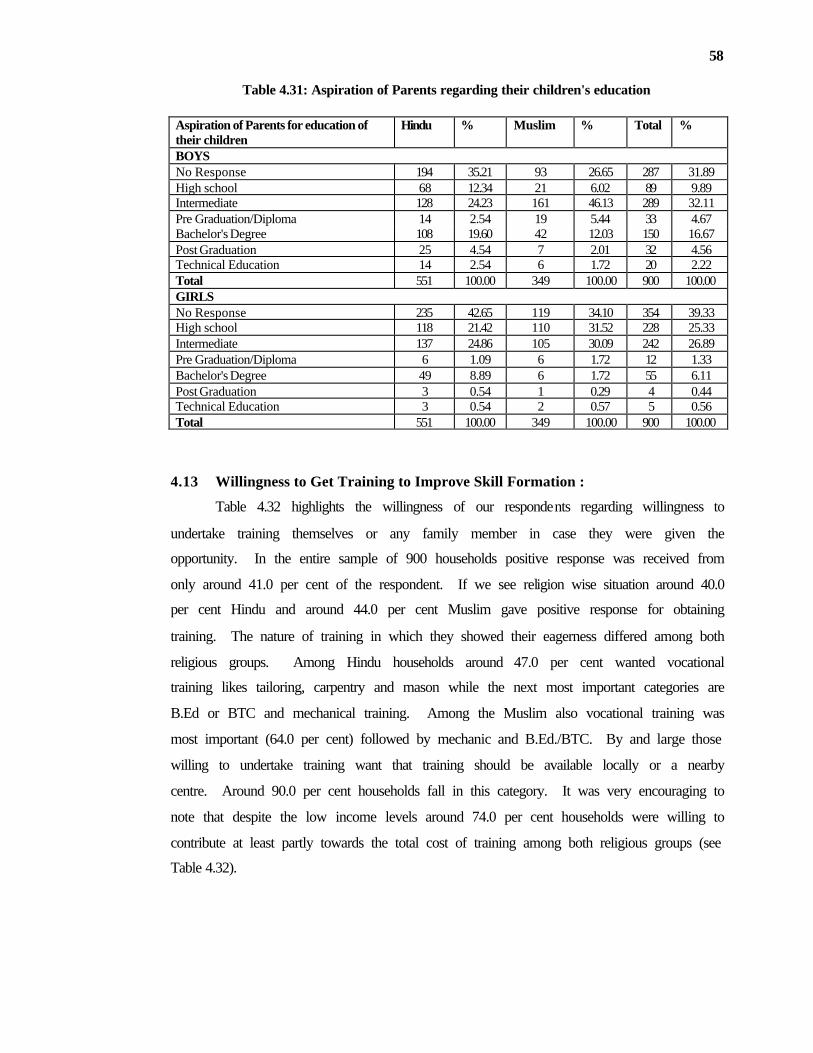
58
Table 4.31: Aspiration of Parents regarding their children's education
Aspiration of Parents for education of their children
Hindu % Muslim % Total %
BOYS No Response 194 35.21 93 26.65 287 31.89 High school 68 12.34 21 6.02 89 9.89 Intermediate 128 24.23 161 46.13 289 32.11 Pre Graduation/Diploma 14 2.54 19 5.44 33 4.67 Bachelor's Degree 108 19.60 42 12.03 150 16.67 Post Graduation 25 4.54 7 2.01 32 4.56 Technical Education 14 2.54 6 1.72 20 2.22 Total 551 100.00 349 100.00 900 100.00 GIRLS No Response 235 42.65 119 34.10 354 39.33 High school 118 21.42 110 31.52 228 25.33 Intermediate 137 24.86 105 30.09 242 26.89 Pre Graduation/Diploma 6 1.09 6 1.72 12 1.33 Bachelor's Degree 49 8.89 6 1.72 55 6.11 Post Graduation 3 0.54 1 0.29 4 0.44 Technical Education 3 0.54 2 0.57 5 0.56 Total 551 100.00 349 100.00 900 100.00
4.13 Willingness to Get Training to Improve Skill Formation :
Table 4.32 highlights the willingness of our respondents regarding willingness to
undertake training themselves or any family member in case they were given the
opportunity. In the entire sample of 900 households positive response was received from
only around 41.0 per cent of the respondent. If we see religion wise situation around 40.0
per cent Hindu and around 44.0 per cent Muslim gave positive response for obtaining
training. The nature of training in which they showed their eagerness differed among both
religious groups. Among Hindu households around 47.0 per cent wanted vocational
training likes tailoring, carpentry and mason while the next most important categories are
B.Ed or BTC and mechanical training. Among the Muslim also vocational training was
most important (64.0 per cent) followed by mechanic and B.Ed./BTC. By and large those
willing to undertake training want that training should be available locally or a nearby
centre. Around 90.0 per cent households fall in this category. It was very encouraging to
note that despite the low income levels around 74.0 per cent households were willing to
contribute at least partly towards the total cost of training among both religious groups (see
Table 4.32).
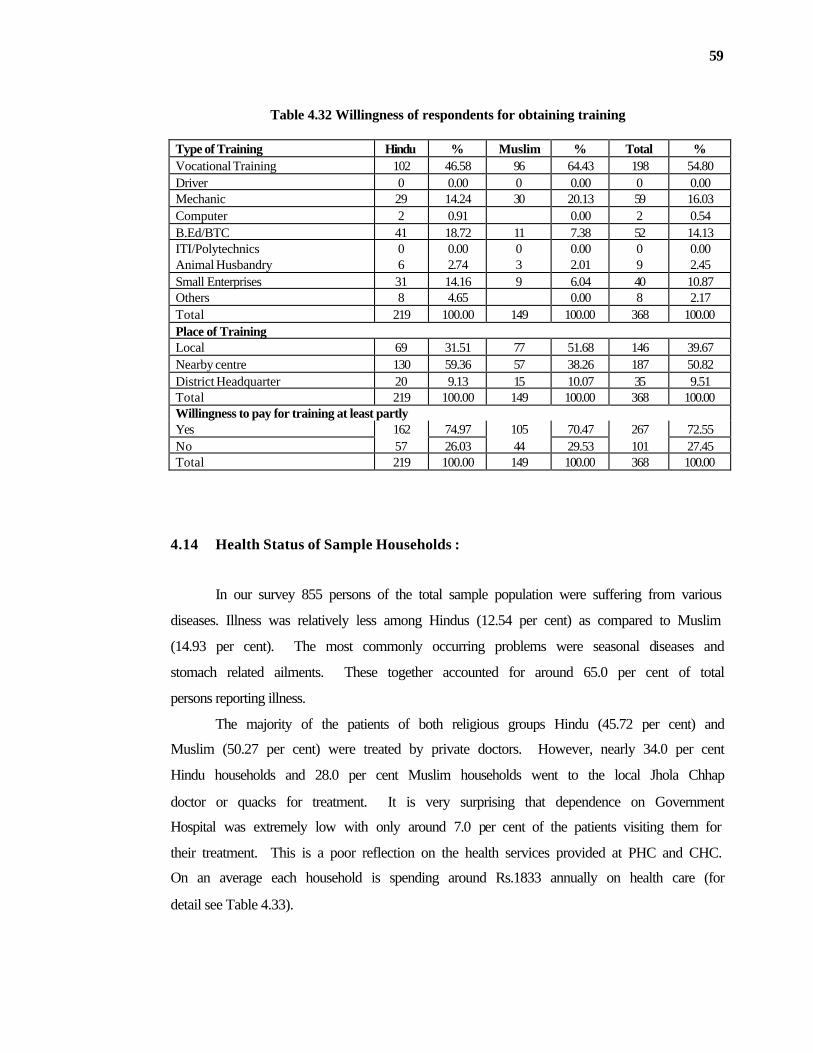
59
Table 4.32 Willingness of respondents for obtaining training
Type of Training Hindu % Muslim % Total % Vocational Training 102 46.58 96 64.43 198 54.80 Driver 0 0.00 0 0.00 0 0.00 Mechanic 29 14.24 30 20.13 59 16.03 Computer 2 0.91 0.00 2 0.54 B.Ed/BTC 41 18.72 11 7.38 52 14.13 ITI/Polytechnics 0 0.00 0 0.00 0 0.00 Animal Husbandry 6 2.74 3 2.01 9 2.45 Small Enterprises 31 14.16 9 6.04 40 10.87 Others 8 4.65 0.00 8 2.17 Total 219 100.00 149 100.00 368 100.00 Place of Training Local 69 31.51 77 51.68 146 39.67 Nearby centre 130 59.36 57 38.26 187 50.82 District Headquarter 20 9.13 15 10.07 35 9.51 Total 219 100.00 149 100.00 368 100.00 Willingness to pay for training at least partly Yes 162 74.97 105 70.47 267 72.55 No 57 26.03 44 29.53 101 27.45 Total 219 100.00 149 100.00 368 100.00
4.14 Health Status of Sample Households :
In our survey 855 persons of the total sample population were suffering from various
diseases. Illness was relatively less among Hindus (12.54 per cent) as compared to Muslim
(14.93 per cent). The most commonly occurring problems were seasonal diseases and
stomach related ailments. These together accounted for around 65.0 per cent of total
persons reporting illness.
The majority of the patients of both religious groups Hindu (45.72 per cent) and
Muslim (50.27 per cent) were treated by private doctors. However, nearly 34.0 per cent
Hindu households and 28.0 per cent Muslim households went to the local Jhola Chhap
doctor or quacks for treatment. It is very surprising that dependence on Government
Hospital was extremely low with only around 7.0 per cent of the patients visiting them for
their treatment. This is a poor reflection on the health services provided at PHC and CHC.
On an average each household is spending around Rs.1833 annually on health care (for
detail see Table 4.33).
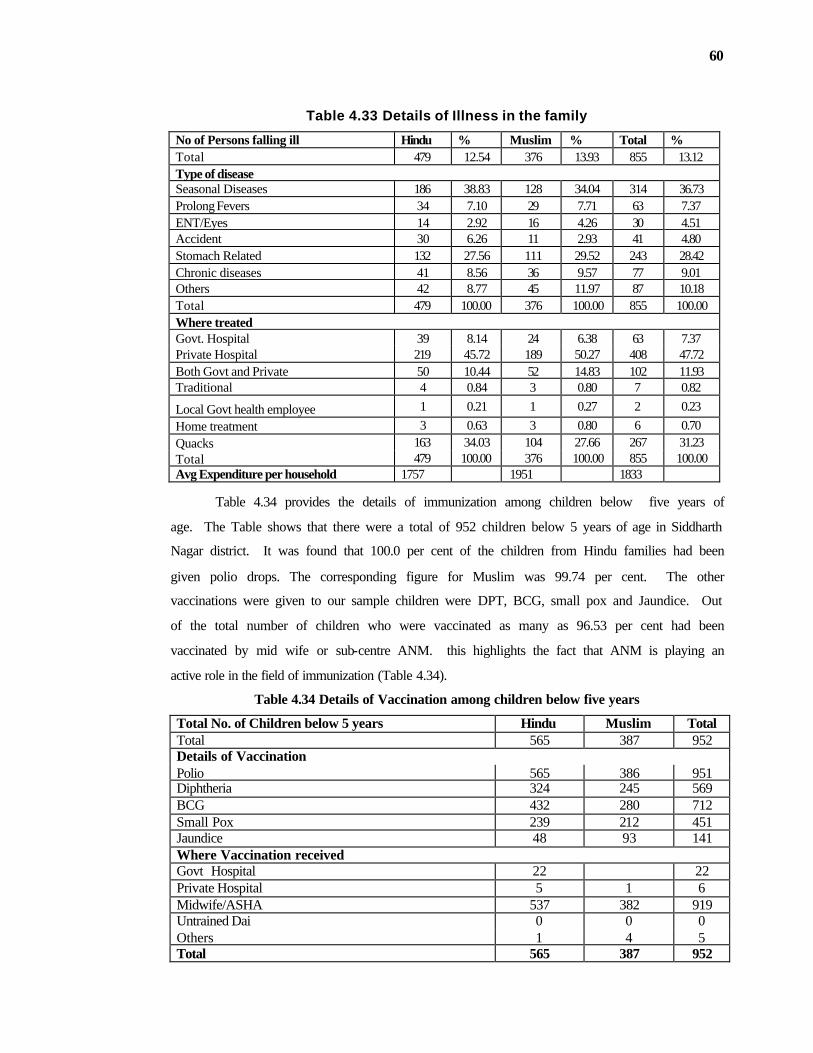
60
Table 4.33 Details of Illness in the family
No of Persons falling ill Hindu % Muslim % Total % Total 479 12.54 376 13.93 855 13.12 Type of disease Seasonal Diseases 186 38.83 128 34.04 314 36.73 Prolong Fevers 34 7.10 29 7.71 63 7.37 ENT/Eyes 14 2.92 16 4.26 30 4.51 Accident 30 6.26 11 2.93 41 4.80 Stomach Related 132 27.56 111 29.52 243 28.42 Chronic diseases 41 8.56 36 9.57 77 9.01 Others 42 8.77 45 11.97 87 10.18 Total 479 100.00 376 100.00 855 100.00 Where treated Govt. Hospital 39 8.14 24 6.38 63 7.37 Private Hospital 219 45.72 189 50.27 408 47.72 Both Govt and Private 50 10.44 52 14.83 102 11.93 Traditional 4 0.84 3 0.80 7 0.82
Local Govt health employee 1 0.21 1 0.27 2 0.23
Home treatment 3 0.63 3 0.80 6 0.70 Quacks 163 34.03 104 27.66 267 31.23 Total 479 100.00 376 100.00 855 100.00 Avg Expenditure per household 1757 1951 1833
Table 4.34 provides the details of immunization among children below five years of
age. The Table shows that there were a total of 952 children below 5 years of age in Siddharth
Nagar district. It was found that 100.0 per cent of the children from Hindu families had been
given polio drops. The corresponding figure for Muslim was 99.74 per cent. The other
vaccinations were given to our sample children were DPT, BCG, small pox and Jaundice. Out
of the total number of children who were vaccinated as many as 96.53 per cent had been
vaccinated by mid wife or sub-centre ANM. this highlights the fact that ANM is playing an
active role in the field of immunization (Table 4.34).
Table 4.34 Details of Vaccination among children below five years
Total No. of Children below 5 years Hindu Muslim Total Total 565 387 952 Details of Vaccination Polio 565 386 951 Diphtheria 324 245 569 BCG 432 280 712 Small Pox 239 212 451 Jaundice 48 93 141 Where Vaccination received Govt Hospital 22 22 Private Hospital 5 1 6 Midwife/ASHA 537 382 919 Untrained Dai 0 0 0 Others 1 4 5 Total 565 387 952

61
4.15 Assessment of the Pubic Distribution System :
Out of total 900 sample households around 69.0 per cent have declared that they fall in
the below poverty line (BPL) category. The Hindu households were maximum (around 71.0 per
cent) in BPL category while around 66.0 per cent Muslims families found in BPL category.
Despite being in BPL category not every households has been able to obtain a BPL ration card.
Among Hindus only around 64.0 per cent BPL families has BPL ration card while in the case of
Muslims this percentage is around 87.0 per cent. Even among families above poverty line all do
not have a normal ration card.
On the whole therefore around 89.0 per cent families are able to obtain ration card and
around 85.0 per cent families are availing their rations from the fair price shop. Those
households who were not able to receive their share of ration from fair price shop reported
various problems like lack of money, lack of supply of ration and discrimination by trader.
further a majority of ration card holders reported that the owner of fair price shops does not give
ration on time and other problem faced by ration card holders are insufficient quantity and bad
quality of ration and the owner of fair rice shop cheat them while weighing rations.
Table 4.35 Details related to availability of food items through PDS
Are you in BPL Category Hindu Muslim Total Yes 392 230 622 No 159 119 278 Total 551 349 900 Do you have BPL Card Yes 245 150 395 No 306 199 197 Total 551 349 900 Do you get ration from PDS Yes 476 321 797 No 75 28 103 Total 551 349 900 Problems faced in PDS Insufficient Quantity 32 26 58 Bad Quality 2 8 10 Less Weight 25 31 56 No availability in time 169 101 270 Others 89 30 119 Are you capable of getting your share Yes 412 268 680 No 139 81 220 If No, than reasons Lack of Money 36 39 75 Lack of Supply in PDS 40 30 70 Discrimination by PDS Trader 30 24 54 Others 37 8 45
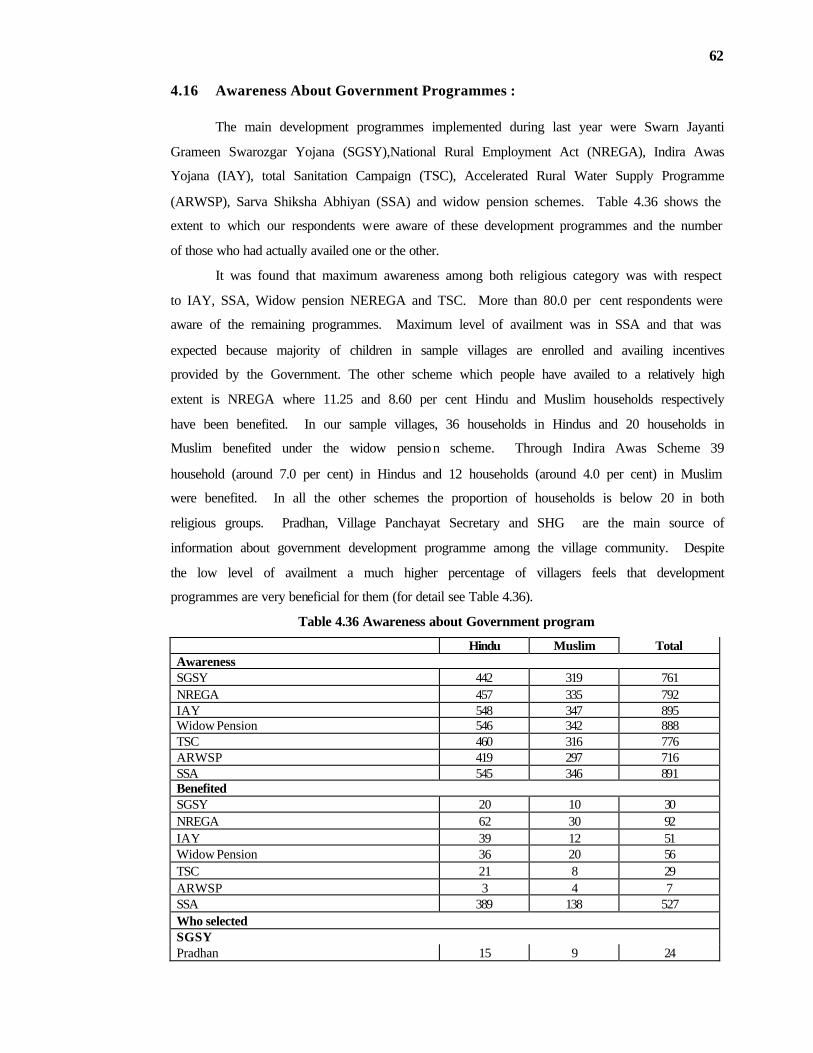
62
4.16 Awareness About Government Programmes :
The main development programmes implemented during last year were Swarn Jayanti
Grameen Swarozgar Yojana (SGSY),National Rural Employment Act (NREGA), Indira Awas
Yojana (IAY), total Sanitation Campaign (TSC), Accelerated Rural Water Supply Programme
(ARWSP), Sarva Shiksha Abhiyan (SSA) and widow pension schemes. Table 4.36 shows the
extent to which our respondents were aware of these development programmes and the number
of those who had actually availed one or the other.
It was found that maximum awareness among both religious category was with respect
to IAY, SSA, Widow pension NEREGA and TSC. More than 80.0 per cent respondents were
aware of the remaining programmes. Maximum level of availment was in SSA and that was
expected because majority of children in sample villages are enrolled and availing incentives
provided by the Government. The other scheme which people have availed to a relatively high
extent is NREGA where 11.25 and 8.60 per cent Hindu and Muslim households respectively
have been benefited. In our sample villages, 36 households in Hindus and 20 households in
Muslim benefited under the widow pension scheme. Through Indira Awas Scheme 39
household (around 7.0 per cent) in Hindus and 12 households (around 4.0 per cent) in Muslim
were benefited. In all the other schemes the proportion of households is below 20 in both
religious groups. Pradhan, Village Panchayat Secretary and SHG are the main source of
information about government development programme among the village community. Despite
the low level of availment a much higher percentage of villagers feels that development
programmes are very beneficial for them (for detail see Table 4.36).
Table 4.36 Awareness about Government program
Hindu Muslim Total Awareness SGSY 442 319 761 NREGA 457 335 792 IAY 548 347 895 Widow Pension 546 342 888 TSC 460 316 776 ARWSP 419 297 716 SSA 545 346 891 Benefited SGSY 20 10 30 NREGA 62 30 92 IAY 39 12 51 Widow Pension 36 20 56 TSC 21 8 29 ARWSP 3 4 7 SSA 389 138 527 Who selected SGSY Pradhan 15 9 24
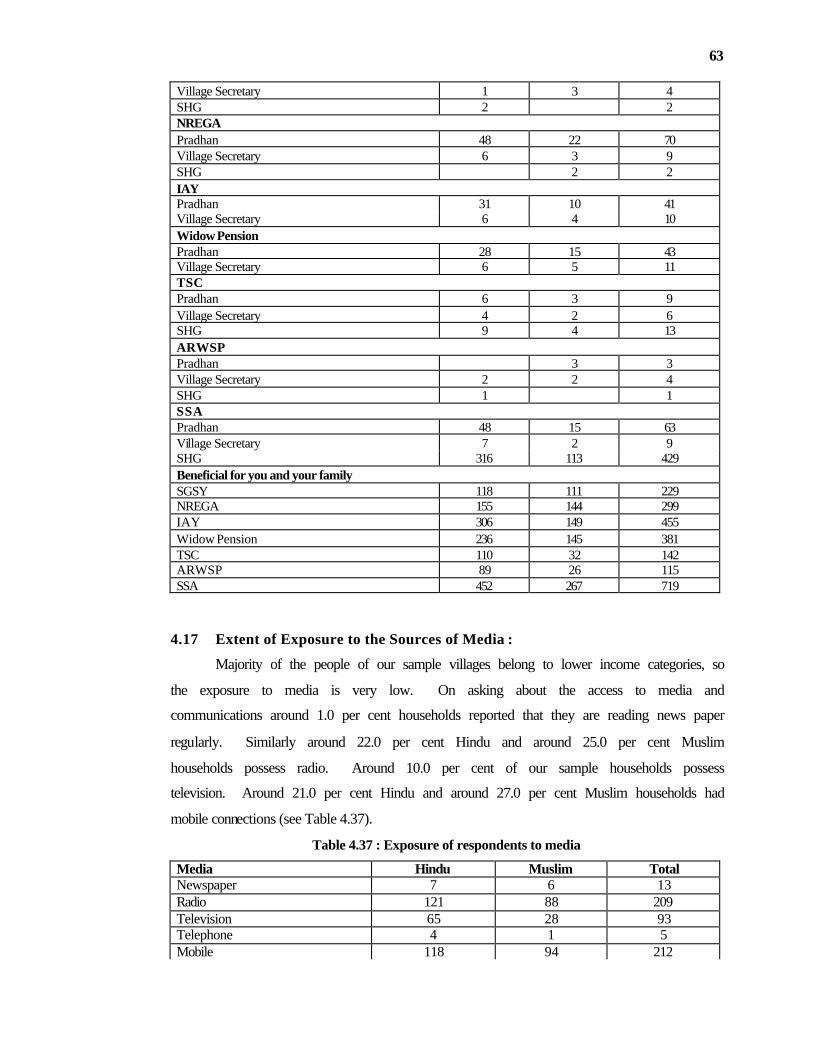
63
Village Secretary 1 3 4 SHG 2 2 NREGA Pradhan 48 22 70 Village Secretary 6 3 9 SHG 2 2 IAY Pradhan 31 10 41 Village Secretary 6 4 10 Widow Pension Pradhan 28 15 43 Village Secretary 6 5 11 TSC Pradhan 6 3 9 Village Secretary 4 2 6 SHG 9 4 13 ARWSP Pradhan 3 3 Village Secretary 2 2 4 SHG 1 1 SSA Pradhan 48 15 63 Village Secretary 7 2 9 SHG 316 113 429 Beneficial for you and your family SGSY 118 111 229 NREGA 155 144 299 IAY 306 149 455 Widow Pension 236 145 381 TSC 110 32 142 ARWSP 89 26 115 SSA 452 267 719
4.17 Extent of Exposure to the Sources of Media :
Majority of the people of our sample villages belong to lower income categories, so
the exposure to media is very low. On asking about the access to media and
communications around 1.0 per cent households reported that they are reading news paper
regularly. Similarly around 22.0 per cent Hindu and around 25.0 per cent Muslim
households possess radio. Around 10.0 per cent of our sample households possess
television. Around 21.0 per cent Hindu and around 27.0 per cent Muslim households had
mobile connections (see Table 4.37).
Table 4.37 : Exposure of respondents to media
Media Hindu Muslim Total Newspaper 7 6 13 Radio 121 88 209 Television 65 28 93 Telephone 4 1 5 Mobile 118 94 212
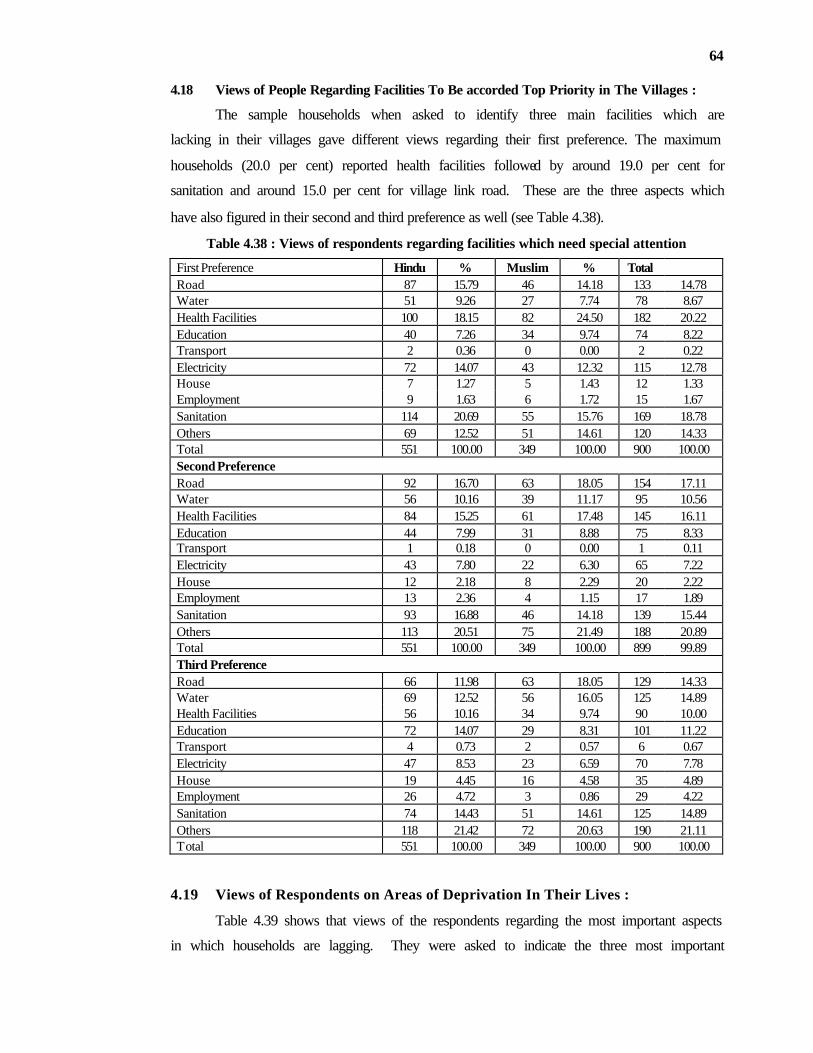
64
4.18 Views of People Regarding Facilities To Be accorded Top Priority in The Villages :
The sample households when asked to identify three main facilities which are
lacking in their villages gave different views regarding their first preference. The maximum
households (20.0 per cent) reported health facilities followed by around 19.0 per cent for
sanitation and around 15.0 per cent for village link road. These are the three aspects which
have also figured in their second and third preference as well (see Table 4.38).
Table 4.38 : Views of respondents regarding facilities which need special attention
First Preference Hindu % Muslim % Total Road 87 15.79 46 14.18 133 14.78 Water 51 9.26 27 7.74 78 8.67 Health Facilities 100 18.15 82 24.50 182 20.22 Education 40 7.26 34 9.74 74 8.22 Transport 2 0.36 0 0.00 2 0.22 Electricity 72 14.07 43 12.32 115 12.78 House 7 1.27 5 1.43 12 1.33 Employment 9 1.63 6 1.72 15 1.67 Sanitation 114 20.69 55 15.76 169 18.78 Others 69 12.52 51 14.61 120 14.33 Total 551 100.00 349 100.00 900 100.00 Second Preference Road 92 16.70 63 18.05 154 17.11 Water 56 10.16 39 11.17 95 10.56 Health Facilities 84 15.25 61 17.48 145 16.11 Education 44 7.99 31 8.88 75 8.33 Transport 1 0.18 0 0.00 1 0.11 Electricity 43 7.80 22 6.30 65 7.22 House 12 2.18 8 2.29 20 2.22 Employment 13 2.36 4 1.15 17 1.89 Sanitation 93 16.88 46 14.18 139 15.44 Others 113 20.51 75 21.49 188 20.89 Total 551 100.00 349 100.00 899 99.89 Third Preference Road 66 11.98 63 18.05 129 14.33 Water 69 12.52 56 16.05 125 14.89 Health Facilities 56 10.16 34 9.74 90 10.00 Education 72 14.07 29 8.31 101 11.22 Transport 4 0.73 2 0.57 6 0.67 Electricity 47 8.53 23 6.59 70 7.78 House 19 4.45 16 4.58 35 4.89 Employment 26 4.72 3 0.86 29 4.22 Sanitation 74 14.43 51 14.61 125 14.89 Others 118 21.42 72 20.63 190 21.11 Total 551 100.00 349 100.00 900 100.00
4.19 Views of Respondents on Areas of Deprivation In Their Lives :
Table 4.39 shows that views of the respondents regarding the most important aspects
in which households are lagging. They were asked to indicate the three most important
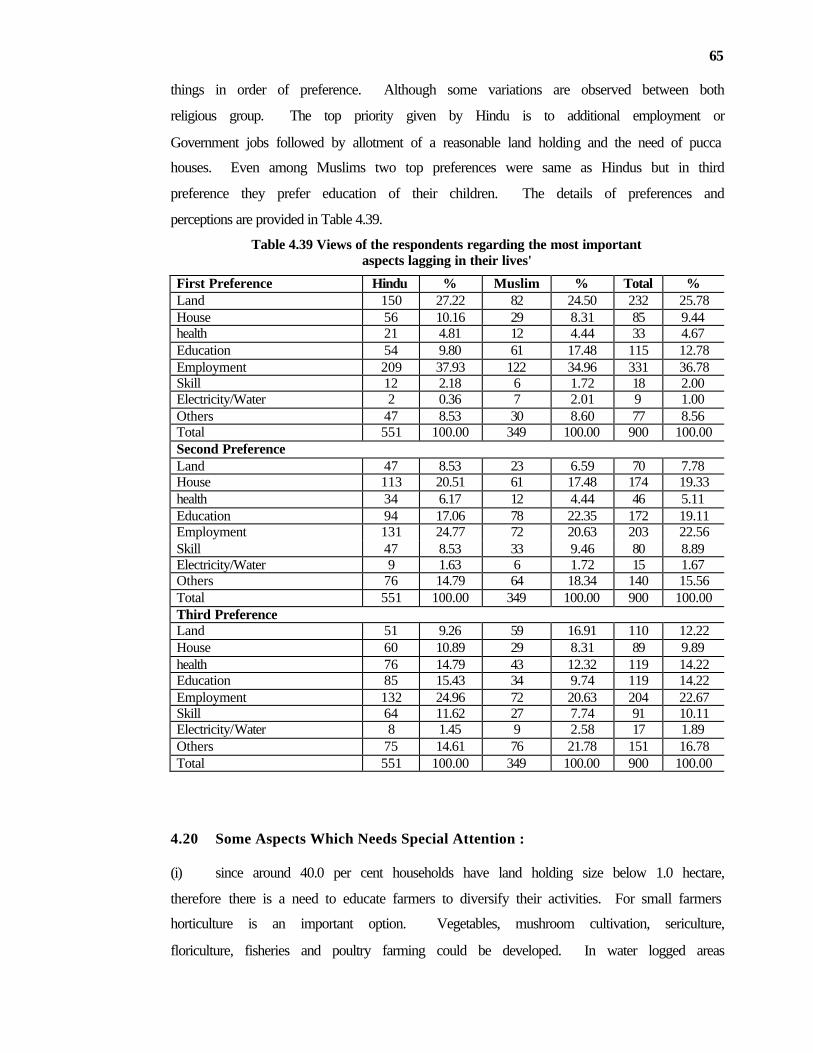
65
things in order of preference. Although some variations are observed between both
religious group. The top priority given by Hindu is to additional employment or
Government jobs followed by allotment of a reasonable land holding and the need of pucca
houses. Even among Muslims two top preferences were same as Hindus but in third
preference they prefer education of their children. The details of preferences and
perceptions are provided in Table 4.39.
Table 4.39 Views of the respondents regarding the most important aspects lagging in their lives'
First Preference Hindu % Muslim % Total % Land 150 27.22 82 24.50 232 25.78 House 56 10.16 29 8.31 85 9.44 health 21 4.81 12 4.44 33 4.67 Education 54 9.80 61 17.48 115 12.78 Employment 209 37.93 122 34.96 331 36.78 Skill 12 2.18 6 1.72 18 2.00 Electricity/Water 2 0.36 7 2.01 9 1.00 Others 47 8.53 30 8.60 77 8.56 Total 551 100.00 349 100.00 900 100.00 Second Preference Land 47 8.53 23 6.59 70 7.78 House 113 20.51 61 17.48 174 19.33 health 34 6.17 12 4.44 46 5.11 Education 94 17.06 78 22.35 172 19.11 Employment 131 24.77 72 20.63 203 22.56 Skill 47 8.53 33 9.46 80 8.89 Electricity/Water 9 1.63 6 1.72 15 1.67 Others 76 14.79 64 18.34 140 15.56 Total 551 100.00 349 100.00 900 100.00 Third Preference Land 51 9.26 59 16.91 110 12.22 House 60 10.89 29 8.31 89 9.89 health 76 14.79 43 12.32 119 14.22 Education 85 15.43 34 9.74 119 14.22 Employment 132 24.96 72 20.63 204 22.67 Skill 64 11.62 27 7.74 91 10.11 Electricity/Water 8 1.45 9 2.58 17 1.89 Others 75 14.61 76 21.78 151 16.78 Total 551 100.00 349 100.00 900 100.00
4.20 Some Aspects Which Needs Special Attention :
(i) since around 40.0 per cent households have land holding size below 1.0 hectare,
therefore there is a need to educate farmers to diversify their activities. For small farmers
horticulture is an important option. Vegetables, mushroom cultivation, sericulture,
floriculture, fisheries and poultry farming could be developed. In water logged areas
66
Makhana and Singara cultivation through co-operative farming can generate income and
employment to rural farmers. In case of households having medium or large holding size
there is a great potential of growing traditional paddy crop known as Kala Namak. The
state Government already has departments to look after these activities. It only needs an
extra effort to motivate people to take up these activities seriously on a commercial basis.
(ii) It is well known fact that the level of literacy in Siddharth Nagar is very low.
Around 35.0 per cent of the total sample were found illiterate among all sample
households and only around 44.0 per cent had received education beyond high school. The
percentage of Hindu household is 40.85 per cent and among Muslim 47.87 percentage
family members come in this category. Although the enrolment levels in the school going
age group is very high it should be ensured they attend school regularly and study properly.
Unfortunately the aspirations among the parents about the education of their children is
upto graduation. For the awareness to parents some honest NGO’s should be identified who
can spread out greater awareness among them.
(iii) In our sample villages around 34.0 per cent Hindus and around 28.0 per cent Muslim
households went to Jhola Chhap doctors or quacks for their treatment. It shows the number
of sub-centres, PHCs and CHCs are, much below the prescribed norms. Rural people are
not getting proper medical attention in the Government hospitals so they are forced to be
dependent on private practitioner. Consequently the annual per household expenditure on
medical health care is around 6.0 per cent of their total household expenditure. As the
income level is low a sizeable member of households are indebted to meet their medical
requirements. Therefore it should be the top priority of Government Machinery that PHCs
and CHCs should be properly managed with all facilities. Medicine and doctors should be
available all the year round in general and specially during the period when seasonal
ailments are common. In this connection it is also important to ensure proper drainage
facilities in the villages.
(iv) In our sample villages around 54.0 per cent of respondents desire to take vocational
training. It is therefore, important that the Government should take appropriate action and
set up training centers at convenient locations to ensure that those willing may be able to
undergo short or medium duration training courses as may be the need of individuals or a
specific training programme. The public private partnership (PPP) may be useful in this
direction but the training fee should be minimum or subsidized by the Government because
rural people belong to disadvantaged group.
67
(v) In the case of Siddharth Nagar the road net work is not properly developed while the
proper road connectivity facilitates the movement of goods and services and this is lacking
in the district.
(vi) The irregular power supply is yet another aspect which has been pointed out. This is
one of the reasons why people are reluctant to take electrical connection whether it is for
domestic, agricultural or commercial purposes. Only a few hours of power supply is
insufficient to meet the requirement of the people. The problem becomes even more acute
considering the fact that most of the time power supply is not available at the time when it is
needed the most.
(vii) Although villagers are aware about various development programmes implemented
by different departments of Government the selection of beneficiaries should be done
carefully so that they are availed by the needy persons only.
(viii) The problem related to public distribution system whether issuing BPL cards or
timely adequate and good quality of ration needs to be streamlined.
(ix) For undertaking various economic activities villagers are unable to obtain loan easily
at reasonable rate of interest from the financial institutions. They are therefore forced to
procure loan from the village money lenders or other sources at very high rate of interest.
(IV) Secondary level data about the villages regarding population and occupational
activities of minority groups are not available neither with block or with district minority
welfare department. It is very essential to maintain data bank at village, block and district
level so that proper planning can be done for minority as well as the area as a whole.
These are some of the aspects which need to be addressed while preparing a plan of
development for the district. As we found that Muslim emerged as a disadvantage group in
terms of value of land, value of livestock, higher education, high percentage of indebtedness
and mostly are engaged as manual labourers. It is essential that minority welfare
department should come up with new schemes to improve their socio-economic conditions.
It should be ensured that the on going programmes be implemented in right earnest. To do
this it is first of all it is essential to strengthen the infrastructure of the minority welfare
department itself. At present it suffers from a lack of staff, office rooms and other facility in
the district.
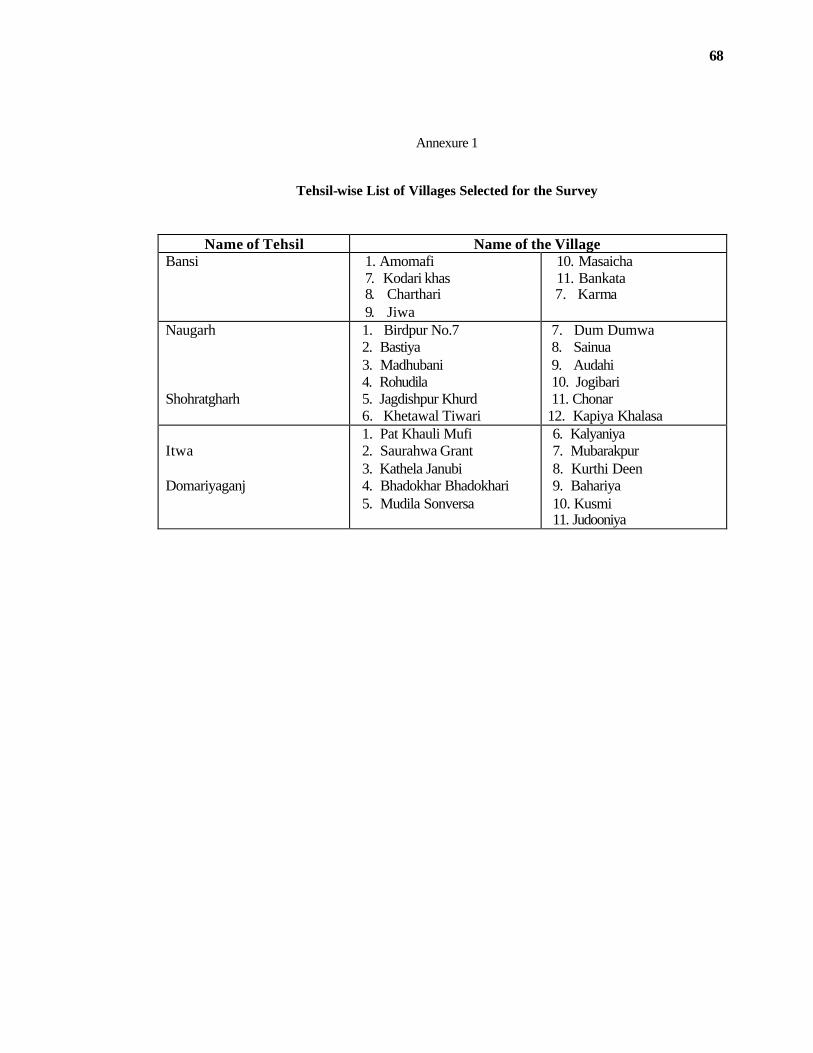
68
Annexure 1
Tehsil-wise List of Villages Selected for the Survey
Name of Tehsil Name of the Village Bansi 1. Amomafi
7. Kodari khas 8. Charthari 9. Jiwa
10. Masaicha 11. Bankata
7. Karma
Naugarh Shohratgharh
1. Birdpur No.7 2. Bastiya 3. Madhubani 4. Rohudila 5. Jagdishpur Khurd 6. Khetawal Tiwari
7. Dum Dumwa 8. Sainua 9. Audahi 10. Jogibari 11. Chonar
12. Kapiya Khalasa Itwa Domariyaganj
1. Pat Khauli Mufi 2. Saurahwa Grant 3. Kathela Janubi 4. Bhadokhar Bhadokhari 5. Mudila Sonversa
6. Kalyaniya 7. Mubarakpur 8. Kurthi Deen 9. Bahariya 10. Kusmi 11. Judooniya
Related Documents