CENSUS OF INDIA 1971 SERIES 6-HARYANA DISTRICT CENSUS HANDBOOK PART X-C DISTRICT CENSUS TABLES, TABLES ON VILLAGE DIRECTORY AND PRIMARY CENSUS ABSTRACT ADMINISTRATIVE, WELFARE AND DEVELOPMENTAL STATISTICS GURQAON DISTRICT ARDAMAN SINGH Deputy Director of Census Operations, Haryana Published by the Government of Haryana 1978

Welcome message from author
This document is posted to help you gain knowledge. Please leave a comment to let me know what you think about it! Share it to your friends and learn new things together.
Transcript
CENSUS OF INDIA 1971
SERIES 6-HARYANA
DISTRICT CENSUS HANDBOOK
PART X-C DISTRICT CENSUS TABLES,
TABLES ON VILLAGE DIRECTORY AND PRIMARY CENSUS ABSTRACT D!~
ADMINISTRATIVE, WELFARE AND DEVELOPMENTAL STATISTICS
GURQAON DISTRICT
ARDAMAN SINGH Deputy Director of Census Operations,
Haryana
Published by the Government of Haryana 1978
Part I-A
Part I-B
Part I-C Part lI-A
Part II-A Supplement
Part II-B
Part II·C(i)
Part U.C(ii)
Part II-D
Part IlI-A
Part lII-B
Part IX-A
Part X
CENSUS OF INDIA 197i
A-CE~r.RAL GOVERNMENf PUBLICATIONS
The p.lblication'> relating to Haryanl bJlr SJries N). 6,ani are bound separately as follows;-
· . Gen'!ral R'!port
· . General Report
· . Subsidiary Tables General Population Tables
Part IV
Part V-A
Part V-B
· . General Population Tables (Standard Urban Areas) . Part VI-A
., Economic 1 abies Part VI-B
· . Social and Cultural Tables Part VI-O (Religion and Scheduled Castes)
., Social and Cultutal Tables and Part VIII-A . Fertility Tables
., Migration Tables Part VIlI.B
.. Establishment Report
.. Establishment Tables
· . Housing Report and Tables
· . Speciallables for Scheduled Oastes and Scheduled Tribes
.. Ethnographic Notes on Sche. duled Oastes and Scheduled Tribes
.. Town Directory
· . Special SUFvey Report on selected towns
. . Survey Reports on selected villages
. . Administration Report: Enumeration (forofficia:l use only)
Administration Report: Tabulation(for official use only)
.. Census Atlas
B-HARYANA GQVERNMENT PUBLICATIONS /
· . Administrative Atlas
.. District Census Handbook for each district in three parts
Part A-Village and Town Directory
Part B-Village and Townwise Primary Census Abstract
Part O-District Census Tables, Tables' on Village Directory and Primary Census Abstract Data, and Administrative, Welfare and Developmental Statistics
(Part A and B of the District Census Handbook for each District of Haryana State have been printed In one volume)
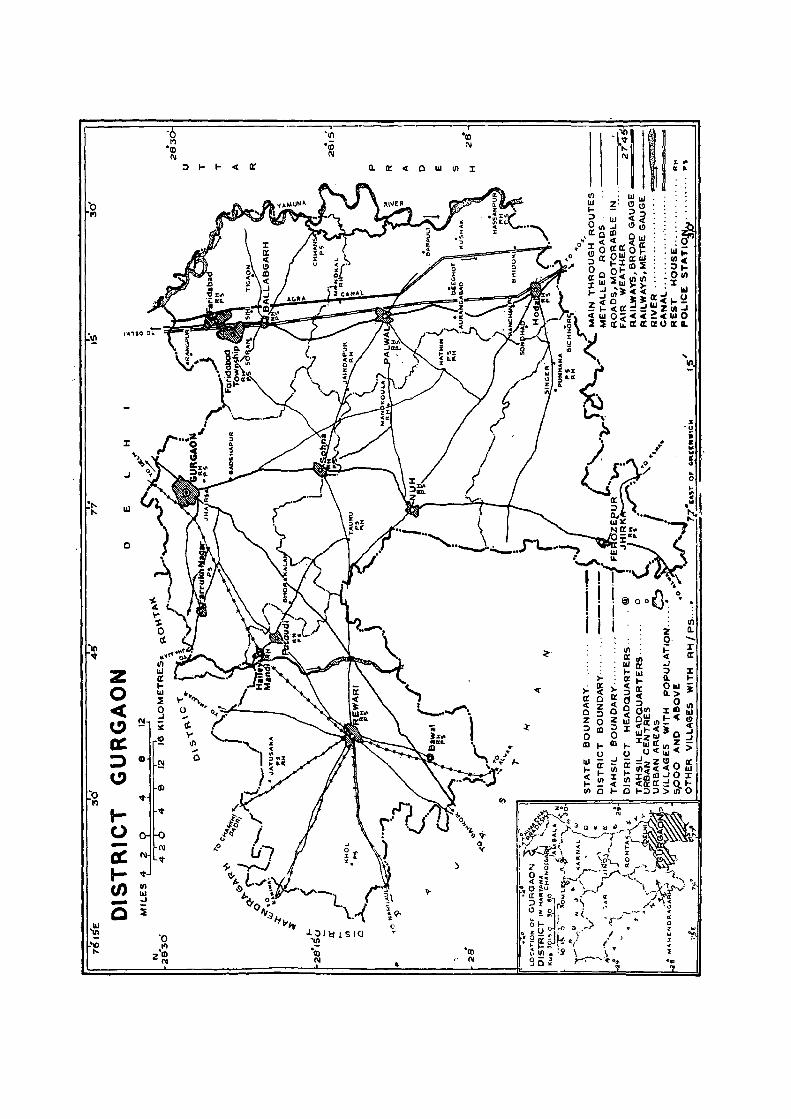
Note :-Boundaries of the district map are correct upto 1971
CONTENTS
Page Page
v Table B-VI PartoB(ii) .. 104-107 Preface Flyleaf to Table B-VII 109
Acknowledgements vi 1able B-VII 111
Figures at a glance vii Flyleaf to Table B-VllI 113
Table B~VIlI 114-115
PishictMap Facing
C-Series 111-141 page 1
Flyleaf to Table C-I Part·A 117
Introduction r-3 Table 0-1 Part-A! 118-119
""\ · Section-A-Ceosus Tables 5-~85 Flyleaf to 1able C-IlI 121
1able O-III Part-A .. 122-123 A·Series 11~30 Table C-Ill Part-B 124-125
Flyleaf to Table A-I 11 Flyleaf to Table C-V 127
Table A-I · 13 Table C-V Part-A(li) .. 128-131 , 1 able C-V Part-B(ii) 132
Sub-Appendix to Appendix-I · 14 Flyleaf to Table C-VII '133
Appendix-II to Table A-I 14 lable C-VII ., 134-135
Appendix-III to Table A-I 15 Fly leaf to 1 able C-VIII 137
Flyleaf to Table A-II ' 17 Table C-VIII ., 138-141
Table A~lI 19 D-Series .. 143-175
Appendix to Table A-II • 19 Flyleaf to Table D-I 143
Flyleaf to Table A-III 21 Table D-l .. 145-147
1 able A-III 22-23 Appendix.;I to Table D-I 148
Appendix to Table A-III 22-,-23 Appendix-II to Table D-I 149
Flyleaf to Table D-V 151 Flyleafto Table A-IV · 25 Table D-V 152-163
TabIcA-IV 27-29 Flyleaf to Table D-VI 165
Appendix~II to Table A-IV 30 labe D~VI · . 166,-;-175
B-Series .. 31-115 I E-Series 177~229
Flyleaf to Table B-1 Part-A 31
Table B-1 Part-~ 32-41 Flyleaf to Table E~I 177 , Flyleaf to Table B-II 43, Table E-I 179
lable B-Il 44-49 Flyleaf to Table E-I1 Part-A 181
Flyleaf to Table B-III Part~A 51 Table E-Il Part-A · . 182-185
Table B-Ill Part-A 52-53 Flyleaf to 1 able E-Il Part-B 187
Flyleaf to Table B-IV Part-A . 55 Table E-I1 Part-B · . 188-205
Table B-IV Part-A 57-63 Flyleaf to 1 able E-Il Part-C 207
Appendix to Table B-IV Part-A 64-69 ' Table E-I1 Part-C .. 209-216
Flyleaf to Table B-IV Part-D 71 Flyleaf to 1 able E-III 217
Table B-IV Part-D 73-75 Table E-Ill .. 218-221
Flyleaf to 'Table B-VI Part-A(i) 77 Flyleaf to Table E-IV 223
Table B-VI Part-A(i) 79-86 1able E·IV 224-229
Flyleaf to Table B-VI Part-A (ii) 87 H-Series
• J ~31-241
lable B-VI Part-A (Ii) 88~91 ..
Flyleaf to Table B"VI Part-B(i) 93 Flyleaf toTable H-I 231
lable B-VI Pa!!t B (i) 95-101 1.'able H~l 233
Flyleaf to Table B-Vl Part-B(ii) 103 Flyleaf to Tab Ie H.·II 235
CONTENTS-colleld.
Page Page
Table H-JI 237 lablc No.3 324
Appendix to lable H-II 238 Table No.' 4 325
Flyleaf to Table H-IlI 239 lable No.5 326
Table H-III · . 240-241 Table No.6 .'. 327
SCheduled Castes Tables 243-263 lable No.7 328
Flyleafto Table SO-I 243 Table No.8 329
Table SC-! Part-A 244-245 Table No.9 330
Table SO-I Part-B 246-247 Table No. 10 331
Flyleaf to Table 'sc-n '249 lable No. 11 .. 332-333
Table SC-I1 250-255 Table No. 12 334
· . lable No. 13 335 Flyleafto 1 able SO-III '257
Table SO-III Part-A 258-259 Table No. 14 336
· . Table No. 15 337 Table SC-III Part-B 2'60
Flyleaf to Table SO-IV 261 Table No. 16 338
. lable SO-IV 262-263 Table No. 1-7 339
Table No. 18 · . 340-341
Anncxures 265-285 Table No. 19 342
Table No. 20 · . 343-344 Annexure-I · . 265-266 Table 'No. 21 345 Annexure-II '267 . , 1able No. 22 347 Annexure-III · . 269-271 Table No. 23 348-349 Annexure-IV · . 272-285 Table No. 24 350-351
Section-B-Tables on Village Directory Table No. 25 352
and Primary Census Abstract data 287-307 Table No. 26 · . 353
· . Table No. 27 354
E'lyleaf to Section-B · . 289-290 Table No. 28 .. 355-356
Table No.1 291 Table No. 29 357
Table No.2 · . 292-293 Table No. 30 358
'fable No.3 ., 294-295 Table No. 31 359
Table No.4 · . 296-298 Table No. 32 360
Table No.5 · . 299-301 lable No. 33 361
lable No.6 .302 Table No. 34 · . 362-363
Table No.7 303 Table No. 35 -364
lable No.8 ,304 Table No. 36 365
Table No.9 305 Table No. 37 366
Table No. 10 · . 306-307 Table No. 38 367
Section~C-Administrative, Welfare and Table No. 39 368
Developmental Statistics Table No. 40 .369
· . 309-375 Table No. 41 369
Flyleaf to Scction-O 311 Table No. 42 ,370
List-A .. 313-314 Table No. 43 3'11
List-B 315 Table No. 44 372
Table No.1 .. 316-321 lable No. 45 373
Table No.2 323 Table No. 46 ., 374~375
PREFACE
District Census Handbook ha~ been introduced since 1951. The level of presentation in all-India volumes is State, District and City. In State volumes, this level goes down to tahsil level for some tables while in District Census Handbooks most of the tables give data down to tahsil and a few tables give data for each town and village also. The greatest advantage of District Census Handbook is that data on all topics are available in one volume while in all-India and State volumes only data of one topic are available in a volume. As District Census Handbooks gave non-Census and Census data up to the lowest level these were found very useful by the planners, administrators, election dep~rtments and research scholars, etc.
2. In 1951-Census, District Census Handbook besides presenting most of the Census tables at tahsil level gave primary Census data of village/block level and presented non-Census data' on a number of topics e.g. Health, Education, Administration, Agriculture, General Physiography, etc. This coverage was further enlarged by Dr. Asok Mitra, the then Registrar General, India and 1961-Census Handbook gave very useful· day-to-day information on non-Census data besides Census data.,
3. The 1951 and 1961-Census Handbook having been applauded by the research workers, administra tors and planners it was decided ,to further enlarge the scope of this handbook for 1971-Census Shri A. Chandra Sekhar; the then Registrar General, India and Dr. B. K. Roy Burman, Deputy Registrar General, .India (Social Studies) prepared draft guidelines for preparation of 1971-Census Handbooks. As per these guidelines District Census Handbooks were to appear in three parts details of which appear in introductory notes. This part i.e. Part-C of the Handbook was to contain detailed analysis and it was aimed to study whether it supported some anticipated hypothesis or the inference drawn from the analysis of the data went against the hypothesis. On account of inordinate delay in procurring non-Census data and processing of analytical tables, the idea of testing these hypothesis was dropped for all districts except Ambala. Detailed analysis could only be carried on for Ambala district which has been presented in District Census Handbook of that district. Those interested in this type of study can go through District Census Handbook of Ambala and if interested attempt detailed study of other districts. .
Dated Chandigarh, the 7th November, 1978.
(v)
ARDAMAN SINGH, Deputy Director of Census Operations,
Haryana, Chandigarh.
ACKNOWLEDGEMENTS
Collection, compilation and analysis of data appearing in this' volume is a result of hard labour put in by scores of officers of this office, all of whom deserve appreciation and thanks. While it is not possible to mention names of all these officers, names of those whose contribution is sIgnificant are given below in the form of credits. For non-Census data appearing in this volume, we are grateful to all concerned State and Central Government Departments who readily co-operated and spared no pains in furnishing the data, in desired formats.
2. I am extremely grateful to Shri A. Chandra Sekhar and Shri R. B. Chari, Ex-Registrar Genera~s, India and Shri P. Padmanabha, Registrar General, India, Dr. B. K. Roy Burman, Deputy Registrar General, India (Social Studies) and Shri K. K. Chakravorty, Assistant Registrar General, India (Census) for guidance and encouragement I received from them from time to time. The decision of Shri P. Padmanabha, Reg istrar General. India to bring out District Census Handbooks without complicated analysis helped us to bring out these 'handbooks quickly. We are grateful to Shri S. N. Chaturvedi, Deputy Director (Data Processing) for processing Census and non-Census data for a number of tables appearing in this volume and to Shri N. G. Nag, AS'sistant Registrar General, India (Social Studies) for getting scrutiny of draft completed at shortest possible time.
3. Shri K. C. Rajput, Controller of Printing and Stationery, Maryana, Shri P. Oommen, Deputy Controller and Shri Amir Chand, Assistant, Controller, Printing and Stationery Department, Union Territory, Chandigarh, deserve special thanks fClr arranging printing ofthese handbooks in shortest possible time.
INTRODUCTION AND FLYLEAVES
1. Shri J. R. Vashistha, Investigator 2. Shri K.. B. Lakhanpal, T.O. 3. Shri Koshy P. Zachariah, S.A.
CENSUS TABLES
1. Shri J. R. Vashistha, Investigator 2. Shri G. D. Singla, Investigator 3. Shri J. N. Suri, T.O. 4. Shri P. 'N. Modgil, T.O. 5. Shri Koshy P. Zachariah, S.A. 6. Shri A. 1. Kakkar, S.A. 7. Shri Jaswant Lal, S.A. 8. Miss Inder Mohan Kaur, S.A. 9. Shri Hari Krishan, Comp.
10. Miss Manju Rani, Compo '11. Shri Varinder Kumar, A.C .
ADMINISTRATIVE, WELFARE & DEVELOPMENTAL STATISTICS
1. Shri J. R. Vashistha, Investigator 2. Shri K. B. Lakhanpal, T.O.
CREDITS
3. Shri Koshy p .. Zachariah, S.A. 4. Shri O. P. Malik, S.A. 5. Mrs. S. P. Ratra, Comp. 6. Shri Nagesh Kumar, A.C. 7. Shri Karam Singh, A.C. 8. Shri Krishan La! Saini, A.C.
PROOF READING & PRINTING
1. Shri Daulat Ram, S. A. 2. Shri Koshy P. Zachariah, S.A. 3. Shri A. L. Kakkar, S.A. 4. Shri O.P. Malik, S.A. 5. Shri R. D. Verma, P.R. 6. Shri Sandeep Kumar, Comp. 7. Shri Sadhu Ram, Compo 8. Shri Rajinder Kakkar, Compo
MAP & COVER
1. Shri S. R .. Puri, Oartographer 2. Shri Amarjit Singh, Cartographer 3. Shri N. P. Gupta, Artist
DICTATION & TYPING
1. Shri D. R. Khanna, P.A. 2. Sl;J.ri B. L. Sehgal, 1ypist 3. Shri R. S. Bedi, Typist
(vi)
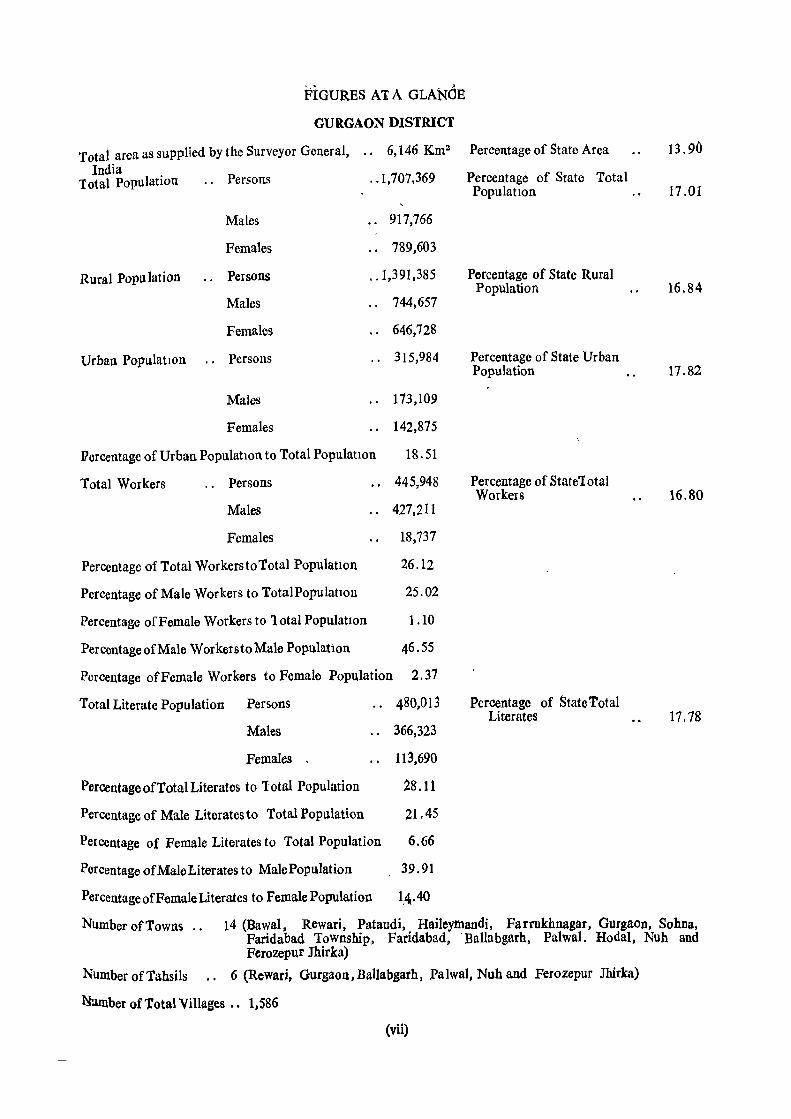
i?IOURES AT A GLANOE
GURGAON DISTRICT
Totai area as supplied by the Surveyor General, .. 6,146 K.m2
India Total population . . Persons .. 1,707,369
Males ., 917,766
Females · . 789,603
Rural population .. Persons · .1,391,385
Males .. 744,657
Females · . 646,728
Urban PopulatlOn .. Persons · . 315,984
Males · . 173,109
Females · . 142,875
Percentage of Urban Population to Total PopulatIOn 18.51
Total Workers . . Persons · . 445,948
Males · . 427,211
Females 18,737
Percentage of Total Workers to Total Population 26.12
Percentage of Male Workers to TotaiPopulatlon 25.02
Percentage of Female Workers to lotal PopulatIOn 1.10
Percentage of Male Workersto Male Populabon 46.55
Percentage of Female Workers to Female Population 2.37
Total Literate Population Persons 480,013
Males · . 366,323
Females , 113,690
Percentage of Total Literates to 'Iotal Population 28.11
Percentage of Male Literates to Total Population 21.45
Percentage of Female Literates to Total Population 6.66
Percentage of Male Literates to Male Population 39.91
Percentage of Female Literates to Female Population 1.~.40
Percentage of State Area
Percentage of State Total PopulatIOn
Porcentage of State Rural Population
Percentage of State Urban Population
Percentage of State'lotal Workers
Percentage of State Total Literates
13.90
17.01
16.84
17.82
16.80
17.78
Number of Towns .. 14 (Dawal, Rewari, Pataudi, Haileymandi, Farrukhnagar, Gurgaon, Sohna, Faridabad Township, Faridabad, . Ballabgarh, Palwal. Hodal, Nuh and Ferozepur Jhirka)
Number ofTahsiIs 6 (Rewar;, GurgaoQ,Ballabgarh, :PalwaJ, Nuh and Ferozepur JWrka)
Nl.lmber of total Villages •. 1,586
(vii)
z 0 <C( .. ~ ~ It.
'r' « ,j\ ... :l CD
~ 0
C) CD
'<t
I- '<t
0 0 0 - C\I
" C\I '<t
t-1-
'<t ~. t/) en .!) I>-III
~6- 0 - ..I () p
Q ~ 'v~1f {: b-~ c
J.;)I't:IlSIO ¥
'0 -It) 1'1
oQi oil) Z'" 1\1
INTRODUCTION
The compilation of District Census Handbooks was initiakdfor the first time at the 1951·Ccnsus since it was felt that the District was the most manageable and rational unit for the presentation of CensuS
data. Census sta~istics wer.e. also compiled for indiyidual vi~lages and tow~s a~ they c0D:sti~uted the ba~ic units of human habitatIOn. Besl(les, some other useful mformatlon had also been mcluded m It to make It a selfcontained book of reference for the district. The compilation of District Census Handbooks was, however, not altogether a new idea, since Census data for smaller units were j:ublished in earlier censuses also in one form or the other. In 1891, a district-wise list of viII ages was published giving the population of each village. At the 1911-Census, data of villages were published in the form of Village Directory. Such village directories were again compiled in the shape of district census statistics at the 1921-Census. In the ultimate fotm, the District Census Handbooks emerged as regular decennial publications since 1951-Census. The general appreciation and utility of this handbook encouraged the Census Organisation to increase the scope of the publi"ation from mere compilation of Census statistics of the district and its component villages and towns in 1951-,Censu~ tp ~ sort of district gazetteer depicting variegated phenomena of human life in the present Census.
2. The 1961-Census brought significant changes in the compilation of District Census Handbooks with a view to presenting more comprehensive picture of the district by including additional information on nonCensus items such as physical features, climate, fauna and flora, history ofthe district, towns and pl~c~s of interest and its administrative machinery. The economic aspects such as agriculture, land-use pattern, irrigation and main crops, livestock, industries, trade and commerce and communications; social and cultural life ; develop· mental activities ; and demographic pattern were also included within the scope of the District Census Handbooks in addition to numerous departmental statistics as collected from the various government departments; Census Tables and Directory of Villages and Towns.
3. The compilation of District Census Handbooks witnessed a new momentum at the i971-Census and its publication became a colossal job due to inclusion of information on a number of new aspects. It was difficult to provide complete .... information in one consolidated volume. Moreover, it was also felt that the basic Census data should not be delayed for want of non-Census data and information, collection of which was really time-consuming. In this perspective, it was decided to publish the District Census Handbooks in three parts viz., Part-A-Village and Town Directory, Part-B-Village and Townwise Primary Census Abstracts, and Part-C-Analytical Report, Administrative Statistics and District Census Tables. In the case ofHaryana State, the data for Parts A and B of the District Census Handbooks were compiled and finalised simultaneously and as such both these parts of the District Census Handbooks have already been published together in one volume.
4. In Part-A of the District Census,J!andbook, the Village Directory furnished information about the total area of each village, availability of educational, medical, power supply, drinking water, communications
post and telegraph amenities, staple food,land-use pattern, location of nearest town and its distance and places of religious, historical, archaeological interest in the village. The Town Directory, on the other hand, presents data on each town giving their civil status, growth history and functional category (Statement I), physiclll aspects and location of towns, 1969 (Statement II), municipal finance, 1968-69 (Statement III), ciVic and other amenities, 1969 and (Statement IV), medical, educational, recreational and cultural facilities in towns, 1969 (Statement V), trade, commerce, industry and banking, 1969 (Statement VI) and population by religion (Statement VII).
5. Part-B of the District Census Handbook contains Village and Townswise Primary Census Abstracts. These abstracts have been presented villagewise and in the case of towns, ward/urban enumerator's blq~kwiSe and give data on area of village in acres and of towns in sq.km., occupied residential houses, number of house:holds, total popUlation, number of scheduled caste persons, number of literates and educated persons, the number of workers and their distribution into nine industrial categories as per the Code of National Industrial Classifjcation and lastly number of non-workers, sex-wise. . .
. 6. However, as a result of considerable delay in the compilation of material due to various reasons, It has been decided to reduce the coverage of District Census Handbook Part-C. The present volume DOW comprises three sets of tables, namely, (a) Census Tables, (b) Tables on Village Directory and Primary Census Abs~~ctdata generated on the computor and (c) Tables on Administrative, Welfare and Developmental StatIstIcs, preceded by a small introduction. The analytical portion as given in the case of District Censul Handbook, Part-C of Ambala district has been given up for the remaining districts.
Definitions and Concepts
7: Two broad divisions of ar~as, namely, rural and urban have always been recognised at the e,enIUses. It IS, ther~fore, nece35lry to define and demarcate these ar~as carefuJly well before'the CeU3\1s itself
The definitions of village, town, ward, urban block, house, household, scheduled caste, literate, worker and nOD-worker adopted for the 1971-Census are given below ;- .
Village
8. The definition of the village adopted in our State for the purpose of Census corresponds to the one contained in the !,unjab Land Revenue Act, 1887. A village means "any area
(a) for which a separate record of rights exists ; or
(b) which has been separately assessed to land revenue, or would have been so assessed if the land revenue had not been realized, or compounded or redeemed; or
(c) which the State government may by general rule or special orders declare to be an estate".
The above definition, abstracted from the Punjab Land Revenue Act, has been uniformly adopted in previous censuses also. Generally speaking, all arel.1s not specifically taken as urban, belong to one village or the other.
Town
9. The definition of a town or an urban area adopted at the 1971-Census generally follows the one adopted at the 1961-Census and stands to denote ;-
(a) All places with a Corporation, Municipality or a Cantonment Board or a Notified Area Committee ; and
(b) All other places which satisfied the following criteria ;-
(i) A minimum population of five thousand ;
(ii) At least seventy-five per cent of the male working population was engaged in economic persuits other than agricultural ; and
(iii) A density of population of at least 400 persons per sq. km. or 1,000 persons per sq .mile.
In Haryana, however, only places with a Municipality or a Cantonment Board or a Notified Area Committee have been treated as towns to the exclusion of all other considerations.
Ward
10. All the towns in the State are divided into a number of municipal wards. A war.d is a compact unit of an urban area with well-defined geographical boundaries, demarcated by the local administration, for the purpose of municipal or any other local body elections.
Urban Block
11. Aithough for the purpose of Census enumeration, the villages had been divided : on the basis of their population into Enumeration Blocks consisting of approximately 750 persons each, data for villages have not been given enumeration blockwise but for the village as wl1ole. In the case 'of towns, on the other hand, data have been furnished for individual enumeration blocks within a ward. The urban blocks were formed on the basis of a population roughly of 600 persons. At the 1971-Census, there were some newly constituted towns such as Naraingarh, Ganaur, Jagadhri Workshop Railway Colony and Tosham where demarcation of electoral wards was yet to be done. In such cases, the entire town was treated as one unit and then divided into enumeration blocks. Some of the big towns had been divided into sectors in persuance of the scheme on permanent house-numbering. In such cases too, the ~numerators' blocks were carved out wardwise and not sector-wise.
House
12. For the purpose of Census, -the term 'house' refers to a building or a part of a building, having a separate main entrance from the road or common court-yard or staircase etc., used or recognised as a separate unit. It may be .inhabited or vacant. It may be used for residential or a non-residential purpose or for both. In Village and Town-wise Primary Census Abstracts, however, the data have been given in respect of occupied residential houses only i.e. Census houses used wholly or partly for residential purposes by one or more·house holds at the time of enumeration.
3
Household
13. A household is defined as 'the entire group of persons who commonly live together and would t ke their meals from a common kitchen unless the exigencies of work prevent them from doing so'. A househa ld can be either a one person household or a multiperson household i.e. a group of two or more persons. They ;ay be related or unrelated persons or a combination of both. A cook or a servant living in the house of his em loyer and taking his food there has been considered as a member of the master's household. Similarly, a ho&l or hostel or a)ail etc. where a number of unrelated persons live together has been considered as'institutional household.
Scbeduled Caste
14. Under Articles 341 and 342 of the Constitution, the President is empowered to specify the list of Scheduled Castes and Scheduled Tribes for each State and Union Territory. In the Scheduled Castes and Scheduled Tribes Lists (Modification) Order, 1956, amended up-to-date, as many as 37 castes are listed as Scheduled Castes in the State of Haryana. Of these, 33 Scheduled Cas tes are listed in the whole State, three for districts other than Mahendragrarh and lind and one for Mahendragarh and Jind districts only. A condition for a person to belong to a Scheduled Caste is that he must be professing either Hindu or Sikh religion. There is, however, no Scheduled Tribe listed as such for the whole or any part of Haryana State.
Literate
15. For the purpose of Census, only persons who can both read and write with understanding in any Janguage, has been considered 'literate'. Evidently, a person who can merely read but cannot write has not been treated as literate. It is not necessary, however, that a person who is literate should have received any formal education or should have passed any minimum educational standard. Children below the age of five years even if they could both read and write have not been considered-literate as such because they could not be considered to have developed the required understanding.
Worker
16. Before defining the term 'worker', it is necessary to explain the concept of 'main activity' adopted for the first time at the 1971-Census. By main activity is meant, as to how a person engages himself mostly. From the point of view of main activity, therefore, the population got divided into two categories viz. workers and non-workers. A worker is a person whose main activity is participation in any economically productive work by his physical or mental activity. Work involves not only actual work but effective supervision and direction of work.
Non-worker
17. Anon-worker is a person who as his main activity is not engaged in any economically productivCJ work but is basically non-working. The non-workers constitute those engaged in Household Duties, Students, Retired Persons or Rentiers, Dependents, Beggars, Inmates of Institutions and Other Non-Workers. The other non-workers include all other non-workers who may not come under any of the six categories mentioned above and may mainly consists of persons seeking work.

5
SECTION-A
CENSUS TABLES

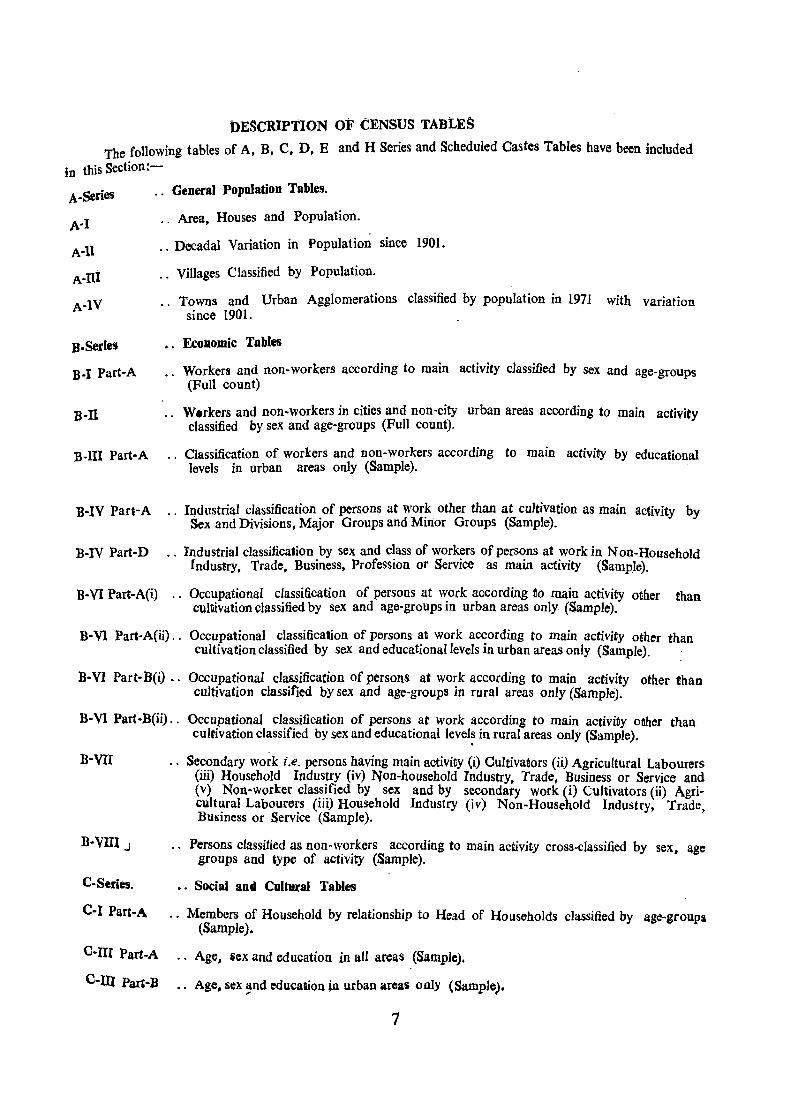
DESCRIPtION OF CENSUS TABLES
The following tables of A, B, C, D, E in this Section:-
and H Series and Scheduled Castes Tables have been included
A-Series .. General Population Tables.
A-I
A-ll
A-UI
A-IV
B-Series
B-1 Part-A
B-TI
B-IV Part-A
B-IV Part-D
B-VI Part-A(i)
.. Area, Houses and Population.
.. Decadal Variation in Population since 1901.
.. Villages Classified by Population.
Towns and Urban Agglomerations classified by population in 1971 with variation since 1901.
Ecollomic Tables
Workers and non-workers according to main activity classified by sex and age-groups (Full count)
W.rkers and non-workers in cities and non-city urban areas according to main activity classified by sex and age-groups (Full count).
Classification of work.ers and non-workers according to main activity by educational levels in urban areas only (Sample).
Industrial classification of persons at work other than at cultivation as main ac~ivity by Sex and Divisions, Major Groups and Minor Groups (Sample).
Industrial classification by sex and class of workers of persons at work in N on-Household Industry, Trade, Business, Profession or Service as main activity (Sample).
Occupational classification of persons at ",:ork according to main activity other than cultivation classified by sex and age-groups In urban areas only (Sample).
B-V1 Part-A(ii).. Occupational classifiea.ion of persons at work according to main activity other than cultivation classified by sex and educational levels in urban areas only (Sample). :
B-VI Part- B(i) .. Occupational classification of persons at work according to main ac'ivity other than cultivation classified by sex and age-groups in rural areas only (Sample).
B-V1 Part-B(ii) .. Occupational classification of persons at work according to main activiby other than cul,ivation classified by sex and educationallevel~ in rural areas only (Sample),
B-VII Secondary work i.e. persons having main activity (i) Cultivanors (ii) Agricultural Labourers (iii) Household Industry (iv) Non-household Industry, Trade, Business or Service and (v) Non-worker classified by sex and by secondary work (i) Cultivators (ii) Agricultural Labourers (iii) Household Industry (iv) Non-Household Industry, Trade, Business or Service (Sample).
B-VUI J Persons classified as non-workers according to main activity cross-classified by sex, age groups and ~ype of activity (Sample).
C-Series. •. Social aDti CIIIhu.'aI Tables
C-l Part-A .. Members of Household by relationship to Head of Households classified by age-groups (Sample).
C-llI Part-A " Age, iCX and education in all areas (Sample).
CoIn ParC-B Age, sex ~nd education ju urban areas only (Sample).
7
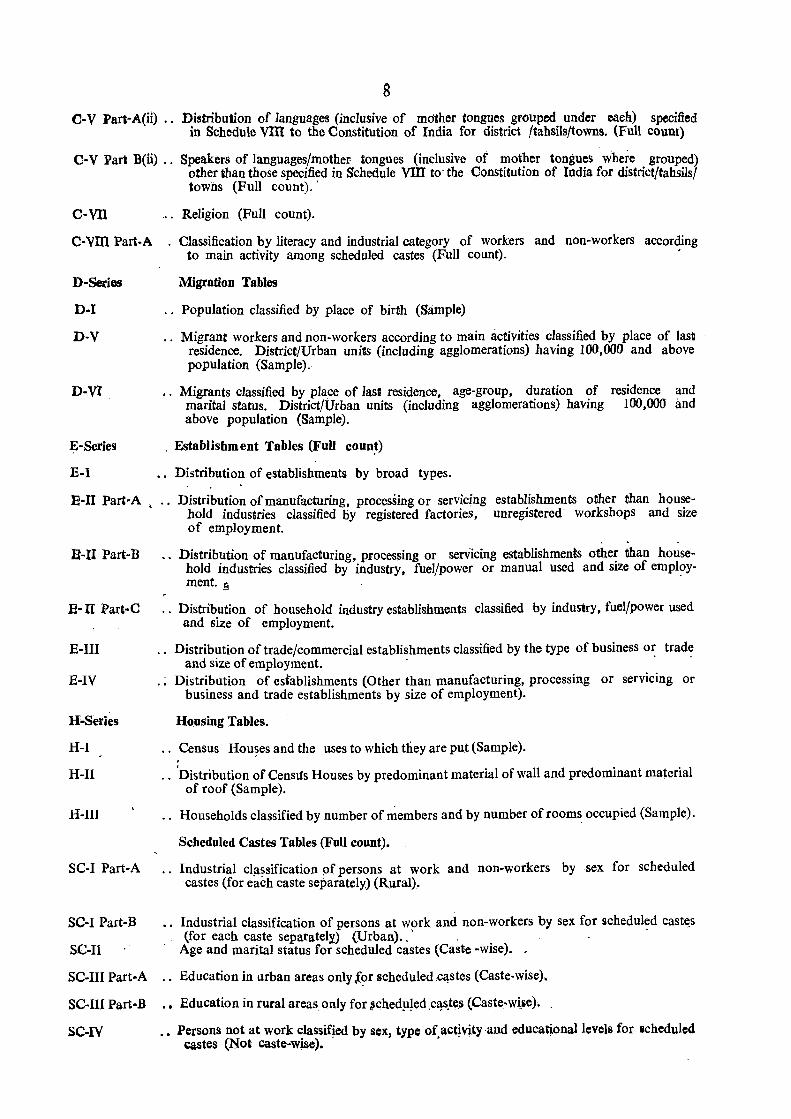
8 c-V Part-A(ii) .. Distribution of languages (inclusive of mo'ther tongues grouped under eaeh) specified
in Schedule VIII to the Constitution of India for district /tahsils/towns. (Full count)
C-V Part B(ii) .. Speakers of languages/mother tongues (inclusive of mother tongues where grouped) other than those specified in Schedule VIn to' the Constitution of India for district/tahsils/ towns (Full count).'
C-VlI " Religion (Full count).
C-VIII Part-A Classification by literacy and industrial category of workers and non-workers accor~ing to main activity among scheduled castes (Full count).
D-Series Migl'atioD Tables
D-I " Population classified by place of birth (Sample)
D-V Migrant workers and non-workers according to main activities classified by place of last residence. District/Urban units (including agglomerations) having 100,000 and above population (Sample).
D-VI Migrants classified by place of lase residence, age-group, duration of residence and marital status. District/Urban units (including agglomerations) having 100,000 aad above population (Sample).
~-Series . Establisbment Tables (FuJI coun~)
E-I .• Distribution of establishments by broad types.
E-n Part-A, .. Distribution of manufacturing, processing or servicing establishments other than household industries classified by registered factories, unregistered' workshops and size of employment.
. . B-II Part-B Distribution of manufacturing, pl'ocessing or serVicing establishments other than house-
hold industries classified by industry, fuelJpower or manual used and size of employ-~a .
13- II Part-C Distribution of household industry establishments classified by industry, fuel/power used and size of employment.
E-III Distribution of trade/commercial establishments classified by the type of business or trade and siz.e of employment. . .
E-IV Distribution of establishments (Other than manufacturing, processing or servicing or business and trade establishments by size of employment).
H-Series Housing Tables.
H-I .. Census Houses and the uses to which they are put (Sample). ,
H-U 'Distribution of Censl1s Houses by predominant material of wall and predominant material of roof (Sample).
H-1Il Households classified by number of members and by number of rooms occupied (Sample).
SC-I Part-A
SC-I Part-B
SC-lI
SC-III Part-A
SC-III Part-B
SC-IV
Scheduled Castes Tables (Full count).
Industrial cl~ssification pf persons at work and non-workers by sex for scheduled castes (for each caste separately) (Rural).
.. Industrial classification of persons at work and non-workers by sex for scheduled caste.s . (for each caste separately) (Urban) .. ' . > > •
. Age and marital status for scheduled castes (Caste -wise).
Education in urban areas only for scheduled c~stes (Caste-wise).
Education in rural areas only for ~chedpJed.c~s.tes (Caste-w~~e) •.
•• Persons not at work classified by sex, type of. act~y~ty and educat~ona11cvels for ichcdulcd ~tes (NOli caste-wlse).
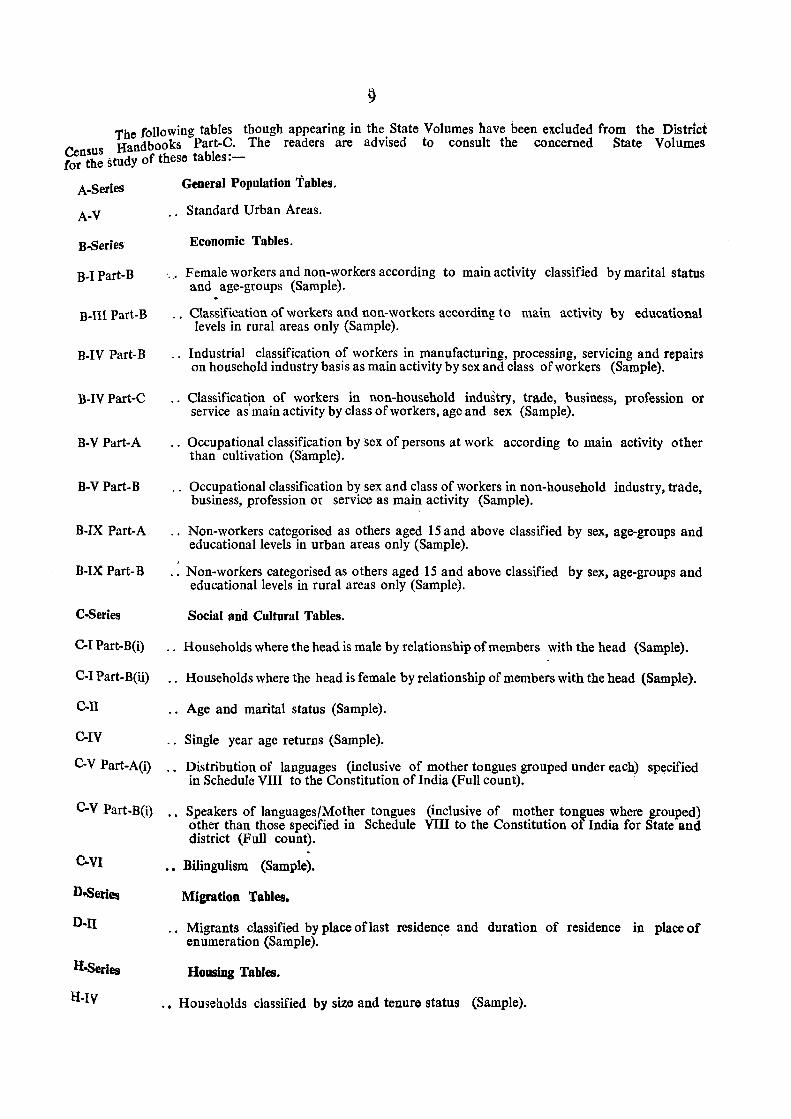
the following tables though appearing in the State Volumes have been excluded from the District
Ce Handbooks Part-C. The readers are advised to consult the concerned State Volumes nsUS bl • for the study of these ta es.-
A-Series
A-V
B-Series
D-I Part-D
B-lII Part-B
B-IV Part-B
B-IV Part-C
B-V Part-A
B-Y Part-B
B-IX Part-A
B-IX Part-B
C-Series
C-I Part-B(i)
C-I Part-B(ii)
ell
C-IY
C-V Part-A(i)
C-V Part-B(i)
C.VI
D..series
D-ll
H-Series
H-IV
General Population Tables.
Standard Urban Areas.
Economic Tables.
., Female workers and non-workers according to main activity classified by marital status and age-groups (Sample).
Classification of workers and non-workers according to main activity by educational levels in rural areas only (Sample).
.. Industrial classification of workers in manufacturing, processing, servicing and repairs on household industry basis as main activity by sex and class of workers (Sample).
,
Classification of workers in non-household industry, trade, business, profession or service as'main activity by class of workers, age and sex (Sample).
Occupational classification by sex of persons at work according to main activity other than cultivation (Sample).
Occupational classification by sex and class of workers in non-household industry, trade, business, profession or service as main activity (Sample).
Non-workers categorised as others aged 15 and above classified by sex, age-groups and educational levels in urban areas only (Sample).
.. Non-workers categorised as others aged 15 and above classified by sex, age-groups and educational levels in rural areas only (Sample).
Social and Cultural Tables.
Households where the head is male by relationship of members with the head (Sample).
.. Households where the head is female by relationship of members with the head (Sample).
.. Age and marital status (Sample).
Single year age returns (Sample).
Distribution of languages (inclusive of mother tongues grouped under each) sp()cified in Schedule VIII to the Constitution of India (Full count). .
Speakers of languages/Mother tongues (inclusive of mother tongues where grouped) other than those specified in Schedule VIII to the Constitution of India for State and district (Full count).
Bilingulism (Sample).
Migration Tables.
Migrants classified by place oflast residence and duration of residence in place of enumeration (Sample).
Housing Tables.
Households classified by size and tenure status (Sample).

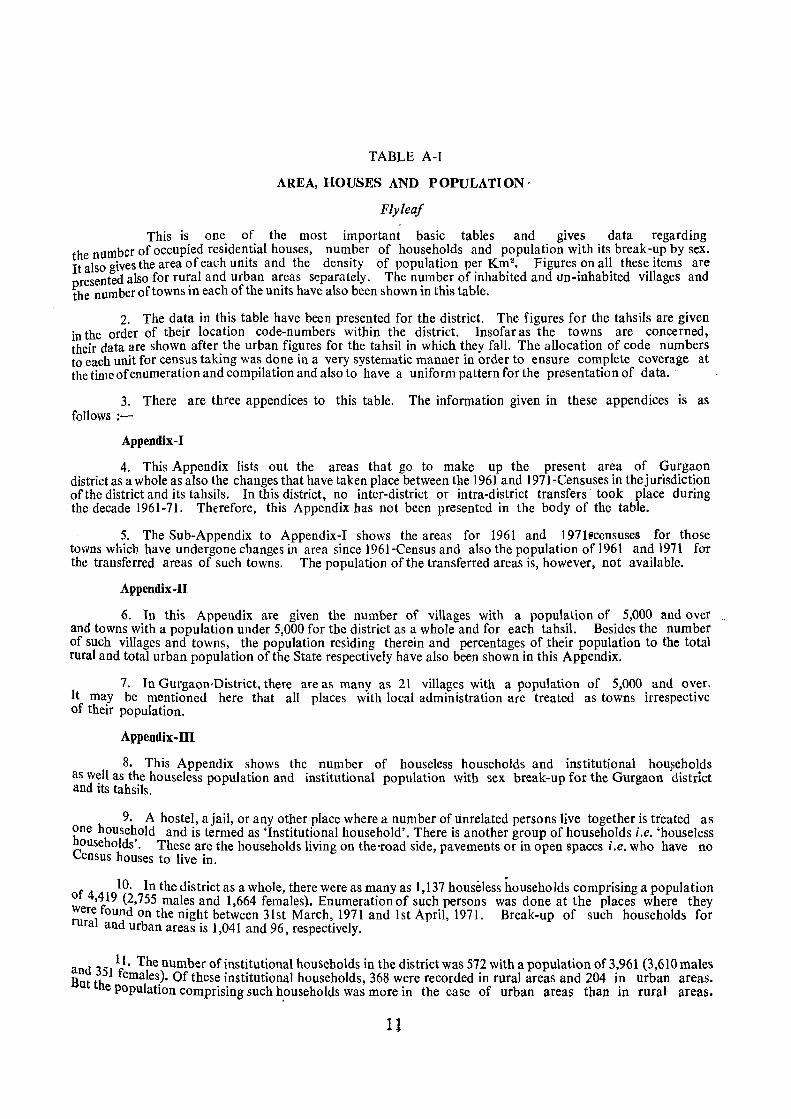
TABLE A-I
AREA, HOUSES AND POPULATION,
Flyleaf
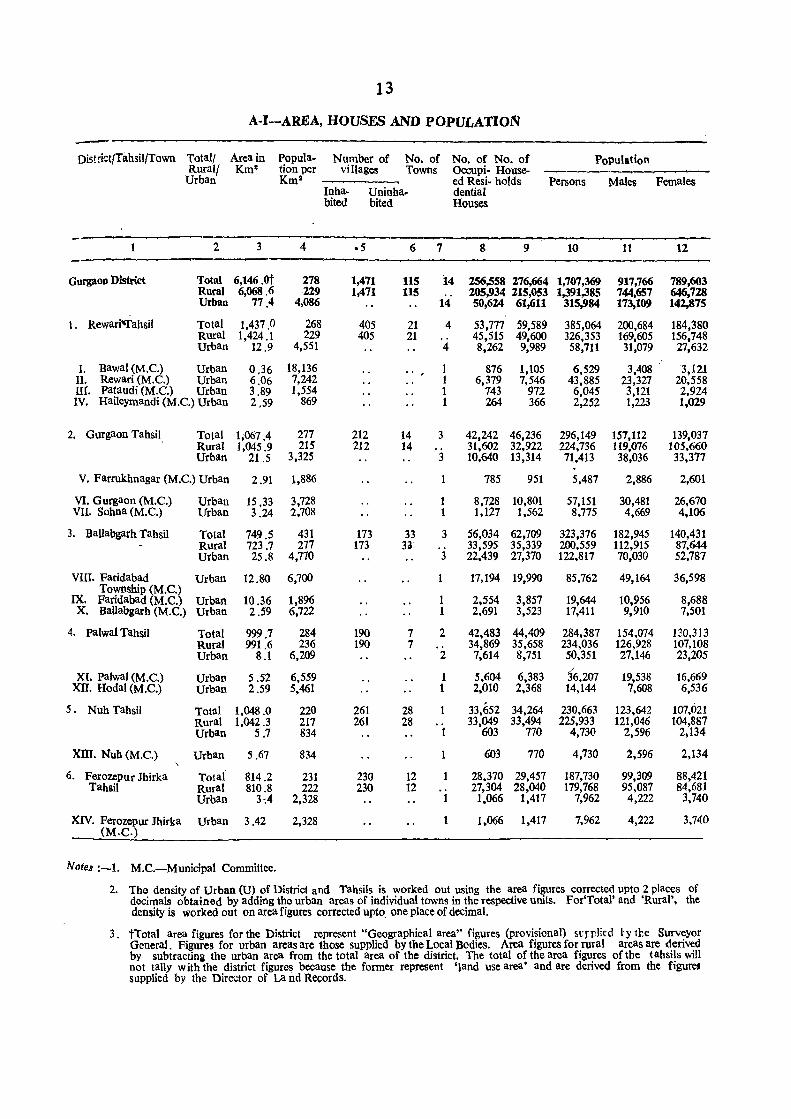
This is one of the most important basic tables and gives data regarding the number of occupied residential houses, number of households and population with its break-up by sex. It also gives the area of each units and the density of population per Km2. Figures on all these items are presented also for rural and urban areas separately. The number of inhabited and un-inhabited villages and the number of towns in each of the units have also been shown in this table.
2. The data in this table have been presented for the district. The figures for the tahsils are given in the order of their location code-numbers within the district. Insofar as the towns are concerned, their data are shown after the urban figures for the tahsil in which they fall. The allocation of code numbers to each unit for census taking was done in a very systematic manner in order to ensure complete coverage at the time of enumeration and compilation and also to have a uniform pattern for the presentation of data.
3. There are three appendices to this table. The information given in these appendices is as follows ;-
Appendix-I
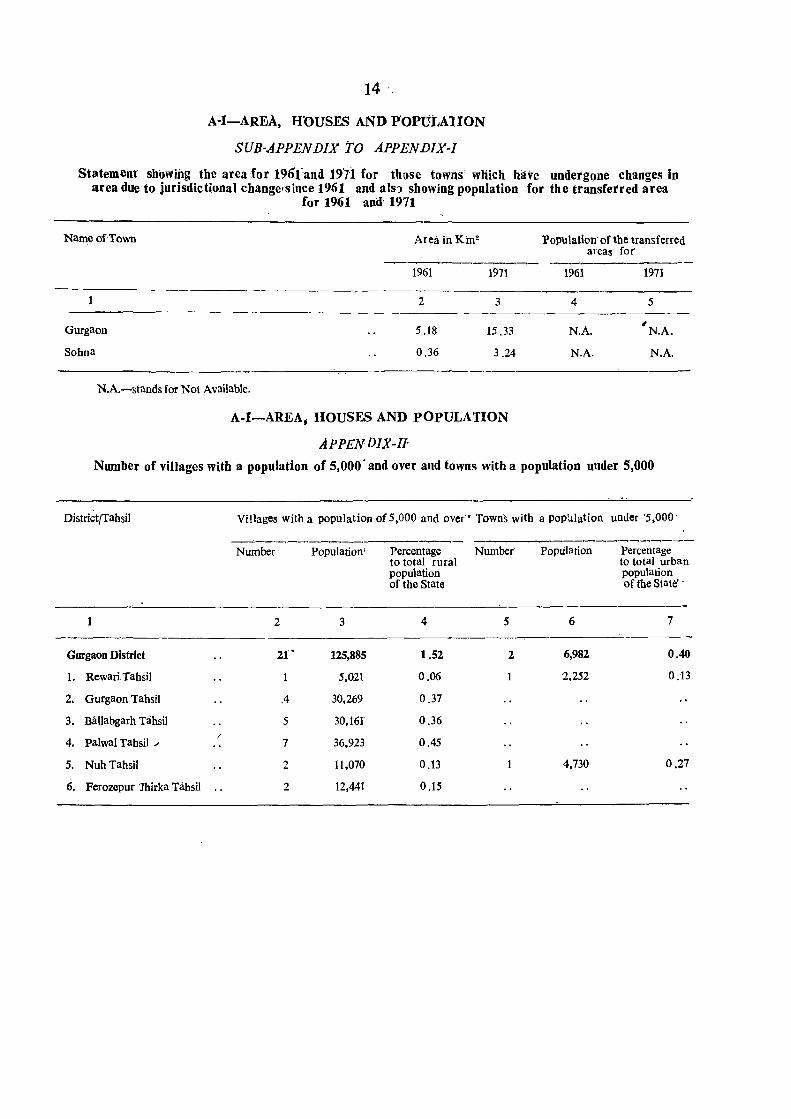
4. This Appendix lists out the areas that go to make up the present area of Gurgaon district as a whole as also the changes that have taken place between tl1e 1961 and 1971-Censuses in the jurisdiction of the district and its tahsils. In this district, no inter-district or intra-district transfers· took place during the decade 1961-71. Therefore, this Appendix has not been presented in the body of the table.
5. The Sub-Appendix to Appendix-I shows the areas for 1961 and 1971@ccnsuses for those towns which have undergone changes in area since 1961-Census and also the population of 1961 and 1971 for thl! transferred areas of such towns. The population of the transferred areas is, however, not available.
Appendix-II
6. In this Appendix are given the number of villages with a population of 5,000 and over and towns with a population under 5,000 for the district as a whole and for each tahsil. Besides the number of such villages and towns, the population residing therein and percentages of their population to the total rural and total urban population of the State respectively have also been shown in this Appendix.
7. In Gurgaon,District, there are as many as 21 villages with a population of 5,000 and over. It may be mentioned here that all places with local administration are treated as towns irrespective of their population.
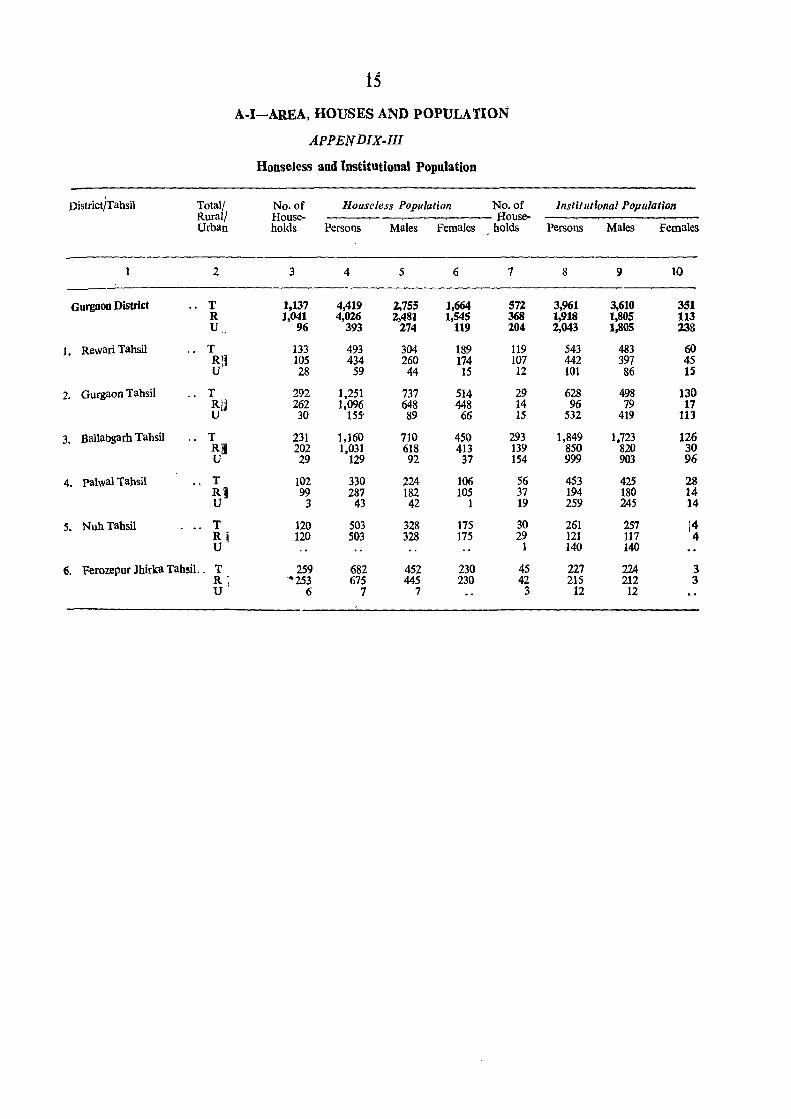
Appendix~III
8. This Appendix shows the number of houseless households and institutional hou~eholds as well as the houseless population and institutional population with sex break-up for the Gurgaon district and its tahsils.
9. A hostel, a jail, or any other place where a number of unrelated persons live together is treated as hne house~old and is termed as 'Institut!o_nal household'. There is another g~oup of househ<?lds i.e. 'houseless
Couseholds. These are the households hvmg on the'road slde, pavements or m open spaces I.e. who have no ensus houses to live in.
f 4 4 10. In the district as a whole, there were as many as 1,137 housCIess households comprising a population o , f, 19 (2,755 males and 1,664 femal~s). Enumeration of such persons was done at the places where they ~er~ ound on the night between 31st March, 1971 and 1st April, 1971. Break-up of such households for
ra and urban areas is 1,041 and 96, respectively.
and 351 Ii . The number of institutional households in the district was 572 with a population of 3,961 (3,610 males But th emales). Of these institutional households, 368 were recorded in rural areas and 204 in urban areas.
e populatlOn comprising such h.ouseholds was more in the case of urban areas than in rural areas.
11

13
A-I-AREA, HOUSES AND POPULATION
-District/Tahsil{Town Total! Area in Po pula- Number of No. of No. of No. of Population
Rural/ Kms tion per villages Towns Occupi- House-Urban Kms ed Resi- holds Persons Males Females
Inha- Uninha. dential bited bited Houses
2 3 4 .5 6 7 8 9 10 11 12
Gurgaon District Total 6,146 .ot 278 1,471 115 '14 256,558 276,664 1,707,369 917,766 789,603 Rural 6,068.6 229 1,471 115 205,934 215,053 1,391,385 744,657 646,728 Urban 77 .4 4,086 14 50,624 61,611 315,984 173,109 142,875
1- Rewari~ahsil Total 1,437.0 268 405 21 4 53,777 59,589 385,064 200,684 184,380 Rural 1,424.1 229 405 21 45,515 49,600 326,353 169,605 156,748 Urban 12.9 4,551 4 8,262 9,989 58,711 31,079 27,632
I. Bawal (M.C.) Urban 0,36 18,136 ... 1 876 1,105 6,529 3,408 3,121 II. Rewari (M.C.) Urban 6.06 7,242 1 6,379 7,546 43,885 23,327 20,558 III. pataudi (M.C.) Urban 3.89 1,554 1 743 972 6,045 3,121 2,924 IV. Haileymandi (M.C.) Urban 2,59 869 1 264 366 2,252 1,223 1,029
2. Gurgaon Tahsil Total 1,067.4 277 212 14 3 42,242 46,236 296,149 157,112 139,037 Rural 1,045.9 215 212 14 31,602 32,922 224,736 119,076 105,660 Urban 21.5 3,325 3 10,640 13,314 71,413 38,036 33,377
V. Farrukhnagar (M.C.) Urban 2.91 1,886 785 951 5,487 2,886 2,601
VI. Gurgaon (M.C.) Urban 15.33 3,728 1 8,728 10,801 57,151 30,481 26,670 VII. Sohna (M.C.) Urban 3.24 2,708 1 1,127 1,562 8,775 4,669 4,106
3. Ballabgarh Tahsil Total 749.5 431 173 33 3 56,034 62,709 323,376 182,945 140,431 Rural 723.7 277 173 3il 33,595 35,339 200,559 112,915 87,644 Urban 25.8 4,770 3 22.439 27,370 122,817 70,030 52,787
VIII. Faridabad Urban 12.80 6,700 17,194 19,990 85,762 49,164 36,598 Township (M.C.)
IX. Faridabad (M.C.) Urban 10.36 1,896 1 2,554 3,857 19,644 10,956 8,688 X. Ballabgarh (M.C.) Urban 2.59 6,722 1 2.691 3,523 17,411 9,910 7,501
4. palwal Tahsil Total 999.7 284 190 7 2 42.483 44,409 284,387 154,074 130,313 Rural 991.6 236 190 7 34,869 35,658 234,036 126,928 107,108 Urban 8.1 6,209 2 7,614 8,751 50,351 27,146 23,205
XI. Palwal (M.C.) Urban 5.52 6,559 1 5,604 6,383 16,207 19,538 16,669 XII. Hodal (M.C.) Urban 2.59 5,461 1 2,010 2,368 14,144 7,608 6,536
5. Nuh Tahsil Total 1,048.0 220 261 28 33,652 34,264 230,663 123,642 107,021 Rural 1,042.3 217 261 28 33,049 33,494 225,933 121,046 104,887 Urban 5.7 834 1 603 770 4,730 2,596 2,134
xm. Nuh (M.C.) Urban 5.67 834 1 603 770 4,730 2,596 2,134
6. Ferozepul' Jhirka Total 814.2 231 230 12 1 28.370 29,457 187,730 99,309 88,421 Tahsil Rural 810.8 222 230 12 27,304 28,040 179,768 95,087 84,681
Urban 3~4 2,328 1 1,066 1,417 7,962 4,222 3,740
XIV. Ferozepur Jhirka Urban 3.42 2,328 1 1.066 1,417 7,962 4,222 3,740 (M.C.)
Notes :-1. M.C.-Municipal Committee.
2. The density of Urban (U) of District and Tahsils is worked out using the area figures corrected upto 2 places of decimals obtained by adding the urban areas of individual towns in the respective units. For'Total' and 'Rural', the density is worked out on area figures corrected upto, one place of decimal.
3. tTotal area figures for the District represent "Geographical area" figures (provisional) sqplied I:y tl:e Surveyor General. Figures for urban areas are those supplied by the Local Bodies. Area fjgures for rural areas are derived by subtractina the urban area from the total area of the district. The total of the area figures of the t ahsils will not tally with the district figures because the former represent 'land use area' and are derived from the figures supplied by the Director of La nd Records.
14
A-I-AREA, HOUSES AND P'OPULAITON
SUB-APPENDIX TO APPENDIX-I
Stlltemenr showing the area for 196'fand 19'7-1 for those towns' which have undergone changes In area due to jurisdictional changersince 1961 and als') showing population for the transferred area
for 1961 and' 1971
Name of-Town
Gurgaon
Sohna
Area in KiUt
1961
2
5,18
0.36
1971
3
15,33
3.24
N.A.-stands for Not Available.
A-I-AREA_ HOUSES AND pOPULATION
APPENDIX-ll
l'opulation'of the transferred areas for'
1961 1971
4 5
N.A ,
N.A.
N.A. N.A.
Number of villages with a population of 5,000' and over and towns with a population under 5,000
District/Tahsil Villages with a population of 5,000 and ovec" Towns with a pop~lation under '5,000'
Number Population' Percentage to total rural
Numbet population Percentage to total urban
population population of the State of the State' -
1 2 3 4 5 6 7
GurgaoD District 21' 125,885 1.52 2 6,982 0.40
1. Rewari'Tahsil 5,021 0.06 2,252 0.13
2. Gurgaon Tahsil .4 30,269 0.37
3. Ballabgarh Tahsil 5 30,161 0.36
4. palwal Tahsil J /
7 36,923 0.45
5. NuhTahsil 2 11,070 0.13 4,730 0.27
6. Ferozepur Jhirka TAhSil .. 2 12,441 0.15
15 A-I-AREA, HOUSES AND POPULATION
APPENDIX· III
Houseless and Institutional Population
I
Instit ullonal Population District/Tahsil Total/ No. of Houseless Population No. of Rural/ House- House-Urban holds Persons Males Females holds Persons Males Females
1 2 3 4 5 6 7 8 9 10
Gurgaon District .. T 1,137 4,419 2,755 1,664 572 3,961 3,610 351 R 1,041 4,026 2,481 1,545 368 1,918 1,805 113 U 96 393 274 119 204 2,043 1,805 238
1. Rewari Tahsil .. T 133 493 304 189 119 543 483 60 R1J 105 434 260 174 107 442 397 45 U' 28 59 44 15 12 101 86 15
2. Gurgaon Tahsil .. T 292 1,251 737 514 29 628 498 130 Rll 262 1,096 648 448 14 96 79 17 U 30 155' 89 66 15 532 419 113
3. Ballabgarh Tahsil ., T 231 1,160 710 450 293 1,849 1.723 126 RlI 202 1,031 618 413 139 850 820 30 U 29 129 92 37 154 999 903 96
4. palwal Tahsil .. T 102 330 224 106 56 453 425 28 R~ 99 287 182 105 37 194 180 14 U 3 43 42 1 19 259 245 14
5. Nuh Tahsil T 120 503 328 175 30 261 257 '4 R~ 120 503 328 175 29 121 117 '4 U 1 140 140
6. Ferozepur Jhirka Tahsil. . T 259 682 452 230 45 227 224 3 R~ "'253 675 445 230 42 215 212 3 U ' 6 7 7 3 12 12

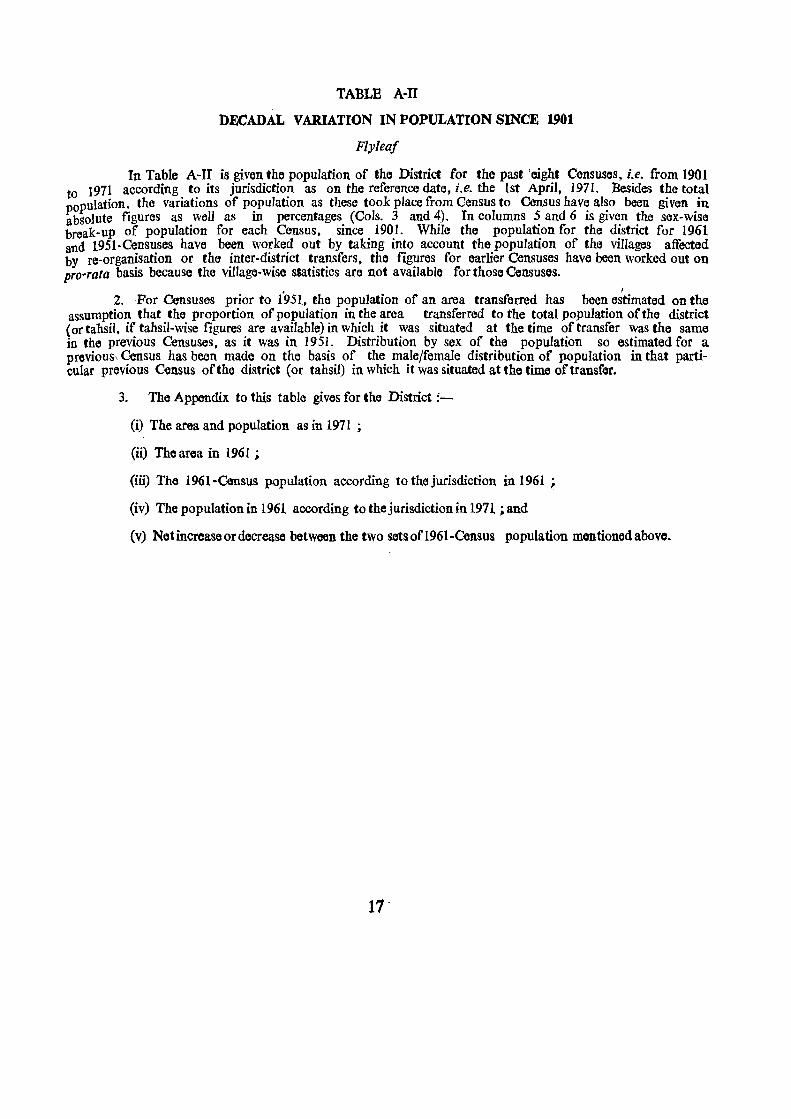
TABLE A-II
DECADAL VARIATION IN POPULATION SINCE 1901
Flyleaf
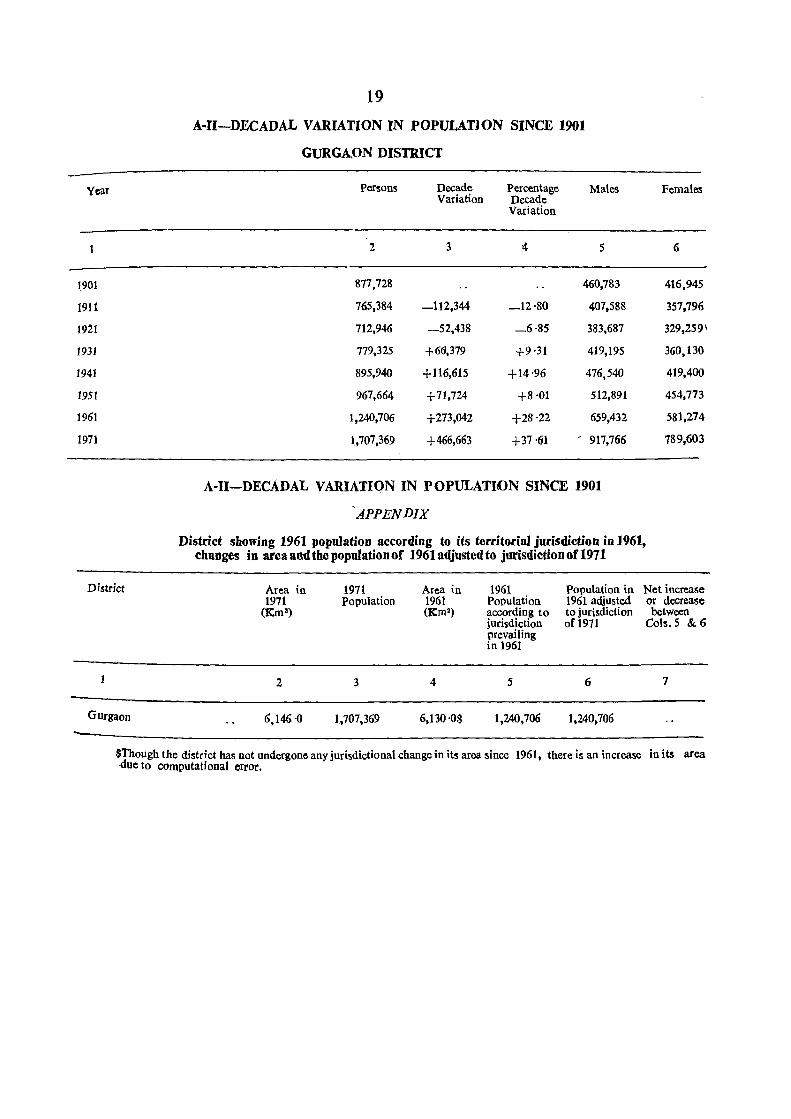
In Table A-II is given the population of the District for the past 'eight Censuses, i.e. from 1901 to 1971 according to its jurisdiction as on the reference date, i.e. the 1st April, 1971. Besides the total population, the variations of population as these took place from Census to Census have also been given in absolute figures as well as in percentages (Cols. 3 and 4). In columns Sand 6 is given the sex-wise break-up of population for each Census, since 1901. While the population for the district for 1961 and 1951-Censuses have been worked out by taking into account the population of the villages affected by re-organisation or the inter-district transfers, the figures for earlier Censuses have been worked out on pro'rata basis because the village-wise statistics are not available for those Censuses.
• I 2. For Censuses prior to 1951, the population of an area transferred has been estimated on the
assumption that the proportion of population in the area transferred to the total population of the district (ortahsil, if tahsil-wise figures are available) in which it was situated at the time of transfer was the same in the previous Censuses, as it was in 1951. Distribution by sex of the population so estimated for a previous\ Census has been made on the basis of the male/female distribution of population in that particular previous Census orthe district (or tahsil) in which it was situated at the time of transfer.
3. The Appendix to this table gives for the District :
(i) The area and population as in 1971 ;
(ii) The area in 1961 ;
(iii) The 1961-C~nsus population according to the jurisdiction in 1961 ;
(iv) The popUlation in 1961 according to the jurisdiction in 1971 ; and
(v) Net increase or decrease between the two setsofl961-Census population mentioned above.

Year
1901
1911
1921
1931
1941
1951
1961
1971
District
GUrgaon
19
A-I1-DECADAL VARIATION IN POPULATJON SINCE 1901
GURGAON DISTRICT
Persons Decade Percentage Males Variation Decade
Variation
2 3 It- S
877,728 460,783
765,384 -112,344 _12·80 407,588
712,946 -52,438 _6·85 383,687
779,325 +66,379 +9·31 419,195
895,940 +116,615 +14·96 476,540
967,664 +71,724 +8·01 512,891
1,240,706 +273,042 +28 ·22 659,432
1,707,369 +466,663 +37 ·61 / 917,766
A~II-DECADAL VARIATION IN POPULATION SINCE 1901
·APPENDIX
Females
6
416,945
357,796
329,259 1
360,130
419,400
454,773
581,274
789,603
District showing 1961 population according to its territorial jurisdiction in 1961, changes in area and the population of 1961 adjusted to jurisdiction of 1971
Area in 1971 Area in 1961 Population in Net increase 1971 population 1961 Population 1961 adjUsted or decrease
(Km') (Km') according to to jurisdiction between jurisdiction of 1971 Cols.5 & () prevailing in 1961
2 3 4 5 6 7
6,146 ·0 1,707,369 6,130·0$ 1,240,706 1,240,706
$Though the district has not undergone any jurisdictional change in its area since 1961, there is an increase in its area ~ue to computational error.

TASLE A-m VILLAGES CLASSIFIED BY POPULATION
Flyleaf
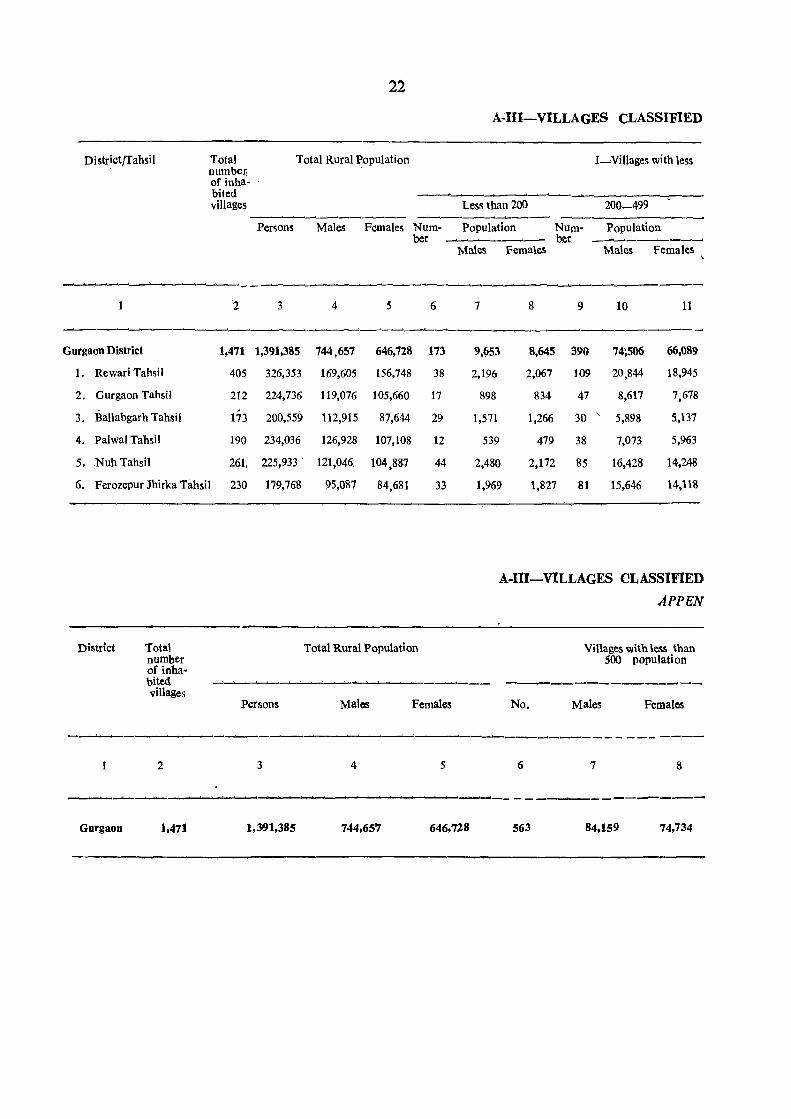
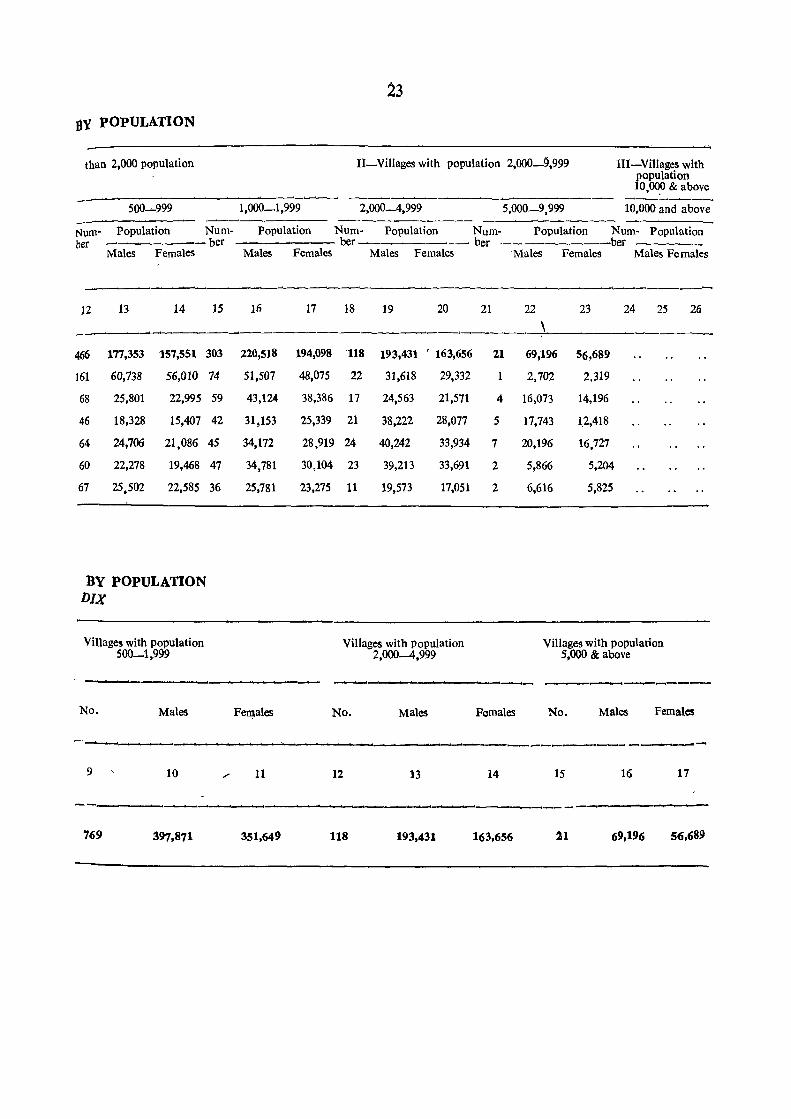
Table A-ID gives the total number of inhabited villages and their classification according to the following population size-groups :-
(1) Less than 200 persons.
(2) 200-499 persons.
(3) 500-999 persons.
(4) 1,000--1.999 persons.
(5) 2.000'""'--4.999 persons.
(6) 5,000--9,999 persons.
(7) 10,000 and above persons.
2. In addition to the number of villages falling in each group, the total population of the villages in each size-group has also been givon by sox. The definition of tho village has already been given in the Introduction. -
3. In the Appendix Co Table A-III. the inhabited viUages havo been classified into four broad sizegroups, viz.. less than .500. 500-1.999, 2.000-4,999 and 5,000 and above. Tho Appendix givos figures both for the number of villages falling in the aforesaid size-groups as well as the population living in such villages by sox break-up, for the district as a whole.
21
22
A~III-VILLAGES CLASSIFIED
Distr!ct/Tahsil Total Total Rural Population I-Nillages with less number, of inha-bited villages
Persons
~--
I 2 3
Gurgaon District 1,471 1,391,385
1. Rewari Tahsil 405 326,353
2. Gurgaon Tahsil 212 224,736
3. Ballabgarh Tahsil 1'73 200,559
4. Palwal Tahsil 190 234,036
5. Nuh Tahsil 26,1. 225,933 .
6. Ferozepur fuirka Tahsil 230 179,768
District
1
Total number of inhabited villages
2
Persons
3
-------_. ---Less than 200 200_499
~-~--.-
Males Females Num- Population Num- Population ber ber --~.----..--.........
Males Female!. Males Females
~-.-_.__._. -----4 5 6
744,657 646,728 173
169,605 156,748 38
119,076 105,660 17
112,915 87,644 29
126,928 107,108 12
121,046. 104,887 44
95,087 84,681 33
Total Rural Population
Males Females
4 5
7 8 9 10 11
9,(i53 8,645 ~90 74;506 66,089
2,196 2,067 109 20,844 18,945
898 834 47 8,617 7,678
1,571 1,266 30 "- 5,898 5,137
539 479 38 7,073 5,963
2,480 2,172 85 16,428 14,248
1,969 1,827 81 15,646 14,118
A-Ill-VILLAGES CLASSIFIED
APPEN
Villages with IC5!o than 500 population
--------------_ No. Males Females
6 7 8
------__..._.....----..~---~~--.-----.......... -----.:.--------- - ------ - -------Gurgaon 1,471 1,391,385 744,657 646,7Z8 563 84,159 74,734
8Y POPULATION
than 2,000 population
500-999
Num- Population Num-ber --ber
Males Females
~~
12 13 14 15
466 177,353 157,551 303
161 60,738 56,010
68 25,801 22,995
46 18,328 15,407
64 24,706 21,086
60 22,278 19,468
67 25,502 22,585
BY POPULATION DIX
Villages with population 500_1,999
No. Males
9 10
74
59
42
45
47
36
23
II-Villages with population 2,000-~,999 III-Villages with
1,000-1,999 2,000--4,999
Population Num- Population
Males Females
16 17
220,518 194,098
51,507 48,075
43,12-4 38,386
31,153 25,339
34,172 28,919
34,781 30,104
25,781 23,275
ber Males Females
18 19 20
118 193,431 ' 163,656
22 31,618 29,332
17 24,563 21,571
21 38,222 28,077
24 40,242 33,934
23 39,213 33,691
11 19,573 17,051
Villages with population 2,OOO-A,999
population 10,~ & above
5,000-9,999 10,000 and above
Num-ber
21
21
4
5
7
2
2
Population Num- Population ber ----
Males Females Males Females
22 23 24 25 26
\
69,196 56,689
2,702 2,319
16,073 14,196
17,743 12,418
20,196 16,727
5,866 5,204
6,616 5,825
Villages with population 5,000 & above
-----,----------------Fell_lales No. Males Females No. Males Females
~--------------
11 12 13 14 15 16 17
-------.-~--~-~---~--.--~.----------------
769 397,871 351,649 118 193,431 163,656 21 69,196 56,689

TABLE A-Iv
TOWNS AND URBAN AGGLOMERATIONS CLASSIFIED BY FOPULATI;ON IN 1971 WITH VARIATION SINCE 1901
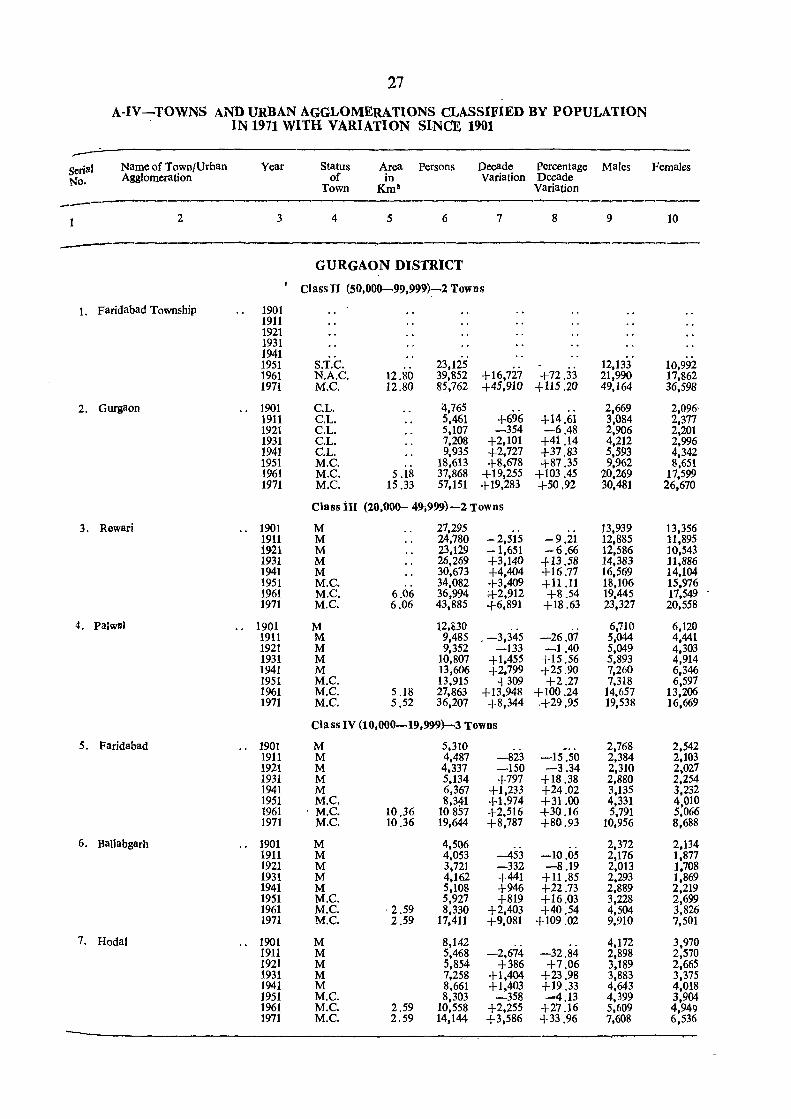
Flylea! Table A-IV exhibi~s ~he variation of population of each town from 190 I-Census to 1971-Ce);lsus,
arranged in the descending order of population aC the 1971-Census.
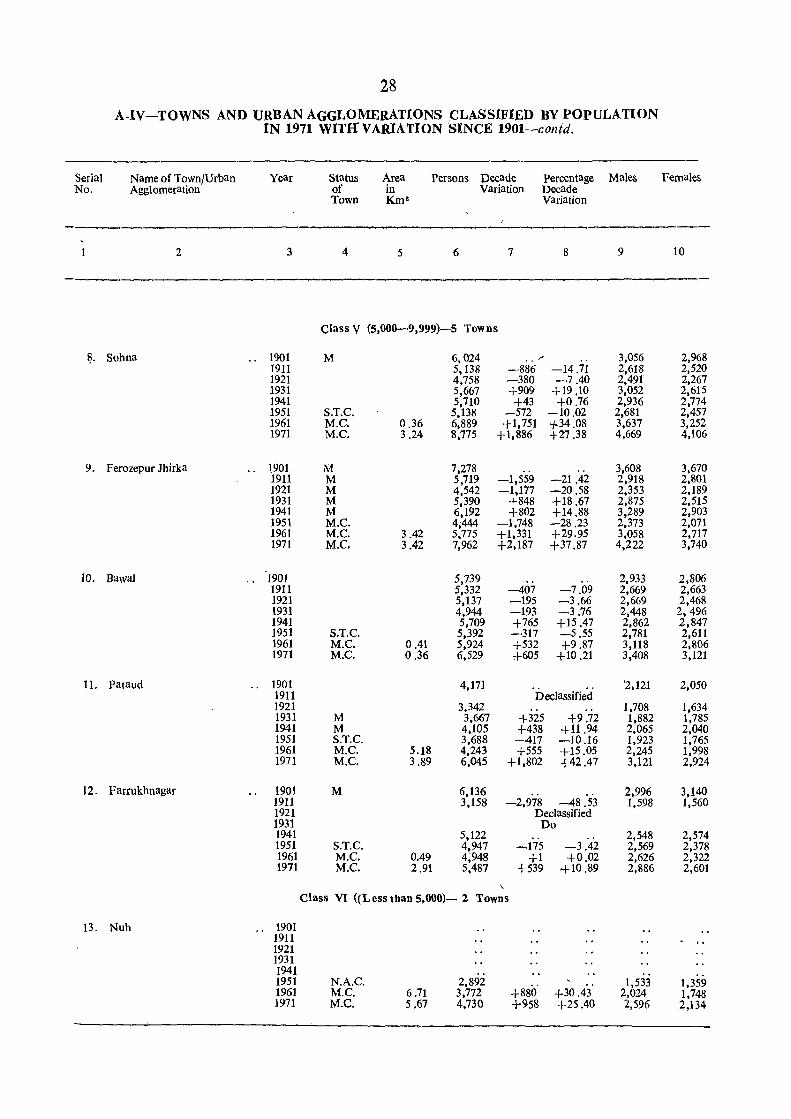
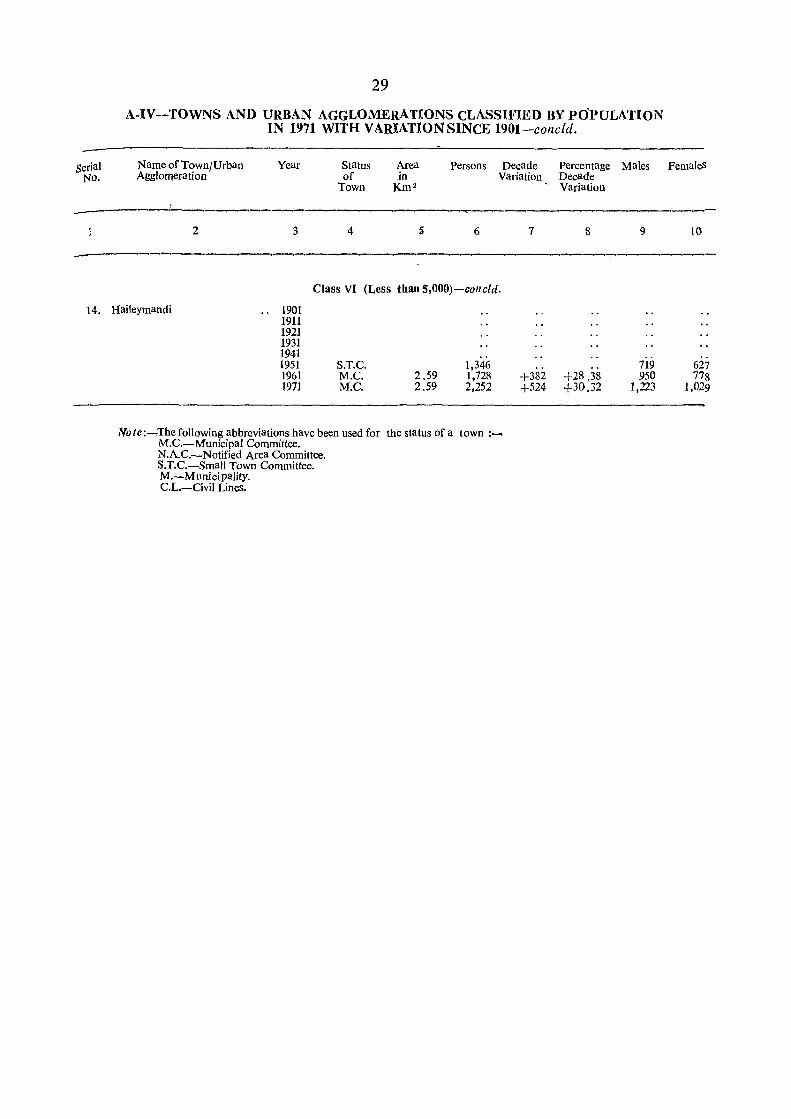
2. Furthermore, the towns have been classified into the following six classes according to population :-
Class I 100,000 and over
Class II
Class m Class IV
Class V
Class VI
50,000 to 99,999
20,000 to 49,999
10,000 to 19,999
5,000 to 9,999
Less than 5,000
3. The changes in the total population of towns falling in each class have also been given in the table.
4. Decadal variation in population has been given both in absolute figures (Column 7) and percentages (Column 8). Sex-wise break-up of popUlation in each Census is also given under columns 9 and 10. The civic sta1!us of each town in each Census, if it was recognised as such, has been mentioned und:tf column 4. Area in km2• has also been shown under column 5 for 1971 and 1961-censuses only as this information is not available for previous Censuses.
5. For the definition of a town, the reader may refer to Introduction.
Urban Agglomeration
6. In 1961-Census, a new concept of Town Groups was devised, whereby two or mar towns lying in very close proximity were treated as one Town Group. It was felt ~hat though such towns were under differen~ civic administrations, they actually constituted one compact uni~. As such. it was decided to present the data for the group of such towns as a whole as well as for the consti1!uen! towns separately.
7. The concept of Town Group adopted at the 1961-Census was, however, given up at the 1971-Census on account of the lack of uniformity in defining 1!he Town Group in different states. Instead, a new concept of Urban Agglomerations made up of a main town together with the adjoining areas of urban growth has been introduced. Bach such agglomeration may be made up of more than one statutory town adjoining one another such as a municipality and the adjoining cantonment and also other adjoining urban out-growths such as a Railway' Colony or Universi1y Campus, etc. Such out-growths which did not qualify to be treated as' individual towns in their own right were to be attached ~o the urban units to which they are adjacent and their population being categorised as urban. In the past Censuses, however, the population residing in 1!he urban out-growths i.e. in the areas outside the statutory limits of a town, if any, though adjacent thereto was treated as rural. Su~h population was not included in the town-groups adopted at ~h 1961-Census either. In Gurgaon district, none of the places satisfied the qualifications for being !reate as an urban aga10meration and no area was recognised as such in the district.
Appendix-I to Table A-IV
8. This Appendix gives the particulars of new towns added in 1971-Census and .towns in 1961 declassified in 1971. In this district, neither any new town has been added nor any town of 1961-Census has been declassified in 1971-Census. Therefore. this Appendix has not been presented in the body of the table.
Appendix II to Table A-IV
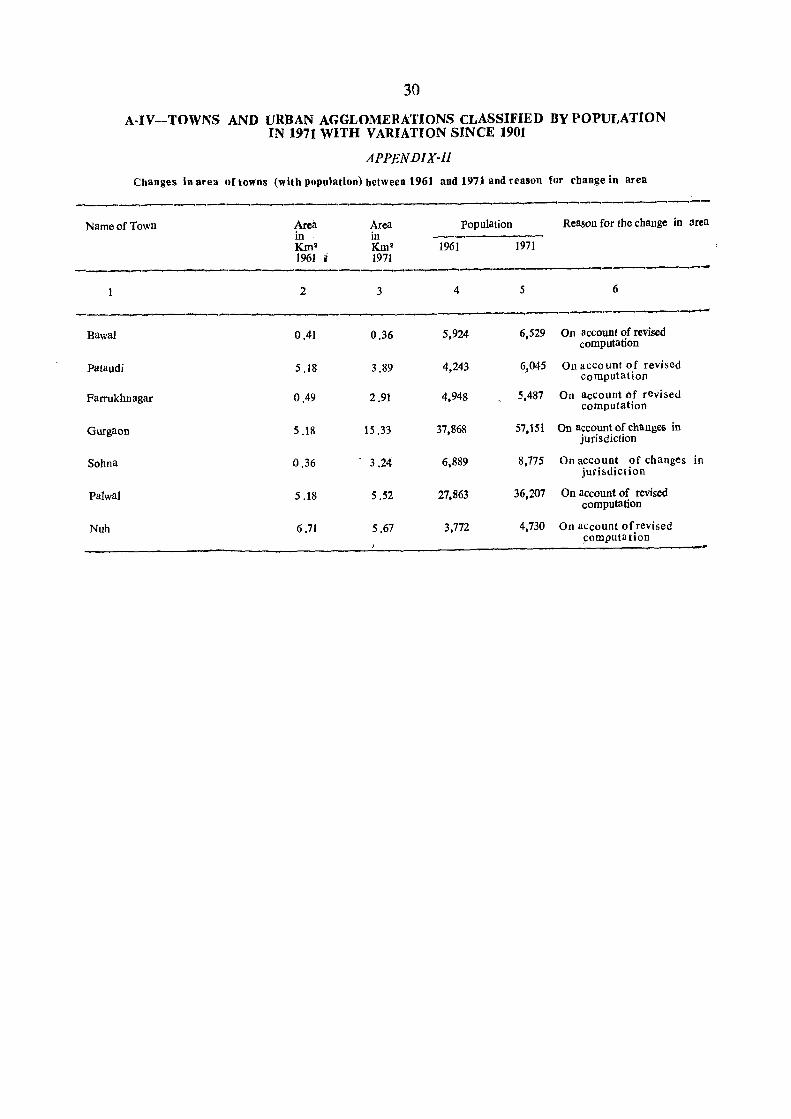
9. This Appendix gives the changes in area of towns (with population) between 1961 and 1971 and reason for change in area. There are 7 towns of which the area has undergone change between 1961 and 1971, Of these, two towns are reported to have changed its jurisdiction while in the remaining 5 towns the change IU area is on account of revised computation.
2S

27 A-IV-TOWNS AND URBAN AGGLOMERATIONS CLASSIFIED BY POPULATION
IN 1971 WITH VARIATION SINCE 1901
Serial Name of Town/Urban Year Status Area Persons Decade Percentage Males Females No. Agglomeration of in Variation Decade
Town Km" Variation -- ~~------- ~-
2 3 4 5 6 7 8 9 10
_-------------------------GURGAON DISTRICT
• Class II (50,000-99,999)-2 Towns
1. Faridabad Township 1901 1911 1921 1931 1941 1951 S.T.C. 23,125 12,133 10,992 1961 NAC. 12.80 39,852 +16,727 +72.33 21,990 17,862 1971 M.C. 12.80 85,762 +45,910 +115.20 49,164 36,598
2. Gurgaon .. 1901 c.L. 4,765 2,669 2,096 1911 C.L. 5,461 +696 +14.61 3,084 2,377 1921 C.L. 5,107 -354 -6.48 2,906 2,201 1931 C.L. 7,208 +2,101 +41.14 4,212 2,996 1941 C.L. 9,935 +2,727 +37.83 5,593 4,342 1951 M.C. 18,613 +8,678 +87.35 9,962 8,651 1961 M.C. 5.18 37,868 +19,255 +103.45 20.269 17.599 1971 M.C. 15.33 57,151 +19,283 +50.92 30,481 26,670
Class In (20,000- 49,999)-2, Towns
3. Rewari " 1901 M 27,295 13,939 13,356 1911 M 24,780 -2,515 -9.21 12,885 11,895 1921 M 23,129 -1,651 -6.66 12,586 10,543 1931 M 26,269 +3,140 +13.58 14,383 11,886 1941 M 30,673 +4,404 +16.77 16,569 14,104 1951 M.C. .. 34,082 +3,409 +11 .11 18,106 15,976 1961 M.C. 6.06 36,994 +2,912 +8.54 19,445 17,549 1971 M.C. 6.06 43,885 +6,891 +18.63 23,327 20,558
4. palwr:J .. 1901 M 12.t30 .. 6,710 6,120 1911 M 9,485 . -3,345 -26.07 5.044 4,441 1921 M 9,352 -133 -1.40 5,049 4,303 1931 M 10,807 +1,455 +15.56 5.893 4,914 1941 M 13,606 +2,799 +25.90 7,260 6,346 1951 M.C. 13,915 +309 +2.27 7,318 6,597 1961 M.C. 5.18 27,863 +13,948 +100.24 14,657 13,206 1971 M.C. 5.52 36,207 +8,344 +29.95 19,538 16,669
Class IV (10,000-19,999)-3 Towns
5. Faridabad ., 1901 M 5,310 2,768 2,542 1911 M 4,487 -823 -15.50 2,384 2,103 1921 M 4,337 -150 -3.34 2.310 2.027 1931 M 5,134 +797 +18.38 2,880 2,254 1941 M 6,367 +1,233 +24.02 3,135 3,232 1951 M.e. 8,3M +1.974 +31.00 4,331 4,010 1961 ' M.e. 10.36 10857 +2,516 +30.16 5,791 5,066 1971 M.e. 10.36 19,644 +8,787 +80.93 10,956 8,688
6. Ballabgarh .. 1901 M 4,506 2,372 2,134 1911 M 4,053 -453 -10.05 2,176 1.877 1921 M 3,721 -332 -8.l9 2,013 1,708 1931 M 4.162 +441 +11.85 2,293 1,869 1941 M 5.108 +946 +22.73 2,889 2,219 1951 M.C. 5,927 +819 +16.03 3,228 2,699 1961 M.C. ·2.59 8,330 +2,403 +40.54 4,504 3.826 1971 M.C. 2.59 17,411 +9,081 +109.02 9,910 7,501
7. Hodal .. 1901 M 8,142 4,172 3,970 1911 M 5,468 -2,674 -32.84 2,898 2,570 1921 M 5,854 +386 +7.06 3,189 2.665 1931 M 7,258 +1,404 +23.98 3,883 3,375 1941 M 8,661 +1,403 +19.33 4,643 4,018 1951 M.C. 8,303 -358 -4.13 4,399 3,904 1961 M.C. 2.59 10,558 +2,255 +27.16 5,609 4.949 1971 M.e. 2.59 14,144 +3,586 +33.96 7,608 6,536
Serial No.
28
A-IV-TOWNS AND URBAN AGGLOMERATIONS CLASSIFIED BY POPULATION IN 1971 WITl{VARIATION SINCE 1901-conid.
Name of Town/Urban Year Status Area Persons Decade Percentage Males Agglomeration of in variation Decade
Town Km2 Variation
Females
--~~ -~---~~----
2 3 4 5 6 7 8 9 10
-----~---.-----~
Class V (5,000-9,999)-5 Towns
~. Sohna .. 1901 M 6,024 .. 3,056 2,968 1911 5,138 -886 -14.71 2,618 2,520 1921 4,758 -380 -7.40 2,491 2,267 1931 5,667 +909 +19.10 3,052 2,615 1941 5,710 +43 +0.76 2,936 2,774 1951 S.T.C. 5,138 -572 -10.02 2,681 2,457 1961 M.C. 0.36 6,889 +1,751 +34.08 3,637 3,252 1971 M.C. 3.24 8,775 +1,886 +27.38 4,669 4,106
9. Ferozepur Jhirka .. 1901 M 7,278 3,608 3,670 1911 M 5,719 -1,559 -21.42 2,918 2,801 1921 M 4,542 -1,177 -20.58 2,353 2,189 1931 M 5,390 ..J..848 +18.67 2,875 2,515 1941 M 6,192 +802 +14.88 3,289 2,903 1951 M.C. 4,444 -1,748 -28.23 2,373 2,071 1961 M.C. 3.42 5,775 +1,331 +29.95 3,058 2,717 1971 M.e. 3.42 7,962 +2,187 +37.87 4,222 3,740
10. Bawal .. 1901 5,739 2,933 2,806 1911 5,332 -407 -7.09 2,669 2,663 1921 5,137 -195 -3.66 2,669 2,468 1931 4,944 -193 -3.76 2,448 2,496 1941 5,709 +765 +15.47 2,862 2,847 1951 S.T.C. 5,392 -317 -5.55 2,781 2,611 1961 M.C. 0.41 5,924 +532 +9.87 3,118 2,806 1971 M.C. 0.36 6,529 +605 +10 .21 3,408 3,121
II. Pataud .. 1901 1911
4,171 . . ~ . Declassified
'2,121 2,050
1921 3,342 1,708 1,634 1931 M 3,667 +325 +9.72 1,882 1,785 1941 M 4,105 +438 +11.94 2,065 2,040 1951 S.T.C. 3,688 -417 -10.16 1,923 1,765 1961 M.C. 5.18 4,243 +555 +15.05 2,245 1,998 1971 M.C. 3.89 6,045 +1,802 +42.47 3,121 2,924
12. Farrukhnagar 1901 M 6,136 2,996 3,140 1911 3,158 -2,978 -48.53 1,598 1,560 1921 Declassified 1931 Do 1941 5,122 2,548 2,574 1951 S.T.C. 4,947 -175 -3.42 2,569 2,378 1961 M.C. 0.49 4;948 +1 +0.02 2,626 2,322 1911 M.C. 2.91 5,487 +539 +10.89 2,886 2,601
Class VI «L ess tban 5,000)- 2 Towns
13. Nuh 1901 1911 1921 1931 1941 1951 N.A.C. 2,892 1,533 1,359 1961 M.C. 6.71 3,772 +880 +30.43 2,024 1,748 1971 M.C. 5.61 4,130 +958 +25.40 2,596 2,134
29
A-tV-TOWNS AND URBAN AGGLOMERATIONS CLASSIFIED BY POPULATION IN 1971 WITH VARIATION SINCE 1901-concld.
Name of Town/Urban Year Status Area Persons Decade Percentage Serial No. Agglomeration of .in Variation Decade
Town Km 2
_----------2 3 4 S 6
Class VI (Less than S,OOO)-collcid.
14. Haileymandi .. 1901 1911 1921 1931 1941 1951 1961 1971
S.T.C. M.C. M.C.
2.59 2.59
1,346 1,728 2,252
Note:-,The following abbreviations have been used for the status of a town :M.C.-Municipal Committee. N.A.C.-Notified Area Committee. S.T.C.-Small Town Committee. M.-Municipality. C.L.-Civil Lines.
, Variation
7 8
+382 +28.38 +524 +30.32
Males
9
719 950
1,223
Females
10
627 778
1,029
30
A·IV-TOWNS AND URBAN AGGLOMERATIONS CLASSIFIED BY POPULATION IN 1971 WITH VARIATION SINCE 1901
APPENDIX-II
Changes in area of towns (with popnlation) between 1961 and 1971 and reason for change in area
------------------_,-__..,.__,--------------~----
Name of Town Area Area population Reason for the change in area in in -----~--Kro2 Km' 1961 1971 1961 ii 1971
---------.----~-------~~- --------------2 3 4 5 6
------.----- _._-------Bawal o Al 0.36 5,924 6,529 On account of revised
computation
Pataudi 5.18 3.89 4,243 6,045 On acco unt of revised computation
Farrukhnagar 0.49 2.91 4,948 5,487 On account of revised computation
Gurgaon 5.18 15.33 37,868 57,151 On account of changes in jurisdiction
Sohna 0.36 3.24 6,889 8,775 On account of changes jurisdiction
in
palwal 5.18 5.52 27,863 36,207 On account of revised computation
Nuh 6.71 5.67 3,772 4,730 On account ofrevised computa tion
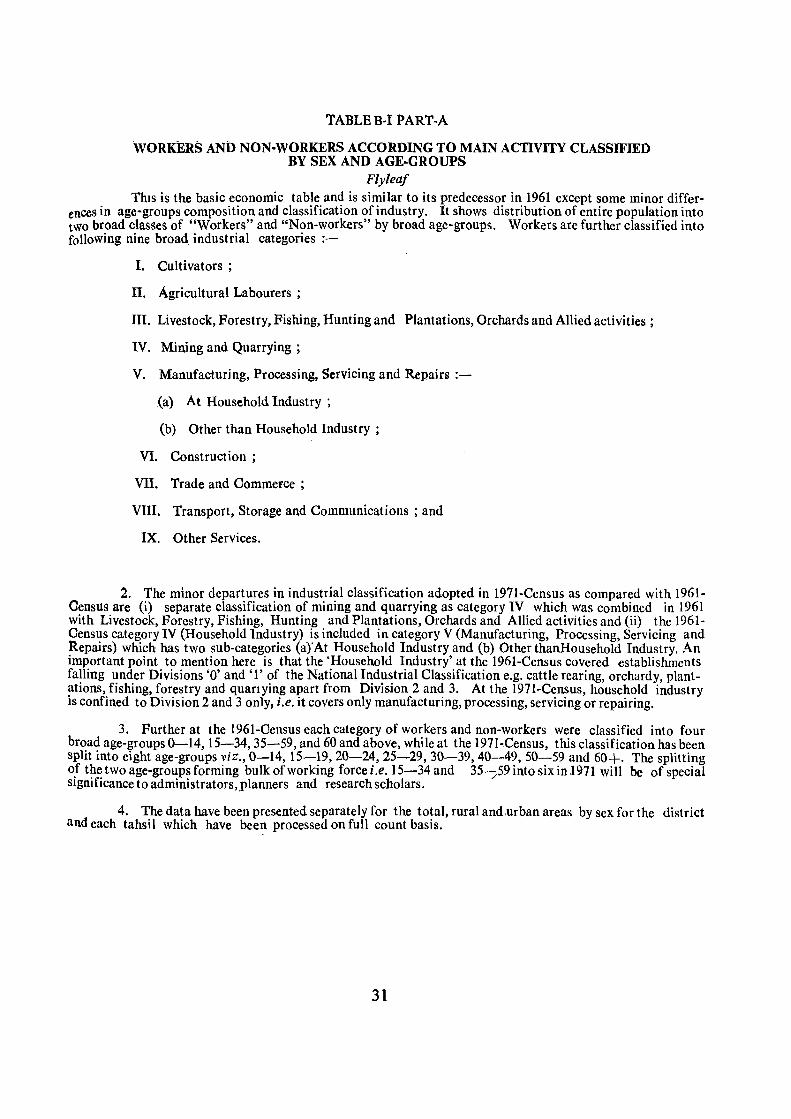
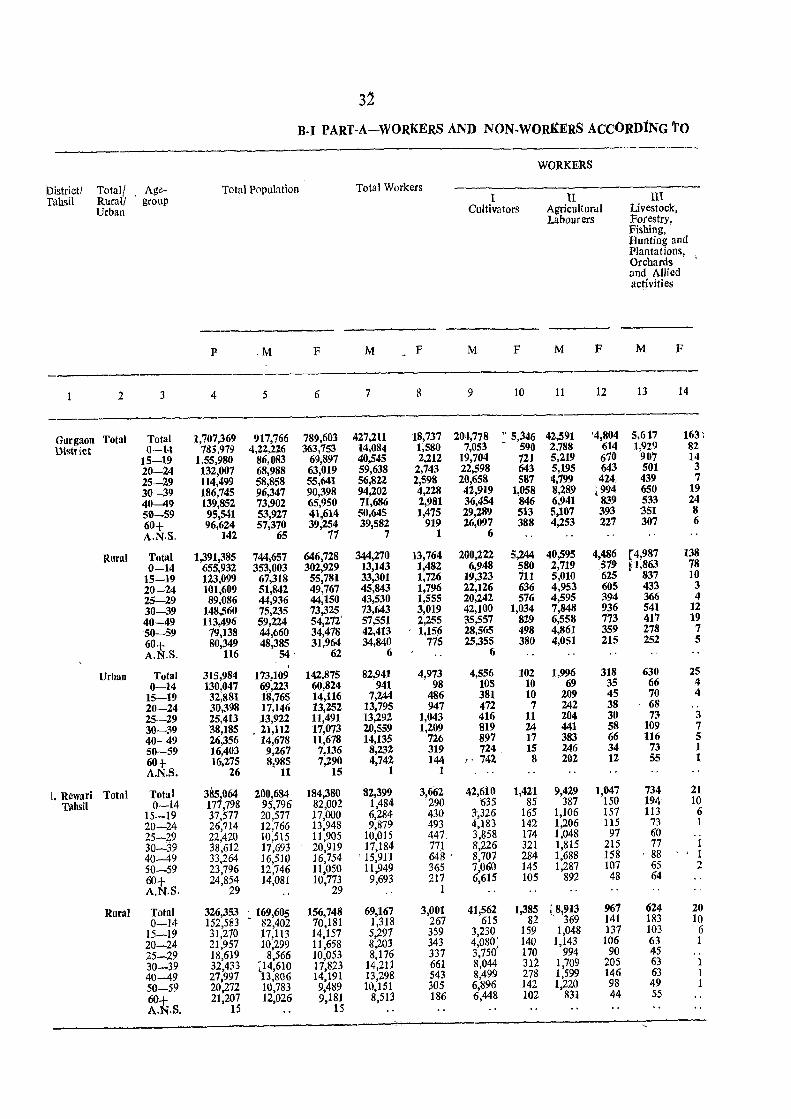
TABLE B-1 PART-A
WORKERS AND NON-WORKERS ACCORDING TO MAIN ACTIVITY CLASSIFIEO BY SEX AND AGE-GROUPS
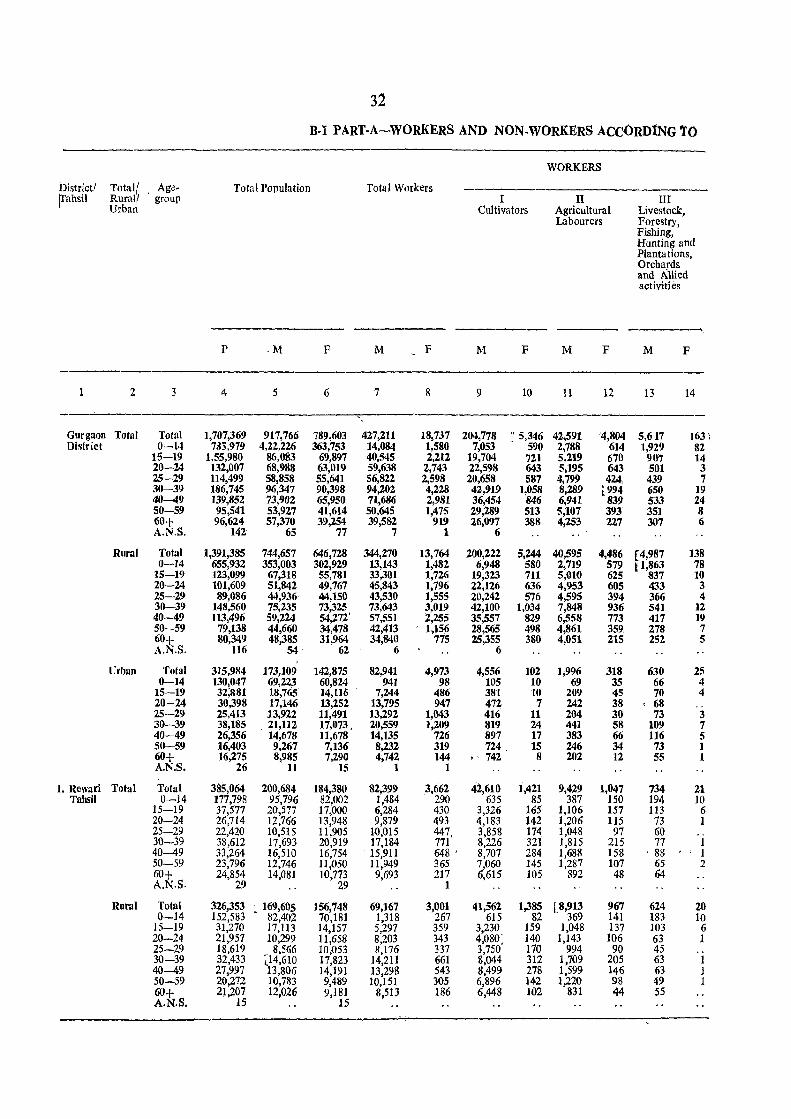
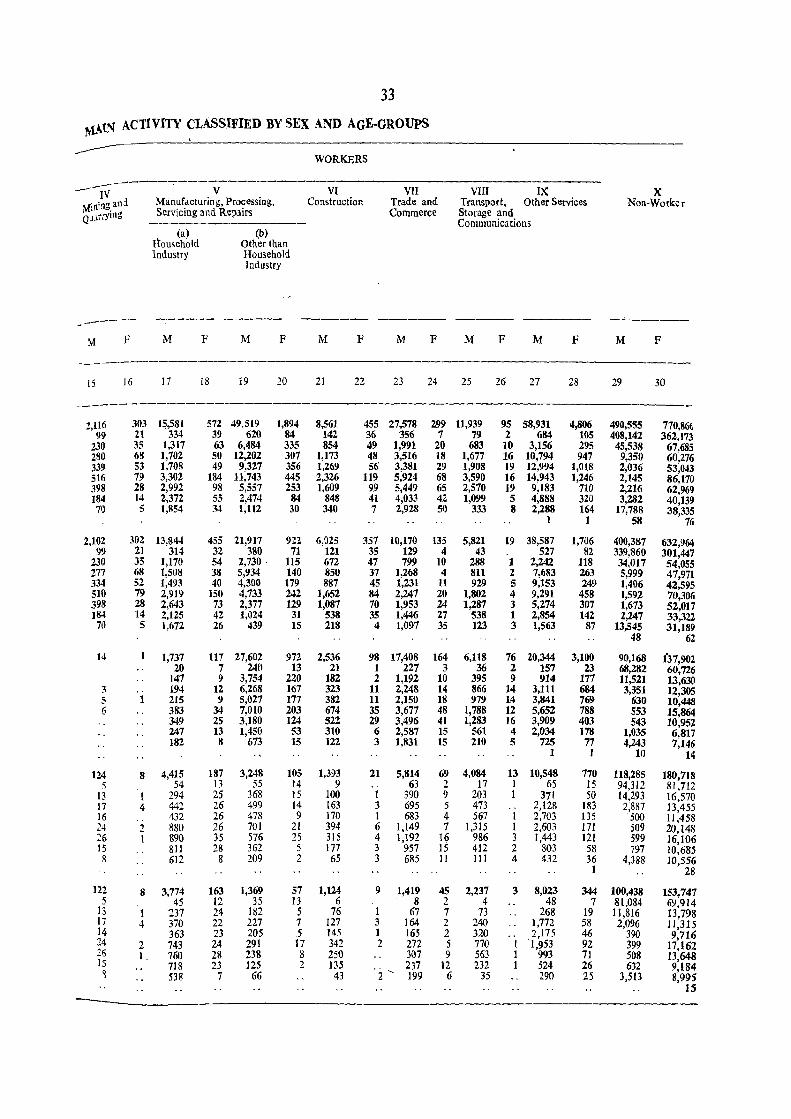
Flyleaf This is the basic economic table and is similar to its predecessor in 1961 except some minor differ
ences in age-groups composition and classification of industry. , It shows distribution of entire popUlation into two broad class(!s of "Workers" and "Non-workers" by broad age-groups. Workers are further classified into following nine broad industrial categories :-
I. Cultivators;
II. Agricultural Labourers ;
lIT. Livestock, Forestry, Fishing, Hunting and Plantations, Orchards and Allied activities;
IV. Mining and Quarrying ;
V. Manufacturing, Processing, Servicing and Repairs :
(a) At Household Industry ;
(b) Other than Household Industry;
VI. Construction;
VII. Trade and Commerce ;
VIII. Transport, Storage and Communications ; and
IX. Other Services.
2. The minor departures in industrial classification adopted in 1971-Census as compared with 1961-Oensus are (i) separate classification of mining and quarrying as category IV which was combined in 1961 with Livestock, Forestry, Fishing, Hunting and Plantations, Orchards and Allied activities and (ii) the 1961-Census category IV (Household Industry) is included in category V (Manufacturing, Processing, Servicing and Repairs) which has two sub-categories (a) 'At Household Industry and (b) Other thanHousehold Industry. An important point to mention here is that the 'Household Industry' at the 1961-Census covered establishments falling under Divisions '0' and' l' of the National Industrial Classification e.g. cattle rearing, orchardy, plantations, fishing, forestry and quanying apart from Division 2 and 3. At the 1971-Census, household industry is confined to Division 2 and 3 only, i.e. it covers only manufacturing, processing, servicing or repairing.
3. Further at the 1961-0ensus each category of workers and non-workers were classified into four broad age-groups 0-14,15-34,35-59, and 60 and above, while at the 1971-Census, this classification has been split into eight age-groups viz., 0-14, 15-19,20-24,25-29,30-39,40-49,50-59 and 60+. The splitting o.f the two age-groups forming bulk of working force i.e. 15-34 and 35/59 into six in 1971 wilt be of special Significance to administrators,planners and research scholars.
4. The data have been presented separately for the total, rural and urban areas by sex for the district and each tahsil which have been processed on full count basis.
31
pistricti [I'ahsil
Gurgaon District
1. Rewari Tahsil
Total! , AgeRural/ group Urban
2 3
Total Total 0-14
15-19 20-24 25-29 30-39 40-49 50-59 60+ A.N,S.
Rural Total 0-14
15-19 20-24 25-29 30-39 40-49 50-59 60+ A.N.S.
Urban Total 0-14
15-19 20-24 25-29 30-39 40-49 SO-59 60+ A.N.S.
Total Total 0-14
15-19 20-24 25-29 30-39 40-49 50-59 60+ A.N.S.
Rural Total 0-14
15-19 20-24 25-29 30-39 40-49 50-59 60+ A.N.S.
32
B-1 PART-A-WORKERS AND NON-WORKERS ACCORDtNG TO
Total Population Total Workers
P ·M F M F
4 5 6 7 8
1,707,369 917,766 789,603 427,211 18,737 785,979 4,22,226 363,753 14,084 1,580
1,55,980 86,083 69,897 40,545 2,212 132,007 68,988 63,019 59,638 2,743 114,499 58,858 55,641 56,822 2,598 186,745 96,347 90,398 94,202 4,228 139,852 73,902 65,950 71,686 2,981 95,541 53,927 41,614 50,645 1,475 96,624 57,370 39,254 39,582 919
142 65 77 7 1
1,391,385 744,657 646,728 344,270 13,764 655,932 353,003 302,929 13,143 1,482 123,099 67,318 55,781 33,301 1,726 101,609 51,842 49,767 45,843 1,796 89,086 44,936 44,150 43,530 1,555
148,560 75,235 73,325 73,643 3,019 113,496 59,224 54,272' 57,551 2,255
79,138 44,660 34,478 42,413 ' 1,156 80,349 48,385 31,964 34,840 775
116 54 62 6
315,984 173,109 142,875 82,941 4,973 130,047 69,223 60,824 941 98 32;881 18,765 14,116 7,244 486 30,398 17,146 13,252 13,795 947 25,413 13,922 11,491 13,292 1,043 38,185 21,112 17,073, 20,559 1,209 26,356 14,678 11,678 14,135 726 16,403 9,267 7,136 8,232 319 16,275 8,985 7,290 4,742 144
26 11 15 1 1
385,064 200,684 184,380 82,399 3,662 177,798 95,796 82,002 1,484 290 37,577 20,577 17,000 6,284 430 26,714 12,766 13,948 9,879 493 22,420 10,515 11,905 10,015 447, 38,612 17,693 20,919 17,184 771 33,264 16,510 16,754 15,911 648 ' 23,796 12,746 11,050 11,949 365 24,854 14,081 10,773 9,693 217
29 29 1
326,353 • 169,605 156,748 61),167 3,001 152,583 82,402 70,181 1,318 267 31,270 17,1l3 14,157 5,297 359 21,957 10,299 11,658 8,203 343 18,619 8,566 ]0,053 8,176 337 32,433 ~14,610 17,823 14,211 661 27,997 13,806 14,191 13,298 543 20,272 ]0,783 9,489 10,151 305 21,207 12,026 9,181 8,513 186
15 15
I Cultivators
M F
9 10
20.J,778 " 5346 7,053 • '590
19,704 721 22,598 643 20,658 587 42,919 1,058 36,454 846 29,289 513 26,097 388
6
200,222 5,244 6,948 580
19,323 711 22,126 636 20,242 576 42,100 1,034 35,557 829 28,565 498 25,355 380
6
4,556 102 105 10 381 10 472 7 416 11 819 24 897 17 724. 15
,. 742 8
42,610 1,421 635 85
3,326 165 4,183 142 3,858 174 8,226 321 8,701 284 7060 145 6,615 105
41,562 1,385 615 82
3,230 159 4,080; 140 3,750 170 8,044 312 8,499 278 6,896 142 6,448 102
WORKERS
II Agricultural Labourers
M F
11 12
42,591 '4,804 2,788 614 5,219 670 5,195 643 4,799 424, 8,289 i..994 6,941 839 5,107 393 4,253 227
40,595 4,486 2,719 579 5,010 625 4,953 605 4,595 394 7,848 936 6,558 773 4,861 359. 4,051 215
1,996 318 69 35
209 45 242 38 204 30 441 58 383 66 246 34 202 12
9,429 1,047 387 150
1,106 157 1,206 115 1,048 97 1,815 215 1,688 158 1,287 107
892 48
[8,913 967 . 369 141 1,048 137
1,]43 106 994 90
1,709 205 1,599 ]46 ],220 98
831 44
III Livestock, Forestry, Fishing, Hunting and Plantations, Orchards and Allied activities
M F
13 14
5,617 1631 1,929 82
907 14 501 3 439 7 650 19 533 24 351 8 307 6
(4,987 138 p,863 78
837 10 433 3 366 4 541 12 417 19 278 7 252 5
630 25 66 4 70 4
, 68 73 3
109 7 116 5
73 1 55 1
734 21 194 10 113 6
73 1 60 77 1
' 88 1 65 2 64
624 20 183 10 103 6 63 1 45 .. 63 1 63 1 49 1 55
33
~t~ ACTIVITY ~LASSIFIED BY SEX AND AGE·GROUPS
---Iv Mini!lg ani QJ1~;ying
----~~
M F
15 16
2,116 303 99 21
230 35 280 68 339 53 516 79 398 28 184 14 70 5
2,102 302 99 21
230 35 277 68 334 52 510 79 398 28 184 14 70 5
14 1
3 5 1 6
124 8 5
13 I 17 4 16 24 2 26 I IS 8
122 8 5
13 I 17 4 14 24 2 26 I IS ~
V Manufacturing, Processing, Servicing and Replirs
(a) Household Industry
(b) Other than Household Industry
WORKERS
VI Construction
VII Trade and Commerce
-_----- ------_ ------ -----M F M F M F M F
17 18 19 20 21 22 23 24
1:;,581 572 49,519 1,894 8,561 455 27,578 299 334 39 620 84 142 36 356 7
1,317 63 6,484 335 854 49 1,991 20 1,702 50 12,202 307 1,173 48 3,516 18 1,708 49 9,327 356 1,269 56 3,381 29 3,302 184 11,743 445 2,326 119 5,924 68 2,992 98 5,557 253 1,609 99 5,449 65 2,372 55 2,474 84 848 41 4,033 42 1,854 34 1,112 30 340 7 2,928 50
13,844 455 21,917 92Z. 6,025 357 10,170 135 314 32 380 71 121 35 129 4
1,170 54 2,730, 115 672 47 799 10 1,508 38 5,934 140 850 37 1,268 4 1,493 40 4,300 179 887 45 1,231 11 2,919 150 4,733 242 1,652 84 2,247 20 2,643 73 2,377 129 1,087 70 1,953 24 2,125 42 1,024 31 538 35 1,446 27 1,672 26 439 15 218 4 1,097 35
1,737 117 27,602 972 2,536 98 17,408 164 20 7 240 13 21 1 227 3
147 9 3,754 220 182 2 1,192 10 194 12 6,268 167 323 11 2,248 14 215 9 5,027 177 382 11 2,150 18 383 34 7,010 203 674 35 3,677 48 349 25 3,180 124 522 29 3,496 41 247 13 1,450 53 310 6 2,587 15 182 8 673 15 122 3 1,831 15
4,415 187 3,248 105 1,393 21 5,814 69 54 13 55 14 9 63 2
294 25 368 15 100 1 390 9 442 26 499 14 163 3 695 5 432 26 478 9 170 1 683 4 880 26 701 21 394 6 1,149 7 890 35 576 25 315 4 1,192 16 811 28 362 5 177 3 957 15 612 8 209 2 65 3 685 11
3,774 163 1,369 57 1,124 9 1,419 45 45 12 35 13 6 8 2
237 24 182 5 76 1 67 7 370 22 227 7 127 3 164 2 363 23 205 5 145 I 165 2 743 24 291 17 342 2 272 5 760 28 238 8 250 307 9 718 23 125 2 135 237 12 538 7 66 43 2 ' 199 6
VIII IX Transport, Other Services Storage and Communications
----M F M
25 26 27
11,939 95 58,931 79 2 684 683 10 3,156
1,677 16 10,794 1,908 19 J2,994 3,590 16 14,943 2,570 19 9,183 1,099 5 4,888
333 8 2,288 1
5,821 19 38,587 43 527
288 1 2,242 811 2 7,683 929 5 9,153
1,802 4 9,291 1,287 3 5,274
538 1 2,854 123 3 1,563
6,118 76 20,344 36 2 157
395 9 914 866 14 3,111 979 14 3,841
1,788 12 5,652 1,283 16 3,909
561 4 2,034 210 5 72S
1
4,084 13 10,548 17 1 65
203 1 371 473 " 2,128 567 I 2,703
1,315 1 2,603 986 3 1,443 412 2 803 111 4 432
2,237 3 8,023 4 48
73 26B 240 1,772 320 .. 2,175 770 1 1,953 563 I 993 232 1 524
35 290
F
28
4,806 105 295 947
1,018 1,246
710 320 164
1
1,706 82
118 263 249
458 307 142
87
3,100 23
177 684 769 788 403 178 77 1
770 15 50
183 135 171 121 58 36 1
344 7
19 58 46 92 71 26 25
X Non-Worker
-----M F
29 30
490,555 770,86t 408,142 362,173 45,538 67,685 9,350 60,276 2,036 53,043 2,145 86,170 2,216 62,969 3,282 40,139
17,788 38,335 58 76
400,387 632,964 339,860 301,447 34,017 54,055 5,999 47,971 1,406 42,595 1,592 70,306 1,673 52,017 2,247 33,322
13,545 31,189 48 62
90,168 [37,902 68,282 60,726 11,521 13,630 3,351 12,305
630 10,448 553 15,864 543 10,952
1,035 6,817 4,243 7,146
10 14
118,285 180,718 94,312 81,712 14,293 16,570 2,887 13,455 '500 11,458 509 20,148 599 16,106 797 10,685
4,388 10,556 2B
100,438 153,747 81,084 69,914 11,816 13,798 2,096 11,315
390 9,716 399 17,162 508 13,648 632 9,184
3,513 8,995 15
32
B-1 PART-A-WORKERS AND NON-WORKERS ACCORD1NG TO
WORKERS
pistrictl Total/ ' Ag~- Total Population Total Workers l'nhsil Rural{ group I II III
Urban Cultivators Agricultural Livestock, Labourers Forestry,
Fishing, Hunting and Plantations, Orchards and Allied activities
-------p .M F M F M F M F M F
2 3 4 5 6 7 8 9 10 11 12 13 14
Gurgaon Total Total 1,707,369 917,766 781),603 427,211 18,737 20,1,778 " 5346 42,591 '4,804 5,617 163,
District 0-14 7iH,919 4,22,216 363,753 14,084 1;580 7,053 - '590 2,788 614 1,929 82 15-19 1,55.980 86,083 69,897 40,545 2,212 19,704 121 5,219 670 9o, 14
20-24 132,007 68,988 63,019 59,638 2,743 22,598 643 5,195 643 501 3
25-29 114,499 58,858 55,641 56,822 2,598 20,658 587 4,799 424, 439 7
30-39 186,745 96,347 90,398 94,202 4,228 42,919 1,058 8,289 1.994 650 19
40-49 139,852 13,902 65,950 71,686 2,981 36,454 846 6.941 839 533 24
50-59 95,541 53,927 41,614 50,645 1,475 29,289 513 5,107 393 351 8
60+ 96,624 57,310 39,254 39,582 919 26,097 388 4,253 227 307 6
A.N.S. 142 65 77 7 1 6
Rural Total 1,391,385 744,657 646,728 344,270 13,764 200,222 5,244 40,595 4,486 (4,987 138
0-14 655,932 353,003 302,929 13,143 1,482 6,948 580 2,719 579 t 1,863 78
15-19 123,099 67,318 55,781 33,301 1,726 19,323 711 5,010 625 837 10
20-24 101,609 51,842 49,767 45,843 1,796 22,126 636 4,953 605 433 3
25-29 89,086 44,936 44,150 43,530 1,555 20,242 576 4,595 394 366 4
30-39 148,560 75,235 73,325 73,643 3,019 42,100 1,034 7,848 936 541 12
40-49 113,496 59,224 54,272' 57,551 2,255 35,557 829 6,558 773 417 19
50-59 79,138 44,660 34,478 42,413 ' 1,15.6 28,565 498 4,861 359 278 7
60+ 80,349 48,385 31,964 34,840 775 25,355 380 4,051 215 252 5
A.N,S. 116 54' 62 6 6 ,
Urban Total 315,984 173,109 142,875 82,941 4,973 4,556 102 1,996 318 630 25
0-14 130,047 69,223 60,824 941 98 105 10 69 35 66 4
15-19 32;881 18,765 14,116 7,244 486 381 10 209 45 70 4
20-24 30,398 17,146 13,252 13,795 947 472 7 242 38 . 68 .. 25-29 25,413 J3,922 11,491 13,292 1,043 416 11 204 30 73 3
30-39 38,185 , 21,112 17,073 20,559 1,209 819 24 441 58 109 7
40-49 26,356 14,678 11,678 14,135 726 897 17 383 66 116 5
50-59 16,403 9,267 7,136 8,232 319 724 15 246 34 73 1
60+ 16,275 8,985 7,290 4,742 144 ,< 742 8 202 12 55 1
A.N.S. 26 11 15 1 1
I. Rewari Total Total 385,064 200,684 184,380 82,399 3,662 42,610 1,421 9,429 1,047 734 21
TIlhsii 0-14 177,798 95,796 82,002 1,484 290 635 85 387 150 194 10 15-19 37,577 20,577 17,000 6,284 430 3-,326 165 1,106 157 113 6
20-24 26,714 12,766 13,948 9,879 493 4,183 142 1,206 llS 73 1 25-29 22,420 10,515 11,905 10,015 447 3,858 174 1,048 97 60
30-39 38,612 17,693 20,919 17,184 771 8,226 321 1,815 2]5 77 1
40-49 33,264 16,510 16,754 . 15,9Jl 648 ' 8,701 284 1,688 158 ' 88 ' 1
50-59 23,796 12,746 11,050 11,949 365 7,060 145 1,287 107 65 2
60+ 24,854 14,081 10,773 9,693 217 6,615 105 892 48 64
A.N.S. 29 29 1
Rural Total 326,353 ~ 169,605 156,748 69,167 3,001 41,562 1,385 l8,913 967 624 20
0-]4 152,583 82,402 70,181 1,318 267 615 82 369 141 183 10
15-19 31,270 17,113 14,157 5,297 359 3,230 159 1,048 137 103 6 20-24 21,957 10,299 11,658 8,203 343 4,080; 140 1,143 106 63 1 25-29 18,619 8,566 10,053 8,176 337 3,750 170 994 90 45 ,.
30-39 32,433 ~14,610 17,823 14,211 661 8,044 312 1,709 205 63 1
40-49 27,997 13,806 14,191 13,298 543 8,499 278 1,599 146 63 1
50-59 20,272 10,783 9,489 10,151 305 6,896 142 1,220 98 49 1
60+ 21,207 12,026 9,181 8,513 186 6,448 102 831 44 55
A.N.S. 15 15

33
l\1AI~ ACTIVITY CLASSIFIED BY SEX AND AGE-GROUPS
-----iV Mining ard QJlf!ying
--~--
M F \
15 16
2,116 303 99 21
230 35 280 68 339 53 516 79 398 28 184 14 70 5
2,102 302 99 21
230 35 277 68 334 52 510 79 398 28 184 14
70 5
14
3 .. 5 1 6
124 8 5
13 1 17 4 16 24 2 26 1 15 8
122 8 5
13 1 17 4 14 24 2 ~;J 1 IS ~
V Manllfacturing, Processing, Servicing and Replirs
(a) Household Industry
(b) Other than Household Industry
WORKERS
VI Const£llction
VII Trade and Commerce
------ _----- ------ -----M F M F M F M F
17 18 19 20 2\ 22 23 24
15,581 572 49,519 1,894 8,561 455 27,578 299 334 39 620 84 142 36 356 7
1,317 63 6,484 335 854 49 1,991 20 1,702 50 12,202 307 1,173 48 3,516 18 1,708 49 9,327 356 1,269 56 3,381 29 3,302 184 11,743 445 2,326 119 5,924 68 2,992 98 5,557 253 1,609 99 5,449 65 2,372 55 2,474 84 848 41 4,033 42 1,854 34 1,112 30 340 7 2,928 50
13,844 455 21,917 922, 6,025 357 10,170 135 314 32 380 71 121 35 129 4
1,170 54 2,730, 115 672 47 799 10 1,508 38 5,934 140 850 37 1,268 4 1,493 40 4,300 179 887 45 1,231 11 2,919 150 4,733 242 1,652 84 2,247 20 2,643 73 2,377 129 1,087 70 1,953 24 2,125 42 1,024 31 538 35 1,446 27 1,672 26 439 15 218 4 1,0n 35
1,737 117 27,602 972 2,536 98 17,408 164 20 7 240 13 21 ] 227 3
147 9 3,754 220 182 2 1,192 10 194 12 6,268 167 323 11 2,248 14 215 9 5,027 177 382 11 2,150 18 383 34 7,010 203 674 35 3,677 411 349 25 3,180 124 522 29 3,496 41 247 13 1,450 53 310 6 2,587 15 182 8 673 15 122 3 1,831 15
4,415 187 3,248 105 1,393 21 5,814 69 54 13 S5 14 9 ., 63 2
294 25 368 15 100 1 390 9 442 26 499 14 163 3 695 5 432 26 478 9 170 1 683 4 880 26 701 il 394 6 1,149 7 890 35 576 25 315 4 1,192 16 811 28 362 ; 177 3 957 15 612 8 209 2 65 3 685 11
3,774 163 1,369 57 1,124 9 1,419 45 45 12 35 13 6 8 2
237 24 182 5 76 1 67 7 370 22 227 7 127 3 164 2 363 23 205 5 145 1 16S 2 743 24 291 17 342 2 272 5 7riJ 28 238 8 250 307 9 718 23 125 2 I35 237 12 538 7 66 43 2 ' 199 6
VIII IX Transport, Other Services Storage and Communications
M F M
25 26 27
11,939 95 58,931 79 2 684
683 10 3,156 1,677 16 10,794 1,908 19 12,994 3,590 16 14,943 2,570 19 9,183 1,099 5 4,888
333 8 2,288 1
5,821 19 38,587 43 527
288 1 2,242 811 2 7,683 929 5 9,153
1,802 4 9,291 1,287 3 5,274
538 1 2,854 123 3 1,563
6,118 76 20,344 36 2 157
395 9 914 866 14 3,111 979 14 3,841
1,788 12 5,652 1,283 16 3,909
561 4 2,034 210 5 725
1
4,084 13 10,548 17 1 65
203 1 371 473 ., 2,128 567 1 2,703
1,315 1 2,603 986 3 1,443 412 2 803 III 4 432
2,237 3 8,023 4 48
73 268 240 1,772 320 2,175 770 1 1,953 563 ] 993 232 1 524
35 290
F
28
4,806 105 295 947
1,018 1,246
710 320 164
1
1,706 82
118 263 249
458 307 142
87
3,100 23
177 684 769 788 403 178
77 1
770 15 50
183 135 171 121 58 36 1
344 7
19 58 46 92 71 26 25
X Non-Worke rs
-------M F
29 30
490,555 770,866 408,142 362,173 45,538 67,685 9,350 60,276 2,036 53,043 2,145 86,170 2,216 62,969 3,282 40,139
17,788 38,335 58 76
400,381 632,964 339,860 301,447 34,017 54,055 5,999 47,971 1,406 42,595 1,592 70.306 1,673 52,017 2,247 33,322
13,545 31,189 48 62
90,168 1"37,902 68,282 60,726 11,521 13,630 3,35. 12,305
630 10,448 553 15,864 543 10,952
1,035 6,817 4,243 7,146
10 14
118,285 180,718 94,312 81,712 14,293 16,570 2,887 13,455
500 11,458 509 20,148 599 16,106 797 10,685
4,388 10,556 28
100,438 153,747 81,084 69,914 11,816 13,798 2,096 11,315
390 9,716 399 17,162 508 13,648 632 9,184
3,513 8,995 15
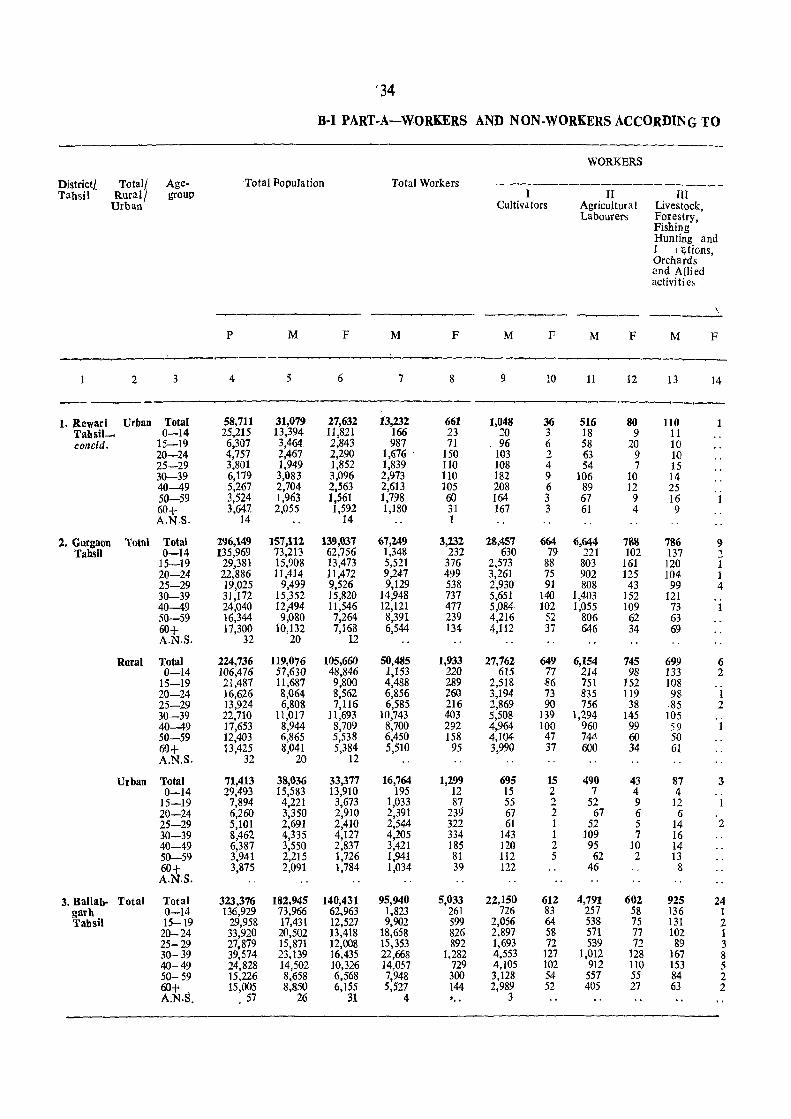
'34
B-1 PART-A-WORKERS AND NON-WORKERS ACCORDING TO
WORKERS
DistrictL Total/ Age- Total Population Total Workers ---------------------Tahsil Rural] group I II III
Urban Cultivators Agricultural Livestock, Labourers Forestry"
Fishing Hunting and r Iljtions, Orchards and Allied activities
\ --~~
P M F M F M F M F M F
~---
2 3 4 5 6 7 8 9 10 11 12 13 14
_----- ~--~ ----I. Rewari Urban Total 58,711 31,079 27,632 13,232 661 1,048 36 516 80 110 1
Tahsil- 0-14 25,215 13,394 11,821 166 23 20 3 18 9 11 coneld. 15-19 6,307 3,464 2,843 987 71 . 96 6 58 20 10
20-24 4,757 2,467 2,290 1,676 . 150 103 2 63 9 10 25-29 3,801 1,949 1,852 1,839 110 108 4 54 7 15 30-39 6,179 3,083 3,096 2,973 110 182 9 106 10 14 40-49 5,267 2,704 2,363 2,613 105 208 6 89 12 25 .. 50-59 3,524 1,963 1,561 1,798 60 164 3 67 9 16 1 60+ 3,647 2,055 1,592 1,180 31 167 3 61 4 9 A.N.s. 14 14 1
2. Gurgaon Total Total 296,149 157,112 139,037 67,249 3,232 28,457 664 6,644 788 786 9 Tahsil 0-14 135,969 73,213 62,756 1,348 232 630 79 221 102 137 :2
15-19 29,381 15,908 13,473 5,521 376 2,573 88 803 161 120 1 20-24 22,886 11,414 11,472 9,247 499 3,261 75 902 125 104 1 25-29 19,025 9,499 9,526 9,129 538 2,930 91 808 43 99 4 30-39 31,172 15,352 15,820 14,948 737 5,651 140 1,403 152 121 .. 40-49 24,040 12,494 11,546 12,121 477 5,084 102 1,055 109 73 1 50-59 16,344 9,080 7,264 8,391 239 4,216 52 806 62 63 60+ 17,300 10,132 7,168 6,544 134 4,112 37 646 34 69 A.N.S. 32 20 12
Rural Total 224,736 119,076 105,660 50,485 1,933 27,762 649 6,154 745 699 6 0-14 106,476 57,630 48,846 1,153 220 615 77 214 98 133 2
15-19 21,487 11,687 9,800 4,488 289 2,518 86 751 152 108 .. 20-24 16,626 8,064 8,562 6,856 260 3,194 73 835 119 98 1 25-29 13,924 6,808 7,116 6,585 216 2,869 90 756 38 85 2 30-39 22,710 11,017 11,693 10,743 403 5,508 139 1,294 145 105 40-49 17,653 8,944 8,709 8,700 292 4,964 100 960 99 59 50-59 12,403 6,865 5,538 6,450 158 4,104 47 744- 60 50 60+ 13,425 8,041 5,384 5,510 95 3,990 37 6QO 34 61 A.N.S. 32 20 12
Urban Total 71,413 38,036 33,377 16,764 1,299 695 15 490 43 87 3 0-14 29,493 15,583 13,910 195 12 15 2 7 4 4 ..
15-19 7,894 4,221 3,673 1,033 87 55 2 52 9 12 1 20-24 6,260 3,350 2,910 2,391 239 67 2 67 6 6 25-29 5,101 2,691 2,410 2,544 322 61 I 52 5 14 2 30-39 8,462 4,335 4,127 4,205 334 143 1 109 7 16 40-49 6,387 3,550 2,837 3,421 185 120 2 95 10 14 50-59 3,941 2,215 1,726 1,941 81 112 5 62 2 13 60+ 3,875 2,091 1,784 1,034 39 122 46 8 A.N.S.
3. Hallab- Total Total 323,376 182,945 140,431 95,940 5,033 22,150 612 4,791 602 925 24 garh 0-14 136,929 73,966 62,963 1,823 261 726 83 257 58 136 1 Tabsil 15-19 29,958 17,431 12,527 9,902 599 2,056 64 538 75 131 2
20-24 33,920 20,502 13,418 18,658 826 2,897 58 571 77 102 1 25-29 27,879 15,871 12,008 15,353 892 1,693 72 539 72 89 3 30-39 39,574 23,139 16,435 22,668 1,282 4,553 127 1,012 128 167 8 40-49 24,828 14,502 10,326 14,057 729 4,105 102 912 110 153 5 50-59 15,226 8,658 6,568 7,948 300 3,128 54 557 55 84 2 60+ 15,005 8,850 6,155 5,527 144 2,989 52 405 27 63 2 A.N.S. 57 26 31 4 > •• 3
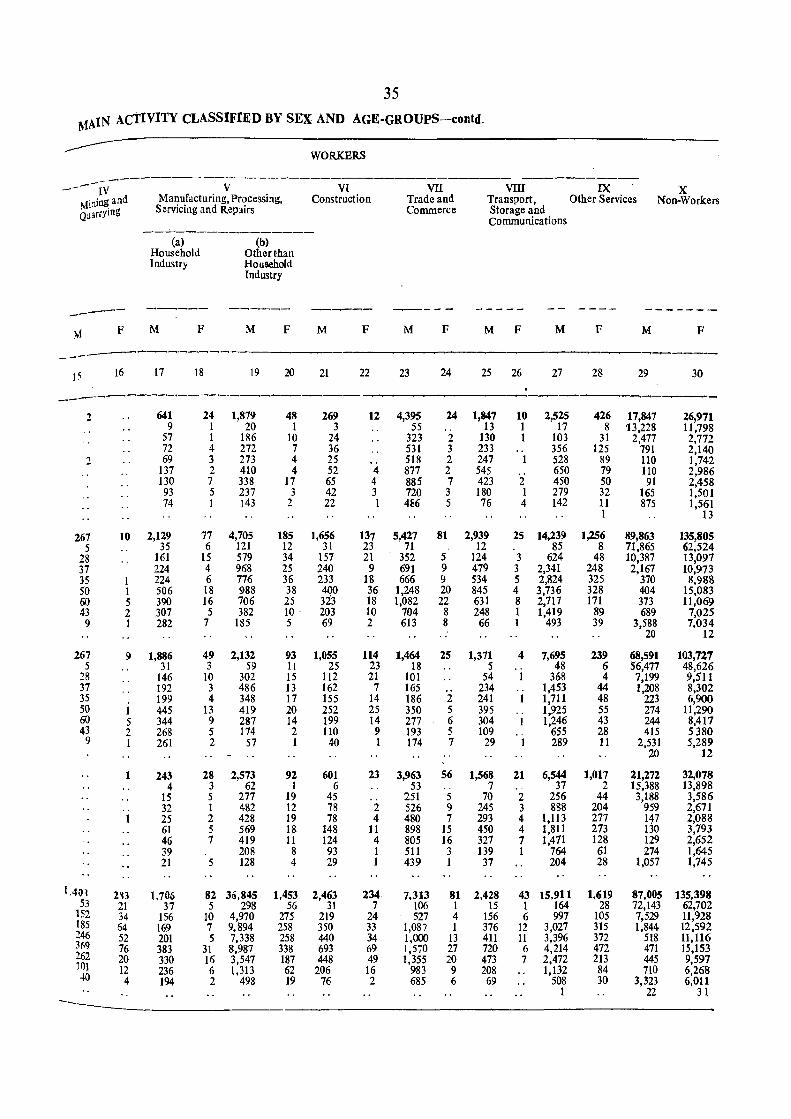
35
MAIN ACTIVITY CLASSIFIED BY SEX AND AGE-GROUPS-contdo
WORKERS
----W-----------V---------VI-------vn-----~II-----_uc-- X Mining and Ma~~facturing, Prqcessing, Construction Trade and Transport, Other Services Non-Workers
Q. J3rrying ServIcmg and Repllrs Commerce Storage and
Communications
---F
--_._-------------(a)
Household Industry
M F
(b) Other than Household Industry
M F M F M F M F M F M F
--- ----~~~-----
15 16 17 18 19 20 21 22 23 24 25 26 27
------~-----~------------------
2
2
267 5
28 37 35 50 60 43
9
267 5
28 37 35 SO 60 43
9
1.4\11 53
152 185 246 369 262 10) 40
10
1 1 5 2 1
9
1 5 2 1
1
o.
1
2H 21 34 64 52 76 20 12 4
641 9
57 n 69
137 130 93 74
2,129 35
161 224 224 506 390 .307 282
1,886 31
146 192 199 445 344 268 261
243 4
15 32 25 61 46 39 21
1,706 37
156 169 201 383 330 236 194
24 1,879 1 20 1 186 4 272 3 273 2 410 7 338 5 237 1 143
77 4,705 6 121
15 579 4 968 6 776 18 988 16 706 5 382
7 185
49 3
10 3 4
13 9 5 2
2,132 59
302 486 348 419 287 174
57
28 2,573 3 62 5 277 1 482 2 428 5 569 7 419
208 5 128
82 36,845 5 298
10 4,970 7 9,894 5 7,338
31 8.987 16 3,547 6 1,313 2 498
48 1
10 7 4 4
17 3
2
269 3
24 36 25 52 65 42 22
185 1,656 12 31 34 157 25 240 36 233 38 400 25 323 10 . 203 5 69
93 11 15 13 17 20 14 2 1
92 I
19 12 19 18 11 8 4
1,453 56
275 258 258 338 187 62 19
1,055 25
112 162 155 252 199 110
40
601 6
45 78 78
148 124 93 29
2,463 31
219 350 440 693 448
206 76
12
4 4 3 1
4,395 55
323 531 518 877 885 720 486
137 5,427 23 71 21 '352 9 691
18 666 36 1,248 18 1,082 10 704 2 613
114 23 21
7 14 25 14 9 1
23
2 4
11 4 1 1
234 7
24 33 34 69 49 16 2
1,464 18
101 165 186 350 277 193 174
3,963 53
251 526 480 898 805 511 439
7,313 106 527
1,087 1000 1:570 1,355
983 685
24 1,847 13
2 130 3 233 2 247 2 545 7 423 3 180 5 76
81 2,939 12
5 124 9 479 9 534 20 845 22 631
8 248 8 66
25
2 5 6 5 7
56 o. 5 9 7
15 16 3 1
1,371 5
54 234 241 395 304 109
29
1,568 7
70 245 293 450 327 139 37
81 2,428 I 15 4 156 I 376
13 411 27 720 20 473 9 208 6 69
10 1 1
o.
1
2 1 4
2,525 17
103 356 528 650 450 279 142
25 14,239 85
3 624 3 2,341 5 2,824 4 3,736 8 2,717 1 1,419 1 493
4
1 o. 1
o·
1
21
2 3 4 4 7 1
7,695 48
368 1,453 1,711 1,925 1,246
655 289
6,544 37
256 888
I,m 1,811 1,471
764 204
43 15,911 1 164 6 997
12 3,027 11 3,396 6 4,214 7 2,472
1,132 508
1
28 29
426 17,847 8 "13,228
31 2,477 125 791
89 110 79 110 50 91 32 165 11 875 1
1,256 8
48 248 325 328 171
89 39
239 6 4
44 48 S5 43 28 11
1,017 2
44 204 277 273 128
61 28
1,619 28
105 315 372 472 213 84 30
89,863 71,865 10,387 2,167
370 404 373 689
3,588 20
68,591 56,477 7,199 1,208
223 274 244 415
2,531 20
21,272 15,388 3,188
959 147 130 129 274
1,057
87,005 72,143 7,529 1,844
518 471 445 710
3,323 22
30
26,971 11,798 2,772 2,140 1,742 2,986 2,458 1,501 1,561
13
135,805 62,524 13,097 10,973 8,988
15,083 11,069
7,025 7,034
12
103,727 48,626 9,511 8,302 6,900
11,290 8,417 5380 5,289
12
32,078 13,898 3,586 2,671 2,088 3,793 2,652 1,645 1,745
135,398 62,702 11,928 12,592 11,116 15,153 9,597 6,268 6,01l
31
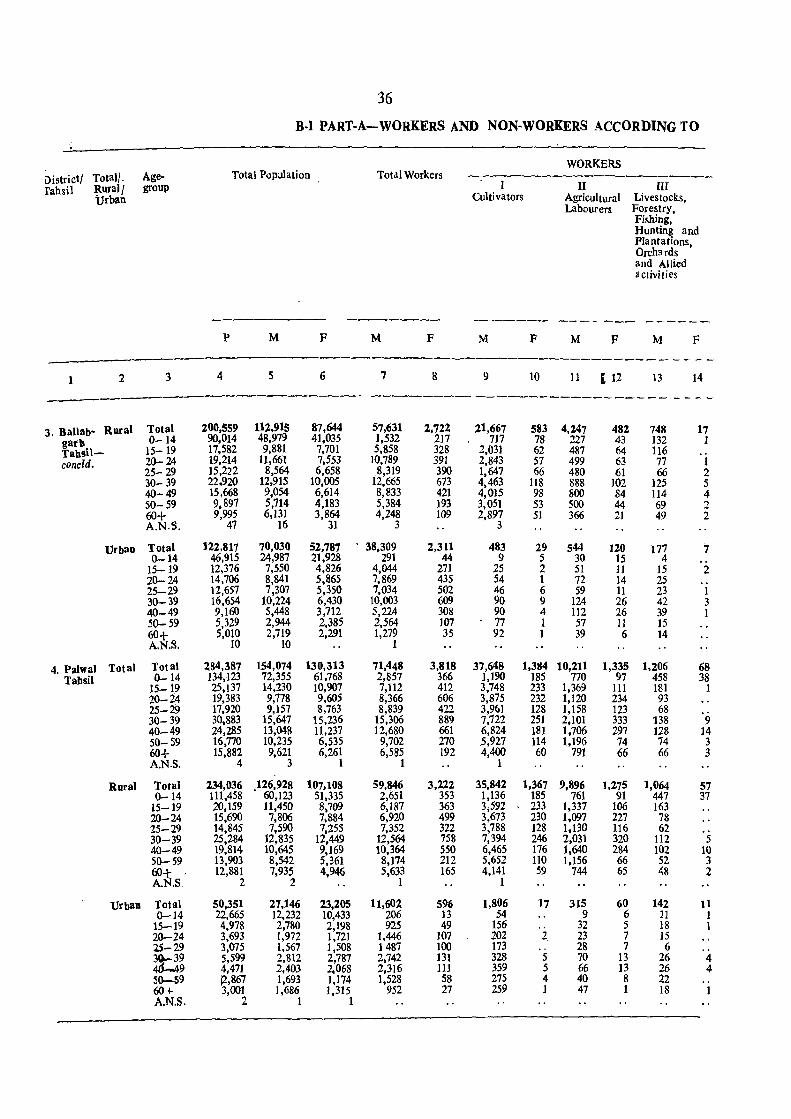
36
B·l PART-A-WORKERS AND NON-WORKERS ACCORDING TO
WORKERS District! Total/. Age- Total Population Total Workers
rahsil Rural! group I II 1lI Urban Cultivators Agricultural Livestocks,
Labourers Forestry, Fishing, Hunting and Plantations, Orchards and Allied activities
------ ------ ---- --- ------P M F M F M F M F M F
---------2 3 4 5 6 7 8 9 10 11 [ 12 13 14
---~------------------
3. Ballab- Rural Total 200,559 112,915 87,644 57,631 2,722 21,667 583 4,247 482 748 17 garb 0-14 90,014 48,979 4],035 ],532 217 717 78 227 43 132 1 Tahsil- 15-19 17,582 9,881 7,701 5,858 328 2,031 62 487 64 116 concld. 20-24 19,214 11,661 7,553 10,789 391 2,843 57 499 63 77 1
25- 29 15,222 8,564 6,658 8,3]9 390 1,647 66 480 6] 66 2 30-39 22,920 12,915 10,005 12,665 673 4,463 118 888 ]02 125 5 40-49 ]5,668 9,054 6,614 8,833 421 4,015 98 800 84 114 4 SO-59 9,897 5,714 4,183 5,384 193 3,05] 53 500 44 69 2 60+ 9,995 6,131 3,864 4,248 ]09 2,897 51 366 21 49 2 A.N.S. 47 16 31 3 3
Urb3u Total 122,817 70,030 52,787 38,309 2,311 483 29 544 120 J77 7 0-14 46.915 24,987 21,928 291 44 9 5 30 15 4 ..
15-19 12,376 7,550 4,826 4,044 271 25 2 51 11 15 2 20-24 14.706 8,841 5,865 7,869 435 54 1 72 ]4 25 25-29 12.657 7,307 5,350 7,034 502 46 6 59 11 23 1 30-39 16,654 10,224 6,430 10,003 609 90 9 124 26 42 3 40-49 9,160 5,448 3,712 5,224 308 90 4 112 26 39 1 50-59 5,329 2,944 2,385 2,564 107 77 1 57 11 15 60+ 5,010 2,719 2,291 1,279 35 92 1 39 6 14 A.N.S. 10 10 1
4. Palwal Total Total 284,387 154,074 130,313 71,448 3,818 37,648 1,3114 10,211 1,335 1,206 68 Tabsil 0-14 134,123 72,355 61,768 2,857 366 1,]90 185 770 97 458 38
15-19 25,137 14,230 10,907 7,112 412 3,748 233 1,369 111 181 1 20-24 19,383 9,778 9,605 8,366 606 3,875 232 1,120 234 93 25-29 17,920 9,157 8,763 8,839 422 3,961 128 1,158 123 68 30-39 30,883 15,647 15,236 15,306 889 7,722 251 2,101 333 138 9 40-49 24,285 13,048 11,237 ]2,680 661 6,824 181 1,706 297 ]28 14 50-59 16,770 10,235 6,535 9,702 270 :>,927 114 1,196 74 74 3 60+ 15,882 9,621 6,261 6,585 192 4,400 60 791 66 66 3 A.N.s. 4 3 1 1 1
Rural Totai 234,036 ;126,928 107,108 59,846 3,222 35,842 1,367 9,896 1,275 1,064 57 0-14 111,458 60,123 51,335 2,651 353 1,136 185 761 91 447 37
15-19 20,159 11,450 8,709 6,187 363 3,592 233 1,337 106 ]63 20-24 15,690 7,806 7,884 6,920 499 3,673 230 1,097 227 78 25-29 14,845 7,590 7,255 7,352 322 3,788 128 1,130 116 62 30-39 25,284 12,835 12,449 12,564 758 7,394 246 2,031 320 112 5 40-49 19,814 10,645 9,169 10,364 550 6,465 176 1,640 284 102 10 50-59 13,903 8,542 5,361 8,174 212 5,652 no 1,156 66 52 3 60+ . 12,881 7,935 4,946 5,633 165 4,141 59 744 65 48 2 A.N.S. 2 2 1 1
Urban Total 50,351 27,146 23,205 11,602 596 1,806 17 315 60 142 11 0-14 22,665 12,232 10,433 206 13 54 9 6 11 1
15-19 4,978 2,780 2,198 925 49 156 32 5 18 1 20-24 3,693 1,972 1,721 ],446 ]07 202 2 23 7 15 25-29 3,075 1,567 1,508 1487 100 173 .. 28 7 6 30!- 39 5,599 2,812 2,787 2,742 131 328 5 70 13 26 4 46-19 4,471 2,403 2,068 2,316 Jll 359 5 66 13 26 4 50-59 12,867 1,693 1,174 1,528 58 275 4 40 8 22 .. 60'" 3,001 1,686 1,315 952 27 259 1 47 1 18 1 A.N.S. 2 1 1
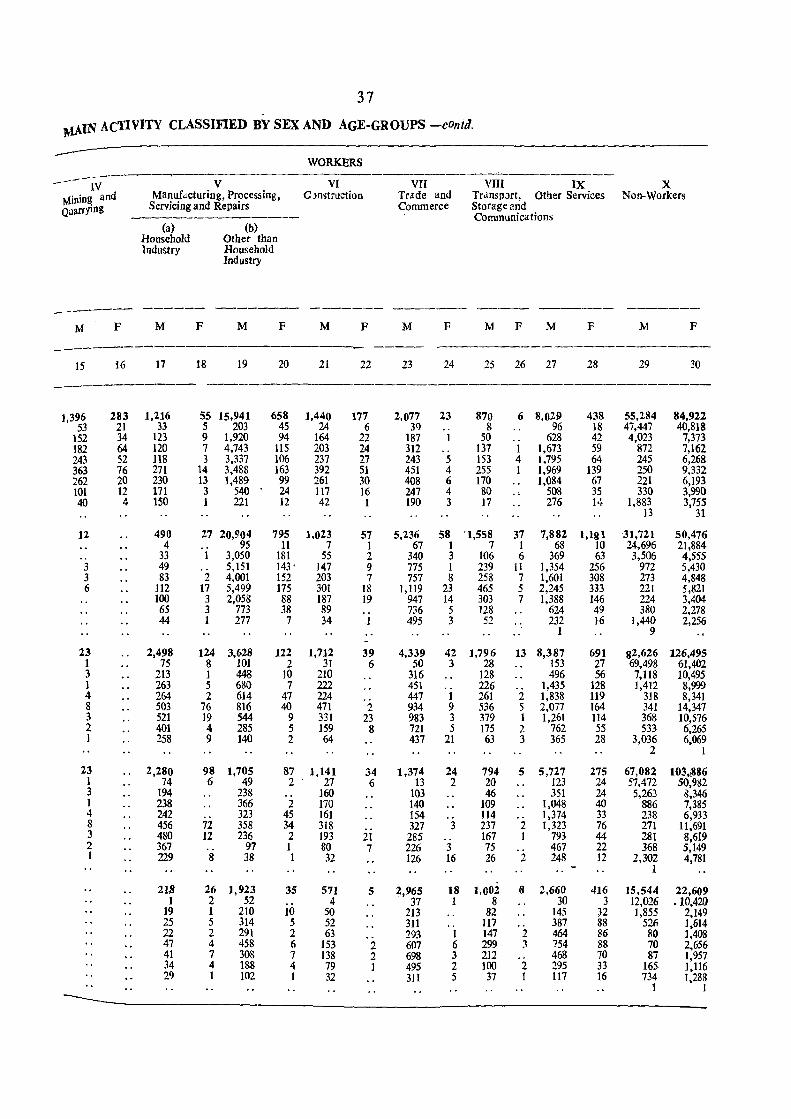
37
~1AIN ACTIVITY CLASSIFIED BY SEX AND AGE-GROUPS -conld.
_---- IV
Minin~ and Quarrymg
-------M F
15 16
1,396 283 53 21
152 34 182 64 243 52 363 76 262 20 101 12 40 4
12
.. 3 3 6
23 1 3 1 4 8 3 2 1
23 1 3 I 4 8 3 2 I
V Manufdcturing, Processing,
Servicing and Repairs
(a) Household Industry
(b) Other than Household Industry
----- ------M F M F
17 18 19 20
1,216 55 15,941 658 33 5 203 45
123 9 1,920 94 120 7 4,743 115 118 3 3,337 106 271 14 3,488 163 230 13 1,489 99 171 3 540 24 150 1 221 12
490 27 20,904 795 4 95 11
33 1 3,050 181 49 5,151 143' 83 2 4,001 152
112 17 5,499 175 100 3 2,058 88 6S 3 773 38 44 1 277 7
2,498 124 3,628 122 75 8 101 2
213 1 448 ]0 263 5 680 7 264 2 614 47 503 76 816 40 521 19 544 9 401 4 285 5 258 9 140 2
2,280 98 1,705 87 74 6 49 2
194 238 238 366 2 242 323 4S 456 72 358 34 480 12 236 2 367 97 1 229 8 38 1
21S 26 1,923 35 1 2 52
19 I 210 10 25 5 314 5 22 2 291 2 47 4 458 6 41 7 308 7 34 4 188 4 29 1 102 1
WORKERS
VI C Jn~truction
------M F
VII Trade and Commerce
------M F
VIII IX X TrdnspJrt, Other Services Non-Workers Storage and Communica tions
---- ------ ------M F M F M F
---- ------------------21 22 23 24 25 26 27 28 29 30
1,440 177 2,077 23 870 6 8,029 438 55,284 84,922 24 6 3l) .. 8 96 18 47,447 40,818
164 22 187 1 50 .. 628 42 4,023 7,373 203 24 312 .. 137 1 1,673 59 872 7,162 237 27 243 5 153 4 1,795 64 245 6,268 392 51 451 4 255 1 1,969 139 250 9,332 261 30 408 6 170 1,084 67 221 6,193 117 16 247 4 80 508 35 330 3,990 42 1 190 3 17 276 14 1,883 3,755
13 31
1,023 57 5,236 58 '1,558 37 7,882 1,181 31,721 50,476 7 1 67 I 7 1 68 10 24,696 21,884
55 2 340 3 106 6 369 63 3,506 4,555 147 9 775 I 239 II 1,354 256 972 5,430 203 7 757 8 258 7 1,601 308 273 4,848 301 18 1,119 23 465 5 2,245 333 221 5,821 187 19 947 14 303 7 1,388 146 224 3,404 89 .. 736 5 128 624 49 380 2,278 34 1 495 3 52 232 16 1,440 2,256
1 9
1,712 39 4,339 42 1,796 13 8,387 691 82,626 126,495 31 6 50 3 28 153 27 69,498 61,402
210 316 128 496 56 7,118 10,495 222 451 .. 226 1,435 128 1,412 8,999 224 447 1 261 2 1,838 119 318 8,341 471 2 934 9 536 5 2,077 164 341 14,347 331 23 983 3 379 1 1,261 114 368 10,576 159 8 721 5 175 2 762 55 533 6,265 64 437 21 63 3 365 28 3,036 6,069
2 1
1,141 34 1,374 24 794 5 5,727 275 67,082 103,t886 27 6 13 2 20 123 24 57,472 50,982
160 103 46 351 24 5,263 8,346 170 140 109 1,048 40 886 7,385 161 154 114 1,374 33 238 6,933 318 327 3 237 2 1,323 76 271 11,691 193 21 285 167 1 793 44 281 8,619 80 7 226 3 75 467 22 368 5,149 32 126 16 26 2 248 12 2,302 4,781
1
571 5 2,965 18 1,002 8 2,660 416 15,544 22,609 4 37 1 8 30 3 12,026 .10,42(}
50 213 82 145 32 1,855 2,149 52 311 117 387 88 526 1,614 63 293 I 147 2 464 86 80 1,408
153 2 607 6 299 3 754 88 70 2,656 138 2 698 3 212 468 70 87 1,957 79 1 495 2 100 2 295 33 165 1,116 32 311 5 37 I 117 16 734 1,288
1 I
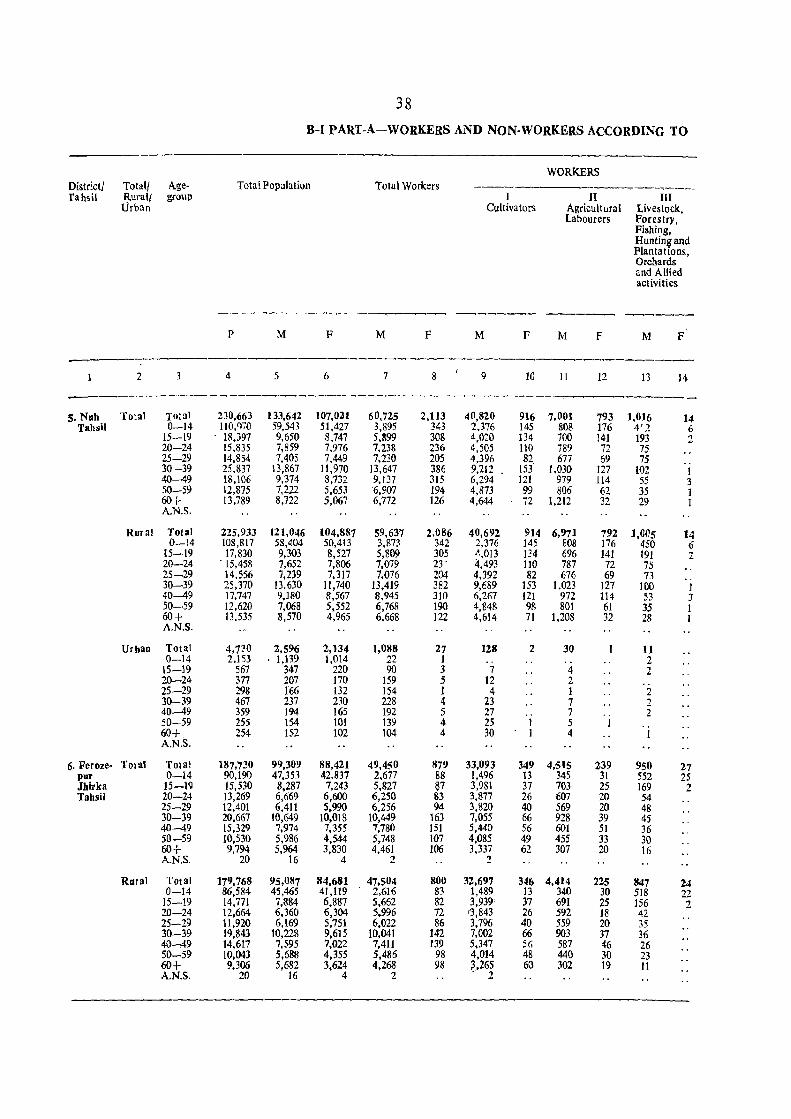
38
B-1 PART-A-WORKERS AND NON-WORKERS ACCORDING TO
WORKERS
District] Totall Age- Total PopJlation Total Workers fahsil Rurall group I II III
Urban Cultivators Agricultural Livestock, Labourers Forestry,
Fishing, Hunting and Plantations, Orchards and Allied activities
--~--- ~---~ ~----
P M F M F M F M F M f
2 3 4 5 6 7 8 9 10 11 12 13 14
S. Nub Total Total 230,663 133,642 107,021 60,725 2,113 40,820 916 7,00) 793 1,016 14 Tahsil 0--14 IIO/no 59,543 51,427 3,895 343 2,376 145 808 176 4'? 6
15-19 . 18,397 9,650 8,747 5,&99 308 4,O~O 134 700 141 193 2 20-24 15,835 7,859 7,976 7,238 236 4,505 110 789 72 75 25-29 14,854 7,405 7,449 7,230 205 4.396 82 677 69 75 .. 30-39 25.837 13,867 11,970 13,647 386 9,112 153 1,030 127 102 1 40-49 18,106 9,374 8,732 9,137 315 6,294 121 979 114 55 3 50-59 12,875 7,222 5,653 6,907 194 4,873 99 806 62 35 I 60+ 13,789 8,722 5,067 6,772 126 4,644 72 1,212 32 29 1 A.N.S.
Rural Total 225,933 121,046 104,887 59,637 2,086 40,692 914 6,971 792 J,O~5 14 0-14 108,817 58,404 50,413 3.873 342 2.376 J45 E08 176 450 6
15-19 17,830 9,303 8,527 5.~09 305 ..... 013 L?4 696 141 191 2 20-24 . 15,458 7,652 7,806 7,079 23' 4,493 110 787 72 75 25-29 14,556 7.239 7,317 7.076 204 4,392 82 676 69 73 .. 30-39 25,370 13,630 11,740 13,419 382 9,689 153 1.023 127 ]00 ] 40-49 17.747 9,180 8,567 8,945 310 6,267 121 972 114 53 3 50-59 12,620 7,068 5,552 6,768 190 4,848 98 801 61 35 1 60+ 13,535 8,570 4,965 6,668 122 4,614 71 1.208 32 26 I A.N.S.
Urbau Total 4,7?O 2,596 2,134 ],038 27 128 2 30 11 0-14 2,153 1,139 1,014 22 1 2
15-19 567 347 220 90 3 7 4 2 20-24 377 207 170 159 5 12 2 25-29 298 166 132 154 1 4 1 2 30-39 467 237 230 228 4 23 7 2 40-49 359 194 165 192 5 27 7 .. 2 50-59 255 154 101 139 4 2S 1 5 I 60+ 254 152 102 104 4 30 1 4 I A.N.S.
6. Feroze- Total Total 187,730 99,309 88,421 49,450 879 33,093 349 4,515 239 950 27 pur 0-14 90,190 47.353 42,837 2,677 88 1,496 13 345 31 552 25 Jhirka 15-19 15,530 8,287 7,243 5,827 ~7 3,981 37 703 25 169 2 Tahsil 20-24 13,269 6,669 6,600 6,250 83 3,877 26 607 20 54
25-29 12.401 6,411 5.990 6.256 94 3,820 40 569 20 48 30-39 20,661 10,649 10,018 10,449 163 7,055 66 928 39 45 40-49 15,329 7,974 7,355 7,780 151 5,440 56 601 51 36 50-59 10,530 5,986 4,544 5,748 107 4,085 49 455 33 30 60+ 9,794 5,964 3,830 4,461 106 3,337 62 307 20 16 A.N.S. 20 16 4 2 2
Rural Total 179,768 95,087 84,681 47,504 800 32,697 346 4,414 225 847 24 0-14 86,584 45,465 41,119 2,616 83 1,489 13 340 30 518 22
15-19 14,771 7,884 6,887 5,662 82 3,939 37 691 25 156 2 20-24 12,664 6,360 6,304 5,996 72 r3,843 26 592 18 42 25-29 11,920 6,169 5,751 6.022 86 3,796 40 559 20 35 30-39 19,843 10,228 9,615 10,041 142 7,002 66 903 37 36 40--49 14,617 7,595 7,022 7,411 139 5,347 56 587 46 26 50-59 10,043 5,688 4,355 5,486 98 4,014 48 440 30 23 60+ 9,306 5,682 3,624 4,268 98 ?265 60 302 19 II A.N.S. 20 16 4 2 2
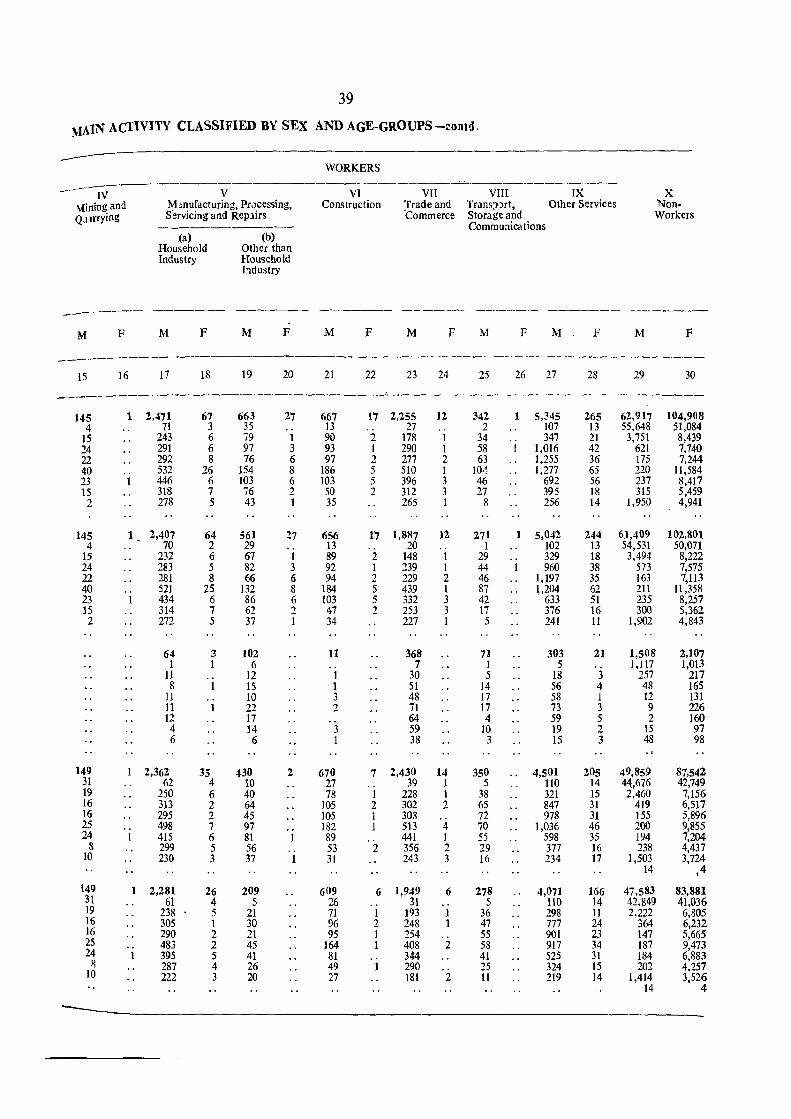
39
. MAIN ACTIVITY CLASSIFIED BY SEX AND AGE-GROUPS -1:antd,
WORKERS
IV V VI VII VIII IX X Mining and Minufacturing, Praces5ing, Construction Trade and Trans:nrt, Other Services Non-QJ)fcying S'ervicing and Replirs 'Commerce Storage and Workers
Communications (a) (b)
Household Other than Industry Household
Industry
_-' ---- ------ ----- ----- -_--- --_--_ ------ --- .. _--M F M F M F M F M F M F M F M F
-----------------------------------------------------------15 16 11 18 19 20 21 22 23 24 25 26 27 28 29 30
.--- ----------------------------------------------------
145 1 2,471 67 663 27 667 17 2,255 12 342 1 5,345 265 62,917 104,908 4 71 3 35 .. 13 .. 27 " 2 107 13 55,648 51,084
15 243 6 79 1 90 2 178 1 34 " 347 21 3,751 8,439 24 291 6 97 3 93 I 290 1 58 1 1,016 42 621 7,140 22 292 8 76 6 97 2 277 2 63 1,255 36 175 7,244 40 "
532 26 154 8 186 5 510 1 10,~, 1,277 65 220 11,584 23 1 446 6 103 6 103 5 396 3 46 692 56 237 8,417 IS 318 7 76 2 50 2 312 3 27 395 18 315 5,459 2 278 5 43 I 35 265 I 8 256 14 1,950 4,941
145 1 2,407 64 561 27 656 17 1,887 12 271 1 5,042 244 61,409 102,801 4 70 2 29 .. 13 20 , . 1 102 13 54,531 50,011
15 232 6 67 1 89 2 148 1 29 ,. 329 18 3,494 8,222 24 283 5 82 3 92 I 239 I 44 I 960 38 5/3 7,575 22 281 8 66 6 94 2 229 2 46 1,197 35 163 7,113 40 ,. 521 25 132 8 184 5 439 1 87 \,204 62 211 1l,358 23 I 434 6 86 6 103 5 332 3 42 633 51 235 8,257 15 314 7 62 2 47 2 253 3 17 376 16 300 5,362 2 272 5 37 1 34 227 1 5 241 11 1,902 4,843
64 3 102 11 368 71 303 21 1,508 2,107 1 6 7 1 5 1,117 1,013
11 .. 12 1 30 5 18 3 257 217 8 1 IS 1 51 14 56 4 48 165
11 .. ID 3 48 17 58 1 12 131 11 1 22 2 71 17 73 3 9 226 12 17 64 4 59 5 2 160 4 14 3 59 10 19 2 15 97 6 6 1 38 3 15 3 48 98
149 2,362 35 430 2 670 7 2,430 14 350 4,501 205 49,859 87,542 31 62 4 10 27 39 1 5 lIO 14 44,676 42,749 19 250 6 40 78 1 228 1 38 321 15 2,460 7,156 16 313 2 64 105 2 302 2 65 847 31 419 6,517 16 295 2 45 105 1 303 72 978 31 155 5,896 25 ., 498 7 97 .. 182 1 513 4 70 1,036 46 200 9,855 24 1 415 6 81 1 89 441 1 55 598 35 194 7,204
8 299 5 56 " 53 2 356 2 29 377 16 238 4,437 10 230 3 37 1 31 243 3 16 234 17 1,503 3,724
14 ,4
149 1 2,281 26 209 609 6 1,949 6 278 4,071 166 47.583 83,881 31 61 4 5 26 ., 31 5 110 14 42,849 41,036 19 238 5 21 71 1 193 1 36 298 11 2,222 6,805 16 305 1 30 96 2 248 1 47 777 24 364 6,232 16 290 2 21 95 1 254 55 901 23 147 5,665 25 .. 483 2 45 164 1 408 2 58 917 34 187 9,473 24 1 395 5 41 81 344 41 525 31 184 6,883 R 287 4 26 49 1 290 25 324 15 202 4,257
10 222 3 20 27 181 2 11 219 14 1,414 3,526 14 4
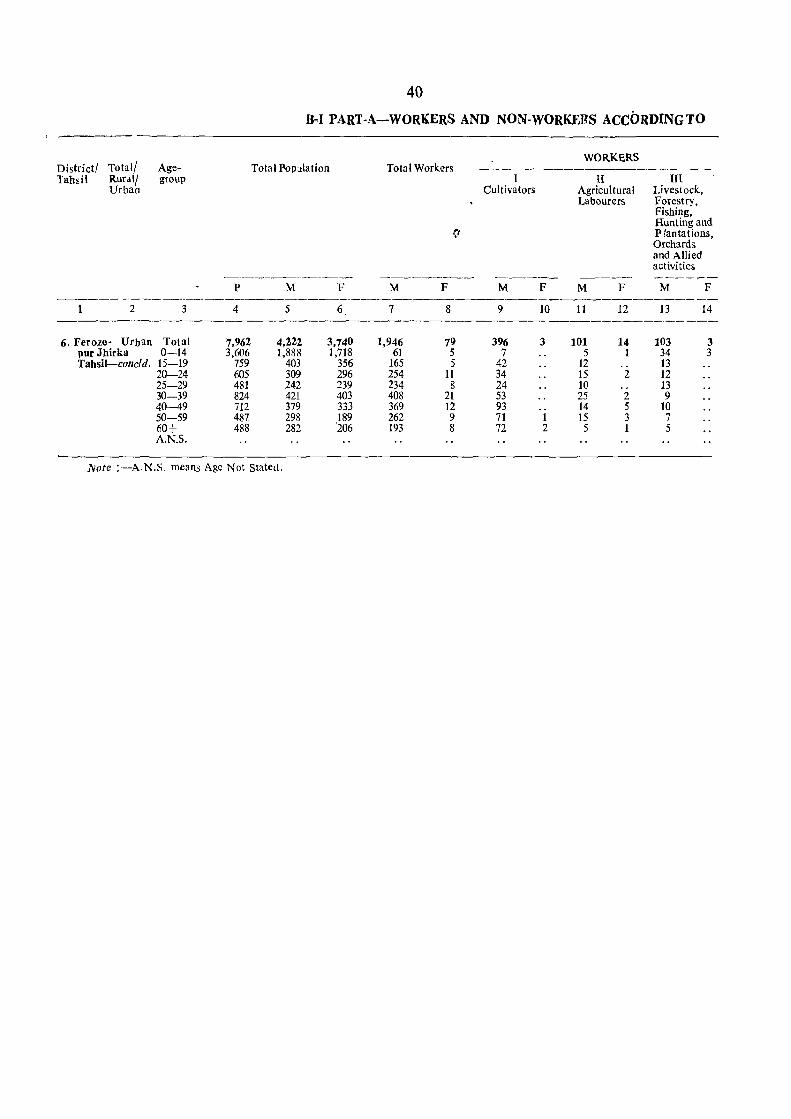
40
B,I PART-A-WORKERS AND NON-WORKERS ACCORDING TO
Total/ WORKERS
Districtf Age- Total Population Total Workers ------------------Tahsil Rural/ group I II III
Urban Cultivators Agricultural Livestock, Labourers Forestry,
Fishing, Hunting and
(I P fantations, Orchards and Allied activities
-------_----- ------~- ---_ ----- ----,...--P M F M F M F M F M F
--------------------------------------------------------.--2 3 4 5 6 7 8 9 10 11 12 13 14
------------6. Feroze- Urban Total 7,962 4,222 3,740 1,946 79 396 3 101 14 103 3
pur Jhirka 0-14 3,606 1,888 1,718 61 5 7 5 1 34 3 Tahsil-concld. 15-19 759 403 356 165 5 42 12 13
20-24 605 309 296 254 11 34 15 2 12 25-29 481 242 239 234 8 24 10 .. 13 30-39 824 421 403 408 21 53 25 2 9 40-49 712 379 333 369 12 93 .. 14 5 10 50-59 487 298 189 262 9 71 1 15 3 7 60+ 488 282 '206 193 8 72 2 5 1 5 A.N.S.
!Yote :-A.N.S. means Age Not Stated.
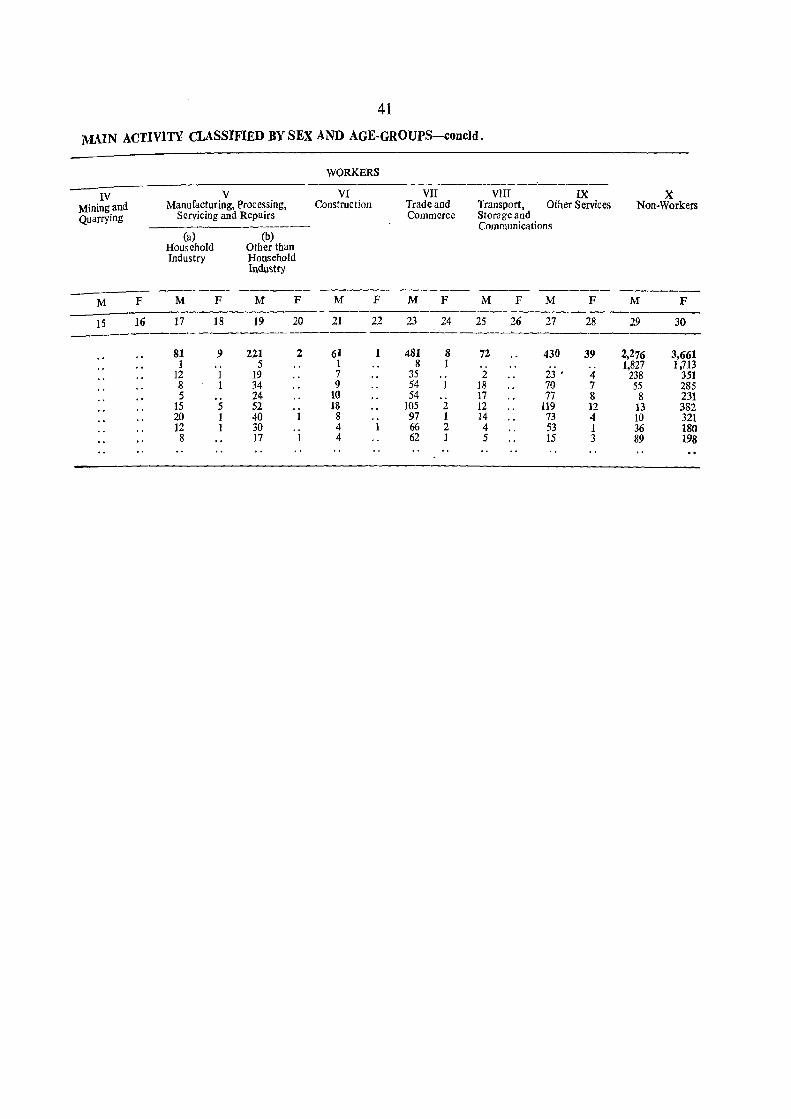
41
MAIN ACTIVITY CLASSIFIED BY SEX AND AGE-GROUPS-concld.
WORKERS
IV V VI VII VIII IX X Mining.and Manufacturing, Processing, Construction Trade and Transport, Other Services Non-Workers Quarrymg Servicing and Repairs Commerce Storage and
Communications (a) (b)
Household Other than Industry Household
Industry
---- ---_-- ---- ----- --- ------ ------M F M F M F M F M F M F M F M F
15 16 17 18 19 20 21 22 23 24 25 26 27 28 29 30 -------------
81 9 221 2 61 1 481 8 72 430 39 2,276 3,661 1 5 1 8 1 1,827 1,713
12 1 19 7 35 .. 2 23 . 4 238 351 8 1 34 9 54 1 18 70 7 55 285 5 24 10 54 17 77 8 8 231
15 5 52 18 lOS 2 12 119 12 13 382 20 1 40 1 8 97 1 14 73 4 10 321 12 1 30 4 1 66 2 4 53 1 36 180 8 17 1 4 62 1 5 15 3 89 198

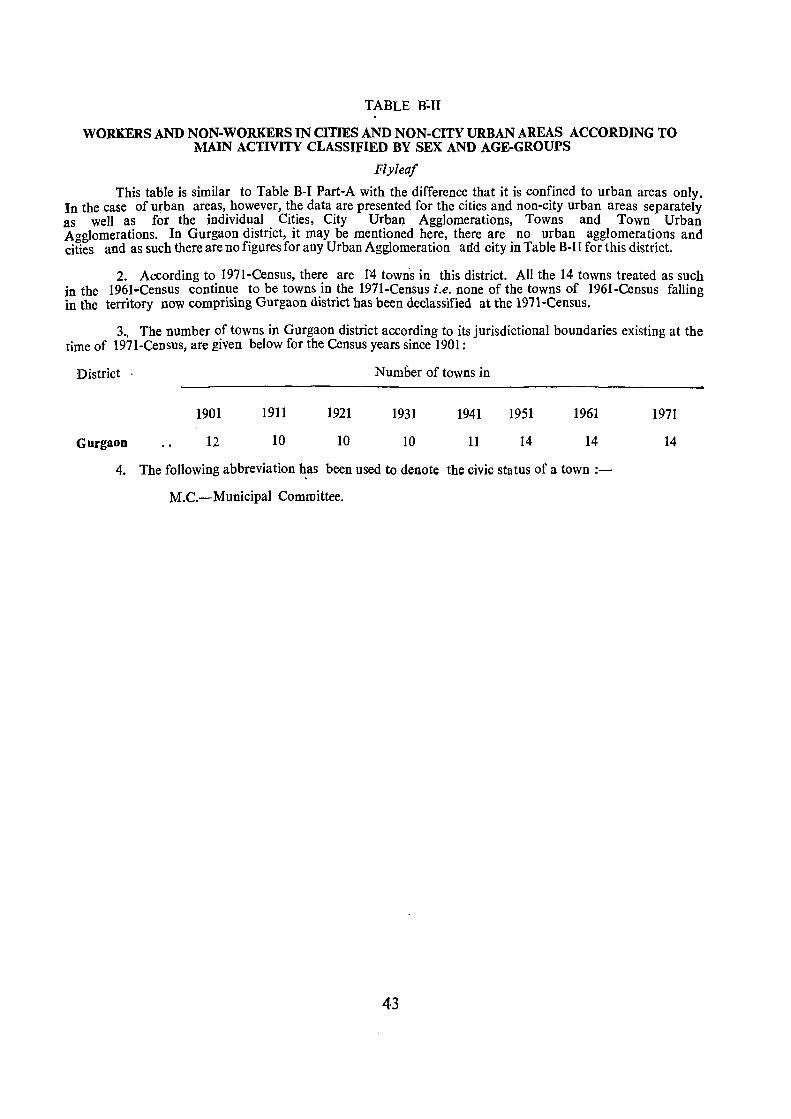
TABLE B:n
WORKERS AND NON-WORKERS IN CITIES AND NON-CITY URBAN AREAS ACCORDING TO MAIN ACTIVITY CLASSIFIED BY SEX AND AGE-GROUPS
Flyleaf
This table is similar to Table B-1 Part-A with the difference that it is confined to urban areas only. In the case of urban areas, however, the data are presented for the cities and non-city urban areas separately as well as for the individual Cities, City UrbaQ, Agglomerations, Towns and Town Urban Agglomerations. In Gurgaon district, it may be mentioned here, there are no urban agglomerations and cities and as such there are no figures for any Urban Agglomeration add city in Table B-II for this district.
2. According to 197I-Census, there are f4 towns in this district. All the 14 towns treated as such in the 1961-Census continue to be towns in the 1971-Census i.e. none of the towns of 1961-Census falling in the territory now comprising Gurgaon district has been declassified at the 1971~Census.
3.; The number of towns in Gurgaon district according to its jurisdictional boundaries existing at the time of 1971-Census, ace given below for the Census years since 1901:
District '
Gurgaon
1901
12
1911
10
1921
10
Number of towns in
1931
10
1941
11
1951
14
1961
14
4. The following abbreviation ~as been used to denote the civic status of a town :
M.C.-MunicipaI Committee.
43
1971
14
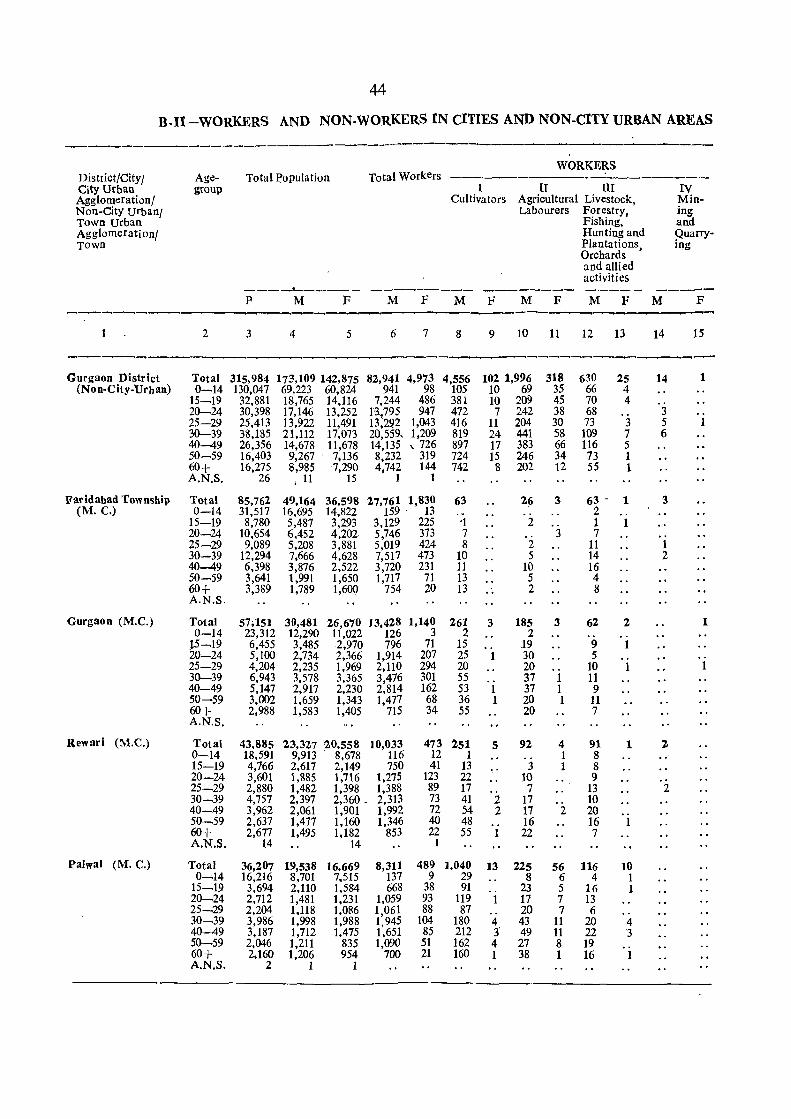
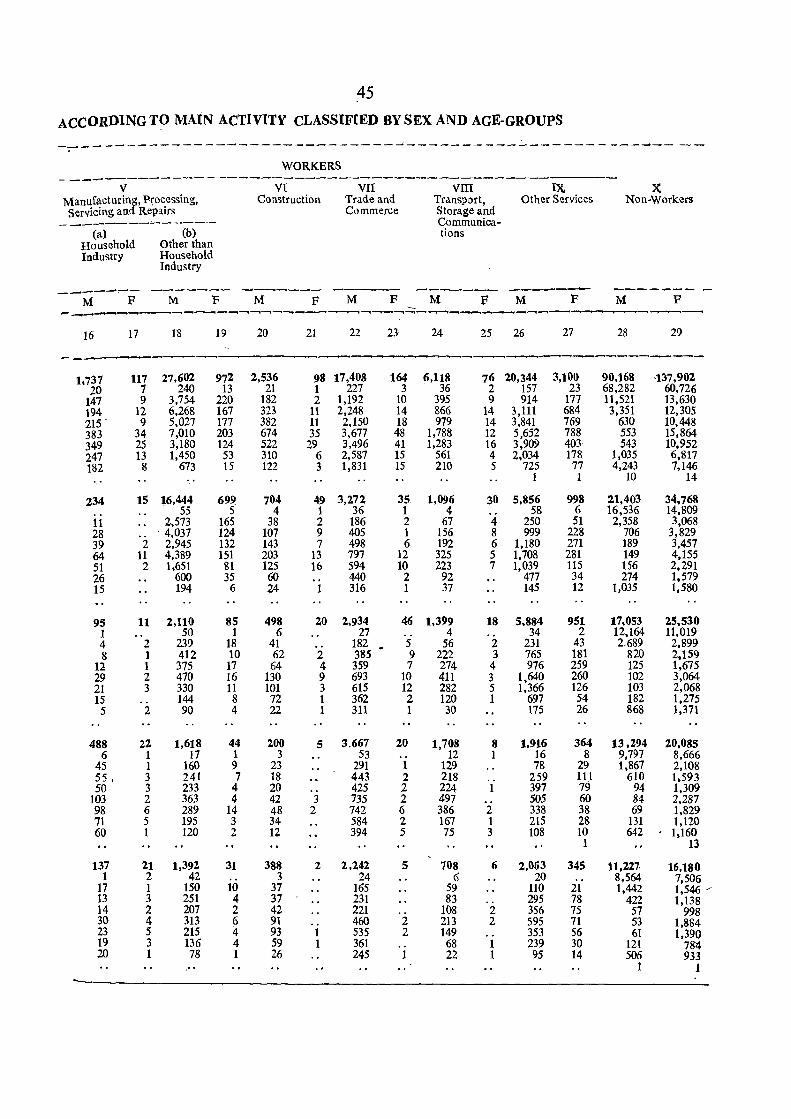
45
ACCORDING T9 MAIN ACTIVITY CLASSIFIED BY SEX AND AGE-GROUPS
---------------~-----------------------------------------. .
WORKERS ----------------------------------------------------
V VI VII VIII IX X Manufacturing, Ptocessing, Construction Trade and Transport, Other Services Non-Workers Servicing and Repairs Commerce Storage and
----------- Communica-(a) (b) tions
Household Other than lndustry Household
Industry
------~- ,-------- ------- ----- ------- -----_ .......... ----_._--. --M F M. F M F M F M F M F M F
______.,------.-.,-~---------~-- --____...------~ ~-
16 17 18 19 20 21 22 23 24 25 26 27 28 29
1.737 117 27,602 972 2,536 98 17,408 164 6,118 76 20,344 3,100 90,168 '1~7,902 20 7 240 13 21 1 227 3 36 2 157 23 68,282 60,726
147 9 3,754 220 182 2 1,192 10 395 9 914 177 11,521 13,630 194 12 6,268 167 323 11 2,248 14 866 14 3,111 684 3,351 12,305 215· 9 5,027 177 382 11 2,150 18 979 14 3,841 769 630 10,448 383 34 7,010 203 674 35 3,677 48 1,788 12 5,652 788 553 15,864 349 25 3,180 124 522 29 3,496 41 1,283 16 3,909 403 543 10,952 247 13 1,450 53 310 6 2,587 15 561 4 2,034 178 1,035 6,817 182 8 673 15 122 3 1,831 15 210 5 725 77 4,243 7,146
1 1 10 14
234 15 16,444 699 704 49 3,272 35. 1,096 30 5,856 998 11,403 34.768 55 5 4 1 36 1 4 58 6 16,536 14,809
11 2,573 165 38 2 186 2 67 4 250 51 2,358 3,068 28 ~ 4,037 124 107 9 405 1 156 8 999 228 706 3,829 39 2 2,945 132 143 7 498 6 192 6 1,180 271 189 3,457 64 11 4,389 151 203 13 797 12 325 5 1,708 281 149 4,155 51 2 1,651 8\ 125 16 594 10 223 7 1,039 115 156 2,291 26 600 35 60 440 2 92 477 34 274 1,579 15 194 6 24 1 316 1 37 145 12 1,035 1,580
95 11 2,110 85 498 20 2,934 46 1,399 18 5,884 951 17,053 25,530 1 50 1 6 27 4 34 2 12,164 11,019 4 2 239 18 41 182 5 56 2 231 43 2.689 2,899 8 1 412 10 62 2 385 9 222 3 765 181 820 2.159
12 1 375 17 64 4 359 7 274 4 976 259 125 1,675 29 2 470 16 130 9 693 10 411 3 1,640 260 102 3,064 21 3 330 11 101 3 615 12 282 5 1,366 126 103 2,068 15 .. 144 8 72 1 362 2 120 1 697 54 182 1,275 5 2 90 4 22 1 311 1 30 175 26 868 1,371
488 22 1,618 44 200 5 3.667 20 1,708 8 1,916 364 13,294 20,085 6 1 17 1 3 53 12 1 16 8 9,797 8,666
45 1 160 9 23 291 1 129 78 29 1,867 2,108 55 ; 3 241 7 18 443 2 218 259 III 610 1.593 50 3 233 4 20 425 2 224 1 397 79 94 1,309
103 2 363 4 42 3 735 2 497 505 60 84 2,287 98 6 289 14 48 2 742 6 386 2 338 38 69 1,829 71 5 195 3 34 584 2 167 1 215 28 131 1,120 60 1 120 2 12 394 5 75 3 108 10 642 1,160
1 13
137 21 1,392 31 388 2 2,242 5 708 6 2,063 345 11,227. 16,180 1 2 42 3 24 6 20 8,564 7,506
17 1 150 10 37 165 59 110 21 1,442 1,546 ,-13 3 251 4 37 231 83 295 78 422 1,138 14 2 207 2 42 221 108 2 356 75 57 998 30 4 313 6 91 460 2 213 2 595 71 53 1,884 23 5 215 4 93 1 535 2 149 .. 353 56 61 1,390 19 3 136 4 59 1 361 68 1 239 30 121 784 20 1 78 1 26 245 1 22 1 95 14 506 933
," 1 1
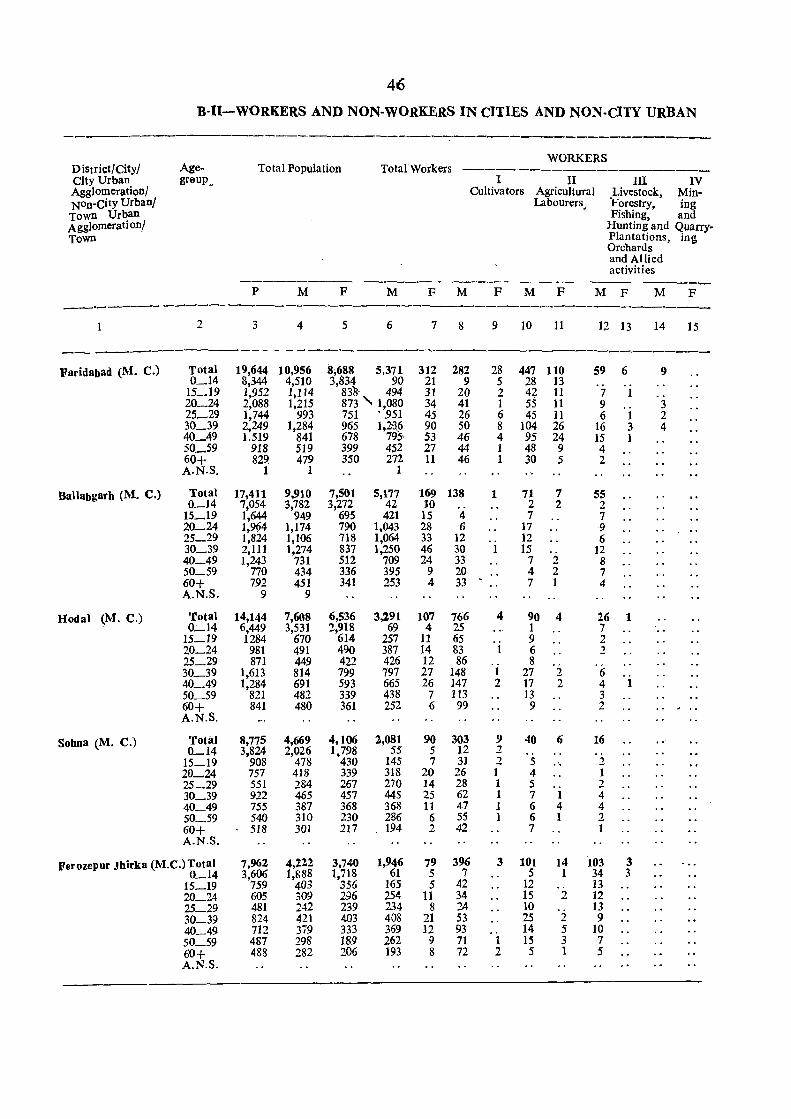
46
B-U-WORKERS AND NON-WORKERS IN CITIES AND NON-CITY URBAN
._------------_ ---------------------WORKERS
District/City} Age- Total Population Total Workers City Urban greup" I II III IV Agglomeration/ Cultivators Agricultural Livestock, Min-Non-City UrbanI Labourers_ Forestry, ing Town Urban Fishing, and Agglomeration/ Hunting and Quarry. Town Plantations, ing
Orchards and Allied activities
-------_- ----- --- ---- --- -----P M F M F M F M F M F M F
1 2 3 4 5 6 7 8 9 10 11 12 13 14 15
--- - -- -----------Faridabad (M. C.) Total 19,644 10,956 8;688 5,371 312 282 28 447 110 59 6 9
0_14 8,344 4,510 3,834 90 21 9 5 28 13 15_19 1,952 1,114 838' 494 31 20 2 42 11 7 1 20_24 2,088 1,215 873 " 1,080 34 41 1 55 11 9 3 25~29 1,744 993 751 ' .951 45 26 6 45 11 6 1 2 3o_39 2,249 1,284 965 1,21,6 90 50 8 104 26 16 3 4 40_49 1.519 841 678 795' 53 46 4 95 24 15 1 50_59 918 519 399 452 27 44 1 48 9 4 60+ 829 479 350 272 11 46 1 30 5 2 A.N.S. 1 1 1
Ballabgarh (M. C.) Total 17,411 9,910 7,501 5,177 169 138 1 71 7 5S 0_14 7,054 3,782 3,272 42 10 2 2 2
15_19 1,644 949 695 421 15 4 7 7 20_24 1,994 1,174 790 1,043 28 6 17 9 25_29 1,824 1,106 718 1,064 33 12 12 6 30_39 2,111 1,274 837 1,250 46 30 1 15 12 40_49 1,243 731 512 709 24 33 7 2 8 50_59 770 434 336 395 9 20 4 2 7 60+ 792 451 341 253 4 33 7 1 4 A.N.S. 9 9
Hodal (M. C.) Total 14,144 7,608 6,536 3,291 107 766 4 90 4 26 1 0.;_14 6,449 3,531 2,918 69 4 25 1 7
15_19 1284 670 614 257 11 65 9 2 20_24 981 491 490 387 14 83 1 6 2 25_29 871 449 422 426 12 86 8 3o_39 1,613 814 799 797 27 148 1 27 2 6 40_49 1,284 691 593 665 26 147 2 17 2 4 1 50_59 821 482 339 438 7 113 13 3 60+ 841 480 361 252 6 99 9 2 A.N.S.
Sohna (M. C.) Total 8,775 4,669 4,106 2,081 90 303 9 40 6 16 o_14 3,824 2,026 1,798 55 5 12 2
15_19 908 478 430 145 7 31 2 5 ,', 2 20_24 757 418 339 318 20 26 1 4 1 25_29 551 284 267 270 14 28 1 5 2 30_39 922 465 457 445 25 62 1 7 1 4 40_49 755 387 368 368 11 47 1 6 4 4 50_59 540 310 230 286 6 55 1 6 1 2 60+ 518 301 217 194 2 42 7 1 A.N.S.
Ferozepur Jhirka (M.e.) Total 7,962 4,122- 3,740 1,946 79 396 3 101 ]4 103 3 0_14 3,606 1,888 1,718 61 5 7 5 1 34 3
15_19 759 403 356 165 5 42 12 13 20_24 605 309 296 254 11 34 15 2 12 25_29 481 242 239 234 8 24 10
'2 13
30_39 824 421 403 408 21 53 25 9 40_49 712 379 333 369 12 93 14 5 10 50_59 487 298 189 262 9 71 1 15 3 7 60+ 488 282 206 193 8 72 2 5 1 5 A.N.S,
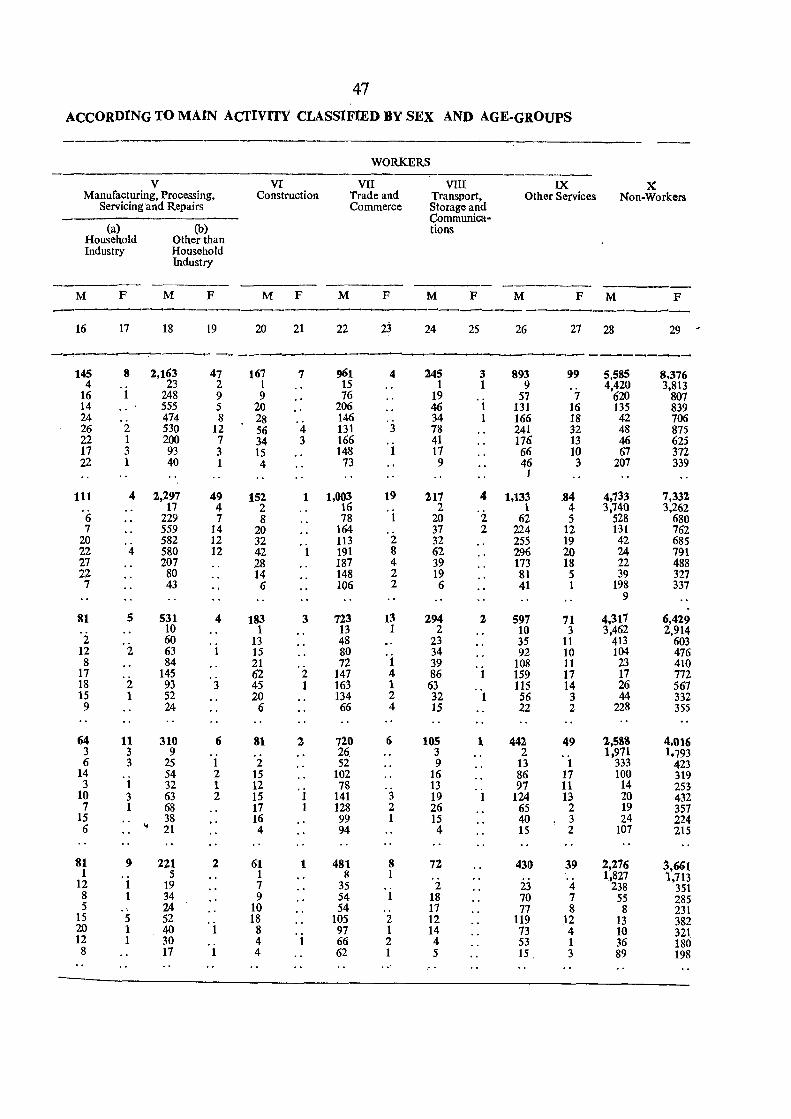
47 ACCORDING TO MAIN ACTIVITY CLASSIFIED BY SEX AND AGE-GROUPS
WORKERS
V VI VII VIII IX X Manufacturing, Processing, Construction Trade and Transport, Other Services Non-Workers
Servicing 'and Repairs Commerce Storage and Communica-
(a) (b) tions Household Other than Industry Household
Industry
----M F M F M F M F M F M F M F
---~---- --- ~--
16 17 18 19 20 21 22 23 24 25 26 27 28 29 -------.--.___,._ ----- ~-- ------_....__
145 8 2,163 47 167 7 961 4 :345 3 893 99 5,585 8,376 4 23 2 1 15 1 1 9 4,420 3,813
16 1 248 9 9 76 19 57 7 620 807 14 555 5 20 206 46 1 131 16 135 839 24 474 8 28 146 '3 34 1 166 18 42 706 26 2 530 12 56 4 131 78 241 32 48 875 22 1 200 7 34 3 166 41 176 13 46 625 17 3 93 3 15 148 1 17 66 10 67 372 22 1 40 1 4 73 9 46 3 207 339
1
111 4 2,297 49 152 1 1,003 19 217 4 1,133 .84 4,733 7,332
'6 17 4 2 16 2 'i 1 4 3,740 3,262
229 7 8 78 1 20 62 5 528 680 7 559 14 20 164 37 2 224 12 131 762
20 582 12 32 113 2 32 255 19 42 685 22 4 580 12 42 ' i 191 8 62 296 20 24 791 27 207 28 187 4 39 173 18 22 488 22 80 14 148 2 19 81 5 39 327 7 43 6 106 2 6 41 1 198 337
9
81 5 531 4 183 3 723 13 294 2. 597 71 4,317 6,429
'2 10 1 13 1 2 10 3 3,462 2,914 60 13 48 23 35 11 413 603
12 2 63 1 15 80 'i 34 92 10 104 476 8 84 21 72 39 108 11 23 410
17 145 62 2 147 4 86 1 159 17 17 772 18 2 93 3 45 1 163 1 63 115 14 26 567 15 1 52 20 134 2 32 56 3 44 332 9 24 6 66 4 15 22 2 228 355
64 11 310 6 81 2 720 6 lOS 1 442 49 2,588 4,016 3 3 9 26_ 3 2 1,971 1,793 6 3 25 1 2 52 9 13 1 333 423
14 54 2 15 102 16 86 17 100 319 3 1 32 1 12 78 13 97 11 14 253
10 3 63 2 15 ' i 141 3 19 1 124 13 20 432 7 1 68 17 1 128 2 26 65 2 19 357
15 38 16 99 1 15 40 3 24 224 6 " 21 4 94 4 15 2 107 2t5
81 9 221 2 61 1 481 8 72 43() 39 2,216 3.661 1 5 1 8 1 1,827 1,713 12 1 19 7 35 2 23 4 238 351 8 1 34 9 54 1 18 70 7 55 285 5 ,', 24 10 54 17 77 8 8 231 15 5 52 18 105 2 12 119 12 13 382 20 1 40 ' i 8 97 1 14 73 4 10 321 12 1 30 4 1 66 2 4 53 1 36 180 8 17 1 4 62 1 5 15 3 89 198
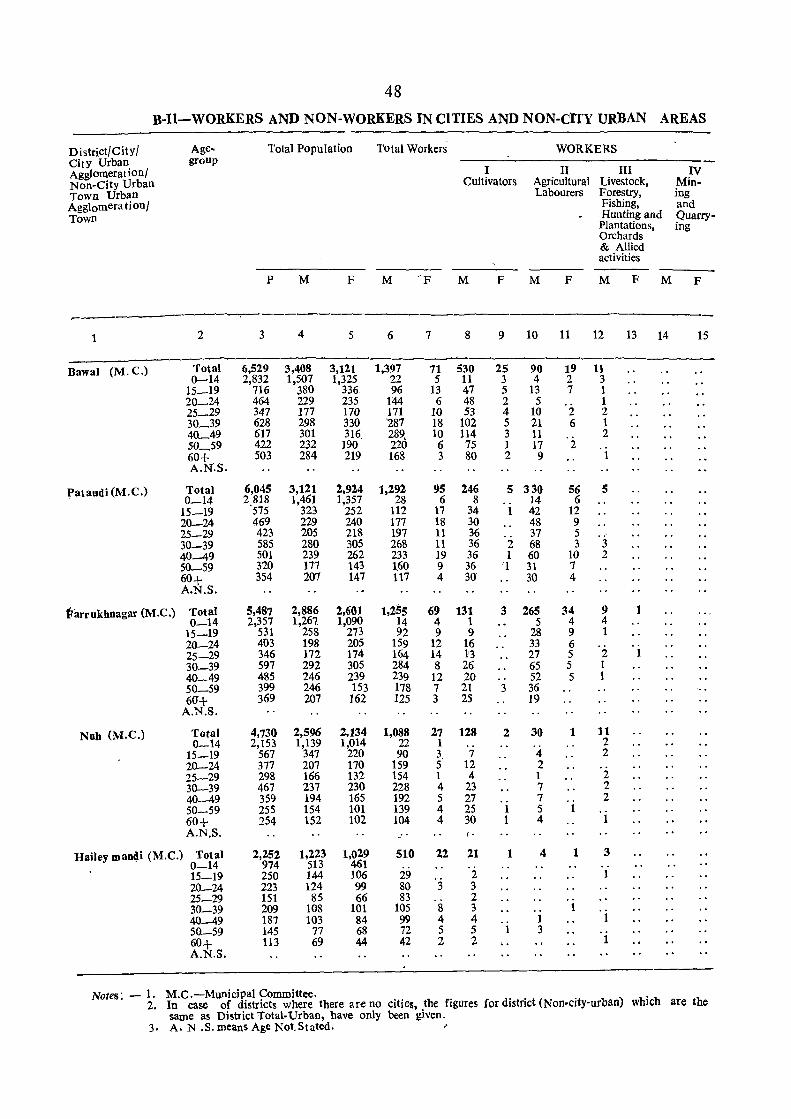
48
B-Il-WORKERS AND NON-WORKERS IN CITIES AND NON-CITY URBAN AREAS
District/City/ Age- Total Population Total Workers WORKERS City Urban gr()UP Agglomerat ion/ I II III IV Non-City Urban Cultivators Agricultural Livestock, Min-Town Urban Labourers Forestry, iDg Agglomerationl Fishing, and Town Hunting and Quarry-
Plantations, ing Orchards & Allied activities
P M F M 'F M P M F M F M F
~-
1 2 3 4 5 6 7 8 9 10 11 12 13 14 15
Bawal (M.e.) Total 6,529 3,408 3,121 1,397 71 530 25 90 19 11 0-14 2,832 1,507 1,325 22 5 11 3 4 2 3
15_19 716 380 336 96 13 47 5 13 7 1 20_24 464 229 235 144 6 48 2 5 1 25_29 347 177 170 171 10 53 4 10 2 2 30_39 628 298 330 287 18 102 5 21 6 1 4<L49 617 301 316. 289, 10 114 3 11 2 50_59 422 232 190 220 6 75 1 17 2 60+ 503 284 219 168 3 80 2 9 1 A.N.S.
Pataudi (M.e.) Total 6,045 3,121 2,924 1,292 95 246 5 330 56 5 0-14 2818 1,461 1,357 28 6 8 14 6
15_19 '575 323 252 112 17 34 1 42 12 20-24 469 229 240 177 18 30 48 9 25-29 423 205 218 197 11 36 37 5 30-39 585 280 305 268 11 36 2 68 3 3 40-49 501 239 262 233 19 36 1 60 10 2 50-59 320 177 143 160 9 36 1 31 7 60+ 354 207 147 117 4 30 30 4 A.N.S.
~arrukhnagar (M.e.) Total 5,487 2,886 2,601 1,255 69 131 3 265 34 9 1 0-14 2,357 1,267 1,090 14 4 1 5 4 4
15-19 531 258 273 92 9 9 28 9 1 20-24 403 198 205 159 12 16 33 6 . i 25-29 346 172 174 164 14 1'3 27 5 2 30-39 597 292 305 284 8 26 65 5 1 40_49 485 246 239 239 12 20 52 5 1 50-59 399 246 153 178 7 21 3 36 6<J+ 369 207 162 125 3 25 19
A.N.S.
Nub (M.C.) Total 4,730 2,596 2,134 1,088 27 128 2. 30 1 11 0-14 2,153 1,139 1,014 22 1 2
15-19 567 347 220 90 3 7 4 2 20-24 377 207 170 159 5 12 2 25-29 298 166 132 154 1 4 1 2 30-39 467 237 230 228 4 23 7 2 40-49 359 194 165 192 5 27 7 2 50-59 255 154 101 139 4 25 1 5 1 . i 60+ 254 152 102 104 4 30 1 4 A.N.S. - I·
Hailey mandi (M.e.) Total 2,252 1,223 1,029 510 22 21 1 4 1 3 . . 0-14 974 513 461
15-19 250 144 106 29 'j
2 1 20-24 223 124 99 80 3 25-29 151 85 66 83 2 30-39 209 108 101 105 8 3 1 40-49 187 103 84 99 4 4 1 1 50-59 145 77 68 72 5 5 1 3 60+ 113 69 44 42 2 2 i. t A.N.S.
Notes: - 1. M.e .-Municipal Committee. which are the 2. In case of districts where there are no cities, the figures for district (Non-city-urban)
same as District Total·Urban, have only been given. 3· A. N .S. means Age Not. Stated. ~
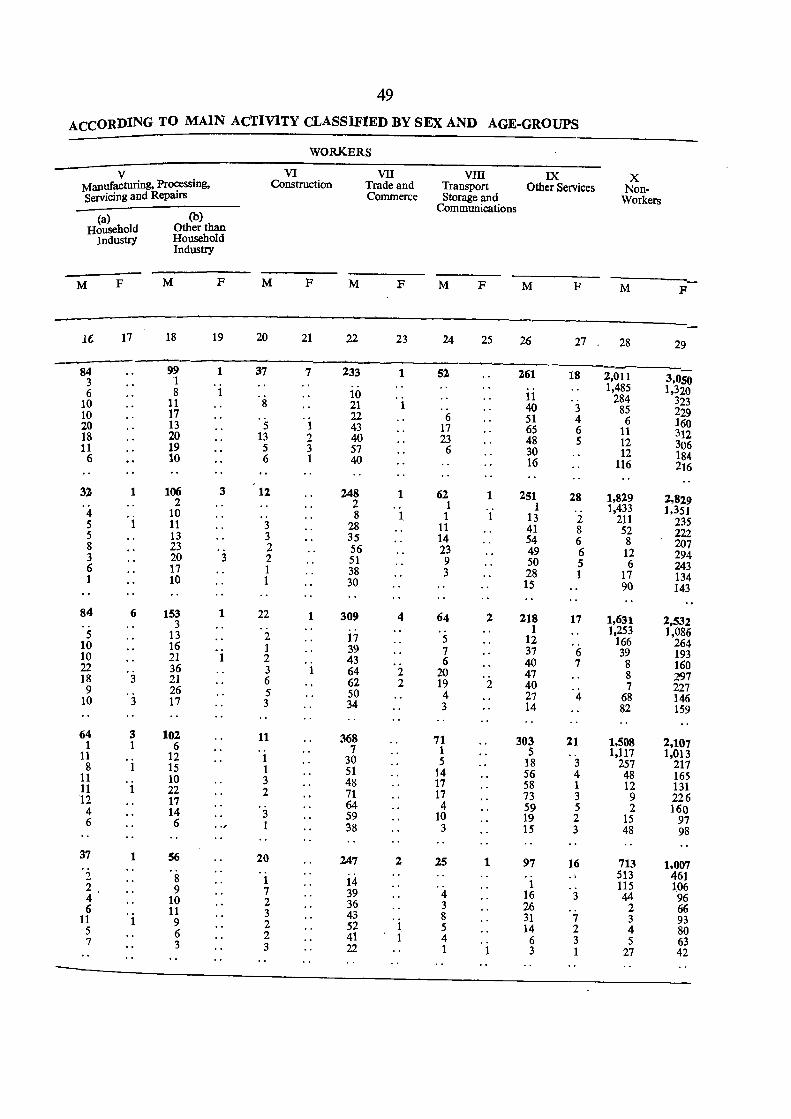
49
ACCORDING TO MAIN ACTIVITY CLASSIFIED BY SEX AND AGE-GROUPS
V 0
Manufacturing, Pr~lDg, Servicing and Repam;
(a) Household
Industry
M F
it: 17
84 3 6
10 10 20 18 11 6
32 1
4 o i 5
5 8 3 6 1
84 6
5 10 10 22 18 3 9
10 3
64 3 1 1
11 o i 8
11 11 1 12 4 6
37 1
2 2 4 6
11 1 5 7
(b) Other than Household Industry
M F
18 19
99 1 1 8 1
11 17 13 20 19 10
106 3 2
10 11 13 23 20 3 17 10
153 1 3
13 16 21 1 36 21 26 17
102 6
12 15 10 22 17 14 6 00'
56
8 9
10 11 9 6 3
WORKERS
VI Construction
M F
20 21
37 7
8
5 1 13 2 5 3 6 1
t:l
3 3 2 2 1 1
22 1
2 1 2 3 1 6 5 3
11
1 1 3 2
0 3 1
20 o i 7 2 3 2 2 3
M
22
233
10 21 22 43 40 57 40
248 2 8
28 35 56 51 38 30
309
17 39 43 64 62 50 34
368 7
30 51 48 71 64 59 38
247
14 39 36 43 52 41 22
VII Trade and Commerce
F
23
1
1
1 00
1
4
2 2
2
1 1
VIII IX Transport Other Services Storage and
Communications
M F M F
24 25 26 27
52. 261 18
11 40 3
6 51 4 17 65 6 23 48 5 6 30
16
62 1 2S1 28 1 1 1 1 13 2
11 41 8 14 54 6 23 49 6 9 50 5 3 28 1
15
64 2 218 17 1
5 12 7 37 6 6 40 7
20 47 19 2 40 4 27 4 3 14
71 303 21 1 5 5 18 3
14 56 4 17 58 1 17 73 3 4 59 5
10 19 2 3 15 3
25 1 97 16 00
1 4 16 3 3 26 8 31 7 5 14 2 4 6 3 1 1 3 1
X Non
Workers
M
28
2,011 1,485
284 85 6
11 12 12
116
1,829 1,433
211 52 8 12 6
17 90
1,631 1,253
166 39 8 8 7
68 82
1,508 1,117
257 48 12 9 2
15 48
713 513 115 44 2 3 4 5
27
F
29
3,050 1,320
323 229 160 312 306 184 216
2,829 1,351
235 222 207 294 243 134 143
2,532 1,086
264 193 160 71)7 227 146 159
2,107 1,013
217 165 131 226 160
97 98
1,007 461 106 96 66 93 80 63 42

TABLE-B-III PART-A
CLASSIFICATION OF WORKERS AND NON-WORKERS ACCORDING TO MAIN ACTIVITY BY EDUCATIONAL LEVELS IN URBAN AREAS ONLY
Flyleaf
This table corresponds to Table B-I1I Part-A of 1961-Census with the difference that in 1961-Census this table was prepared on full count basis whereas in 1971-Census it has been estimated on th! basis of 20 per cent sample for urban areas.
2. The test adopted for literacy in 1971-Census was the ability to read and write a simple letter with understanding. If a person fulfilled this test then he was treated as literate otherwise illiterate. In case of literate persons classification has been done according to the highest examination passed or the highest ed ucational level attained if any.
3. In this table entire population is classified into nine industrial categories of workers and non-workers and further cross-tabulated by educational levels. -
4. The educational levels adopted for this table are as follows
(l) Primary;
(2) Middle;
(3) Matriculation or Higher Secondary ;
(4) Non-technical diploma or Certificate not equal to degree
(5) Technical diploma or Certificate not equal to degree;
(6) Graduate degree other than technical degree ;
(7) Post-graduate degree other than technical degree ; and
(8) Technica~ degree or Diploma equal to degree or Post-graduate degree :
(i) Engineering and technology
(ii) Medicine;
(iii) Agriculture, veterinary and dairying
(iv) Teaching; and
(v) Others.
5. The data have been presented at the district level only.
51
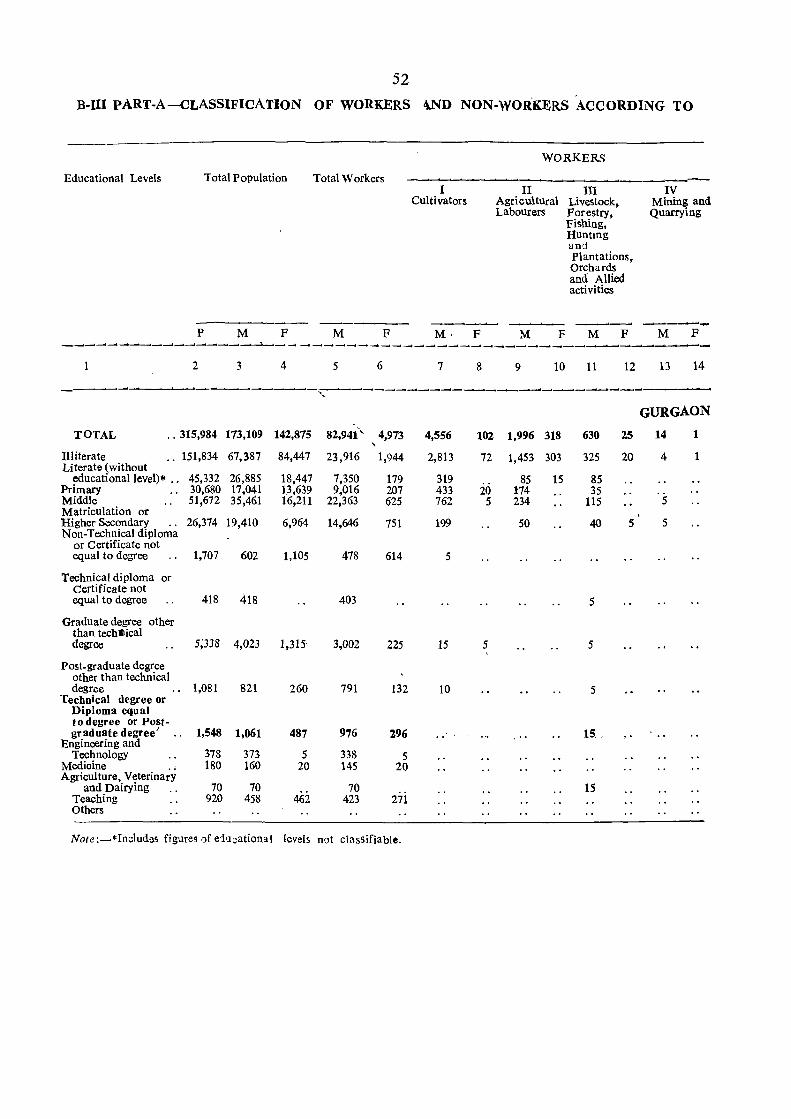
52
B-III PART-A-CLASSIFICATION OF WORKERS <\ND NON-WORKERS ACCORDING TO
Educational Levels Total Population
P M F
Total Workers
M F
I Cultivators
M· F
WORKERS
II Agri c u\tural Labourers
M F
III Livestock, Forestry, Fishing, Huntmg and Plantations, Orchards and Allied activities
M F
-~--------------~~---------------------------------2 3 4 5 6 7 8 9 10 11 12
------ ------------------------_---------------".
IV Mining and Quarrying
M F
13 14
GURGAON
TOTAL .. 315,984 173,109 142,875 82,94f' 4,973 4,556 102 1,996 318 630 25 14 1 \
llIiterate .. 151,834 67,387 Literate (without
84,447 23,916 1,944 2,813 72 1,453 303 325 20 4 1
educationallevel)* .. 45,332 26,885 18,447 7,350 179 319 85 15 85 Primary 30,680 17,041 13,639 9,016 207 433 20 174 35 Middle 51,672 35,461 16,211 22,363 625 762 5 234 115 5 Matriculation or Higher Secondary Non-Technical diploma
26,374 19,410 6,964 14,646 751 199 50 40 5 5
or Certificate not equal to degree 1,707 602 1,105 478 614 5
Technical diploma or Certificate not equal to degree 418 418 403 5
Graduate degree other than techllical degree 5;338 4,023 1,315 3,002 225 15 5 5
Post-graduate degree other than technical degree 1,081 821 260 791 132 10 5
Technical degree or Diploma equal to degree or Post-graduate degree'
Engineering and 1,548 1,061 487 976 296 IS, .
Technology 378 373 5 338 5 Medicine 180 160 20 145 20 Agriculture, VeterinarY
and Dairying .. 70 70 70 15 Teaching 920 458 462 423 271 Others
Note :~*Includes figures I)f e1ucational levels not classifiable.
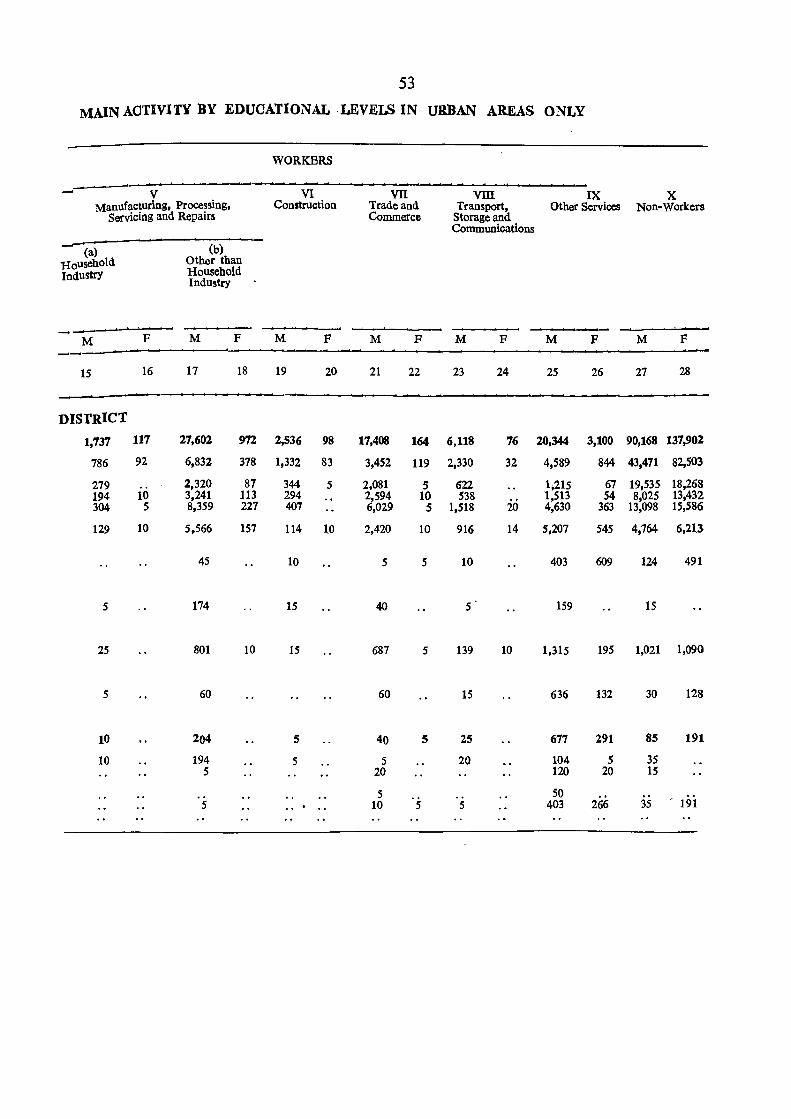
53
MAIN AOTIVITY BY EDUCATIONAL ·LEVELS IN URBAN AREAS ONLY
V Manufacturing, Processing,
Servicing and Repairs
(a) Household Industry
M
15
DISTRICT
1,737
786
279 194 304
129
5
25
5
10
10
F
16
117
92
10 5
10
(b) Other than Household Industry
M F
17 18
27,602 972
6,832 378
2,320 87 3,241 113 8,359 227
5,566 157
45
174
801 10
60
204
194 5
5
WORKERS
VI Construction
M F
19 20
2,536 98
1,332 83
344 5 294 <W7
114 1.0
10
15
15
5
5
vn Trade and Commerce
M F
21 22
17,408 164
3,452 119
2,081 S 2,594 10 6,029 5
2,420 10
5 5
40
687 .5
60
40 5
5 20
5 10 5
VIII IX X Transport, Other Services Non-Workers
Storage and Communications
M F M F M F
23 24 25 26 27 28
6,118 76 20,344 3,100 90,168 137,902
2,330 32 4,589 844 43,471 82,503
622 1;215 67 19,535 18,268 538 1,513 54 8,025 13,432
1,518 20 4,630 363 13,098 15,586
916 14 5,207 545 4,764 6,21.3
10 403 609 124 491
5 159 15
139 10 1,315 195 1,021 1,090
15 636 132 30 128
25 677 291 85 191
20 104 5 35 120 20 15
50 5 403 266 35 191

TABLE B-IV PART-A'
INDUSTRIAL CLASSIFICATION OF PERSONS AT WORK OTHER THAN AT CULTIVATION AS MAIN ACTIVITY BY SEX AND DIVISIONS, MAJOR GROUPS AND MINOR GROUPS
Flyleaf
This table presents the distribution of population at work other than at cultivation by Divisions, Major· <Jroups and Minor Groups of the National Industrial Classifications, 1970 (N.I.C. (1970) which has been ;adopted at the 1971-Census with suitable modifications. Data at the District level have been presented for 'All Areas' and 'Urban Areas'. The number of workers for 'Rural Areas' can be derived by subtracting the urban figures from the total. .
2. This table is supplemented with an Appendix which gives the distribution of workers in manufacturing, processing, servicing and repairs by household industry and non-household industry. The Appen.dix presents the same type of information as Table B· N Part -C of 1961-Census insofar as it relates to the 'workers engaged in manufacturing, processing, servicing and repairs. Both the table and its Appendix are !based on 20 per cent sample for urban areas and 10 per cent sample for rural areas.
3. This table is very important ecoi1omic table as it gives a detailed picture of employment position lin various sectors of economy.
55

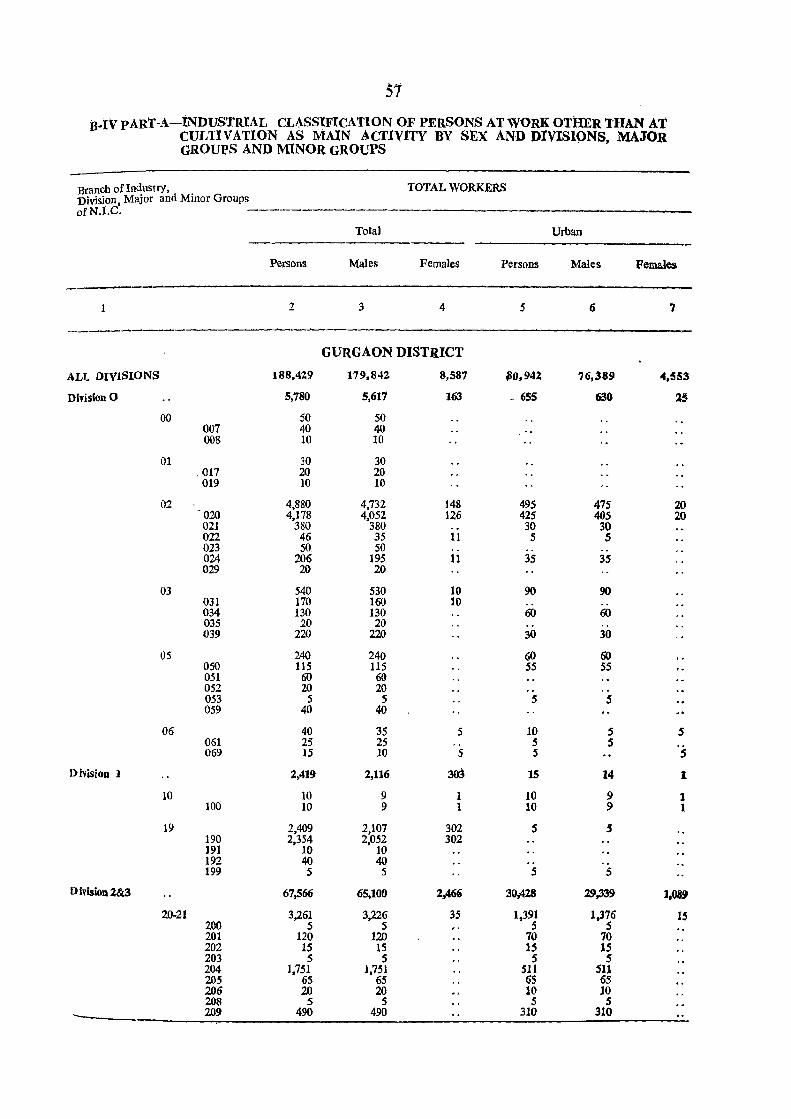
57
n.lV pART-A-INDUSTRIAL CLASSIFIcATION OF PERSONS AT WORK OTHER lUAN Al' CULTIVATION AS :MAIN ACTIVITY BY SEX AND DIVISIONS, MAJOR GROUPS AND MINOR GROUPS
Branch oflndustry, TOTAL WORKERS Division, Major and Minor Groups ofN.I.C.
Total Urban
Persons Males Females Persons Males Females
2 3 4 5 6 7
GURGAON DISTRICT
ALL DIVISIONS 188,429 179,842 8,587 ~O.942 ?6,389 ".553
Division 0 5,780 5,617 163 - 655 630 15
00 50 50 007 40 40 008 10 10
01 30 30 017 20 20 019 10 10
02 4,880 4,732 148 495 475 20 - 020 4,178 4,052 126 425 405 20
021 380 380 " 30 30 022 46 35 11 5 5 023 50 50 " .. .. 024 206 195 11 35 35 029 20 20
03 540 530 10 90 90 031 170 160 10 .. .. 034 130 130 60 60 035 20 2() .. .. 039 220 220 30 30
05 240 240 60 60 050 115 115 55 55 051 60 60 052 20 20 .. .. 053 5 5 5 5 059 40 40
06 40 35 S 10 5 5 061 2S 25 .. 5 5 069 15 10 5 5 5
Division 1 2,419 2,116 303 15 14 1
10 10 9 1 10 9 1 100 10 9 1 10 9 1
19 2,409 2,107 302 5 5 190 2,354 2,052 302 191 10 10 192 40 40 .. 199 5 5 5 5
Division 2&3 67,566 65,100 2,466 30,428 19,339 1.089
20·21 3,261 3,226 35 1,391 1,376 15 200 5 5 5 5 201 120 120 70 70 202 15 15 15 15 203 5 5 5 5 204 1,751 1,751 511 511 205 65 6S 65 6S 206 20 20 10 10 208 5 5 5 5 209 490 490 310 310
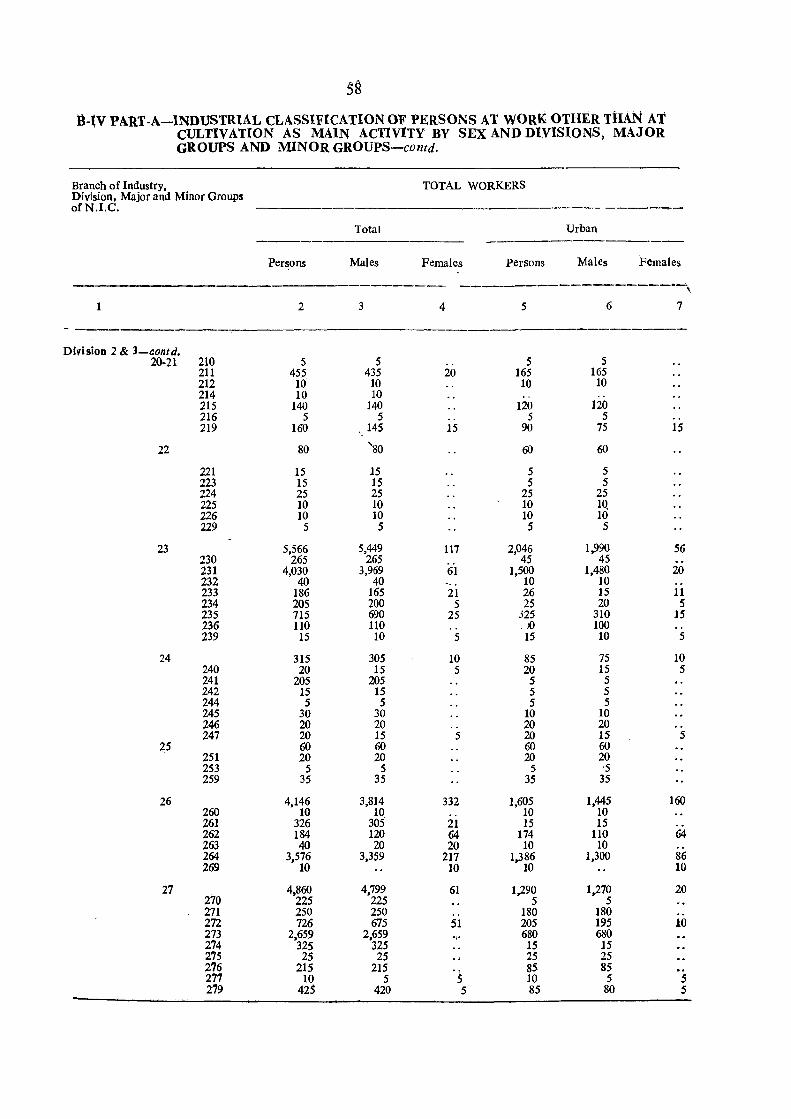
58
ii-IV PART-A-INDUSTRIAL CLASSIFICATION OF PERSONS AT WORK OTHER TiIAN AT , CULTIVATION AS MAIN ACTIVITY BY SEX AND DIVISIONS, MAJOR
GROUPS AND MINOR GROUPS-contd.
Branch oflndustry, TOTAL WORKERS Division. Major and Minor Groups ofN.I.C. ----~-
Total Urban ---------------
Persons Males Females Persons Males Females
------------__ - ___ 0_\
1 2 3 4 5 6 7
DifisioD 2 & 3-contd. 20·21 210 5 5 .. 5 5
211 455 435 20 165 165 212 10 10 10 10 214 10 10 .. .. 215 140 140 120 120 216 5 5 .. 5 5 .. 219 160 ,.145 15 90 75 15
22 80 'sO 60 60
221 15 15 5 5 223 15 15 5 5 224 25 25 25 25 225 10 10 10 lQ 226 10 10 10 10 229 5 5 5 5
23 5,566 5,449 117 2,046 1,990 56 230 265 265 45 45 .. 231 4,030 3,969 61 1,500 1,480 20 232 40 40 10 10 .. 233 186 165 21 26 15 11 234 205 200 5 25 20 5 235 715 690 25 325 310 15 236 110 110 .. . )0 100 .. 239 15 10 5 15 10 5
24 315 305 10 85 75 10 240 20 15 5 20 15 5 241 205 205 5 5 242 15 15 5 5 244 5 5 5 5 245 30 30 10 10 246 20 20 .. 20 20 .. 247 20 15 5 20 15 5
25 60 60 60 60 251 20 20 20 20 253 5 5 5 5 259 35 35 35 35
26 4,146 3,814 332 1,605 1,445 160 260 10 10 .. 10 10 261 326 305 21 15 15 .. 262 184 120 64 174 110 64 263 40 20 20 10 10 .. 264 3,576 3,359 217 1,386 1,300 86 269 10 10 10 10
27 4,860 4,799 61 1,290 1,270 20 270 225 225 5 5 271 250 250 .. 180 180 .. 272 726 675 51 205 195 10 273 2,659 2,659 680 680 274 325 325 15 15 275 25 25 ., 25 25 276 215 215 85 85 277 10 5 S 10 5 5 279 425 420 5 85 80 5
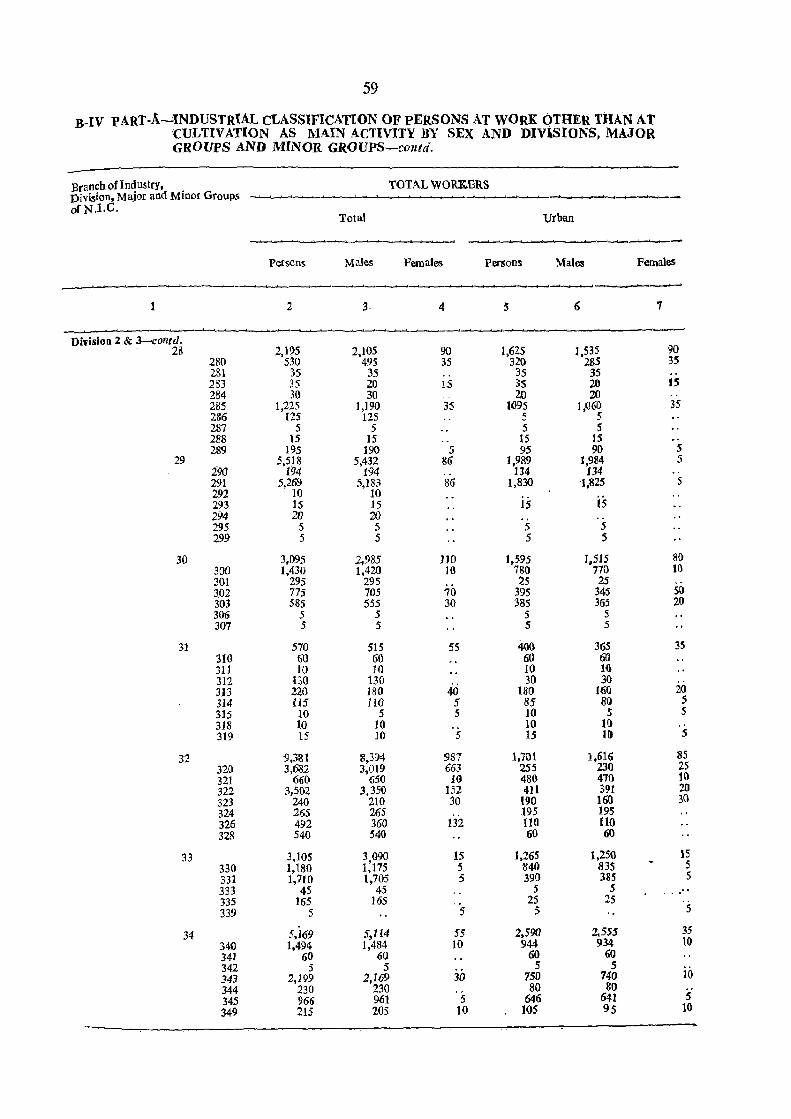
59
B-IV PART-A~INDUSTRtAL CLASSIFICATION OF pERSONS AT WORK OTHER TitAN AT CULTIVATION AS MAIN ACTIVITY BY SEX AND DIVlS[ONS, MAJOR GROUPS AND MINOR GR.OUPS-contd.
Branch ofIndustry, TOTAL WORKERS Division, Major and Minor Groups __._---..---~-
ofN.I.C. Urban Total
Persons Males Females Persons Males Females
---2 3 4 5 6 7
Division 2 & J-.contd. 2B 2,195 2,105 90 1,625 1,535 90
280 530 495 35 320 285 35 281 35 35 ,. 35 35 .. 283 35 20 1:5 35 20 15 284 30 30 . . 20 20 .. 285 1,225 1,190 35 1()95 1,060 35 286 125 125 5 :5 287 5 :5 5 5 288 15 ]5 15 l5 .. 289 195 190 5 95 90 5
29 5,518 5,432 86 1,989 1,984 5 290 194 194 .. 134 134 .. 291 5,269 5,183 86 1,830 1,825 5 292 10 10 293 15 15 15 15 294 20 20 295 5 5 5 5 299 5 5 5 5
30 3,D95 2.935 110 1,595 1,5J5 80 300 1,430 1,420 10 7S0 770 l(} 301 295 295 25 25 3,02 775 705 70 395 345 5()
303 585 555 30 385 365 20 306 5 5 5 5 307 5 5 5 5
31 570 515 55 400 365 35 310 GO 60 60 60 311 10 10 10 10. 312 no 130 30 30 313 220 180 40 ISO 160 2(l
314 llS 110 5 85 8f) :5 315 10 5 5 10 S 5 318 10 10 10 I() 319 15 10 5 15 10 5
~., '9,31!1 8,394 987 l,iDI 1,616 85 ;)~
320 3,682 3,019 663 255 230 25 321 660 650 .10 480 471} 10 322 3,5{)2 3,350 152 411 391 211 323 240 210 30 190 160 30 324 265 265 195 195 326 492 360 132 110 110 328 540 540 60 60
33 3,105 3090 15 1,265 1,250 15 330 1,180 1;175 5 840 835 5 331 1,710 1,705 5 390 385 5 333 45 45 5 5 , .. .. 335 165 165 25 25 339 5 :5 :5 5
34 5,169 5,1I4 55 2,590 2,555 35 340 1,494 1,484 10 944 934 10 341 60 60 60 60 342 5 5 5 :5 343 2,199 2,169 30 750 740 HI 344 230 230 80 80 345 966 961 5 646 64J :5 349 215 205 10 105 95 10
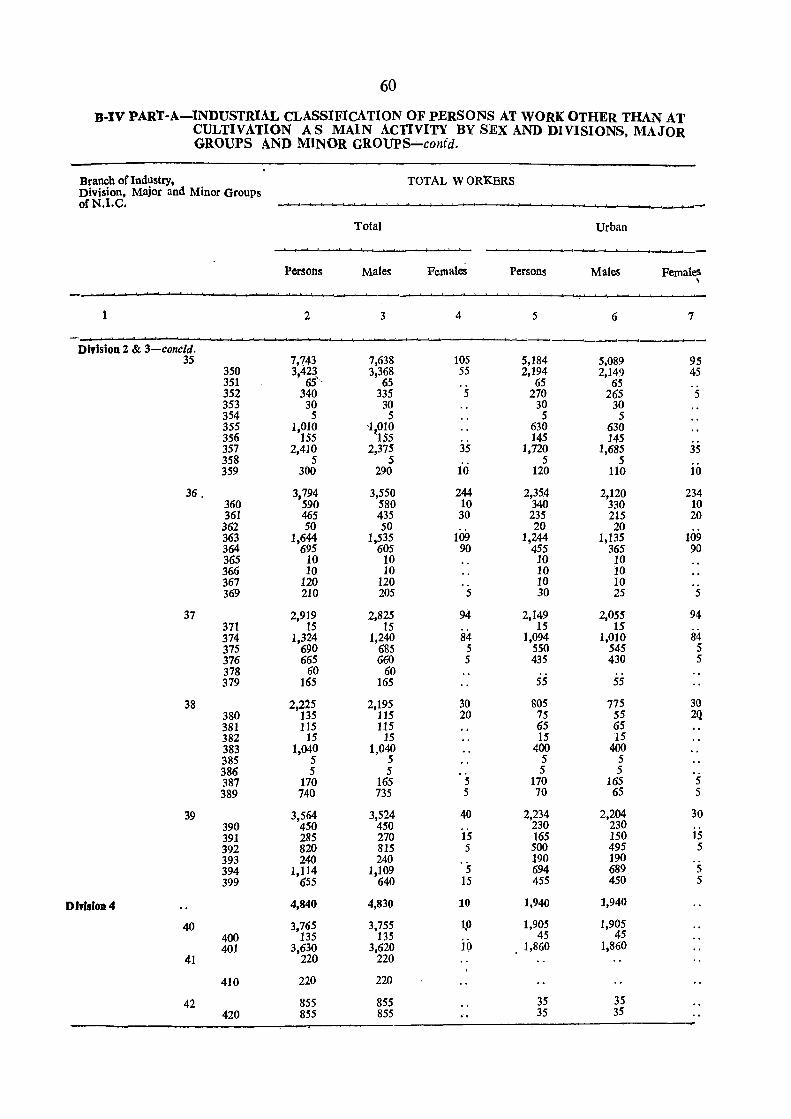
60
B-IV PART-A-INDUSTRlAL CLASSIFICATION OF PERSONS AT WORK OTHER THAN AT CULTIVATION A S MAIN ACTIVITY BY SEX AND DIVISIONS, MAJOR GROUPS AND MINOR GROUPS--confd.
Branch oflndustry, Division, Major and Minor Groups
TOTAL WORKERS
ofN.I.C. ___.._.__. ___...."..J~-
Total Urban
__..___.__. __._.~-----.......
Persons Males FemaleS Persons Males FemaleS ,
1 2 3 4 5 6 7
~---..._...___.,__""._
Di,ision 2 & 3-concld. 35 7,743 7,638 105 5,184 5,089 95
350 3,423 3,368 55 2,194 2,149 45 351 65" 65 65 65 352 340 335 5 270 265 5 353 30 30 30 30 354 5 5 5 5 355 1,010 '1,010 630 630 356 155 '155 145 145 357 2,410 2,375 35 1,720 1,685 35 358 5 5
10 5 5
359 300 290 120 110 10
36. 3,794 3,550 244 2,354 2,120 234 360 590 580 10 340 330 10 361 465 435 30 235 215 20 362 50 50 20 20 363 1,644 1,535 109 1,244 1,135 109 364 695 605 90 455 365 90 365 10 10 10 10 366 10 10 10 10 367 120 120 10 10 369 210 205 5 30 25 5
37 2,919 2,825 94 2,149 2,055 94 371 15 15 15 15 374 1,324 1,240 84 1,094 1,010 84 375 690 685 5 550 545 5 376 665 660 5 435 430 5 378 60 60 379 165 165 55 55
38 2,225 2,195 30 805 775 30 380 135 115 20 75 55 2Q 381 115 115 65 65 382 15 15 15 15 383 1,040 1,040 400 400 385 5 5 5 5 386 5 5 5 5 387 170 165 5 170 165 5 389 740 735 5 70 65 5
39 3,564 3,524 40 2,234 2,204 30 390 450 450
is 230 230
is 391 285 270 165 150 392 820 815 5 500 495 5 393 240 240 . 5 190 190 394 1,114 1,109 694 689 5 399 655 640 15 455 450 5
Division 4 4,840 4,830 10 1,940 1,940
40 3,765 3,755 1.0 1,905 1,905 400 135 135
ii> 45 45
401 3,630 3,620 1,860 1,860 41 220 220
410 220 220
42 855 855 35 35 420 855 855 .. 35 35
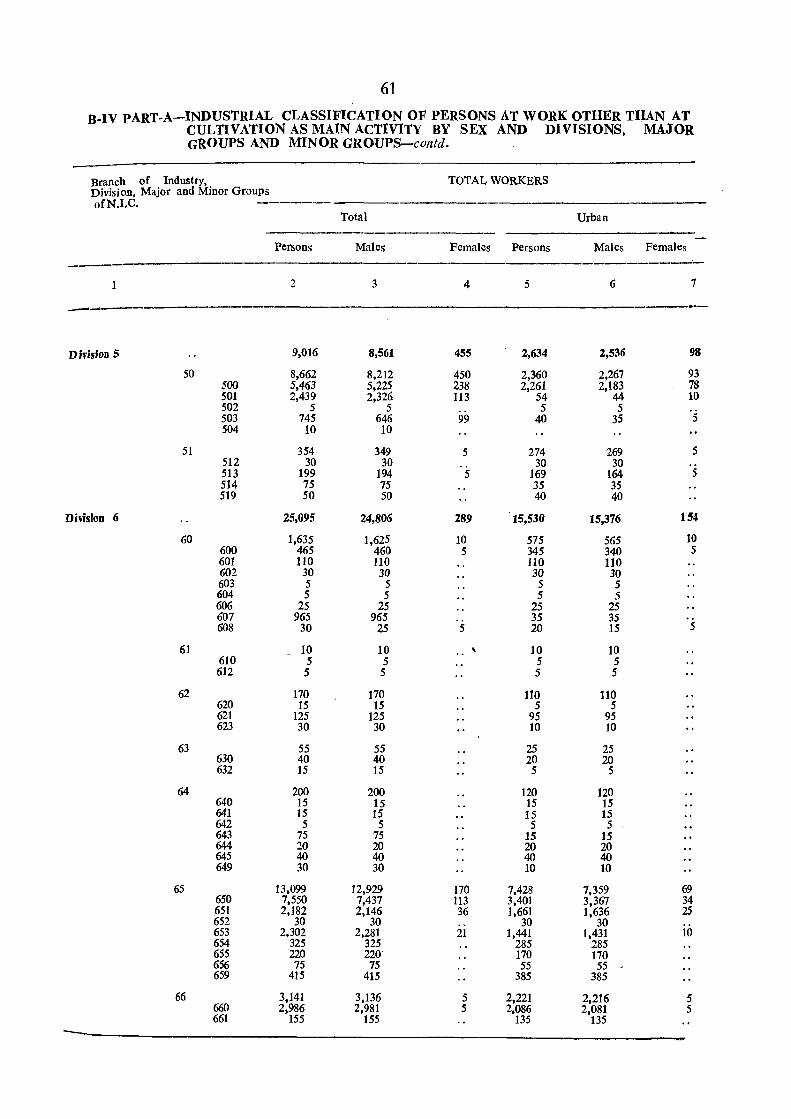
61
B-IV pART-A-INDUSTRIAL CLASSIFICATION OF PERSONS AT WORK OTHER TIJAN AT CULTIVATION AS MAIN ACTIVITY BY SEX AND DIVISIONS, MAJOR GROUPS AND MINOR GROUPS-confd.
Branch of Industry. TOTAL WORKERS Division, Major and Minor Groups ofN.I.C. ------
Total Urban
Persons Ma1es Females Persons Males Females
---2 3 4 5 6 7
---Division 5 9,016 8,561 455 2,634 2,536 98
50 8,662 8,212 450 2,360 2,267 93 500 5,463 5,225 238 2,261 2,183 78 501 2,439 2,326 113 54 44 10 502 5 5 5 5 ·s 503 745 646 99 40 35 504 10 10
51 354 349 5 274 269 5 512 30 30 30 30 513 199 194 5 169 164 5 514 75 75 35 3S 519 50 50 40 40
Division 6 25,095 24,806 289 15,530 15,376 154
60 1,635 1,625 10 575 565 10 600 465 460 5 345 340 5 601 110 110 110 110 602 30 30 30 30 603 5 5 5 5 604 5 5 5 5 606 25 25 25 25 607 965 965 35 35 608 30 25 5 20 15 5
61 10 10 10 10 610 5 5 5 5 612 5 5 5 5
62 170 170 ltO l1(j 620 15 15 5 5 621 125 125 95 95 623 30 30 10 10
63 55 55 25 25 630 40 40 20 20 632 15 15 5 5
64 200 200 120 120 640 15 15 15 15 641 15 15 15 15 642 5 5 5 5 643 75 75 15 15 644 20 20 20 20 645 40 40 40 40 649 30 30 10 10
65 13.099 12,929 170 7,428 7,359 69 650 7.550 7,437 113 3,401 3,367 34 651 2,182 2,146 36 1,661 1,636 25 652 30 30 30 30 653 2,302 2,281 21 1,441 1,431 10 654 325 325 285 285 655 220 220' 170 170 656 75 75 55 55 659 415 415 385 385
66 3.141 3,136 5 2,221 2.216 5 660 2,986 2.981 5 2.086 2,081 5 661 155 155 135 135
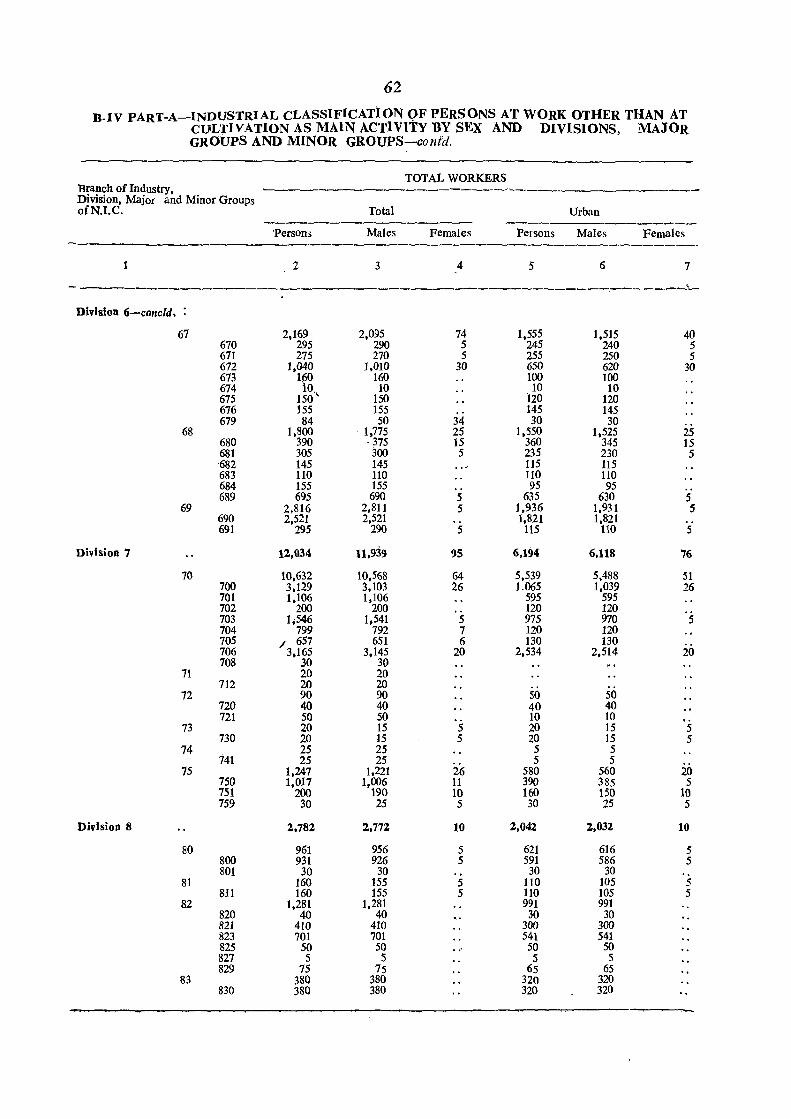
62 B.IV PART-A-INDUSTRIAL CLASSIFICATiON QF PERSONS AT WORK OTHER THAN AT
CULTIVATION AS MAIN ACTIVITY BY SEX AND DIVISIONS, MAJOR GROUPS AND MINOR GROUPS-contd.
TOTAL WORKERS Branch of Industry, Division, Major and Minor Groups ofN.I.C. Total Urban ---------... --_-._
'Person3 Males Females Persons Males Females
1 2 3 4 5 6 7
-------------------~------------------------------------~ Division 6-concld, :
67 2.169 2,095 74 1,555 1,515 40 670 295 290 5 245 240 5 671 275 270 5 255 250 5 672 1.040 1,010 30 650 620 30 673 160 160 100 100 674 10. 10 10 10 675 150 " 150 120 120 676 155 155 145 145 679 84 50 34 30 30
68 1,800 1.775 25 1.550 1,525 25 680 390 ·375 15 360 345 15 681 305 300 5 235 230 5 682 145 145 115 115 683 110 110 110 110 684 155 155 .. 95 95 ,. 689 695 690 5 635 630 5
69 2,816 2,811 5 1,936 1,931 5 690 2,521 2,521 1.821 1,821 691 295 290 5 115 110 5
Division 7 12,034 11,939 95 6,194 6,118 '76
70 10,632 10,568 64 5,539 5,488 51 700 3.129 3,103 26 1.065 1,039 26 701 1.106 1,106 595 595 702 200 200 120 120 703 1.546 1,541 5 975 970 5 704 799 792 7 120 120 705 / 657 651 6 130 130 706 3,165 3.145 20 2,534 2,514 20 708 30 30 ':' ~
71 20 20 712 20 20
72 90 90 50 SO 720 40 40 40 40 721 50 50 10 10
73 20 15 5 20 15 5 730 20 15 5 20 15 5
74 25 25 5 5 741 25 25 5 5
75 1.247 1,221 26 580 560 20 750 1.017 1.006 11 390 385 5 751 200 190 10 160 150 10 759 30 25 5 30 25 5
Division 8 2.782 2,772 10 2,042 2,On 10
80 961 956 5 621 616 5 800 931 926 5 591 586 5 801 30 30 " 30 30 ..
81 160 155 5 110 105 5 811 160 155 5 110 105 5
82 1,281 1,281 991 991 820 40 40 30 30 821 410 410 300 300 823 701 701 541 541 825 50 50 50 50 827 S S S S 829 7S 75 65 65
83 380 380 320 320 830 380 380 320 320
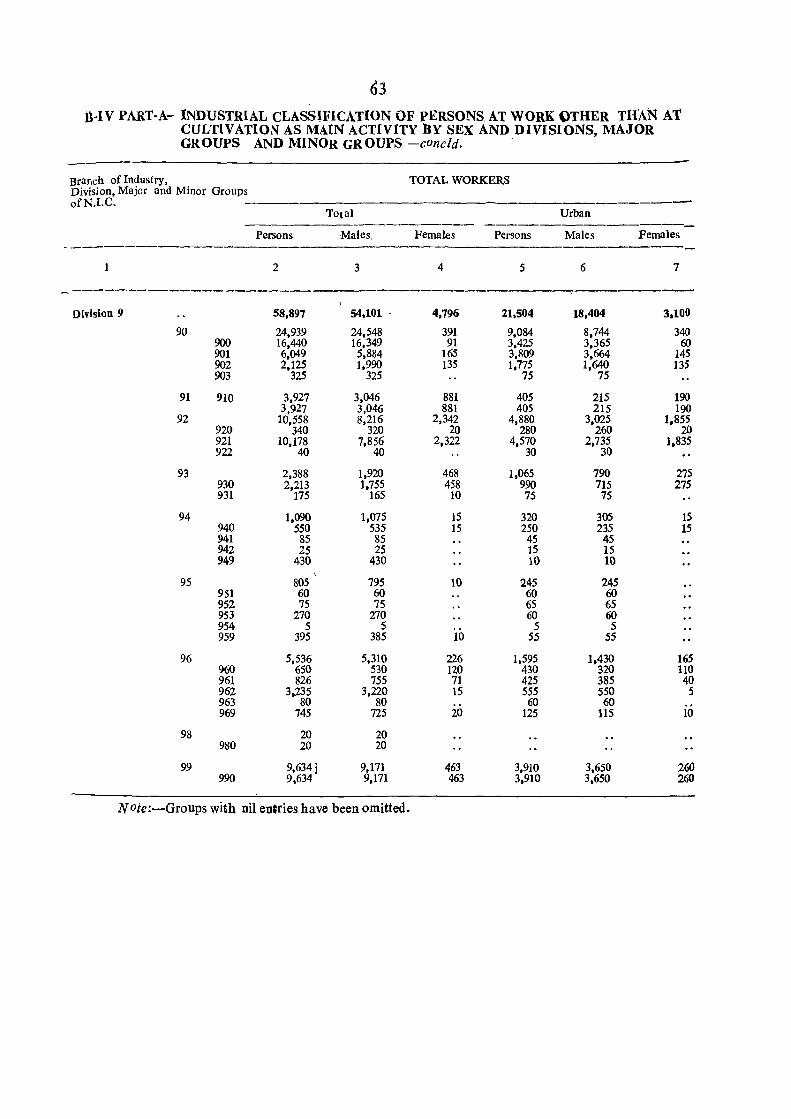
63 :tHV PART-A-INDUSTRIAL CLASSlFICATION OF PERSONS AT WORK OTHER THAN AT
CULTIVATION AS MAIN ACTIVITY BY SEX AND DIVISIONS, MAJOR GROUPS AND MINOR GR OUPS -cone/d.
Branch of Industry, Division, Major and Minor Groups
TOTAL WORKERS
ofN.I.C. Total Urban
--------------_ Persons Males Females Persons Males Females
2 3 4 5 6 7
Division 9 58,897 54,101 - 4,796 21,504 18,404 3.100
90 24,939 24,548 391 9,084 8,744 340 900 16,440 16,349 91 3,425 3,365 60 901 6,049 5,884 165 3,809 3,664 145 902 2,125 1,990 135 1,775 1,640 135 903 325 325 75 75
91 910 3,927 3,046 881 405 215 190 3,927 3,046 881 405 215 190
92 10,558 8,216 2,342 4,880 3,025 1.855 920 340 320 20 280 260 20 921 10,178 7,856 2,322 4.570 2.735 1.835 922 40 40 30 30
93 2,388 1,920 468 1,065 790 275 930 2,213 1.755 458 990 715 275 931 175 165 10 75 75
94 1,090 1,075 15 320 305 15 940 550 535 15 250 235 15 941 85 85 45 45 942 25 25 15 15 949 430 430 10 10
95 805 795 10 245 245 951 60 60 60 60 952 75 75 65 65 953 270 270 60 60 954 5 5 5 5 959 395 385 10 55 55
96 5,536 5,310 226 1.595 1,430 165 960 650 530 120 430 320 110 961 826 755 71 425 385 40 962 3.235 3,220 15 555 550 5 963 80 80 60 60 969 745 725 20 125 115 10
98 20 20 980 20 20
99 9,634j 9,171 463 3,910 3,650 260 990 9,634 9,171 463 3,910 3,650 260
Noie:-Groups with nil entries have been omitted.
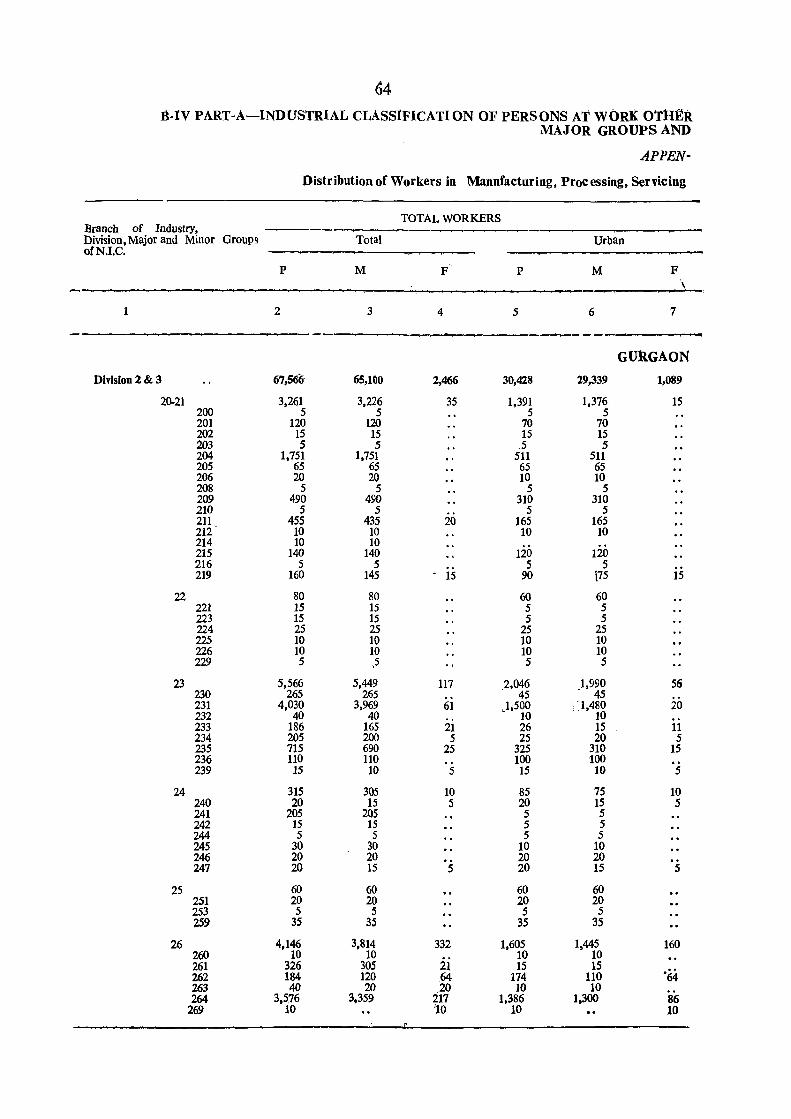
()4
B-XV PART-A-INDUSTRIAL CLASSIFICATION OF PERSONS AT WORK O'flI~R MAJOR GROUPS AND
APPEN-
Distribution of Workers in Mannfacturing, Proc essing, Servicing
TOTAL WORKERS Branch of Industry, Division, Major and Minor Groups Total Urban orN.I.C.
p M ,
F P M F \
2 3 4 5 6 7
-.-..----GURGAON
Division 2 & 3 67,566' 65,100 2,466 30,428 29,339 1,089
20-21 3,261 3,226 35 1,391 1,376 15 200 5 5 5 5 201 120 120 70 70 202 15 15 15 15 203 5 5 .5 5 204 1,751 1,751 511 511 205 65 65 65 65 206 20 20 10 10 208 5 5 5 5 209 490 490 310 310 210 5 5 5 5 211 455 435 20 165 165 212 10 10 10 10 214 10 10 215 140 140 120 120 216 5 5 5 5 .. 219 160 145 15 90 115 15
22 80 80 60 60 221 15 15 5 5 223 15 15 5 5 224 25 25 25 25 225 10 10 10 10 226 10 10 10 10 229 5 ,5 5 5
23 5,566 5,449 117 ),046 1,990 56 230 265 265 45 - 45 231 4,030 3,969 61 I j 500 i '1480 20 232 40 40 - 10 ,- , 10 233 186 165 21 26 15 11 234 205 200 5 25 20 5 235 715 690 25 325 310 15 236 110 110 100 100 .. 239 15 10 5 15 10 5
24 315 305 10 85 75 10 240 20 15 5 20 15 5 241 205 205 5 5 242 15 15 5 5 244 5 5 5 5 245 30 30 10 10 246 20 20 20 20 247 20 15 5 20 15 5
25 60 60 60 60 251 20 20 20 20 253 5 5 5 5 259 35 35 35 35
26 4,146 3,814 332 1,605 1,445 160 260 10 10 10 10 261 326 305 21 15 15
'64 262 184 120 64 174 110 263 40 20 20 10 10 264 3.576 3,359 217 1,386 1,300 86
269 10 /10 10 10
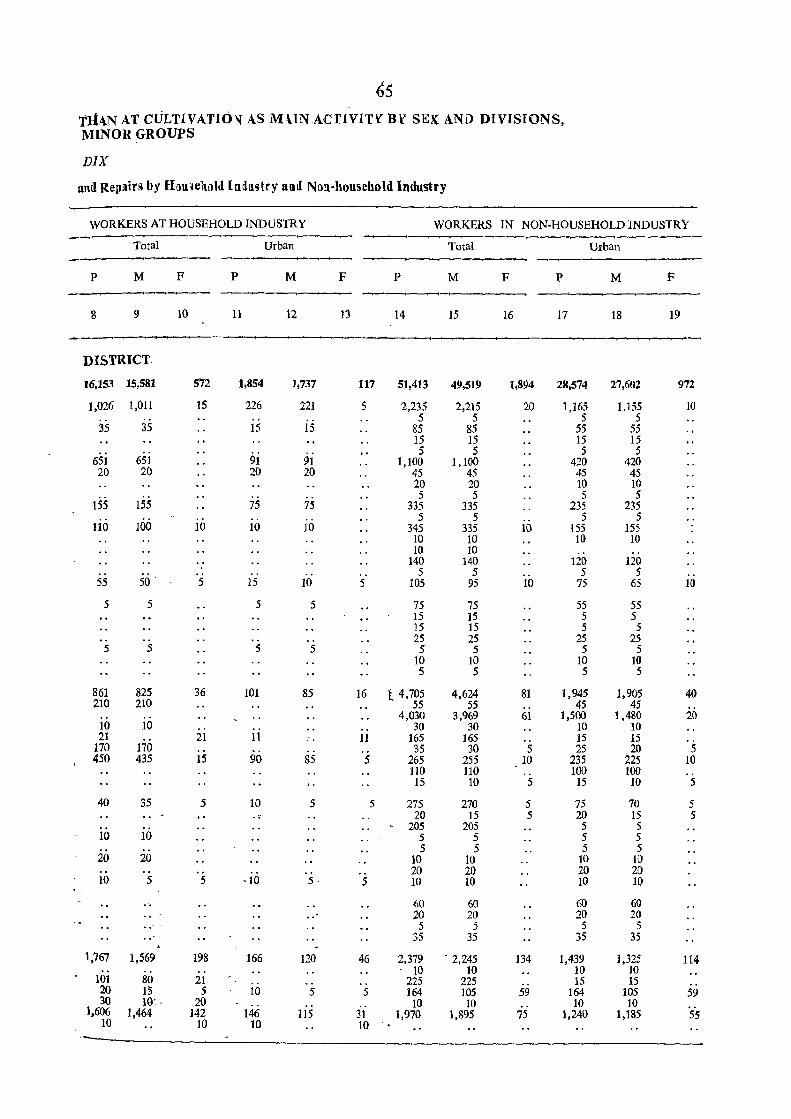
65 tHAN AT CULTIVATH)_~ AS MHNACfIVITY BY SEK AND D~VISIONS, MINOR GROUPS
DIX
and Replin by H!}u.e1t()ld In:iltstry and N!}u-household Industry
WORKERS AT HOUSEHOLD INDUSTRY WORKERS IN NON-HOUSEHOLD INDUSTRY
Total Urban Total Urban
p M F P M F P M F P M F ~~ ~-
8 9 10 11 12 13 14 15 16 17 18 19
DISTRICT
16,153 15,581 572 1,854 1,737 117 51,413 49,519 1,894 28,574 27,602 972
1,026 1,011 15 226 221 5 2,235 2,215 20 1,165 1,155 10 .. 5 5 5 5
35 35 15 15 85 85 55 55 15 15 15 15
6si 9i 5 5 5 5 651 91 1,100 1,100 420 420
20 20 20 20 45 45 45 45 20 20 10 10 5 5 5 5
155 155 75 75 335 335 235 235 5 5 5 5 ..
110 ]00 10 10 10 345 335 10 155 155 10 10 10 10 10 10 .. ..
., 140 140 120 120 .. 5 5 5 5
55 50· 5 15 10 5 105 95 10 75 65 10
5 5 5 5 75 75 55 55 15 15 5 5 15 15 5 5 .. .. 25 25 25 25
5 5 5 5 5 5 5 5 10 10 10 10 5 5 5 5
861 825 36 101 85 16 t 4,705 4,624 81 1,945 1,905 40 210 210 55 55 45 45
4,030 3,969 61 1,500 1,480 20 10 10 .. 3D 30 10 10 21 21 11 .-. 11 165 165 15 15
170 170 .. 35 30 5 25 20 5 450 435 15 90 85 5 265 255 10 235 225 10
110 110 100 100 15 10 5 15 10 5
40 35 5 10 5 5 275 270 5 75 70 5 .. 20 15 5 20 15 5
205 205 5 5 10 10 5 5 5 5
5 5 5 5 20 20 10 10 10 10 .. 20 20 20 20 10 5 5 -to 5· 5 10 10 10 10
60 60 60 60 .. . 20 20 20 20 5 5 5 5
35 35 35 35
1,767 1,569 198 166 120 46 2,379 . 2,245 134 1,439 1,325 114 .. 10 10 10 10 101 80 21 .. .' .. 225 225 .. 15 15 .. 20 15 5 10 5 5 164 105 59 164 105 59 30 lQ: . 20 10 10 10 10
1,606 1,464 142 146 115 31 1,970 1,895 75 1,240 1,185 55 10 10 10 10
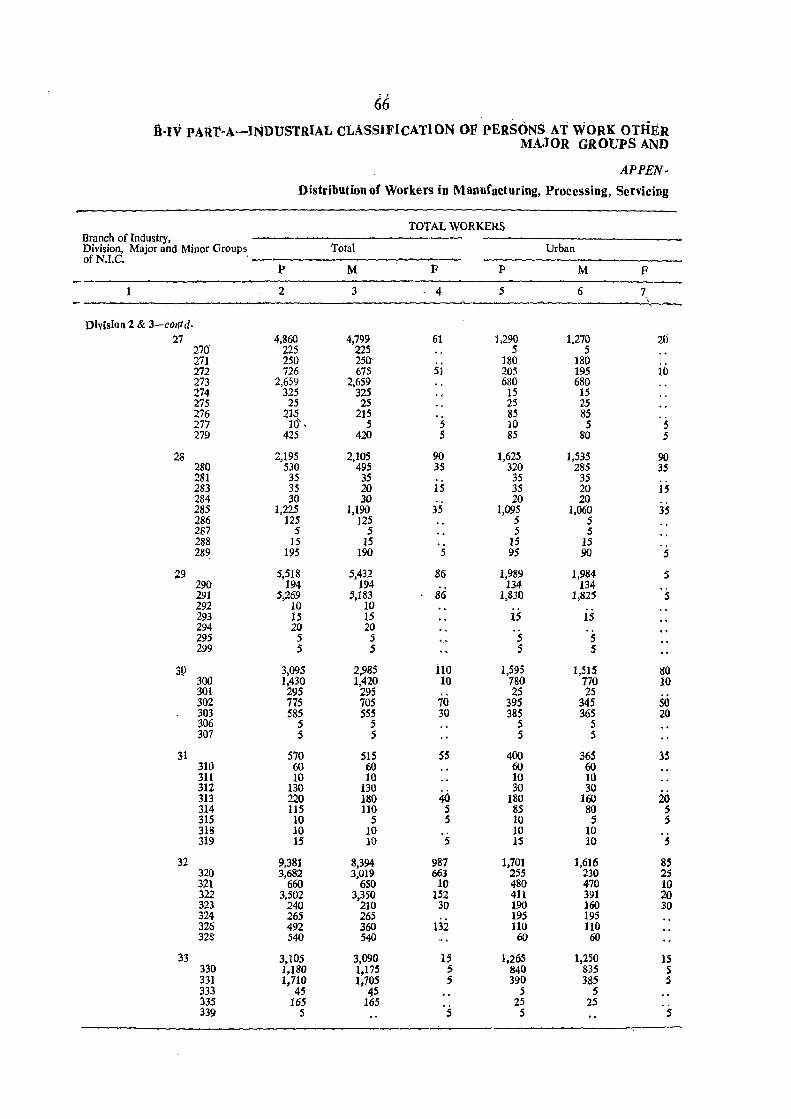
66 B-rv PARr-A-INDUSTRIAL CLASSIFICATION OF PERSONS AT WORK OTliER
MAJOR GROUPS AND
APPEN-
Distribution of Workers in Manufacturing, Processing, Servicing
TOTAL WORKERS Branch of Industry, Division, Major and Minor Groups of N.I.C. '
Total Urban
P M F P M F
2 3 4 5 6 7,
Division 2 & 3-contd. 27 4,860 4,799 61 1,290 1,270 20
270 225 225 5 5 271 250 250' 180 180 272 726 675 51 205 195 10 273 2,659 2,659 680 680 274 325 325 15 15 275 25 25 25 25 276 215 215 85 85 277 10" • 5 5 10 5 5 279 425 420 5 85 80 5
28 2,195 2,105 90 1,625 1,535 90 280 530 495 35 320 285 35 281 35 35 35 35 283 35 20 15 35 20 15 284 30 30 20 20 285 1,225 1,190 35 1,095 1,060 35 286 125 125 5 5 287 5 5 5 5 288 15 15 15 15 289 195 190 5 95 90 5
29 5,518 5,432 86 1,989 1,984 5 290 194 194 134 134 291 5,269 5,183 86 1,830 1,825 5 292 10 10 293 15 IS 15 15 294 20 20 295 5 5 ',' S 5 299 5 S S 5
19 3,095 2,985 110 1,595 1,515 80 300 1,430 1,420 10 780 770 10 301 295 295 25 25 302 775 70S 70 395 345 SO 303 585 55; 30 385 365 20 306 5 5 5 5 307 5 5 5 5
31 570 515 55 400 365 35 310 60 60 60 60 311 10 10 10 10 312 130 130
40 30 30
20 313 220 180 180 160 314 115 110 5 85 80 5 315 10 5 5 10 5 5 318 10 10 10 10 319 15 10 5 15 10 5
32 9,381 8,394 987 1,701 1,616 8S 320 3,682 3,019 663 255 230 25 321 660 650 10 480 470 10 322 3,502 3,350 152 411 391 20 323 240 210 30 190 160 30 324 265 265 195 195 326 492 360 132 110 110 328 540 540 60 60
33 3,105 3,090 15 1,265 1,250 15 330 1,180 1,175 5 840 835 5 331 1,710 1,705 5 390 385 5 333 45 45 5 S 335 165 165 '5 2S 25 339 5 5 S
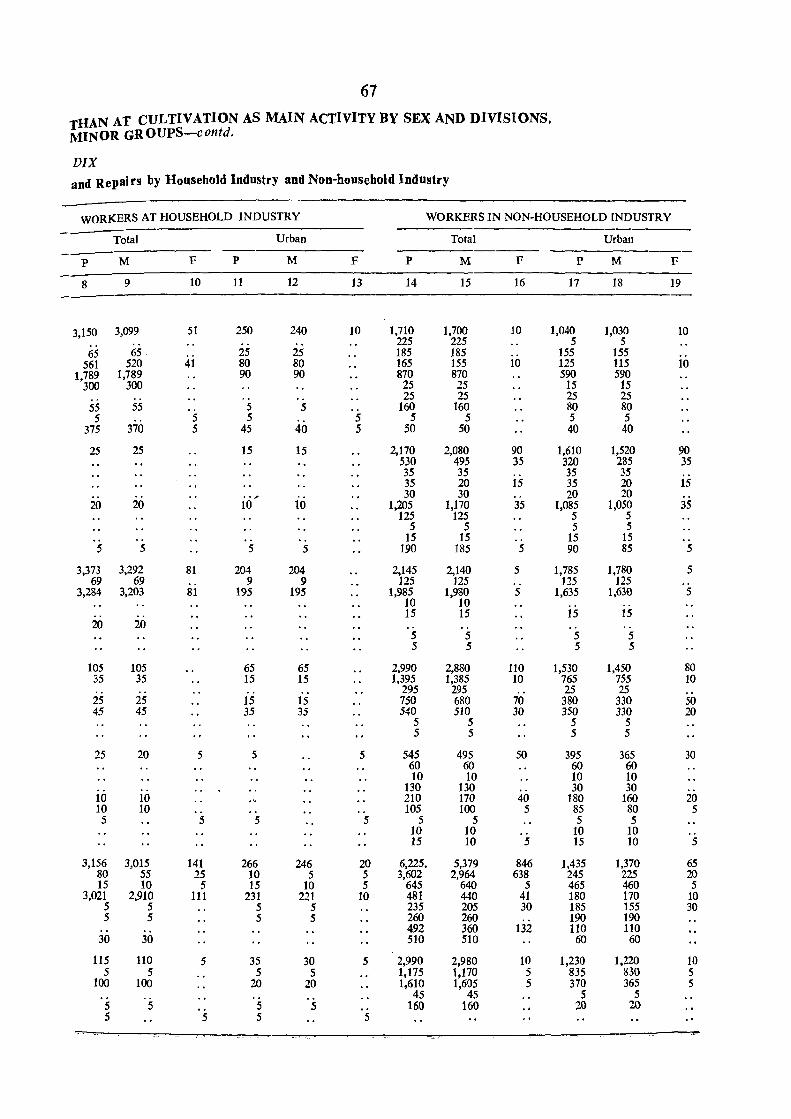
67
THAN AT CULTIVATION AS MAIN ACTIVITY BY SEX AND DIVISIONS, MINOR GROUPS-contd.
DIX and Repairs by Household Industry and Non-household Industry
WORKERS AT HOUSEHOLD INDUSTRY WORKERS IN NON-HOUSEHOLD INDUSTRY
Total Urban Total Urban
p M F P M F P M F P M F
8 9 10 11 12 13 14 15 16 17 18 19
3,150 3,099 51 250 240 10 1,710 1,700 10 1,040 1,030 10 .. 225 225 5 5
65 65 25 25 185 185 155 155 561 520 41 80 80 165 155 10 125 115 10
1,789 1,789 90 90 870 870 590 590 300 300 25 25 15 15
.. 25 25 25 25 55 55 5 5 160 160 80 80 5 5 5 5 5 5 5 5
375 370 5 45 40 5 50 50 40 40
25 25 15 15 2,170 2,080 90 1,610 1,520 90 530 495 35 320 285 3S 35 35 35 35 35 20 15 35 20 15
.. .. , 30 30 20 20 20 20 10 10 1,205 1,170 35 1,085 1,050 35
125 125 5 5 5 5 5 5
.. .. 15 15 .. 15 15 5 5 5 5 190 185 5 90 85 5
3,373 3,292 81 204 204 2,145 2,140 5 1,785 1,780 5 69 69 9 9 125 125 125 125
3,284 3,203 81 195 195 1,985 1,980 5 1,635 1,630 5 10 10
.. 15 15 15 15 20 20 .. ..
5 5 5 5 5 5 5 5
105 105 65 65 2,990 2,880 110 1,530 1,450 80 35 35 15 15 1,395 1,385 10 765 755 10
295 295 .. 25 25 25 25 15 IS 750 680 70 380 330 50 45 45 35 35 540 510 30 350 330 20
5 5 5 5 5 5 5 5
25 20 5 5 5 545 495 50 395 365 30 60 60 60 60 10 10 10 10
130 130 30 30 10 10 210 170 40 180 160 20 10 10 .. .. .. 105 100 5 85 80 5 5 5 5 5 5 5 5 5
10 10 10 10 15 10 5 15 10 5
3,156 3,015 141 266 246 20 6,225. 5,379 846 1,435 1,370 65 80 55 25 10 5 5 3,602 2,964 638 245 225 20 15 10 5 15 10 5 645 640 5 465 460 5
3,021 2,910 111 231 221 10 481 440 41 180 170 10 5 5 5 5 235 205 30 185 155 30 5 5 5 5 260 260 190 190
492 360 132 110 110 30 30 510 510 60 60
115 110 5 35 30 5 2,990 2,980 10 1,230 1,220 10 5 5 5 5 1,175 1,170 5 835 830 5
100 100 20 20 1,610 1,605 5 370 365 5 45 45 5 5
5 S 5 S ., 160 160 20 20 5 5 5 5
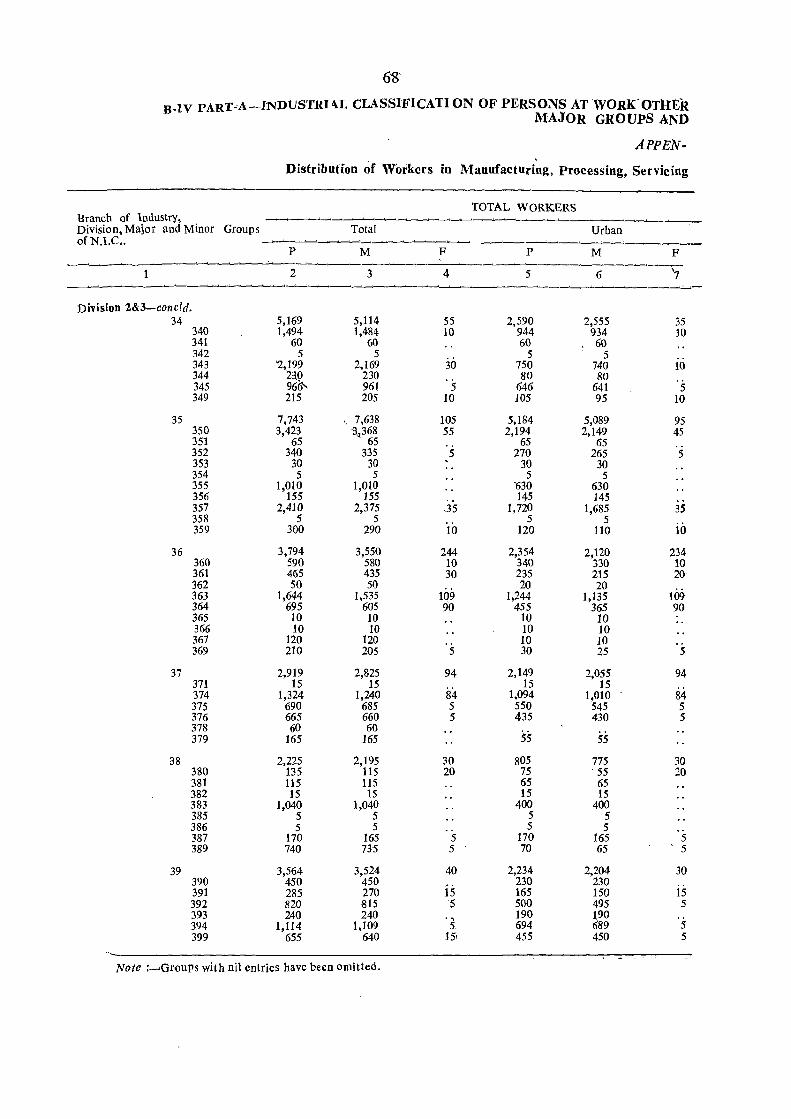
6'8'
B-IV PART"A-INDUSTRHL CLASSIFICATION OF PERSONS AT'WORK'OTlIER MAJOR GROUPS AND
APPE'N-,
Distribution of Workers in Manufacturing, Processing, Servicing
TOTAL WORK.ERS Branch of Industry, Division, Major and Minor Groups Total Urban ofN.I.e .. ____..._..~
-~ -~-P M F P M F
-2 3 4 5 6 '7 ~-'--'~
Division 2&3-concld. 34 5,169 5,114 55 2,590 2,555 35
340 1,494 1,484 10 944 934 10 341 60 60 60 60 342 5 5 5 5 343 2,199 2,169 30 750 740 10 344 23.0 230 '5 80 80 345 96()\. 961 646 641 5 349 215 205 10 105 95 10
35 7,743 " 7,638 105 5,184 5,089 95 350 3,423 '~368 55 2,194 2,149 45 351 65 65 65 65 352 340 335 5 270 265 5 353 30 30 30 30 354 5 5 5 5 355 1,010 1,010 '630 630 356 155 155 145 145 357 2,410 2,375 .35 1,720 1,685 35 358 5 5 5 5 359 300 290 10 120 110 iii
36 3,794 3,550 244 2,354 2,120 234 360 590 580 10 340 330 10 361 465 435 30 235 215 20 362 50 50 20 20 363 1,644 1,535 109 1,244 1,135 109 364 695 605 90 455 365 90 365 10 10 10 10 366 10 10 10 10 367 120 120 10 10 369 210 205 5 30 25 5
37 2,919 2,825 94 2,149 2,055 94 371 15 15 15 15 374 1,324 1,240 84 1,094 1,010 84 375 690 685 5 550 545 5 376 665 660 5 435 430 5 378 60 60 379 165 165 55 55
38 2,225 2,195 30 805 775 30 380 135 115 20 75 . 55 20 381 115 115 65 65 382 15 15 15 15 383 1,040 1,040 400 400 385 5 5 5 5 386 5 5 5 5 387 170 165 5 170 165 5 389 740 735 5 70 65 . 5
39 3,564 3,524 40 2,234 2,204 30 390 450 450
is 230 230
391 285 270 165 150 15 392 820 815 5 500 495 5 393 240 240 . , 190 190 394 1,114 1,109 5 694 689 5 399 655 640 151 455 450 5
Note :~Groups with nil entries have been omitted.
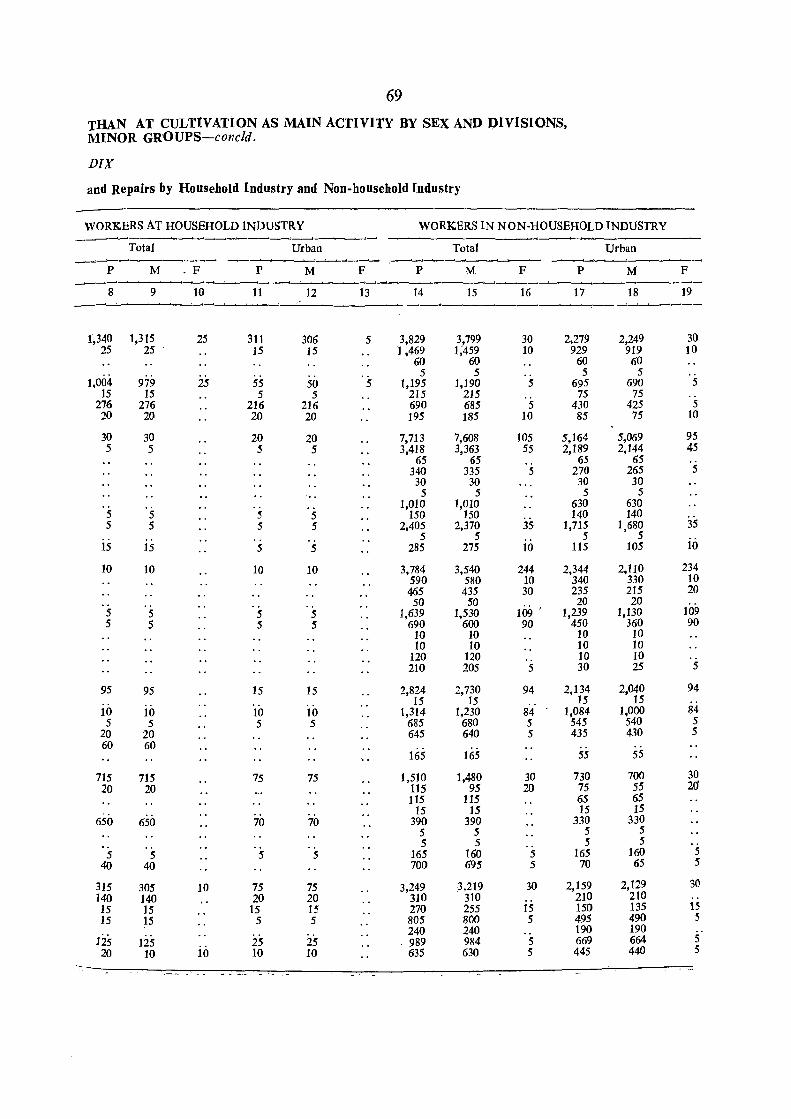
69
THAN AT CULTIVATION AS MAIN ACTIVITY BY SEX AND ))IVISIONS, MINOR GROUPS-concld.
DIX
and Repairs by Household Industry and Non-household Industry
WORKERS AT HOUSEHOLD INDUSTRY WORKERS IN NON-HOUSEHOLD INDUSTRY ______.___.~
Total Urban Total Urban __ -..l-.....;__,___.~
~~~
P M .F P M F P M F P M F _....-----___.___.
~--------~ 8 9 10 11 12 13 14 15 16 17 18 19
__.. ~~-~--- --'_-"_---
1,340 1,315 25 311 306 5 3,829 3,799 30 2,279 2,249 30 25 25 15 15 1,469 1,459 10 929 919 10
60 60 60 60 5 5 .. 5 5
1,004 979 25 55 50 5 1,195 1,190 5 695 690 5 15 15 5 5 215 215 75 75
276 276 216 216 690 685 5 430 425 5 20 20 20 20 195 185 10 85 75 10
30 30 20 20 7,713 7,608 105 5,164 5,069 95 5 5 5 5 3,418 3,363 55 2,189 2,144 45
65 65 65 65 340 335 5 270 265 5 30 30 30 30 5 5 5 5
1,010 1,0to 630 630 5 5 5 5 150 150 140 140 5 5 5 5 2,405 2,370 35 1,715 1,680 35
.. 5 5 5 5 in 15 15 5 5 285 275 10 115 105
10 10 10 10 3,784 3,540 244 2,344 2,110 234 590 580 10 340 330 10 465 435 30 235 215 20 50 50 20 20
5 5 5 5 1,639 1,530 109 I 1,239 1,130 109 5 5 5 5 690 600 90 450 360 90
10 10 10 10 10 10 10 10
120 120 10 10 210 205 5 30 25 5
95 95 15 15 2,824 2,730 94 2,134 2,040 94 15 15 15 15
10 10 10 10 1,314 1,230 84 1,084 1,000 84 5 5 5 5 685 680 5 545 540 5
20 20 645 640 5 435 430 5 60 60
165 165 55 55
715 715 75 75 1,510 1,480 30 730 700 30 20 20 115 95 20 75 55 20
115 115 65 65 15 15 15 15
650 650 70 70 390 390 330 330 5 5 5 5 5 5 5 5
5 5 5 5 165 160 5 165 160 5 40 40 700 695 5 70 65 5
315 305 10 75 75 3,249 3.219 30 2,159 2,129 30 140 140 20 20 310 310 210 210 15 15 15 15 270 255 15 150 135 15 15 15 5 5 805 800 5 495 490 5
240 240 .. 190 190 125 125 25 25 . 989 984 5 669 664 5 20 10 io 10 10 635 630 5 445 440 5
- ~-.... -_ ,-..._

tABLE B-iv PART-D INDUSTRiAL CLASSIFICATION BY SEX AND CLASS OF WORKERS OF PERSONS AT WORR
IN NON-HOUSEHOLD INDUSTRY, TRADE, BUSINESS, PROFESSION OR SERVICE AS MAIN ACTIVITY
Flyleaf
This table corresponds to Table B-IV Part-B of 1961-Census and gives the distribution of persons engaged at work in non-hou~ehold industry, trade, .business, professi.o~ .or service b~ each class of workers viz., employers, employees, smgle workers and famdy workers by DlVlslOns and Major Groups of National Industrial Classification, 1970.
2. Figures are given for total and urban areas and for rural areas these can be derived by subtracting urban figures from the total.
3. Data in this table have been presented at District level only and have been estimated from 10 per cent sample for rural areas and 20 per cent sample for urban areas.
71

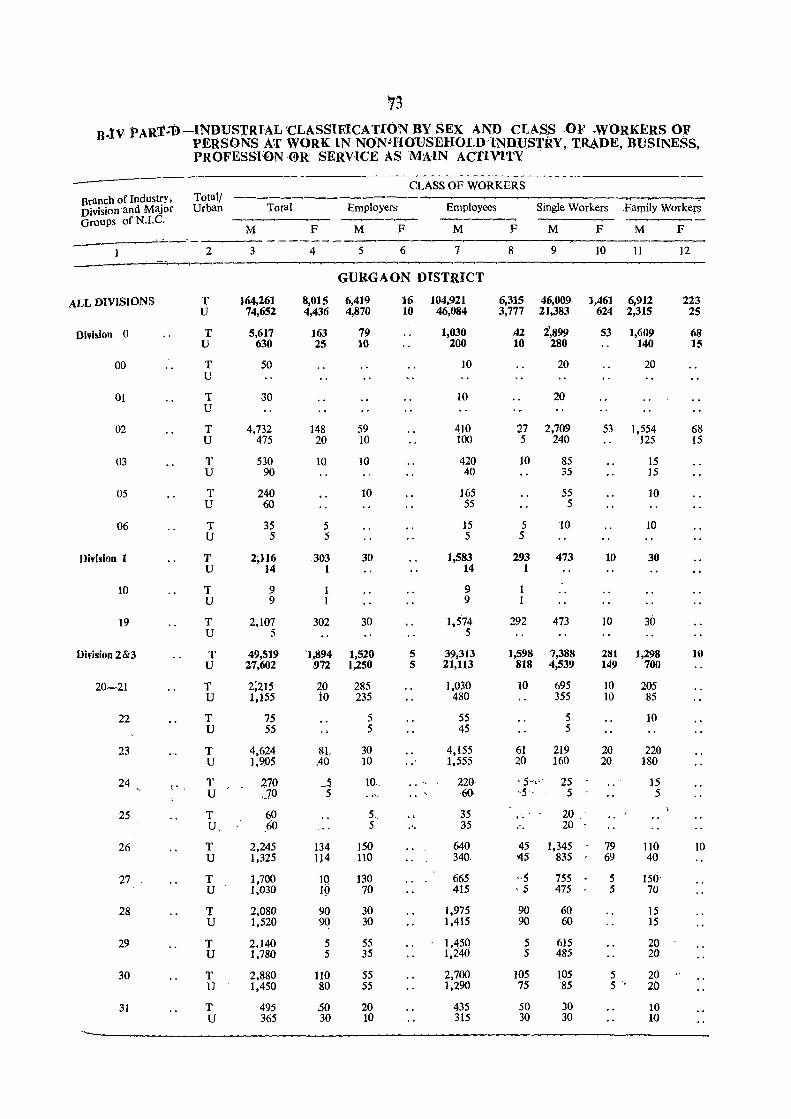
73 n-lV PARt:D -INDustRIAL 'CLASSIEICA TION BY SEX AND CLAS,S, OF ·WORKERS OF
PERSONS A:f WORK IN NON!HOlJSEHOLD'tNDUSl'RY, TRADE, :BUSINESS, PROFESSION (!)R SERVICE AS Mi\lN ACTIVITY
CLASS OF WORKERS Branch of Indust~y , Total! ~~
Division 'and Major Urban Total Employers Employees Single Workers .Family Workers Groups of N.te. ~~~ ~-~~
M F M F M F M F M F
--- --~----------~ 2 3 4 5 6 7 8 9 10 11 12
----_....:"'.=.::.~~ ~~~--
GURGAON DISTRICT
ALL DIVISIONS T 164,261 8,015 6,419 16 104,921 6,315 46,009 1,461 6,912 223 U 74,652 4,436 4,870 10 46,084 3,777 21,383 624 2,315 25
Division 0 T 5,617 163 79 1,030 42 t,899 53 1,609 68 U 630 25 10 200 10 280 140 15
00 T 50 10 20 20 U
01 T 30 10 20 U
02 T 4,732 148 59 410 27 2,709 53 1,554 68 U 475 20 10 100 5 240 125 15
03 T 530 10 10 420 10 85 15 U 90 40 35 15
05 T 240 10 165 55 10 U 60 55 5
06 T 35 5 15 5 10 10 U 5 5 5 5
Division 1 T 2,116 303 30 1,583 293 473 10 30 U ]4 1 14 1
10 T 9 1 9 1 U 9 1 9 1
19 T 2,107 302 30 1,574 292 473 10 30 U 5 5
Division 2&3 T 49,519 1,894 1,520 5 39,3J3 1,598 7,388 281 1,298 10 U 27,602 972 1,250 5 21,113 818 4,539 149 700
20-21 T 2;215 20 285 1,030 10 695 10 205 U 1,155 io 235 480 355 10 85
22 T 75 5 55 5 10 U 55 5 45 5
23 T 4,624 81. 30 4,155 61 219 20 220 U 1,905 .40 10 1,555 20 160 20 180
24 ,. T 270 _5 10,_ 220 ' ,5~," 25 15 U . .10 5 ,60- '5 ' 5 5
25 T 60 5:. 35 ,', 20 " U, 60 5 .', 35 " 20 '
26 T 2,245 134 150 640 45 1,345 79 110 10 U 1,325 Ij4 110 340 45 835 69 40
27 T 1,700 lQ 130 665 "5 755 5 150 U 1,030 10 70 415 ,5 475 , 5 70
28 T 2,080 90 30 1,975 90 60 15 U 1,520 90 30 1,415 90 60 15
29 T 2,140 5 55 1,450 5 615 20 U 1,780 5 35 1,240 5 485 20
30 T 2,880 Ito 55 2,700 105 105 5 20 U 1,450 80 55 1,290 75 85 5 " 20
31 T 495 .50 20 435 50 30 10 U 365 30 10 315 30 30 10
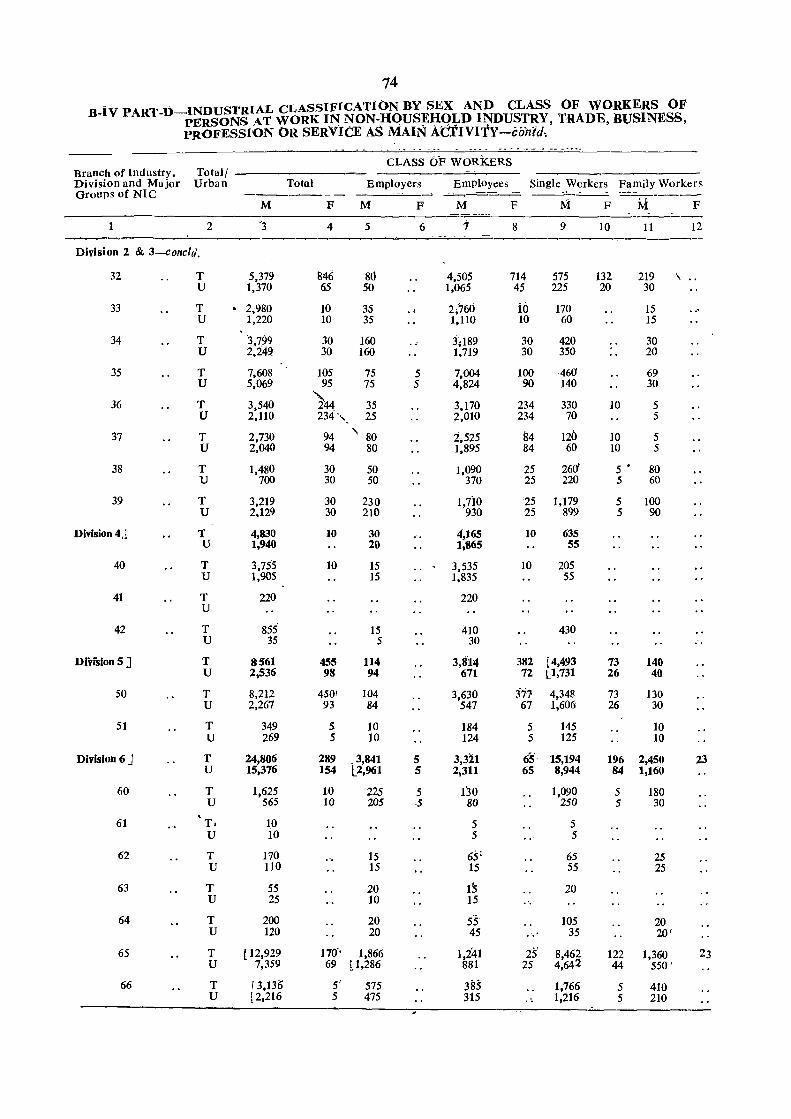
74 B-IV PART-D-INDUSTRIAL CLASSIFICATION BY SEX AND CLASS OF WORKERS OF
PERSONS AT WORK IN NON-HOUS~H9~D INDUSTRY, TRADE, BUSINESS, PROFESSION OR SERVICE AS MAIN ACTIVITY -c(intd~
... . ~ -- - -- --- - --- - --.- -- -----CLASS OF WORKERS
Branch of Industry, Total/ -~
Division and Major Urban Total Employers Employees Single Workers Family Workers Groups of NIC ------- - -- - ------~---
M F M F M F M F M F ----2 ~3 4 5 6 ,., 8 9 10 11 12
----Division 2 & 3-eoncld.
32 T 5,379 846 80 4,505 714 575 132 219 \ .. U 1,370 65 50 1,065 45 225 20 30
33 T • 2;980 10 35 .1 2;760 io 170 15 ..1 U 1,220 10 35 1,110 10 60 15
34 T "3,799 30 160 :1;189 30 420 30 U 2,249 30 160 1,719 30 350
, 20
35 T 7,608 105 75 5 7,004 100 460 69 U 5,069 95 75 5 4,824 90 140 30
36 T 3,540 ),.4 35 3,170 234 330 10 5 U 2,110 234', 25 2,010 234 70 5
37 T 2,730 94 '\ 80 2;525 84 120 10 5 U 2,040 94 80 1,895 84 60 10 5
38 T 1,480 30 50 1,090 25 26(j 5 • 80 U 700 30 50 370 25 220 5 60
39 T 3,219 30 230 1,7iO 25 1,179 5 100 U 2,129 30 210 930 25 899 5 90
Division 4,~ T 4,830 10 30 4~165 10 635 U 1,940 20 1,865 55
40 T 3,755 10 15 3,535 10 205 U 1,905 15 1,835 55
41 T 220 220 U
42 T 855 15 410 430 U 35 5 30
Division 5 ] T 8561 455 114 3,814 382 (4,493 73 140 U 2,536 98 94 671 72 ll,731 26 40
50 T 8,212 4501 104 3,630 :177 4,348 73 130 U 2,267 93 84 547 67 1,606 26 30
51 T 349 5- 10 184 5 145 10 U 269 5 10 124 5 125 10
Division 6 J T 24,806 289 ,3,841 5 3,321 65 15,194 196 2,450 23 U 15,376 154 l2,961 5 2,311 65 8,944 84 1,160
60 T 1,625 10 225 5 130 1,090 5 180 U 565 10 205 5 80 250 5 30
61 T. 10 5 5 U 10 5 5
62 T 170 15 65: 65 25 U 110 15 15 55 25
63 T 55 20 15 20 u 25 10 15 "
64 T 200 20 55 105 20 U 120 20 45 35 20'
65 T [12,929 17(1' 1,866 1,241 :25' 8,462 122 1,360 23 U 7,359 69 p,286 881 25 4,642 44 550'
66 T i 3,130 5'- 575 385 1,766 5 410 U [ 2,216 5 475 315 .. 1,216 5 210
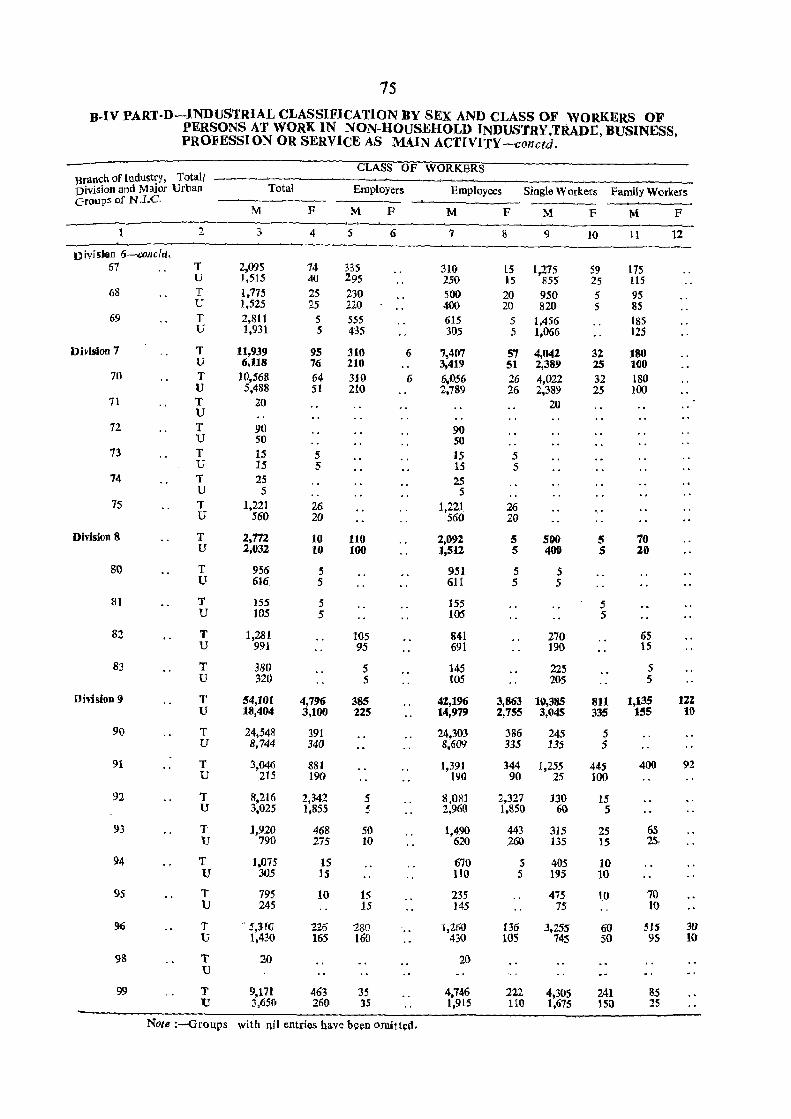
75
B-IV PART·D-INDUSTRIAL CLASSIFICATION By SEX AND CLASS OF WORKERS OF PERSONS AT WORK IN NON-HOUSEHOLD INDUSTRY,TRAJ)E, BUSINESS. PROFESSION OR SERVICE AS MAIN ACTIVITY-conctd.
CLASS OF WORKERS Brandl of Indust!Y, Totall
Total Employers Family Workers Division and Major Urban Employees Single Workers Groups of N .I.C.
M F M F M F M F F M ------1 2 3 4 5 6 7 8 9 HI 11 12
o ivisiOll 6-aJJJcld, 67 T 2,095 74 335 310 15 1,275 59 115
U 1,515 40 295 2S0 15 855 25 115 68 T 1,775 25 230 500 20 9S0 5 95
U 1,525 25 220 400 20 820 5 85 69 T 2,811 5 555 615 5 1,456 185
U 1,931 5 435 305 5 1,066 125
Division 7 T 11,939 95 310 6 7,407 57 4,042 32 180 U 6,118 76 210 3,419 51 2,389 25 100
70 T 10,568 64 310 6 6.056 26 4,022 32 180 V 5,488 51 210 2,789 26 2,389 25 100
71 T U
20 20
72 T 90 9{) U SO SO
73 T 15 5 JS 5 U :Is 5 15 5
74 T 25 2S U 5 5
75 T 1,221 26 1,221 26 U 560 20 560 2{)
Division 8 T 2,m 10 110 2,092 5 500 5 70 U 2,032 10 100 1,512 5 400 S 20
80 T 956 5 951 5 5 U 616 5 611 5 5
81 T 155 5 155 5 U 105 5 105 5
82 T 1,281 105 841 270 65 U 991 95 691 190 15
83 T 380 :5 145 225 5 U 320 :5 105 205 5
Division 9 T 54,101 4,796 385 41,196 3,863 10,385 1!l1 t,135 J21 U 18,404 3,100 225 14,979 2,755 3,045 335 155 11)
90 T 24,548 391 24,303 386 245 5 U 8,744 34Q 8,609 335 135 5
91 T 3,046 881 1,391 344 1,255 445 400 92 U .215 Ii){) 190 90 25 100
92 T 8,216 2,342 5 8,081 2,327 130 15 U 3,025 ],855 :5 2,960 1,850 60 5
93 T 1,920 468 50 1,490 443 315 25 65 U 790 275 to 620 260 135 15 25,
94 T 1,075 15 670 :5 405 10 U 305 15 110 5 195 10
95 T 795 10 15 235 475 10 70 lJ 245 15 145 75 10
96 T . 5,310 216 180 1,16"(1 136 3,255 60 515 30 l~ 1,430 165 160 430 105 745 50 95 10
98 T 20 20 U
99 T 9,171 463 35 4,746 222 4,305 241 85 tJ 3,650 260 35 1,915 110 1,615 150 25
Note :-Groups with nil entries have be~n omitted,

TABLE B-VI PART-A(i)
OCCUPATIONAL CLASSIFICATION OF PERSONS AT WORK ACCORDING TO lVlAIN ACTIVITY OTHER THAN CULTIVATION CLASSIFIED BY SEX AND AGE·GROUPS IN URBAN AREAS ONLY
Flyleaf
Table B-Yl has two parts i.e. Part-A and Part-REach part has been further divided into two subparts. Sub-parts A (i) and A(ii) give data for urban areas and sub-parts BCi) and B (ii) for rural areas only.
2. This part gives data for persons at work other than those engaged in cultivation classified by sex and age-groups for each division and group of National Classification of Occupations, 1968. Age-groups adopted for this table are the same as for Table B-1 Part -A, i.e. 0-14, 15-19, 20-24, 25-29, 30-39, 40-49, 50-59, 60 +and Age not stated. There are marginal differences in some age-groups figures as appearing in this table and those obtained by adding categories III to IX in Table-B-I Part-A. These differences are bound to exist as this table has been processed by raising results of 20 per cent sample tabulatio'n while Table B-1 Part-A is based on full count.
3. In 1961-Census Table B-YI gave similar data for urban areas only. Information in this table was limited to occupational divisions and that too for broad age-groups.
77

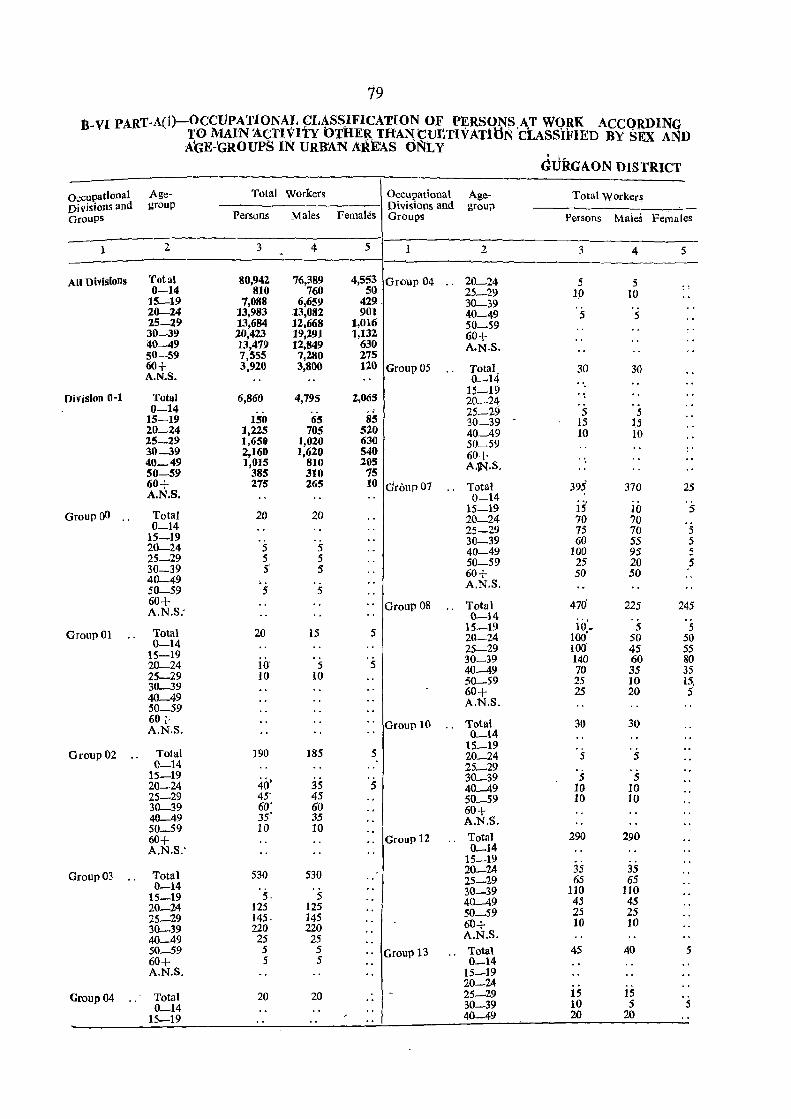
19 1J VI PARl'-A(i)-OCCVPATIONAL CLASSlFICATION OF PERSONS AT WORK ACCORDING
- 10 MAIN~CTI"\,ItY OTHER THANtU:tTIVATltlN 'CtASSIFIED BY SEX AND AGE-'GROUP8 IN lJRB~N AR.:EAS ONLY
dURGAON DISTRICT
Occupati6nai Age- Total Workers Occupational Age- Total Workers Divisions and group Divisions and group GrouPS Persons Males Females Groups Persons Males Females
1 2 3 4 5 2 3 4 5
All Divisions Total 80,942 76,389 4,553 Gr<lUP 04 .. 20_24 5 5 0-14 810 760 50 25_29 10 10 .'
15-19 7,088 6,659 429. 30-39 20-24 13,983 13,082 901 40-49 5 5 25-29 13,684 12,668 1,016 50-59 30-39 20,423 19,291 1,132 60+ 40-49 13,479 12,849 630 A.N.S. 50-59 7,555 7,280 275 60+ 3,920 3,800 120 Group 05 Total 30 30 A.N.S. 0-14
2,()(j5 15-19
Division 0-1 Total 6,860 4,795 20-24 0-14 .. 25-29 ·s 5
15-19 150 65 85 30_39 15 1,5 20-24 1,225 705 520 40-49 10 10 25-29 1,650 1,020 630 50-59 30-39 2,160 1,620 540 60+ 40_49 1,015 810 20S A·IN·S. 50-59 385 310 75 60+ 275 265 10 droup07 ., Total 395 370 25 A.N.S. 0-14 ",
15-19 15 10 5 Group 00 .. Total 20 20 20-24 70 70
0-14 25-29 75 70 5 15-19 30-39 60 55 5 20-24 5 5 40-49 100 95 5 25-29 5 5 50-59 25 20 5 30-39 5' 5 60+ 50 50 40-49 A.N.S. 50-59 5 5 60+ .. GrouP 08 Total 470 225 245 A.N.S: 0--14
5 15-19 io', 5 5 Group 01 Total 20 15 20-24 100' 50 50 0-14 25-29 100 45 55 15-19 ·s 30_39 140 60 80 20-24 10 5 40-49 70 35 35 25-29 10 10 50-59 25 10 15. 30-39 60+ 25 20 5 40_49 A.N.S. 50-59
60+ .. Group 10 Total 30 30 A.N.S. 0_14
15_19 Group 02 .. Total 190 185 5 20_24 5 5
0-14 . 25_29
15-19 40' 30_39 5 5
20-24 35 5 40_49 10 10 25-29 45' 45 50_59 10 10 30-39 60' 60 60+ 40-49 35' 35 A.N.S. 50_59 10 10
Total 290 290 60+ Group 12 A.N.S: 0_14
15_19
530 530 20-24 35 35 Group 03 .. Total 25-29 65 65
0-14 30-39 110 110 15-19 5, 5 40-49 45 45 20_24 125 125 50_59 25 25 25_29 145. 145
60+ 10 10 30-39 220 220
A.N.S. 40-49 25 25 50_59 5 5 " Group 13 Total 45 40 5 60+ 5 5 0_14 A.N.S. 15-19
20-24 Group 04 Total 20 20 25-29 15 IS
30-39 10 5 5 0_14 40-49 20 20 15-19
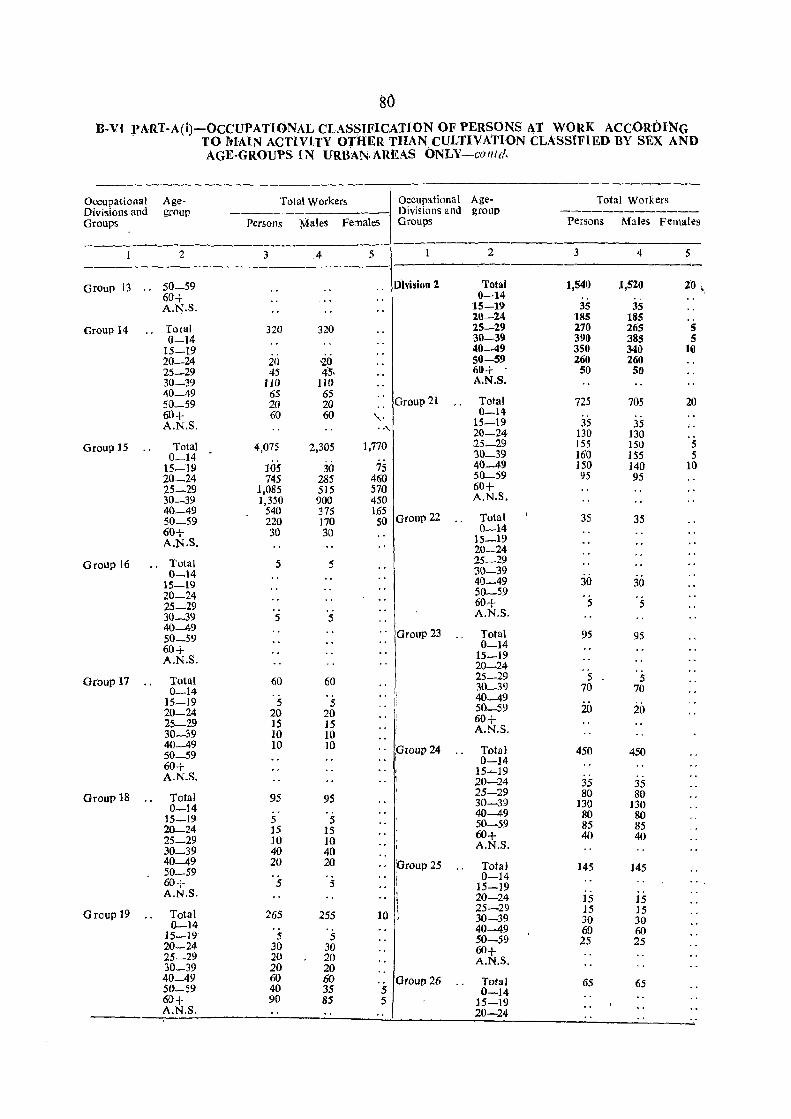
sO n-vI rART-A(i)-OCCUPATH:>NAL CLASSIFICATION OF PERSONS AT WORK AceORtnNG
TO l'tlA[N ACTIVITY OTHER THAN CULTIVATION CLASSIFIED BY SEX AND AGE-GROUPS IN URBANf\REAS ONLY -co lit d.
Occupational Age- Total Workers Occup:ltional Age- Total Workers Divisions and group Divisions and group -------------Groups Persons Males Females Groups Persons Males Females
------2 3 .4 5 2 3 4 5
Group 13 .. 50-59 Division 2 Total 1,540 1,520 20,. 60+ 0-14 A.N.S. 15-19 3S 3S
20-24 185 185 Croup 14 .. Total 320 320 25-29 270 265 5
0-14 30-39 390 385 5 15-19 40-49 350 340 10 20-24 20 i6 50-59 260 260 25-29 45 45. 60+ 50 50 30-39 110 110 A.N.S. 40-49 65 65
Group 21 SO_59 20 20 Total 725 705 20 60+ 60 60 ,. 0-14 A.N.S. . ., 15-19 35 35
20-24 130 130 Group 15 Total 4,075 2,305 1,770 25_29 155 ISO 5
0-14 30_39 160 155 5 15-19 105 30 7S 40-49 150 140 10 20-24 745 285 460 50-59 95 95 25-29 1,085 515 570 60+ 30-39 1,350 900 450 A.N.S. 40-49 540 375 165
Group 22 50-59 220 170 50 .. Total 35 35 60+ 30 30 0-14 A.N.S. 15-19
20-24 Group 16 .. Total 5 5 25-29
0-14 30-39 15-19 40-49 30 30 20-24 50-59 25-29 60+ 5 5 30-39 5 5 A.N.S. 40-49 ., Group 23 Total 50-59 95 95 60+ 0-14 A.N.S. 15-]9
20-24
Group 17 Total 60 60 25-29 5 5 0-14 30_39 70 70
15-19 5 5 40-49 20 20-24 20 20 50-59 20
25-29 15 15 60+ 30-39 10 10
A.N.S.
40-49 10 10 .. ,Droup24 Total 450 50-59 450 60+
.. I 0-14
A.N.S. .. I 15~19
I 20-24 35 35 Group 18 Total 95 95
25-29 80 80 0-14 30-39 130 130
15-19 5 5 40--49 80 80
20--24 15 15 50-59 85 85
25-29 10 ]0 60+ 40 40 30-39 40 40
A.N.S.
40-49 20 20 .. 'Group 25 Total 145 145 50_59 60+ 5 5
0-14 15-19 A.N.S. 20-24 IS 15
Group 19 Total 265 255 10 25-29 IS 15
0-14 30-39 30 30
15-19 5 5 40-49 60 60 50-59 25 25 20-24 30 30 60+ 25-29 20 20
30-39 20 20 A.N.S.
40-49 60 60 Group 26 Total 65 65 50-59 40 35 5 0-14 60+ 90 85 5 15-19 A.N.S. 20 24
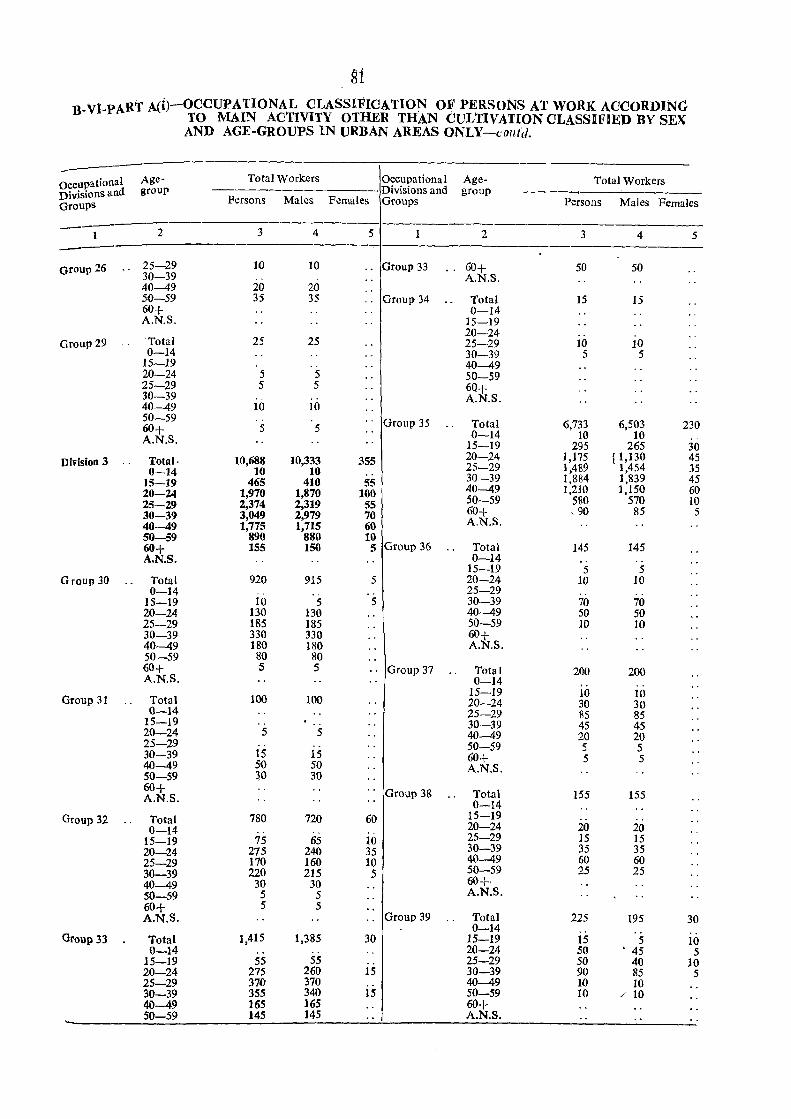
si B VI-PART A(i)-OCCUPATIONAL CLASSlFICATIO~ OF PERSONS AT WORK ACCORDING
- TO J\lIAIN ACTIVITY OTHER THAN CULTIVATION CLASS1FIED BY SEX AND AGE-GROUPS IN URBAN AREAS ONLY-contd.
occupational Age- Total Workers Occupationa 1 Age- Total Workers Divisions and group Divisions and group --~
GrouPs Persons Males Females Groups Persons Males Females
2 3 4 5 1 2 3 4 5
Group 26 25-29 10 10 .. 30-39
Group 33 60+ A.N.S.
50 50
40-49 20 20 50-59 35 35 · . Group 34 Total 15 15 60+ 0-14 A.N.S. 15-19
20-24 .. GrouP 29 ' . Total 25 25 25-29 10 10
0-14 30-39 5 5 15-19 40-49 20-24 5 5 50-59 25-29 5 5 6Q+ 30-39 . , A.N.S . 40-49 10 10 50-59 · , Group 35 Total 6,733 6,503 230 60+ 5 5 A.N.S. 0-14 10 10 ,.
15-19 295 265 30 Division 3 Total. 10,688 10,333 355 20-24 1,175 11,130 45 , .
25-29 1,489 1,454 35 0-14 10 10 · . 30-39 1,884 1,839 45 15-19 465 410 55 20-24 1,970 1,870 100 40-49 1,210 1,150 60
50-59 580 570 10 25-29 2,374 2,319 55 60+ .90 85 5 30-39 3,049 2,979 70 A.N.S. 40--49 1,775 1,715 60 50-59 890 880 10 60+ 155 150 5 Group 36 Total 145 145 A.N.S. 0-14 .. · .
15-19 5 5 Group 30 Total 920 915 5 20-24 10 10
0-14 . , 25-29 .. · . 15-19 10 5 5 30-39 70 70 20-24 130 130 40-49 50 50 25-29 185 185 50-59 10 10 30-39 330 330 60+ 40-49 180 180 A.N.S. 50-59 80 80 60+ 5 5 .. Group 37 Total 200 200 A.N.S. 0-14
15-19 l() 10 Group 31 Total 100 100 20-24 30 30 0-14 25-29 85 85 15-19 .. 30-39 45 45 20-24 5 5 40--49 20 20 25-29 50-59 5 5 30-39 15 15 60+ 5 5 40-49 50 50 A.N.S. 50-59 30 30 60+ " Group 38 Total 155 155 A.N.S. 0-14
Group 32 Total 780 720 60 15-19 · . 0-14 20-24 20 20
15-19 75 65 10 25-29 IS 15 20-24 275 240 35 30-39 35 35 25-29 170 160 10 40--49 60 60 30-39 220 215 5 50-59 25 25 40-49 30 30 60+ 50-59 5 5 A.N.S. 60+ 5 5 A.N.S. · . Group 39 Tolal 225 195 30
0-14 Group 33 Total 1,415 1,385 30 15-19 15 5 10
0-14 .. 20-24 50 • 45 5 15-19 55 55 25-29 50 40 10 20-24 275 260 15 30-39 90 85 5 25-29 370 370 40--49 10 10 30-39 355 340 15 50-59 10 /' 10 40--49 165 165 60+ SO-59 145 145 A.N.S.
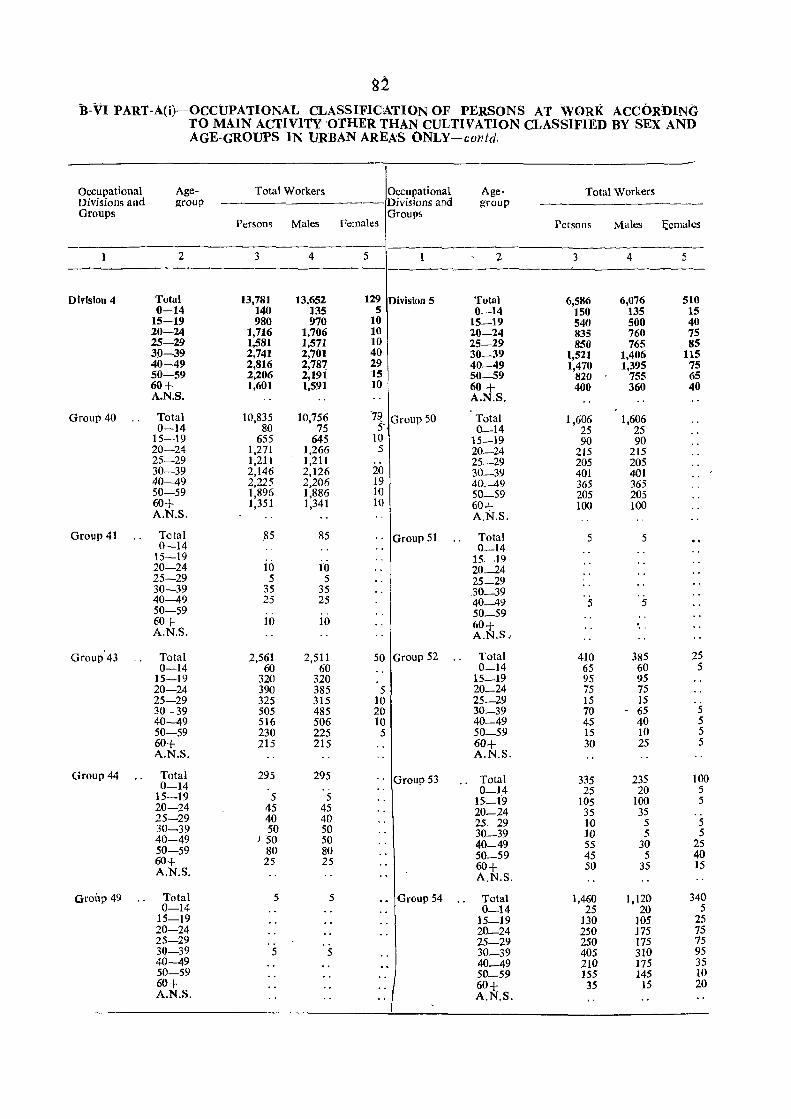
S2 B-VI PART-A(i)--OCCUPATIONAL CLASSIFICATION OF PERSONS AT WORK ACCORDING
TO MAIN ACTIVITY 'OTHER THAN CULTIVATION CLASSIFIED BY SEX AND AGE-GROUPS IN URBAN AREAS ONLY-conid.
occupational Age- Total Workers Occupational Age- Total Workers Divisions and group Divisions and group Groups
Females Groups
Persons Males Persons Males F.emales
2 3 4 5 2 3 4 5
Division 4 Total 13,781 13,652 129 Division 5 Total 6,586 6,076 510 0-14 140 135 5 0-14 150 135 15
15-19 980 970 10 15-19 540 500 40 20-24 1,716 1,706 10 20-24 835 760 75 25-29 1,581 1,571 10 25-29 850 765 85 30-39 2,741 2,701 40 30-39 1,521 1,406 115 40-49 2,816 2,787, 29 40-49 1,470 1,395 75 50-59 2,206 2,191 15 50-59 820 755 65 60+ 1,601 1,591 10 60 + 400 360 40 A.N.S. A.N.S.
Group 40 Total 10,835 10,756 79 Group 50 Total 1,606 1,606 0-14 80 75 5'. 0-14 25 25
15-19 655 645 10 15-19 90 90 20-24 1,271 1,266 5 20-24 215 215 25-29 1,211 1,211 25-29 205 205 30-39 2,146 2,126 20 30-39 401 401 40---49 2,225 2,206 19 40_49 365 365 50-59 1,896 1,886 10 50_59 205 205 60+ 1,351 1,341 10 60+ 100 100 A.N.S. A.N.S.
Group 41 Total .85 85 .. Group 51 Total 5 5 0-14 0_14
15-19 15-19 20-24 10 10 20_24 25-29 5 5 25-29 30-39 35 35 30-39 40-49 25 25 40-49 5 5 50-59 .. 50_59 60+ 10 10 60+ .. A.N.S. A.N.S ..
Group'43 Total 2,561 2,511 50 Group 52 Total 410 385 25 0-14 60 60 0-14 65 60 5
15-19 320 320 15-19 95 95 20-24 390 385 5 20-24 75 75 25-29 325 315 10 25-29 15 15 30-39 505 485 20 30_39 70 65 5 40-49 516 506 10 40-49 45 40 5 50-59 230 225 5 50-59 15 10 5 60+ 215 215 60+ 30 25 5 A.N.S. A.N.S.
Group 44 Total 295 295 .. Group 53 Total 335 235 100 0-14 0-14 25 20 5
15-19 5 5 15_19 105 100 5 20-24 45 45 20-24 35 35 .. 25-29 40 40 25-29 10 5 5 30-39 50 50 30_39 10 5 5 40-49 ) 50 50 40-49 55 30 25 50-59 80 80 50-59 45 5 40 60+ 25 25 60+ 50 35 15 A.N.S. A.N.S.
Group 49 Total 5 5 Group 54 Total 1,460 1,120 340 0-14 0-14 25 20 5
15-19 15-19 130 105 25 20-24 20-24 250 175 75 25-29 25-29 250 175 75 30-39 5 5 30-39 405 310 95 40-49 40_49 210 175 35 50-59 50-59 155 145 10 60+ 60+ 35 15 20 A.N.S.
"/ A.N.S.
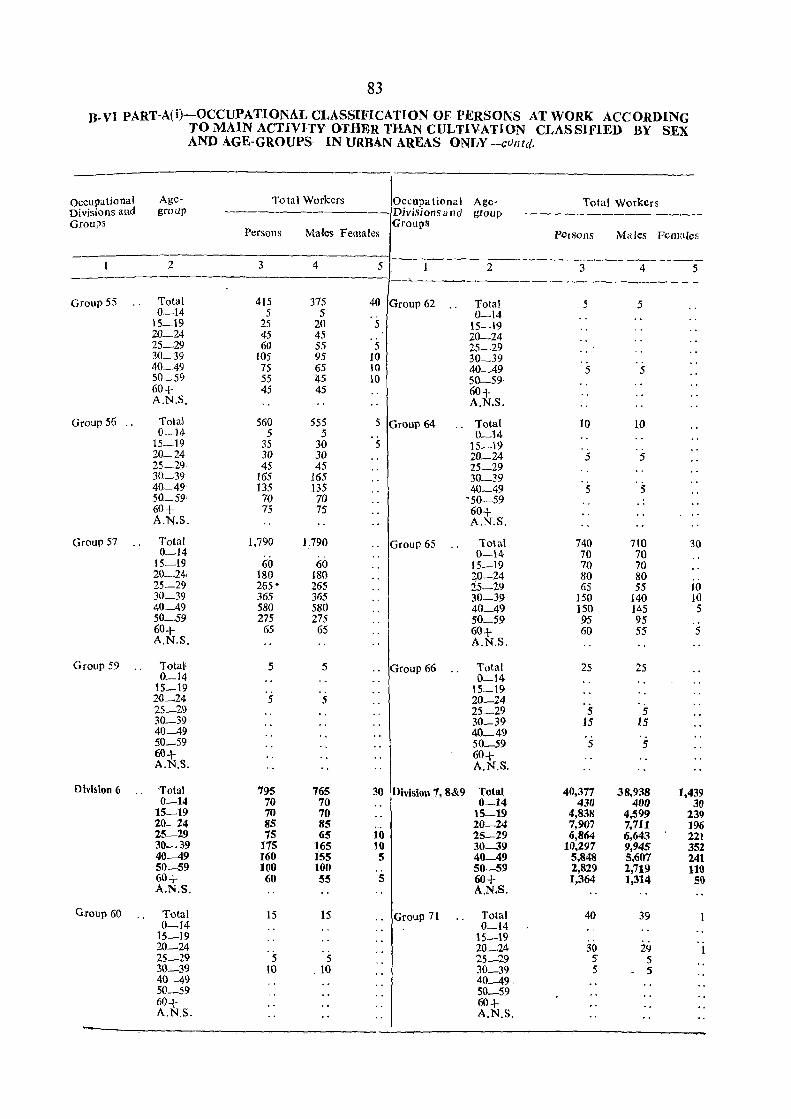
83
B-VI PART-A{i)-OCCUPATIONAL CLASS[FICATION OF PERSONS AT WORK ACCORDING TO MAIN ACTIVITY OTHER THAN CULTIVATION CLASSIFIED BY SEX AND AGE-GROUPS IN URBAN AREAS ONLY -crJntd.
occullational Age- Total Workers Occupa tional Age- Total workers Divisions aud group Divisions a nd group Groups
Persons Males Females Groups
Persons MaJes Females
2 3 4 5 ----------------~-----2 3 4 5 -----------------
Group 55 Total 415 375 40 . Group 62 ., Total 5 5 0-14 5 5 0-14
15_19 25 20 5 15-19 20-24 45 45 20-24 25_29 60 55 5 25-29 30-39 105 95 10 30_39 40-49 75 65 10 40_49 5 5 50_59 55 45 10 50-59 60+ 45 45 60+ A.N.S. A.N.S.
Group 56 ., Total 560 555 5 Group 64 .. Total 10 10 0-14 5 5 0_14
15-19 35 30 5 15-19 20-24 30 30 20_24 5 5 25-29 45 45 25_29 30-39 165 165 30-39 40-49' 135 135 40-49 5 5 50_59' 70 70 ~50-59 .. 60+ 75 75 60+ A.N.S. A.N.S.
Group 57 Total 1,790 1,790 .. Group 65 Total 740 710 30 0-14
60 0-14 70 70 15-19 60 15-19 70 70 20-24, 180 180 20-24 80 80 25-29 265' 265 25-29 65 55 10 30-39 365 365 30-39 150 140 10 40-49 580 580 40_49 150 145 5 50-59 275 275 50_59 95 95 60+ 65 65 60+ 60 55 5 A.N.S. A.N.S.
Group 59 Total' 5 5 .. Group 66 Total 25 25 0-14 0_14
15_19 15-19 20_24 5 5 20-24 25-29 25_29 5 5 30-39 30-39 15 15 40--49 40-49 50_59 50_59 5 5 60+ 60+ A.N.S. A.N.S.
Division 6 'Total 795 765 30 Division 7, 8&9 Total 40,317 38,938 1,439 0-14 70 70 0-14 430 400 30
15-19 70 70 15-19 4,838 4,599 239 20-24 85 85 20-24 7,90? 7,711 196 25-29 7S 65 10 25-29 6,864 6,643 221 30-39 175 165 10 30--39 10,297 9,945 352 40--49 160 155 5 40--49 5,848 5,607 241 50-59 100 100 50-59 2,829 2,719 110 60+ 60 5S 5 60+ 1,364 1,314 50 A.N.S. A.N.S.
Group 60 Total 15 15 " Group 71 Total 40 39
0-14 0_14 15-19 15-19 20-24 20_24 30 29 1 25-29 5 5 25_29 5 5 30_39 10 . 10 30_39 5 - 5 40-49 40-49. 50-59 SO_59 60+ 60+ A.N.S. A.N.S.
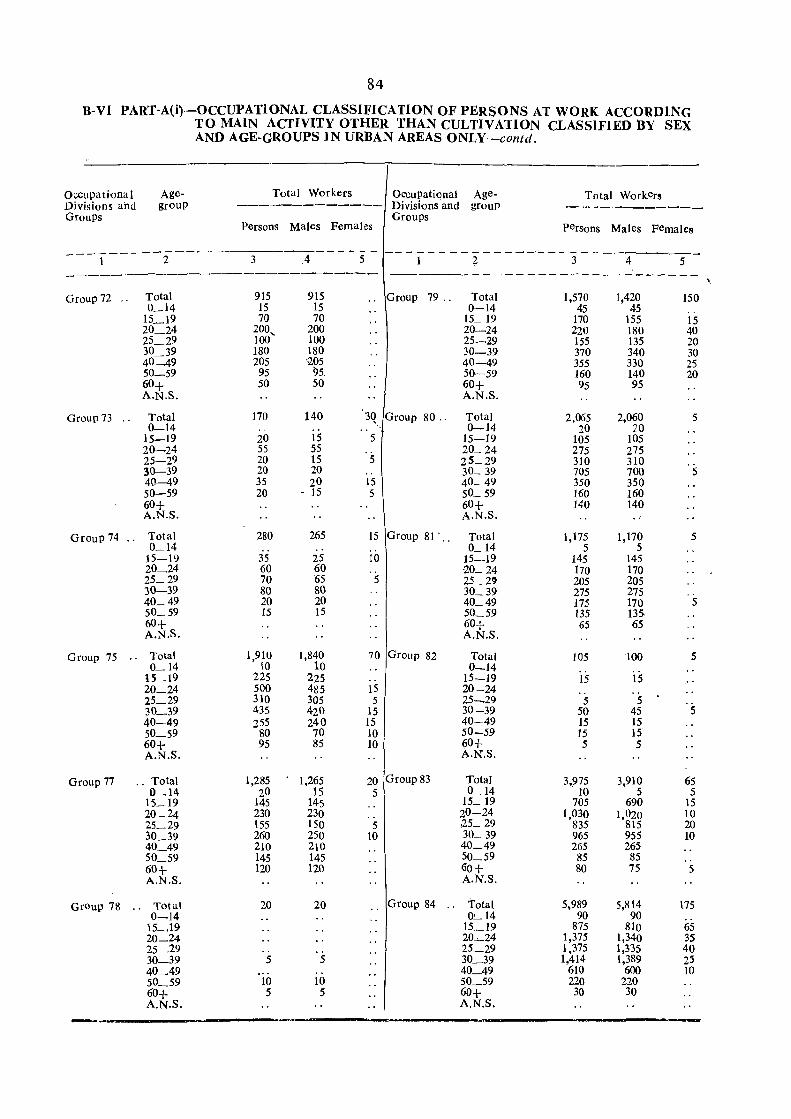
84
B-VI PART-A(i)-OCCUPATlONAL CLASSIFICATION OF PERSONS AT WORK ACCORDING TO MAIN ACTIVITY OTHER THAN CULTIVATION CLASSIFIED BY SEX AND AGE-GROUPS IN URBAN AREAS ONLY-conid.
AgegrouP
Total Workers Occupational Divisions and Groups
Persons Males Femal es
- - - - - - - - - - --------2 3 .4 5
Occupational Divisions and Groups
AgegroUp
Total Workers
persons Males Females
------------------------~--------------------------------
Group 72 ..
Group 73 .,
Total 0_14
15_19 20_24 25_29 30 39 40_49 50_59 60+ A.N.S.
Total 0-14
15-19 20-24 25-29 30---39 40-49 50-59 60+ A.N.S.
Group 74 ., Total 0_14
15-19 20_24 25-29 30-39 40_49 50_59 60+ A.N.S.
Group 75 .. Total 0_14
15_19 20_24 25_29 30_39 40-49 50_59 60+ A.N.S.
Group 77
Group 7S
.. Total 0_14
15- 19 20_ 24 25_29 30_39 40_49 50_59 60+ A.N.S.
., Total 0-14
15_19 20_24 25_29 30_39 40_49 50_59 60+ A.N.S.
915 15 70
200 100'" 180 205 95 50
170 .. 20 55 20 20 35 20
280
35 60 70 80 20 15
1,9lg 225 500 310 435 255
80 95
1,285 20
145 230 155 260 210 145 120
20
.. 5
10 5
915 15 70
200 100 180 '105
95. 50
140
15 55 15 20 20
- 15
265 ..
25 60 65 80 20 15
1,840 10
225 485 305 420 240 70 85
1,265 15
145 230 150 250 210 145 120
20
5 .. 10
5.
., Group 79 ..
3Q Group 80 ..
5
5 .. 15 5
15 Group 81' ..
10
5
70 Group 82
.. 15 5
15 IS 10 10
20 Group 83 5
.. S
10
.. Group 84 ..
Total 0-14
15_ 19 20-24 25-29 30-39 40-49 50-59 60+ A.N.S.
Total 0-14
15-19 20_ 24 25-29 30_ 39 40- 49 50_ 59 60+ A.N.S.
Total 0_14
15-19 10_ 24 25_ 2~ 30_39 40_49 50_59 60+ A.N.S.
Total 0-14
15-19 20-24 25_29 30-39 40-49 50-59 60+ A.N.S.
Total 0_14
15_ 19 20-24 ,25-29 30_ 39 40_49 50_59 60+ A·N.S.
Total 0,---.14
15_19 20~24 25_29 30_39 40_49 50_59 60+ A.N.S.
1,570 45
170 220 155 370 355 160 95
2,065 20
105 275 310 705 350 160 140
1,175 5
145 170 205 275 175 135 65
105
15
5 50 15 15 5
3,975 10
705 1,030
835 965 265 85 80
5,989 90
875 1,375 1,375 1,414
610 220 30
1,420 45
155 180 135 340 330 140 95
2,060 20
105 275 310 700 350 160 140
1,170 5
145 170 205 275 170 135-65
100
15
5 45 15 15 5
3,910 5
690 1,020
815 955 265 85 75
5,814 90
810 1,340 1,335 1,389
600 220 30
150 .. 15 40 20 30 25 20
5
5
5
5
5
5
65 5
15 10 20 10
., 5
175
65 35 40 25 10
\
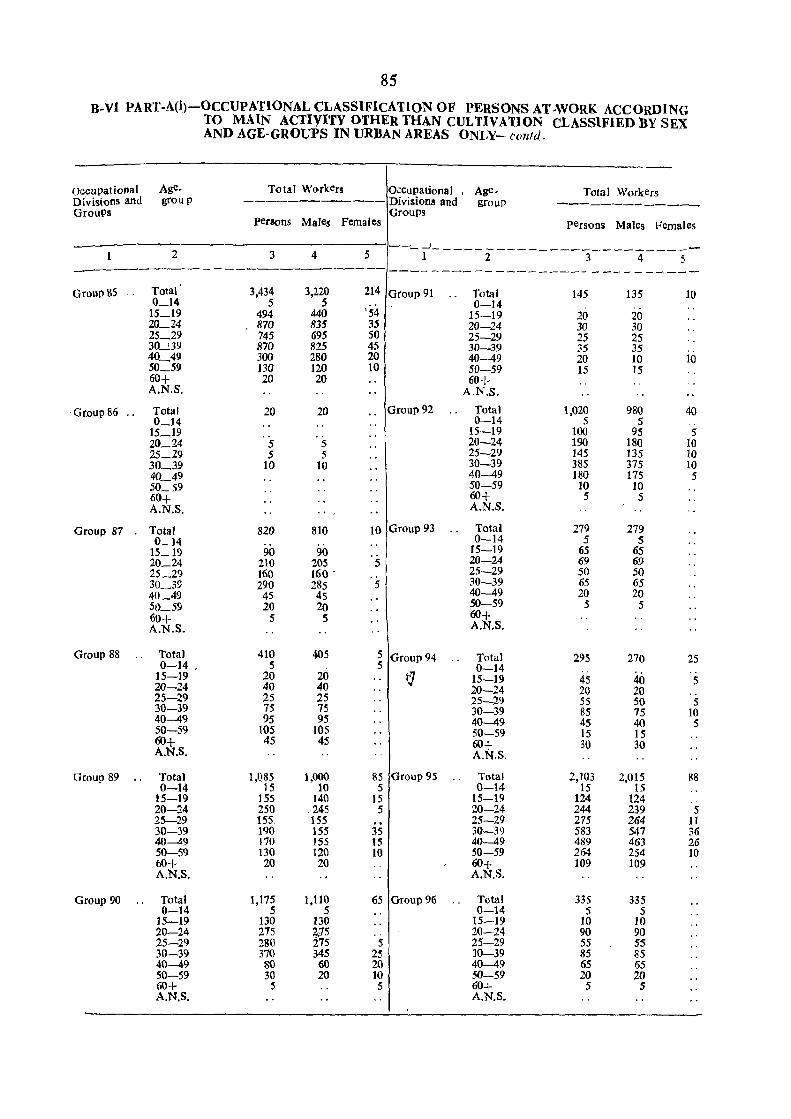
85
B-VI PART-A(i)-OCCUPATIONAL CLASSIFICATION OF PERSONS AT-WORK ACCORDING TO MAIN ACTIVITY OTHER THAN CUI,TIVA'rION CLASSIFIED ny SEX AND AGE-GROUPS IN URBAN AREAS ONLY- could.
occupational Age. T()tal Workers O~cupational , Age. Total Workers Divisions and groll p ---------- Divisions and groUP -----------GrouPs Groups
perllOns Males Females persons Males Females
2 3 4 5 ~-~-------------------------1 2 3 4 5 ~-~-------- -----------------------------Group 85 .. Total 3.434 3,220 214 Group 91 Total 145 135 10 0_14 5 5
'54 0-14 'l5_19 494 440 15-19 20 20 20_24 870 835 35 20-24 30 30 25_29 745 695 50 25-29 25 25 30__l39 870 825 45 30-39 35 35 40_49 300 280 20 40-49 20 10 10 50_59 130 120 10 50-59 15 15 60+ 20 20 60+ A.N.S. A.N.S.
. Gr.oup 86 .. Total 20 20 Group 92 Total 1,020 980 40 0_14 0-14 5 5 ..
15:_19 15-19 100 95 5 20_24 5 5 20-24 190 180 10 25_29 5 5 25-29 145 135 10 30_39 10 10 30-39 385 375 10 40_49 40-49 180 175 5 50_59 50-59 10 10 60+ 60+ 5 5 A.N.S. A.N.S.
Group 87 Total 820 810 10 Group 93 Total 279 279 0_14 0-14 5 5
1,L 19 90 90 15-19 65 65 20_24 210 205 5 20-24 69 69 25_29 160 160 . 25-29 50 50 30_39 290 285 5 30-39 65 65 40_49 45 45 40-49 20 20 SO_59 20 2Q 50-59 5 5 60+ 5 5 60+ A.N.S. A.N.S.
Group 88 Total 410 405 5 Group 94 Total 295 270 25 0-14 , 5 5 0-14 .. 15-19 20 20 fJ 15-19 45 40 5 20-24 40 40 20-24 20 20 .. 25-29 25 25 25-29 5S 50 5 30-39 75 75 30-39 85 75 10 40-49 95 95 40-49 45 40 5 50-59 105 105 50-59 15 15 60+ 45 45 60+ 30 30 A.N.S. A.N.S.
Group 89 .. Total l,Q85 1,000 85 Group 95 Total 2,103 2,015 88 0-14 15 10 5 0-14 15 15
15-19 155 140 15 15-19 124 124 .' 20-24 250 245 5 20-24 244 239 5 25-29 155. 155 25-29 275 264 11 30-39 190 155 35 30-39 583 547 36 40-49 170 155 15 40-49 489 463 26 50-59 130 120 10 50-59 264 254 10 60+ 20 20 60+ 109 109 A.N.S. A.N.S.
Group 90 Total 1,175 1,110 65 Group 96 Total 335 335 0-14 5 5 0-14 5 5
15-19 130 130 15-19 10 10 20-24 275 :',;75 20-24 90 90 25-29 280 275 5 25-29 55 55 30-39 370 345 25 30-39 85 85 40-49 80 60 20 40-49 65 65 50-59 30 20 10 50-59 20 20 60+ 5 5 60+ 5 5 A.N.S. A.N.S,
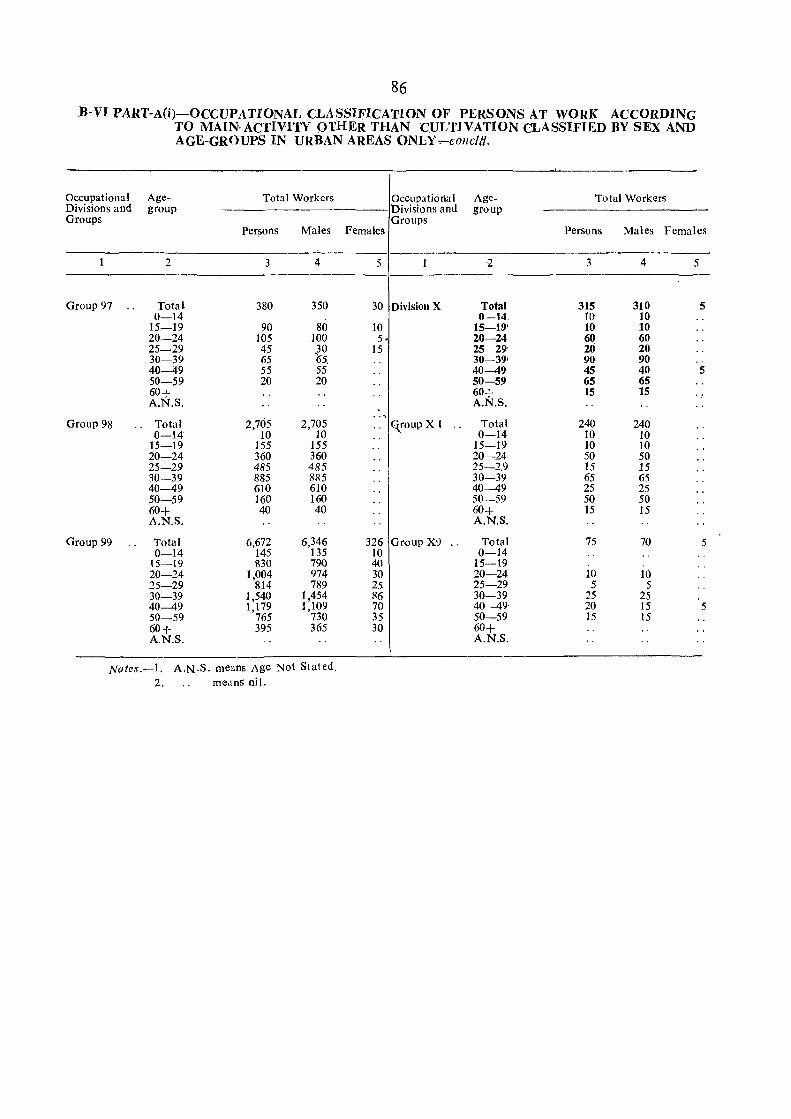
86
,B-VI PART-A(i)-OCCUPATfONAL CLASSIFICATlON OF PERSONS AT WORK ACCORDING TO MAIN, ACTIVITY OTHER THAN 'CULTIVATION CLASSIFIED BY SEX AND AGE-GROUPS IN URBAN AREAS ONLY-,-eoncl8.
Occupational Age- Total Workers Occupational Age- Total Workers Divisions and group ------------Divisions and group ------------Groups Groups
Persons Males Females Persons Males Females
---2 3 4 5 2 3 4 5
-----------
Group 97 Total 380 350 30 Division X Total 315 310 5 0-14 0-14. 10 10
15-19 90 80 10 15-19' 10 10 20-24 105 100 5· 20-24 60 60 25-29 45 ~O 15 25-29 20 20 30-39 65 65, 30-39' 90: 90 .. 40-49 55 55 40-49 45 40 5 50-59 20 20 50-59 65 65 60+ 60+ 15 15 A.N.S. A.N.S.
Group 98 . . Total 2,705 2,705 . . <(roup X I .. Total 240 240 0-14 10 10 0-14 10 10
15-19 155 155 15-19 10 10 20-24 360 360 20-24 50 50 25-29 485 485 25-2.9 15 15 30-39 885 885 30-39 65 65 40-49 610 610 40-49 25 25 50-59 160 160 50-59 50 50 60+ A.N.S.
40 40 60+ A.N.S.
15 15
Group 99 Total 6,672 6,346 326 Group XI) .. Total 75 70 5 0-14 145 135 10 0-14
15-19 830 790 40 15-19 20-24 1,004 974 30 20-24 10 10 25-29 814 789 25 25-29 5 5 30-39 1,540 1,454 86 30-39 25 25 40-49 1,179 1,109 70 40-49· 20 15 5 50-59 765 730 35 50-59 15 15 60+ 395 365 30 60+ A.N.S. A.N.S.
Notes.-I. A.N.S. means Age Not Stated. 2. meanS nil.
TABLE B-VI PART-A(ii)
OCCUPATIONAL CLASSIFICA110N 'OF PERSONS AT WORK ACCORDING TO MAIN ACTIVIty OTHER UlAN CUL TIV A TION CLASSIFIED BY SEX AND EDUCA TIONAJ ... LEVELS
IN URBAN AREAS ONLY
Flyleaf
This part furnishes data for workers other than those engaged in cultivation by sex and divisions and groups of National Classification of Occupations. 1968. The data for each group and division has been further classified into educational levels. The number of illiterate persons has not been shown separately but can be derived by subtracting the figures of literate workers from the total workers. On account of different procedures of estimation adopted for Table B-III Part-A and B-VI Part-A(ii)-educationallevels figures for total literate workers other than cultivation vary to a negligible·extent.
2. In 1961-Census similar statistics were presented for urban areas only in Table B-VI but it was limited to occupational division level only.
3. The educational levels adop,ted for this table ate as under:
(1) Primary;
(2) Middle;
(3) Matriculation or Higher Secondary;
(4) Non-technical diploma or Certificate not equal to degree;
(5) Technical diploma or Certificate not equal to degree;
(6) Graduate degree other than technical degree;
(7) Post-graduate degree other than technical degree; and
(8) Professional degree or Diplom~ equal to degree or post-graduate degree in:-
(i) Engineering and technology.
(ii) Medicine.
(iii) Agriculture, veterinary or dairying.
(iv) Teaching.
(v) Others.
87
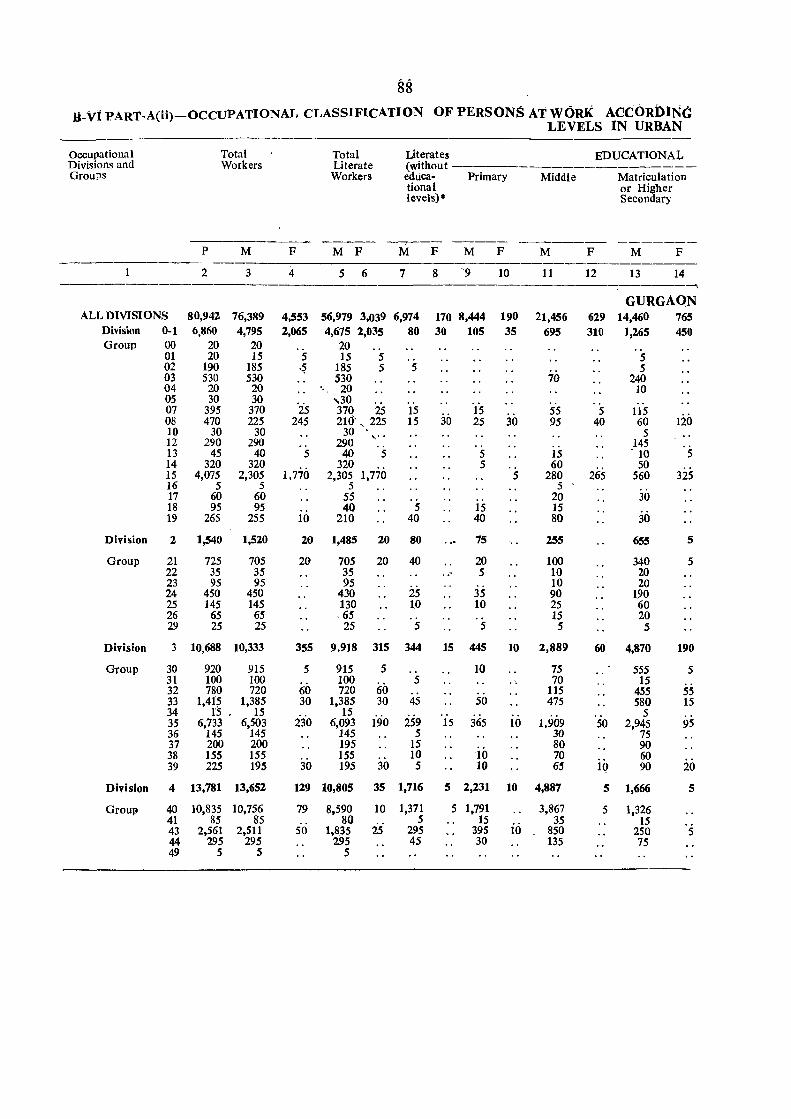
88 ii-VI PART-A(ii)-OCCUPATIONAL CLASSIFICATION OF PERSONS AT WORK ACCORDINC
LEVELS IN URBAN
occupational Total Total Literates EDUCATIONAL Divisions and Workers Literate (without -------------------Groups Workers educa- Primary Middle Matriculation
tional or Higher levels) * Secondary
---- -~--- --- ------- -------P M F M F M F M F M F M F
-----------2 3 4 5 6 7 8 '9 10 11 12 13 14
---'I
GURGAON ALL DIVISIONS 80,942 76,389 4,553 56,979 3,039 6,974 170 8,444 190 21,456 6:29 14,460 765
Division 0-1 6,860 4,795 :2,065 4,675 2,035 80 30 105 35 695 310 1,265 450 Group 00 20 20 20 00
01 20 15 5 15 5 5 02 190 185 ~ 185 5 5 5 03 530 530 530 70 240 04 20 20 0, 20 10 05 30 30 0
25 ,30 0
10
5 07 395 370 370 25 15 30
55 5 115 120 08 470 225 245 2Uj', 225 15 25 30 95 40 60
10 30 30 30 '" 0
5 12 290 290 290 145 13 45 40 5 40 5 5 15 010 5 14 320 320
1,770 320 5 60
265 50
15 4,075 2,305 2,305 1,770 5 280 560 325 16 5 5 5 5 17 60 60 55 20 30 18 95 95 40 5 15 15
30 19 265 255 10 210 40 40 80
Division 2 1,540 1,520 20 1,485 20 80 75 255 655 5
Group 21 725 705 20 705 20 40 20 100 340 5 22 35 35 35 00 5 10 20 23 95 95 95 10 20 24 450 450 430 25 35 90 190 25 145 145 130 1.0 10 25 60 26 65 65 .65 15 20 29 25 25 25 5 5 5 5
Division 3 10,688 10,333 355 9,918 315 344 15 445 10 2,889 60 4,870 190
Group 30 920 915 5 915 5 10 75 555 5 31 100 100 100
60 5 00 70 15
32 780 720 60 720 115 455 55 33 1,41? 1,385 30 1,385 30 45 50 475 580 15 34 15 0 15 15
i90 259 5
3S 6,733 6,503 230 6,093 15 365 10 1,909 50 2,945 95 36 145 145 145 5 30 75 37 200 200 195 15 80 90 38 155 155 155 10 10 70 60 39 225 195 30 195 30 5 10 65 lQ 90 20
Division 4 13,781 13,652 129 10,805 35 1,716 5 2,231 10 4,887 S 1,666 5
Group 40 10,835 10,756 79 8,590 10 1,371 5 1,791 3,867 5 1,326 41 85 85 80 5 15
io 35 15
43 2,561 2,511 50 1,835 25 295 395 850 250 5 44 295 295 295 45 30 135 75 49 5 5 5
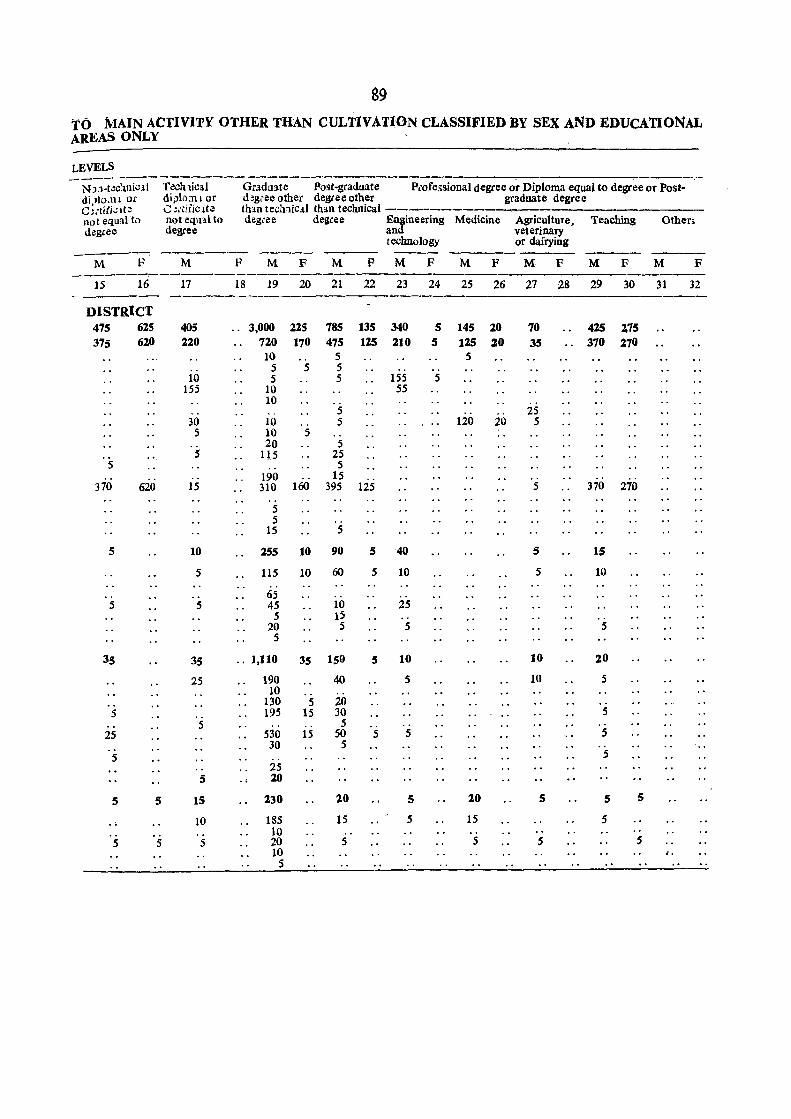
89
TO MAIN ACflVI1Y OTHER THAN CULTIVATION CLASSIFIED BY SEX AND EDucAtIONAL AREAS ONLY
LEVELS
N ):l-tx:lnicl( Tl!clnical Graduate Post-graduate Pcofessional degree or Diploma equal to degree or Post-di Jlo.nl or di,Jlo;m or d!gree other degree other graduate degree C;,tif;;at.! (: ~,·tiiiclte thln technical than technical ---not equal to not equal to deg,ee degree Engineering Medicine Agriculture, Teaching Others degree degree and veterinary
technology or daiiying --- ---
M F M F M F M F M F M F M F M F M F
15 16 17 18 19 20 21 22 23 24 25 26 27 28 29 30 31 32 -_---DISTRICT
475 615 405 .. 3,000 225 185 135 340 5 145 20 70 425 2.75 375 620 120 720 170 475 125 210 S 125 20 3S .. 370 270
10 .. 5 5 5 5 5 .. . .
10 5 5 155 S 155 10 55
10 .. 5 25 30 10 .. 5 120 20 5 5 10 5 ..
20 5 S 115 25
5 , . 5 " 190 15
370 620 15 310 160 395 125 5 370 270 " 5 5
15 5
5 10 255 10 90 5 40 5 15
5 115 10 60 5 10 5 10
, . ,. 65 ,. 5 5 45 10 25
5 15 .' 20 5 5 5 5
35 35 .. 1,110 35 150 5 10 10 20
25 190 40 5 10 5 10
130 5 20 5 195 15 30 5
5 5 25 530 15 50 5 5 5
30 5 .. 5 S
25 5 20
5 5 15 230 10 5 20 5 5 5
10 185 15 5 15 5 , , 10 " "
S 5 5 20 5 5 5 5 10 ,.
5
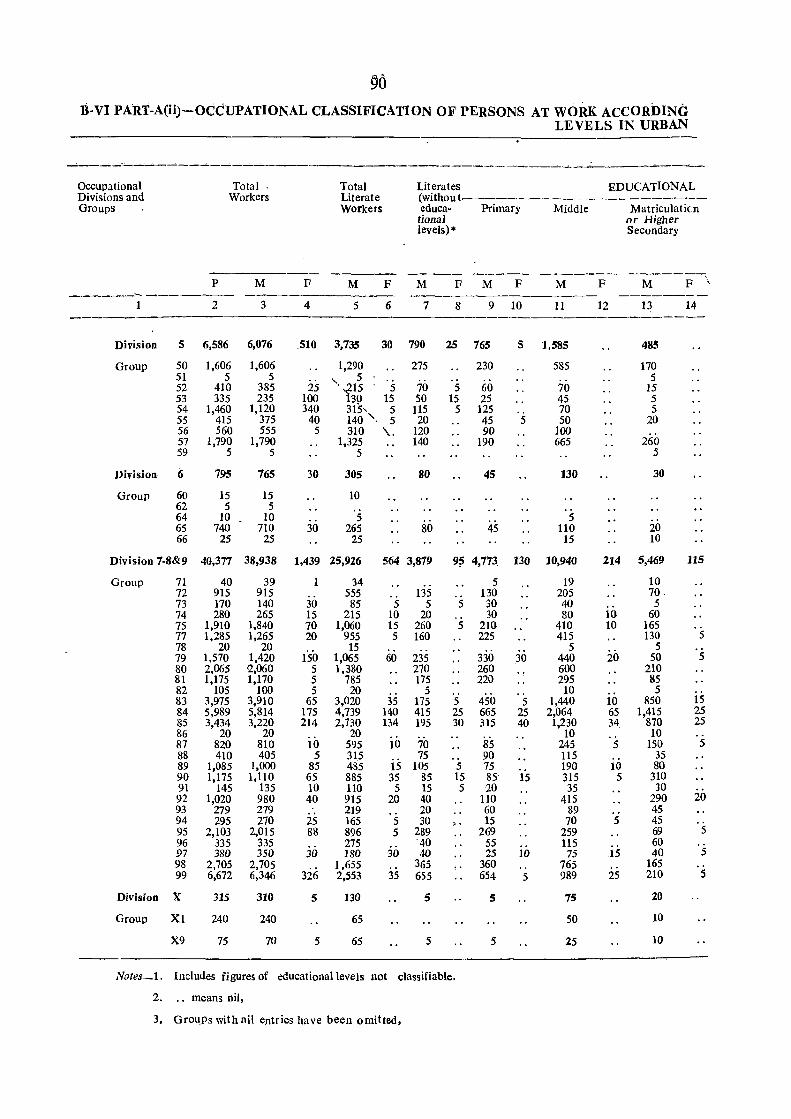
90 B-VI PART-A(ii)-OCCUPATIONAL CLASSIFICATION OF PERSONS AT WORK ACCORDING
LEVELS IN URBAN
~----~~---~----~--~~--------------------------~-~-----~--~~
Occupational Total. Total Literates EDUCATIONAL Divisions and Workers Literate (wi thou t----------------------Groups Workers educa· Primary Middle Matriculativn
tional or Higher levels) * Secondary
---- ----- ------_ ---------P M F M F M F M F M F M F .,
-------- -------------- --------2 3 4 5 6 7 8 9 10 11 12 13 14
Division 5 6,586 6,076 ,510 3,735 30 790 25 765 5 1,585 485
Group 50 1,606 1,606 1,290 275 230 585 170 51 5 5 .... 5 5 52 410 385 25 ' ..215 5 70 5 60 70 15 53 335 235 100 Iso 15 50 15 25 45 5 54 1,460 1,120 340 315, 5 115 5 125 70 5 55 415 375 40 140 '. 5 20 45 5 50 20 56 560 555 5 310 \.. 120 90 100 57 1,790 1,790 1,325 140 190 665 260 59 5 5 5 5
Division 6 795 765 30 305 80 4S 130 30
Group 60 15 15 10 62 5 5 64 10 10 5 5 65 740 710 30 265 80 45 110 20 66 25 25 25 15 10
Division 7-8&9 40,377 38,938 1,439 25,926 564 3,879 9? 4,773 130 10,940 214 5,469 115
Group 71 40 39 1 34 5 19 10 72 915 915 555 135 130 205 70 73 170 140 30 85 5 5 5 30 40 5 74 280 265 15 215 10 20 30 80 10 60 75 1,910 1,840 70 1,060 15 260 5 210 410 10 165 77 1,285 1,265 20 955 5 160 225 415 130 5 78 20 20
150 15 5
20 5
79 1,570 1,420 1,065 60 235 330 30 440 50 5 80 2,065 '2.,060 5 1,380 270 260 600 210 81 1,175 1,170 5 785 175 220 295 85 82 105 100 5 20
3S 5
450 10 5
83 3,975 3,910 65 3,020 175 5 5 1,440 10 850 15 84 5,989 5,814 175 4,739 140 415 25 665 25 2,064 65 1,415 25 85 3,434 3,220 214 2,730 134 195 30 315 40 1,230 34 870 25 86 20 20 20
70 85 10 10
87 820 810 10 595 10 245 5 150 5 88 410 405 5 315 is
75 90 115 35 89 1,085 1,000 85 485 105 5 75 190 10 80 90 1,175 1,110 65 885 35 85 15 85 15 315 5 310 91 145 135 10 110 5 15 5 20 35 30 92 1,020 980 40 915 20 40 110 415 290 20 93 279 279 219 20 60 89 45 94 295 270 25 165 5 30 I"~ 15 70 5 45 95 2,103 2,015 88 896 5 289 269 259 69 5 96 335 335 275
30 '40 55 115 60
97 380 350 30 180 40 25 10 75 15 40 5 98 2,705 2,705 1 ,655 365 360 765 165 99 6,672 6,346 326 2,553 35 655 654 5 989 25 210 5
Division X 315 310 5 130 5 5 75 20
Group Xl 240 240 65 50 10
X9 75 70 5 65 5 5 25 10
Notes_I. Includes figures of educational levels not classifiable.
2. .. means nil,
3, Groqps with nil entries have been omitted,
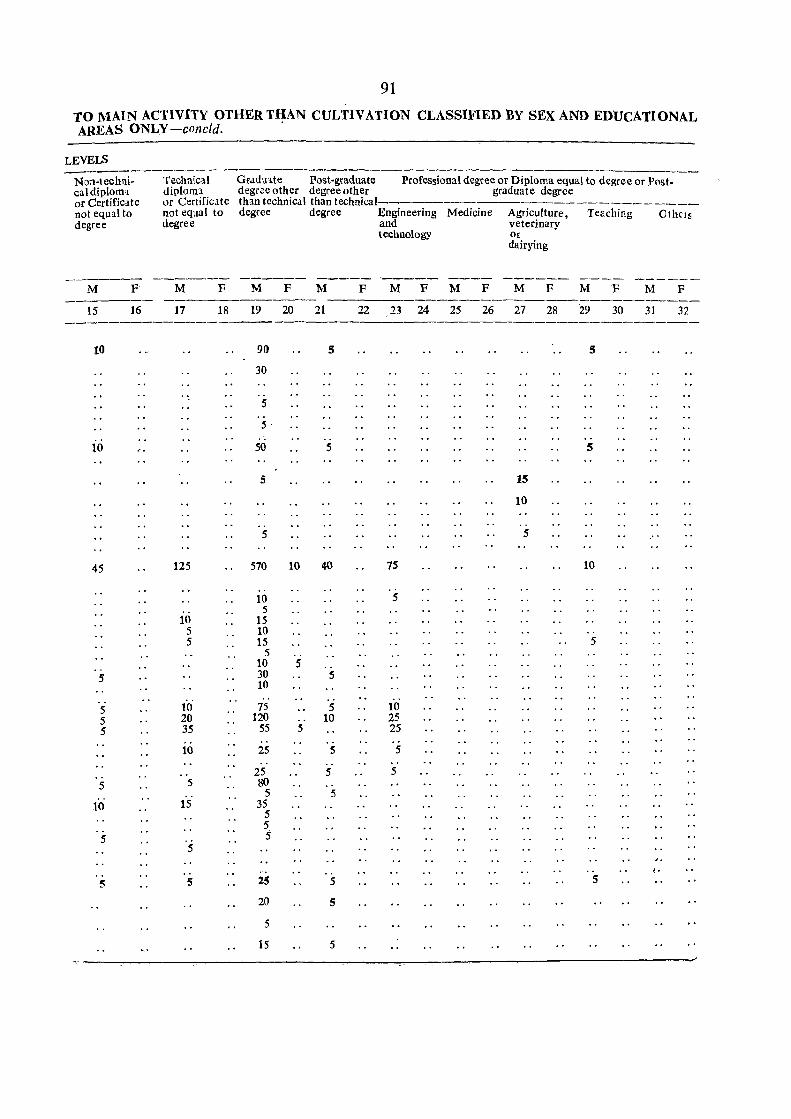
91
TO MAIN ACTIVITY OTHER THAN CULTIVATION CLASSIFIED BY SEX AND EDUCATIONAL AREAS ONLY -concld. .
LEVELS
Non-technicaldiplom'l. or Certificate not equal to degree
M
15
10
10
45
s
5 5 5
5
10
5
5
F
16
Technical diploml or Certificate not equal to degree
M
17
125
.. 10
5 5
10 20 35
10
5 ..
15
5
. , S
F
18
Gradulte Post-graduate Professional degree or Diploma equal to degree or Post-degree other degree other graduate degree than technical than technical~~----~--------------____ _ degree degree Engineering Medicine Agriculture, Te2ching Others
and veterinary
M F M
19 20 21
90
30
.. 5
.. 5' · .
50
5
· . 5
570
· . 10
5 15 10 15
5 10 30 10 ..
75 120
55 ., 25 .,
25 80
5 35
5 5 5
. ' . 25
20
5
15
10
.. 5
5
5
5
40
5
5 10
5
5
5
5
5
5
technology Or dairying
F M F M F M F
22 23 24 25 26 27 28
7S
5
10 25 25
5
5
15
10
.. 5
M
29
5
5
10
5
5
F
30
M
31
~ .
F
32

TABLE B-VI PART-BO)
OCCUPATIONAL CLASSIFICATION OF PERSONS AT WORK ACCORDING TO MAIN ACTIVITY OTHER THAN CULTIVATION CLASSIFIED BY SEX AND AGE-GROUPS
IN RURAL AREAS ONLY
Flyleaf
This table is aneW addition and furnishes data for rural areas only. The typeofinformation presented in this table is similar to Table B-VI Part-ACi).The figures against various age-groups appearing in this table also do not tally with totals of categories III to IX appearing in Table B-1 Part-A for rural areas. These differences are bound to exist as this table has also been processed by raising results of 10 per cent sample tabulation while Table IH Part-A is ba,sed,on fuJI count, . -
93

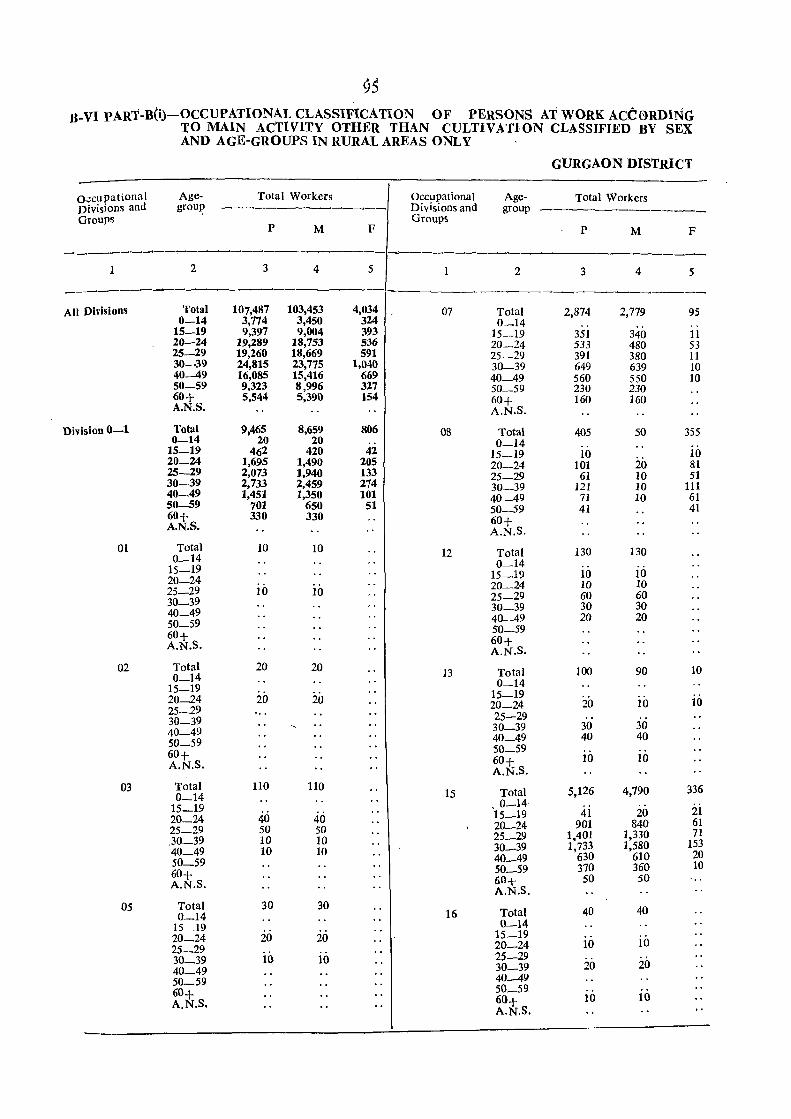
9) 8-VI PART-B(i.)-OCCUPATlONAL CLASSIFICATION OF PERSONS AT WORK ACCORDING
TO MAIN ACTIVITY OTHER THAN CULTIVATION CLASSIFIED BY SEX AND AGE-GROUPS IN RURAL AREAS ONLY
GURGAON DISTRICT
o.;cupational Age- Total Workers Occupational Age- Total Workers Divisions and grou~ ---~---~---- Divisions and group -----------GrouPs Groups
p M F p M F
---------'--~--~-----------1 2 3 4 5 2 3 4 5
--~-------__.----~----.I----------- ~---------
All Divisions Total 107,487 103,453 4,034 07 Total 2,874 2,779 95 0-14 3,774 3,450 324 0-14 ..
15-19 9,397 9,004 393 15-19 351 340 11 20-24 19,289 18,753 536 20-24 533 480 53 25-29 19,260 18,669 591 25-29 391 380 11 30-39 24,815 23,775 1,040 30-39 649 639 10 40-49 16,085 15,416 669 40-49 560 550 10 50-59 9,323 8,996 327 50-59 230 230 60+ 5,544 5,390 154 60+ 160 160 A.N.S. A.N.S.
Division 0-1 Total 9,465 8,659 806 08 Total 405 50 355 0-14 20 20 0-14
15-19 462 420 42 15-19 10 10 20-24 1,695 1,490 205 20-24 101 20 81 25-29 2,073 1,940 133 25-29 61 10 51 30-39 2,733 2,459 274 30_39 121 10 111 40-49 1,451 1,350 101 40-49 71 10 61 50-59 701 650 51 50-59 41 41 60+ 330 330 60+ A.N.S. A.N.S.
01 Total 10 10 12 Total 130 130 0-14 0_14
15-19 15-19 10 10 20-24
io 20_24 10 10 25_29 10 25-29 60 60 30-39 30-39 30 30 40_49 40-49 20 20 50_59 50-59 60+ 60+ A.N.S. A.N.S.
02 Total 20 20 13 Total 100 90 10 0_14 0_14 15-19 15-19 20_24 20 20 20_24 20 10 10 25-29 25-29 30-39 30-39 30 30 40_49 40_49 40 40 50_59 50_59 60+ 60+ 10 10 A.N.S. A.N.S.
03 Total 110 110 15 Total 5,126 4,790 336 0_14
15_19 ,0_14 4i 20 ii 40 15_19 20_24 40 20-24 901 840 61
25_29 50 50 25_29 1,401 1,330 71 30_39 10 10 30_39 1,733 1,580 153 40_49 10 10 40_49 630 610 20 50-59 50_59 370 360 10 60+ 60+ 50 50 A.N.S.
A.N.S.
05 Total 30 30 16 Total 40 40 0_14
15-19 0-14 20-24 20 20 15_19
10 25_29 20-24 10 30_39 10 10 25-29
20 40_49 30-39 20 50_59 40_49 60+ 50_59
10 60+ 10 A.N.S. A.N.S.
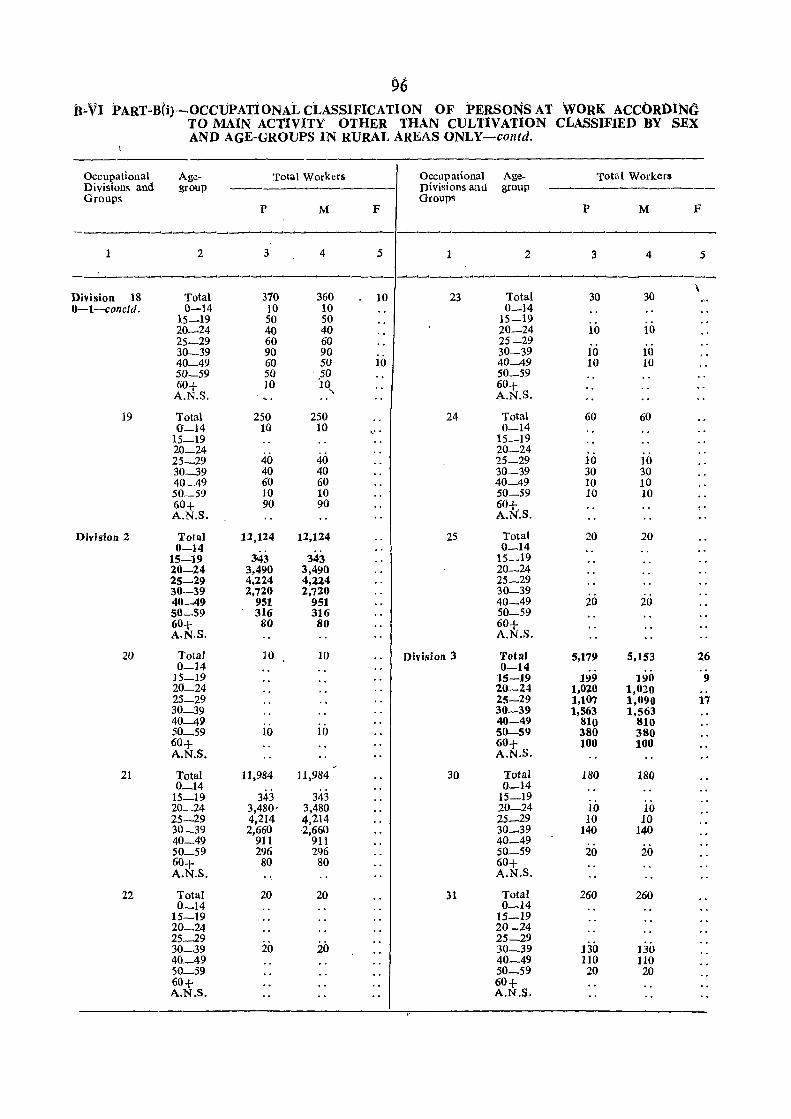
96 b .. VI PART-Bti)~OCCUPATioNAt CLASSIFICATION OF PERSONS AT 'wORK ACc()RDINC
TO MAIN ACTIVITY OTHER THAN CULTIVATION CLASSIFIED BY SEX AND AGE-GROUPS IN RURAL AREAS ONLY-contd.
Occupational Age- Total Workers Occupational Age- Total Workers Divisions and group Divisions and group __,__.___.~-----------
Groups Groups p M F P M F
---___.-~~ ~___.--__..______. ~~~.--~~.---
1 2 3 4 5 1 2 3 4 5
------__,___.---~~-~~-~ ---------~---\
Division 18 Total 370 360 10 23 Total 30 30 0-I-concld. 0-14 10 10 0_14
15-19 50 50 15-19 20-24 40 40 20-24 10 10 25-29 60 60 25-29 30-39 90 90 30~39 10 10 40-49 60 50 10 40-49 10 10 50-59 50 50 50_59 60+ 10 -10" 60+ A.N.S. A.N.S.
19 Total 250 250 24 Total 60 60 0"-14 10 10 , .. 0-14
15-19 15_19 20_24 . .- 20-24 25-29 40 40 25-29 10 10 30-39 40 40 30_39 30 30 40-49 60 60 40-49 10 10 SO-59 10 10 SO-59 10 10 60+ 90 90 60+ A.N.S. A.N.S.
Division 2 Total 12,124 12,124 25 Total 20 20 0-14
343 0_14
15-19 343 15_19 20-24 3,490 3,490 20-24 25~29 4,224 4,224 25-29 30-39 2,720 2,720 30-39 40-49 951 951 40_49 20 20 50-59 316 316 50-59 60+ A.N.S.
80 80 60+ A.N.S.
20 Total 10 10 Division 3 Total 5,179 5,153 26 0-14 0-14 ..
15-19 15-19 199 190 9 20_24 20-24 1,020 1,020 .. 25_29 25-29 1,107 1,090 17 30_39 30-39 1,563 1.563 40-49 40-49 810 810 50_59 10 10 50-59 380 380 60+ A.N.S.
60+ A.N.S.
100 100
21 Total 11,984 11,984 30 Total 180 180 0_14 0-14
15-19 343 343 15-19 20_24 3,480- 3,480 20-24 10 10 25-29 4,214 4,214 25_29 10 10 30-39 2,660 2,660 30_39 140 140 40_49 911 911 40-49 50_59 296 296 50_59 20 20 60+ 80 80 60+ A.N.S. A.N.S.
22 Total 20 20 31 Total 260 260 0-14 0-14
15-19 15-19 20_24 20-24 25_29
io io 25-29
130 30-39 30_39 130 40_49 40-49 110 110 50_59 50-59 20 20 60+ 60+ A.N.S. A.N.S.
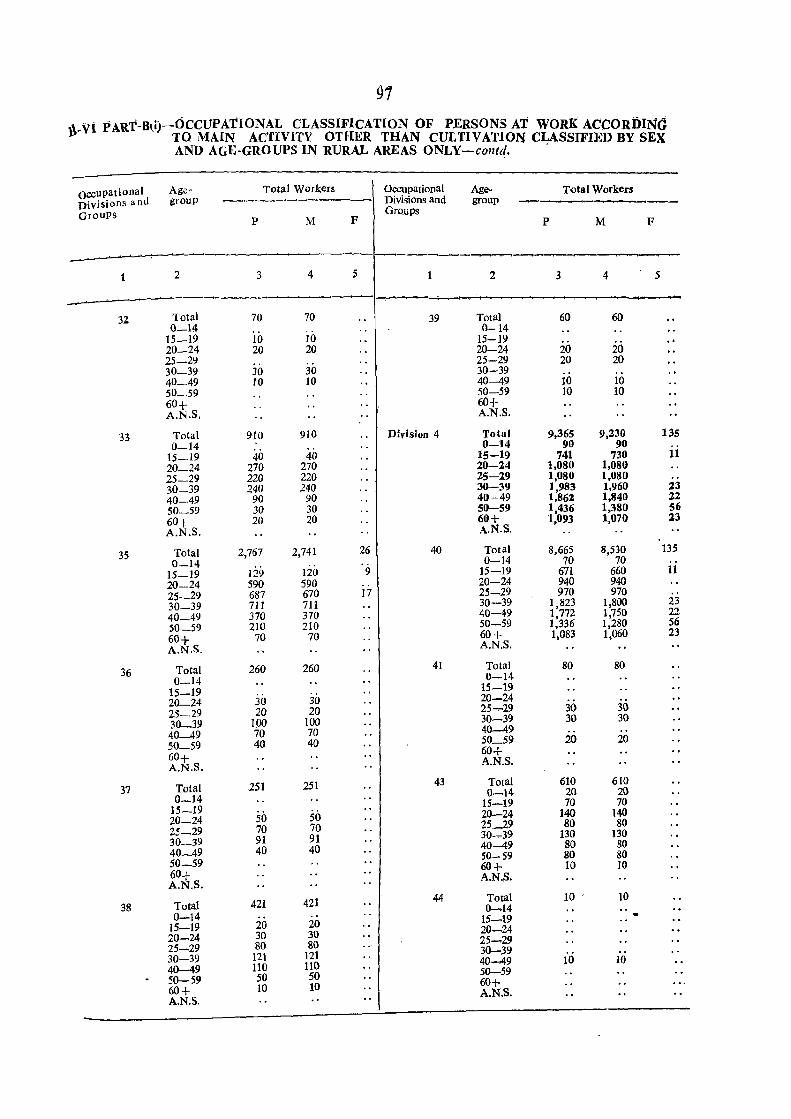
~7
)\-Vi PARr-B~i)-OCCl1PATIONAL CLASSIFICATION OF PERSONS AT WORK ACCORDING TO MAIN Ac11VITY OTHER THAN CULTIVATION CLASSIFIED BY SEX AND AGE-GROUPS I~ RURAL AREAS ONLY-contd. '
occupational Age- Total Workers Occupational Age- Total Workers Divisions and grouP ----------- Divisions and group ~-GrouPs F
Groups p M P M F
___._.. ~---...---
2 3 4 5 2 3 4 5
32 Total 70 70 39 Total 60 60 0_14 0-14
15_19 10 10 15-19 20_24 20 20 20-24 20 20 25-29 25-29 20 20 30-39 30 30 30-39 40-49 10 10 40-49 10 10 50_59 50-59 10 10 60+ 60+ A.N.S. A.N.S.
33 Total 910 910 Division 4 Total 9,365 9,230 135 0-14 0-14 90 90
15-19 40 40 15-19 741 730 11 20-24 270 270 20-24 1,080 1,080 25-29 220 220 25-29 1,080 1,080 30-39 240 240 30-39 1,983 1,960 ::3 40-49 90 90 40-49 1,862 1,840 22-50_59 30 30 50-59 1,436 1,380 S6
60+ 20 20 60+ 1,093 1,070 23 A.N.S. A.N.S.
3S Total 2,767 2,741 26 40 Total 8,665 8,530 135 0-14 0-14 70 70
15-19 129 120 9 15-19 671 660 11 20-24 590 590 20-24 940 940 25_29 687 670 17 25-29 970 970 30-39 711 711 30-39 1,823 1,800 23 40_49 370 370 40-49 1,772 1,750 22 50_59 210 210 50-59 1,336 1,280 56
60+ 70 70 60+ 1,083 1,060 23
A.N.S. A.N.S.
36 Total 260 260 41 Total 80 80 0-14 0-14
15-19 15-19 20_24 30 30 20-24 25-29 20 20 25-29 30 30 30_39 100 100 30-39 30 30
40-49 70 70 40-49 50_59 40 40 50_59 20 20
60+ 604-A.N.S. A.N.S.
37 Total 251 251 43 Total 610 610 0-14 .20 20
0-14 15-19 70 70 15-19 50 50 20-24 140 140 20-24 25-29 70 70 25.......29 80 80
30-39 91 91 30-39 130 130
40_49 40 40 40-49 80 80 50-59 80 80
50-59 60+ 10 10 60+ A.N.S. A.N.S.
Total 421 421 44 Total 10 .. 10 38 0~14
0-14 20 15-19 15-19 20 20-24 20-24 30 30 25-29 25-29 80 80 30-39 30-39 121 121 40-49 10 10 40-49 110 110 50-59 50-59 50 50 60+ 60+ 10 10 A.N.S. A.N.S.
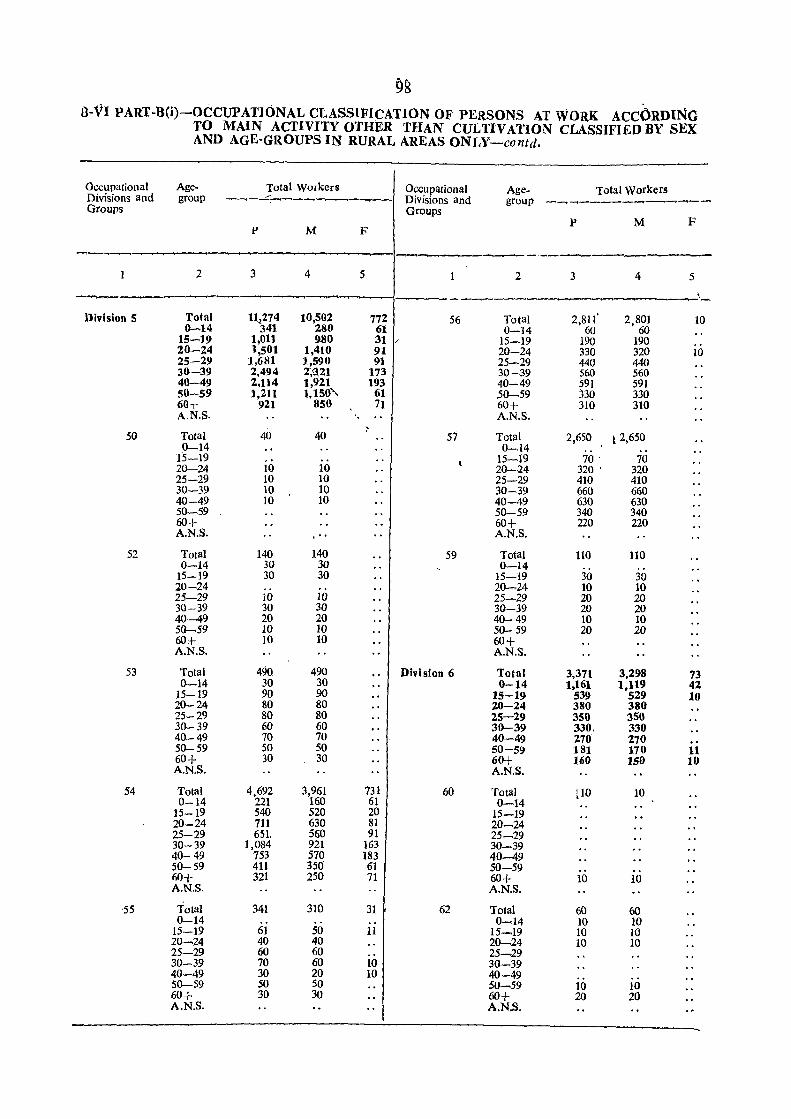
9S a-VI PART-B(i)-OCCUPATIONAL CLASSIFICATION OF PERSONS AT WORK ACCORDING
TO MAIN ACTIVITY OTHER THAN CULTIVATION CLASSIFIED BY SEX AND AGE-GROUPS IN RURAL AREAS ONLY-confd.
Occupational Age- Total Workers Occupational Age- Total Workers Divisions and group -..__,-~----.~---.__,--- Divisions and group ---.,__,---------__.,~--Groups Groups
F p M p M F
-------,----------2 3 4 .5 2 3 4 5
-___._,._.,-.~~ ~__,_., -.....--- ~~---'\-
Division 5 Total 11~274 10,502 772 56 Total 2,811' 2,801 10 0-.14 341 280 61 0-14 60 60
15-19 1,011 980 31 / 15-19 190 190 20-14 1,501 1,410 91 20-24 330 320 10 25-29 1,681 1,590 91 25-29 440 440 30-39 2,494 2~'3.21 173 3{}-'39 560 560 40-.49 2,114 1,921 193 40-49 591 591 51}-59 1,211 I, ISO'\. 61 50-59 330 330 60+ 921 850 71 I 60+ 310 310 A.N.S. A.N.S.
50 Total 40 40 57 Total 2,650 t 2,650 0-14 0-14
15-19 .. 15-19 70 . 70 20-24 10 10 20-24 320 . 320 25-29 10 10 25-29 410 410 30-39 10 10 30-39 660 660 40-49 10 10 40-49 630 630 50_59 50-59 340 340 60+ 60+ 220 220 A.N.S. . " A.N.S.
52 Total 140 140 59 Total 110 110 0-14 30 30 0-14 ..
15-19 30 30 15-19 30 30 20-24 20-24 10 10 25-29 10 10 25-29 20 20 30-39 30 30 30-39 20 20 40-49 20 20 40-49 10 10 50-59 10 10 50-59 20 20 60+ 10 10 60+ A.N.S. A.N.S.
53 Total 490 490 Division 6 Total 3,371 3,298 73 0-14 30 30 0-14 1,161 1,119 42
15-19 90 90 15-19 539 529 10 20-24 80 80 20-24 380 380 25-29 80 80 25-29 350 350 30-39 60 60 30-39 330. 330 40-49 70 70 40-49 270 270 50-59 50 50 50-59 181 170 11 60+ 30 30 60+ 160 150 10 A.N.S. A.N.S.
54 Total 4,692 3,961 731 60 Total l10 10 0-14 221 160 61 0-14
15-19 540 520 20 15-19 20-24 711 630 81 20-24 25-29 651, 560 91 25-29 30-39 1,084 921 163 30-39 40-49 753 570 183 40-49 50-59 411 35() 61 50-59 fiO+ 321 250 71 60+ 10 10 A.N.S. A.N.S.
,55 Total 341 310 31 62 Total 60 60 0-14 0-14 10 10
15-19 61 50 11 15-19 10 10 2Q-.24 40 40 2Q-.24 10 10 25-29 60 60 25-29 30-39 70 60 10 30-.39 40-49 30 20 10 40-49 SO-59 50 50 50-.59 10 10 60+ 30 30 60+ 20 20 A.N.S. A.N.S.
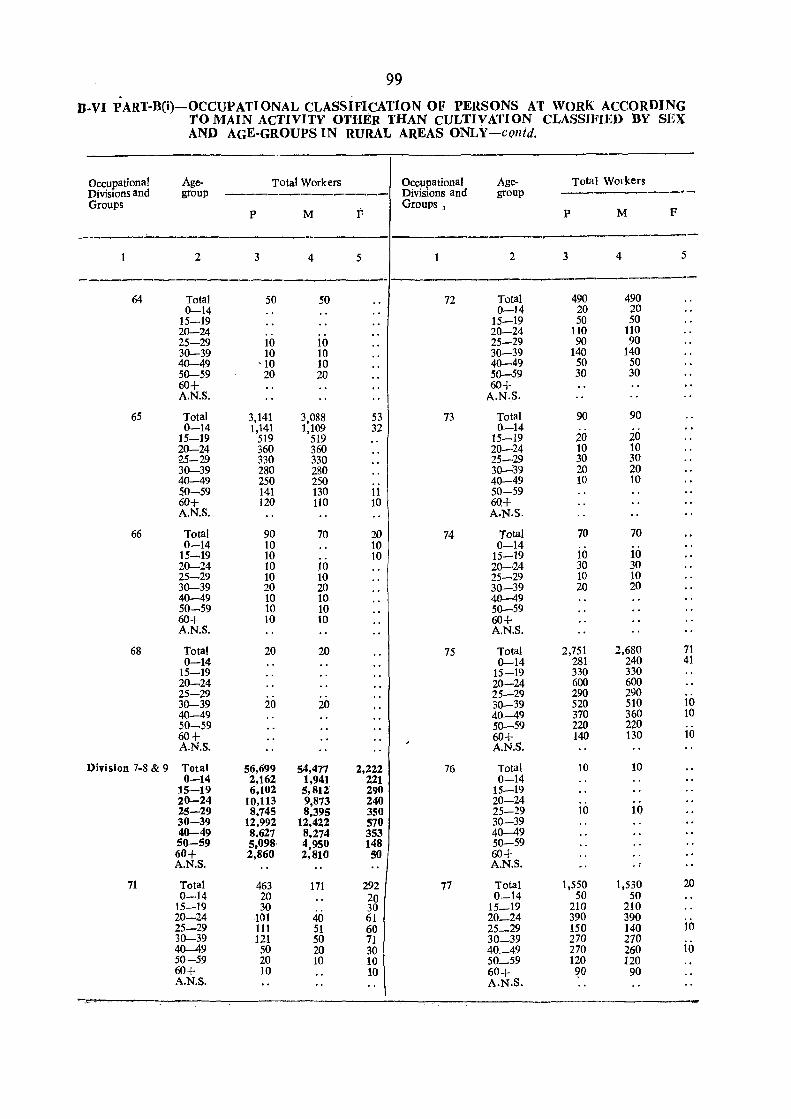
99 . .
B.VI PART·B(i)-OCCUPATIONAL CLASSIFICATIoN OF PERSONS AT WORK ACCORDING TO MAIN ACTIVITY OTHER THAN CULTIVATION CLASSIFIED BY SEX AND AGE·GROUPS IN RURAL AREAS ONLY-contd.
Occupational Age- Total Workers Occupational Ag~ Total Workers Divisions and group ------------- Divisions and group -----__.,--_--_ Groups Groups j
M F P M F P
.... _-----2 3 4 5 2 3 4 5
---------------------~--- ~ ~-------------
64 Total 50 50 72 Total 490 490 0-14 0-14 20 20
15-19 15-19 50 50 20-24 ., 20-24 110 110 25-29 10 10 25-29 90 90 30-39 10 10 30-39 140 140 40-49 '10 10 40-49 50 50 50-59 20 20 50-59 30 30 60+ 60+ A.N.S. A.N.S.
65 Total 3,141 3,088 53 73 Total 90 90 0-14 1,141 1,109 32 0-14
15-19 519 519 15-19 20 20 20-24 360 360 20-24 10 10 ;25-29 330 330 25-29 30 30 30-39 280 280 30_;39 20 20 40-49 250 250 40-49 10 10 5.0-59 141 130 11 50-59 60+ 120 110 10 60,+ AN.S. A.N.S.
66 Total 90 70 20 74 Total 70 70 0-14 10 10 0-14
15-19 10 10 15-19 10 10 20-24 10 10 20-24 30 30 25-29 10 10 25-29 10 10 30-39 20 20 30-39 20 20 40-49 10 10 40-49 50-59 10 10 50-59 60+ 10 10 60+ AN.S. A.N.S.
68 Total 20 20 75 Total 2,751 2,680 71 0-14 0-14 281 240 41
15-19 15-19 330 330 20-24 20-24 600 600 25-29 ., 25-29 290 290 30-39 20 20 30-39 520 510 10 40-49 40-49 370 360 10 50-59 50-59 220 220 60+ 60+ 140 130 10 A.N.S. A.N.S.
Division 7-8 & 9 Total 56,699 54,417 2,222 76 Total 10 10 0-14 2,162 1,941 221 0-14
15-19 6,102 5,81Z 290 15-19 20-24 lo.t13 9,873 240 20-24 .. 25-29 8,745 8,395 350 25-29 10 10 30-39 12,992 12,422 570 30-39 40-49 8,627 8,274 353 40-49 50-59 5,098· 4,950 148 50-59 60+ 2,860 2,810 50 60+ A.N.S. AN.S. .;
71 Total 463 171 292 77 Total 1,550 1,530 20 0-14 20 20 0-14 50 50
15-19 30 30 15_19 210 210 20-24 101 40 61 20_24 390 390 25-29 11l 51 60 25_29 150 140 10 30-39 121 50 71 30-39 270 270 40-49 50 20 30 40_49 270 260 10 50-59 20 10 10 50_59 120 120 60+ 10 10 60+ ~O 90 A.N.S. A.N.S.
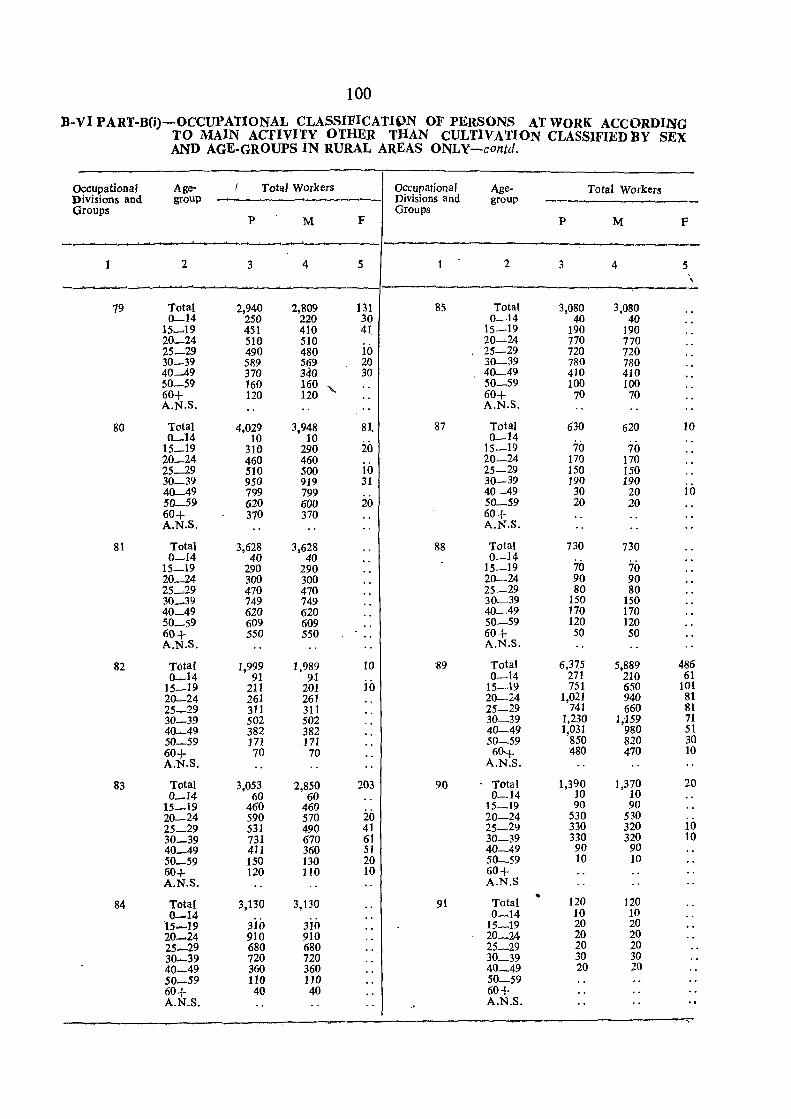
100
B-VI PART-B(j)-OCCUPATI0NAL CLASSIFICATION OF PERSONS AT WORK ACCORDl~G TO MAIN ACTIVI'fY OTHER THAN CULTIVATION CLASSIFIED BY SEX AND AGE. GROUPS IN RURAL AREAS ONLY-contd.
occupational Age- Total Workers Occupational Age. Total Workers Divisions and group _ _..;; ........... _ Divisions and group -----Groups Groups
p M F p M F
_____ ----"----'_'_ -----~ -----1 2 3 4 5 2 3 4 5
\ -----------------~
79 Total 2,940 2,809 131 8S Total 3,080 3,080 0-14 250 220 30 0-14 40 40 15~19 451 410 41 15-19 190 190 20_24 510 510 20-24 770 770 25-29 490 480 10 25-29 720 720 30-39 589 5f?9 20 30-39 780 780 40~9 370 340 30 40-49 410 410 50-59 160 160
" SO-59 100 100
60+ 120 120 60+ 70 70 A.N.S. A.N.S.
80 Total 4,029 3,948 81. 87 Total 630 620 10 0_14 10 10 0_14
15_19 310 290 20 15-19 70 70 20_24 460 460 20-24 170 170 25_29 510 500 10 25-29 150 150 30_39 950 919 31 30-39 190 190 40-49 799 799 40-49 30 20 10 50-59 620 600 20 50~59 20 20 60+ 370 370 60+ A.N.S. A.N.S.
81 Total 3,628 3,628 88 Total 730 730 0-14 40 40 0-14
70 15-19 290 290 15-19 70 20_24 300 300 20-24 90 90 25-,29 470 470 25_29 80 80 30-,39 749 749 30-39 150 150 40~9 620 620 40_49 170 170 50_59 609 609 50-59 120 120 60+ 550 550 60+ 50 50 A.N.S. A.N.S.
82 Total 1,999 1,989 to 89 Total 6,375 5,889 486 0_14 91 9-1 0_.14 271 210 61
15_19 211 201 jo 15-19 751 650 101 2(}'_"'24 261 261 20-24 1,021 940 81 25-29 311 311 25-29 741 660 81 30-39 502 502 30-39 1,230 1;159 71 40-49 382 382 40-49 1,031 980 51 50-59 171 171 50-59 850 820 30 60+ 70 70 60-+ 480 470 10 A.N.S. A.N.S.
83 Total 3,053 2,850 203 90 Total 1,390 1,370 20 0_14 60 60 0-14 10 10
15_19 460 460 15-19 90 90 20-24 590 570 20 20-24 530 530 25_29 531 490 41 25-29 330 320 10 30-39 731 670 61 30-39 330 320 10 40_49 411 360 51 40-49 90 90 50_59 150 130 20 50-59 10 10 60+ 120 110 10 60+ A.N.S. A.N.S ,
120 120 84 Total 3,130 3,130 9l Total 0-14 0-14 10 10
15-19 3io 310 15-19 20 20 20-24 910 910 20_24 20 20 25-29 680 680 25_29 20 20 30-39 720 720 30_39 30 30 40-49 360 360 40_49 20 20 50-59 110 110 50_59 60+ 40 40 60+ A.N.S. A.N.S.
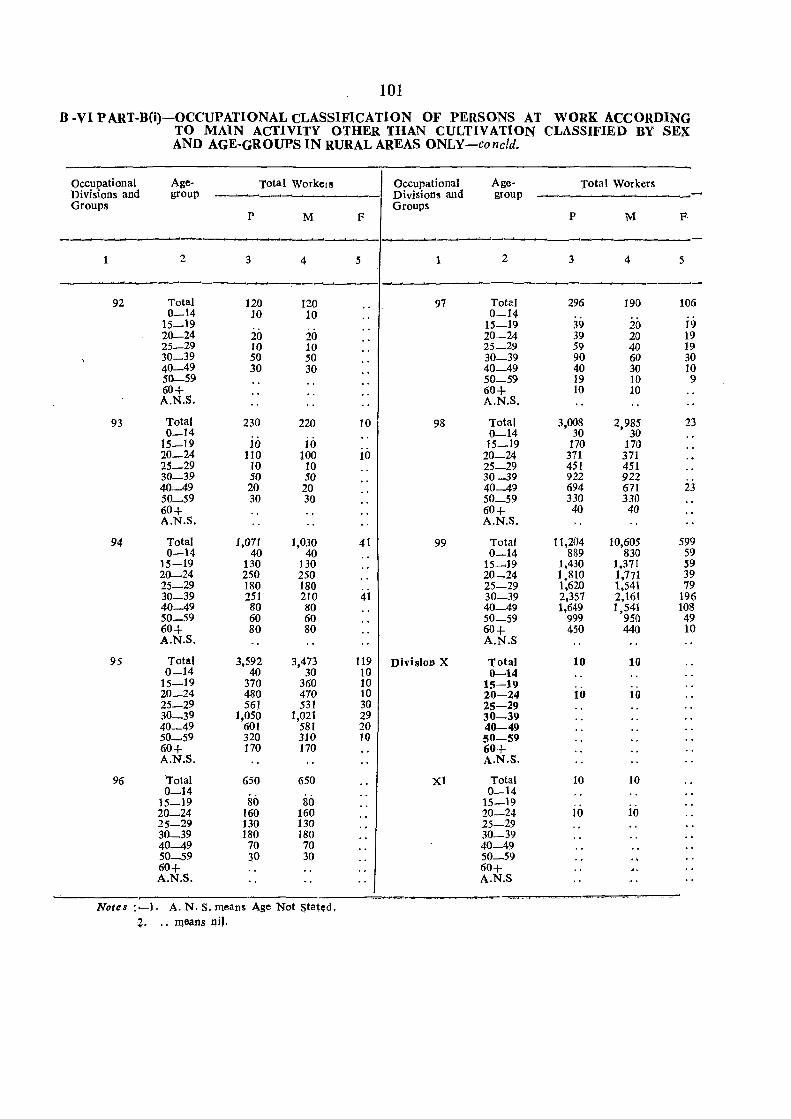
101
B -VI PART-B(i)-OCCUPATIONAL CLASSIFICATION OF PERSONS AT WORK ACCORDING TO MAIN ACTIVITY OTHER THAN CULTIVATION CLASSIFIED BY SEX AND AGE-GROUPS IN RURAL AREAS ONLY-conc!d.
Occupational Age- Total Workers Occupational Age· Total Workers Divisions and group Divisions and group ~___.-........;~ --Groups Groups
p M P P M p,
---~-------.,I---"'--- ~~- ----~-~
2 3 4 5 1 2 3 4 5
-___'~-----'-----"'___'--~-'-~, -~ -------'---_----___,,__;,,-_ ........ _----92 Total 120 120 97 Total 296 190 106
0_14 10 10 0-14 15_19 15-19 39 20 19 20-24 20 20 20-24 39 20 19 25-29 10 10 25-29 59 40 19 30_39 50 50 30-39 90 60 30 40-49 30 30 40-49 40 30 10 50-59 50-59 19 10 9 60+ 60+ 10 10 A.N.S. A.N.S.
93 Total 230 220 10 98 Total 3,008 2,985 23 0-14 io 0-14 30 30
15-19 io 15-19 170 170 20-24 110 100 10 20-24 371 371 25_29 10 10 25-29 451 451 30-39 50 50 30-39 922 922 40-49 20 20 40-49 694 671 23 50-59 30 30 50-59 330 330 60+ 60+ 40 40 A.N.S. A.N.S.
94 Total 1,071 1,030 41 99 Total 11,204 10,605 599 0-14 40 40 0-14 889 830 59
15-19 130 130 15-19 1,430 1,371 59 20-24 250 250 20-24 1,810 1,771 39 25-29 180 180 25-29 1,620 1,541 79 30-39 251 210 41 30-39 2,357 2,161 196 40-49 80 80 40-49 1,649 1,541 108 50-59 60 60 50-59 999 950 49 60+ 80 80 60+ 450 440 10 A.N.S. A.N.S
95 Total 3,592 3,473 119 DivisioD X Total 10 10 0_14 40 30 10 0-14
15-19 370 360 10 15-19 20-24 480 470 10 20-24 10 10 25-29 561 531 30 25-29 30_39 1,050 1,021 29 30-39 40-49 601 581 20 40-49 50_59 320 310 10 50-59 60+ 170 170 60+ A.N.S. A.N.S.
96 'Total 650 650 Xl Total 10 10 0-14 0-14
15-19 80 80 15-19 io 20-24 160 160 20-24 10 25-29 130 130 25-29 30-39 180 180 30-39 40-49 70 70 40-49 50_59 30 30 50-59 60+ 60+ A.N.S. A.N.S
Notes :-1. A. N. S. means Age Not Stat~d • Z. . , means nil.

TABLE B-Vl PAItT-"B (ii)
OCCUPATIONAL CLASSIFICATION OF PERSONS AT WORK ACCORDING TO MAIN ACTIVITY OLHER THANCULTIVATI08CLASSIFIEDBY SEX AND EDUCATIONAL LEVELS
IN RURAL AREAS ONLY Flyleaf
This table is also a n~w acldition and furnisho)s data for rural area<; only. It furnish'!s similar data as given in Tabl~ B-VI Part-A(i.i). <?n acco~nt of lower educational standards prevailing in rural areas a precise educatlOnal level classification as glVen below was adopted for rural areas : -
(1) Primary.
(2) Middle.
(3) Matriculation or Higher Secondary.
(4) Graduate and above.
2. Educationallevels viz., Non-technical diploma or certificate not equal to degree and technica I diploma or certificate not equal to degree has been combined with Matriculation or Higher Secondary in this table. On account of different procedures of estimation adopted for Table B-III Part -B and this t8Qle educational level figures for total literate workers other than cultivators vary to a negligible extent.
103
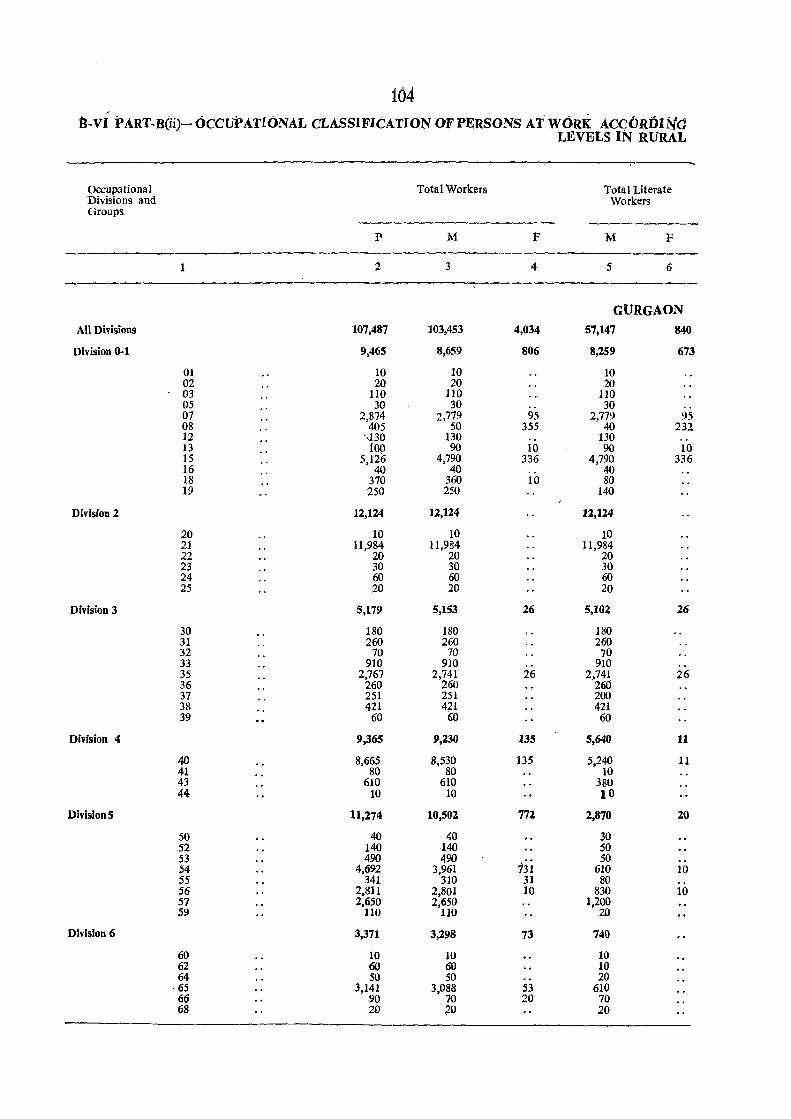
104 B-vi PART-B(ii)-OCCUPATIONAL CLASSIFICATION OJ? PERSONS AT" WORK Acc;tJRfiING
LEVELS IN RURAL
Occupational Total Workers Total Literate Divisions and Workers Groups
p M F M F
1 2 3 4 5 6
GURGAON All Divisions 107,487 103,453 4,034 57,147 840
Division 0-1 9,465 8,659 806 8,259 673
01 10 10 10 02 20 20 20 03 110 110 110 05 30 30 .. 30 07 2,874 2,779 95 2,779 95 08 405 50 355 40 232 12 ',130 130 " 130 .. 13 10Q 90 10 90 10 15 5,126 4,790 336 4,790 336 16 40 40 . " 40 18 370 360 10 80 19 250 250 140
Division 2 12,124 12,124 12,124
20 10 10 10 21 11,984 11,984 11,984 22 20 20 20 23 30 30 30 24 60 60 60 25 20 20 20
Division 3 5,179 5,153 26 5,102 26
30 180 180 180 31 260 260 260 32 70 70 70 33 910 910 .. 910 .. 35 2,767 2,741 26 2,741 26 36 260 260 260 37 251 251 200 38 421 421 421 39 60 60 60
Division 4 9,365 9,230 135 5,640 11
40 8,665 8,530 135 5,240 11 41 80 80 10 43 610 610 380 44 10 10 10
DivisionS 11,274 10,501 772 2,870 20
50 40 40 30 52 140 .140 50 53 490 490
73i 50 ..
54 4,692 3,961 610 10 55 341 310 31 80 .. 56 2,811 2,801 10 830 10 57 2,650 2,650 1,200 59 110 110 20
Division 6 3,371 3,298 73 740
60 10 10 10 62 60 60 10 64 50 50 .. 20
·65 3,141 3,088 53 610 66 90 70 20 70 68 20 ;20 20
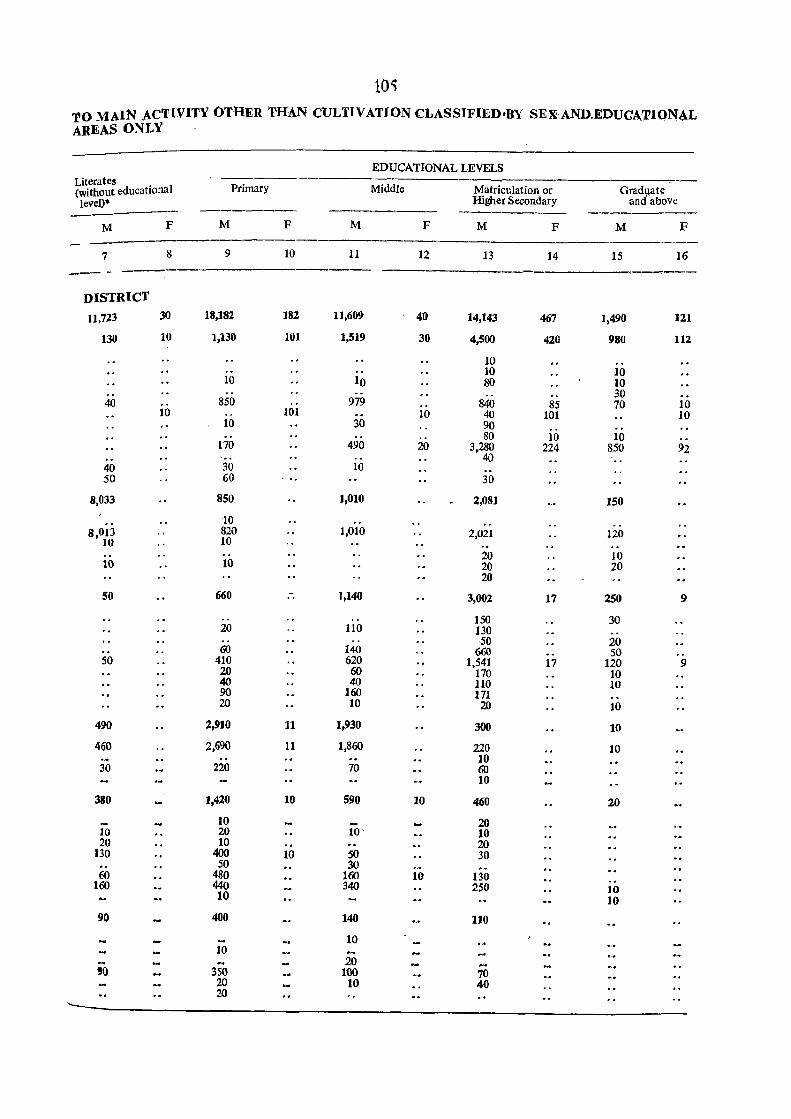
10)
'rO MAIN ACTIVITY' OTHER THAN CULTIVATION CLASSIFIED'BY SE~'AND.EDUCA:'FION.AL AREAS ONLY -
EDUCATIONAL LEVELS Literates
Primary Middle Matriculation or GradlJate (without educational leveO* Higher Secondary and above
M F M F M F M F M F
7 8 9 10 11 12 13 14 15 16
---DISTRICT
11,723 30 18,182 182 11,609 40 14,143 467 1,490 121
130 10 1,130 101 1,519 30 4,500 420 980 112
10 .. .. .. 10 10 10 10 80 10 .. .. .. .. . . 30
40 850 .. 979 .. 840 85 70 10 10 .. 101 .. 10 40 101 10
10 30 90 .. .. 80 10 10 .. 170 490 20 3,280 224 850 92 .. .. 40
40 30 10 50 60 30
8,033 850 1,010 2,081 150
.. 10 .. . . 8,013 820 1,010 2,021 120
10 10 .. .. .. .. 20 10 10 10 20 20
20
50 660 - 1,140 3,002 17 250 9 .. .. .. 150 30 20 110 130 ., ..
140 50 20 .. 60 660 .. 50 . .
50 410 620 1,541 17 120 9 20 60 170 10 40 40 110 10 90 160 171 .' 20 10 20 10
490 2,910 11 1,930 300 10
460 2,690 11 1,860 220 10 . - .. .. 10 30 220 70 60
10
380 1,420 10 590 10 460 20
.- 10 20 10 20 10' 10 20 10 .. .. 20
130 400 10 SO 30 -. 50 30 .. 60 480 160 10 130
160 440 340 250 10 10 10
90 400 140 ltO
- 10 10
20 '0 350 100 70
20 10 40 20
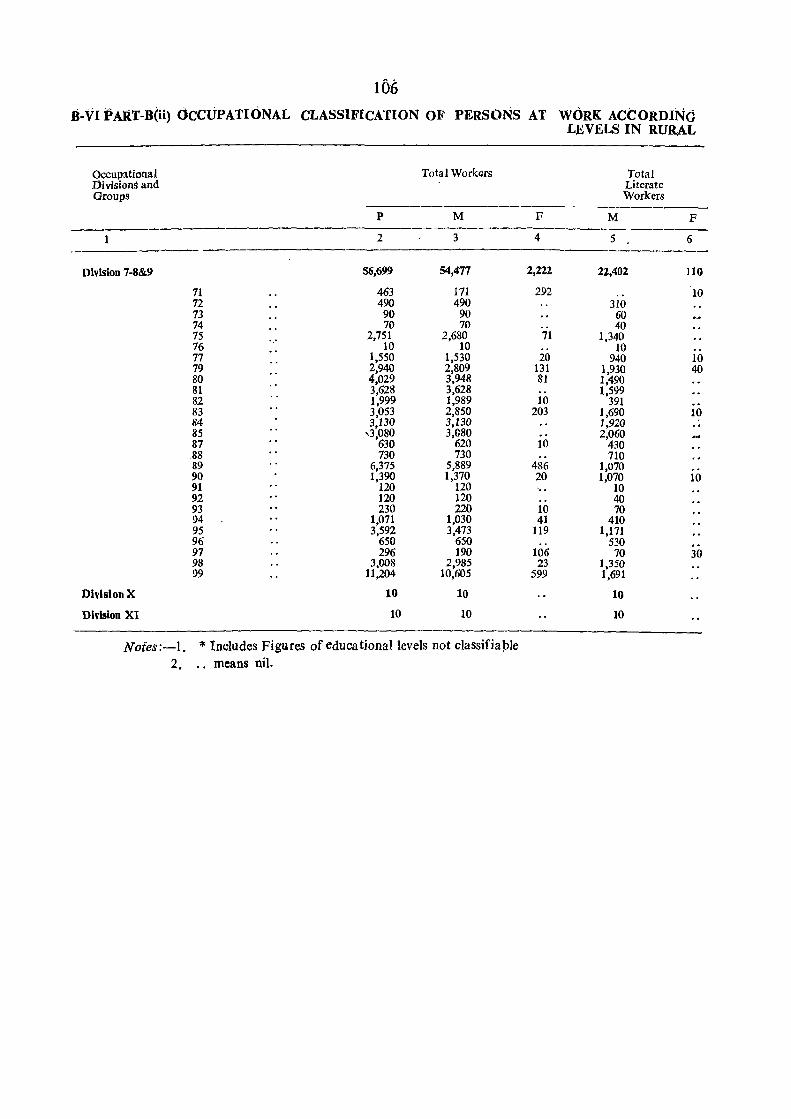
106 .a-VI PART-B(ii) OCCUPATIONAL CLASSIFICATION OF PERSONS AT WORK ACCORDING
LEVELS IN RURA-L
Occupational Total Workers Total Divisions and Literate Groups Workers
---------------- --------P M F M F ----
I 2 3 4 5 6 ---------
Division 7-8&9 56,699 54,477 2,222 22,402 110
71 463 171 292 .. 10 72 490 490 310 73 90 90 60 74 70 70 .. 40 75 2,751 2,680 71 1,340 76 10 10 ., 10 .. 77 1,550 1,530 20 940 10 79 2,940 2,809 131 1,930 40 80 4,029 3,948 81 1,490 81 3,628 3,628 ,. 1,599 82 1,999 1,989 10 391 83 3,053 2,850 203 1,690 10 84 3,130 3,130 1,920 .. 85 ,3,080 3,080 .. 2,060 87 630 620 10 430 .88 730 730 .. 710 89 6,375 5,889 486 1,070 " 90 1,390 1,370 20 1,070 10 91 120 120 10 92 120 120 .. 40 93 230 220 10 70 94 1,071 1,030 41 410 95 3,592 3,473 119 1,171 96 650 650 530 ., 97 296 190 106 70 30 98 3,008 2,985 23 1,350 99 11,204 10,605 599 1,691
Division X 10 10 10
Division XI 10 10 10
Nofes:-l. * Includes Figures of educational levels not classifiable 2. " means nil.
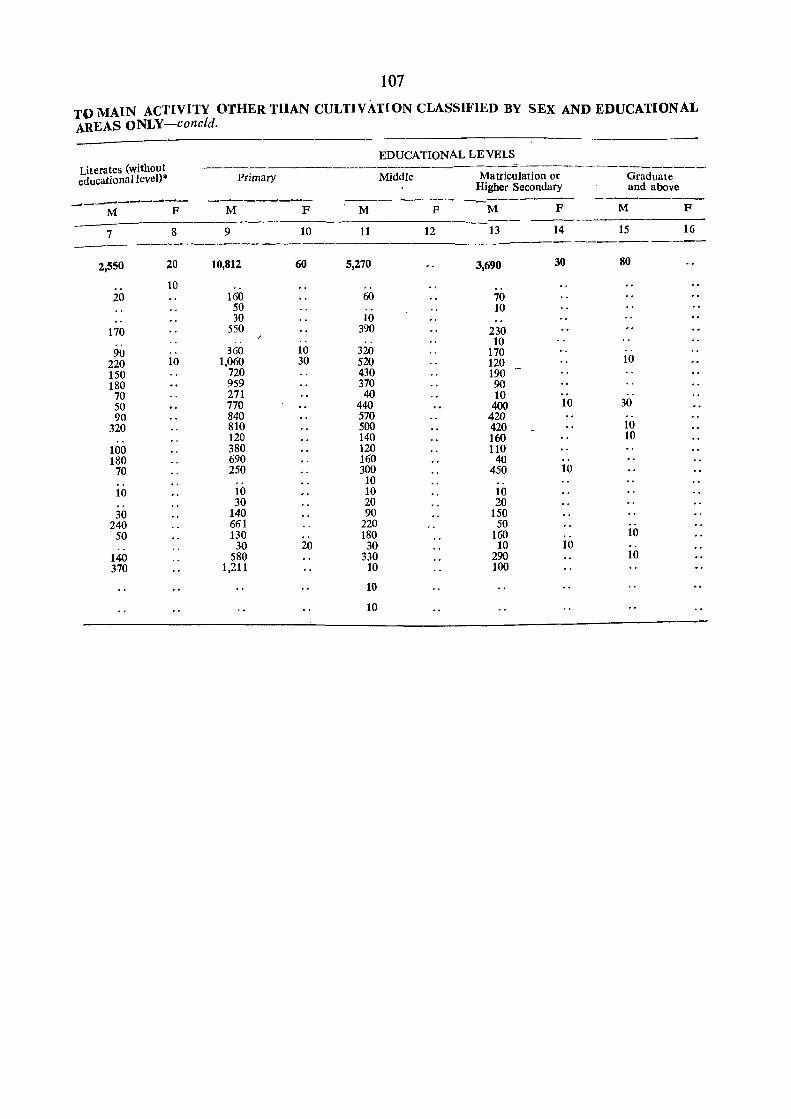
107
TO MAIN ACTIVITY OTHER THAN CULTIVATION CLASSl.FIED BY SEX AND EDUCATIONAL AREAS ONLY-conc/d.
EDUCATIONAL LE VELS Literates (without -------------------_---------------------_. educationalleve1)* Primary Middle Matriculation or Graduate
Higher Secondary and above
------------ --------- -------- --------, M F M F M F M F M F
7 8 9 10 11 12 13 14 15 16 --------------
2,550 20 10,812 60 5,270 3,690 30 80
.. 10 .. . . .. 20 160 60 70
50 .. 10 30 to
170 550 390 230 .. .. . . to 90 .. 360 10 320 170 ..
220 10 1,060 30 520 120 10 150 720 430 190 180 959 370 90 70 271 40 10 .. .. 50 770 440 400 10 30 90 840 570 420 ..
320 810 500 420 10 .. 120 140 160 10
100 380 120 110 180 690 160 40 .. 70 250 300 450 10 .. .. 10 .. 10 10 10 10 .. 30 20 20 30 140 90 150
240 661 220 50 50 130 .. 180 160 .. 10 .. 30 20 30 10 10 ..
140 580 330 290 10 370 1,211 10 100
10
10

TABLEB-VII
SECONDARY WORK i.e. PERSONS HAVING MAIN ACTIVITY (I) CULTIVATORS (II) AGRICULTURAL LABOURERS (III) HOUSEHOLD INDUSTRY (IV) NONHOUSEHOLD INDUSTRY, TRADE, BUSINESS OR SERVICE AND (V) NON· WORKERS CLASSIFIED BY SEX AND BY SECONDARY WORK (I) CULTIVATORS (II) AGRICULTURAL LABOURERS (III) HOUSEHOLD INDUSTRY (IV) NON·
HOUSEHOLD INDUSTRY, TRADE, BUSINESS OR SERVICE
Flyleaf
Table B-VII provides comprehensive statistics about the secondary work done by both workers and non-workers. Persons having main activity as cultivators, agricultural labourers working at household industry and non-household industry, business, trade or service and non-workers have been further classified in the case of persons whose secondary work is either 0) Cultivation or Oi) Agricultural Labourer or (iii) Household industry or (iv) Non-household industry, trade business, service, etc.
2. In 1961-Census participation in secondary activity was not given for non-workers and in case of workers it was presented in two parts. Presentation in Part-A was limited to such workers Who were having main activity as cultivators, agricultural labourers or household industry and were having secondary activity amongst any of these very categories but other than their main activity . Workers having secondary activity as non-household industry, trade, business, profession or service were omitted. In Part-R workers having their main activity as non-household industry, trade, business, profession or service only such of the workers were classified for secondary work who had their secondary activity as household industry only.
3. The table gives information for the total, rural and urban areas of the district for males and females separately.
4. This table is based on 20% sample for urban areas and 10% sample for rural areas. The sample results have been blown up for obtaining estimates for full count.
109

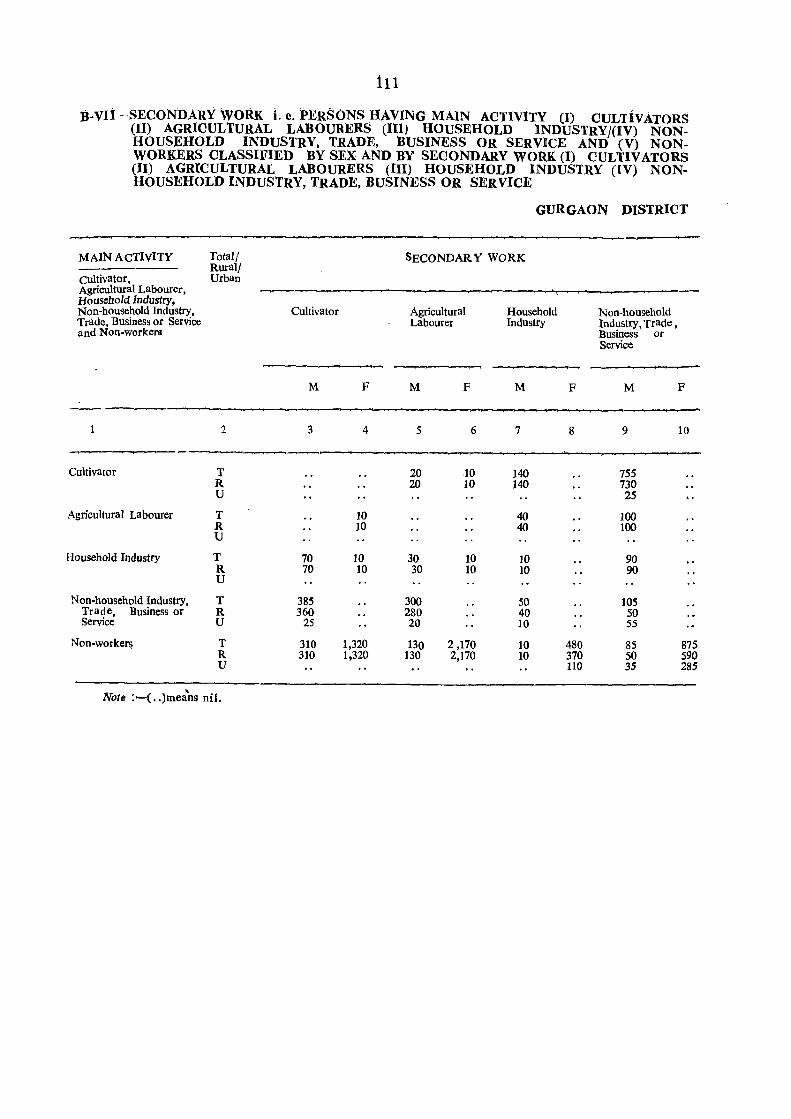
ill
B-Vli-SECONOARY WORI\ L e. PERSONS HAVING MAIN ACTIVITY (I) CULTivATORS (II) AGRICULTURAL LABOURERS (III) HOUSEHOLD INDUSTRY/(IV) NONHOUSEHOLD INDUSTRY. TRADE. BUSINESS OR SERVICE AND (V) NONWORKERS CLASSIFIED BY SEX AND BY SECONDARY WORK (I) CULTIVATORS (II) AGRICULTURAL LABOURERS (III) HOUSEHOLD INDUSTRY (IV) NONHOUSEHOLD INDUSTRY, TRADE. BUSINESS OR SERVICE
MAIN ACTIVITY
cultivator. Agricultural Labourer, Household Industry, Non-household Industry, Trade, Business or Service and Non-workers
Total I Rural! Urban
Cultivator
M F
GURGAON DISTRICT
SECQNDAR Y WORK
Agricultural Labourer
M F
Household Industry
M F
Non-household Industry, Trade, Business or Service
M F
--------~~~------~.--------------------~-----------------~--~---
Cultivator
Agricultural Labourer
Household Industry
Non-household Industry, Trade, Business or Service
Non-workers
2
T R U
T R U
T R U
T R U
T R U
Note :-( .. )means nil.
3
70 70
385 360
25
310 310
4
10 10
10 10
1,320 1,320
S
20 20
30 30
300 280 20
6
10 10
10 10
130 2,170 130 2,170
7
140 140
40 40
10 10
50 40 10
10 10
8
480 370 110
9
755 730 2S
100 100
90 90
105 50 55
85 50 35
10
875 590 285

'fABLE ;8-Vnl
PERSONS CC'ASSIFIED AS NON-WORKERS ACCORDING TO MAIN ACTIVITY CROSS-CLASSIFIED BY SEX, AGE-GROUPS AND TYPE OF ACTIVITY
Flyleaf
This table shows the classificatign of non-workers by sex and according to the activity pursued by them. Such activities are, however, 11'Ot treated as economically productive activities for Census purposes and the persons engaged therein are, therefore, treated as non-workers. Activities of all non-workers have been classified into the following seven categories:- .
(1) Students~
(2) Household duties.
(3) Dependents and infants.
(4) Retired, rentiers and persons of independentmeans.
(5) Beggars, vagrants'ctc. \
(6) Inmates of penal, mental & charitable institutions.
(7) Others.
2. This table has been prepared for total, rural and urban areas for the district only. The non-workers in each activity are further cross-tabulated by age-groups 0-14,15-19,20-24,25-29, 30-39, 40-49,50-59,60+ and Age not stated. The last activity of non-workers i.e. 'Others' largely comprises of the 'unemployed'. \
3. This table corresponds to Table B-IX of 1961-Census wherein the non-workers were classified into eight activities as against seven activities at the 1971·Census. The two categories of 1961-Census i.e. 'Persons. seeking employment for the first time' and 'Persons-employed before but now out of employment and seeking work' have not been adopted at the t971·Census. As,such, these persons do not fall in any of the first six above listed activities. These automatically fall in the residual activity i.e. 'Othel's'. First six categoricj arc almost the same. as at the 1961 ~Census.
4. This table is based on 20% sample for urban areas and 10% sample for rural areas. Sample results have been blown up to obtain estimats for full count.
113
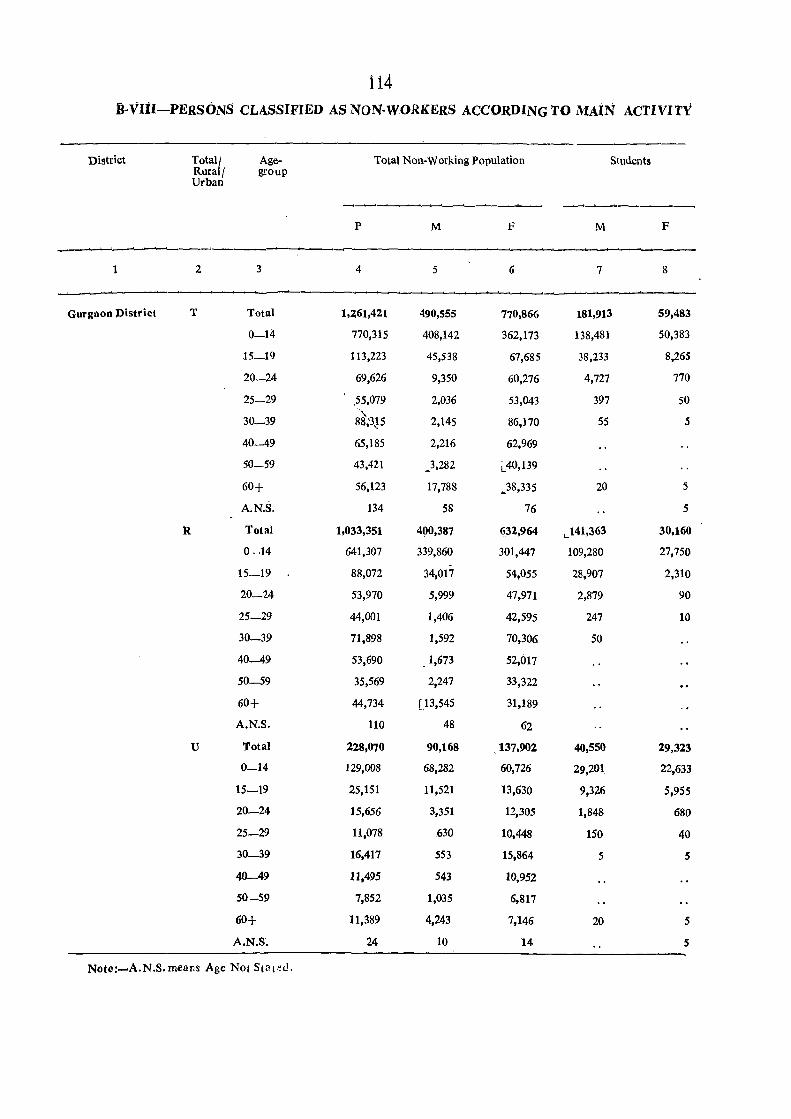
114 il-VIiI-PERSONS CLASSIFIED AS NON-WORKERS ACCORDING TO MAiN ACTIVITY
District Totalj Age- Total Non-Working Population Students Ruralj group Urban
~--
p M F M F ._ 1 2 3 4 5 6 7 8
--------... ___ Gurgaon District T Total 1,261,421 490,555 770,866 181,913 59,483
0-14 770,315 408,142 362,173 138,481 50,383
15-19 113,223 45,538 67,685 38,233 8,265
20-24 69,626 9,350 60,276 4,727 770
25-29 .55,079 2,036 53,043 397 50
30_39 ." 88,'3J5 2,145 86,170 55 5
40-49 65,185 2,216 62,969
50-59 43,421 ~3,282 L 40,139
60+ 56,123 17,788 .38,335 20 5
A.N.S. 134 58 76 5
R Total 1,033,351 400,387 !!32,964 L.141,363 30,160
0-14 641,307 339,860 301,447 109,280 27,750 -
15-19 88,072 34,017 54,055 28,907 2,310
20-24 53,970 5,999 47,971 2,879 90
25-29 44,001 1,406 42,595 247 10
30-39 71,898 1,592 70,306 50
40-49 53,690 1,673 52,017
50-59 35,569 2,247 33,322
60+ 44,734 [13,545 31,189
A.N.S. 110 48 62
U Total 228,070 90,168 ,137,902 40,550 29,323
0_14 129,008 68,282 60,726 29,201 22,633
15-19 25,151 11,521 13,630 9,326 5,955
20-24 15,656 3,351 12,305 1,848 680
25-29 11,078 630 10,448 150 40
30-39 16,417 553 15,864 5 5
40-49 11,495 543 10,952
50-59 7,852 1,035 6,817
60+ 11,389 4,243 7,146 20 5
A.N.8'. 24 10 14 5
Note:~A.N.S.means Age Not St31P.d.
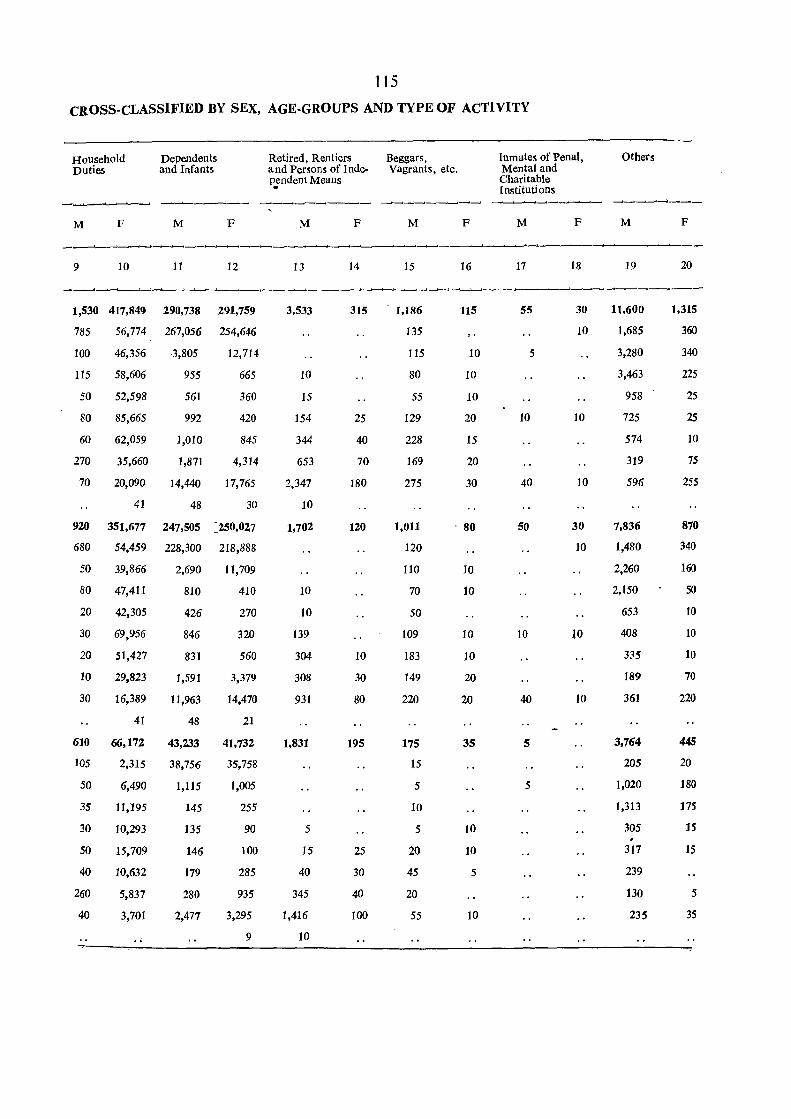
115
CROSS.CLASSIFIED BY SEX, AGE-GROUPS AND TYPE OF ACTIVITY
Household Duties
M F
Dependents and Infants
M
_--'_-'-_'_-9 10 11
F
12
1,530 417,849 290,738 291,759
785
100
115
50
80
60
270
70
56,774 267,056 254,646
46,356
58,606
52,598
85,665
62,059
35,660
20,090
41
3,805
955
561
992
1,010
1,871
14,440
48
12,714
665
360
420
845
4,314
17,765
30
920 351,677 247,505 =250,027
680
50
80
20
30
20
10
30
54,459 228,300 218,888
39,866 2,690 11,709
47,411
42,305
69,956
51,427
29,823
16,389
41
810
426
846
831
410
270
320
560
610 66,172
1,591
11,963
48
43,233
38,756
3,379
14,470
21
41,732
35,758
1,005
255
90
100
285
935
105
50
35
30
50
40
260
40
2,315
6,490
11,195
10,293
15,709
10,632
5,837
3,701
1,115
145
135
146
179
280
2,477 3,295
9
Retired, Rentiers Beggars, and Persons of Inde- vagrants, etc. pcndentMeans .
M
13
3,533
10
15
154
344
653
2,347
10
1,702
10
10
139
304
308
931
1,831
5
15
40
345
1,416
10
F M
14 15
315 . 1,186
25
40
70
180
120
10
30
80
195
25
30
40
100
135
115
80
55
129
228
169
275
1,011
120
110
70
50
109
183
149
220
175
15
5
10
5
20
45
20
55
F
16
115
10
10
10
20
15
20
30
. 80
10
10
10
10
20
20
35
10
10
5
10
Inmates of Penal, Mental and Charitable Institutions
M
17
55
5
10
40
50
10
40
5
5
F
18
30
10
10
10
30
10
10
10
Others
M
19
11,600
1,685
3,280
3,463
958
725
574
319
596
7,836
1,480
2,260
2,150
653
408
335
189
361
3,764
205
1,020
1,313
305
317
239
130
235
F
20
1,315
360
340
225
25
25
10
75
255
870
340
160
50
10
10
10
70
220
445
20
180
175
15
15
5
35

TABLE C-l PART-A
MEMBERS OF HOUSEHOLD BY RELATIONSHIP TO HEAD OF HOUSEHOLD CLASSIFIED BY AGE-GROUPS
Flyleaf
This table has been prepared for total, rural and urban population of the,district only and is based 0 n two stages of 20 % sample. The results obtained from sample have been inflated to obtain estimates for full count-Details of sampling and estimation procedure have been dicussed in technical note appearing in Annexure-II. The data in this table furnish information about the composition of households by relationship to the head of the household classified by three broad age-groups viz., less than 30, 30-49 and 50+. The figures for age not stated have been included in all ages. Data have been presented separately for related and unrelated members of the households and single member households. The relationship to the head of the household has been shown for son, brother, father; mother and other male or female members separately for married relations and for relation other than married relations (never married, widowed and divorced or separated persons). For later relations in addition to above mentioned relations information for daughter and sister has also been furnished. Unrelated persons and single member households have not beCll·classified according to marital status. Among the married relations, the data-for the spouses of the heads of the households have been given separately.
2. The table also presents total number of household and total household population by sex which is less than appearing in ,General population Tables as this is based on estimation obtained from a sample of population records and excludes institutional and houscless households while general population tables have been generated 'from individual slip on full count.
3. Thi~ table broadly corresponds to Table C-l of 1961-Census which had been prepared on 20 % sample basis for total, rural and urban population separately. The members of the households were grouped under (a) family members; heads of household who could be either male or female; their spouses; married sons and other male and female married relations and relations other'1han married persons, and (b) non-family members. No information by relationship was given for relations other than married persons nor any information was given for single member households. C,lassification by broad age-groups was also not attempted. The information for rural areas was then classified by households (i) engaged neither in cultivation nor in household industry (ii) engaged in household industry and(iii) engaged in cultivation by size of holding group while combined figures were given for urban and total areas. This additional information was processed from household schedules canvassed in 1961-Census only.
4. This table indicates the extent of the joint family system which is a topic of sociological interest. The age distribution of the heads of the househ,)lds and their relations classified by marital status will further help to study the future trend of the joint family system.
117
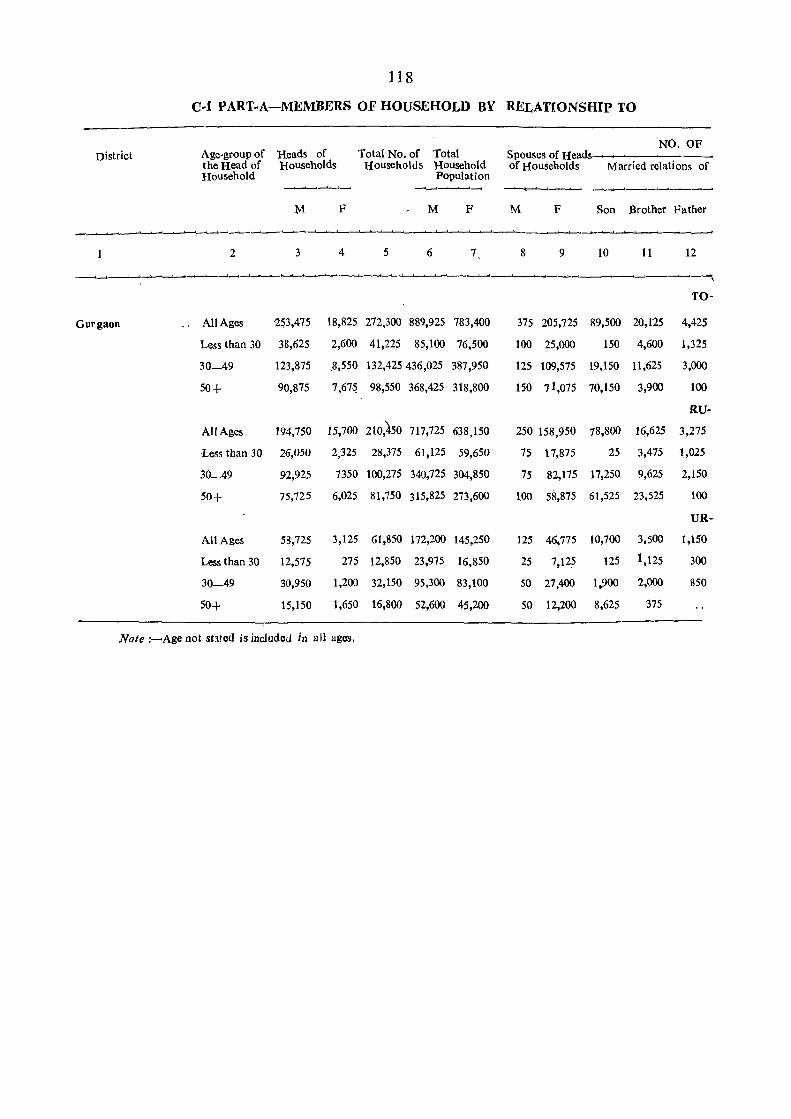
118
C·I PART. A-MEMBERS OF HOUSEHOLD BY RELATXONSHIP TO
NO. OF District Age-group of Heads of Total No. of Total Spouses of Heads
the Head of Households Households Household of Households Married relations of Household Population
-___.~._.. ~--.I~___'~ __.___....----~
~ F M F M F Son Brother Father
~~~____.__...~~___.--.I -~-~. ~~_..___,___.____,__.___._...__.___.____.
2 3 4 5 6 7 8 9 10 11 12
"___.__.___.__,_-----------_ TO-
Gurgaon .. AliAges '153,475 18,825 272,300 889,925 783,400 375 205,725 89,500 20,125 4,425
Less than 30 38,625. 2,600 41,225 85,100 76,500 100 25,000 150 4,600 1,325
30-49 123,875 .8,550 132,425 436,025 387,950 125 109,575 19,150 11,625 3,000
50+ 90,875 7,67~ 98,550 368,425 318,800 150 7 1,075 70,150 3,900 100
RU·
All Ages 194,750 15,700 210,450 717,725 638,150 250 158,950 78,800 16,625 3,275
Less than 30 26,050 2;325 28,375 61,125 59,650 75 17,875 25 3,475 1,025
30-49 92,925 7350 100,275 340,725 304,850 75 82,175 17,250 9,625 2,150
50+ 75,725 6,025 81,750 315,825 273,600 100 58,875 61,525 23,525 100
UR-
All Ages 58,725 3,125 61,850 172,200 145,250 125 46,775 10,700 3,500 1,150
Less than 30 12,575 275 12,850 23,975 16,850 2S 7,125 125 1,125 300
30-49 30,950 1,200 32,150 95,300 83,100 50 27,400 1,900 2,000 850
50+ 15,150 1,650 16,800 52,600 45,200 50 12,200 8,625 375
Note :~Age not shred is included in all ages.
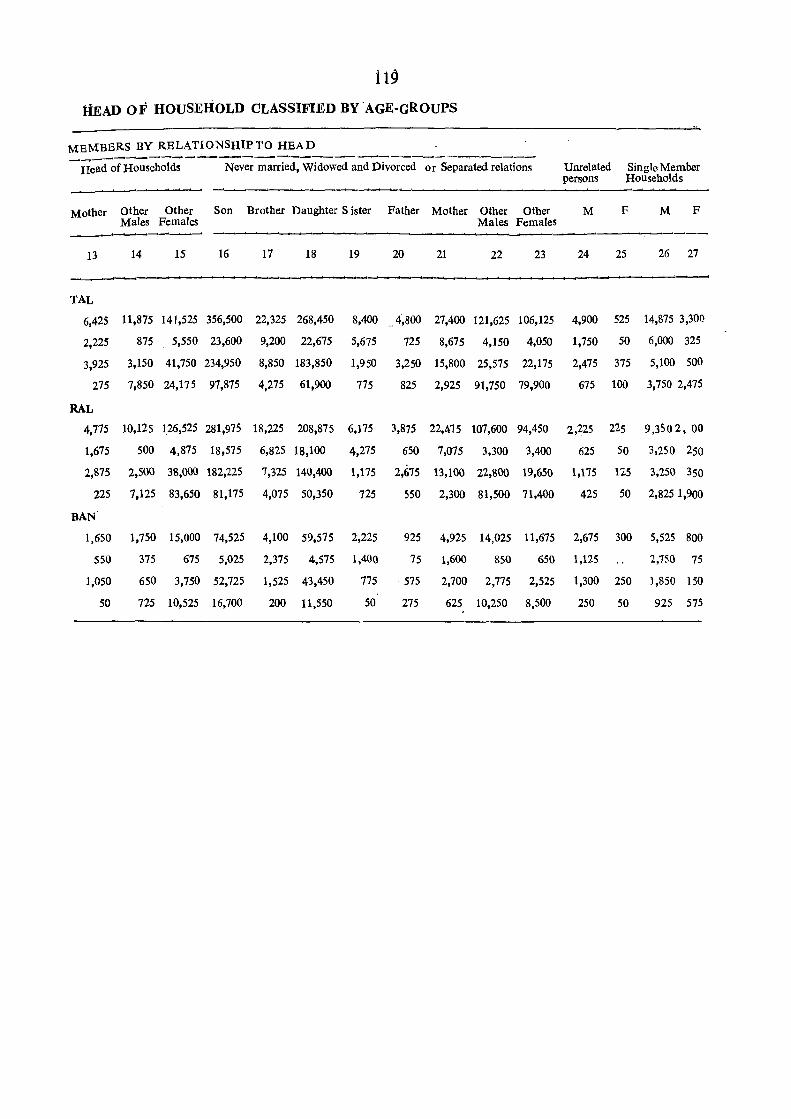
119
HEAD 0 F HOUSEHOLD CLASSIFIED BY 'AGE-GROUPS
MEMBERS BY RELATIONSHIP TO HEAD
-Headorno-;sehol&---N~v;";~:;;rried,Widow~~ Divorced;rSeparated relatio~ Unrelated Single Member persons Households
~~~
Mother Other Other Son Brother Daughter Sister Father Mother Other Other M F M F Males 'Females Males Females
-____._..--~
13 14 15 16 17 18 19 20 21 22 23 24 25 26 27
TAL
6,425 11,875 141,525 356,500 22,325 268,450 8,400 .,4',800 27,400 121,625 106,125 4,900 525 14,875 3,300
2,225 875 5,550 23,600 9,200 22,675 5,675 725 8,675 4,150 4,050 1,750 50 6,000 325
3,925 3,150 41,750 234,950 8,850 183,850 1,950 3,250 15,800 25,575 22,175 2,475 375 5,100 500
275 7,850 24,175 97,875 4,275 61,900 775 825 2,925 91,750 79,900 675 100 3,750 2,475
RAL
4,775 10,125 1,26,525 281,975 18,225 208,875 6,175 3,875 22,415 107,600 94,450 2,225 225 9,3502,00
1,675 500 4,875 18,575 6,825 18,100 4,275 650 7,075 3,300 3,400 625 50 3,250 250
2,875 2,500 38,000 182,225 7,325 140,400 1,175 2,675 13,100 22,800 19,650 1,175 1:t.5 3,250 350
225 7,125 83,650 81,175 4,075 50,350 725 550 2,300 81,500 71,400 425 50 2,8251,900
BAN
1,650 1,750 15,000 74,525 4,100 59,575 2,225 925 4,925 14,025 11,675 2,675 300 5,525 800
550 375 675 5,025 2,375 4,575 1,400 75 1,600 850 650 1,125 2,750 7S
1,050 650 3,750 52,725 1,525 43,450 775 ' 575 2,700 2,775 2,525 1,300 250 1,850 150
50 725 10,525 16,700 200 11,550 50 275 625 10,250 8,500 250 50 925 575

'TABLI~ C-Ilt
AGE, SEX AND EDUCATION
Flyleaf
This table has been prepared in two parts, Part-A relates to all areas and Part-B to urban areas.
2. The table corresponds to Table C-III Part A and B of last Census with slightly different educational levels and age-groups. In 1961 it was prepared on full count basis and in 1951 on 10% sample basis. This time it has been prepared on 10% sample for rural areas and 20% sample for urban areas. Thereafter the sample has been raised to full count.
3. The test adopted for literacy in 1971-Census was the ability to read and write with understandini. If a person fulfilled this te~t then he was treated as literate otherwise illiterate. In case of literate persons the highest examination passed or the highest educational level attained, if any, was also recorded.
levels.
4. The educational levels adopted for Part-A i. e., all areas of this table are as follows :-
(1) Primary;
(2) Middle;
(3) Matriculation or Higher Secondary ;
(4) Non-technical diploma or Certificate not equal to degree;
(5) Technical diploma or Certificate not equal to degree ; and
(6) Graduate and above.
5. The educational levels of Part~B i. e., urban areas are as follows :
(1) Primary;
(2) Middle ;-
(3) Matriculation or Higher Secondary ;
(4) Non-technical diploma or Certificate not equal to degree;
(5) Technical diploma or Certificate not equal to degree;
(6) Graduate degree other than technical degree;
(7) Post-graduate degree other than technical degree ; and
(8) Technical degree or Diploma equal to degree or Post-graduate degree :-
(i) Engineering and technology; (ii) Medicine ; (iii) Agriculture, veterinary and dairying ; (iv) Teaching ; and (v) Others.
6. This table enables us to assess progress in literacy in different age-groups and educational
121
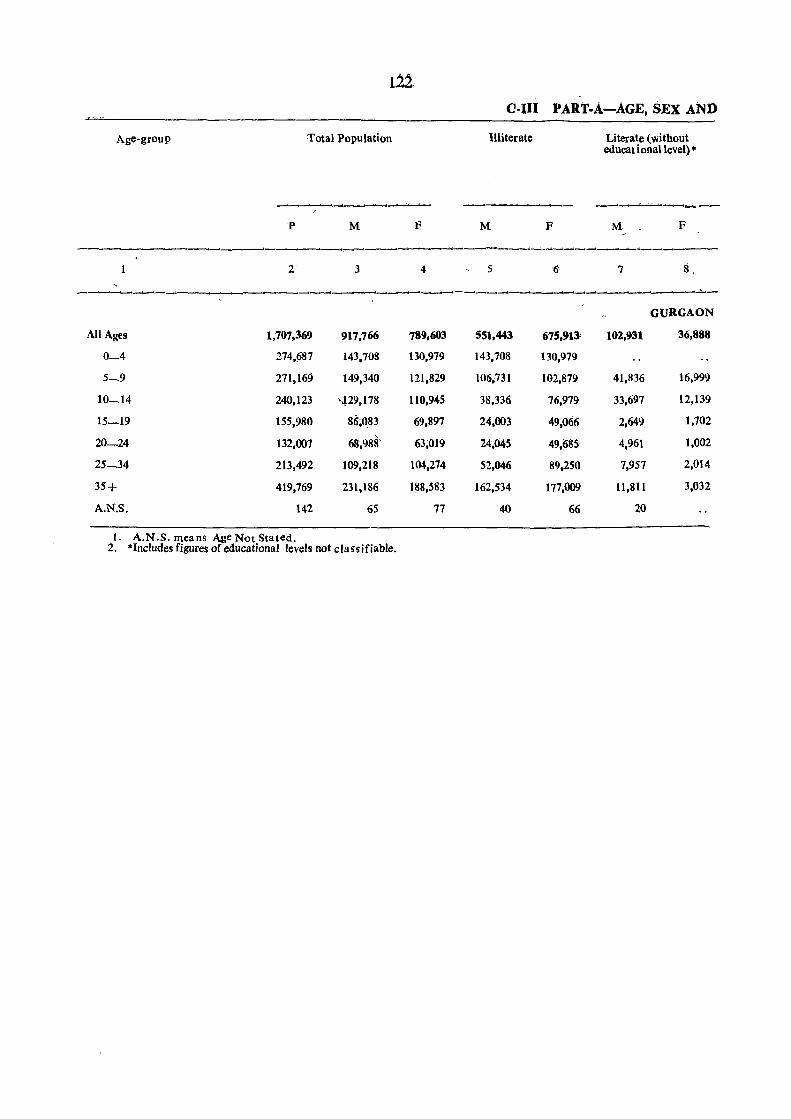
0-111 PART-A-AGE, SEX AN))
Age-group Total Population Illiterate
P M F M F
~-~-~-.--------------
2 3 4 5 6
-__._.._..--___.___.-----~-- ------------------------All Ages 1.707,369 917.766 789,603 551,443 675,913'
0-4 274,687 143,708 130,979 143,708 130.979
5-9 271,169 149,340 121,829 106,731 102,879
10-14 240,123 ;,129,178 110,945 38,336 76,979
15_19 155.980 86~Q83 69.897 24,003 49,066 ,
20_24 132,007 68,988' 63,019 24,045 49,~85
25_34 213,492 109,218 104,274 52.046 89.250
35+ 419,769 231,186 188,583 162,534 177,009
A.N.S. 142 65 77 40 66
t. A.N .S. means Age Not Stated. 2. *IncIudes figures of educational levels not classifiable.
Literate (without educat ionallevel) *
-~-'-"""""_---
M F
7 8.
--------~-
GURGAON
10a,931 36.888
41,836 16,999
33.697 12,139
2,649 1,702
4,961 1,002
7,957 2,014
11,811 3,032
20
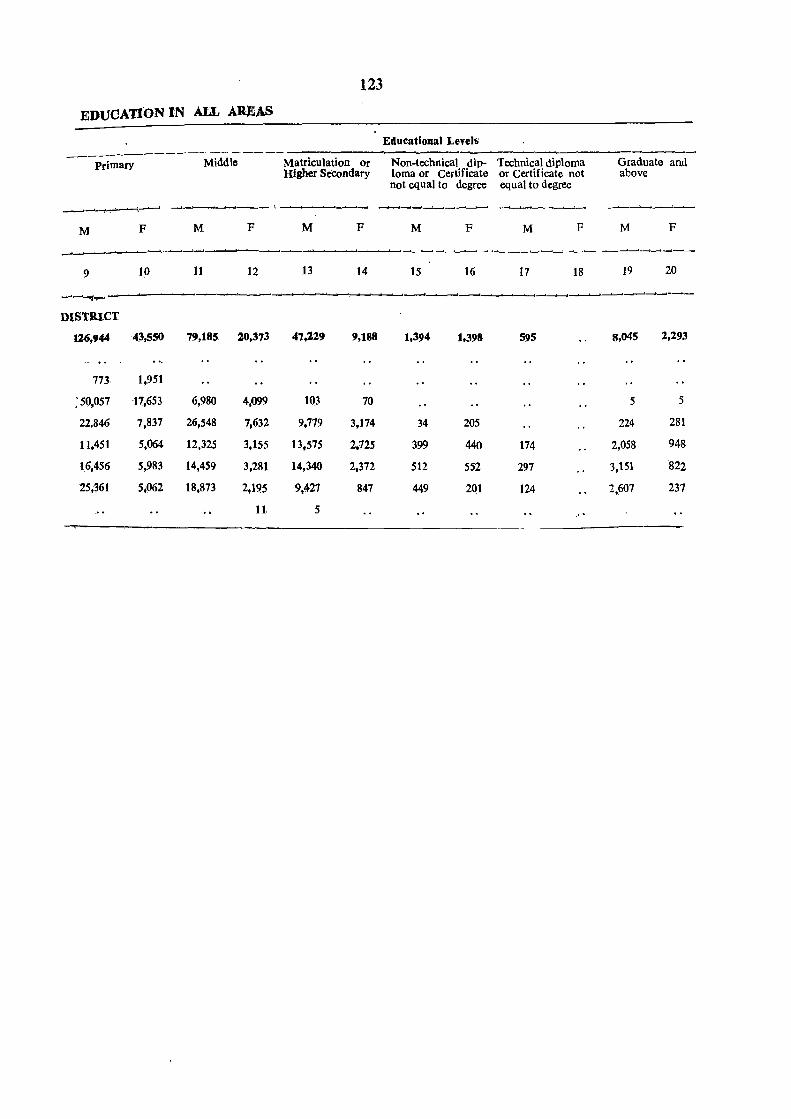
123
EDUCATION IN ALL AREAS
Educational Levels ------------_. -- ----- ------------~---
Primary Middle Matriculation or Non-technical dip- Technical diploma Graduate and Higber Secondary lorna or Certificate or Certificate not above
not equal to degree equal to degree
M F M F M F M F M F M F
_.__.._
9 10 11 12 13 14 15 16 17 18 19 20
~~
DiSTRICT
126,''''' 43,550 79,185 20,373 47,229 9,188 1,394 1,398 595 8,045 2,293
773. 1,951
:50,057 17,653 6,980 4,099 103 70 5 5
22.846 7,837 26,548 7,632 9,779 3,174 34 205 224 281
11,451 5,064 12,325 3,155 13,575 2,725 399 440 174 2,058 948
16,456 5,983 14,459 3,281 14,340 2,372 512 552 297 3,151 822
25,361 5,()62 18,873 2,195 9.427 847 449 2Ql 124 2,607 237
11 5
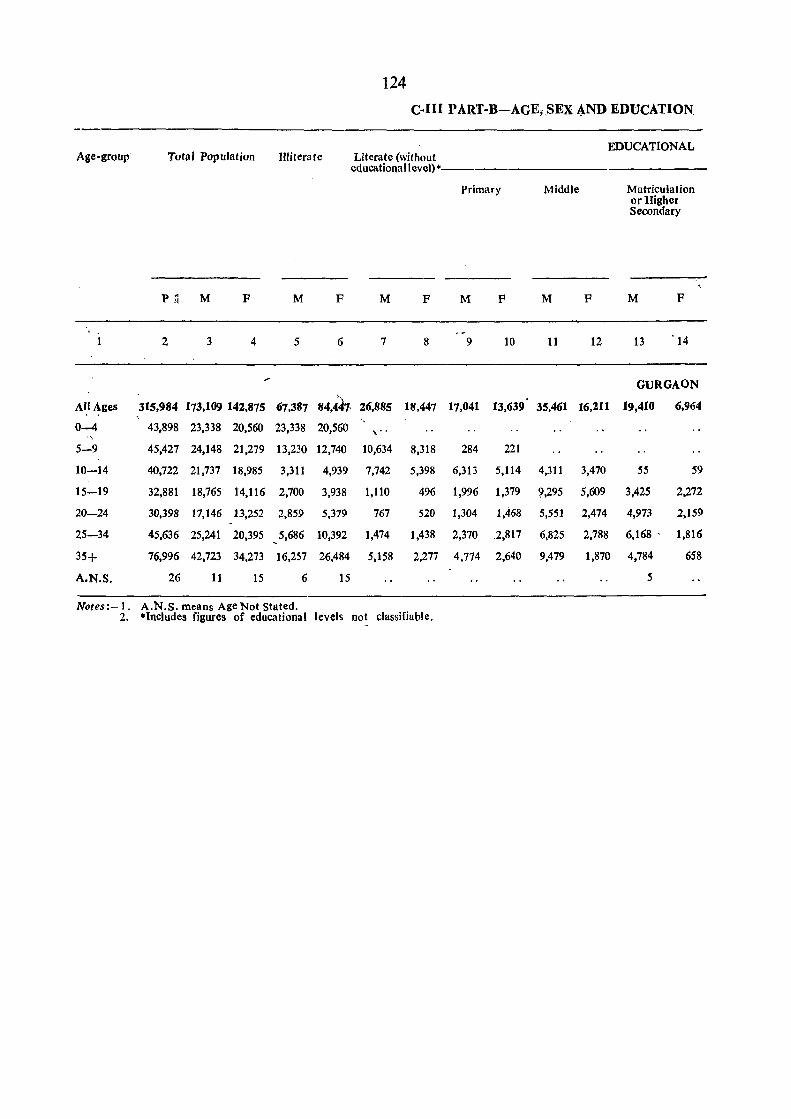
1
All Ages
0-4
5-9
10-14
15-19
20-24
25-34
35+
A.N.S.
Notes:-l. 2.
124 C-III PART-B-AGELSEX ~ND EDUCATION
Total Population Illiterate
p ~ M F M
2 3 4 5
F
6
~,
Literate (without educationallevel) *
M F
7 8
315,984 173,109 142,875 67,387 84,447, 26,885 18,447
43,898 23,338 20,560 23,338 20,560 , .. 45,427 24,148 21,279 13,230 12,740 10,634 8,318
40,722 21,737 18,985 3,311 4,939 7,742 5,398
32,881 18,765 14,116 2,700 3,938 1,110 496
30,398 17,146 13,252 2,859 5,379 767 520
45,636 25,241 20,395 5,686 10,392 1,474 1,438 ,
76,996 42,723 34,273 16,257 26,484 5,158 2,277
26 11 15 6 15
A.N.S. means Age Not Stated. *Includes figures of educational levels not classifiable.
-
Primary
M F
9 10
17,041 13,639
284 221
6,313 5,114
1,996 1,379
1,304 1,468
2,370 2,817
4,774 2,640
EDUCATIONAL
Middle
M F
11 12
35,461 16,211
4,311 3,470
9,295 5,609
5,551 2,474
6,825 2,788
9,479 1,870
Matriculation or Higher Secondary
M F
13 '14
GURGAON
19,410 6,964
55 59
3,425 2,272
4,973 2,159
6,168 . 1,816
4,784 658
5
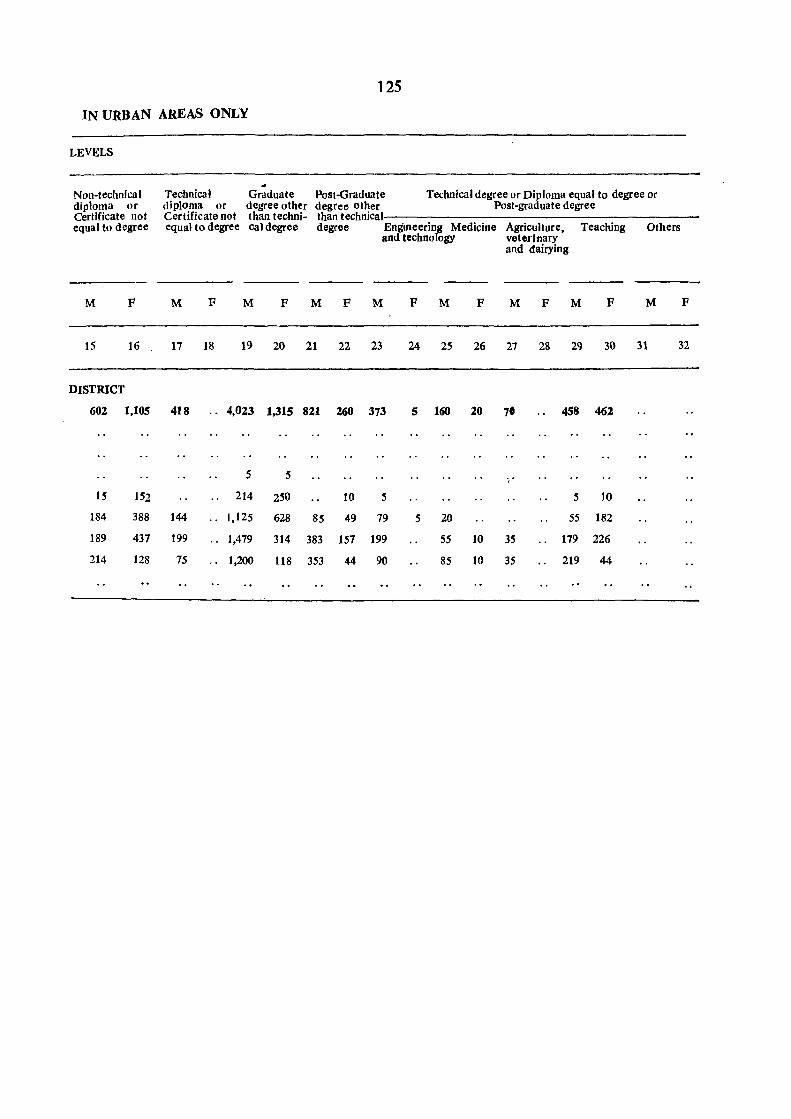
IN URBAN AREAS ONLY
LEVELS
. Technical Graduate diploma or degree other
125
Post-Graduate degree other than technical
Technical degree or Diploma equal to degree or Post-graduate degree
Non-technical diploma or Certificate not equal to degree
Certificate not than techniequal to degree cal degree degree Engineering Medicine
and technology Agriculture, veterinary and dairying
Teaching Others
M F M F M F M F M
15 16 17 18 19 20 21 22 23
DISTRICT
602 1,105 418 .. 4,023 1,315 821 Z60 373
15
184
189
214
152
388
437
128
144
199
75
5 5
214 250 10 5
.. 1,125 628 85 49 79
.. 1,479 314 383 157 199
.. 1,200 118 353 44 90
F M F M F M F M
24 25 26 27 28 29 30 31
5 160 20 70
','
5 20
55 10 35
85 10 35
458 462
5 10
55 182
179 226
219 44
F
32

TABLE C-V-MOTHE~-TONGUES OF niE 1971-CENSUS
PART-A-DISTRIBUTION OF LANGUAGES (INCLUSIVE OF MOTHER-TONGUES GROUPEO UNDER EACH) .SPECIFIED IN SCHEDULE VIII TO THE CONSTITUTION OF INDIA
PART-B-SPEAKERS OF LANGUAGES/MOTHER-TONGUES (INCLUSIVE OF MOTHER",TONGUES ",HERE GROUPED) OTHER THAN THOSE SPECIFIED IN SCHEDULE VIII TO THE CONSTITUTION OF INDIA
Flyleaf
These tables correspond to the all-India language tables of the Census of India, 1951 published in Census ofIndia Paper-I of 1954 and the language tables C-V of the Census of India, 1961 published in Volume I Part-I1-C(ii)-Language tables and Volume Xln Punjab, Part II-C, Social and Cultural Tables.
2. The question on mother-tongues at the 1971-Census and instructions to enumerators Were as follows-
Question 14: Mother-Tongue:
3. Dcfinition.-Mother-tongue is the language spoken in childhood by the person's mother to the person. If the mother died in infancy, the language mainly spoken in the person's home in childhood will be the mother-tongue. In the case of infants and deaf mutes the language usually spoken by the mother shall be recorded. . .
4. Record mother-tongue in full whatever be the name of the language as returned and avoid use of abbreviations. You are not expected to determine if the language returned by a person is the dialect of another major language and so on. You should not try to establish any relationship between religion and mothertongue. You are bound to record the language as returned by the person as his mother-tongue and you should not enter into any argument with him and try to record anything other than what is returned. If you have reason to suspect that in any area due to any organised movement, mother-tongue was not being truthfully returned, you should record the mother-tongue as actually returned by the respondent and make a report, to your superior Census Officers for verification. You are not authorised to make any correction on your own.
5. Table C-V Part-A is in two sections: (i) showing the distribution of speakers of languages (inclusive of mother tongues grouped under. each) specified in Schedule Vln to the Constitution of India for the district, for total, rural and urban areas cross-classified by sex and (ii) showing the distribution of speakers of these languages for the district, six tahsils and fourteen towns in the district for total areas only crossclassified by sex. The data for the rural areas of the tahsil are not presented but they can be derived by subtracting data in respect of towns within the tahsil from the total tahsil figures.
6. Table C-V Par~-B presents speakers of languages/mother-tongues (inclusive of mother-tongues where grouped) other·than'those shown under Part-A for the district, tahsils and towns. This table is also being presented in two sections: (i) showing the speakers of these languages/mother-tongues for the district for total, rural and urban areas cross-classified by sex and (ii) showing the distribution of these languages/mothertongues for total areas of-the district, tahsils and towns cross-classified by sex.
7. We have, however, presented Tables C-V Part-A (ii) and C-V Part-B(ii) only in this volume.
8. In both Par-ts A and B, mother-tongues have been grouped in some cases under the relevant languagee,). This has been done on the basis of information readily available or in the light of studies already made. Those 'identifiable' mother-tongues which returned 10,000 or more speakers each at the all-India level have been grouped in Parts A and B as shown below :-
Part-A (Hindi) Banjari, Bhadrawahi, Bhojpuri, Braj Bhasha ; Bundelkhandi ; Chhattisgarhi; Garhwali; Haryanvi ; Kangri ; Kumauni ; Magadhi/Magahi ; Maithili ; Malvi ; Mandeali ; Marwari ; Mewati ; Nimadi ; Pahari* ; Rajasthani
Punjabi Bagri Part-B
BhiliJBhilodi Bhilali, Kokna/Kokni/Kukna Lahnda Multani
9. All other mother-tongues falling under Part~B and which returned less than 10,000 speakers each at the all-India level or were not 'identifiable' on the basis of information available as of data, are included in the category 'Others' occurring as the last entry in Part-B .
. ------------------------~-----------------*Pahari is combination of various speeches spoken over long stretches of areas where the speakers
p referred to give a general name as Pahari.
127
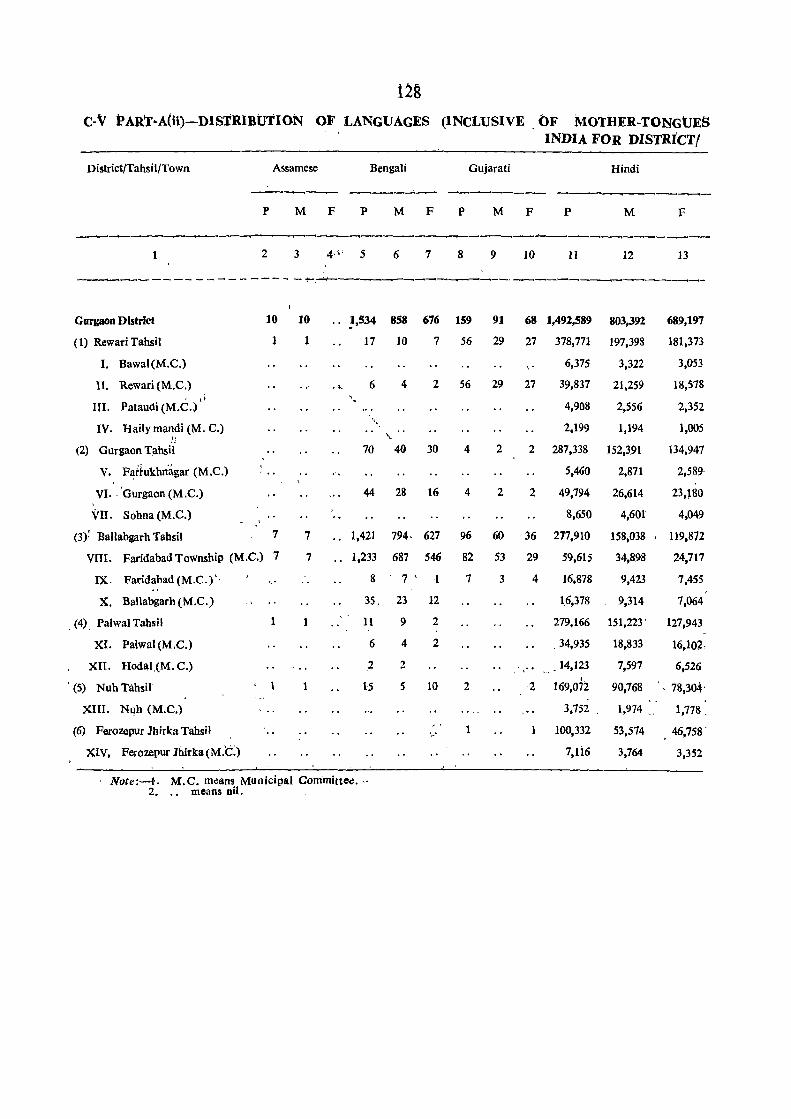
128 c-v P AR'r~A(ii)-DISTRIBtJTI ON OF LANGUAGES (INCLUSIVE OF MOlHER-TONGUES
INDIA FOR DISTRICT!
District/Tahsil/Town Assamese Bengali Gujarati Hindi __... __ -.._,._ ---- ----- --------------
P M F P M F P M F P M F
-----"'I-----~- --~-----------~----___,_------
2 3 4·" 5 6 7 8 9 10 11 12 13
--------------r,~----------~-----, _________________
Gurgaon District 10 10 .. },S34 858 676 159 91 68 1,492,589 803,392 689,197
(1) Rewari Tahsil 1 1 17 10 7 56 29 27 378,771 197,398 181,373
I. Bawal (M.e.) 6,375 3,322 3,053
n. Rewari (M.e.) .>. 6 4 2 56 29 27 39,837 21,259 18,578 , li , .
III. PatauCli (M.C.,) . 4,908 2,556 2,352 ,
IV. Haily mandi (M. C.) 2,199 1,194 1,005 !; \.
(2) Gurgaon Tahsil 70 40 30 4 2 2 287,338 152,391 134,947
V. Fattukhnagar (M.e.) , , .. 5,460 2,871 2,589'
VI. . 'Gurgaon (M.e.) 44 28 16 4 2 2 49,794 26,614 23,J80
VII. Sohna (M.C.) 8,650 4,601' 4,049
(3f Ballabgarh Tahsil 7 7 1,421 794. 627 96 60 36 277,910 158,038 119,872
VIII. Faridabad Township (M.C.) 7 7 .. 1,233 687 546 82 53 29 59,615 34,898 24,717
IX. Faridabad (M.C.)·' 8 7 • 1 7 3 4 16,878 9,423 7,455
X. Ballabgarh (M.e.) 35, 23 12 16,378 9,314 7,064
, (4). Palwal Tahsil 1 11 9 2 279,166 151,223 ' 127,943
XI. Palwal(M.C.) 6 4 2 ,34,935 18,833 16,10~·
XII. Hodal{M.e.) 2 2 .. ,. _ 14,123 7,597 6,526 , ' ,
, (5) Nuh Tahsil 1 1 15 5 10 2 2 169,072 90,768 . 78,304'
XIII. Nllb (M.e.) \ .. 3,752 1,974 " 1,778 ,
(6) Ferozepur 1hirka Tahsil - 1 1 100,332 53,574 46,758 '
XIV. Ferozepur Jhirka(M.C:) 7,li6 3,764 3,352
Note:-l . M.e. means Municipal Committee ... 2. . , means oil.
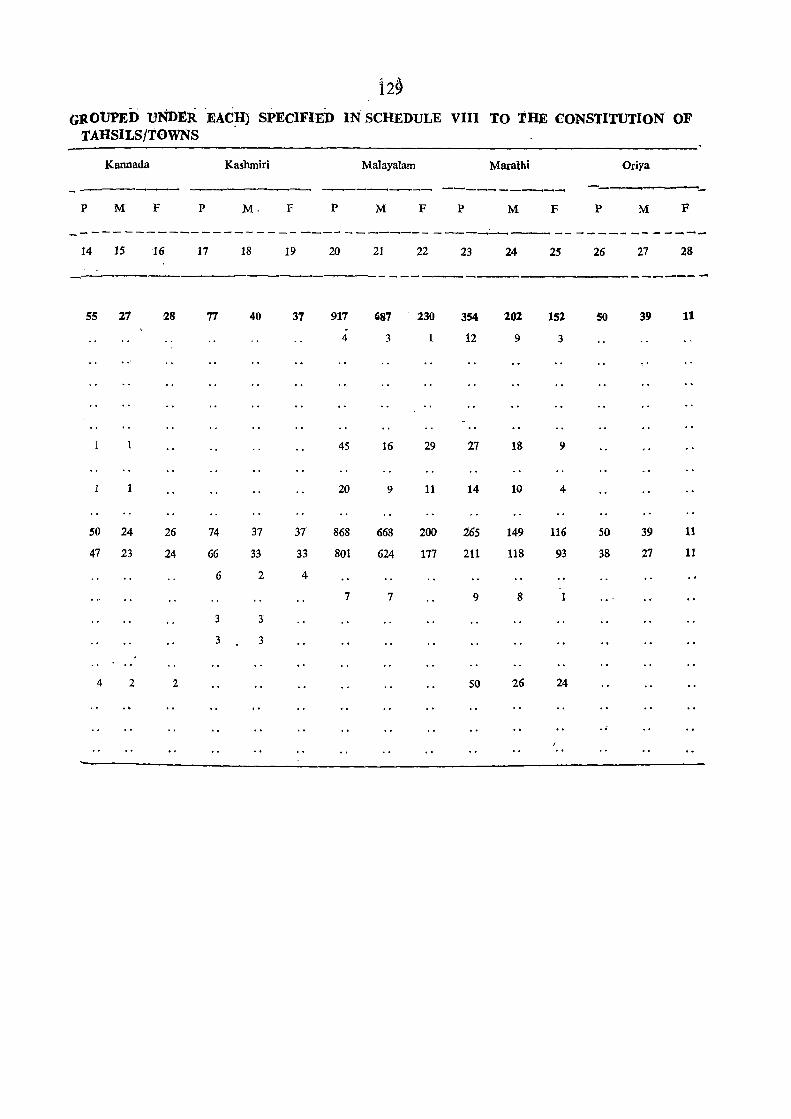
i2~
GROUPED UND:lR EAC~) SPECIFIED IN SCHEDULE VIII TO THE CONSTITUTION OF TAHSILS/TOWNS
Kannada Kashmiri Malayalam Maralhi Oriya
------~- ----------- ---------- ----------- -----~---p M F p M· F p M F p M F p M F
--------------~------------------------------------------14 15 16 17 18 19 20 21 22 23 24 25 26 27 28
------- -------
55 27 .28 77 40 37 917 Ci87 230 354 202 152 50 39 11 . 4 3 1 12 9 3
45 16 29 27 IS 9
20 9 11 14 10 4
50 24 26 74 37 37 868 668 200 265 149 116 SO 39 11
47 23 24 66 33 33 801 624 177 211 118 93 38 27 11
6 2 4
7 7 9 8
3 3
3 3
4 2 2 SO 26 24
..
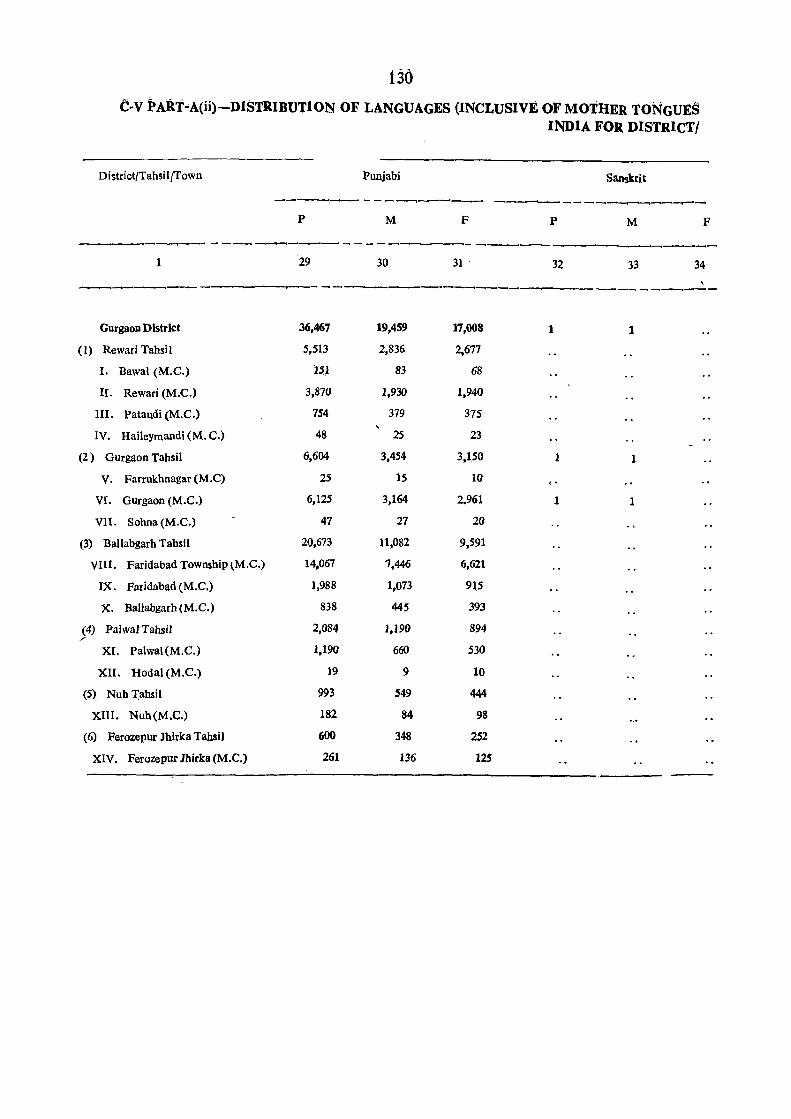
130 C-V PART-A(ii)-DISTRIBUTION OF LANGUAGES (INCLUSIVE Of MOTHER TONGUES
INDIA FOR DISTRICTI
District/Tahsil IT own Punjabi Sanskrit
--------___,_-_- ----- --.---p M F p M F
------___,_- - --- -----.---...,-- - - - - ---~-------------~--~-1 29 30 31 ' 32 33 34
'. --------------....-----------, ---------------- -------.---
GUrgaoD District 36,467 19,459 17,008 1 1
(1) Rewari Tahsil 5,513 2,836 2,677
1. Bawal (M.e.) 15.1 83 68
II. Rewari (M.e.) 3,870 1,930 1,940
III. Pataudi (M.e.) 754 379 375
IV. Haileymandi (M. e.) 48 25 23
(2 ) Gurgaon Tahsil 6,604 3,454 3,150 1 1
V. Farrukhnagar (M.C) 25 15 10
VI. Gurgaon (M.e.) 6,125 3,164 2.961 1 1
VII. Sohna (M.e.) 47 27 20
(3) Ballabgarh Tahsil 20,673 11,082 9,591
VIII. Faridabad Township tM.e.) 14.067 7,446 6,621
IX. Faridabad (M.e.) 1,988 1,073 915
X. BaUabgarh (M.e.) 838 445 393
(4) Palwal Tahsil 2,084 1,190 894 ./
XI. Palwal(M.e.) 1.190 660 530
XII. Hodal (M.e.) 19 9 10
(5) Nuh rahsi! 993 549 444
XIII. Nuh(M.C.) 182 84 98
(6) Ferozepur Jhirka Tahsil 600 348 252
XIV. Ferozepur Jhirka (M.e.) 261 136 125
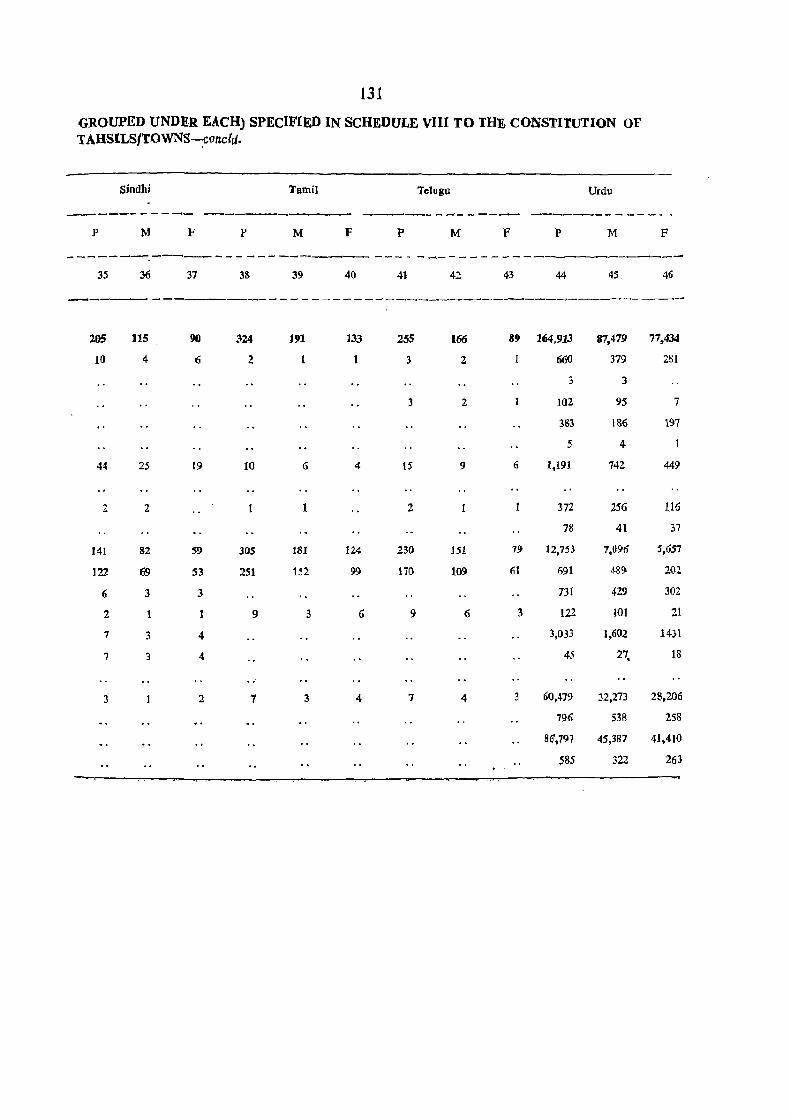
131
GROUPED UNDER EACH) SPECIFIED IN SCHEDULE VIII TO THE CONSTITUTION OF TAHSILS/TOWNS--:concid.
Sindhi Tamil Telugu Urdu
_--------- -------- --_------ ...
P M F P M F P M F P M F
- ------.----- - - - - ---_-_-- - - - - - -- - - - - - -- - ------~-------35 36 37 38 39 40 41 42 43 44 45. 46
----------------------------------------------------------295 115 90 324 191 133 25S 166 89 164,913 37,419 71,434
10 4 6 2 3 2 660 379 281
3
3 2 102 95 7
383 186 191
5 4
4~ 25 19 10 6 4 15 9 6 1,191 742 449
2 2 2 372 256 116
78 41 37
141 82 59 305 181 124 230 151 19 12,75} 7,(}96 5,651
]22 69 53 251 152 99 170 109 61 691 489 202
6 3 3 131 429 302
2 9 3 6 9 6 3 122 101 21
7 3 4 3,033 1,602 1431
., 3 4 45 27, 18
3 2 7 3 4 7 4 60,479 32,273 2S,206
796 538 258
86,797 45,387 4l,4Hl
585 322 263
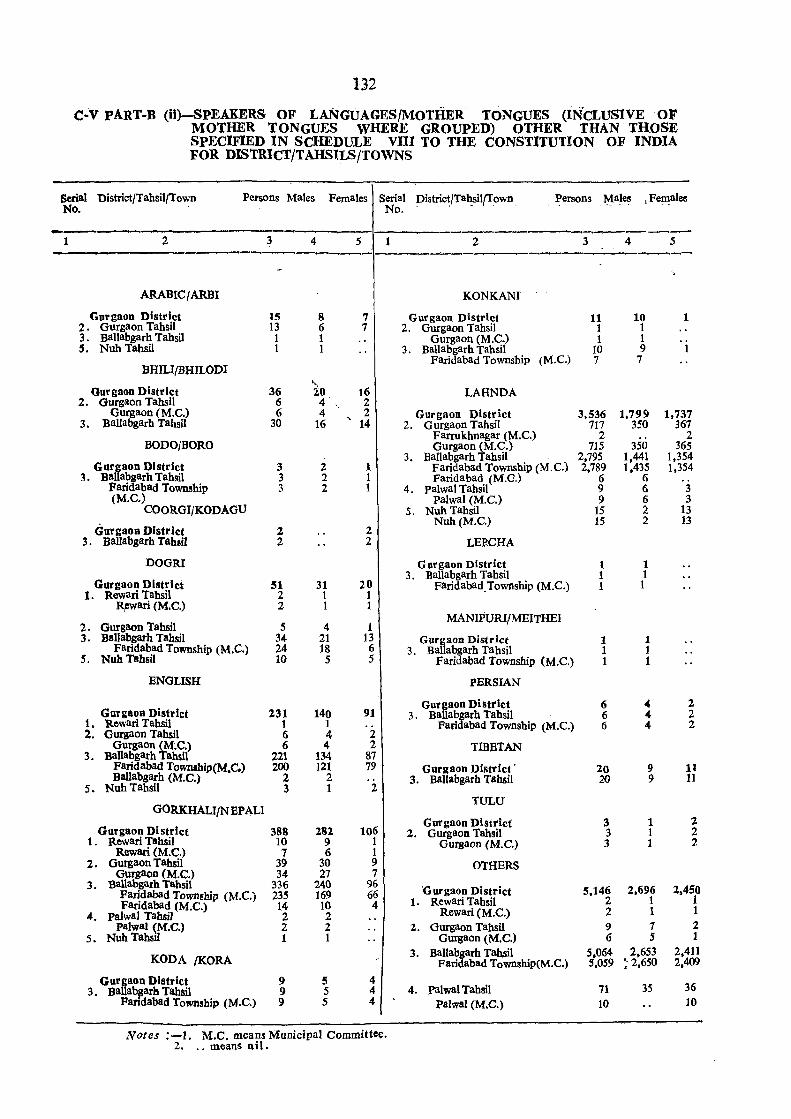
132
c·v pART·B (ii)-SPEAKERS OF LANGUAGES/MOTHER TONGHES (INCLUSlVE O:F MOTHER TONGUES WHERE GROUPED) OTHER THAN THOSE SPECIFIED IN SCHEDULE VIII TO THE CONSTITUTION OF INDIA FOR DISTRICT/TAHSILSjTOWNS
Serial Oistrict/Tahsil/Town Persons Males Females Serial pistric~/Ta~sil/Town Persons .~ales ,Females No. No.
-- ~--~-1 2 3 4 5 1 2 3 4 5
-~-'---~ ~~-
ARABIC f ARBI KONKANI
GurgaoD District 15 8 7 GUl'gaon District 11 10 1 2 . Gurgaon Tahsil 13 6 7 2. Gurgaon Tahsil 1 1 3. Ballabgarh Tahsil 1 1 Gurgaon (M.C.) 1 1 5. Nub Tahsil 1 1 3. Ballabgarh Tahsil 10 9 1
Faridabad Township (M.C.) 7 7 BH1LIfBHILODI
Ourgaon District 36 io 16 LAHNDA 2. Gurgaon Tahsil 6 4 2
Gurgaon (M.C.) 6 4 2 GUrgaon District 3,536 1,799 1,737 3. Ballabgarh Tahsil 30 16 14 2. Gurgaon Tahsil 717 350 367
Farrukhnagar (M.e.) 2 2 BODO/BORO Gurgaon (M.C.) 715 350 365
3. Ballabgarh Tahsil 2,795 1,441 1,354 Gargaon District 3 2 1 Faridabad Township (M.e.) 2,789 1,435 1,354
3. B!llabgarh Tahsil 3 2 1 Faridabad (M.e.) 6 6 Faridabad Towmhip 3 2 1 4. Palwal Tahsil 9 6 3 (M.C.) Palwal (M.C.) 9 6 3
COORGI/KODAGU 5. Nub Tahsil 15 2 13 Nuh(M.C.) 15 2 13
GargaoD District 2 2 3. Ballabgarh Tahlil 2 2 LEPCHA
DOGRI Gurgaon District 1 1 3. Ballabgarh Tahsil 1 1
GurgaoD District 51 31 20 Faridabad.Township (M.C.) 1 1 1. Rewari Tahsil 2 1 1
R,cwari (M.C.) 2 1 1
2. Gurgaon Tahsil 5 4 1 MANIPURI/MEITHEI
3. Ballabgarh Tahsil 34 21 13 Gurgaon District 1 1 Faridabad Township (M.e.) 24 18 6 3. Ballabgarh Tahsil 1 1
5. Nub Tahsil 10 5 5 Faridabad Township (M.C.) 1 1
ENGLISH PERSIAN
Gurgaon District 6 4 2 GurgaoD District 231 140 91 3 . Ballabgarh Tahsil 6 " 2
1. Rewari Tahsil 1 1 Faridabad Township (M.C.) 6 " 2 2. Gurgaon Tahsil 6 4 2
Gurgaon (M~C.) 6 4 2 TmBTAN 3. Ballabgath Tahsil 221 134 87
Faridabad Townthip(M.C.) 200 121 79 Gurgaon District' 20 9 11 Ballabgarh (M.e.) 2 2 3. Ballabgarh Tahsil 20 9 11
5. Nuh Tahsil 3 1 2
GORKHALI/N EPALI TULU
Gurgaon District 3 1 2 GurgaoD District 388 282 106 2. Gurgaon Tahsil 3 1 2
1 . Rewari Tahsil 10 9 1 Gurgaon (M.C.) 3 1 2 Rewari (M.C.) 7 6 1
2. Gurgaon Tahsil 39 30 9 OTHERS Gurgaon (M.e.) 34 27 7
3. BaUabgarh Tahsil 336 240 96 Gurgaon District 5,146 2,696 2,450 Faridabad Township (M.e.) 235 169 66
Faridabad (M.e.) 14 10 4 1. Rewari Tahsil 2 1 1
4. Palwa] Tahsil 2 2 Rewari (M.C.) 2 1 1
palwal (M.C.) 2 2 2. Gurgaon Tahsil 9 7 2 5. Nub Tahsil 1 1 Gurgaon (M.e.) 6 5 1
KODA /KORA 3. Ballabgarh Tah,sil 5,064 2,653 2,411
Faridabad Township(M.C.) 5,059 ~ 2,650 2,409
GurHaon District 9 5 3. Ba abgarh Tahsil 9 5
4 4 4. palwal Tahsil 71 35 36
Faridabad Township (M.C.) 9 5 4 Palwal (M.C.) 10 10
Notes :-1. M.C. means Municipal Committee. 2. .. means nil.
TABLE C-VII
RELIGION
Flyleaf
This table gives us distribution of total, rural and urban population by religion and is based on full count. This table gives us information upto tahsil level for total and rural areas and upto town level for urban areas. It, corresponds to Table C-VII of the 1961-Census and Table D-U of the 1951-Census.
2. The table gives data for 'males' and 'females' separately for each of the six numerically important religions of India, viz., Buddhism, Christianity, Hinduism, Islam, Jainism, and Sikhism. Figures of other religions which are numerically less important have been grouped together and shown in columns 18 and 19 i .. e. 'Other religions and persuasions'.
3. Columns 20 and 21 are self-explanatory and give the number of males and females, respectively, who did not report their religions at the 1971-Census. The number of such persons is 272 (145 males and 127 females).
4. It may be mentioned here that some persons returned their religions by sect names instead of the main, religion to which the sects belong. All such sects were recorded as reported without any mention about the religion to which they belong, at the time of enumeration. After the sorting of individual slips the population returning sllch sects was clubbed with the respective religion to which these sects belong.
133
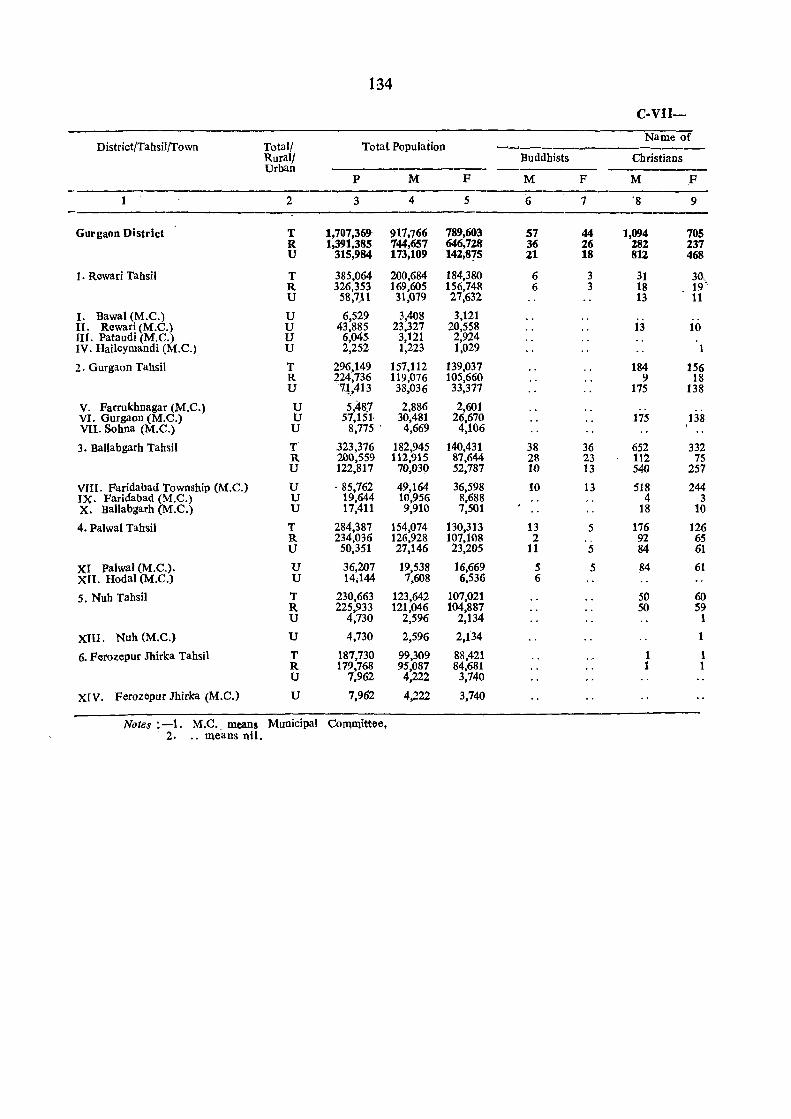
134
C-VII-
District/Tahsilfrown Total/ Total Population Name of --------___,\_-------
Rurall Buddhists Christians Urban
P M F M F M F
1 2 3 4 5 6 7 '8 9
Gurgaon District T 1,707,369 917,766 789,603 57 44 1,094 705 R 1,391,385 744,657 646,728 36 26 282 237 U 315,984 173,109 142,875 21 18 812 468
1. Rewari Tahsil T 385,064 200,684 184,380 6 3 31 30, R 326,353 169,605 156,748 6 3 18 19' U 58,7)1 31,079 27,632 13 11
I. Bawal (M.e.) U 6,529 3,408 3,121 II. Rewari (M.e.) u 43,885 23,327 20,558 13 10 III. Pataudi (M.e.) U 6,045 3,121 2,924 IV. Haileymandi (M.e.) u 2,252 1,223 1,029
2. Gurgaon Tahsil T 296,149 157,112 139,037 184 156 R 224,736 119,076 105,660 9 18 U '71,413 38,036 33,377 175 138
V. Farrukhnagar (M.e.) U 5,487 2,886 2,601 .. VI. Gurgaon (M.e.) tJ 57,151· 30,481 26,670 175 138 VII. Sohna (M.C.) U 8,775 . 4,669 4,106
3. BaUabgarh Tahsil T ,323,376 182,945 140,431 38 36 652 332 R 200,559 112,915 87,644 28 23 112 15 U 122,817 70,030 52,787 10 13 540 257
VIII. Faridabad Township (M.C.) U ·85,762 49,164 36,598 10 13 518 244 IX. Faridabad (M.e.) U 19,644 10,956 8,688 4 3 X. Ballabgarh (M.C.) U 17,411 9,910 7,501 18 10
4. Palwal Tahsil T 284,387 154,074 130,313 13 5 176 126 R 234,036 126,928 107,108 2 . ' 92 65 U 50,351 27,146 23,205 11 5 84 61
XI palwal (M.C.). U 36,207 19,538 16,669 5 5 84 61 XII. Hodal (M.C.) U 14,144 7,608 6,536 6
5. Nuh Tahsil T 230,663 123,642 107,021 50 60 R 225,933 121,046 104,887 50 59 U 4,730 2,596 2,134 1
XIII. Nuh (M.e.) U 4,730 2,596 2.134
6. Fetozepur lhirka Tahsil T 187,730 99,309 88,421 1 1 R 179,768 95,087 84,681 1 1 U 7,962 4,222 3,740
XlV. Ferozepur Jhirka (M.C.) U 7,962 4,222 3,740
Notes :-1. M.e. means Municipal Committee. 2. .. me'ans nil.
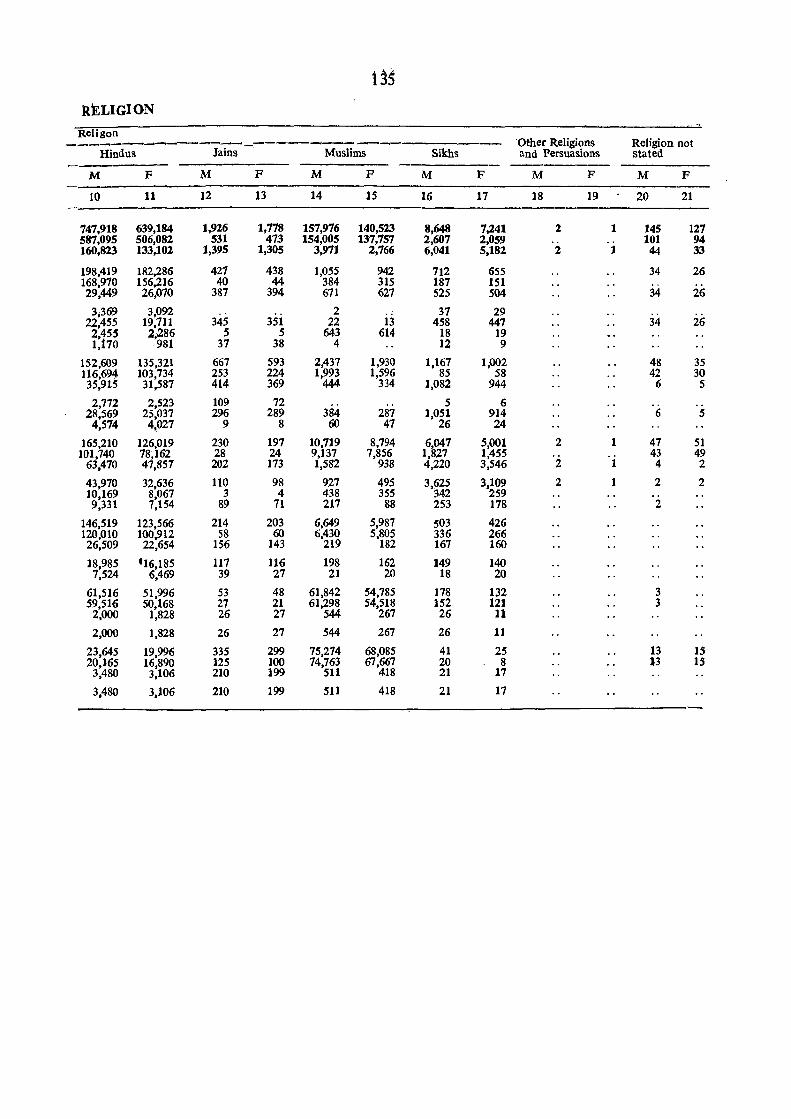
1M kELIGION
Rciigon 'Other Religions Religion not ------------------._-----.-----~
Hindus Jains Muslims Sikhs and Persuasions stated
M F M F M F M F M F M F
10 11 12 13 14 15 16 17 18 19 20 21
747,918 639,184 1,926 1,778 157,976 140,523 8,648 7,241 2 1 145 127 587,095 506,082 531 473 154,005 137,757 2,607 2,059 " 101 94 160,823 133,102 1,395 1,305 3,971 2,766 6,041 5,182 2 1 44 33
198,419 182,286 427 438 1,055 942 712 655 34 26 168,970 156,216 40 44 384 315 187 151 29,449 26,070 387 394 671 627 525 504 34 26
3;369 3,092 ,. 2 37 29 22,455 19,711 345 351 22 13 458 447 34 26
2,455 2,286 5 5 643 614 18 19 1,170 981 37 38 4 12 9
152,609 135,321 667 593 2,437 1,930 1,167 1,002 48 35 116,694 103,734 253 224 1,993 1,596 85 58 42 30 35,915 31,587 414 369 444 334 1,082 944 6 5
2,772 2,523 109 72 5 6 28,569 25,037 296 289 384 287 1,051 914 6 5
4,574 4,027 9 8 60 47 26 24
165,210 126,019 230 197 10,719 8,794 6,047 5,001 2 1 47 51 101,740 78,162 28 24 9,137 7,856 1,827 1,455 43 49
63,470 47,857 202 173 1,582 938 4,220 3,546 2 1 4 2
43,970 32,636 110 98 927 495 3,625 3,109 2 1 2 2 10,169 8,067 3 4 438 3S5 342 2S9 9,331 7,154 89 71 217 88 253 178 2
146,519 123,566 214 203 6,649 5,987 503 426 120,010 100,912 S8 60 6,430 5,805 336 266 26,509 22,654 IS6 143 219 182 167 160
18,985 '16,185 117 116 198 162 149 140 7,524 6,469 39 27 21 20 18 20
61,516 51,996 S3 48 61,842 54,785 178 132 3 59,516 50,168 27 21 61,298 54,518 152 121 3
2,000 1,828 26 27 544 267 26 11
2,000 1,828 26 27 544 267 26 11
23,645 19,996 335 299 75,274 68,085 41 25 13 IS 20,165 16,890 125 100 74,763 67,667 20 8 13 15
3,480 3,106 210 199 511 418 21 17
3,480 3,106 210 199 511 418 21 17

TABLE C-VIlI
SCHEDULED CASTES "AND SCHEDULED TRmES
PAItT-A : Classification by literacy and industrial category of workers aod nOD-workers according to ioaln activity among Scheduled Castes.
PART -B : Classification by literacy and industrial category of workers and Don-workers accordin~ to maio activity among Scheduled ~ribes.
Flyleaf
This t~ble, according to the pattern adopted for all States and Union Territories, has two parts : Part-A for Scheduled Castes; and Part-B for Scheduled Tribes. Since there are no Scheduled Tribes in Haryana State according to the Presidential Order, only Part-A of this table appears in the Report. This table gives us distribution of Scheduled Castes population for total, rural and urban areas on full count. Scheduled Castes population has been distributed by literacy, workers and non-workers and workers have been further distributed in broad industrial categories. This is a general table for Scheduled Castes and gives us data down to tahsil level. This table corresponds to Table C-VIlI of 1961-Census.
131
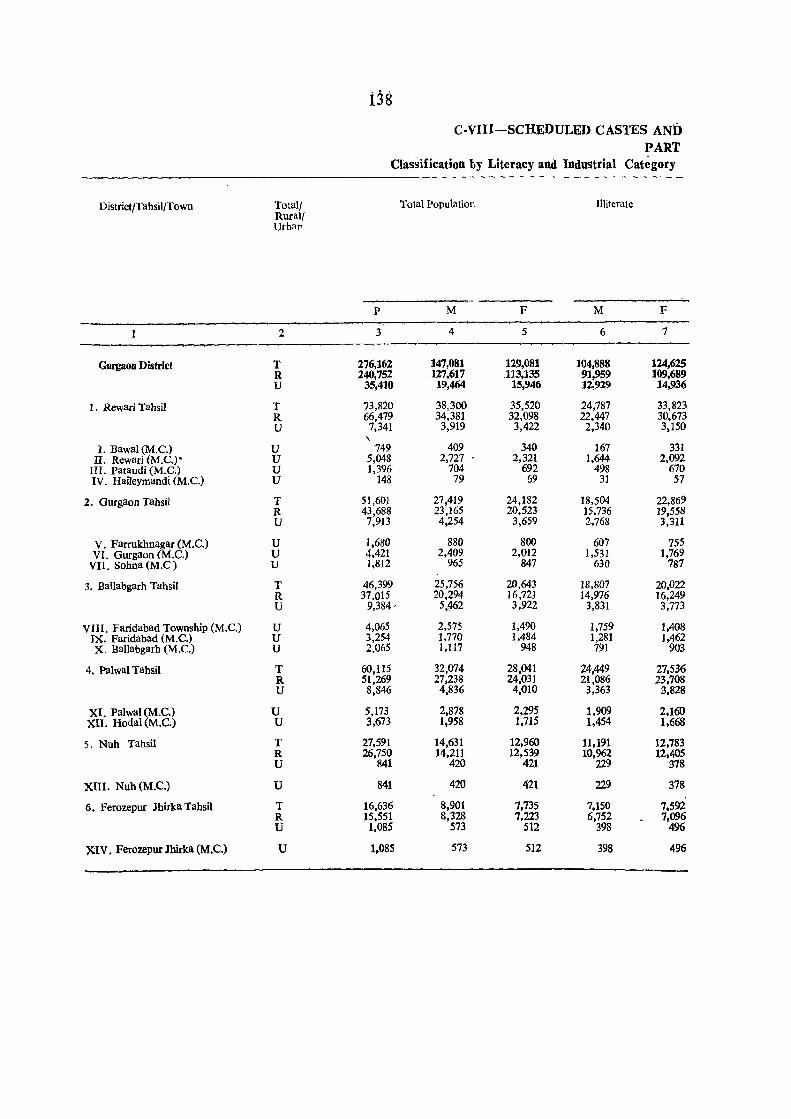
District/Tahsil/Town
Gurgaon District
1. Rewari Tahsil
I. Bawal (M.e.) II. Rewari (M.e.)·
III. Pataudi (M.e.) IV. Haileymandi (M.e.)
2. Gurgaon Tahsil
V. Farrukhnagar (M.e.) VI. Gurgaon (M.e.)
VIr. Sohna (M.e )
3. Ballabgarh Tahsil
VIII. Faridabad Township (M.e.) IX. Faridabad (M.e.) X. Ballabgarh (M.e.)
4. Paiwal Tahsil
XI. Palwal (M.e.) XII. Hodal (M.e.)
S. Nuh Tahsil
XIII. Nub (M.e.)
6. Ferozepur Jhirka Tahsil
XIV. Ferozepur lhirka (M.e.)
TotalJ Rural/ Urban
2
T R U
T R U
u U u U
T R U
U U U
T R U
U U U
T R U
u U
T R U
U
T R U
u
C-VIII-SCHEDULED CASTES AND PART
Classification by Literacy and Industrial Category
Total Population Illiterate
--.-.-'-0
P M F M F
3 4 5 6 7
276,162 147,081 129,081 104,888 124,625 240,752 127,617 113,135 91,959 109,689
35,410 19,464 15,946 12,929 14,936
73,820 38,300 35,520 24,787 33,823 66,479 34,381 32,098 22,447 30,673 7,341 3,919 3,422 2,340 3,150
" 749 409 340 167 331 5,048 2,727 2,321 1,644 2,092 1,396 704 692 498 670
148 79 69 31 57
51,601 27,419 24,182 18,504 22,869 43,688 23,165 20,523 15,736 19,558 7,913 4,254 3,659 2,768 3,311
1,680 880 800 607 755 4,421 2,409 2,012 1,531 1,769 1,812 965 847 630 787
46,399 25,756 20,643 18,807 20,022 37.015 20,294 16,721 14,976 16,249
9,384 ' 5,(J62 3,922 3,831 3,773
4,065 2,575 1,490 1,759 1,408 3,254 1,770 1,484 1,281 1,462 2,065 1,117 948 791 903
60,115 32,074 28,041 24,449 27,536 51,269 27,238 24,031 21,086 23,708 8,846 4,836 4,010 3,363 3.828
5,173 2,878 2,295 1,909 2,160 3,673 1,958 1,715 1,454 1,668
27,591 14,631 12,960 11,191 12,783 26,750 14,211 12,539 10,962 12,405
841 420 421 229 378
841 420 421 229 378
16,636 8,901 7,735 7,150 7,592 15,551 8,328 7,223 6,752 7,096 1,085 573 512 398 496
1,085 573 512 398 496
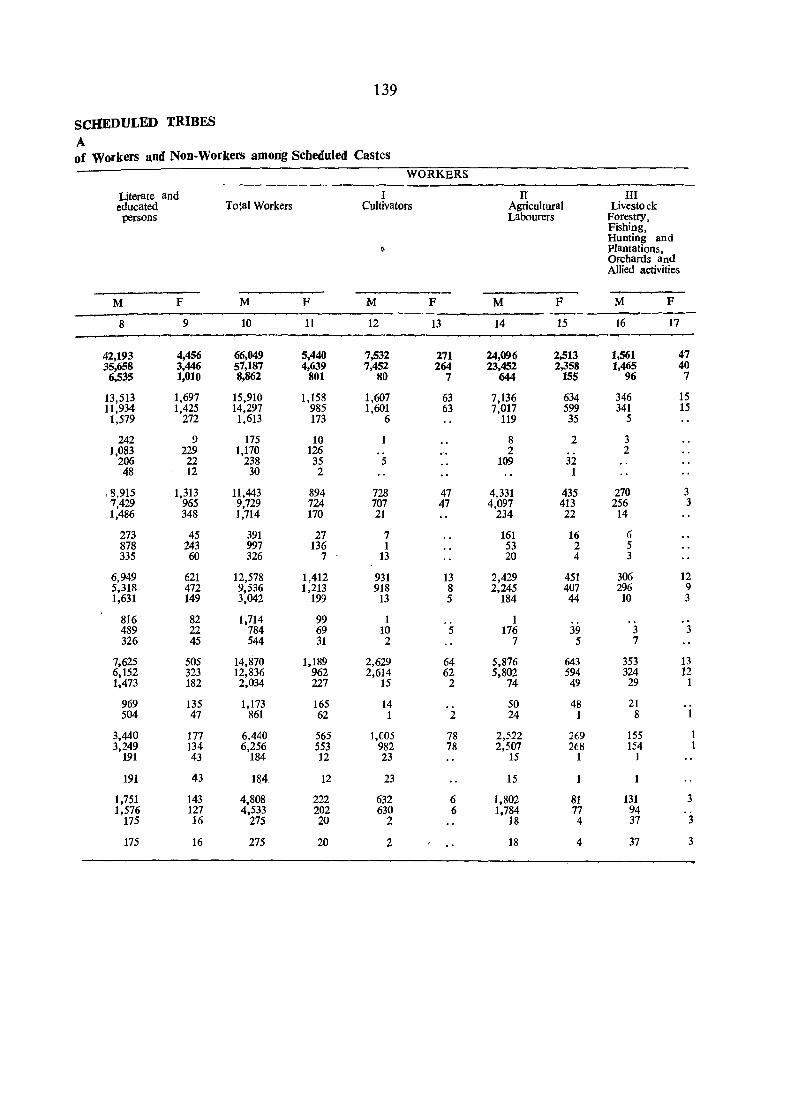
139
SCU:EDULED TRIBES A of Workers and Non-Workers among Scheduled Castes
WORKERS -------------------Literate and I II III educated Total Workers Cultivators Agricultural livestock persons Labourers Forestry,
Fishing, Hunting and Plantations, Orchards and Allied activities
M F M F M F M F M F .,_---_
8 9 10 11 12 13 14 15 16 17
42,193 4,456 66,049 5,440 7,532 271 24,096 2,513 1,561 47 35,658 3,446 57,187 4,639 7,452 264 23,452 2,358 1,465 40 6.535 1,010 8,862 801 80 7 644 155 96 7
13,513 1,697 15,910 1,158 1,607 63 7,136 634 346 15 11,934 1,425 14,297 985 1,601 63 7,017 599 341 15 1,579 272 1,613 173 6 119 35 5
242 9 175 10 8 2 3 1,083 229 1,170 126 .. 2 2
206 22 238 35 5 109 32 48 12 30 2 1
18,915 1,313 11,443 894 728 47 4,331 435 270 3 7,429 965 9,729 724 707 47 4,097 413 256 3 1,486 348 1,714 170 21 234 22 14
273 45 391 27 7 161 16 6 878 243 997 136 1 53 2 5 335 60 326 7 13 20 4 3
6,949 621 12,578 1,412 931 13 2,429 451 306 12 5,318 472 9,536 1,213 918 8 2,245 407 296 9 1,631 149 3,042 199 13 5 184 44 10 3
816 82 1,714 99 1 1 489 22 784 69 10 5 176 39 3 3 326 45 544 31 2 7 5 7
7,625 505 14,870 1,189 2,629 64 5,876 643 353 13 6,152 323 12,836 962 2,614 62 5,802 594 324 12 1,473 182 2,034 227 15 2 74 49 29 1
969 135 1,173 165 14 50 48 21 504 47 861 62 1 2 24 1 8 1
3,440 177 6,440 565 1,005 78 2,522 269 155 3,249 134 6,256 553 982 78 2,507 268 154
191 43 184 12 23 15 1 1
191 43 184 12 23 15
1,751 143 4,808 222 632 6 1,802 81 131 3 1,576 127 4,533 202 630 6 1,784 77 94
175 16 275 20 2 18 4 37 3
175 16 275 20 2 18 4 37 3
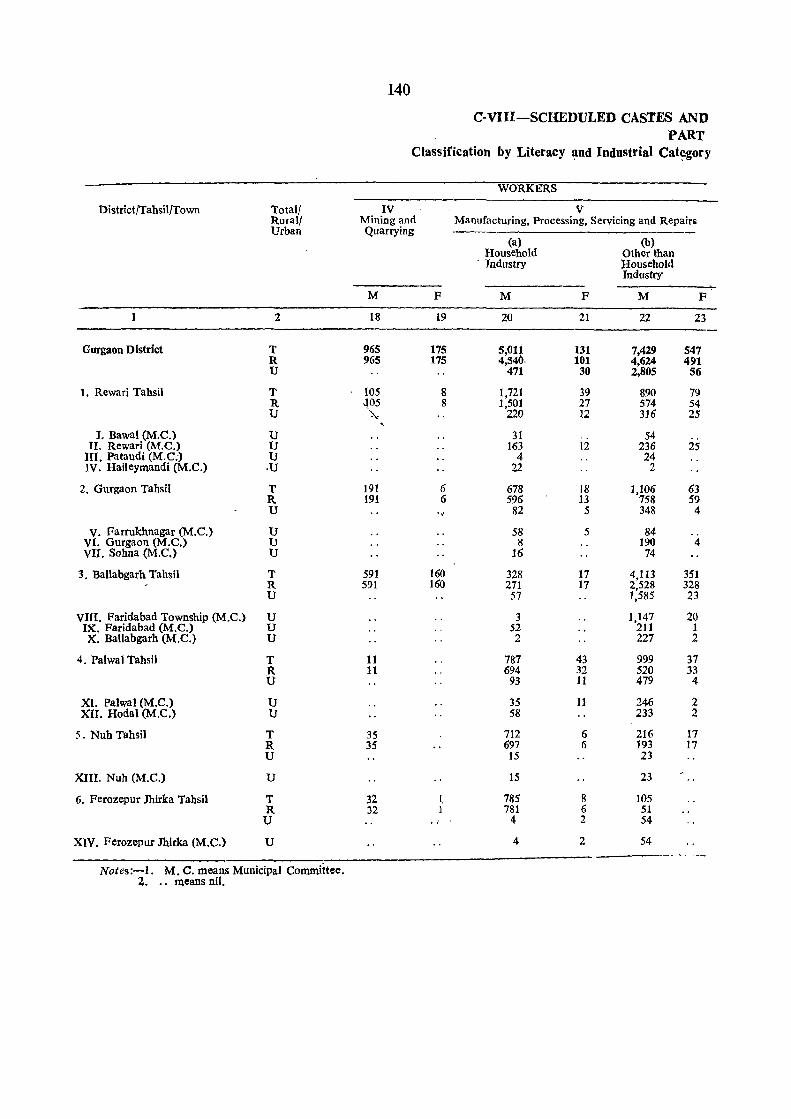
140
C-VIII-SCHEDULED CASTES AND PART
Classification by Literacy ~nd Industrial Cat~gory
WORKERS
Districtrrahsilrrown Totalj IV V 'Rural! Mining and Manufacturing, Processing, Servicing and Repair, Urban Quarrying
(a) (b) Household Other than
, Industry lIousehold Industry ------
M F M F M F
1 2 18 19 20 21 22 23
Gurgaon District T 965 175 5,OIA 131 7,429 547 R 965 175 4,54 . 101 4,624 491 U 471 30 2,805 56
t. Rewari Tahsil T 105 8 1,721 39 890 79 R -l05 8 1,501 27 574 54 U ':-." 220 12 316 25
" I. BawaJ (M.C.) U 31 .. 54 II. Rewari (M.C.) U 163 12 236 25
III. Pataudi (M.e;) U 4 24 IV. Haileymandi (M.C.) .U 22 2
2. Gurgaon Tahsil T 191 6 678 18 1,106 63 R 191 6 596 13 758 59 U ',' 82 5 348 4
V. Farrukhnagar (M.C.) U 58 5 84 .. VI. Gurgaon (M.C.) U 8 190 4 VII. Sohna (M.e.) u 16 74
3. BaUabgarh Tahsil T 591 160 328 17 4,113 351 R 591 160 271 17 2,528 328 U 57 1,585 23
vm. Faridabad Township (M.C.) U 3 1,147 20 IX. Faridabad (M.C.) U 52 211 1 X. Batlabgarh (M.C.) U 2 227 2
4. Palwal Tahsil T 11 787 43 999 37 R 11 694 32 520 33 U 93 11 479 4
Xl. Palwal (M.C.) U 35 11 246 2 XII. Hodal (M.C.) U 58 233 2
5. Nub Tahsil T 35 712 6 216 17 R 35 697 6 193 17 U 15 23
XIII. Nuh (M.C.) U 15 23
6. Ferozepur Jhirka Tahsil T 32 ~ 785 8 105 R 32 1 781 6 51 U 4 2 54
XIV. Ferozepur Jhirka (M.C.) U 4 2 54
Notes:-l. M. C. means Municipal Commiitee. 2. .. means nil.
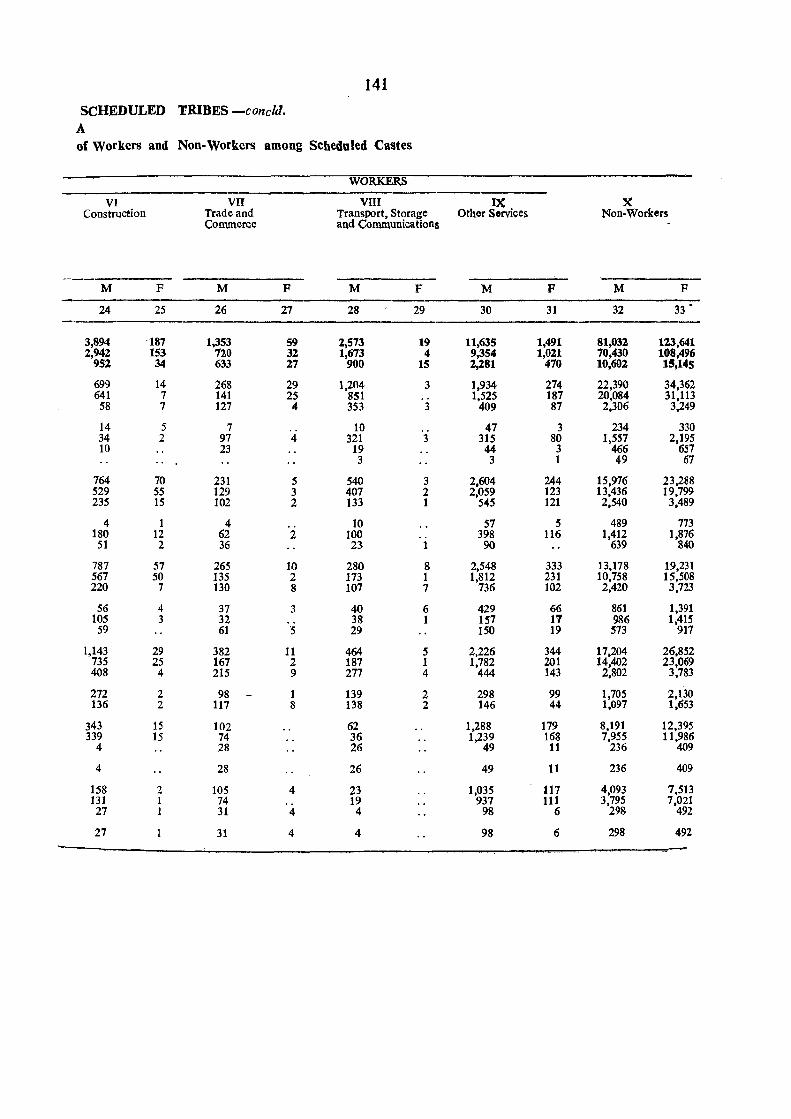
141
SCHEDULED TRIBES -cone/d. A of Workers and Non- Workers among Scheduled Castes
VI Construction
M
24
3,894 2,942
952
699 641 58
14 34 10
764 529 235
4 180
51
787 567 220
56 105
59
1,143 735 408
272 136
343 339
4
4
158 131 27
27
F
25
187 153 34
14 7 7
5 2
70 55 15
1 12 2
57 50 7
4 3
29 25
4
2 2
15 15
2 1 1
VII Trade and Commerce
M
26
1,353 720 633
268 141 127
7 97 23
231 129 102
4 62 36
265 135 130
37 32 61
382 167 215
98 117
102 74 28
28
105 74 31
31
F
27
59 32 27
29 25 4
4
5 3 2
2
10 2 8
3
5
11 2 9
1 8
4 .. 4
4
WORKERS
VIII IX Transport, Storage Other Sorvices and Communications
M F M
28 29 30
2,573 19 11,635 1,673 4 9,354
900 15 2,281
1,204 3 1,934 851 1,525 353 3 409
10 47 321 3 315 19 44 3 3
540 3 2,604 407 2 2,059 133 1 5.5
10 57 100 398 23 1 90
280 8 2,548 173 1 1,812 107 7 736
40 6 429 38 1 157 29 150
464 5 2,226 187 1 1,782 277 4 444
139 2 298 138 2 146
62 1,288 36 1,239 26 49
26 49
23 1,035 19 937 4 98
4 98
F
31
1,491 1,021
470
274 187 87
3 80 3 1
244 123 121
5 116
333 231 102
66 11 19
344 201 143
99 44
179 168 11
11
t17 111
6
6
X Non-Workers
M F
32 33 •
81,031 123,641 70,430 108,496 10,602 15,145
22,390 34,362 20,084 31,113 2,306 3,249
234 330 1,557 2,195
466 657 49 67
15,976 23,288 13,436 19,799 2,540 3,489
489 773 1,412 1,876
639 840
13,178 19,231 10,758 15,508 2,420 3,723
861 1,391 986 1,415 573 917
17,204 26,852 14,402 23,069 2,802 3,783
1,705 2,130 1,097 1,653
8,191 12,395 7,955 11,986
236 409
236 409
4,093 7,513 3,795
298 7,021
492
298 492

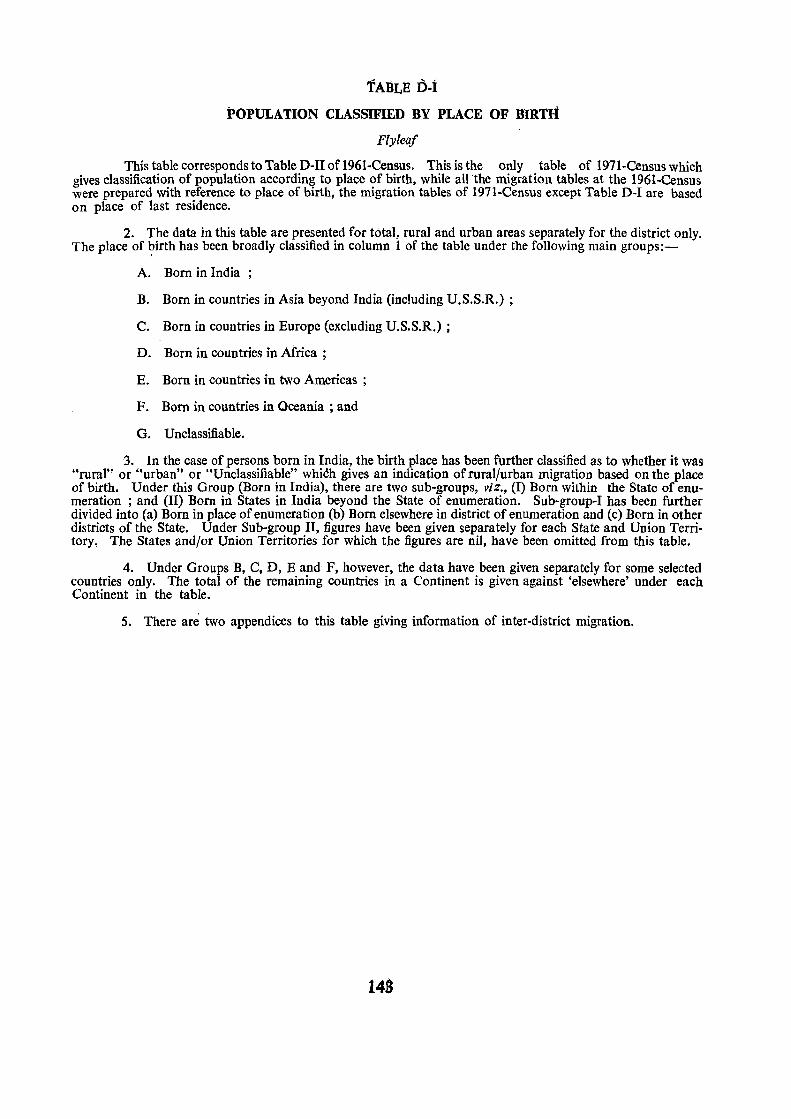
TABLE D-i
POPULATION CLASSIFIED BY PLACE OF BIRTH
Flyleaf
This table corresponds to Table D-II of 1961-Census. This is the only table of 1971-Census which gives classification of population according to place of birth, while all the migration tables at the 1961-Census were prepared with reference to place of birth, the migration tables of 1971-Census except Table D-I are based on place of last residence.
2. The data in this table are presented for total, rural and urban areas separately for the district only. The place of l?irth has been broadly classified in column 1 of the table under the following main groups:-
A. Born in India ;
B. Born in countries in Asia beyond India (including U.S.S.R.) ;
C. Born in countries in Europe (excluding U.S.S.R.) ;
D. Born in countries in Africa;
E. Born in countries in two Americas ;
F. Born in countries in Oceania ; and
G. Unclassifiable.
3. In the case of persons born in India, the birth place has been further classified as to whether it was "rural" or "urban" or "Unclassifiable" which gives an indication of rural/urban migration based on the place of birth. Under this Group (Born in India), there are two sub-groups, viz., (I) Born within the State of enumeration ; and (II) Born in States in India beyond the State of enumeration. Sub-group-I has been further divided into (a) Born in place of enumeration (b) Born elsewhere in district of enumeration and (c) Born in other districts of the State. Under Sub-group II, figures have been given separately for each State and Union Territory, The States and/or Union Territories for which the figures are nil, have been omitted from this table.
4. Under Groups B, C, D, E and F, however, the data have been given separately for some selected countries only. The total of the remaining countries in a Continent is given against 'elsewhere' under each Continent in the table.
5. There are two appendices to this table giving information of inter-district migration.
143

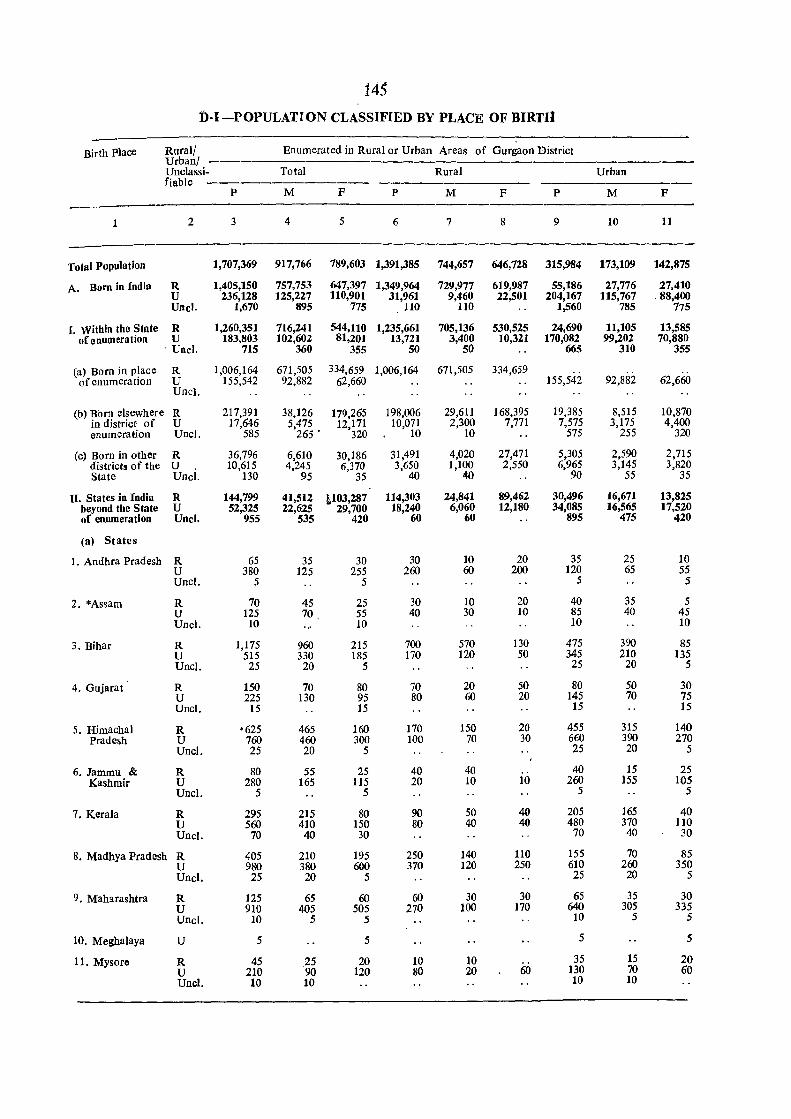
145 f)-I-POPULATION CLASSIFIED BY PLACE OF BIRTH
Birth Place Rural/ UrbanI
Enumerated in Rural or Urban Areas of Gurgaon District
Unclassi- Total Rural Urban fiable
P M F P M F P M F
1 2 3 4 5 6 7 8 9 10 11
Total Population 1,707,369 917,766 789,603 1,391,385 744,657 646,728 315,984 173,109 142,875
A. Born in India R 1,405,150 757,753 647,397 1,349,964 729,977 619,987 55,186 27,776 27,410 U 236,128 125,227 110,901 31,961 9,460 22,501 204,167 115,767 .88,400 UncI. 1,670 895 775 110 110 1,560 785 775
I. Within the State R 1,260,351 716,241 544,110 1,235,661 705,136 530,525 24,690 11,105 13,585 of enumeration U 183,803 102,602 81,201 13,721 3,400 10,321 170,082 99,202 70,880
. UncI. 715 360 355 50 50 665 310 355
Ca) Born in p!ace R 1,006,164 671,505 334,659 1,006,164 671,505 334,659 of enumeratIOn U 155,542 92,882 62,660 155,542 92,882 62,660
UncI.
(b) Born elsewhere R 217,391 38,126 179,265 198,006 29,611 168,395 19,385 8,515 10,870 in district of U 17,646 5,475 12,171 10,071 2,300 7,771 7,575 3,175 4,400 enumeration UncI. 585 265 . 320 10 10 575 255 320
(c) Born in other R 36,796 6,610 30,186 31,491 4,020 27,471 5,305 2,590 2,715 districts of the U 10,615 4,245 6,370 3,650 1,100 2,550 6,965 3,145 3,820 State UncI. 130 95 35 40 40 90 55 35
n. States in India R 144,799 41,512 LI03,287 114,303 24,841 89,462 30,496 16,671 13,825 beyond the State U 52,325 22,625 29,700 18,240 6,060 12,180 34,085 16,565 17,520 of enumeration Unci. 955 535 420 60 60 895 475 420
(a) States
1. Andhra Pradesh R 65 35 30 30 10 20 35 25 10 U 380 125 255 260 60 200 120 65 55 UncI. 5 5 5 5
2. *Assam R 70 45 25 30 10 20 40 35 5 U 125 70 55 40 30 10 85 40 45 UncI. 10 10 10 10
3. Bihar R 1,175 960 215 700 570 130 475 390 85 U 515 330 185 170 120 50 345 210 135 UncI. 25 20 5 25 20 5
4. Gujarat R 150 70 80 70 20 50 80 50 30 U 225 130 95 80 60 20 145 70 75 UncI. 15 15 15 15
5. Himachal R '625 465 160 170 150 20 455 315 140 Pradesh U 760 460 300 100 70 30 660 390 270
UncI. 25 20 5 25 20 5
6. Jammu & R 80 55 25 40 40 40 15 25 Kashmir U 280 165 115 20 10 10 260 155 105
UncI. 5 5 5 5
7. Kerala R 295 215 80 90 50 40 205 165 40 U 560 410 150 80 40 40 480 370 110 UncI. 70 40 30 70 40 30
8. Madhya Pradesh R 405 210 195 250 140 110 155 70 85 U 980 380 600 370 120 250 610 260 350 Unel. 25 20 5 25 20 5
9. Maharashtra R 125 65 60 60 30 30 65 35 30 U 910 405 505 270 100 170 640 305 335 UncI. 10 5 5 10 5 5
10. Meghalaya U 5 5 5 5
11. Mysorc R 45 25 20 10 10 35 15 20 U 210 90 120 80 20 60 130 70 60 UncI. 10 10 10 10
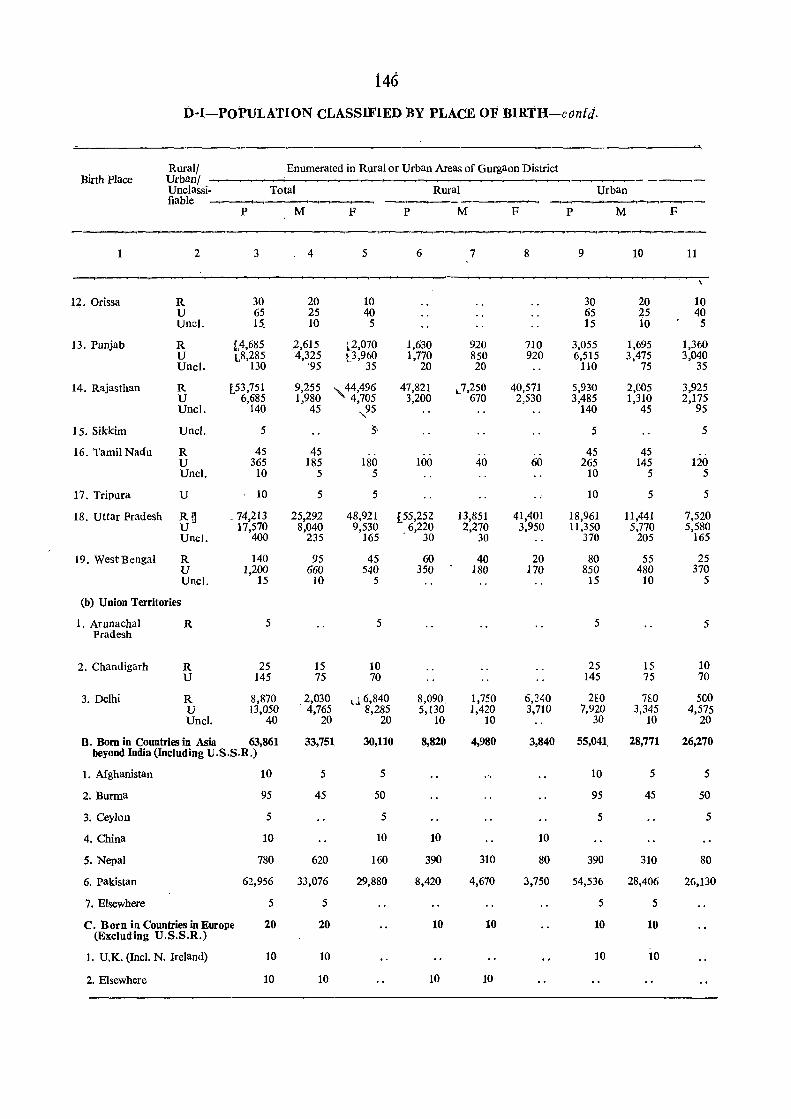
146
D-I-POPULATION CLASSIFIED BY PLACE OF lnRTH-confd.
Birth Place Rural/ Enumerated in Ruralor Urban Areas of Gurgaon District Urbani ----Unclassi- Total Rural Urban fiable ~~-- ------- ........._....._-
P M F P M F P M F
2 3 4 5 6 7 8 9 10 11
12. Orissa R 30 20 10 30 20 10 U 65 25 40 65 25 40 UncI. 15_ 10 5 15 10 5
13. Punjab R ~4,685 ),615 ~2,070 1,630 920 710 3,055 1,695 1,360 U L8,285 4,325 t3 ,960 1,770 850 920 6,515 3,475 3,040 UncI. 130 '9,5 35 20 20 110 75 35
14. Rajasthan R l53,751 9,255 ,44,496 47,821 L7,250 40,571 5,930 2,005 3,925 U 6,685 1,980 4,705 3,200 670 2,530 3,485 1,310 2,175 UncI. 140 45 ,,95 140 45 95
15. Sikkim UncI. 5 5, 5 5
16. Tamil Nadu R 45 45 .. .. 45 45 U 365 185 180 100 40 60 265 145 120 Uncl. 10 5 5 10 5 5
17. Tripura U 10 5 5 10 5 5
18. Uttar Pradesh RU . 74,213 25,292 48,921 (55,252 13,851 41,401 18,961 11,441 7,520 U 17,570 8,040 9,530 6,220 2,270 3,950 11 ,350 5,770 5,580 UncI. 400 235 165 . 30 30 370 205 165
19. WestBengal R 140 95 45 60 40 20 80 55 25 U 1,200 660 540 350 180 170 850 480 370 UncI. 15 10 5 15 10 5
(b) Union Territories
1. Arunachal R 5 5 5 5 Pradesh
2. Chandigarh R 25 15 10 25 15 10 U 145 75 70 145 75 70
3. Delhi R 8,870 2,030 d6,840 8,090; 1,750 6,3':;0 2EO no 500 U 13,050 4,765 8,285 5,130 1,420 3,710 7,920 3,345 4,575 UncI. 40 20 20 10 10 30 10 20
B. Bom in Countries in Asia 63,861 33,751 30,110 8,820 4,980 3,840 55,041, 28,771 26,270 beyond India (Including U.S.S.R.)
1. Afghanistan 10 5 5 10 5 5
2. Burma 95 45 50 95 45 50
3: Ceylon 5 5 5 5
4. China 10 10 10 10
5. Nepal 780 620 160 390 310 80 390 310 80
6. pakistan 62,956 33,076 29,880 8,420 4,670 3,750 54,536 28,406 26,130
7. Elsewhere 5 5 5 5
C. Born in Countries in Europe 20 20 10 10 10 10 (Excluding U.S.S.R.)
1. U.K. (Incl. N. Ireland) 10 10 10 10
2. Elsewhere 10 10 10 10
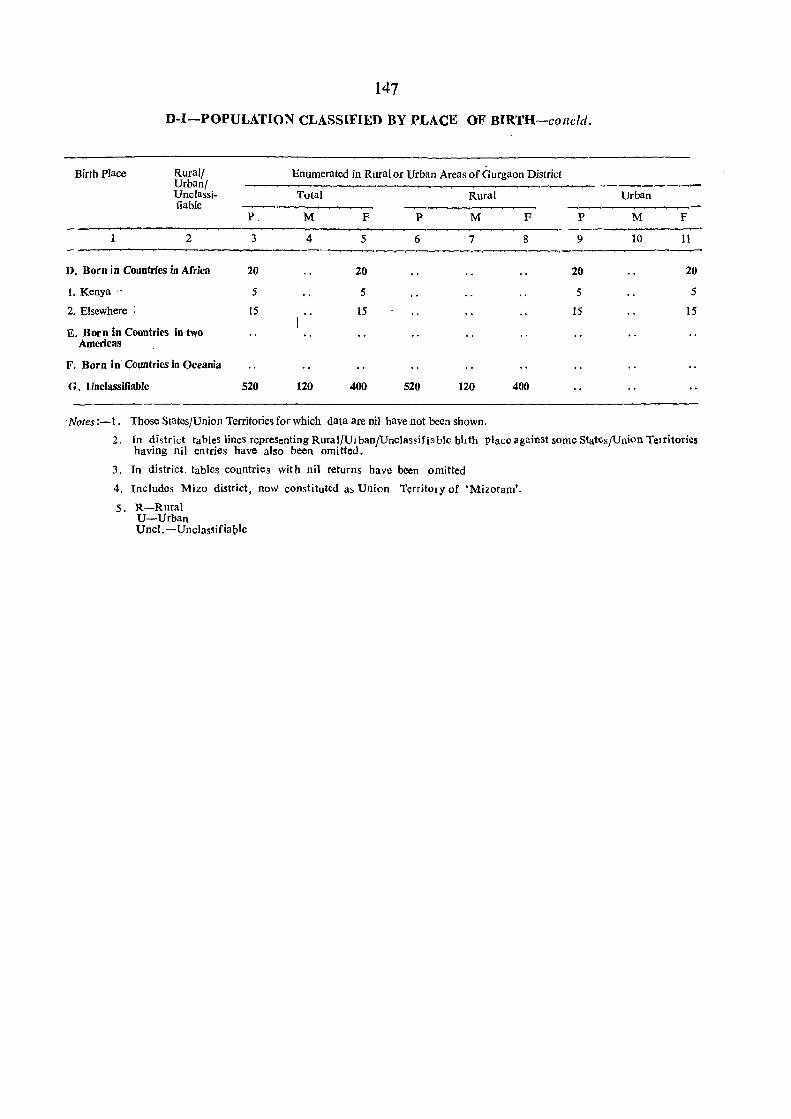
147
D-I-POPULATION CLASSIFIED BY PLACE OF BIRTH-cofield.
Birth Place Ruralf Enumerated in Rural or Urban Areas of Gurgaon District UrbanI ---------"--Unclassi- Total Rural Urban fiable
P M F P M F P M F
2 3 4 5 6 7 8 9 10 11
D. Born in Countries in Africa 20 20 20 20
I. Kenya -, 5 5 5 5
2. Elsewhere : 15 15 15 15
E. Born in Countries in two Americas
F. Born in'Countriesin Oceania
G. Unclassifiable 520 120 400 520 120 400
. Notes :-1. Those States/Union Territories for which data are nil have not been shown.
2. In district tables lines representing Rural/Urban/Ullclassifiable birth place against some States/Union Territories having nil entries have also been omitted.
3. In district. tables countries with nil returns have been omitted
4. Includes Mizo district, noW constituted as Union Territory of 'Mizoram'.
5. R-Rural U-Urban UncI.-Unclassifiaple
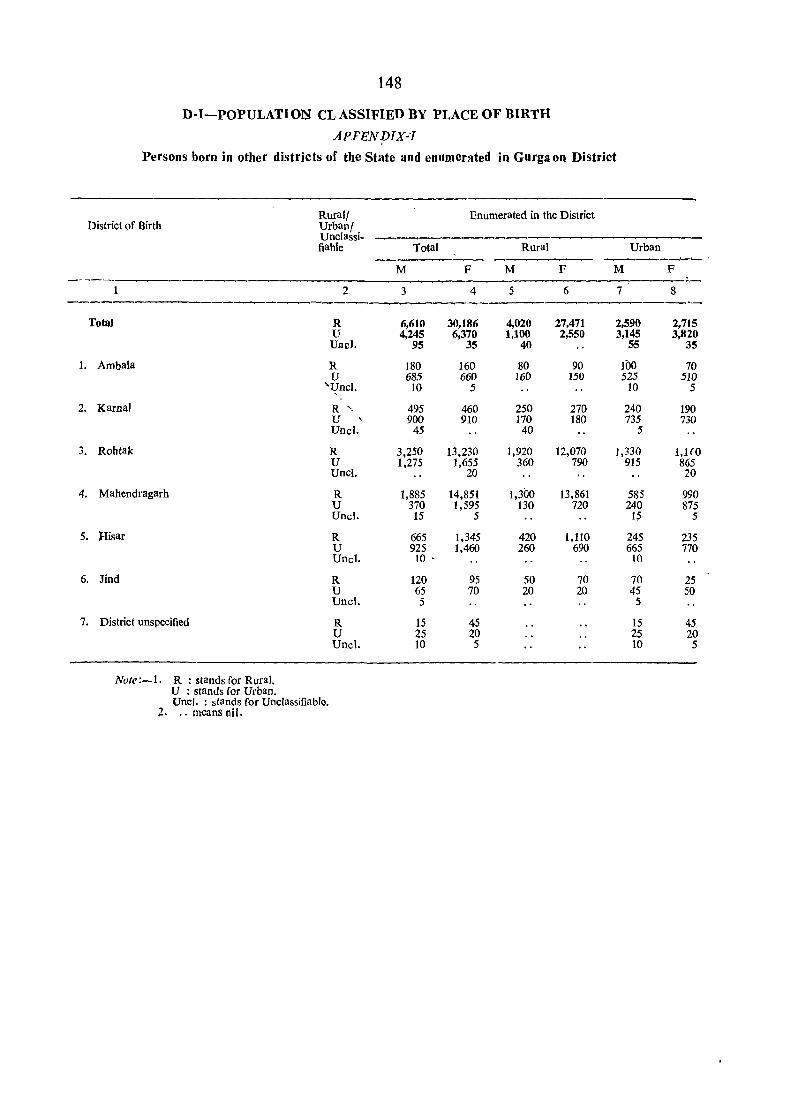
148
D-I-POPULATION CL ASSIFIED BY PLACE OF 'BIRTH
APFENDIX~I
Persons born in other districts of the State and enumerated in Gurga on District
Rural! Enumerated in the District District of Birth Urban!
Unclassi-fiable Total Rural Urban
M F M F M ~~~
1 2 3 4 5 6 7 ~-~--------. ---
Totlll R 6,610 30,186 4,020 27,471 2,590 U 4,245 6,370 1,100 2,550 3,145 UncI. 95 35 40 55
1. Ambala R 180 160 80 90 100 U 685 660 160 150 525
'Unci. 10 5 10
2. Kamal R ''-. 495 460 250 270 240 U 900 910 170 180 735 Unel. 45 40 5
3. Rohtak R 3,250 13,230 1,920 12,070 1,330 U 1,275 1,655 360 790 915 Unci. 20
4. Mahendragarh R 1,885 14,851 1,300 13,861 585 U 370 1,595 130 720 240 Unci. 15 5 15
5. lIisar R 665 1,345 420 1,110 245 U 925 1,460 260 690 665 Unel. 10 • 10
6. Jind R 120 95 50 70 70 U 65 70 20 20 45 UncI. 5 5
7. District unspecified R 15 45 15 U 25 20 25 Unci. 10 5 10
Note:-l. R : stands for Rural. U : stands for Urban. UncI. : stands for Unclassifiable.
2. ., meanS nil.
F ~-
8
2,7J5 3,820
35
70 510
5
190 730
1,1 (0 865 20
990 875
5
235 770
25 50
45 20 5
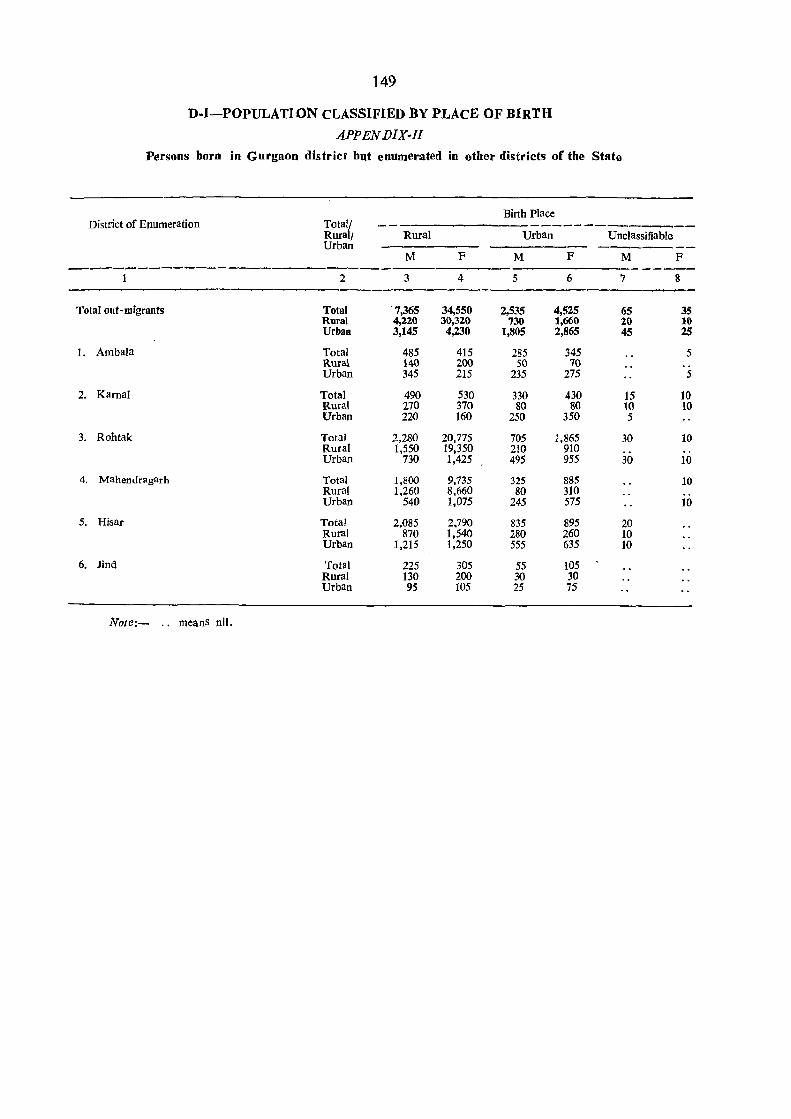
149
D-I-POPULATION CLASSIFIED BY PLAcE OF BIRTH
APPEN DIX-ll
Persons born in GurglloD district but enumerated in other districts of the State
Birth Place District of Enumeration Totalj
Rural/ Rural Urban U nclassifiable Urban
M F M F M F ------------- ----
2 3 4 5 6 7 8
Total out-migrants Total '7,365 34,550 2.535 4,525 65 35 Rural 4,220 30,320 730 1,660 20 10 Urban 3,145 4,230 1,805 2,865 45 25
1. Ambala Total 485 415 285 345 5 Rural 140 200 SO 70 Urban 345 215 235 275 5
2. Karnal Total 490 530 330 430 15 10 Rural 270 370 80 80 10 10 Urban 220 160 250 350 5
3. Rohtak Total 2,280 20,775 705 1,865 30 10 Rural 1,550 19,350 210 910 .. Urban 730 1,425 495 955 30 10
4. Mahendragarh Total 1,800 9,735 325 885 10 Rural 1,260 8,660 80 310 .. Urban 540 1,075 245 575 10
5. Hisar Total 2,085 2,790 835 895 20 Rural 870 1,540 280 260 10 Urban 1,215 1,250 555 635 10
6. Jind Total 225 305 55 105 Rural 130 200 30 30 Urban 95 105 25 75
Note:- .. meanS nil.

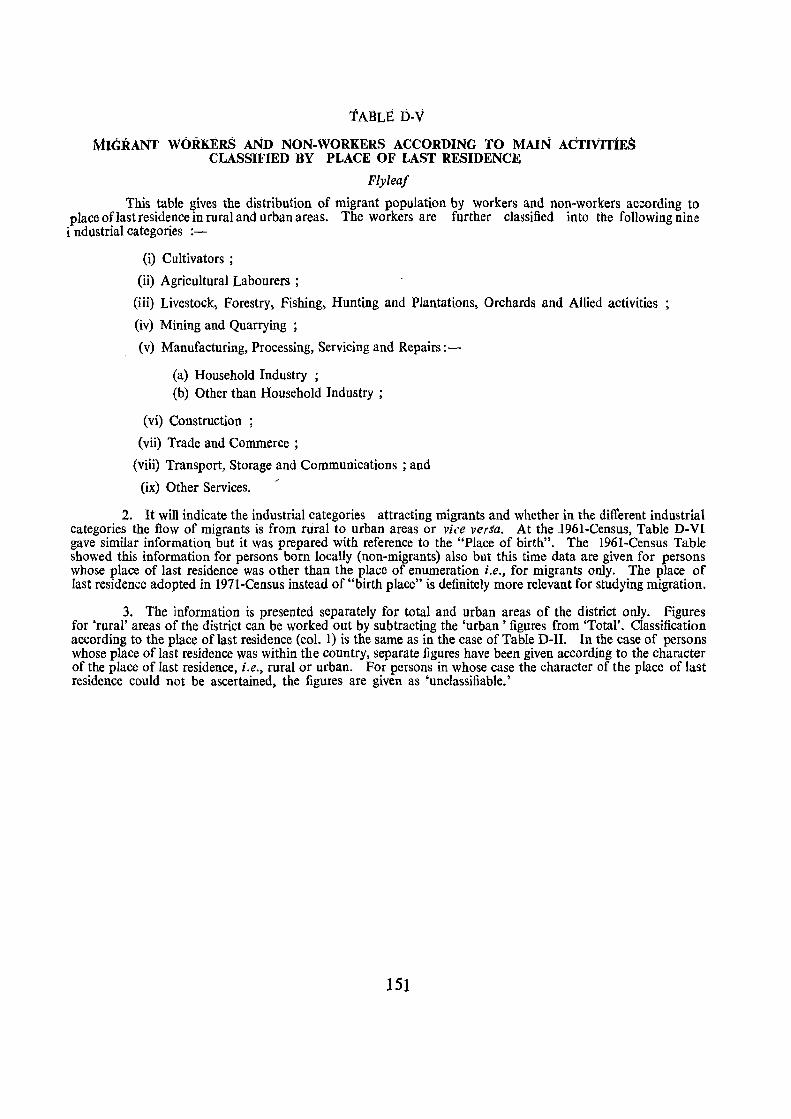
tABLI~ D-V
MIGRANT WORKERS AND NON-WORKERS ACCORDING TO MAIN ACTIVITiES CLASSIFIED BY PLACE OF LAST RESIDENCE
Flyleaf
This table gives the distribution of migrant population by workers and non-workers according to place oflast residence in ruraland urban areas. The workers are further classified into the following nine i ndllstrial categories :-
(i) Cultivators ;
(ii) Agricultural Labourers ;
(iii) Livestock, Forestry, Fishing, Hunting and Plantations, Orchards and Allied activities
(iv) Mining and Quarrying;
(v) Manufacturing, Processing, Servicing and Repairs:-
(a) Household Industry ; (b) Other than Household Industry;
(vi) Construction ;
(vii) Trade and Commerce;
(viii) Transport, Storage and Communications ; and
(ix) Other Services.
2. It will indicate the industrial categories attracting migrants and whether in the different industrial categories the flow of migrants is from rural to urban areas or vice versa. At the 1961-Census, Table D-VI gave similar information but it was prepared with reference to the "Place of birth". The 1961-Census Table showed this information for persons born locally (non-migrants) also but this time data are given for persons whose place of last residence was other than the place of enumeration i.e., for migrants only. The place of last residence adopted in 1971-Census instead of "birth place" is definitely more relevant for studying migration.
3. The information is presented separately for total and urban areas of the district only. Figures for 'rural' areas of the district can be worked out by subtracting the 'urban' figures from 'Total'. Classification according to the place of last residence (col. 1) is the same as in the case of Table D-II. In the case of persons whose place of last residence was within the country, separate figures have been given according to the character of the place of last residence, i.e., rural or urban. For persons in whose case the character of the place of last residence could not be ascertained, the figures are given as 'unclassifiable.'
151
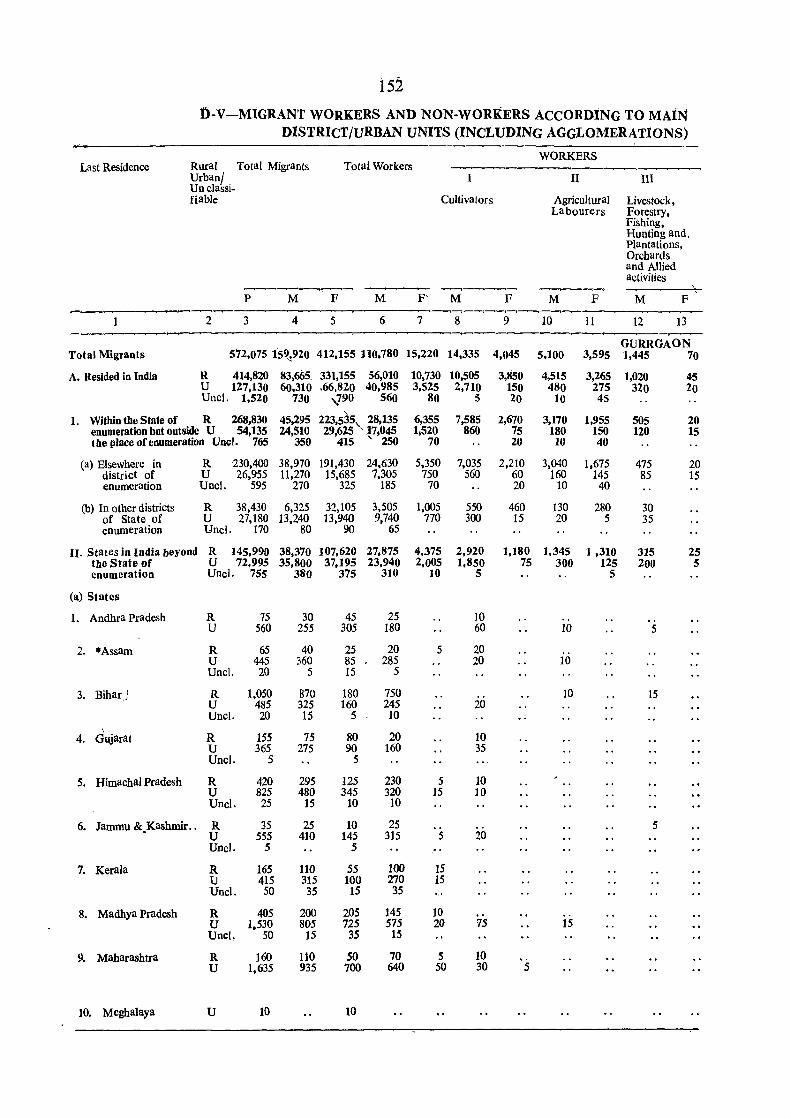
i 52 f)·V-MIGRANT WORKERS AND NON-WORKERS ACCORDING TO MAiN
DISTRICT/URBAN UNITS (INCLUDING AGGLOMERATIONS)
WORKERS Last Residence Rural Total Migrants Total Workers
UrbanI I II III Unclassi-nable Cultivators Agricultural Livestock,
Labourers Forestry, Fishing, Hunting and. Plantations, Orchards and Allied activities
~-
P M F M F' M F M F M F ~~~
1 2 3 4 5 6 7 8 9 10 11 12 13
Total Migrants 572,075 15~!920 412,155 110,780 15,220 14,335 4,045 GURRGAON
5,100 3,595 1,445 70
A. Resided in India R 414,820 83,665. 331,155 56,010 10,730 10,505 3,850 4,515 3,265 1,020 45 U 127,130 60,310 .66,820 40,985 3,525 2,710 150 480 275 320 20 Unci. 1,520 730 '190 560 80 5 20 10 45
" 6,355 I. Within the State of R 268,830 45,295 223,535, 28,135 7,585 2,670 3,170 1,955 505 20 enumeration but outside U 54,135 24,510 29,625 17,045 1.520 860 75 180 150 120 15 the place of enumeration Unci. 765 350 415 \. 250 70 20 10 40
(a) Elsewhere in R 230,400 38,970 191,430 24,630 5,350 7,035 2,210 3,040 1,675 475 20 district of U 26,955 11,270 15,685 7,305 750 560 60 160 145 85 15 enumeration Unci. 595 270 325 185 70 20 10 40
(b) In other districts R 38,430 6,325 32,105 3,505 1,005 550 460 130 280 30 of State of U 27,180 13,240 13,940 9,740 770 300 15 20 5 35 enumeration Unci. 170 80 90 65
II. States in India beyond R 145,990 38,370 107,620 27,875 4,375 2,920 1,180 1,345 1,310 315 25 the State of U 72,995 35,800 37,195 23,940 2,005 1,850 75 300 125 200 5 enumeration Unci. 755 380 375 310 10 5 5
(a) States
1. Andhra Pradesh R 75 30 45 25 10 .. U 560 255 305 180 60 10 5
2. *Assam R 65 40 25 20 5 20 U 445 360 85 285 20 10 Unci. 20 5 15 5
3. Bihar) R 1,050 870 180 750 10 15 U 485 325 160 245 20 Unc]. 20 15 5 10
4. Gujarat R 155 75 80 20 10 U 365 275 90 160 35 Unci. S S
5. Himachal Pradesh R 420 295 125 230 5 10 U 825 480 345 320 15 10 UncI. 25 15 10 10
6. Jammu &_Kashmir .. R 35 25 10 25 5 U 555 410 145 315 5 20 UncI. 5 5
7. Kerala R 165 110 55 100 15 U 415 315 100 270 15 UncI. 50 35 15 35
8. Madhya Pradesh R 405 200 205 145 10 U 1,530 805 725 575 20 75 15 UncI. 50 15 35 15
9. Maharashtra R 160 110 50 70 5 10 U 1,635 935 700 640 50 30 5
to. Meghalaya U 10 10 ..
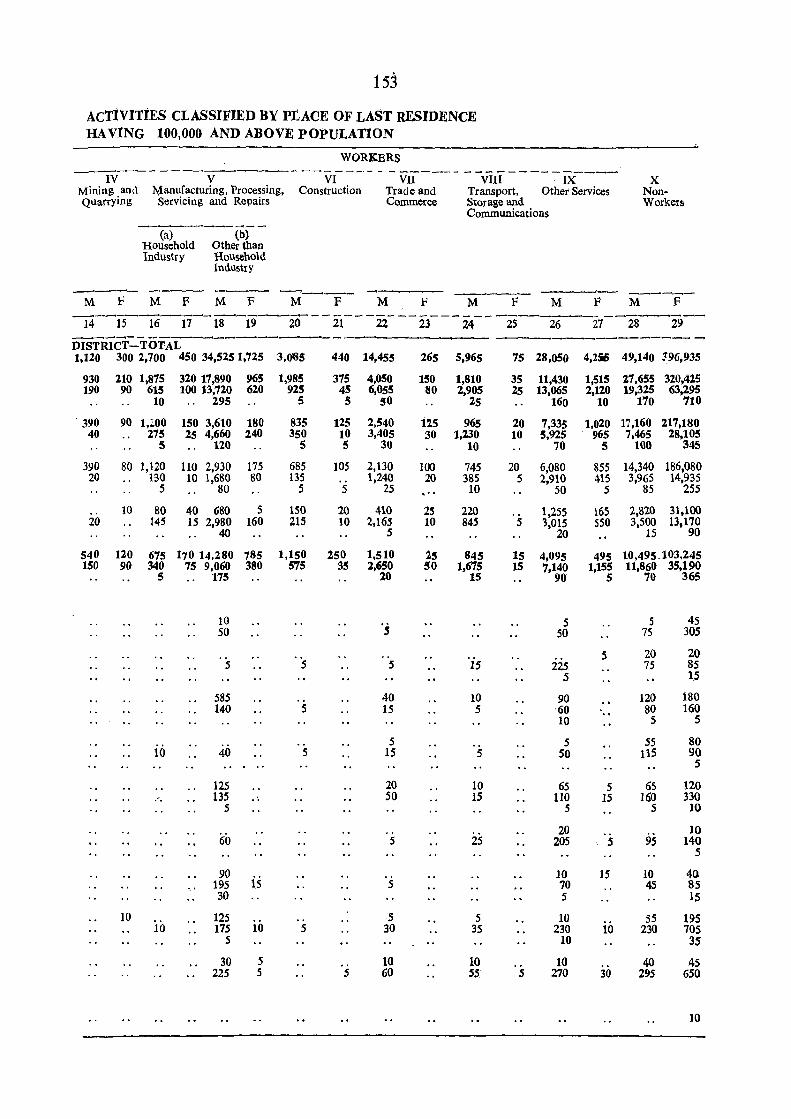
ACTiviTiES CLASSIFIED BY PLACE OF LAST RESIDENCE HA VING 100,000 AND ABOVE POPULATION
WORKERS ------ _------------ -------_.- - - ------ - -- -----------
IV V VI VII VIII . IX Mining anl\ l\:1anufacturing, Processing, Construction Trade and Transport, Other Services Quarrying Servicing and Repairs Commerce Storage and
Communications
X Non-
(a) Household Industry
(b) Other than Household Industry
. Workers
~---- ~-~-M F M F M F M
DISTRICT-=-TOTAL ---1,120 300 2,700 450 34,5251,725 3,065
930 190
390 40
390 20
20
210 1,875 90 615
10
90 1,;;'00 275
5
80 1,120 130
5
320 17,890 965 100 13,720 620
295
150 3,610 180 25 4,660 240
120
110 2,930 10 1,680
80
175 80
10 80 40 680 5 145 15 2,980 160
40
1,985 925
5
835 350
5
685 135
5
150 215
540 120 675 170 14,280 785 1,150 150 90 340 75 9,060 380 575
10
5 175
10
10
10 50
5
585 140
40
125 135
5
60
90 195 is 30
125 175 10
5
30 225
5 5
5
5
5
5
F M
440 14,455
375 45 5
125 10 5
105
5
4,050 6,055
50
2,540 3,405
30
2,130 1,240
25
20 410 10 2,165
5
1,50 1,510 35 2,650
10
5
·s s
40 15
5 15
20 SO
5
5
5 30
10 60
F M F M
26
M F -------27 28 29
265 5,965 75 28,050 4,256 49,140 ~96,935
150 80
125 30
100 20 ... 25 10
1,810 2,905
25
965 1,230
10
745 385 10
220 845
1,5 845 50 1.675
15
·i5
10 5
5
10 15
25
5 35
10 55
35 11,430 25 13,065
160
20 7,335 10 5,925
70
20 5
5
6,080 2,910
50
1,255 '3,015
20
15 4,095 15 7,140
90
5
5 50
225 5
90 ·60 10
5 SO
65 110
5
20 205
10 70 5
10 230
10
10 270
1,515 27,655 320,425 2,120 19,325 63,295
10 170 710
1,020 17,160 217,180 965 7,465 28,105
S 100 345
855 14,340 186,080 415 3,965 14,935
5 85 255
165 2,820 31,100 550 3,500 13.170
15 90
495 10,495.103,245 1,155 11,860 35,190
5 70 365
5
5 15
5
15
10
30
5 75
20 75
120 80 5
55 115
65 160
5.
9S
10 45
55 230
40 295
45 305
20 85 15
180 160
5
80 90
5
120 330
10
10 140
5
40 85 IS
195 70S 35
45 650
10
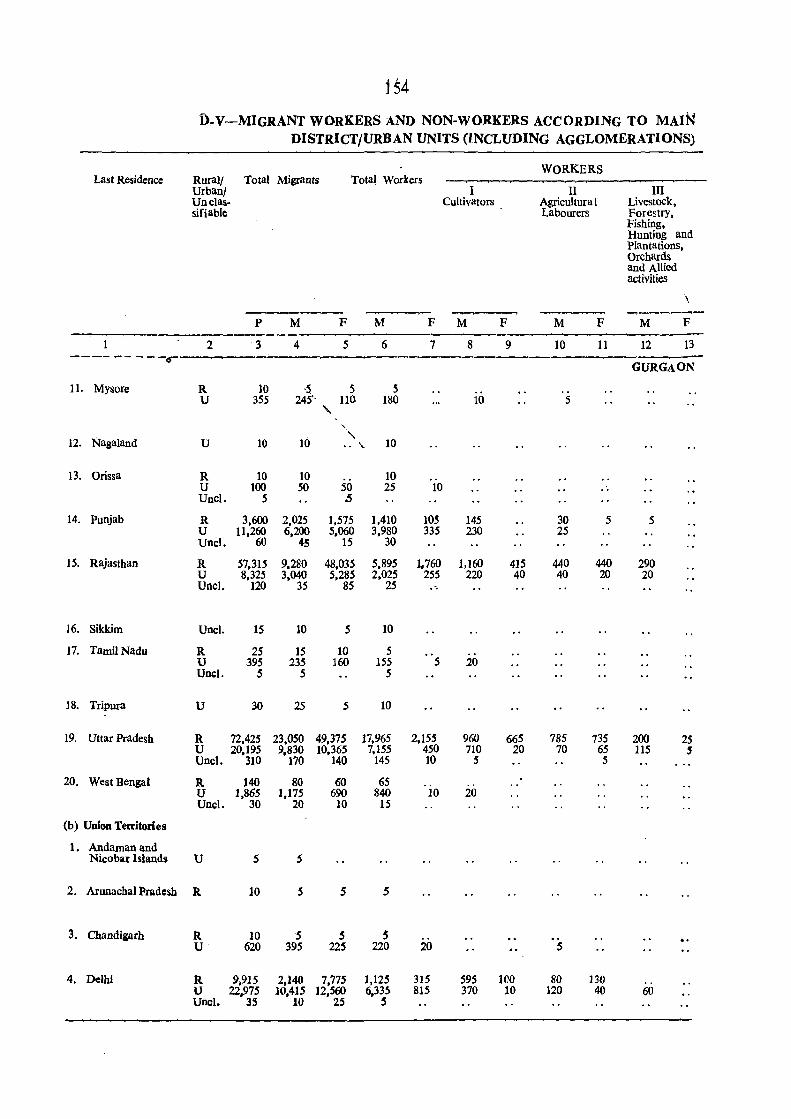
j 54
D-V-MIGRANT WORKERS AND NON-WORKERS ACCORDING TO MAIN DISTRICT/URBAN UNITS (INCLUDING AGGLOMERATIONS)
WORKERS Last Residence Rural/ Total Migrants Total Workers
UrbanI I II III Unclas- Cultivators Agricultura I Livestock, sifiable Labourers Forestry,
Fishing, Hunting and Plantations, Orchards and Allied activities
\
p M F M F M F M F M F
2 3 4 5 6 7 8 9 10 11 12 13 ---------r
GURGAON
11. Mysore R 10 -s 5 5 U 355 245" 110 180 10 5
"- , 12. Nagaland U 10 10 " 10 .. \.
13. Orissa R 10 10 10 U 100 50 50 25 10 ., UncI. S .5
14. Punjab R 3,600 2,025 1,575 1.410 105 145 30 5 5 U 11,260 6,200 5,060 3,980 335 230 25 UncI. 60 45 15 30
15. Rajasthan R 57,315 9,280 48,035 5,895 1.760 1,160 415 440 440 290 U 8,325 3,040 5,285 2,025 255 220 40 40 20 20 UncI. 120 35 85 25 ..
16. Sikkim UncI. 15 10 5 10
17. Tamil Nadu R 25 15 10 5 ., U 395 235 160 155 5 20 Unci. S 5 5
18. Tripura U 30 25 5 10
19. Uttar Pradesh R 72,425 23,050 49,375 17,965 2,155 960 665 785 735 200 25 U 20,195 9.830 10,365 7,155 450 710 20 70 65 115 , UncI. 310 170 140 145 10 5 5
20. West Bengal R 140 80 60 65 U 1,865 1,175 690 840 10 20 UncI. 30 20 10 15
(b) Union Territories
1. Andamanand Nicobar Islands U 5 5
2. Arunachal Pradesh R 10 5 5 5
3. Chandigarh R. 10 5 5 5 U 620 395 225 220 20 5
4. Delhi R 9,915 2,140 7,775 1,125 315 595 leO 80 130 U 22,975 10,415 12,560 6,335 815 370 10 120 40 60 Unci. 3S 10 25 5
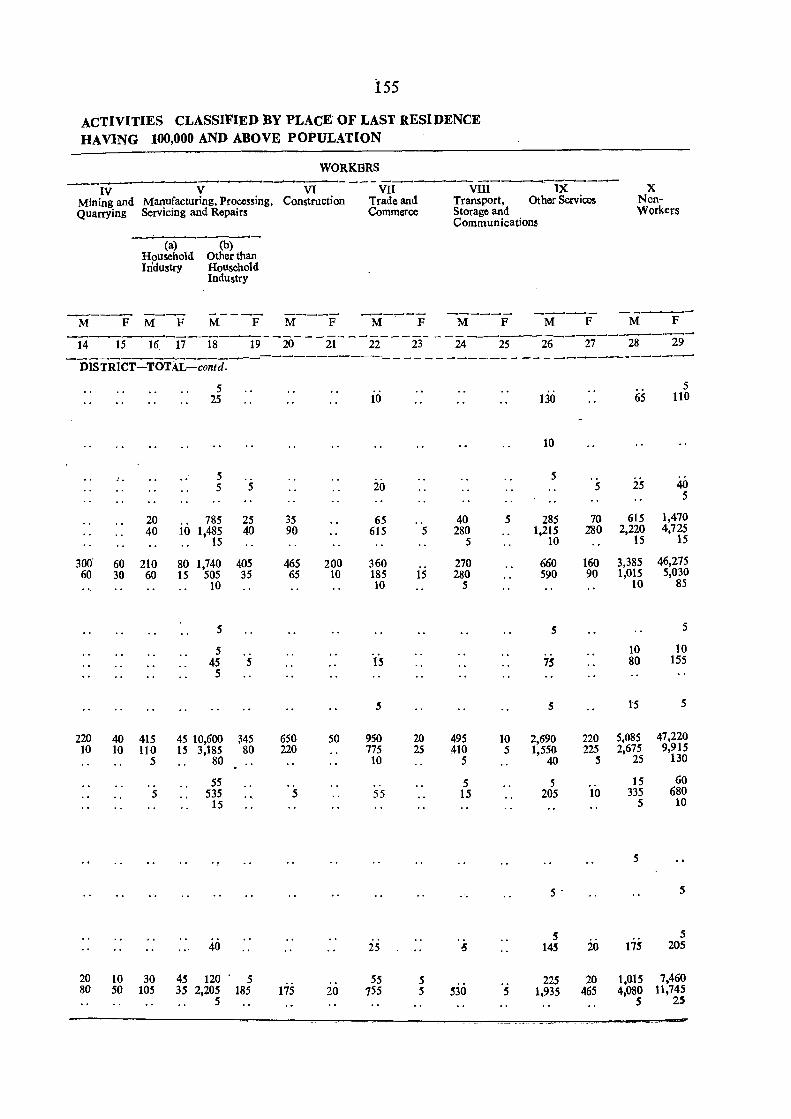
155
ACTIVITIES CLASSIFIED BY PLACE OF LAST RESI DENCE
HAVING 100,000 AND ABOVE POPULATION
WORKBRS -----_----
IV V VI VII VIII IX X Mining and Manufacturing, Processing, Construction Trade and Transport, Other Services Non-Quarrying Servicing and Repairs Commerce Storage and Workers
Communications
---+----------(a) (b)
Household Other than Industry Household
Industry
----- -- ----- ----- --~-- ------ ---- -----M F M F M F M F M F M F M F M F
------------------------_-------------14 15 16. 17 18 19 20 21 22 23 24 25 26 27 28 29
---------------------------------------------------------~ DISTRICT-TOTAL-contd,
5 5 25 10 130 65 110
10
" 5 5 5 5 20 5 25 40
5
20 785 25 35 65 40 5 285 70 615 1,470 40 10 1,485 40 90 615 5 280 1,215 2'80 2,220 4,725
15 5 10 15 15
300· 60 210 80 1,740 405 465 200 360 270 660 160 3,385 46,275 60 30 60 15 505 35 65 10 185 15 280 590 90 1,015 5,030
10 10 5 10 85
5 5 5
5 'IS
10 10 45 5 75 80 155 5
5 5 15 5
220 40 415 45 10,600 ~45 650 50 950 20 495 10 2,690 220 5,085 47,220 10 10 110 15 3,185 80 220 775 25 410 5 1,550 225 2,675 9,915
5 80 10 5 40 5 25 130
55 " 5 5 15 60 5 535 5 55 15 205 10 335 680
15 5 10
5
5 ' 5
5 5 40 25 ~ 145 20 175 205
20 10 30 45 120 5 " 55 5 225 20 1,015 7,460
80 50 105 35 2,205 185 175 20 755 5 530 5 1,935 465 4,080 11,745 5 5 25
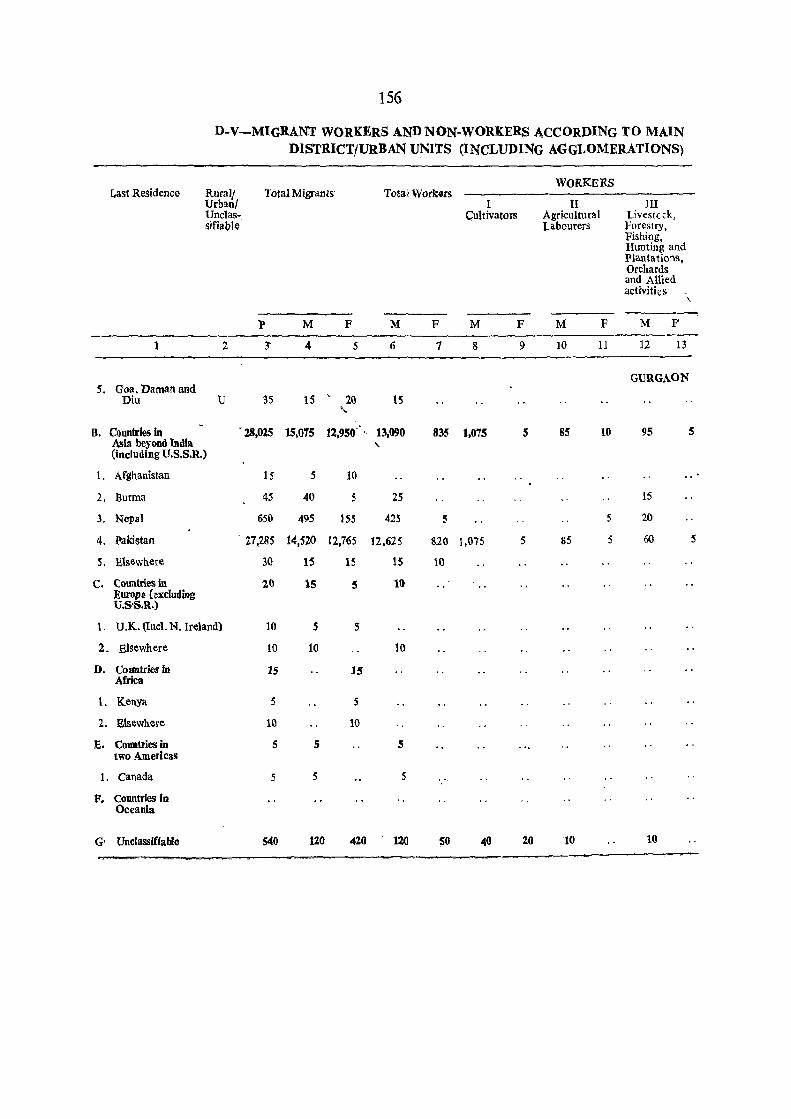
156
D-V-MIGRANT WORKERS AND NON-WORK.ERS ACCORDING TO MAIN DISTRICT/URBAN UNITS (INCLUDING AGGLOMERATIONS)
WORKERS Last Residence Rurall Total Migranls Total Workers
UrbanI I II III Unc1as~, Cultivators Agricultural Livestcck, sifiable labourers Forestry,
Fishing, Hunting and Plantations, Orchards and Allied activities
\
p M F M F M F M F M F
1 2 3' 4 5 6 7 8 9 10 11 12 13
GURGAON 5. Goa, Daman and
Diu U 35 15 20 IS "-
B. Countries in '28,025 15,075 11,950" " 13,090 835 1,075 5 85 10 95 5 Asia beyond India " (including U.S.S.R.)
1. Afghanistan 15 5 10
2. Burma 45 40 5 25 15
3, Nepal 650 495 155 425 5 5 20
4. Pakistan . 27,285 14,520 12,765 12,625 820 1,075 5 85 5 6() 5
5. Elsewhere 30 15 15 15 10
C. Countries in 20 15 5 10 Europe (excluding U.S'S.R.)
1. U.K. (IncI. N. Ireland) 10 5 5
2. Elsewhere 10 10 10
D. Coontries in 15 15 Africa
L Kenya 5 5
2. Elsewhere 10 10
E. COUDtries in 5 5 5 two Americas
1. Canada 5 5 5
F. Countries in Oceania
G' Unclassiffable 540 120 420 120 SO 40 20 10 10
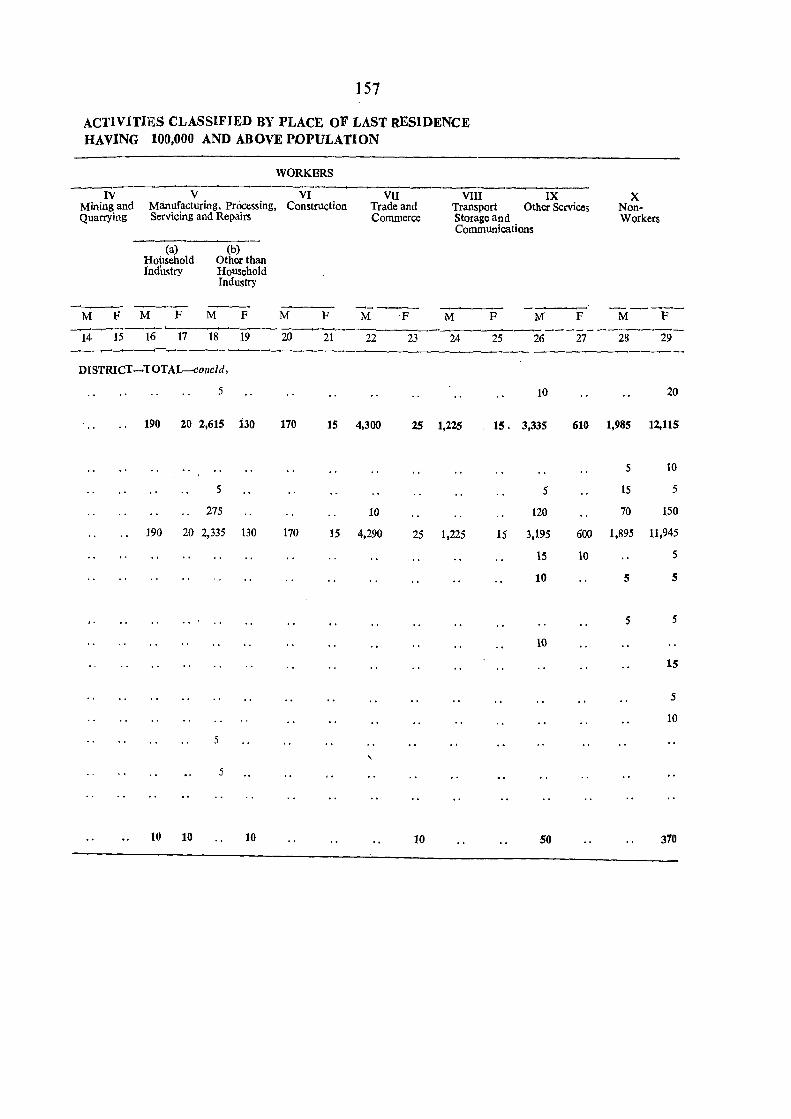
157
ACTIVITIES CLASSIFIED BY PLACE OF LAST RESIDENCE HAVING 100,000 AND ABOVE POPULATION
WORKBRS
--W----y--- VI
Mining and Manufacturing, PrOcessing, Construction Quarrying Servicing and Repairs
M F
(a) Household IndustrY
M F
(b) Other than HOUSehold Industry
M F M F
VII Trade and Commerce
M ·F
VIII IX Transport Other Services Storage and Communications
---' M F M F
X NonWorkers
-_--M F _------------_ 21 22 23 24 25 26 27 28 29
--____..._.......--_____.-....,...-------..--------~-----__.----- --------------DISTRICT-TOTAL.-.concld,
5
190 20 2,615 130
5
275
190 20 2,335 130
5
5
10 10 10
170
170
15 4,300
10
15 4,290
,
10
25 1,225 15. 3,335
5
120
25 1,225 15 3,195
15
10
10
10 50
20
610 1,985 12.115
5 10
15 5
70 150
600 1,895 11,945
10 5
5 5
5 5
15
5
10
370
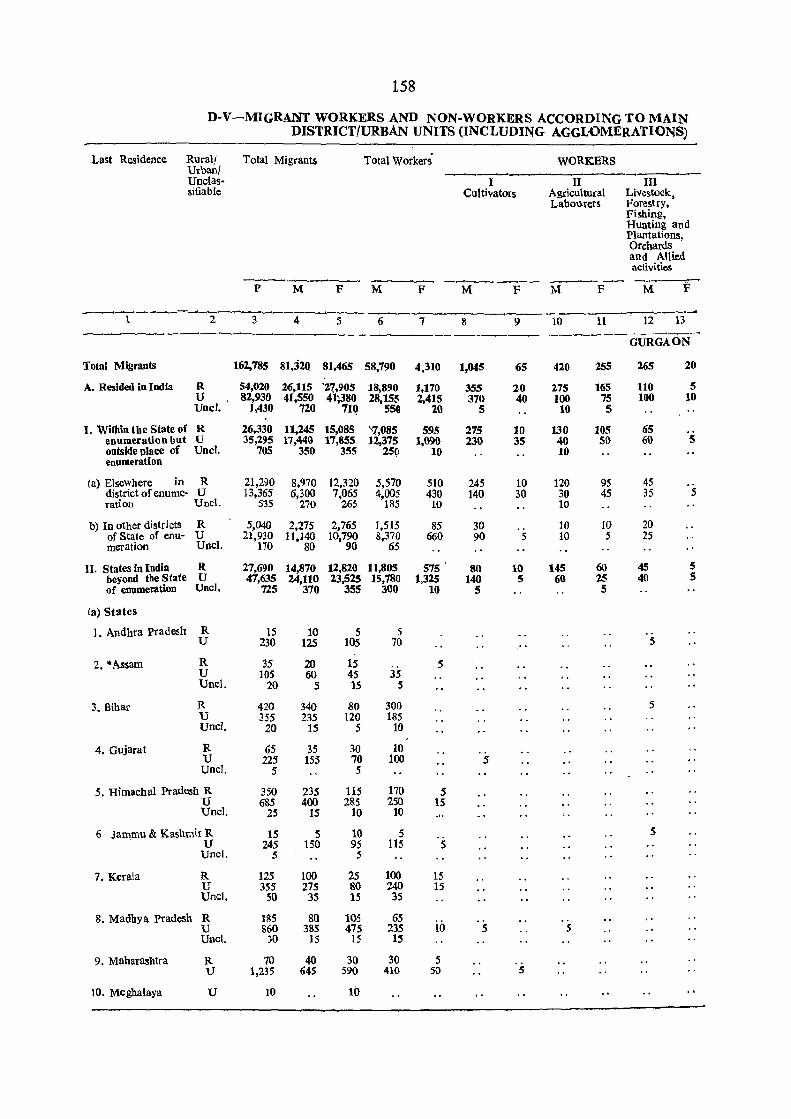
158
D-V-MIGRANT WORKERS AND NON-WORKERS ACCORDING TO MAIN DISTRICTfURBAN UNITS (INCLUDING AGGLOMERATIONS)
Last Residence Rurall Urbani
Total Migrants Total Workers WORKERS
Unclas- I II III sifiable Cultivators Agricultural Livestock,
Labo~rer5 Forestry, Fishing, Hunting and Plantations, Orchards and AHied activities
--- ---"':t'-P M F M F M F M F M F
-1 2 3 4 5 6 7 8 9 10 11 12 13
------ ----------------GURGAON
Total Migrants 162,785 81,320 81,465 58,790 4,310 1,045 65 420 255 265 20
A. Resided in India R 54,020 26,115 '27,905 18,890 1,170 35S 20 275 165 110 5 U 82,930 41,550 41~380 28,155 2,415 370 40 100 75 100 10 Unci. 1,430 720 71Q 550 20 5 10 5
I, Within the State of R 26,330 11,245 15,085 \7,085 595 215 10 130 105 65 enumeration but U 35,295 17,440 17,855 12,375 1,090 230 35 40 50 60 5 outside place of Unci. 705 350 355 250 10 10 enumeration
(a) Elsewhere in R 21,290 8,970 12,320 5,570 510 245 10 120 95 45 district of enume· U 13,365 6,300 7,065 4,005 430 140 30 30 45 35 5 ration Unel, 535 270 265 185 10 10
b) In other districts R 5,040 2,275 2,765 1,515 85 30 10 10 20 of State of enu- U 21,930 11,140 10,790 8,370 660 90 5 10 5 25 meration UncI. 170 80 90 65
II. States in India R 27,690 14,870 12,820 11,80S 575 80 10 145 60 45 5 beyond tbe State U 47,635 24,110 23,525 15,780 1,325 140 5 60 25 40 5 of enumeration Unci. 725 370 355 300 10 5 5
(a) States
1. Andhra Pradesh R 15 10 5 5 U 230 125 105 70 5
2. "'Assam R 35 20 15 5 U 105 60 45 35 UncI. 20 5 15 5
3. Bihar R 420 340 80 300 5 U 355 235 120 185 Unel. 20 15 5 10
4. Gujarat R 65 35 30 10 U 225 155 70 100 5
UncI. 5 5
5. Himachal Pradesh R 350 235 115 170 5 U 685 400 285 250 15 Uncl. 25 15 10 10
6 Jammu & Kashmir R 15 5 10 5 5 U 245 150 95 115 5
UncI. 5 5
7. Kerala R 125 100 25 100 15 U 355 275 80 240 15 Unc!. 50 35 15 35
8. Madhya Pradesh R 185 80 105 65 in U 860 385 475 235 5 5
Uocl. 30 15 15 15
9. Maharashtra R 70 40 30 30 5 '5 U 1,235 645 590 410 SO
to. Meghalaya U 10 10
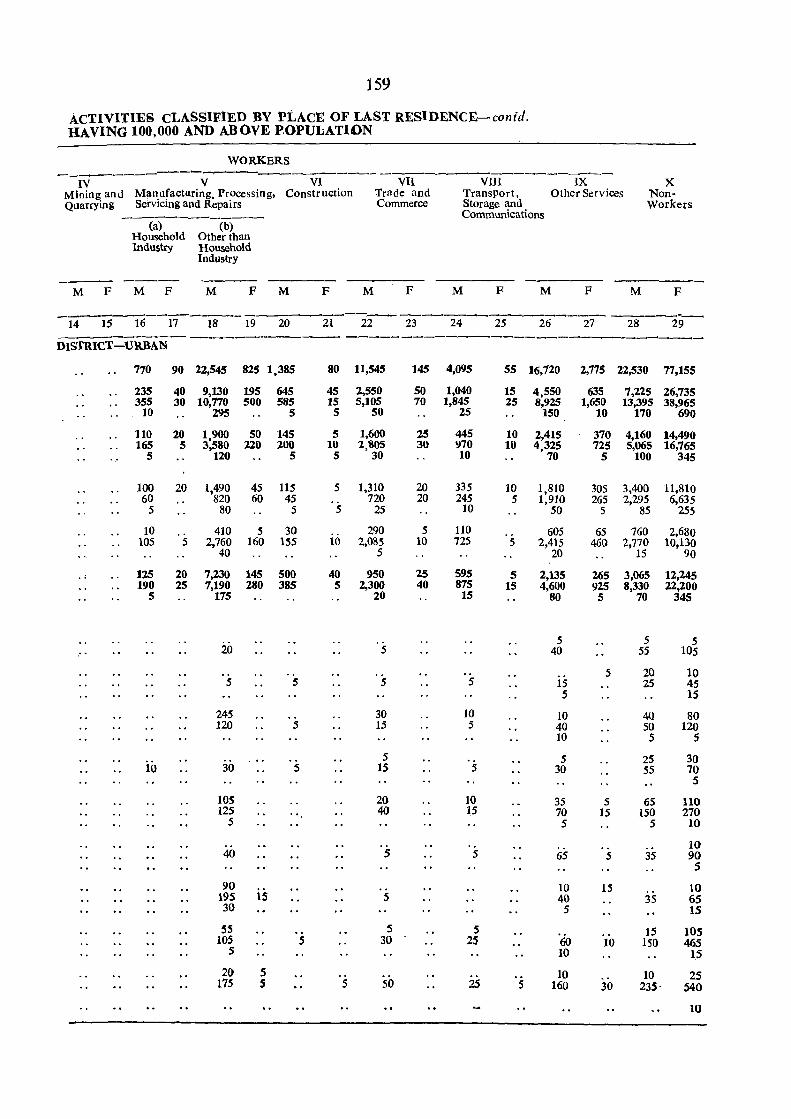
159
ACT.IVITIES CtASSIFIED BY PLACE OF LAST RESIDENCE-contd. HAVING 100,000 AND ABOVE P,OPULATION
WORKERS
-------------~--IV V VI VII VIII IX X Mining and Man ufacturing, Processing, Construction Trllde and Transport, Other Services Non-Quarrying Servicing and Repairs Commerce Storage and Workers
Communications (a) (b)
Household Other than Industry Household
Industry
M F M F M F M F M F M F M F M F
----~---------------------- "_ 14 15 16 17 18 19 20 21 22 23 24 25 26 27 28 29 ----------------~ ---------------------------DISTRICT-URBAN
770 90 22,545 825 1,385 80 11,545 145 4,095 55 16,720 2,775 22,530 77,155
235 40 9,130 195 645 45 2,550 50 1,040 15 4,550 635 7,225 26,735 355 30 10,770 500 585 15 5,105 70 1,845 25 8,925 1,650 13,395 38,965
10 295 5 5 50 25 150 10 170 690
110 20 1900 50 145 5 1,600 25 445 10 2,415 370 4,160 14,490 165 5 3:580 220 200 10 2,805 30 970 10 4,325 725 5,065 16,765
5 120 5 5 30 10 70 5 100 345
100 20 1,490 45 115 5 1,310 20 335 10 1,810 305 3,400 11,810 60 820 60 45 720 20 245 5 1,910 265 2,295 6,635
5 80 5 5 25 10 50 5 85 255
10 410 5 30 290 5 110 605 65 760 2,680 105 5 2,760 160 155 10 2,085 10 72S 5 2,415 460 2,770 10,130
40 5 20 15 90
.. 125 20 7,230 145 500 40 950 25 595 5 2,135 265 3,065 12,245 190 25 7,190 280 385 5 2,300 40 875 15 4,600 925 8,330 22,200
5 175 20 15 80 5 70 345
S 5 5 20 5 40 55 105
S 20 10 5 5 5 5 15 25 45
5 15
245 30 10 10 40 80 120 5 15 5 40 50 120
10 5 5
io 30 5 5 25 30
5 15 5 30 55 70 5
105 20 10 35 5 65 110 125 40 15 70 15 150 270
5 5 5 10
40 5 5 65 10
5 35 90 5
90 10 15 10 195 15 5 40 35 65 30 5 15
55 5 5 15 105 105 5 30 2S 60 10 150 46S
5 10 15
20 5 ,. 10 10 25 175 S 5 50 25 5 160 30 235' 540
10
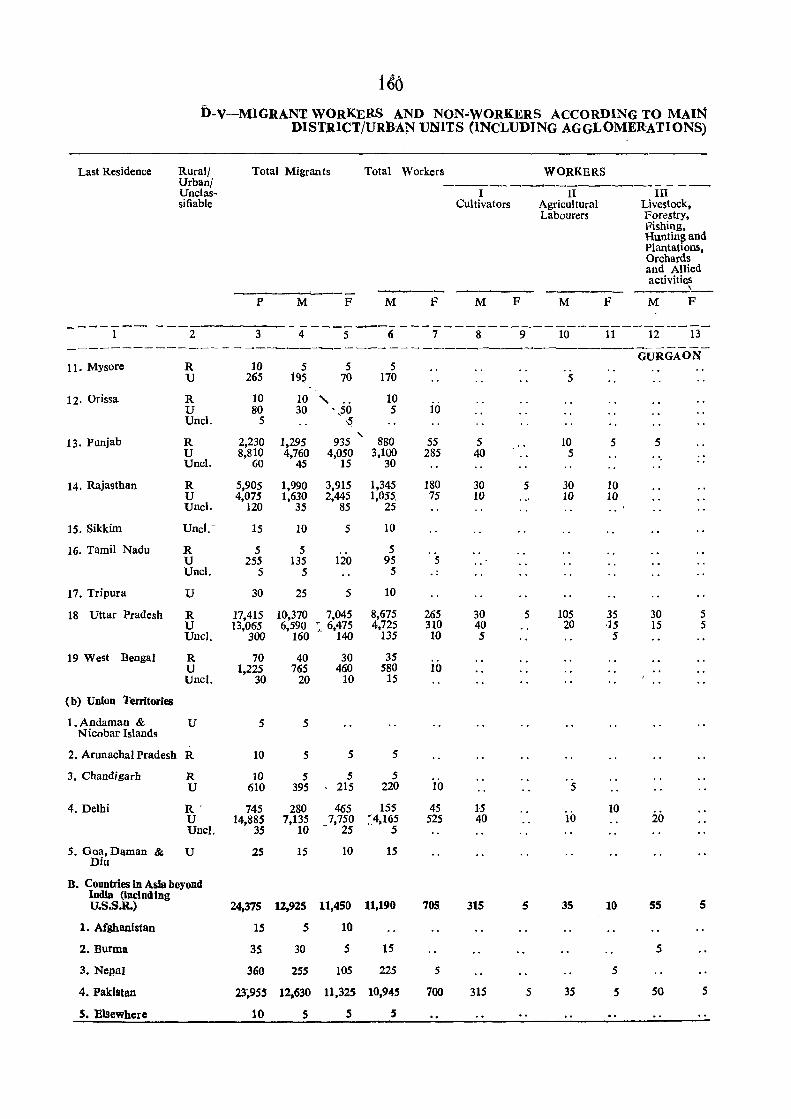
i66 b-V-MIGRANT WORKERS AND NON~WORKERS ACCORDING TO MAIN
DISTIUCTjURnAjS UNITS (INCLUDING AGGLOMERATIONS)
Last Residence RUral! Urban! Uuclassifiable
Total Migrants
P M
Total Workers
F M F
WORKERS
I II Cultivators Agricultural
Labourers
M F M F
III Livestock, Forestry, Fishing, Hunting and Plantations, Orchards and Allied activities
---_)_ M F
----1--- ---2-----r---4---s---6---7---g---9--10--11--12--13-------------------------~----------------~----------GURGAON-
11. Mysore
12. Orissa
13. Punjab
14. Rajasthan
15. Sikkim
16. Tamil Nadu
17. Tripura
18 Uttar Pradesh
19 West Bengal
(b) Union Territories
1.Andaman & Nicobar Islands
R U
R U UncI.
R U ·Uncl.
R U Unel.
Uncl.
R U UncI.
U
R U UncI.
R U Unci.
u
2. Arunachal Pradesh R
3. Chandigarh
4. Delhi
R U
R' U UncI.
5. Goa, Daman & U Diu
B. Countries in Asia beyond India (Including U.S.S.R.)
1. Afghanistan
2. Burma
3. Nepal
4. Pakistan
S. Elsewhere
10 265
10 80
5
2,230 8,810
60
5,905 4,075
120
15
5 255
5
30
5 195
5 70
10 " 30 ',50
1,295 4,760
45
1,990 1,630
35
10
5 135
5
25
.q
935 4,050
15
3,915 2,445
85
5
120
S
17,415 10,370 7,045 13,065 6,590:' 6,475
300 160 140
70 1,225
30
5
10
10 610
745 14,885
35
25
40 765
20
S
5
5 395
30 460
10
5
5 215
280 465 7,135 7,750
10 - 25
15 10
,
5 170
10 5
880 3,100
30
1,345 1,055
25
10
5 95
5
10
8,675 4,725
135
3S 580
15
5
5 220
155 ~,4,165
5
15
24,375 12,925 11,450 11,190
15
35
360
5
30
255
10
5
lOS
15
225
23~9SS 12.630 11,325 10,945
10 S 5 j
10
55 285
180 75
5
265 310 10
10
io 45
525
705,
5
700
5 40
30 10
30 40 5
15 40
315
315
5
5
5
5
5
10 5
30 10
105 20
5
10
3S
35
5
10 10
35 ·15
5
10
10
5
5
5
30 15
20
55
5
50
5 5
5
5
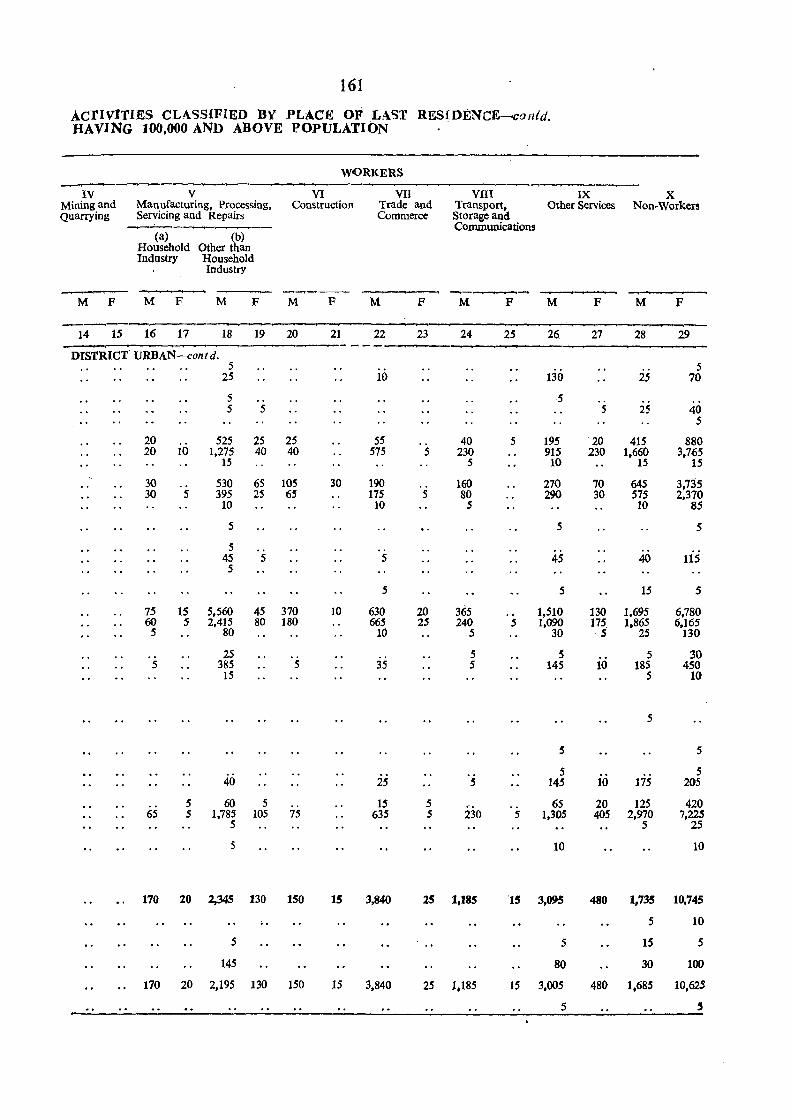
161
ACTIVITIES CLASSIFIED BY PLACE OF LAST RES~DENCE-co "ld. HAVING 100,000 AND AlJOVE POPULATION
WORKERS _...--.,--_,_,,_...
IV V VI VII VIII IX X Mining and Man ufacturing, Processing, Construction Trade and Transport, Other Services Non-Workers Quarrying Servicing and Repairs Commerce Storage and
Communications (a) (b)
Household Other than Industry Household
Industry
~--
M F M F M F M F M F M F M F M F
14 15 16 17 18 19 20 21 22 23 24 25 26 27 28 29 - ---
DISTRICT' URBAN-contd. 5 5
25 10 130 25 70
5 5 5 5 5 25 40
5
20 525 25 25 55 40 5 195 20 415 880 20 10 1,275 40 40 575 5 230 915 230 1,660 3,765
15 5 10 15 15
30 .. 530 65 105 30 190 160 270 70 645 3,735 30 5 395 25 65 175 5 80 290 30 575 2,370
10 10 5 10 85
5 5 5
5 45 5 5 45 40 115 5
5 5 15 5
75 15 5,560 45 370 10 630 20 365 1,510 130 1,695 6,780 60 5 2,415 80 180 665 25 240 5 1,090 175 1,865 6,165 5 80 10 5 30 ,5 25 130
25 5 5 5 30 5 385 5 35 5 145 10 185 450
15 5 10
5
5 5
"5 5 5 40 25 145 10 175 205
5 60 5 15 5 .'. 65 20 125 420 65 5 1,785 105 75 635 5 230 5 1,305 405 2,970 7,225
5 5 25
5 10 10
170 20 2,345 130 150 15 3,840 25 1,185 15 3,095 480 1,735 10,745
.. 5 10
5 5 15 5
145 80 30 100
170 20 2,195 130 150 15 3,840 25 1.185 15 3,005 480 1,685 10,625
5 ,
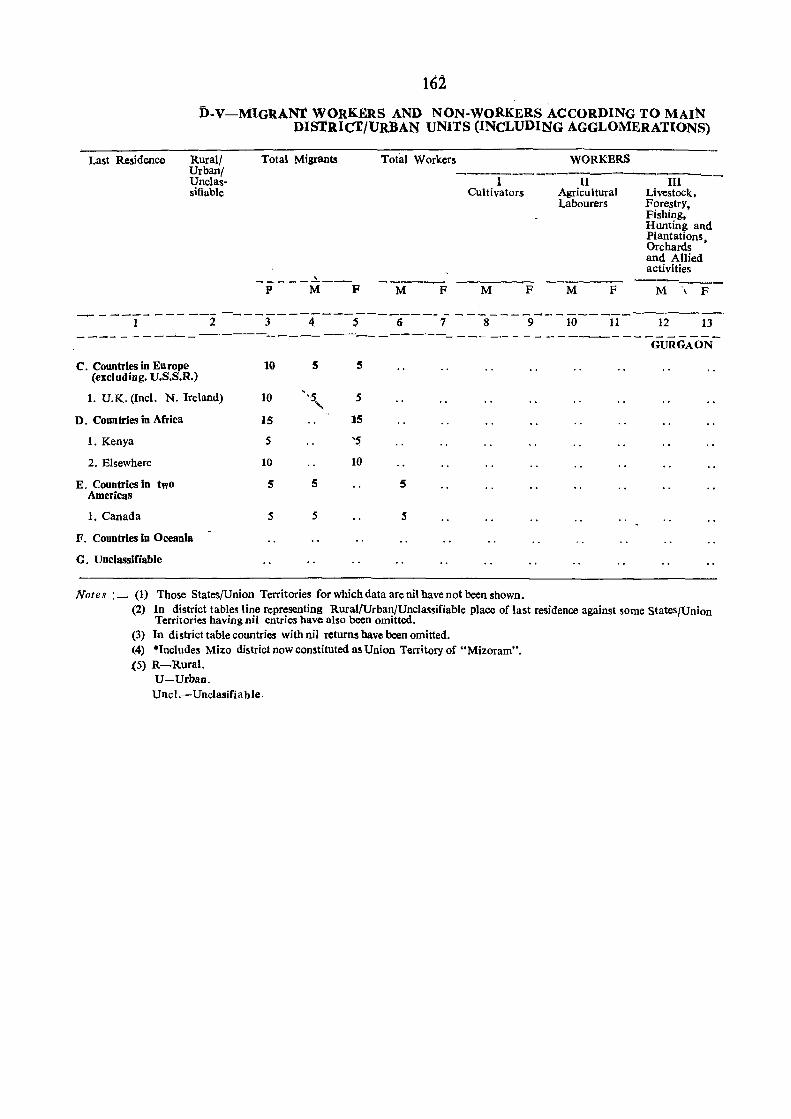
162
D-V-:MIGRANr WORKERS AND NON-WORKERS ACCORDING TO MAIN DISTRICT/URBAN UNITS (INCLUDING AGGLOMERATIONS)
Last Residence Total Migrants Total Workers WORKERS Rural/ Urbani UncI assifiable
--------.-------,~--
-----~--P M F M F
I Cultivators
-------M F
II Agricultural Labourers
M F
III Livestock. ForestrY, Fishing, Hunting and Plantations. Orchards and Allied activities
M \ F
_--- - ----_------_---------_-----_ --~- -- - - - --------------'-GURGAON
C. Countries in Eu rope 10 5 5 (excluding. U.S.S.R.)
1. U.K. (Incl. N. Ireland) 10 ",5
" 5
D. Countries in Africa 15 15
1. Kenya 5 'S
2. Elsewhere 10 10
E. Countries in two 5 5 5 Americas
1. Canada S 5 S
F. Countries in Oceania
G. Unclassifiable
Notes :_ (1) Those States/Union Territories for which data are nil have not been shown. (2) In district tables line representing Rural/Urban/Unclassifiable place of last residence against some States/Union
Territories having nil entries have also been omitted. (3) In district table countries with nil returns have been omitted. (4) *Includes Mizo district now constituted as Union Territory of "Mizoram". (5) R-Rural.
U-Urban. Uncl.-Unclasifiable.
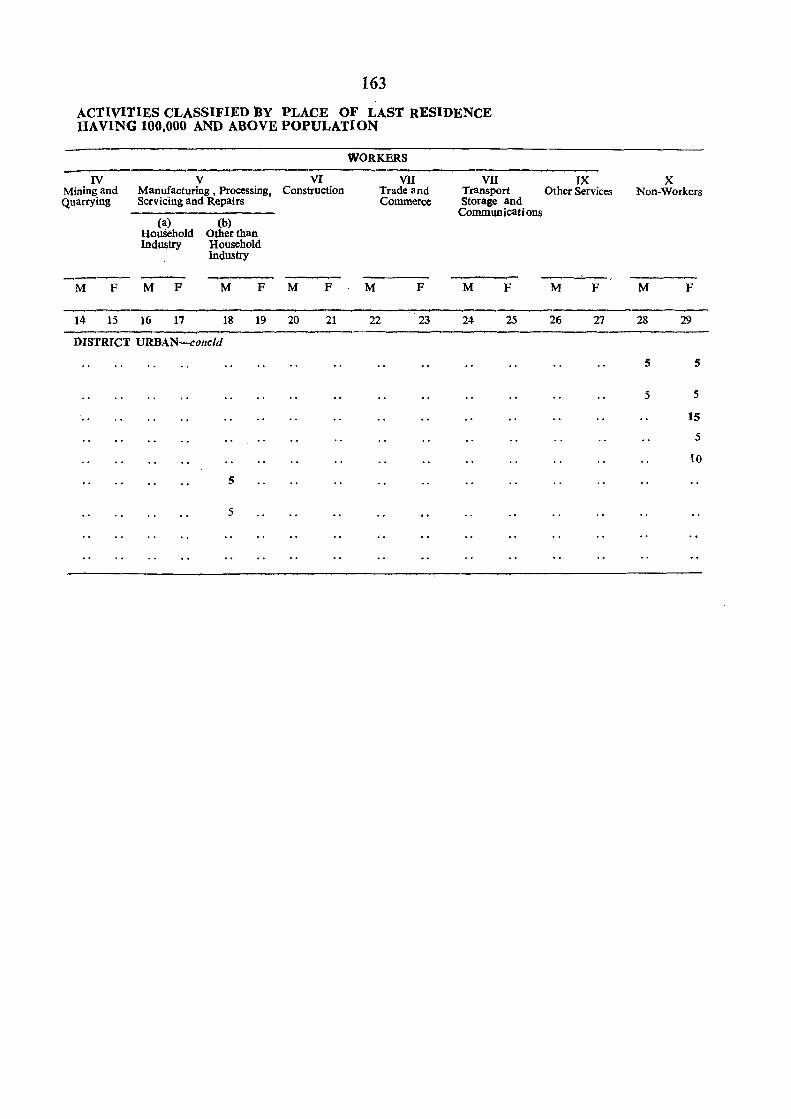
163
ACTIVITIES CLASSIFIED:BY PLACE OF LAST RESIDENCE HAVING 100,000 AND ABOVE POPULATION
IV Mining and Quarrying
1\1 F
14 15
V VI Manufacturing. Processing, Construction ServiCing and Repairs
(a) (b) HouSehold Other than Industry Household
Industry
M F M F M
16 17 18 19 20
F
21
DISTRICT URBAN~conc/d
5
5
WORKERS
M
VII Trade and Commerce
F
22 23
..
VII IX Transport Other Services Storage and
Communications
--......:...- .. M F M F
24 25 26 27
X Non-Workers
---_ M F
28 29
5 5
5 5
15
5
10


TABLE D-VI
MIGRANTS CLASSIFIED BY PLACE OF· LAST RESIDENCE. AGE-GROUP, DURATION OF RESIDENCE AND MARITAL STATUS
This is a new table introduced for the first time in 1971-Census giving the distribution of migrants based on the place of last residence by sex, age-group, duration of residence and marital status.
2. Data relating to 'place of last residence' have been classified under the following heads and sub-heads under column :- -
Total A Resided in India. I. Within the State of enumeration but outside the place of enumeration.
(a) Elsewhere in district of enumeration. (b) In other districts of State of enumeration. II. States in India beyond the State of enumeration. B Outside India.
3. The duration of residence of the migrants in the place of enumeration has been classified into three ranges, viZ., less than 1 year, 1-9, years and 10 years and above. The figures for migrants in whose case the duration of residence was not known are included in the totals i.e., under "All durations" which thus do not tally with the total of figures under less than 1 year, 1-9 years and 10 years and above.
4. The age-groups adopted for this table are 0-14, 15-19,20-24,25-49, 50 +and Age not stated. The migrants under each age-group have been cross-tabulated into Never Married (NM), Married (M) and Widowed and Divorced or Separated' (W &D). Those, who did not return their marital status, have been included in 'Total'.
5. Table D-VI has been prepared for the district only.The table gives separate figures for rural and urban areas according to place of enumeration and do not show the rural/urban classification of last place of residence.
6. This table enables us to study migration on account of a most important sociological factor viz., marriage. There is a good proportion of migration specially amongst females which can be attributed to this factor. In the past on account of problems due to distance, people used to prefer marriages in nearby places. The problem of distance having been solved to a great extent and in the wake of advancement in our society cue to literacy inter-district and inter-state marriages are on the increase.
165
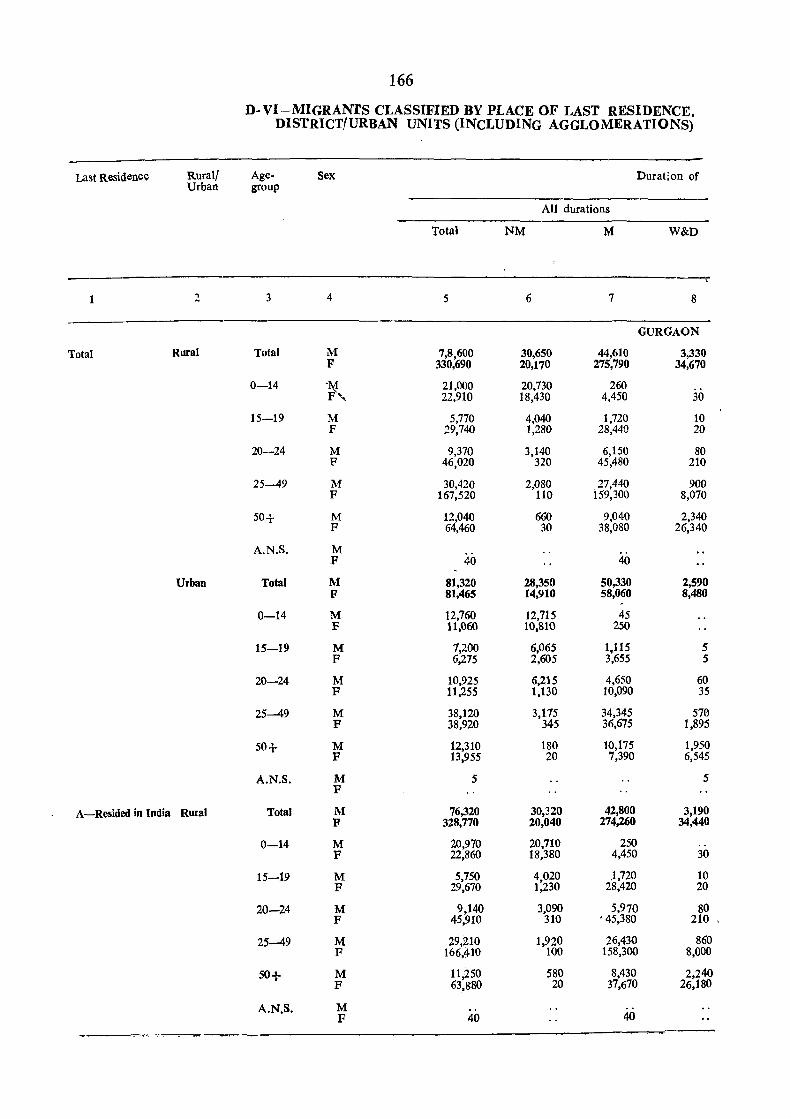
Last Residence
1
Total
Rural/ Urban
2
Rural
Urban
A-Resided in India Rural
166
D- VI-MIGRANTS CLASSIFIED BY PLACE OF LAST RESIDENCE, DISTRICT/URBAN UNITS (INCLUDING AGGLOMERATIONS)
Agegroup
3
Total
0-14
15-19
20-24
25-49
50+
A.N.S.
Total
0-14
15-19
20-24
25-49
50+
A.N.S.
Total
0-14
15-19
20-24
25-49
50+
A.N.S.
Sex
4
M F
-M F~,
M F
M F
M F
M F
M F
M F
M F
M F
M F
M F
M F
M F
M F
M F
M F
M F
M F
M F
M F
Total
5
7,8,600 330,690
21,000 22,910
5,770 29,74()
9,370 46,020
30,420 167,520
12,040 64,460
40
81,320 81,465
12,760 11,060
7,200 6,275
10,925 11,255
38,120 38,920
12,310 13.955
5
76,320 328,770
20,970 22,860
5,750 29,670
9,140 45,910
29,210 166,410
11,250 63,880
40
Durat;on of
All durations
NM M W&D
6 7 8
GURGAON
30,650 44,610 3,330 20,170 275,790 34,670
20,730 260 18,430 4,450 30
4,040 1,720 10 1,280 28,44!l 20
3,140 6,150 80 320 45,480 210
2,080 27,440 900 110 159,300 8,070
660 9,040 2,340 30 38,080 26,340
40
28,350 50,330 2,590 14,910 58,060 8,480
12,715 45 10,810 250
6,065 1,115 5 2,605 3,655 5
6,215 4,650 60 1,130 10,090 35
3,175 34,345 570 345 36,675 1,895
180 10,175 1,950 20 7,390 6,545
5
30,320 42,800 3,190 20,040 274,260 34,440
20,710 250 .. 18,380 4,450 30
4,020 .1,720 10 1,230 28,420 20
3,090 5,970 80 310 • 45,380 210 ,
1,920 26,430 860 100 158,300 8,000
580 8,430 2,240 20 37,670 26,180
40
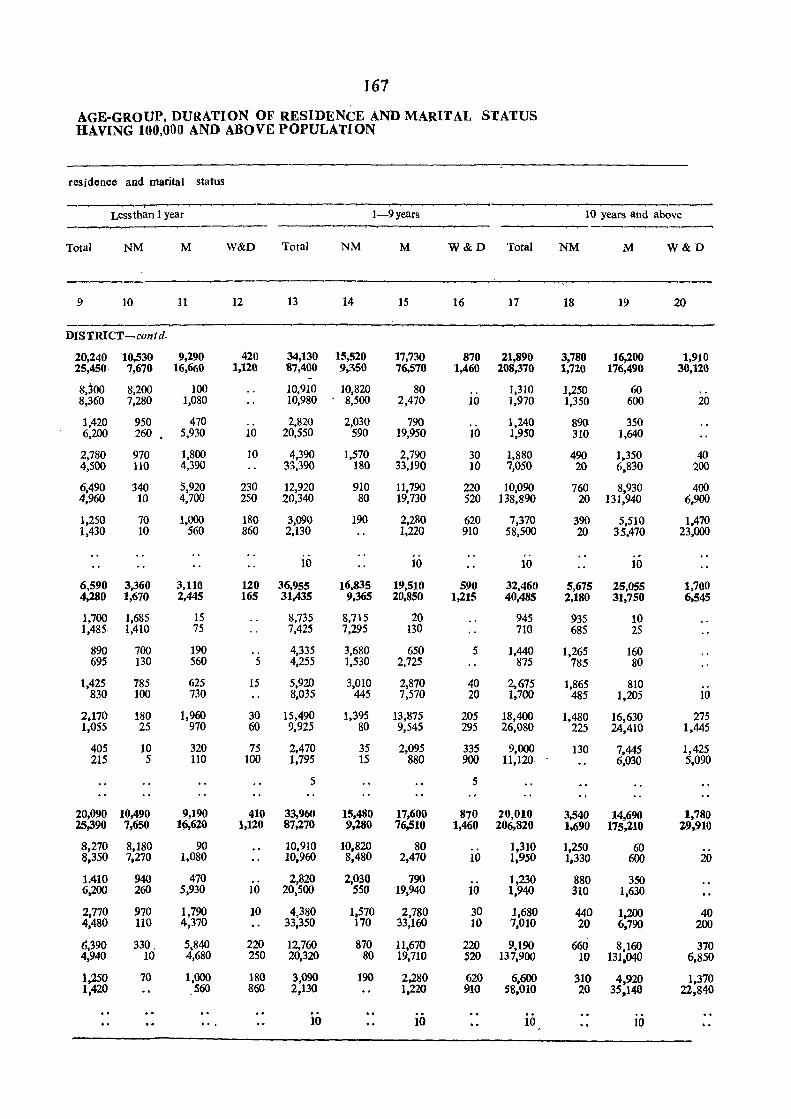
161
AGE-GROUP, DURATION OF RESIDENCE AND MARITAL STATUS HAVING 100,000 AND ABOVE POPULATION
reSidence and marital status
Less than 1 year 1-9 years
Total NM M W&D Total NM M W & D Total
9 10 11 12 13 14 15 16 17
-----~
DISTRICT~contd.
20,240 10,530 9,290 420 34,130 15,520 17,730 870 21,890 25,450 7,670 16,660 1,120 87,400 9,350 76,570 1,460 208,370
8,300 8,200 100 10,910 10,820 80 1,310 8,360 7,280 1,080 10,980 8,500 2,470 10 1,970
1,420 950 470 .. 2,820 2,030 790 1,240 6,200 260 5,930 10 20,550 590 19,950 10 1,950
2,780 970 1,800 10 4,390 1,570 2,790 30 1,880 4,500 110 4,390 33,390 180 33,190 10 7,050
6,490 340 5,920 230 12,920 910 11,790 220 10,090 4,960 10 4,700 250 20,340 80 19,730 520 138,890
1,250 70 1,000 180 3,090 190 2,280 620 7,370 1,430 10 560 860 2,130 1,220 910 58,500
io ..
10 10
6,590 3,360 3,110 120 36,955 16,835 19,5tO 590 32,460 4,280 1,670 2,445 165 31,435 9.365 20,850 1,215 40,485
1,700 1,685 15 8,735 8,715 20 945 1,485 1,410 7S 7,425 7,295 130 710
890 700 190 .. 4,335 3,680 650 5 1,440 695 130 560 5 4,255 1,530 2,725 875
1,425 785 625 15 5,920 3,010 2,870 40 2,675 830 100 730 8,035 445 7,570 20 1,700
2,170 180 1,960 30 15,490 1,395 13,875 205 18,400 1,055 25 970 60 9,925 80 9,545 295 26,080
405 10 320 75 2,470 35 2,095 335 9,000 215 5 110 100 1,795 15 880 900 11,120
5 5
20,090 10,490 9,190 410 33,960 15,480 17,600 870 20,010 25,390 7,650 16,620 1,120 87,270 9,280 76,510 1,460 206,820
8,270 8,180 90 10,910 10,820 80 1,310 8,350 7,270 1,080 10,960 8,480 2,470 10 1,950
1.410 940 470 2,820 2,030 790 1,230 6,200 260 5,930 10 20,500 550 19,940 10 1,940
2,770 970 1,790 10 4,380 1,570 2,780 30 1,680 4,480 110 4,370 33,350 170 33,160 10 7,010
6,390 330, 5,840 220 12,760 870 11,670 220 9,190 4,940 10 4,680 250 20,320 80 19,710 520 137,900
1,250 70 1,000 180 3,090 190 2,280 620 6,600 1,420 560 860 2,130 1,220 910 58,010
10 10 10
10 years and above
NM M W&D
18 19 20
3,780 16,200 1,910 1,720 176,490 30,120
1,250 60 .. 1,350 600 20
890 350 310 1,640
490 1,350 40 20 6,830 200
760 8,930 400 20 131,940 6,900
390 5,510 1,470 20 35,470 23,000
.. 10
5,675 25,055 1,700 2,180 31,750 6,545
935 10 685 25
1,265 160 785 80
1,865 810 485 1,205 10
1,480 16,630 275 225 24,410 1,445
130 7,445 1,425 6,030 5,090
3,540 14,690 1,780 1.690 175,210 29,910
1,250 60 1,330 600 20
880 350 310 1,630
440 1,200 40 20 6.790 200
660 8,160 370 10 131,040 6,850
310 4,920 1,370 20 35,140 22,840
10
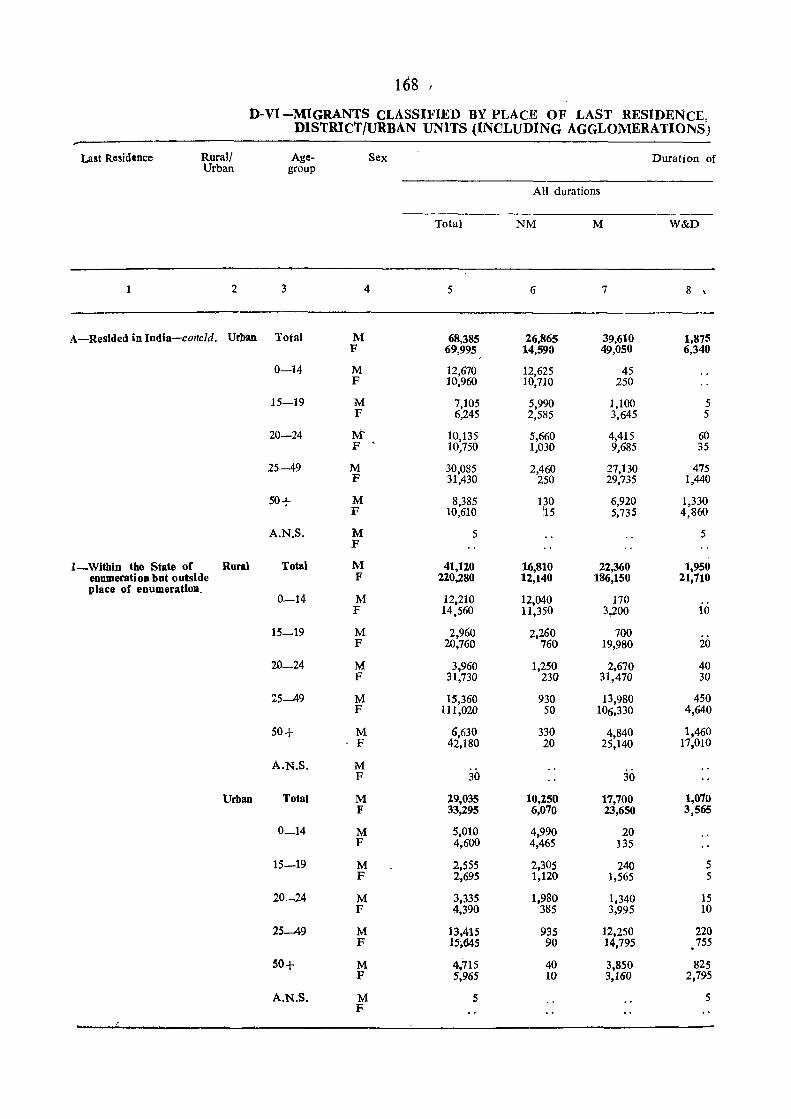
168 J
D-VI -MIGRANTS CLASSIFIED BY PLACE OF LAST RESIDENCE, DISTRICT/URBAN UNITS (INCLUDING AGGLOMERATIO~S)
Last Residence Rural! Urban
1 2
A-Resided in India-coneld. Urban
I-Within the State of Rural eDumeratio. but outside place of enumeratloD.
Urban
3
Agegroup
Total
0-14
15-19
20-24
25--49
50+
A.N.S.
Total
0-14
15~19
20-24
25-49
50+
A.N.S.
Total
0_14
15-19
20--24
25~49
50+
A.N.S.
Sex
Total
4 5
M 68,385 F 69,995
M 12,670 F 10,960
M 7,105 F 6,245
M' 10,135 F
, 10,750
M 30,085 F 31,430
M 8,385 F 10,610
M 5 F
M 41,120 F 22Q,280
M 12,210 F 14,560
M 2,960 F 20,760
M 3,960 F 31,730
M 15,360 F 111,020
M 6,630 ·F 42,180
M F 30
M 29,035 F 33,295
M 5,010 F 4,600
M 2,555 F 2,695
M 3,335 F 4,390
M 13,415 F 15,645
M 4,715 F 5,965
M 5 F
Duration of
All durations
NM M W&D
6 7 8 \
26,865 39,610 1,875 14,590 49,050 6,340
12,625 45 10,710 250
5,990 1,100 5 2,585 3,645 5
5,660 4,415 60 1,030 9,685 35
2,460 27,130 475 250 29,735 1,440
130 6,920 1,330 :15 5,735 4,860
5
16,810 22,360 1,950 12,140 186,150 21,710
12,040 170 11,350 3,200 10
2,260 700 760 19,980 20
1,250 2,670 40 230 31,470 30
930 13,980 450 50 106,330 4,640
330 4,840 1,460 20 25,140 17,010
30
10,250 17,700 1,070 6,070 23,650 3,565
4,990 20 4,465 135
2,305 240 5 1,120 1,565 5
1,980 1,340 15 385 3,995 10
935 12,250 220 90 14,795 . 755
40 3,850 825 10 3,160 2,795
5
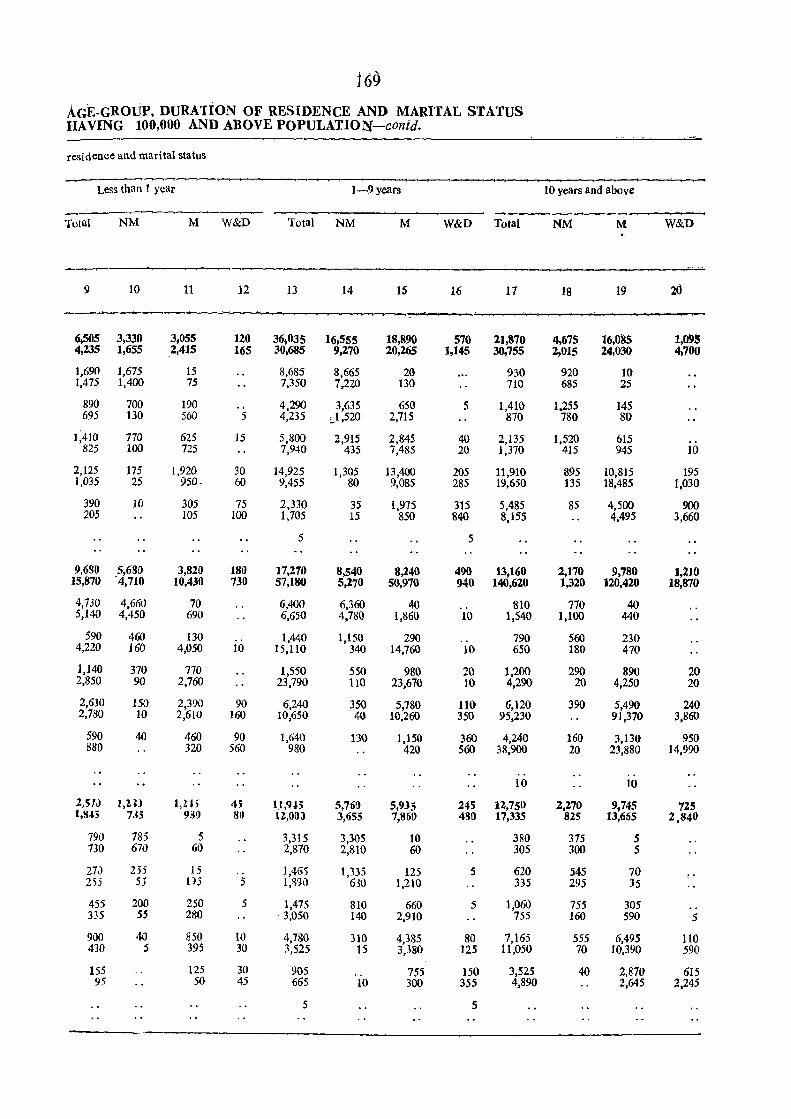
169 AGE-GROUP, DURA1ioN OF RESIDENCE AND MARITAL STATUS HAVING 100,000 AND ABOVE PQPULATION-conid.
residence and marital status
Less than 1 year 1-9 years 10 years and above
Total NM M W&D Total NM M W&D Total NM M W&D
-~
9 10 11 12 13 14 15 16 17 18 19 20
6,505 31330 3,055 120 36,035 16,555 18,890 570 21,870 4,675 16,085 1,095 4,235 1,655 2,415 165 30,685 9,270 20,265 1,145 30,755 2,015 24,030 4,700
1,690 1,675 15 8,685 8,665 20 930 920 10 1,475 1,400 7S 7,350 7,220 130 710 685 25
890 700 190 4,290 3,635 650 5 1,410 1,255 145 695 130 560 5 4,235 "-1,520 2,715 870 780 80
1;410 770 625 15 5,800 2,915 2,845 40 2,135 1,520 615 825 100 725 7,940 435 7,485 20 1,370 415 945 10
2,125 175 1,920 30 14,925 1,305 13,400 205 11,910 895 10,815 195 1,035 25 950. 60 9,455 80 9,085 285 19,650 135 18,485 1,030
390 10 305 75 2,330 35 1,975 315 5,485 85 4,500 900 205 105 100 1,705 15 850 840 8,155 4,495 3,660
5 5
9,680 5,680 3,820 180 17,270 8,540 8,24() 490 13,160 2,170 9,780 1,210 15,870 -4,710 10,43i1 730 57,180 5,270 50,970 940 140,620 1,320 120,420 18,870
4,730 4,660 70 6,400 6,360 40 .. 810 770 40 5,140 4,450 690 6,650 4,780 1,860 10 1,540 1,100 440
590 460 130 .. 1,440 1,150 290 ., 790 560 230 4,220 160 4,050 10 15,110 340 14,760 10 650 180 470
1,140 370 770 1,550 550 980 20 1,200 290 890 20 2,850 90 2,760 23,790 110 23,670 10 4,290 20 4,250 20
2,630 150 2,390 90 6,240 350 5,780 110 6,120 390 5,490 240 2,780 10 2,610 160 10,650 40 10,260 350 95,230 91,370 3,860
590 40 460 90 1,640 130 1,150 360 4,240 160 3,130 950 880 320 560 980 420 560 38,900 20 2.3,880 14,990
.. .. 10 10
2,51J 1,2)) 1,21) 4) 1l,9.H 5,761} 5,933 245 12,750 2,270 9,745 725 I,S"5 735 93!) Sf) U,OaJ 3,655 7,lIDO 480 17,335 825 13,665 2,840
790 735 5 3,315 3,305 10 380 315 5 730 670 60 2,870 2,810 60 305 300 5
27J 235 15 1,465 1,335 125 5 620 545 70 ,. 255 5; 03 5 1,~90 630 ],210 335 295 35
455 200 250 5 1,475 810 660 5 1,060 755 305 335 55 280 . 3,050 140 2,910 755 160 590 5
900 40 850 10 4,780 3]0 4,385 80 7,165 555 6,495 110 430 S 395 30 3,525 15 3,380 125 11,050 70 10,390 590
155 125 30 905 755 ]50 3,525 40 2,870 615 95 50 45 665 10 300 355 4,890 2,645 2,245
5 5
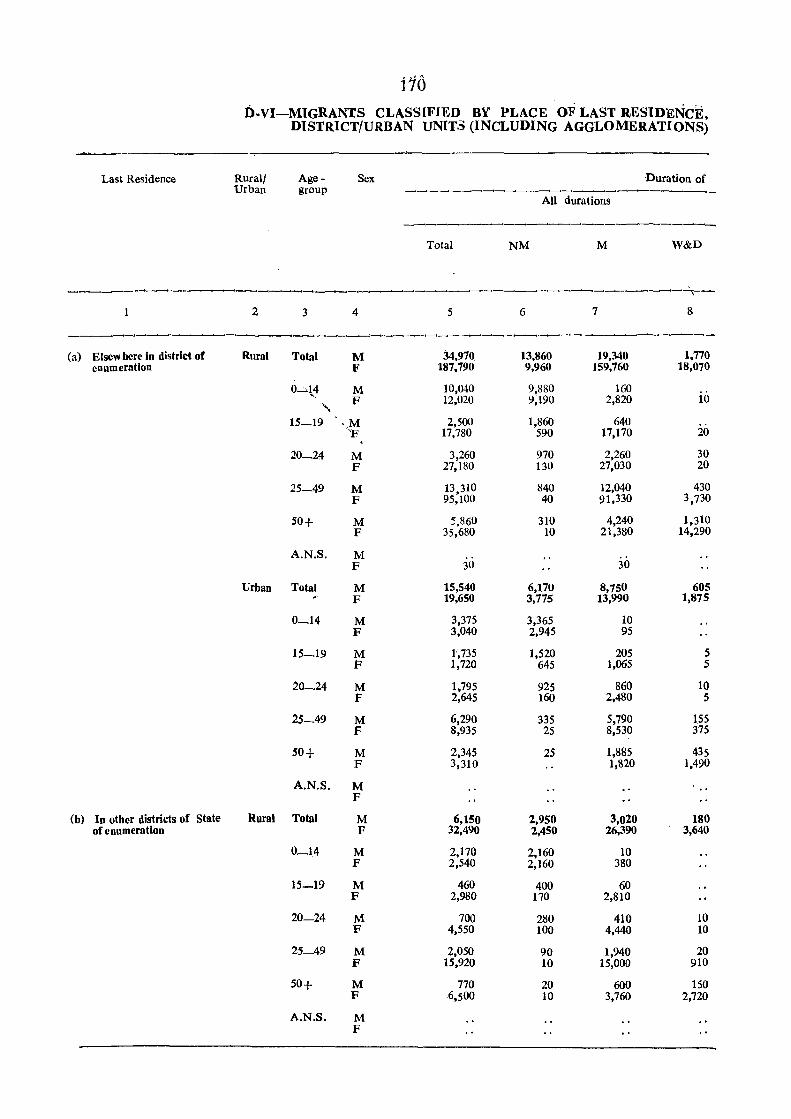
i70 0-VI-MIGRANTS CLASSIFIED BY PLACE OF LAST RESIDENCE,
DISTRICT/URBAN UN£T3 (INCLUDING AGGLOMERATIONS)
Last Residence Rural! Age- Sex -Duration of Urban group
All durations
----------..---_ Total NM M W&D
--~-------_________ _.t
----~-~-----~--2 3 4 5 6 7 8
--~-----------_.._-----~-- _---___.__-------(a) Elsew here in district of Rural Total M 34,970 13,860 19,340 1,770
cnumeration F 187,790 9,960 159,760 18,070
0--"l4 M 10,040 9,880 160 F 12,020 9;190 2,820 10
" 15-19 ,M 2,500 1,860 640 "F 17,780 590 17,170 20
20_24 M 3,260 970 2,260 30 F 27,180 130 27,030 20
25-49 M 13,310 840 12,040 430 F 95,100 40 91,330 3,730
50+ M :,860 310 4,240 1,310 F 35,680 10 21,380 14,290
A.N.S. M F 30 30
Urban Total M 15,540 6,170 8,750 60S F 19,650 3,775 13,990 1,875
0_14 M 3,375 3,365 10 F 3,040 2,945 95
15_19 M 1',735 1,520 205 5 F 1,720 645 1,065 5
20_24 M 1,795 925 860 10 F 2,645 160 2,480 5
25_49 M 6,290 335 5,790 155 F 8,935 25 8,530 375
50+ M 2,345 25 1,885 435 F 3,310 1,820 1,490
A.N.S. M F
(b) In otbcr districts of Stllte Rural Total M 6,150 2,950 3,020 180 of enumeration F 32,490 2,450 26,390 3,640
0_14 M 2,170 2,160 10 F 2,540 2,160 380
15-19 M 460 400 60 F 2,980 170 2,810
20-24 M 700 280 410 10 F 4,550 100 4,440 10
25-49 M 2,050 90 1,940 20 F 15,920 10 15,000 910
50+ M 770 20 600 150 F 6,500 10 3,760 2,720
A.N.S. M F
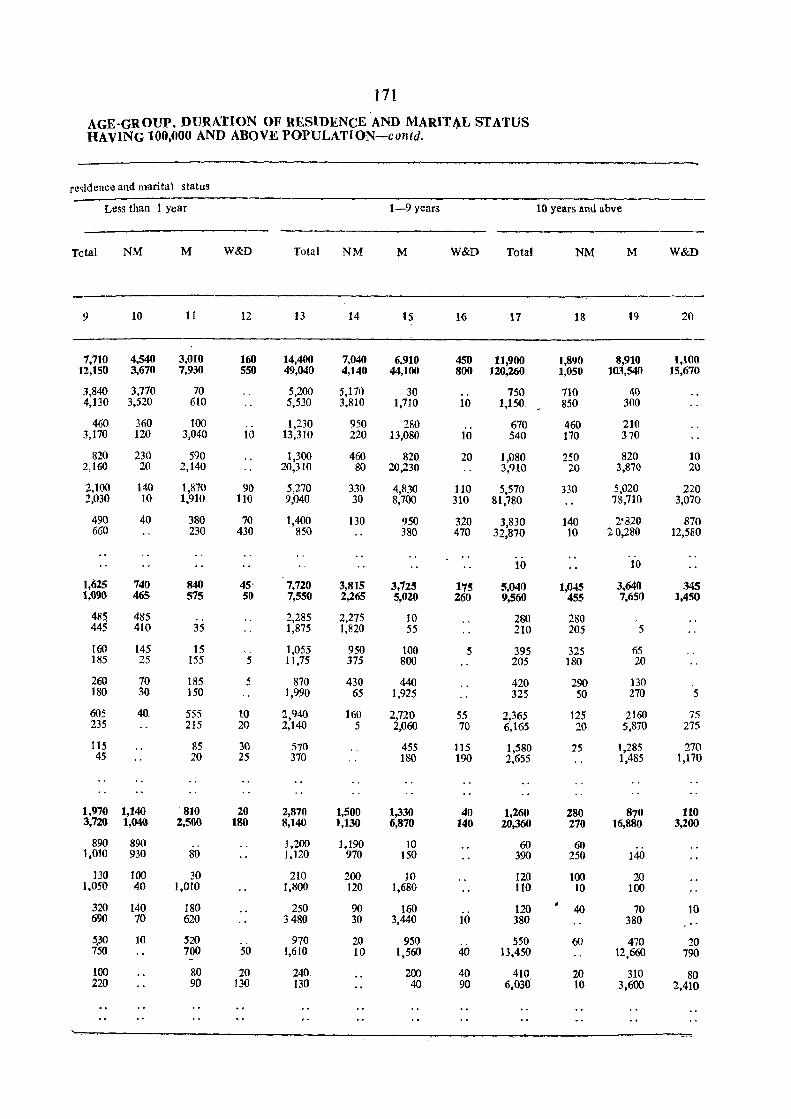
171
AGE-GROUP. DURATION OF RESIDENcE AND MARIT~L STATUS HAVING 100,000 AND ABOVE POPULATION-conid.
residence and marital status
Less than 1 year 1-9 years
Total NM M W&D Total NM M W&D Total
9 10 11 12 13 14 IS 16 17
7,710 4,540 3,010 160 14,400 7,040 6,910 450 11,900 12,150 3,670 7,930 550 49,040 4,140 44,100 800 120,260
3,840 3,770 70 5,200 5,170 30 .. 750 4,130 3,520 610 5,530 3,810 1,710 10 1,150
460 360 too .. 1,230 950 280 670 3,170 120 3,040 10 13,310 220 13,080 10 540
820 230 590 1,300 460 820 20 1,080 2,160 20 2,140 20,310 80 20,230 3,910
2,100 140 1,870 90 5,270 330 4,830 110 5,570 2,030 10 1,910 110 9,040 30 8,700 310 81,780
490 40 380 70 1,400 130 950 320 3,830 660 230 430 850 380 470 32,870
10
1,625 740 840 45 7,720 3,815 3.723 175 5,040 I,Q90 465 575 50 7,550 2,265 5,020 260 9,560
485, 485 .. 2,285 2,275 10 280 445 410 35 1,875 1,820 55 210
loo 145 15 , . 1,055 950 100 5 395 185 25 155 5 11,75 375 800 205
260 70 185 5 870 430 440 420 180 30 150 1,990 65 1,925 325
605 40. 555 10 2,940 160 2,720 55 2,365 235 215 20 2,140 5 2,060 70 6,165
115 85 30' 570 455 115 1,580 45 20 25 370 180 190 2,655
1,970 1,140 . 810 20 2,870 1,500 1,330 40 1,260 3,720 1,040 2,500 180 8,140 1,130 6,870 140 20,360
890 890 1,200 1,190 10 60 1,010 930 80 1.120 970 150 390
130 100 30 210 200 10 120 1,050 40 1,010 1.800 120 1,680 110
320 140 180 250 90 160 120 690 70 620 3480 30 3,440 10 380
5,.30 10 520 970 20 950 550 750 700 50 1,610 - 10 1,560 40 13.450
100 80 20 240 200 40 410 220 90 130 130 40 90 6,030
10 years lind abve
NM M W&D
18 19 20
1,890 8,910 1,100 1,050 103,540 15,670
710 40 850 300
460 210 170 370
250 820 10 20 3,870 20
330 5,020 220 78,710 3,070
140 2'820 870 10 20,280 12,580
.. 10
1,045 3,640 345 455 7,650 1,450
280 205 5
325 65 180 20
290 130 50 270 5
125 2160 75 20 5,870 275
25 1,285 270 1,485 1,170
280 870 110 270 16,880 3,200
60 250 140
100 20 10 100 .,
40 70 10 380
60 470 20 12,660 790
20 310 80 10 3,600 2,410
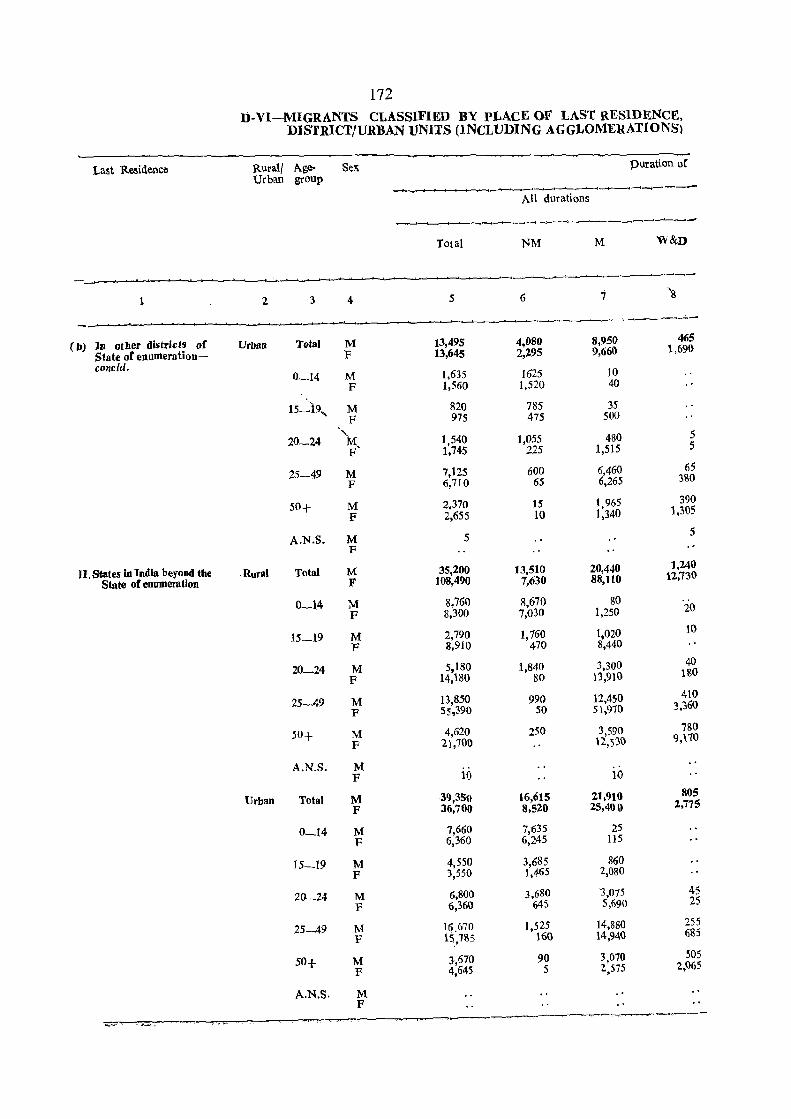
172 n-VI-MIGRANTS CLASSIFIED BY PLACE OF LAST RESlDENCE,
DISTRICT/UR:BAN UNITS (INCLUDING AGGLOMERATIONS)
Last Residence Rurall A.ge- Sex pUration of
Urban group __"__"__'_...--.I _ __.,____,--.-"""_--
All durations
~___"____"'~---",;~---~--",;--'-_""...--I---,;:__""' .......... -.-____,;__'--.-<'
TOlal NM M W&n
~___.._.
1 2 3 4 5 6 i 'g
(b) III other districts of Urban Total M 13,495 4,080 8,950 465
State or enumeration- F 13,645 2,295 9,660 1,690
concld. 0-14 M 1,635 1625 10
F 1,560 1,520 40
'. 15_19, M 820 785 35
F 975 475 500
" 5 20-24 M. 1,540 1,055 480
F 1,745 225 1,515 5
25-49 M 7,125 600 6,460 65 F 6,710 65 6,265 380
50+ M 2,370 15 1,965 390
F 2,655 to 1,340 1,305
A.N.S. M 5 5
F
II. States in India beyond the . Rural Total M 35,200 13,510 20,440 1,240
State of enumeration F 108,490 7,630 88,110 12,730
0_14 M 8,760 8,670 80 20
F 8,300 7,030 1,250
15-19 M 2,790 1,160 1,020 10
F 8,910 470 8,440
20_24 M 5,180 1,840 3,300 40
F 14,180 80 13,910 180
25-49 M 13,850 990 12,450 410
F 55,390 50 51,9'10 3,360
50+ M 4,620 250 3,590 780
F 21,700 12,530 9,110
A.N.S. M .. F 10 10
Urban Total M .39,35() 16,615 21,910 805
F 36,700 8,520 25,400 2,77'5
0_14 M 7,660 7,635 25
F 6,360 6,245 115
15-19 M 4,550 3,685 860 F 3,550 1,465 2,080
20-24 M 6,800 3,680 3,075 45
F 6,360 64S 5,690 25
25-49 M 16.670 1,525 14,880 255
F ls..;n~s 16() 14,940 685
50+ M 3,670 90 3,070 505
F 4,645 5 2,575 2,065
A.N.S. M F
-~
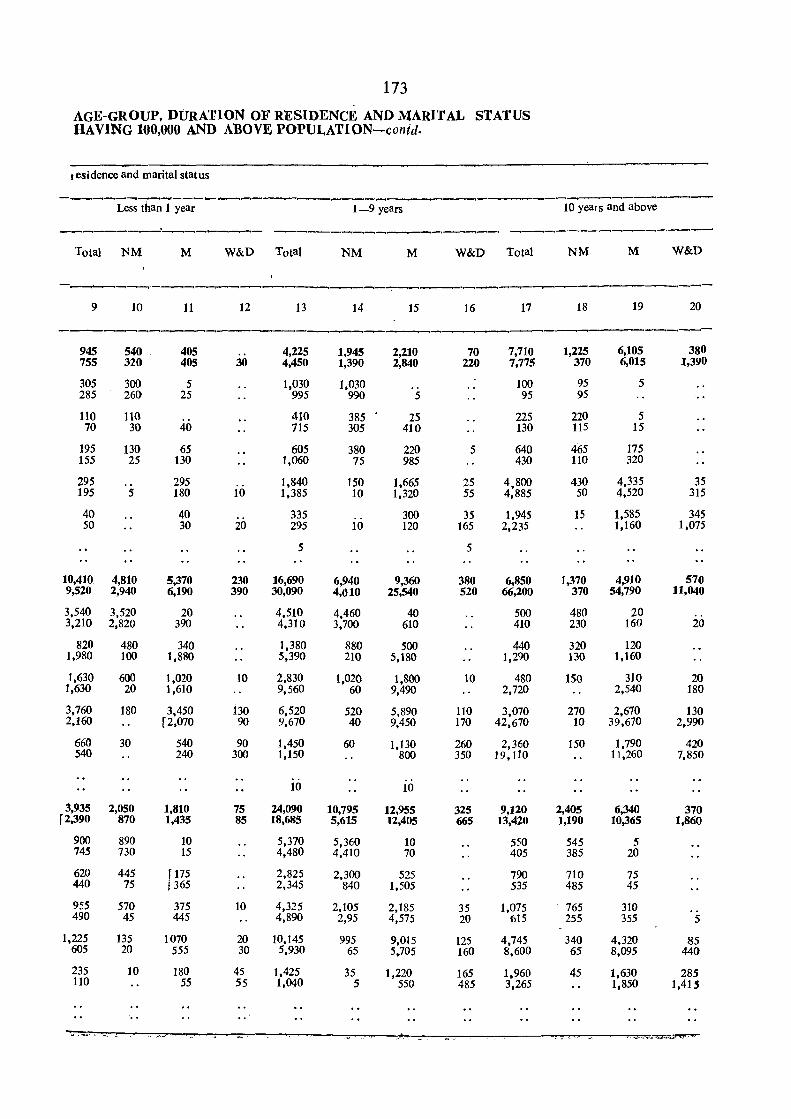
173
AGE-GROUP, DURATION OF RESIDENCE AND MARITAL STATUS HAVING 100,000 AND ABOVE POPULATION-coned.
residence and marital status
-------__...-. __ --------~-~-~~--------Less titan 1 year 1-9 years 10 years and above
---------~-------- ---------------_....,_,._- -.--.-.--..-.-------.-------Total NM M W&D Total NM M W&D Total NM M W&D
--~-.,---.-.------...-.,---~_,-_,,--------_,--_...,---------.--..-----___,-----.--
9 10 11 12 13 14 15 16 17 18 19 20
____.,------_-..-----945 540 405 .. 4,225 1,945 2,210 70 7,710 1,225 6,105 380 755 320 405 30 4,450 1,390 2,840 220 7,775 370 6,015 1,390
305 300 5 1,030 1,030 100 95 5 285 260 25 995 990 5 95 95
110 110 410 385 25 225 220 5 70 30 40 715 305 410 130 115 15
195 130 65 605 380 220 5 640 465 175 155 25 130 1,060 75 985 430 110 320
295 295 1,840 150 1,665 25 4,800 430 4,335 35 195 S 180 10 1,385 10 1,320 55 4,885 50 4,520 315
40 40 335 300 35 1,945 15 1,585 345 50 30 20 295 10 120 165 2,235 1,160 1,075
5 5
10,410 4,810 5,370 230 16,690 6,940 9,360 380 6,850 1,370 4,910 570 9,520 2,940 6,190 390 30,090 4,010 25,540 520 66,200 370 54,790 11,040
3,540 3,520 20 4,510 4,460 40 500 480 20 3,210 2,820 390 4,310 3,700 610 410 230 160 20
820 480 340 1,380 880 500 440 320 120 1,980 100 1,880 5,390 210 5,180 1,290 130 1,160
1,630 600 1,020 10 2,830 1,020 1,800 10 480 150 310 20 1,630 20 1,610 9,560 60 9,490 2,720 2,540 180
3,760 180 3,450 130 6,520 520 5,890 110 3,070 270 2,670 130 2,160 [2,070 90 9,670 40 9,450 170 42,670 10 39,670 2,990
660 30 540 90 1,450 60 1,130 260 2,360 150 1,790 420 540 240 300 1,150 800 350 19,110 11,260 7,850
10 10
3,935 2,050 1,810 75 24,090 10,795 12,955 325 9,120 2,405 6,340 370 f2,390 870 1,435 85 18,685 5,615 12,405 665 13,420 1,190 10,365 1,860
900 890 10 5,370 5,360 10 550 545 5 745 730 15 4,480 4,410 70 405 385 20
620 445 fI75 2,825 2,300 525 790 710 75 440 75 1365 2,345 840 1,505 535 485 45
955 570 375 10 4,325 2,105 2,185 35 1,075 765 310 .. 490 45 445 4,890 2,95 4,575 20 615 255 355 5
1,225 135 1070 20 10,145 995 9,015 125 4,745 340 4,320 85 605 20 555 30 5,930 65 5~705 160 8.600 65 8,095 440
235 10 180 45 1,425 35 1,220 165 1,960 45 1,630 285 110 55 55 1,040 5 550 485 3,265 1,850 1,415
..
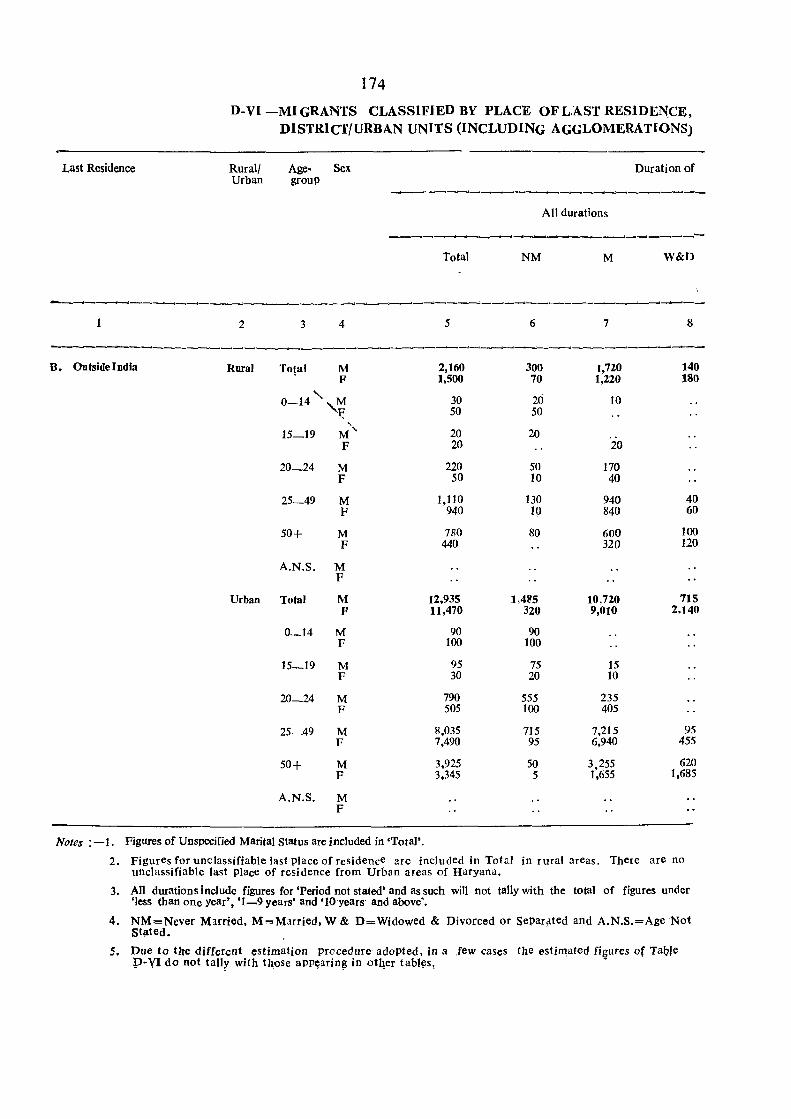
Last Residence
174
D-VI-MIGRANTS CLASSIFIED BY PLACE QFL.AST RESIDENCE, DISTRICT/URBAN UNITS (INCLUDING AGGLOMERATIONS)
Rural! Urban
Age- Sex group
Duration of ____ ---.l _________________ ___,__ ___ _
All durations
------._._-------------"-----__ -Total NM M W&D
- ________ --.1 ______________________ ....;;....", _____________________________ • ______ _
1 2 3 4 5 6 7 8
------------------------------------_-.:._-_.-----.:_-_. __ ._---_. ----B. Outside India Rural Total M 2,160 300 1,720 140
F 1,500 70 1,220 180
"- 30 20 10 0-14 ,M I? 50 50 ,
15_19 M' 20 20 F 20 20
20_24 M 220 50 170 F 50 10 40
25-49 M 1,110 130 940 40 F 940 1() 840 60
50+ M 780 80 600 100 F 440 320 120
A.N.S. M F
Urban Total M 12,935 I.4P5 10,720 715 F 11,470 320 9,010 2,140
0-14 M 90 90 F 100 100
15_19 M 95 75 15 F 30 20 10
20_24 M 790 555 235 F 505 100 405
25-49 M 8,035 715 7,215 95 F 7,490 95 6,940 455
50+ M 3,925 50 3,255 620 F 3,345 5 1,655 1,685
A.N.S. M F
Notes :-1. FigUres of Unspecified Marital status are included in 'Total'.
2. Figures for unclassifiable last place of residence are included in Total in rural areas. There are no unclassifiable last place of residence from Urban areas of Haryana.
3. All durations include figures for 'Period not stated' and as such will not tally with the total of figures under 'less than one year', '1-9 years' and '10 years' and above'.
4. NM=Never M:mied, M=Married. W·& D=Widowed & Divorced or Separ~ted and A.N.S.=Age Not Stated.
5. Due to the different estimation procedure adopted, in a Jew caseS the estimated filJures of Table p-VI do not tall¥ with those app~arin~ in otqer tables,
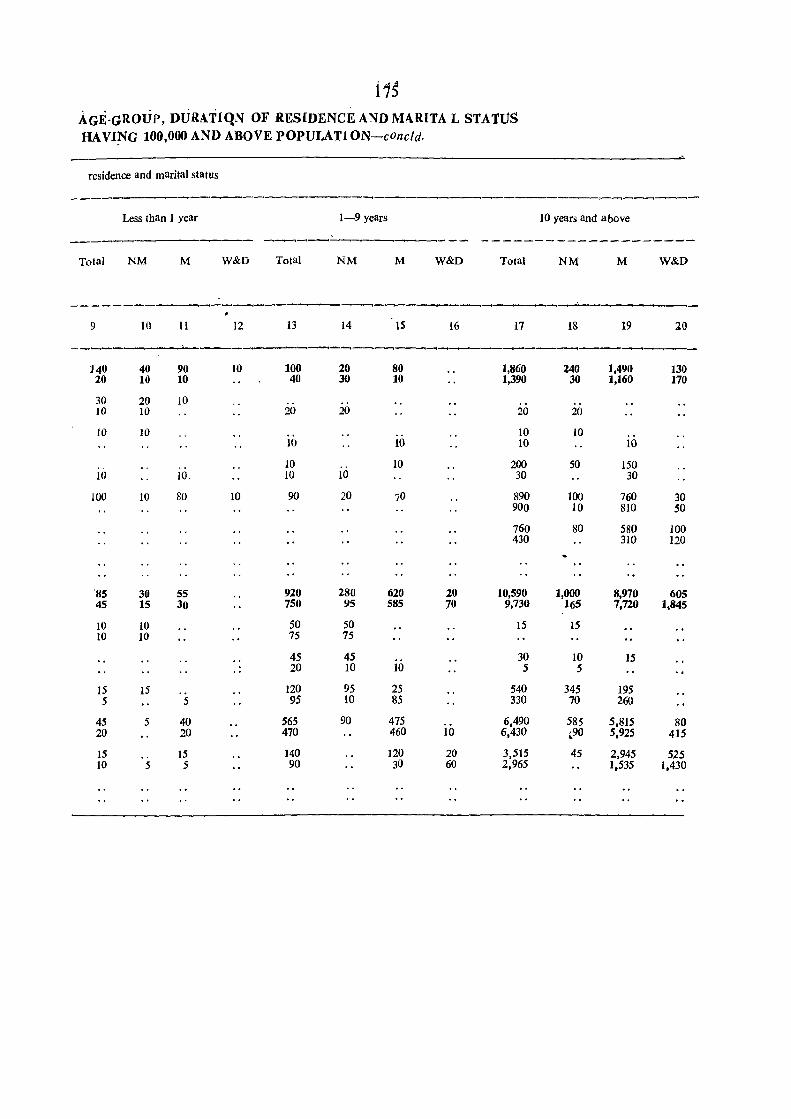
i1s AGE-GROUP, DUJ.UTIQ,~ OF RESIDENCE A~D MARITA L STATUS HAVING 100,000 AND ABOVE POPULATI ON-cOncld_
residence and marital status
Less than 1 year 1-9 years
Total NM M W&D Total NM M W&D Total
10 years and above
NM M W&D
-~------~---~------------~------~------------~---------9 10 11 12 13 14 IS 16 17 IS 19 20
----------.......:....-__-------.-..--.-.,--------_.._.._-----------.----------140 40 90 10 100 20 80 1,860 240 1,490 130 20 10 10 40 30 10 1,390 30 1,160 170
30 20 10 10 10 20 20 20 20
10 10 10 10 10 10 10 10
10 10 200 50 150 10 10, 10 10 30 30
100 10 80 10 90 20 70 890 100 760 30 900 10 810 50
760 80 580 100 430 310 120
85 30 55 920 280 620 20 10,590 1,000 8,970 605 45 15 30 750 95 585 70 9,730 165 7,720 1,845
10 10 50 50 15 15 10 10 75 75
45 45 30 10 15 .. 20 10 10 5 5
15 15 120 95 25 540 345 195 5 5 95 10 85 330 70 260
45 5 40 565 90 475 6,490 585 5,815 80 20 20 470 460 10 6,430 .90 5,925 415
15 15 140 120 20 3,515 45 2,945 525 10 5 5 90 30 60 2,965 1,535 1.430

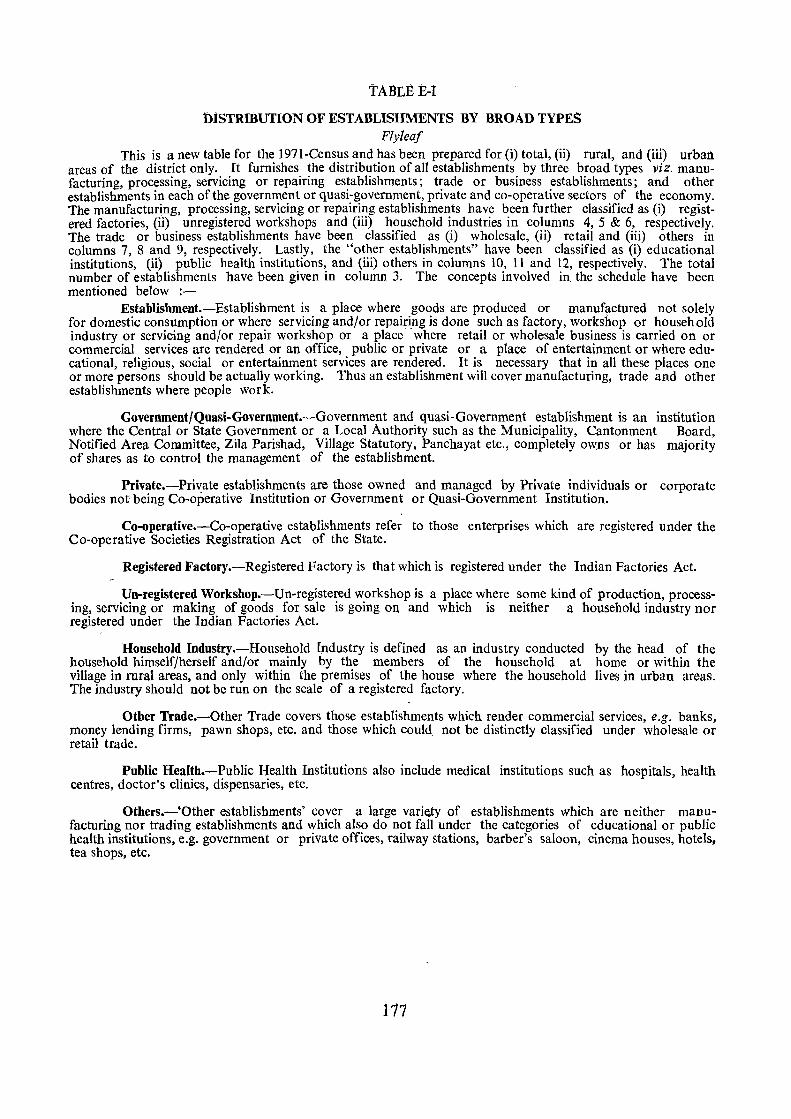
tABLE E-l
D1STRIBUTION OF ESTABLISHMENTS BY BROAD TYPES Flyleaf
This is a new table for the 1971-Census and has been prepared for (i) total, (ii) rural, and (iii) urban areas of the district only. It furnishes the distribution of all establishments by three broad types viz. manufacturing, processing, servicing or repairing establishments; trade or business establishments; and other establishments in each of the government or quasi-government, private and co-operative sectors of the economy. The manufactur~ng, processing, servicing or repairing establishments have been further classified as (i) registered factories, (ii) unregistered workshops and (iii) household industries in columns 4, 5 & 6, respectively. The trade or business establishments have been classified as (i) wholesale, (ii) retail and (iii) others in columns 7, 8 and 9, respectively. Lastly, the "other ~stablishments" have been classified as (i) educational institutions, (ii) public health institutions, and (iii) others in columns 10, 11 and 12, respectively. The total number of establishments have been given in column 3. The concepts involved in. the schedule have been mentioned below :-
Establishment.-Establishment is a place where goods are produced or manufactured not solely for domestic consumption or where servicing and/or repairing is done such as factory, workshop or household industry or servicing and/or repair workshop or a place where retail or wholesale business is carried on or commercial services are rendered or an office, public or private or a place of entertainment or where educational, religious, social or entertainment services are rendered. It is necessary that in all these places one or more persons should be actually working. Thus an establishment will cover manufacturing, trade and other establishments where people work.
Government/Quasi-Government.-Government and quasi-Government establishment is an institution where the Central or State Government or a Local Authority such as the Municipality, Cantonment Board, Notified Area Committee, Zila Parishad, Village Statutory, Panchayat etc., completely owns or has majority of shares as to control the management of the establishment.
Private.-Private establishments are those owned and managed by Private individuals or corporate bodies not' being Co-operative Institution or Government or Quasi-Government Institution.
Co-operative.-Co-operative establishments refer to those enterprises which are registered under the Co-operative Societies Registration Act of the State.
Registered Factory.-Registered Factory is that which is registered under the Indian Factories Act.
Un-registered Workshop.-Un-registered workshop is a place where some kind of production, processing, servicing or making of goods for sale is going on and which is neither a household industry nor registered under the Indian Factories Act.
Household Industry.-Household Illdustry is defined as an industry conducted by the head of the household himself/herself andlor mainly by the members of the household at home or within the village in rural areas, and only within the premises of the house where the household lives in urban areas. The industry should not be run on the scale of a registered factory.
Otber Trade.-Other Trade covers those establishments which render commercial services, e.g. banks, money lending firms, pawn shops, etc. and those which could not be distinctly classified under wholesale or retail trade.
Public Health.-Public Health Institutions also include medical institutions such as hospitals, health centres, doctor's clinics, dispensaries, etc.
Otbers.-'Other establishments' cover a large vari~y of establishments which are neither manufacturing nor trading establishments and which also do not fall under the categories of educational or public health institutions, e.g. government or private offices, railway stations, barber's saloon, cinema houses, hotels, tea shops, etc.
177

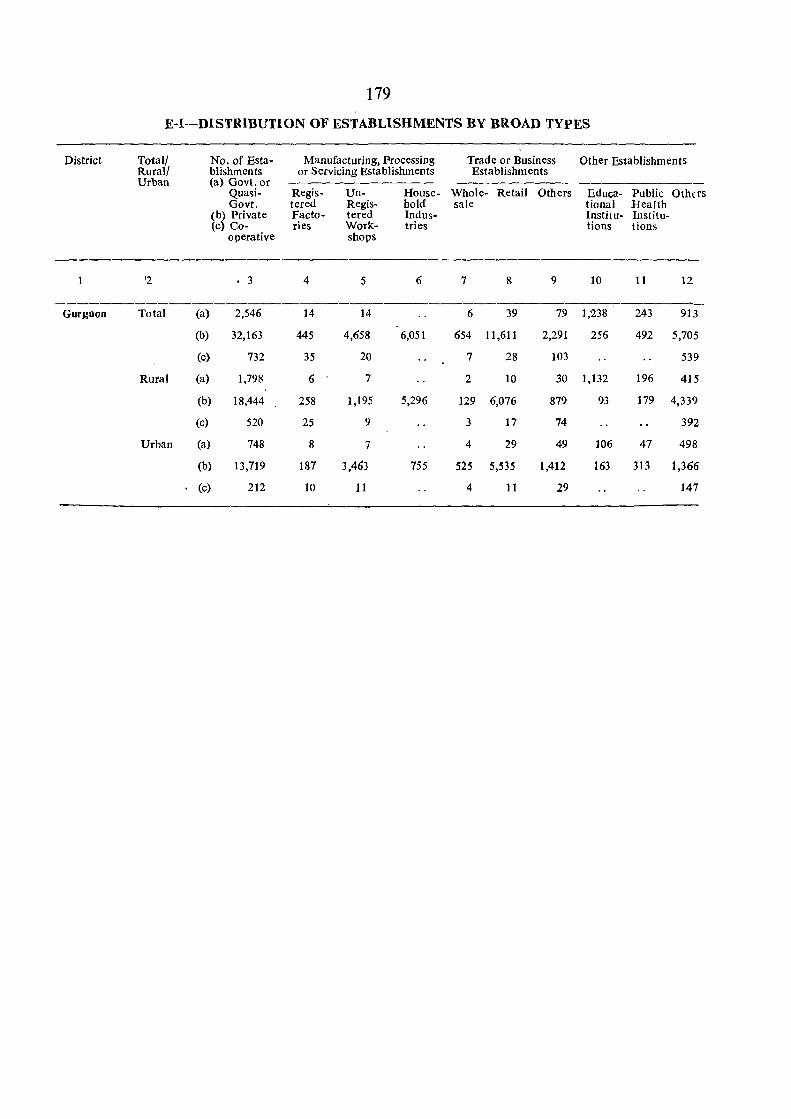
179
E-I-DISTRIBUTlON OF ESTABLISHMENTS BY :BROAD TYPES
District Total! No. of Esta- Manufacturing, Processing Trade or Business Other Establishments Rurall blishments or Servicing Establishments Establishments Urban (a) Govl. or
Quasi- Regis- Un- House- Whole- Retail Others Educa- Public Oth(fs Govt. tered Regis- hold sale tional Health
(b) Private Facto- tered Indus- Institu- Institu-(c) Co- ries Work- tries tions lions
operative shops
'2 • 3 4 5 6 7 8 9 10 11 12
------------------------------------------------------Gurgaon Total (a) 2,546 14 14 6 39 79 1,'238 243 913
(b) 32,163 445 4,658 6,051 654 11,611 2,291 256 492 5,705
(c) 732 35 20 7 28 103 539
Rural (a) 1,798 6 7 2 10 30 1,132 196 415
(b) 18,444 258 1,195 5,296 129 6,076 879 93 179 4,339
(c) 520 25 9 3 17 74 392
Urban (a) 748 8 7 4 29 49 106 47 498
(b) 13,719 187 3,463 755 525 5,535 1,412 163 313 1,366
(c) 212 10 11 4 11 29 147

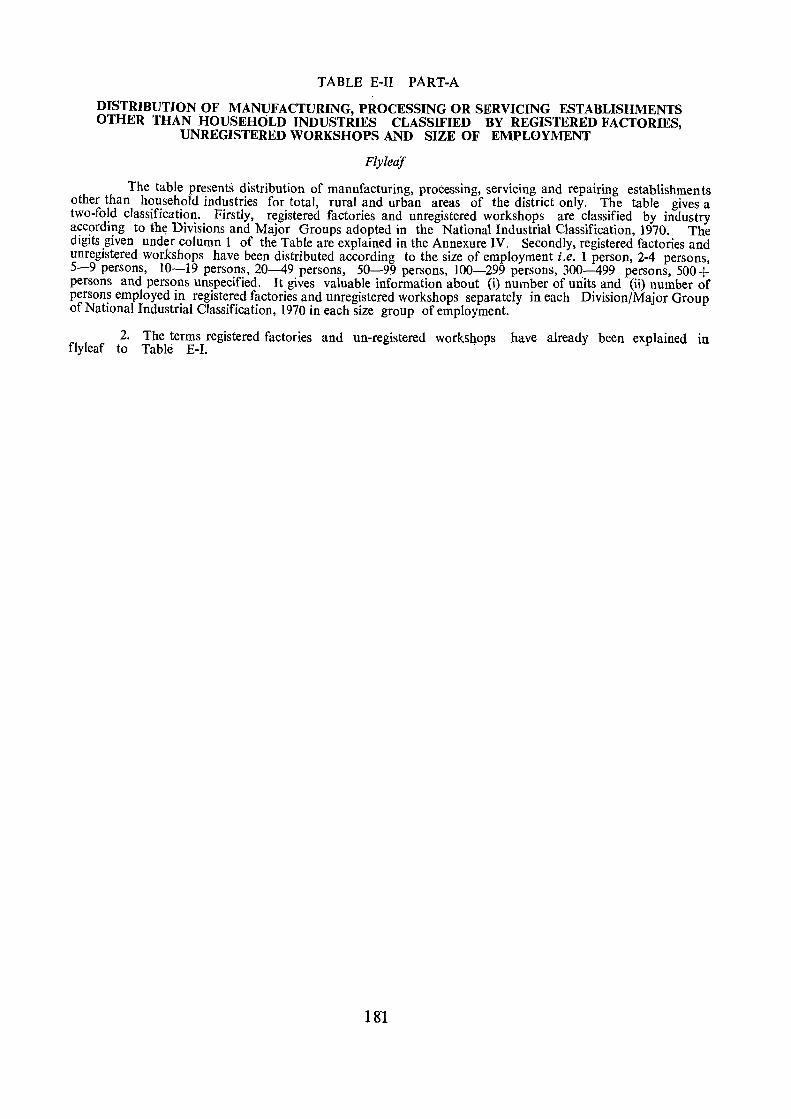
TABLE E-II PART-A
DISTRIBUTION OF MANUFACTURING, PROCESSING OR SERVICING ESTABLISHMENTS OTHER THAN HOUSEHOLD INDUSTRIES CLASSIFIED BY REGISTERED FACTORIES,
UNREGISTERED WORKSHOPS AND SIZE OF EMPLOYMENT
Flyleaf
The table presents distribution of manufacturing, processing, servicing and repairing establishments other than household industries for total, rural and urban areas of the district only. The table gives a two-fold classification. Firstly, registered factories and unregistered workshops are classified by industry according to tht? Divisions and Major Groups adopted in the National Industrial Classification, 1970. The digits given under column 1 of the Table are explained in the Annexure IV, Secondly, registered factories and unregistered wor,kshops have been distributed according to the size of employment i.e. 1 person, 2-4 persons, 5-9 persons, 10-19 persons, 20-49 persons, 50-99 persons, 100-299 persons, 300-499 persons, 500+ persons and persons unspecified. It gives valuable information about (i) number of units and (ii) number of persons employed in registered factories and unregistered workshops separately in each Division/Major Group of National Industrial Classification, 1970 in each size group of employment.
2. The terms registered factories and un-registered workshops have already been explained in flyleaf to Table E-1.
181
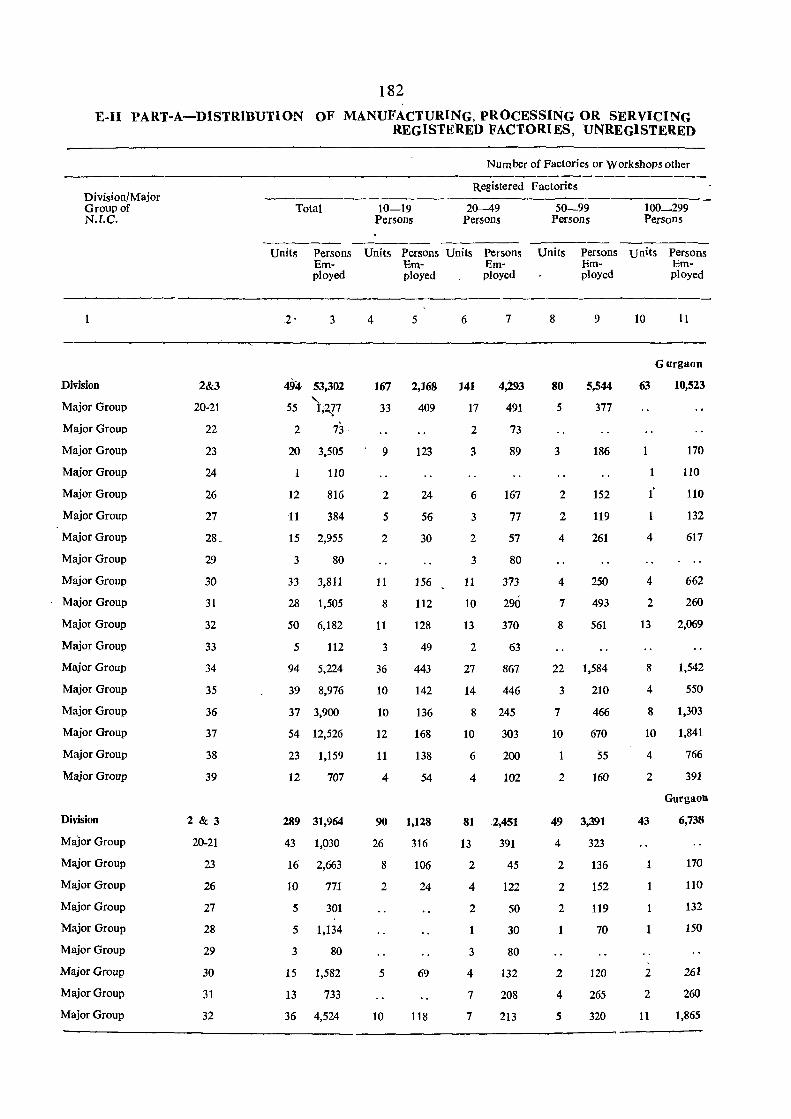
182
E-II PART-A-DISTRIBUTION OF MANUFACTURING, PROCESSING OR SERVICING REGISTERED FACTORIES, UNREGISTERED
Number of Factories or Workshops other ----------------------------,--------------------
Division/Major Group or N.I.C.
Division
Major Group
Major Group
Major Group
Major Group
Major Group
Major Group
Major Group
Major Group
Major Group
Major Group
Major Group
Major Group
Major Group
Major Group
Major Group
Major Group
Major Group
Major Group
Division
Major Group
Major Group
Major Group
Major Group
Major Group
Major Group
Major Group
Major Group
Major Group
2&3
20-21
22
23
24
26
27
28_
29
30
31
32
33
34
35
36
37
38
39
2 & 3
20-21
23
26
27
28
29
30
31
32
Total
Units
.2'
Persons Employed
3
494 53,302 "-55 1;2J7
2 73
20 3,505
110
12 816
11 384
15 2,955
3 80
33. 3,811
28 1,505
50 6,182
5 112
94 5,224
39 8,976
37 3,900
54 12,526
23 1,159
12 707
289 31,964
43 1,030
16 2,663
10 771
5 301
5 1,134
3 80
15 1,582
13 733
36 4,524
Registered Factories
10-19 Persons
20--49 Persons
Units Persons Units Persons Em- Em-ployed ployed
4 5 6 7
167 2,168 141 4,293
33 409 17 491
9
2
5
2
11
8
11
3
36
10
10
12
11
4
123
24
56
30
156
112
128
49
443
142
136
168
138
54
90 1,128
26
8
2
5
10
316
106
24
69
118
2
3
6
3
2
3
11
10
13
2
27
14
73
89
167
77
57
80
373
290
370
63
867
446
8 245
10 303
6
4
200
102
81 2,451
13
2
4
2
3
4
7
7
391
45
122
50
30
80
132
208
213
50-99 Persons
100-299 Persons
Units Persons units Em-
Persons Employed ployed
8 9 10
._---------
80
5
3
2
2
4
4
7
8
5,544
377
186
152
119
261
250
493
561
22 1,584
3 210
7
10
2
466
670
55
160
49 3,391
4
2
2
2
1
2
4
5
323
136
152
119
70
120
265
320
63
1
4
4
2
13
8
4
Gurgaon
10,523
170
110
110
132
617
662
260
2,069
1,542
550
8 1,303
10 1,841
4
2
43
2
2
11
766
391
Gurgaon
6,738
170
110
132
150
261
260
1,865
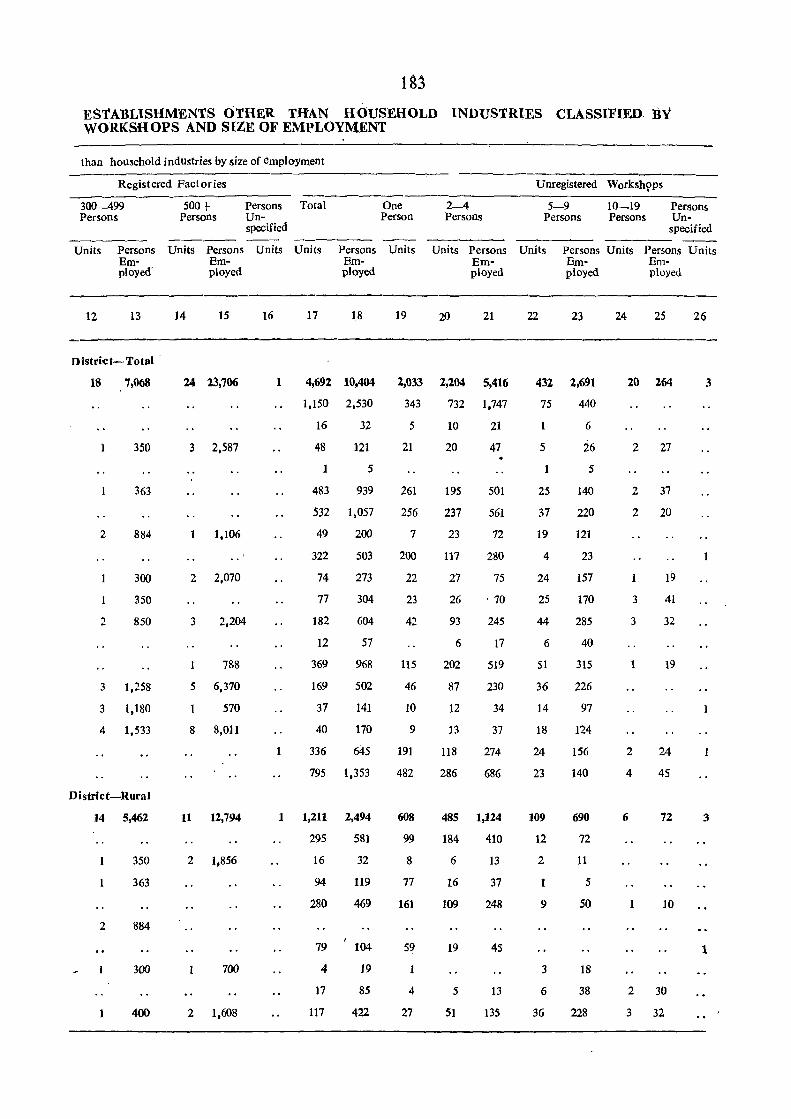
1 B3
ESTABLlSHM·£NTS OTHER TRAN HOUSEHOLD INDUSTRIES CLASSIFIED BY WORKSHOPS AND SIZE OF EMPLOYMENT
than household industries by size of employment
Registered Fact ories
---------------------------- --------300-499 Persons
Units Persons Employed'
12 13
District-Total'
18
2
2
7~068
350
363
884
300
350
850
3 1,258
3 1,180
4 1,533
District-Rural
14 5,462
350
363
2 884
300
400
500+ Persons
Persons Total Un-specified
Units Persons Units Units Em-ployed
14 15 16 17
Persons Employed
18
One Person
Units
19
2--4 Persons
Units Persons Employed
21
24 23~706 1 4~692 10;404 2~033 2~204 5~416
3 2,587
1,106
2 2,070
3 2,204
788
5 6,370
570
8 8,011
11 12,794
2 1,856
700
2 1,608
1,150 2,530
16
48
1
483
32
121
5
939
532 1,057
49
322
74
77
182
12
369
169
37
40
200
503
273
304
604
57
968
502
141
170
336 645
795 1,353
1 1,211 2,494
295
16
94
280
79 4
17
117
581
32
119
469
104
19
85
422
343
5
21
261
256
7
200
22
23
42
115
46
10
9
191
482
608
99
8
77
161
4
27
732 1,747
10
20
195
237
23
117
27
26
93
6
202
87
12
13
118
286
21
47
501
561
72
280
75
, 70
245
17
519
230
34
37
274
686
485 1,124
184
6
16
109
19
5
51
410
13
37
248
45
13
135
Unregistered Worksh9ps
5-9 Persons
10-19 Persons
Persons Un
specified
Units Persons Units Persons Units Em- Em-ployed ployed
22 23 24 2S
432 2,691 20 264
75
5
25
37
19
4
24
25
44
6
51
36
14
18
24
23
109
12
2
1
9
3
6
36
440
6
26 5
140
220
121
23
157
170
285
40
315
226
97
124
156
140
690
72
11
5
50
18
38
228
2 27
2 37
2 20
3
3
19
41
32
2
4
6
19
24
45
72
10
2 30
3 32
26
3
3
1
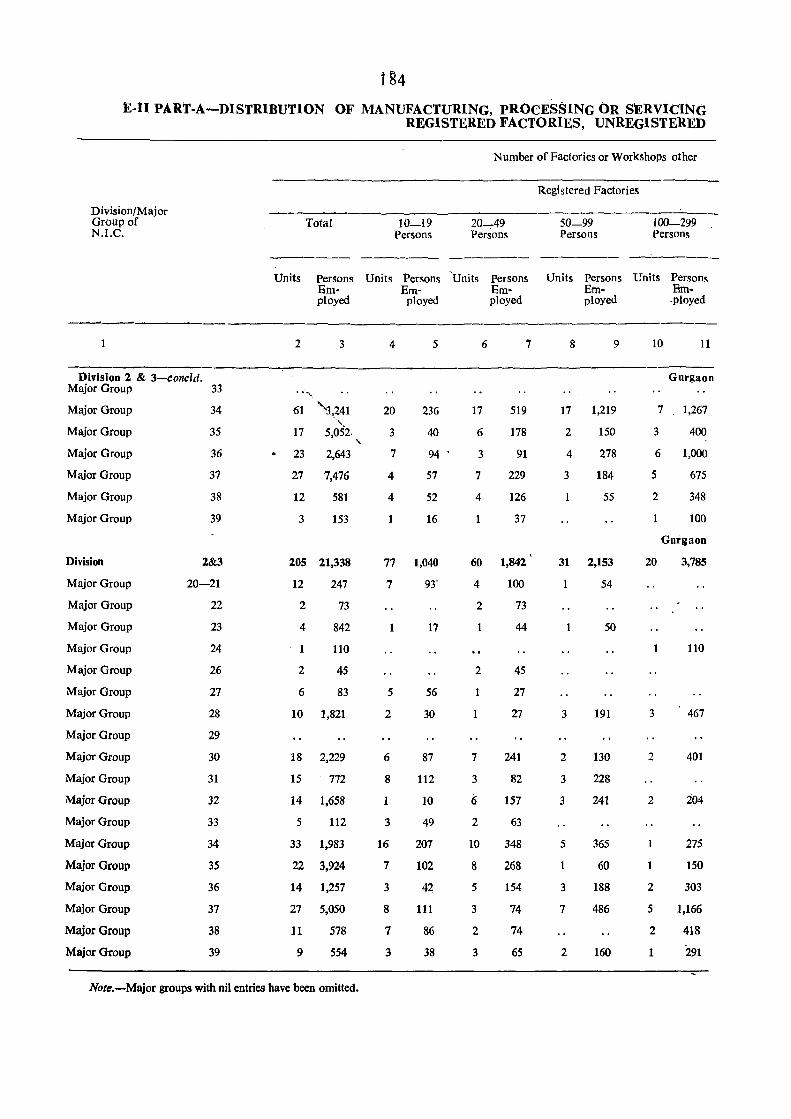
184
E-tI PART-A-DISTRIBUTION OF MANUFACTURING, pROCESSING OR S'ERVICING REGISTERED FACTORIES, UNREGISTERED
Division/Major Group of N.I.C.
Division 2 & 3-concld. Major Group 33
Major Group
Major Group
Major Group
Major Group
Major Group
Major Group
Division
Major Group
Major Group
Major Group
Major Group
Major Group
Major Group
Major Group
Major Group
Major Group
Major Group
Major Group
Major Group
Major Group
Major Group
Major Group
Major Group
Major Group
Major Group
34
35
36
37
38
39
2&3
20-21
22
23
24
26
27
28
29
30
31
32
33
34
35
36
37
38
39
Total
Units
2
",
Persons Employed
3
61 's,241 -, 17 5,052.
23 2,643
27 7,476
12
3
581
153
205 21,338
12
2
4
1
2
6
247
73
842
110
45
83
10 1,821
18 2,229
15 772
14 1,658
5 112
33 1,983
22 3,924
14 1,257
27 5,050
11
9
578
554
"-
Note.-Major groups with nil entries have been omitted.
Number of Factories or Workshops other
10-19 Persons
20-49 Persons
Units Persons 'Units Em-
Persons Employed
4
20
3
7
4
4
ployed
5
236
40
94
57
52
16
77 1,040
7
1
5
2
6
8
3
16
7
3
8
7
3
93-
17
56
30
87
112,
10
49
207
102
42
111
86
38
6
17
6
3
7
4
1
7
519
178
91
229
126
37
60 1,842
4
2
1
2
1
7
3
6
2
10
8
5
3
2
3
100
73
44
45
27
27
241
82
157
63
348
268
154
74
74
65
Registered Factories
50-99 Persons
100-299 Persons
Units Persons Units Persons Em- Em-ployed -ployed
8 9
17 1,219
2
4
3
150
278
184
55
31 2,153
54
3
2
3
3
1
5
3
7
2
50
191
130
228
241
365
60
188
486
160
10 11
Gurgaon
7 1,267
3 400
6 1,000
5 675
2
20
3
2
2
1
1
2
5
2
1
348
100
Gurgaon
3,785
110
467
401
204
275
150
303
1,166
418
291
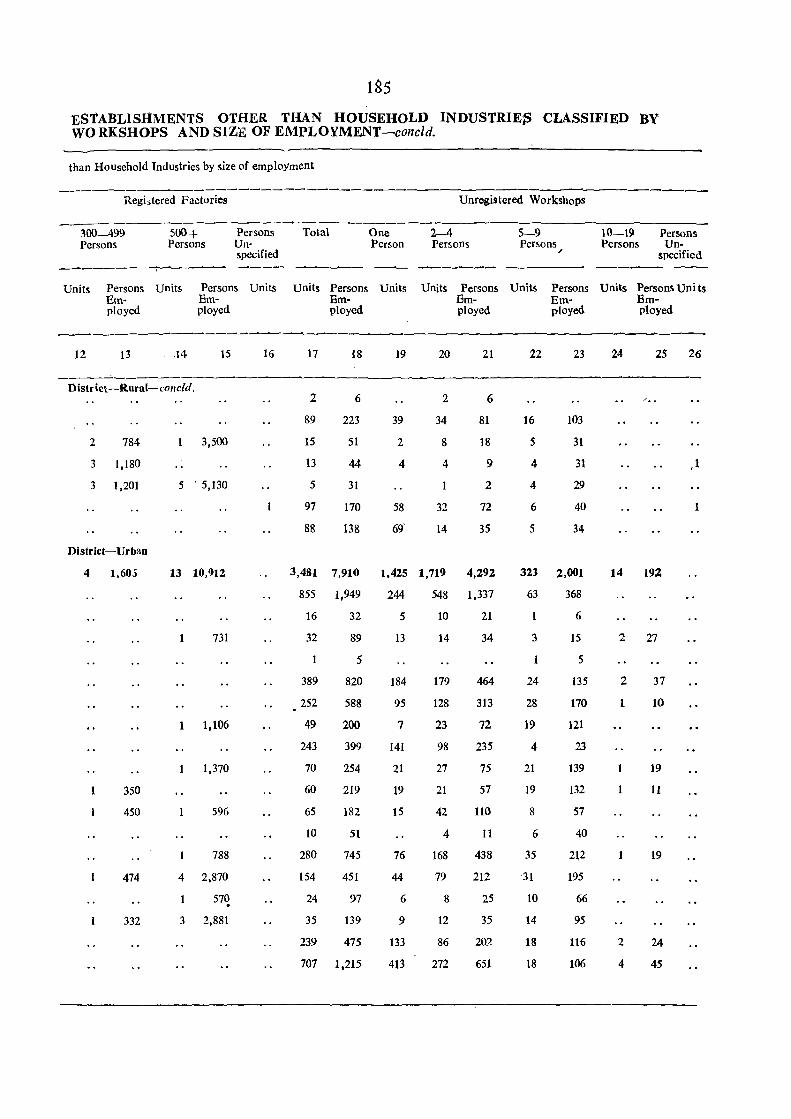
1SS ESTABLISHMENTS OTHER THAN HOUSEHOLD INDUSTRIE~ CLASSIFIED BY WO RKSHOPS AND SIZE OF EMPLOYMENT-concld.
than Household Industries by size of employment
Regi,tered Factories
300---499 Persons
500+ Persons
Persons Unspecified
Units Persons Units Em-
Persons Units Em-
ployed ployed
12 13 15
District -Rural- c:oncld.
2 784
3 1,180
3 1,201
District-Urban
4 1,60,)
350
450
474
332
3,500
5 . 5,130
13 10,912
731
1,106
1,370
596
788
4 2,870
57~
3 2.881
16
Total One Person
units Persons Units Bm-
17
2
89
15
13
5
97
88
ployed
18
6
223
51
44
31
170
138
19
39
2
4
58
69
Unregistered Workshops
2-4 Persons
5-9 Persons
"
10-19 Persons Persons Un-
specified
Units Persons Units Bm-
Persons Units Persons Uni ts Bm- Bm-
20
2
34
8
4
32
14
ployed
21
6
81
18
9
2
72
35
22
16
5
4
4
6
5
ployed ployed
23
103
31
31
29
40
34
24 25 26
,1
1
3,481 7,910 1,425 1,719 4.292 323 2,001 14 192
855 1,949 244 548 1,337
16
32
389
252
49
243
70
60
65
10
280
154
24
35
32
89
5
820
588
200
399
254
219
182
51
745
451
97
139
239 475
707 1,215
5
13
184
95
7
141
21
19
15
76
44
6
9
133
413
10
14
179
128
23
98
27
21
42
4
168
79
8
12
86
272
21
34
464
313
72
235
75
57
110
11
438
212
25
35
202
651
63 368
1
3
24
28
19
4
21
19
8
6
35
31
10
14
18
18
6
15
5
135
170
121
23
139
132
57
40
212
195
66
95
116
106
2 27
2
1
2
4
37
10
19
11
19
24
45

TABLE E-II PART-B
DISTRIBUTION OF MANUFACTURING, PROCESSING OR SERVICING ESTABLISHMENTS OTHER THAN HOUSEHOLD INDUSTRIES CLASSIFIED BY INDUSTRY, FUEL/POWER
OR MANUAL USED AND SIZE OF EMPLOYMENT Flyleaf
In this table also, the number of registered factories and un-registered workshops have been presented for total, rural and urban areas of the district and by Division/Major Group of National Industrial Classification, 1970 and by size of employment as in Table E-II Part-A. This table furnishes additional information about the kind of fuel or power used in the industries.
2. The power or fuel bas teen clasdfied into fOUf categories as under in case the machinery is employed :-
(a) El~Ctricity;
(b) Liquid Fuel;
(c) Coal, Wood and Bagasse;
(d) Other Power.
3. All such factories and workshops where no machinery is employed or where the machinery is propelled manually have been classified separately under "Manual" power.
187
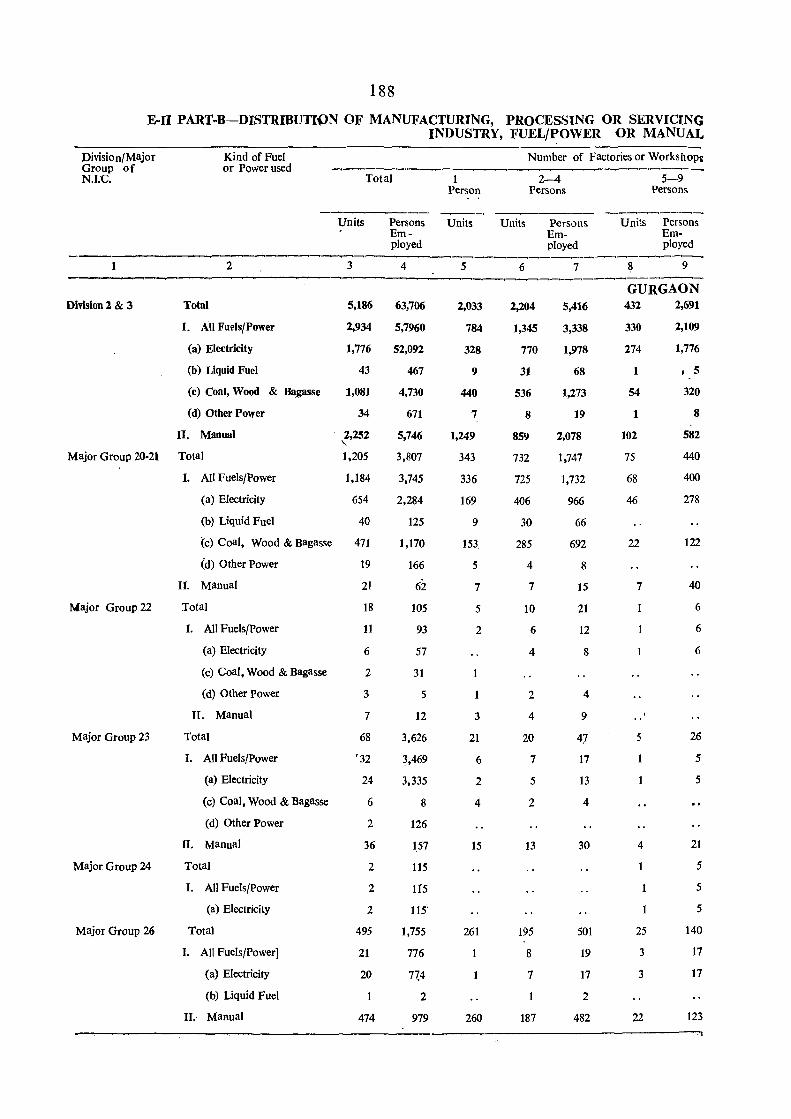
188
E-JI PART-B-DISTRIBUTI()N OF MANUFACTURING, PROCESSING OR SERVICING INDUSTRY, FUEL/POWER OR MANUAL
Division/Major Group of N.I;C.
1
Division 2 & 3
Kind of Fuel or Power used
Total
Units Persons Employed
-----~-------------2 3
Total 5,186
I. All Fuels/Power 2,934
(a) Electricity 1,776
(b) Liquid Fuel 43
(c) Coal, Wood & Bagasse 1,081
(d) Other Power 34
II. Manual 2,252 ,
4
63,706
5,7960
52,092
467
4,730
671
Major Group 20-21 Total 1,205
5,746
3,807
3,745
2,284
Major Group 22
Major Group 23
Major Group 24
Major Group 26
I. All Fuels/Power 1,184
(a) Electricity 654
(b) Liquid Fuel 40
(c) Coal, Wood & Bagasse 471
(d) Other Power
II. Manual
Total
I. All Fuels/Power
(a) Electricity
(c) Coal, Wood & Bagasse
(d) Other Power
II. Manual
Total
I. All Fuels{power
(a) Electricity
(c) Coal, Wood & Bagasse
(d) Other Power
II. Manual
Total
I. All Fuels/Power
(a) Electricity
Total
I. All Fuels/Power]
(a) Electricity
(b) Liquid Fuel
II. Maaual
19
21
18
11
6
2
3
7
68
'32
24
6
2
36
2
2
2
495
21
20
474
125
1,170
166
62
105
93
57
31
5
12
3,626
~,469
3,335
8
126
157
115
115
115'
1,755
776
7~4
2
979.
1 Person
Units
5
2,033
784
328
9
440
7
1,249
343
336
169
9
153
5
7
5
2
3
21
6
2
4
15
261
260
Number of Factories or WorkshoPi
2-4 Persons
Units Persons
6
2,204
Employed
7
5,416
1,345 3,338
770 1,978
31 68
536 1,273
8 19
859 2,078
732
725
406
30
285
4
7
10
6
4
2
4
20
7
5
2
13
195
8
7
187
1,747
1,732
966
66
692
8
15
21
12
8
4
9
47
17
13
4
30
501
19
17
2
482
5-9 Persons
U nits Persons
8
Employed
9
GURGAON 432
330
274
1
54
1
102
75
68
46
22
7
5
4
25
3
3
22
2,691
2,109
1,776
, 5
320
8
582
440
400
278
122
40
6
6
6
26
5
5
21
5
5
5
140
17
17
123
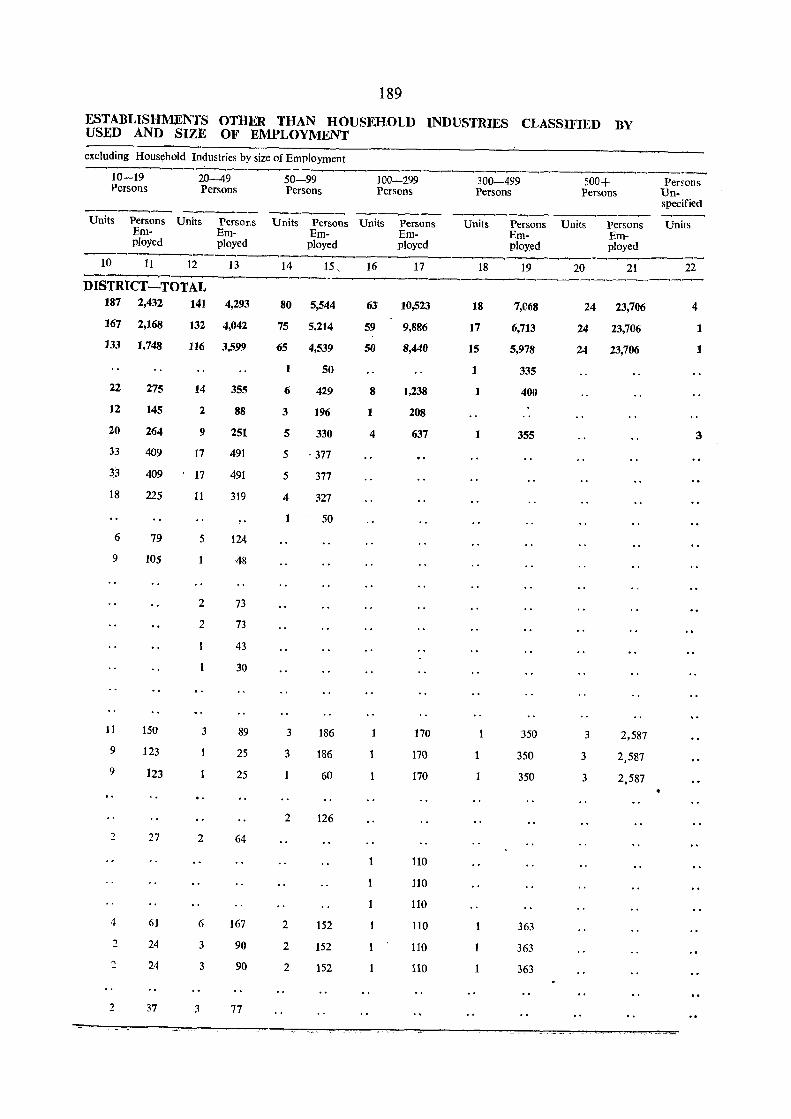
189
ESTABLISHMENTS OTHER THAN HOUSEHOLD INDUSTRIES CLASSIFIED BY USED AND SIZE OF EMPLOYMENT
excluding Household Industries by size of Employment -~--~--~.~-~---~
10-19 20-49 50-99 100-299 300-499 500+ Persons Persons Persons Persons Persons Persons Persons Un-specified
-----~ ----- --'-..---.--- _-_----~----- ----Units Persons Units Persons Units Persons Units Persons Units Persons Units Perwns Units
Em- Em- Em- Em- Em- Em-ployed ployed ployed ployed pJoy.ed ployed
10 11 12 13 14 15, 16 17 18 19 20 21 22
DISTRICT-TOTAL --~--.__,~------
187 2,432 141 4,293 80 5,544 63" 10,523 18 7,068 24 23,706 4 167 2,168 132 4,042 75 5,214 59 9,886 17 6,713 24 23,706 1 133 1,748 116 3,599 65 4,539 50 8,440 15 5,978 24 23,706 1
1 50 1 335 22 275 14 355 6 429 8 1,238 1 400 12 145 2 88 3 196 1 208
20 264 9 251 5 330 4 637 1 355 3 33 409 17 491 5 ·377
~3 409 17 491 5 377
18 225 11 319 4 327
50
6 79 5 124
9 105 48
2 73
2 73
43
30
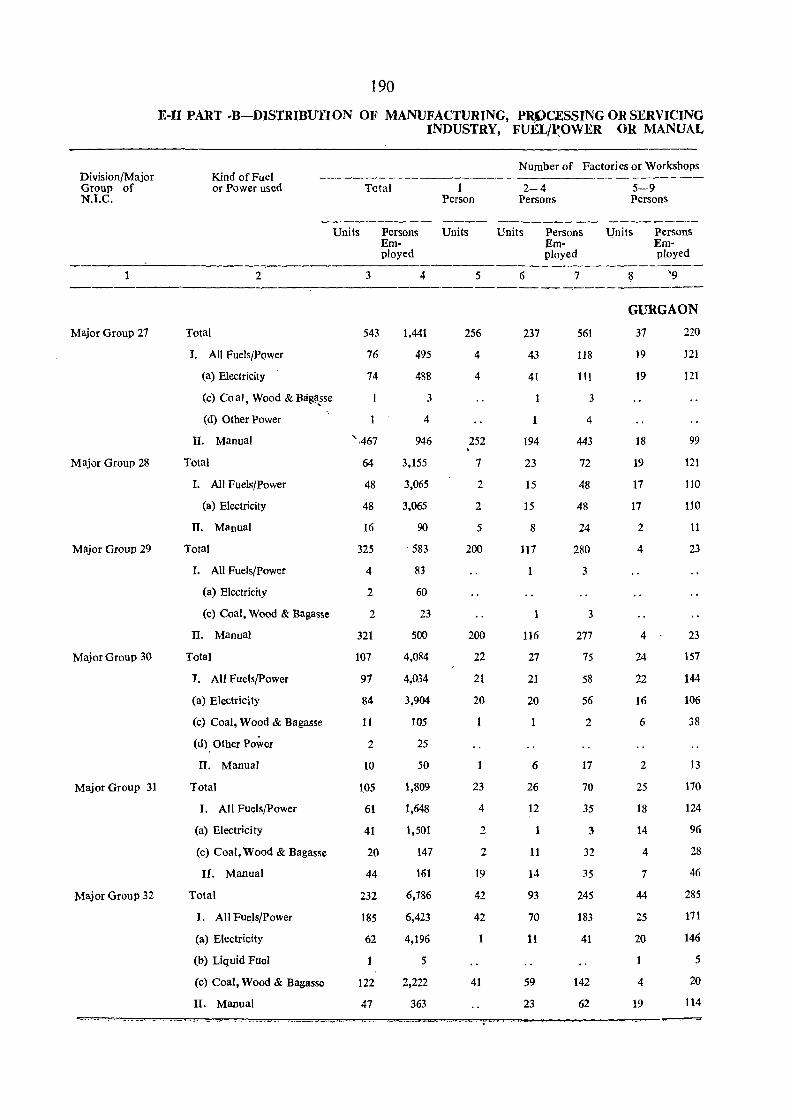
Di vision/Major Group of N.I.C.
1
Major Group 27
Major Group 28
Major Group 29
Major Group 30
Major Group 31
Major Group 32
190
E-I1 PART -B-DlSTRIBUTION OF MANUFACTURING, PRPCESSING OR SERVICING INDUSTRY, FUh'L/p.OWER OR MANUAL
Kind of Fuel or Power used
2
Total
I. All Fuels/Power
(a) Electricity
(c) Co aJ, Wood & Bag?.,sse
(d) Other Power
II. Manual
Total
I. All Fuels/Power
(a) Electricity
II. Manual
Total
I. All Fuels/Power
(a) Electricity
(c) Coal, Wood & Bagasse
II. Manua}
Total
I. All Fuels/Power
(a) Electricity
(c) Coal, Wood & Bagasse
(d). Other Power
II. Manual
Total
1. All Fuels/Power
(a) Electricity
(c) Coal, Wood & Bagasse
II. Manual
Total
1. All Fuels/Power
(a) Electricity
(b) Liquid Fuel
(c) Coal, Wood & Bagasse
II. Manual
Total
Uni ts Persons
3
543
76
74
" 467
64
48
48
16
325
4
2
2
321
107
97
84
11
2
10
105
61
41
20
44
232
185
.62
122
47
Employed
4
1,441
495
488
3
4
946
3,155
3,065
3,065
90
. 583
83
60
23
500
4,084
4,034
3,904
105
25
50
1,809
1,648
1,501
147
161
6,786
6,423
4,196
5
2,222
363
Person
Units
.5
256
4
4
252 . 7
2
2
5
200
200
22
21
20
23
4
2
2
19
42
42
1
41
Number of Factories or Workshops
2-4 Persons
Units Persons
6
237
43
41
194
23
15
15
8
l17
116
27
21
20
6
26
12
11
14
93
70
11
59
23
Employed
7
561
118
111
3
4
443
72
48
48
24
280
3
3
277
75
58
56
2
17
70
35
3
32
35
245
183
41
142
62
5-9 Persons
Units Persons
8
Employed
GURGAON
37
19
19
18
19
17
17
2
4
4
24
22
16
6
2
25
18
14
4
7
44
25
20
4
19
220
121
121
99
121
110
110
11
23
23
157
144
106
38
13
170
124
96
28
46
285
171
146
5
20
114
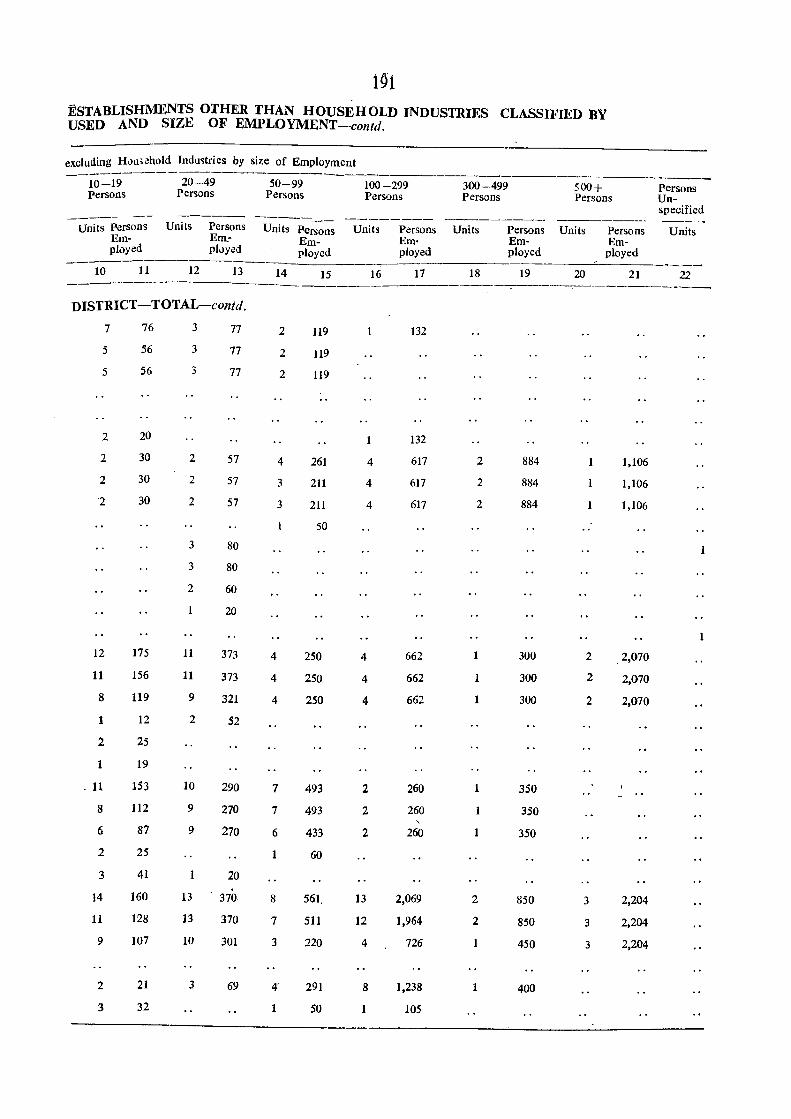
1~1
ESTABLISHMENTS OTHER THAN HOUSEHOLD INDUSTRIES CLASSIFIED:BY USED AND SIZE OF EMPLOYMENT-contd.
excluding H..m;ehold Industries by size of Employment
10-19 Persons
Units Persons Employed
10 11
20-49 50-99 Persons Persons
Units Persons
12
Em.pjvyed
13
Units Persons Employed
14 15
DISTRICT - TOTAL-conid.
7
5
5
2
2
2
2
12
11
8
1
2
1
.11
8
6
2
3
14
11
9
2
3
76
56
56
20
30
30
30
175
156
119
12
25
19
153
112
87
25
41
160
128
107
21
32
3
3
3
2
2
2
3
3
2
11
11
9
2
10
9
9
13
13
10
3
77
77
77
57
57
57
80
80
60
20
373
373
321
52
290
270
270
20
370
370
301
69
2
2
2
4
3
3
4
4
4
7
7
6
1
8
7
3
4'
1
119
119
119
261
211
211
50
250
250
250
493
493
433
60
561.
511
220
291
50
100 -299 Persons
--------Units Persons
Em-ployed
16 17
132
132
4 617
4 617
4 617
4 662
4 662
4 662
2 260
2 260
2 260
13 2,069
12 1,964
4 726
8 1,238
105
300-499 500+ Persons Persons
--------- -------Units Persons Units Persons
Em- Em-ployed ployed
18 19 20 21
2 884 1 1,106
2 884 1,106
2 884 1,106
1 300 2 2,070
1 300 2 2,070
300 2 2,070
350
350
1 350
2 850 3 2,204
2 850 3 2,204
1 450 3 2,204
1 400
Persons Un-specified ----
Units
22
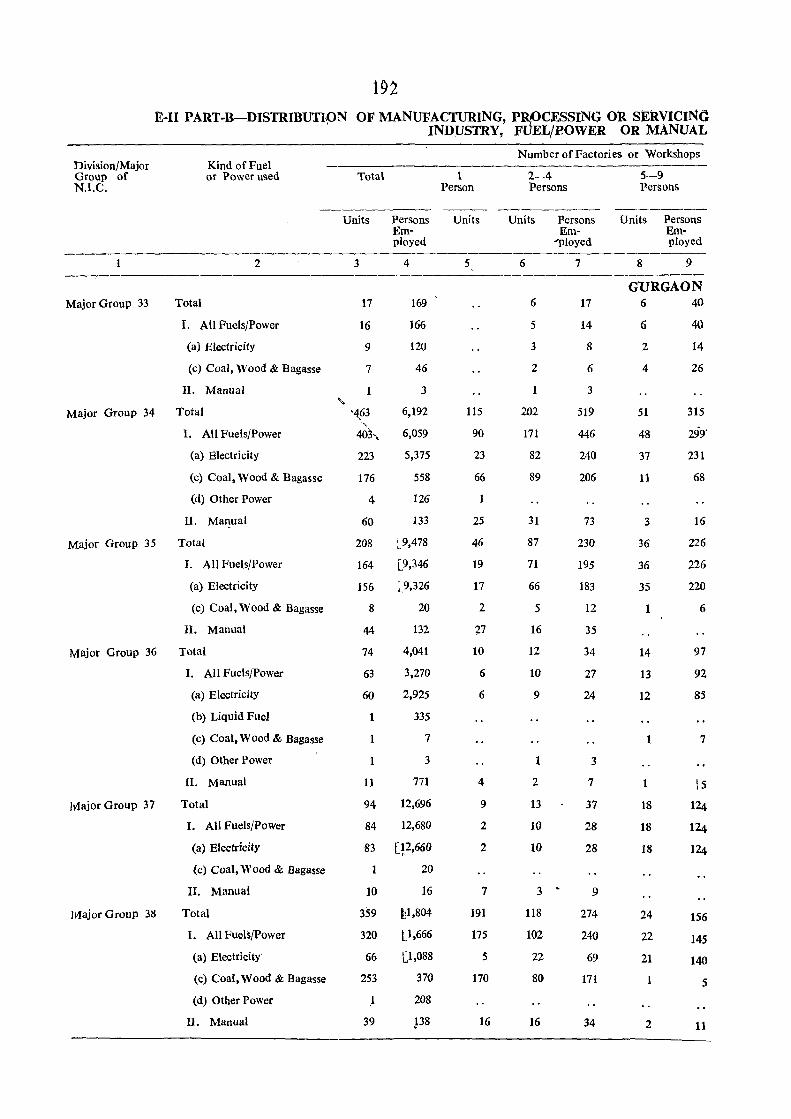
E-U PART-B-DISTRIBUTIpN OF MANUFACTURING, P~pCESSING On. SERVICING INDUSTRY, FuEL/POWER OR MANUAL
Division/Major Group of N.I.C.
1
Major Group 33 Total
Kind of Fuel or Power used
2
I. All Fuels/Power
(a) Electricity
(c) Coal, Wood & Bagasse
II. Manual
Major Group 34 Total
1. All Fuels/Power
(a) Electricity
(c) Coal, Wood & Bagasse
(d) Other Power
II. Manual
Major Group 35 Total
1. All Fuels/Power
(a) Electricity
(c) Coal, Wood & Bagasse
II. Manual
Major Group 36 Total
M.ajor Group 37
Major Group 311
I. All Fuels/Power
(a) Electricity
(b) Liquid Fue]
(c) Coal, Wood & Bagasse
(d) Other Power
II. Manual
Total
I. All Fuels/Power
(a) Electricity
(c) Coal, Wood & Bagasse
II. Manual
Total
I. All Fuels/Power
(a) Electricity'
(c) Coal, Wood & Bagasse
(d) Other Power
II. Manual
Total
Units Persons
.....
3
17
16
9
7
1
'463 "
403"
223
176
4
60
208
164
156
8
44
74
63
60
1
1
11
94
Employed
4
169
166
120
46
3
6,192
6,059
5,375
558
126
133
~_ 9,478
[9,346
l_9,326
20
132
4,041
3,270
2,925
335
7
3
771
12,696
84 12,680
83 [P,660
1
10
359
320
66
253
1
39
20
16
~1,804
Ll,666
[1,088
370
208
p8
1 Person
Units
5
115
90
23
66
25
46
19
17
2
27
10
6
6
4
9
2
2
7
191
175
5
170
16
Number of Factories or Workshops
2-4 Persons
Units Persons Em-
1Jloyed
6
6
5
3
2
1
202
171
82
89
31
87
71
66
5
16
12
10
9
1
2
13
10
10
3 ~
118
102
22
80
16
7
17
14
8
6
3
519
446
240
206
73
230
195
183
12
35
34
27
24
3
7
37
28
28
9
274
240
69
171
34
5-9 Persons
Units Persons Employed
8 9
GURGAON 6
6
2
4
51
48
37
11
3
36
36
35
1
14
13
12
1
1
18
18
18
24
22
21
1
2
40
40
14
26
315
299'
231
68
16
226
226
220
6
97
92
8S
7
[5
124
124
124
156
145
140
5
11
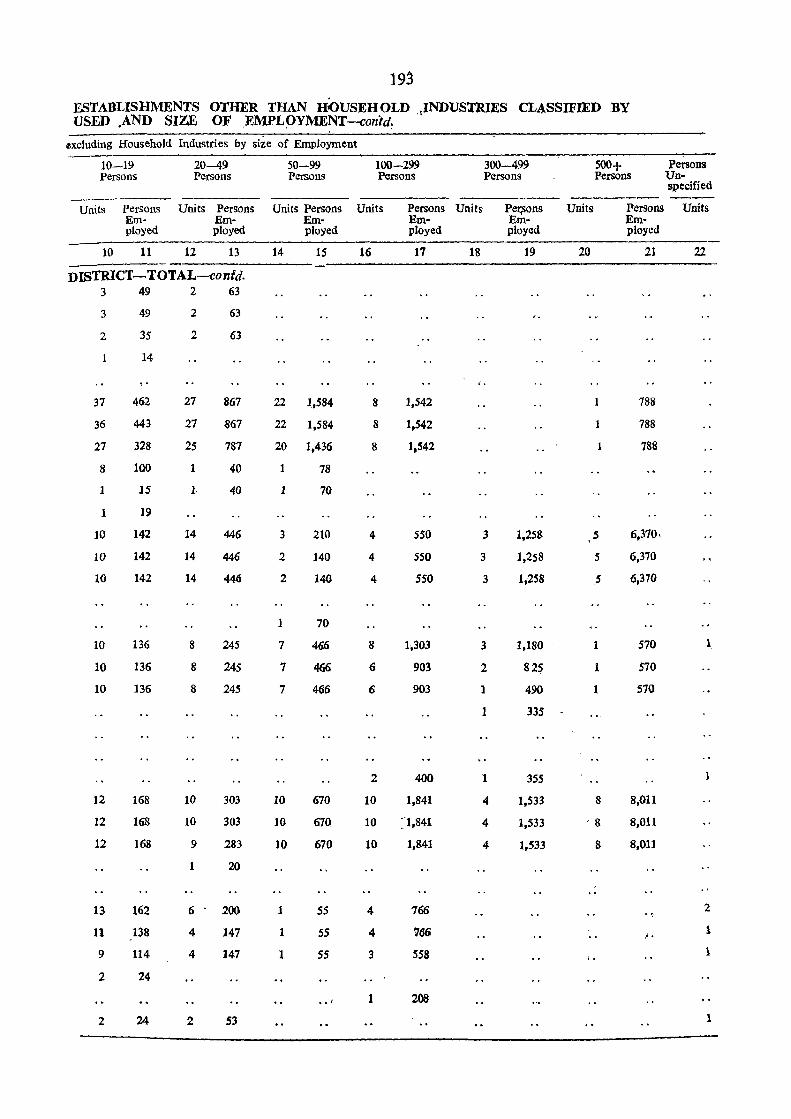
193
ESTABLISHMENTS OTHER THAN HOUSEHOLD .JNDUSl'RI£S CLASSIFIED BY USED .AND SIZE OF EMPL9YMENT-conid~
excluding Household Industries by size of Employment
10-19 20-49 50-99 100-299 300-499 500+ Persons Persons Persons Persons Persons Persons Persons Un-
specified
Units PerSons Units Persons Units Persons Units Persons Units Per,sons Units Persons Units Em- Em- Em- Em- Em- Em-ployed ployed ployed ployed ployed ployed
10 11 12 13 14 15 16 17 18 19 20 21 22
DISTRICT-TOTAL-confd. 3 49 2 63
3 49 2 63
2 35 2 63
14
.. 37 462 27 867 22 1,584 8 1,542 788
36 443 27 867 22 1,584 8 1,542 788
27 328 2S 787 20 1,436 8 1.542 788
8 100 1 40 78
1 IS 1 40 1 70
1 19
10 142 14 446 3 210 4 550 3 1,258 5 6,370,
10 142 14 446 2 140 4 550 3 1,258 5 6,370
10 142 14 446 2 140 4 550 3 1,258 5 6,370
1 70
10 136 8 245 7 466 8 1,303 3 1,180 1 570 1
10 136 8 245 7 466 6 903 2 82? 1 570
10 136 8 245 7 466 6 903 1 490 1 570
1 335
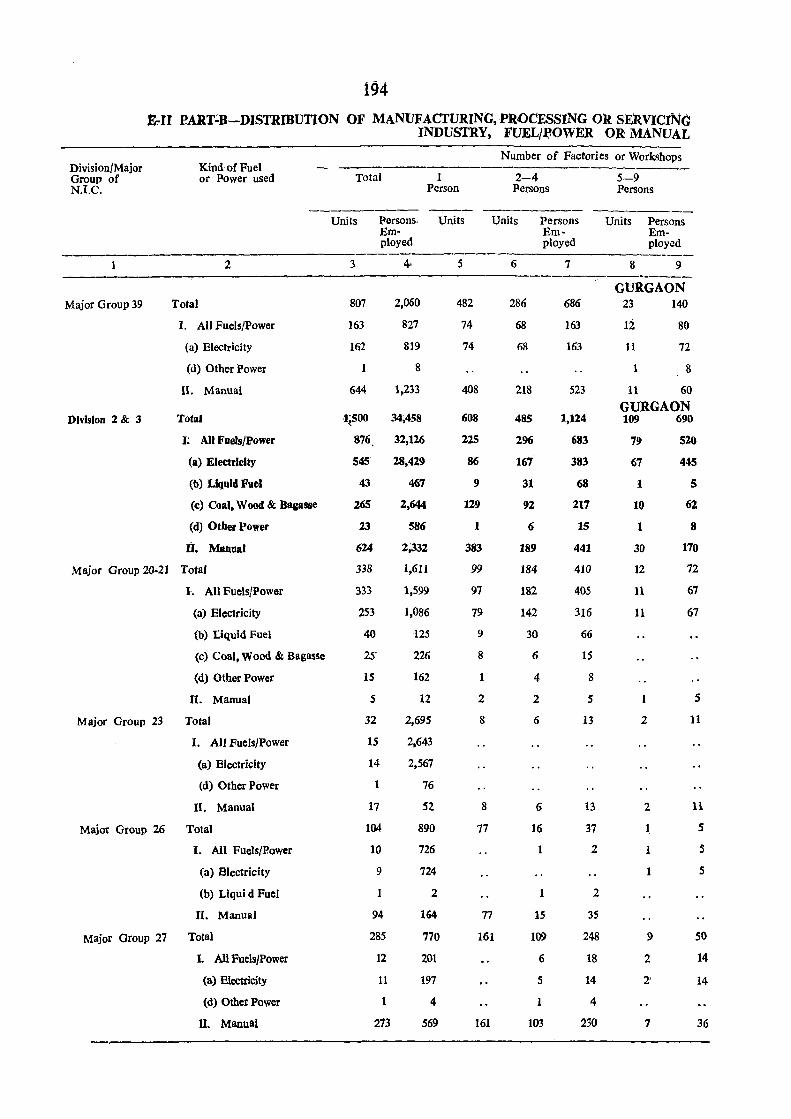
194
£,.n P.ART~B-DlSTRIBUTlON OF MANUFACTURING, PR()CESSING Ok SE:aV1CING INDUSTRY, FUELmOWER OR MANUAL
Division/Major Group of N.I.C.
1
Major Group 39
DivisIon 2 & 3
Total
Kind of Fuel or Power used
2
I. All Fuels/Power
( a) Electricity
(d) Other Power
II. Manual
Total
I; All Fuels/Power
(a) Electricity
(b) Liquid Fuel
(c) Coal, Wood & Bagasse
(d) Other Power
Ii. Manual
Major Group 2O~21 Total
Major Group 23
1. AU Fuels/Power
(a) Electricity
(b) Liquid Fuel
(c) Coal, Wood & Bagasse
(d) Other Power
II. Manual
Total
I. AU Fuels/Power
(a) Electricity
(d) Other Power
II. Manual
Major Group 26 Total
I. All Fuels/Power
(a) Electricity
(b) Liqui d Fuel
II. Manual
Major Group 27 Total
I. All Fuels/Power
(a) Electricity
(d) Other Power
n. Manual
Total 1 Person
Number of Factories or Workshops
2-4 Persons
5-9 Persons
Units Persons, Units Em-
Units Persons Units Persons
ployed
3
807
163
162
2,060
827
819
8 1
644
·1~500
1,233
34;458
876 32,126
545 28,429
43 467
265 2,644
23 586
624 2~332
3J8 1,611
333 1,599
253 1,086
40
25'
15
5
32
15
14
1
17
104
10
9
94
285
12
11
1
273
125
226
162
12
2,695
2,643
2,567
76
52
890
726
724
2
164
770
201
197
4
569
5
482
74
74
408
608
225
86
9
129
1
383
99
97
79
9
8
1
2
8
8
77
77
161
161
Employed
6
286
68
68
218
485
296
167
31
92
6
189
184
182
142
30
6
4
2
6
6
16
1
15
109
6
5
1
103
7
686
163
163
523
1,124
683
383
68
217
15
441
410
405
316
66
15
8
5
13
13
37
2
2
3S
248
18
14
4
230
Employed
8 9
GURGAON 23
12
11
1
140
80
72
8
11 60
GURGAON 109 690
79
67
1
10
1
30
12
11
11
1
2
2
1
1
1
9
2
2'
7
520
445
5
62
8
170
72
67
67
5
11
11
5
5
5
50
14
14
36
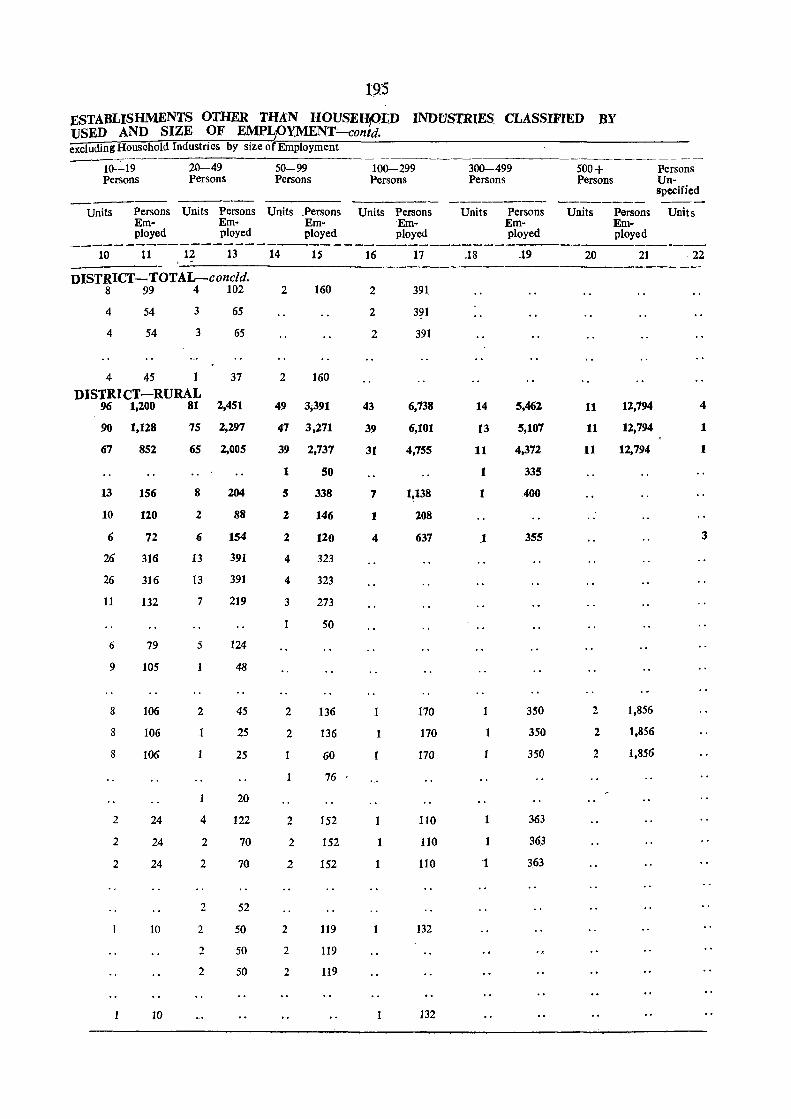
19,5
ESTABLISHMENTS OTHER THAN HOUSEHtOLD INDUSTRIES CLASSIFIED BY USED AND SIZE OF EMPLpYMENT.c-.conid. excluding Household Industries by size of Employment
----10-19 20--49 50-99 100-299 300-499 500+ Persons Persons Persons Persons Persons Persons Persons Un-
specified ----- ------ ------- ---
Units Persons Units Persons Units .Persons Units Persons Units Persons Units Persons Units Em- Em- Em- Em- Em- Em-ployed ployed ployed ployed ployed ployed
10 11 12 13 14 IS 16 17 .18 .19 20 21 22 , -DISTRICT - TOTAL-concld.
8 99 4 102 2 160 2 391
4 54 3 65 2 391
4 54 3 65 2 391
4 45 1 37 2 160
DISTRICT-RURAL 96 1,200 81 2,451 49 3;391 43 6,738 14 5,462 11 12,794 4
90 1,128 75 2,297 47 3,271 39 6,101 13 5,107 11 12,794 1
67 852 65 2,005 39 2,737 31 4,755 11 4,372 11 12,794 1
1 50 1 335
13 156 8 204 5 338 7 1,138 1 400
10 120 2 88 2 146 1 208
6 72 6 154 2 120 4 637 .1 355 3
26' 316 13 391 4 323
26 316 13 391 4 323
11 132 7 219 3 273
50
6 79 5 124
9 105 48
8 106 2 45 2 136 1 170 350 2 1,856
8 106 25 2 136 170 350 2 1,856
8 106 25 60 170 350 2 1,856
76
20
2 24 4 122 2 152 110 1 363
2 24 2 70 2 152 1 110 363
2 24 2 70 2 152 1 110 1 363
2 52
10 2 50 2 119 132
2 50 2 119
2 50 2 119
10 132
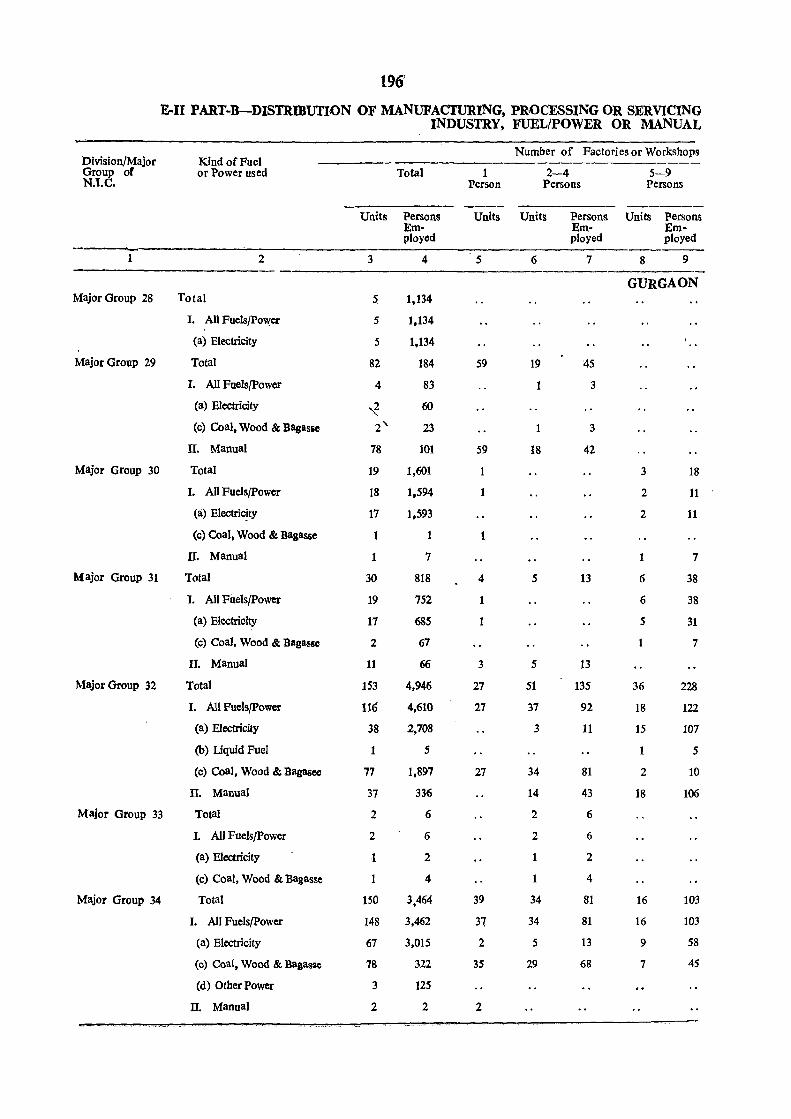
196!
E-II PART-B-DlsnmunoN OF MANUFACTURING, PROCESSING OR SERVICING INDUSTRY, FUEL/POWER OR MANUAL
Division/Major Kind of Fuel Number of Factories or Workshops
Group of or Power used Total 1 2-4 5-9 NJ.C. Person Persons Persons
------Units Persons Units Units Persons Units Persons
Em- Em- Em-ployed ployed ployed
2 3 4 5 6 7 8 9
GURGAON Major Group 28 Total 5 1,134
I. All FuelsJPower 5 1,134
(a) Electricity 5 1,134
Major Group 29 Total 82 184 59 19 4S
J. All Fuels/power 4 83 1 3
(a) Electricity ~ 60
(c) Coal, Wood & Bagasse 2' 23 1 3
II. Manual 78 101 59 18 42
Major Group 30 Total 19 1.601 1 3 18
I. All Fuels/power 18 1,594 1 2 11
(a) ElectriC!ty 17 1.593 2 11
(c) Coal, Wood & Bagasse 1 1 1
II. Manual 1 7 7
Major Group 31 Total 30 818 4 5 13 6 38
i. All Fue!s/power 19 752 1 6 38
(a) Electricity 17 685 1 5 31
(c) Coal, Wood & Bagasse 2 67 7
II. Manual 11 66 3 5 13
Major Group 32 Total 153 4,946 27 51 135 36 228
I. All Fuels/power 116 4,610 27 37 92 18 122
(a) Electricity 38 2,708 3 11 15 107
(b) Liquid Fuel 1 5 1 5
(c) Coal, Wood & Bagasee 77 1,897 27 34 81 2 10
II. Manual 37 336 14 43 18 106
Major Group 33 Total 2 6 2 6
1. AIl Fuels/Power 2 6 2 6
(a) Electricity 1 2 1 2
(c) Coal, Wood & Bagasse 1 4 4
Major Group 34 Total 150 3,464 39 34 81 16 103
1. All FuelsJPower 148 3,462 37 34 81 16 103
(a) Electricity 67 3,015 2 5 13 9 58
(c) Coal. Wood & BagllSae 78 322 35 29 68 7 45
(d) Other Power 3 125 .. II. Manual 2 2 2
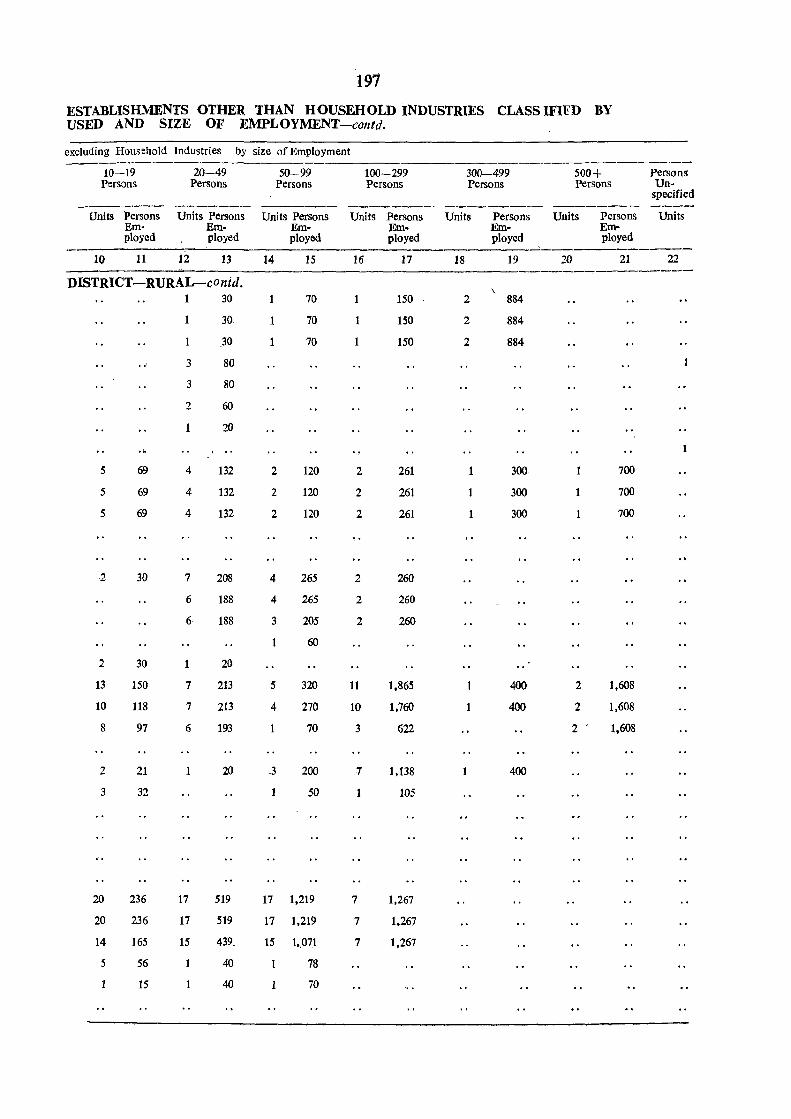
197
ESTABLISHMENTS OTHER THAN HOUSEHOLD INDUSTRIES CLASSIF1FD BY USED AND SIZE OF EMPLOYMENT-contdo
excluding Household Industries by size of Employment
10-19 20-49 Persons Persons
------- -------Units Persons Units Persons
Em- Em-ployed ployed
10 11 i2 13
DISTRICT-RURAL-conid.
5
5
5
2
2
13
10
8
2
3
20
20
14
5
OJ'
69
69
69
30
30
150
118
97
21
32
236
236
165
56
15
1
3
3
2
4
4
4
7
6
6
7
7
6
17
17
15
30
30
30
80
80
60
20
132
132
132
208
188
188
20
213
213
193
20
519
519
439.
40
40
50-99 Persons
----Units Persons
Em-ployed
14 15
70
1 70
70
2 120
2 120
2 120
4 265
4 265
3 205
60
5 320
4 270
70
3 200
50
17 1,219
17 1,219
15 1,,071
78
70
100-299 Persons
-------Units
16
1
1
2
2
2
2
2
2
11
10
3
7
7
7
7
Persons Em-ployed
17
150
150
150
261
261
261
260
260
260
1,865
1,760
622
1,138
105
1,267
1.267
1,267
300-499 500+ Persons Persons
------- -------Units Persons Units Persons
Em- Em-ployed ployed
18 19 20 21
\ 2 884
2 884
2 884
300 700
300 700
300 700
400' 2 1,608
400 2 1,608
2 . 1,608
400
Persons Un-
specified
Units
22
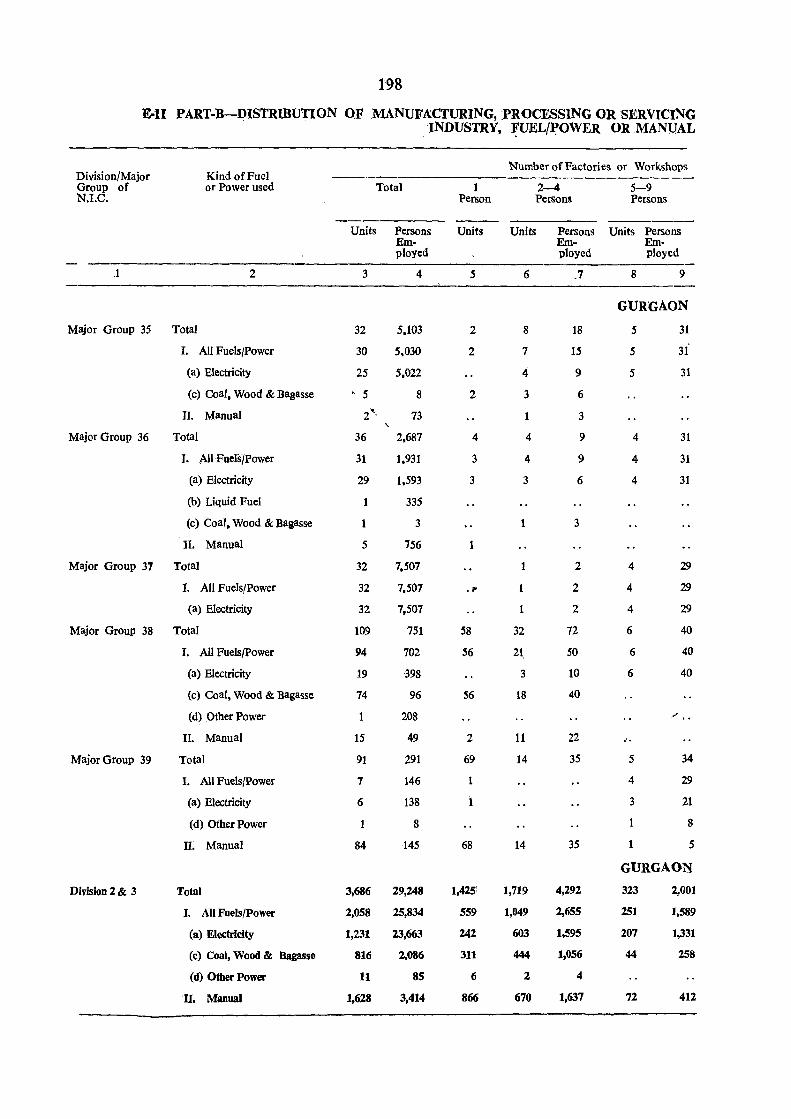
198
E-lI PART-B-DISTRIBUTION OF .MANUFACTURING, PROCESSING OR SERVICING INDUSTRY, :rrUELWOWER OR MANUAL
Division/Major Kind of Fuel Number of Factories or Workshops
Group of or Power used Total 1 2-4 5-9 N.I.C. Person Persons Persons
Units Persons Units Units Persons Units Persons Em- Em- Em-ployed ployed ployed
.1 2 3 4 5 6 .7 8 9
GURGAON
Major Group 35 Total 32 5.103 2 8 18 5 31
r. All Fuels/Power 30 5.030 2 7 15 5 31
(a) Electricity 25 5.022 4 9 5 31
(c) Coal. Wood & Bagasse h 5 8 2 3 6
II. Manual 2'<· 73 1 3 , Major Group 36 Total 36 2.687 4 4 9 4 31
I. All-Fuels/Power 31 1.931 3 4 9 4 31
(a) Electricity 29 1.593 3 3 6 4 31
(b) Liquid Fuel 335
(c) Coal, Wood & Bagasse 1 3 3
II. Manual 5 756
Major Group 37 Total 32 7.507 2 4 29
r. All Fuels/Power 32 7.507 .... 2 4 29
(a) Electricity 32 7,507 1 2 4 29
Major Group 38 Total 109 751 58 32 72 6 40
r. All Fuels/Power 94 702 56 21 SO 6 40
(a) Electricity 19 198 3 10 6 40
(c) Coal, Wood & Bagasse 74 96 56 18 40
(d) Other Power 1 208 _,.
II. Manual 15 49 2 11 22
Major Group 39 Total 91 291 69 14 35 5 34
1. All FuelsfPower 7 146 4 29
(a) Electricity 6 138 i 3 21
(d) Other Power 8 1 8
II; Manual 84 145 68 14 35 5
GURGAON
Division 2 & 3 Total 3,686 29,248 1,425: 1,719 4,292 323 2,001
I. All FuelS/Power 2,058 25,834 559 1,049 2,655 251 1,589
(a) Electricity 1,231 23,663 242 603 1,595 207 1,331
(c) Coal, Wood & Bagasse 816 2,086 311 444 1,056 44 258
(d) Other Power 11 85 6 2 4
'no Manual 1,628 3,414 866 670 1,637 72 412
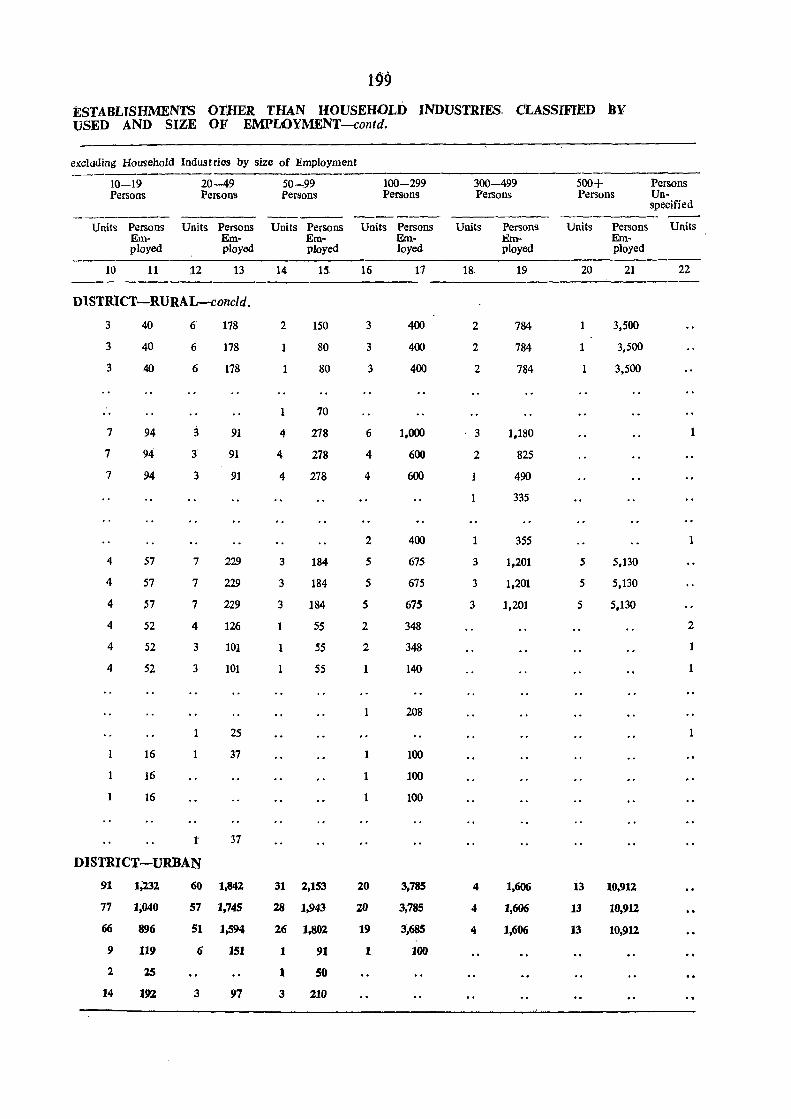
1~9
ESTABLISHMENTS OTHER THAN HOUSEHOLD INDUSTRIES. CLASSIFIED BY USED AND SIZE OF EMPLOYMENT -contd.
excluding Household Industries by size of Employment
10-19 20-49 50-99 100-299 300-499 500+ Persons Persons Persons Persons Persons Persons Persons Un-
specified ------ -------
Units Persons Units Persons Units Persons Units Persons Units Persons Units Persons Units Em- Ero- Em- Em- .t:m- Em-ployed ployed ployed loyed. ployed ployed
10 11 12 13 14 15 16 11 18· 19 20 21 22 ---DISTRICT-RURAL-concld.
3 40 6· 178 2 150 3 400 2 784 1 3,500
3 40 6 178 80 3 400 2 784 1 3,500
3 40 6 178 80 3 400 2 784 3,500
1 70
7 94 3 91 4 278 6 1,000 3 1,180 1
7 94 3 91 4 278 4 600 2 825
7 94 3 91 4 278 4 600 490
335
2 400 355 1
4 57 7 229 3 184 5 675 3 1,201 5 5,130
4 57 7 229 3 184 5 675 3 1,201 5 5.130
4 ~7 7 229 3 184 5 675 3 1,201 5 5,130
4 52 4 126 55 2 348 2
4 52 3 101 1 55 2 348
4 52 3 101 55 1 140
1 208
25
16 1 37 1 100
16 1 100
16 1 100
l' 37
DISTRICT-URBAN
91 1;231 60 1,841 31 1,153 10 3,785 4 1,606 13 10,911
77 1;040 57 1,745 28 1,943 20 3,785 4 1,606 13 10,912
66 896 51 1,594 26 1,802 19 M85 4 1,606 13 10,912
9 119 6 151 1 91 1 100
2 15 1 SO
14 192 3 97 3 210
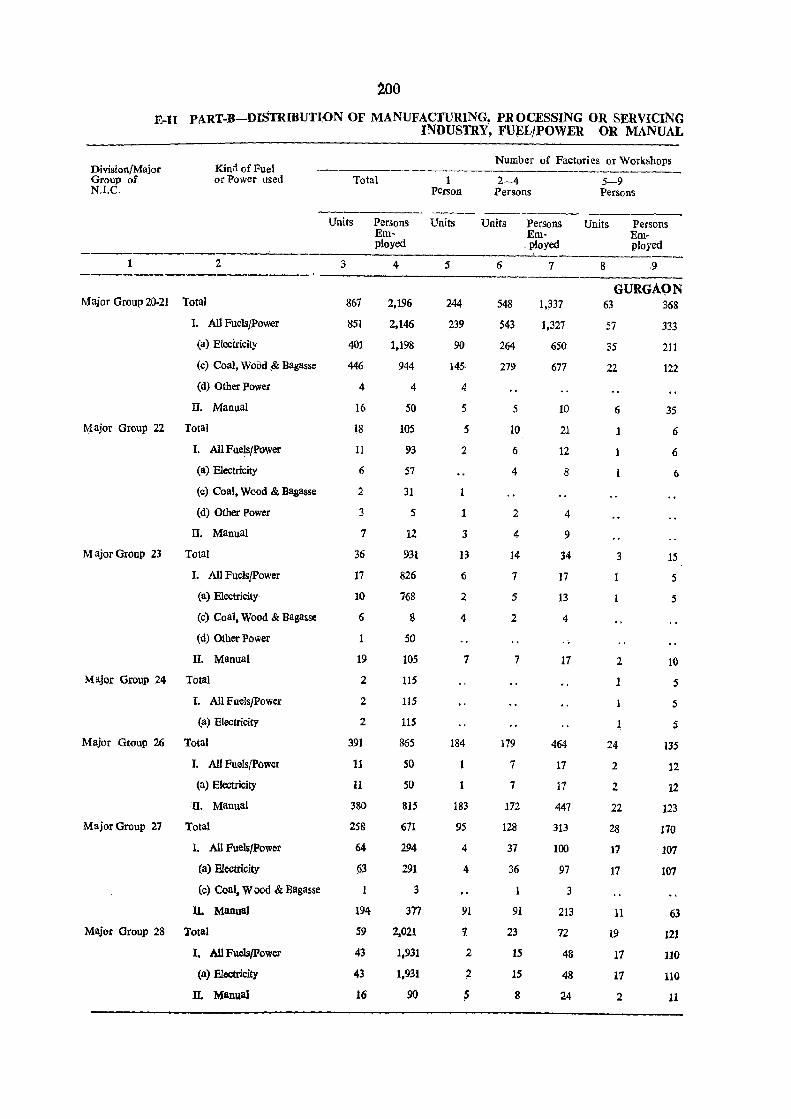
200
E-II PART-B-DlSTRmUTlON OF MANUFACTURING, PR OCESSING OR SERVICING INDUSTRY, FUELjPOWER OR MANUAL
Division/Major Group of N.I.C.
Kind of Fuel or Power used
2
Major Group 20·21 Total
I. All Fuels/Power
(a) Electricity
(c) Coal, Wood & Bagasse
(d) Other Power
n. Manual
~aj()r Group 22 Total
Major Group 23
l. All Fuels/Power
(a) Electricity
(c) Coal, Wood & Bagasse
(d) Other Power
II. Manual
Total
I. All Fuels/Power
(a) Elew.icity
(c) Coal, Wood & Bagasse
(d) Other Power
n. Manual
Major Group 24 Total
I. All Fuels/Power
(a) Electricity
Major Group 26 Total
Major Group 27
I. All Fuels/power
(a) Electricity
n. Manual
Total
L All Fuels!power
(a) Electricity
(c) Coal. Woed & Bagasse
n. Manual
Majo. Group 28 Total
I. All Fuels/power
(a) Electricity
n. Manual
Total 1 person
Units Persons Units Em-
3
867
851
401
446
4
16
~8
11
6
2
3
7
36
17
10
6
19
2
2
2
391
11
11
380
258
64
63
194
59
43
43
16
ployed
4
2,196
2.146
1,198
944
4
50
105
93
57
31
5
12
931
826
768
8
50
105
115
115
liS
865
50
50
815
671
294
291
3
377
2,021
1,931
1,931
90
5
244
239
90
145
4
5
5
2
1
3
13
6
2
4
7
184
1
183
95
4
4
91
1
2
2
~
Number of Factories or Workshops
2-4 Persons
Units Persons
6
548
543
264
279
5
10
6
4
2
4
14
7
5
2
7
179
7
7
172
128
37
36
91
23
15
15
8
Employed
7
1,337
1,327
650
677
10
21
12
8
4
9
34
17
13
4
17
464
17
17
447
313
100
97
3
213
72
48
48
24
5-9 Persons
Units Persons
g
Employed
.9
GURGAON 63
57
35
22
6
1
3
2
1
1
24
2
2
22
28
17
17
11
19
17
17
2
368
333
211
122
35
6
6
6
15
5
5
10
5
5
S
135
12
12
123
170
107
107
63
121
110
110
11
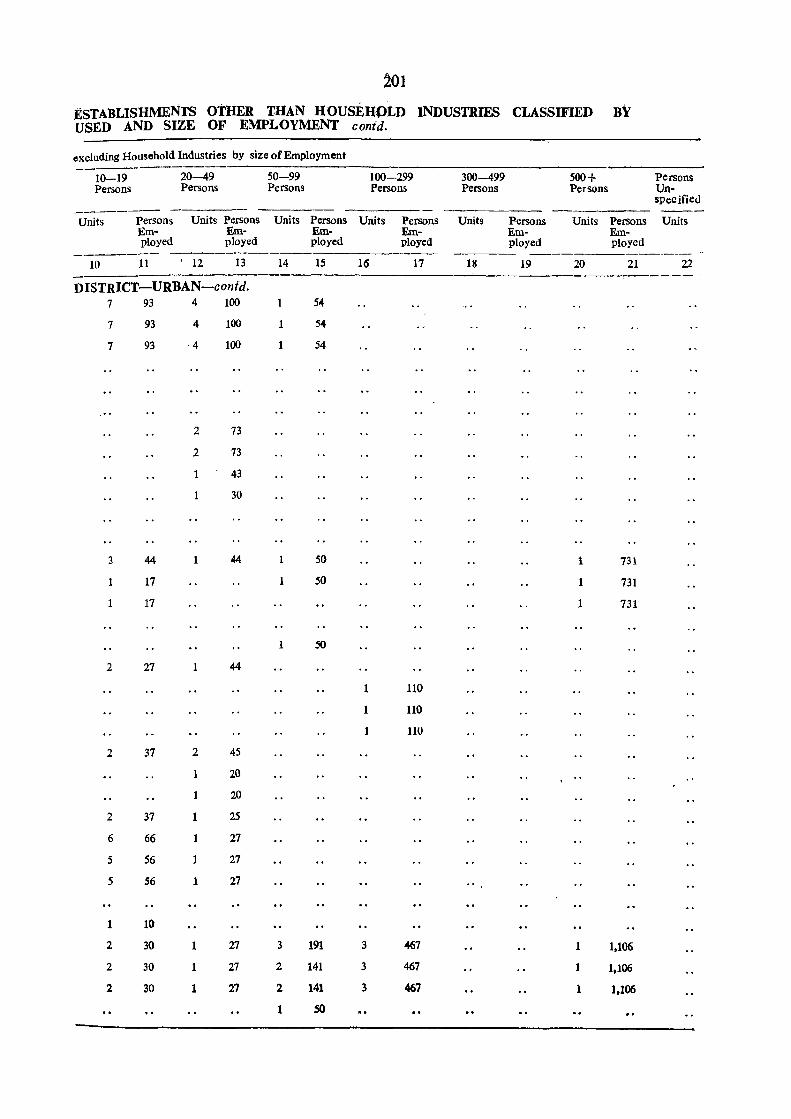
~Ol
ESTABLISHMENTS OTHER THAN HOUSEHOLD INDUSTRIES CLASSIFIED BY USED AND SIZE OF EMPLOYMENT· contd.
excluding Household Industries by size of Employment
10-19 Persons
------Units Persons
Em-ployed
-------10 11
20-49 Persons
Units Persons Em-ployed
12 13
DISTRICT-URBAN-confd. 7 93
7 93
7 93
3 44
17
17
2 27
2 37
2 37
6 66
5 56
5 56
1 10
2 30
2 30
2 30
4
4
4
2
2
100
100
100
73
73
43
1 30
1 44
1 44
2 45
1 20
1 20
1 25
1 27
27
1 27
1 27
1 27
1 27
50-99 Persons
Units
14
1
1
3
2
2
1
Persons Em-ployed
15
54
54
54
50
50
50
191
141
141
SO
100-299 Persons
Units Persons Em-ployed
16 17
1 110
110
110
3 467
3 467
3 467
300-499 Persons
Units
18
..
500+ Persons
Persons Units Persons Em- Em-ployed ployed
19 20 21
1 731
731
731
1 1,106
1 1,106
1 1,106
Persons Un-specified ---Units
22
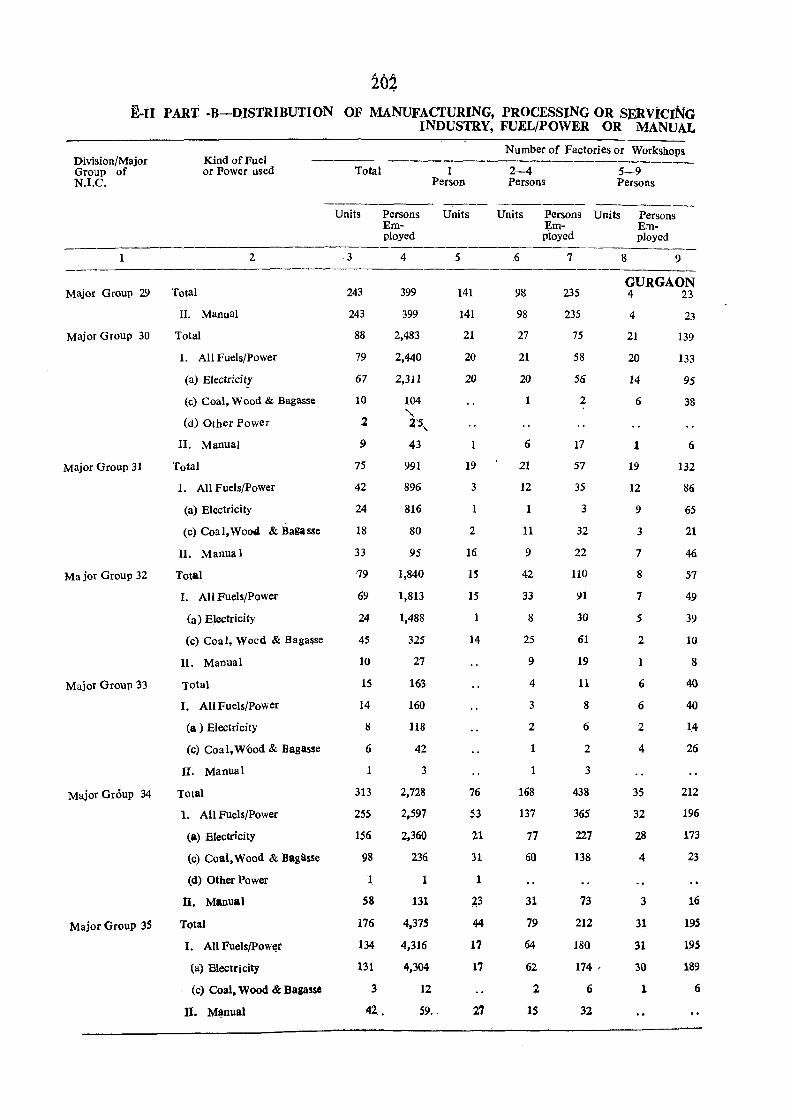
20~
E-I1 PART -B-DISTRIBUTION OF MANUFACTURING, PROCESSING OR SERViCING INDUSTRY, FUEL/POWER OR MANUAL
Division/Major Group of N.I.C.
1
Kind of Fuel or Power used
2
Major Group 29 Total
Major Group 30
Major Group 31
Ma jor Group 32
Major Group 33
Major Group 34
Major Group 35
II. Manual
Total
I. All Fuels/Power
(a) Electricitr
(c) Coal, Wood & Bagasse
(d) Other Power
II. Manual
Total
I. All Fuels/Power
(a) Electricity
(c) Coal,Wo04 & Bagasse
II. Manual
Total
I. All Fuels/Power
(a) Electricity
(c) Coal, Woed & Bagasse
II. Manual
Total
I. All Fuels/power
(a ) Electricity
(c) Coal, W'bod & Bagasse
II. Manual
Total
1. All Fuels/Power
<a) Electricity
(c) Coal, Wood & Bagasse
(d) Other Power
II. Manual
Total
I. All Fuels/Pow~r
(a) Electricity
(c) Coal, Wood & Bagasse
11. MI}DUal
Total
Units
3
243
243
88
79
67
10
2
9
75
42
24
18
33
79
69
24
45
10
15
14
8
6
313
255
156
98
1
S8
176
134
131
Persons Employed
4
399
399
2,483
2,440
2,311
104
"-2'5,
43
991
896
816
80
95
1,840
1,813
1,488
325
27
163
160
118
42
3
2,728
2,597
2,360
236
1
131
4,375
4,316
4,304
1 Person
Units
5
141
141
21
20
20
19
3
2
16
15
15
1
14
76
53
21
31
1
~3
44
17
17
3.
42, •
12
59 .. 27
Number of Factories or Workshops
2-4 5-9 Persons Persons
Units
98
98
27
21
2Q
1
6
21
12
1
11
9
42
33
8
25
9
4
3
2
1
1
168
137
77
60
3~
79
64
62
2
IS
Persons Units Em-Ployed
7
235
235
75
58
56
2
17
57
35
3
32
22
110
91
30
61
19
11
8
6
2
3
438
365
227
138
73
212
180
174 .
6
32
8
Persons Employed
9
GURGAON 4 23
4
21
20
14
6
1
19
12
9
3
7
8
7
S
2
1
6
6
2
4
35
32
28
4
3
31
31
30
1
23
139
133
9S
38
6
132
86
65
21
46
57
49
39
10
8
40
40
1.4
26
212
196
173
23
16
195
195
189
6
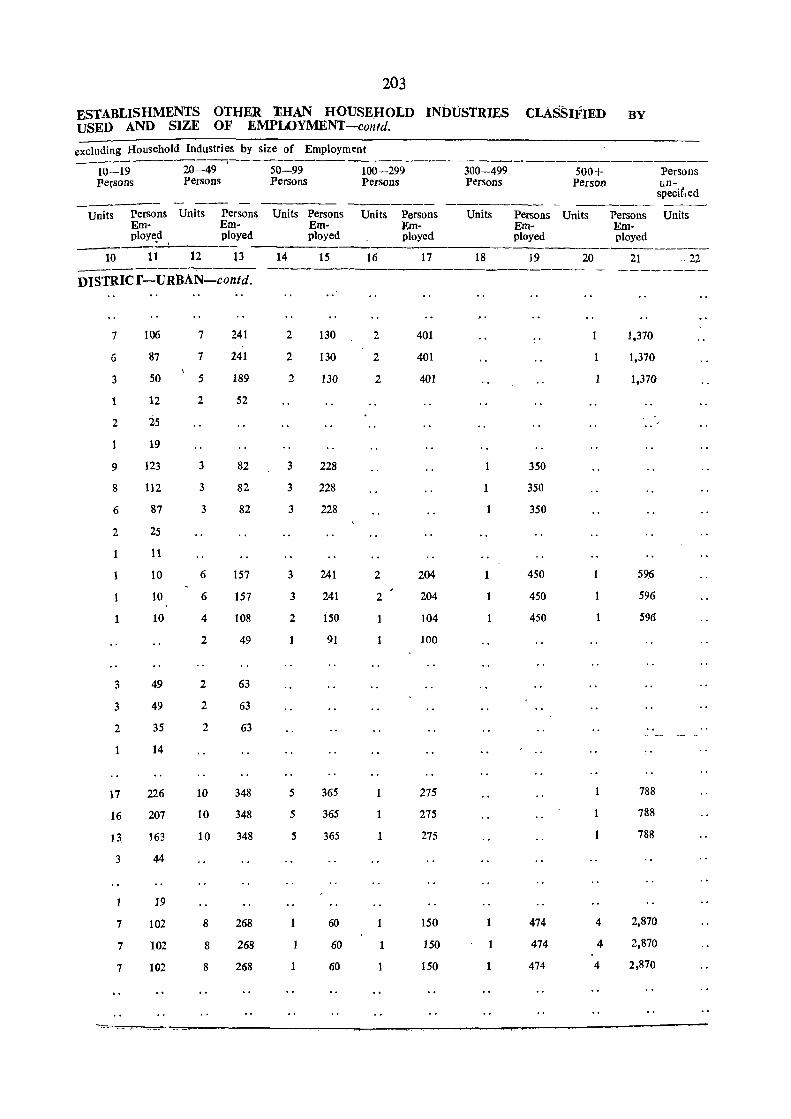
203
ESTABLISHMENTS OTHER tHAN HOUSEHOLD INDUSTRIES CLASSIFIED BY USED AND SIZE OF EMPLOYMENT -co,;,d. excluding Household Industries by size of Employment
---------- -----------------10-19 20-49 50-99 100-299 300-499 500+ Persons Pe{sons Persons Persons Persons Persons Person un-
specifIed - -- ------- ------ - ----- ----
Units Persons Units Persons Units Persons Units Persons Units Persons Units Persons Units Em- Em- Em- Em- Em- Em-ployed ployed ployed ployed ployed ployed __ 0_, ____ -
10 11 12 13 14 15 16 17 18 19 20 21 . 22 ---- --------DISTRIC r -URBAN-con/d .
..
7 106 7 241 2 130 2 401 1,370
6 87 7 241 2 130 2 401 1,370
3 50 5 189 2 130 2 401 1,370
1 12 2 52
2 25
19
9 123 3 82 3 228 350
8 112 3 82 3 228 350
6 87 3 82 3 228 350
2 25
11
1 10 6 157 3 241 2 204 450 5~6
1 10 6 157 3 241 2 204 1 450 596
1 10 4 108 2 150 1 104 450 1 596
2 49 91 100
3 49 2 63
3 49 2 63
2 35 2 63
1 14
17 226 10 348 5 365 275 788
16 207 10 348 5 365 1 275 788
13 163 10 348 5 365 275 788
3 44
19
7 102 8 268 60 150 1 474 4 2,870
7 102 8 268 60 150 474 4 2,870
7 102 8 268 60 1 150 474 4 2,870
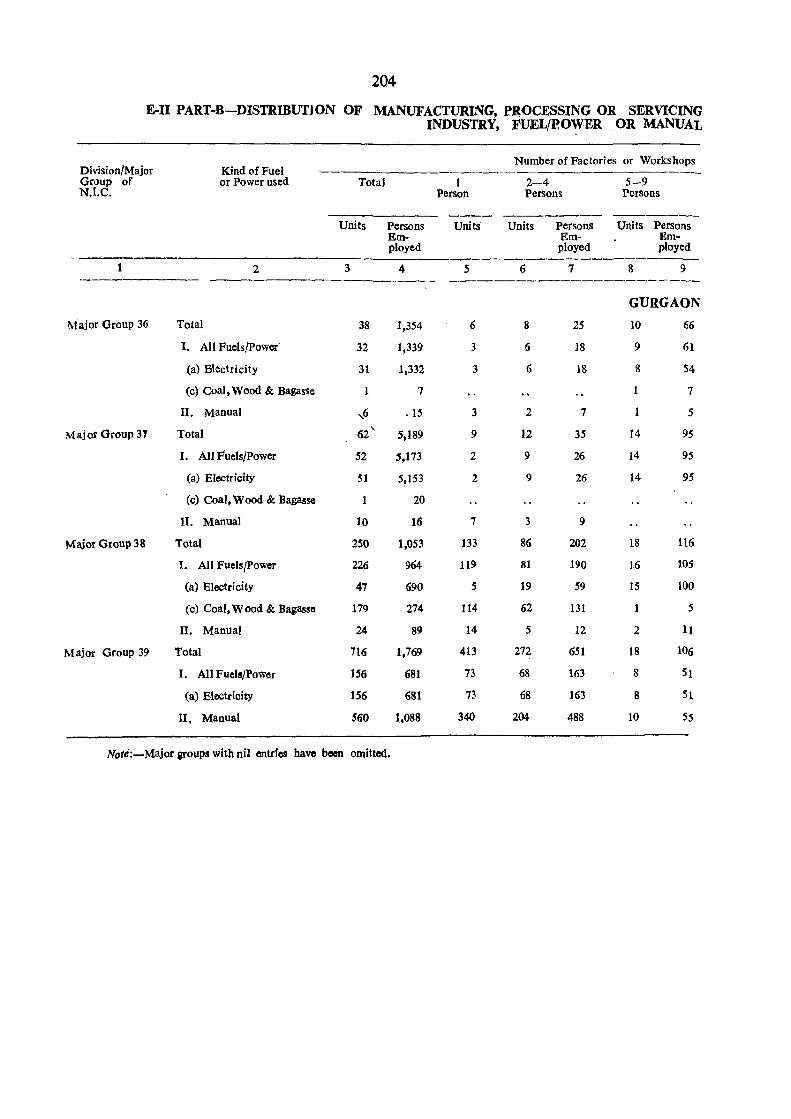
204
E-II PART·B-DISTRmUTJON OF MANUFACTURING, PROCESSING OR SERVICING INDUSTRY, FUEL/POWER OR MANUAL
Division/Major Kind of Fuel Number of Factories or Workshops
-----------------------------Group of or Power used Total 1 2-4 5-9 N.I.C. Person Persons Persons
--- ------Units Persons Units Units Persons Units Persons
Em- Em- Em-ployed ployed ployed
1 2 3 4 5 6 7 8 9 -------- -------------~---------
GURGAON
Major Group 36 Total 38 1,354 6 8 25 10 66
I. All Fuels/Power 32 1,339 3 6 18 9 61
(a) Electricity 31 1,332 3 6 18 8 54
(c) Coal, Wood & Bagasse 1 7 7
II. Manual ,6 .15 3 2 7 5
Major Group 31 Total 62" 5,189 9 12 35 14 95
I. All Fuels/Power 52 5,173 2 9 26 14 95
(a) Electricity 51 5,153 2 9 26 14 95
(c) Coal, Wood & Bagasse 1 20
II. Manual 10 16 7 3 9
Major Group 38 Total 250 1,053 133 86 202 18 116
1. All FueIsfPower 226 964 119 81 190 16 105
(a) Electricity 47 690 5 19 59 15 100
(c) Coal, Wood & Bagass!! 179 274 114 62 131 1 5
II. Manual 24 89 14 5 12 2 11
Major Group 39 Total 716 1,769 413 272 651 18 106
1. All Fuels/Power 156 681 73 68 163 8 51
(a) Electrioity 156 681 73 68 163 8 51
II, Manual 560 1.088 340 204 488 10 55
Note:-Major 81'0ups with nil entries have been omitted.
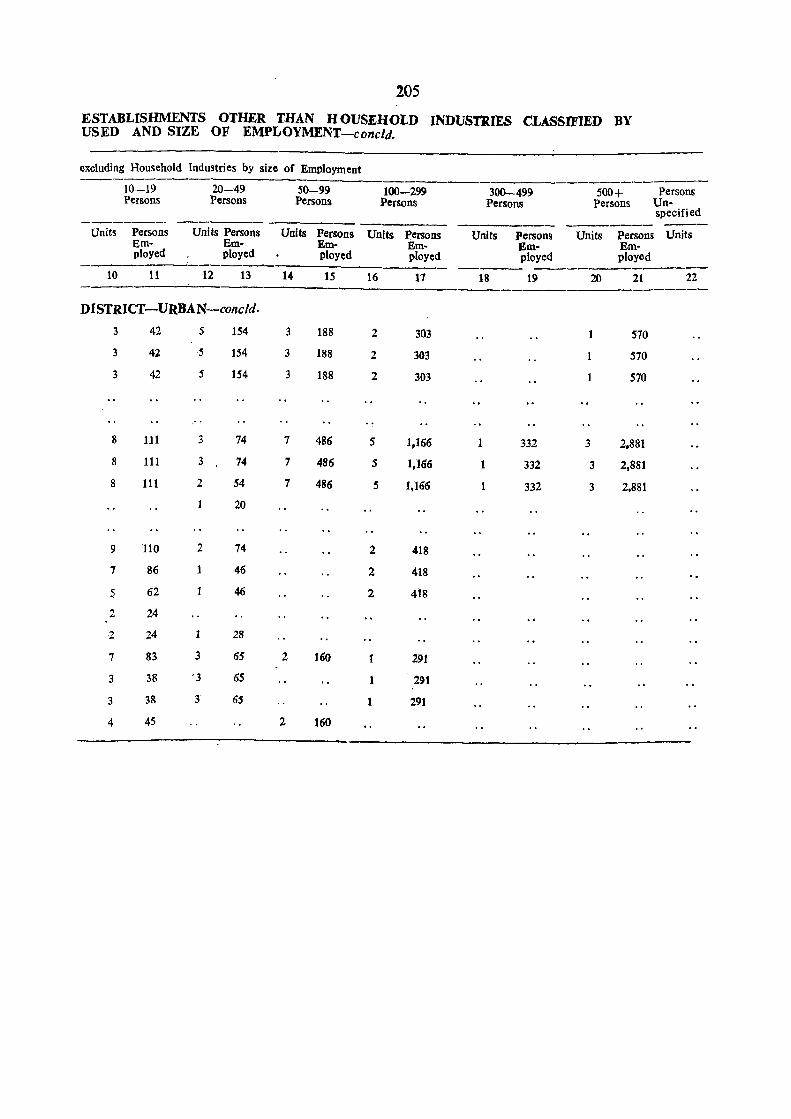
205
ESTABLISHMENTS OTHER 'IHAN HOUSEHOLD INDUSTRIES CLASSIFIED BY USED AND SIZE OF EMPLOYMENT-concld.
excluding Household Industries by size of Emt'loyment
10-19 20-49 50-99 100-299 300-499 500+ Persons Persons Persons Persons Persons Persons Persons Un-
specified ------ ------ ------ ---
Units Persons Unlts Persons Units Persons Units Persons Units Persons Units Persons Units Bm- Bm- Em- Em- Em- Em-ployed ployed ployed ployed ployed ployed -- -----10 11 12 13 14 15 16 17 18 19 20 21 22
DISTRICT -URBAN--concld.
3 42 5 154 3 188 2 303 1 570
3 42 5 154 3 188 2 303 570
3 42 5 154 3 188 2 303 1 570
--8 111 3 74 7 486 5 1,166 1 332 3 2,881
8 111 3 14 7 486 5 1,166 1 332 3 2,881
8 111 2 54 7 486 5 1,166 1 332 3 2.881 20
9 110 2 74 2 418
7 86 1 46 2 418
S 62 46 2 418
2 24
2 24 28
7 83 3 65 2 160 I 291
3 38 -3 65 1 291
3 3& 3 65 291
4 45 2 160

fABLE E-li PARi" .. C
DISTRl8tJTION OF HOUSEHOLD INDUSTRY ESTABLISHMENTS CLASsiFiED BY INDUSTRY, FUEL/POWER USED AND SIZE OF EMPLOYMENT
Flyleaf
This table furnishes similar information about Household Industry Establishments as in the case of Factories and 'Workshops in Table E-I1 Part-B. The presentation according to area units is also the same.
2. This table gives a three-fold classification. Firstly, Household Industry Establishments have been classified by I Division and Major Group of National Industrial Classification, 1970. Secondly, such Establishments are distributed according to the power or fuel used viz., electricity; liquid fuel; coal, wood and bagasse; other power and manual. Thirdly, these Establishments have been distributed according to the size of employment, i.e. 1 person, 2-4 persons, 5-9 persons, 10-19 persons and persons unspecified.
201

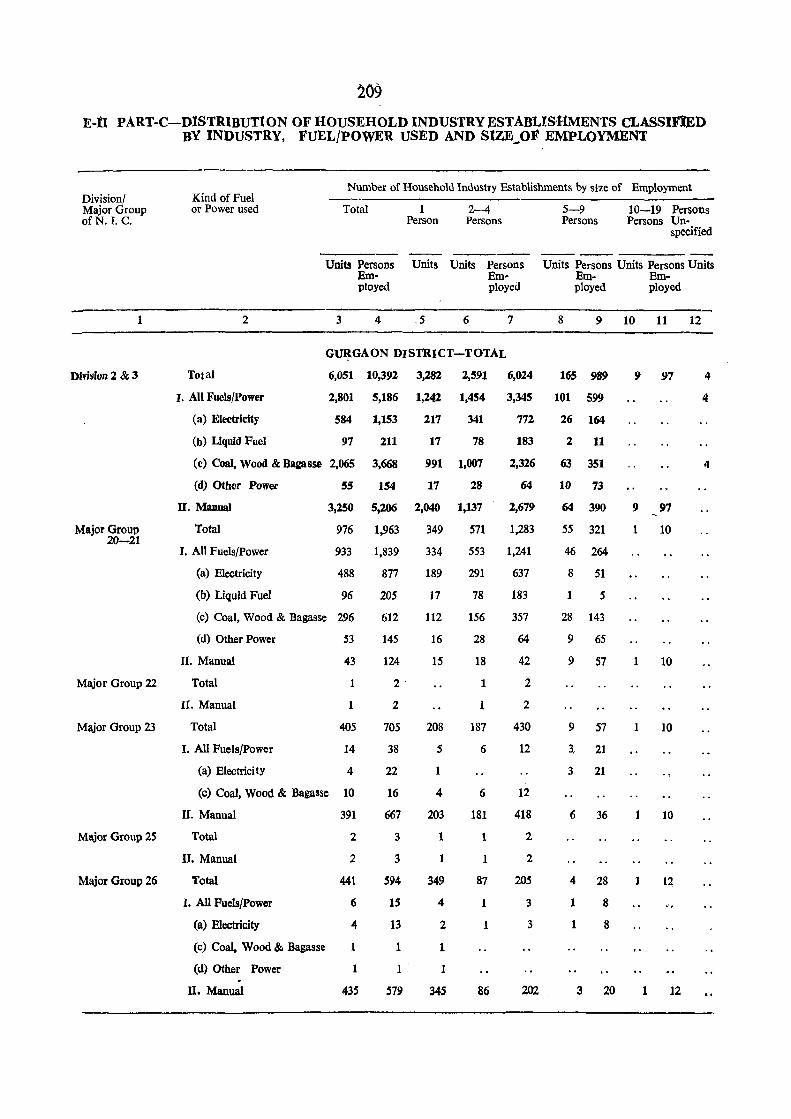
~09
E-II PART-C-DISTRIBUTION OF HOUSEHOLD INDUSTRY ESTABLISflMENTS CLASSIFIED BY INDUSTRY, FUEL/POWER USED AND SIZE~OF EMPLOYMENT
Division! Major Group ofN. 1. C.
1
Division 1 & 3
Major Group 20-21
Major Group 22
Major Group 23
Major Group 25
Major Group 26
Kind of Fuel or Power used
Number of Household Industry Establishments by size of Employment
2
Total
Total
Units Persons Employed
3 4
1 Person
2-4 Persons
Units Units Persons Employed
6 7
GURGAON DISTRICT-TOTAL
6,051 10,392 3,282 2,591 6,024
5-9 Persons
10-19 Persons Persons Un
specified
--------Units Persons Units Persons Units
Em- Em-ployed ployed
8 9 10 11 12
165 989 9 97
I. All Fuels/power
(a) Electricity
(b) Liquid Fuel
2,801 5,186 1,242 1,454 3,345 101 599
4
4
S84 1,153
97 211
(c) Coal, Wood & BaKa8Se 2,065 3,668
(d) Other Power !5 154
217
17
341
78
991 1,007
17 28
772
183
2,326
64
n. Mlmual
Total
3,250 5,206 2,040 1,137 2,679
1,283
1. All Fuels/Power
(a) Electricity
(b) Liquid Fuel
976 1,963
933 1,839
488 877
96 205
(c) Coal, Wood & Bagasse 296 612
145
124
(d) Other Power
II. Manual
Total
II. Manual
Total
I. All Fuels/power
(a) Electricity
S3
43
1
1
405
14
4
(c) Coal, Wood & Baiasse 10
II. Manual
Total
n. Manual
Total
I. All Fuels/power
(a) Electricity
(c) Coal, Wood & Bagasse
(d) Other Power . n. Manual
391
2
2
441
6
4
1
1
435
2
2
705
38
22
16
667
3
3
594
15
13
1
1
579
349
334
189
17
112
16
15
208
5
1
4
203
1
349
4
2
1
1
345
571
553 1,241
291 637
78 183
156
28
18
1
1
187
6
6
181
1
1
87
1
86
357
64
42
2
2
430
12
12
418
2
2
20S
3
3
202
26 164
2 11
63 351
10 73
64 390
55 321
46 264
8 51
1 5
28 143
9 65
9 57
9 57
3, 21
3 21
6 36
4 28
1
1
8
8
3 20
4
9 97
1 10
10
10
10
1 1~
1 12
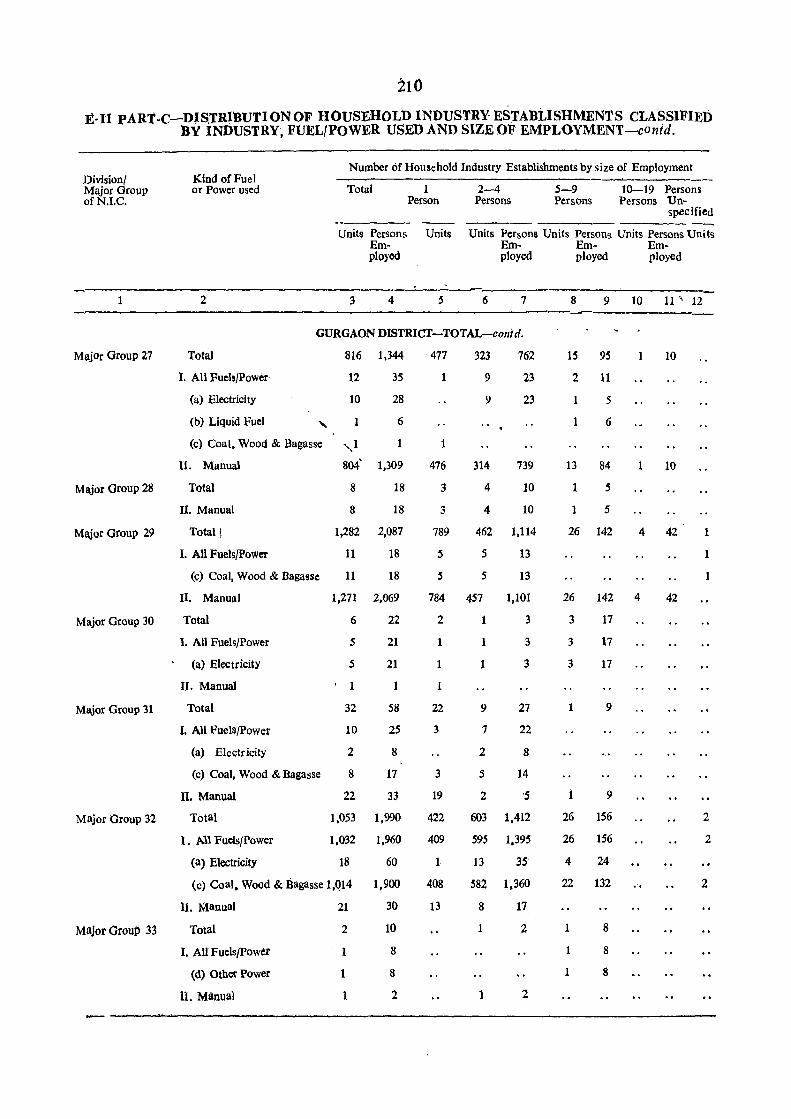
E-ll PART-C-DJS.TRl'BUTIONOF HOUSEHOLD INDUSTRY. ESTABLISHMENTS CLASSIFIED BY INDUSTRY, FUEL/POWER USED AND SIZEOF EMPLOYMENT-contd.
Divisionl Major Group ofN.I.C.
Kind of Fuel or Power used
Number of Household Industry Establishments by size of Employment
Total
Units Persons Employed
1 Person
2-4 Persons
5-9 Persons
10-19 Persons Persons Un
specified
Units Units Persons Units Persons Units Persons Units Em- Em- Em-ployed ployed played
.---._--------------_ .. _---= _ _;. ____
MajOr Group 27
Major Group 28
Major Group 29
Major Group 30
Major Group 31
Major Group 32
Major Group 33
2 3 4 5 6 7
GURGAON DISTRICT-TOTAL-contd.
Total
I. All Fuels/Power
(a) Electricity
(b) Liquid Fuel
816 1,344
12
10
1
35
28
6
(c) Coal, Wood & Bagasse ........ 1 1
II. Manual 804' 1,309
Total
II. Manual
Total I
I. All Fuels/power
(c) Coal, Wood & Bagasse
II. Manual
Total
1. All Fuels/Power
(a) Electricity
II. Manual
Total
I. All Fuels/Power
(a) Electricity
(c) Coal, Wood & Bagasse
II. Manual
Total
I. Ml Fuels/Power
(a) Electricity
8
8
18
18
1,282 2,087
11
11
18
18
1,271 2,069
6
5
5
1
32
10
2
8
22
22
21
21
1
58
25
8
17
33
1,053 1,990
1,032 1,960
18 60
(c) Coal, Wood & Bagasse 1,{}14 1,900
n. Manual
Total
1. All Fuels/power
(d) Other Power
n. Manual
21
2
1
1
30
10
8
8
2
477
1
1
476
3
3
789
5
S
323
9
9
314
4
4
762
23
23
739
10
10
462 1,114
5
5
13
13
784 457 1,101
3
3
3
2
1
1
1
22
3
3
19
422.
409
1
408
13
1
1
1
9
7
2
5
2
27
22
8
14
'5
603 1,412
595 1,395
13 35
582 1,360
8
1
17
2
2
8 9 10 11" 12
15 95
2 11
1
1
5
6
13 84
1
1
5
5
26 142
1 10
1 10
4 42
26 142 4 42
3
3
3
1
i
17
17
17
9
9
26 156
26 156
4 24
22 132
1
1
8
8
8
1
1
2
2
2
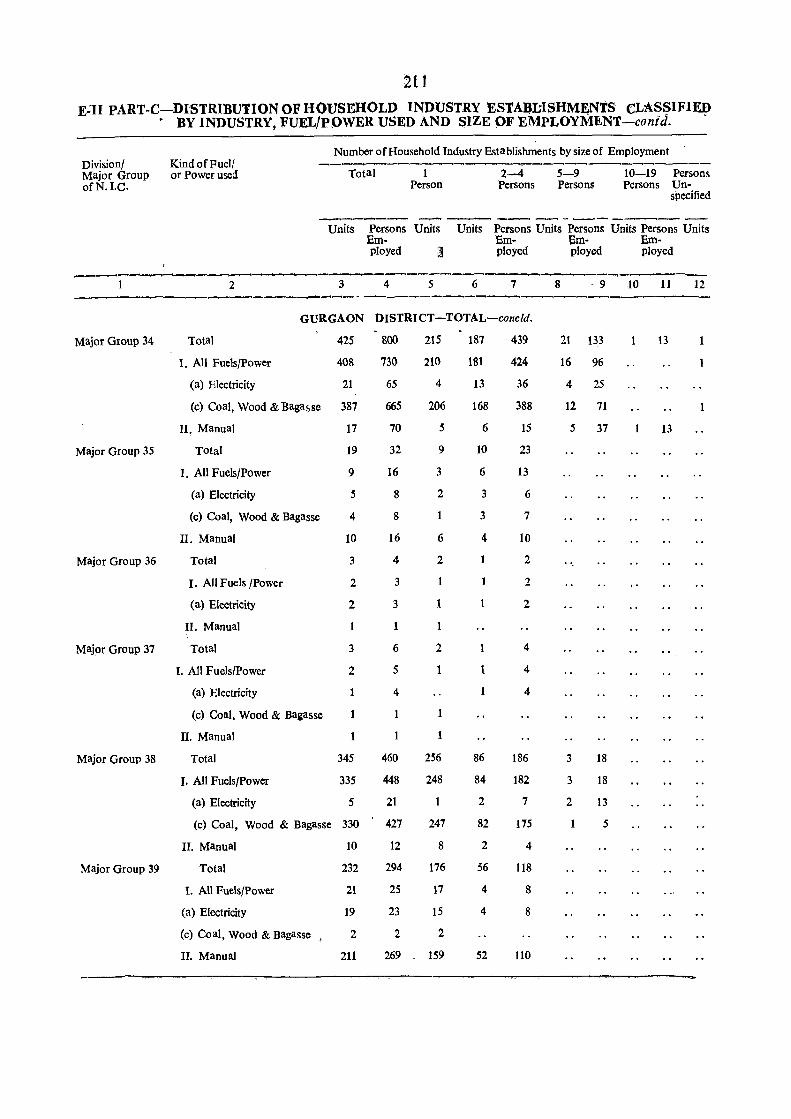
211
E':II PART-C-DISTRIBUTION OF HOUSEHOLD INDUSTRY ESTA:QI;ISHMENTS eL1\SSIFIED . BY INDUSTRY, FUEL/POWER USED AND SIZE OF EMPLOYMJ1NT-contd. .
Number of Household Industry Establishments by size of Employment Division/ Kind of Fuel/ ----Major Group or Power used Total 2--4 5-9 10-19 Persons orN.I.C. Person Persons Persons Persons Un-
specified
--_- ~ -- _---. - ..__----- --Units Persons Units Units Persons Units Persons Units Persons Units
Em- Em- Bm- Em-ployed ] played ployed ployed
-_--.__,-----.-..-.......-..-.--__.... ,-------~--_,
2 3 4 5 6 1 8 - 9 10 11 12 ---------------.... ---~-,__------.-------------~-GURGAON DISTRICT-TOTAL-concld.
Major Group 34 Total 425 800 215 181 439 21 133 13
I. All Fuels/Power 408 730 210 181 424 16 96
(a) Electricity 21 65 4 13 36 4 25
(c) Coal, Wood & Bagasse 381 665 206 168 388 12 71
II. Manual 17 70 5 6 15 5 37 13
Major Group 35 Total 19 32 9 10 23
I. All Fuels/Power 9 16 3 6 13
(a) Electricity 5 8 2 3 6
(c) Coal, Wood & Bagasse 4 8 3 7
II. Manual 10 16 6 4 10
Major Group 36 Total 3 4 2 2
I. All Fuels /Power 2 3 2
(a) Electricity 2 3 1 2
II. Manual
Major Group 31 Total 3 6 2 4
I. All Fuels/Power 2 5 4
(a) Electricity 4 4
(c) Coal, Wood & Bal:asse
II. Manual
Major Group 38 Total 345 460 256 86 186 3 18
I. All Fuels/Power 335 448 248 84 182 3 18
(a) Electricity 5 21 2 7 2 13
(c) Coal, Wood & Bagasse 330 427 247 82 175 5
II. Manual 10 12 8 2 4
Major Group 39 Total 232 294 176 56 118
1. All Fuels/Power 21 25 17 4 8
(a) Electricity 19 23 15 4 8
(c) Coal, Wood & Bagasse , 2 :2 2
II. Manual 211 269 159 52 110
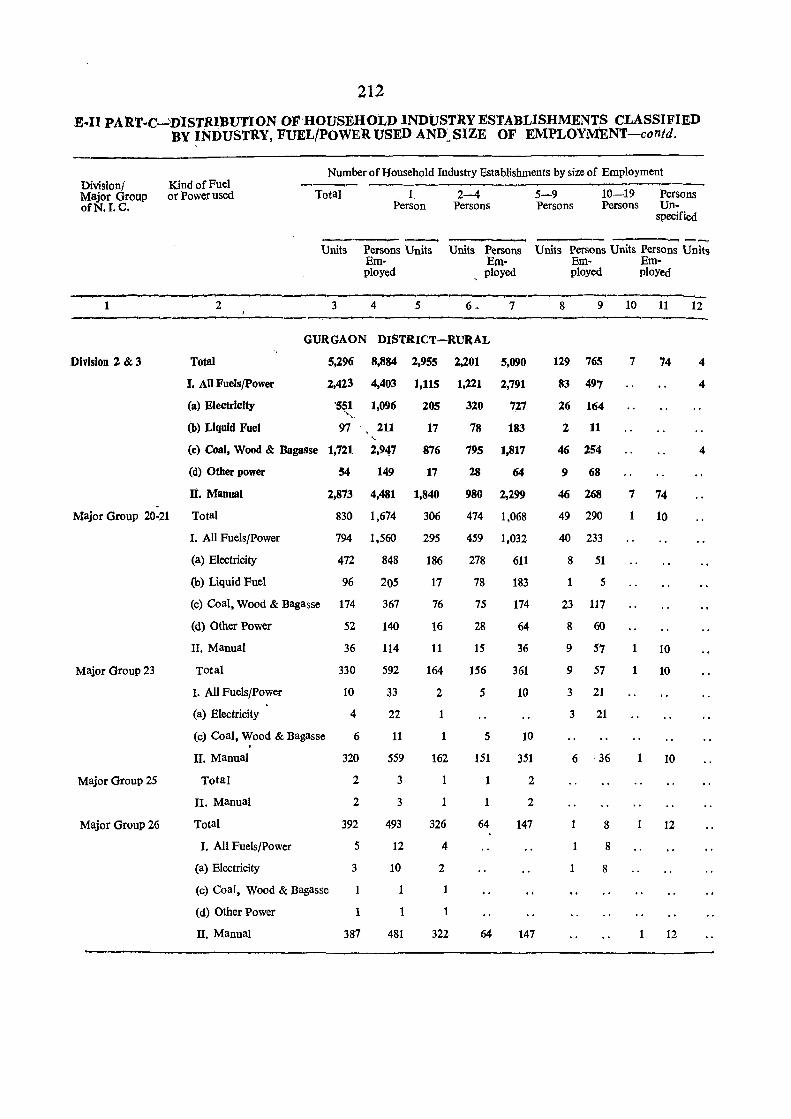
212
:£-11 PART-C~DISTRIBUTION OF 'HOUSEHOLD INDUSTRY ESTABLISHMENTS CLASSIFIED ny INDUSTRY, FUEL/POWER USED AND~SIZE OF EMPLOYMENT-contd.
Number of Household Industry Establishments by size of Employment Division! Kind of Fuel Major Group or Power used orN.I. C.
Total 1 2-4
Units
Person Persons
Persons Units Em-ployed
Units Persons Employed
5-9 Persons
10-19 Persons Persons Un-
specified
----~~-Units Persons Units Persons Units
Em- Em-ployed ploYed
--------~------------~-----------------~~~~-----~-~---~ .--~--1
Division :: & 3
-
2
Total
I. All Fuels/Power
(a) Electricity
(b) Liquid Fuel
3 4 5 7
GURGAON DISTRICT-RURAL
5,296 8,884 2,955 2,201 5,090
2,423 4,403 1,115 1,221 2,791
97 " 211
320
78
727
183
(c) Coal, Wood & Bagasse 1,721 2,947
205
17
876
17
795 1,817
(d) Other power
n. Manual
54 149
2,873 4,481 1,840
28 64
980 2,299
Major Group 20-21 Total 830 1,674 306
295
186
474 1,068
Major Group 23
Major Group 25
Major Group 26
J. All Fuels/Power
(a) Electricity
(b) Liquid Fuel
794 1,560
472 848
96
(c) Coal, Wood & Bagasse 174
205
367
140
114
592
(d) Other Power 52
II. Manual
Total
I. All Fuels/Power
(a) Electricity
(c) Coal, Wood & Bagasse
II. Manual
Total
II. Manual
Total
I. All Fuels/Power
( a) Electricity
(c) Coal, Wood & Bagasse
(d) Other Power
II. Manual
36
330
10
4
6
320
2
2
392
5
3
1
387
33
22
11
559
3
3
493
12
10
1
481
17
76
16
11
164
2
1
162
326
4
2
1
322
459 1,032
278 611
78
75
28
15
156
5
5
151
1
1
64
64
183
174
64
36
361
10
10
351
2
2
147
147
8 9 10 11
129 765
83 497
26 164
2 11
46 254
9 68
46 268
49 290
40 233
8 51
5
23 117
8 60
9 57
9 57
3 21
3 21
6 36
8
8
8
7 74
7 74
1 10
1 10
1 10
10
12
12
12
4
4
4
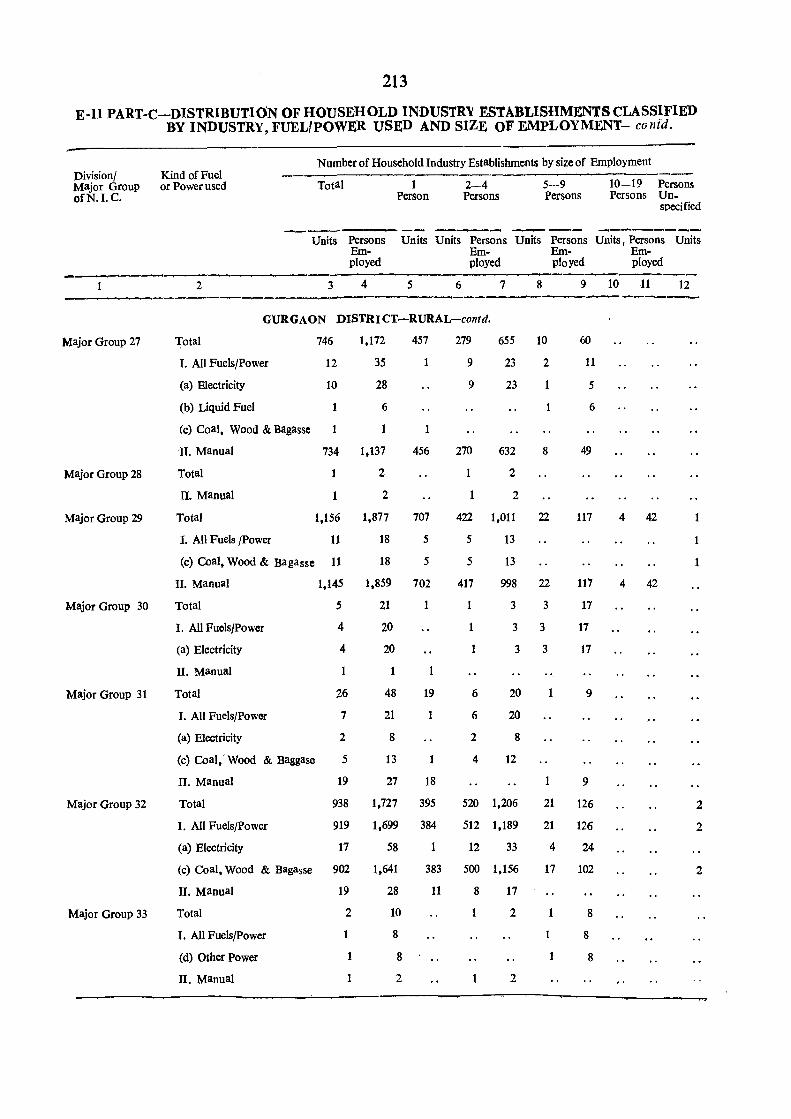
213
E-II PART-C-DISTRIBUTION OF HOUSEHOLD INDUSTR~ ESTABLISHMENTS CLASSIFIED BY INDUSTRY, FUELfPOWER USED AND SIZE OF EMPLOYMENT- conid.
Number of Household Industry Establishments by size of Employment Division/ Kind of Fuel
Total 1 Person
2-4 Persons
5-9 Persons
10-19 Persons Persons Un
specified
Major Group or Power used ofN.I.C.
Major Group 27
Major Group 28
Major Group 29
Major Group 30
Major Group 31
Major Group 32
Major Group 33
~-----Units Persons Units Units Persons Units Persons Units r Persons Units
Employed
Em- Em- Em-ployed ployed ployed
-------------~----2 3 4 5 6 7 8 9 10 11 12 --------,------
GURGAON DISTRICT-RURAL-colltd.
Total
I. All Fuels/Power
(a) Electricity
(b) Liquid Fuel
746
12
10
1,172
35
28
6
457
1
(c) Coal, Wood & Bagasse
II. Manual 734 1,137 456
Total
II. Manual
Total
I. All Fuels /Power
1
1
1,156
11
(c) Coal, Wood & Bagasse 11
II. Manual
Total
1. All FuelS/Power
(a) Electricity
II. Manual
Total
1. All FuelS/Power
(a) Electricity
(c) Coal,' Wood & Baggase
II. Manual
Total
I. All Fuels/Power
(a) Electricity
1,145
5
4
4
26
7
2
5
19
938
919
17
2
2
1,877
18
18
707
5
5
1,859 702
21
20
20
1
48
21
8
13
27
19
18
1,727 395
1.699 384
58
279
9
9
270
1
655 10
23
23
632
2
2
2
8
422 1,011 22
13
13
5
5
417 998 22
6
6
2
4
3 3
3 3
3 3
20
20
8
12
520 1,206
512 1,189
12 33
1
(c) coal, Wood & Bagasse 902 1,641
28
10
8
383 500 1,156
21
21
4
17
II. Manual
Total
1. All Fuels/Power
(d) Other Power
II. Manual
19
2
1
1 8
2
11 8
1
17
2
2
1
1
60
11
5
6
49
117
117
17
17
17
9
9
126
126
24
102
8
8
8
4 42
4 42
1
2
2
2
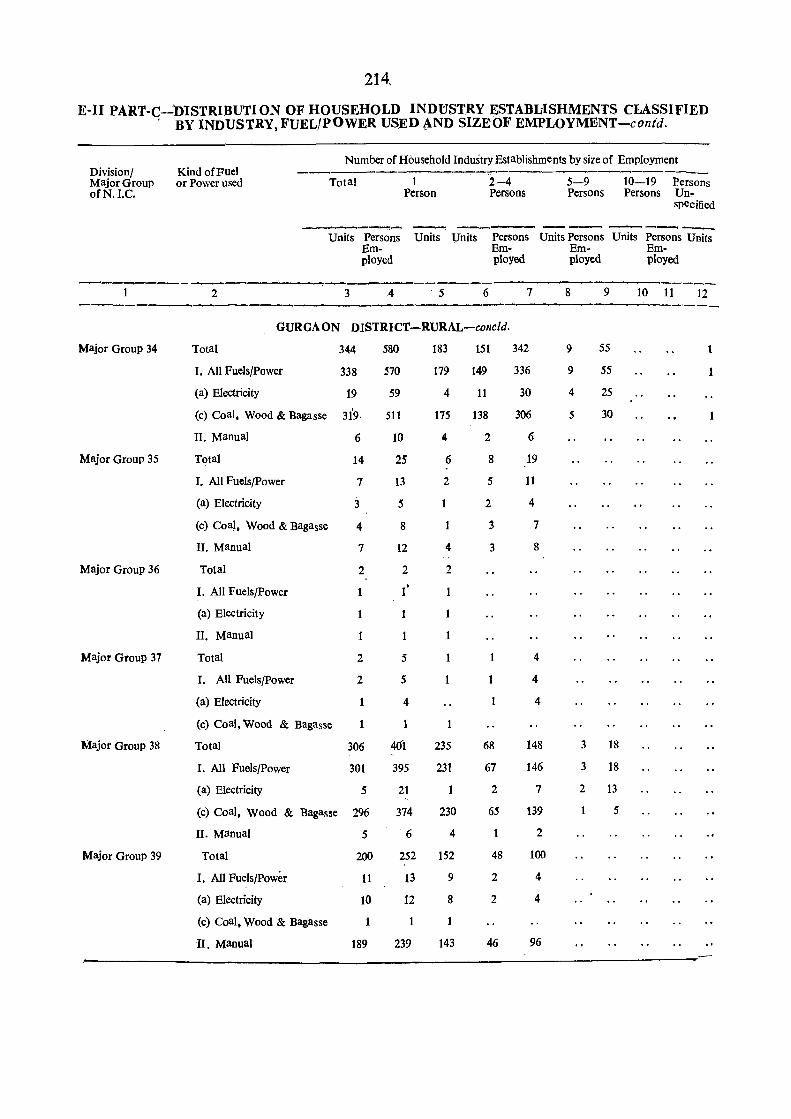
214.
E-II PART-C-DISTRIBUTION OF HOUSEHOLD INDl:JSTRY ESTABLISHMENTS CLASSIFIED . BY INDUSTRY, FUELfPOWER USED .t\.ND SIZE OF EMPLOYMENT-contd.
Number of Household Industry Establishments by size of Employment Division/ Kind ofPuel Major Group or Power used Total 1
Person 2-4 Persons
5-9 10-19 Persons ofN.I.C. Persons Persons Un-
specified
------- -------Units Persons
Employed
Units units Persons Units Persons Units Persons Units Em- Em- Em-ployed ployed ployed
--------"-------:o--,--- -.------,-------------1 2 3 4 5 6 7 8 9 10 11 12 ---------.-_...,--_. -----_
GURGA ON DISTRICT-RURAL-conc/d.
Major Group 34 Total 344 580 183 151 342 9 55 1
I. All Fuels/Power 338 570 179 149 336 9 55
(a) Electricity 19 59 4 11 30 4 25
(c) Coal, Wood & Bagasse 31'9. 511 175 138 306 5 30
II. Manual 6 10 4 2 6
Major Group 35 Total 14 25 6 8 19
I. All Fuels/Power 7 13 2 5 11
(a) Electricity 3 5 2 4
(c) Coal, Wood & Bagasse 4 8 3 7
II. Manual 7 12 4 3 8
Major Group 36 Total 2 2 2
I. All Fuels/Power l' 1
(a) Electricity
II. Manual 1
Major Group 37 Total 2 5 4
1. All Fuels/Power 2 5 1 4
(a) Electricity 4 4
(c) Coal, Wood & Bagasse 1 1
Major Group 38 Total 306 401 235 68 148 3 18
I. All Fuels/Power 301 395 231 67 146 3 18
(a) Electricity 5 21 2 7 2 13
(c) Coal, Wood & Bagasse 296 374 230 65 139 5
II. Manual 5 6 4 2
Major Group 39 Total 200 252 152 48 100
I. All Fuels/Power 11 13 9 2 4
(a) Electricity 10 12 8 2 4
(c) Coal, Wood & Bagasse
II. Manual 189 239 143 46 96
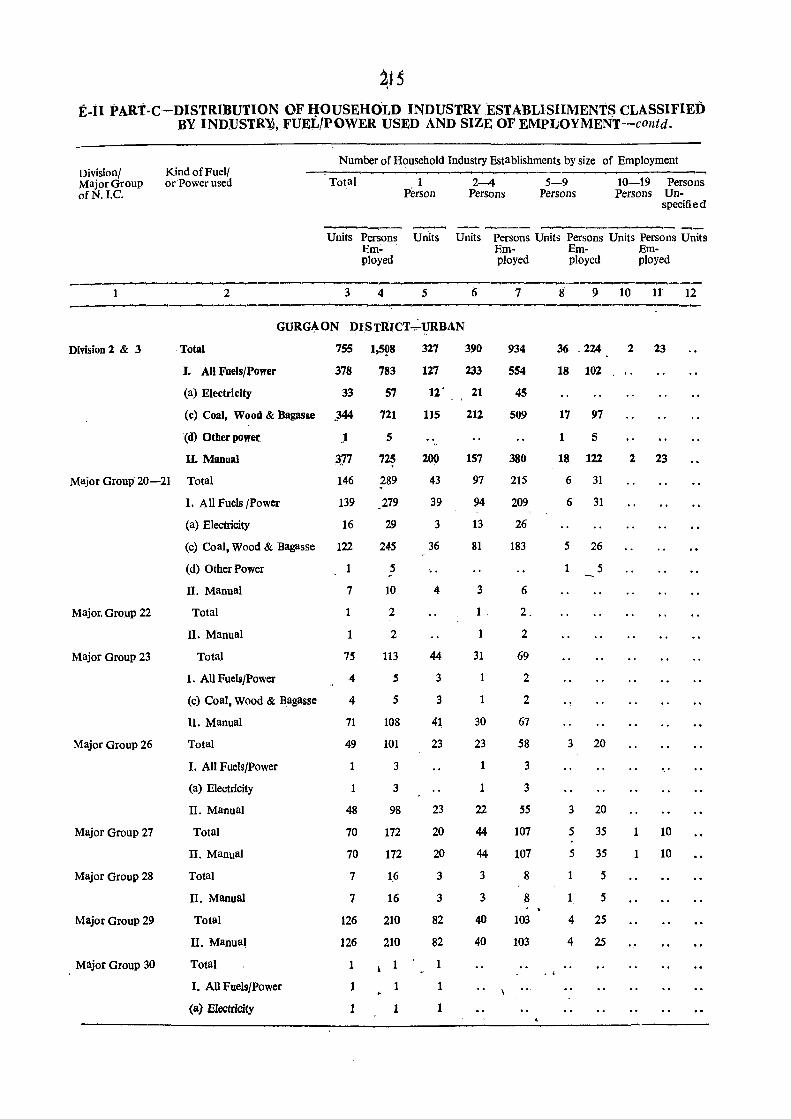
~j5
E-n PART-C-DISTRIBUTION OF HOUSEHOLD INDUSTRY ,ESTABLISHMENTS CLASSIFIED BY IND1JSTR~, FUEL/POWER USED AND SIZE OF EMPLOYMENT-contd.
Number of Household Industry Establishments by size of Employment Division/ Kind of Fuel/ Major Group or Power used Total 1 2-4 5-9 10-19 Persons ofN.I.C. Person Persons Persons Persons Un-
specified
---- -~--~-.--..._- _.,_ Units Persons Units Units Persons Units Persons Units Persons Units
Em- Em- Em- Em-ployed ployed played ployed
-~~-~-~ ~~ ~--
2 3 4 5 6 7 8 9 10 U 12
GURGAON DISTRICT"":"VRBAN -
Divlsion 2 & 3 . Total 755 1,598 327 390 934 36 224 2 23
I. All Fuels/Power ~78 783 127 233 554 18 102
(a) Electri city 33 57 12' 21 45
(c) Coal, Wood & Bagasse .;344 721 115 212 509 17 97
(d) Other power J 5 1 5 .. II. Manual '3.77 725 200 157 380 18 122 2 23
Major Group 20-21 Total 146 289 43 97 215 6 31
I. All Fuels /Power 139 279 39 94 209 6 31
(a) Electricity 16 29 3 13 26
(c) Coal, Wood & Bagasse 122 245 36 81 183 5 26
(d) Other Power 1 5 5
II. Manual 7 10 4 3 6
Major, Group 22 Total 2 2.
II. Manual 1 2 1 2
Major Group 23 Tota) 75 113 44 31 69
I. All Fuels/Power 4 5 3 2
(c) Coal, Wood & Bagasse 4 5 3 1 2
II. Manua) 71 108 41 30 67
Major Group 26 Total 49 101 23 23 58 3 20
I. All Fuels/Power 3 1 3
(a) Electricity 1 3 1 3
II. Manual 48 98 23 22 55 3 20
Major Group 27 Total 70 172 20 44 107 5 35 1 10
II. Manual 70 172 20 44 107 5 35 1 10
Major Group 28 Total 7 16 3 3 8 1 5
II. Manual 7 16 3 3 8 1 5
Major Group 29 Total 126 210 82 40 103 4 25
II. Manual 126 210 82 40 103 4 25
Major Group 30 Total 1 1 .. I. All Fuels/Power 1 1 1
(a) Electricity 1 1 1
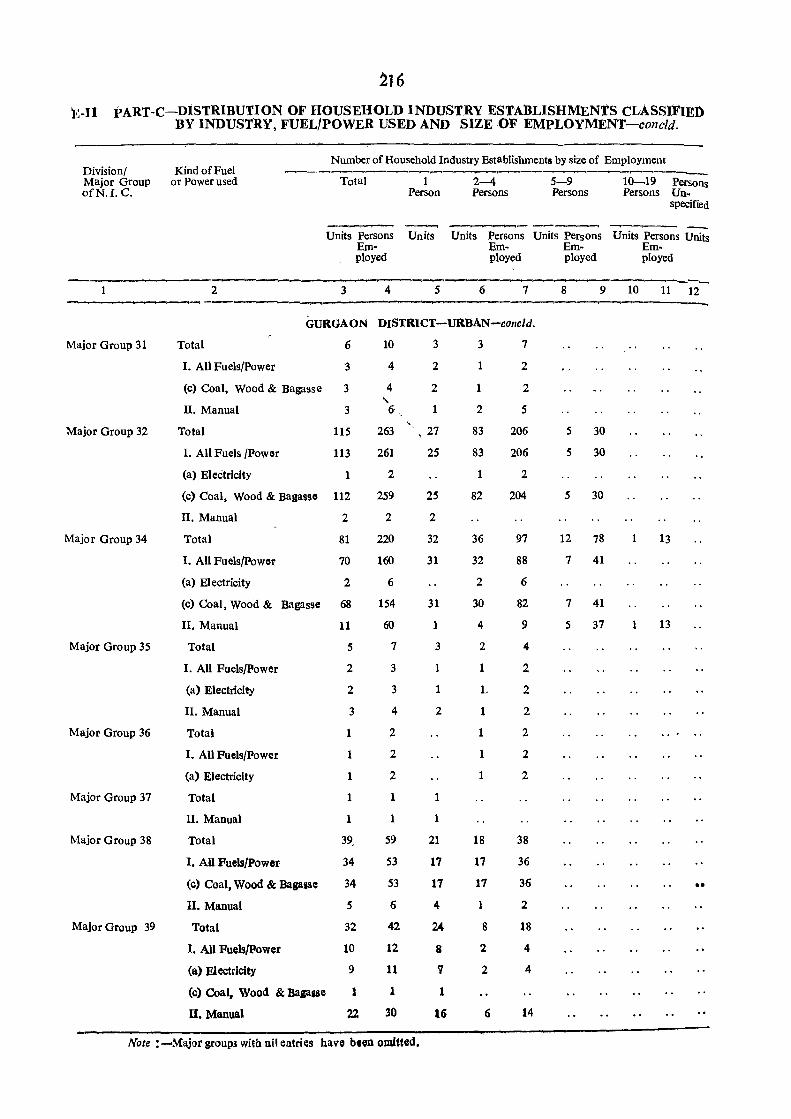
~16
l!:-ll pART-C-DISTRIBUTION OF HOUSEHOLD INDUST.RY ESTABLISHMENTS CLASSIFIEI) BY INDUSTRY, FUEL/POWER USED AND SIZE OF EMPLOYMENT-concld.
Division/ Major Group ofN. I. C.
1
Kind of Fuel or Power used
2
Number of Household Industry Establishments by size of Employment
Total 1 Person
Units Persons Units Em-ployed
2-4 Persons
--.--.-_- ._,
5-9 Persons
10-19 Persons
---Persons Unspecified
Units Persons Units Persons Units Persons Units Em- Em- Em-ployed played played
----------------~----------------------------~--~-------------3 4 5 6 7 8 9 10 11 12
-----------------------~--------------------------- ~-~--~--~--
GURGAON DISTRICT-URIiAN-conc/d.
Major Group 31
Major Group 32
Major Group 34
Major Group 35
Major Group 36
Major Group 37
Major Group 38
Major Group 39
Total 6
I. All Fuels/Power '3
(c) Coal, Wood & Bagasse 3
II. Manual 3
Total
I. All Fuels /Power
(a) Electricity
115
113
1
(c) Coal, Wood & Bagasse 112
II. Manual
Total
I. All Fuels/power
(a) Electricity
2
81
70
2
(c) Coal, Wood & Bagasse 68
II. Manual
Total
I. All Fuels/power
(a) Electricity
II. Manual
Total
I. All Fuels/Power
(a) Electricity
Total
II. Manual
Total
I. AU Fuels/powol'
(c) Coal, Wood & Bagasse
II. Manual
Total
I. All Puelstpower
(a) Electricity
(c) Coal. Wood & Bagape
n. Manual
11
5
2
2
3
1
1
1
1
39,
34
34
5
32
10
9
1
22
10
4
4 .... 6
263
261
2
259
2
220
160
6
154
60
7
3
3
4
2
2
2
1
59
53
53
6
42
12
11
1
30
3
2
2
1
, 27
25
25
2
32
31
31
1
3
1
2
1
1
21
17
17
4
24
8
V
1
,16
Note: -Major group3 with nil entries havo blon omitted.
3
1
1
2
83
83
1
82
36
32
2
30
4
2
1
L
1
1
1
1
18
1'7
11
1
8
2
2
6
7
2
2
5
206
206
2
204
97
88
6
82
9
4
2
2
2
2
2
2
38
36
36
2
18
4
4
14
5 30
5 30
5 30
12 78
7 41
7 41
5 37
13
1 13
00
tABLE E-m
DISTRIBUTION OF TRADE/COMMERCIAL ESTABLISHMENTS CLASSIFIED BY THE TYPE OF BUSINESS OR TRADE AND SIZE OF EMPLOYMENT
Flyleaf
This is a new table for the 1971-Census and has been prepared for the district for the total, rural and urban areas, separately. The table presents data regarding the nutnber of trade of commercial establishments and number of persons employed in each type of business or trade according to the Divisions and Major Groups adopted in the National Industrial Classification, 1970, under each size-group of employment, i. t. 1 person, 2-4 persons, 5-9 persons, 10-19 persons,20-49 persons, 50-99 persons, lOO+persons and persons unspecified.
2. Columns 2 and 3 show total number of establishments and extent of employment, respectively under each Division/Major Group.
2J7
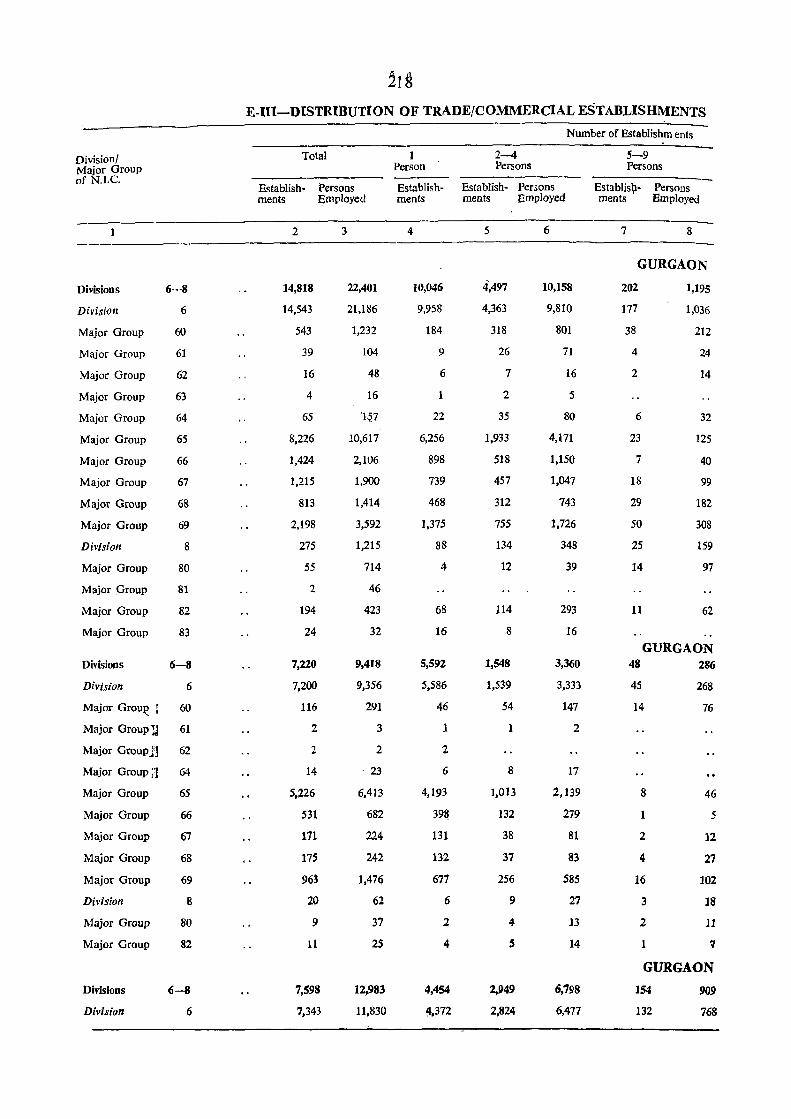
Division! Major Group of N.I.C.
Divisions 6-8
Divisioll 6
Major Group 60
Major Group 61
Major Group 62
Major Group
Major Group
Major Group
Major Group
Major Group
Major Group
Major Group
Division
Major Group
Major Group
Major Group
Major Group
63
64
65
66
67
68
69
8
80
81
82
83
Divisions 6-8
Division 6
Major Groul? 60
Major Group:J 61
Major GrouP.n 62
Major Group a 64
Major Group
Major Group
Major Group
Major Group
Major Group
Division
Major Group
Major Group
Divisions
Division
65
66
67
68
69
8
80
82
6-8
6
E-Ill-DISTRIBUTION OF TRADE/COMMERCIAL ESTABLISHMENTS
Total
EstabIish- Persons ments Employed
2
14,818
14,543
543
39
16
4
65
8,226
1,424
1,215
813
2,198
275
55
2
194
24
7,220
7,200
116
2
2
14
5,226
531
171
175
963
20
9
11
7,598
7.343
3
22,401
21,186
1,232
104
48
16
"1-57
10,617
2,106
1,900
1,414
3,592
1,215
714
46
423
32
9,418
9,356
291
3
2
23
6,413
682
224
242
1,476
62
37
2S
12,983
11,830
Number of Establishm ents
1 2--4 Person Persons
Establish- EstabIish- Persons ments ments Employed
4
10,046
9,958
184
9
6
1
22
6,256
898
739
468
1,375
88
4
68
16
5,592
5,586
46
1
2
6
4,193
398
131
132
677
6
2
4
4,454
4.372
5
4,497
4,363
318
26
7
2
35
1,933
518
457
312
755
134
12
114
8
1,548
1,539
54
1
8
1,013
132
38
37
256
9
4
S
2.949
2,824
6
10,158
9,810
801
71
16
5
80
4,171
1.150
1.047
743
1.726
348
39
293
16
3,360
3.333
147
2
17
2.139
279
81
83
S85
27
13
14
6,798
6,477
5-9 Persons
EstabJisJ;l- Persons ments Employed
7 8
GURGAON
202
177
38
4
2
6
23
7
18
29
50
25
14
11
1,195
1.()36
212
24
14
32
125
40
99
182
308
159
97
62
GURGAON 48
45
14
8
1
2
4
16
3
2
1
286
268
76
46
5
12
27
102
18
11
'1
GURGAON
154
132
909
768
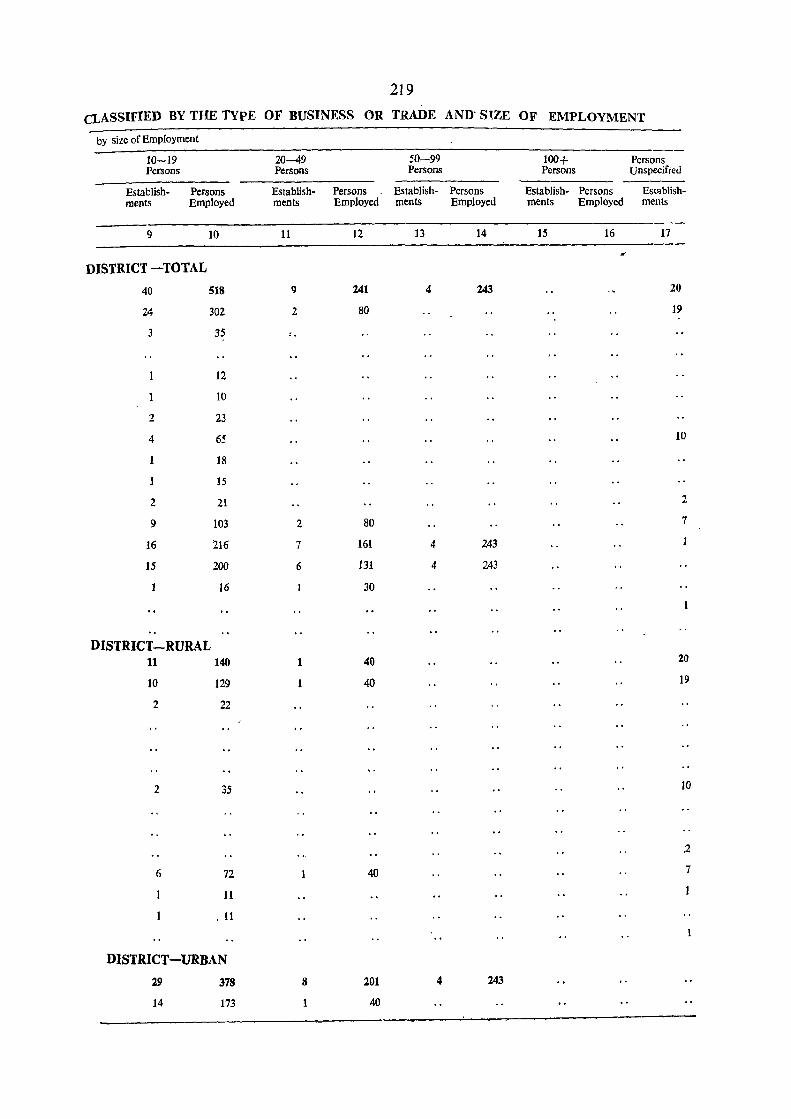
219
CLASSIFIED BY THE TYPE OF BUSINESS OR TRADE
by size of Employment
10-19 Persons
Establish- Persons ments Employed
9 10
DISTRICT -TOTAL
40 518
24 302
3 35
12
10
2 23
4 65
18
15
2 21
9 103
16 216
15 200
16
DISTRICT-RURAL 11
10
2
2
6
140
129
22
35
72
11
.11
DISTRICT-URBAN
29 378
14 173
20-49 Persons
Establish-ments
11
9
2
..
2
7
6
1
8
1
Persons Employed
12
241
80
80
161
131
30
40
40
40
201
40
50-99 Persons
Establish-ments
13
4
4
4
4
AND' S~ZE
Persons Employed
14
243
243
243
243
OF EMPLOYMENT
100+ Persons
Establish- Persons ments Employed
15 16
Persons unspecified
Est'lblish-ments
17
20
19
10
2
7
20
19
10
.2
7
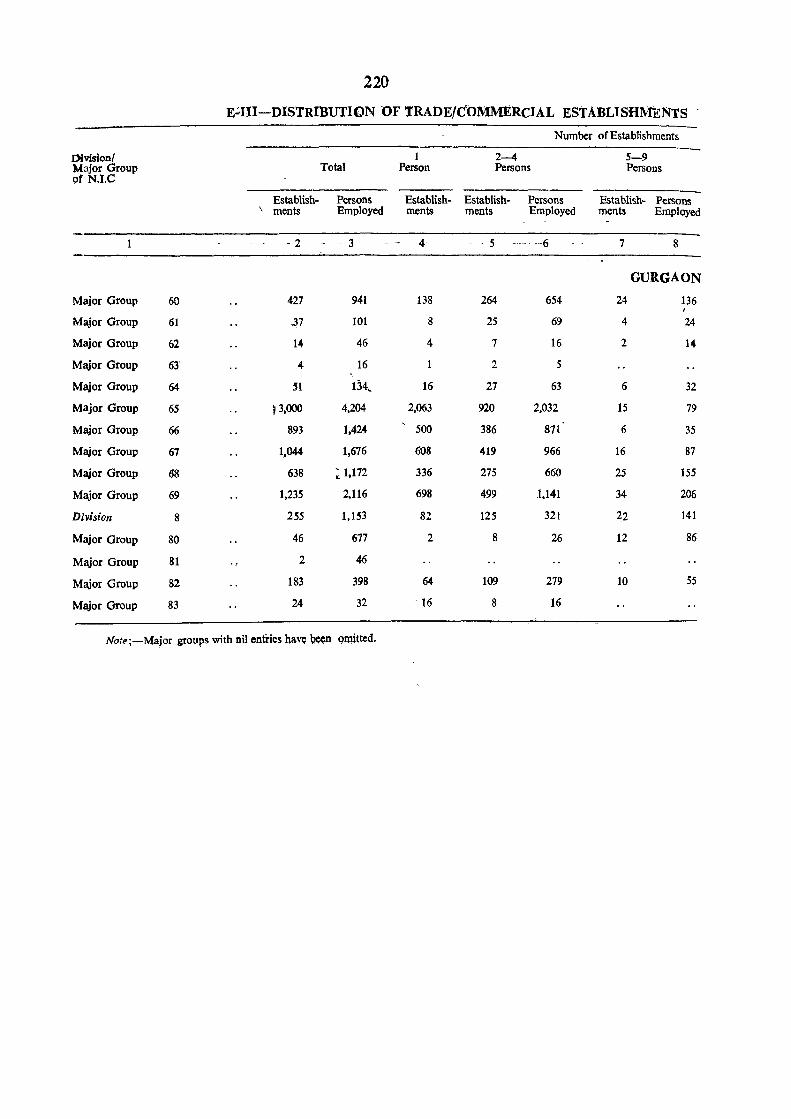
220
E':'III-DISTRIBUTION OF TRADE/COMMERCIAL EstABLISHMENTS
Number of Establishments
Division! 1 2-4 5-9 Major Group Total Person Persons Persons of N.I.C
Establish- Persons Establish- Establish- Persons Establish- Persons \ ments Employed ments ments Employed ments Employed
1 - 2 3 4 . 5 --_. --6 7 8
GURGAON
Major Group 60 427 941 138 264 654 24 136
Major Group 61 .37 101 8 25 69 4 24
Major Group 62 14- 46 4 7 16 2 14
Major Group 63 4 16 2 5
Major Group 64 51 134, 16 27 63 6 32
Major Group 65 13,000 4,204 2,063 920 2,032 15 79
Major Group 66 893 1,4U 500 386 871 6 35
Major Group 67 1,044 1,676 608 419 966 16 87
Major Group 68 638 : 1,172 336 275 660 25 155
Major Group 69 1,235 2.116 698 499 1,141 34 206
Division 8 255 1,153 82 125 321 22 141
Major Group 80 46 677 2 8 26 12 86
Major Group 81 2 46
Major Group 82 183 398 64- 109 279 10 55
Major Group 83 24 32 . 16 8 16
Note;-Major groups with nil enfries n(lVe ~n 9rmtted,
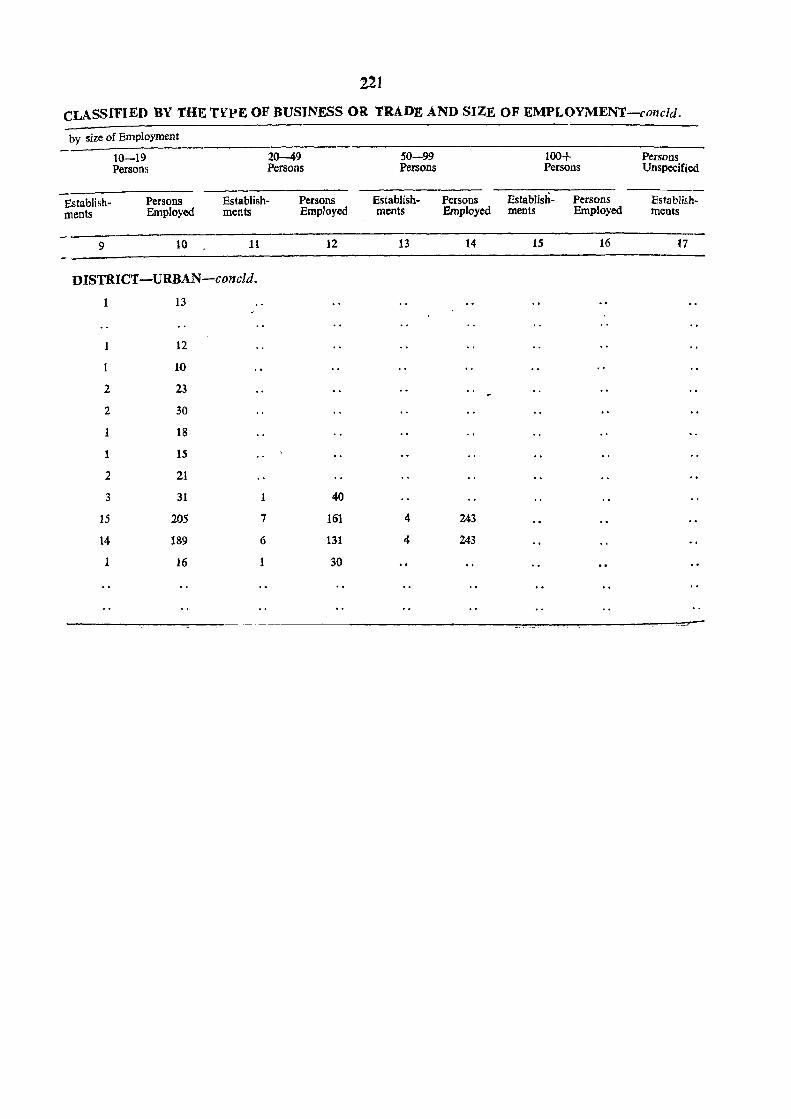
211
CLASSIFIED BY THE TYPE OF BUSINESS OR TRADE AND SIZE OF EMPLOYMENT-concld.
by size of Employment
10-19 20-49 50-99 100+ Persons Persons Persons Persons Persons Unspecified
-----Establish- Persons Establish- Persons Establish- Persons Establish- Persons Establish-ments Employed ments Employed ments Employed ments Employed ments
9 10 11 12 13 14 15 16 17
DISTRICT-URBAN-concld.
1 13
12
10
2 23
2 30
18
1 15
2 21
3 31 1 40
15 205 7 161 4 243
14 189 6 131 4 243
1 16 1 30

l'ABLE E-1V
])ISTRlBUTION OF ESTABLISHMENTS (OTHER THAN MANUFACtURING, PROCESSiNG Oa SERVICING OR BUSINESS·AND TRADE ESTABLISHMENTS) BY SIZE OF EMPLOYMENT
Flyleaf This table gives the distribution of establishments (other than manufacturing, processing or business
and trade establishment,s) by size of employment, which are the same as in Table E-III for total, rural and urban areas of the district separately in each Division/Major Gr9UP of National Industrial Classification, 1970. All establishments (other than manufacturing, processing or servicing or business and trade) further furnish employment by broad groups in each Division/Major Group. This table which has been attempted for the first time in t971-Census also provides frame for the establishments not covered by Tables E-U (Parts A, B & C) and E-III.
2. Columns 2 and 3 give total number of establishments (other than manufacturing, processing or servicing or business and trade) and total persons employed, respectively in each Division/Major Group of National Industrial Classification, 1970.
223
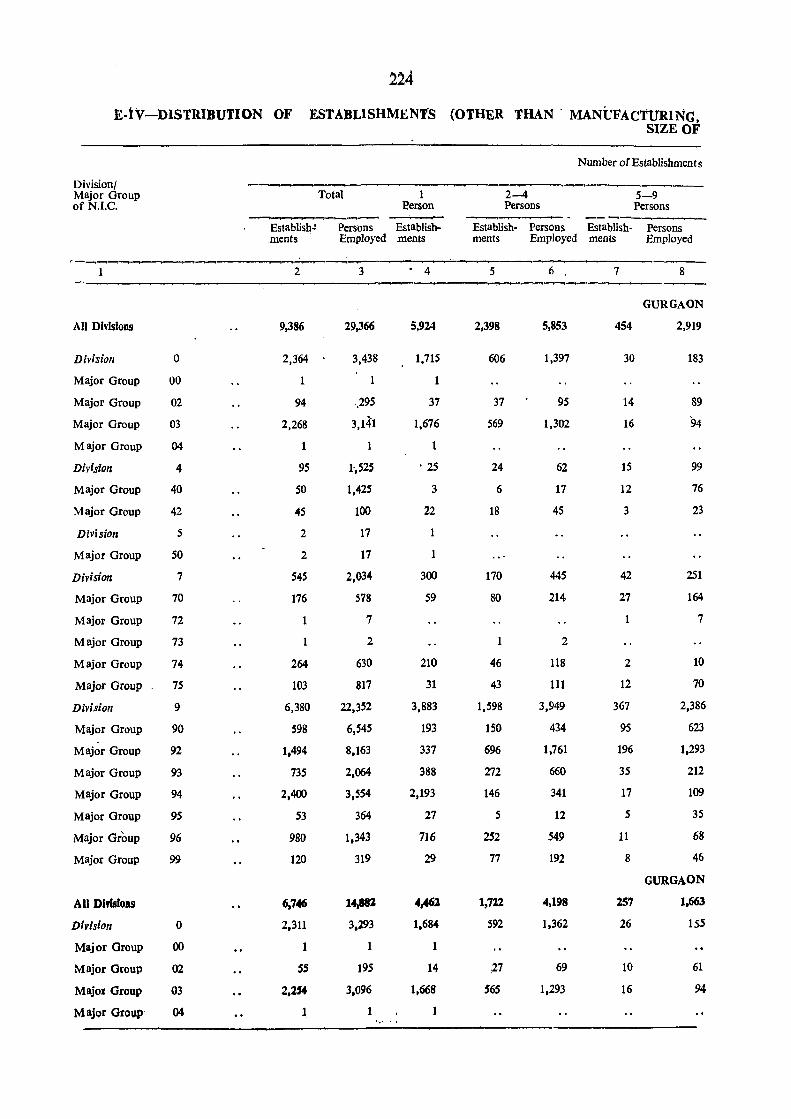
224
E-lv-DISTRIBUTION OF ESTABLISHMENTS (OTHER THAN' MANUFACTURING.
Divisionl Major Group of N.I.C.
All Divisions
Diyision
Major Group
Major Group
Major Group
Major Group
Diyision
Major Group
Major Group
Division
Major Group
Division
Major Group
Major Group
Major Group
Major Group
Major Group
Diyision
Major Group
Major Group
Major Group
Major Group
Major Group
Major Group
Major Group
AU Dirisloas
Division
Major Group
Major Group
Majol Group
Major Group
o 00
02
03
04
4
40
42
5
50
7
70
72
73
74
75
9
90
92
93
94
95
96
99
o 00
02
03
04
Total 1 l?erson
Establish.. Persons Establish-ments Employed .ments
2
9,386
2,364
1
94
2,268
95
50
45
2
2
545
176
1
1
264
103
6,380
598
1.494
735
2,400
53
980
120
6,746
2,311
1
55
3
29,366
3,438
1
.. 295
3,141
1-,525
1,425
100
17
17
2,034
578
7
2
630
817
22,352
6,545
8,163
2,064
3,554
364
1,343
319
14,181
3.2.93
1
195
3.096
1
. 4
5,924
1,715
1
37
1,676
1
. 25
3
22
1
300
59
210
31
3,883
193
337
388
2,193
27
716
29
4,461
1.684
1
14
2-4 Persons
SIZE OF
Number of Establishments
5-9 Persons
.Establish- Persons Establish- Persons ments Employed ments Employed
5
2,398
606
37
569
24
6
18
170
80
1
46
43
1,598
150
696
272
146
5
252
77
1,712
592
:27
565
6
5,853
1,397
9S
1,302
62
17
4S
445
214
2
118
III
3,949
434
1,761
660
341
12
549
192
4,198
1,362
69
1,293
7
454
30
14
16
15
12
3
42
27
2
12
367
95
196
35
17
5
11
8
257
26
10
16
8
GURGAON
2,919
183
89
94
99
76
23
251
164
7
10
70
2,386
623
1,293
212
109
35
68
46
GURGAON
1.663
155
61
94
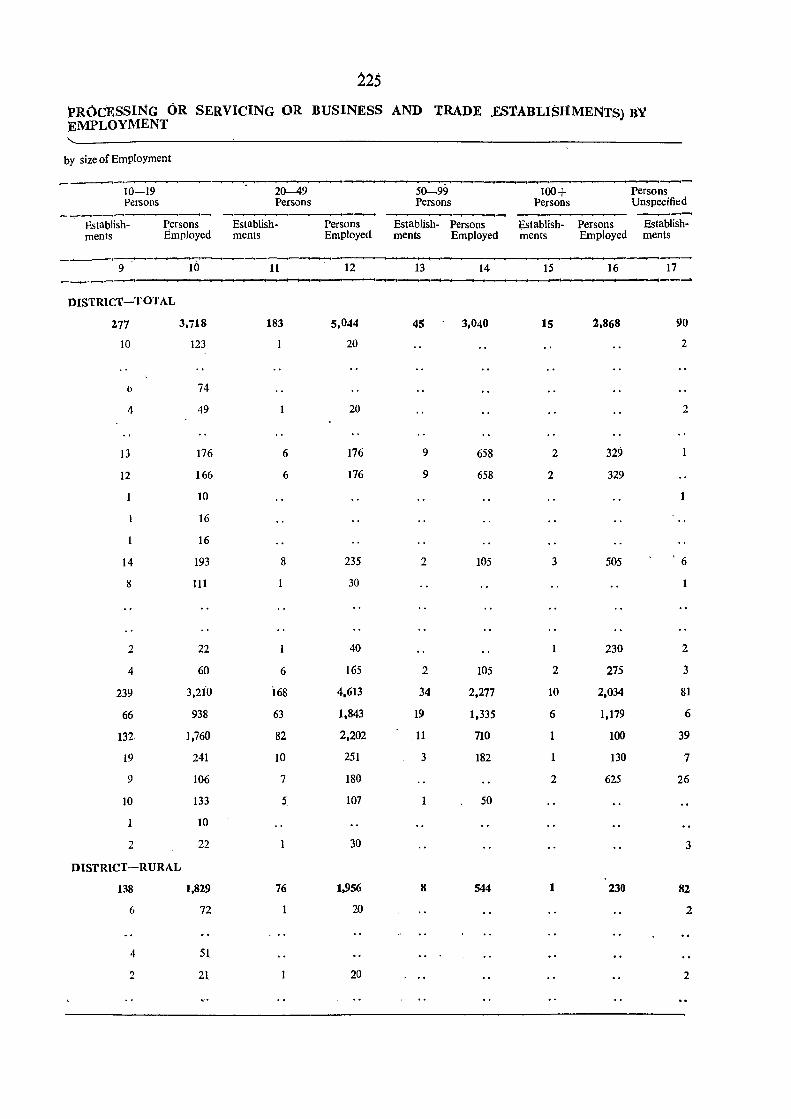
225
PROCESSING OR SERVlCING OR BUSINESS AND tRADE .ESTABLISHMENTS) BY EMPLOYMENT
by size of Employment
~~ ........-._-..-
10-19 20-49 5~99 100+ Persons Persons Persons Persons Persons Unspecified
-------.--_____,___.....----. ~~~
Establish- Persons Establish- Persons Establish- Persons Establish- Persons Establish-ments Employed ments Employed ments Employed ments Employed ments
____...---.---.~_,__..., ~~~ ~-. .
9 10 11 12 13 14 15 16 17
DISTRICT-TOTAL
277 3,i18 183 5,044 4S 3,040 15 2,868 90
10 123 20 2
() 74
4 49 20 2
13 176 6 176 9 658 2 329
12 166 6 176 9 658 2 329
10
16
16
14 193 8 235 2 105 3 505 ' 6
8 111 30
2 22 40 230 2
4 60 6 165 2 105 2 275 3
239 3,2io i68 4,613 34 2,277 10 2,034 81
66 938 63 1,843 19 1,335 6 1,179 6
132. 1,760 82 2,202 11 710 100 39
19 241 10 251 3 182 130 7
9 106 7 180 2 625 26
10 133 5 107 50
10
2 22 30 3
DISTRICT-RURAL
138 1,829 76 1,956 8 544 1 230 82
6 72 20 2
4 51
2 21 20 2
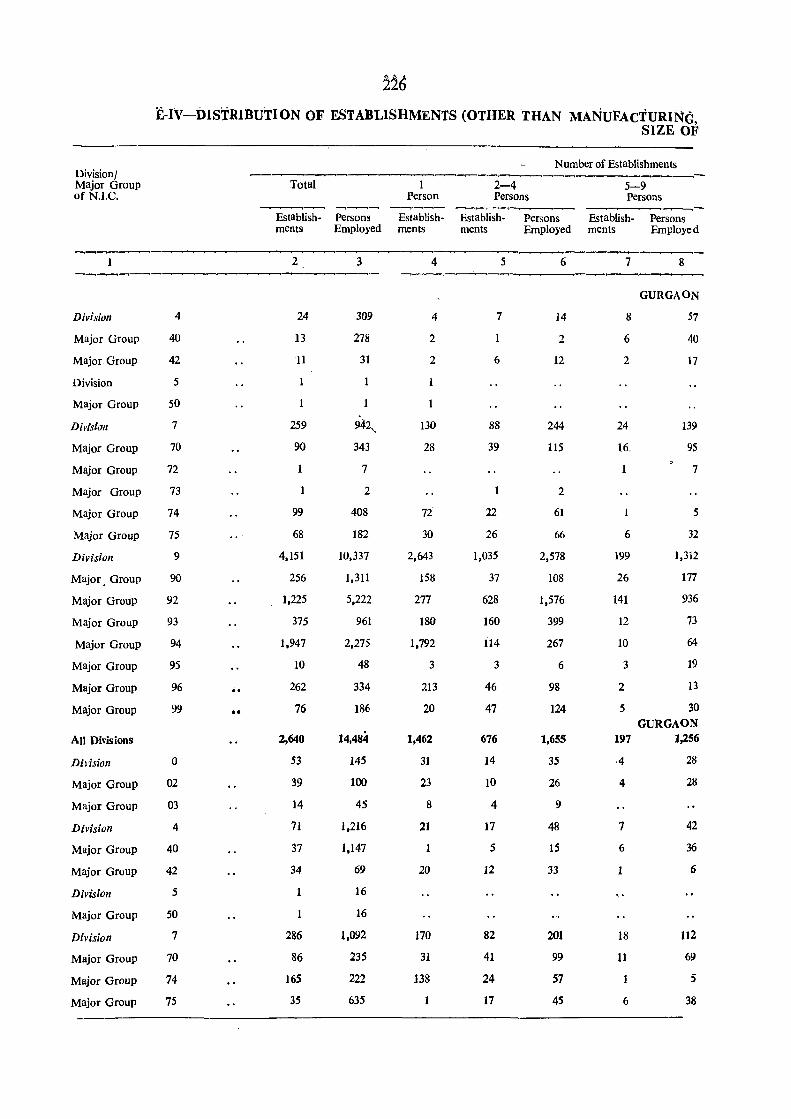
Division/ Major Group of N.I.C.
Division
Major Group
Major. Group
Division
Major Group
Division
Major Group
Major Group
Major Group
Major Group
Major Group
Division
Major. Group
Major Group
Major Group
Major Group
Major Group
Major Group
Major Group
All Divisions
Dil'ision
Major Group
Major Group
Division
Major Group
Major Group
Division
Major Group
Division
Major Group
Major Group
Major Group
E-Iv-inSTRIBUTION OF ESTABLISHMENTS (OTHER THAN MANUFACTURING, SIZE OF
4
40
42
5
50
7
70
72
73
74
75
9
90
92
93
94
95
96
99
o 02
03
4
40
42
5
50
7
70
74
75
..
Total 1 Person
2-4 Persons
Number of Establishments
5-9 Persons
Establish- Persons Establish- Establish- Persons Establish- Persons ments Employed ments ments Employed ments Employed
2 3 4 5 6 7 8
24
13
11
1
259
90
1
1
99
68
4,151
256
1,225
375
1,947
10
262
76
2,640
53
39
14
71
37
34
286
86
165
35
309
278
31
942,
343
7
2
408
182
10,337
1,311
5,222
961
2,275
48
334
186
14,484
145
100
45
1,216
1,147
69
16
16
1,092
235
222
635
4
2
2
130
28
72
30
2,643
158
277
180
1,792
3
113
20
1,462
31
23
8
21
20
170
31
138
7
6
88
39
22
26
1,035
37
628
160
114
3
46
47
676
14
10
4
17
5
12
82
41
24
17
14
2
12
244
115
2
61
66
2,578
108
1,576
399
267
6
98
124
1,655
35
26
9
48
IS
33
201
99
57
4S
8
6
2
24
16.
6
199
26
141
12
10
3
2
5
197
·4
4
7
6
I
','
18
11
6
GURGAON
57
40
17
139
95
7
5
32
1,312
177
936
73
64
19
13
30 GURGAON
1,256
28
28
42
36
6
112
69
5
38
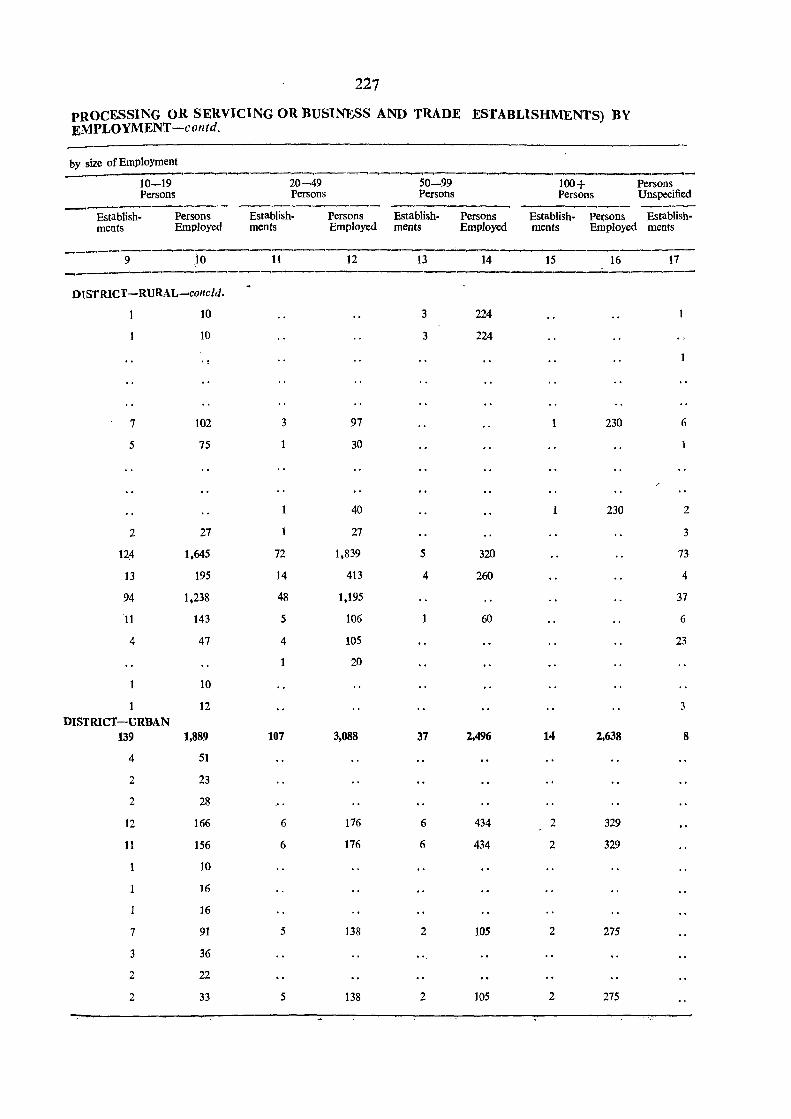
227
PROCESSING OR SERVICING OR BUSINESS AND TRADE ESTABLISHMENTS) BY EMPLOYMENT-contd.
by size of Employment
10-19 Persons
20-49 Persons
50-99 Persons
100+ Persons
Persons Unspecified
Establish· ments
Persons Employed
Establish· ments
Persons Establish· Persons Establish· Pe~sons Establish· Employed ments Employed ments Employed ments
---9-----10 ----i1-~--u_--- 13
DISTRIcr-RURAL~concld.
10
10
7
5
2
124
13
94
11
4
DISTRICT-URBAN 139
4
2
2
12
11
7
3
2
2
. ~
102
75
27
1,645
195
1,238
143
47
10
12
1,889
51
23
28
166
156
10
16
16
91
36
22
33
3
72
14
48
5
4
107
6
6
5
5
97
30
40
27
1,839
413
1,195
106
105
20
3,088
176
176
138
138
3
3
5
4
1
37
6
6
2
..
2
14
224
224
320
260
60
2,496
434
434
105
105
15
14
2
2
2
2
16 17
230 6
230 2
3
73
4
37
6
23
3
2,638 8
329
329
275
275
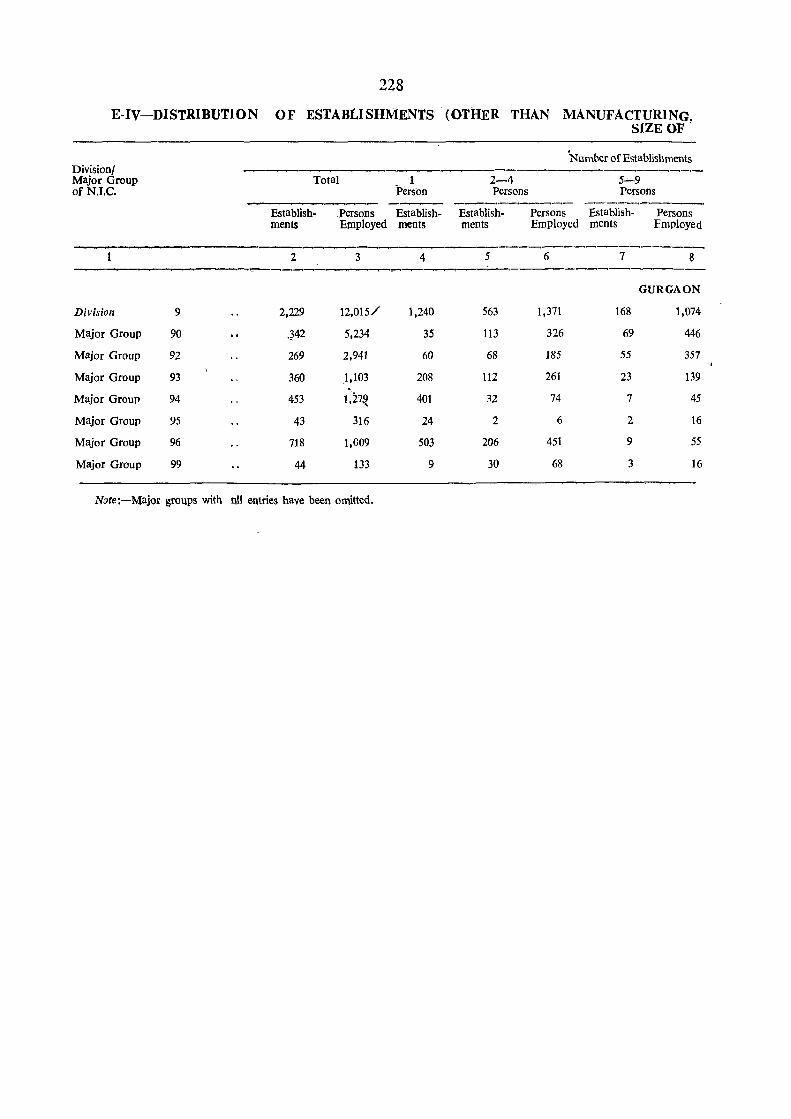
228
E-IV-DISTRIBUTION OF ESTABLISHMENTS· (OTHER THAN MANUFACTURING, SIZE OF
Divisionl Major Group of N.I,C,
1
Division
Major Group
Major Group
Major Group
Major Group
Major Group
Major Group
Major Group
9
90
92
93
94
95
96
99
Note:-Major groups with
'Number of Establishments
----------------------------------Total Person Persons
Establish.. .Persons Establish- Establish-ments Employed ments ments
2 3 4 5
2,229 12,015/ 1,240 563
.~42 5,234 35 113
269 2,941 60 68
360 1,103 208 112
453 1,279. 401 32
43 316 24 2
718 1,009 503 206
44 133 9 30
utI entries have been omitted.
5~9
Persons
Persons Establish- Persons Employed ments Employed
6 7 8
GURGAON
1,371 168 1,074
326 69 446
185 55 357
261 23 139
74 7 45
6 2 16
451 9 55
68 3 16
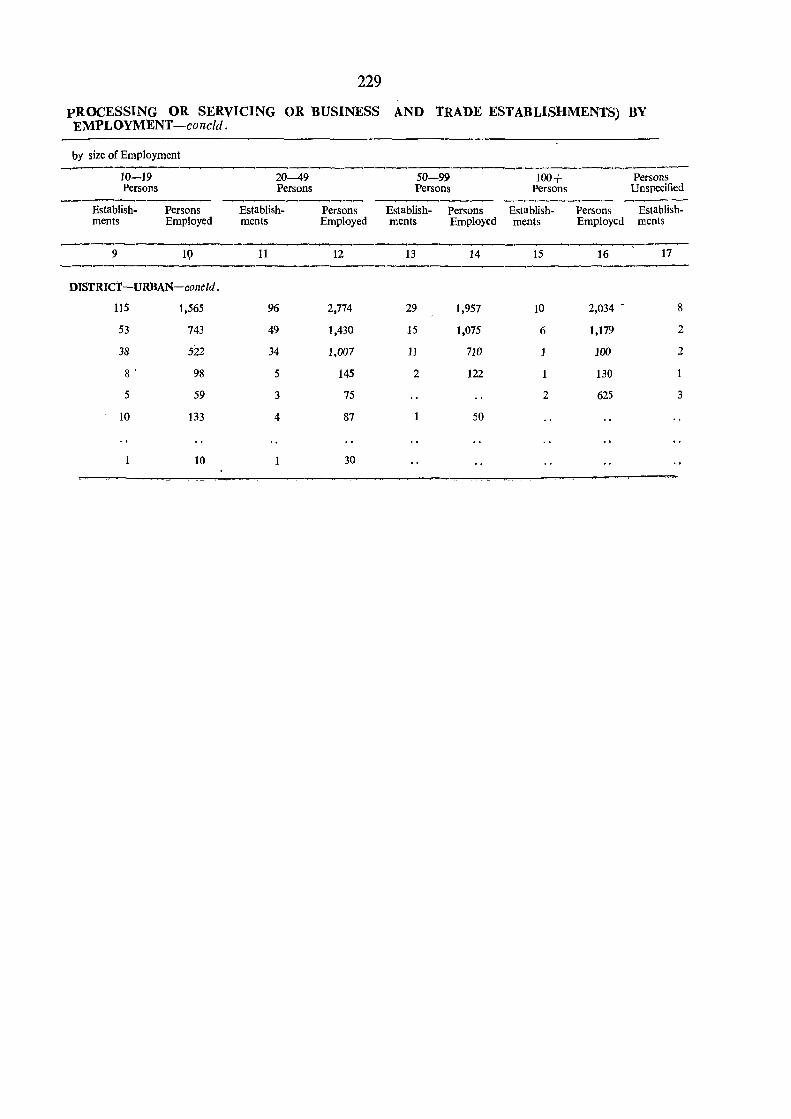
229
pROCESSING OR SERVICING OR BUSINESS AND TRADE ESTABLISHMENTS) BY EMPLOYMENT -concld .
by size of Employment
10-19 Persons
Establishments
Persons Employed
-------.----. 9
DISTRICT-URBAN-collcld.
115 1,565
53 743
38 522
8 ' 98
5 59
10 133
10
20-49 Persons
Establishments
11
96
49
34
5
3
4
1
50-99 Persons
100+ Persons
Persons Unspecified
Persons Establish- Persons Establish- Persons Establish-Employed ments Employed ments Employed ments
12
2,714
1,430
1,D07
145
75
87
30
----~-~
13 14
29 1,957
15 1,075
11 710
2 122
50
15
10
6
2
16
2,034 -
1,179
lDO
130
625
17
8
2
2
3

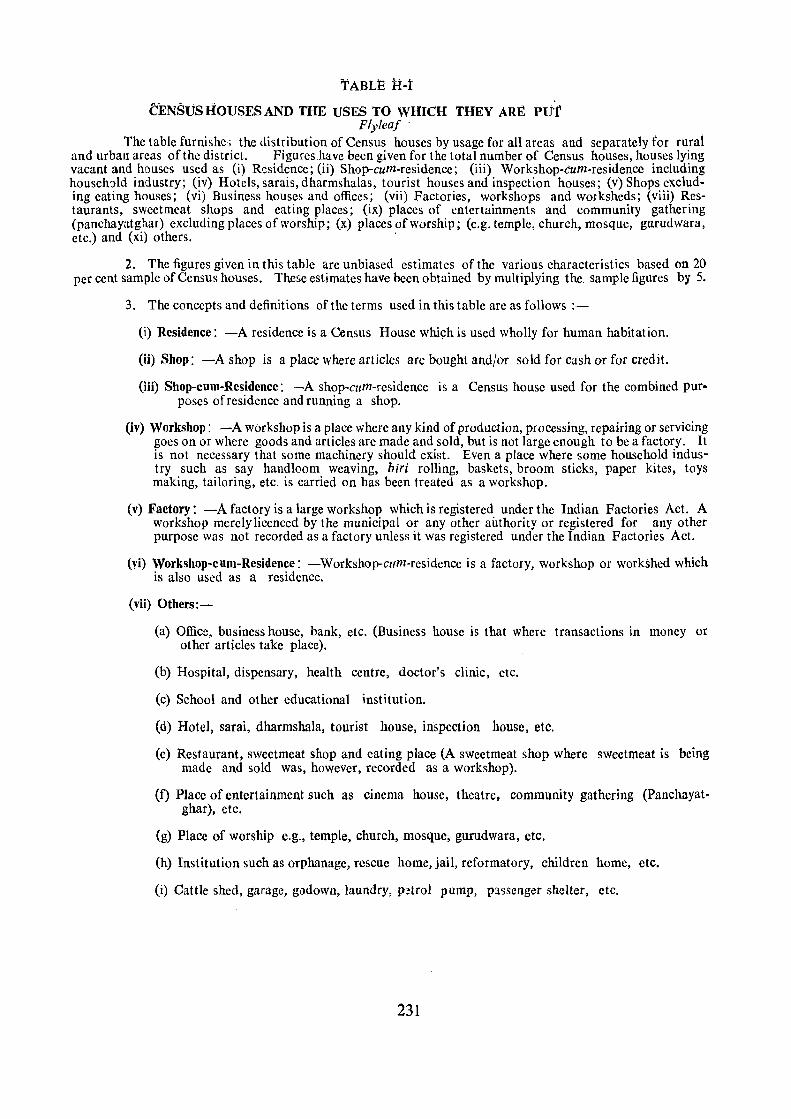
TABLE H-t
CENSUS HOUSES AND THE USES TO WHICH THEY ARE: put Flyleaf·
The table furnishc3 the distribution of Census houses by usage for all areas and separately for rural and urban arcas of the district. Figures.have been given for the total number of Census houses, houses lying vacant and houses used as (i) Residence; (ii) Shop-cum-residence; (iii) Workshop-tum-residence including househ')ld industry; (iv) Hotels, sarais, dharmshalas, tourist houses and inspection houses; (v) Shops excluding eating houses; (vi) Business houses and offices; (vii) Factories, workshops and worksheds; (viii) Restaurants, sweetmeat shops and eating places; (ix) places of entertainments and community gathering (panchayatghar) excluding places of worship; (x) places of worship; (e.g. temple, church, mosque, gurudwara, etc.) and (xi) others. .
2. The figures given in this table arc unbiased estimates of the various characteristics based on 20 per cent sample of Census houses. These estimates have been obtained by multiplying the. sample figures by 5.
3. The concepts and definitions of the terms used in this table are as follows :-
(i) Residence: -A residence is a Census House whi9h is used wholly for human habitation.
(ii) Shop: -:-A shop is a place where articles are bought and/or sold for cash or for credit.
(iii) Shop-cum-Residence: -A shop-cum-residence is a Census house used for the combined purposes of residence and running a shop.
(iv) Workshop: -A workshop is a place where any kind of production, processing, repairing or servicing goes on or where goods and articles are made and sold, but is not large enough to be a factory. It is not necessary that some machinery should exist. Even a place where some household industry such as say handloom weaving, hiri rolling, baskets, broom sticks, paper kites, toys making, tailoring, etc. is carried on has been treated as a workshop.
(v) Factory: -A factory is a large workshop which is registered under the Indian Factories Act. A workshop merely licenced by the municipal or any other authority or registered for any other purpose was not recorded as a factory unless it was registered under the Indian Factories Act.
(Vi) Workshop-cum-Residence: -Workshop-cum-residence is a factory, workshop or workshed which is also used as a residence.
(vii) Others:-
(a) Office, business house, bank, etc. (Business house is that where transactions in money or other articles take place).
(b) Hospital, dispensary, health centre, doctor's clinic, etc.
(c) School and other educational institution.
(d) Hotel, sarai, dharmshala, tourist house, inspection house, etc.
(e) Restaurant, sweetmeat shop and eating place (A sweetmeat shop where sweetmeat is being made and sold was, however, recorded as a workshop).
(f) Place of entertainment such as cinema house, theatre. community gathering (Panchayat· ghar). etc.
(g) Place of worship e.g., temple, church, mosque, gurudwara, etc.
(h) Institution such as orphanage, rescue home, jail, reformatory, children home, etc.
(i) Cattle shed, garage, godown, laundry, p:!trol pump, plssenger shelter, etc.
231

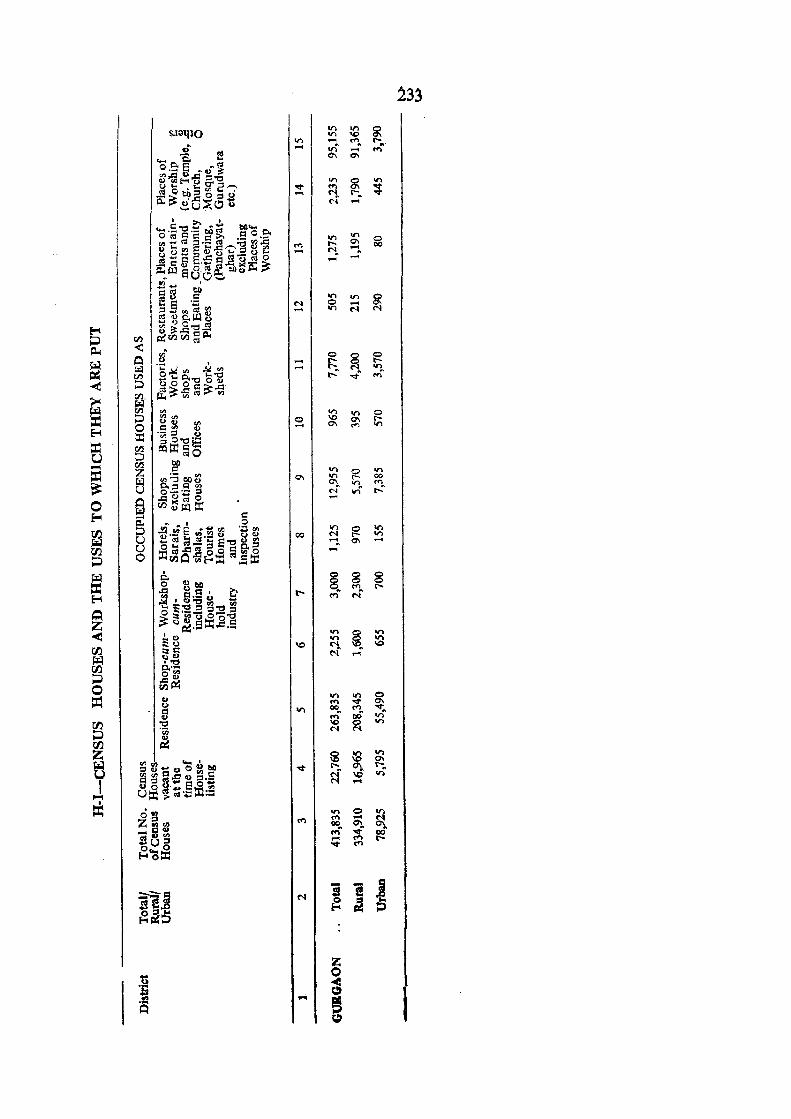
233
If") If")
~ or. ~ or. .... v)
..... 1-•. ..... .... '" '"
'<t VI ~ or. .... .... ("l t-. ~ N ....
If") VI
M I- '" 0 - C"i, -. 00 -
N VI If") ~ 0 -.... or. N N
g ~ g 1-. 10 I- "<t. .....
0 or. VI g \0 - '"
0\ .... or.
00 or. g I() N .... VI
0\ .....
8. g g .... r-.. .... N·
or. '" 0 .... ..r 0\ 00 .... '¢ • ..... rR or. \0 ~
VI N
~ V> II') \0 0\
r-.. 0\ 1-.
~ ...; VI ....
or. 0 If") .... .... -DC 0\ ~ ..,ft '<to rR .... ..... t-• ....
N i i ~ ~ ~ p

TABLE H-II
DISTRIBUTION OF CENSUS HOUSES BY PREDOMINANT MATERIAL OF WALL AND PREDOMINANT MATERIAL OF ROOF
Flyleaf
This table gives the distribution of Census houses by predominant material of wall and predominant material of roof. Data have been presented fol' the total, rural and urban areas of the district separately.
2. The figu~es given in this table are unbiased estimates of the characteristics based on 20% sample of Census houses. These csti~ates have been obtained by mUltiplying the sample figures by 5.
3. The table has been supplemented with an Appendix (Appendix to Table H-II) which cross-classfies material of wall with material of roof.
235

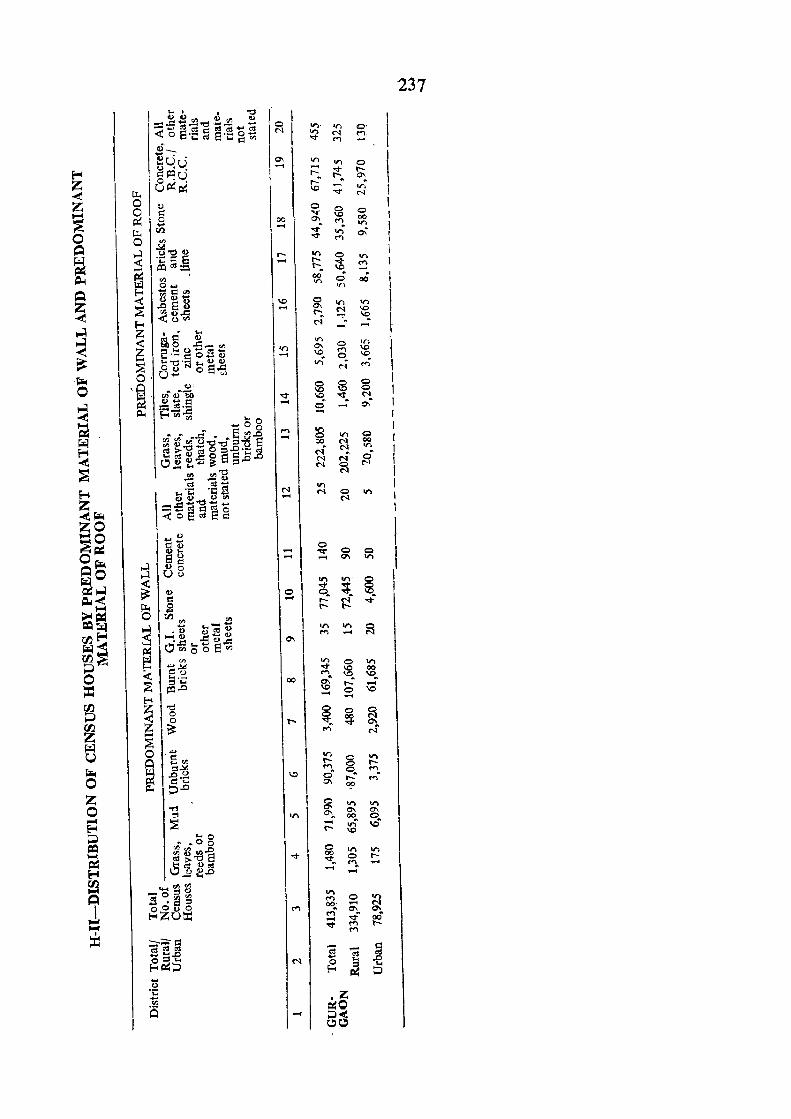
l~ I~ I-
I I~ I
--
11"). .,., o· II") N ..... '<t .....
Vl on 0 ,..., ;t~ I'-I'- 0"-r-:
I.C Vl "<t N
0 0 0 .... \0 00 0"-. ..... oro "<t .,., 0\ v M
In 0 .,... I'- "<l' ..... I'-~ \0 00 0 00 .,... .,... 0 .,., .,., ~ N I.C t-;. '"". \0 N ..... ,..., .,...
0 .,...
~ ..... \0 \.0 o_ \0 In"
N .....
0 0 0 I.C \0 0 \C -.:t_ N
0 ~
In on 0 0 00 N 00
~ N .,...
N N 0 N 0 N
N
on N 0 .,.,
N
0 0 «r 0 ..... ~ .,.,
on In 0 '<t "<t' ~. O. ""'. I'- N "<t' I'- I'-
on on ~ ..... .... .,., 0 .,., '<t \0 00 ..... \0 \0. ~~ ...: -\0 0 \0 .... .....
~. 0 ~ 00 '<t ~ ..... N
Vl 0 on I'- 0 I'-..... O~ .....~ 0 I'- .....
~ ~
0 .,., .,., 0'1 0'1 ~ 0'1. 00 o~ - .,.; \C I'- \.0
0 Vl .,., 00 0 I'-'<to ..... ~ ..... ..... -on
0 on ..... 00.; ....
~~ ..... ~ . .... "<t' 00 '<t ..... I'-.....
C; - d
~ <':! .. .D
~ ~ ::; ,Z ~O
§~
\ I
\ I I 1 I I I 1
\ I I I I 1 I I I
I I I I 1
! II
237
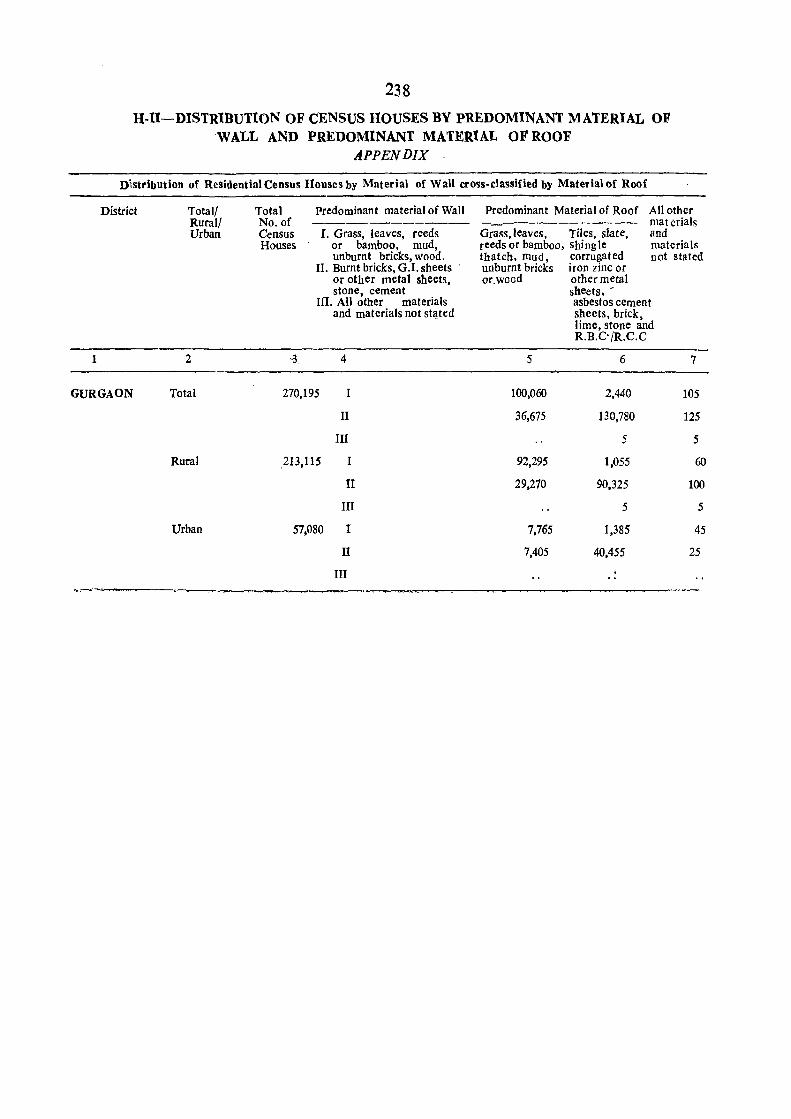
1
238
H-Il-DISTRIBUTION OF CENSUS HOUSES BY PREDOMINANT MATERIAL OF WALL AND PREDOMINANT MATERIAL OF ROOF
APPENDIX
Distribution of Residential Census Houses by Materia) of Wall cross-classified by Material of Roof
District Total! Total Predominant material of Wall Predominant Material of Roof All other Rural! No. of -------- - - ---------- materials Urban Census I. Grass, leaves, reeds Grass, leaves, Tiles, slate, and
Houses or bamboo, mud, reeds or bamboo, shing Ie materials unburnt bricks, wood. thatch, mud, corrugated not stated
II. Burnt bricks, G.I.sheets . unburnt bricks iron zinc or or other metal sheets, or.wood other metal stone, cement sheets, -
III. All other materials asbestos cement and materials not st<l,ted sheets, brick,
lime, stone and R.B.C'/R.C.C
2 .. 3. 4 5 6 7
GURGAON Total 270,195 I 100,060 2,440 105
II 36,675 130,780 125
III 5 5
Rural 213,115 I 92,295 1,055 60
II 29,270 90,325 100
III 5 5
Urban 57,080 I 7,765 1,385 45
II 7,405 40,455 25
III ..
TABLE iI-iii
HOUSEHOLDS CLASSIFIED BY NUMBER OF MEMBERS AND BY NUMBER OF ROOMS OCCUPIED
Flyleaf
This table gives figures relating to households occupying one room, 2, 3,4 and 5 rooms and with unspecified number: of rooms as also the number of members involved. The data have been presented for the total, rural and urban areas of the district separately. The data are helpful in the measurement of congestion and over-crowding in households. .. - - - . . . - - ..
2. The figures given in this table are unbiased estimates of the charateristics based on 20% sample of Census houses. These estimates have been obtained after multiplying the sample figures by 5.
239
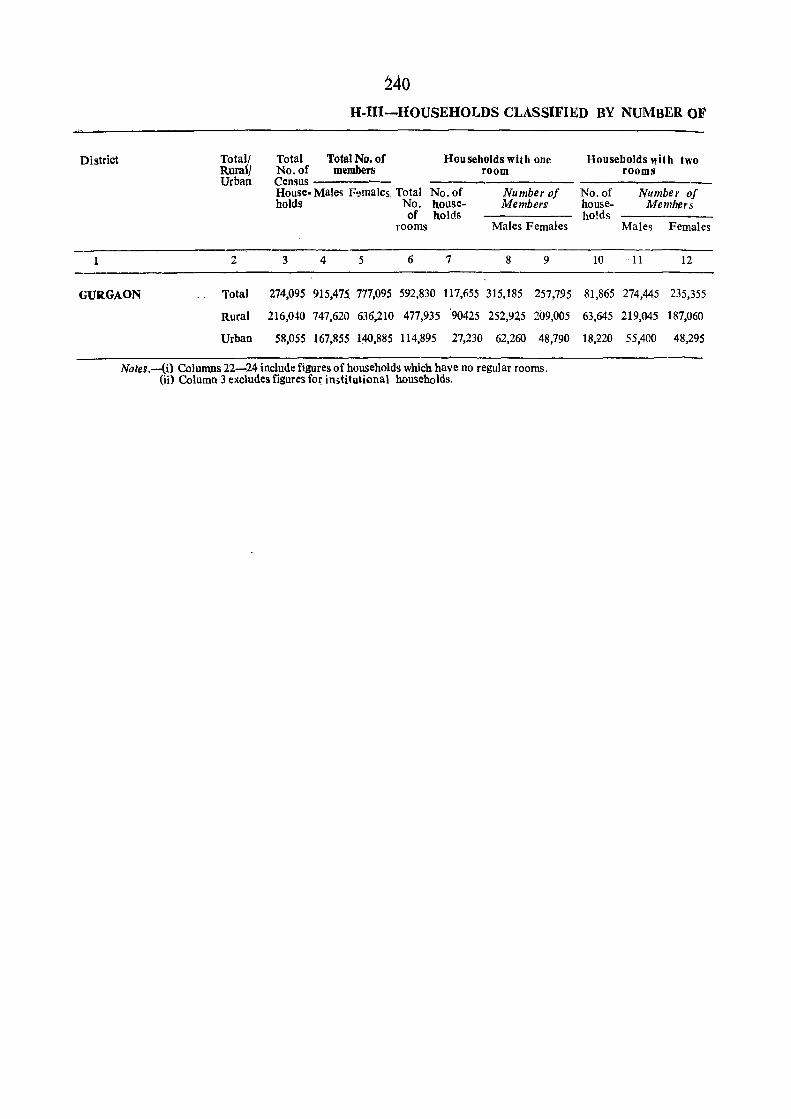
240 H-lIl-HOUSEHOLDS CLASSIFIED BY NUMBER OF
Total! Total Total No. of Households with one Rural! No. of members room
District
Urban Census --House- Males F'.lmales. Total No. of Number of holds No. house- Members
of holds rOoms Males Females
2 3 4 5 6 7 8 9
GURGAON Total 274,095 915,475. 777,095 592,830 117,655 315,185 257,795
Rural 216,0~O 747,620 636,210 477,935 90425 252,925 209,005
Urban 58,055 167,855 140,885 114,895 27,230 62,260 48,790
Notes.-(i) Columns 22-24 include figures of households which have no regular rooms. (ij) Column 3 ex.cludes figures fo~ institutional households.
Households with two rooms
No. of Number of house- Members holds
Males Females
10 ~11 12
81,865 274,445 235,355
63,645 219,045 187,060
18,220 55,400 48,295
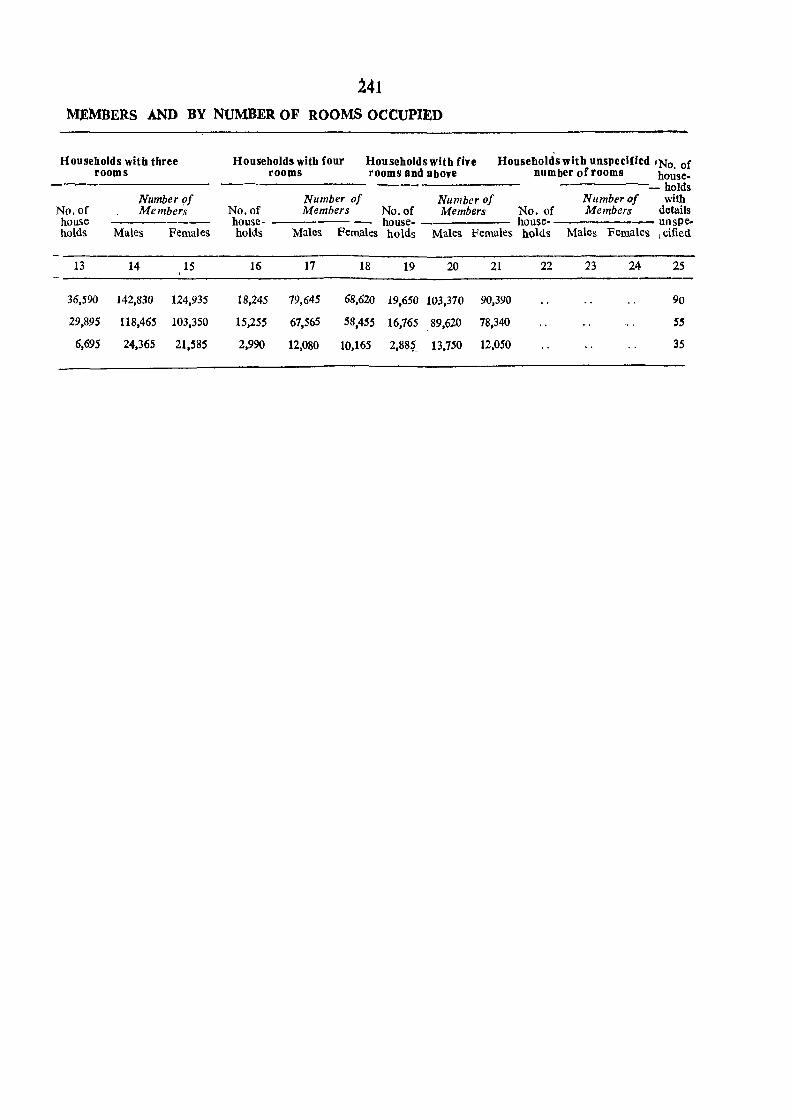
241 MEMBERS AND BY NUMBER OF ROOMS OCCUPIED
Households with three Households with four Households with five Households with unspecified 'No. of rooms rooms rooms and abOve number of rooms house---- holds
Number of Number of Number of Number of with No. of Members No. of Members No. of Members No. of Members details house house- house. house- unspe. holds Males Females holds Males Females holds Males Females holds Males Females , cified
13 14 15 16 17 18 19 20 21 22 23 24 25
36,590 142,830 124,935 18,245 79,645 68,620 19,650 103,370 90,390 90
29,895 118,465 103,350 15,255 67,565 58,455 16,765 89,620 78,340 SS
6,695 24,365 21,585 2,990 12,080 10,165 2,88~~ 13,750 12,050 3S

TABLE SC-I
INDUSTRIAL CLASSIFICATION OF PERSONS AT WORK AND NON-WORKERSBYSEX FOR SCHEDULED CASTES
Flyleaf
This table has been prepared in two parts, Part-A for rural areas and Part-B for urban aread The table gives the population of each scheduled caste by sex alongwith their classification into workers an' non-workers. Workers of each scheduled castes are further classified into the following nine industrial catc-s gories of workers:-
I. As Cultivators;
II. As Agricultural Labourers;
III. In Livestock, Forestry, Fishing, Hunting and Plantations, Orchards and Allied activities;
IV. In Mining and Quarrying;
V. In Manufacturing, Processing, Servicing and Repairs:
(a) Household Industry;
(b) Other than Household Industry;
VI. In Construction;
VII. In Trade and Commerce;
VIII. In Transport, Storage and Communications; and
IX. In Other Services.
2. Data in this table have been presented for the district only. The castes for which there are no figures have been deleted from the table. This table corresponds to Table SGT-I Part-A of 1961-Census. Table SCT-I Part-A of 1961-Census, however, presented additional data for the workers engaged in special occupations i.e. 'tanning and currying of hides and skins' and 'scavenging' but no such classification has beea attempted at the 1971-Census.
243
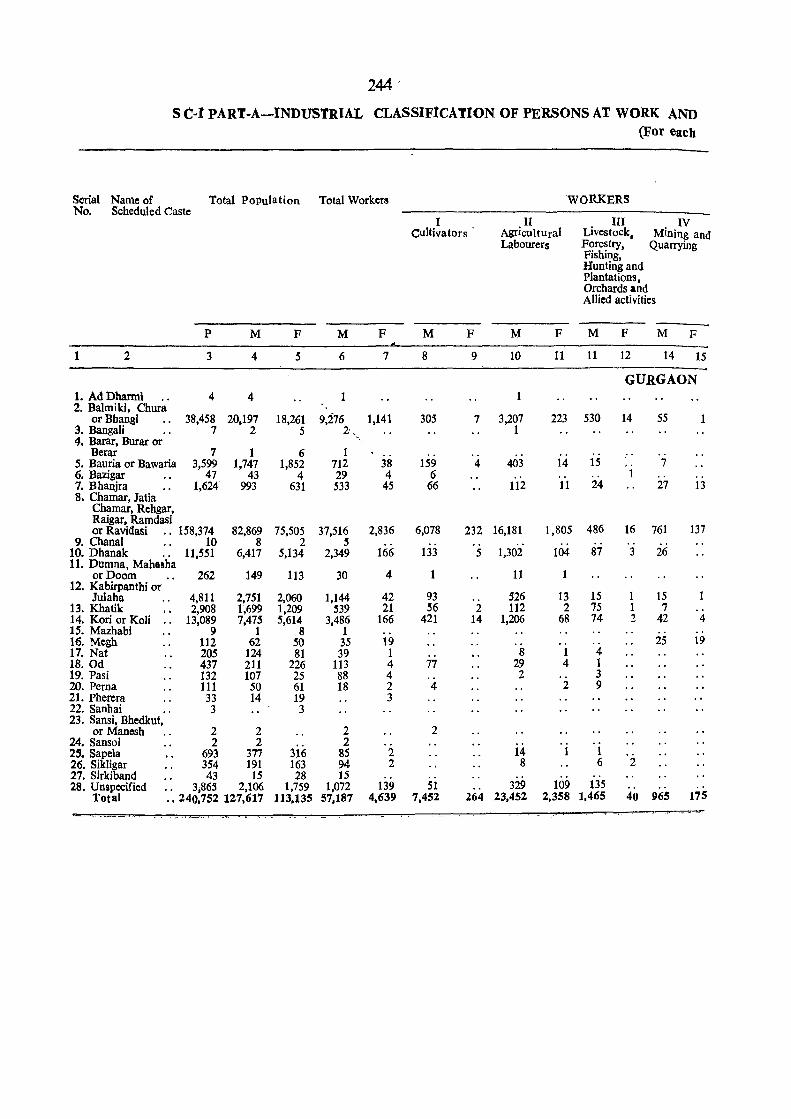
244
SC-I PART-A-INDUSTRIAL CLASSIFICATION OF PERSONS AT WORK AND (For each
Serial Name of Total Population Total Workers WORKERS No. Scheduled Caste
I II III IV cultivators· Agricultural Livestock, Mining and
Labourers Forestry, Quarrying Fishing, Hunting and Plantations, Orchards and Allied activities
P M F M F M F M F M F M F
1 2 3 4 5 6 7 8 9 10 11 11 12 14 15
GURGAON 1. Ad Dhanni 4 4 2. Balmikl, Chura
or Bhangi .. 38,458 20,197 18,261 9,276 1,141 305 7 3,207 223 530 14 55 3. Bangali 7 2 5 2', 1 4. Barar, Burar or '.
Berar 7 1 6 1 .. . . . . .. .. S. Bauria or Bawaria 3,599 1,747 1,852 712 38 159 4 403 14 15 .. 7 6. Bazigar 47 43 4 29 4 6 . , .. 1 .. .. 7. Bhanjra 1,624 993 631 533 45 66 112 11 24 27 13 8. Chamar, Jatia
Chamar, Rehgar, Raigar. Ramdasi or Ravidasi .. 158,374 82,869 75,505 37,516 2,836 6,078 232 16,181 1,805 486 16 761 137
9. Chanal 10 8 2 5 .. .. 10. Dhanak 11,551 6,417 5,134 2,349 166 133 5 1,302 104 87 3 26 11. Dumna, Mah88ha
or Doom 262 149 113 30 4 1 11 1 12. Kabirpanthi or
Julaha 4,811 2,751 2,060 1,144 42 93 526 13 15 1 15 13. Khatik 2,908 1,699 1,209 539 21 56 2 112 2 75 1 7 14. Kori or Ko)i .. 13,089 7,475 5,614 3,486 166 421 14 1,206 68 74 2 42 4 15. Mazhabi 9 1 8 1 .. ., 16. Megh 112 62 50 35 19 .. .. 25 19 17. Nat 205 124 81 39 1 8 1 4 18.0d 431 211 226 113 4 77 29 4 1 19. Pasi 132 107 25 88 4 2 3 20. Perna 111 50 61 18 2 4 2 9 21. Pherera 33 14 19 3 22. Sanhai .. 3 3 23. Sansi, Bhedkut,
or Manesh 2 2 2 2 24. Sansoi 2 2 2 25. Sapeta 693 317 316 85 2 14 1 1 26. Sikligar 354 191 163 94 2 8 6 2 21. Slrkiband 43 15 28 15 .. 28. Unspecified .. 3,865 2,106 1,759 1,072 139 51 .. 329 109 135 .. .,
Total .• 240,752 127,61'7 113,135 57,187 4,639 7,452 264 23,452 2,358 1,465 40 965 175
..... -. ------,-
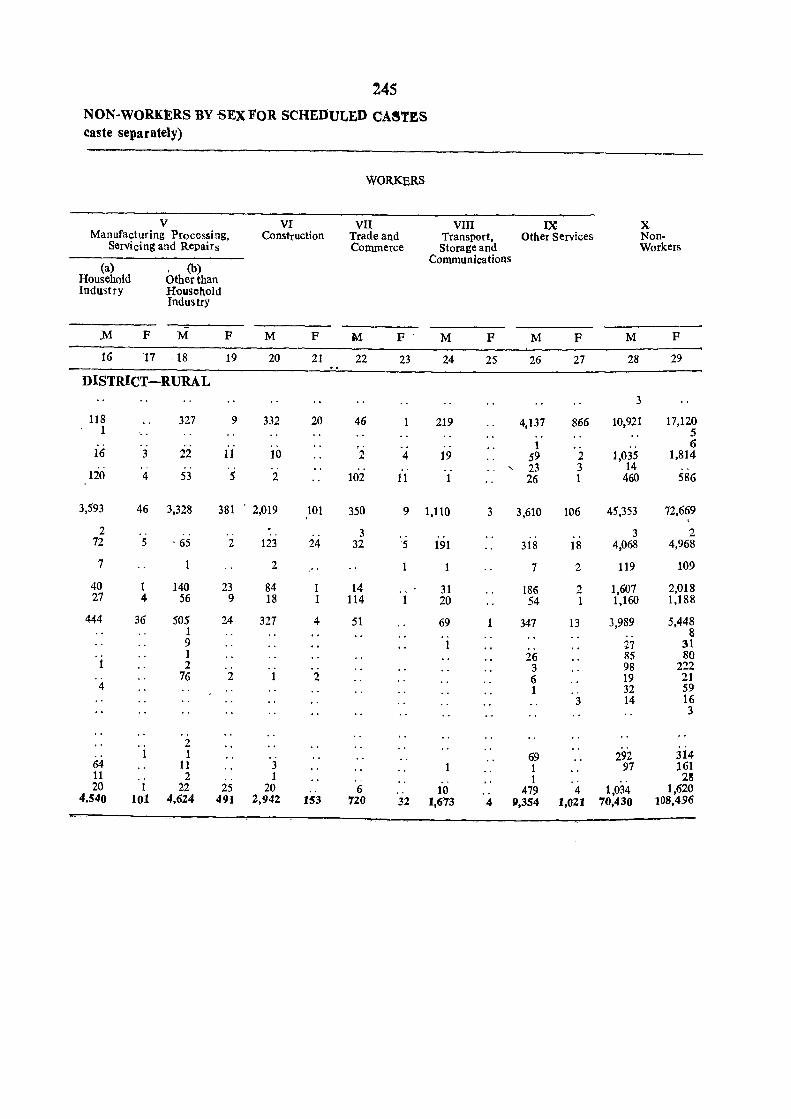
145 NON-WORKERS BY -SEX FOR SCHEDULED CASTES caste separately)
WORKERS
V VI VII VIII IX X Manufacturing Processing, Construction Trade and Transport, Other Services Non-
Servicing and Repairs Commerce Storage and Workers Communica tions
(a) , (b) Household Other than Industry Household
Industry
,M F M F M F M F- M F M F M F
16 17 18 19 20 21 22 23 24 25 26 27 28 29
DISTRICT-RURAL 3
118 327 9 332 20 46 1 219 4,137 866 10,921 17,120 1 .. 5
.. 1 .. 6 16 3 22 11 10 2 4 19 59 2 1,035 1,814
. - . , . , "- 23 3 14 .. 120 4 53 5 2 102 11 1 26 1 460 586
3,593 46 3,328 381 ' 2,019 101 350 9 1,110 3 3,610 106 45,353 72,669 , 2 . 3 3 2 ' , . - - . , , , , . , , ' ..
12 5 . 65 2 123 24 32 5 191 318 18 4,068 4,968
7 2 7 2 119 109
40 1 140 23 84 1 14 31 186 2 1,607 2,018 27 4 56 9 18 1 114 1 20 54 1 1,160 1,188
444 36 505 24 327 4 51 69 347 13 3,989 5,448 1 .- 8 9 1 .. 7.7 31 1 26 85 80
1 2 3 98 222 76 2 1 2 6 19 21
4 1 32 59 3 14 16
3
. , 2
1 1 69 292 314 64 11 3 1 97 161 11 2 . . 1 , , 1 .. , . 2~ 20 1 22 25 20 ,. 6 , , 10 , , 479 4 1,034 1,620
4,540 101 4,624 491 2,942 153 720 32 1,673 4 9,354 1,021 70,430 108,496
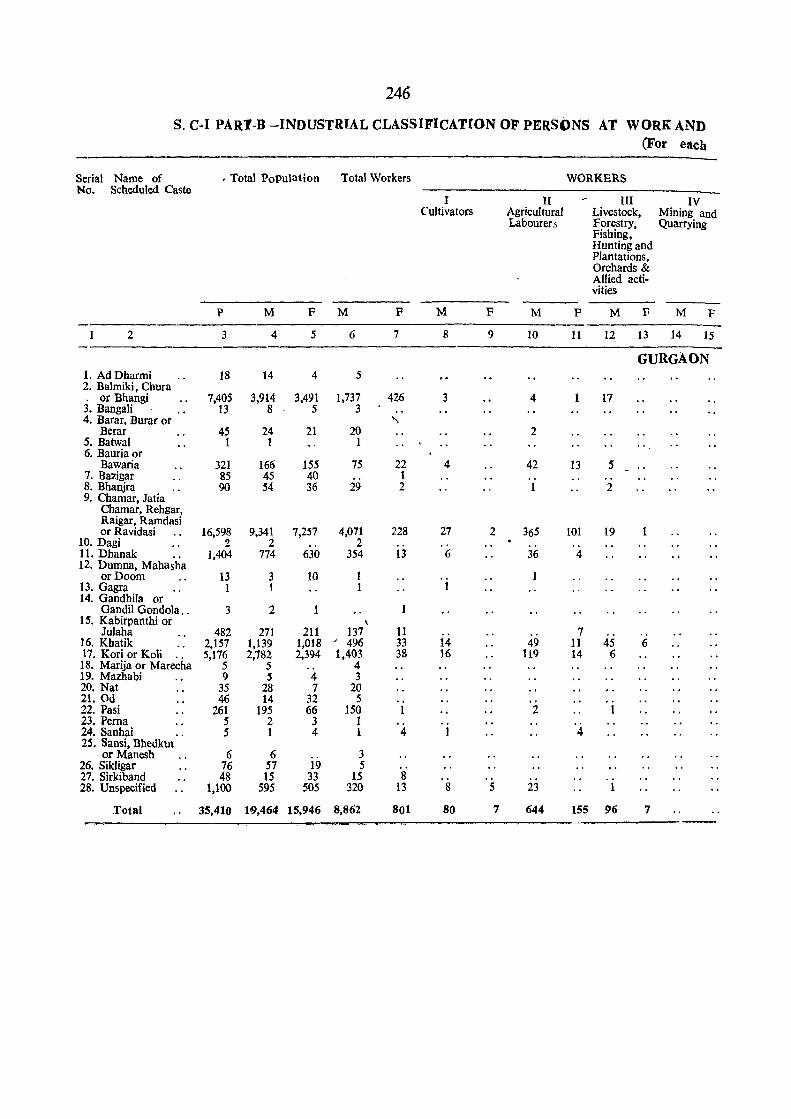
246
S. C-I PAR'l-B-INOUSTRIAL CLASSIFICATION OF PERSONS AT WORK AND (For eacb
Serial Name of • Total Population Total Workers WORKERS No. Scheduled Caste
I II III IV Cultivators Agricultural Livestock, Mining and
Labourers Forestry, Quarrying Fishing, Hunting and Plantations, Orchards & Allied acti-vities
p M F M F M F M F M F M F
2 3 4 5 6 7 8 9 10 11 12 13 14 15
GURGAON 1. AdDharmi 18 14 4 5 2. Balmiki, Chura . or Bhangi 7,405 3,914 3,491 1,737 426 3 4 17 3. BangaJi 13 8 5 3 .. 4. Barar, Burar or '-,
Berar 45 24 21 20 2 5. Batwal 1 1 1 .. 6. Bauria or
Bawaria 321 166 155 75 22 4 42 13 5 7. Bazigar 85 45 40 .. 1 .. 8. Bhanjra 90 54 36 29 2 1 2 9. Chamar, Jatia
Chamar, Rehgar, Raigar, Ramdasi or Ravidasi 16,598 9,341 7,257 4,071 228 27 2 365 101 19
10. Dagi 2 2 .. 2 11. Dhanak 1,404 774 630 354 13 6 36 4 12. Dumna, Mahasha
or Doom 13 3 10 1 13. Gagra 1 1 1 1 14. Gandhila or
Gandil Gondola .. 3 2 IS. Kabirpanthi or \
Julaha 482 271 211 137 11 7 " 16. Khatik
" 2,157 1,139 1,018 -' 496 33 14 49 11 45 6 17. Kori or Koli " 5,176 2,782 2,394 1,403 38 16 119 14 6 18. Marija or Marecha 5 5 4 19. Mazhabi 9 5 4 3 20. Nat 35 28 7 20 21. Od 46 14 32 5 22. Pasi 261 195 66 150 1 2 1 23. Perna 5 2 3 1 24. Sanhai 5 1 4 1 4 1 4 25. Sansi, Bhedkut
or Manesh 6 6 3 26. Sikligar 76 57 19 5 27. Sirkiband 48 15 33 15 8 28. Unspecified 1,100 595 505 320 13 8 5 23 1
Total 35,410 1'9,464 15,946 8,862 801 80 7 644 155 96 7
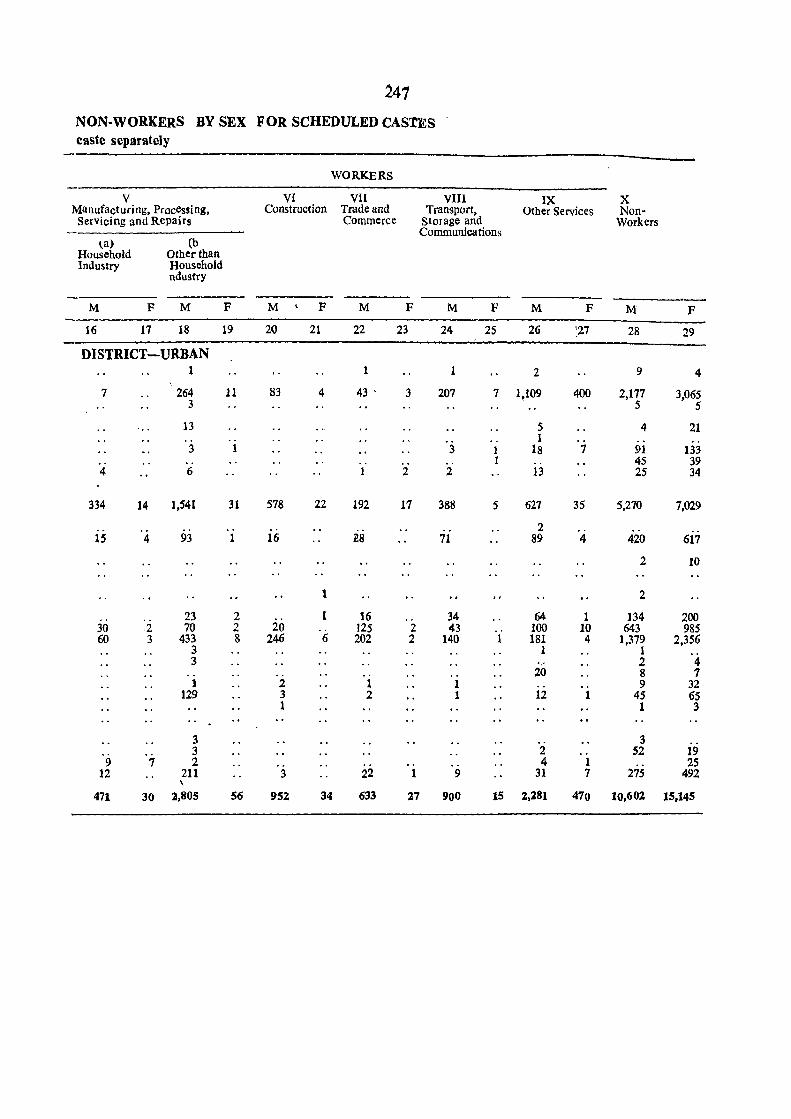
241
NON-WORKERS BY SEX FOR SCHEDULED CASTES caste separately
WORKERS
V VI VII VIII IX X Manufacturing, Processing, Construction Trade and Transport, Other Services Non-
Servicing and Repairs Commerce Storage and Workers Communications
\a) (b Household Other than Industry Household
ndustry
M F M F M F M F M F M F M F
16 17 18 19 20 21 22 23 24 2S 26 ~27 28 29
DISTRICT-URBAN 1 1 1 2 9 4
7 264 11 83 4 43 ' 3 207 7 1,109 400 2,177 3,065 3 5 5
13 5 4 21 .. 1 ..
3 1 3 1 18 7 91 133 .. .. 1 . . 4S 39
4 6 1 2 2 13 25 34
334 14 1,541 31 578 22 192 17 388 5 627 35 5,270 7,029
2 15 4 93 1 16 l28 71 89 4 420 617
2 10
1 2
23 2 1 16 .. 34 64 1 134 200 30 2 70 2 20 125 2 43 100 10 643 985 60 3 433 8 246 6 202 2 140 1 181 4 1,379 2,356
3 1 1 3 2 4
.. 20 8 7 1 2 1 1 .. 9 32
129 3 2 1 12 1 45 65 1 1 3
3 3 3 2 52 19
9 7 2 .. 4 1 25 12 211 3 22 1 9 31 7 275 492
\
471 30 l,805 56 952 34 633 27 900 15 2,l81 470 10,602 15,145

TABLE SC-II
AGE AND MARITAL STATUS FOR SCHEDULED CASTES (CASTE-WISE)
Flyleaf
This table corresponds to Table SCT-II Part-A of 1961-Census and gives the distribution of male and female population of each caste separately by the three broad age-groups i.e. 0-14, 15-44, 45+and Age not stated. The population under each age-group is further classified according to the marital-status viz., 'Never Married', 'Married,' Widowed, 'Divorced or Separated,' and 'Unspecified marital status'. Persons who did not report their marital status have been grouped under' 'unspecified marital status' for each group separately. The number of such persons in Gurgaon District was 23 (3 males and 10 females). A bulk of persons having unspecified marital status were in the age-group 0-14, viZ., 20 persons (2 males and 18 females).
i. This table is presented for the district only without any rural or urban break-up. The castes for which there are no figures have been omitted from the Table. Castes have been arranged in alphabetic order.
249
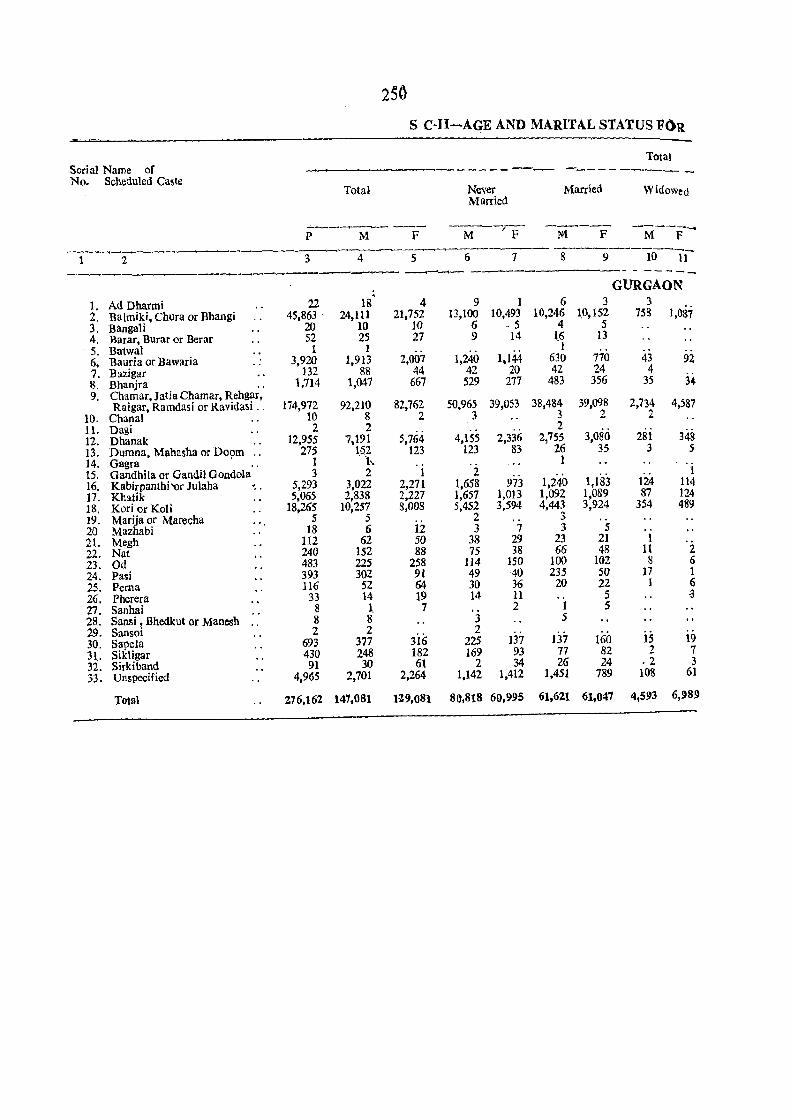
250
S C-I1-AGE AND MARITAL STATUS F()R
Total Serial Name of --------_ --------~-No. Scheduled Ca5te
Total Never Married Widowed Married
~-_..,___,- --- ~----rp ------ -M--F"-P M F N1. F ---__.....-~
1 2 3 4 5 ~---7 -- -8---9---10-11
~--~-------- - ----
GURGAON
1. Ad Dharmi 22 18 4 9 I 6 3 3
2. Balmiki, Chura or Bhangi 45,863 24,111 21,752 13,100 10,493 10,246 1.0,152 758 1,037 3. Bangali 20 10 10 6 ·5 4 5 4. Barar, Burar or Berar 52 25 27 9 14 1.6 13
. 5. Batwal 1 1 1,144-
1 6, Bauria or Bawaria .. 3,920 1,913 2,007 1,240 630 770 43 92 7. Bazigar ]32 88 44 42 20 42 24 4 8. Bhanjra 1,714 1,047 667 529 277 483 356 35 34 9. Chamar, Jatia Chamar, Rehgar,
Raigar, Ramdasi or Ravidasi .. 174,972 92,2].0 82,762 50,965 39,053 38,484 39,098 2,734 4,587 10. Chanal ]0 8 2 3 3 2 2 11. Dagi 2 2 2
3,080 12. Dhanak 12,955 '7,191 5,164 4,155 2,336 2,755 281 348 13. Dumna, Mahasha or Doom .. 275 152 123 123 83 26 35 3 5 14. Gagra . .. 1 ), 1 15. GandhiIa or Gaudil Gondola 3 2 1 2
1,240 1,183 1
16. Kabirpanthi 'Or Julaha ., 5,293 3,022 2,271 1,658 973 124 114 17. Khatik 5,065 2,838 2,227 1,657 1,013 1,.092 1,089 87 124 18. Kori or Koli 18,265 10,257 8,008 5,452 3,594 4,443 3,924 354 489
19. Marija or Marecha 5 5 2 3 20 Mazhabi 18 6 12 3 7 3 5 21. Megh 112 62 50 38 29 23 21 1 22. Nat 240 152 88 75 38 66 48 11 2 23. Od 483 225 258 114 150 100 102 8 6 24. Pasi 393 3.02 91 49 40 235 50 17 1
25. Perna 116 52 64 30 36 20 22 ] 6 26. Pherera 33 14 19 14 11 5 ·3 27. Sanhai 8 1 7 2 1 5 28. Sansi , Bhedkut or Manesh .. 8 8 3 5 29. Sansoi 2 2
3i6 2 is 30. Sapela 693 377 225 137 137 160 19
31. Sikligar 430 248 182 169 93 77 82 2 7
32. Sirkiband 91 30 61 2 34 26 24 .2 3
33. Unspecified 4,905 2,701 2,264 1,142 1,412 1,451 189 108 61
Total 276,162 147,081 1!z9,OSl SO,StS 60,995 61,621 61,047 4,593 6,989
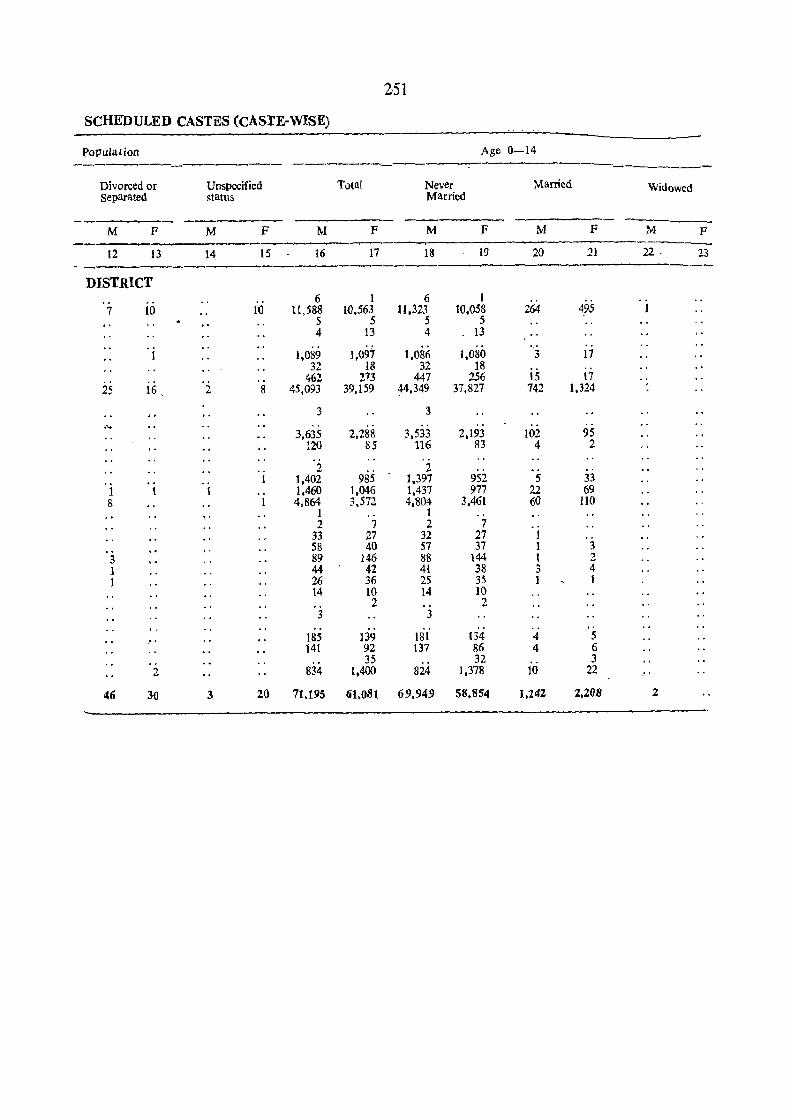
251
SCHEDULED CASTES (CASTE-\VrSE)
Popuiation Age 0-14 ---------------~
Divorced or Unspecified Total Never Married Widowed separated status Married
-- ---'-- -----M F M F M F M F M F M F
--.~
12 13 14 15 16 17 18 Iii 20 21 22· 23
DISTRICT .. 6 1 6 1 7 10 10 1l,588 10,563 11,323 10,058 264 495 J
5 5 5 5 4 13 4 13
.. 'j 1 1,089 1,097 1,086 1,080 17 32 18 32 18 .-
. , 462 273 447 25{i 15 11 .. 25 16 2 8 45,093 39,159 ~4.349 37,827 742 1.324 1
3 3
." .. . . .. 3,635 2,288 3.533 2,193 102 95
120 85 116 83 4 2 ..
2 2 1 1,402 985 1,397 952 5 33
1 1 I ., 1,460 1,046 1,437 977 22 69 8 1 4,&64 3,572 4,804 3,461 6(} ltO
,. 1 .. 1 .. 2 7 2 7
33 27 32 27 1 58 40 57 37 1 3
3 89 146 88 144 1 2 1 44 42 41 38 3 4 1 26 36 25 35 I 1
14 10 14 10 2 2
3 3 .. .. . .
185 139 181 134 4 5 141 92 137 86 4 6
35 32 3 2 834 1,400 824 1,378 10 22
46 30 3 20 11,195 61,081 69,949 58,854 1.242 2,20~ 2
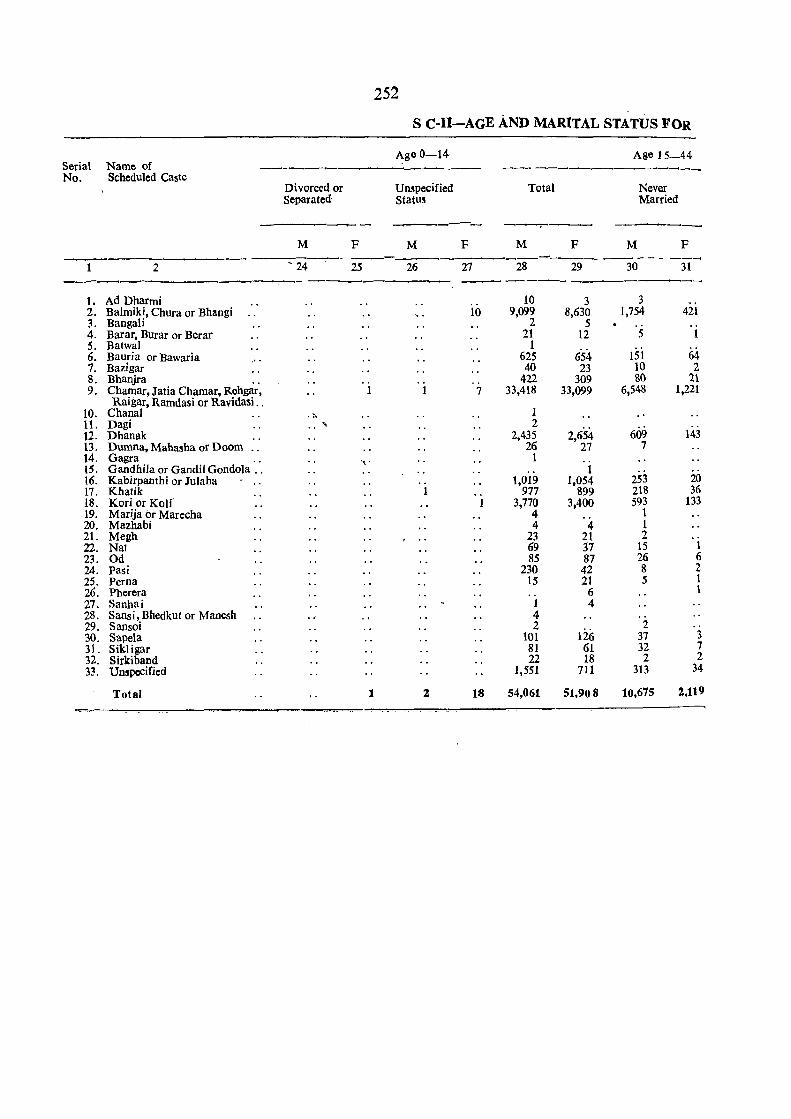
Serial Name of No. Scheduled Caste
1 2
1. Ad Dharmi 2. Balmiki, Chura or Bhangi 3. Bangali 4. Barar, Burar or Berar 5. Batwal 6. Bauria or Bawaria 7. Bazigar 8. Bhanjra .. 9. Chamar, JatiaChamar, Rehgar,
Raigar, Ramdasi or Ravidasi .. 10. Chanal 11. Dagi 12. Dhanak 13. Dumna, Mahasha or Doom 14. Gagra .. 15. Gandhila or Gandil Gondola .. 16. Kabirpanthi or Iulaha 17. Khatik 18. Kori or Kolf 19. Marija or Marecha 20. Mazhabi 21. Megh 22. Nat 23. Od 24. pasi 25. Perna 26. Pherera 27. Sanhai 28. Sansi,Bhedkut or Manesh 29. Sansoi 30. Sapela 31. Sikligar 32. Sirkiband 33. Unspecified
Total
252
S C-Il-AGE AND MARITAL STATUS FOR
Age 0-14 Age 15-44 ------_______ --.1 __
Divorced or Unspecified Total Separated Statu~
.------------ ----------- ---,-----F M F M
- 24 -------_.-----_ 25 26 27 --_____ , __ ----------
10
.. 7
" ~
". .. 1
1 18
M
28
10 9,099
2 21
1 625 40
422 33,418
1 2
2,435 26
1
1,019 9"17
3,770 4 4
23 69 85
230 15
1 4 2
101 81 22
1,551
54,061
F
29
3 8,630
5 12
654 23
309 33,099
2,654 27
1 1,054
899 3,400
4 21 37 87 42 21
6 4
lifi 61 18
711
51,908
Never Married
------M
30
3 1,754
5
151 10 80
6,548
609 7
253 218 593
1 1 2
15 26 8 5
2 37 32
2 313
10,675
F
31
421
1
64 2
21 1,221
143
20 36
133
1 6 2 1 1
., 3 7 2
34
2,119
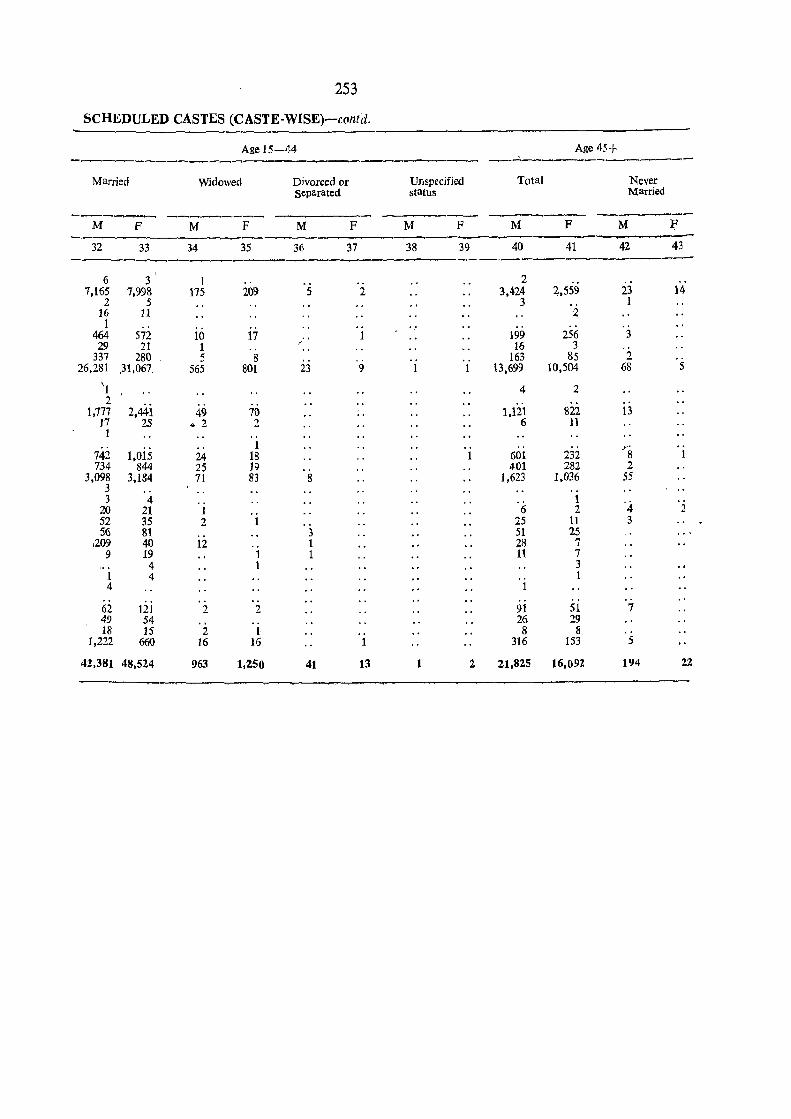
253
SCHEDULED CASTES (CASTE-WISE)-col1td.
Age 15-~·4 Age 45+ -~--------,.........,-..-~~-~-----_,,_.,.
Married Widowed Divorced or Unspecified Total Never separated status Married
--~---M F M F M F M F M F M ~ ___ _,,__.....-------32 33 34 35 36 37 38 39 40 41 42 43
---.-6 3 1 .. .. 2
7,165 7,998 175 209 5 2 3.424 4,559 23 14 2 5 3 1
16 11 2 1 ..
464 572 10 17 1 199 256 3 29 21 1 "
16 3 337 280 5 8 163 85 2
26,281 ,31,067. 565 801 23 9 1 1 13,699 10,504 68 5
'I 4 2 2
1,777 2,441 49 70 " 1,121 822 13 17 25 • 2 2 6 11
1 .. .. 1 .. r
742 1,015 24 18 1 601 232 8 1 734 844 25 19 401 282 2
3,098 3,184 71 83 8 1,623 1,036 55 3 .. 3 4 .. 1 '4 20 21 1 6 2 ~
"-
52 35 2 1 25 11 3 56 81 3 51 25
,209 40 12 1 28 7 9 19 1 1 11 7
". 4 1 3 1 4 1 4 1
.. 62 121 2 2 91 51 7 49 S4 26 29 18 15 2 1 .. 8 8
1,222 660 16 16 1 316 153 5
42,381 48,524 963 1.250 41 13 I 2 21,825 16,092 194 22
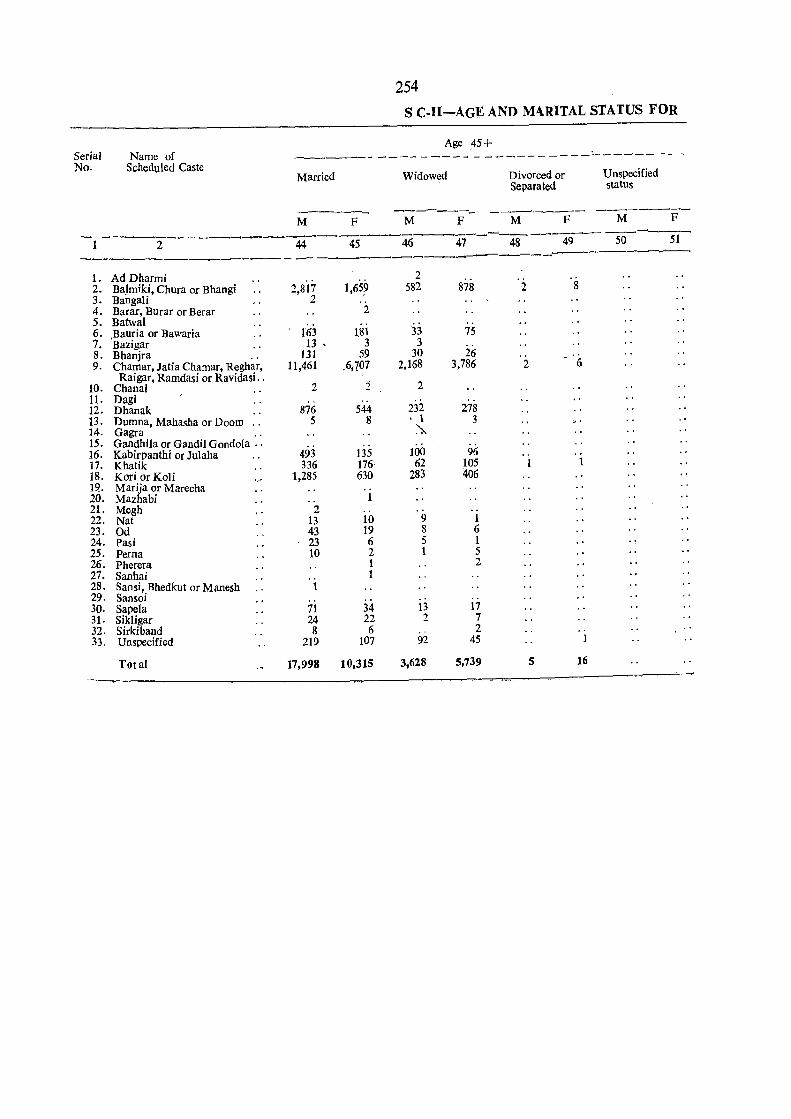
254 S C-II-AGE AND M'\RITAL STATUS FOR
Age 45+ Serial No,
Name of Scheduled Caste
-------------------------------~-----
Married
M
-1----"2--- 44
F
45 --_------_--~~-- _- ----
1. Ad Dharmi 2. Ba.lmiki, Chura or Bhangi 3. Bangali 4. Barar, BUrar or Berar 5. Batwal 6. .Bauria or Bawaria 7. Bazigar 8. Bhanjra 9. Chamar, Jatia Chamar, Reghar,
Raigar, Ramdasi or Ravidasi. . 10. Chana! 11. Dagi 12. Dhanak 13. Dumna, Mahasha or Doom 14. Gagra .' 15. Gandhila or Gandil Gondola .. 16. Kabirpanthi or Julaha 17. Khatik 18. Kori or Koli 1\1. Marija or Marecha 20. Mazhabi 21. Megh 22. Nat 23. Od 24. Pasi 25. Perna 26. Pherera 27. Sanhai 28. Sansi, Bhedkut or Manesh 29. Sansoi 30. Sapela 31· Sikligar 32. Sirkiband 33. Unspecified
Total
2,817 2
163 13 ,
131 11,461
2
876 5
493 336
1,285
.. 2
13 43 23 10
1
71 24 8
219
17,998
1,65?
2
l81 3
59 ,6,707
'2
544 8
135 176 630
1 .. 10 19 6 2 1 1
34 22 6
107
10,315
Widowed Divorced or Separated
-------_ -~.---M
46
F
47
M
---~~
2 582
3:3 3
30 2,168
2
232 1 " .')..
loo 62
283
9 8 5 1
13 2
92
3,628
878
75
26 3,786
278 3
96 105 406
1 6 1 5 2
17 7 2
45
5,739
2
.. 2
.. 1
5
F
g
6
1
1
16
Unspecified status
M F
2S5 SCHEDULED CASTES (CASTE-WISE) -concld.
Total
M
52
F
53
' ..
Never Married
M
54
F
55
Age not stated
M8rried:
M F
56 57
Widowed
M
58
F
59
----~~~.--~---
Divorced or Separated
Unspecified status
-~-~~- -__,------M
60
F
61
M
62
F
63

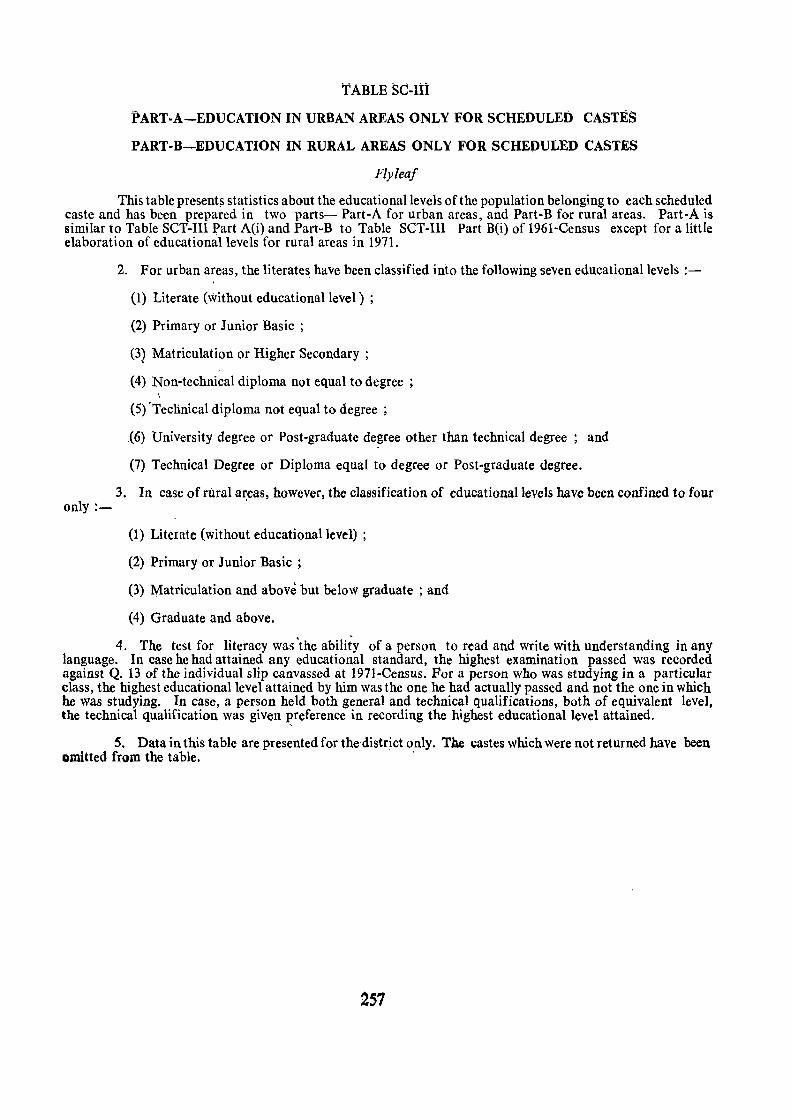
TABLE SC-Iii
PART-A-EDUCATION IN URBAN AREAS ONLY FOR SCHEDULED CASTES
PART-B-EDUCATION IN RURAL AREAS ONLY FOR SCHEDULED CASTES
Flyleaf
This table present~ statistics about the educational levels of the population belonging to each scheduled caste and has been prepared in two parts- Part-A for urban areas, and Part-B for rural areas. Part-A is similar to Table SCT-III Part A(i) and Part-B to Table SCT-III Part B(i) of 1961-Census except for a little elaboration of educational levels for rural areas in 1971.
2. For urban areas, the literate~ have been classified into the following seven educational levels :-,
(1) Literate (without educational level ) ;
(2) Primary or Junior Basic ;
(3) Matriculation or Higher Secondary ;
(4) Non-technical diploma not equal to degree ;
(5) "Technical diploma not equal to degree ;
.(6) University degree or Post-graduate degree other than technical degree ; and
(7) Technical Degree or Diploma equal to degree or Post-graduate degree.
3. In case of rural areas, however, the classification of educational levels have been confined to four only!- . ,
(1) Literate (without educational level) ;
(2) Primary or Junior Basic ;
(3) Matriculation and above but below graduate ; and
(4) Graduate and above.
4. The test for literacy was'the ability of a person to read and write with understanding in any language. In case he had attained any educational standard, the highest examination passed was recorded against Q. 13 of the in4ividual slip canvassed at 1971-Census. For a person who was studying in a particular class, the highest educational level attained by him was the one he had actually passed and not the one in which he was studying. In case, a person held both general and technical qualifications, both of equivalent level, the technical qualification was given preference in recording the highest educational level attained.
5, Data in this table are presented for the district only. The castes which were not returned have been omitted from the table. '
257
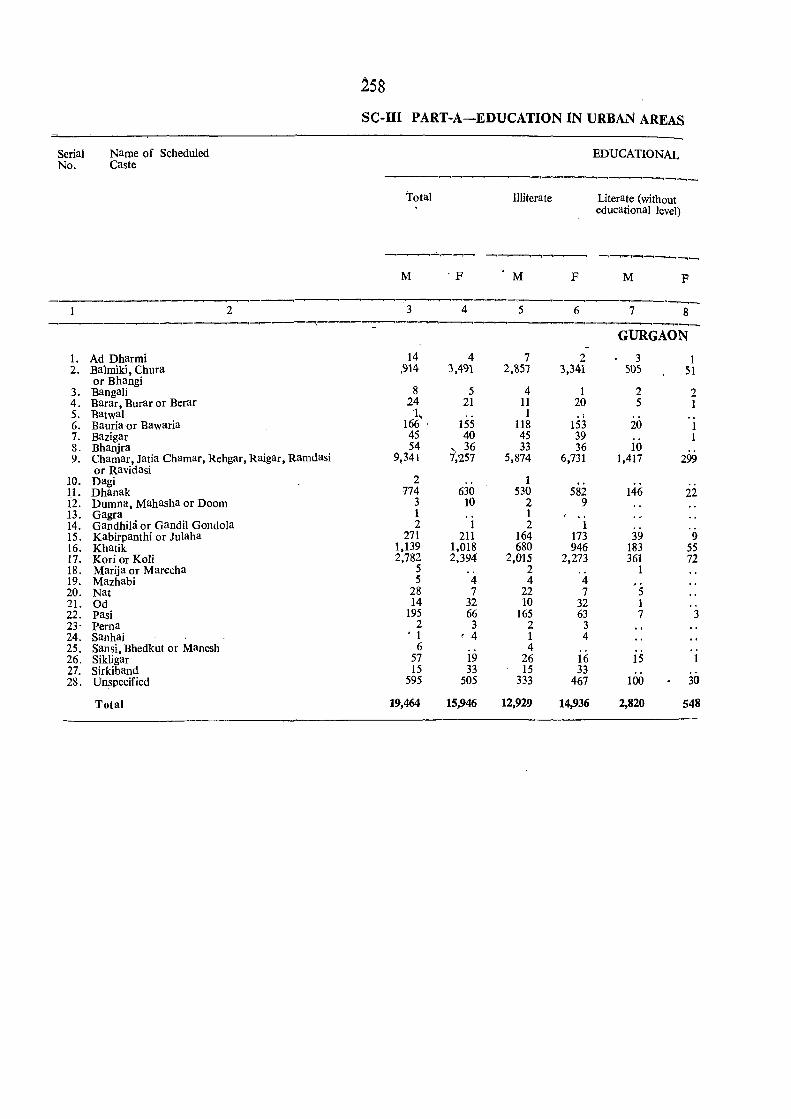
Serial No.
Name of Scheduled Caste
258
SC-III PART-A-EDUCATION IN URBAN AREAS
EDUCATIONAL
~--~-'---'-------'--__'-----'-'--""----'-'--
Total Illiterate
M 'F M F
Literate (without educational level)
M F
---1 --~~~------2---~~-~--~-'-3 ~--4---~5~--6-----7---'8-
-------.---__,-----.-----------...----------~--~-.-.-,---.-_,._....---~-----.---.--."'--
1. Ad Dharmi 2. Balmiki, Chura
or Bhangi 3. Bangali 4. Barar, Burar or Berar 5. Batwal 6. Bauria'or Bawaria 7. Bazigar S. Bhanjra 9. Chamar, Jatia Chamar, Rehgar, Raigar, Ramdasi
or Ravidasi 10. Dagi 11. Dhanak i2. Dumna, Mahasha or Doom 13. Gagra 14. Gandhila or Gandil Gondola 15. Kabirpanthi or Ju)aha 16. Khatik 17. Kori or Koli 18. Marija or Marecha 19. Mazhabi 20. Nat 21. Od 22. pasi 23· Perna 24. Sanhai 25. Sansi, Bhedkut or Manesh 26. Sikligar 27. Sirkiband 28. Unspecified
Total
14 ,914
8 14
'I, 166 ' 45 54
9,341
2 774
3 1 2
271 1,139 2,782
5 5
28 14
195 2
, 1
6 57 15
595
19,464
4 3,491
5 21
155 40
x, 36 7,7.57
.. 630
10
1 211
1,018 2,394
4 7
32 66
3 , 4
19 33
505
15,946
7 2,857
4 11 1
118 45 33
5,874
1 530
2 1 2
164 680
2,015 2 4
22 10
165 2 1 4
26 15
333
12,929
2 3,341
1 20
153 39 36
6,731
582 9
I ..
1 173 946
2,273
4 7
32 63
3 4
16 33
467
14,936
GURGAON
3 50S
2 5
20
10 1,417
146
39 183 361
1
5 1 7
15
100
2,820
1 51
"
2 1
1 1
299
22
9 55 72
.. 3
.. 1
30
548
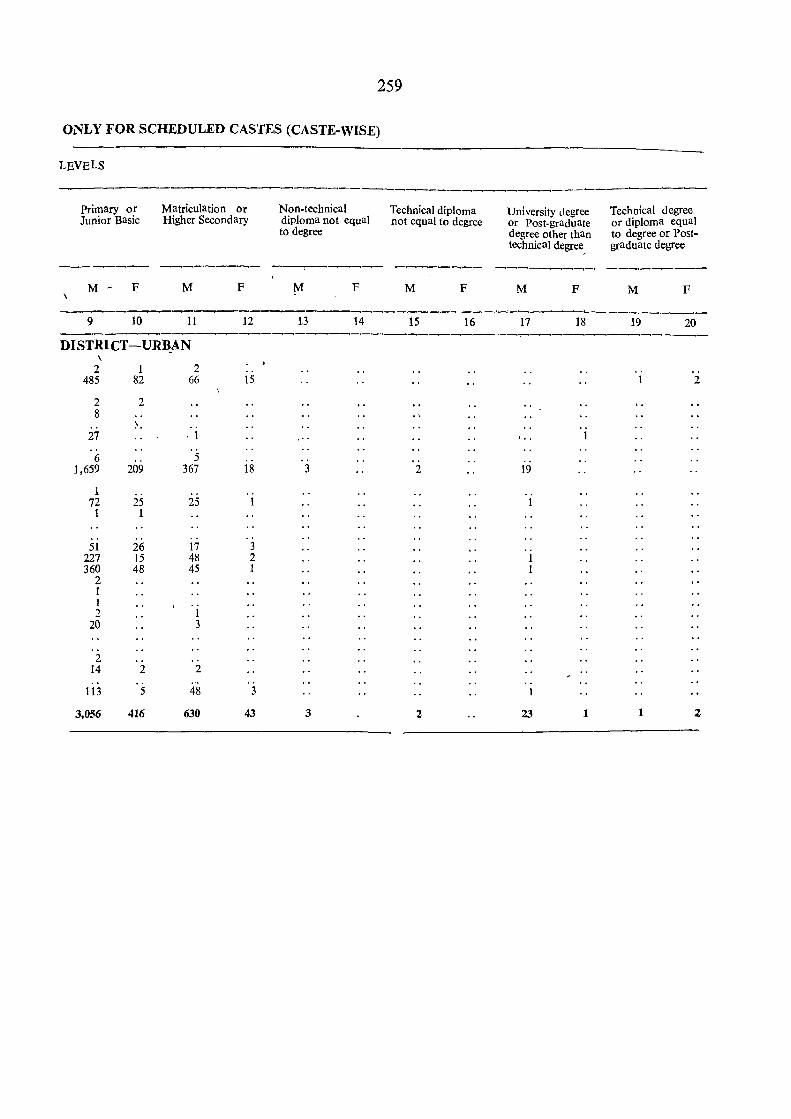
259
ONLY FOR SCHEDULED CASTES (CASTE-WISE)
LEVELS
----__,__,--------___,-..-_,---___,-..--.---------.._,--.--.---.------.--..-.-.-.-_,~--~
Primary or Matriculation or Non-technical Technical diploma University degree Technical degree Junior Basic Higher Secondary diploma not equal not equal to degree or Post-graduate or diploma equal
to degree degree other than to degree or Post-technical degree, graduate degree
--.------ --.-.__,-..---_- ---.-..-------.----.- --__,_,-_-- --.--__,---.--~~~ --_ __,-.---M - F M F M
\ F M F M F M F
-~---------------------------- .... --~ 9 10 11 12 13 14 15 16 17 18 19 20 -----__,--.-------~----.____,--___,--..-------__,---------__,.---_.,--:-"'-__,__,---..-~__,--.-----.--.--.-
DISTRICT-UR~AN , 2 1 2 00 00
485 82 66 15 1 2
2 2 8 '0
~o 27 o 1
'00 1
6 5 00
1.659 209 367 18 3 2 19
1 72 25 25 1 1 1 1
00 00 00
51 26 17 3 227 15 48 2 1 360 48 45 1 1
2 1 1 2 1
20 3
2 14 2 2
113 5 48 3
3,056 416 630 43 3 2 23 1 1 2
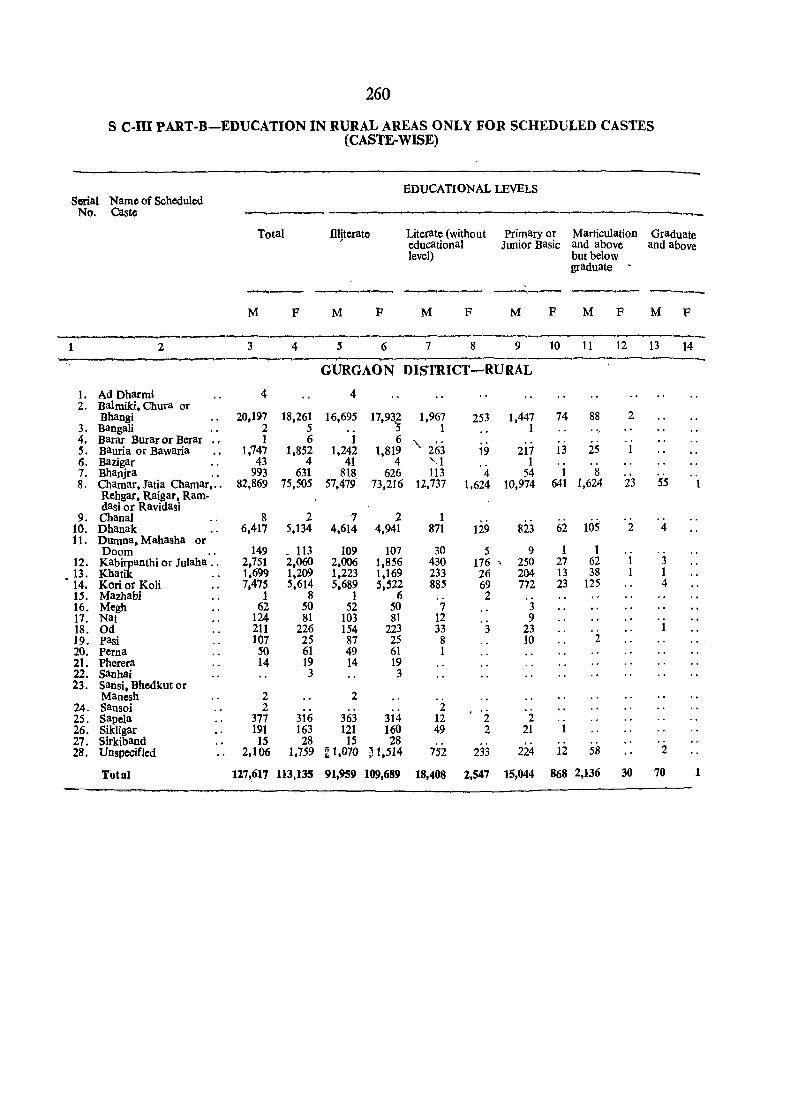
260
s com PART-B-EDUCATION IN RURAL AREAS ONLY FOR SCHEDULED CASTES (CASTE-WISE)
Serial Name of Scheduled No. Caste
Total
M F
EDUCATIONAL LEVELS
'--~--~-~----------------
flijterato
M F
Literate (without educational level)
M F
Primary or Marticulation Graduate Junior Basic and above and above
but below graduate
, -...----- --_- ----_ M F M F M F
-----~-..-----------------1 2 3 4 6 7 8 9 10 11 12 13 14
-_...___...----.-__,,------:o---------.--~--~--.-,,----.---------.
- GURGAON DISTRICT-RURAL '
1. Ad Dbarmi 2. Balmiki, Chura or
Bhangi 3. Bangali 4. Barar Burar or Berar .. 5. Bauria or Bawaria 6. Bazigar 7. Bhanjra 8. Chamar, Jatia Chamar, ..
Rehgar, Raigar, Ramdasi or Ravidasi
9. Chanal 10. Dbanak 11. Dumna, Mabasba or
Doom 12. Kabirpanthi or Julaha .. 13. Khatik 14. Kori or Koli 15. Mazhabi 16. Mesh 17. Nat 18. Od 19. pasi 20. Perna 21. Pherera 22. Sanhai 23. Sansi, Bbedkut or
Manesh 24. Sansoi 25. Sapela 26. Sikligar 27. Sirkiband 28. Unspecified
Total
4
20,197 2 1
1,747 43
993 82,869
8 6,417
149 2,751 1,699 7,475
1 62
124 211 107
SO 14
2 2
377 191 15
2,106
18,261 5 6
1,852 4
631 75,505
2 5,134
_ 113 2,060 1,209 5,614
8 50 81
226 25 61 19 3
316 163 28
1,759
4
16,695
1 1,242
41 818
57,479
7 4,614
109 2,006 1,223 5,689
1 52
103 154 87 49 14
2 ..
363 121
15 ~ 1,070
17,93,2 5 6
1,819 4
626 73,216
2 4,941
107 1,856 1,169 5,522
6 50 81
223 25 61 19 3
314 160 28
~ 1,514
1,967 1
'\. 263 , 1 113
12,737
1 871
30 430 233 885 ., 7
12 33 8 1
2 12 49
752
253
19
4 1,624
129
5 176 26 69 2
3
2 2
233
1,447 1
217 1
54 10,974
823
9 250 204 772
3 9
23 10
.. 2
21
224
74 88 ", ..
13 25 .. 1 8
641 1,624
.. 62 105
1 1 27 62 13 38 23 125
2
.. 1
12 58
2
23
2
1 1
55
4
3 1 4
2
127,611 113,135 91,959 109,689 18,408 2,547 15,044 868 2,136 30 70
.. 1
1
TABLE SC-IV
PERSONS NOT AT WORK CLASSIFIED BY SEX, TYPE OF ACTIVITY AND EI)UCATIONAL . LEVELS FOR SCHEDULED CASTES
Flyleaf
Entire population has been divided into two broad streams of main activity, namely, workers and non-workers according to type of main activity a person engages himself/herself mostly. A non-worker is a person whG,as his main activity, is not engaged in any economically productive work but is basically nonworking. In this table, non-workers among the scheduled castes have been classified as under:-
(1) Students ;
(2) Household Duties;
(3) Dependents and Infants ;
(4) Retired, Rentiers and Persons of Independent Means;' ,
(5) Beggars, Vagrants, etc. ;
(6) Inmates of Penal, Mental and Charitable Institutions ; and
(7) Others.
2. This table also gives the 'educational levels' of all the non-workers i.e. whether 'Illiterate', 'Literate (without educational level)" 'Primary or Junior Basic,' 'Matriculation and above but below Graduate' and 'Graduate ~nd above'. The term 'literacy' has already been explained in the fly-leaf to Table SC-III.
3. The table, however, presents data for the total scheduled caste population and not for each caste separately. The data arc given for the total, rural and urban areas of the district only. To some extent, the table corresponds to Table SC-I of 1961-Census. In 1961, the non-workers were categorised into four broad heads only, i.e. :- .
(a) Full-time students;
(b) Persons seeking employment for the first time;
(c) Persons employed before but now out of employment and seeking work; and
(d) Others.
4. Comparison of data of two censuses except for students is not possible. Moreover, the last two categories of educational levels of 1971-Census were grouped together as 'Above Matriculation or Higher Secondary' at the 1961-Census.
261
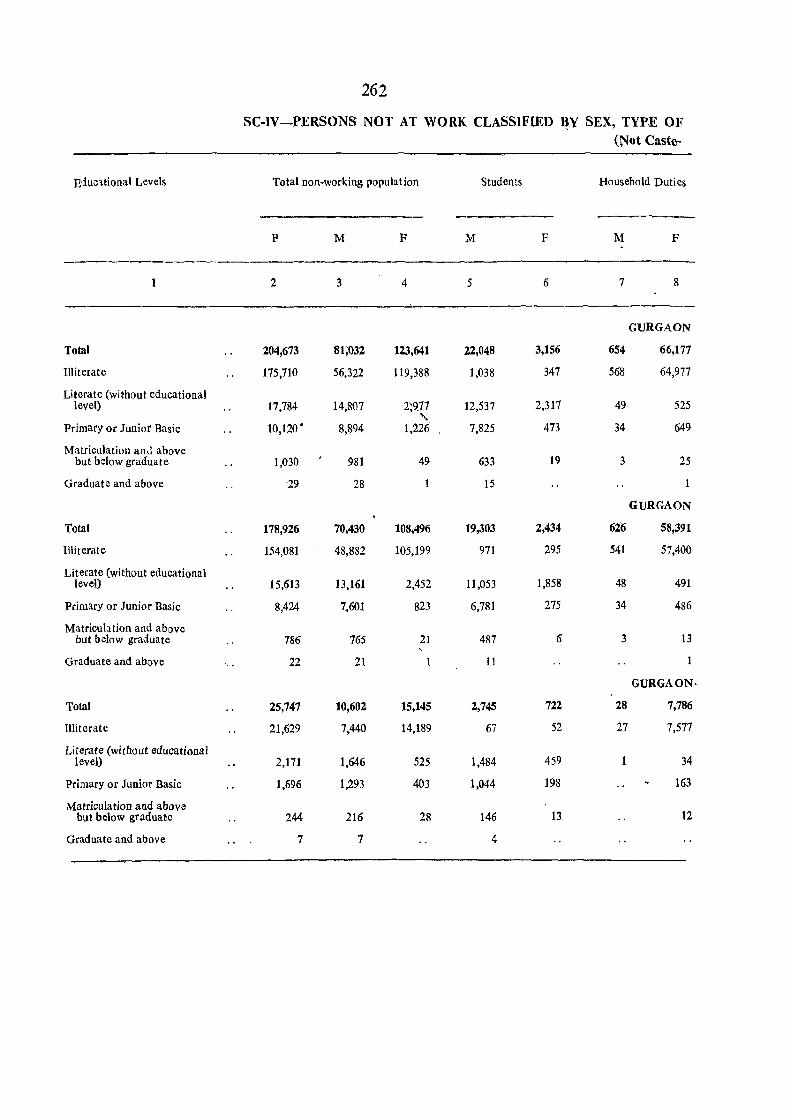
262
SC-IV~PERSONS NOT AT WORK CLASSIFIED ~y SEX, TYPE OF (Not Caste-
Eiucltional Levels Total non-working population Students Household Duties
~---~--
P M F M F M F
2 3 4 5 6' 7 8
GURGAON
Total 204,673 81;032 123,641 22,048 3,156 654 66,177
Illiterate 175,710 56,322 119,388 1,038 347 568 64,977
Literate (without educational level) 17,784 14,807 2;9.77
..... 12,537 2,317 49 525
Primary or Junior Basic 10,120 • 8,894 1,226' 7,825 473 34 649
Matriculation an..! above but below graduate 1,030 981 49 633 19 3 25
Graduate and above 29 28 15
GURGAON
Total 178,926 70,430 108,496 19,303 2,434 626 58,391
Illiterate 154,081 48,882 105,199 971 295 541 57,400
Literate (without educational level) 15,613 13,161 2,452 11,053 1,858 48 491
Primary or Junior Basic 8,424 7,601 823 6,781 275 34 486
Matriculation and above but below graduate 786 765 21 487 I) 3 13
Graduate and above 22 21 1 11
GURGAON·
Total 25,747 10,602 15,145 2,745 722 28 7,786
Illiterate 21,629 7,440 14,189 67 52 27 7,577
Literate (without educational level) 2,171 1,646 525 1,484 459 34
Primary or Junior Basic 1,696 1,293 403 1,044 198 163
Matriculation and above but below graduate 244 216 28 146 13. 12
Graduate and above 7 7 4
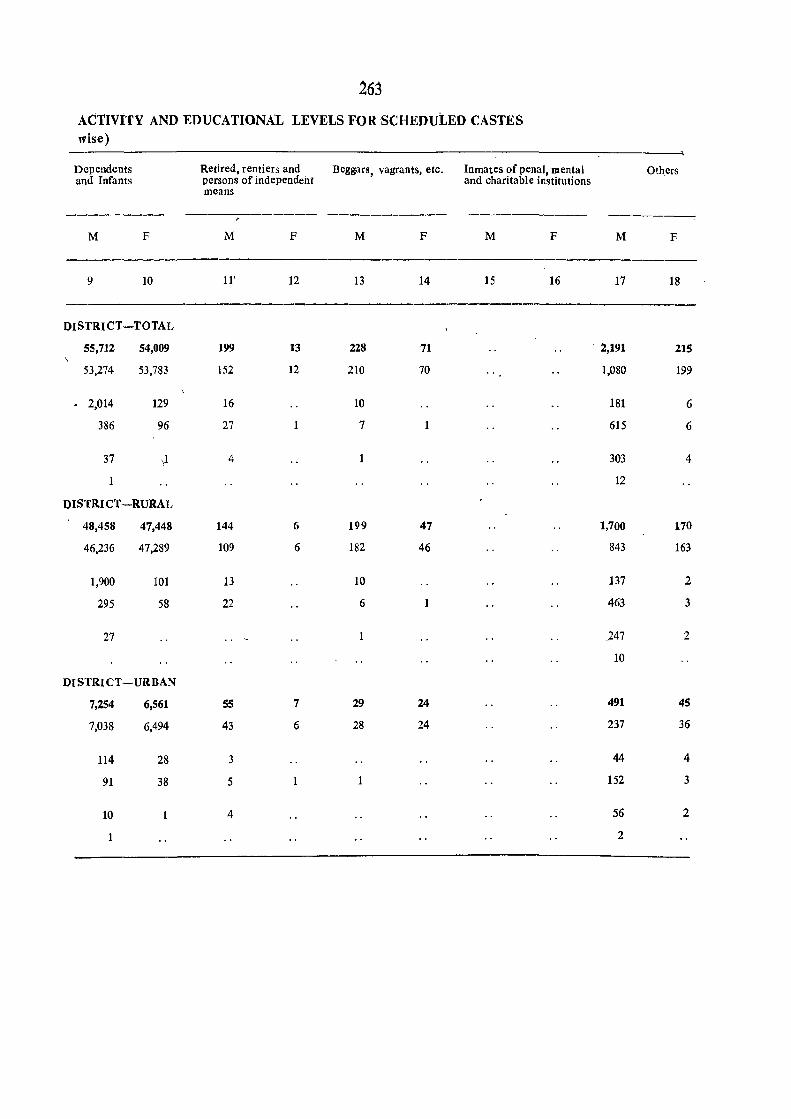

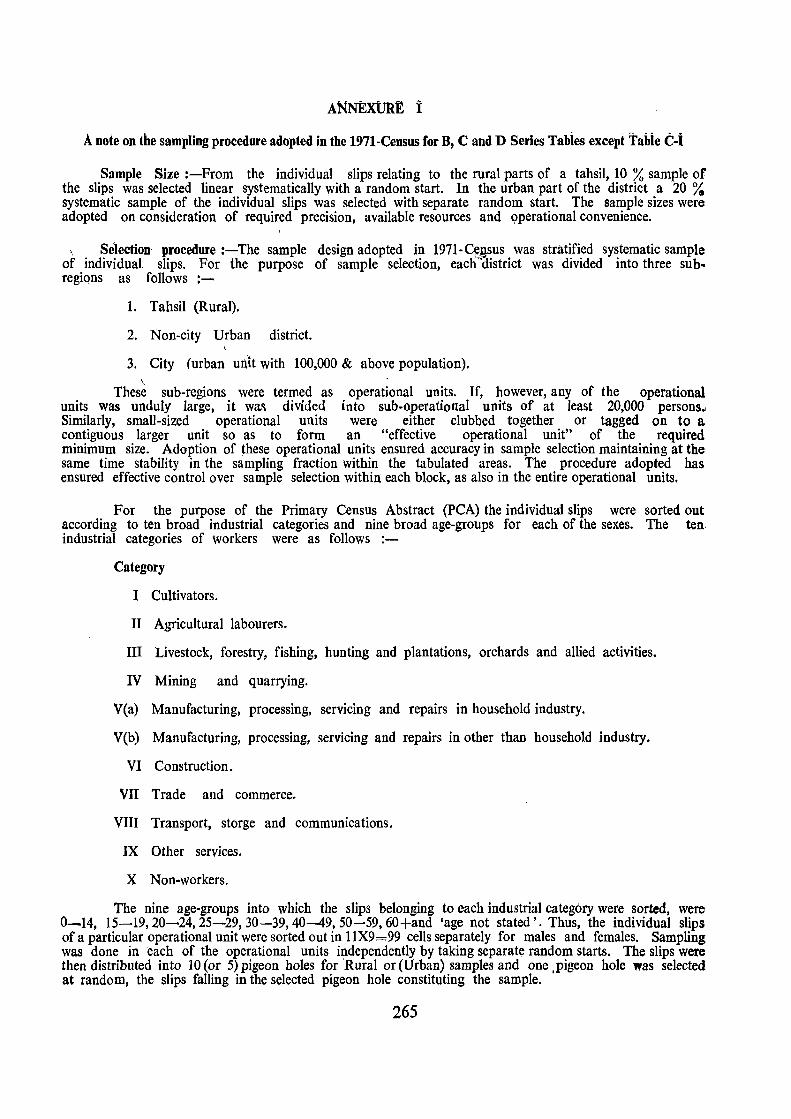
ANNEXURE i
A note on tile sampling procedure adopted in the 1971-Census for B, C and D Series 'rabies except Tahie c-i Sample Size :-From the individual slips relating to the rural parts of a tahsil, 10 % sample of
the slips was selected linear systematically with a random start. In the urban part of the district a 20 % systematic sample of the individual slips was selected with separate random start. The sample sizes were adopted on consideration of required precision, available resources and Qperational convenience.
" Selection' procedure :-The sample design adopted in 1971-C~usus was stratified systematic sample of individual slips. For the purpose of sample selection, each"district was divided into three subregions as follows:-
1. Tahsil (Rural).
2. Non-city Urban district.
3. City (urban unit with 100,000 & above population). ,
These sub-regions were termed as operational units. If, however, any of the operational, units was unduly large, it was divided into sub-operational units of at least 20,000 persons., Similarly, small-sized operational units were either clubbed together or tagged on to a contiguous larger unit so as to form an "effective operational unit" of the required minimum size. Adoption of ~hese operational units ensured accuracy in sample selection maintaining at the same time stability in the sampling fraction within the tabulated areas. The procedure adopted has ensured effective control over sample selection within each block, as also in the entire operational units.
For the purpose of the Primary Census Abstract (peA) the individual slips were sorted out according to ten broad industrial categories and nine broad age-groups for each of the sexes. The ten, industrial categories of workers were as follows :-
Category
I Cultivators.
II Agricultural labourers.
III Livestock, forestry, fishing, hunting and plantations, orchards and allied activities.
IV Mining and quarrying.
V(a) Manufacturing, processing, servicing and repairs in household industry.
V(b) Manufacturing, processing, servicing and repairs in other than household industry.
VI Construction.
VII Trade and commerce.
VIII Transport, storge and communications.
IX Other services.
X Non-workers.
The nine age-groups into which the slips belonging to each industrial category were sorted, were 0-14, 15-19,20-24,25-29,30-39,40-49,50-59, 60+and 'age not stated'. Thus, the individual slips of a particular operational unit were sorted out in llX9=99 cells separately for males and females. Sampling was done in each of the operational units independently by taking separate random starts. The slips were then distributed into 10 (or 5) pigeon holes for 'Rural or (Urban) samples and one ,pigeon hole was selected at random, the slips falling in the selected pigeon hole constituting the sample.
265
266
~ £stimation procedure :-The tables prepared for each of the Districts from the 10 % rural and 20 % urban sample slips have been inflated to give the final estimated tables. Estimates have been obtained by making use of the cell frequencies (usually labelled as 'controls') available from the tables prepared on full count basis, namely, peA and B-1 Part A. -
In order to ensure maximum possible inteNable consistency, it became necessary to use the estimated frequencies of a few of the final tables as controls for estimating some cell frequencies of other tables.
This way of estimating the cell frequencies .ensured marginal totals of estimated tables tally with that of the full count tables. This is convenient to the user, because after adjustment, the identical marginal totals are found in tables having the same. marginal specification. "The adjustment diminishes the sampling variance to some extent; the more the controls the smaller the ~sampling variance of the adjusted frequencies"l. Further, adju$jment to known control totals has at the same time the effect of eliminating biases in the nature of inherent differences between the sample and complete count.
For the purpose of estimation of final tables, a set of multipliers was prepared for each table. A multiplier is the ratio of full count frequency of some characteristics from PCA or Table B-1 Part A (or some estimated frequency from some already estimated table) and the corresponding sample frequency of the same characteristics from the sample table.
Since the characteristics of the migrants can be-- ;expected to be' strikingly <lifferent from that of the total population, it was not considered appropriate to'apply to the multiplier derived from the total population. In the absence of direct controls for multiplie!-,s, sample Tables D-II to D-VI have been multiplied uniformly by 10 in case of rural and by 5 in case of urQan to arrive at the final estimated tables.
Reliability of the estimates :-No exact formula can be given for the precision of the estimates in view of the systematic sampling design adopted. A very rough estimate of the relative standard error
on the basis of simple random sample may be estimated as A / (I-f)/ I-p where (f) is the proportion V np
sampled (0.10 in case of rural areas and 0.20 in case of urban areas) and 'p' is the estimated proportion in any cell and 'n' the sample size, having equal to 10 % of individual slips in rural areas and 20 % in urban areas. In the present Census, slips were sorted by sex, industrial category and age-group before sampling. It is expected that the efficiency must be considerably higher than a simple random sample of identical size. Extensive studies conducted have indicated that systematic sampling of individuals is more efficient than random sampling specially when the slips were pre-sorted for most of the socioeconomic characteristics covered in a Census2• Thus the estimates prepared on the basis of the systematic sampling in the present Census can be expected to be quite reliable.
IDeming W. E. 'Statistical adjustment of data' - Chapter VII.
2Lahiri D. B. - An experimental approach on the basis of census enumeration slips. (Studies in population sampling). Volume I, (December, 1957, 1959).
ANNEXURE IT
A note on the sampling procedure adopted in 1971~Census for C-I Part A
Sample size :-For the preparation of table C-I P~rt A, on household composition, a sample of residential households was drawn in two stages. In the first stage, a twenty per cent systematic sample of effective enumeration blocks (defined later) was selected systematically. In the second stage, a twenty per cent sample of population records relating to residential household was selected from each of the sample block again systematically.
Selection procedure :-For the purpose of sample selection, the rural and urban parts of each district were treated as separate strata. Within each stratum, a list of blocks was prepared by merging those containing less than 50 households with the neighbouring blocks. Blocks formed in this way were called 'effective enumeration blocks' or simply 'effective blocks'. The list of effective blocks so formed served as a frame for the selection of the first stage unit. A twenty per cent sample of effective blocks was then selected systematically. Having identified the first stage units, the population record books for the selected effective blocks were assembled. Within each selected effective block, the population records relating to 'houseless households or institutional households'. Care was also taken to see that only one serial number was assigned to a population record, whenever the record relating to a household co,(ered more than one page. In cases where 'effective blocks' were formed by merging two or more blocks, the population record books corresponding to all the census enumeration blocks constituting the effective block, were assembled together and then the households were selected. Fresh random numbers were selected for each effectiye block. The population records corresponding to the selected households were marked'S' at the right hand top comer with a stamp provided. .
Estimation procedure ':-The tables prepared for each of the stratum :were multiplied uniformly by 25 to giVe the final estimated table.
2(j7

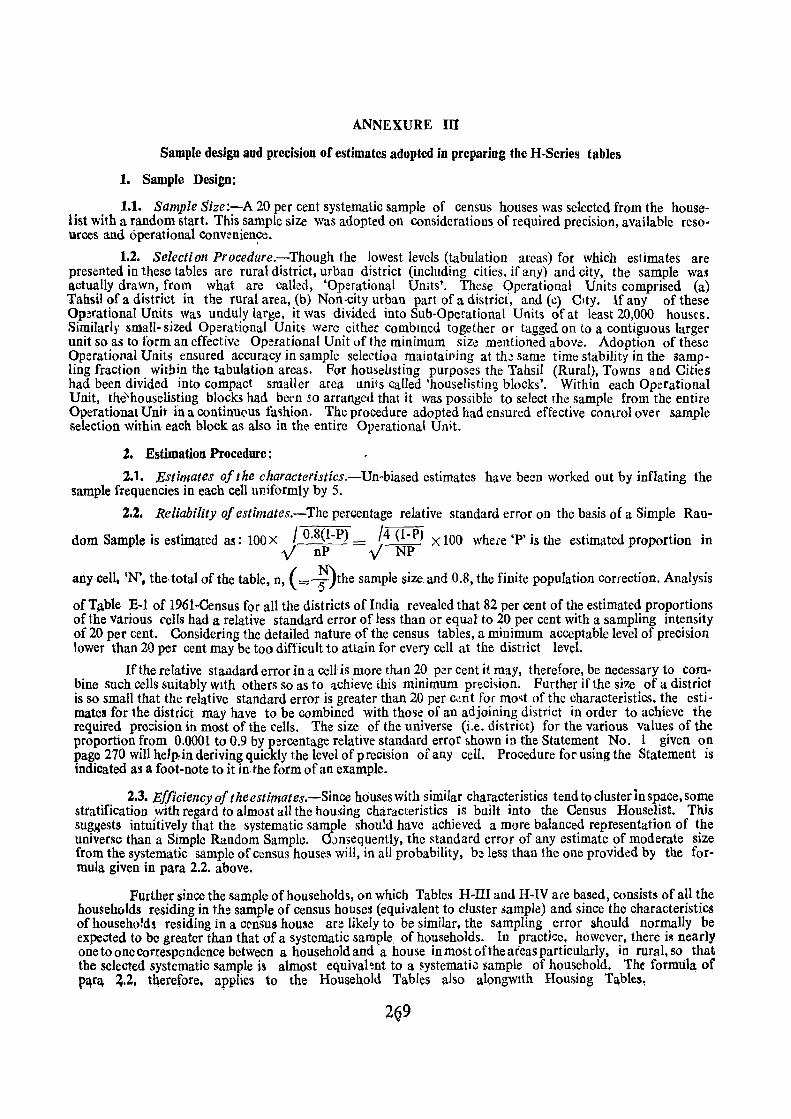
ANNEXURE In Sample design aod precision of estimates adopted in preparing the H-Series tables
1. Sample Design:
1.1. Sample Size :-A 20 per cent systematic sample of census houses was selected from the houselist with a random start. This sample size was adopted on considerations. of required precision, available resources and operational conwnience.
I
1.2. Selection Procedare.-Though the lowest levels (tabulation areas) for which estimates are presented in these tables are rural district, urban district (including cities. if any) and city, the sample was actually drawn, from what are called, 'Operational Vmts'. These Operational Units comprised (a) Tahsil of a district in the rural area, (b) Non.city urban part of a district, and (I!) City. If any of these Op!rational Units Was unduly large, it was divided into SUb-Operational Units of at least 20,000 houses. Similarl)' small- sized Operational Units w.;:re either combIned together or tagged on to a contiguous larger unit so as to form an effective Operational Unit of the minimum size mentioned above. Adoption of these Operational Units ensured accuracy in sample selectioil maintaiping at thJ same timt: stability in the sampling fraction wit!Jin the tabulation areas. For houseltsting purposes the Tahsil (Rura!), Towns and Cities had been divided into compact smaller area unit's called 'houselisting blocks'. Within each Operational Unit, the\houselisting blocks had bern so arranged that it was pos:;ible to select rhe sample from the entire Operational Unit in a continu0us fa~hion. The procedure adopted had en:;ured effective control over sample selection within each block as also in the. entire Op~rational Unit.
2. EstiDlation Procedure:
2.1. Estimates of the characteristics.-Un-biased estimates have been worked out by inflating the sample frequencies in each cell uniformly by 5.
2.2. Reliability of estimates.-The percentage relative standard error on the basis of a Simple Ran-
dom Sample is estimated as: 100 X I 0.8(1-P) = /4 (l-P) X 100 where 'P' is the estimated proportion in V nP V NP
any cell. 'N', the· total of the table, n, (= ~)the sample size. and 0.8, the finite population correction. Analysis
of Table E-l of 1961~Census for all the districts oflndia revealed that 82 per cent of the estimated proportions of the various rells had a relative standard error of less than or equal to 20 per cent with a sampling intensity of 20 per cent. Considering the detailed nature of the census tables, a minimum acceptable level of precision lower than 20 per cent may be too difficult to attain for every cell at the district level.
If the relative standard error in a cell is more (han 20 per cent it may, therefore, be necessary to combine such cells suitably With others so as to achieve this minimum precision. Further if the si7.e of a district is so small that the relative standard error is greater than 20 per cm t for mo,t of the characteristics. the estimates for the distriCi may have to be combined with tho')e of an adjoining district in order to achieve the required precision in most of the cells. The size of the universe (i.e. district) for the various values of the proportion from 0.0001 to 0.9 by percentage relative standard error f>hown in the Statement No. 1 given on page 270 will help; in deriving quickly the level of precision of any cell. Procedure fof' using the Statement is indicated as a foot-note to it in the form of an example.
2.3. Efficiency of the estimates.-Since houses with similar characteristics tend to cluster in space, some stratification with regard to almo~t all the housing characteristics is built into the Census Houselist. This sug.~ests intuitively that the systematic sample shou~d have achieved a more balanced representation of the univene than a Simple Random Sample. OJn5equently, the standard error of any estimate of moderate size from the systematic sample of census houses will, in all probability, be less than the one provided by the formula given in para 2.2. above.
Further since the sample of households. on which Tables H-III and H-IV a(e based, consists of all the households residing in the sample of census house:J (equivalent to cluster ~ample) and since the characteristics of household! residing in a ct'nsus home are likely to be similar, the sampling error should normally be expected to be greater than that of a systematic sample of households. In practice, however, there i'l nearly one to one corr.espondence between a household and a house in mo~t of the areas particularly, in rural, so that the selected systematic sample is almost ectujval~nt to a systemati.; I)ample of household. The formula of Pl\r~ ~.2, t4erefore. applies to the Household Tables also alongwlth Housin~ Ta.bles~
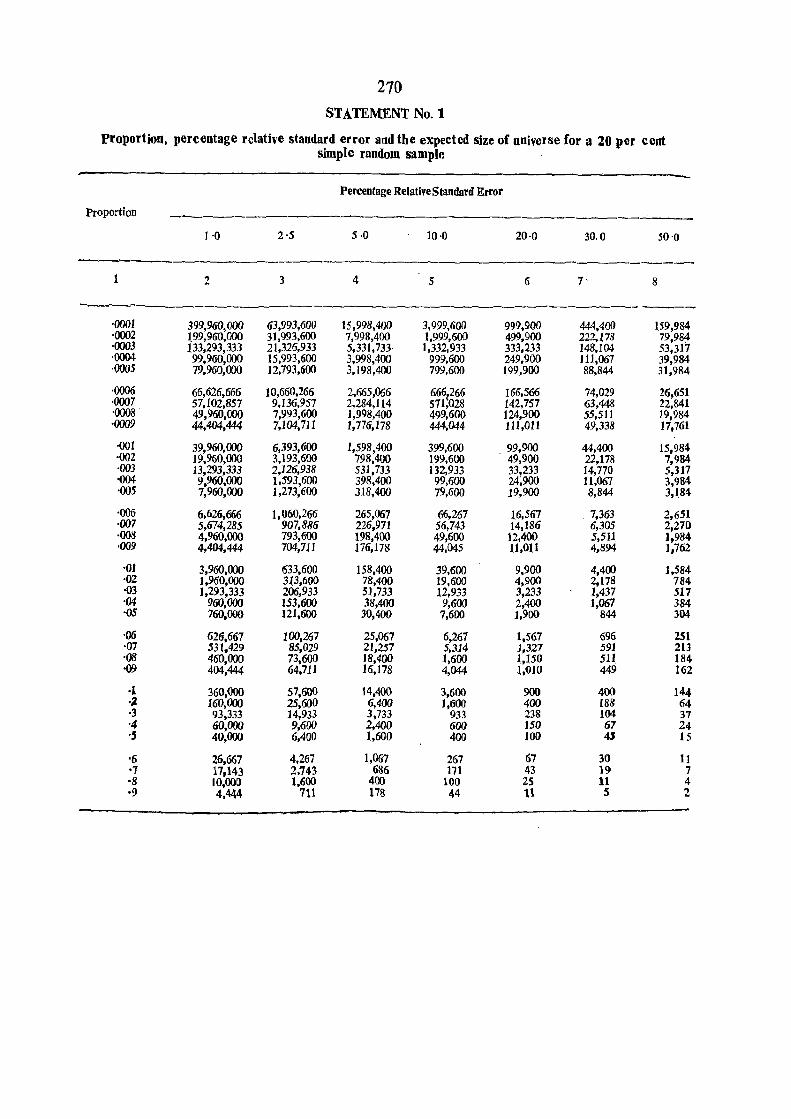
270
STATEMENT No.1
proportion, percentage relative standard error and the expected size of universe for a 20 per cent simple random samplr. .
Percentage Relative Standard Error
Proportion --1,0 2·5 5·0 10·0 20·0 30.0 50'0
2 3 4 5 G 7' 8
-------_ ----------'0001 399,960,000 63,993,600 15,998,400 3,999,600 999,900 444,400 159,984 ·0002 ~99,960,000 31,993,600 7,998,400 1,999,600 499,900 222,178 79,984 ·0003 1.33,293,333 21,326,933 5,331,733· 1,332,933 333,233 148,104 53,317 ·0004 99,960,000 15,993,600 3,998,400 999,600 249,900 111,067 39,984 ·0005 79,960,000 12,793,600 3,198,400 799,600 199,900 88,844 31,984
·0006 66,626,666 10,660,266 2,665,066 666,266 166,566 74,029 26,651 '0007 57,102,857 9.136,957 2,284,114 571;G2S 142,757 63,448 22,841 '0008 . 49,960,000 7,993,600 1,998,400 499,600. 124,900 55,511 19,984 -0009 44,404,444 7,104,711 1,776,178 444,044 111,011 49,338 17,761
0001 39,960,000 6,393,600 1,598,400 399,600 . 99,900 44,400 15,984 ·002 19,960,000 3,193,600 798,400 1.99,600 49,900 22,178 7,984 ·003 13,293,333 2,126,938 531,733 132,933 33,233 14,770 5,317 -004 9,960,000 1,593,600 398,400 99,600 24~900 11,067 3,984 -005 7,960,000 1,273,600 318,400 79,600 19,900 8,844 3,184
,006 6,626,666 1,060,266 265,067 66,267 1.6,567 . 7,363 2,651 ·007 5,674,285 907,886 226,971 56,743 14,186 6,305 2,210 ·008 4,960,000 793,600 198,400 49,600 12,400 5,511 1,984 ·009 4,404,444 704,711 176,178 44,045 11,011 4,894 1,762
·or 3,960,000 633,600 158,400 39,600 9,900 4,400 1,584 -02 1,960,000 3l3,6oo 78,400 19,600 4,900 2,118 784 -{)3 1,293,333 206,933 51,733 1.2,933 3,233 1,431 517 '04 960,000 153,600 38,400 9,600 2,400 1,067 384 '05 760,000 121,600 30,400 7,600 1,900 844 304
·06 626,667 100,267 25,067 6,267 I,S67 696 251 ·07 531.429 85,029 21,257 5,314 1,327 591 213 '08 460,000 73,600 18,400 1,600 1,,150 511 184 ,09 404,444 64,711 16,178 4,044 1,010 449 162
.( 360,000 57,600 14,400 3,600 900 400 144 ·Z 160,000 25,600 6,400 1,600 400 188 64 ·3 93,333 14,933 3,733 933 238 104 37 -4 60,000 9,G()I) 2,400 600 150 67 24 ., 40,000 6,400 1,600 400 100 4' 15
'6 26,667 4,267 1.,067 267 67 30 11 '7 17,143 2,743 686 171 43 19 7 '8 10,000 1,600 400 100 25 11 4 ·9 4,444 711 178 44 11 5 2
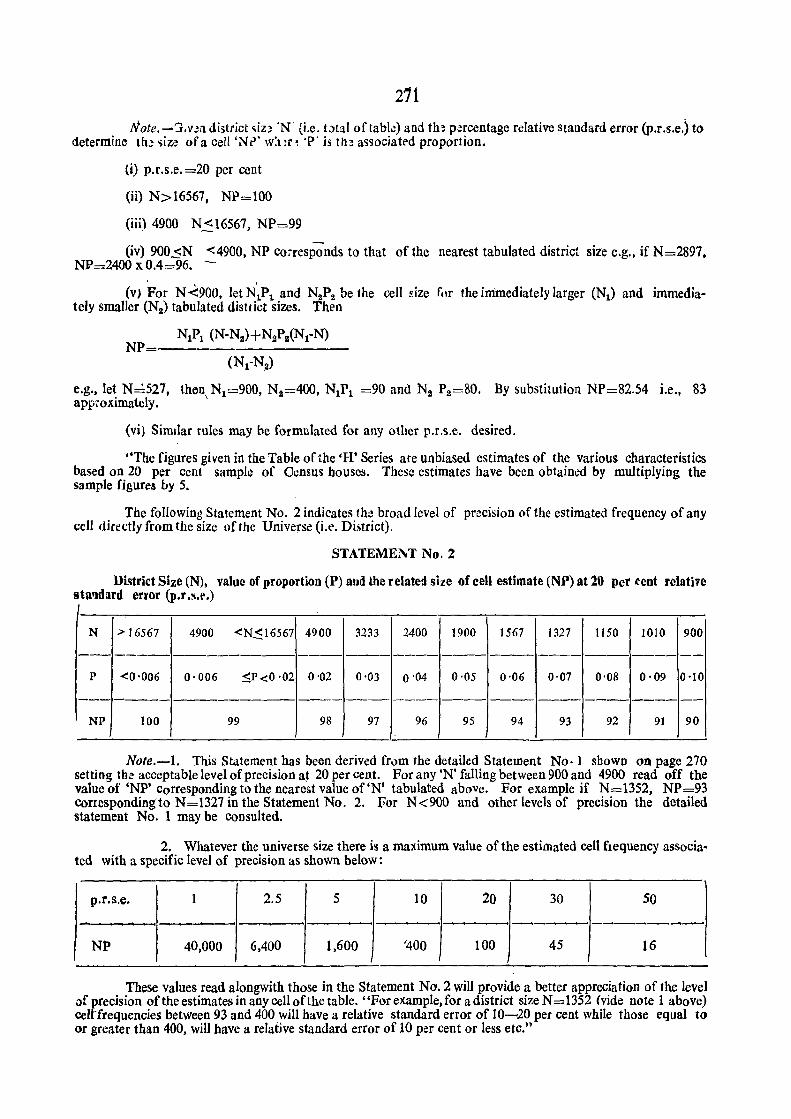
271
Note ........ j.v .. m district ~iz~ 'N' (i.e. t.)tal of tab!.!) and th~ p:!rcentage relative standard error (p.r.s.e.) to determine th..! siz~ ofa cell 'N?' w:l!r~ 'P' is th:! associatt"d proportion.
(i) p.r.s.e. =20 per cent
(ii) N>16567, NP=100
(iii) 4900 N < 16567, NP =99
(iv) 900.=:;N <4900, NP co;-responds to that of the nearest tabulated district size e.g., if N=2897. NP=2400 x 0.4=96. -
(v, For N <=900. let N~Pl and NIlPz be the cell Eize for the immediately larger (Nl) and immediately smaller (Nil) tabulated disttict sizes. Then
NP NlP! (N-Nz)+NllPZ(N1-N)
(N1-NJI)
e.g., let N '527, theo\ N1=900, NlI =400, N1P1 =90 and Na P2=80. By substitution NP=82.54 i.e., 83 approximately.
(vi) Simtlar rules may be formulated for any other p.r.s.e. desired.
"The figures given in the Table of the 'R' Series are unbiased estimates of the various characteristics based on 20 per cent sample of Oemus houses. These estimates have been obtained by mUltiplying the sample figures by 5.
The following Statement No. 2 indicates tho! broad level of precision of the estimated frequency of any cell directly from the size of the Universe (i.e. Dhtrict).
STATEME1'T No.2
District Size (N), vahle of proportion (P) and the relate!l size of cell estimate (NP) at 20 pet fent relative staqdllrd error (p.r .s.t'.)
N > 16567 4900 <N~16567 4900 3233 2400 1900 1567 1327 1150 1010 900
------------------------------------ -------------p <0,006 0·006 ~p<o ·02 0'02 0,03 0'04 0·05 0,06 0·07 0'08 O· 09 0,10
--------------------------------- ---------------NP 100 99 98 97 96 95 94 93 92 91 90
Note.-I. This Statement has been derived from the detailed Statement No· 1 shown on page 270 setting the acceptable level of precision a~ 20 per cent. For any 'N' falling between 900 and 4900 read off the value of 'NP' corresponding to the nearest value of 'N' tabulated above. For example if N=1352, NP=93 corresponding'to N=1327 in the Statement No.2. For N<900 and other levels of precision the detailed statement No. 1 may be consulted.
2. Whatever the universe size there is a maximum value of the estimated cell flequency associated with a specific level of precision as shown below:
p.r.s.e. 1 2.5 5 10 20 30 SO
- --. __,,__ ___..._----------..-NP 40,000 6,400 1,600 '400 100 45 16
These values read alongwith those in the Statement No.2 will provide a better appreciation of the level ;)f precision of the estimates in any cell of the table. "For example, for a district size N=1352 (vide note 1 above) celHrequencies between 93 and 400 will have a relative standard error of 10-20 per cent while those equal to or greater than 400, will have a relative standard error of 10 per cent or less etc."
ANNEXURE tv
NA TIONAL INDUSTRIAL CLASSIFICATION (NIC)-1970
This classification groups the industries into : 10 Divisions (0 to 9 & 'X') 66 Major Groups
386 Minor Groups
o 1 2 & 3 4 5 6 7 8 9 X
The Divisions, Majo~ Groups and Minor Groups with their code numbers are listed below :
DIVISIONS
(One digit level of Classification)
Agriculture, Hunting, Forestry and Fishing Mining and Quarrying Manufacturing and Repair -Electricity, Gas and Water Construction Wholesale and Retail Trade and Restaurants & Hotels Transport, Storage and Communications, Financing Insurance, Real Estate and Bbsiness Services Community, Social and Personal Services Activities not Adequately Defined
MAJOR GROUPS
(Two digit level of classification)
Major Group Division O-Agriculture, Hunting, Forestry and Fishing.
00 Agricultural Production 01 Plantation 02 Livestock Production 03 Agricultural Services 04 Hunting, Trapping and Game Propagation 05 Forestry and Logging 06 Fishing
10 11 12 19
20-21 22 23 24 25 26
27 28
29 30 31
32 33
Division I-Mining and Quarrying.
Coal Mining Crude Petroleum and Natural Gas Metal Ore Mining Other Mining
Division 2 & 3-Manufacturing and Repair.
Manufacture of Food Products· Manufacture of Beverages, Tobacco and Tobacco Products Manufacture of Cotton Textiles Manufacture of Wool, Silk and Synthetic Fibre Textiles Manufacture of Jute, Hemp, and Mesta Textiles Manufacture of Textile Products (including Wearing Apparel other than Footwear) Manut~lcture of Wood and Wood Products, Furniture & Fixtures Manufa~ture of Paper and Paper Products & Printing, Publishing and Allied Indus:. tries _. .
Manufacwre of Leather and Leather & FUr Products, (exCept repair) Manufactufe of Rubber, Plastic, Petroleum and Coal Products Manufactur~ of Chemicals and Chemical Products (except Products of Petroleum and Coal)
Manufacture Df Non-Metallic Mineral Products Basic Metal a.nd Alloys Industries
272
Description Major Group
34 Manufacture of Metal Products and Parts except Machinery . and Transport Equlp~ ment
35 36
37 38 39
40 , 41
42
50 51
Manufacture of Machinery, Machine Tools and Parts except Electrical Machinery Manufacture of Electrical Machinery, Apparatus, Appliances and Supplies and Parts
Manufacture of Transport Equipment and Parts Other Manufacturing Industries Repair
Division 4-Eiectricity, Gas and Water.
Electricity Gas and Steam Water Works and Supply
Division 5-Constrllction~
Construction Activities Allied to Construction
Division 6-Wholesale and Retail Trade and Restaurants & Hotels. \
60 . Wholesale Trade in Food, Textiles, Live Animals, Beverages and Intoxicants 61 Wholesale Tr~de in Fuel, Light, Chemicals, Perfumery, Ceramics, Glass 62 Wholesale Trade in Wood, Paper, Other Fabrics, Hide and Skin and Inedible Oils 63 Wholesale Trade in All Types of Machinery, Equipments including Transport and
Electrical Equipment 64 Wholesale Trade in Food and Miscellaneous Manufacturing 6S Retail Trade in Food and Food Articles, Beverage, Tobacco and Intoxicants 66 Retail Trade in Textiles 67 Retail Trade in Fuel and Other Household Utilities and Durables. 68 Retail Trade in Others 69 Restaurants and Hotels
Division 7-Transport, Storage and Communications.
70 Land Transport 71 Water Transport 72 Air Transport 73 Services incidental to Transport 74 Storage and Warehousing 75 Communications
Division 8-Financing lnsurance, Real Estate and Business Services.
80 Banking and Similar Type of Financial Institutions 81 Providents and Insurance 82 Real Estate and Business Services 83 Legal Services
Division 9-Community, Social afld Personal Services. 90 Public Administration & Defence Services 91 Sanitary Services 92 Education, Scientific and Research Services 93 Medical & Health Services 94 Community Services 9S Recreational & Cultural Services 96 Personal Services 98 International and other Extra Territorial Bodies Services 99 Services not elsewhere classified
Division X-Activities not Adequately Defined. XO Persons without any affiliation' to any particular industry (including fresh entrants
to labour force) Xl Activities not Adequately Defined (Other than those in XO)
Major Group
00
01
02
03
D4
Minor Group
274
MINOR GROUPS
(Three digit level of classification)
Description
Division O-Agriculture,_ Hunting, Forestry & Fishing.
000 001 002 003 004 005
006 007
008
010 011 012 013 014 015 016
017 018 019
020 021 022 023 024 025 026 029
030 031 032 033 034 035 036 039
040
Agricultural Production.
Cereal Crops (Paddy, wheat, jowar, bajra, maize, ragi, barley & gram, etc.). Pulses (arhar, moong, masur and urd etc.) Raw cotton. Raw jute, mesta. Sunn hemp and other kindred fibres. Production of oilseeds such. as sesamum, groundnuts. rape, mustard, linseed. castor seeds, etc. Sugarcane. Roots and tubers, vegetables, pan, singhara. chillies and spices (other than pepper and cardamom) and flowers and parts 'Qf plants. Agricultural production not elsewhere cl~ssified.
Plantations
Tea. Coffee. Rubber. Tobacco. Pepper. Cardamom. _ Edible nuts (excluding coconut and groundnut), walnut, almond, cashewnut, etc. . Production of fruits. coconuts, e.g. bananas, apples. grape,s. mangoes, oranges. Production of ganja. cinC,hona;' opium, etc. Crops of plantations, not· elsewhere classified (e.g. Betel nuts, etc.).
Livestock Production.
Cattle and goats-breeding, rearing, ranching etc. and production of. milk. Rearing of sheep and production of wool. Rearing of horses, mules, camels and other pack animals. Rearing of pigs and other animals. Rearing of ducks, hen and other birds and production of eggs. Rearing of bees and production of honey and wax. Rearing of silk-worms and production of cocoons and raw silk. Rearing of livestock and production of livestock products not elsewhere classified.
Agricultural Services.
Pest destroying, spraying. pruning of infected stems. Operation of irrigation system. Animal sharing and livestock services (other than veterinary services). Grading agricultural and livestock products. Horticultural and nursery services. Soil conservation. Scientific services like soil testing. Agricultural services not elsewhere classified (like land clea{iqg! land draining etc.)
Hunting, Trapping and Game l'f('Jpagati on.
HUnting, trappin,g and game propagation for commercial pUJ;'poses (other than for sports).
Major Minor Group Group
05
050 051
052 053 054
059
06
060 061 062
,063 069
10
100 rOI
11
110 III
12
120 121 122 123 124 125 126 127 128 12!1
19
190 191
192
275
Description
Division O-Agriculture, Hunting, Forestry and Fishing-Contd.
Forestry and Logging.,
Planting, replanting and conservation of forests. Logging-felling and cutting of trees and preparation of rough, round, hewn or
. riven logs (including incidental hauling). Production of fUel (including charcoal by burning) by exploitation of forests. Gathering of fodder by exploitation of forests. Gathering of uncultivated materials such as gums, resins, lac, barks, herbs, wild fruits and leaves by exploitation of forests. Othei' fore3t prodncts not elsewhere cla,;sified such as munjh.
Fishing.
Ocean, sea and coastal fishing. Inland water fishing. Pisciculture~reariDg of fish. Collection of pearls, conches, shells, sponge and other sea products. Fishing and all ied activities not elsewhere classified.
Division I-Mining and Quarrying.
Coal Mining
Coal. Lignite.
Crude Pet; oleum and Natufal GaS.
Crude Petroleum. Na tural Gas.
Metal Ore Mining.
Iron Ore Manganese. Chromite. Bauxite. Gold and Silver Ores. Copper Ore. Lead and Zinc Ores· Limenite and Rutile. Wolfram. Metal Ores not elsewhere classified,
Other Mining.
Stone quarrying. clay and sand pits. Chemicals and fertilizer mineral ming (such as soda ash, sulphur, phosphates, r itl'ates, etc.) Salt mining and quarrying including crushing. screening and evaporating in pans.
Major Group
19
20-21
22
23
Minor Group
276
Description
Division I-Mining and Quarrying-eontd.
193 194 195 199
Precious a.nd semi-precious stones. Mica. Gypsum. _ Other mining not elsewhere classified (asbestos, quartz, tale and soap stone, natural abrasives other than sand, graphite, etc.).
Division 2 & 3-Ma71Ufacturing and Repair.
200 201 202 203 204 205 206 207
208 209 210 211
212 213 214 215 216 217 218
220 221 222 223 224 225
226 227 228 229
230 231
232 233 234 235 236 ~39
Manufacture of Food Products.
Slaughtering', preparation & preservation of meat. Manufacture of dairy products. . Canning and preservation of fruits·,and vegetables. _ Canning, preserving and processing of-{ish, crustacea and similar foods. Grain mill products. ' " Manufacture of bakery products. " Manufacture and refining of sugar (vacuum p~l\sugar factories). Production of indigenous sugar boora, khandsari, gur, etc. from sugarcane, palm juice.
Production of common salt. Manufacture of cocoa, chocolate and sugar confectionery (including s~eetmeats). Manuf cture of hydrogenated oils, vanaspati ghee, etc. Manufacture of other edible oils and fats e.g. mustard oil, ground nut oil, til oil, etc. (Inedible oils shown under 315). Te~ processing. Coffee curing, roasting and grinding. Cashewnut processing like drying, shelling, roasting, salting, etc. Manufacture of ice. . Manufacture of prepared animal feeds. Manufacture of starch. Manufacture of food products not elsewhere classified.
Manufacture of Beverages, Tobacco and Tobacco Products.
Distilling, rectifying and blending of spirits. Wine industries. Malt liquors and malt. Production of country liquor and toddy. Soft drinks and carbonated water industries. Tobacco stemming, redrying and all other operations which arc connected with pre-paring raw leaf tobacco for manufacture.
Manufacture of bidi. Manufacture of cigars, cigarettes, cheroots and cigarette tobacco. Manufacture of chewing tobacco, zarda and snuff. Manufacture of tobacco and tobacco products, not elsewhere classified.
Manufacture of Cotton Textiles.
Cotton ginning, cleaning and baling. Cotton spinning, weaving, shrinking, sanforizing, m~rcerising and finishing of cotton textiles tn mills.
Printing, dyeing and bleaching of cotton textiles. Cotton spinning other than in mills (charkha). Production of khadi. Weaving and finishing of cotton textiles in handlooms, other than khadi. Weaving and finishing of Cotton textiles in power-looms. ' Got ton te~tiIes nqt elsew~ere clllrssifieq.
Major Group
24
25
26
27 ~'!,
Minor Group
277
Description
Division 2 & 3-Manufacturinf: and Repair- Contd.
240 241 242 243 244 245 246 247
248 249
250 251 252 253 259
260 261 262 263 264 265 266
267 268 269
270 271 272
273
274
275 276 277 279 ..
Manufacture of Wool, Silk and Synthetic fibre Textiles.
\ Wool cleaning, baling and pressing. Wool spinning, weaving and finishing in mills. Wool spinqing and weaving (other than in mills). Dyeing and bleaching of woollen textile. Manufacture of wool not elsewhere classified. Spinning, weaving and finishing of silk. Printing, dyeing and bleaching of silk textiles. Spinning, weaving and finishing of other textibs-synthetic fibres~ rayons, nylons,
etc. Pripting, dyeing and bleaching of synthetic textiles. Silk and synthetic fibre textiles not elsewhere classified.
Manufacture of Jute, Hemp and Mesta Textiles
Jute and Mesta pressing and baling. Jute and Mesta spinning and weaving. Dyeing, printing and bleaching of jute textiles. Preparing; spinning, weaving and finishing of hemp and other coarse fibres. Manufacture of jute bags and other jute textiles not elsewhere classified.
-Manufacture Textile Products (including Wearing Apparel other than Footwear).
Knitting mills. Manufacture of all types of threads, cordage, ropes, twines, nets, etc.
~ Emb,roidery and making of crapes laces and fringes. Weaving carpets, rugs and other similar textile products. Manufacture of all types of textiles, garments including wearing appareL Manufacture of rain coats, hats, etc. Manufacture of made up textile goods (except garments) such as curtains, mosquito nets, etc.
Manufacture of water proof textiles such as oil cloth, tarpaulin, etc. Manufacture of coir and coir products. Manufacture of textiles not elsewhere classified like linoleum, padding, wadding, upholstering, filling.
Manufacture of Wood and Wood Products, Furniture and Fixtures.
Manufacture of veneer, plywood and their products. Sawing and planing of wood (other than plywood). Manufacture of wooden and cane boxes, crates, drums, barrels and other wooden containers, baskets and other rattan, bamboo, reed and willow wares made entirely or mainly of cane, rattan, reed, bamboo and willow.
Manufacture of structural wooden goods (including treated timber) such as beams, posts, doors and windows (excluding hewing and rough shaping of poles, bolts. and other wood material which is classified under logging).
Manufacture of wooden industrial goods, such as bobbins, blocks, handles, saddling and similar equipment and fixtures.
Manufacture of cork and cork products. Manufacture of wooden furniture and fixtures. Manufacture of bamboo and cane furniture and fill:tures. Manufacturl? of w<?o~ and r~ed~ 'I?<l;~boo 3;nd c~ne product~ 110t ~l~ewlwre classi-fi~~· .
Major Group
28
29
30
31
Minor Group
278
Description
Division 2 & 3-Manufacturing and Repair-Contd.
280 281 282 283 284 285
286 287 288 289
290 291
292
293 294
295 296 299
300 301 302 303 304 305 306 307
310
311 312 313 314
315 316
317 318 ~19
Manufacture of Paper and Paper Products and Printing, Publishing and A !lied Industries.
Manufacture of pulp, paper and paper board including newsprint. Manufacture of container and boxes of paper and paper board. Manufacture of pulp products not elsewhere classified like dolls. Manufacture of paper and paper board articles not elsewhere classified. Printing and publishing of newspaper. Printing and publishing of periodicals, books, journals, atlases, maps, sheet music directories.
Printing of bank notes, currency notes, postage stamps; security presses. Engraving, etching, block making, etc. Book Binding. Printing, putllishing and allied activities, not elsewhere classified like envelope printing, picture post card printing, embossing.
Manufacture of Leather and feather and Fur Produ,cts (except Repair).
"-Tanning, currying, finishing, embossing and japanning of leather. Manufacture of footwear (excluding repair) except vulcanized or moulded rubber or plastic footwear·.
Manufacture of wearing apparel like coats, gloves, etc. of leather and subsititutes of leather.
Manufacture of Leather Consumer Goods (other than apparel and footwear). Scrapping, currying, tanning, bleaching and dyeing of fur and other pelts for the
trade. Manufacture of wearing apparel of fur and pelts. Manufacture of fur and skin rugs and other articles. Manufacture of Leather and Fur Products not elsewhere classified'.
Manufacture of Rubber, Plastic, Petroleum and Coal Products.
Tyre and tube industries. Manufacture of footwear made primarily of vulcanized or moulded rubber and Plastic. Manufacture of rubber products not elsewhere classified. Manufacture of plastic products not elsewhere classified (except house furnishing). Petroleum refineries. Manufacture of products of petroleum not elsewhere classified. Production of coal tar in coke ovens. Manufacture of other coal and coal tar products not elsewhere classified.
Manufacture of Chemicals and Chemical Products (except Products of Petroleum and Coa!).
Manufacture of basic industrial organic and inorganic chemicals an-d gases such as acids, alkalies and their salts ; gases like acetylene, oxygen, nitrogen, etc.
Manufacture offertilisers and pesticides. Manufacture of paints, varnishes and lacquers. Manufacture of drugs and medicines. Manufacture of perfumes, cosmetics, lotions, hair dressings, tooth pastes, soap in any form, synthetic detergents, shampoos, shaving products, cleansers, washing and scouring products and other toilet preparations.
Manufacture of inedible oils. Manufacture of turpentine, synthetic resins, plastic materials and Synthetic fibres like nylon, terylene except glass.
Manufacture of matches. Manufacture of explosives and ammunition and fire works. Manufacture of chemical products not el~e",here cl\l:ssined (including photo-chemic~.1s, sensiti~ed filp1s and paper). . .
Major Group
32
33:
34
35
Minor Group
219
Description
Division 2 & 3-Manufacturing and Repair-Contd.
320 321 322 323 324 325 326
327 328 329
330\ 33.1 332 333 334 335 336 339
340
341 342 343 344 345 349
350 351
35:2
353 354 355
356
Manufacture of Non-Metallic Mineral Products.
Manufacture of structural clay products. Manufacture of glass and glass products. Manufacture of earthen-ware and earthen pottery. Manufacture of china-ware and procelainware. Manufacture of cement, lime and pla&ter. Manufacture of 'mica products. Manufacture of structural stone goods, stone dressing and stone crushing, stone ware.
Manufacture of earthen and plaster statutes and other products. Manufacture of asbestos, cement and other cement products. Manufactur~ .of miscellaneous non-metallic mineral products such as slate products, abrasives, graphite products, mineral wool, silica products and other non-metallic mineral products not-elsewhere classified.
\
Basic Me/all and Alloys Industries.
Iron and steel industries. _ Foundaries for casting and forging iron and steel. Manufacture of ferro-alloys. Copper manufacturing. Brass manufacturing. Aluminium manufacturing. Zinc manufacturing. Other non-ferrous metal industries.
Manufacture of Metal Products and Parts except Machinery and Transport Equipment.
Manufacture of febricated metal products such as metal cans from tin-plate, terneplate or enamelled sheet metal, metal shipping containers, barrels, drums, kegs, pails, safes, vaults, enamelled, sanitary and all other fabricated metal products not elsewhere classified.
Manufacture of structural metal products. Manufacture of furniture and fixtures primarily of metal. Manufacture of hand tools and general hardware. Enamelling, japanning, lacquering, galvanising, plating and polishing metal products. Manufacture of metal utensils, cutlery and kitchenware. Manufacture of metal products except meachinery and tr~nsport equipment not elsewhere classified, like t)'pe founding.
Manufacture of Machinery, Machine tools and Parts £?>xcept Electrical Machinery.
Manufacture of agricultural machinery and equipment and parts. Manufacture and repair of drills, coal cutting machines, earth moving, lifting and hoisting machinery, cranes, conveyors and road raHers and other heavy machinery and equipment used by construction and mining industries. .
Manufacture of prime movers, boilers and steam generating plants such as .diesel engines and parts.
Industrial Machinery for Food and Textile Industries. Industrial Machinery for other than Food and Textiles Industries. Manufacture of Refrigerators, Airconditioners, and Fire Fighting Equipment, and other parts, components and accessories.
Manufacture, alteration and repair of general items of non-electrical machinery, components, equipment and accessories not elsewherc classified, e.g., manufacture and rcpair of size reduction equipment like. Pentagraph, Mapograph etc., crushcrs, conveyors, bucket elevators, ship hoist cranes, derricks, etc., mixers and reactors, centrifugal machines, driers, etc., power driven pumps, etc., air gas compressors and vacuum pumps (excluding electrical furnaces), etc.
Major Group
35
36
37 .
38
Minor Group
Description
Division 2 & 3-Manufacturing and Repair-Contd.
357 358 359
360
361 362 363
364
365 366 367 369
370 371 372 373 374 375 376 377 378 379
380 381
382 383 384 385 386 387
389
Manufacture of Machine Tools, their parts and accessories. Manufacture of office computing and accounting machinery and parts. Manufacture and repair of non-electrical machinery, equipment, components and accessories not elsewhere classified, (such as sewing machines, automatic merchandising machines, washing, . laundry, dry-cleaning and pressing machines, cooking ranges and ovens, other service industry machines, arms and armlments etc.).
Afanufacture of Electrical Machinery, Apparatus, Appliances and Supplies and Parts.
Manufacture of electrical industrial machinery and apparatus and parts (su(.'h as electrical motors, generators, transformers, electro-magnetic clutches and brakes, etc.).
Manufacture of insulated wires and cables. Manufacture of dry and wet batteries. , Manufacture of electrical apparatus, appijances and their parts, such as lamps, bulbs, tubes, sockets, switches, fans, insulators (except porcelain), conductors, irons, heaters, shavers, vaCuum cleaners, etc'\ excluding repairing.
Manufacture of radio and television transmitting and receiving sets including transistor, radio sets, sound reproducing and recording equipment including tape recorders, public address systems, gramophone records and pre-recorded magnetic tapes, wire and wireless, telephone and telegraph equipment, signalling and detection equipment and apparatus, radar equipment and installations ; parts and supplies specially used for electronic apparatus classified in this group.
Manufacture and repair of Radiographic X-ray apparatus and tubes and parts. Manufacture of Electronic Computers, Control Instruments and other Equipment. Manufacture of electronic components and accessories not elsewhere classified. Manufacture of electrical machinery, apparatus, appliances and supplies and parts
not elsewhere classified.
Manufacture of Tra!lSport Equipment and Parts.
Ship building and repairing. Manufacture of locomotives and parts. Manufacture of railway wagons and coaches and parts. Manufacture of other rail-road equipment. Manufacture of motor vehicles and parts. Manufacture of motor-cycles and scooters and parts. Manufacture of bicycles, cycle-rickshaw and parts. Manufacture of aircrafts and its parts. Bullock-carts, push-carts, hand carts, etc. Manufacture of transport equipment and parts not elsewhere classified.
Other Manufacturing Industries.
Manufacture of medical, surgical and scientific equipment. Manufacture of photographic and optical goods (excluding photo chemicals, sen-sitised paper and film).
Manufacture of watches and clocks. Manufacture of jewellery and related articles. Minting of coins. Manufacture of sports and atheletic goods. Manufacture of musical instruments. Manufacture of stationery articles like fountain pens, pencils, pens, pin cushions, tags, etc., not elsewhere classified.
Manufacture of miscellaneous products not elsewhere classified such as cC'stume jewellery, costume novelties, feather, plumes, artificial flowers, brooms, brushes, lamp shades, tobacco piptts, cigarette holders, ivory goods, badges, wigs and similar articles.

Major Group
Minor Group
281
Description
Division 2&3-Manufacturing and Repair-Concld. 39 Repair.
40
41
42
50
51
60
390 Repair of footwear and other leather goods. 391 Electrical repair shops. 392 Repair of motor vehicles and motor-cycles. 393 Repair of watch, clock and jewellery. 394 Repair of bicycles and cycle rickshaws. 399 Repair of enterprises not elsewhere classified.
Division 4-Electricity, Gas and Water.
400 401
410
420
Electricity.
Generation and transmission of electric energy. Distribution of electric energy to household, industrial and commercial and other
users. \
Gas and Steam.
Manufacture of gas in gas works and distribution through mains to household, industrial and commercial and other users.
Water Works and Supply.
Water supply, i.e., collection, purification and distribution of water.
Division 5-Constructions.
500 501
502
503
504 505 509
510 511 512 513 514 519
Division
600 601 602
603 604 605 606 607 608
Construction Construction and maintenance of buildings (including aerodromes). Construction and maintenance of toads, railways, bridges, tunnels, pipe lines, ports, harbours, runways, etc.
Construction and maintenance of telegraph and telephone lines and other communication systems.
Construction and maintenance of water-ways and water reservoirs such as bund, embankments, dams, canals, tanks, wells, tube wells, etc.
Construction of hydro-electric projects. Construction of industrial plants including thermal plants. Construction not elsewhere classified.
Activities Allied to Construction.
Plumbing. Heating and air conditioning installation, lift installation, sound proofing, etc. Setting of tiles, marble, brick, glass and stone. Plumber works, such as fixing of doors, windows, panels, painting and decorating. Electrical installation. Other activities allied to construction not elsewhere classified, such as fixing of hand .. pumps.
6-Wholesale and Retail Trade and Restaurants & Hotels.
Wholesale Trade (W.T.) in Food, Textiles, Live Animals, Beverages and Intoxicants.
Wholesale trade in cereals and pulses. Wholesale trade in foodstuff other than cereals and pulses. Wholesale trade in textiles and textile products, like all kinds of fabrics, garment9, shirtings, suitings, hosiery goods.
Wholesale trade in beverages other than intoxicants, e.g., aerated water. Wholesale trade in intoxicants like wines and liquors including bottling. Wholesale trade in intoxicants like opium, ganja, etc. Wholesale trade in tobacco and tobacco products. Wholesale trade in animals. Wholesale trade in straw and fodder.
Major Group
61
62
63
64
65
66
67
Minor Group
" " ~ .282
Description
Division 6-Wholesale and Retail Trade and Restaurants and Hotels-Contd.
Wholesale Trade in Fuel, Light, Chemicals, Prefumery, Ceramics, Glass.
610 Wholesale trade in medicines and chemicals. 611 Wholesale trade in fuel and lighting products. 612 Wholesale trade in toilets, prefumery and cosmetics. 613 Wholesale trade in metal, porcelain and glass utensil croc~ery and chinaware.
Wholesale Trade in Wood, Paper, Other Fabrics, Hide and Skin and Inedible Oils.
620 Wholesale trade in petrol, mobil oil and allied products. 621 Wholesale trade in wood, cane, bamboo, thatches, etc. 622 Wholesale trade in paper and other stationery goods. 623 Wholesale trade in skin,' leather and fur etc.
630
631 632
640 641 642 643 644 645 646 647 649
650 651 652 653 654 655 656 659
660 661
Wholesale Trade in all Types of Machinery, Equipments including Transport and Electrical Equipment.
Wholesale trade in agricultural and Industrial machinery, e.g., harvestors, sowing machines, etc. "
Wholesale trade in electrical machinery and, equipment. Wholesale trade in transport and storage equipment.
Wholesale Trade in Food and Miscellaneous Manufacturing.
Wholesale trade in furniture and fixtures. Wholesale trade in rubber and rubber products. Wholesale trade in household and equipment not elsewhere classified. Wholesale trade in building materials. Wholesale trade in clocks, eye-glasses and frames. Wholesale trade in hardware and sanitary equipment. Wholesale trade in scientific, medical and surgical instruments. Wholesale trade in precious metals, stones and jewellery. Wholesale trade in goods not elsewhere classified.
Retail Trade (R.T.) in Food and Food Articles, Beverage, Tobacco and Intoxicants.
Grain and grocery store. Vegetable and fruit selling. Dealers in meat, fish and poultry. Dealers in sweetmeat, bakery products, dairy. products and eggs. Pan, bidi, cigarette shops. Dealers in aerated water, soft drinks and ice cream. Wine and liquor shops. Retail trade in food and food articles, beverage, tobacco and intoxicants not elsewhere classified.
Retail Trade in Textiles.
Dealers in textiles (non-ready made). Dealers in ready-made garments.
Retail Trade (R.T.) in Fuel and Other Household Utilities and Durables.
670 Dealers in firewood, coal and kerosene oil. 671 Utensil shops. 672 Fancy stores (including crockery and glassware dealers). 673 Dealers in electrical and electronic goods. 674 Furniture shops. 675 Jewellery marts. 676 Footwear shops. .. . 679 Retail trade in fuel and other household utilities and durables D()t elsewhete classi-
fied.
M.a'jor Group
68
69
70
71
72
73
74
75
Minor Group
283
Description
Division 6-Wholesale and Retail Trade and Rest'aurants and Hotels-Concld.
Retail Trade in Others.
6~O Medical shops. 6g1 B()'oksellers and sta.tioners. 682 Dealers in buildings material. 683 Dealers in transport equipment. 684 Petrol fillings stations. 689 Retail trade in othels not elsewhe -e cIassifred.
690 691
Restaurants and Hotels.
Restaurants, cafes and others eating and drinking places. Hotels, rooming houses, camps and other lodging places.
Division 7-Transport, Storage and Communications
700 701 702 703 704 705 706
707 708
710 711 712
720 721
730
740 741 749
750 751 759
Land Transport.
Railway transport. Passenger transp.ort by tramway and bus-services. Passe'ilger transport by other motor vehicles. Freight transport by motor vehicles. Hackney carriages bullocks-carts, ekka, tonga, etc. _ Transport by animals like horses, elePhants, mules, camels" etc. Transport by man (including rickshaw pullers hand-cart pullers, porters, coolies, etc.).
Pipeline transport. Supporting services to land transport, like operation of highway bridges, toll roads, vehicular tunnels, parking lots, etc.
Water-transport.
Ocean and coastal water-transport. Inland watel'-transport. Supporting services to water-transport like oper tion and maintenance of piers, docks, pilotage, light houses, loading and discharging of vessels, etc.
Air Transport.
Air-transport carriers (of passengers and freight). Supporting services to air-transport, like operation of airports, flying facilities, radio beacor flying control centres, radar stations, etc.
Services Incidental to Transport.
Services incidental to transport, such as packing, crating travel agency, etc.
Storage and Ware-Housing,
Ware-Housing. Cold-storage. Storage and ware-housing not elsewhere classified.
Communications.
Postal, telegraphic, wireless and signal communication. Telephone communication. Commdnicatjo!l !lot el~ewl1~r~ 91assified.
Major Group
Minor Group
Descritption
284
Division 8-Financing, Insurance, Real Estate and }Jusiness Services
80 Banking and Similar Type of Financial InStitutions.
800 Banking. 801 Credit Institutions other than banks, such as saving and loan associations, agricultural
credit institution industrial development banks, etc. 809 Other financial institutions such as pawn brokers, money lenders" financiers, chit
funds, etc.
81 Providents and Insurance.
810 Provident Services. 811 Insurance carriers, .Life. 819 Insurance carriers other than life such as fire, marine, accident, health etc.
82 Real Estate and BUSiness Services
820 Purchase, sale, letting and operating of real estate, such as residential and nonresidential buildings developing and sub-ai~iding real estate into lots, lessors of real property, real estate agents brokers and managers engaged in renting, buying and selling, managing and appraising real estate on contract or fee basis.
821 Purchase and sale, agents and brokers. 822 Auctioneering. ~ 823 Accounting, auditing and book-keeping services. 824 Data processing and tabulating services. 825 Engineering, architectural and technical services. 826 Advertising and publicity services. 827 Machinery and equipment, rental and leasing. 828 News Agencies e.g.,. P.T.I. U.N.I. Reuter, etc. 829 Business services, except machinery and equipment rental and leasing, not elsewhere
classified.
83 [,egal Services.
90
92
830 Legal Services, such as those rendered by advocates, barristers, solicitors, pleaders mukhtiars, etc.
Division 9-Community, Social and Personal Services.
900 901 902
903
Public Administration and Defence Services
Public services in the union' Government inclUding Defence services. Public Services in State Government including Police Services. .., Public Services in local bodies departments and offices engaged in admInIstratIOn like local taxation, business regulations, etc. Public Services in Quui-Government bodies.
Sanitary Servic,es.
910 Sanitation and similar services such as garbage and sewage disposal, operation of drainage systems and all other types of work connected with public health and
Sanitation.
920
921
922
Education, Secielltijic and Research Services.
Educational services rendered by techincal or vocational colleges, schools and other institution. Educational sevices rendered by non-technipal colleges, school, universities and other institutions. Research and Scientific Services not classified elsewhere such as those rendered ~Y institution and laboratories engaged in research in the biological, physical, and SocIal sciences, meterological institutes and medical research organisation, etc.
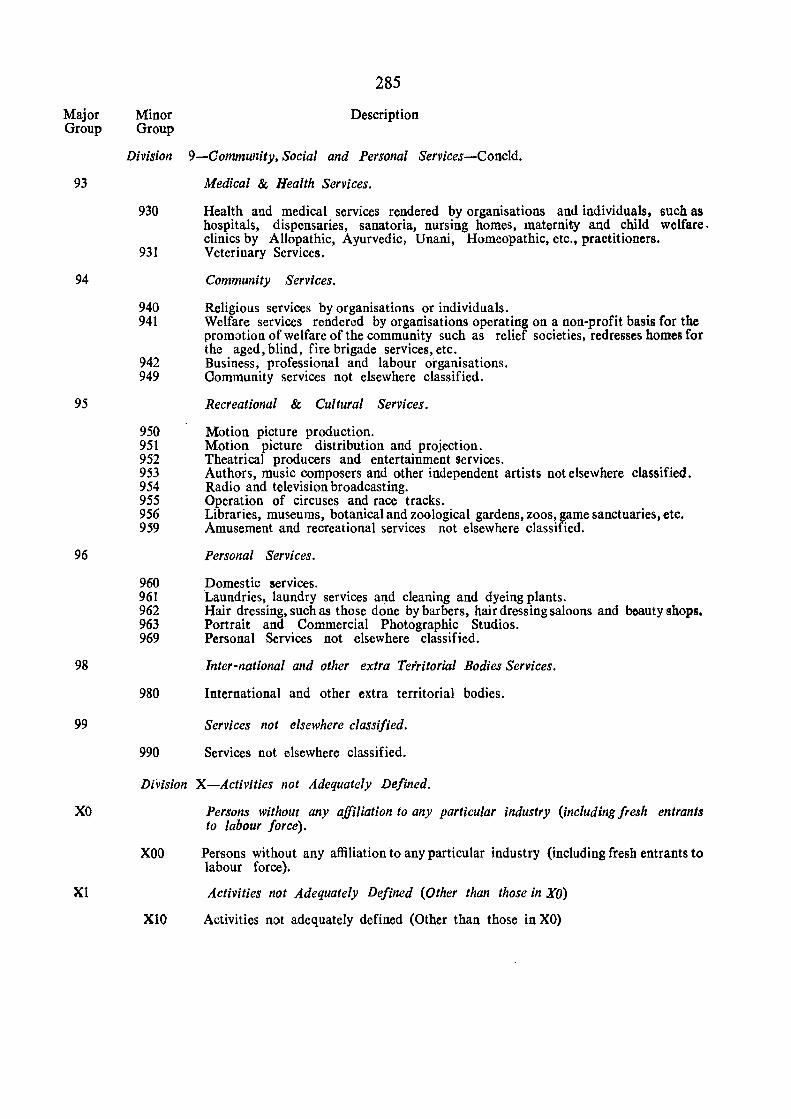
Major Group
93
94
95
96
98
99
xo
Xl
Minor Group
Division
930
931
940 941
942 949
950 951 952 953 954 955 956 959
960 961 962 963 969
980
990
285
Description
9-00mmunity. Social and Personal Services-Coneld.
Medical & Health Services.
Health and medical services rendered by organisations and individuals, such as hospitals, dispensaries, sanatoria, nursing homes, maternity and child welfare, clinics by Allopathic, Ayurvedic, Vnani, Homeopathic, etc., practitioners. Veterinary Services.
Community Services.
Religious services by organisations or individuals. Welfare services rendered by organisations operating on a non-profit basis for the promotion of welfare of the community such as relief societies, redresses homes for the aged, blind, fire brigade services, etc. Business, professional and labour organisations. Oommunity services not elseWhere classified.
Recreational & Cultural Services.
Motion picture production. Motion picture distribution and projection. Theatrical producers and entertainment services. Authors, music composers and other independent artists not elsewhere classified. Radio and television broadcasting. Operation of circuses and race tracks. Libraries, museums, botanical and zoological gardens, :zoos, game sanctuaries, etc. Amusement and recreational services not elsewhere classified.
Personal Services.
Domestic services. Laundries, laundry services a~d cleaning and dyeing plants. Hair dressing, such as those done by barbers, hair dressing saloons and beauty shops. Portrait and Commercial Photographic Studios. Personal Services not elsewhere classified.
Inter-national and other extra Territorial Bodies Services.
International and other extra territorial bodies.
Services not elsewhere classified.
Services not elsewhere classified.
Division X-Activities not Adequately Defined.
xoo
XIO
Persons without any affiliation to any particular industry (including fresh entrants to labour force).
Persons without any affiliation to any particular industry (including fresh entrants to labour force).
Activities not Adequately Defined (Other than those in XO)
Activities not adequately defined (Other than those in XO)

SECTION.B TABLES ON VILLAGE DIRECfORY AND PRIMARY CENSUS ABSTRACT DATA
l87

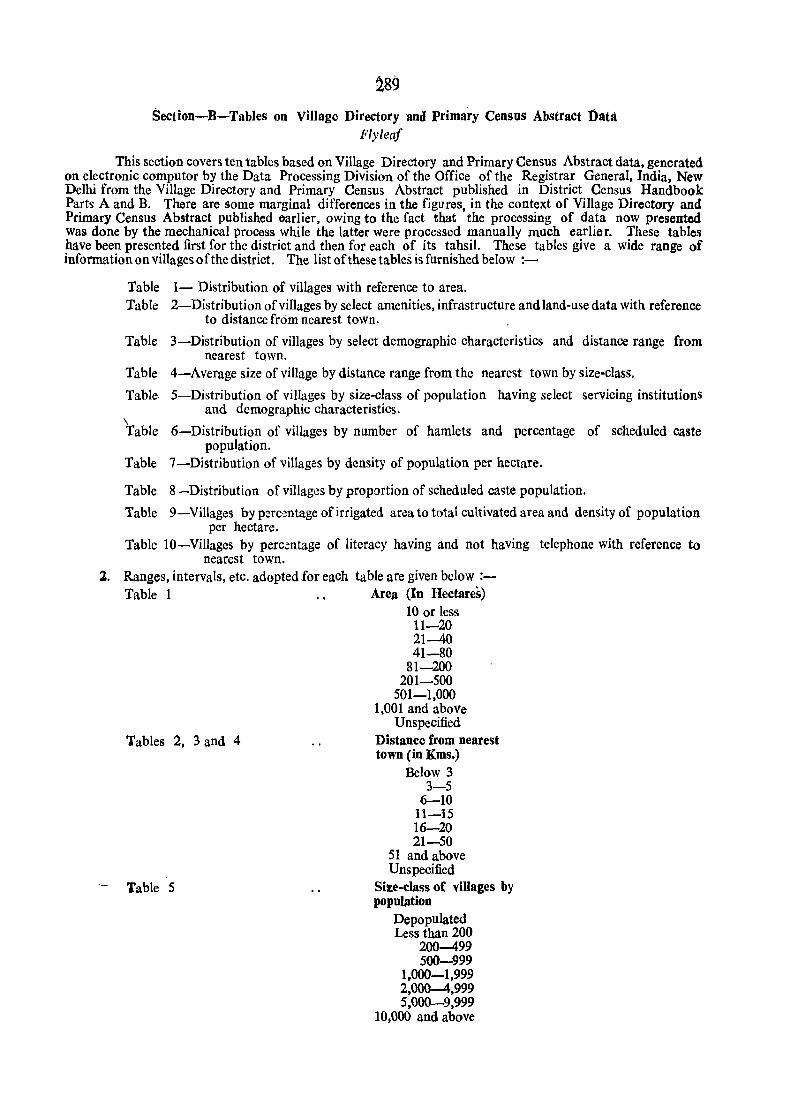
Section-B-Tables on Village Directory and Primary Census Abstract Data Flyleaf
This section covers ten tables based on Village Directory and Primary Census Abstract data, generated on electronic computor by the Data Processing Division of the Office of the Registrar General. India, New Delhi from the Village Directory and Primary Census Abstract published in District Census Handbook Parts A and B. There are some marginal differences in the figures, in the context of Village Directory and Primary Census Abstract published earlier, owing to the fact that the processing of data now presented was done by the mechanical process while the latter were processed manually much earlier. These tables have been presented first for the district and then for each of its tahsil. These tables give a wide range of information on villages 0 f the district. The list of these tables is furnished below :-
Table 1- Distribution of villages with reference to area. Table 2-Distribution ofviIlages by select amenities, infrastructure and land-use data with reference
to distance from nearest town.
Table 3-Distribution of villages by select demographic characteristics and distance range from nearest town.
Table 4-Average size of village by distance range from the nearest town by size-class.
Table, 5-Distribution of villages by size-class of population having select servicing institutions and demographic characteristics.
\ Table 6-Distribution of villages by number of hamlets and percentage of scheduled caste
population. Table 7-Distribution of villages by density of popUlation per hectare.
Table 8-Distribution of villages by proportion of scheduled ca~te population.
Table 9-Villages by perc~ntage of irrigated area to total cultivated area and den~ity of population per hectare.
Table 10-ViIlages by perc~ntage of literacy having and not having telephone with reference to nearest town.
1. Ranges, intervals, etc. adopted for each table are given below :-Table 1
Tables 2, 3 and 4
Table 5
Area (In Hectares) 10 or less 11-20 21--40 41-80
81-200 201-500
501-1,000 1,001 and above
Unspecified Distance from nearest town (in Kms.)
Below 3 3-5
6-10 11-15 16-20 21-50
51 and above Unspecified
Size-class of villages by popuhltion
Depopulated Less than 200
200--499 500-999
1,000-1,999 2,000-4,999 5,000-9,999
10,000 and above
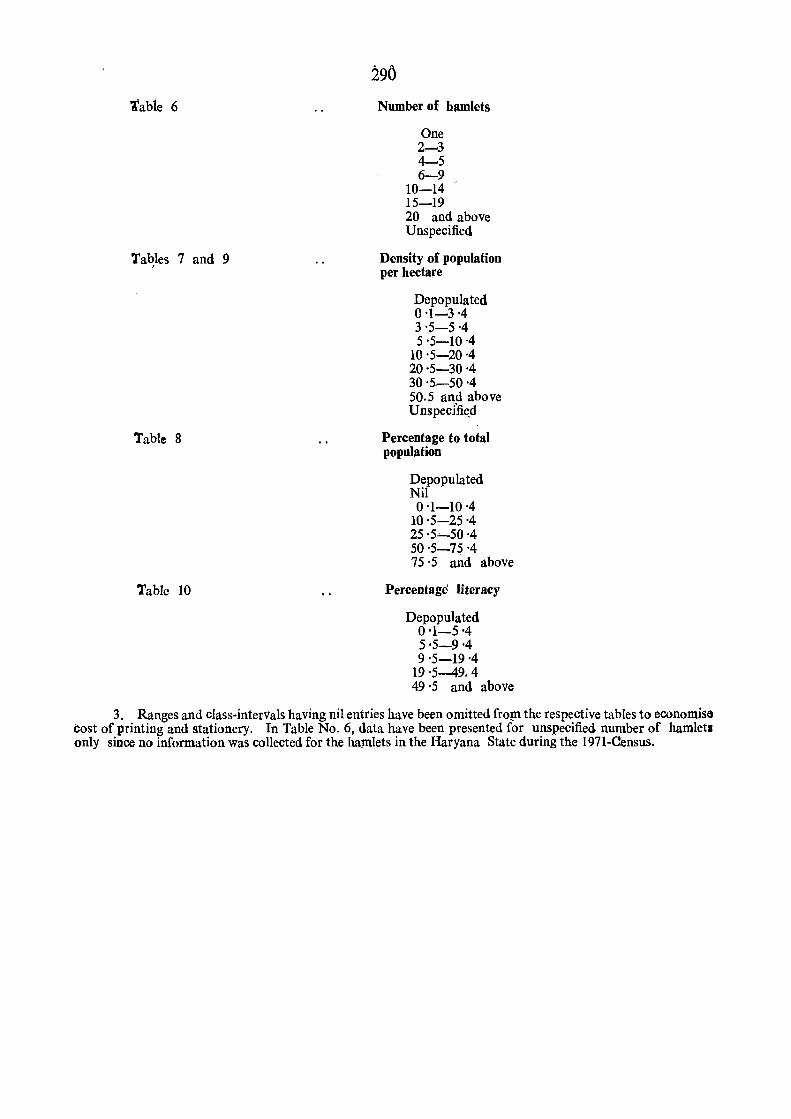
Tabte 6
Taqles 7 and 9
Table 8
Table 10
Number of hamlets
One 2-3 4-5 6-9
10-14 15-19 20 and above Unspecified
Density of population per hectare
Depopulated 0'1-3 '4 3'5-5·4 5'5-10·4
10'5-20·4 20'5-30·4 30'5~50'4 50.5 and above Unspec1ftf<_d
Percentage to total population
Depopulated Nil 0'1-10·4
10'5-25'4 25·5.;..._50·4 50'5-75'4 75'5 and above
Percentage literacy
Depopulated 0'1-5 ·4 5·5-9·4 9'5-19·4
19'5-49.4 49'5 and above
3. Ranges and class-intervals having nil entries have been omitted fro!ll the respective tables to economisa cost of printing and stationery. In Table No.6, data have been presented for unspecified number of hamlet. only since no information was collected for the haJUlets in the Haryana State during the 1971-0ensus.
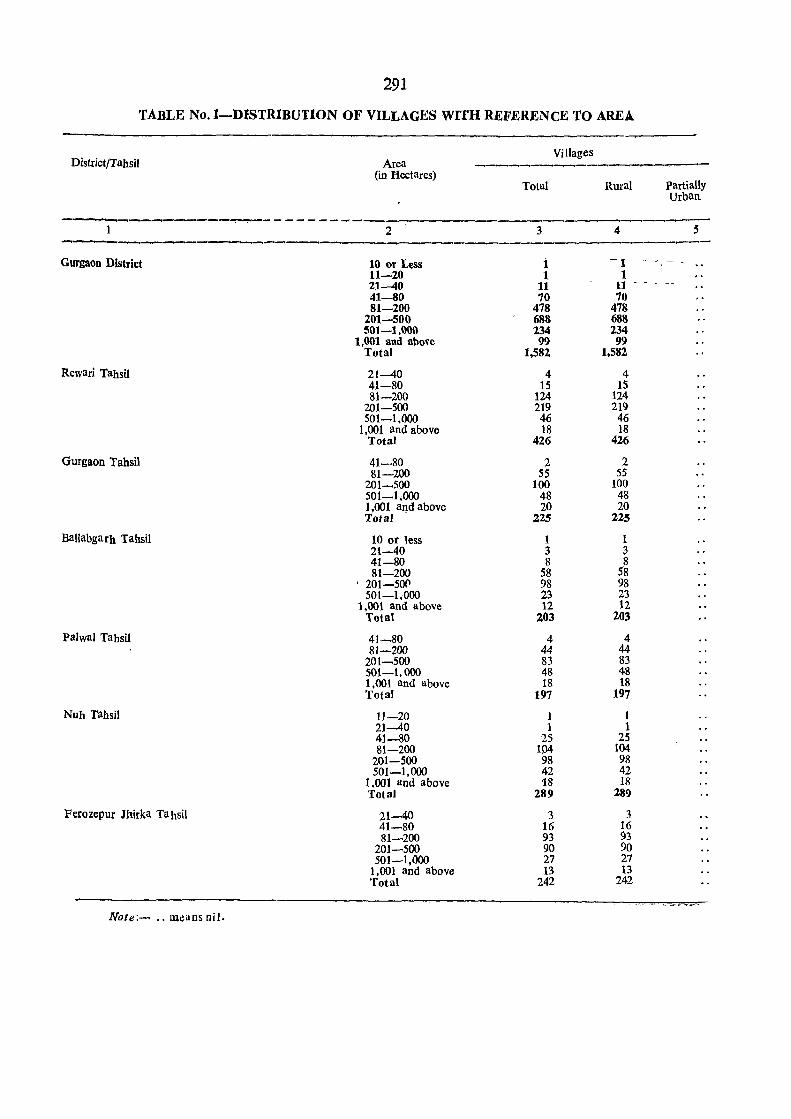
291
TABLE No.1-DISTRIBUTION OF VILLAGES WITH REFERENCE 1'0 AREA
District/Tahsil Villages
Area -~~--__,-------~-. ---(in Hectares)
partially Total Rural Urban
-- - - - - - - -----~-------------------1 2 3 4 5
-------------------------_.,_------~-----.---Gurgaon District 10 or Less 1 -1
11-20 1 1 21-40 11 11 - -41-80 70 70 81-200 478 478
201-500 688 688 501-1,000 234 234
1,001 and above 99 99 Total 1,582 1,582
Rewari Tahsil 21-40 4 4 41-80 15 15 81-200 124 124
201-500 219 219 501-1,000 46 46
1,001 and above 18 18 Total 426 426
Gurgaon Tahsil 41-80 2 2 81-200 55 5S
201-500 100 100 501-1,000 48 48 1,001 and above 20 20 Total 225 225
Ballabgarh Tahsil 10 or less 1 1 21-40 3 3 41-80 8 8 81-200 58 58
, 201-5{)(l 98 98 501-1,000 23 23
1,001 and above 12 12 Total 203 203
Palwal Tahsil 41-80 4 4 81-200 44 44
201-500 83 83 501-1,000 48 48 1,001 and above 18 18 Total 197 197
Nub Tahsil 11-20 1 1 21-40 1 1 41-80 25 25 81-200 104 104
201-500 98 98 501-1,000 42 42
1,001 and above 18 18 Total 289 289
Ferozepur Jhirka Tahsil 21-40 3 3 41-80 16 16 81-200 93 93
201-500 90 90 501-1,000 27 27
1.001 and above 13 13 Total 242 242
l'{ote:- .. llleans nil.
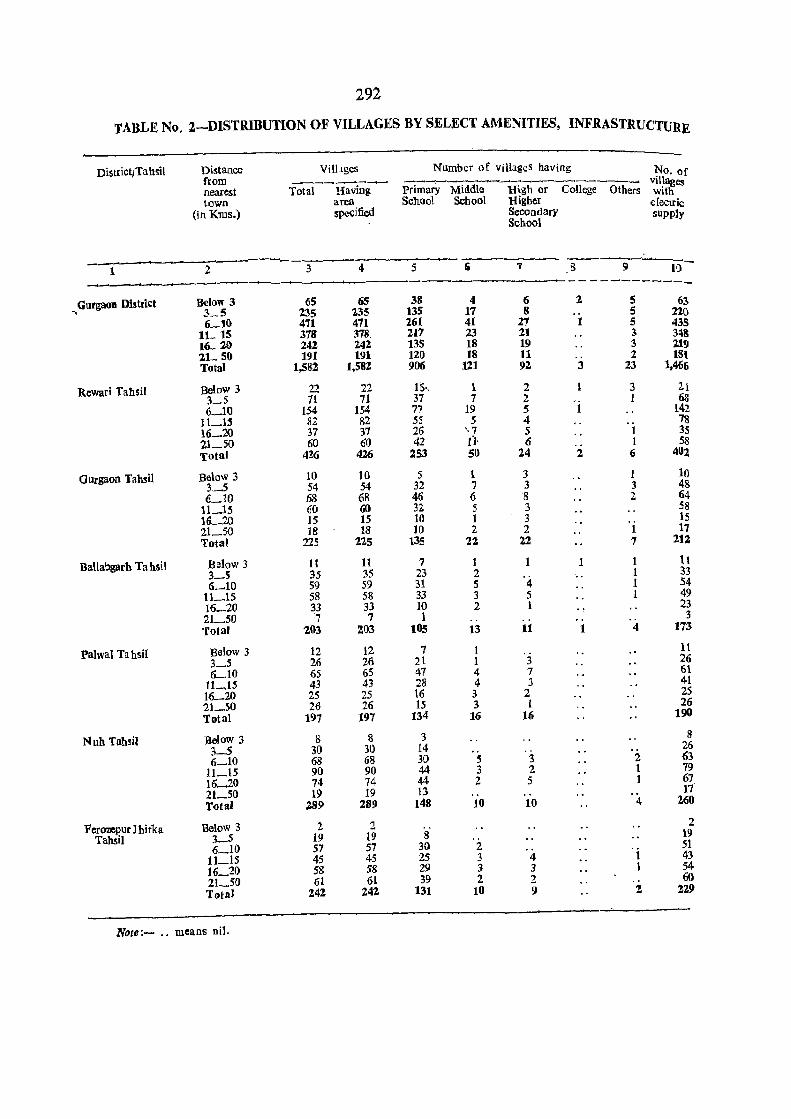
....
292
TABLE No.2-DISTRIBUTION OF VILLAGES BY SELECT AMENITIES~ INFRASTRUCTURE
District/Tahsil Distance from nearest town
(in Kms.)
2
ViIllges Number of villages having
------Total Having
area specified
Primary Middle Sch(101 Scbool
-~-------...-'-___'. 345
High~;- College - Oth~ Higher Secondary School
9
No, of villages with electric supply
-__.~,-+--~----I----- ,--~------------_--_-
GurgaoD District
Rewari Tahsil
Glllgaon Tahsil
Ballabgarh Ta hsil
Palwal Ta hsil
Nub Tahsil
Ferorepur Jhirka Tahsil
Below 3 3_5 6_10
11_ 15 16_ 20 21-50 Total
BeloW 3 3_5 6_10 ll~U 16_20 21_50 Total
Below 3 3_5 (LlO
11_15 HL20 21_50 Total
Below 3 3_5 6_10
11_15 16-20 21_50 T{)tal
Below 3 3_5 ILto 1l~15 16-20 21_50 Total
Below 3 3-5 6-10
11_15 16~20 21_50 Total
Below 3 3_5 6_10
11_15 16_20 21_50 Tota]
Note:- .. means nil.
65 235 471 378 242 191
1,532
22 71
154 82 37 60
426
10 54 68 ~O IS 11:1
225
If 35 59 58 33 7
1()3
12 26 65 43 25 26
197
S 30 68 90 74 19
289
2 19 57 45 58 61
242
6S 235 471 378, 242 191
1,582
22 71
154 82 37 60
426
10 54 68 60 15 18
225
H 35 59 58 33 7
203
12 26 65 43 2S 26
197
1\ 30 68 90 74 19
289
2 19 57 45 58 61
242
38 13S 261 217 13S 120 906
Hi·. 37 77 55 26 42
253
S 32 46 32 10 10
135
7 23 31 33 10 1
lOS 7
21 47 28 16 15
134
3 14 30 44 44 13
148
8 30 25 29 39
131
4 17 41 2J 18 18
121
1 7
19 5
'.J {I' 50
1 7 6 5 I 2
22
1 2 S 3 2
, ,
13
1 1 4 4-3 3
16
5 3 2
.. 10
2 3 3 2
10
6 8
27 21 19 11 92
2 2 5 4 5 6
24
3 3 8 3 3 2
22
'4 5 1
11
'j 7 .}
2 1
16
"
3 2 5
10
4 3 2 9
2
1.
3
,. 2
"
1
5 5 5 3 3 2
23
3 1
1 1 6
1 3 2
1 7
1 1 1 1
4
2 1 1
4
'i 1
" 2.
63 21.0 435 348 219 181
1,466
21 68
142 78 35 58
402
10 48 64 58 15 17
212
11 33 S4 49 23 3
173
11 26 61 41 25 26
190
8 26 63 79 67 17
260
2 19 51 43 54 60
229
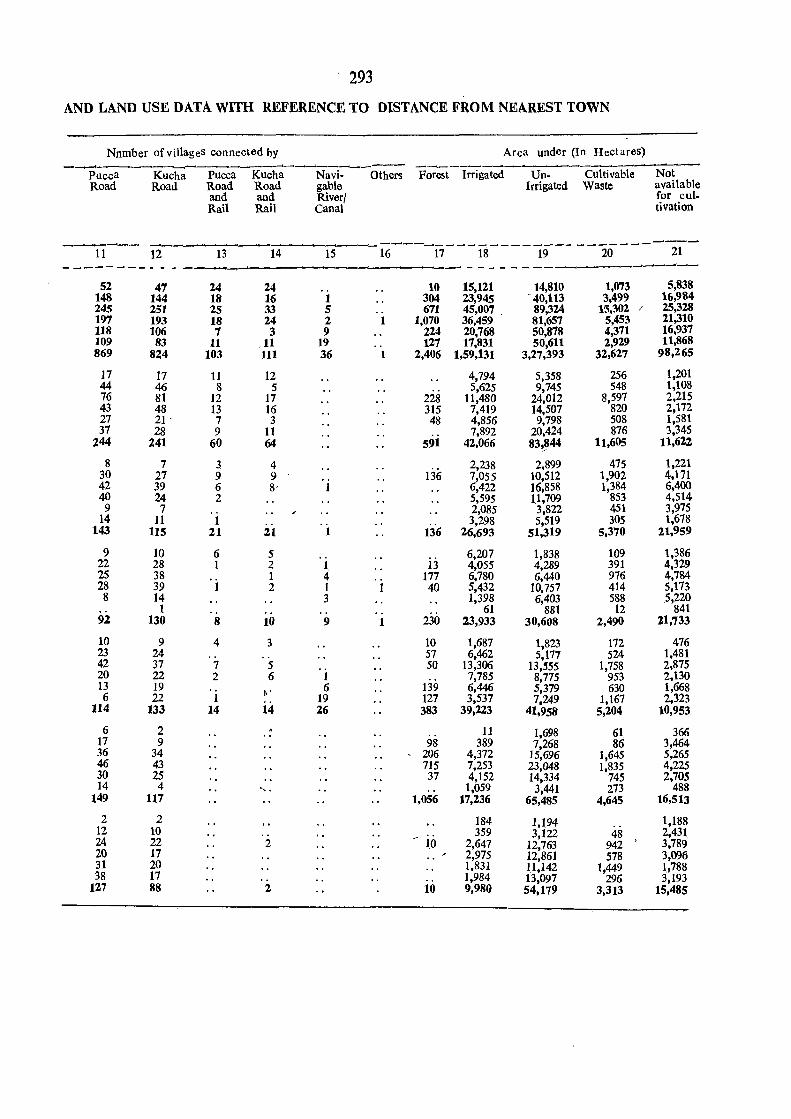
293
AND LAND USE DATA WITH REFERENCE TO DISTANCE FROM NEAREST TOWN
Nnmber of villages connected by Area under (In lIcctares) -____'---~ ~-------- ___'--
Pucca Kucha Pucca Kucha Navi- Others Forest Irrigated Un- Cultivable Not Road Road Road Road gable Irrigated Waste available
and and River{ for cul-Rail Rail Canal tivation
------ ~ -----------------------------11 12 13 14 15 16 17 18 19 20 21
-------------~------ ~----------~----~-~-----52 47 24 24 10 15,121 14,810 1,073 5,838
148 144 18 16 1 304 23,945 . 40,113 3,499 16,984 245 251 25 33 5 .. 671 45,007 . 89,324 15,302 / 25,328 197 193 18 24 2 1 1,070 36,459 81,657 5,453 21,310 118 106 7 3 9 224 20,768 50,878 4,371 16,937 109 83 11 .11 19 .. 127 17,831 50,611 2,929 11,868 869 824 103 111 36 1 2,406 1,59,131 3,27,393 32,627 98,265
17 17 11 12 4,794 5,358 256 1,201 44 46 8 5 5,625 9,745 548 1,108 76 81 12 17 228 11,480 24,012 8,597 2,215 43 48 13 16 315 7,419 14,507 820 2,172 27 21 . 7 3 48 4,856 9,798 508 1,581 37 28 9 11 7,892 20,424 876 3,345
244 241 60 64 591 42,066 83,.!I44 11,605 11,622
8 7 3 4 2,238 2,899 475 1,221 30 27 9 9 136 7,055 10,512 1,902 4,171 42 39 6 8' 1 6,422 16,858 1,384 6,400 40 24 2 5,595 11,709 853 4,514
9 7 2,085 3,822 451 3,975 14 11 1 3,298 5,519 305 1,678
143 115 21 21 1 136 26,693 51,319 5,370 21,959
9 10 6 5 6,207 1,838 109 1,386 22 28 1 2 1 ij 4,055 4,289 391 4,329 25 38 1 4 177 6,780 6,440 976 4,784 28 39 1 2 1 1 40 5,432 10,757 414 5,173 8 14 3 1,398 6,403 588 5,220
1 .. . . .. 61 881 12 841 92 130 8 10 9 1 230 23,933 30,608 2,490 21.733
10 9 4 3 10 1,687 1,823 172 476 23 24 57 6,462 5,177 524 1,481 42 37 7 5 50 13,306 13,555 1,758 2,875 20 22 2 6 1 7,785 8,775 953 2,130 13 19 6 139 6,446 5,379 630 1,668 6 22 1 b'
19 127 3,537 7,249 1,167 2,323 114 133 14 14 26 383 39,223 41,958 5,204 10,953
6 2 . 11 1,698 61 366 " 17 9 98 389 7,268 86 3,464 36 34 , 206 4,372 15,696 1,645 5,265 46 43 715 7,253 23,048 1,835 4,225 30 25 37 4,152 14,334 745 2,705 14 4 ' .. .. 1,059 3,441 273 488
149 117 1,056 17,236 65,485 4,645 16,513
2 2 184 1,194 1,188 12 10 .. 359 3,122 48 2,431 24 22 2 - i6 2,647 12,763 942 3,789 20 17 2,975 12,861 578 3,096 31 20 1,831 11,142 1,449 1,788 38 17
" 1,984 13,097 296 3,193 127 88 2 10 9,980 54,179 3,313 15.485
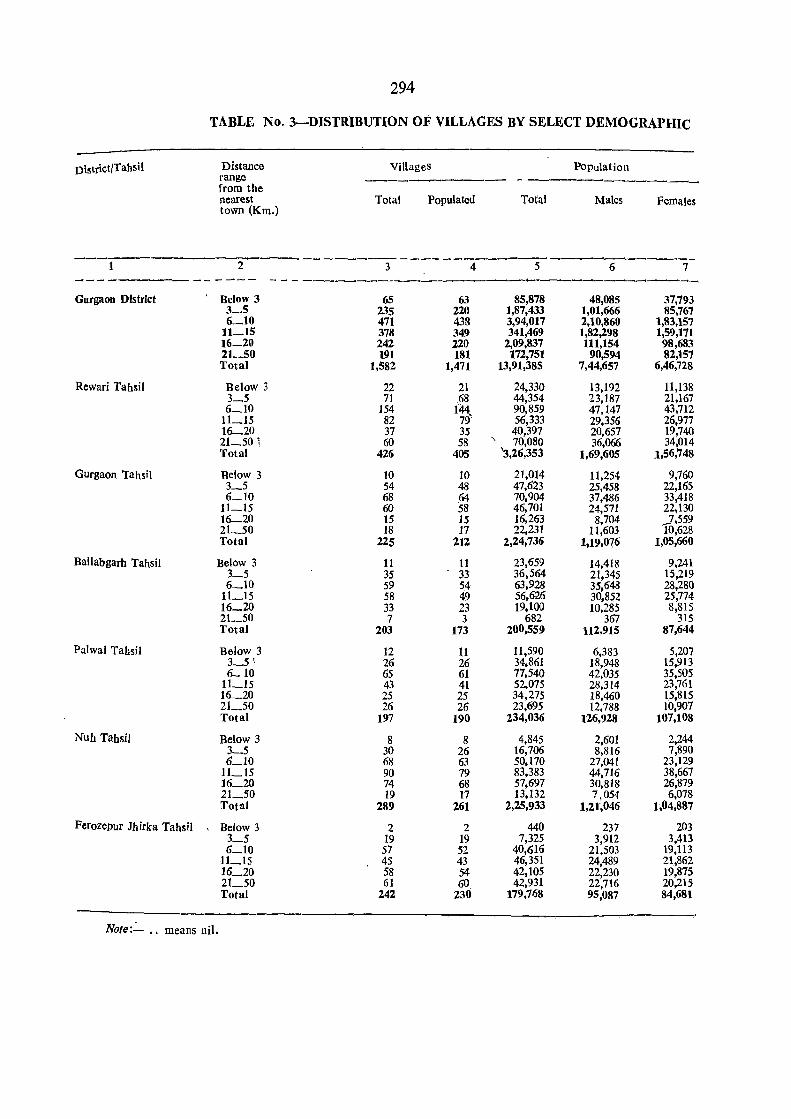
294
TABLE No.3-DISTRIBUTION OF VILLAGES BY SELECT DEMOGRAPHIC
District/Tahsil Distance Villages Population range - ------------from the nearest Total Populated Total Males Females town (Kill.)
_---_ -_ ---------- ----------------1 2 3 4 5 6 7
----------------- - - - -------------------Gurgaon District Below 3 6S 63 85,878 48,085 37,793
3~5 235 220 1,87,433 1,01,666 85,767 6_10 471 438 3,94,017 2,10,860 1,83,157 11~15 378 349 341,469 1,82,298 1,59,171 16_20 242 220 2,09,837 111,154 98,683 21_50 191 181 172,751 90,594 82,157 Total 1,582 1,471 13,91,385 7,44,657 6,46,728
Rewari Tahsil Below 3 22 21 24,330 13,192 11,138 3_5 71 68 44,354 23,187 21,167 6_10 154 1'44. 90,859 47,147 43,712
11_15 82 79 56,333 29,356 26,977 16-20 37 35 40,397 20,657 19,740 21_501 60 58 " 70,080 36,066 34,014 Total 426 405 '3,26,353 1,69,605 1,56,748
GUrgaon Tahsil Below 3 10 10 21,014 11,254 9,760 3_5 54 48 47,6'23 25,458 22,165 6_10 68 64 70,904 37,486 33,418
11_15 60 58 46,701 24,571 22,130 16-20 15 15 16,263 8,704 _7,559 21_50 18 17 22,231 11,603 10,628 Total 225 2IZ 2,24,736 1,19,076 1,05,660
Ballabgarh Tahsil Below 3 11 11 23,659 14,418 9,241 3_5 35 33 36,564 21,345 15,219 6_10 59 54 63,928 35,648 28,280
11_15 58 49 56,626 30,852 25,774 16_20 33 23 19,100 10,285 8,815 21_50 7 3 682 367 315 Total 203 173 200,559 112,915 87,644
Palwal Tahsil Below 3 12 11 11,590 6,383 5,207 3_5 1 26 26 34,861 18,948 15,913 6-10 65 61 77,540 42,035 35,505
11_15 43 41 52,075 28,314 23,761 16_20 25 25 34,275 18,460 1.5,815 21_50 26 26 23,695 12,788 10,907 Total 197 190 234,036 126,928 107,108
Nuh Tahsil Below 3 8 8 4,845 2,601 2,244 3_5 30 26 16,706 8,816 7,890 6'_10 68 63 50,170 27,041 23,129
11_15 90 79 83,383 44,716 38,667 16_20 74 68 57,697 30,818 26,879 21_50 19 17 13,132 7,054 6,078 Total 289 261 2,25,933 1,21,046 1,04,887
Ferozepur Jhirka Tahsil , Below 3 2 2 440 237 203 3_5 19 19 7,325 3,912 3,413 6_10 57 52 40,616 21,503 19,113
11_15 45 43 46,351 24,489 21,862 16_20 58 54 42,105 22,230 19,875 21_50 61 60 42,931 22,716 20,215 Total 242 230 179,768 95,087 84,681
Note::__ .. means nil.
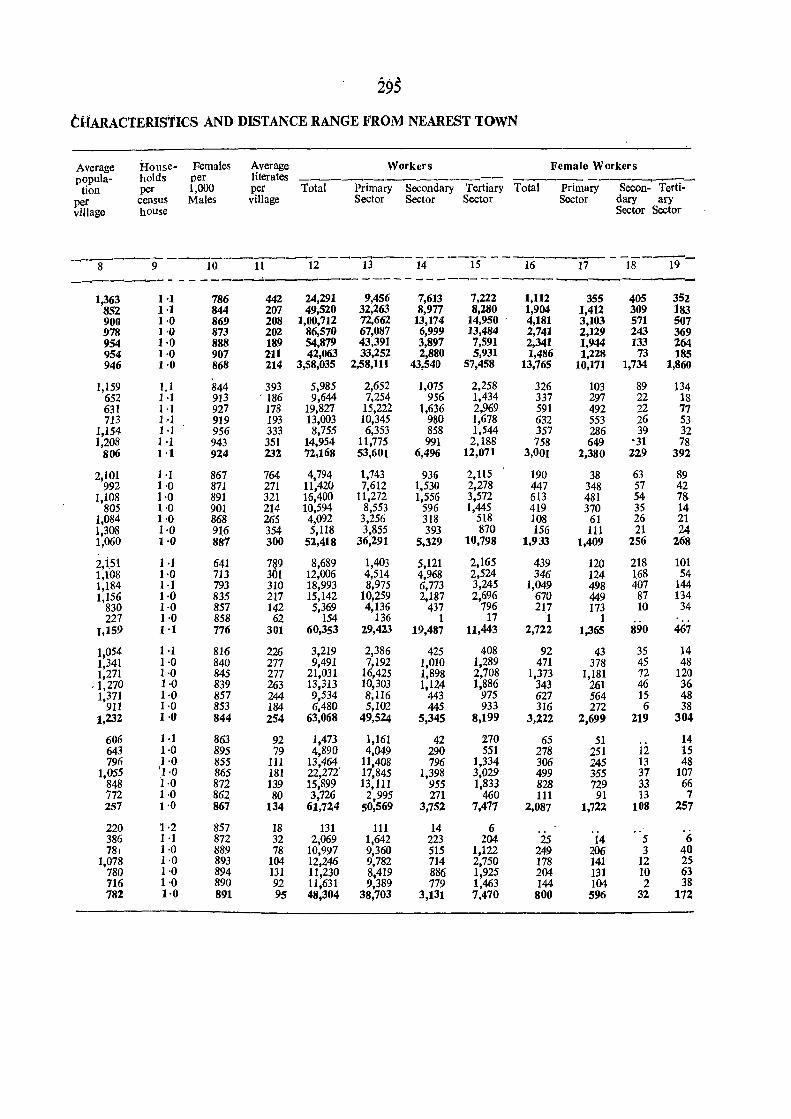
295
tHARACTERISTICS AND DISTANCE RANGE FROM NEAREST TOWN
Average House- Females Average Workers Female Workers popula- holds per literates
tion per 1,000 per Total Primary Secondary Tertiary Total Primary Secon- Terti-per census Males village Sector Sector Sector Sector dary ary village house Sector Sector
-----------~-.. - - - - -_-- - -------~- - ----_ 8 9 10 11 12 13 14 15 16 17 18 19
__ __..o--...... ---------.:.----.... ...... --- - - - - - -_ --. _"_---------1,363 1·1 786 442 24,291 9,456 7,613 7,222 1,112 355 405 352
852 1·1 844 207 49,520 32,263 8,977 8,280 1,904 1,412 309 183 900 1·0 869 208 1,00,712 72,662 13,174 14,950 . 4,181 3,103 571 507 978 1·0 873 202 86,570 67,087 6,999 13,484 2,741 2,129 243 369 954 1·0 888 189 54,879 43,391 3,897 7,591 2,341 1,944 133 264 954 1·0 907 211 42,063 33,252 2,880 5,931 1,486 1,228 73 185 946 1·0 868 214 3,58,035 2,58,111 43,540 57,458 13,765 10,171 1,734 1,860
1,159 1.1 844 393 5,985 2,652 1,075 2,258 326 103 89 134 652 1 ·1 913 . 186 9,644 7,254 956 1,434 337 297 22 18 631 1 ·1 927 178 19,827 15,222 1,636 2,969 591 492 22 77 713 1 ·1 919 193 13,003 10,345 980 1,678 632 553 26 53
1,154 1 ·1 956 333 8,755 6,353 858 1,544 357 286 39 32 1,208 1 ·1 943 351 14,954 11,775 991 2,188 758 649 -31 78
806 1·1 924 232 72,168 53,601 6,496 12,071 3,001 2,380 229 392
2,101 1-1 867 764 4,794 1,743 936 2,115 190 38 63 89 992 1·0 871 271 11,420 7,612 1,530 2,278 447 348 57 42
1,108 1·0 891 321 16,400 11,272 1,556 3,572 613 481 54 7& 805 1·0 901 214 10,594 8,553 596 1,445 419 370 35 14
1,084 1'0 868 265 4,092 3,256 318 518 108 61 26 21 1,308 1·0 916 354 5,118 3,855 393 870 156 111 21 24 1,060 1·0 887 300 52,418 36,291 5,329 10,798 1,933 1,409 256 268
2,i51 1-1 641 7~9 8,689 1,403 5,121 2,165 439 120 218 101 1,108 1·0 713 3 1 12,006 4,514 4,968 2,524 346 124 168 54 1,184 1 ·1 793 310 18,993 8,975 6,773 3,245 1,049 498 407 144 1,156 1·0 835 217 15,142 10,259 2,187 2,696 670 449 87 134
830 1·0 857 142 5,369 4,136 437 796 217 173 10 34 227 1 ·0 858 62 154 136 1 17 1 1
1,159 1'1 776 301 60,353 29,423 19,487 11,443 2,722 1,365 890 467
1,054 1 ·1 816 226 3,219 2,386 425 408 92 43 35 14 1,341 1 ·0 840 277 9,491 7,192 1,010 1,289 471 378 45 48 1,271 1·0 845 277 21.031 16,425 1,898 2,708 1,373 1,181 72 120
,1,270 1·0 839 263 13.313 10,303 1,124 1,886 343 261 46 36 1,371 1·0 857 244 9,534 8,116 443 975 627 564 15 48
911 1·0 853 184 6,480 5,102 445 933 316 272 6 38 1,232 1·0 844 254 63,068 49,524 5,345 8,199 3,222 2,699 219 304
606 1 ·1 863 92 1,473 1,161 42 270 65 51 14 643 1·0 895 79 4,890 4,049 290 551 278 251 12 15 796 1·0 855 111 13,464 11,408 796 1,334 306 245 13 48
1,055 \1·0 865 181 22,272' 17,845 1,398 3,029 499 3,55 37 107 848 '1·0 872 139 15,899 13,111 955 1,833 828 729 33 66 772 1·0 862 80 3,726 2,995 271 460 III 91 13 7 257 1·0 867 134 61,724 50,569 3,752 7,477 2,087 1,722 108 257
220 1·2 857 18 131 111 14 6 386 1 ·1 872 32 2,069 1,642 223 204 25 14 5 6 781 1·0 889 78 10,997 9,360 515 1,122 249 206 3 40
1,078 1·0 893 104 12,246 9,782 714 2,750 178 141 12 25 780 1·0 894 131 11,230 8,419 886 1,925 204 131 10 63 116 1'0 890 92 11,631 9,389 779 1,463 144 104 2 38 782 1·0 891 95 48,304 38,703 3,131 7,470 800 596 32 172
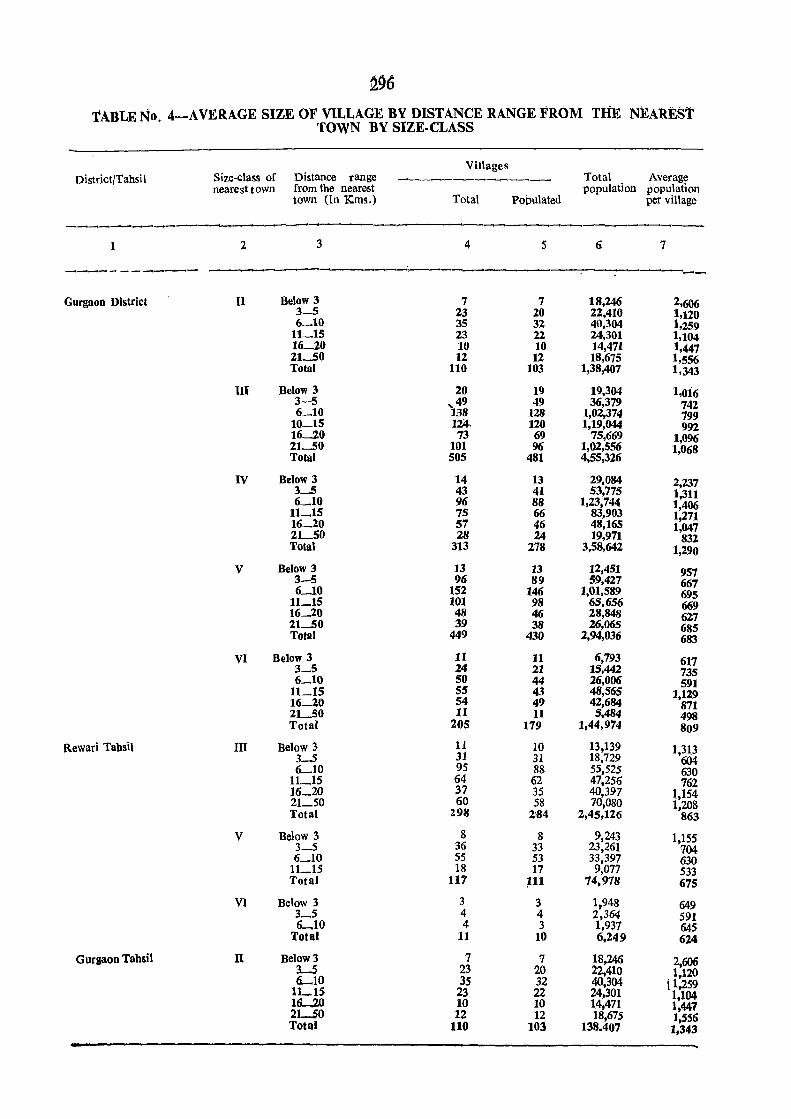
~9()
TABLE No.4-AVERAGE SIZE OF VILLAGE BY DISTANCE RANGE FROM THE NEAREST TOWN BY SIZE-CLASS
Villages District/Tahsil Size-class of Distance range --.-_...------ Total Average
nearest town from the nearest population population town (In Kms.) Total Populated per village
----- -~~--
1 2 3 4 5 6 7
--------- ~-Gurgaoo District II Below 3 7 7 18,246 2,606
3_5 23 20 22,410 1,120 6_10 35 32 40,304 1,259
11_15 23 22 24,301 1,104 16_20 10 10 14,471 1,447 21~50 12 12 18,675 1,556 Total 110 103 1,38,407 1,343
III Below 3 20 19 19,304 1,016 3-5 ,49 49 36,379 742 6_10 1.38 128 1,02,374 799
10_15 124, 120 1,19,044 992 16_20 73 69 75,669 1,096 21_50 101 96 1,02,556 1,068 Total 505 481 4,55,326
IV Below 3 14 13 29,084 2,237 L.5 43 41 53,775 1,311 6_10 96 88 1,23,744 1,406
11_15 75 66 83,903 1,271 16_20 57 46 48,165 1,047 21_50 28 24 19,971 832 Total 313 278 3,58,642 1,290
V Below 3 13 13 12,451 957 3-5 96 89 59,427 667 6_10 152 146 1,01,589 695
11_15 101 98 65,656 669 16-20 48 46 28,848 627 21-50 39 38 26,065 685 Total 449 430 2,94,036 683
VI Below 3 11 11 6,793 617 3_5 24 21 15,442 735 6_10 50 44 26,006 591
11_15 55 43 48,565 1,129 16--10 54 49 42,684 871 21_50 11 11 5,484 498 Total 205 179 1,44,974 809
Rewari Tahsil III Below 3 11 10 13,139 1,313 3_5 31 31 18,729 604 6_10 95 88 55,525 630
11_15 64 62 47,256 762 16-20 37 35 40,397 1,154 21_50 60 58 70,080 1,208 Total 2.98 2184 2,45,126 863
V BeloW 3 8 8 9,243 1,155 3_5 36 33 23,261 704 6_10 55 53 33,397 630
11_15 18 17 9,077 533 Total 117 ~1l 74,978 675
VI Below 3 3 3 1,948 649 3_5 4 4 2,364 591 6-,10 4 3 1,937 645
Total 11 10 6,249 624
Gurgaon Tahsil n Below 3 7 7 18,246 2,606 L.5 23 20 22,410 1,120 6-10 35 32 40,304 [ 1,259
11_15 23 22 24,301 1,104 llL.2O 10 10 14,471 1,441 21--50 12 12 18,675 1,556 Total 110 103 138.407 1,343
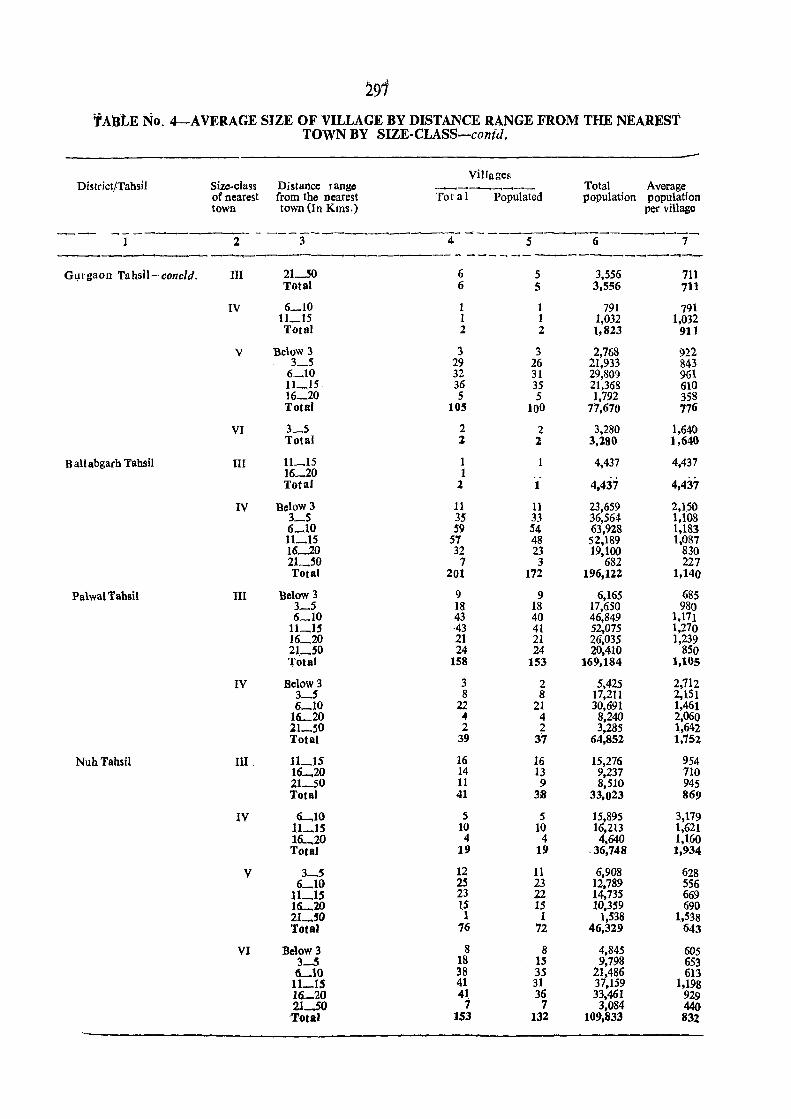
291 TABLE No.4-AVERAGE SIZE OF VILLAGE BY DISTANCE RANGE FROM THE NEAREST
TOWN BY SIZE-CLASS-contd.
Villages District/Tahsil Size-class Distance r angc
--~----Total Average
of nearest from the nearest Total Populated population population town town (In Kms.) per village
---------------------- - -:-- ~-----------2 3 4 5 6 7
----------- - --- - -----------~--Gl}rgaon Tahsll-concld. III 21_.50 6 5 3,556 711
Total 6 5 3,556 711
IV 6_10 1 1 791 791 11_15 1 1 1,032 1,032 Total 2 2 1,823 911
V Below 3 3 3 2,768 922 3_5 29 26 21,933 843
6_10 32 31 29,809 961 11_15. 36 35 21,368 610 16_20 .5 5 1,792 358 Total 105 100 77,670 776
VI 3_5 2 2 3,280 1,640 Total 1 2 3,280 1,640
BaUabgarh Tahsil III 11_15 1 4,437 4,437 16_20 1 .'
4,437 Total 2 1 4,437
IV Below 3 11 11 23,659 2,150 3_5 35 33 36,564 1,108 6_10 .59 .54 63,928 1,183 11_15 57 48 52,189 1,087 Hi_20 32 23 19,100 830 21_50 7 3 682 227 Total 201 172 196,122 1,140
Palwal Tahsil III Below 3 9 9 6,165 685 3_5 18 18 17,650 980 6_10 43 40 46,849 1,171
11_15 ·43 41 52,075 1,270 16_20 21 21 26,035 1,239 21._50 24 24 20,410 850 Total 158 153 169,184 1,105
IV Below 3 3 2 5,425 2,712 3_5 8 8 17,211 2,151 6_10 22 21 30,691 1,461
lL20 .of 4 8,240 2,060 21_50 2 2 3,285 1,642 Total 39 37 64,852 1,752
Nuh Tahsil III 11_15 16 16 15,276 954 16....,20 14 13 9,237 710 21-50 11 9 8,510 945 Total 41 38 33,023 869
IV 6....,10 5 5 15,895 3,179 11_1S 10 10 16,213 1,621 16._20 4 4 4,640 1,160 Total 19 19 .36,748 1,934
V 3_5 12 11 6,908 628 6_10 25 23 12,789 556 ll~IS 23 22 14,735 669 lL20 1.5 15 10,359 690 21_50 1 1 1,538 1,538 Total 76 72 46,329 643
VI Below 3 8 8 4,845 605 3-5 18 IS 9,798 653 (LI0 38 35 21,486 613
11_15 41. 31 37,159 1,198 16-20 41. 36 33,461 929 21_50 7 7 3,084 440
'Total 153 132 109,833 832
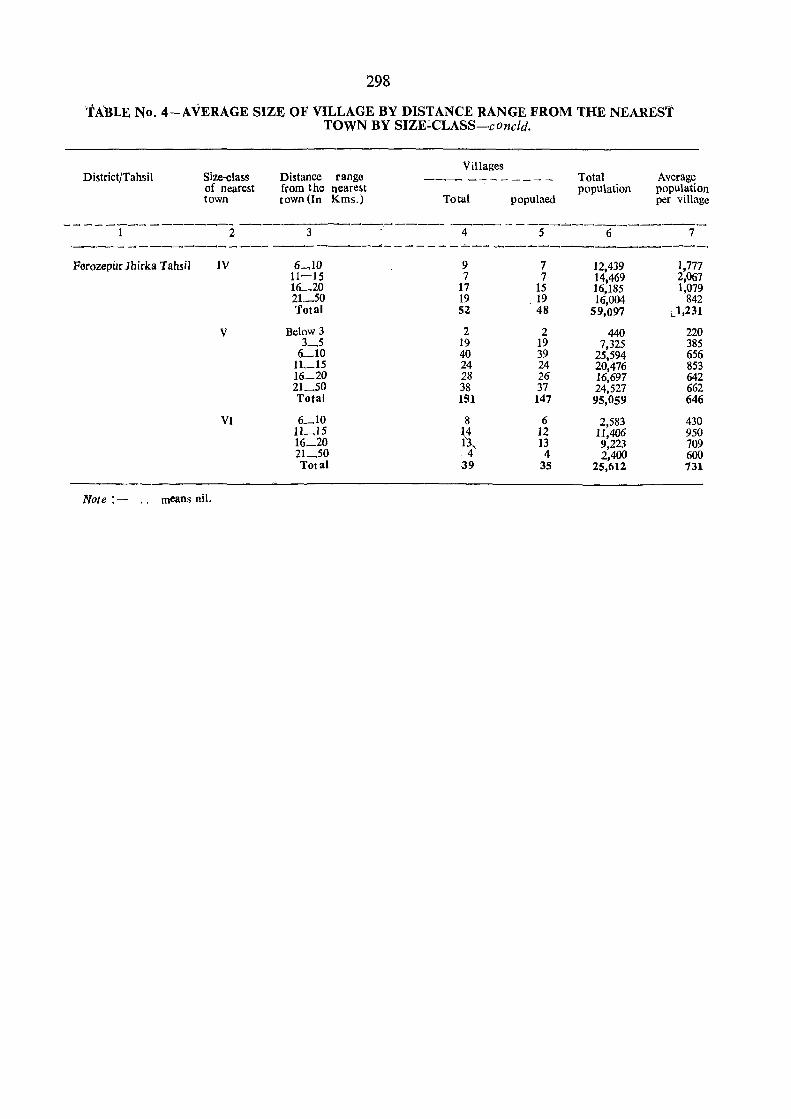
298
TABLE No.4-AVERAGE SIZE OF VILLAGE BY DISTANCE RANGE FROM THE NEAREST TOWN BY SIZE~CLASS-concld.
District/Tahsil Size-class of nearest town
Distance range from the nearest town (In Kms.)
Villages
Total populaed
Total population
Average population per village
.---------------------------~-------~--~-~~------------~--
Ferozepur Jhirka Tahsil IV
V
VI
Note: - " mcans nil.
6~1O 1l~15
16-20 21_50 Total
Below 3 3_5
6_10 11_15 16_20 21_50 Total
6_10 11_15 16_20 21_50 Total
9 7
17 19 52
2 19 40 24 28 38 151
8 H 1~
4 39
7 7
15 19 48
2 19 39 24 26 37
147
6 12 13
4 35
12,439 14,469 16,185 16,004
59,097
440 7,325
25,594 20,476 16,697 24,527 95,059
2,583 11,406 9,223 2,400
25,612
1,777 2,067 1,079
842 L1,231
220 385 656 853 642 662 646
430 950 709 600 731
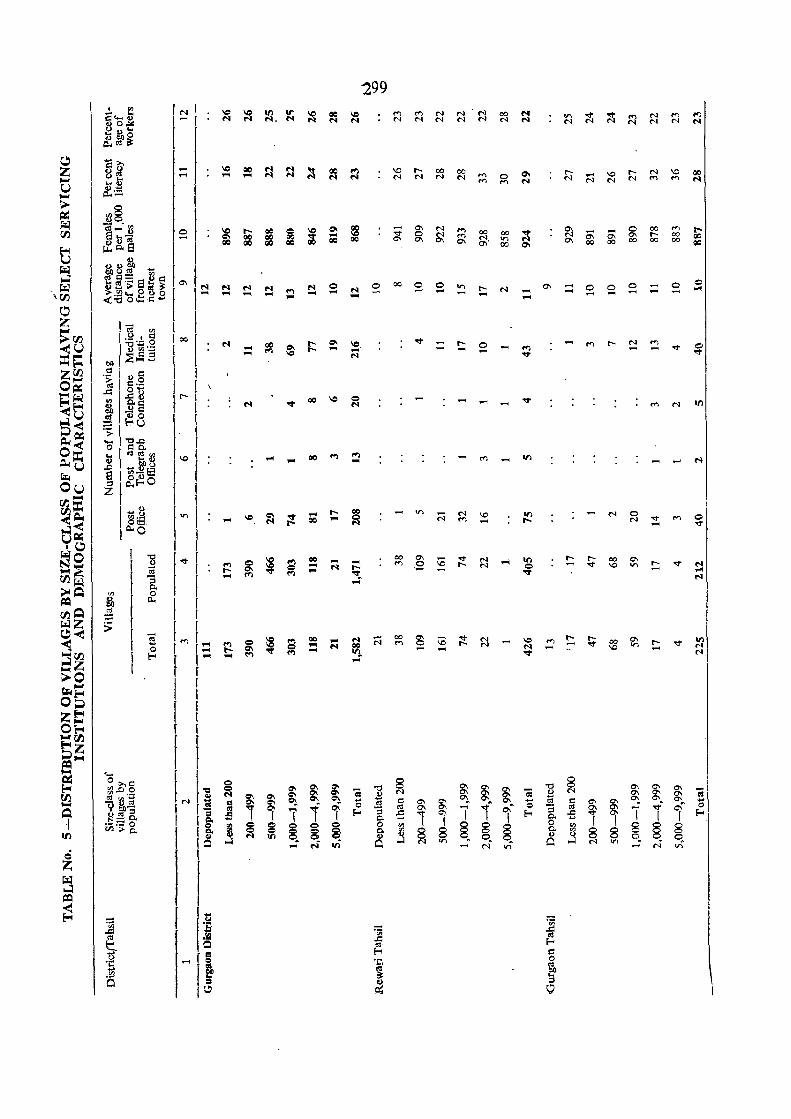
299
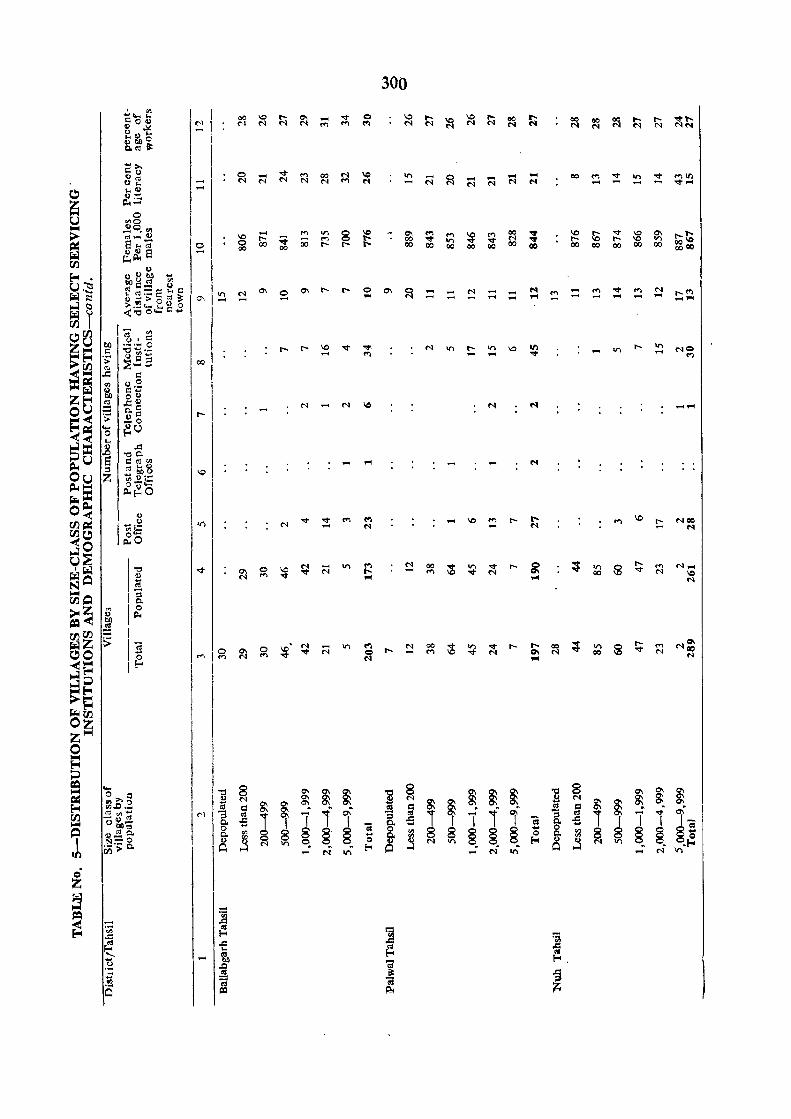
300
, '" I I ........... 00 \0 r-- gj .... "'" Q \0 ~ \0 !=:i 00 .... 00 00 r-- r-- "'"t-C::O~ \0 00 Q ~ I~ I <'l N N M M C') <'l N <'l <'l N N N N N N "1<'1 <:> .... ll~o Q, Ol a: I I .... >, QU 0 .... "'" '" eo <'l \0 '" ....
~ .... ... eo M "'" '" "'" "'10 OJ", - <'l <'l <'l N <'l M N <'l .... c::l N N - ","'" 0 .... <'l
C ... ~ ....
~ ~= 0 I I u rIlO
Ioooi ~O.'"
1
01 .... M I/') 8 \0 ,. a- M eo "'" \0 r-- "'" ~ a- r--t-~
crt..., ... \0 r-- .... ..... M t- eo '<t" M ~ '" N "'" r-- \0 r-- I/')
8 ... -;;' 0 00 "'" 00 r-- r-- t- oo 00 '" "'" 00 00 00 00 00 00 Ie eo eo 00 00 00 00 00 0000
~ ~~e -I 00.
... O~.... I I ~. b.Qu('3 rn
u:~ Q- ... Q
"'" N o;"'-S"'C:: N a- 0 CT\ r-- r-- a- ~ - ..... N .... .... N M - M .... r--C')
~:::: li ~'> 0 3 ~ 10\ I ~ .... .... ... .... .... - .... .... ... .... - .... .... ....... ~r ~;;;'Oc!;'c::2
r'2 '" I coo. (j , c:: z~ bO ;a-=.S I r-- r-- \0 "'" "'" N oro r-- oro \0 III I/') r-- '" NQ
>~ I:::
~;g'5 001 - C') - "'" ....
<'l '> ~; '" ~~ I .I:l .... § '" z~ ~
c: .... ~ _g~ I N .... N Ie N N .... ... OU ~ o.§ r--
~~ .20 .... ~o 0
.... .8 .d
Su -00. S dOlUl
IIC .... ... .... N
~ :::s Ol .......
Ou z ~ :.~ ~-:=: ~Ioooi ~~o
~= I I ~~ I OJ <:> I.,., "'" "'" M C') .... \0 M r-- t- M 10 r-- NOO
I<;;jS N .... N .... N .... N OOC ~o <0 ~~ I.", :; r--y~ <'l .... I/') ~ ~ 00 ~
I/') "'" r-- 0 oro g M N ... "<f- a- 0 ~ "'" N M "'" N 01 00 "'" N Ie ~~ I! N .... ... ... N
~~ 1&
~~ ,~
Ice I Q bO
0000. ~ I
IMI~ ~z :> I~ . ~ .... on C') ~ 00 I! I/') ~ r-- t- oo :; oro g r-- M Na-
CO gj 0 \0 N Q t- M
"'" N a- N 00 "'" N 00 M "'" N ... N
<E= 1£-0
I I
~~
I ~~ I ~~ I Zloooi 0 H ~
I = .... ~ 8 ~ ~ 8 a-
~ ; -0 a-
~" ~ 1 ~ ~ ~ o = *
CI\ N N ~ ",,""0
10
'
~ ~ 0\
~ ~ a-
~ ~ f.f.J.&J ._ t:: ,. t::
f 01" Ol ~ 0\ .
~ cd r/)"'" "3 0:1 i 1 i "3 0:1 , .... "3 i ....
~" 00. o~.; 0. .d [ 0. .d I I 'i Q, £ [ 1-~ .... 'iii ....
0 §~ ~ 0 8 ~ § 0
~ 8 §" § § 0' rIl
~ ~ § ... "'0. Q, '" 0 8 .... ~
~ Q,
'" ~
-0 Q ~ ~ q = ~ oro Eo< Q ~ ~~o. ~ on Eo; N"
.f-o ..... N oro - on .... N If)
o· Z ;j
~ .= ~
.... ';i; ~ =-a .d
~ .I:l ~ 'i ~ Eo< ~ c; £-0, ~ I~ ~
~ ~ -; -; (5 I:I:l ~
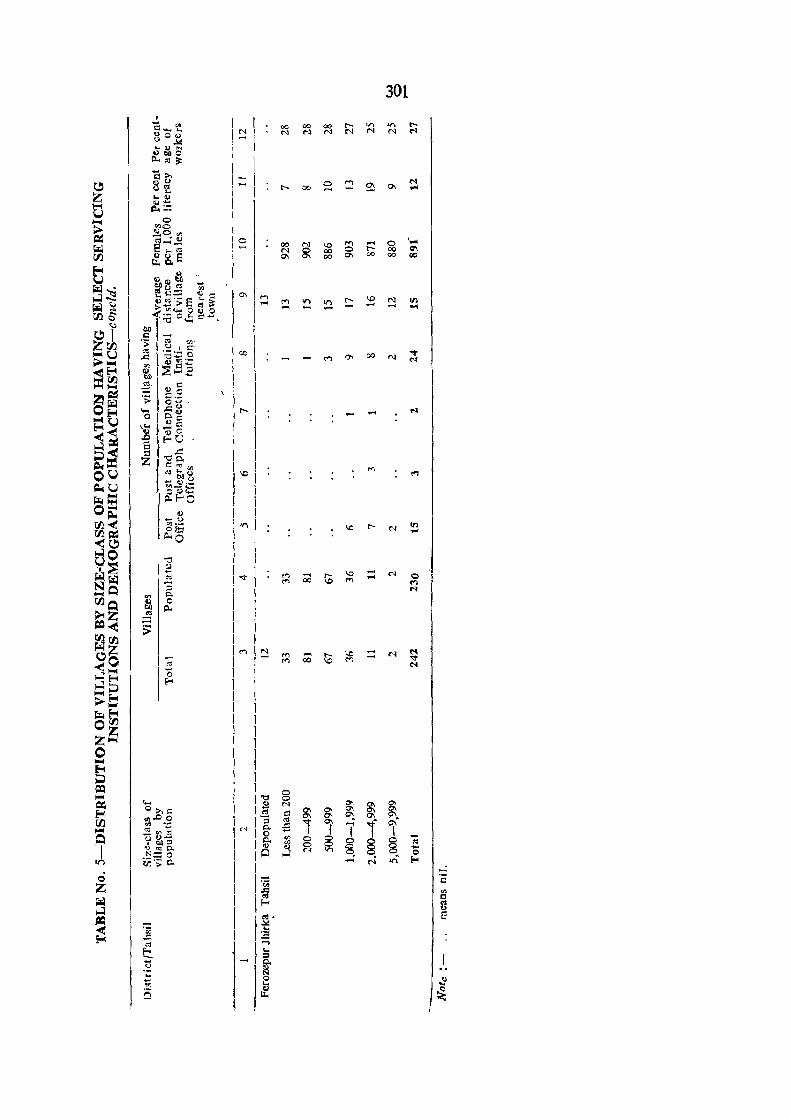
I I I ~ I i I
I I I::: I I I
I 1
121 I I
·1 I
30t
10,1..., I 1- ~ V"l VI ~ ~ ~ ~
1 1 1 I I co I
\ \
1 I I r-- I I I I Ie I I I I 1 ! ! I 1 1 V) I
I I \ I I '<:I" I ! I I \ I I I I I , I I
.... -
~ 00 to ~ = r-1 ~ Ii IN
I~'N ~ _ ~ _ N 1 ,- M 00 ~ CTl - N ..,.
lIN I I , I , , I 1
I 1 I 1 I , I I 1 1 1 l'g 8 1 ,-; M 0\ ~ ~ ~ 1 - c: 0\ ~ "'. y, ~, IN!%S l! '"" i Oi
I Ifr~~~§§§~ I I Q _" • • t.... , 1 M 11"\ '""'
I I:::: I I~ I f!
'
I 0: •
~ I .<:
-I; l ~ ~ ,
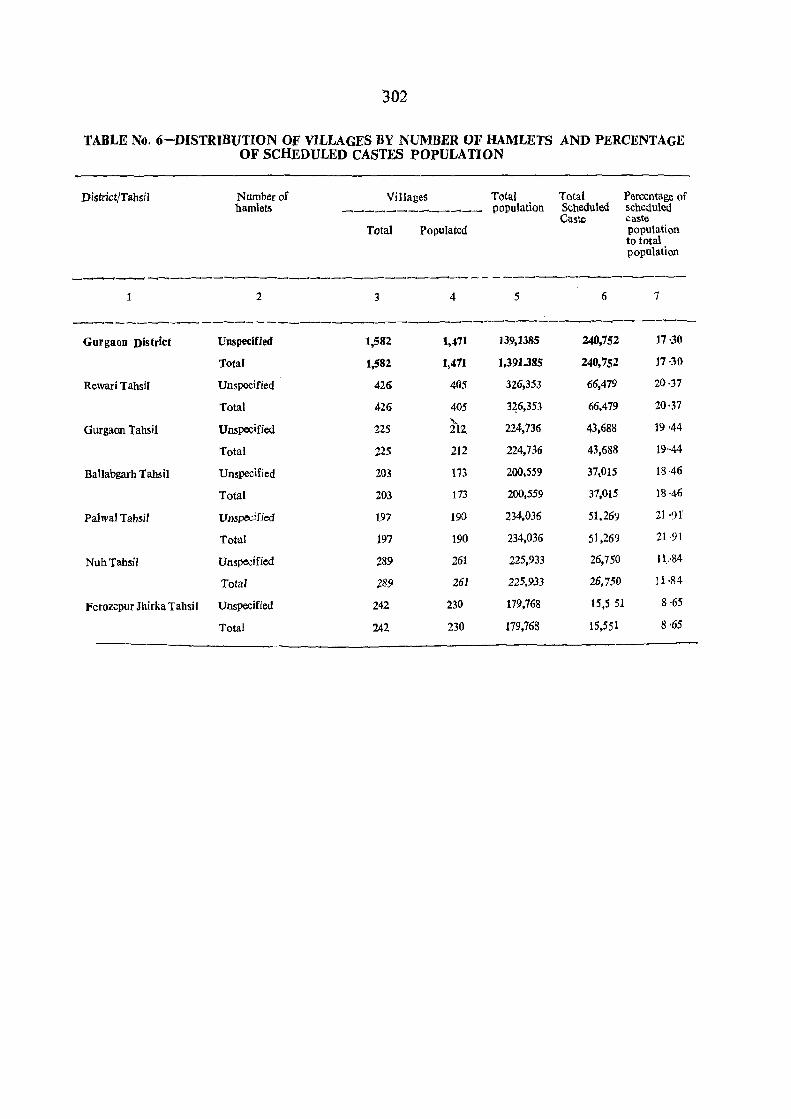
302
TABLE No.6-DISTRIBUTION OF VILLAGES BY NUMBER OF HAMLETS AND PERCENTAGE OF SCHEDULED CASTES POPULA lION
District/Tahsil Number of Villages Total Total Percentage of hamlets -------------- population SCheduled scheduled
Caste caste Total Populated population
to total population
------------------------------~-- - ------~-~--~---2 :; 4 5 6 7
------------------- ----.----------~--
GurgaoD District Unspecified 1,582 1,471 139,1385 240,752 17-30
Total 1,582 1,471 1,391.385 240,752 17 -30
Rewari Tahsil Unspecified 426 405 326,353 66,479 20-37
Total 426 405 3~6,353 66,479 20-37
Gurgaon Tahsil Unspecified 225 ilz. 224,736 43,688 19 -44
Total .225 212 224,136 43,688 19·-44
Ballabgarh Tahsil Unspecified 203 173 200,559 37,015 18 ·46
Total 203 173 200,559 37,015 18-46
Palwal Tahsil Unspecified 197 190 234,036 51,269 21 -')1'
Total 197 190 234,036 51,269 21 ·91
NuhTahsil Unspecified 289 261 225,933 26,750 11.-84
Total 289 261 225,933 26,750 11-84
Ferozepur Jhirka Tahsil Unspecified 242 230 179,768 15,5 51 8·65
Total 242 230 179,768 15.551 8-65
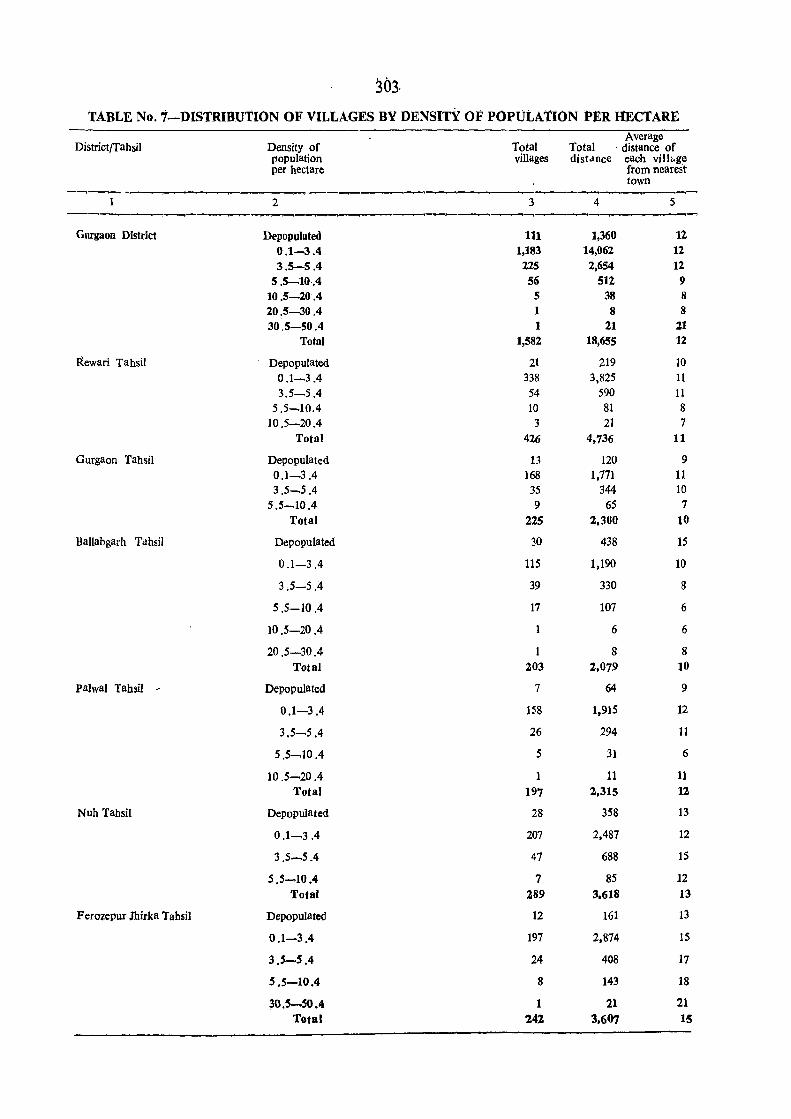
303 TABLE No.7-DISTRIBUTION OF VILLAGES BY DENSITY OF POPULATION PER HECTARE
Average District/Tahsil Density of Total Total . distance of
population villages dist.tnce each village per hectare from nearest'
town ----.~-,
~---__ _,,_.,.-,-.,-.- ~__,-.
2 3 4 5 --..--------,_ Gurgaon District Depopulated 111 1,360 12
O.I~3.4 1,183 14,062 12 3.5-5.4 225 2,654 12 5.S~10.4 56 512 9 10.5~20.4 5 38 8 20.5~30A 1 8 8 30,5-5004 1 21 11
Total 1,581 18,655 12
Rewari Tahsil Depopulated 21 219 10 0.1-3.4 338 3,825 11 3.5-5.4 54 590 11 5.5~10.4 10 81 8 1O.5~20.4 3 21 7
Total 426 4,736 11
Gurgaon Tahsil Depopulated 13 120 9 0.1~3 .4 168 1,771 11 3.5~5 .4 35 344 10 5.5~10.4 9 65 7
Total 225 2,300 10
Ballabgarh Tahsil Depopulated 30 438 15
0.1-3.4 115 1,190 10
3.5-5.4 39 330 8
5.5-10 .4 17 107 6
10.S~20.4 6 6
20.5~30.4 1 8 8 Total 203 2,079 10
palwal Tahsil ~ Depopulated 7 64 9
0.1-3.4 158 1,915 12
3.5-5.4 26 294 11
5.5-1004 5 31 6
10.5-'--20 A 1 11 11 Total 197 2,315 12
Nuh Tahsil Depopulated 28 358 13
0.1-3.4 207 2,487 12
3.5~5.4 47 688 15
5.S~IO.4 7 85 12
Total 289 3,618 13
Ferozepur Jhirka Tahsil Depopulated 12 161 13
0.1-3.4 197 2,874 15
3.5-5,4 24 408 17
5.5-10.4 8 143 18
30.s-.SO.4 1 21 21 Total '141 3.607 IS
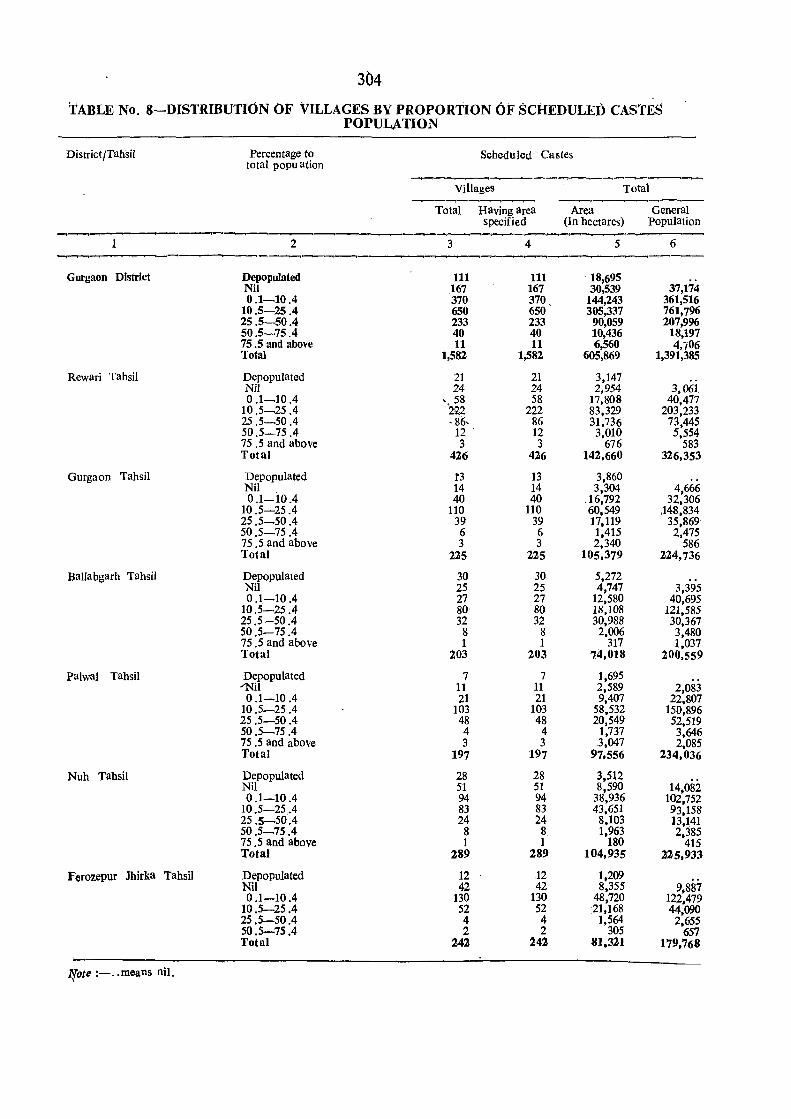
304
TABLE No.8-DISTRIBUTION OF VILLAGES BY PROPORTION OF SCHEDULED CASTES POPULATION
District/Tahsil Percentage to Scheduled Castes total popu ation
-------.____,__,--__,~--...-._,_.._._,
Villages Total ~~ ~-
Total Having area Area General specified (In hectares) population
---__,__,---1 2 3 4 5 6
~~-___,,----. -,-,~~-~
Gurgaon District Depopulated 111 111 ' 18,695 .. Nil 167 167 30,539 37,174 0.1~10.4 370 370 144,243 361,516
10.5-25.4 650 650 305,337 761,796 25.5-50.4 233 233 90,059 207,996 50.5-75.4 40 40 10,436 18,197 75 .5 and above 11 11 6,560 4,706 Total 1,582 1,582 605,869 1,391,385
Rewari Tahsil Depopulated 21 21 3,147 Nil 24 24 2,954 3,061 o .1~10A ',58 58 17,808 40,477
10.5-25 A 222 222 83,329 203,233 25.5-50 A ·86, 86 31,736 73,445 50.5-75.4 12 . 12 3,010 5,554 75.5 and above 3 3 676 583 Total 426 426 142,660 326,353
Gurgaon Tahsil Depopulated f3 13 3,860 Nil 14 14 3,304 4,666 0.1-1004 40 40 .16,792 32,306
10.5-25.4 110 110 60,549 ,148,834 25.5-5004 39 39 17,119 35,869 50.5-75.4 6 6 1,415 2,475 75 .5 and above 3 3 2,340 586 Total 225 225 105,379 224,736
Ballabgarh Tahsil Depopulated 30 30 5,272 Nil 25 25 4,747 3,395 0.1-10 A 27 27 12,580 40,695
10.5-25.4 80 80 18,108 121,585 25.5-50.4 32 32 30,988 30,367 50.5-75.4 8 8 2,006 3,480 75.5 and above 1 1 317 1,037 Total 203 203 7.4,018 200,559
Palwal Tahsil Depopulated 7 7 1,695 "Nil 11 11 2,589 2,083 0.1-1004 21 21 9,407 22,807
10.5-25 A 103 103 58,532 150,896 25.5-50.4 48 48 20,549 52,519 50.5-75 A 4 4 1,737 3,646 75 .5 and above 3 3 .3,047 2,085 Total 197 197 97,556 234,036
Nuh Tahsil Depopulated 28 28 3,512 Nil 51 51 8,590 14,082 0.1-10 A 94 94 38,936 102,752
10.5-25 . .4 83 83 43,651 93,158 25.5-50.4 24 24 8,103 13,141 50.5-75.4 8 8 1,963 2,385 75.5 and above 1 1 180 415 Total 289 289 104,935 225,933
Ferozepur Jhirka Tahsil Depopulated 12 12 1,209 Nil 42 42 8,355 9,887 0.1-1004 130 130 48,720 122.479
10.5-25.4 52 52 21,168 44,090 25.5-5004 4 4 1,564 2,655 50.5-75.4 2 2 305 657 Total 242 242 ~1,321 179,768
r[ote ;-.. means nil.
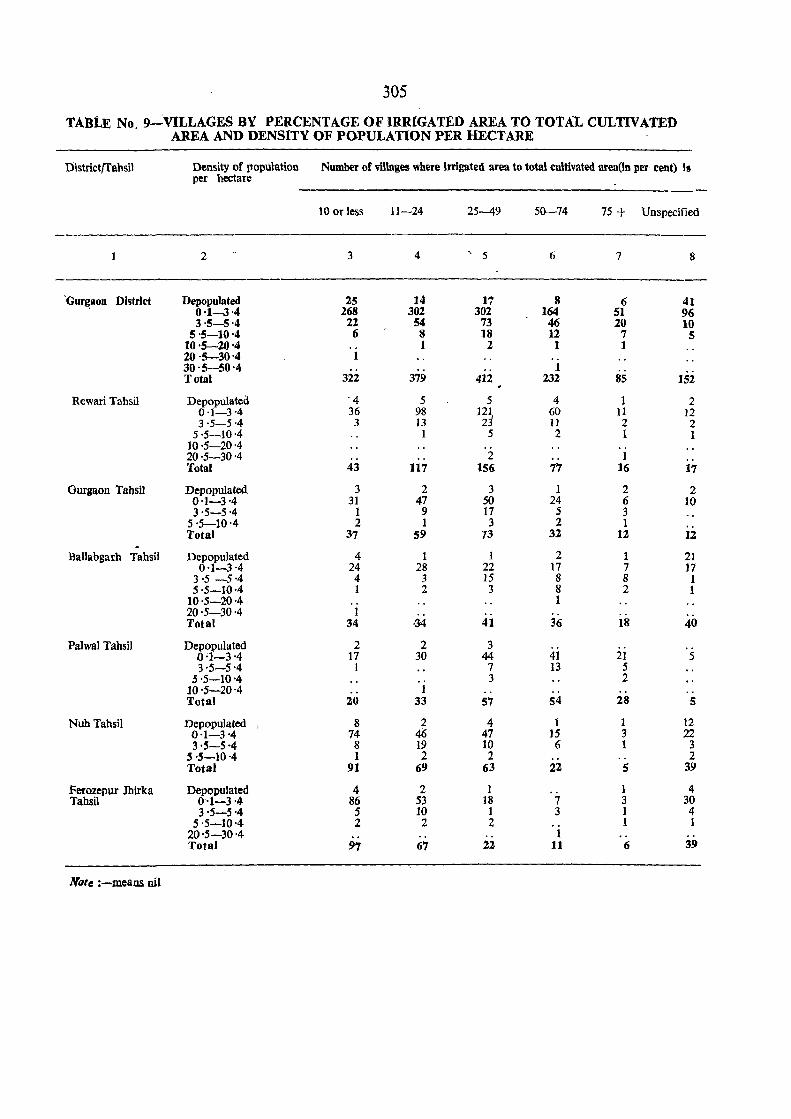
305
TAlJLE No_ 9"-:VILLAGES BY PERCENTAGE OF IRRIGATED AREA TO TOTAL CULTIVATED AREA AND DENSITY OF POPULATION PER HECTARE
District{rahsil Density of population Number of villages where irrigated area to total cultivated area(ln per cent) Is per hectare
10 or less 11-24 25-49 50--74 75 + Unspecified
2 3 4 ,
5 6 7 8
'G~aon District Depopulated 15 14 17 8 6 41 0-1-3-4 168 302 302 164 51 96 3'5-5-4 22 54 73 46 20 10
5-5-10-4 6 8 18 12 7 5 10'5-20-4 1 2 1 1 20 -5-30-4 1 30-5-50-4 -- 1 .. Total 322 379 412 232 85 152
Rewari Tahsil Depopulated '4 5 5 4 1 2 0·1-3·4 36 98 1~} 60 11 12 3'5-5·4 3 13 11 2 2
5-5-10·4 1 5 2 1 1 10-5-20'4 20-5-30'4 .. -' 2 -- I .. Total 43 117 156 77 16 17
Ourgaon Tabsil Depopulated; 3 2 3 1 2 2 0'1-3-4 31 47 50 24 6 10 3'5-5'4 1 9 17 5 3
5'5-10'4 2 1 3 2 1 '-Total 37 59 .,3 32 12 12
BaUabgarh Tahsil Depopulated 4 1 1 2 1 21 0-1-3-4 24 28 22 17 7 17
3·5 -5·4 4 3 15 8 8 1 5-5-10-4 1 2 3 8 2 1
10'5-20-4 1 20-5-30'4 1 .. .. Total 34 ·34 41 36 18 40
Palwal Tahsil Depopulated 2 2 3 0'1-3-4 17 30 44 41 21 5 3'5-5-4 1 7 13 5
5'5-10-4 3 2 10-5-20-4 -- 1 .- --Total 20 33 57 54 28 5
Nub Tahsil Depopulated I 8 2 4 1 1 12 0'1-3-4 74 46 47 15 3 22 3-5-5-4 8 19 10 6 1 3
5 ·5-10-4 1 2 2 2 Total 91 69 63 22 5 39
Fer02epur Jhirka Depopulated 4 2 1 1 4 Tahsil 0·1-3·4 86 53 18 7 3 30
3'5-5'4 5 10 1 3 1 4 5'5-10·4 2 2 2 1 1
20-5-30'4 " " 1 -' Total 97 67 22 11 6 39
NOle :-me8lli nil
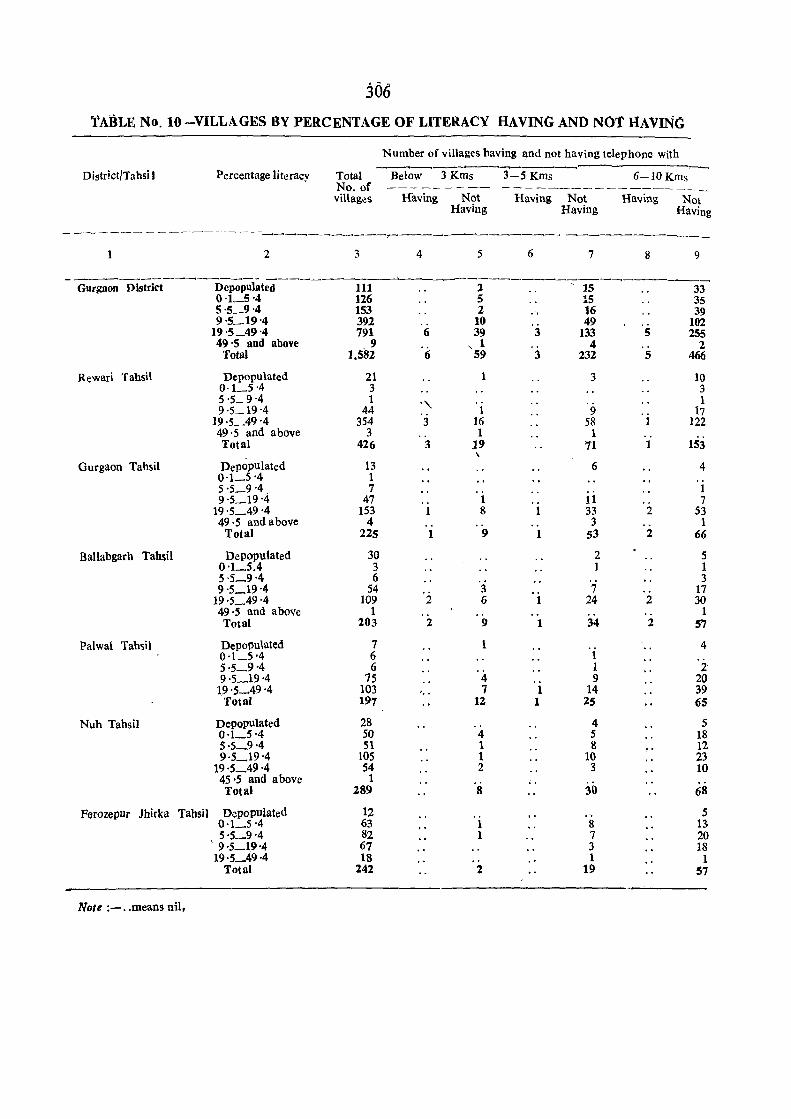
306 TABLE No. to-VILLAGES BY PERCENTAGE OF LITERACY HAVING AND N011IAVING
Number of villages having ~nd not having telephone with -~---~--__'------District/Tahsi I Percentage literacy Total Below 3 Kms 3-5 Kms 6-10Kms
No. of --------- ----------------viHagl!s Having Not Having Not Having Not
Having Having Having
--~-------------------------~-----------~-----~-----~--
2 3 4 5 6 7 8 9
--------__.,------ ----------_. ~---------------------..-------GUrgaon District Depopulated 111 2 15 33
0'1_5·4 126 5 15 35 5'5_9'4 153 2 . \ 16 39 9,5_19'4 392 10 49 102
19·5_49'4 791 6 39 3 133 5 255 49'5 and above 9 , 1 4 2
Total 1,582 6 59 3 232 5 466
Rewari Tahsil Depopulated 21 1 3 10 0·1_5·4 3 3 5'5-9·4 1 ., 1 9,5-19'4 44 1 9 17
19·5_49'4 354 3 16 58 . i 122 49·5 and above 3 .. 1 1 Total 426 3 19 71 1 153 ,
Gurgaon Tahsil Depopulated 13 6 4 0'1_5 ,4 1 5'5_9·4, 7 1 9'5_19'4 47 1 11 7
19'5_49 ·4 153 1 8 1 33 2 S3 49·5 and above 4 .. .. 3 " 1
Total 225 1 9 1 53 2 66
Ballabgarh Tahsil Depopulated 30 2 5 0'1_5.4 3 1 1 5·5_9,4 6 3 9'5_19·4 54 3 7 .. 17
19·5_49,4 109 2 6 1 24 2 30 49·5 and above 1 .. .. .. 1 Total 203 2 9 1 34 2 57
Palwal Tahsil Depopulated 7 1 4 0·1_5,4 6 1 5,5_9,4 6 1 2 9,5_19-4 75 4 9 20 19'5~49'4 103 ' .. 7 1 14 39
Total 197 12 1 25 65
Nuh Tahsil Depopulated 28 4 5 0,1_5 ·4 50 4 5 18 5·5_9·4 51 1 8 12 9·5_19,4 105 1 10 23
19·5_49·4 54 2 3 10 45·5 and above 1 Total 289 8 30 68
Ferozepur Jhirka Tahsil DePOpulated 12 5 0·1_5 ·4 63 1 8 13 5,5_9,4 82 1 7 20
, 9,5_19'4 67 3 18 19,5_49·4 18 1 1
Total 242 2 19 57
Note :-.. means nil,
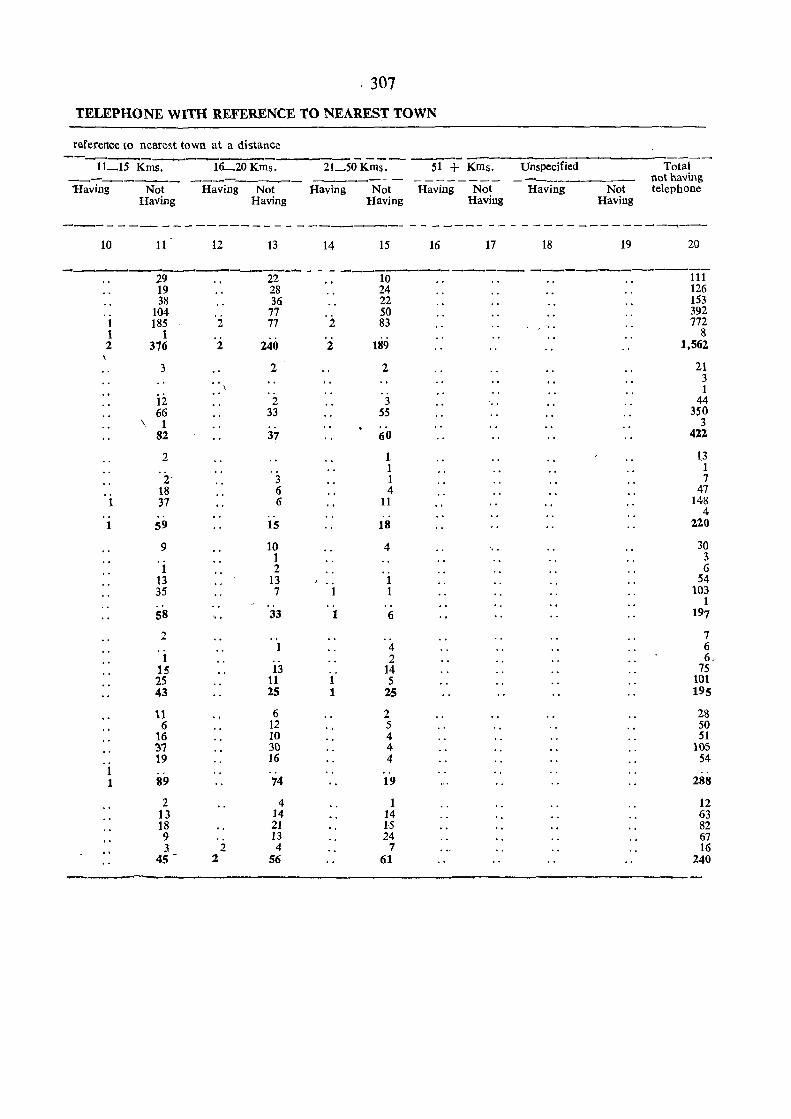
307
TELEPHONE WITH REFERENCE TO NEAREST TOWN
reference to neare~,t town at a distance
---1i::t5K~S:-~-162~7----2i_SoK-;;1;. -- -51+ ~~-Unspecified----Total--'Having--~- - H';;ing-NoT-- Having- N~t - -H-;;:0ng - N-;;t- Having--Not- ~cl~~~~i~;
Having Having Having Having Having
10 11 12 14 15 16 17 18 19 20
---~----2~------22--------10-------------------------Ul
.. 1 1 2
. , 1
1 1
\
19 28 24 126 38 36 22 153
104 77 50 392 185 2 77 . 2 83 772
1 8 376 2 240 2 189 1,562
3
ii 66 1
82
2
2' 18 37 . ' 59
9
1 13 35 .' 58
2
1 15 2S 43
11 6
16 37 19
89
2 13 18 9 " 3 2
45 - 2
2
2 33
37
3 6 6
.. 15
10 1 2
13 7
33
1
13 11 25
6 12 10 30 16 "
74
4 14 21 13 4
56
.. 1
1 1
2 21 3 1
3 44 55 350
3 60 422
1 13 1 1 1 7 4 47
11 148 .. 4
18 220
4 .. 30 3 6
1 54 1 103
1 6 197
.. 7 4 6 2 6-
14 75 5 101
25 195
2 28 5 50 4 51 4 105 4 54
.. . . 19 288
1 12 14 63 15 82 24 67
7 16 61 240

309
SECTION-C ADlVIINISTRATIVE, WELFARE
AND DEVELOPMENTAL STATISTICS

Section-C-Administrative, weitare and Deveiopmentai Statistics
Flyleaf
In this Section the tables based on administrative, welfare and developmental statistics have been given. As per the revised coverage of District Census Handbooks Part-C, seventy four such tables were proposed to be included uniformly at all-India pattern. As data for some of these tables were not available it was decided to include in this volume such'tal?les only data for which was available for all the districts in the State. There were only 46 such table,s as Iiste,d in List-A. Information for these tables has been collected from the concerned Government/Quasi-Government Departments of Haryana State and Central Government. Data for some of the tables have been extracted froin some pUblications. Source of data has been indicated in a foot-note under each table. The remaining 28 tables appearing in List-B have been dropped since the information on these tables was not readily and uniformly available for all the districts. .
.311

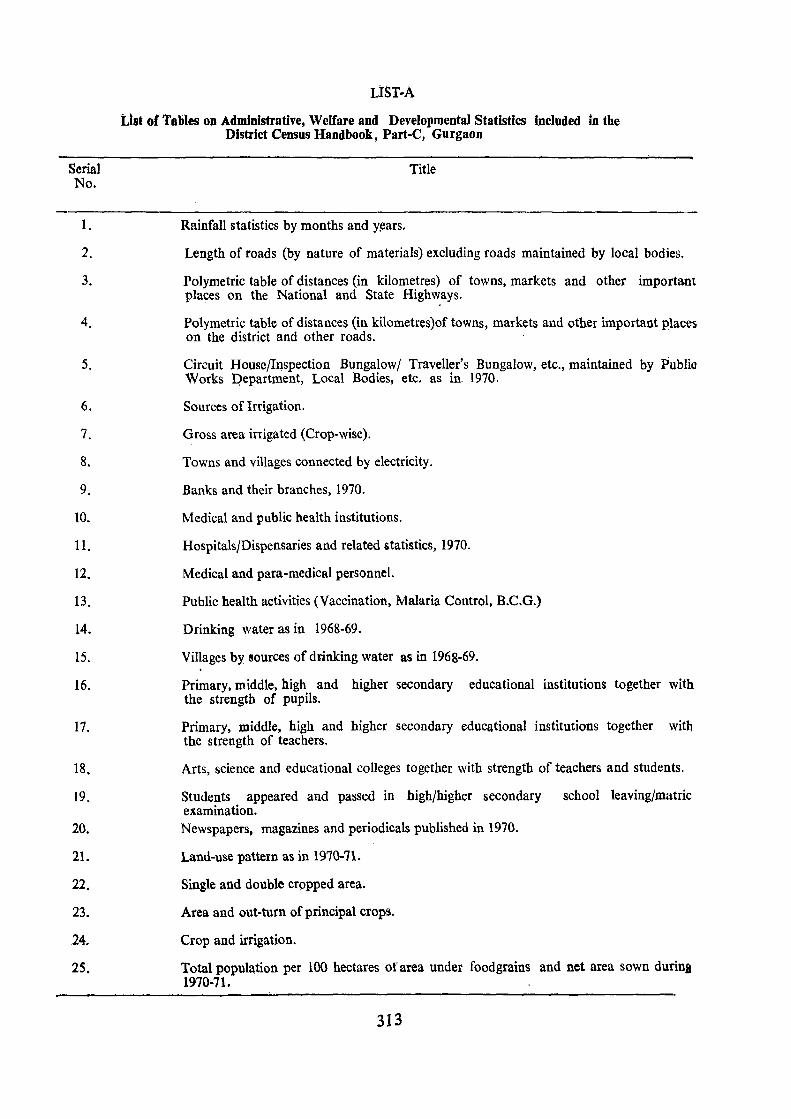
Serial No.
1.
2.
3.
4.
5.
6.
7.
8.
9.
10.
11.
12.
13.
14.
15.
16.
17.
18.
19.
20.
2l.
22.
23.
24.
25.
LIST-A
Ust of Tables on Administrative, Welfare and Developmental Statistics included in the District Census Handbook, Part-C, Gurgaon
Title
Rainfall statistics by months and y~ars.
Length of roads (by nature of materials) excluding roads maintained by local bodies.
Polymetric table of distances (in kilometres) of towns, markets and other important places on the National and State Highways.
Polymetric table of distances (in kilometres)of towns, markets and other important places on the district and other roads.
Circuit House/Inspection Bungalow/ Traveller's Bungalow, etc., maintained by Public Works pepartment, Local Bodies, etc. as in. 1970.
Sources of Irrigation.
Gross area irrigated (Crop-wise).
Towns and villages connected by electricity.
Banks and their branches, 1970.
Medical and public health institutions.
Hospitals/Dispensaries and related &tatistics, 1970.
Medical and para-medical personnel.
Public health activities (Vaccination, Malaria Control, B.C.G.)
Drinking water as in 1968-69.
Villages by sources of drinking water as in 1968-69.
Primary, middle, high and higher secondary educational institutions together with the strength of pupils.
Primary, middle, high and higher secondary educational institutions together with the strength of teachers.
Arts, science and educational colleges together with strength of teachers and students.
Students appeared and passed in high/higher secondary school leaving/matric examination. Newspapers, magazines and periodicals published in 1970.
Land-use pattern as in 1970-71.
Single and double crppped area.
Area and out-turn of principal crops.
Crop and irrigation.
Total population per 100 hectares or area under foodgrains and net area sown durina 1970-71.
313
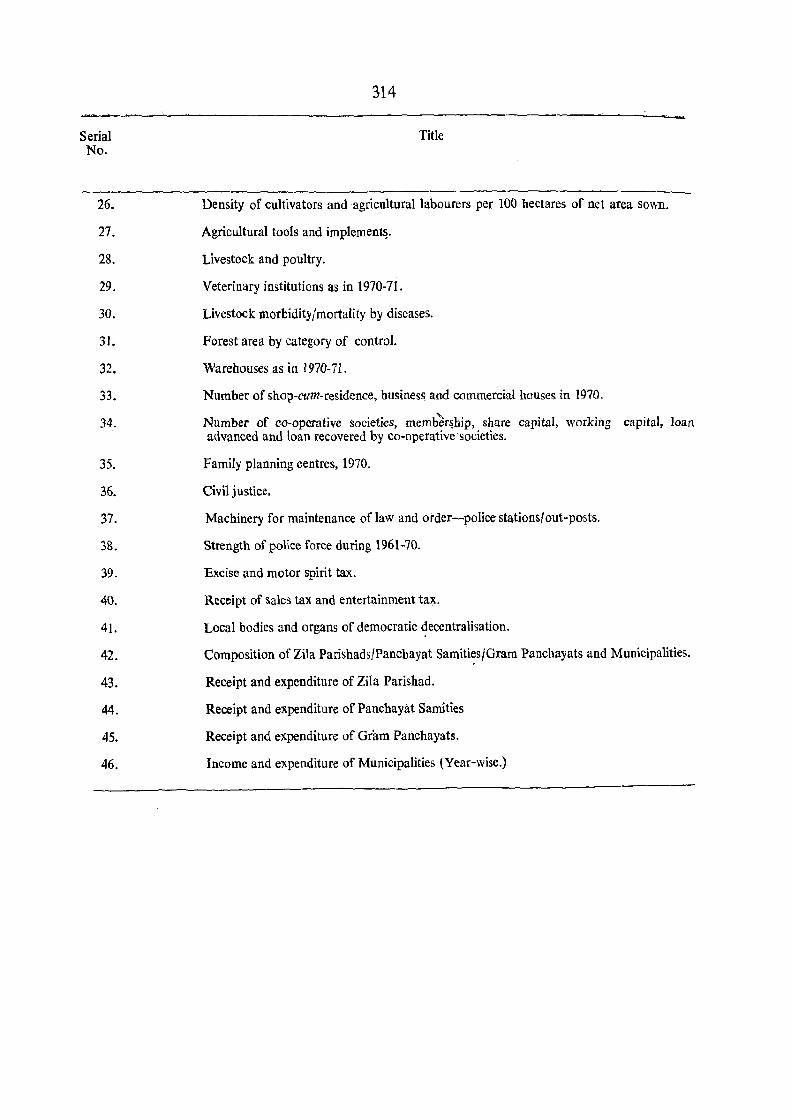
Serial No.
26.
27.
28.
29.
30.
31.
32.
33.
34.
35.
36.
37.
38.
39.
40.
41.
42.
43.
44.
45.
46.
314
Title
Density of cultivators and agricultural labourers per 100 hectares of net area sown.
Agricultural tools and implement~.
Livestock and poultry.
Veterinary institutions as in 1970-71.
Livestock morbidity/mortality by diseases.
Forest area by category of control.
Warehouses as in 1970-71.
Number of shop-cum-residence, busines~ and commercial houses in 1970.
Number of co-operative societies, memb)r~hip, share capital, working capital, loan advanced and loan recovered by co-operative 'societies.
Family planning centres, 1970.
Civil justice.
Machinery for maintenance of law and order-police stationsfout-posts.
Strength of police force during 1961-70.
Excise and motor spirit tax.
Receipt of sales tax and entertainment tax.
Local bodies and organs of democratic decentralisation.
Composition of Zila Parishads/Panchayat Samities/Gram Panchayats and Municipalities.
Receipt and expenditure of Zila Parishad.
Receipt and expenditure of Panchayat Samities
Receipt and expenditure of Gram Pancbayats.
Income and expenditure of Municipalities (Year-wise.)
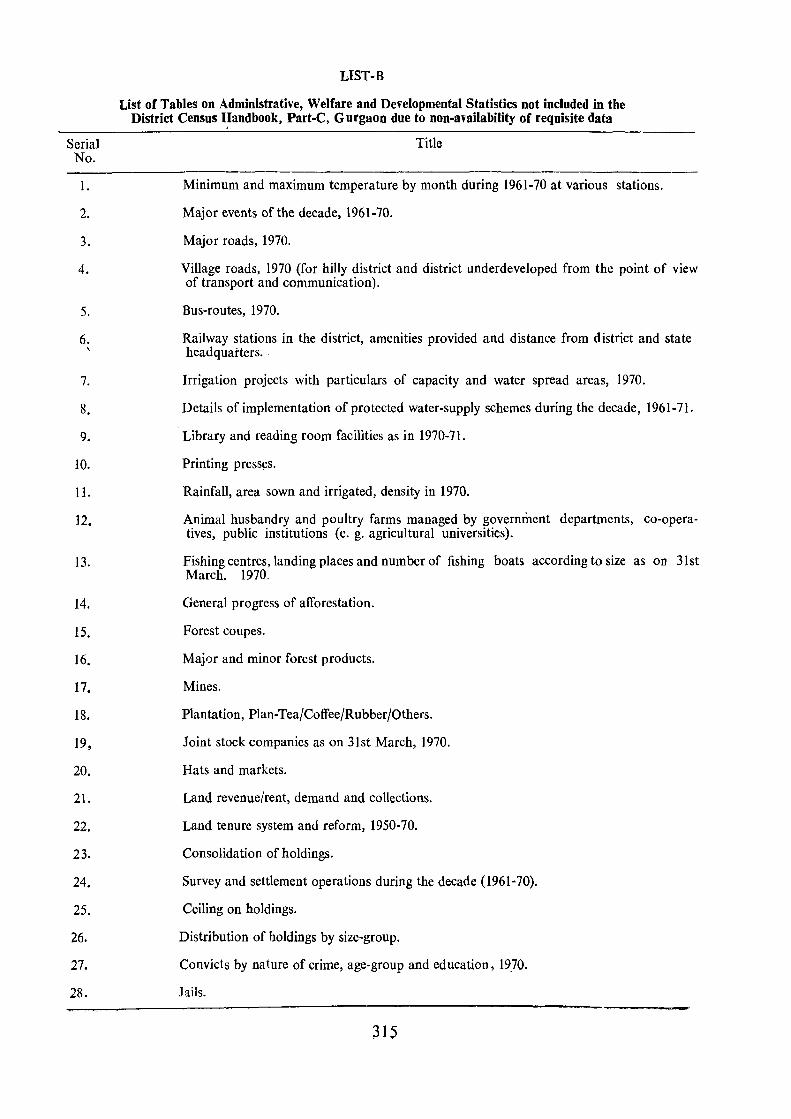
Serial No.
1.
2.
3.
4.
5.
6. ,
7.
8.
9.
10.
11.
12.
13.
14.
15.
16.
17.
18.
19,
20.
21.
22.
23.
24.
25.
26.
27.
28.
LIST-B
List of Tables on Administrative, Welfare and Developmental Statistics not included in the District Census I:Iandbook. Part-C, Gurgaon due to non-availability of requisite data
Title
Minimum and maximum temperature by month during 1961-70 at various stations.
Major events of the decade, 1961-70.
Major roads, 1970.
Village roads, 1970 (for hilly district and district underdeveloped from the point of view of transport and communication).
Bus-routes, 1970.
Railway stations in the district, amenities provided and distance from district and state headquarters.
Irrigation projects with particulars of capacity and water spread areas, 1970.
Details of implementation of protected water-supply schemes during the decade, 1961-71.
Library and reading room facilities as in 1970-71.
Printing presses.
Rainfall, area sown and irrigated, density in 1970.
Animal husbandry and poultry farms managed by government departments, co-operatives, public institutions (e. g. agricultural universities).
Fishing centres, landing places and number of fishing boats according to size as on 31st March. 1970.
General progress of afforestation.
Forest coupes.
Major and minor forest products.
Mines.
Plantation, Plan-Tea/Coffee/Rubber/Others.
Joint stock companies as on 31st March, 1970.
Hats and markets.
Land revenue/rent, demand and collections.
Land tenure system and reform, 1950-70.
Consolidation of holdings.
Survey and settlement operations during the decade (1961-70).
Ceiling on holdings.
Distribution of holdings by size-group.
Convicts by nature of crime, age-group and education, 19.70.
Jails.
3]~
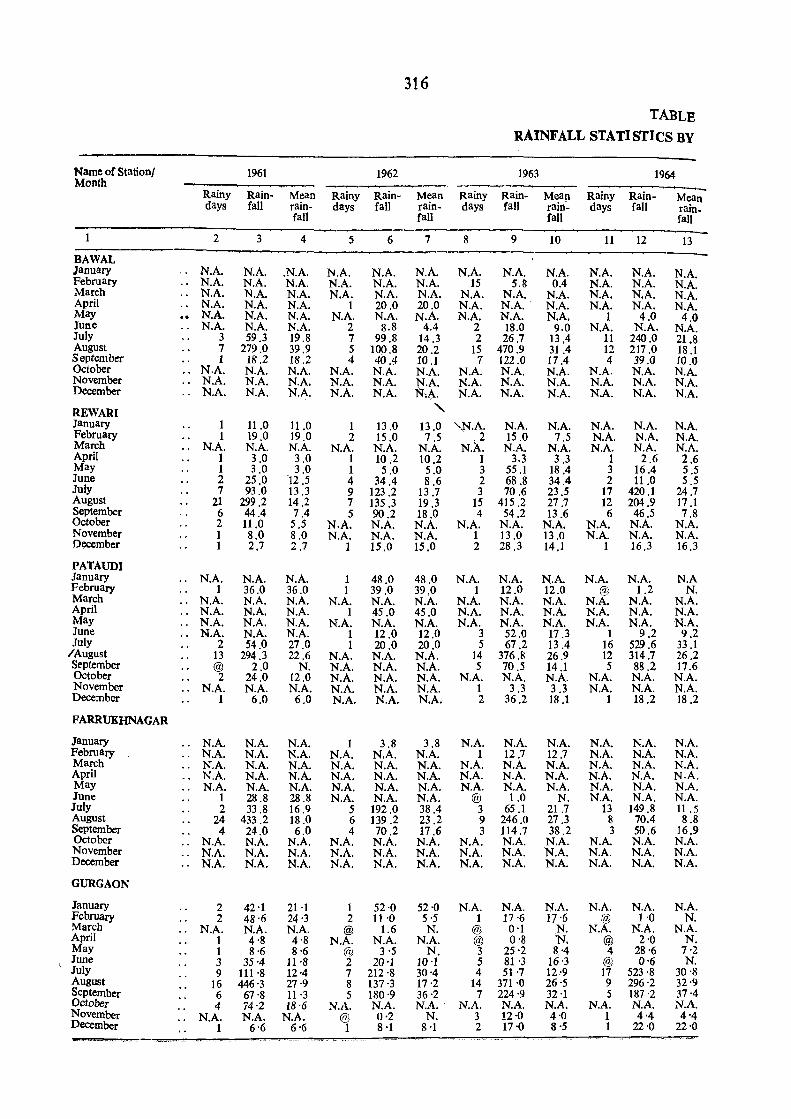
316
TABLE RAINFALL STATISTICS BY
Name of Stationl 1961 Month
1962 1963 1964
Rainy Rain- Mean Rainy Rain- Mean Rainy Rain- Mean Rainy Rain- Mean days fall rain- days fall rain- days fall rain- days fall rain_
fall fall fall fall
1 2 3 4 5 6 7 8 9 10 11 12 13
BAWAL January -, N.A. N.A. . N.A. N.A. N.A. N.A. N.A. N.A. N.A. N.A . N.A. N.A. February .. N.A. N.A. N.A. N.A. N.A. N.A. 15 5.8 0.4 N.A. N.A. N.A . March .. N.A. N.A. N.A. N.A. N.A. N.A. N.A. N.A. N.A. N.A. N.A. N.A . April .. N.A. N.A. N.A. 1 20.0 20.0 N.A. N.A. N.A. N.A. N.A. N.A . May N.A. N.A. N.A. N.A. N.A. N.A. N.A. N.A. N.A. 1 4.0 4.0 June .. N.A. N.A. N.A. 2 8.8 4.4 2 18.0 9.0 N.A. N.A. N.A . July 3 59.3 19.8 7 99.8 14.3 2 26.7 13.4 11 240.0 21.8 August 7 279.0 39.9 5 100.8 20.2 15 470.9 31.4 12 217.0 18.1 September 1 18.2 18.2 4 40.4 10.1 7 122.0 17.4 4 39.0 10.0 October .. N.A. N.A. N.A. N.A. N.A. N.A. N.A. N.A. N.A. N.A. N.A. N.A. November .. N.A. N.A. N.A. N.A. N.A. N.A . N.A. N.A. N.A. N.A. N.A. N.A. December .. N.A. N.A. N.A. N.A. N.A. N:-t\. N.A . N.A. N.A. N.A. N.A. N.A.
REWARI " January 1 11.0 11.0 1 13.0 13.0 "N.A. N.A. N.A. N.A. N.A. N.A. February 1 19.0 19.0 2 15.0 7.5 . 2 15.0 7.5 N.A . N.A. N.A. March .. N.A. N.A. N.A. N.A. N.A. N.A . N.).. N.A. N.A. N.A. N.A. N.A. April 1 3.0 3.0 1 10.2 10.2 1 3.3 3.3 1 2.6 2.6 May 1 3.0 3.0 1 5.0 5.0 3 55.1 18.4 3 16.4 5.5 June 2 25.0 12.5 4 34.4 8.6 2 68.8 34.4 2 11 .0 5.5 July 7 93.0 13 .3 9 123.2 13.7 3 70.6 23.5 17 420.1 24.7 August 21 299.2 14.2 7 135.3 19.3 15 415.2 27 .7 12 204.9 17.1 September 6 44.4 7.4 5 90.2 18.0 4 54.2 13.6 6 46.5 7.8 October 2 11.0 5.S N.A. N.A. N.A. N.A. N.A. N.A. N.A. N.A. N.A. November 1 8.0 8.0 N.A. N.A. N.A. 1 13.0 13.0 N.A. N.A. N.A. December 1 2.7 2.7 1 15.0 15.0 2 28.3 14.1 1 16.3 16.3
PATAUDI January .. N.A. N.A. N.A. 1 48.0 48.0 N.A. N.A. N.A. N.A. N.A. N.A February 1 36.0 36.0 1 39.0 39.0 1 12.0 12.0 @ 1.2 N. March .. N.A. N.A. N.A. N.A. N.A . N.A. N.A. N.A. N.A. N.A. N.A. N.A. April .. N.A. N.A. N.A. 1 45.0 45.0 N.A. N.A. N.A. N.A. N.A. N.A. May .. N.A. N.A. N.A. N.A. N.A . N.A. N.A. N.A. N.A. N.A. N.A. N.A. June ., N.A. N.A. N.A. 1 12.0 12.0 3 52.0 17 .3 1 9.2 9.2 July 2 54.0 27.0 1 20.0 20.0 5 67.2 13 .4 16 529.6 33.1
/August 13 294.3 22.6 N.A. N.A. N.A. 14 376.8 26.9 12 314.7 26.2 September @ 2.0 N. N.A. N.A. N.A. 5 70.5 14.1 5 88.2 17.6 October 2 24.0 12.0 N.A. N.A. N.A. N.A. N.A. N.A. N.A. N.A. N.A. November .. N.A. N.A. N.A. N.A . N.A. N.A. 1 3.3 3.3 N.A. N.A. N.A. December 1 6.0 6.0 N.A. N.A. N.A. 2 36.2 18.1 1 18.2 18.2
FARRUKHNAGAR
January .. N.A. N.A. N.A . 1 3.8 3.8 N.A. N.A. N.A. N.A. N.A. N.A. February .. N.A. N.A. N.A . N.A. N.A. N.A. 1 12.7 12.1 N.A. N.A. N.A. March .. N.A. N.A . N.A. N.A. N.A. N.A. N.A. N.A. N.A. N.A. N.A. N.A. April .. N.A. N.A. N.A. N.A . N.A. N.A. N.A. N.A. N.A. N.A. N.A. N.A. May .. N.A. N.A . N.A. N.A. N.A. N.A. N.A. N.A. N.A. N.A. N.A. N.A. June 1 28.8 28.8 N.A. N.A. N.A. @ 1 .0 N. N.A. N.A. N.A. July 2 33.8 16.9 5 192.0 38.4 3 65.1 21.7 13 149.8 11 .5 August 24 433.2 18.0 6 139.2 23.2 9 246.0 27 .3 8 70.4 8.8 September 4- 24.0 6.0 4 70.2 17.6 3 114.7 38.2 3 50.6 16.9 October .. N.A. N.A . N.A. N.A. N.A. N.A. N.A. N.A. N.A. N.A. N.A. N.A. November .. N.A. N.A . N.A. N.A. N.A. N.A. N.A. N.A. N.A. N.A. N.A. N.A. December .. N.A. N.A. N.A . N.A. N.A. N.A. N.A. N.A. N.A. N.A. N.A. N.A.
GURGAON
January 2 42·1 21-1 1 52·0 52·0 N.A. N.A. N.A. N.A. N.A. N.A. February 2 48·6 24'3 2 11 ·0 5·5 1 17'6 17'6 @ 1 ·0 N. March .. N.A. N.A . N.A. @ 1.6 N. @ 0'1 N. N.A. N.A. N.A. April 1 4'8 4·8 N.A. N.A. N.A. @ 0'8 N. @ 2'0 N. May I 8·6 8·6 @ 3·5 N. 3 25'2 8,.4 4 28'6 7'2 June 3 35'4 11 '8 2 20'1 10 '1 5 81 '3 16'3 @ 0'6 N. July 9 111 ·8 12·4 7 212·8 30'4 4 51 ·7 12 ·9 17 523·8 30'8 August 16 446'3 27·9 8 137 ·3 17·2 14 371·0 26·5 9 296·2 32'9 September 6 67'8 11 ·3 5 180'9 36·2 7 224·9 32',1 5 187·2 37'4 October 4 74·2 18-6 N.A. N.A. N.A. - N.A. N.A. N.A. N.A. N.A. N.A. November .. N.A . N.A. N.A. @ 0·2 N. 3 12·0 4'0 1 4'4 4'4 December 1 6'6 6·6 1 8 ·1 8 '1 2 17·0 8'S 1 22'0 22'0
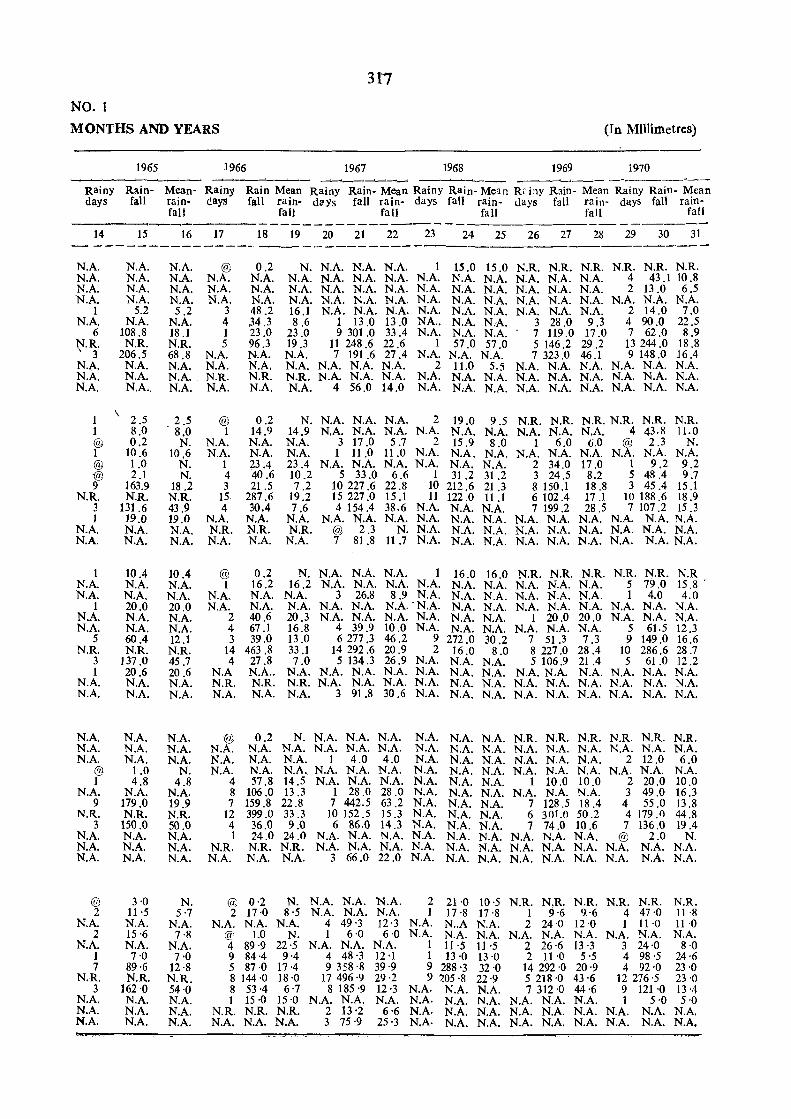
31i
NO.1
MONTHS AND YEARS (In MilHmetres)
1965 1966 1967 1968 1969 1970 --~_-
_----_-__ Rainy Rain- Mean- Rainy Rain Mean Rainy Rain- Mean Rainy Rain- Me~n R' i:1Y Rain- Mean Rainy Rain- Mean days fall rain- days fall rain- days fall rain- days fall rain- days fall rain- days fall rain-
fall fall fa 11 fa II fall fall ----~~ ------------------ ------
14 15 16 17 18 19 20 21 22 23 24 25 26 27 28 29 30 31 - --------------_. --------------N.A. N.A. N.A. @ 0.2 N. N.A. N.A. N.A. 1 15.0 15.0 N.R. N.R. N.R. N.R. N.R. N.R. N.A. N.A. N.A. N.A. N.A. N.A. N.A. N.A. N.A. N.A. N.A. N.A. N.A. N.A. N.A. 4 43.1 10.8 N.A. N.A. N.A. N.A. N.A. N.A. N.A. N.A. N.A. N.A. N.A. N.A. N.A. N.A. N.A. 2 13.0 6.5 N.A. N.A. N.A. N.A. N.A. N.A. N.A. N.A. N.A. N.A. N.A. N.A. N.A. N.A. N.A. N.A. N.A. N.A.
1 5.2 5.2 3 48.2 16.1 N.A. N.A. N.A. N.A. N.A. N.A. N.A. N.A. N.A. 2 14.0 7.0 N.A. N.A. N.A. 4 ,34.3 8.6 1 13.0 13 .0 NA .. N.A. NA. 3 28.0 9.3 4 90.0 22.5
6 108.8 18.1 1 23.0 23.0 9 301 .0 33.4 N.A. N.A. N.A. 7 119.0 17.0 7 62.0 8.9 N.R. N.R. N.R. 5 96.3 19.3 11 248.6 22.6 1 57.0 57.0 5 146.2 29.2 13 244.0 18.8 \ 3 206.5 68.8 N.A. N.A. N.A. 7 191.6 27.4 N.A. N.A. N.A. 7 323.0 46.1 9 148.0 16.4 N.A. N.A. N.A. N.A. N.A. N.A. N.A. N.A. N.A. 2 11.0 5.5 N.A. N.A. N.A. N.A. N.A. N.A. N.A. N.A. N.A .. N.R. N.R. N.R. N.A. N.A. N.A. N.A. N.A. N.A. N.A. N.A. N.A. N.A. N.A. N.A. N.A. N.A .. N.A. N.A. N.A. N.A. 4 56.0 14.0 N.A. N;A. N.A. N.A. N.A. N.A. N.A. N.A. N.A.
1 \
2.5 2.5 @ 0.2 N.A. N.A. N.A. 2 N.R. N.R. N.R. N.R. N. 19.0 9.5 N.R. N.R. 1 8.0 8.0 1 14.9 14.9 N.A. N.A. N.A. N.A. N.A. N.A. N.A. N.A. N.A. 4 43.8 11.0 @ 0.2 N. N.A. N.A. N.A. 3 17.0 5.7 2 15.9 8.0 1 6.0 (j.0 @ 2.3 N. 1 10.6 10.6 N.A. N.A. N.A. 1 11.0 11.0 N.A. N.A. N.A. N.A. N.A. N.A. N.A. N.A. N.A. @ 1.0 N. 1 23.4 23.4 N.A. N.A. N.A. N.A. N.A. N.A. 2 34.0 17.0 1 9.2 9.2 @ 2.1 N. 4 40.6 10.2 5 33.0 6.6 1 31.2 31.2 3 24.5 8.2 5 48.4 9.7 9 163.9 18 .2 3 21.5 7 .2 10 227.6 22.8 10 212.6 21.3 8 150.1 18.8 3 45.4 15.1
N.R. N.R. N.R. 15 287.6 19.2 15 227.0 15.1 11 122.0 11.1 6 102.4 17.1 10 188.6 18.9 3 131.6 43.9 4 30.4 7.6 4 154.4 38.6 N.A. N.A. N.A. 7 199.2 28.5 7 107.2 15.3 1 19.0 19.0 N.A. N.A. N.A. N.A. N.A. N.A. N.A. N.A. N.A. N.A. N.A. N.A. N.A. N.A. N.A.
N.A. N.A. N.A. N.R. N.R. N.R. @ 2.3 N. N.A. N.A. N.A. N.A. N.A. N.A. N.A. N.A. N.A. N.A. N.A. N.A. N.A. N.A. N.A. 7 81.8 11 .7 N.A. N.A. N.A. N.A. N.A. N.A. N.A. N.A. N.A.
1 10.4 10.4 @ 0.2 N. N.A. N.A. N.A. 1 16.0 16.0 N.R. N.R. N.R. N.R. N.R. N.R N.A. N.A. N.A. 1 16.2 16.2 N.A. N.A. N.A. N.A. N.A. N.A. N.A. N.A. N.A. 5 79.0 15.8 . N.A. N.A. N.A. N.A. N.A. N.A. 3 26.8 8.9 N.A. N.A. N.A. N.A. N.A. N.A. 1 4.0 4.0
1 20.0 20.0 N.A. N.A. N.A. N.A. N.A. N.A. °N.A. N.A. N.A. N.A. N.A. N.A. N.A. N.A. N.A. N.A. N.A. N.A. 2 40.6 20.3 N.A. N.A. N.A. N.A. N.A. N.A. 1 20.0 20.0 N.A. N.A. N.A. N.A. N.A. N.A. 4 67.1 16.8 4 39.9 10.0 N.A. N.A. N.A. N.A. N.A. N.A. 5 61.5 12.3
5 60.4 12.1 3 39.0 13.0 6277 .3 46.2 9 272.0 30.2 7 51 .3 7.3 9 149.0 16.6 N.R. N.R. N.R. 14 463 .8 33.1 14292.6 20.9 2 16.0 8.0 8 227.0 28.4 10 286.6 28.7
3 137.0 45.7 4 27.8 7.0 5 134.3 26.9 N.A. N.A. N.A. 5 106.9 21.4 5 61.0 12.2 1 20.6 20.6 N.A N.A .. N.A. N.A. N.A. N.A. N.A. N.A. N.A. N.A. N.A. N.A. NA. N.A. N.A.
N.A. N.A. N.A. N.R. N.R. N.R. N.A. N.A. N.A. N.A. N.A. N.A. N.A. N.A. N.A. N.A. N.A. N.A. N.A. N.A. N.A. N.A. N.A. N.A. 3 91.8 30.6 N.A. N.A. N.A. N.A. N.A. N.A. N.A. N.A. N.A.
N.A. N.A. N.A. @ 0.2 N. N.A. N.A. N.A. N.A. N.A. N.A. N.R. N.R. N.R. N.R. N.R. N.R. N.A. N.A. N.A. N.A. NA. N.A. N.A. N.A. N.A. N.A. N.A. N.A. N.A. N.A. N.A. N.A. N.A. N.A. N.A. N.A. N.A. N.A. N.A. N.A. 1 4.0 4.0 N.A. N.A. N.A. N.A. N.A. N.A. 2 12.0 6.0
@ 1.0 N. N.A. N.A. N.A. N.A. N.A. N.A. N.A. N.A. N.A. N.A. N.A. N.A. N.A. N.A. N.A. 1 4.8 4.8 4 57.8 14.5 N.A. N.A. N.A. N.A. N.A. N.A. 1 10.0 10.0 2 20.0 10.0
N.A. N.A. N.A. 8 106.0 13 .3 1 28.0 28.0 N.A. N.A. N.A. N.A. N.A. N.A. 3 49.0 16.3 9 179.0 19.9 7 159.8 22.8 7 442.5 63.2 N.A. N.A. N.A. 7 128.5 18.4 4 55.0 13 .8
N.R. N.R. N.R. 12 399.0 33.3 10152.5 15.3 N.A. N.A. N.A. 6 301.0 50.2 4 179.f) 44.8 3 150.0 50.0 4 36.0 9.0 6 86.0 14.3 N.A. N.A. N.A. 7 74.0 10.6 7 136.0 19.4
N.A. N.A. N.A. 1 24.0 24.0 N.A. N.A. N.A. N.A. N.A. N.A. N.A. N.A. N.A. @ 2.0 N. N.A. N.A. N.A. N.R. N.R. N.R. N.A. N.A. N.A. N.A. N.A. N.A. N.A. N.A. N.A. N.A. N.A. N.A. N.A. N.A. N.A. N.A. N.A. N.A. 3 66.0 22.0 N.A. N.A. N.A. N.A. N.A. N.A. N.A. N.A. N.A.
@ 3 '0 N. (jf:, 0·2 N. N.A. N.A. N.A. 2 21'0 10·5 N.R. N,R. N.R. N.R. N.R. N.R. 2 11 '5 5·7 2 17·0 8'5 N.A. N.A. N.A. 1 17'8 17·8 1 9'6 9·6 4 47·0 11 ·8
N.A. N.A. N.A. N.A. N.A. N.A. 4 49'3 12 ·3 N.A. N .. A N.A. 2 24'0 12'0 1 Il ·0 11 ·0 2 15'6 7·8 @ 1.0 N. 1 6'0 6·0 N.A. N.A. N.A. N.A. N.A. N.A. N.A. N.A. N.A.
N.A. N.A. N.A. 4 89·9 22·5 N.A. N.A. N.A. 1 11'5 11 ·5 2 26·6 13 ·3 3 24·0 8·0 1 7·0 7·0 9 84·4 9'4 4 48·3 12 '1 1 13 ·0 13 '0 2 H'O 5·5 4 98·5 24'6 7 89'6 12·8 5 87·0 17 ·4 9 358·8 39·9 9 288'3 32'0 14292·0 20·9 4 92·0 23·0
N.R. N.R. N.R. 8 144·0 18 ·0 17496·9 29·2 9 ?05·8 22·9 5 218·0 43·6 12276'5 23'0 3 162'0 54·0 8 53 ·4 6·7 8185'9 12 ·3 N.A. N.A. N.A. 7312·0 44·6 9 121 '0 13 ·4
N.A. N.A. N.A. 1 15 ·0 15·0 N.A. N.A. N.A. N.A. N.A. N.A. N.A. N.A. N.A. 1 5·0 5'0 N.A. N.A. N.A. N.R. N.R. N.R. 2 13'2 6'6 N.A. N.A. N.A. N.A. N.A. N.A. N.A. N.A. N.A. N.A. N.A. N.A. N.A. N.A. N.A. 3 75·9 25'3 N.A. N.A. N.A. N.A. N.A. N.A. N.A. N.A. N.A.
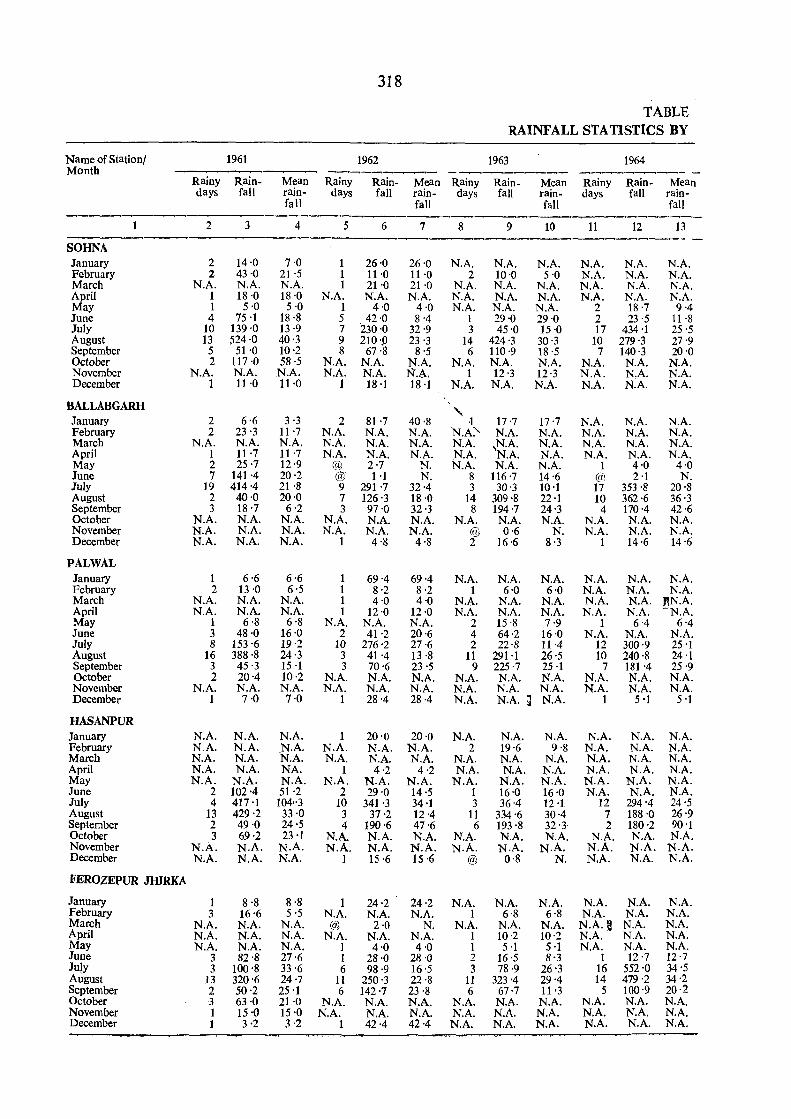
318
TABLE RAINFALL STATISTICS BY
Name of Station/ 1961 1962 1963 1964 Month ~~~~
--~-~---Rainy Rain- Mean Rainy Rain- Mean Rainy Rain- Mean Rainy Rain- Mean days fall rain- days fall rain- days fall rain- days fall rain-
fall fall fall fall
2 3 4 5 6 7 8 9 10 11 12 13
SOHNA January 2 14'0 7·0 1 26·0 26'0 N.A. N.A. N.A. N.A. N.A. N.A. February 2 43·0 21 ·5 1 11 '0 11 '0 2 10'0 5'0 N.A. N.A. N.A. March N.A. N.A. N.A. 1 21 '0 21 '0 N.A. N.A. N.A. N.A. N.A. N.A. April 1 18·0 18'0 N.A. N.A. N.A. N.A. N.A. N.A. N.A. N.A. N.A. May 1 5'0 5·0 1 4'0 4·0 N.A. N.A. N.A. 2 18·7 9·4 June 4 75·1 18·8 5 42·0 8'4 1 29'0 29'0 2 23·5 11 '8 July 10 139 ·0 13·9 7 230'0 32'9 3 45'0 15·0 17 434 ·1 25·5 August 13 524·0 40·3 9 210'9 23'3 14 424'3 30·3 10 279·3 27'9 September 5 51 ·0 10·2 8 67·8 8'5 6 110'9 18·5 7 140·3 20'0 October 2 117 ·0 58·5 N.A. N.A. N.A. N.A. N.A. N.A. N.A. N.A. N.A. November N.A. N.A. N.A. N.A. N.A. N.A. 1 12 '3 12 ·3 N.A. N.A. N.A. December 1 11·0 11·0 1 18 ·1 18 ·1 N.A. N.A. N.A. N.A. NA N.A.
BALLABGARH
" January 2 6·6 3·3 2 8! '7 40'8 ·1 17'7 17·7 N.A. N.A. N.A. February 2 23'3 11'7 N.A. N.A. N.A. N.A~ N.A. N.A. N.A. N.A. N.A. March N.A. N.A. N.A. N.A. N.A. N.A. N.A. ,N.A. N.A. N.A. N.A. N.A. April 1 11·7 11'7 N.A. N.A. N.A. N.A. N.A. N.A. N.A. N.A. N.A. May 2 25·7 12·9 @ 2·7 N. N.A. N.A. N.A. 1 4·0 4'0 June 7 141·4 20·2 @ 1 ·1 N. 8 116·7 14·6 @ 2 ·1 N. July 19 414'4 21 ·8 9 291 ·7 32'4 3 30'3 10·1 17 353·8 20·8 August 2 40·0 20·0 7 126'3 18'0 14 309'8 22·1 10 362·6 36 ·3 September 3 18'7 6'2 3 97'0 32 ·3 8 194'7 24'3 4 170·4 42'6 October N.A. N.A. N.A. N.A. N.A. N.A. N.A. N.A. N.A. N.A. N.A. N.A. November N.A. N.A. N:A. N.A. N.A. N.A. @ 0'6 N. N.A. N.A. N.A. December N.A. N.A. N.A. 1 4·8 4'8 2 16 ·6 8·3 1 14·6 14'6
PALWAL January 1 6'6 6·6 1 69·4 69·4 N.A. N.A. N.A. N.A. N.A. N.A. February 2 13'0 6·5 1 8'2 8·2 1 6'0 6'0 N.A. N.A. N.A. March N.A. N.A. N.A. 1 4'0 4·0 N.A. N.A. N.A. N.A. N.A. Jl,N.A. April N.A. N.A. N.A. 1 12'0 12·0 N.A. N.A. N.A. N.A. N.A. -N.A. May 1 6·8 6·8 N.A. N.A. N.A. 2 15'8 7·9 1 6-4 6'4 June 3 48·0 16·0 2 41 ·2 20'6 4 64·2 16·0 N.A. N.A. N.A. July 8 153·6 19·2 10 276'2 27·6 2 22·8 11·4 12 300·9 25 '1 August 16 388·8 24·3 3 41 ·4 13 ·8 11 291-1 26·5 10 240·8 24 ·1 September 3 45·3 15·1 3 70'6 23 '5 9 225·7 25·1 7 181 '4 25'9 October 2 20·4 lO·2 N.A. N.A. N.A. N.A. N.A. N.A. N.A. N.A. N.A. November N.A. N.A. N.A. N.A. N.A. N.A. N.A. N.A. N.A. N.A. N.A. N.A. December 1 7·0 7·0 1 28'4 28·4 N.A. N.A. ~ N.A. 1 5 ·1 5 '1
HASANPUR January N.A. N.A. N.A. 1 20'0 20·0 N.A. N.A. N.A. N.A. N.A. N.A. February N.A. N.A. N.A. N.A. N.A. N.A. 2 19·6 9'8 N.A. N.A. N.A. March N.A. N.A. N.A. N.A. N.A. N.A. N.A. N.A. N.A. N.A. N.A. N.A. April N.A. N.A. NA. 1 4·2 4·2 N.A. N.A. N.A. N.A. N.A. N.A. May N.A. N.A. N.A. N.A. N.A. N.A. N.A. N.A. N.A. N.A. N.A. N.A. June 2 102·4 51 ·2 2 29'0 14·5 1 16'0 16'0 N.A. N.A. N.A. July 4 417 ·1 104,,3 10 341 ·3 34 ·1 3 36'4 12 ·1 12 294'4 24'5 August 13 429·2 33·0 3 37·2 12·4 11 334'6 30·4 7 188·0 26'9 September 2 49·0 24·5 4 190'6 47'6 6 193·8 32'3 2 180'2 90'1 October 3 69·2 23·j N.A. N.A. N.A. N.A. N.A. N.A. N.A. N.A. N.A. November N.A. N.A. N.A. N.A. N.A. N.A. N.A. N.A. N.A. N.A. N.A. N.A. December N.A. N.A. N.A. 1 15 ·6 15·6 @ 0·8 N. N.A. N.A. N.A.
FEROZEPUR JIDRKA
January 1 8·8 8·8 1 24·2 24·2 N.A. N.A. N.A. N.A. N.A. N.A. February 3 16'6 5·5 N.A. N.A. N.A. 1 6·8 6·8 N.A. N.A. N.A. March N.A. N.A. N.A. @ 2·0 N. N.A. N.A. N.A. N.A.~ N.A. N.A. April N.A. N.A. N.A. N.A. N.A. N.A. 1 10·2 to·2 N.A. N.A. N.A. May N.A. N.A. N.A. 1 4·0 4'0 1 5-1 5 ·1 N.A. N.A. N.A. June 3 82·8 27'6 I 28'0 28'0 2 16·5 8'3 1 12'7 12·7 July 3 100·8 33'6 6 98·9 16'5 3 78'9 26'3 16 552'0 34'5 August 13 320'6 24'7 11 250·3 22'8 11 323'4 29'4 14 479'2 34'2 September 2 50'2 25'1 6 142·7 23 ·8 6 67·7 11'3 5 100'9 20·2 October 3 63·0 21 ·0 N.A. N.A. N.A. N.A. N.A. N.A. N.A. N.A. N.A. November 1 15'0 15'0 N.A. N.A. N.A. N.A. N.A. N.A. N.A. N.A. N.A. December 1 3·2 3·2 1 42'4 42'4 N.A. N.A. N.A. N.A. N.A. N.A.
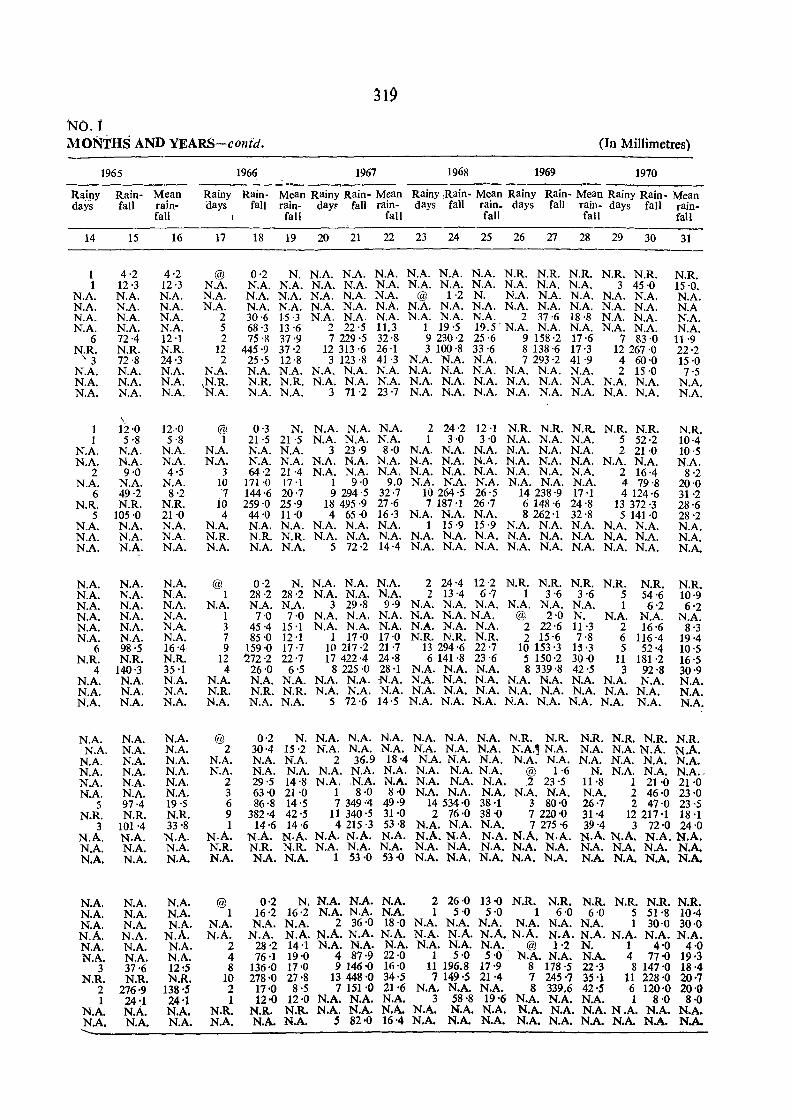
319
'NO. i MONTHS AND YEAR8-contd. (In MiIlimetres)
1965 1966 1967 1968 1969 1970 -----_ ----_
Rainy Rain- Mean Rainy Rain- Mean Rainy Rain- Mean Rainy :Rain- Mean Rainy Rain- Mean Rainy Rain- Mean days fall rain- days fa]] rain- day~ fall rain- days fall rain_ days fall rain- days fall rain-
fall fall fall fall fall fall
14 15 16 17 18 19 20 21 22 23 24 25 26 27 28 29 30 31
-1 4·2 4·2 @ 0'2 N. N.A. N.A. N.A. N.A. N.A. N.A. N.R. N.R. N.R. N.R. N.R. N.R. 1 12 ·3 12 ·3 N.A. N.A. N.A. N.A. N.A. N.A. N.A. N.A. N.A. N.A. N.A. N.A. 3 45 ·0 15·0.
N.A. N.A. N.A. N.A. N.A. N.A. N.A. N.A. N.A. @ 1 ·2 N. N.A. N.A. N.A. N.A. N.A. N.A. N.A. N.A. N.A. N.A. N.A. N.A. N.A. N.A. N.A. N.A. N.A. N.A. N.A. N.A. N.A. N.A. N.A. N.A N.A. N.A. N.A. 2 30'6 15·3 N.A. N.A. N.A. N.A. N.A. N.A. 2 37·6 18·8 N.A. N.A. N.A. N.A. N.A. N.A. 5 68·3 13 ·6 2 22·5 11.3 1 19'5 19.5' N.A. N.A. N.A. N.A. N.A. N.A.
6 72·4 12 '1 2 75'8 37·9 7229·5 32·8 9230·2 25·6 9 158·2 17·6 7 83'0 11'9 N.R. N.R. N.R. 12 445'9 37·2 12 313 ·6 26·1 3 100·8 33'6 8 138·6 17·3 12267 ·0 22·2
, 3 72·8 24'3 2 25·5 12·8 3 123·8 41·3 N.A. N.A. N.A. 7293·2 41 '9 4 60'0 15·0 N.A. N.A. N.A. N.A. N.A. N.A. N.A. N.A. N.A. N.A. N.A. N.A. N.A. N.A. N.A. 2 15·0 7'5 N.A. N.A. N.A. ,N.R. N.R. N.R. N.A. N.A. N.A. N.A. N.A. N.A. N.A. N.A. N.A. N.A. N.A. N.A. N.A. N.A. N.A. N.A. N.A. N.A. 3 71 ·2 23·7 N.A. N.A. N.A. N.A. N.A. N.A. N.A. N.A. N.A.
\
1 12·0 J2.·0 @ 0'3 N. N.A. N.A. N.A. 2 24·2 12 ·1 N.R. N.R. N.R. N.R. N.R. N.R. 1 5·8 5·8 1 21 ·5 21'5 N.A. N.A. N.A. 1 3 ·0 3'0 N.A. N.A. N.A. 5 52·2 10'4
N.A. N.A. N.A. N.A. N.A. N.A. 3 23·9 8·0 N.A. N.A. N.A. N.A. N.A. N.A. 2 21·0 10·5 N.A. N.A. N.A. N.A. N.A. N.A. N.A. N.A. N.A. N.A. N.A. N.A. N.A. N.A. N.A. N.A. N.A. N.A.
2 9·0 4'5 3 64'2 21 ·4 N.A. N.A. N.A. N.A. N.A. N.A. N.A. N.A. N.A. 2 16'4 8'2 N.A. N.A. N.A. 10 171 ·0 17 ·1 1 9·0 9.0 N.A. N.A. N.A. N.A. N.A. N.A. 4 79'8 20'0
6 49·2 8'2 '7 144'6 20'7 9294'5 32·7 10264·5 26'5 14238'9 17 '1 4 124'6 31 ·2 N.R. N.R. N.R. 10 259·0 25·9 18495·9 27·6 7187'1 26'7 6148'6 24'8 13 372'3 28'6
5 105'0 21'0 4 44'0 11'0 4 65 ·0 16·3 N.A. N.A. N.A. 8262'1 32·8 5 141·0 28'2 N.A. N.A. N.A. N.A. N.A. N.A. N.A. N.A. N.A. 1 15·9 15·9 N.A. N.A. N.A. N.A. N.A. N.A. N.A. N.A. N.A. N.R. N.R. N.R. N.A. N.A. N.A. N.A. N.A. N.A. N.A. N.A. N.A. N.A. N.A. N.A. N.A. N.A. N.A. N.A. N.A. N.A. 5 72·2 14'4 N.A. N.A. N.A. N.A. N.A. N.A. N.A. N.A. N.A.
N.A. N.A. N.A. @ 0·2 N. N.A. N.A. N.A. 2 24'4 12·2 N.R. N.R. N.R. N.R. N.R. N.R. N.A. N.A. N.A. 1 28·2 28·2 N.A. N.A. N.A. 2 13·4 6·7 1 3'6 3'6 5 54'6 10'9 N.A. N.A. N.A. N.A. N.A. N.A. 3 29·8 9·9 N.A. N.A. N.A. N.A. N.A. N.A. 1 6'2 6'2 N.A. N.A. N.A. 1 7·0 7·0 N.A. N.A. N.A. N.A. N.A.N.A. @ 2'0 N. N.A. N.A. N.A. N.A. N.A. N.A. 3 45'4 15 '1 N.A. N.A. N.A. N.A. N.A. N.A. 2 22'6 11·3 2 16'6 8'3 N.A. N.A. N.A. 7 85'0 12·1 1 17·0 17·0 N.R. N.R. N.R. 2 15'6 7·8 6 116'4 19'4
6 98·5 16'4 9 159·0 17·7 10217·2 21 ·7 13 294'6 22'7 10153'3 1$'3 5 52'4 10·5 N.R. N.R. N.R. 12 '272 '2 22'7 17422·4 24·8 6 141 '8 23'6 5 150·2 30·0 11 181·2 16'5
4 140'3 35 '1 4 26'0 6'5 8225·0 28'1 N.A. N.A. N.A. 8339'8 42'5 3 92'8 30'9 N.A. N.A. N.A. N.A. N.A. N.A. N.A. N.A. N.A. N.A. N.A. N.A. N.A. N.A. N.A. N.A. N.A. N.A. N.A. N.A. N.A. N.R. N.R. N.R. N.A. N.A. N.A. N.A. N.A. N.A. N.A. N.A. N.A. N.A. N.A. N.A. N.A. N.A. N.A. N.A. N.A. N.A. 5 72·6 14·5 N.A. N.A. N.A. N.A. N.A. N.A. N.A. N.A. N.A.
N.A. N.A. N.A. @ 0'2 N. N.A. N.A. N.A. N.A. N.A. N.A. N.R. N.R. N.R. N.R. N.R. N.R. N.A. N.A. N.A. 2 30'4 15'2 N.A. N.A. N.A. N.A. N.A. N.A. N.A.~ N.A. N.A. N.A. N.A. N.A.
N.A. N.A. N.A. N.A. N.A. N.A. 2 36.9 18'4 N.A. N.A. N.A. N.A. N.A. N.A. N.A. N.A. N.A. N.A. N.A. N.A. N.A. N.A. N.A. N.A. N.A. N.A. N.A. N.A. N.A. @ 1·6 N. N.A. N.A. N.A .. N.A. N.A. N.A. 2 29'5 14'8 N.A. N.A. N.A. N.A. N.A. N.A. 2 23'5 11'8 1 21'0 21 '0 N.A. N.A. N.A. 3 63'0 21 '0 1 8·0 8·0 N.A. N.A. N.A. N.A. N.A. N.A. 2 46'0 23·0
5 97'4 19 ·5 6 86·8 14'5 7 349-4 49'9 14534'0 38 '1 3 80·0 26'7 2 47'0 23'5 N.R. N.R. N.R. 9 382'4 42'5 11 340·5 31'0 2 76·0 38'0 7220'0 31'4 12217'1 18 '1
3 101 '4 33'8 1 14'6 14'6 4215·3 53·8 N.A. N.A. N.A. 7275'6 39'4 3 72'0 24'0 N.A. N.A. N.A. N.A. N.A. N.A. N.A. N.A. N.A. N.A. N.A. N.A. N.A. N.A. N.A. N.A. N.A.N.A. N.A. N.A. N.A. N.R. N.R. N.R. N.A. N.A. N.A. N.A. N.A. N.A. N.A. N.A. N.A. N.A. N.A. N.A. N.A. N.A. N.A. N.A. N.A. N.A. 1 53·0 53·0 N.A. N.A. N.A. N.A. N.A. N.A. N.A. N.A. N.A.
N.A. N.A. N.A. @ 0·2 N. N.A. N.A. N.A. 2 26·0 13'0 N.R. N.R. N.R. N.R. N.R. N.R. N.A. N.A. N.A. 1 16'2 16·2 N.A. N.A. N.A. 1 5'0 5'0 1 6'0 6'0 5 51'8 10·4 N.A. N.A. N.A. N.A. N.A. N.A. 2 36'0 18'0 N.A. N.A. N.A. N.A. N.A. N.A. 1 30'0 30'0 N.A. N.A. N.A. N.A. N.A. N.A. N.A. N.A. N.A. N.A. N.A. N.A. N.A. N.A. N.A. N.A. N.A. N.A. N.A. N.A. N.A. 2 28'2 14 '1 N.A. N.A. N.A. N.A. N.A. N.A. @ 1'2 N. 1 4'0 4·0 N.A. N.A. N.A. 4 76·1 19'0 4 87'9 22'0 1 5'0 5'0 N.A. N.A. N.A. 4 77'0 19·3
3 37'6 12~5 8 136'0 17'0 9 146'0 16'0 11 196.8 17·9 8 178 '5 22'3 8 147'0 18'4 N.R. N.R. N.R. 10 278'0 27'8 13448'0 34·5 7 149'5 21'4 7 245'7 35'1 11 228'0 20·7
2 276'9 138'5 2 17'0 8 ·5 7 151 '0 21'6 N.A. N.A. N.A. 8 339.6 42'5 6 120'0 20'0 1 24'1 24'1 1 12·0 12'0 N.A. N.A. N.A. 3 58'8 19'6 N.A. N.A. N.A. 1 8'0 8·0
N.A. N.A. N.A. N.R. N.R. N.R. N.A. N.A. N.A. N.A. N.A. N.A. N.A. N.A. N.A.N.A. N.A. N.A. N.A. N.A. N.A. N.A. N.A. N.A. 5 82'0 16'4 N.A. N.A. N.A. N.A. N.A. N.A. N.A. N.A. N.A.
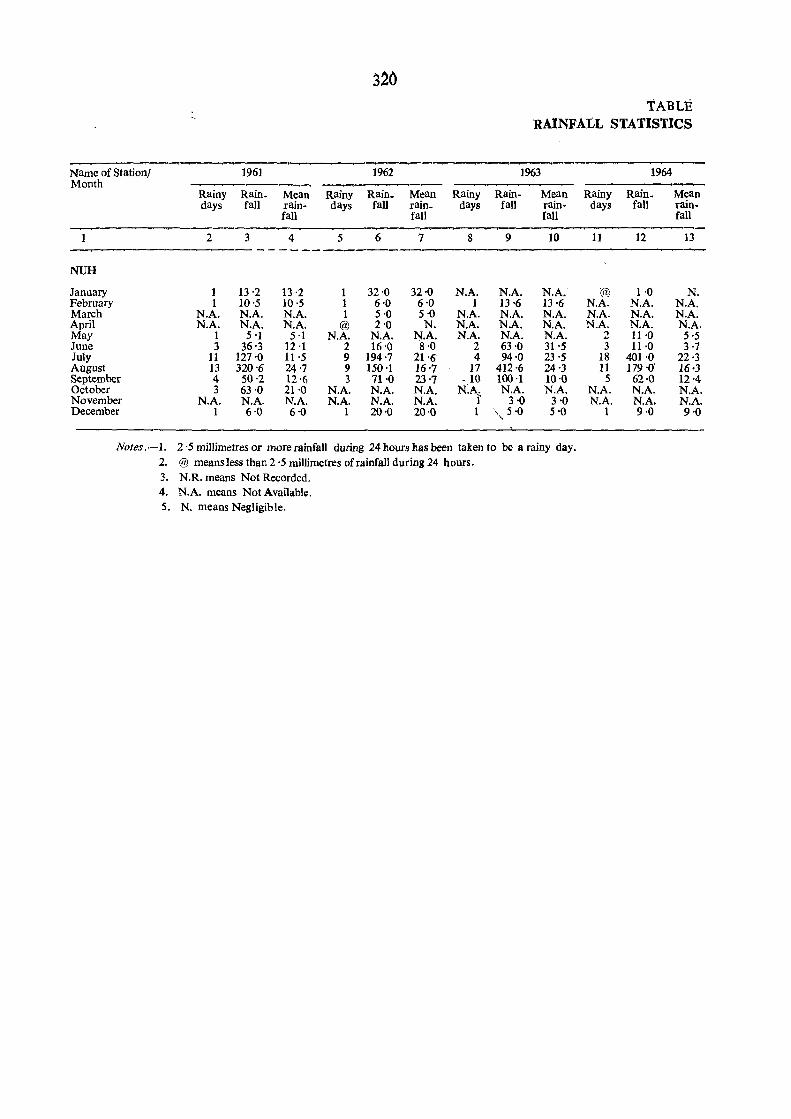
~2()
TABLE RAINFALL STATISTICS
~~
Name of Station/ 1961 1962 1963 1964 Month
Rainy Rain. Mean Rainy Rain. Mean Rainy Rain· Mean Rainy Rain. Mean days fall rain· days fall rain. daYB fall rain· days fall rain·
fall fall Call fall ~--
2 3 4 5 6 7 8 9 10 11 12 13 ------
NUB
January 1 13·2 13·2 1 32'0 32·0 N.A. N.A. N.A. @ 1 ·0 N. February 1 10'5 10·5 1 6'0 6·0 1 13'6 13 ·6 N.A. N.A. N.A. March N.A. N.A. N.A. 1 5'0 5·0 N.A. N.A. N.A. N.A. N.A. N.A. April N.A. N.A. N.A. @ 2'0 N. N.A. N.A. N.A. N.A. N.A. N.A. May 1 5 '1 5 ·1 N.A. N.A. N.A. N.A. N.A. N.A. 2 11·0 5·5 June 3 36'3 12 ·1 2 16'0 g·O 2 63'0 31 '5 3 11·0 3 ·7 July 11 127'0 11 ·5 9 194·7 21'6 4 94·0 23'5 18 401·0 22·3 August 13 320'6 24'7 9 150'1 16'7 17 412·6 24 '3 11 179 '0' 16·3 September 4 50'2 12'6 3 71·0 23'7 .10 lOG'1 10·0 5 62·0 12·4 October 3 63·0 21'0 N.A. N.A. N.A. NA N.A. N.A. N.A. N.A. N.A. November N.A. N.A. N.A. N.A. N.A. N.A. f 3'0 3 '0 N.A. N.A. N.A. December 1 6·0 6·0 1 20·0 20'0 1 .... 5'0 , 5 '0 1 9·0 9·0
NOles.-l. 2 ·5 millimetres or more rainfall during 24 hours has been taken to be a rainy day. 2. @ means less than 2·5 millimefres of rainfall during 24 hours. 3. N.R. means Not Recorded. 4. N.A. means Not Available. 5. N. means Negligible.
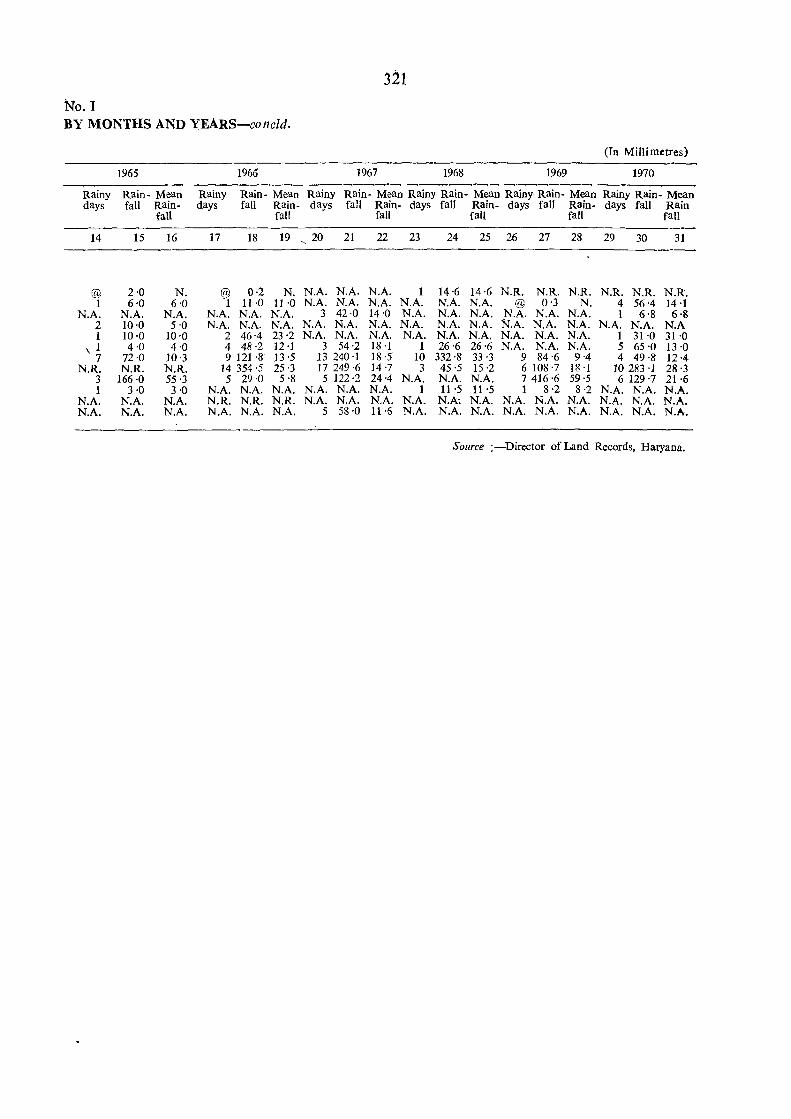
321
No. I BY MONTHS AND YEARS-concld.
1965
Rainy Rain - Mean days fall Rain
fall
14 15 16
@ 2·0 N. 1 6·0 6'0
N.A. N.A. N.A. 2 10·0 5·0 1 10·0 10'0
\ 1 4·0 4'0 7 72·0 10·3
N.R. N.R. N.R. 3 166·0 55·3 1 3·0 3 ·0
N.A. N.A. N.A. N.A. :l'{.A. N.A.
Rainy days
17
@ '1
N.A. N.A.
2 4
1966 1967 1968 1969
(In Millimetres)
1970
Rain- Mean Rainy Rain- Mean Rainy Rain- Mean Rainy Rain- Mean Rainy Rain- Mean fall Rain- days fall Rain- days fall Rain- days fall Rain- days fall Rain
fall fall fall fall fall
18 19, 20 21 22 23 24 25 26 27 28 29 30 31
0·2 N. N.A. N.A. N.A. 1 14·6 14·6 N.R. N.R. N.R. N.R. N.R. N.R. 11 ·0 11 ·0 N.A. N.A. N.A. N.A. N.A. NA. @ 0'3 N. 4 56'4 14 ·1
NA- N.A. 3 42·0 14'0 N.A. N.A. NA. NA. N.A. N.A. 1 6·8 6·g N.A. N.A. N.A. N.A. N.A. N.A. N.A. N.A. N.A. N.A. N.A. N.A. N.A. N.A 46·4 23'2 N.A. N.A. N.A. N.A. N.A. N.A. N.A. N.A. N.A. 1 31 '0 31 ·0 48 ·2 12 ·1 3 54·2 18 ·1 1 26'6 26'6 N.A. N.A. N.A. 5 65'0 13 ·0
9 121 ·8 13'5 13 240·1 18 ·5 10 332·8 33'3 9 84'6 9'4 4 49·8 12'4-14 354·5 25'3 17 249·6 14'7 3 45·5 15 '2 6108'7 18 ·1 10283 ·1 28·3 5 29·0 5·8 5 122·2 24'4 N.A. N.A. N.A. 7 416·6 59'5 6129·7 21 ·6
N.A. N.A. N.A. N.A. N.A. N.A. 1 11 ·5 11'5 1 8·2 8·2 N.A. N.A. N.A. N.R. N.R. N.R. N.A. N.A. N.A. N.A. N.A: N.A. N.A. N.A. N.A. N.A. N.A. N.A. N.A. NA. N.A. 5 58·0 11·6 N.A. N.A. N.A. N.A. N.A. N.A. N.A. N.A. N.A.
Source ;-Director of Land Records, Haryana.

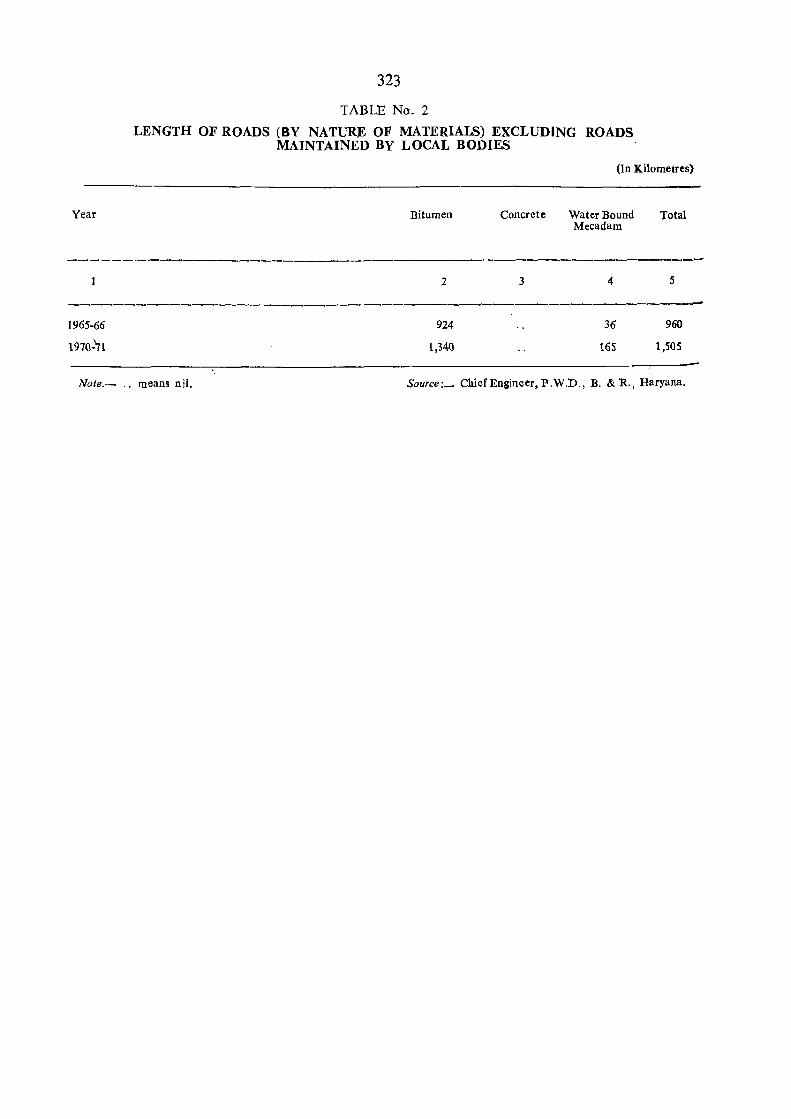
Year
323
TABLE No.2
LENGTH OF ROADS (BY NATURE OF MATERIALS) EXCLUDING ROADS MAINTAINED By LOCAL BODIES
(In Kilometres)
Bitumen Concrete Water Bound Total Mecadam
2 3 5
---------------------------------------------------------1965-66
1970-71
Note.- .. means nil.
924
1,140
36
165
960
1,505
Source:_ CltiefEngineer, P.W.D., B. & R., Haryana.
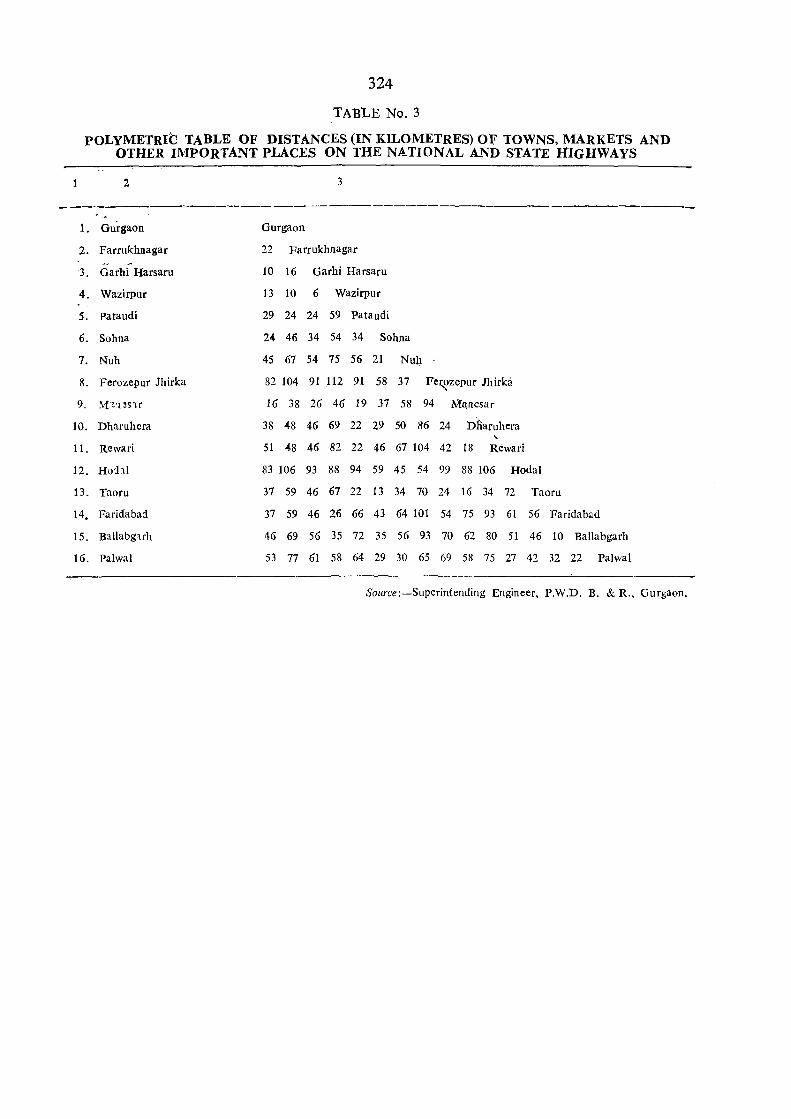
324
TABLE No.3
POLYMETRIC TABLE OF DISTANCES (IN KILOMETRES) OF TOWNS, MARKETS AND OTHER IMPORTANT PLACES ON THE NATIONAL AND STATE HIGHWAYS
1 2 3
-----------1. Gurgaon Gurgaon
2. Farrukhnagar 22 Farrukhnagar
3. Garhi Harsaru 10 16 Garhi Harsaru
4. Wazirpur 13 10 6 Wazirpur
5. pataudi 29 24 24 59 pataudi
6. Sohna 24 46 34 54 34 Sohna
7. Nuh 45 67 54 75 56 21 Nuh
8. Ferozepur Jhirka 82 104 91 112 91 58 37 Fef.?zepur Jhirka
9. M"nnr 16 38 26 46 19 37 58 94 Mllnesar
10. Dharuhera 38 48 46 69 22 29 50 86 24 Dliaruhera .. 11. Rewari 51 48 46 82 22 46 67 104 42 18 Rewari
12. Hohl 83 106 93 88 94 59 45 54 99 88 106 Hodal
13. Taoru 37 59 46 67 22 13 34 70 24 16 34 72 Taoru
14. Faridabad 37 59 46 26 66 43 64 101 54 75 93 61 56 Faridabad
15. Ballabguh 46 69 56 35 72 35 56 93 70 62 80 51 46 10 BaUabgarh
16. Palwal 53 77 61 58 64 29 30 65 69 58 75 27 42 32 22 Palwal
SOllrce:-Superintending Engineer, P.W.D. B. & R., Gurgaon.
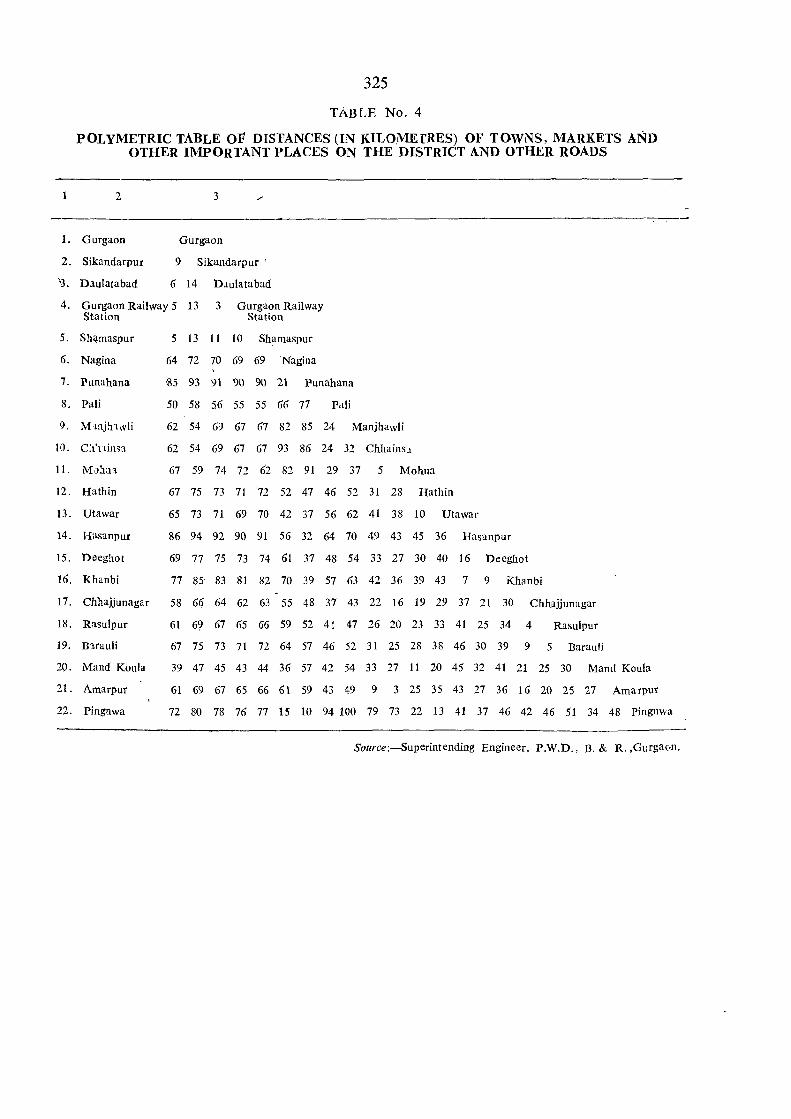
325
TABLE No.4
POLYMETRIC TABLE OF DISTANCES (IN KILOMErRES) OF TOWNS, MARKETS AND OTHER IMPORTANT PLACES ON THE DISTRICT AND OTHER ROADS
2
1. Gurgaon
2. Sikandarpur
'3. Dlulatabad
3
Gurgaon
9 Sikandarpur'
6 14 Dlulatabad
4. Gurgaon Railway 5 13 3 Gurgaon Railway Station Station
5. SMmaspur
6. Nagina
7, Punahana
8. Pali
9, Mtnj;nwli
10. CYninn
11. M0!1:11
12. Hathin
13. Utawar
14. Hasanpur
15. Deeghot
16. Khanbi
5 13 11 10 Shamaspur
64 72 70 69 69 'Nagina
85 93 91 90 90 21 Punahana
50 58 56 55 55 66 77 Pali
62 54 69 67 67 82 85 24 Manjhawli
62 54 69 67 67 93 86 24 32 Chhainsl
67 59 74 72 62 82 91 29 37 5 Mohna
67 75 73 71 72 52 47 46 52 31 28 Hathin
65 73 71 69 70 42 37 56 62 41 38 10 Utawar
86 94 92 90 91 56 32 64 70 49 43 45 36 Hasanpur
69 77 75 73 74 61 37 48 54 33 27 30 40 16 Deeghot
77 85 83 81 82 70 39 57 63 42 36 39 43 7 9 Khanbi
17. Chhajjunagar 58 66 64 62 63 55 48 37 43 22 16 19 29 37 21 30 Chhajjunagar
18. Rasulpur 61 69 67 65 66 59 52 4l 47 26 20 23 33 41 25 34 4 Rasulpur
19. il1.rauli 67 75 73 71 72 64 57 46 52 31 25 28 38 46 30 39 9 5 Barauli
20. Mand Koula 39 47 45 43 44 36 57 42 54 33 27 11 20 45 32 41 21 25 30 Mand Koula
21. Amarpur 61 69 67 65 66 61 59 43 49 9 3 25 3S 43 27 36 16 20 2S 27 Amarpur
22. Pingnwa 72 80 78 76 77 15 10 94 100 79 73 22 13 41 37 46 42 46 51 34 48 Pingnwa
Source:-Superintending Engineer, P.W.D., B, & R. ,Gurgaon .
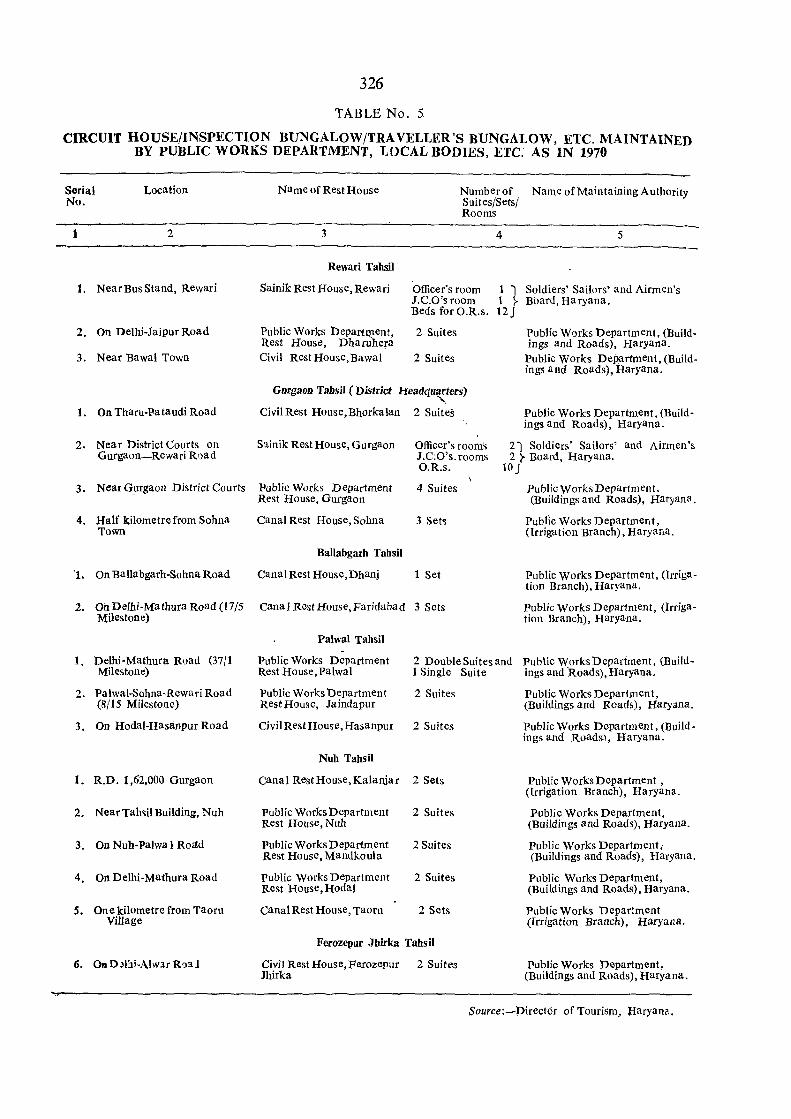
326
TABLE No.5
CIRCUIT HOUSE/INSPECTION BUNGALOW /TRA VELLER 's BUNGALOW, ETC. MAINTAINED BY PUBLIC WORKS DEPARTMENT, LOCAL BODIES, ETC. AS IN 1970
Serial No.
1
Location
2
1. NearBusStand, Rewari
2. On Delhi-Jaipur Road
3. Near Bawal Town
1. On Tharu-pataudi Road
2. Near District Courts on Gurgaon~Rewari Road
3. Near G_urgaon District Courts
4. Half kilometre from Sohna Town
'1. On Ballabgarh-Sohna Road
Name of Rest House
3
Rewari Tahsil
Sainik Rest House, Rewari
Public Works Departrp.ent, Rest Hause, Dhanihera Civil Rest House, Bawal
Number of Name of Maintaining A ulhority Suites/Sets/ Rooms
4 5
Officer's room 1 I Soldiers' Sailors' and Airmen's J.C.O'sroom 1 ~ Board,Haryana. Beds forO.R.s. 12J
2 Suites
2 Suites
Public Works Department, (Build. ings and Roads), Haryana .
Public Works Department, (Buildings and Roads), Haryana.
Gurgaol) Tabsil (District Headquarters)
"". Civil Rest House,Bhorkalan 2 Suites
Sainik Rest House, Gurgaon
Public Works Department Rest House, Gurgaon
Canal Rest House, Sohna
BaUabgarh Tahsil
Canal Rest House,Dhanj
Officer's rooms J.C:O's. rooms O.R.s.
4 Suites
3 Sets
1 Set
Public Works Department, (Build· ings and Roads), Haryana.
21 Soldiers' Sailors' and Airmen's 2 r Board, Haryana.
10 J Public Works Department. (Buildings and Roads), Haryana .
Public Works Department, (Irrigation Branch), Haryana.
Public Works Department, (Irrigation Branch), Haryana .
2. On Delhi-Mathura Road (17/5 cana I RestHouse,Faridabad 3 Sets Milestone)
Public Works Department, (Irrigation Branch), Haryana.
1. Delhi-Mathura Road (37/1 Milestone)
2. Palwal-Sohna-Rewari Road (8/15 Milestone)
3. On Hodal-Hasanpur Road
1. R.D. 1,62,000 Gurgaon
2. Near Tahsil Building, Nuh
3. On Nuh-palwal Roltd
4. On Delhi-Mathura Road
S. On e kilometre from Taoru Village
6. 00 D~lhi-Alwa.r R')a:i
Palwal Tahsil
Public Works Department Rest House, palwal
2 Double Suites and Public Works Department, (Build-1 Single Suite ings and 'Roads), Haryana.
Public Works bepartment 2 Suites Rest Hause, Jaindapur
Civil Rest House, Hasanpur 2 Suites
Nuh Tahsil
canal Rest House, Kalanjar 2 Sets
Public Works Department 2 Suites Rest House, Nuh
Public Works Department 2 Suites Rest House, Mandkoula
Public Works Department 2 Suites Rest House, Hodal
Canal Rest House, Taoru 2 Sets
Ferozepur Jhirka Tahsil
Civll Rest House, Ferozepur 2 Suites Jhirka
Public Works Department, (Buildings and Roads), Haryana.
Public Works Department, (Buildings and Roads.), Haryana.
Public Works Department, (Irrigation Branch), Haryana.
Public Works Department, (Buildings and Roads), Haryana.
Public Works Department,· (Buildings and Roads), Haryana.
Public Works Department, (Buildings and Roads), Haryana.
Public Works Department (Irrigation Branch), Haryan8.
Public Works Department, (Buildings and Roads), Haryana.
$ource:-DirecI6r of Tourism, lIaryana.
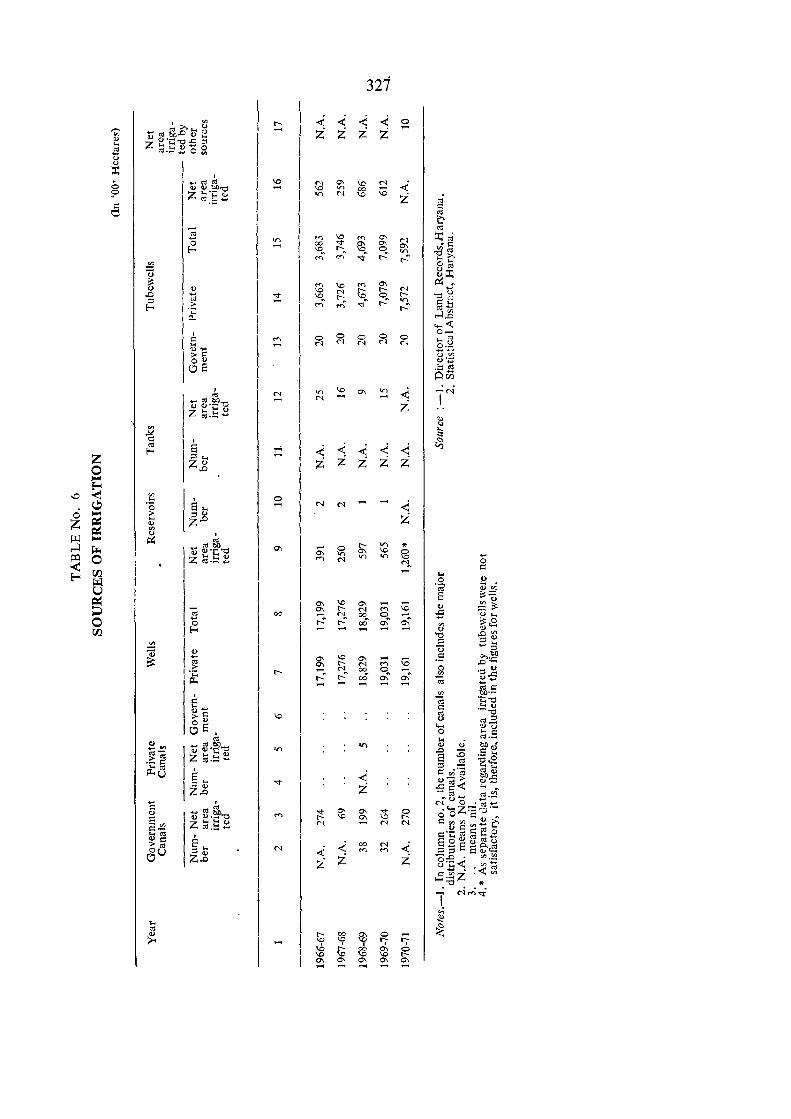
Is .. [
;::IV z..o o -
321
--< --< --< --< iii i
o N
o <'I
o N
--< i
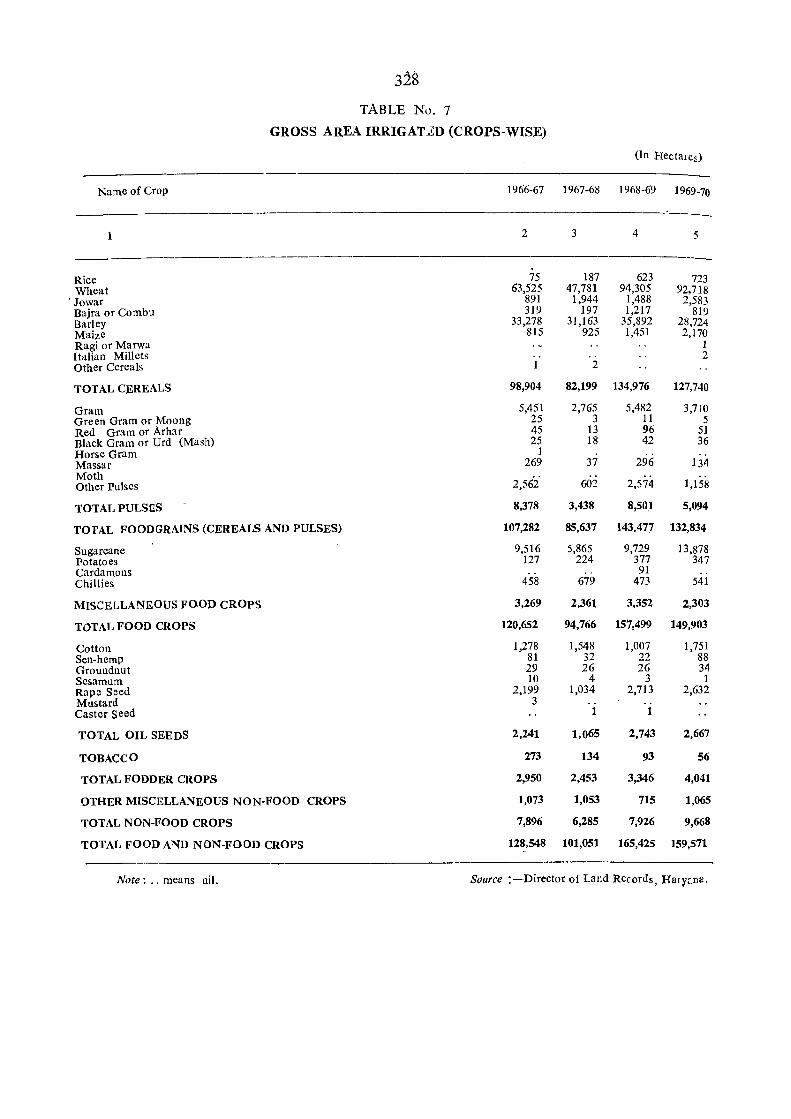
328
TABLE No.7
GROSS AREA IRRIGAt2D (CROPS-WISE)
(In Hectares)
Name of Crop 1966-67 1967-68 1968-69 1969-70 --_ 1 2 3 4 5
Rice 75 187 623 723 Wheat 63,525 47,781 94,305 92,718
, Jowar 891 1,944 1,488 2,583 Bajra or Combu 319 197 1,217 819 Barley 33,278 31,163 35,892 28,724 Maize 815 925 1,451 2,170 Ragi or Marwa 1 Italian Millets ' , 2 Other Cereals 1 2
TOTAL CEREALS 98,904 82,199 134,976 127,740
Gram 5,451 2,765 5,482 3,710 Green Gram or Moong 25 3 11 5 Red Gram or Arhar 45 13 96 51 Black Gram or Drd (Mash) 25 18 42 36 Horse Gram 1 Massar 269 37 296 134 Moth
2,562' Other pulses 602 2,574 1,158
TOTAL PULSES 8,378 3,438 8,501 5,094
TOTAL FOODGRAINS (CEREALS AND PULSES) 107,282 85,637 143.477 132,834
Sugarcane 9,516 5,865 9,729 13,878 Potatoes 127 224 377 347 Cardamons ' , 91 Chillies 458 679 473 541
MISCELLANEOUS FOOD CROPS 3,269 2,361 3,352 2,303
TOTAL FOOD CROPS 120,652 94,766 157,499 149,903
Cotton 1,278 1,548 1,007 1,751 Sen-hemp 81 32 22 88 Groundnut 29 26 26 34 Sesamum 10 4 3 1 Rape Seed 2,199 1,034 2,713 2,632 Mustard 3 Caster seed
TOTAL OIL SEEDS 2,241 1,065 2,743 2,667
TOBACCO 273 134 93 56
TOTAL FODDER CROPS 2,950 2,453 3,346 4,041
OTHER MISCELLANEOUS NON-FOOD CROPS 1,073 1,053 715 1,065
TOTAL NON-FOOD CROPS 7,896 6,285 7,926 9,668
TOTAL FOOD AND NON-FOOD CROPS 128,548 101,051 165,425 159,571
Note: .. means nil. Source : -Director of Lar.d Records, Hary<_na,
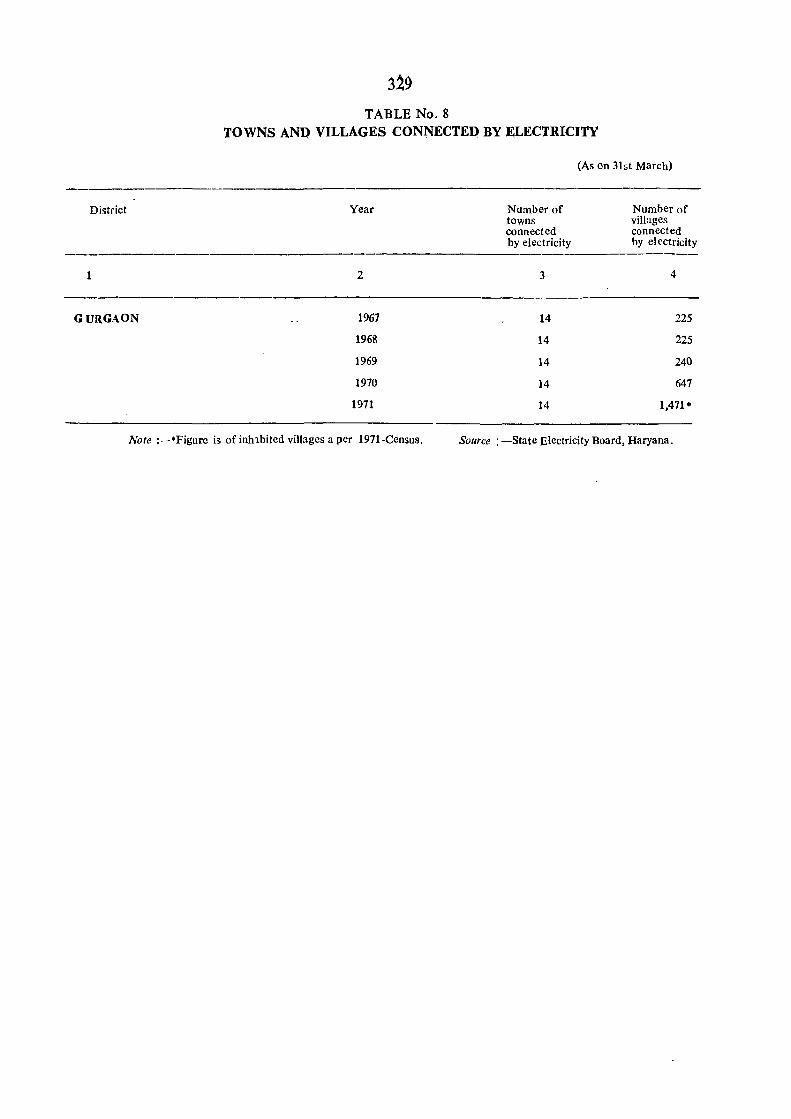
3~9
TABLE No.8 TOWNS AND. VILLAGES CONNECTED BY ELECTRICITY
District
1
GURGAON
Year
2
1967
1968
1969
1970
1971
Note :-*Figure is of inh'lbited villages a per 1971-Census.
Number of towns connected by electricity
3
14
14
14
14
14
(As on 31st March)
Number of villages connected by electricity
4
225
225
240
647
1,471*
Source: -State Electricity Board, Haryana.
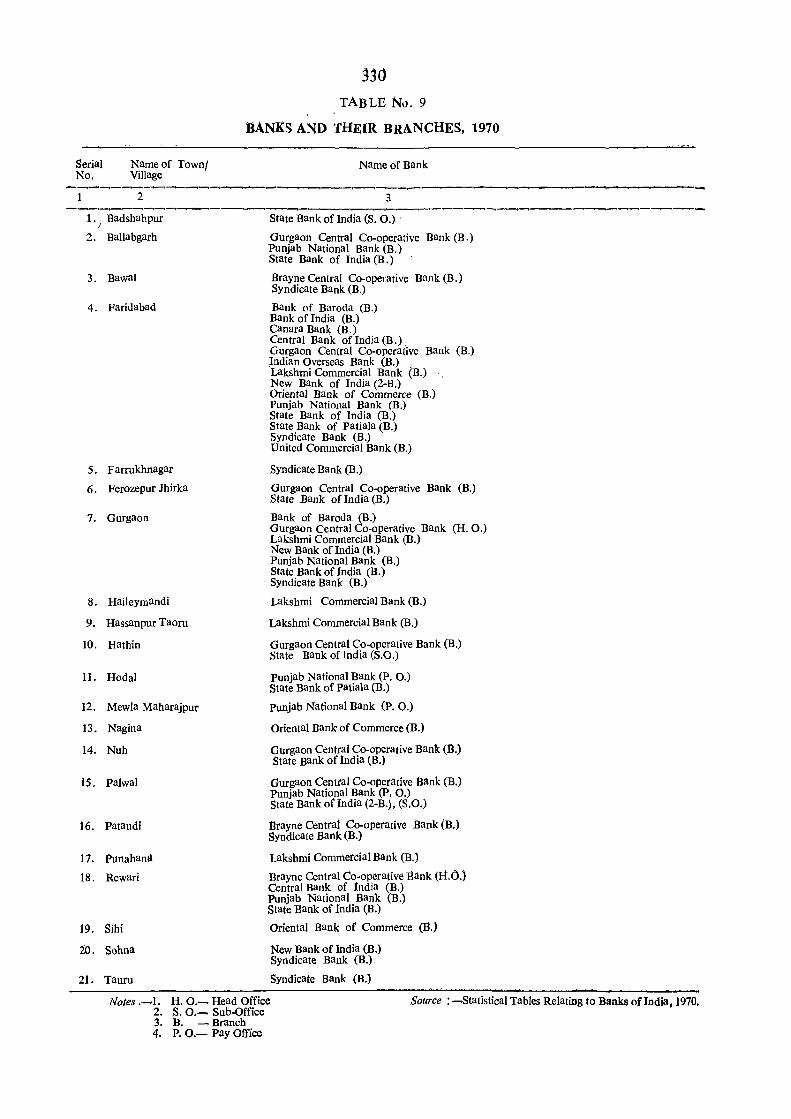
TABLE No.9
BANKS AND THEIR BRANCHES, 1970
Serial No.
Name of Townl Village
2
1 . / Badshahpur
2. Ballabgarh
3. Bawal
4. Faridabad
5. Farrukhnagar
6, Ferozepur Jhirka
7. Gurgaon
8, Haileymandi
9. Hassanpur Taoru
10, Hathin
11. Hodal
12. Mewla Maharajpur
13. Nagina
14. Nuh
15. palwal
16, Pataudl
17. Punahan!l
18, Rewari
19, Sihi
20. Sohna
21. Tauru
Name of Bank
'~-~,__..-------.------3
State Bank of India (S. 0.)
GUrgaon Central Co-operative Bank (B.) Punjab National Bank (B.) State Bank of India (B,)
Brayne Central Co-operative Bank (B,) Syndicate Bank (B,) .
Bank of Baroda (B,) Bank of India (B,) Canara Bank (B,) Central Bank ofIndia (B,), Gurgaon Central Co-operative Bank (B.) Indian Overseas Bank (B.) . Lakshmi Commercial Bank (B,) . New Bank of India (2-B.) Oriental Bank of Commerce (B.) Punjab National Bank (B.) State Bank of India (B,) State Bank of Patiala (B.) Syndicate Bank (B.) United Commercial Bank (B.)
Syndicate Bank (B.)
Gurgaon Central Co-operative Bank (B,) State Bank of India (B.)
Bank of Baroda (B.) Gurgaon Central Co-operative Bank (H. 0.) Lakshmi Commercial Bank (B.) New Bank of India (B.) Punjab National Bank (B.) State Bank of India (B.) Syndicate Bank (B,)
Lakshmi Commercial Bank (B,)
Lakshmi Commercial Bank (B,)
Gurgaon Central Co-operative Bank (B.) State Bank of India (S,O.)
Punjab National Bank (P.O.) State Bank of patiala (B,)
Punjab National Bank (P.O.)
Oriental Bank of Commerce (B.)
Gurgaon Central Co-operative Bank (B.) State Bank of India (B.)
Gurgaon Central Co"operative Bank (B.) Punjab National Bank (p.O.) State Bank of India (2-B,), (S.O,)
Brayne Central Co-operative Bank (B,) Syndicate Bank (B.)
Lakshmi Commercial Bank (B.)
Brayne Central Co-operative Bank (It.O.) Central Bank of India (B,) Punjab National Bank (B.) State Bank of India (B.)
Oriental Bank of Commerce (E.)
New Bank of India (B,) Syndicate Bank (B.)
Syndicate Bank (B.)
Notes .-1. H. O.~ Head Office Source :~Statistical Tables Relating to Banks oflndia, 1970. 2. S. o,~ Sub-Office 3. B. _ Branch 4. P. 0.- Pay Office
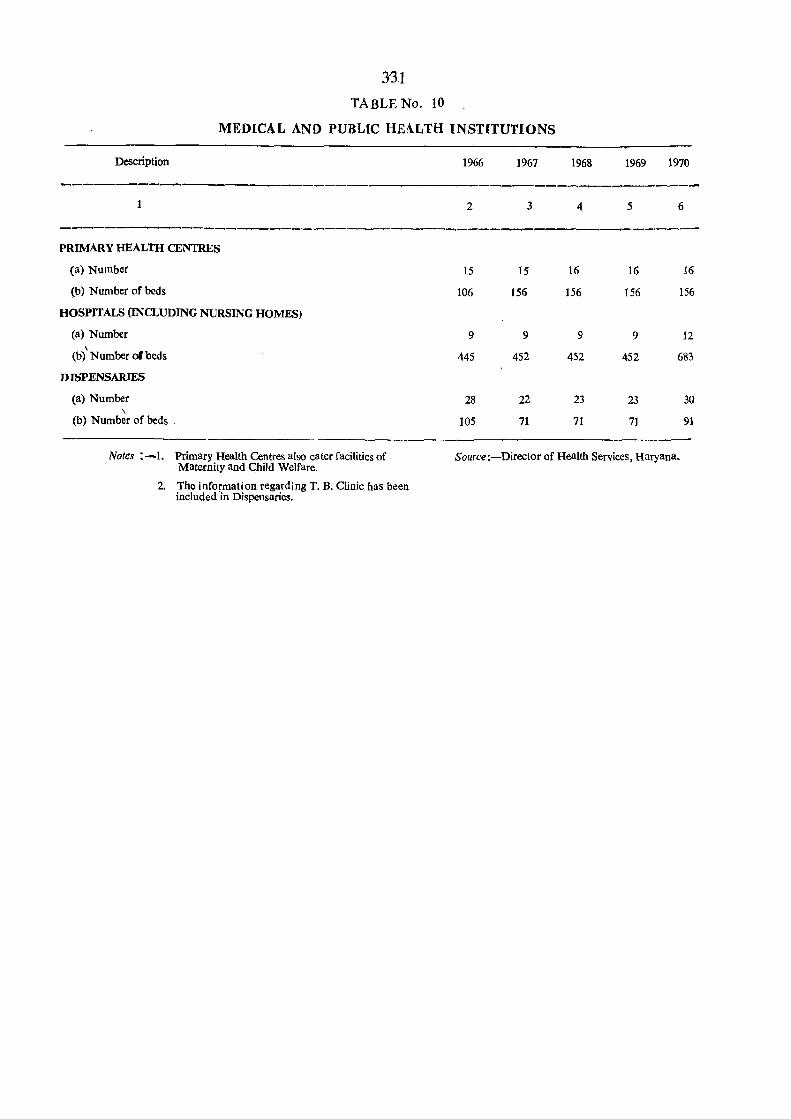
Description
3'31
TABLE No. 10
MEDICAL AND PUBLIC HEALTH INSTITUTIONS
1966 1967 1968 1969 1970
------------------------------------------2 3 4 5 6
--------------_,---_..,-----------.-----~------------
PRIMARY HEALTH CENTRES
(a) Number
(b) Number of beds
HOSPITALS (INCLUDING NURSING HOMES)
(a) Number \
(b) Number 01 beds
D ISPENSARlES
(a) Number \
(b) Number of beds.
Notes : --1. Primary Health Centres also cater facilities of Maternity and C;hiId Welfare.
2. The information regarding T. B. Clinic has been included in Dispensaries.
15 15 16 16 16
106 156 156 156 156
9 9 9 9 12
445 452 452 452 683
28 22 23 23 30
105 71 71 71 91
Source:-Director of Health Services, Haryana.
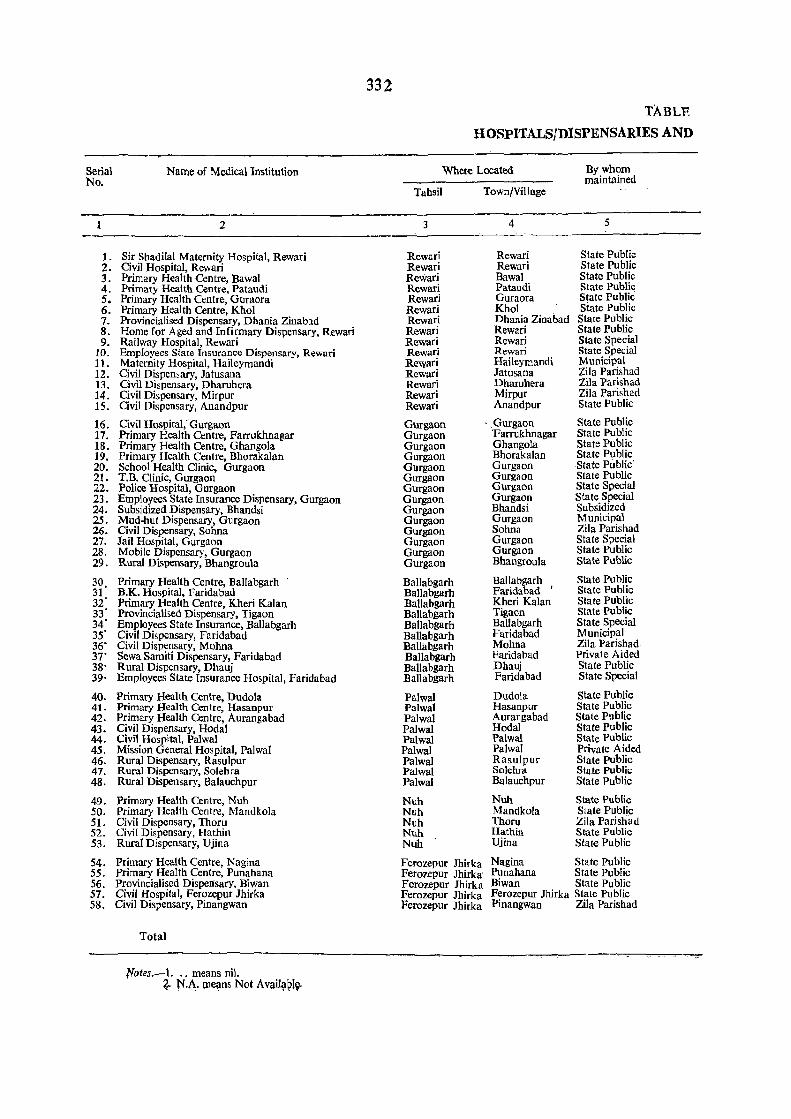
332
Serial Name of Medical Institution No.
1 2
1- Sir Shadilal Maternity Hospital, Rewati 2. Civil Hospital, Rewari 3. Primary Health Centre, Bawal 4. Primary Health Centre, Pataudi 5. Primary Health Centre, Guraora 6. Primary Health Centre, Khol 7. Provincialised Dispensary, Dhania Zinabad 8. Home for Aged and Infirmary Dispensary, Rewari 9. Railway Hospital, Rewari
10. Employees State Insurance Dispensary, Rewari 11. Maternity Hospital, Haileymandi 12. Civil Dispenmry, Jatusana 13. Civil Dispensary, Dharuhera 14. Civil Dispensary, Mirpur 15. Civil Dispensary, Anandpur
16. Civil Hospital;'Gurgaon 17. Primary Health Centre, Farrukhnagar IS. Primary Health Centre, Ghangola 19. Primary Health Centre, Bhorakalan 20. School Health Clinic, Gurgaon 21. T.B. Clinic, Gurgaon 22. Police Hospital, Gurgaon 23. Employees State Insurance Dispensary, Gurgaon 24. Subsidized Dispensary, Bhandsi 25. Mud·but Dispensary, Gurgaon 26. Civil Dispensary, Sohna 27. Jail Hospital, Gurgaon 28. Mobile Dispensary, Gurgaon 29. Rural Dispensary, Bbangroula
30. Primary Health Centre, Ballabgarh 31 B.K. Hospital, Faridabad 32' Primary Health Centre, Kheri Kalan 33' Provincialised Dispensary, Tigaon 34' Employees State Insurance, Ballabgarh 35' Civil Dispensary, Faridabad 36' Civil Dispensary, Mohna 37' Sewa Samiti Dispensary, Faridabad 38' Rural Dispensary, Dhauj 39' Employees State Insurance Hospital, Faridabad
40. Primary Health Centre, Dudola 41. Primary Health Centre, Hasanpur 42. Primary Health Centre, Aurangabad 43. Civil Dispensary, Hodal 44. Civil Hospital, Pa]wal 45. Mission General Hospital, Palwal 46. Rural Dispensary, Rasulpur 47. Rural Dispensary, Solehra 48. Rural Dispensary, Balauchpur
49. Primary Health Centre, Nuh 50. Primary Health Centre, Mandkola 51. Civil Dispensary, Thoru 52. Civil Dispensary, Hathin 53. Rural Dispensary, Ujina
54. Primary Health Centre, Nagina 55. Primary Health Centre, Punahana 56. Provincialised Dispensary, Biwan 57. Civil Hospital, Ferozepur Jhirka 58. Civil Dispensary, Pinangwan
Total
ffutes.-l. " means nil. ~, N.A.llle~ns Not Avail{l~19·
TABLE
H OSPITALSfDISPENSARIES AND
Where Located By whom maintained
Tahsil Town/Village
3 4 5
Rewari Rewari State Public Rewari Rewari State Public Rewari Bawal State Public Rewari Pataudi State Public Rewari Guraora State Public Rewari Khol state Public Rewari Dhania Zinabad State Public Rewari Rewari State Public Rewari Rewari State Special Rewari Rewari State Special Rewari Haileymandi Municipal Rewari Jatusana Zila Parishad Rewari Dharuhera Zila Parishad Rewari Mirpur Zila Parishad Rewari Anandpur State Public
Gurgaon Gurgaon State Public Gurgaon 'Farrukhnagar State Public Gurgaon Ghangola State Public Gurgaon Bhorakalan State Public, Gurgaon Gurgaon State Public' Gurgaon Gurgaon State Public Gurgaon Gurgaon State Special Gurgaon Gurgaon State Special Gurgaon Bhandsi Subsidized Gurgaon Gurgaon Municipal Gurgaon Sobna Zila Parishad Gurgaon Gurgaon State Special Gurgaon Gurgaon State Public Gurgaon Bhangroula State Public
Ballabgarh Ballabgarh State Public Ballabgarh Faridabad
, State Public Ballabgarh Kheri Kalan State Public Ballabgarh Tigaon State Public Ballabgarh Ballabgarh State Special Ballabgarh Faridabad Municipal Ballabgarh Mohna Zila Parishad Ballabgarh Faridabad Private Aided Ballabgarh Dhauj State Public Ballabgarh Faridabad State Special
Palwal Dudola State Public Palwal Hasanpur State Public Palwal Aurangabad State Public Palwal Hodal State Public Palwal Palwal State Public Palwal Palwal Private Aided Palwal Rasulpur State Public Palwal Solehra State public Palwal Balauchpur State Public
Nuh Nuh State Pubtic Nuh Mandkola State Public Nuh Thoru Zila Parishad Nuh Hathin State Public Nub Ujina State Public
Ferozepur Jhirka Nagina State Public Ferozepur Jhirka' Punahana State Public Ferozepur Jhirka Biwan State Public Ferozepur Jhirka Ferozepur Jhirka State Public Ferozepur Jhirka Pinangwan Zila Parish ad
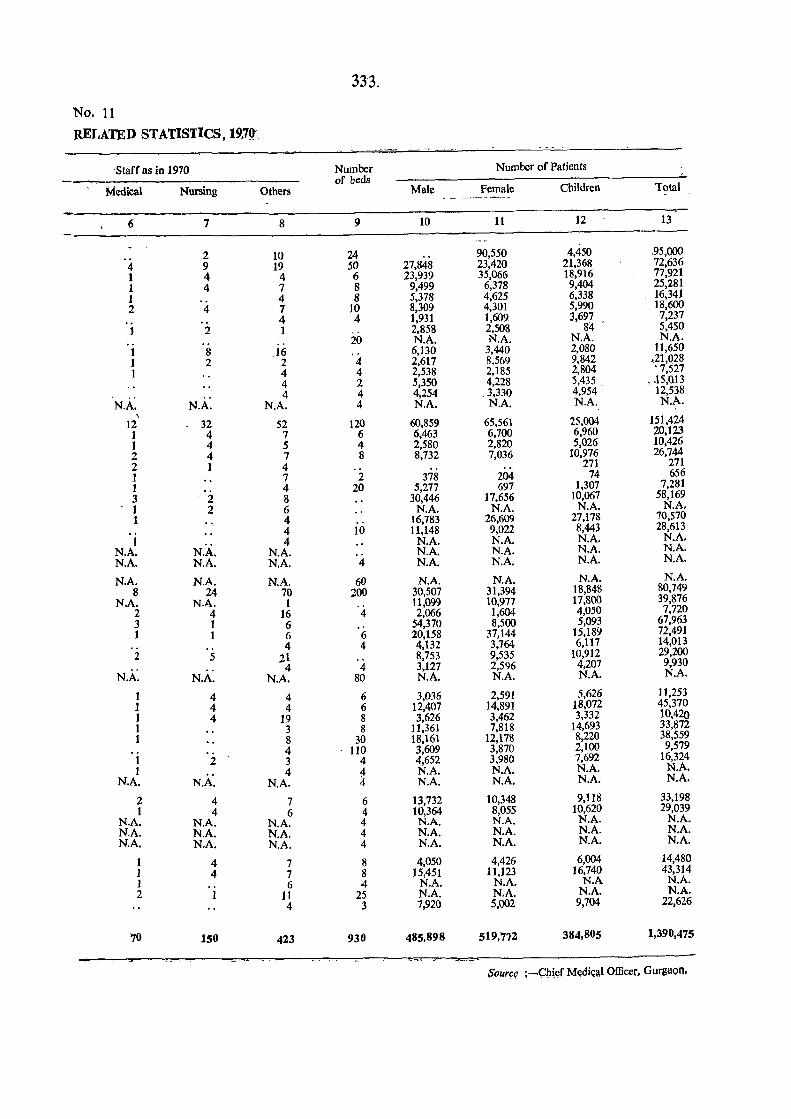
333.
No. 11
RELATED STATISTICS, 19,7(t
-Staff as in 1970 Number Number of Patients -- of beds Medical Nursing Others Male Female Children Total
- _. --- - .--.~ -
6 7 8 9 10 11 12 13
2 10 24 90,550 4,450 95,000
4 9 19 50 27,848 23,420 21,368 72,636
1 4 4 6 23,939 35,066 18,916 77,921
1 4 7 8 9,499 6,378 9,404 25,281
1 4 8 5,378 4,625 6,338 16,341
2 4 7 10 8,309 4,301 5,990 18,600
4 4 1,931 1,609 3,697 7,237
1 2 1 2,858 2,508 84 5,450 20 N.A. N.A. N.A. N.A.
1 8 .16 6,130 3,440 2,080 11,650
1 2 2 4 2,617 8,569 9,842 ,21,028
1 4 4 2,538 2,185 2;804 '7,527
4 2 5,350 4,228 5,435 < .l5,0l3 4 4 4,254 .3,330 4,954 . 12,538
N.A. N.A. N.A. 4 NA. N.A. NA. N.A. \
12 32 52 120 60,859 65,561 25,004 151,424
1 4 7 6 6,463 6,700 6,960 20,123
1 4 5 4 2,580 2,820 5,026 10,426
2 4 7 8 8,732 7,036 10,976 26,744
2 1 4 .. .. 271 271
1 7 2 378 204 74 656
1 4 20 5,277 697 1,307 7,281
3 2 8 30,446 17,656 10,067 58,169
1 2 6 N.A. N.A. N.A. N.A. 1 .. 4 16,783 26,609 27,178 70,570
4 10 11,148 9,022 8,443 28,613
1 4 N.A. N.A. N.A. N.A. N.A. N.A. N.A. N.A. N.A. N.A. N.A. N.A. N.A. N.A. 4 N.A. N.A. N.A. N.A.
N.A. N.A. N.A. 60 N.A. N.A. N.A. N.A. 8 24 70 200 30,507 31,394 18,848 80,749
N.A. N.A. 1 11,099 10,977 17,800 39,876
2 4 16 4 2,066 1,604 4,050 7,720
3 1 6 54,370 8,500 5,093 67,963
t 1 6 6 20,158 37,144 15,189 72,491
4 4 4,132 3,764 6,117 14,013
2 5 21 8,753 9,535 10,912 29,200
N.A. 4 4 3,127 2,596 4,207 9,930
N.A. N.A. 80 N.A. N.A. N.A. N.A.
1 4 4 6 3,036 2,591 5,626 11,253 1 4 4 6 12,407 14,891 18,072 45,370
1 4 19 8 3,626 3,462 3,332 10,420 1 3 8 11,361 7,818 14,693 33,872
1 8 30 18,161 12,178 8,220 38,559
4 110 3,609 3,870 2,100 9,579
1 2 3 4 4,652 3,980 7,692 16,324
1 4 ~ N.A. N.A. N.A. N.A. N.A. N.A. N.A. 4 N.A. N.A. N.A. N.A.
2 4 7 6 13,732 10,348 9,118 33,198 1 4 6 4 10,364 8,055 10,620 29,039
NA. N.A. N.A. 4 N.A. N.A. N.A. N.A. N.A. N.A. N.A. 4 N.A. N.A. N.A. N.A. N.A. N.A. N.A. 4 N.A. N.A. N.A. N.A.
1 4 7 8 4,050 4,426 6,004 14,480 1 4 7 8 15,451 11,123 16,740 43,314 1 6 4 N.A. N.A. N.A N.A. 2 1 11 25 N.A. N.A. N.A. N.A.
4 3 7,920 5,002 9,704 22,626
70 150 423 930 485,898 519,712 384,805 1,390,475
Sourcf1 ;-<;::hief Medi~iJ,1 Officer, Gurgaon.
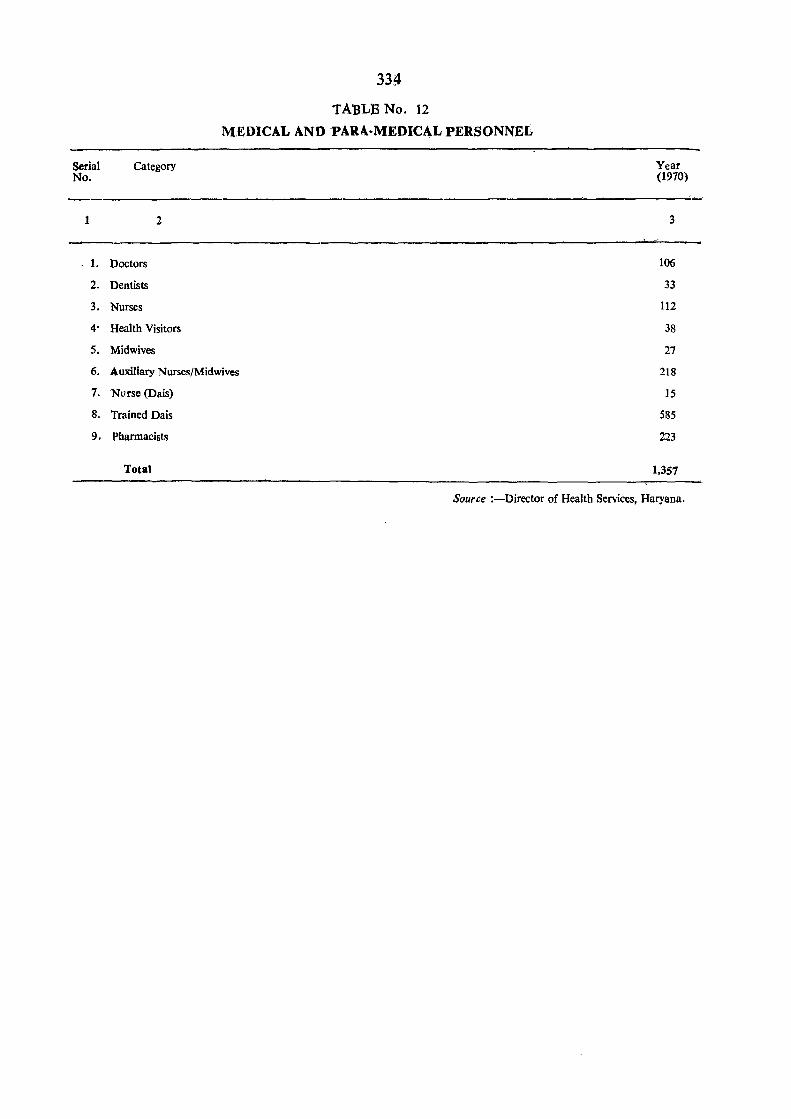
Serial No.
t
1.
2.
3.
4'
5.
6.
7.
8.
9.
334
TABLE No. 12
M.EDICAL AND PARA-MEDICAL PERSONNEL
Category Year (1970)
----------------.----------------------------------------------~------------~ .. ~ 2 3
Doctors
Dentists
Nurses
Health Visitors
Midwives
Auxiliary Nurses/Midwives
106
33
112
38
27
218
15
585
223
Nurse (Dais)
Trained Dais
Pharmacists
Total 1,357
Source :-Director of Health Services, Haryana.
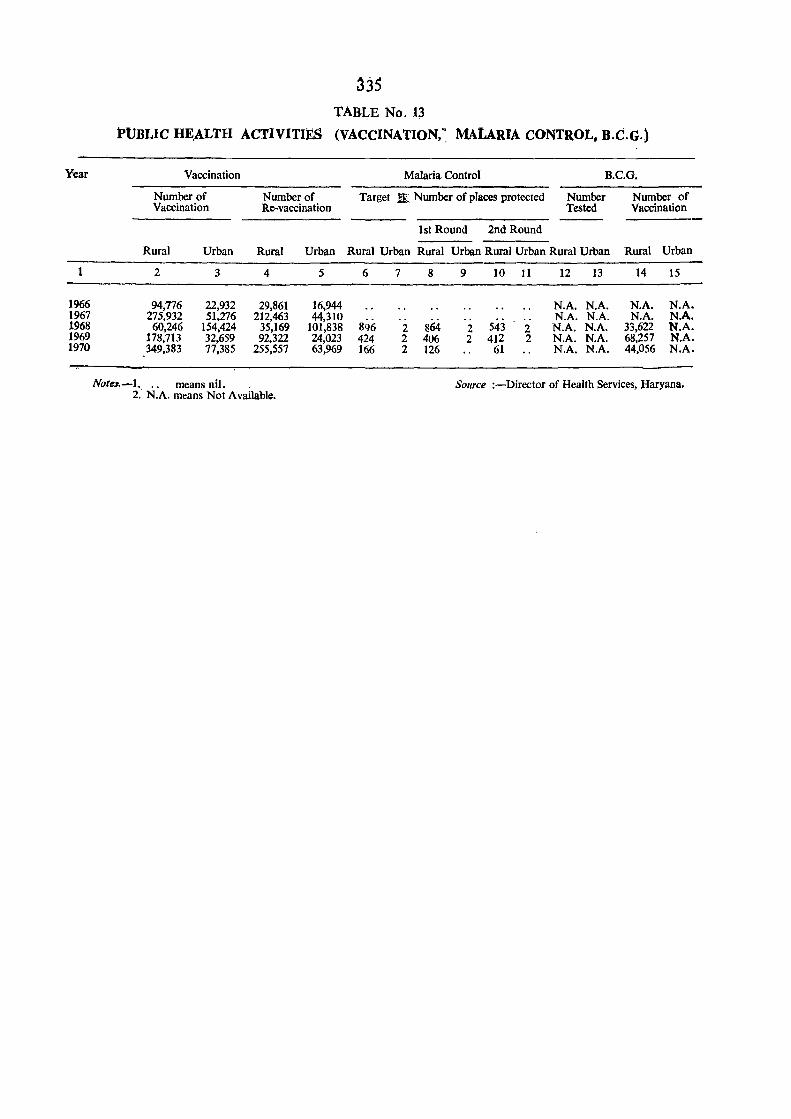
Year
1
1966 1967 1968 1969 1?70
TABLE No. 13
PUBLIC HE,ALTH ACTIVITIES (VACCINATION,~ MALARIA CONTROL, B.C.G.)
Vaccination
Number of Vaccination
Number of Re-vaccination
Malaria Control B.C.G.
Target I!: Number of places protected Number Number of Vaccination Tested
1st Round 2nd Round
Rural Urban Rural Urban Rural Urban Rural Urban Rural Urban Rural Urban Rural Urban
2
94,776 275,932
60,246 178,713
,349,383
3
22,932 51,276
154,424 32,659 77,385
Notl1S',-L, " means nil. .
4
29,861 212,463
35,169 92,322
255,S57
2. N.A. means Not Available.
5
16,944 44,310
101,838 24,023 63,969
6
896 424 166
7
2 2 2
8
864 4U6 126
9
2 2
10 11
543 412
61
2 2
12 13
N.A. N.A. N.A. N.A. N.A. N.A. N.A. N.A. N.A. N.A.
14
N.A. N.A.
33,622 68,257 44,056
15
N.A. N.A. N.A. N.A. N.A.
Source :-Director of Health Services, Jlaryana.
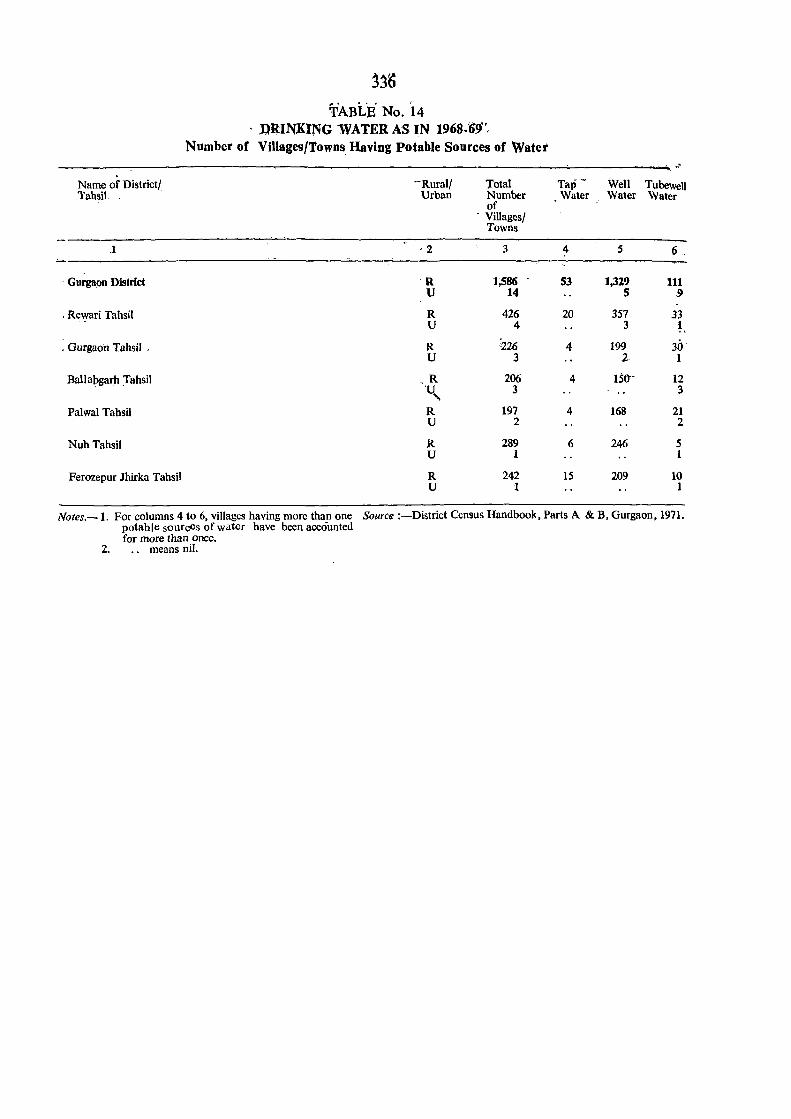
j~~
TABLE No. '14 l)RINKING WATER AS IN 1968-69".
Number of Villages/Towns. Having Potable Sources of Water ~'
Name of District/ -Rural! Total Tap- Well TubeweU Tahsil Urban Number , Water Water Water
of . Villages!
Towns
.1 ·2 3 4 5 6 ..
· Gurgaon District R 1,586 53 1,319 III U 14 5 9
· Rewari Tahsil R 426 20 357 33 U 4 3 t
· Gurgaon Tahsil , R :226 4 199 3ir u 3 2 1
Ballabgarh Tahsil R 206 4 150-- 12 'U 3 3
"-Palwal Tahsil R 197 4 168 21
U 2 2
Nub Tahsil R 289 6 246 5 U 1 1
Ferozepur Jhirka Tahsil R 242 15 209 10 U 1 1
Notes.-l. For columns 4 to 6. villages having more than one Sourcil :-District Census Handbook. Parts A & B. Gurgaon, 1971. potable sources of water have been accounted for more than once.
2. .. means nil.
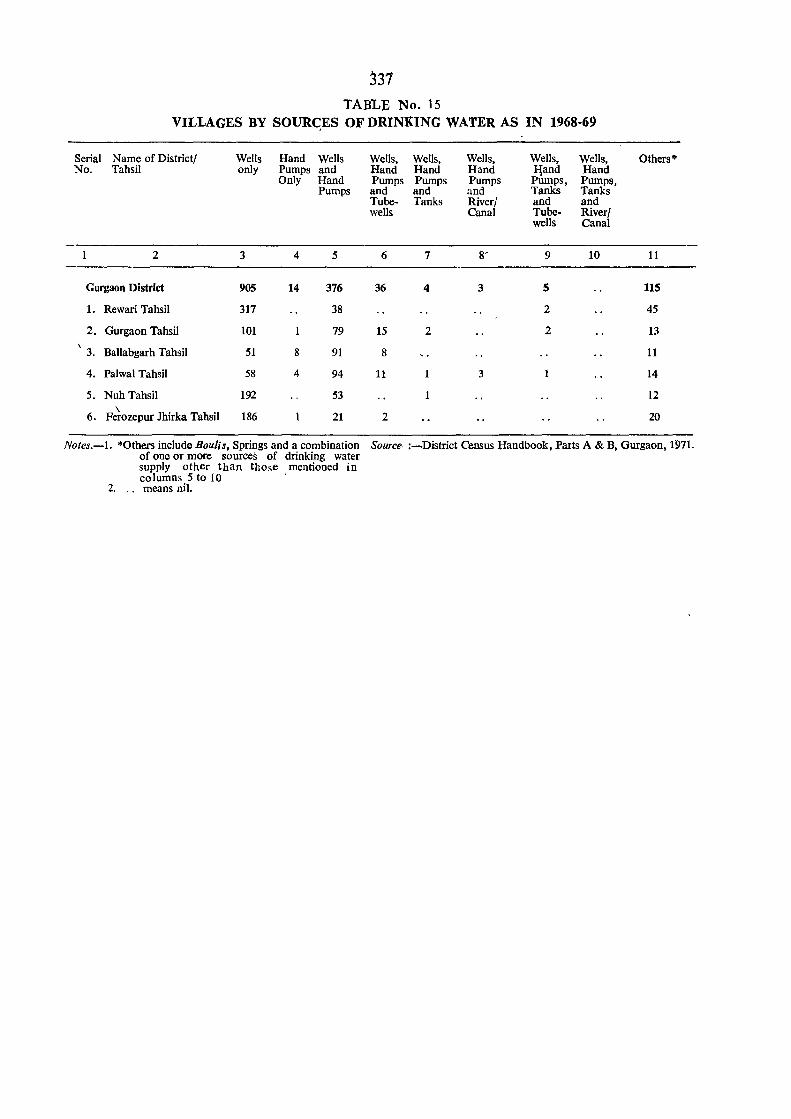
331 TABLE No. 15
VILLAGES BY SOUR<;ES OF DRINKING WATER AS IN 1968-69
Serial Name of District/ Wells Hand Wells Wells, Wells, Wells, Wells, Wells, Others· No. Tahsil only Pumps and Hand Hand Hand !:land Hand
Only Hand Pumps Pumps Pumps Pumps, Pumps, Pumps and and and Tanks Tanks
Tube- Tanks River/ and and wells Canal Tube- River/
wells Canal
2 3 4 5 6 7 8~ 9 10 11
Gurgaon District 905 14 376 36 4 3 5 115
1. Rewari Tahsil 317 38 2 45
2. Gurgaon Tahsil 101 79 15 2 2 13
3. Ballabgarh Tahsil 51 8 91 8 11
4. Palwal Tahsil 58 4 94 11 1 3 1 14
5. Nuh Tahsil 192 53 1 12
6. Feiozepur Jhirka Tahsil 186 21 2 20
Notes.-l. "'Others include Bon/is, Springs and a combination Source :~District Census Handbook, Parts A & B, Gurgaon, 1971. of one or more sources of drinking water supply other than those mentioned in columns 5 to 10
2. .. means nil.
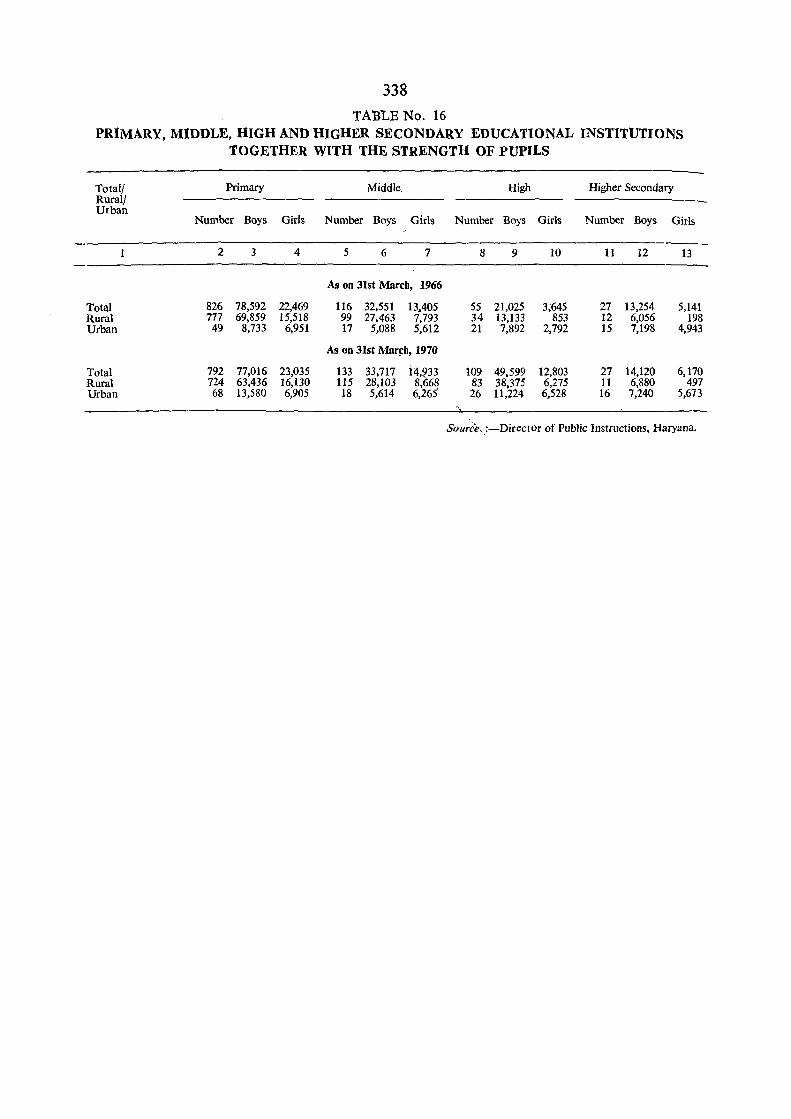
338 TABLE No. 16
PRIMARY, MIDDLE, HIGH AND HIGHER SECONDARY EDUCATIONAL INSTITUTIONS TOGETHER WITH THE STRENGTH OF PUPILS
Total/ Primary Middle. High Higher Secondary Rural! Urban
Number Boys Girls Number Boys Girls Number Boys Girls Number Boys Girls
2 3 4 5 6 7 8 9 10 11 12 13
As on 31st March, 1966
Total 826 78,592 22,469 116 32,551 13.405 55 21,025 3,645 27 13,254 5,141 Rural 777 69,859 15,518 99 27,463 7,793 34 13,133 853 12 6,056 198 Urban 49 8,733 6,951 17 5,088 5,612 21 7,892 2,792 15 7,198 4,943
As on 31st Mar«:h, 1970
Total 792 77,016 23,035 133 33,717 14;!?33 109 49,599 12,803 27 14,120 6,170 Rural 724 63,436 16,130 115 28,103 8,668 83 38,375 6,275 11 6,880 497 Urban 68 13,580 6,905 18 5,614 6,265 26 11,224 6,528 16 7,240 5,673
Source,_:-Director of Public Instructions, Haryana.
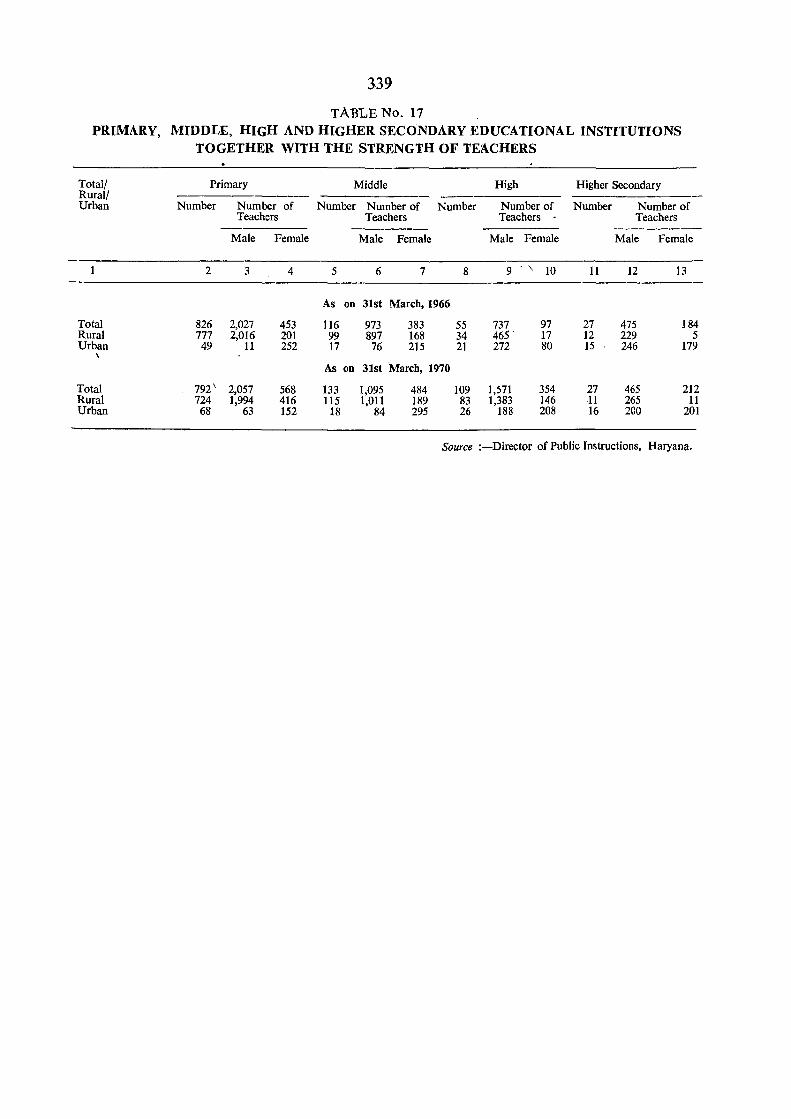
339
TABLE No. 17 PRIMARY, MIDDLE, HIGH AND HIGHER SECONDARY EDUCATIONAL INSTITUTIONS
TOGETHER WITH THE STRENGTH OF TEACHERS
Total! Primary Middle High Higher Secondary Rural! Urban Number Number of Number Number of Number Number of Number Number of
Teachers Teachers Teachers Teachers
Male Female Male Female Male Female Male Female
2 3 4 5 6 7 8 9 - \ 10 11 12 13
As on 31st March, 1966
Total 826 2,027 453 116 973 383 55 737 97 27 475 ] 84 Rural 777 2,016 201 99 897 168 34 465 - 17 12 229 5 Urban 49 11 252 17 76 215 21 272 80 15 246 179
\
As on 31st March, 1970
Total 792' 2,057 568 133 1,095 484 109 1,571 354 27 465 212 Rural 724 1,994 416 115 1,011 189 83 1,383 146 11 265 11 Urban 68 63 152 18 84 295 26 188 208 16 2CO 201
Source :-Director of Public Instructions, Haryana.
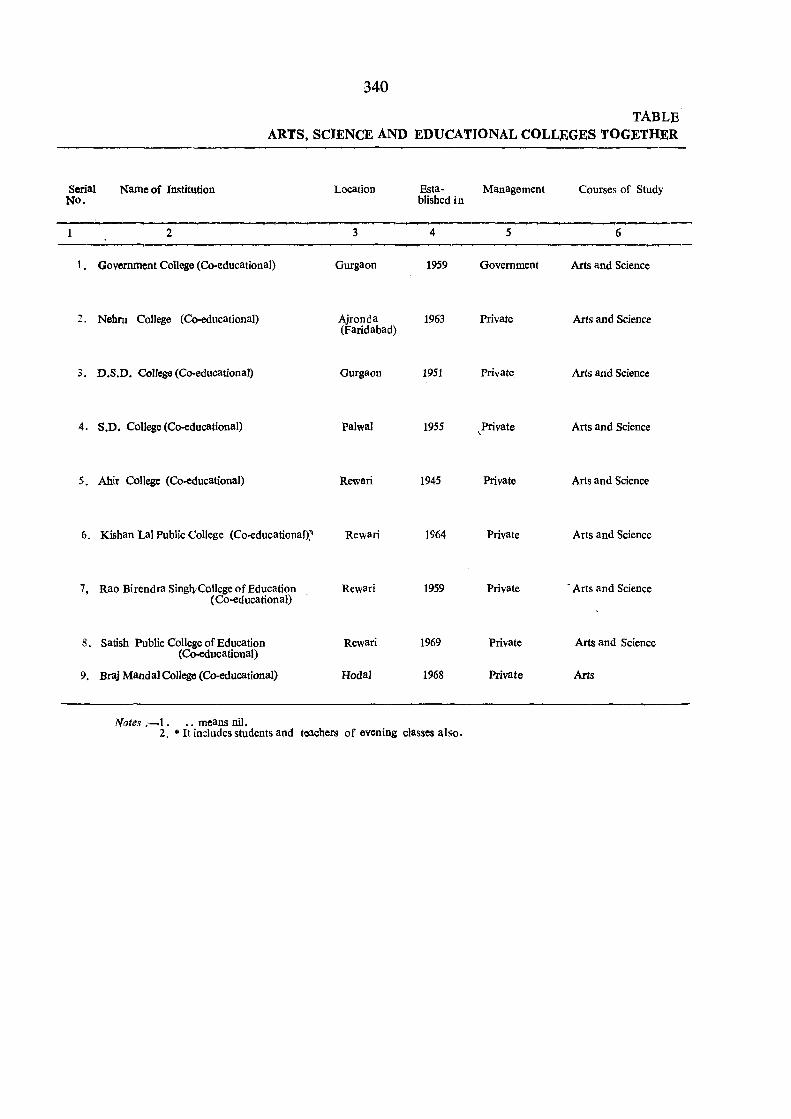
340
TABLE ARTS, SClENCE AND EDUCATlONAL COLLEGES TOGETHER
Serial No.
Name of Institution
1 2
1. Government College (Co-educational)
2. Nehru College (Co-educational)
3. D.S.D. College (Co-educational)
4. S.D. College (Co-educational)
5. Ahir College (Co-educational)
6. Kishan Lal Public College (Co-educational):
7, Rao Birendra Singh.College of Education ( Co-educational)
8. Satish Public College of Education (Co-educational)
9. Braj MandaI College (Co-educational)
Notes ;~l. " means nil.
Location
3
Gurgaon
Ajronda (Faridabad)
Gurgaon
Palwal
Rewari
Rewari
Rewari
Rewari
Hodal
Esta- Management blished in
4 5
1959 Government
1963 Private
1951 Private
1955 Private ,
1945 Private
1964 Private
1959 Private
1969 Private
1968 Private
2. * It in~ludes students and toachers of evening classes also.
Courses of Study
6
Arts and Science
Arts and Science
Arts and Science
Arts and Science
Arts and Science
Arts and Science
. Arts and Science
Arts and Science
Arts
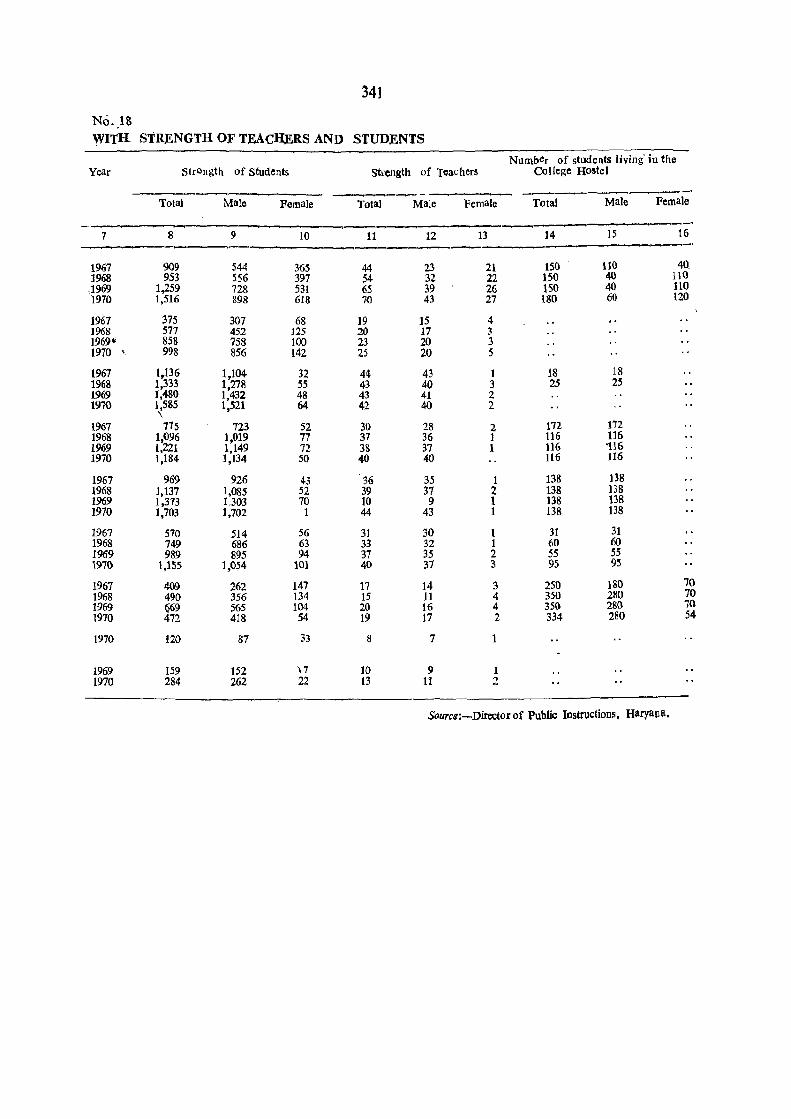
341
No .. lS WITH STRENGTH OF TEACHERS AND STUDENTS
Number of students living' in the Year Strength of Students stl'ength of Teachers College Hostel
~~
Total Male Female Total Male Female Total Male Female
7 8 9 10 11 12 13 14 15 16 -~ --'
1967 909 544 365 44 23 21 150 110 40. 1968 953 556 397 54 32 22 150 40 110
.1969 1,259 728 531 65 39 26 150 40 ltO '1970 1,516 898 618 70 43 27 180 60 120
1967 315 301 68 19 15 4 1968 571 452 125 20 17 3 1969* 858 'i58 100 23 20 3 1970 \ 998 856 142 25 20 5
1967 1,136 1,104 32 44 43 1 18 18 1968 1,333 1,278 55 43 40 3 25 25 1969 1,480 1,432 48 43 41 2 1970 1,585 1,521 64 42 40 2
'\ 1%7 775 723 52 30 28 2 172 172 1968 1,096 1,019 77 37 36 1 116 116 1969 1,221 1,149 72 38 37 1 116 '116 1970 1,184 1,134 50 40 40 116 116
1967 969 926 43 36 35 1 138 138 1968 1,137 ],085 52 39 37 2 138 138 1969 1,373 1.303 70 10 9 1 138 138 1970 1,703 ],702 1 44 43 ] 138 ]38
]967 570 5]4 56 31 30 1 31 31 1968 749 686 63 33 32 ] 60 60 1969 989 895 94 37 35 2 55 55 1970 1,155 1,054 101 40 37 3 95 95
1967 409 262 147 17 14 3 250 180 10 1968 490 356 134 15 11 4 350 280 70 1969 ~9 565 104 20 16 4 350 2S0 70 1970 472 418 54 ]9 17 2 334 280 54
1970 120 87 33 8 7 1
1969 159 152 \7 10 9 1 1970 284 262 22 13 11 2
Source:-Directorof Public Instructions, Haryatla.
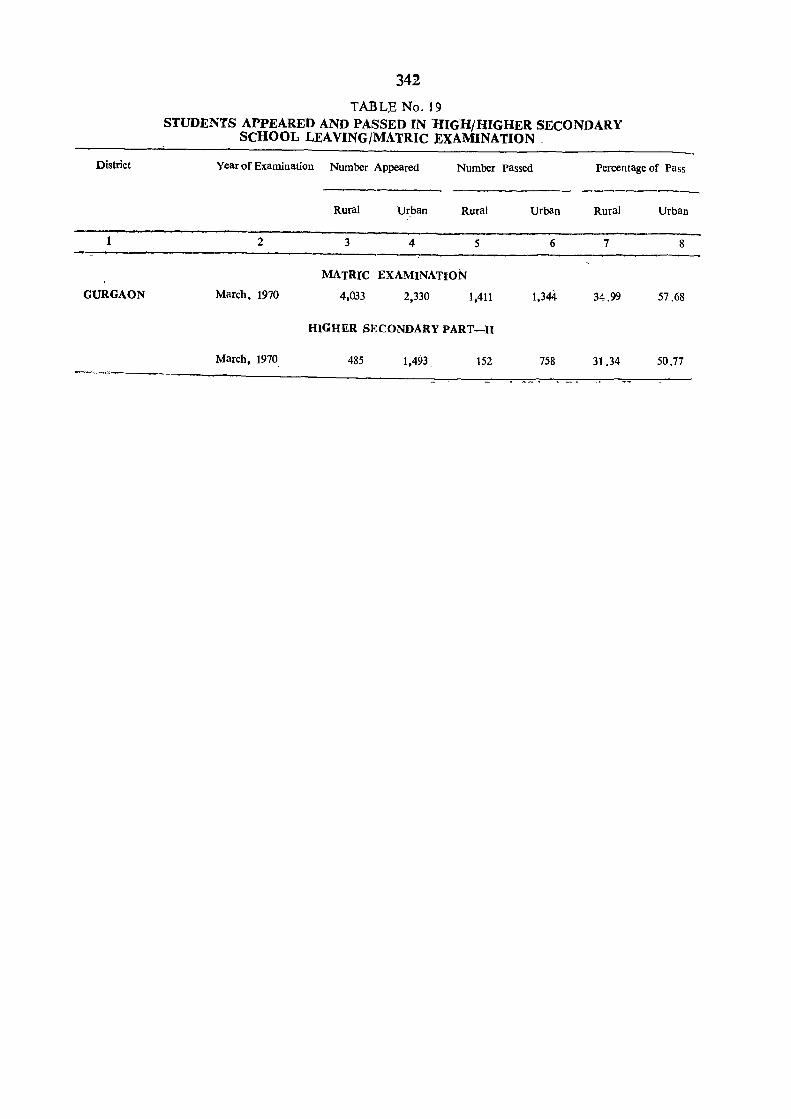
District
I
GURGAON
342
TABLE No. 19 STUDENTS APPEARED AND PASSED IN 1IIGH/HIGHER SECONDARY
SCHOOL LEAVINGjMATRIC EXAMINATION.
Year of Examination Number Appeared Number Passed Percentage of Pass
-~~--~~
Rural Urban Rural Urban Rural Urban
--2 3 4 5 6 7 8
MATRIe EXAMINATION
March, 1970 4,033 2,330 1,411 1,344 34.99 57.68
HIGHER SECONDARY PART-II
March, 1970 485 1,493 152 758 31.34 50.77
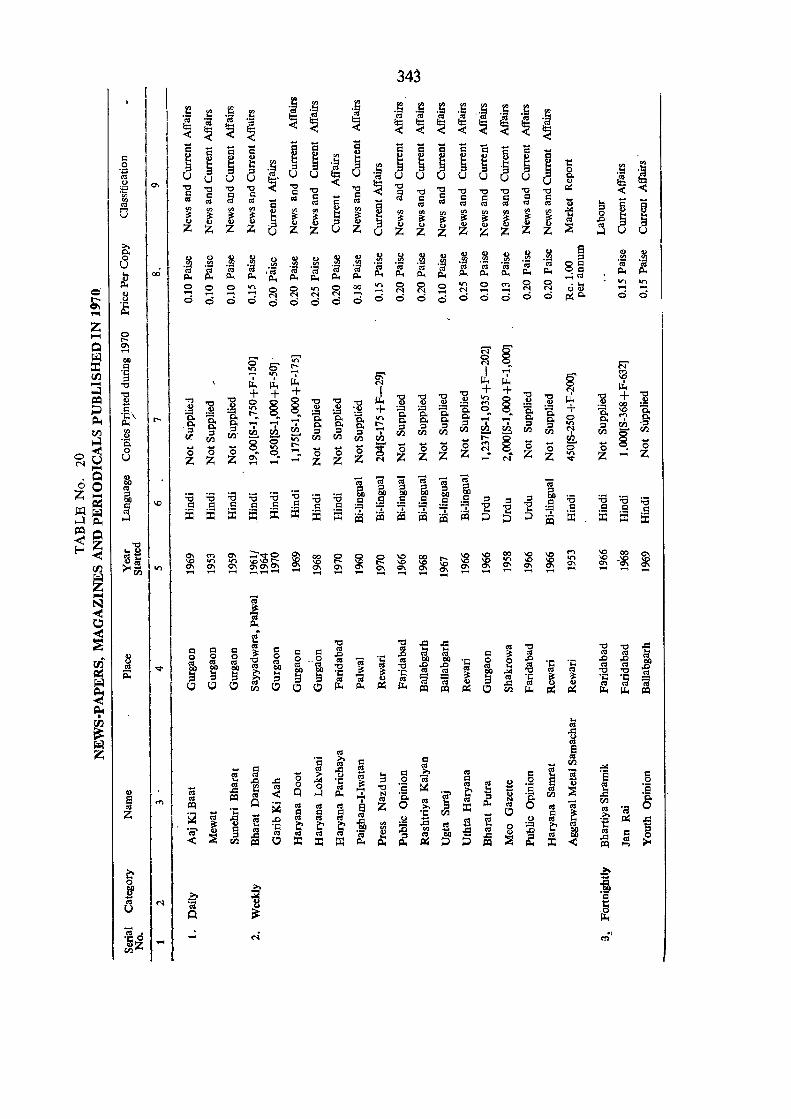
'" o .~
o "" .~
o
I u
Ci1. 'I: 0 ~Z
[10 I
I I." I
'" g ! §
I I ~ l~ I ~ i IN
....
343
00
~ -00 VI 0'1 -
., <!)
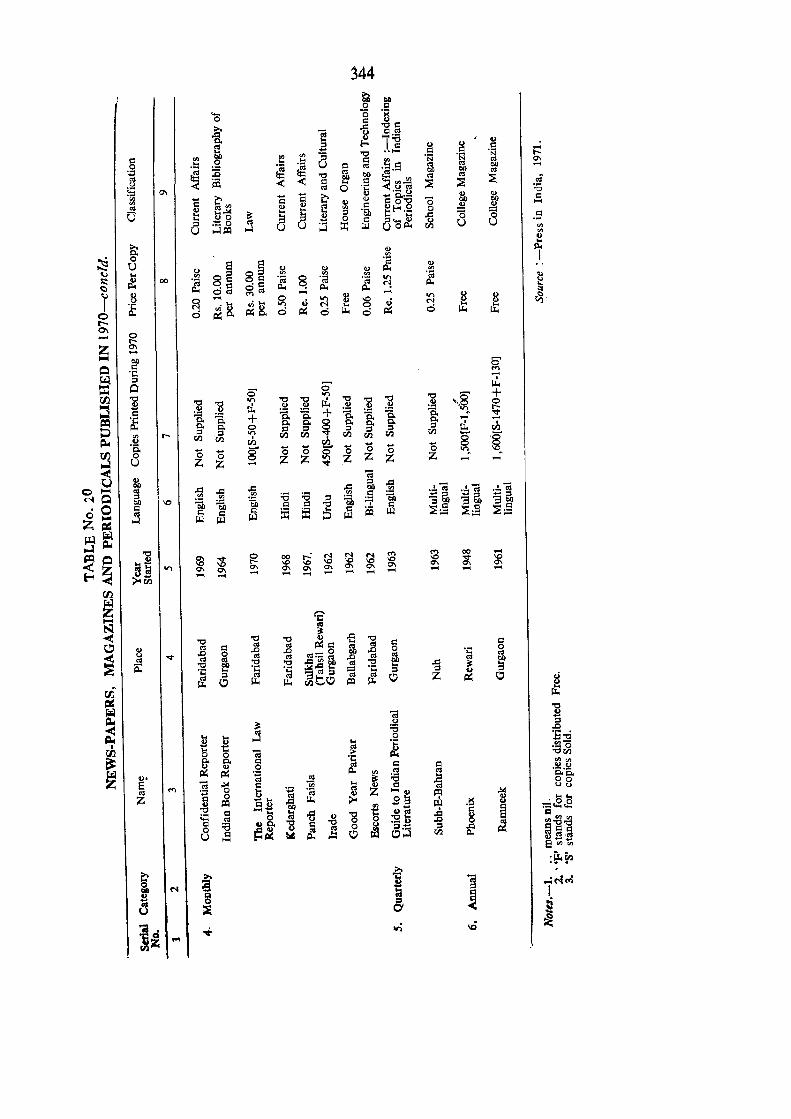
344 til ~ 0
'-0
'0 '5 -& ~
-5 "C)c::
..:l,~
~ ~ 1"8 <I) ,5
<I)
8 "C) ...... c:: c:: -
c:: '" '" Ul '03
0 ,!:: 0 ... ... c:: '" '03 N t-
~ gb 0\
~ ~ z ~ = ~ -;.5 ~ ~ -"C) ~ OJ)
CI) CI) ~
~ -< CI) l::: <Jl ~ ~ ::; -< c:: ... c:: ::; ::; ~
'til 0\
~ 0 ';::; <.213 ~
E i:'", E ...
i:' <I)
~ ~ '"
c:: 0 ~ ~.- '0 c::
~ t <I) 1':0'8
0 ~ S,;.c ~ ~ "' c::
~ ~ ....
~ ~ ., '50 ~ Eo< ';::; 0
00 ., 0 ~ ,S ., .~ 0 c:: 8'O~ U ....ll%l ....l U U :x: ~ u <Jl
'" u .. >. 0.
<I)
~ 0 ~ ,
.... u <I) 8 8 <I) 0 .., ... 8 6 86
<I) <I) <Jl
Ul '" <Jl
;::: ~ 00 'a 'a 8 'a ,~ .,., ;f .. ~ ,= 'c:: Po.
~ "! ~ Po. o~ ~~ ,...; Po. Po.
I ~ - - :::: 0
tt5~ rnt 0 c)
.,., i! 'C .,., 0 <I) ~,
N .,., N 0 Q N &: &:
0 0 PI 0. P::o. 0 P:: 0 ~ 0 P:: 0 r-0'1 - g Z 0\ .... """ OJ)
0 '§ 5'
r.l "" .... =: Q 5' 0' rL 00 "C)
on + """ B ] "C) on "C) "C) . "C) "C) "C) "C) ,go S .~ rL .~ <I) ~ .~ .~
<I) .2 0
c:: "S. "S. ~ + 8: :a "S. ''q_ t-
iE "S. + "S. """ 0. 0. g- ~
0. g- .... -:;J g- o 0. :h
Ul t-.,
II'l :c ., ::l ., r:h
=-- .s. en en r:h en en en en en en
'§ 00
... ... 8 ... '0 !!!. ... '0 .. ... 8
0 0 0 0 0 0 0 0 "'.
~ U Z Z Z on Z Z Z Z Z - ...r
-< U ~
<a ., ~ c """ ~ ~ ~
..c: ..c: til .~ ca .. ~ Cd .~ '; (~ 0
., .~ :a :a '" .5 ~ 0
OQ 'C Cb ~ "5b 0 ~ .!::~ "'0
..... ., c:: c:: = 5 '0'
~ ::1= "'3OQ "'3 OQ
0 """ .:3
I'l &S ~ :E = &S ~ ::;;.::; ::;;§ ~;§
z = ~
!j r.l =--
~ 0 "C) 0 "" 0 0\ :$
00 t-- ~ N ~ "" 00 -~ ~1;i on '"
.... '" '" 'C '" 'C """ '"
0\ 0\ 0\ 0\ 0\ 0\ 0\ 0\ 0\ '" '" 0\
i-I :><ril - .... .... - .... - .... - - - .... ....
00
~ 1: """ lSI 101
-< "C) it:
oS "C) "C) 0 "C)
" 0 .2 I': ~ ~ PIt:: ~ ~ I': = .0
~ u ...r 0 ~
.0 (';$= g OQ .0 0 .~ 0
~ ~ ~ ~ ~
~ ~ ... ~
ii: "C)
~ :g "0 ..c:"'0J) "C) ~ .g .,
~ .;::;
~ ..:.o:..c: ...
~ ~ ~ ~ ~ "'3"'''
., .,
00 0 ent-O 1%1 0 Z PI 0 0
&:
= r;;;1 "C)
=--<a B
~ ~ :a .,
... ... .:3 .0
• B 0 ... 0 ]..0
00. ~ 1:: (;! ., ~ .~o
~ 0 ...
0. 0. Q .;::; "OrIl
~ ~ 0 0 ~ I': =
UlUl
<I). PI ~ en :6 ~
00
8 - ~ .,
~ ~ '0:0.
~ Q "iil ... 00
~ "" t ~ '03 ~ Q Z "'0
uo
z .8 0 ~ ~
,;.c 1%1
...... ~ ~
0'" ~ ...... ,s! ~
... .a i .~ :;::.2,,8
;;:: I': ... -5 '8 ,gS Q Q
~
~! ., ,g 8 8 a:l
~ :a "C) I': 0 .~ u ., CIl~CI.l 0
~ oS 0 ." ~;3 f u tEl ~ 0 III en PI s:I ="C)
~~; E! ... , ... "''''
:~in
~ >.
i r;:: 'a
g ("I i ,...;c-i.,)
Q J I 0 )1 6 ;i ....
~d .,;. on .Q ~
entz; ...
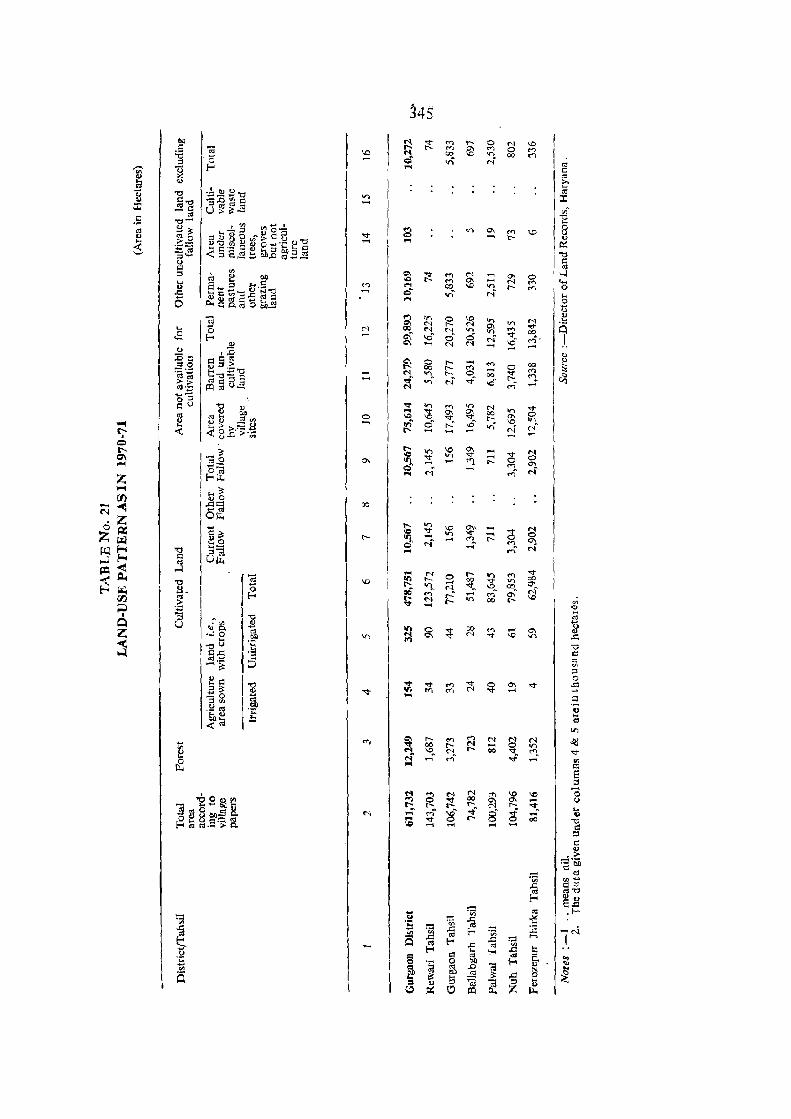
on -
N .-;
-.-; o
00
N -00
0-. ......
-N I
I~ I ... I~ I

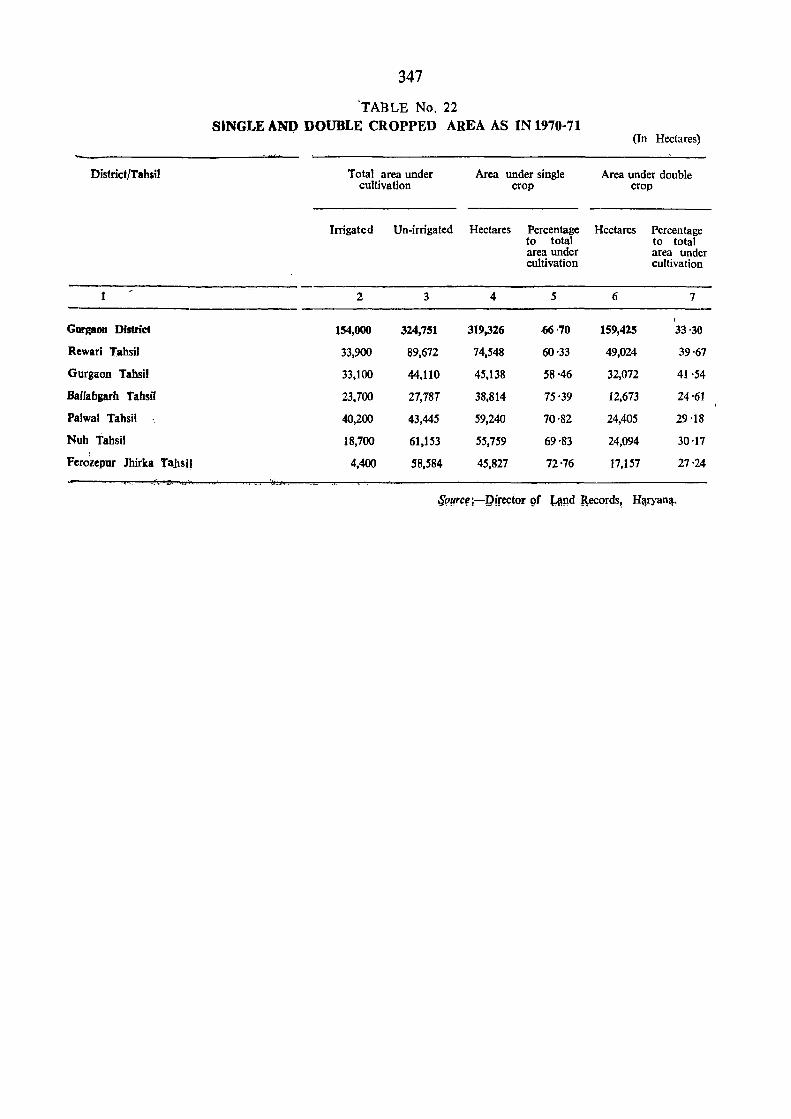
District/Tahsil
1
Gurgaon District
Rewari Tahsil
Gurgaon Tahsil
BaUabgarh Tahsil
Palwal Tahsil
Nuh Tahsil I
Ferozepur lhirka taj1Sil
347
'T ABLE No. 22 SINGLE AND DOUBLE CROPPED AREA AS IN 1970~71
(In Hectares)
Total area under Area under single Area under double cultivation crop crop
Irrigated Un-irrigated Hectares Percentage Hectares Percentage to total to total area under area under cultivation cultivation
2 3 4 5 6 7
(
154,000 324,751 319,326 ·66·70 159,425 33'30
33,900 89,672 74,548 60'33 49,024 39'67
33,100 44,110 45,138 58·46 32,072 41'54
23,700 27,787 38,814 75'39 12,673 24'61
40,200 43,445 59,240 70'82 24,405 29 '18
18,700 61,1.53 .55,7.59 69'83 24,094 30'17
4,400 58,584 45,827 72'76 17,157 27'24
Sf!!fYC~i-Qirector g( y~d Records! H'!ryanl\.
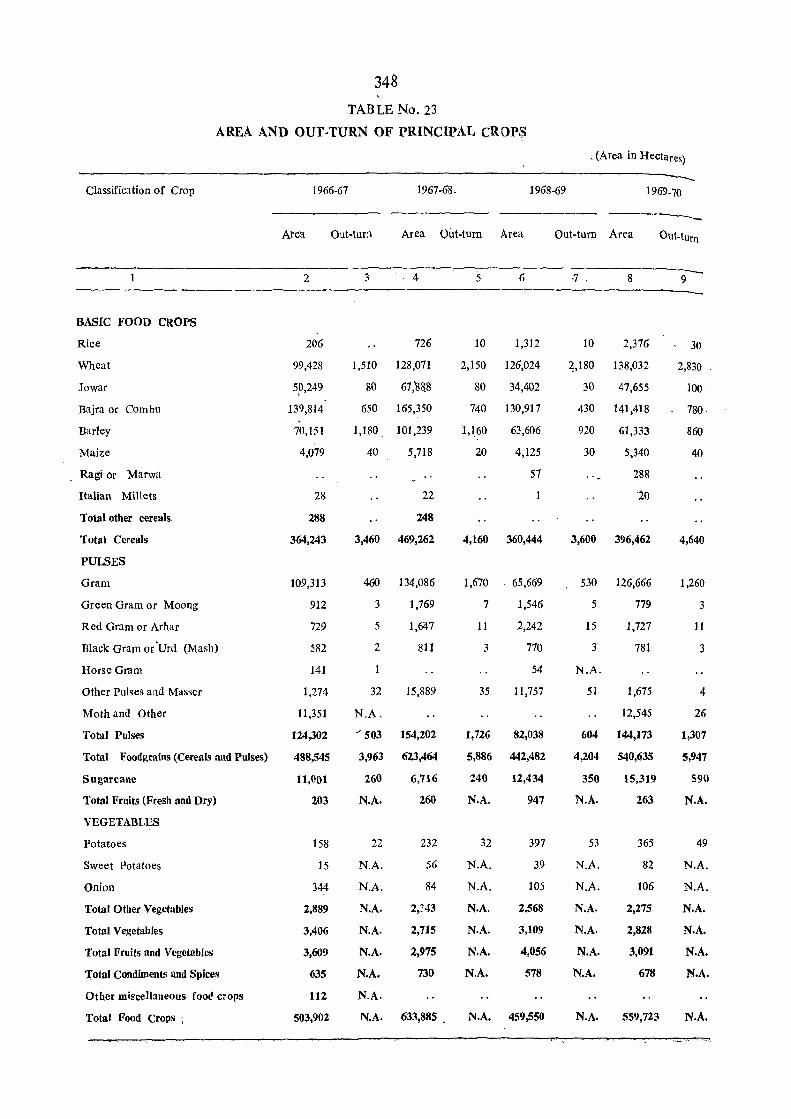
348
TABLE No. 23
AREA AND OUT-TURN OF PRINCIPAL CROPS
_ (Area in Hectares)
Classification of Crop 1966-67 1967-68. 1968-69 1969-70
BASIC FOOD CROPS
Rice
Wheat
Jowar
Bajra or Combu
Barley
Maize
Ragi Or Marwa
Italian Millets
Total other cereals
Total Cereals
PULSES
Gram
Green Gram or Moong
Red Gram or Arhar
Black Gram or 'Urd (Mash)
Horse Gram
Other Pulses and Masser
Moth and Other
Total Pulses
Total Foodgrains (Cereals and Pulses)
Sugarcane
Total Fruits (Fresh and Dry)
VEGETABLES
Potatoes
Sweet Potatoes
Onion
Total Other Vegetables
Total Vegetables
Total Fruits and Vegetables
',fotal Condiments and Spices
Other miscellaneous fool1 crops
Total Food Crops I
Area
2
206
99,428
5~,249.
139,814
70,151
4,079
28
288
364,243
109,313
912
729
582
141
1,274
11,351
124,302
488,545
11,<l01
203
158
15
344
2,889
3,406
3,609
635
112
503,902
Out-turn Area Out-turn Area
3
1,510
80
4
726
128,071
67;8&8
650 165,350
1,180. 101,239
40 5,718
22
248
3,460 469,262
460 134,086
3 1,769
5 1,6'1-7
2 811
32
N.A.
.-- 503
3,963
260
N.A.
22
N.A.
N.A.
N.A.
N.A.
N.A.
N.A.
N.A.
N.A.
15,889
154,202
623,464
6,716
260
232
56
84
2,343
2,715
2,975
730
633,885 •
10
2,150
80
740
1,1,~0
20
6
1,312
126,024
34,402
130,917
63,606
4,125
57
4,160 360,444
1,670
7
11
3
35
1,726
5,886
240
N.A.
32
N.A.
N.A.
N.A.
N.A.
N.A.
N.A.
N.A.
65,669
1,546
2,242
770
54
11,757
82,038
442,482
12,434
947
397
39
105
2,568
3,109
4,056
578
459,550
---_ -_ Out-turn Area Out-turn
·7 . 8 9 .------_
10
2,180
30
430
920
30
2,376
138,032
47,655
141,418
61,333
5,340
288
20
3,600 396,462
530 126,666
5 779
15 1,727
3 781
N.A.
51
604
4,204
350
N.A.
53
N.A.
N.A.
N.A.
N.A.
N.A.
N.A.
N.A.
1,675
12,545
144,173
540,635
15,319
263
365
82
106
2,275
2,828
3,091
678
559,723
30
2,830
100
780·
860
40
4,640
1,260
3
11
3
4
26
1,307
5,947
590
N.A.
49
N.A.
N.A.
N.A.
N.A.
N.A.
N.A.
N.A.
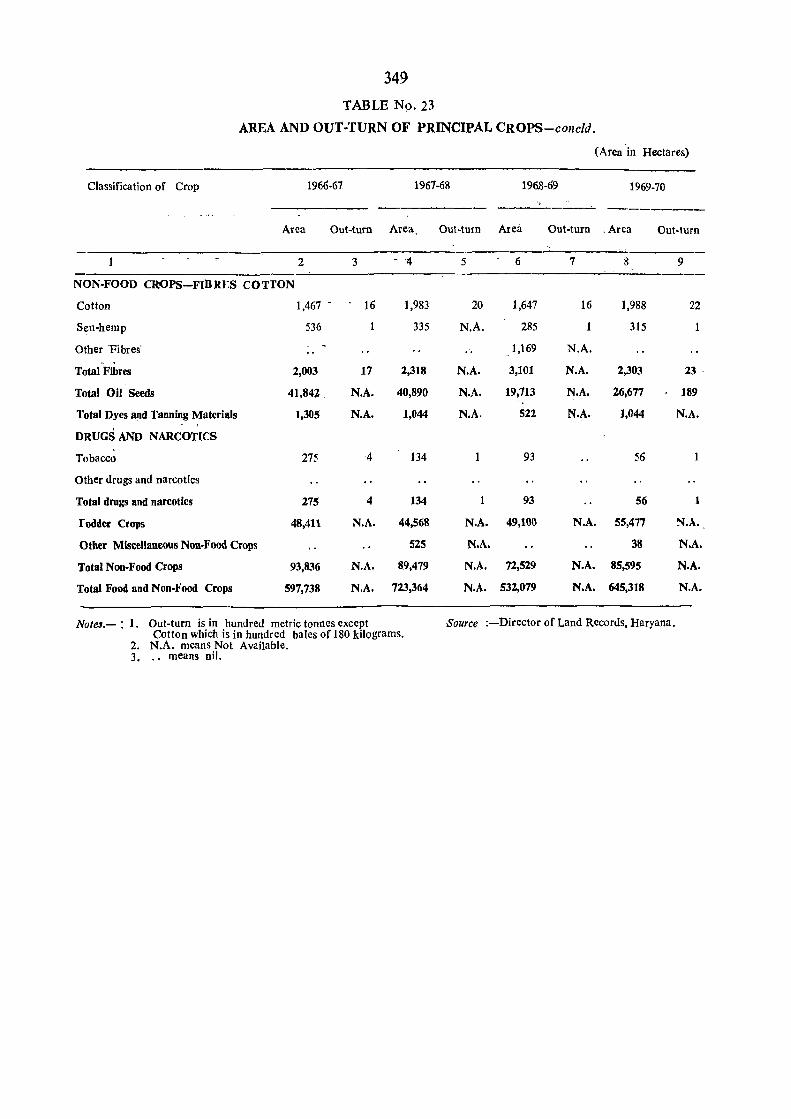
349
TABLE No. 23
AREA AND OUT-TURN OF PRINCIPAL CROPS-concld.
(Area 'in Hectares)
Classification of Crop 1966-67 1967-68 1968-69 1969-70
--------Area Out-turn Area Out-turn Area Out-turn , Area Out-turn
2 3 - 4- 5 6 7 8 9
NON-FOOD CROPS-FIBRT:S COTTON
Cotton 1,467 16 1,983 20 1,647 16 1,988 22
Sen-hemp 536 335 N.A. 285 315
Other 'Fibres' 1,169 N.A.
Total Fibres 2,003 17 2,318 N.A. 3,101 N.A. 2,303 23 '
Total Oil Seeds 41,84']. N.A. 40,890 N.A. 19,713 N.A. 26,677 189
Total Dyes and Tanning Materials 1,305 N.A. 1,044 N.A. 522 N.A. 1,044 N.A.
DRUGS AND NARCOTICS
Tobacco 275 4 134 93 56
Other drugs and narcotics
Total drugs and narcotics 275 4 134 93 56 1
r odder Crops 48,411 N.A. 44,568 N.A. 49,100 N.A. 55,477 N.A.
Otber Miscellaneous Non-Food Crops 525 N.A. 38 N.A.
Total Non-Food Crops 93,836 N.A. 89,479 N.A. 72,529 N.A. 85,595 N.A.
Total Food and Non-Food Crops 597,738 N.A. 723,364 N.A. 532,079 N.A. 645,318 N.A.
Noles.- : 1. Out-tum is in hundred metric tonnes except Source :-Director of Land Records, Haryana. Cotton which is in hundred bales of 180 kilograms.
2. N.A. means Not Available. 3. ., means nil.

350
Name of Crop Rewari Tahsil Gurgaon Tahsil
___.......___._.
Total Area Irrigated Area Total Area Irrigated Area
1968-69 1970-71 1968-69 1970-71. 1968·69 1970-71 1968-69 1970-71
1 2 4 5 6 , 7 8 9
Rice ~~ ,~6, . 3. 57 Ii 20
Wheat .1 ~ 17,353' 22,33.6 15;968 19,572 22,363 30,879 19t624, ;25,941 .. .Jowar I· 5,406 5,35~ 31 16 3,028 2,035 135 16
Bajra .. 54,688 59,060 199 19 35,091 36,539 522 32
Barl~y .. 20,193 43,364' 17,8161 556 11,267 15,049 7,821 1,317
Maize 13 8 5 5 154 62 61 8
Gram 15,186 14,939 749 12,294 ,7;699 10,097 1,597 5,281
Sugarcane 86 , 166 83 166 ;' ,2,40 400 17P' I, 279
TABLB
CROP AND
BalJabgarlt T'ahsil
----.....-.....__.---..--~-......... -Total Area Irrigated Area
1968:69 1970-7!_ 1968-69 1970-71
10 11 12 13
242 331 157 ,165'
22,300 26,399 16,982 19;742
3,434 3,561 109 445
8,634 10,4~7 98 179
4,152 5,844 1,483 317 '
2,183 1,978 893 807.
3,279 4,\49 589 816
1,638 1,483 1,585 1,4~2
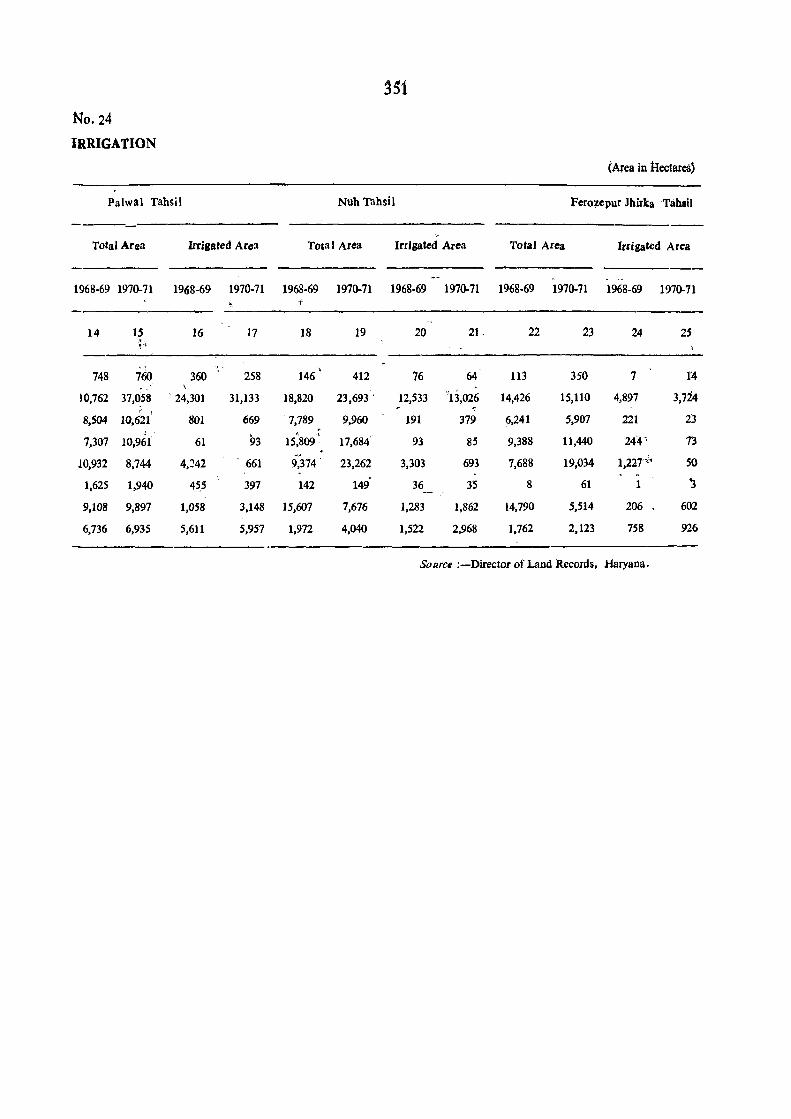
~Sl
No. 24
IRRIGATION
(Area in HectareS)
Palwal Tahsil Nuh Tahsil Ferozepur Jhirka Tahsil
r
Total Arca Irrigated Area Total Area Irrigated Area Total Area Irrigated Area
1968-69 1970-71 1968-69 1970·71 1968-69 1970-71 1968-69 1970-71 1968-69 1970-71 1968-69 1970-71 1
14 15 16 17 18 19 20 21- 22 23 24 25 ;'f , '
748 7(J) 360 258 146 412 76 64 113 350 7 14
10,762 37,058 ' 24,301 31,133 18,820 23,693 . 12,533 "13,026 14,426 15,110 4,897 3,714 <
" , 8,504 10,621 801 669 7,789 9,960 191 379 6,241 5,907 221 23
., 93
'I , .. 7,307 10,961 61 15,809· 17,684 93 85 9,388 11,440 244' 73
10,932 8,744 4,~42 . 661 9,374 23,262 3,303 693 7,688 19,034 1,227" SO
1,625 1,940 45,5 397 142 14') 36 35 8 61 1 '3
9,108 9,897 1,058 3,148 15,607 7,676 1,283 1,862 14,790 5,514 206 602
6,736 6,935 5,611 5,957 1,972 4,040 1,522 2,968 1,762 2,123 758 926
Source :-Director of Land Records, Haryana.
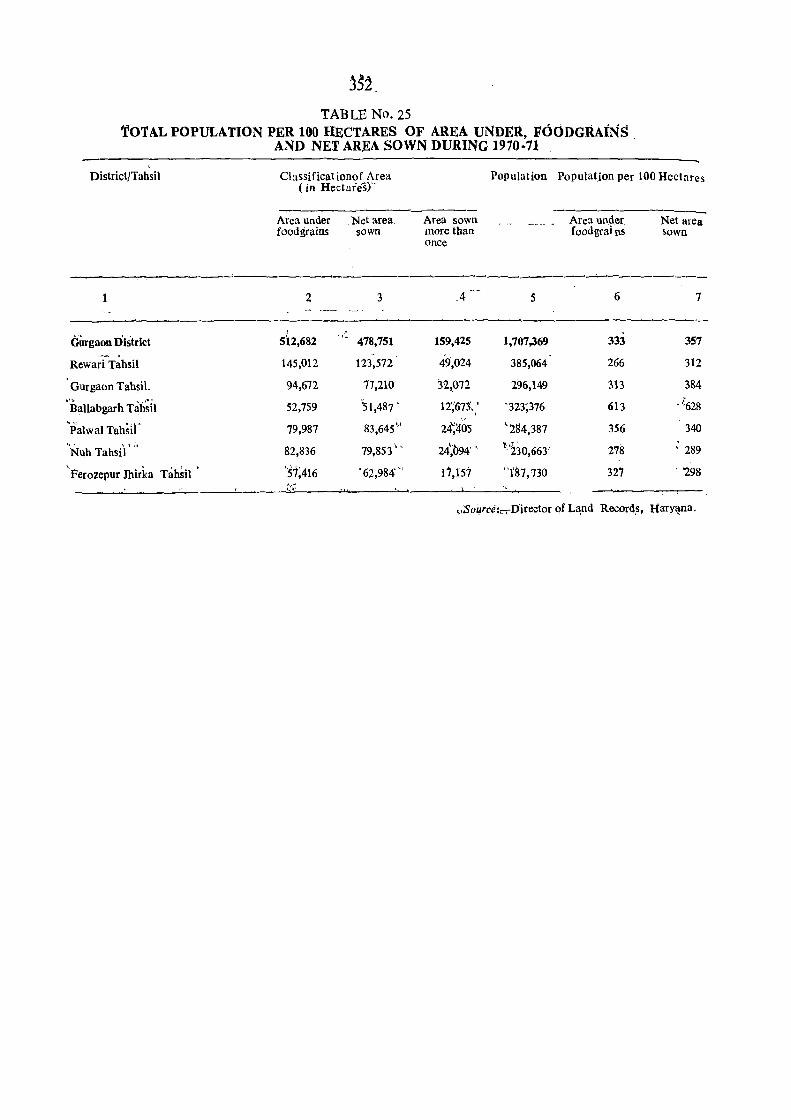
TABLE No. 25 'totAL POPULATION PER 100 HECTARES OF AREA UNDER, FOODGRAiNS
AND NET AREA SOWN DURING 1910·71
District/Tahsil
1
G~rgaon District
Rewari Tahsil
GUrgaon TabsiL
"Ballabgarb Tah;il 'Palwal Tahsi(
Nub Tahsi'l ' "
'Ferozepur Jhirka Tahsil .
Cbssificat ionof Are:l. ( in Hectares)'"
Area under Net area foodgraius sown
2 3
t . 512,682
', ... 478,751
145,012 123,572
94,672 77,210
52,759 '51,487 .
79,987 83,645'"
82,836 79,853' .
'51;416 '62,984' v ._:('
Area sown more than once
_4
159,425
49,024
32,.072
12~·673·.:
24~~05
24~tl94' ,
1'7,157
Population Population per 100 Hectares
Area under foodgrains
Net area ~own
----__..:;;_------S 6 7
---_ 1,707,369 333 357
385,064 266 312
296,149 313 384
-323;376 613 .liJ28
'1S4.387 356 340
~. ':230,663' ,
278 ' 289
''fin,730 327 . '298
\..,source:"...,Director qf L~nd Records, HaTy~na.
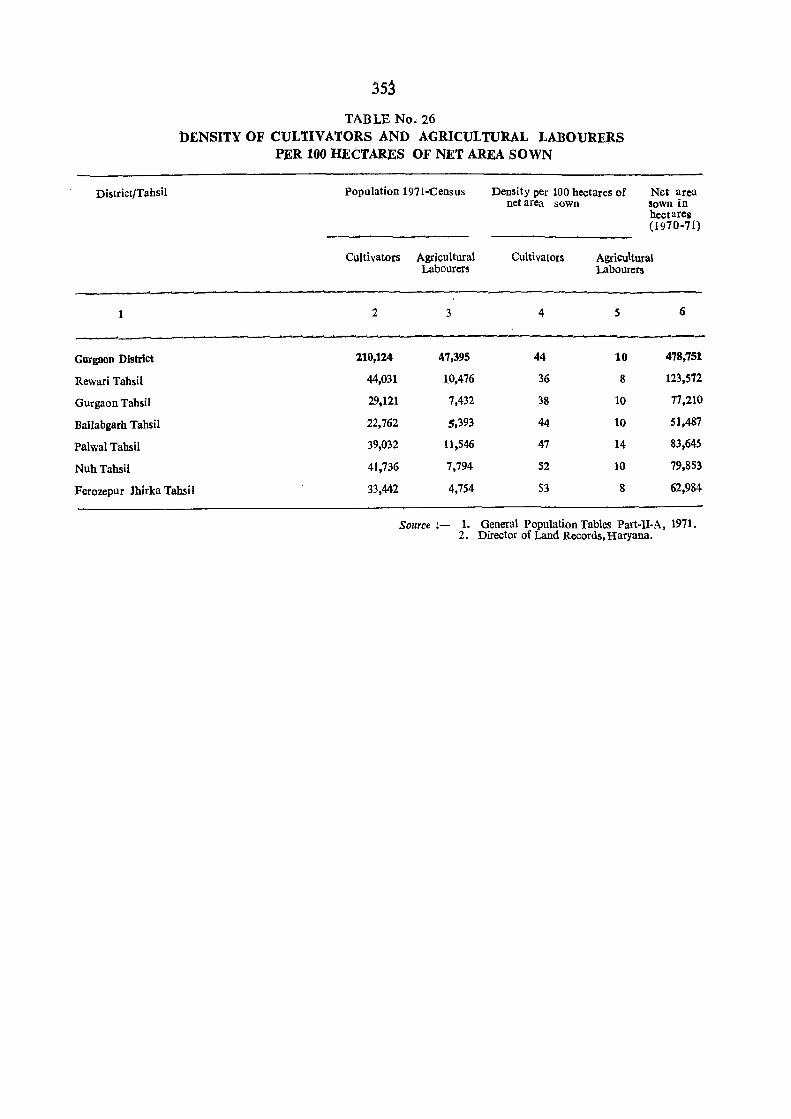
District/TahsH
1
Gurgaon District
Rewari Tahsil
GUrgaon Tahsil
BaUabgarh Tahsil
Palwal Tahsil
Nuh Tahsil
TABLE No. 26 nENSITY OF CULTIVATORS AND AGRICULTURAL LABOURERS
PER too HECTARES OF NET AREA SOWN
Population 1971-Census Density per 100 hectares of net area sown
Net arca sown in hectarcil (1970-71)
Cultivators Agricultural Cultivators Agricultural Labourers Labourers
2 3 4 5 6
210,124 1\7,395 44 10 478,751
44,031 10,476 36 8 123,572
29,121 7,432 38 10 77,210
22,762 5,393 44 10 51,487
39,032 11,546 47 14 83,645
41,736 7,794 52 10 79,853
Ferozepur Jhirka Tahsil 33,442 4,754 53 8 62,984
Source :- 1. General Population Tables Part-U-A, 1971. 2. Director of Land Records, Haryana.
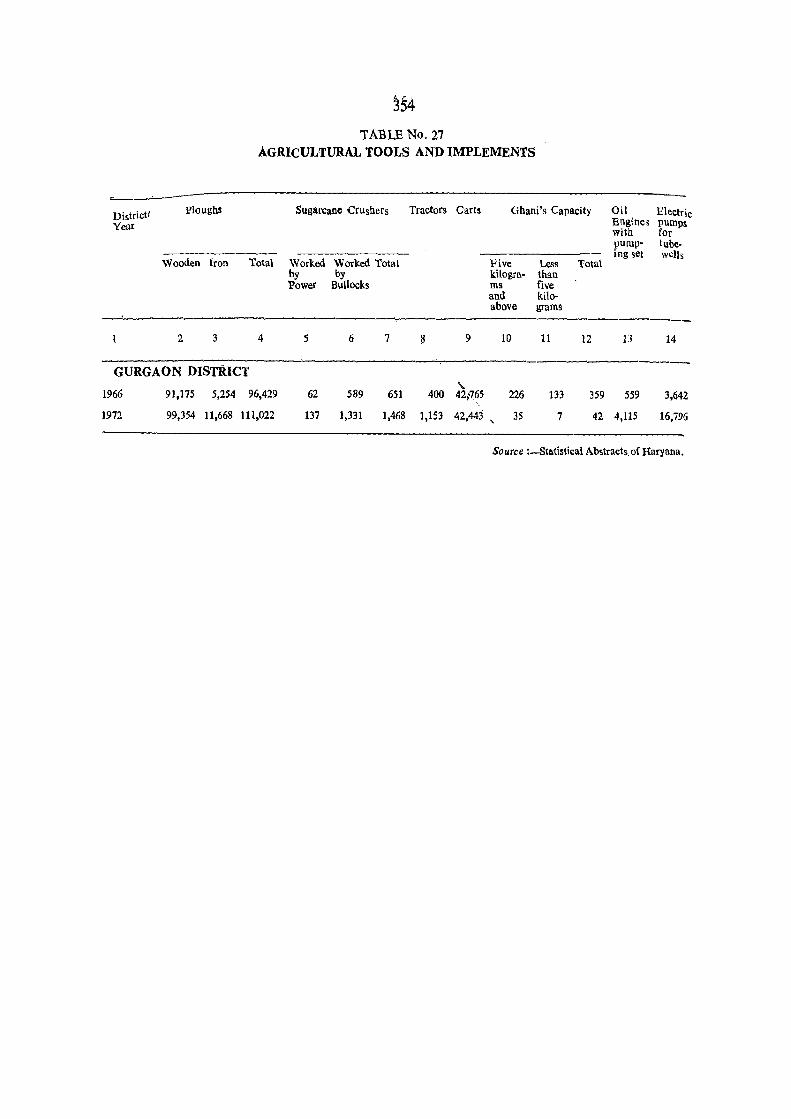
Districtl Year
PloughS
354 TABLE No. 27
AGRICULTURAL TOOLS AND IMPLEMENtS
Sugarcane Crushers Tractors Carts Ghani's Capacity
--------- ----------Wooden Iron Total Worked Worked Total Five Less Total
by by kilogra- than Power Bullocks ms five
and kilo-above grams
2 3 4 5 6 7 ~ 9 10 11 12
GURGAON DISTRICT
1966 91,175 5,254 96,429 62 589 651 '-400 42,.:(65 226 133 359
1972 99,354 11 ,668 111,022 137 1,331 1,468 1,153 42,443 , 35 7 42
Oil Electric Engines pumps with for pump- tube-ing set wells
13 14
559 3,642
4,115 16,796
Source :-Statistical Abstracts, ofHaryana.
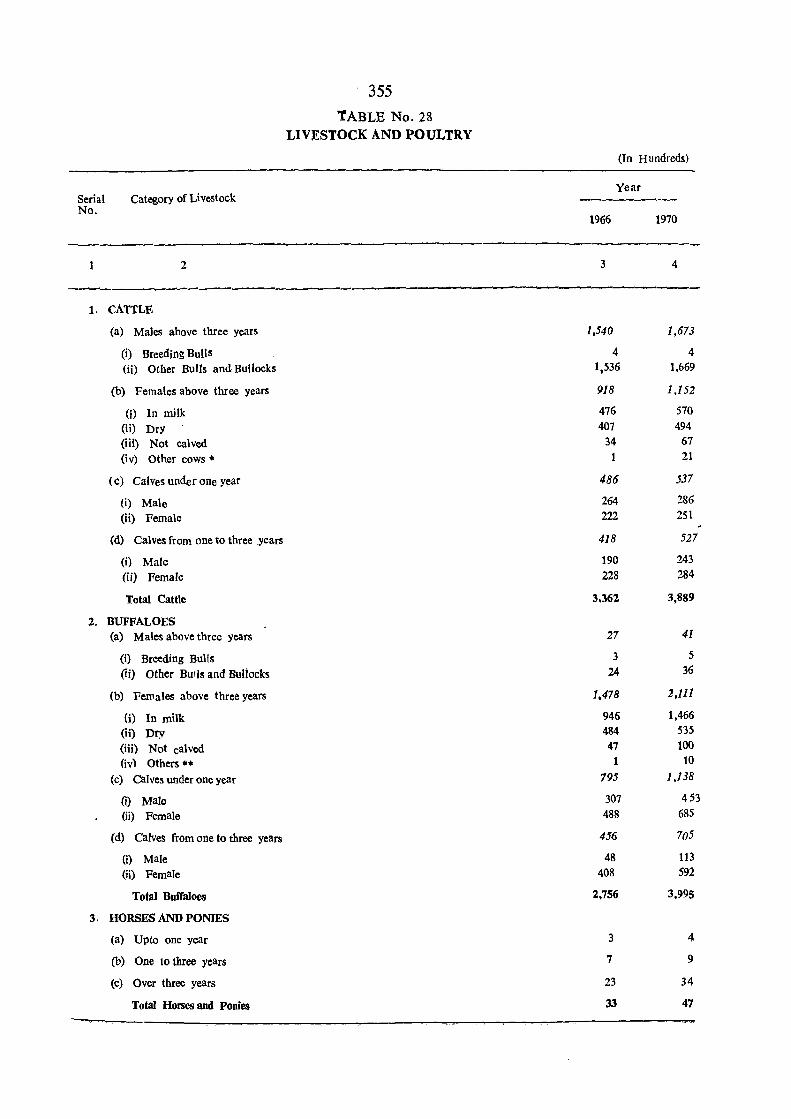
Serial No.
Category of Livestock
2
1. CATTLE
(a) Males above three years
(i) Breeding Bulls (ii) Other Bulls and Bullocks
(b) Females above three years
(i) In milk (ii) Dry (iii) Not calved (iv) Other cows •
(c) Calves under one year
(i) Male (ii) Female
(d) Calves from one to three years
(i) Male (ii) Female
Total Cattle
2. BUFFALOES (a) Males above three years
(i) Breeding Bulls (ii) Other BUlls and Bullocks
(b) Females above three years
(i) In milk (ii) Dry
(iii) Not calved (iv) Others ••
(c) Calves under one year
0) ,Male (ii) Female
(d) Calves from one to three years
(i) Male (ii) Female
Total Buffaloes
3. HORSES AND PONIES
(a) Upto one year
(b) One to three years
(c) Over three years
Total Horses and Ponies
355
'tABLE No. 28 LIVESTOCK AND POULTRY
(In Hundreds)
Year
1966 1970
3 4
1,540 1,673
4 4 1,536 1,669
918 1,152
476 570 407 494
34 67 21
486 537
264 286 222 25t
418 527
190 243 228 284
3.362 3,889
27 41
3 5 24 36
1,478 2,Ill
946 1,466 484 535 47 100 1 10
795 1,138
307 453 488 685
456 705
48 113 408 592
2.756 3,995
3 4
7 9
23 34
33 47
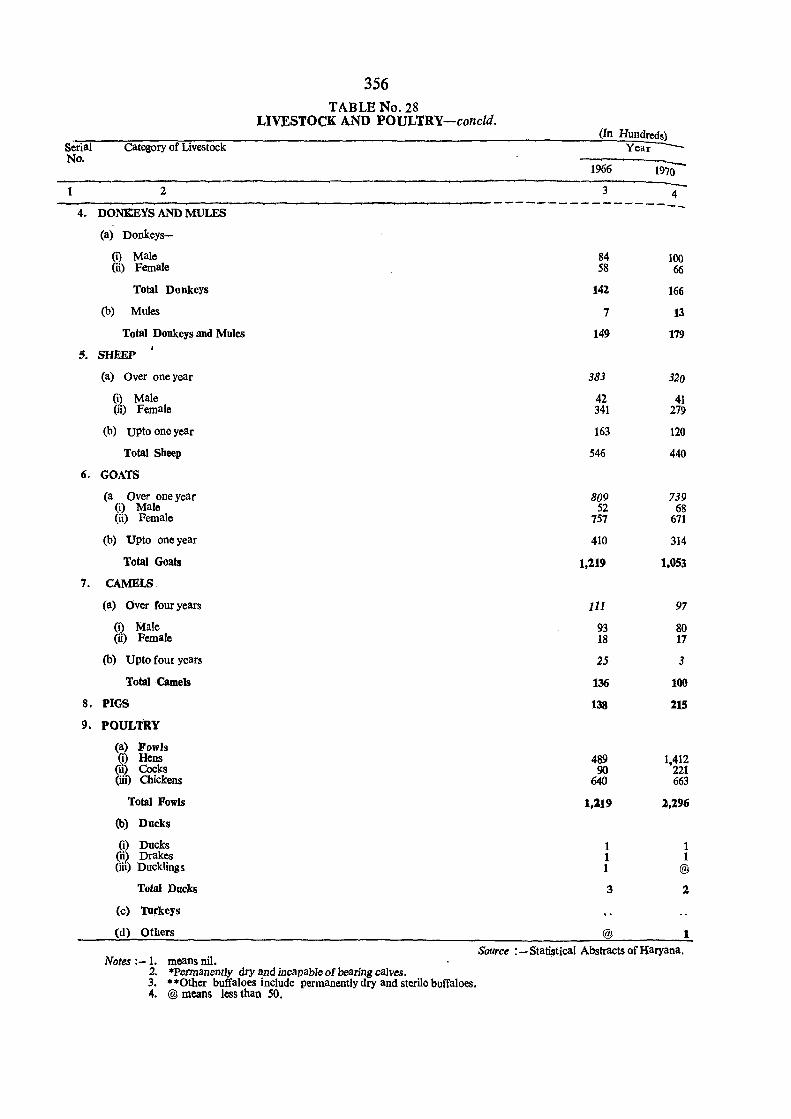
Serial No.
Category of Livestock
356 TABLE No. 28
LIVESTOCK AND POULTRY-concld.
-------,--------------.------~-----------1 2
(In Hundreds) Year -
----~~-1966 1970
3 4 ,-----------~-------------------
4. DONKEYS AND MULES
(a) Donkeys-
(i) Male (ii) Female
Total Donkeys
(b) Mules
Total Donkeys and Mules
5. SHEEP
(a) Over one year
(i) Male (iJ) Female
(b) upto one year
Total Sheep
6. GOATS
(a Over one year (i) Male (ii) Female
(b) Upto one year
Total Goats
7. CAMELS
(a) Over four years
(i) Male (ii) Female
(b) Upto four years
Total Camels
8. PIGS
9. POULTRY
(a) Fowls (i) Hens (ii) Cocks (iii) Chickens
Total Fowls
(b) Ducks
(i) Ducks (ii) Drakes (iii) Duckling s
Total Ducks
(c) Turkeys
(d) Others
Notes :- 1. means nil. 2. *Pennanently dry and incapable of bearing calves. 3. * *Other buffaloes include permanently dry and sterile buffaloes. 4. @ means less than 50.
84 100 58 66
142 166
7 13
149 179
383 320
42 41 341 279
163 120
546 440
809 739 52 68
757 671
410 314
1.219 1,053
111 97
93 80 18 17
25 3
136 100
138 215
489 1,412 90 221
640 663
1,219 2,296
1 1 1 1 1 @
3 2
@ 1 Source : - Sta~tical Abstracts of Haryana.
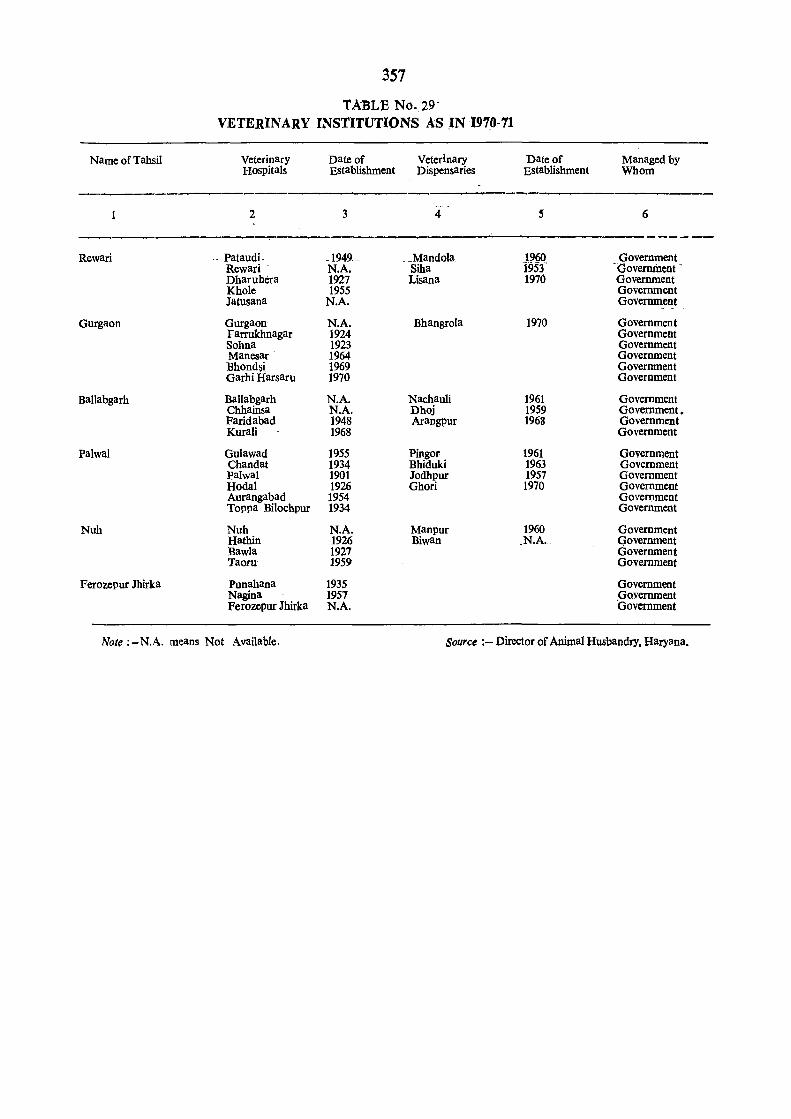
357
TABLE No .. 29-VETERINARY INSTITUTIONS AS .IN 197_6-71
Name of Tahsil Veterinary Date of Veterinary Date of Managed by Hospitals Establishment Dispensaries Establishment Whom
2 3 4 S 6
-----Rewari -- Pataudi- _1949 _ __ Mandola. 1960 Government
Rewari ' N.A. Siha 1953- -'Government -Dharuhera 1927 Lisana 1970 Government Khole 1955 Government Jatusana N.A. Government
Gurgaon Gurgaon N.A. Bhangrola 1970 Government Farrukhnagar 1924 Government Sohna 1923 Government Manesar 1964 Government Bhondsi. 1969 Government Garhi Harsaru 1970 Government
Ballabgarh Ballabgarh N.A. Nachauli 1961 Government Chhainsa N.A. Dhoj 1959 Government. Faridabad 1948 Arangpur 1968 Government Kurali 1968 Government
Palwal Gulawad 1955 Pingor 1961 Government Chandat 1934 Bhiduki 1963 Government palwal 1901 Jodhpur 1957 Government Hodal 1926 Ghori 1970 Government Aurangabad 1954 Government Toppa Bilochpur 1934 Government
Nuh Nuh N.A. Manpur 1960 Government Hathin 1926 Biwan .N.A •. Government Bawla 1927 Government Taoru 1959 Government
Ferozepur Jhirka Punahana 1935 Government Nagina 1957 Government Ferozepur Jhirka N.A. 'Government
Note :-N.A. means Not Available. Source :- Director of Animal Husbandry, Haryana.
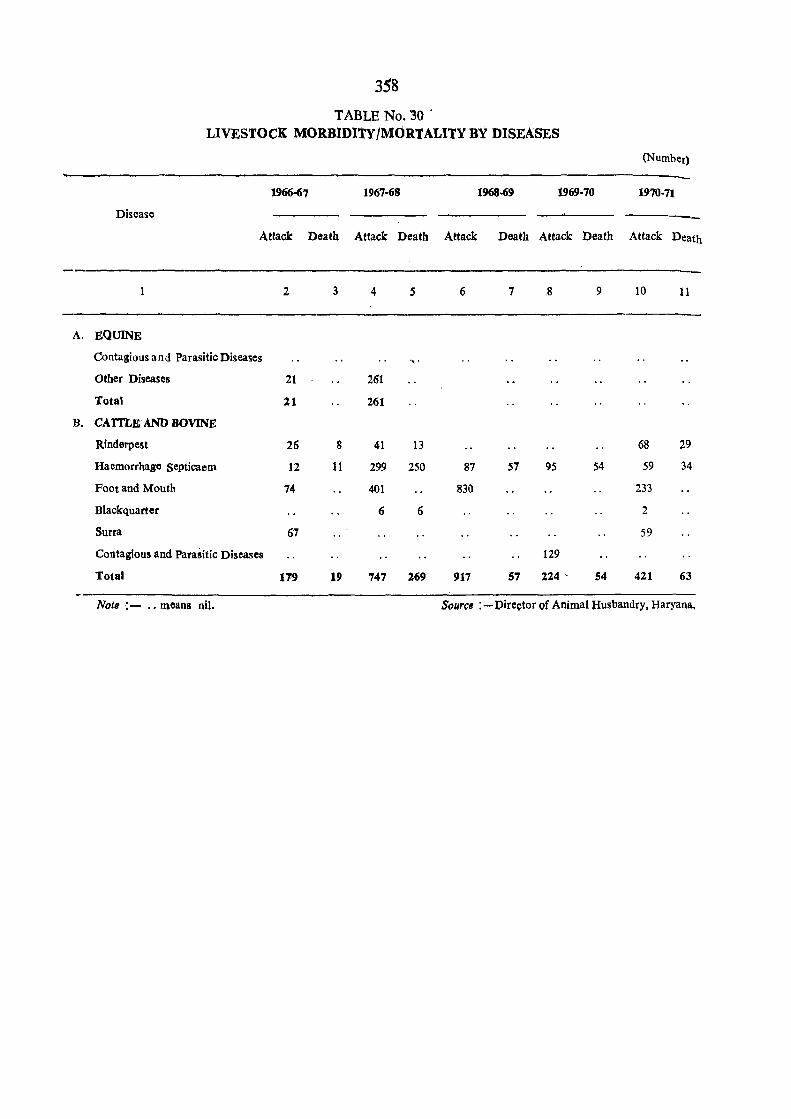
358
T ABLE No. '30 . LIVESTOCK MORBlDI'fV /MORTALITY BY DISEASES
(Number)
1966-67 1967-68 1968·69 1969·70 1970-71
Disease
Attack Death Attack Death Attack Death Attack Death Attack Death
1 2 3 4 5 6 7 8 9 10 11
A. EQUINE
Contagious and Parasitic Diseases .~ . Other Diseases 21 261
Total 21 261
B. CATTLE AND BOVINE
Rinderpest 26 8 41 13 68 29
Haemorrhage septicaem 12 11 299 250 87 57 95 54 59 34
Foot and Mouth 74 401 830 233
Blackquarter 6 6 2
Surra 67 59
Contagious and Parasitic Diseases 129
Total 1719 19 '747 269 917 57 224 . S4 421 63
Note i- .. means nil. Source : -Director of Animal Husbandry, Haryana,

Year
1966-67
1967-68
19,68-69
1969-70
1970-71
359 TABLE No. 31
FOREST AREA BY CATEGORY OF CONTROL
Reserved Forest
2
6
6
6
6
6
(In Square Kilometres)
Protected Forest
3
19
28
34
42
42
Unclassed Forest
4
1
1
2
1
2
Total
5
26
35
42
49
50
SQurce : -Chief Conservator of Forests, Haryana.
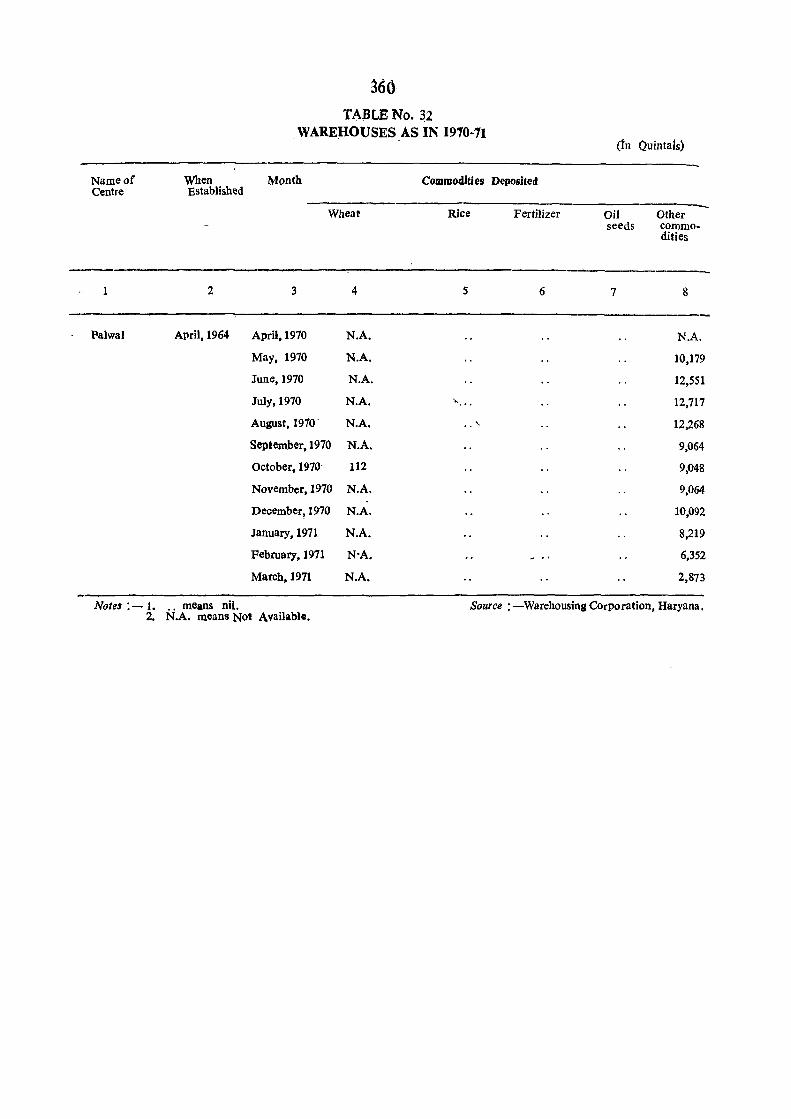
Name of Centre
--I
Palwal
Notes :-1. 2.
When Established
2
April, 1964
.. means nil.
360 TABLE No. 32
WAREHOUSES AS IN 1910-71
Month Commodities Deposited
(tn Quintals)
--------------------------------------------------____ Wheat Rice Fertilizer Oil Other seeds commo-
dities
3 4 S 6 7 8
April, 1970 N.A. N.A.
May, 1970 N.A. 10,179
June, 1970 N.A. 12,551
July, 1970 N.A. ........ 12,717
August, 1910' N.A. " , 12,268
September, 1970 N.A. 9,064
October, 1970 112 9,048
November, 1970 N.A. 9,064
December, 1970 N.A. 10,092
January, 1971 N.A. 8,219
February, 1971 N·A. 6,352
March, 1971 N.A. 2,873
N.A. means Not Available. Source: -Warehousing Corporation, Haryana.
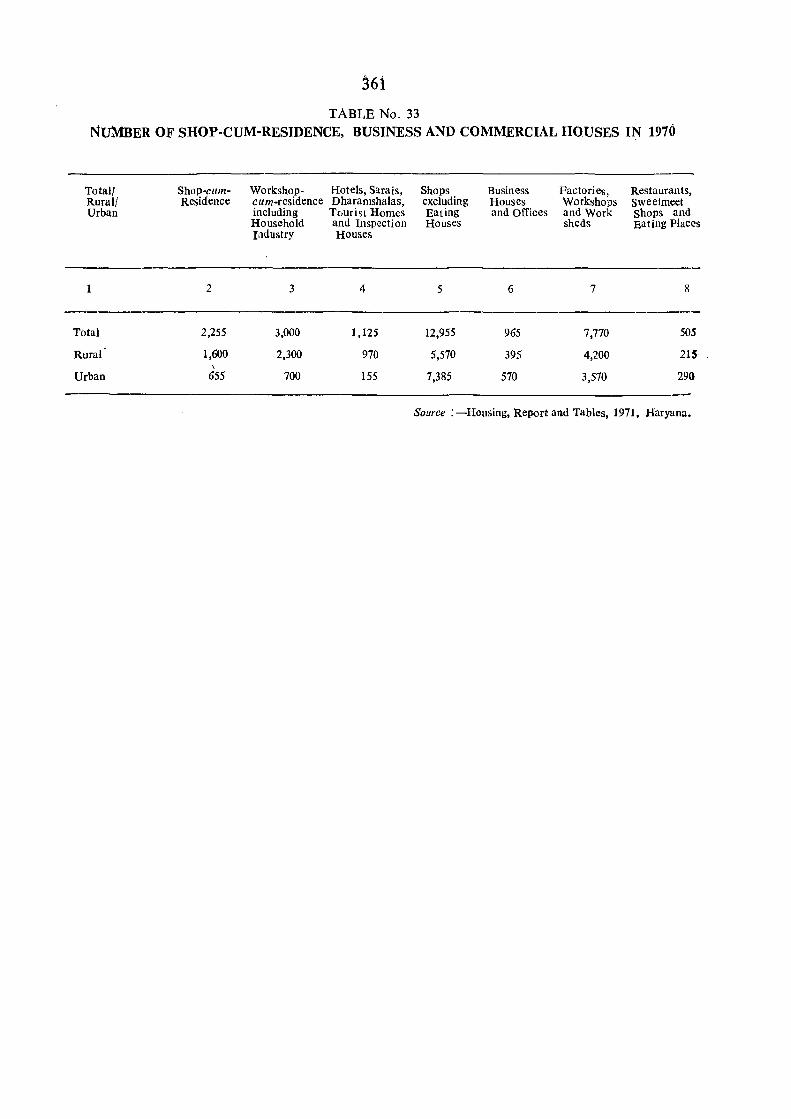
361
TABLE No. 33 NuMBER OF SHOP-CUM-RESIDENCE, BUSINESS AND COMMERCIAL HOUSES IN 1970
Total! Shop-cum- Workshop- Hotels, Sarais, Shops Business Factories, Restaurants, Rural/ Residence cum-residence Dharamshalas, excluding Houses Workshops Sweetmeet Urban including Tourist Homes Eating and Offices and Work Shops and
Household and Inspection Houses sheds Ea ting Places Iildustry Houses
2 3 4 5 6 7 8
Total 2,255 3,000 1,125 12,955 965 7,770 50S
Rural 1,600 2,300 970 5,570 395 4,200 2iS \
Urban 655 700 155 7,385 570 3,570 290
SOl/rce :-Housing, Report and Tables, 1971, Haryana.
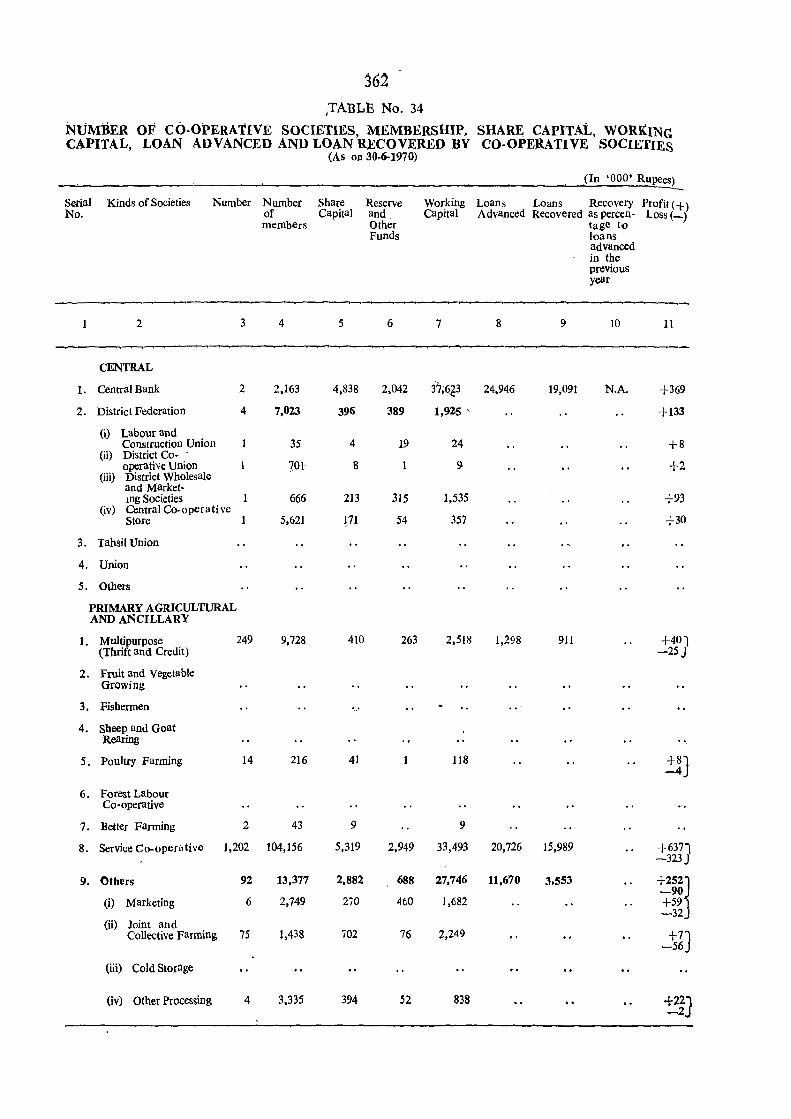
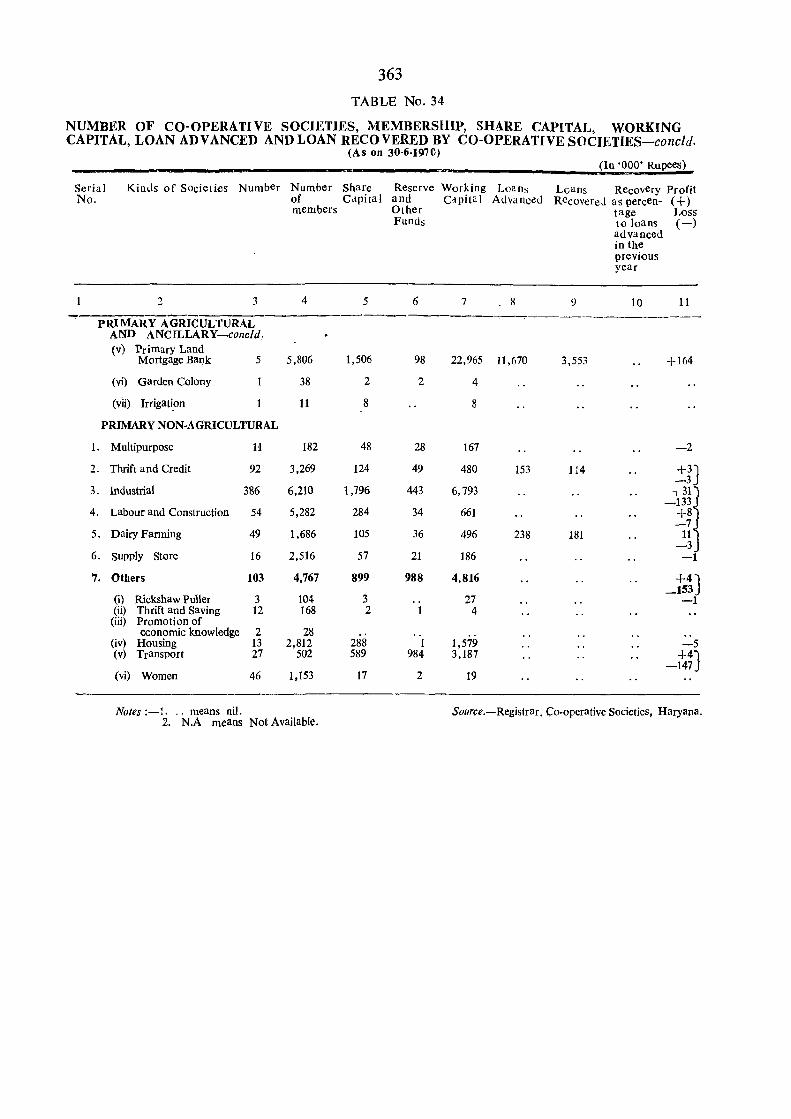
363
TABLE No. 34
NUMBER OF CO-OPERATIVE SOCIETIES, MEMBERSHIP, SHARE CAPITAL, WORKING CAPITAL, LOAN ADVANCED AND LOAN RECO VERED BY CO-OPERATIVE SOCIETIES-concld.
(As on 30-6·1970) (In '000' Rupees)
Serial Kinds of Societies Number Number Share Reserve Working Loans Loans Recovery Profit 'No- of Cdpital and Cdpital Advanc~d RecovereJ as percen- (+)
members Other tage Loss Funds to loans (-)
advanced in the previous year
.2 3 4 5 6 7 . 8 9 10 11
PRIMARY AGRICULTURAL AND ANCILLARY~concld.
(v) Primary Land Mortgage BaQk 5 5,806 1,506 98 22,965 11 ,670 3,553 +164
(vi) Garden Colony 38 2 2 4
(VIi) Irrigation 11 8 8
PRIMARY NON-AGRICULTURAL
1. Multipurpose 11 182 48 28 167 -2
2. Thrift and Credit 92 3,269 124 49 480 153 114 +3J -3 3. Industrial 386 6,210 1,796 443 6,793 ., 311
-133J 4. Labour and Construction 54 5,282 284 34 661 +81
5. Dairy Farming 49 1,686 105 36 -7J
496 238 181 111
57 -3J
6. Supply Store 16 2,516 21 186 -1
7. Others 103 4,767 899 988 4,816 +41
3 _153J
(i) Rickshaw Puller 3 104 .. 27 -1 (ii) Thrift and Saving 12 168 2 1 4
(iii) Promotion of economic knowledge 2 28 ., ..
(iv) Housing 13 2,812 288 1 1,579 -5 (v) Transport 27 502 589 984 3,187 +41
(vi) Women 46 1,153 17 2 19 -147J
Notes :-1. ., means nil. Source.-Registrar. Co-operative Societies, Haryana. 2. N.A means Not Available.
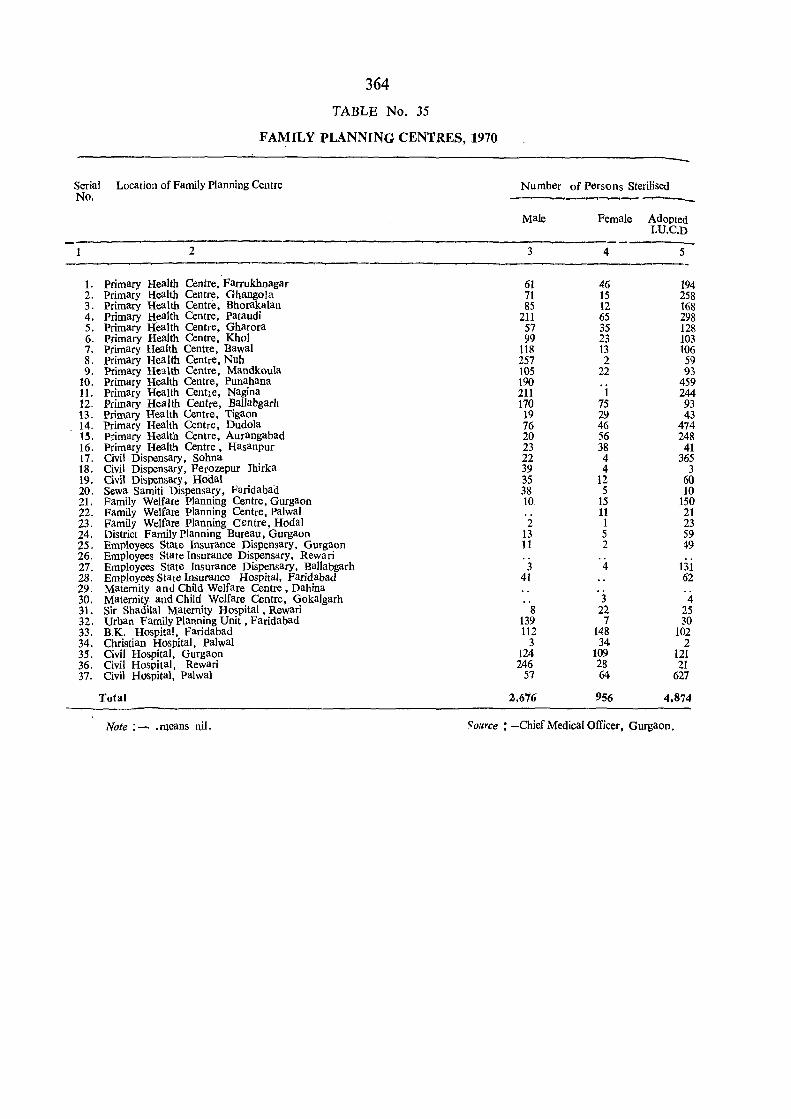
364
TABLE No. 35
FAMILY PLANNING CENTRES, 1970
Serial Location of Family Planning Centre No.
2
1. Primary Health Centre. Farrukhnagar 2. Primary Health Centre, Ghangola 3. Primary Health Centre, Bhorakalan 4. Primary Health Centre, pataudi 5. Primary Health Centre, Gharora 6. Primary Health Centre, Khol 7. Primary Health Centre, Bawal 8. Primary Health Centre, Nuh 9. Primary Health Centre, Mandkoula
10. Primary Health Centre, Punahana 11. Primary Health Centre, Nagina 12. Primary Health Centre, Ballabgarh 13. Primary Health Centre, Tigaon 14. Primary Health Centre, Dudola 13. Primary Health Centre, Aurungabad 16. Primary Health Centre, Hasanpur 17. Civil Dispensary, Sohna 18. Civil Dispensary, Ferozepur Jhirka 19. Civil Dispensary, Hodal . 20. Sewa Samiti Dispensary, Faridabad 21. Family Welfare Planning Centre, Gurgaon 22. Family Welfare Planning Centre, Palwal 23. Family Welfare Planning centre, Hodal 24. District Family Planning Bureau, Gurgaon 25. Employees State Insurance Dispensary, Gurgaon 26. Employees State Insurance Dispensary, Rewari 27. Employees State Insurance Dispensary, Ballabgarh 28. Employees State Insurance Hospital. Faridabad 29. Maternity and Child Welfare Centre, Dahina 30. Maternity and Child Welfare Centre, Gokalgarh 31. Sir Shadilal Maternity Hospital, Rewari 32. Urban Family Planning Unit, Faridabad 33. B.K. Hospital, Faridabad 34. Christian Hospital, Palwal 35. Civil Hospital, Gurgaon 36. Civil Hospital, Rewari 37. Civil Hospital, palwal
Total
~~
Number of Persons Sterilised
Male Female AdoPted I.U.C.D
------__ 3 4 5
61 46 194 71 15 258 85 12 168
211 65 298 57 35 128 99 23 103
118 13 106 257 2 59 105 22 93 190 459 211 1 244 170 75 93 19 29 43 76 46 474 20 56 248 23 38 41 22 4 365 39 4 3 35 12 60 38 5 10 10 15 150
11 21 2 1 23
13 5 59 11 2 49
.. 3 4 131
41 62 ..
3 4 8 22 25
139 7 30 112 148 102
3 34 2 124 109 121 246 28 21
57 64 627
2,676 956 4,874
Note :- . means nil. "ouree : -Chief Medical Officer, Gurgaon .
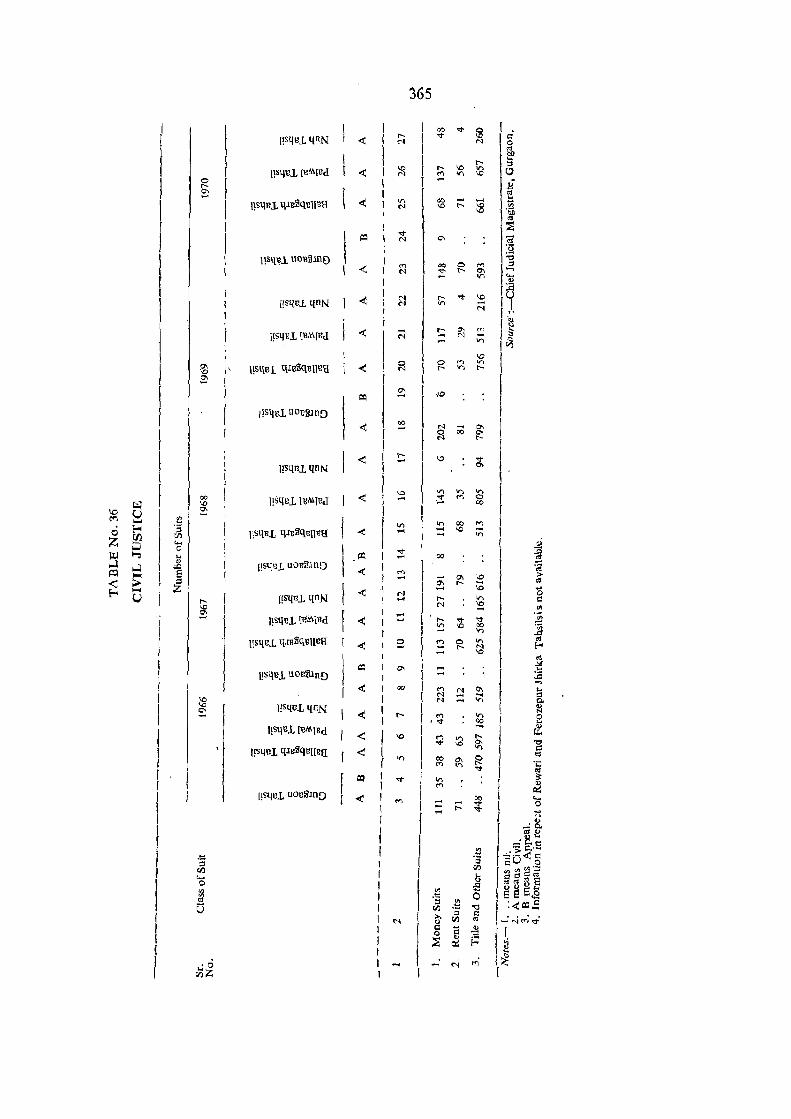
i
I I I
I I I [ I I !
I I
I I I { I
I'
I I I'
I
~ ! ! I r I
· r I
I
]!sqBL {ll·\\fl1d
l!sqllJ., U011'illnD
[[sqllL qn _N
I!S\jB.L I'e'M\lld
llSllllL q.rnilQElll1K
US\[\lL UOll2.!nD
(!sQI1L qn_N
l!Sl.\llL IBMIUd
I!squ]. q.miJqllj[IlH
I ~
I r ..(
, , l:i
1 I ~ I I \ :q \ \ \ ;!i I
I "" \ M I \ <'I
f
'"
(.1
~
0'1 -00 -
I ~
I
M -N ....
I 01 I I 00
I I r-I
I : f v I I M
\ 1 \ I I I 1 I I I \ M I I I I I
365
I ~
I : : : [ ~ r-- ~
r 0\
I : : ; .... 10
'0
~ ~ ~
,'0
N ... 0'1 ~ 00 g;
[\.? (j;
I;;;~~ 1:Sil:~
II ~ ~ ~ "'" :tt 1~1O;r;
I ; g ~ ( N E ~ f,~ ~
I : : ; I e ~ ~
I ~ .~ j If o~Jl ~ 1:: ~
I ~ : : I
I . c: o '" ~ o i .~ ;;p ~ Oi ~g
'" :s .... ...... .!ol
[.e
I~ L" r ~ i ::: I~
I I I j.
'" ~
I ~
I i I 8
I ! r _: &
ClIO
I ..... a:; I :;;: p,._
r'au~§
f ~~ ~f IE 9 s~
:..(al.5 [r";,.-i";..i . r
I~ I
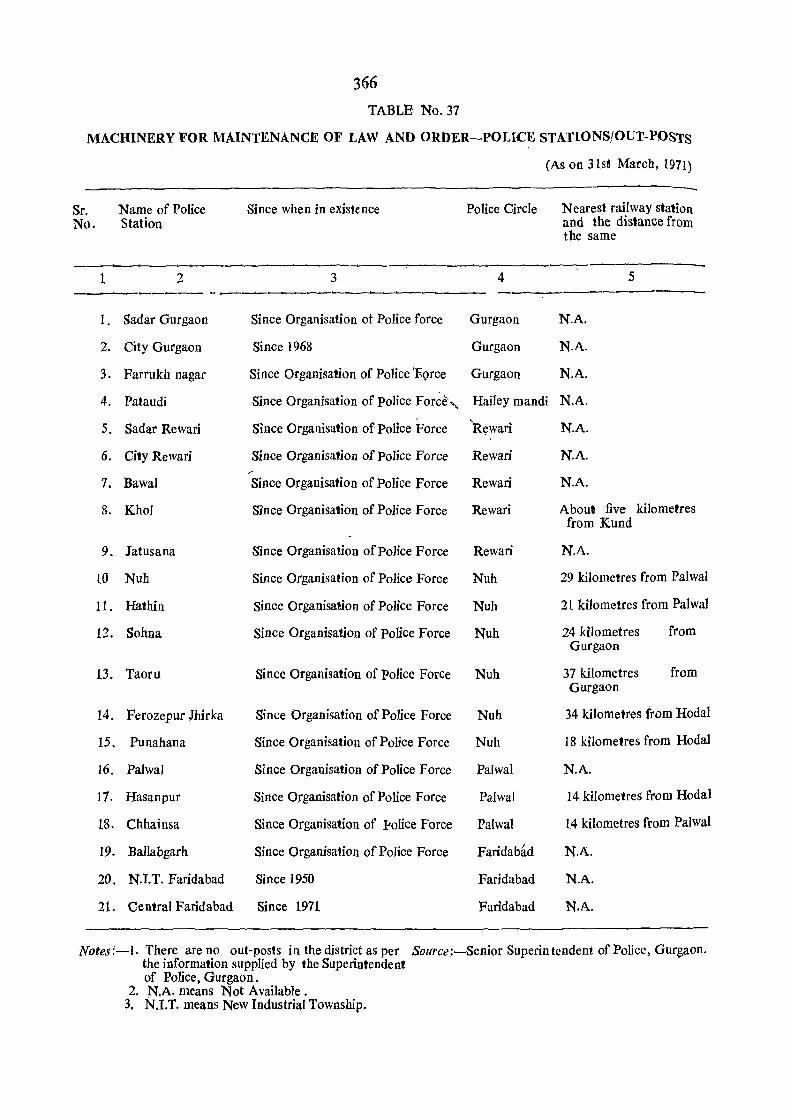
366
TABLB No. 37
MACHINERY FOR MAINTENANCE OF LAW AND ORDER-POLICE STATIONS/OUT-POStS
(As on 31st March, 1971)
Sr. Name of Police Since when in existence No. Station
Police Circle Nearest railway station and the distance from the same
~----,--. -----_ 1 2 3
-------- - ----.----1 . Sadar Gurgaon Since Organisation ot Police force
2. City Gurgaon Since 1968
3. Farrukh nagar Since Organisation of Police 'FQrce
4
Gurgaon
Gurgaon
Gurgaon
N.A.
N.A.
N.A.
5
4. Pataudi Since Organisation of Police Force·", Hailey mandi N.A.
5. Sadar Rewari Since Organisation of Police Force R.~wari
6. City Rewari Since Organisation of Police Force Rewari /"
7. Bawal Since Organisation of Police Force Rewari
8. KhoI Since Organisation of Police Force Rewari
9. Jatusana Since Organisation of Police Force Rewari
to Nuh
11. Hathin
12. Sohna
13. Taoru
Since Organisation of Police Force
Since Organisation of Police Force
Since Organisation of Police Force
Since Organisation of Police Force
14. Ferozepur Jhirka Since Organisation of Police Force
15. Punahana Since Organisation of Police Force
16. Palwal Since Organisation of Police Force
17. Hasanpur Since Organisation of Police Force
18. Chhainsa Since Organisation of ¥olice Force
19. Ballabgarh Since Organisation of Police Force
20. N.I.T. Faridabad Since 1950
21. Central Faridabad Since 1971
Nuh
Nub
Nub
Nuh
Nuh
Nuh
Palwal
Palwal
Palwal
Faridabad
Faridabad
Faridabad
N.A.
N.A.
N.A.
About five kilometres from Kund
N.A.
29 kilometres from Palwal
21 kilometres from Palwal
24 kilometres Gurgaon
37 kilometres Gurgaon
from
from
34 kilometres from Hodal
18 kilometres from Hodal
N.A.
14 kilometres from Hodal
14 kilometres from Palwal
N.A.
N.A.
N.A.
Notes:-I. There are no out-posts in the district as per Source:-Senior Superin tendent of Police, Gurgaon. the information supplied by the Superintendent of Police, Gurgaon.
2. N.A, means Not Available. 3, N.I.T. means New Industrial Township.
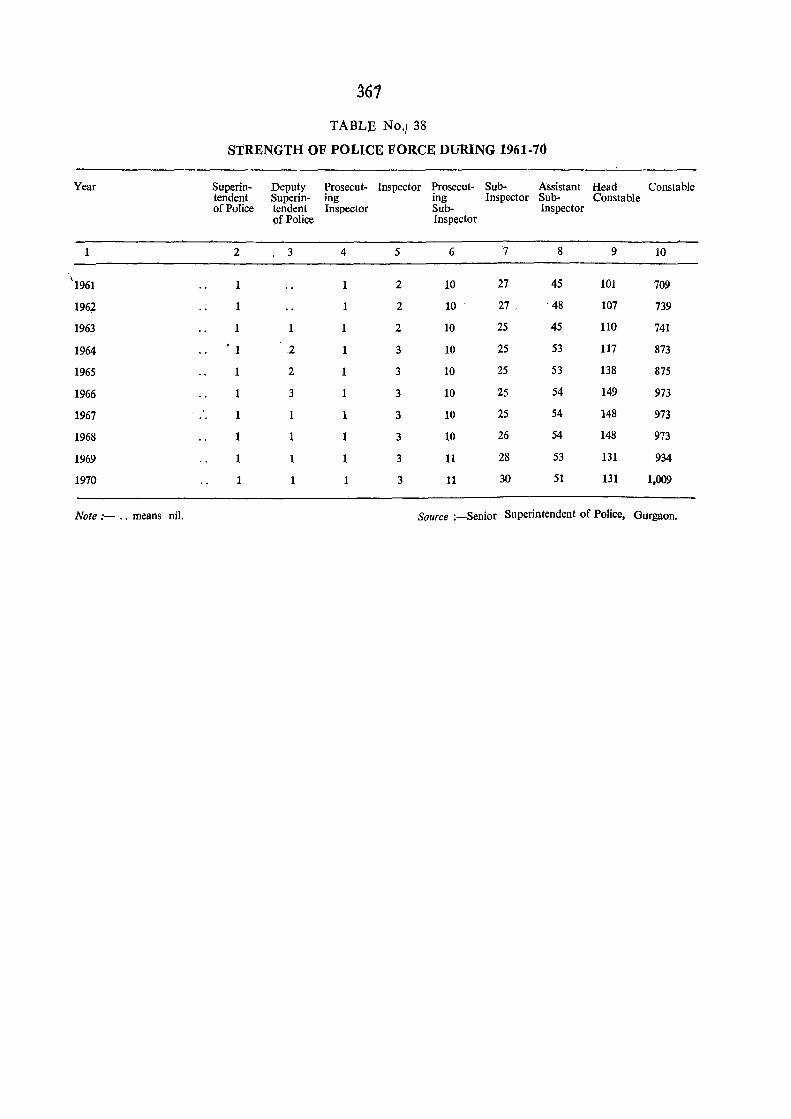
~61
TABLE No., 38
STRENGTH OF POLICE FORCE DURING 1961-70
Year Superin- Deputy Prosecut- Inspector Prosecut- Sub- Assistant Head Constable tendent Superin- ing ing Inspector Sub- Constable of Police tendent Inspector Sub- Inspector
of Police Inspector
2 3 4 5 6 7 8 9 10
\1961 1 1 2 10 27 45 101 709
196~ 1 2 10 27 . . 48 107 739
1963 1 1 1 2 10 2S 4S 110 741
1964 • 1 .2 1 3 10 2S 53 117 873
1965 1 2 1 3 10 25 53 138 87S
1966 1 3 1 3 10 25 54 149 973
1967 1 1 3 10 2S 54 148 973
1968 1 1 3 10 26 54 148 973
1969 1 1 3 11 28 53 131 934
1970 1 3 11 30 51 131 1,009
Note :- .. means nil. Source :-Senior Superintendent of Police, Gurgaon.
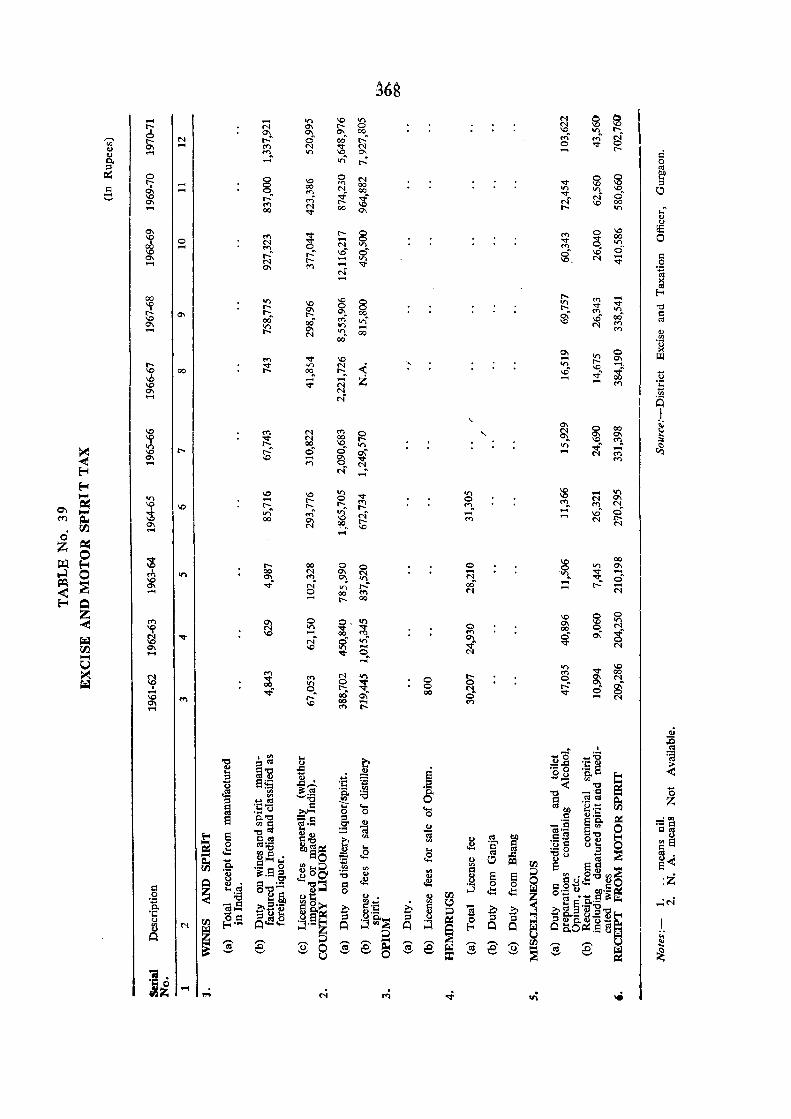
~68
- '" 10 a N 0 ~ ,.., N '" ~ N 0\ .,... '" ""l,
.,... 0'\ 0\ 0'\. 00
M 8 "....._ N .,..." 0 00 .,..." M .,... 0 "'" '" 0'\ ..... M N \1; N ..... .,... cu .... M • '" 0\ d cu or) r-: 0 0. -::s '" ~ 0 0 0 N 0 ° e?
~ 10 M "'" '" '" ::I .... 8 co N co
'" on '" ~ Q ..... M
ti 00 "<:t N" 0 ......
'" r..:- M \1; • N" '-' 0'\ '" 00 M N 00 I"- '" ..... 00 "<:t '" cu 0
~ .,... 8 M 0 10 ~ g 00 0 0
M - "<:t ~ II"l N N II"l M o· 00 ..... M 10 .,.... r..:- IO· 0 o· 10 ..... I:: 0'\ .,... ..... '" 10, N
"'" 0 ,.., N ..... "'" 0'\ M N 0'; .....
~ I"- -00 II"l 10 0 '" M
"'" 10 .,... \0 0 ° .,... "'" II"l '0 t!- 0\ 0\ M I:: 0\ .,.... .,... 00 0'\ • IJS 00· 10 00 00· M ",. 10 M '" 0'\ If'> If'> .... N
M .... .,... 0\ '" 00 (!) N 00" <Il
'u 01 0 :<
"'" \0 .... '" '" lJ.! M -, If'> .,... --.,... tt '" ~. ~ IJS 10 ,.f '" 00 00
"'"" t) -b .... Z 00 N ..... M ~ 10 ..,.
0\ N ,.., ('.l.
ei ~
I 0'\ ~ <"l ~
0 00 10 M ('.l g '. 0'\ '" '" tt. N 00 v;' 10" <'l. ::: I 00 10 If'> ~ ~
If'>
'" <$ o· ~
...... ~ -'" .,...
M
-< 0\ 10 ..... ~ M .... <"l 1"1 ~ N
~ '" '"
10 ..... II"l 10 10 "<:t 10 0'\ Joo< If'> - '" 0 ° <'l. N N ~ 10 "'. .,... '" M <'l. «:. 10 ","
.,... ..... o· Q\ Joo< ~ If'> M ~ ..... ...... 10
10 M ('.l (":00 ("f"l ~ 00 0'\ N 00 '" N 00. 10
0 ,.., ....
z ~ 0 ~ ~
00 Ill. ~ .,... 00 0 0 0 If'> 0'\ ..:l 0 00 N 0\ N ..... .""l, ~. 2-M It) "'. M 0\. If'> N I:t:I 10
2f <1:J. ...... ~ 0\ "<:t V) r..:- ...... N <: ,..,
00 M N ...... t"- oo ~ Q
~ 10 0 0 M 0\ 0 O. It) 01 10 '" ~
N If'> "<:t "<:t 0 00 ° i 10 ..... 00 to M o· 0\ r;ol "<:t rif o· ",. 0'\
t "'" 00 0\ If'> .... ,.., "'" 0" - .... U If'>
"'" 10
M 00 ~ fi?
M M ~ '"
.,... 0 0\ N "'" 0 0\ r;ol ~ '" t-;. ~ 0 ~ r..:- 0 ~ - "'"
o. 00 0\ 00 o· "'" ..... N '" M to 00 ..... M 0\ M I'-....
U
~..g I
:g '" ~:a :;:I
'0 b'" ~ ti ~,L1 '1=: cu ~ e Q'O .~ 0 'as ::s "'0 .; ::::: e 3,2 '" ~ 1:) e;;: ,L1' :E <= 'a < '0 ...
~ '" ~'2 0. • l!l '0 --I:: 0 '" ._..~ '" '0 0 Q .!!! <II Z ::s ... '" = :5'0 = '§' '0 ..... "'co ~'E rn 8
;., ...... 0 I:: o.~ Q'. 0.'0 ~.!3 ::s ~~
.",
"'= g cu .; _"8 S
:;:1= '0'"
... '; "'.~ c", ~ § CUcu 'Il oS ~ t:l'" 0] Q)
Q'" Q'O C <Il II) .;:: 'od 0 ~e ; (Ij;a 11o"'Q'. S ... ... ~ «I .~ 0 u~ <1:= ~ Q • 80 <E ~
«I ,L1 13 0 ~ «I
~ 0 '" ~ s< ~ Q ...... ....
"' ... 0 .i '" g e e~ .~ d 0 ~ 00' '" '" Q e l!l . 8'0 "'~ :.~.§- '0 0 0 .S § ::i
~ ~ . ~'B::3 d ~ ~ 0 co2 ..... ~O d "'03 0'0- 0 rn ~ <1:= <l::
~ O'~ 0 bl).~ Q'. 0 :a Q)~ 01:: 'U 0 1; ·0..9 ~ »;., ....;C'i "a -d ;., !3.~ "'0 .... ~.~ '" g ;.,l; §·o '0 '0 r; r; Q 'a .e- .e-03 ...... 'Sue 8 0.Q'. Q,).~ 'U 15 c..~ ~.E Q) ~ ·c Od .S:! o.~ ~ Q'. ~ ::J ::J
~ N rn ~ ... o~rE ~.§~ 0 ~'" 0 ~
0 0 oeo. g1;Q.. J. A ~ e ~
c.O~.~ ofil ~ :s $ '2 e $ ~
"....._ U ~ 0 '2 ~ '2 ~ e ~
.. '-' U
._, ._, ._, ._, $ ~ ... 'I=: ' .;!~ ...
N ..; ..;. .n .. ""'
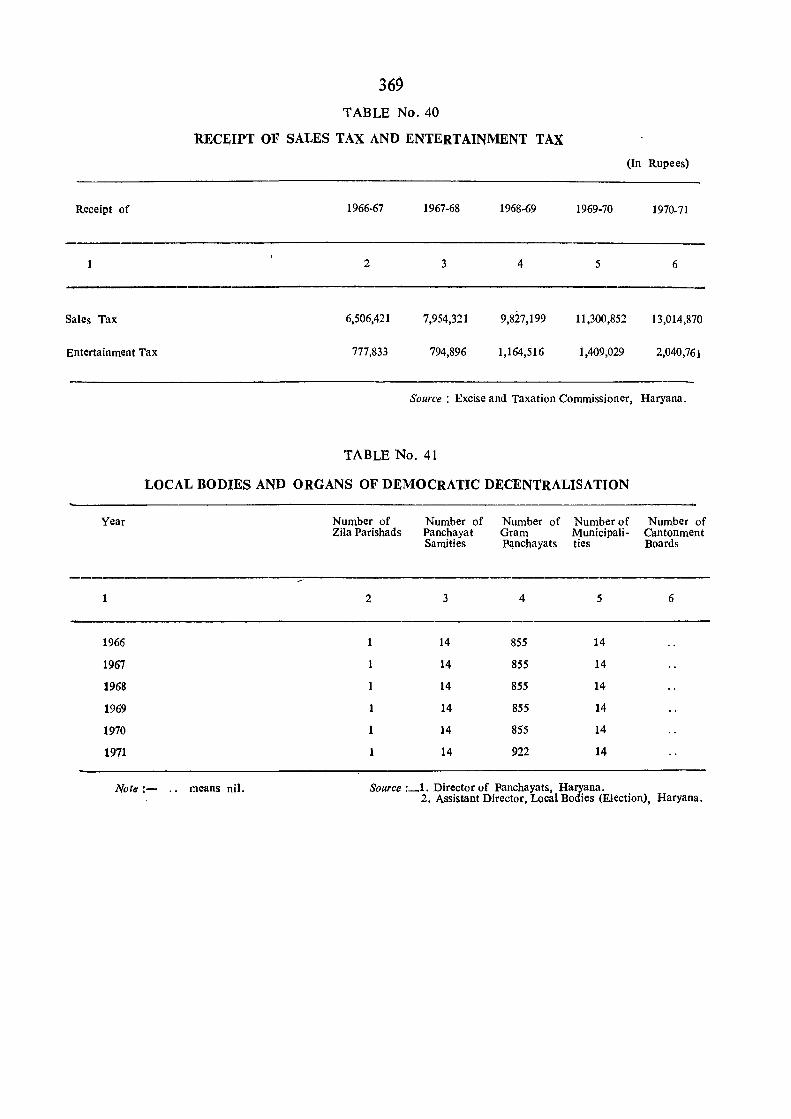
369
TABLE No. 40
RECEIPT OF SALES TAX AND ENTERTAINMENT TAX
(In Rupees)
Receipt of 1966-67 1967-68 1968-69 1969-70 1970-71
2 3 4 5 6
Sales Tax 6,506,421 7,954,321 9,827,199 11,300,852 13,014,870
Entertainment Tax 777,833 794,896 1,164,516 1,409,029 2,040,761
SOllrce : Excise and Taxation Commissioner, Haryana.
TABLE No. 41
LOCAL BODIES AND ORGANS OF DEMOCRATIC DECENTRALISATION
Year
1966
1967
1968
1969
1970
1971
Note :- .. means nil.
Number of Zila Parishads
2
Number of Panchayat Samities
3
14
14
14
14
14
14
Number of Gram panchayats
4
855
855
855
855
855
922
Number of Municipalities
5
14
14
14
14
14
14
SOllrce :_1. Director of Panchayats, Haryana.
Number of Cantonment Boards
6
2. Assistant Director, Local Bodies (Election), Haryana.
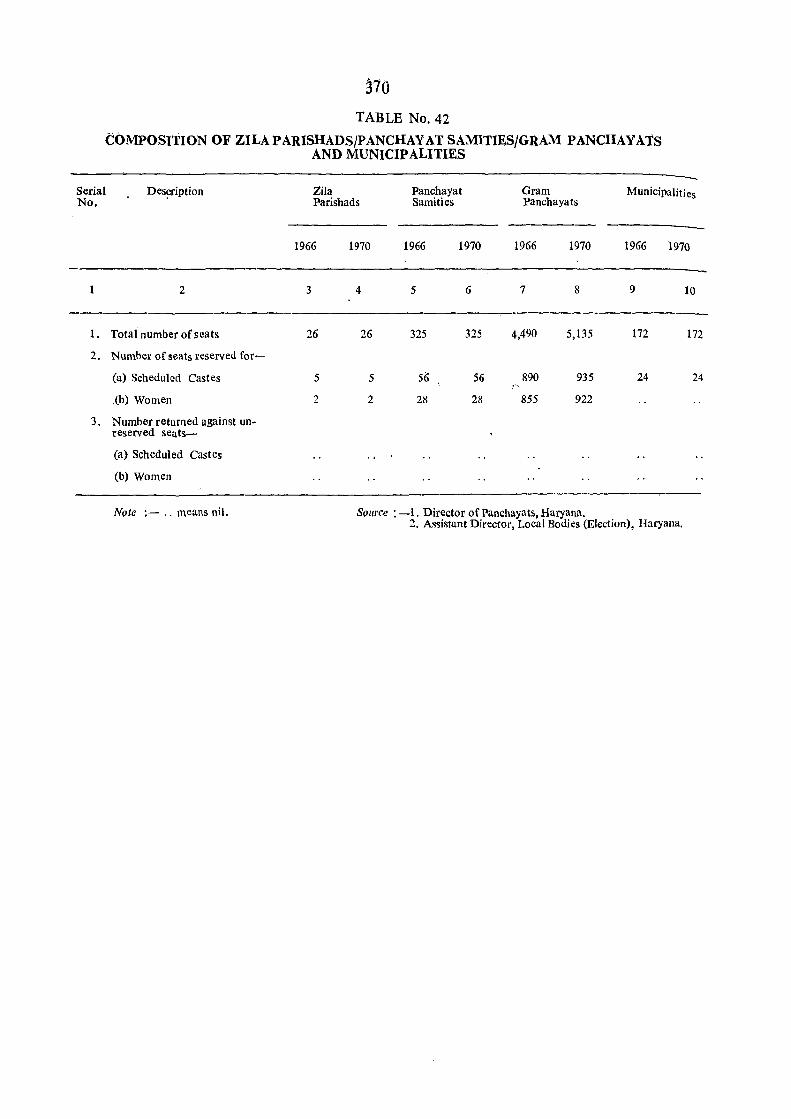
370 TABLE No. 42
COMPOSITION OF ZILAPARISHADSjPANCHAYAT SAMITIESjGRAM PANCHAYATS AND MUNICIPALITIES
Serial No.
Desp-iption
2
1. Total number of seats
2. Number of seats reserved for-
(a) Scheduled Castes
.(b) Women
3. Number returned against unreserved seats-
(a) Scheduled Castes
(b) Women
Note ;- .. means nil.
Zila Parishads
1966
3
26
5
2
1970
4
26
5
2
Panchayat Samities
1966 1970
5
325
56
28
6
325
56
28
Gram Panchayats
1966
7
4,490
890
855
1970
8
5,135
935
922
Municipalities
1966 1970
9 10
172 172
24 24
Source : -1. Director of Panchayats, Haryana. 2. Assistant Director, Local Bodies (Election), Haryana.
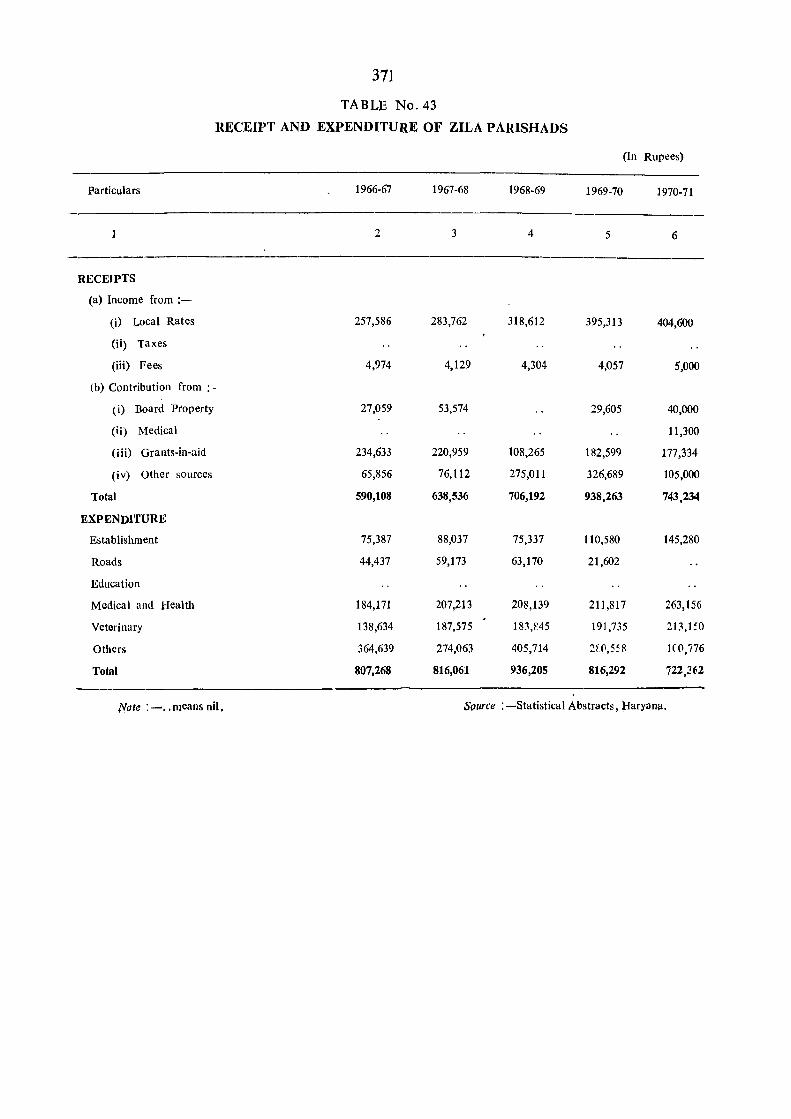
371
TABLE No. 43
RECEIPT AND EXPENDITURE OF ZILA PARISHADS
(In Rupees)
Particulars 1966-67 1967-68 1968-69 1969-70 1970-71
1 2 3 4 5 6
RECEIPTS
(a) Income from ;-
(i) Local Rates 257,586 283,762 318,612 395,313 404,600
(ii) Taxes
(iii) Fees 4,974 4,129 4,304 4,057 5,000
(b) Contribution from: -
(i) Board Property 27,059 53,574 29,605 40,000
(ii) Medical 11,300
(iii) Grants-in-aid 234,633 220,959 108,265 182,599 177,334
(iv) Other sources 65,856 76,112 275,011 326,689 105,000
Total 590,108 638,536 706,192 938,263 743,234
EXPENDITURE
Establishment 75,387 88,037 75,337 110,580 145,280
Roads 44,437 59,173 63,170 21,602
Education
Medical and Health 184,171 207,213 208,139 211,817 263,156
Veterinary 138,634 187,575 183,N5 191,735 213,1:0
Others 364,639 274,063 405,714 2[(1,558 1(0,776
Total 807,268 816,061 936,205 816,292 722,:?()2
Note: - .. means nil. Source : -Statistical Abstracts, Haryana.
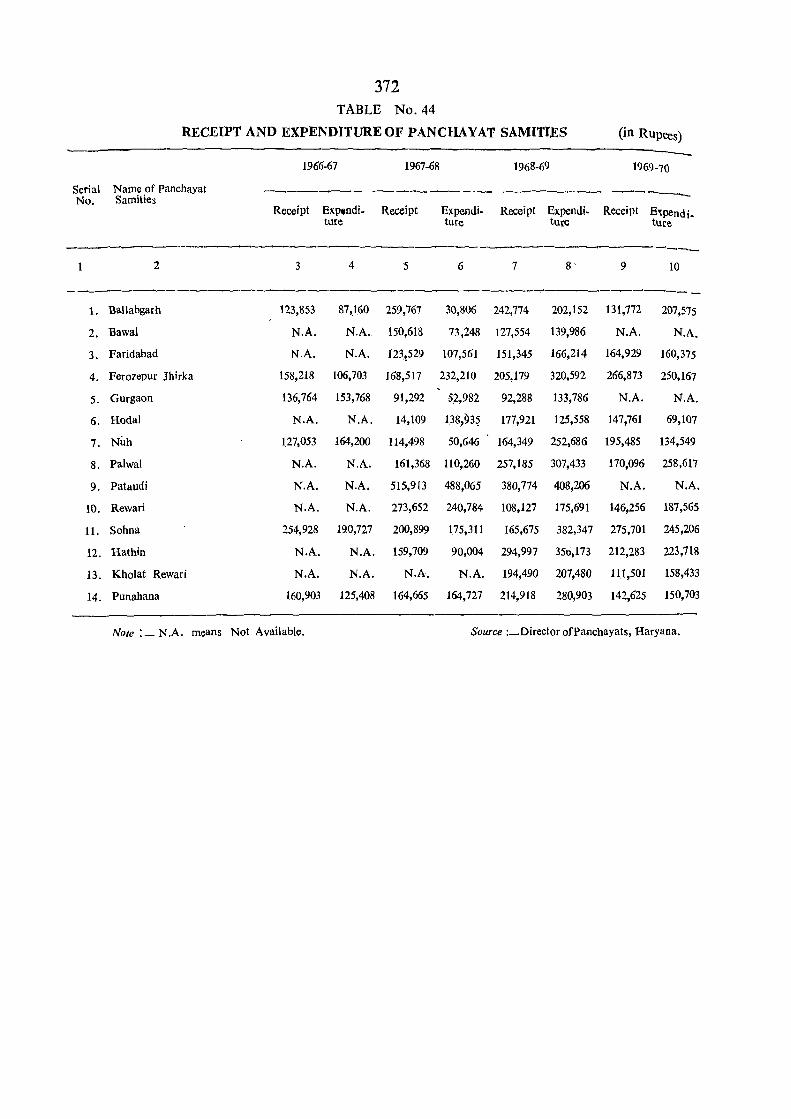
372 TABLE No. 44
RECEIPT AND EXPENDlTUREOF PANCHAYAT SAMITIES (in RUpees)
1966.67 1967·68 1968·69 1969-70
Serial Name of Panchayat ~~_-~- -----~- --------- ~-----No. Samities Receipt EXPlndi- Receipt Expendi. Receipt Expendi- Receipt E'tpendi_
ture ture ture ture
-- ----I 2 3 4 5 6 7 8' 9 10
--- ~-----
1. Ballabgarh 123,853 87,160 259,767 30,806 242,774 202,152 131,772 207,575
2. Bawal N.A. N.A. 150,618 73,248 127,554 139,986 N.A. N.A.
3. Faridabad N.A. N.A. r23~529 107,561 151,345 166,214 164,929 160,375
4. Ferozepur Jhirka 158,218 106,703 168,517 232,210 205,179 320,592 266,873 250,167
5. GUrgaon 136,764 153,768 91,292 ~2,982 92,288 133,786 N.A. N.A.
6. Hodal N.A. N.A. 14,109 138,i)3~ 177,921 125,558 147,761 69,107
7. Nub 127,053 164,200 114,498 50,646 164,349 252,686 195,485 134,549
8. Palwal N.A. N.A. 161,368 110,260 257,185 307,433 170,096 258,617
9. Pataudi N.A. N.A. 515,913 488,065 380,774 408,206 N.A. N.A.
10. Rewari N.A. N.A. 273,652 240,784 108,127 175,691 146,256 187,565
11. Sohna 254,928 190,727 200,899 175,311 165,675 382,347 275,701 245,206
12. Hathin N.A. N.A. 159,709 90,004 294,997 350,173 212,283 223,718
13. Kholat Rewari N.A. N.A. N.A. N.A. 194,490 207,480 111,501 158,433
14. Punahana 160,903 125,408 164,665 164,727 214,918 280,903 142,625 150,703
Note :_ N.A. means Not Available. Source :_Director ofPancbayats, Haryana.
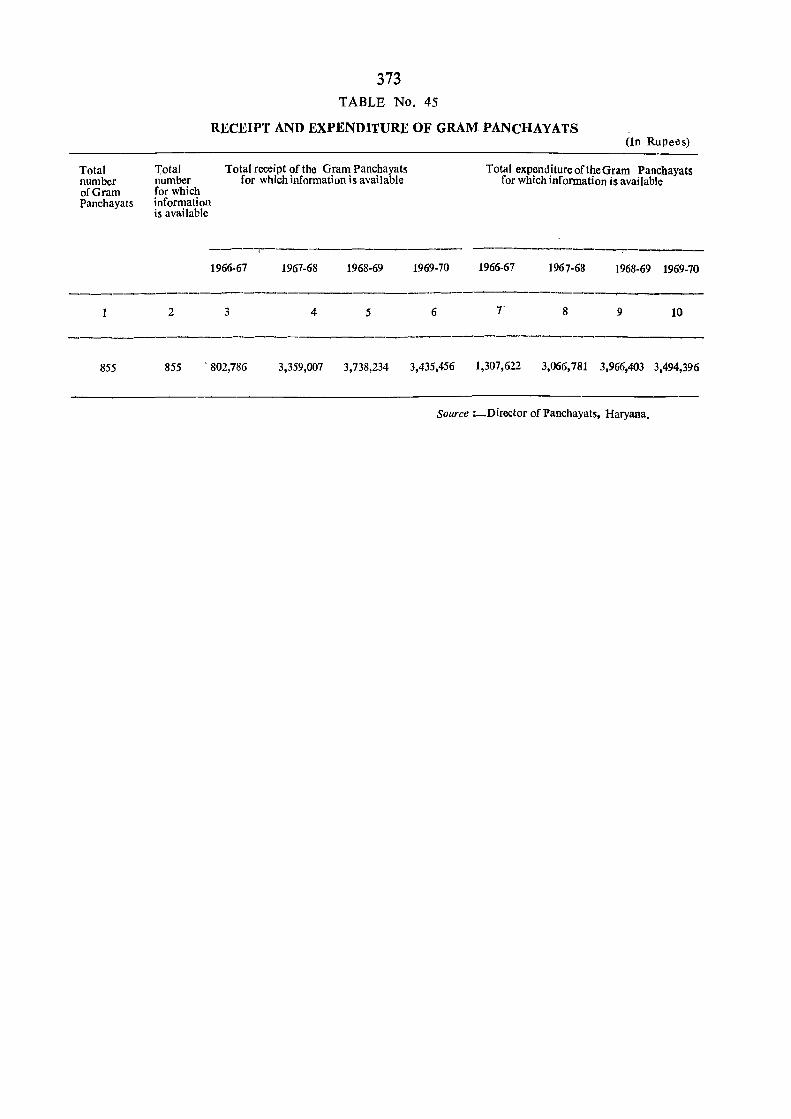
Total number of Gram Panchayats
855
373 TABLE No. 45
R,ECEIPT AND EXPENDITURE OF GRAM PANCHAYATS
Total Total receipt of the Gram Panchayats number for which information is available for which information is available
(In Rupees)
Total expenditure of the Gram Panchayats for which information is available
-----, --~------~---- ------1966·67 1967.68 1968-69 1969·70 1966·67 1967·68 1968·69 1969·70
2 3 4 5 6 8 9 10
855 . 802,786 3,359,007 3,738,234 3,435,456 1,307,622 3,066,781 3,966,403 3,494,396
Source :_Director of Panchayats, Haryana.
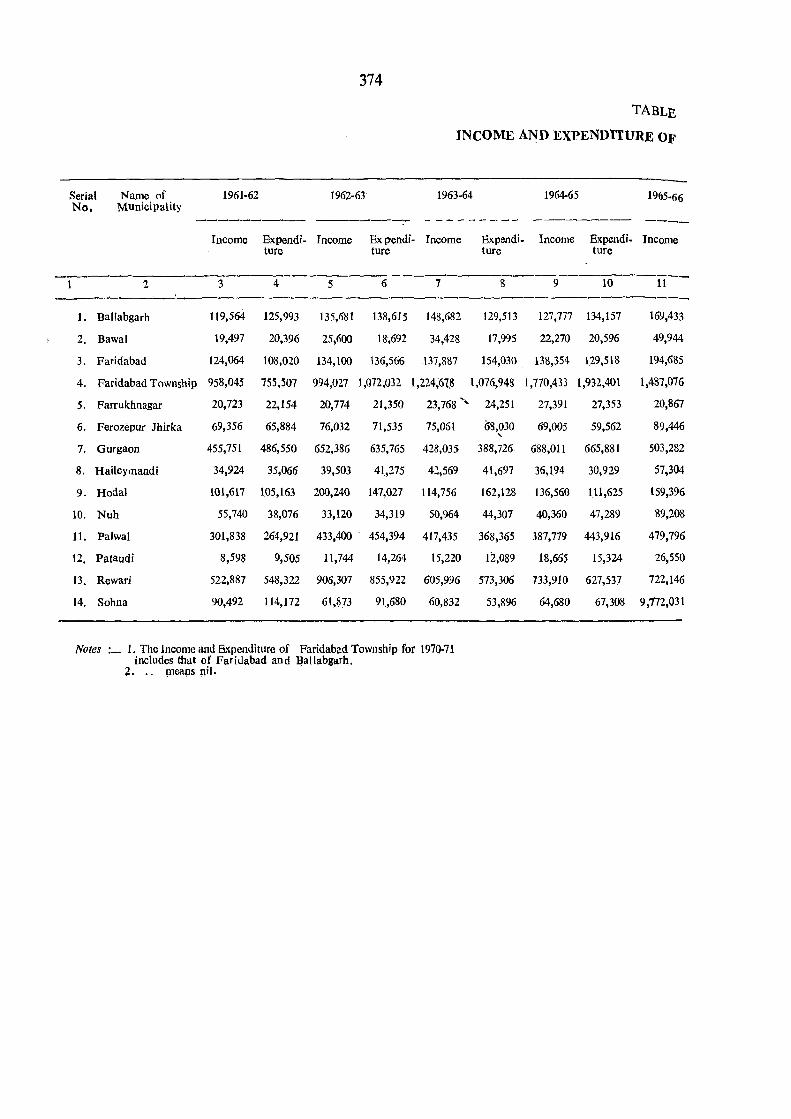
374
TABLE.
INCOME AND EXPENDITURE OF
Serial Name of 1961-62 1962-63 1963-64 1964·65 1965-66 No, Municipality
------..,- --------- ---Income Expendi- Income Expendi- Income Expendi- Income Expendi. Income
ture ture ture ture
1 2 3 4 5 6 7 8 9 10 11
1. Ballabgarh 119,564 125,993 135,681 138,615 148,682 129,513 127,777 134,157 169,433
2. Bawal 19,497 20,396 25,600 18·,692 34,428 17,995 22,270 20,596 49,944
3. Faridabad 124,064 108,020 134,100 136,566 137,887 154,030 138,354 129,518 194,685
4. Faridabad Township 958,045 755,507 994,027 J,072,032 1,224;6"Z~ 1,076,948 1,770,433 1,932,401 1,487,076
5. Farrukhnagar 20,723 22,154 20,774 21,350 23,768 ' .... 24,251 27,391 27,353 20,867
6. Ferozepur Jhirka 69,356 65,884 76,032 71,535 75,051 68,030 69,005 59,562 89,446 "-
7. Gurgaon 455,751 486,550 652,386 635,765 428,035 388,726 688,011 665,881 503,282
8. Haileymandi 34,924 35,066 39,503 41,275 42,569 41,697 36,194 30,929 57,304
9. Hodal 101,617 105,163 200,240 147,027 114,756 162,128 136,560 111,625 159,396
10. Nuh 55,740 38,076 33,120 34,319 50,964 44,307 40,360 47,289 89,208
11. Palwal 301,838 264,921 433,400 . 454,394 417,435 368,365 387,779 443,916 479,796
12. Pataudi 8,598 9,505 11,744 14,264 15,220 12,089 18,665 15,324 26,550
13. Rewari 522,887 548,322 906,307 855,922 605,996 573,306 733,910 627,537 722,146
14. Sohna 90,492 114,172 61,873 91,680 60,832 53,896 64,680 67,308 9,772,031
Notes :_ L The Jncome and Expenditure of Faridabad Township for 1970·7J includes that of Faridabad and Uallabgarh.
2. .. !Ueaps nil·
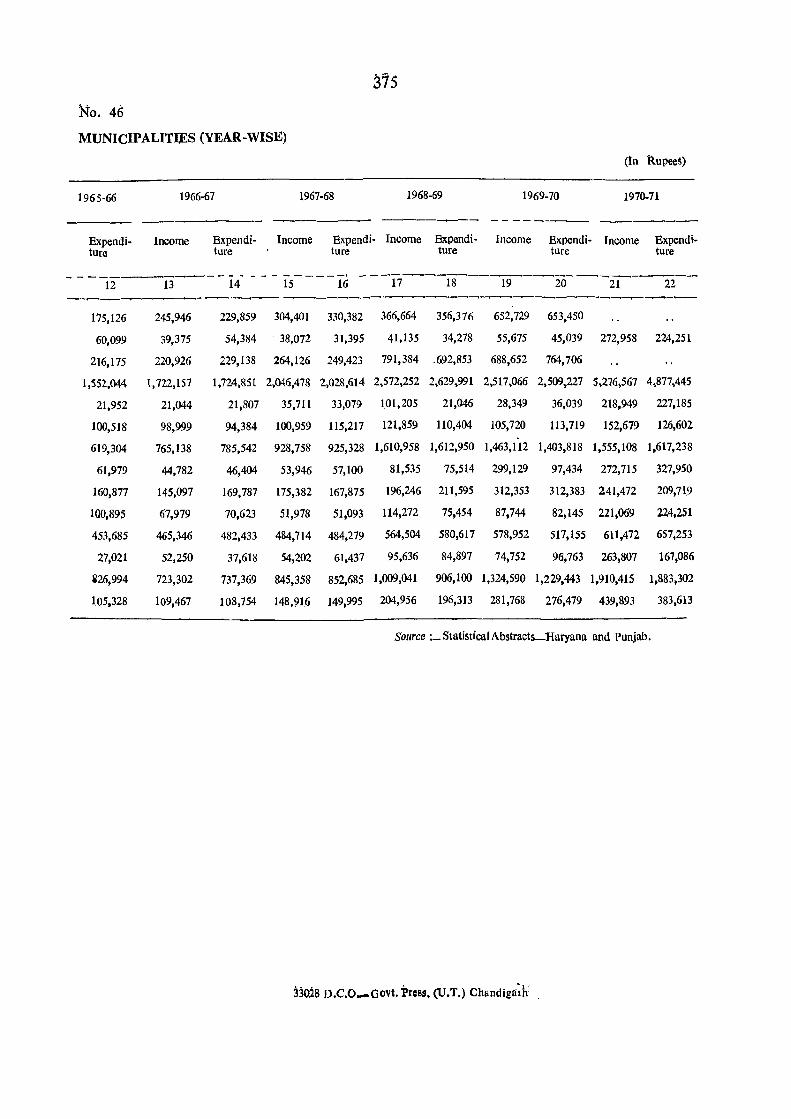
375
'No. 46
MUNICIPALITIES (YEAR-WISE)
(1n Rupees)
1965·66 1966·67 1967·68 1968·69 1969·70 1970..71
Expendi. Income tUre
175,126
60,099
216,175
245,946
39,375
220,926
----~-- --------Expendi· Income Expendi· Income Expendi· Income Expendi· Income Expendi. ture ture ture ture ture
229,859 304,401 330,382 366,664 356,376 652,729 653,450
54,384 . 38,072 31,395 41,135 34,278 55,675 45,039 272,958 224,251
229,138 264,126 249,423 791,384 .692,853 688,652 764,706
1,552,044 1,722,157 1,724,85t 2,046,478 2,028,614 2,572,252 2,629,991 2,517,066 2,509,227 5,276,567 4,877,445
21,952
100,518
619,304
61,979
160,877
100,895
453,685
27,021
i26,994
105,328
21,044
98,999
765,138
44,782
145,097
67,979
465,346
52,250
723,302
109,467
21,807 35,711 33,079 101,205 21,046 28,349 36,039 218,949 227,185
94,384 100,959 115,217 121,859 110,404 105,720 113,719 152,679 126,602
785,542 928,758 925,328 1,610,958 1,612,950 1,463,112 1,403,818 1,555,108 1,617,238
46,404 53,946 57,100 81,535 75,514 299,129 97,434 272,715 327,950
169,787 175,382 167,875 196,246 211,595 312,353 312,383 241,472 209,719
70,623 51,978 51,093 114,272 75,454 87,744 82,145 221,069 224,251
482,433 484,714 484,279 564,504 580,617 578,952 517,155 611,472 657,253
37,618 54,202 61,437 95,636 84,897 74,752 96,763 263,807 167,086
737,369 845,358 852,685 1,009,041 906,100 1,324,590 1,229,443 1,910,415 1,883,302
108,754 148,916 149,995 204,956 196,313 281,768 276,479 439,893 383,613
SOllrce :_ Statistical Abstracts-Haryana and Punjab.
33028 D.C.O_Govt. Press, (U.T.) Chandiga:~h
Related Documents


