CENSUS OF INDIA 1961 RAJASTHAN DISTRICT CENSUS HANDBOOK BIKANER DISTRICT C. S. GUPTA OF THE INDlAN ADMINlS'l'RATlVE: SERVICE Superintendent of Census Operations, Rajasthan

Welcome message from author
This document is posted to help you gain knowledge. Please leave a comment to let me know what you think about it! Share it to your friends and learn new things together.
Transcript
CENSUS OF INDIA 1961
RAJASTHAN
DISTRICT CENSUS HANDBOOK
BIKANER DISTRICT
C. S. GUPTA OF THE INDlAN ADMINlS'l'RATlVE: SERVICE
Superintendent of Census Operations, Rajasthan

Printed by Mafatlal Z. Gandhi. at Nayan Printing Preis. Ahmedabad-I.
FOREWORD
The Census data has always been considered as indispensable for day to day administration. ] t is increasingly being considered now as the foundation stone or' all regional planning. The publication of this series of District Census Handbooks wherein census statistics is made available for smaller territorial units is. therefore~ a significant occasion for it fills many existing gaps in statistics at the lower levels. Many interesting details have been revealed by the Census 1961 and I hope persons engaged in the administration of the State and public in general will appreciate the value and the effort that has gone into the production of such a standard book of reference.
1 congratulate the Superintendent of Census Operations, Rajasthan, Shri C. S. Gupta I. A. S. and his colleagues who have done a good job with skill and perseverence.
JAIPUR,
1st March, 1966.
iii
B. MEHTA Chief Secretary
to the Government of Rajasthan.

PREFACE
The District Census Handbooks, to which series the present volume belongs. are the gifts of the Census of India and were first introduced in 1951. The 1961 series of District Census Handbooks are more elaborate than their counter-part in 1951 and present all important cen,slls data alon~with such other basic information as is very relevant for an understanding of the district. A wide variety of information which the Census 1961 collected: has already been released in several parts as mentioned elsewhere in this book. The information contained in the present volume wi1l be found useful by the Government, the district administration, persons engaged in regional planning, social workers and scholars in the field of humanities. Unfortunately tbese Handbooks became available to the users rather late in the decade. This was due to difficulties in printing. The Government Press Jodhpur. to whom this work was assigned by the State (}overnment, had a beavy backlog of printing and found it impossible to print all the books in the series itself. Arrangements had therefore to be made to get these printed through a private press. I trust a more expeditious method for printing of such valuable matter in time will be devised in future.
T am grateful to Shri Asok Mitra, Registrar General, India for his guidance in this work from time to time. I am greatly beholden to the State Government for their lGindly agreeing, as they also did in 1951, to get this series pu bIis hed at their cost.
Dr. U. B. Mathur .. Dy. Superintendent Census Operations, Rajasthan assisted me hi editing this series. Tabulation Officer Shri S. R. Luhadia assiduously worked for compilation of the information presented in the book and has seen it th rough the press. Many of the facts and figures incorporated in the book were built up after scrutiny of a lot of raw material and by personal contacts. This task was admirably done by Shri Ram Autar Gupta, Statistical Assistant. Without their sincere cooperation and the assistance rendered by various members of the staff, mentioned overleaf, who were associated with this work, it would have been hardly possible to present the information which is the subject matter of this book. I thank them all.
JAIPUR.
l~th Auxwt. 1966.
v
C. S. GUPTA Superintendent,
Census Operations, Rajasthan.
OTHER MEMBERS OF THE STAFF ASSOCIATED WITH THIS WORK
Shri WaH Haider ... ... Computor
Shri R. N. Verma Computor
Sbri T. C. Patni Compiler
Sbri B. B. Dave Compiler
Shri D. L. Badiwal Compiler
Shri M. L. Kumawat Draftsman
Shri D. L. Verma .. , Asstt. Draftsman
Shri M. M. Goyal Proof Reader
Shri O. P. Avasthy Proof Reader
vi
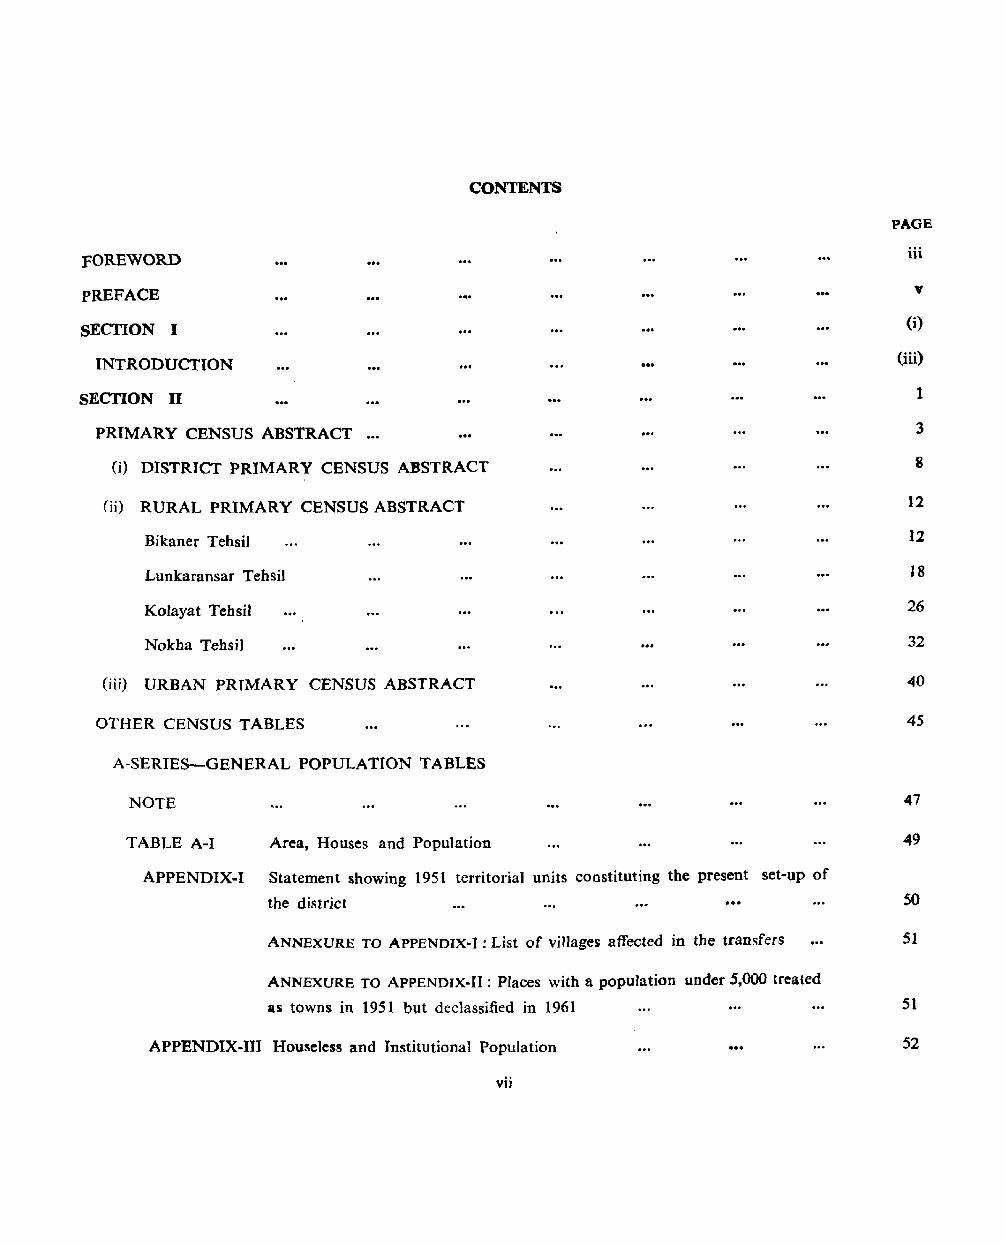
FOREWORD
PREFACE
SECTION I
INTRODUCTION
SECTION n
PRIMARY CENSUS ABSTRACT
CONTENTS
... ....
... (i) DISTRICf PRIMARY CENSUS ABSTRACT
(ii) RURAL PRIMARY CENSUS ABSTRACT
Bikaner TehsiJ
Lunkaransar Tehsil
Kolayat Tehsil
Nokha Tehsil
(iii) URBAN PRIMARY CENSUS ABSTRACT
OTHER CENSUS TABLES
A-SERIES-GENERAL POPULATION TABLES
NOTE
PAGE
iii
... v
(i)
... (iii)
... 1
3
8
12
12
18
26
32
40
45
47
T ABLE A-I Area, Houses and Population 49
APPENDIX-I Statement showing 1951 territorial units constituting the present set-up of
tbe district 50
ANNEXURE TO APPENDIX-I: List of viIJages affected in the transfers
ANNEXURE TO ApPENDIX-II: Places with a population under 5,000 treated
as towns in 1951 but declassified in 1961
APPENDIX·I11 Houseless and Institutional Population ... vii
51
51
52
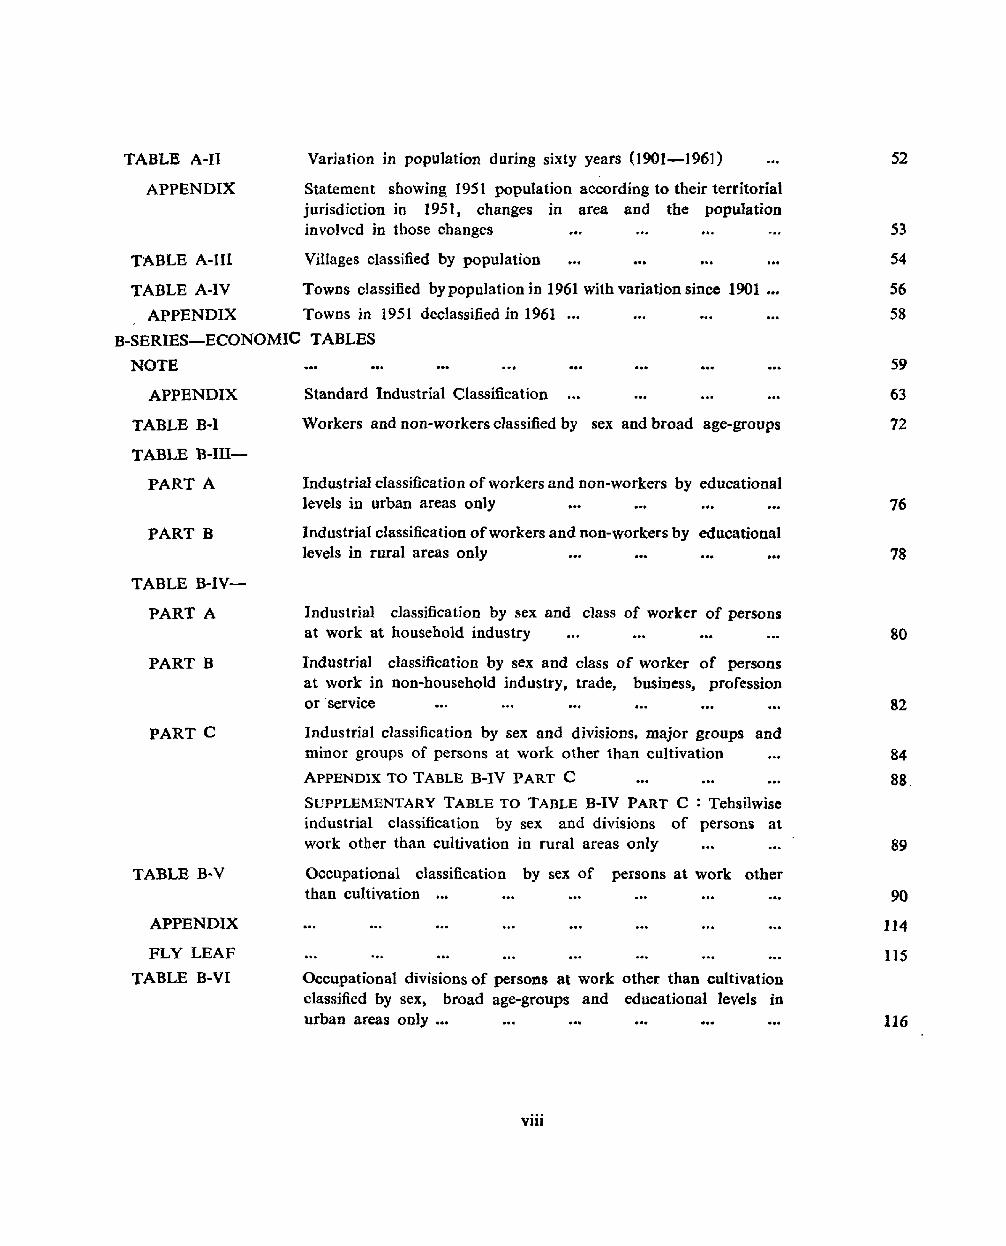
TABLE A-II
APPENDIX
TA.BLE A-III
Variation in population during sixty years (1901-1961)
Statement showing, 1951 population according to their territorial jurisdiction in 1951, changes in area and the population invo)ved in those changes
Villages classified by population
TABLE A-IV Towns classified by population in 1961 with variation since 1901 '"
APPENDIX Towns in 1951 declassified in 1961 ... '"
B-SERIES-ECONOMIC TABLES
NOTE ••• • •. . ., APPENDIX
TABLE B-1
TABLE B-III
PART A
PART B
TABLE B-IV
PART A
PART B
PART C
TABLE B-V
APPENDIX
FLY LEAF
TABLE B-VI
Standard Industrial Classification
Workers and non-workers classified by sex and broad age-groups
Industrial classification of workers and non-workers by educational levels in urban areas only •••
Industrial classification of workers and non-workers by educational levels in rural areas only .••
Industrial c1assification by sex and class of worker of persons at work at household industry
Industrial classification by sex and class of worker of persons at work in non-household industry, trade, business, profession or 'service
Industrial classification by sex and divisions, major groups and minor groups of persons at work other than cultivation
ApPENDIX TO TABLE B-IV PART C
SUPPLEMENTARY TABLE TO TABLE B-IV PART C : Tehsilwise industrial classification by sex and divisions of persons; at work other than cultivation in rural areas only
Occupational classification by sex of persons at work other than cultivation
Occupational divisions of persons at work other than cultivation classified by sex, broad age-groups and educational levels in urban areas only ...
viii
52
53
S4
56
58
59
63
72
76
78
80
82
84
88.
89
90
114
lIS
116
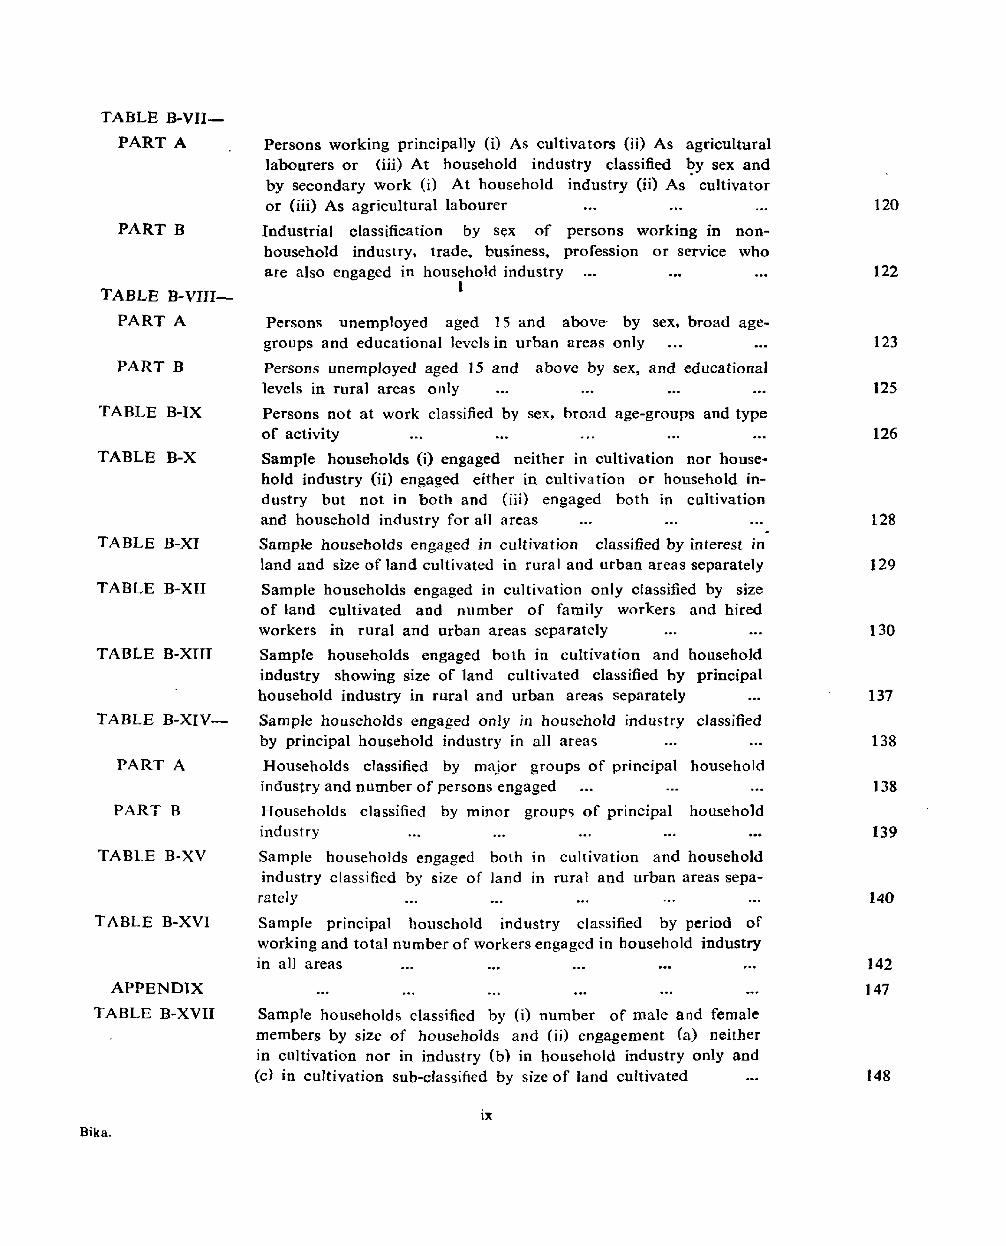
TABLE B-VII
PART A
PART B
TABLE B-VIII
PART A
PART B
TABLE B-IX
TABLE B-X
TABLE B-XI
TABLE B-XII
TABLE B-XIII
TABLE B-XIV-
PART A
PART B
TABLE B-XV
TABLE B-XVI
APPENDIX
TABLE B-XVII
Bika.
Persons working principally 0) As cultivators (ij) As agricultural labourers or (iii) At household industry classified ~y sex and by secondary work (i) At household industry (ij) As cultivator or (iii) As agricultural labourer
Industrial classification by sex of persons working in nonhousehold industry, trade. business, profession or service who are also engaged in household industry
1
Persons unemployed aged 15 and above- by sex, broad agegroups and educational levels in urban areas only
Persons unemp10yed aged 15 and above by sex, and educational levels in rural areas only
Persons not at work classified by sex, broad age-groups and type of activity
Sample households (i) engaged neither in cultivation nor house· hold industry (ii) engaged either in cultivation or household industry but not in both and (iii) engaged both in cultivation and household industry for all areas
Sample households engaged in cultivation classified by interest in land and size of land cultivated in rural and urban areas separately
Sample households engaged in cultivation only classified by size of land cultivated and number of family workers and hired, workers in rural and urban areas separately
Sample households engaged both in cultivation and industry showing size of land cultivated classified by household industry in rural and urban areas separately
Sample households engaged only in household industry by principal household industry in all areas
Households classified by major groups of principal industry and number of persons engaged
Households classified by minor groups of principal industry
Sample households engaged both 10 culrivation and
household principal
classified
household
household
household industry classified by size of land In rural and urban areas separately
Sample principal household industry classified by period of working and total number of workers engaged in household industry in all areas
Sample households classified by (1) number of male and female members by size of households and (ii) engagement (a) neither in cultivation nor in industry (b) in household industry only and (c) in cultivation sub-classified by size of Jand cultivated
ix
120
122
123
125
126
128
129
130
137
138
]38
139
140
142
147
148
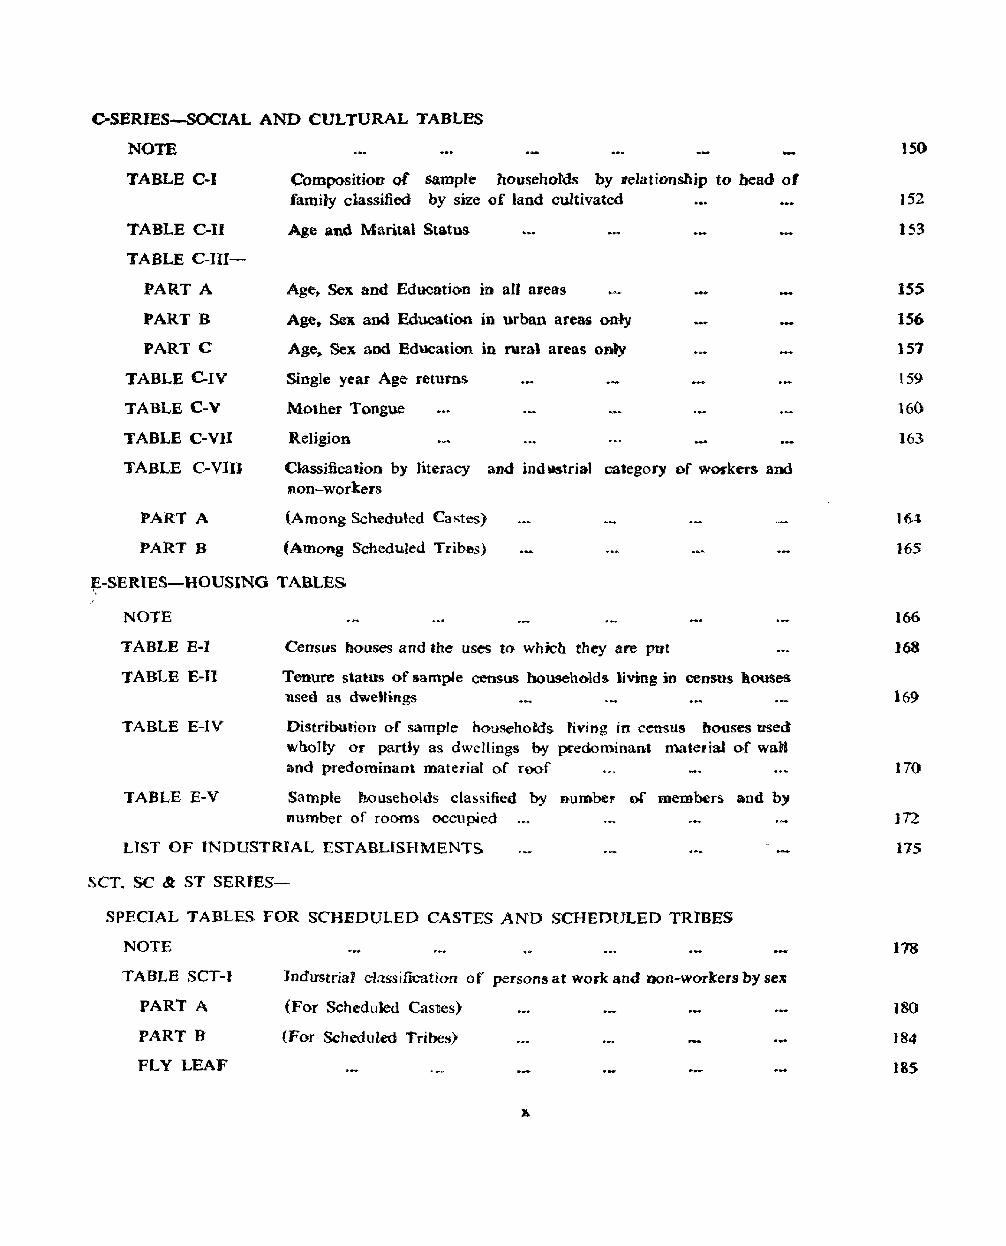
C-SERIES-SOCIAL AND CULTURAL TABLES
NOTE
TABLE C-I
TABLE C-I1
TABLE C-III
PART A
PART B
PART C
TABLE elV
TABLE c-v TABLE C-VII
TABLE C-VIlJ
PART A
PART B
Composition of sam-pte households by reJationsllip to bead of family classified by size of land cultivated
Age and Marital Status
Age,. Sex and Education in all areas
Age. Sex and Education in urban areas only
Age,. Sex and Education in rural areas only
Single year Age returns
Mother Tongue
Religion
Classification by literacy and ind ystrial calegory of wOI'kers and Bon-workers
(Among Scheduled Castes)
(Among Scheduled Tribes)
~-SERIES-"OUSING TABLES
NOTE
TABLE E-J
TABLE E-U
TABLE E-IV
TABLE E-V
Census houses and the uses to which they are put
Tenure status of sample census households. living in census houses. nsed as dwetHflg8
Distribution of sample househotd's fiving in census houses used wholly or partly as dwellings by predominant material of wall and predominant mate,.ial of roof
Sample households classified boy Dumbef' of members and by f1umber of rooms occupied
LIST OF INDUSTRIAL ESTABLISHMENTS
SeT. SC &: ST SERJES-
SPECIAL TABLES FOR SCHEDULED CASTES AND SCHEDULED TRmES
NOTE
TABLE SCT-I
PART A
PART B
FLY LEAF
Industrial classification of persons at work and DOn-workers by sex
(For Scheduled Castles)
(For Scheduled Tribes)' ..... .-
150
152
153
155
156
151
159
16()
163
161
165
166
168
169
110
112
175
118
]80
184
185
TABLE SCT-JI
PART A
PART B
TABLE SCT-III
PART A (j)
PART A (ii)
PART B (i)
PART B (ii)
TABLE SCT-IV
PART A
PART B
TABLE SCT-V
PART A
PART B
TABLE SC-I
TABLE ST-I
TABLE ST-U
SECTION III
Age and Marital Starus
(For Scheduled Castes)
(For Scheduled Tribes)
Education
(For Scheduled Castes in urban areas only)
(For Scheduled Tribes in urban areas only)
(For Scheduled Castes in rural areas only) I
(For Scheduled Tribes in rural areas only)
Religion
(For Scheduled Castes)
(For Scheduled Tribes)
Sample households engaged in cultivation classified by interest in Jand and _size of land cultivated in rural areas only
(For Scheduled Castes)
(For Scheduled Tribes)
Persons not at work classified by sex, type of activity and educational levels for Scheduled Castes
Mother Tongue and Bi-lingualism for Scheduled Tribes
Persons Dot at work classified by sex and type of activity for Scheduled Tribes
VILLAGE DIRECTORY
SOME OFFICIAL STATISTICS
SECTION IV
DISTRICT & TEHSIL MAPS ...
xi
186
190
192
192
193
193
194
195
196
196
197
199
200
201
203
221
235
237
SECI10N I
INTRODUCTION

INTRODUCTION
The territory, now known as district Bikaner, used to be a part of the Princely State of Bikaner which merged into the United States of Greater Rajasthan in the year 1949. After the merger the district was formed wbich continues up-to-date.
Location and Formation
2. District Bikaner is situated in the north-west of Rajasthan and lies between 27° 15' and 29°5' north latitudes and 71°53' and 74°20' east longitudes. It is bounded on the north by Ganganagar district, on the west by Pakistan and Iaisalmer district, on the east by Churu district and on the south-east and south by Nagaur and Jodhpur dIstricts respectively.
3. The area of the district as reported by the Surveyor General of India is 10,561 Sq. miles and according to village papers it is 10,554.5 Sq. miles or 27,336.2 Sq. Kms. The district covers 8.0,~ of the total area of Rajasthan and &tands 3rd in rank in area amongst the other districts of thl! State.
4. The district is composed of four tehsils viz. Bikaner, Lunkaransar, Kolayat and Nokha which continue their name and form ever since the formation of the district. There has, however, been an inter-district transfer of areas as a result of which 43 villages and 3 hamlets of former Bap tehsil of laisalmer district were transferred to Kolayat tehsil of this district during the inter- censal period 1951-61. During the same period an inter-tehsil transfer of Mudsar village was also affected from Nokha to Bikaner tehsil.
Topography
5. In the greater part of the territory, the plain is undulating or interspersed with shifting sand hills the slopes of which are lightly furrowed from the action of the wind. Some of these sand dunes are moving while some have by now got fairly stabilised wJth trees and sbrubs growing on them. The height of these sand dunes vary from 5 ft. to 100 ft. In the south of Bikaner City a considerable tract is covered with brushwood 10caJIy called cIorbir' which develops fully during
th~ rainy season and gives an impression of a dense forest. After the rains the whole tract of tbe district grows into a beautiful greeny area covered with grass. The general elevation of the district varies from 400 ft. to 1,200 ft. above the sea level. Bikaner City is situated at a height of 736 ft. above sea level.
6. There are a few local 'naUahs' in the district. These have been impounded in tanks in Kolayat tehsil while others get lost in the sand. The Gajner lake which lies on the Bikaner-Iaisalmer route is situated at about 20 miles from Bikaner and is a very pretty spot in the district. The water of this lake is mostly utilised for drinking and bathing purposes but in the years of good rainfall wheat and mustard are also grown in its neighbouring areas. Another small lake is at Kolayat which is at a distance of about 19 Kms: from Gajner. About 80 Kms north-east of Bikaner City there is a salt lake at Lunkaransar. There are various other tanks in the district notably at Gangsarowar, Mandai, Madh, Dadar, Kiniya, Bbatia and Khudi.
7. Water is found, in the district at varying depths. There are wells 'which are more than 300 ft. deep but sometimes water is available only within 20 ft. of the surface. Generally desert soil (grey and brown) is found in the district.
Climate
8. The cHmate of the district is dry but bealthy and is characterised by extremes of temperature. DUring summer, hot winds blow with great force. Sand storms are frequent during whicb sometimes a deep layer of sand is deposited on railway lines resulting in break down of the service for several hours. The district lies in the belt having an average minimum temperature ranging from 12°.5C to I5°.OC and an average maximum, temperature of 32°.5C. The normal annual rainfall of the district is 29.13 Cms. and occurs from July to September. Tbe normal rainy days in the district are about 17 a year.
Geology and Minerals
9. The district is composed of tbe dreary and desolate arid region and forms a part of the Great
(iv)
Indian Desert of 'Thar·. In the south-western area of the district, which forms a part of Ko]ayat tebsil, rocks are found. The geological formation of Eocene age are well represented in the neighbourhood of Bikaner City. The strata consists of thick white and bulf limestones and shales. Lignite (Palana) and beds of fuller"s earth occur in these formations.
10. Gypsum occurs at surface in large quantities at village Jamsar and also in Dheereran, Dholera, Bhair~o, Kaoni and Jaimalsar villages of Bikaner tehs]l, Madh of Kolayat tehsil and at Lunkaransar. The g:yp:sum found at Jamsar is of fine quality. There are deposito; of fuller's earth or 'Multani Mitti' at villages Palana (Bikaner tehsil) and Madh (Kolayat tehsil). Clay is found near Bi~aner City and at some places ~n Kolayat tehslL Red sand stone quarries are located n~ar Khf:lri and Dulmera villages (Lunkaransar teh!)il) in north-east of the City. This stone is of excellent quality and ~he excavations are deep and extensive. Impure lime stone is excavated practically every where in tbe district a~ 'Kankar'. Glass sand is found near village Madh. Lignite is available at various places in Kolayat tehsi1 and at village Palana.
Forest, Flora and Fauna
11. During 1960-61 only about 0.3% of the total area of the district was under forests according to vilJage papers. The vegetation which is commonly found in the desert plains. occur in this district. The trees and bushes which grow are insufficient even to fulfil the local requirements for construction of houses, for making agricultural implements and for fuel purposes. The ~ost common tree found in the district is Khejri (Prosopis spicisera) the fruit of which is a long pod caned 'Sangri'. This plant is very valuable for its, pods, leaves and even the bark are eaten by the catt)~. Sangri is also used as a vegetable. Other trees found in the district, are Rohera (Tecomella undulata), Ber t Zizyphus juj uba ), lal or Pilu (Salvadora oleoides ). Some other trees found on embarkments in the vicinity of tanks or in the gardens are Shisham (Dalbergia sissoo), 'Bar (Ficus bengalensis), Pipat (Ficus religiosa), Siris (Albizzia lebbek) etc. Among the shrubs found in the region mention may be made of Ak (Calotropis procera), Phog (Calligonum' POlygonoides t Bui ( Aerna .
tomentosa), Pala (Zizyphus rotundifolia), Karel (Capparis aphylla ), Thor (Euphorbia nivulia and Euphorbia royleana). Bhurat (Cenchrus barbatus), Sewan (Elion· urus hirsutus), Munj (Saccharum griffithii), grasses also grow. A large number of snakes are found in the district having their different names and sizes 'Viz. Bandi. Painda, Sankh Chur, Tolia, Padam, Khurava, Chi tal and Sarprotia etc. At Gajner are found the Imperial sand Grouse ( Petroc]es orienta1is). Another interesting bird is the Rosy Poster (Pastor reseus) which visits in the winter season and helps in destroying the loc~sts. Sacred bird 'Neel-Kanth' (Cor~cias bengalensis) of local variety has a speciality of having a brown throat instead of the usual blue. Otber important wild animals found in tht: qistrict ar~ wild pig, deer etc. There is a Forest Ranger in the district at Bikaner who looks after the
" , ,
~~liviti~s of the depar.tI!lent and works under the super-vision of the Divisional Forest Officer, post~d at Jodhpur.
~eneral Administration . .
12. For the purposes of administration the district is divided ioto two sub--divisions and four tehsils as mentioned below :-
Name of Sub-division Name of Tehsil
1 Bikaner-North 1 Bikaner 2 Lunkaransar
2 Bikaner-South 1 Kolayat 2 Nokha
13. The Collector is the administrative Chief of the district who is also the District Magistrate. Each Sub-division is under the charge of a Sub-divisional Magistrate who IS vested with 1st class magisterial powers while each tehsil is under the charge and supervision, of a TehsiIdar who is vested with 2nd or 3rd class magisteri"!' powers as the case may be. Besides Collector, Sub-divisional Officers and Tehsildars who exercise criminal powers, there are courts of District and Sessions J!Jdge, Civil Judge and Munsif at Bikaner.
14. With the advent of democratic decentralisation., 4 Panchayat Samities have been formed out of which 3 are Community Development Blocks. The Panchayat Sa~ities are guided by the Zila Parishad under the
cbairmansh ip of the Pramukh and supervised by the Collector of the district who is also tbe District Development Officer. The Rajasthan Panchayat Samities and Zita Parishads Act, 1959 devolves on these Panch· ayat Samities the complete charge of the administration of the Block including the implementation of the Community Development Programmes. For imparting tbe technical guidance to the villagers the Government has deputed its representatives from various departments to the Blocks, so that an all round progress may be achieved. The ultimate aim of the Government is to make these Panchayat Saniities the sole agency of all developmental activities at ~he Block level.
15. There is a jail and a judicial lock-up at Bikaner City. The office of the Supenntendent of Police is located at Bikaner City. Besides, three separate Deputy Superintendents are posted at Bikaner City one each for the City, north and south areas. IS Police Stations and 19 Police out-posts functioned in the district during the year 1961.
Land Use
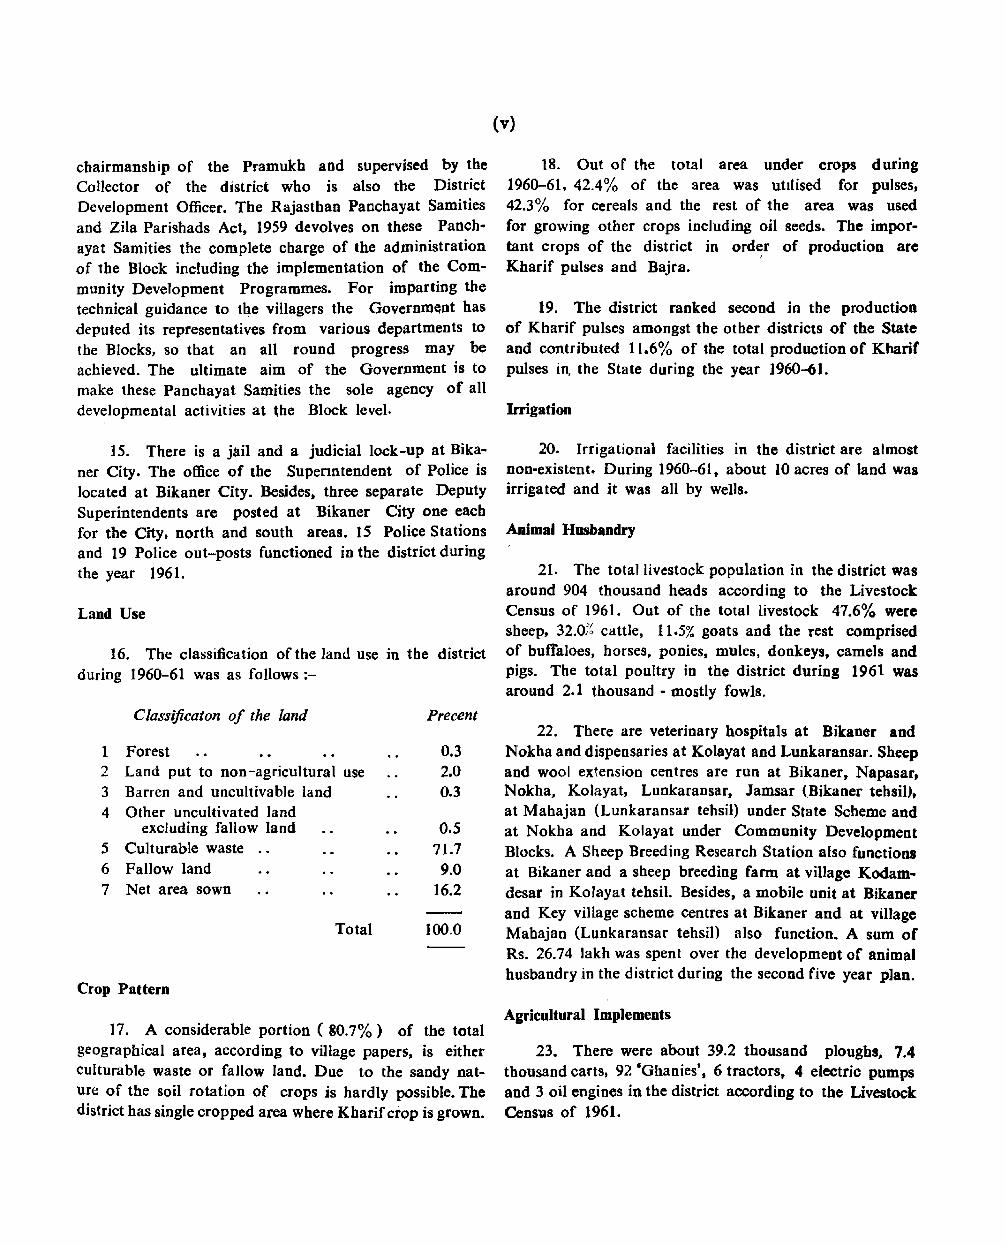
16. The classification of the land use in the district during 1960-61 was as follows :-
Classificaton of the land Precent
1 Forest 0.3 2 Land put to non-agricultural use 2.0 3 Barren and uncultivable land 0.3 4 Other uncultivated land
excluding fallow land 0.5 5 Culturable waste 71.7 6 Fallow land 9.0 7 Net area sown 16.2
Total 100.0
Crop Pattern
17. A considerable portion ( 80.7%) of the total geographical area, according to village papers, is either culturable waste or faHow land. Due to the sandy nature of the soil rotation of crops is hardly possible. The district has single cropped area where Kbarif crop is grown.
(v)
18. Out of the total area under crops during 1960-61, 42.4% of the area was utilised for pulses, 42.3 % for cereals and the rest of the area was used for growing other crops including oil seeds. The important crops of the district in order of production are Kharif pulses and Bajra.
19. The district ranked second in the production of Kharjf pulses amongst the other districts of the State and contributed 11.6% of the total production of Kharif pulses in, the State during the year 1960-61.
Irrigation
20. Irrigational facilities in the district are almost non-existent. During 1960-61, about 10 acres of land was irrigated and it was all by wells.
Animal Husbandry
21. The total livestock population in the district was around 904 thousand heads according to the Livestock Census of 1961. Out of the total livestock 47.6% were sheep, 32.0% cattle, 11.5% goats and the rest comprised of buffaloes, horses, ponies, mules, donkeys, camels and pigs. The total poultry in the district during 1961 was around 2.1 thousand - mostly fowls.
22. There are veterinary hospitals at Bikaner and Nokha and dispensaries at Kolayat and Lunkaransar. Sheep and wool extension centres are run at Bikaner, Napasart Nokha, Kolayat, Lunkaransar. Jamsar (Bikaner tehsilJ, at Mahajan (Lunkaransar tehsil) under State Scheme and at Nokha and Kolayat under Community Development Blocks. A Sheep Breeding Research Station also functions at Bikaner and a sheep breeding farm at viUage Kodam .. desar in Kolayat tehsil. Besides, a mobile unit at Bikaner and Key village scheme centres at Bikaner and at village Mahajan (Lunkaransar tehsil) also function. A sum of Rs. 26.74 lakh was spent over the development of animal husbandry in the district during the second five year plan.
Agricultural Implements
23. There were about 39.2 thousand ploughs, 7.4 thousand carts, 92 'Ghanies', 6 tractors, 4 electric pumps and 3 oil engines in the district according to the Livestock Census of 1961.
(vi)
Agricultural Improvements
24. During the second five year plan a sum of Rs. 8.47 lakh was spent in the district on agriculture sector. During thi~ period over 4 thousand Mds. of improved seeds. 47 thousand tons of manure and around 3 hundred improved agricultural implements were di~tributed to the farmers under various schemes of the Agriculture Department. Besides, over 3 thousand manure pits were dug and 2 hundred acres of land was brought under the plough.
Industries and Labour
25. During the year 1952·53 there were 3 registered factories in the district the number of which increased to 69 by the end of December 1961. Bikaner Loco Carriage & Wagon Workshop is the largest establishment of the district which provided employment to over 1.6 thousand persons during the year 1961. The district is famous for the manufacture of fine variety of woolen blanket. 'Shawls· and 'lois' giving employment to a number of persons. The sman scale and cottage industries of the district are flour mills, dal mills, oil mills, manufacturing of water 'Pakhals' and leather 'Kuppis'. The fine red clay found in the district has led to the establishment of a large number of potteries. A number of persons are also engaged in stone cutting and carving industries.
26. A branch office of the Industries Department is run in the district for reviving the old industries and to help in starting new industries. The department aids the small scale industries by advancing loans to the parties. A sum of Rs. 6.17 lakh was spent 'on industrial develop. ment if) the district during the second five year plan.
27. There are '8' Class Labour Welfare Centres at Bikaner and Jamsar (Bikaner tehsil). These Centres provide the facilities of recreation, child welfare, adult education. gymnasium, wrestling, in-door and out-door games, reading room, Ii brary etc. Besides, variety of entertainment such as free cinema shows, radio programmeS are also provided to workers and their families. An Industrial Training Centre also functions in the district.
28. The district has an employment exchange located at Bikaner City which registers people who are
seeking employment and helps in securing employment for tbem. During 1961, tbe total Dumber of registrations in the district was over 7.6 thousand.
Trade UaiODI
29. There were 14 registered trade unions in the djstrjct during 1960-61. The oldest trade union is Palana COlliery Mazdoor Union at Palana (Bikaner tehsil) which was registered in the. yeat 1951. Other trade unions are Bikaner Division P.W.D. Mazdoor Union, Garden Labour Union, Mundhra Metal Workers Union, Bikaner Municipal Karamchari Sangh, Bikaner Press Employees Union, Bijli Nal Karamc;hari Union, Bikaner Division Railway Porters Union, Vidyut Karyalaya Karamchari Sangh, Bikaner Division Vyapar Karamchari Union, Jamsar Gypsum Mazdoor Sangh, Gypsum Mine Workers Union, Sindri Fertilizers Jamsar Workers Union at Jamsar (Bikaner tehsil) and Palana Colliery Karamchari Union at Palana.
Power
30. Rajasthan State Electricity Board's Power House at Bikaner, one of the largest power houses in Rajasthan, provides electricity to the City and the adjoining places. It provided employment to about 3 hundred persons in the year 1961. Churn town, prior to the setting of a grid sub-station at Rajgarh, also used to receive electricity from this power house. A set of 224 KW and two sets each of 104 K W capacity were installed in 1958-59 and four sets each of 100 KW capacity were installed in 1959 under development of thermal power stations and connected works at this power house. By the end of March, 1961, all the towns and a few villages of the district were electflfied. During the second five year plan a sum of Rs. 154.11 lakh was spent on the development of power resources in tbis district.
Trade and Commerce
31. The articles that are exported out of this dIstrict consist ~f woolen carpets, 'Sajji', 'Ghee', Sugarcandy, cattle, bone, hides, mustard, taramira and blankets etc. while the import includes mainly steel, cloth. piece goods, rice, tobacco, metal goods. 'Kieana' ( Groceries), coal and jewellery.

(vii)
32. Bikaner, Nokha Mandi and Lunkaransar are the main trade centres in the district. Facilities of local markets also exist in certain villages which have been shown in the Primary Census Abstract elsewhere in this book.
33. The State Bank of Bikaner has got its branches at Bikaner, Nokha Mandi and Lunkaransar while the Punjab National Bank' Ltd., the United Commercial Bank Ltd; the Central Bank of India Ltd; and the Bank of Rajasthan Ltd. have their branches at Bikaner.
34. There were 11 shops dealing in country liquor, 7 in Indian made foreign liquor and 6 in hemp drugs at the various places in the district during 1960-61. There were two permanent cinema houses in the district during 1960.
Education
35. During 1956-57 there were 8 Colleges, 14 High/Higher Secondary Schools. 27 Middle Schools, 9 Junior Basic Schools, 163 Primary Schools, 1 Professional School and 13 Schools for Special Education in tbe district. The number increased to 9 Colleges, 17 High/ Higher Secondary Schools, 48 Middle Schools, 50 Junior Basic Schools, 290 Primary Schools, 3 Professional Schools and 79 Schools for Special Education in 1960-61. The total number of scholars in all types of institutions during 1960-61 was about 46.2 thousand. There iS'an office of the Director of Education of Schools at Bikaner. With the ushering in of the Panchayati Rajya, the control of the Primary Schools, except those in urban areas. was entrusted to the Panchayat Samities. A sum of Rso 71.49 lakh was spent on the development of educational facilities in the district during the second five year plan.
Medical and Public Health
36 During 1956-57 there were 16 allopathic hospitals and dispensaries with 641 beds. By the end of the year 1960 the number of such Government institutions increased to 18 with 716 beds. There are maternity and child welfare centres at Bikaner and Gangashahar. Maternity facilities have also teen provided by starting a special ward in P. B. M. Women's Hospital, Bikaner having 47 beds. Family Planning
Centres also function at dispensaries in Gangashahar and Bikancr and at maternity and child welfare centre in Bikaner City under Government control. Such centres al80 function at Bikaner and Nokha under tbe Paocbayat Sa~ities. There is a tuberculosis hospital at Bikaner with 101 beds. A tuberculosis, clinic also functions there.
37. There is a venereal diseases clinic, an eye ward, a paediatric ward and an anti-rabic centre in P.B.M. Men's Hospital at Bikaner. P.B.M. Women·s Hospital is also provided with, an eye ward. An antimalarial umt has also been functioning in the district with the headquarters at Bikaner City under the Nalional Malaria Eradication Programme. X-ray facilities are provided in the P.B.M. Men'S and Women's hospitals at Bikaner. Laboratory facilities are available in P.B.M. Men's Hospital, Bikaner and Government Dispensary, Deshnoke.
38. In March, 1961 there were 25 Government AYUfvedic and Unani hospitals and dispensaries in the district as compared to 13 during th.e year 1956-57.
39. The number of out-door and io-doo.r patients treated in the Government alJopathic medical institutions of the district in the year 1960 were around 385 thousand and 14 thousand respectively. A sum of Rs. 14.1 I lakh and 80 thousand was spent on Medi~a1 and Public Health and Ayurvedic facilities in the district during the second five year plan.
Drinking Water Facilities
40. During the second five year plan water supply schemes were started for Bikaner and Nokha Mandi town over which Rs. 29.47 lakhs and Rs. 10 thousand were spent. As the work could not be completed, it was carried over to the third five year plan. Besides, other rural water supply schemes were completed under the control and supervision of the Panchayat Samities.
Housing
41. Under the scheme of Low Income Group Housing, loan upto the tone of Rs. 6 lakhs was disbursed to the public during the year 1955·56 for the construction of residential quarters in the district .. During the second five year plan a sum of Rs. 12.90
(viii)
lakh was disbursed to the public under Low Income Group Housing Scheme and Rs. 2.83 lakh under Middle Income Group Housing Scheme as a result of which 405 houses were constructed under L.I.G.H. and 17 houses under M.I.O.H. Schemes. ]70 houses under L.I.G.H. and 2 under M.I.O.H. Schemes were under construction.
Transport and CommunicatioD
42. The district had only 114 miles of roads in 1950 -51 which increased to 568 miles by the end of March, 1961. 49.8% of the roads in the district were painted and metalled 29.6% fair weather and dressed up tracks and the rest consisted of gravelJed type during the year 1960-61. 2 road works were completed and a sum of Rs. 16.42 lakh was spent on road development works in the district during the second plan period.
43. There were 752 motor vehicles on road in 1954 which increased to 1,312 in 1961. The dIstrict is connected by the metre-guage line of the Northern Railway. TwO' main lines and two brancn lines of the railway pass through the district. A main line connects Bikaner City with Sadulpur (Churu district) while anotber line connects this City with Merta Road of Nagaur district. A branch line connects this City with Hanumangarh,(Ganganagar district) while the other connects with Kolayat of this district. The total length of tbe railway line in the district during 1961 was about 205 Kilometres. There is a landing ground about 9 miles from Bikaner City but there is no regular service. There is a State Circuit House and a Dak Bungalow at Bikaner and Rest Houses at Kotayat, Deh (Kolayat tehsil) and Lunkaransar. All the important places of the district are connected with bus routes There were 61 Post Offices, 13 Telegraph Offices, 3 Public Call Offices and ODe Telephone Exchange in the district during 1960-61.
Local Bodies and Co-operatioD
44. There are Municipal Boards in the district at Bikaner, Gangasbabar, Bhinasar, Deshnoke and Nokha Mandi. The main sources of revenue of the municipalities are rent of shops, octroi, taxes, license fees, contracts and the grants provided by the Government while the items of expenditure are public health and sanitation,
]j~ht, water works etc. There is a Zila Parisbad comprising of 4 Panchayat Samities and 123 Gram Panchayats in the district.
45. There is a Central Co-operative Bank and various types of Co-operative Societies in the district. In June, 1961 there were 320 societies of various categories including a Co-operative Bank with a total membership of over 22 thousand in the district. The working capital of these societies was around 43.0 lakh and the share capital was Rs. 11.5 lakh. A loan of about Rs. 25.7 lakh was advanced by the Government. The deposits and borrowings during the period was around Rs. 9.0 lakh and Rs. 21.9 lakh respectively while the total liabilities amounted to Rs. 46.8 lakh. In aU, 219 societies were functioning at profit, 61 at loss and 40 societies were functioning on no profit no loss basis. During the second five year plan a sum of Rs. 3.82 lakh was spent on co-operation in the district.
Community Development
46. The Community Development Programme was started in the district during 1955-56 by establishing a block at Nokha. This was followed by the establishment of a block at Kolayat in 1958-59 and Bikaner in 1960-61. Thus by the end of the year 1961, there were 3 blocks functioning in the district.
47. During the year 1961, 4 hundred Mds. of seeds and 43 agricultural implements were distributed to the farmers and 20 agricultural demonstrations were held in the various Panchayat Samities of the district. 3 wells were constructed for irrigation and another 14 for drinking purposes. 76 adult literacy centres were opened and over 1.4 thousand persons were made literate. 24 Youth Clubs and 9 Mahila Samities were started and 6 reading rooms and libraries were opened.
Social Welfare
48. There is an office of tbe State Social Welfare Department under charge of the Social Welfare Officer at Bikaner which looks after the welfare activities connected with the uplift of the backward classes in the district. It also acts as a liaison between prisoners and their relatives.

49. There are two GO\fernment hostels "in the district. Besides, voluntary agency hostels ar:e run at Ko)ayat and Nokha Mandi under the supervision of Harijan Chhatrawas; Nokha and Jag Jeewan Chhatrawas. Ko)ayat with the sanctioned strength of 25 and 40 respoo.tively. There are two training-eum-production centres for Scheduled Castes at Bikaner each of which provides the training in the trades. of tailoring and shoe ... mak iog respectively. '
so. The Government has also opened two 'Sanskar Kendras' at Bikaner City for the development of cultu .. raI and religious activities of tbe Scheduled Castes. Houses have been constructed for rehabilitating the Scheduled Castes and Gadolia Luhars at Bikaner City. DUring the year 1956-57 ,a sum of Rs. 29 thousand was sanctioned ,for the construction of houses, PanchayatGhar and dfillking water wells at Pal ana ( Bikaner tehsil). Beside~, houses were constructed at Nokha, Deshnoke etc. for, rehabilitating the Scheduled Castes. In all a sum of Rs. 5.89 lakh was spent for SOCial
welfare at;ld welfare of backward classes in the district during the second five year plan.
51. Som~ of the impo.rtant fairs. of the district are as follows:-
( i ) Kapil Muni-ka-Mela
At village Kolayat, situated at a distance of 50 Kms;. to the south-west of the Bikaner City, a fair is held in the honour of Kapil Muni on Kartika Sudi 13 to Agrahayana Badi 1 (Oct.-Nov.) every year. It is the bIggest fair of the district where about 50,000 people assemble to participate in the fair. The main day of the fair is on Kartika Sudi 15 (Pumima). The main place of piJgrimage is a tank wbich has 52 bathing ghats of which several are reserved for women. A temple dedicated to the saint at the main gbat contains a statue in white marble to which coconuts, batasha (Sugar-drops), dry fruits, mishry (Sugar candy) etc. are offered. Shri Kolayatji is the nearest railway station.
•
wh'ctl is about 20 miles from Sikalitt' City. The·tb&iJl fair. is held ,every year dUriDg the 'Navraua' >0n :Cliaitt.a Sudi 1 to Chailra Sudi 10 (March-April) in hODOUt' b1 Kami MaUl - a Charan W0man 'wIle) is b~d to MWI
. beel1 an inc3matioo ,of Devi. 'The ta.:r.gest 'COognYgatioa. is on Saptami aDd Ashtami wb~n about 30;000 p~nc> .. assemble in the fair. A fair also takes 'Place iii 'Navtatft' OD Ashvina Sudi I to Ashvina Sudi 10 (Sept.-Oct.) when nearly 5,000 people participate. Most of these "PeopIct belong to Ganganagar, Bikaner and Churu districts. Rajputs and Charan~ bowe~, 'come from 811 over Rajasthan. Tbe Rajputs celebrate ~Jfldula) (tbe fit'$t hair cut of a child) ceremony of their children and place the child at the feet of the deity to obtain bet blessings. Deshnoke is a railway station and is connected by a metalled road with Bikaner, Naaaur, Jodhpur and Jaipur. Cash, coconuts and sweets are offered to the deity.
( iii ) Jambhe5War~ka-Mela
A fair is held at village M ukam "in Nokha tehln at a distance of 15 Krns. from Nokha Manai 'own in the honour of Jambheswar-the illustrious founder saint of the Bishnoi sect who worship him as,the incartl&tH;a of Vishnu. The fair takes place twice in a year on Phalguna Badi Amawasya to Phalguna Sudi 3 (Feb.March) and Ashvina Dedi 14 to Ashvina SUdi 2' (Sept~. Oct.). The former is the main fair wlrllc the later is" smaller one. The estimated congregation in these fairs are over 12,000 and 3,500 respectively. The B~hnOis pay their homage to the saint and offer cash~ Moth etc. in his bonour. They observe fa'S! on: AMClwasya and perform congregational bawan of 'agmho1ta' q.t do not canduct any other business· orr tlliS' day.
(iv) Bhaironji-ka-Mela
A fair is held at village Kodamdesar ill' Kolliyat tehsil either on Bbadrapada Sudi 12 or Bbadrapada'sudi 13 (Aug.-Sept.) every year. The estimated congregation in the fair is 4,000. The people' also' perform the 'JBdtiRt, ceremony' of their children on this occasion •
( ii) Karni Mata-ka-Mela (l') Shlvwari-ka-Mela
This fair is held at Deshnoke town (Bikanec tehsil) A reHgious fair is held in village Shivwari (Bikaner

(X)
tehsiJ), which is about balfway between Devi Kund and the City at some distance to the south of the road, on Shravana Sudi 7 to Shravana Sudi 10 (July-Aug.) every year. The peak day is Shravana Sudi 10 (July-Aug.). There is a temple dedicated to Lord Shiva where about 10,000 people congregate to offer their prayers. Bikan~r is the nearest railway station.
( -vi) Jaitha Bhutta-ka-Mela
At vi11age Gajner (Ko]ayat tebsil) there is a Samadhi of Jaitha Bhutta on the bank of a lake near the Palace. A fair is held here on Ashvina Sudi 8 ( Sept. -Oct. ) every year. About 4,000 people participate in the fair. Although both Hindus and Muslims assemble, only Muslims participate in the worship. Gajner itself is a railway station.
52. The main festivals among the Hindus are Navratri, AksHya Tritiya, Gangaur, Raksha-Bandhan, Dashera, Deewali. Basant Panchmi while the Muslims observe Moharrum, Idul-Milad-ul-Nabi, Ramzan, Idujfitre and Idul Zuha.
Places of Historical ad Archaeological Importance
53. Following places are considered important in the district from the historical and archaeological point of view :-
Bikaner
Bikaner, the fourth largest City of Rajasthan, has a population around 1.51 lakh which constitutes 80.1% of the district's urban population. It lies fairly deep in the Thar Desert behind the endless waves of sand dunes. This region is believed to be the seat of a great civilization at the time when the sacred river Saraswati used to ,flow here. The town is directJy connected by rail with Delhi 462 Kms. (287 miles), Jaipur 378 Kms. (235 miles) and Jodhpur 275 Kms. (171 miles). The walled City ~resents the appearance of a magnificent town. The City wall is about seven Kms. in circuit built wholly of stone with several fine gates. The town is built upon a rock formation which is higher than the surrounding sandy tract. Due to this reason Bilai,ner is visible even from a distance. The fort is the maio attraction of
the City. There are some other elegant bwldings in red and yellow sand stone.
The Forts
The Bikaner Fort was built by Raja Raisingh (1571-1611), one of Akbar's distinguished generals, during 1588-1593 A.D. It has two entrances each of which has three or four successive gates with different names and its ramparts have numerous towers. The fort, which also contains the Maharaja Raja Rai Singh's Palace (the oldest building in the fort) is situated about three hundred yards from the Kat gate of the City and includes the Suraj parol, the Karkhana Kalan (great workshop), the Har Mandir, the Chaubara and Hazuri Darwaza (royal entrance) and the Raj Nivas. Most of these buildings are executed in yellow sand stone. The wans of Chandan Mahal are covered with niches, mirrors and carved marble panels. Phool Mahal is decorated with glittering mirror work, carvings and paintings and the ante-room of this Ma hal is adorned by the sculptures of Hindu deities. The Sheesh Mahal of Gaj Mandir is famous for its mirror and stucco work. The Chhatar Mahal, the ceiling of which is highly ornamented, bears a 'Ras Lila' frieze. Ganga N ivas, the spacious darbar hall, is faced with richly carved red sand stone. There is a big tank known as 'Sur Sagar' near the fort which was constructed by' Maharaja Sur Singh. The old fort, built by Bin, (the founder of Bikaner City) is situated on some high rocky ground. It is surrounded by ravines and is located outside the southern wall of the City. It is a' small place and is considered more like a shrine tban a fort. There are cenotaphs of Bika and his successors and inscriptions over tbem record the dates of tho funerals and the number of 'Satis' at each.
Palaces and Temples
Outside the City is the Lalgarh Palace, an imposing edifice of carved red stone, which contains a remarkable collection of paintings. It is one of :~.:.
most magnificent bUilding in Bikaner City and;.: present is the residence of the Mabaraja. It was built by Mabaraja Ganga Singh in the memory of his father Lal Singh. Within the Palace, the flooring has mostly been done in marble. The Gajner Palace built on :==

(xi)
banks of a lake, is situated about 31 Kms. (20 miles) south-west of Bikaner City. It was founded by Maharaja Gaj Singh and was a favourite place of residence of Bikaner Chiefs. There is a temple dedicated to Susani Devi, the 'Kuldevi' of the Surana Oswals, in village Morkhana of N okha tehsil. The village is_ situated at a distance of 28 miles south-east of Bikaner City and is about 14 miles from Deshnoke town. The temple is built of Jaisalmeri stone. There are carved images on its exterior but many of tbese have been covered by white plaster. Of the famous temples, the Bhandasar Jain temple, Laxmi Narain temple and temple of Dhuni Natb are important in the district.
The Museum
The Ganga Golden Jubilee Museum at Blkaner is stocked with some very interesting and rare art pieces. There is a fine collection of terracottas belonging to the Gupta period. One of the beautiful pieces is a five feet white marble image of Saraswati.
Devi Kund or Devi Sagar
This tank~ which is a picnic spot, is situated three miles east of the Bikaner City. A large number of cenotaphs of the former rulers are located on the banks of this tank. These are fine buildings and have beautiful domes.
Electoral Participation and Preferences
54. During the first general elections in the year
1952, the district formed three constituencies with a voting popUlation of about 158 thousand persons aod three seats in the State Vidhan Sabha. 43.1 % voters exercised their right of franchise. The highest percentage of polling was 45.5 recorded in Bikaner CIty constitu~ncy, the lowest was in Nokha constituency where only 39.7% votes were polled. All the three seats were captured by the independent candidates. No separate seat was allotted to the district in the House of the People for it was combined with Sardarshahar. Rataogarh and Sujangarh assembly constituencies of Churu district and Nagaur-West and Didwana assembly constituencies of Nagaur district for this purpose.
55. During the second general elections in the year 1957, the number of assembly constituencies remained the 5lame but one of them was ma.de a double member constituency. The total voting population was about 181 thousand. 42.0% voters (49.6% of men and 28.1% of women) exercised their right of franchise. The highest percentage of polling was 50.9 in Bikaner City constituency and lowest in Lunkaransar constituency where 33.4% votes were polled. One seat was captured by the Congress, one by the Praja Socialist Party and the rest two were taken by the candidates who were independent. The district at this time too was not allotted any separate seat for the House of the People as it was combined with Ganganagar and Chum districts (excluding a few villages 0 f Sujangarh tehsil) to form a parliamentary constituency.

SECTION II
PRIMARY CENSUS ABSTRACT
I:
OTHER CENSUS TABLES


PRIMARY CENSUS ABSTRACT


PRIMARY .,ENSUS ABSTRACT
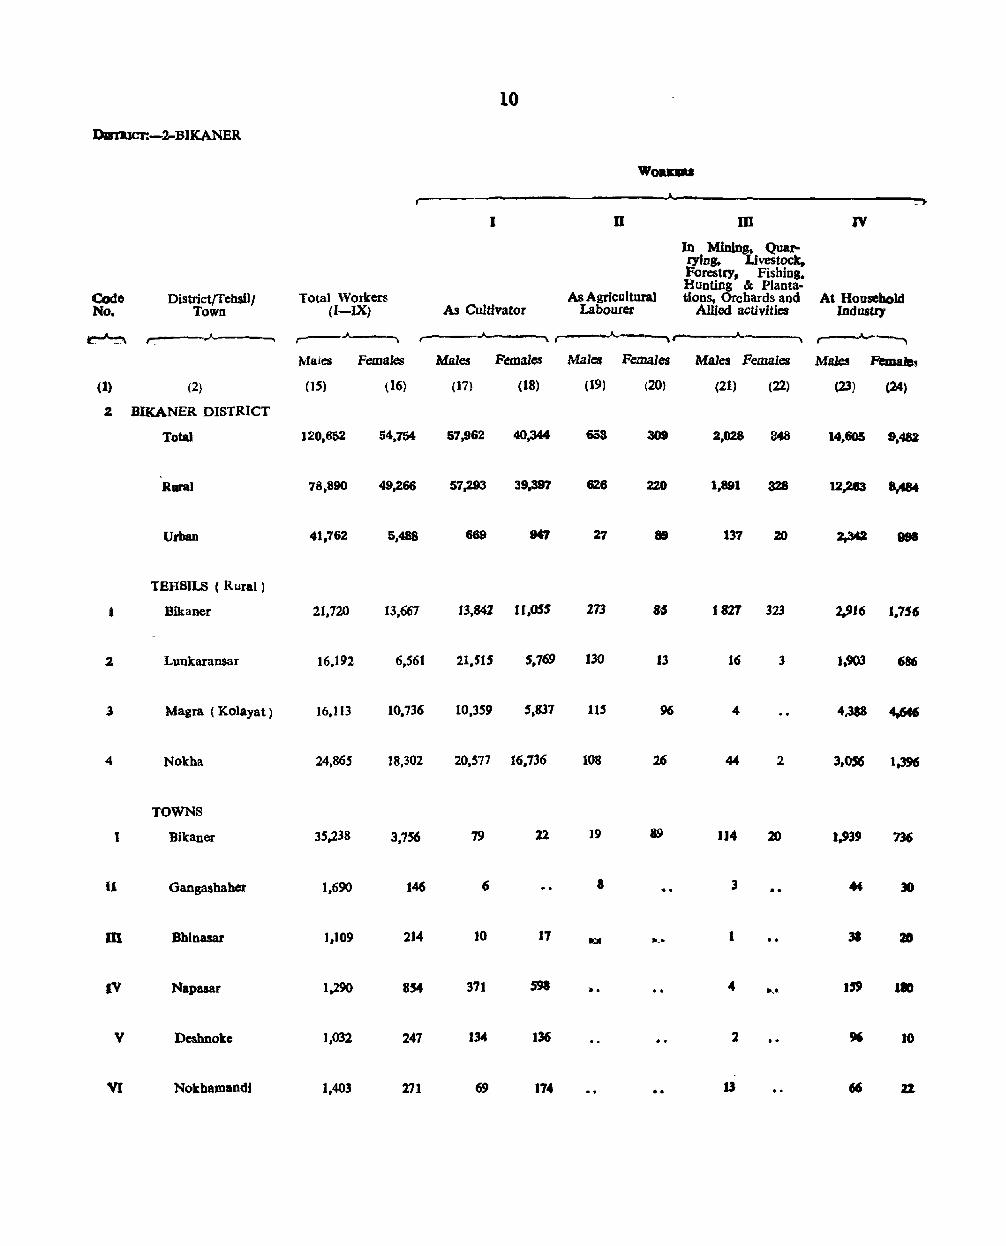
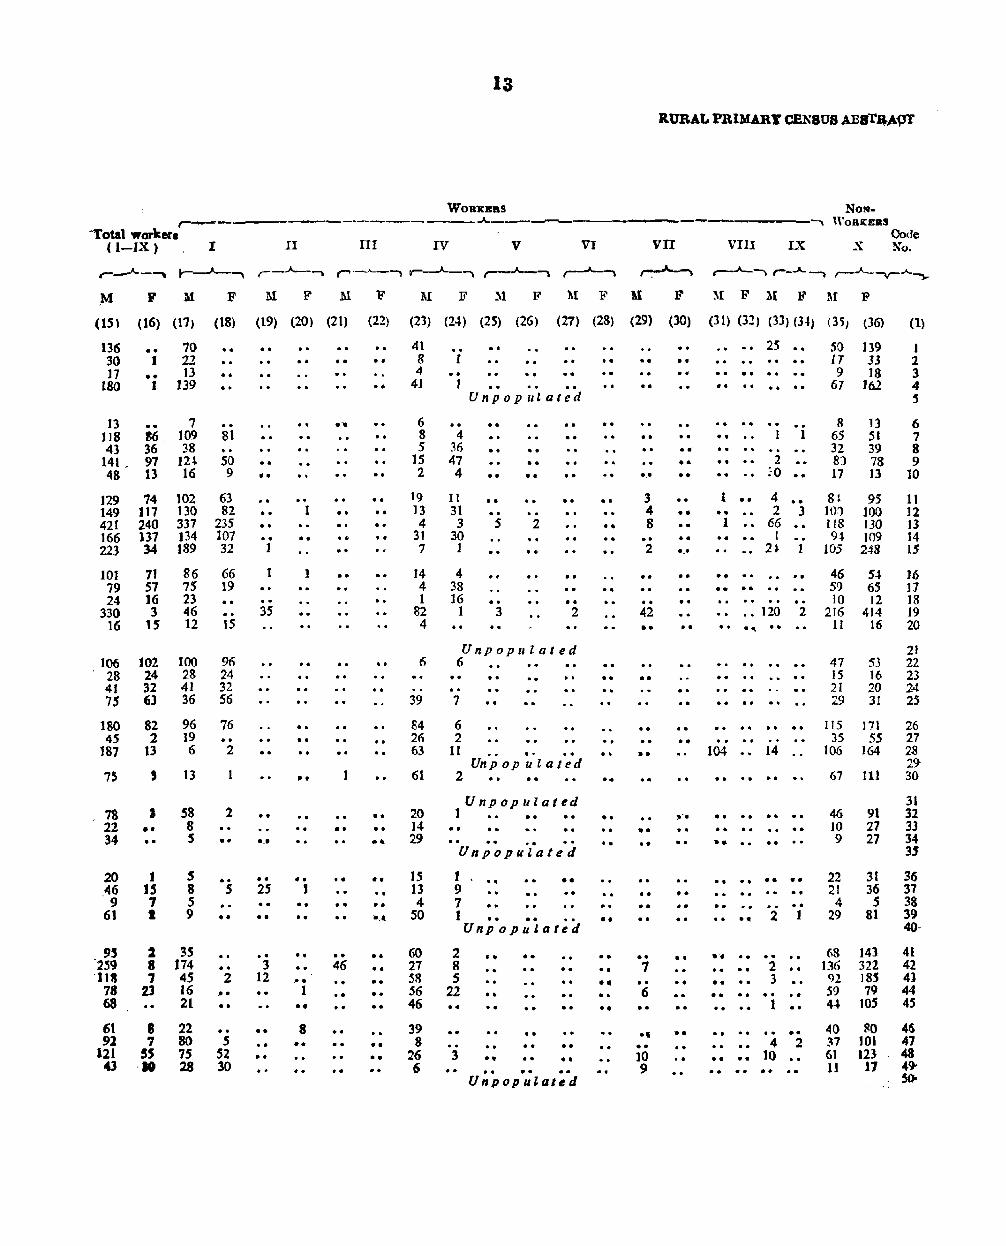
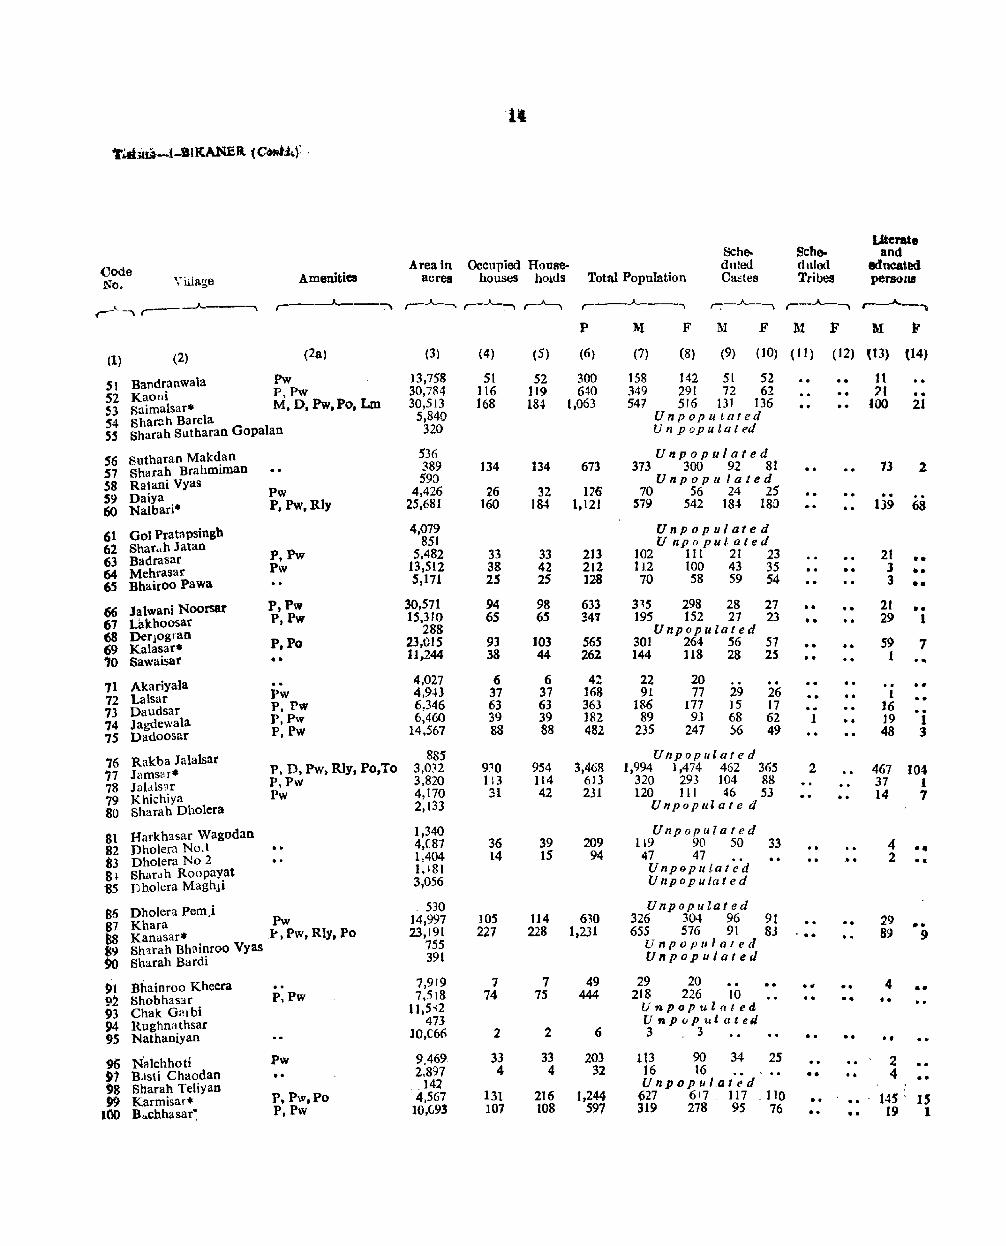
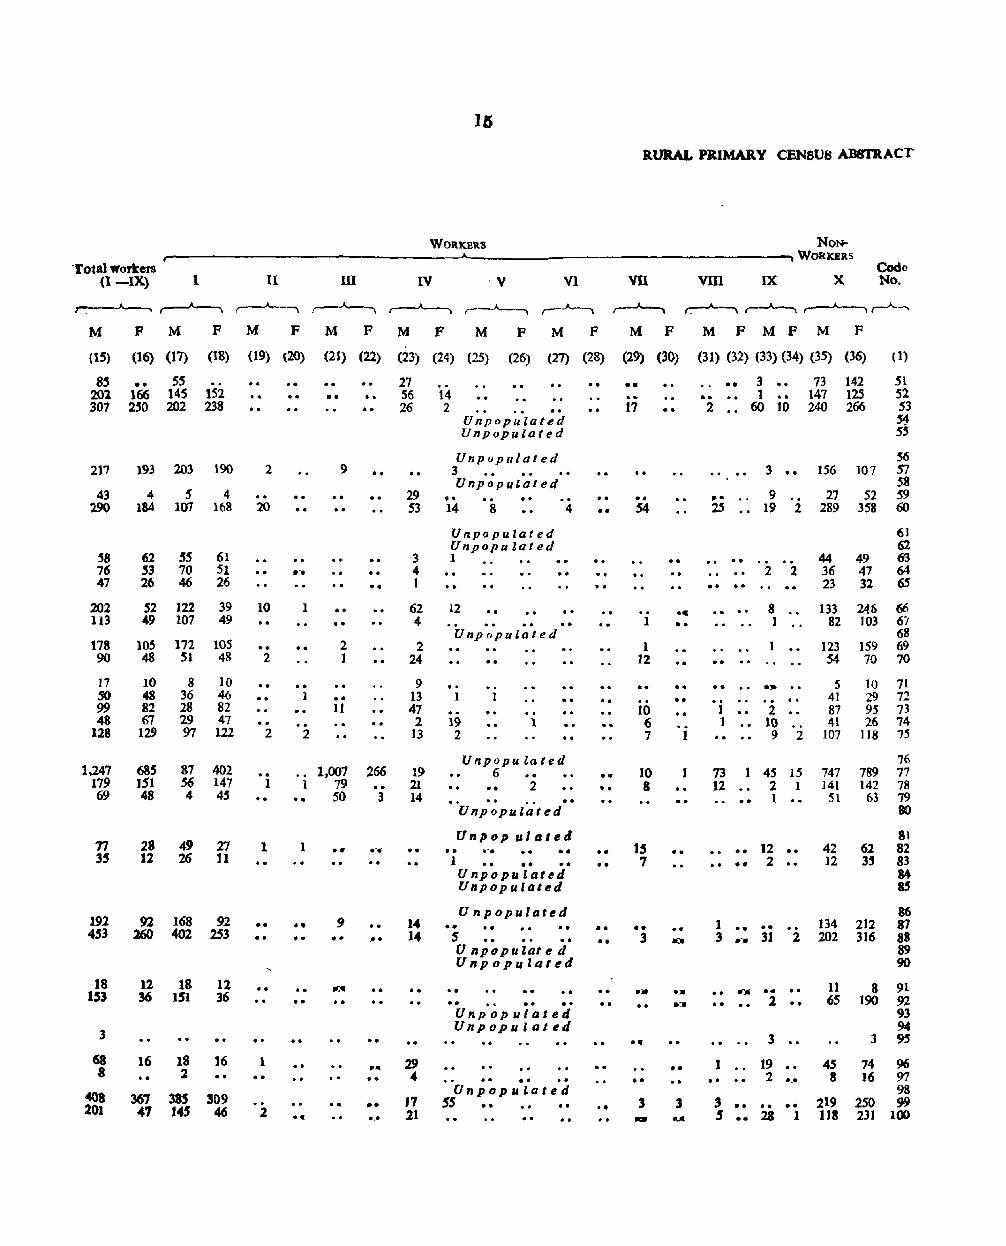
The Primary Census Abstract furnishes the population figures for 1961 Census and is presented in three parts viz. District, Rural and Urban Primary Census Abstracts. These abstracts contain the data in respect of area, number of occupied residential houses and households, total population and its breakup by sex, literacy, Scheduled Castes and Scheduled Tribes, workers and non"workers. The workers have further been classified into following nine industrial cat.egories:-
I As Cultivator, II As Agricultural Labourer,
III In Mining, Quarrying, Livestock, Forestry, Fishing, Hunting and Plantations, Orchards and allied activities,
IV At Household Industry, V In Manufacturing other than Household
Industry, VI In Construction,
VII In Trade and Commerce, VilI In Transport, Storage and Communications and
IX In Other Services.
2. The District Primary Census Abstract furnishes the data fOT the district total, rural and urban areas, each rural tehsil and for each town separately. The Rural Primary Census Abstract presents the data fo:r the villages while Urban Primary Census Abstract furnishes information for the municipal wards of all the towns in the district.
3. A Revenue Mauza (including its hamlets) is treated as a village while a town is a place ha"Ving either a Municipality or Cantonment or satisfying the following factors:-
(a) having a minimum population of 5,000 and (b) having three-fourth of his male adult; population
engaged in non-agricultural pursuits, or (c) having a density of approximately 1,000 persons
per sq. mile.
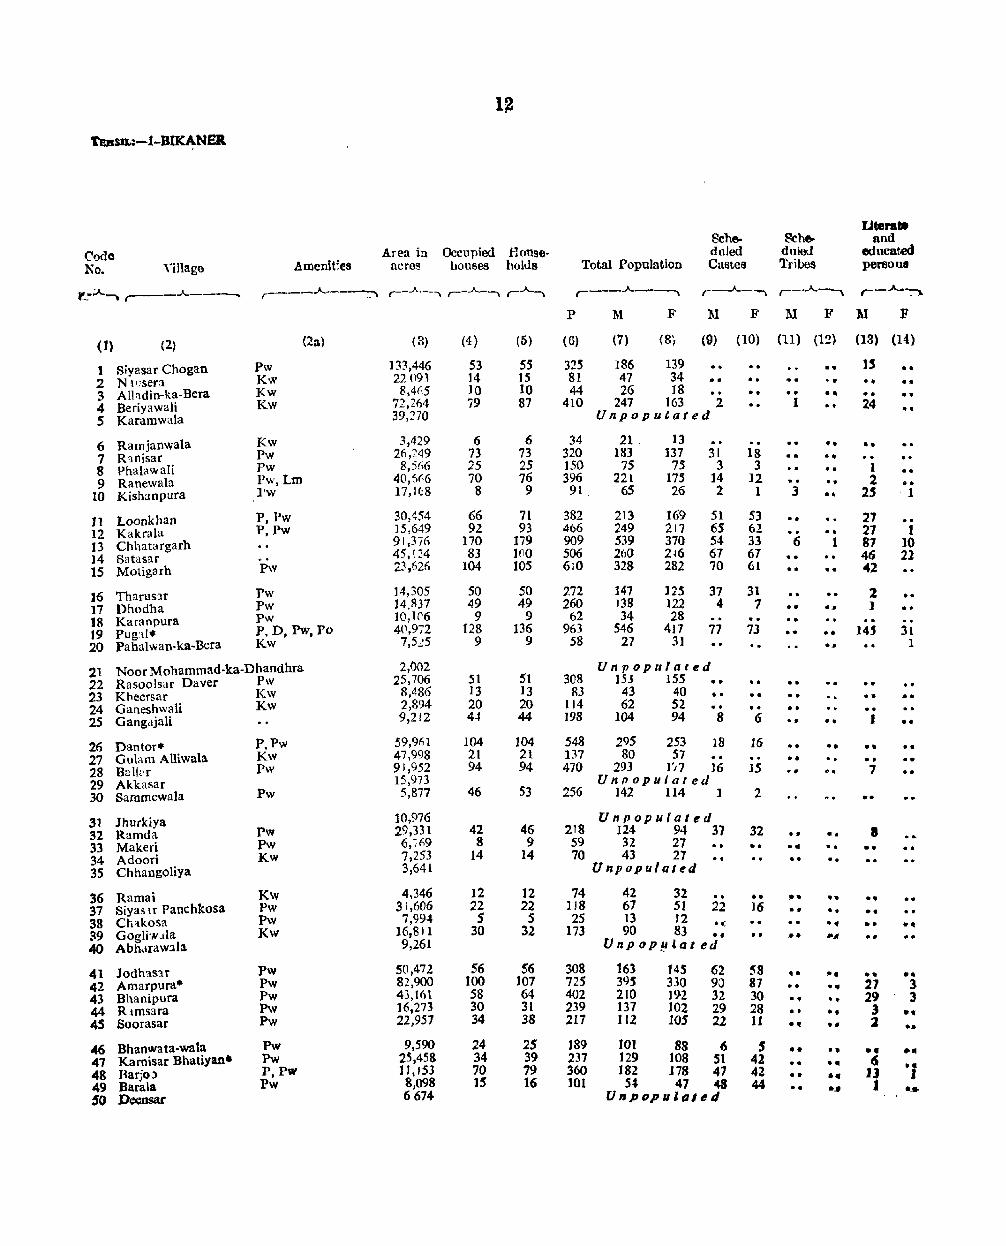
Hamlets falling into the revenue areas of the towns but not administered by the municipality are treated as the non-municipal area of the town. The villages in the Rural Primary Census Abstract are presented tehsilwise and within a tehsil in order of their Census location code numbers.
4. In the Urban Primary Census Abstract, the data has Oetm presented for each municipal ward of the towns. The blockwise fii{llres for towns could not be presented
here for want of space. This information, however) is available in the office of the Superintendent, Census Operations, Rajasthan. The data for non-municipal areas attached to a town has been shown just after the wards while for special charges, the figures ha"Ve generally been included in the respective wards.
5. A special column (2a) in the Rural Primary Census Abstract has been provided for showing some of the basic amenities which existed in the villages. These amenities have been shown by means of symbols as under: ...
P-Primary School M-Middle School H-HighJ Higher Secondary School G-College D-Dispensary
Hos-Hospital Tmw-Trained Midwife
V-Veterinary Hospital/Dispensary Pw-Pucca well K w-Kutcha well Tk-Tank B-Baori (stepped well)
Rly-Railway Station Po-Post Office To-Telegraph Office
Lm-Local Market
6. Village marked with an asterisk (*) indicates the location of a Gram Panchayat.
7. The area figures shown in column (3) of the Rural Primary Census Abstract are colJected from the Revenue Authorities while this column ofthe Urban Primary Census Abstract ha~ been left blank as area figures for the wards are not available.
8. Column (4) of the Abstract includes houses used as dwellings or partly us dwellings.
9. Column (5) shows the number of households. A "household" has been defined as a group of persons who commonly live together in the same house and take their meals from a common kitchen. A servant, friend or a guest (related or unrelated) residing and eating with the household during the census period has been treated as & member of the household. On the other hand, & SOD
or a daughter residing in a hostel is not treated as a member of the houselJ()ld.
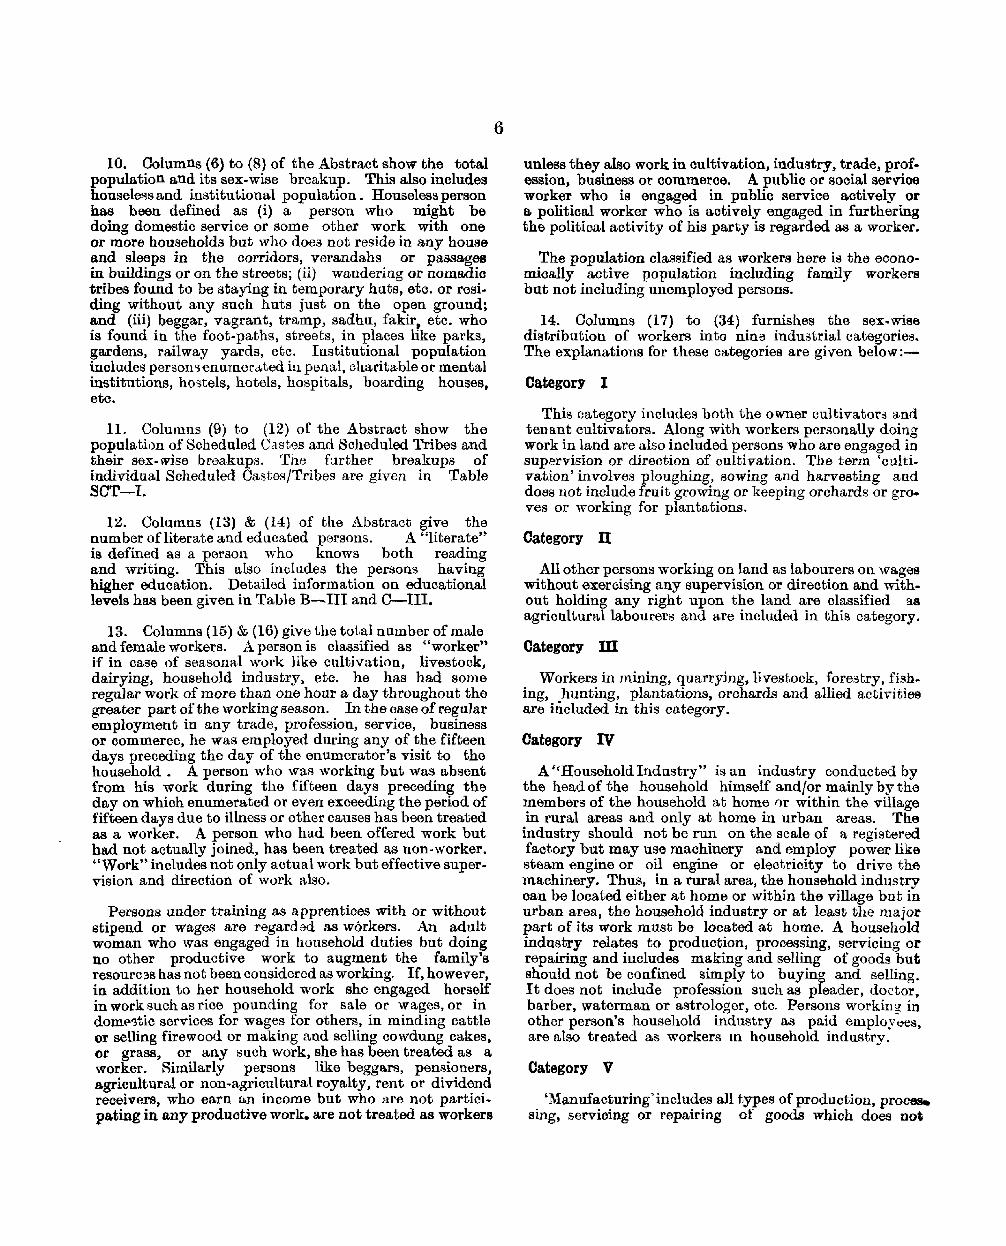
10. Columns (6) to (8) of the Abstract show the total population and its sex·wise breakup. This also includes housele~s and institutional population. Houseless person has boon defined as (i) a person who might be doing domestic service or some other work with one or more households but who does not reside in any house and sleeps in the corridors, verandahs or passages in buildings or on the streets; (ii) wandering or nomadio tribes found to be staying in temporary huts, etc. or resi· ding without any such huts just on the open ground; and (iii) beggar, vagrant, tramp, sadhu, fakir. etc. who is found in the foot.paths, streets, in places like parks, gardens, railway yards, etc. Institutional population includes personsenumcl'a.ted in penal, charita,ble or mental institutions, hostels, hotels, hospita,ls, boarding houses, etc.
11. Columns (9) to (12) of the Abstract show the population of Schednled Ca.st0s and Scheduled Tribes and their sex-wise br~akups. The further breakups of individual Scheduled Castes/Tribes are given in Table SOT-I.
12. Oolumns (13) & (14) of the Abstract give the number of literate and educated persons. A "literateH
is defined as a person who knows both reading and writing. This also includes the persons having higher education. Detailed information on educational levels has been given in Table B-III and C-III.
13. Columns (15) & (16) give the total number of male and female workers. A person is classified as "worker" if in case of seasonal work like cultivation, livestock. dairying, household industry, etc. he has had some regular work of more than one hour a day throughout the greater part of the working season. In the case of regular employment in any trade, profession, service, business or commerce, he was employed during any of the fifteen days preceding the day of the enumerator's yisit to the household. A person who wal'! working but was absent from his work during the fifteen days preceding the day on which enumerated or even exceeding the period of fifteen days due to illness or other causes has been treated as a worker. A person who had been offered work but had not actually joined, has been treated as non-worker. "Work n includes not only actual work but effective super. vision and direction of work also.
Persons under training as a pprentioes with or without stipend or wages are regarded as workers. An adult woman who was engaged in household duties but doing no other productive work to augment the family's resourC3S has not been considered as working. If, however, in addition to her household work she engaged herself in work such as rice pounding for sa,le or wages, or in domf''3tic services for wages for others, in minding cattle or selling firewood or making and selling cowdung cakes, or grass, or any such work, she has been treated as a worker. Rimilarly persons like beggars, pensioners, a.gricultural or non~agricultural royalty, rent or dividend receivers, who earn an income but who are not partici. pa.ting in any productive work. are not treated as workers
6
unless they also work in oultivation, industry, trade, profession, business or commerce. A public or social servios worker who is engaged in public service actively or a political worker who is actively engaged in furthering the political activity of his party is regarded as a worker.
The population classified as workers here is tha acono· mically active popUlation including family workers but not including unemployed persons.
14. Columns (17) to (34) furnishes the sex· wise distribution of workers into nine industrial categories. The explanations for these categories are given below:-
Category I
This category includes both the owner cultivators and tenant cultivators. Along with workers personally doing work in land are also included persons who are engaged in supervision or direction of cultivation. The term 'culti~ vation'involves ploughing, sowing and harvesting and does not include fruit growing or keeping orchards or groves or working for plantations.
Category n All other persons working on land as labourers on wages
without exercising any supervision or direotion and without holding any right upon the land are classified as agricultural labourers and are included in this category.
Category m
Workers in mining, quarrying, livestock, forestry, fishing, hunting, plantations, orchards and allied activities are hicluded in this category.
Category IV
A • 'Household Industry" is an industry conducted by the head of the household himself and/or mainly by the members of the household at home nr within the village in rural areas and only at home in urban areas. The industry should not be run on the scale of a registered factory but may use machinery and employ power like steam engine or oil engine or electricity to drive the machinery. Thus, in a rural area, the household industry can be located either at home or within the village but in urban area. the household industry or at least the major part of its work m.ust be located at home. A household industry relates to production, processing, servicing or repairing and includes making and selling of goods but should not be confined simply to buying and selling. It does not include profession such as pleader, doctor, barber, waterman or astrologer, etc. Persons workinl! in other person's household industry as paid employ~, are also treated as workers In household industry.
Category V
'Manufacturing'includes all types of production, proces. sing, servicing or repairing of goods which does not

include production or processing under category IV.
Category Vl
This category includes workers engaged in construction and maintenance of buildings, roads, railways, bridges, telegraph, telephones, water-ways, reservoirs, etc.
Category VU.
This category includes workers engaged in' any capacity in wholesale or retail trading activity and commercial transactions relating to imports and exports, real estates and properties, stock RJlr) ~bares, insurance, money lending banking, etc.
Category vm~
This category mcludes workers engaged in transport activities by air, rail, road or water and in services incidental to transport such as packing, carting, loading unloading, etc. Workers engaged in storage, warehousing and communication services such as posts, telegraph, telephones, wireless signalling, information and broadcasting are also inoluded in this category.
Category IX
This category includes (i) Public utility services like electricity or gas or water supply, sanitary services; (ii) Central, State or Municipal emploYl~es; (iii) Professional services; (iv) Trade or labour associations, recreation services, etc.
15. Columns (35) & (36) give the total num ber of male and female non-workers. The following persons have been
'1
olasslfied as non-workers:-
1. Full-time student or ohild attending sohool who does no other work, suoh as make artioles at home for sale, nor even help pan-time in his own family oultivation, industry, trade or business.
2. Person engaged in unpaid home duties (like housewife or other adult female) who does no other work, such as make articles at home for sMe or wages, nor help regularly even part-time in family cultivation, industry, trade or business.
3. Dependant, inoluding an infant or child not attending school, a person permanently disabled from work beoause of illness or old age.
4. Retired person who is not employed again, rentier, person living on agricultural or non-agricultural royalty, rent or dividend or any other person of independent means for securing whioh he does not have to work and who does no other work.
5. Beggar, vagrant or independent woman without indication of source of income and others of unspecified source of income.
6. Convict in Jail (an underptrial prisoner has been shown as a worker if he used to work before he was apprehended) or an inmate of a penal, menta.l or oharitable institution.
7. Person who has not been employed before but is seeking employment for the first time.
8. Person employed before but now out of employment and seeking employment.

8
Dl!nuor.-2-BIKANER
Area In Code Square Occupied No. D1strlctJTebsllJTown mUes Roures Households Total Population
~ J, . , " d\
Persons Males Females
{It (2) (3) (4) (5) (6) (7) (8)
2 BIKANER DISTRICT
Total 10,554-5 73,313 78.073 444,515 232,699 211,816
Rural 10,464'2 41,620 44,989 26,489 134,539 121,950
Urbaa SO'3 31,693 33,084 18,026 98,160 89,866 .
TBH8ILB ( Rur.! )
Blkaner 3,473'6 12,088 12,947 71,495 37.586 33,909
2 Lunkaransar 2,460'3 8,225 9,229 53,967 28,329 25.638-
3 Magra ( Kolayat ) 3,068'8 7.654 8,589 47,998 25,710 22,281
4 Nokha 1,461'S 13,6S3 14,224 83,029 42,914 40,11'
TOWNS
1 Bikaner 14'71 25,580 26,580 150.634 79,945 10,689
n Gangashaher 4-58 1,672 1,884 10.696 5.052 5,644-
111 Bbinasar 3-78 885 933 5.442 2,718 2.724-
IV Napasar 29-S5 1.112 1,147 6,634 3,243 3,391·
V Deshnol 33-61 1,179 1,207 6,880 3.344- 3,536
VI NOkhamandi 4-09 1,265 1,.333 7,740 3,858 3,882"

• DISTRJCT PRIMAR Y CElolBU8 ABSruct'
Co". 8cbedubt Olstes Scheduled Tribes Uterate It educated persons Dlstrict/TehsU/ToWD No. _- r= "---------:-"\ ~
Maflcs Females Males Females Males Females
(9) (10) (11) (12) (13) (14) (2) (1)
BIKANER DISTRICT Z
:33,923 32,059 539 495 76,641 26,427 Total
26,_ 25,,269 28 14 25,434 4,257 Rura)
7_ 6,_ 513 481 51,207 22,170 Urban
TBHSILS (Rural )
. 7/)24 7,345 13 1 7,497 1,231 Bikaner J
5,146 4.873 5,751 1,182 Lunkaransar 2
5.87. 5,564 8 6 4,006 728 Magra ( Kolayat ) 3
7,713 7,481 S 7 8,180 1,116 Nokha 4
TOWl'-S
5,331 5,008 499 462 42.083 17,728 Bikaner
111 168 I 2,872 1,769 Gangasbaher Jl
549 486 .. " "'- 1.329 610 Bhinat.ar iu
S811 536. .; 1,432 657 Napasar rv
430 432 9, 1.5 1,436 715 Deshnoke V
160 4 4 2.05S 691 Nokhamandi ,
YI
10
DIIm.Jcr:-2-BlKANER
WOUDI
I D m IV
In Mining, Quar-rying, Livestock. Forestry, FishiD8.
As Agricultural Hunting & Planta-
Codo District{fehsill Total Workers tlons, Orchards and At Household No. Town (I-IX) As Cultivator Labourer Allied activities IndllStr)'
~ ,..A "'" ,- J. , ..A ""\ ,-- A.. _ .. , ~
Males Females Males Females Males Females Males Females Males Female"
(1) (2) (15) (16) (17) (18) (19) (20) (21) (22) (23) (24)
2 BlKANER DISTRICT
Total 120,652 54.754 51.962 40.344 653 309 2,028 348 14,605 9,482
Rural 78,890 49,266 57,293 39,397 626 220 1,891 328 12,283 8,484
Urban 41,762 5,488 669 27 81 137 20
THR8ILS ( Rural)
t Bik a Rer 21,120 13,661 13,842 B,OSS 273 86 f 821 323 2.916 1,756
2 Lunkaransar 16,192 6,561 21,S15 5,769 130 13 16 3 1.903
.3 Magra (Kolayat) 16.113 10,736 10,359 5,837 llS 4 4.388 4.6C6
4 Nokha 24,865 18,302 20,577 16,736 108 26 44 2 3,OSCS 1.-TOWNS
1 Bikaner 35,238 3,7S6 79 19 114 20 1.93'
U Oangashahcr 1,690 146 6 I 3 .. 30
m Bhinasar 1,109 214 10 17 .. _" 1 .. 20
IV Napasar 1,290 854 371 •• 4 .. .... U'9 180
V Deshnokc 1,032 247 134 136 .. 2 10
VI Nothamandt 1,403 271 69 174 .. 13

·l"l
DISTRICT PRIMARY -ef~SU8 A~STitACT
WORKERS
.A.-
"V VI VII VlII IX X
In manufactur-ing other tban In Transport. Household In Trade and , Storage and In other NON-WORKER') District/Tehsill Code
Industry In Construction Commerce Communications Services Town No.
..J... , ,-..A-.--.,_ ,--..A--.. ,--A--, ,----A __ '-\ r---A-------. ,----"---_--. ,A __ •
Males Females Males Females Males Females Males Females Males Females Males Female_;
{2S) (26) (21) (28) (29) (30) (31 ) (32) (33) (34) (35) (36) (2) (I)
BIKANER DISTRICT 2
4Jr13 813 4,013 3S3 9.713 421 7.617 25 19,1E8 2,659 112,047 157,062 Total
486 ' 164 331 68 1.564 152 860 5 3.576 448 55,649 12,684 Rural
4.387 649 3,682 2.85 8,149 169 6,757 15.612 2,211 56,398 84,373 Urhan
TEHSTLS (Rural, . '
Z63 91 185 27 609 95 415 2 1.390 233 15,866 20,2-\2 Bik.:mer t
171 IS 40 5 458 8 280 677 62 12.137 19.071 Lunkaransar 2
9 4' 60 30 218 8 71 3 889 75 9.597 11,552 Magra ( Kolayat) 3
41 17 46 6 279 41 94 620 78 18.')49 21,813 Nokh:l
TOW'l\:S
·3.365 4j7 2~954 231 6,408 224 6,386 19 13,974 1,978 44,707 66.933 Bikancr I
362 37 96 2 601 12 126 444 65 3.362 5,498 Gangashaher IJ " '
• '223 ' ' [34 ~90 6 190 4 66 291 33 1.609 2,510 Bhinasar" In
87 '2 128 29 272 3 43 226 42 1,953 2.537 Napasar IV
lSI 2? 191 9 225 18 14 249 45 2,312 3,2S9 Deshnoke V
" '
"' '99 I to 'tl3 8 453 . : ~ 62 1 428 48 2,455 3,611 Nokhamandi \'1
'l'EBsn.:-l-BIKANER
Code No. Yillage
(1) (2)
1 Siyasar Chogan 2 N lusera 3 Alhldin-ka-Bera 4 Beriyawali 5 Karamwala
6 Ramjanwala 7 R'lnisar 8 Phalawali 9 Ranewala
10 Kishanpura
11 Loonkhan 12 Kakrala ] 3 Chhatargarh ]4 Satasar IS Motigarh
)6 Tharus1r 17 Dhodha 18 Karanpura 19 PUg:l:. 20 Pahalwan-ka-Bera
Amenlt:es
Pw Kw Kw Kw
Kw Pw Pw Pw,Lm l'w
P,Pw P,Pw
Pw
Pw Pw Pw
(2n.)
P, D, Pw.Po Kw
21 Noor Mohammad-ka-Dhandhra 22 Rasoolsar Daver Pw 23 Khecrsar Kw 24 Ganeshwali Kw 25 Gangdjali
26 Dantor* 27 Gulam Alliwala 28 BaIlDr 29 Akkasar 30 Sammewala
31 Jhurkiya 32 Ramda 33 Makeri 34 Adoori 35 Chhangoliya
36 Ramai 37 Siyas u Panchkosa 38 Ch'lkosa 39 Gogliwclla 40 Abh.lraW:l1a.
41 Jodhas1r 42 Amarpura* 43 Bhanipura 44 Rlmsara 45 Soorasar
046 Bhanwata-wata 47 Karnisar Bhatiyan. 48 Hario') 49 Barala 50 Deensar
P,Pw Kw Pw
Pw
Pw Pw Kw
Kw Pw Pw Kw
Pw Pw Pw Pw Pw
Pw Pw P,Pw Pw
l~
Area in Occupied Honse-acres houses holds
(3)
133,446 22093
8,4(15 72,264 39,::'70
3,429 26,149
8,5fi6 40/)(.6 17,1(;8
30A54 ]5,649 91,376 45,[24 23,626
14,305 14)\37 10,1r6 4(1,972
7,525
2,002 25,706
8,486 2,894 9,212
59,%1 47,998 91,952 15,973 5,877
10,976 29,331 6, i f.9 7,253 3,641
4,346 31,606 7,99~
16,811 9,261
50,472 82,900 43,161 ]6,273 22,957
9,590 25,458 11,153
8,098 6674
(4)
53 14 10 79
6 73 25 70 8
66 92
170 83
104
50 49
9 128
9
51 13 20 4~
104 21 94
46
42 8
14
12 22 5
30
S6 ]00 58 30 34
24 34 70 IS
(5)
SS 15 10 87
6 73 25 76
9
71 93
179 J(lO 105
SO 49
9 136
9
51 13 20 44
104 21 94
53
46 9
14
12 22 S
32
56 107 64 31 38
2S 39 79 16
Total Population
F
Schednled Castes
F
SchedUled 'Tribes
IJten. and
educated per80118
F M F P
( 6)
M
(7) {S, (9) (10) (11) (12) (13) (14)
325 186 139 81 47 34 44 26 18 ••
410 247 163 2
34 320 )50 396 91.
382 466 909 506 610
272 260
62 963
58
308 83
114 J98
Unpopulated
21 . 183
75 221
65
213 249 539 2()O 328
147 J38 34
546 27
13 137
75 175 26
169 217 370 216 282
]25 122 28
417 31
31 3
14 2
51 65 54 67 70
37 4
77
Unpoplllated 153 }55 ...
43 40 •• 62 52 ....
104 94 8
· . · . .. · . · . 18
3 ]2 1
53 62 33 67 61
31 7
73
00 ... o.
6
548 29$ 253 18 16 137 80 57 470 293 Ii7 J6 15
Un{)OpUlaled 256 142 114 I 2
Unpopulated 218 124 94 37 32
S9 32 27 •• e. 70 43 27
Unpopu/aled
74 42 32 •• 1]8 67 51 22 16 25 13 12 00'
173 90 83 .; •• Unpopylaled
308 725 402 239 217
163 39S 210 137 112
145 62 58 330 90 87 19-2 32 30 102 29 28 lOS 22 11
J89 tOl 88 6 $ 237 129 108 51 42 360 182 178 41 42 101 54 41 4S 44
UnpopuJaled
• • 1
•• ••
· . J
•• ... 6
•• .. ••
•• .. .. •• · . •• ....
• • ... ••
,.. ••
••
· .. •• •• • • .111
•• •• •• ••
•• · .. . .. • • •• · . • • ••
· . 1
o • .. o •
•• ... ·0
•• ... .. . . .. · . ·0
·0 .0
.. .. • •
•• •• o. " ••
•• •• ." . ..
.. . •• 24
•• I 2
lS
27 27 81 46 42
2 1
141
.. •• . . J
•• • • 1
... 8
••
•• oo.
•• ••
•• 21 29 3 2
•• 6 II
J
•• •• oo.
••
.. · . .. .. . 1
I 10 21
••
31 1
· . ••
•• .. ..oo
• •
... ••
.. · . • III
• • l 3
•• •• .. .. •• J . ...
r-"Total worker.
(I-IX) I
,M F M F
(1S) (16) (17) (18)
136 30 17
ISO
13 118 43
141 , 48
129 149 421 166 223
101 79 24-
330 16
•• 1
O'
J
70 22 13
J39
7 116. 109 36 38 97 12.J. 13 16
74 117 240 131 34
71 57 16 3
15
102 130 331 )34 189
86 75 23 46 12
106 102 100 28 24 28 41 32 41 75 63 36
180 4S
187
7S
78 22 34
20 046 ·9 61
9' '2S9 'lUI
78 68
61 92
121 43
82 2
13 , J
•• .. 1
IS 7 I
2 8 1
21
8 7
SS '10
96 19 6
13
S8 8 5
5 8 5 9
35 J74 4S 16 2l
22 80 7S 28
••
· . • •
81
SO 9
63 82
235 107 32
66 19
15
96 24 32 S6
76
2
2
••
· . S
••
2 ,. . ••
· . 5 52 30
11
F M
(19) (20) (21)
••
· . • •
.. • • 1
1
35
.0
• •
',1
2S
••
.. 3
12 .. •• • 0
••
• 0
• 0
· . 1
"
1 · . · . · .
o •
• 0
• 0
o 0
JO.
• 0 • 0
o.
J •• o •
• 0
,0 •
1 •• 8
'0
..
o.
• •
· . · . ..
· .
o •
1
••
.0
• •
•• 46 • 0 · . ••
••
III
F
(22)
.~
..
.. · .
.. · .
o 0
· . '0
· . · .
• 0
· . • • • • ...
· . ••
• • • • · . •• .. •• " ••
13
WORk.as ____ ..A..
IV V VI
M F F M F M
RURAL PIUMARY CENSUS AE81'1J,~1JT
VII
F
NON
--~---... WORItERS Code
VIII IX .x No.
U F It F 1\[ F
(23) (24) (25) (26) (27) (28) (29) (30) (31) (32) (3l) (34) (35} (36) (1)
I 1 3 4 S
41 8 4
41
6 8 5
15 2
19 13 4
31 7
14 4 1
82 4
6
39
84 26 63
61
20 14 29
15 13 4
SO
60 21 58 56 46
39 8
26 6
1 • 0
o •
4 36 47 4
11 31
3 30 1
4 38 16
1
• • ... . .
o 0
Unpop ul ated
•• • 0
• 0 •• .. • • o •
• 0 . . 5 2
• •
· . .. 3 2
Unpopulated 6
o.
7
6 2
11
2
. . Un pop u l a led · . . .
Unpopulated 1 • • •• • •
••
1 9
• •
· .
• 0
•• .. 7 •• 1 ••• •
2 8 5
22 .. 3 . .
Unpopulated
... •• o. .. • • .. . . · . •• .. .0 ..
Unpopulated
· .
· . • 0
· . O.
· . · . o •
••
· . • 0
•• · . · .
• •
• • • 0
•• · . •• . . o •
••
••
.0
. ~ . 3 4 8
2
••
42 ••
• •
••
••
•• ••
· . •• •• • •
•• 7 · . 6
•• ., •• )0 9
• 0
• •
.. •• •• ••
· . ••
•• .~.
...
.. • 0
• 0
· . ••
o • .0
• •
· . .0 •• . . ••
25 o • · . • 0
• •
• 0 1
· . 2 .. ;0 ••
1 •• 1 ..
•• ••
· .
104
· .
••
.o.
.0
4 2
66 I
2J
120 ••
. . ]4
.0
•• • • • • · . . . •• • •
O. 3
1
· . 2
· .
.. •• •• ••
•• ••
o. .0
• • •• . . · . . . · . o •
• • • • . .
2
2 3 . . 1
4 10 . .
· . 1
. . .0
.. 2
SO 17 9
67
8 65 32 8) 17
8~ J01 118 9~
105
46 59 10
216 It
47 15 21 29
115 35
106
67
46 10 9
22 21
4 29
68 136 n S9 4-1-
40 37 61 11
Il9 Jj 18
162
13 51 39 78 13
95 ]00 no 109
248
S.J 6S 12
414 16
53 16 20 31
l71 5S
J64
111
91 21 21
31 36 S
81
14) 322 18S 79
lOS
6 7 8 9
10
11 12 13 14 15
]6 11 J8 19 20
21 22 23 24 25
26 27 28 29-30
31 32 33 34 3' 36 37 38 39 40-
41 42 41 44 4S
RO 46 JO] 47 123 48
11 49-. i SO-
1.
Jjterate Sche- SchOo and
Area in Code Occupied House- dn!ed dilled lid R(~ated No. Villa.ge Amenities acres houses hoJ.ds Total Population Cru;tes Tribes persona
.,._" --. , __ __A..-~ , ,-..A...--. ,-..A...-'-l ,A, ,~..A...-__ , r-:-A -, ,_.A..-, "---A-",",,
P M F 1\1 F M F M li'
(1) (2) (2a) (3) (4) (5) (6) (7) (8) {9} (10) (11 ) (12) ttl) (l4)
51 Bandranwala Pw 13,758 51 52 300 158 142 51 52 11 •• · . 52 Kaoni P,Pw 30,784 116 119 640 349 291 72 62 .. 11 .. 53 Raimaisar* M, D. Pw. Po, Lm 30,513 168 184 l,063 547 516 131 136 •• .. tOO 21 S4 Shar:!h Barela 5,840 Unpoputated
SS Sharah Sutharan Gopalan 320 U n pop u l a t ed
S6 Sutharan Makdan 536 U"popu!ated
57 Sharah Brahmiman 389 134 134 67) 373 300 92 81 · . 73 2
58 Ratani Vyas 593 Unpopulated
59 Daiya Pw 4 ,426 26 32 lit) 70 56 24 25 · . P, Pw, Rly 25,681 160 184 •• . . · .
60 Nalbari· 1,121 579 542 184 180 • • 139 68
61 Gol Pratapsingb 4,079 Unpopulated
62 Sharuh latan 851 U npo put ated
63 Badrasar P,Pw 5,482 33 33 213 102 111 21 23 21 Pw 13,512 ••
64 Mehrasar 38 42 212 112 100 43 35 .. J 5,171 2S 25 128
•• •• 65 Bbairoo Pa wa 70 58 59 S4 · . 3 •• 66 Jalwani Noorsat P,Pw 30,571 94 98 633 3lS 298 28 27 •• 21
P,Pw 15,310 65 65 347 195 152 • • •• 67 Iltkboosar 21 23 • • · . 29 1
68 Deqogran 288 Unpopulated
69 Kalasar* P,Po 23,015 93 103 565 301 264 56 57 •• 59 7 11,244 38 44 262
•• 10 Sawaisar •• 144 118 28 2S • • 1 ••
71 Akariyala 4,027 6 6 4: 22 20 · . Pw 4,9-B 37 37 168 91 ••
72 Lalsar 77 29 26 1 P, Pw 6,346 63 63 363 186 •• ..
73 Daudsar 177 ]5 17 · . 16
74 Jagdewala P, P'\v 6,460 39 39 182 89 93 68 62 1 19 · . 1 75 Dadoosar P,Pw 14.567 88 88 482 235 247 ,)6 49 48 3
76 Rakba Jalalsar 885 Unpopulated
77 lamsllr· P, 0, Pw, RIy, Po,To 3,032 9:10 954 3,468 1,994 ) ,474 462 365 2 467 104 78 Jaldls3r P,Pw 3,820 113 114 613 320 293 104 gH 37 1
79 Khichiya Pw 4,170 31 42 231 120 I II 46 53 14 7 Shara h Dholera 2,133 Unpopulale d ••
80
81 Harkhasar Wagodan 1,340 Unpopulated
82 Dholera No.l 4,C87 36 39 209 119 90 50 33 4 83 Dholera No 2 1,404 14 15 94 47 47 · . •• .. · . 2
1.181 Un p Q put a t ~'d .' . ." 8~ Shardh Roopayat 115 Dholera MaghJi 3,056 Un pop u La ted
fI6 Dholera Pem,i , 530 Unpopulated
87 Khara Pw 14,997 ]05 114 630 326 304- 96 91 .. 29 . J#, Pw, Rly. Po 23,191 227 228 1,231 655 576 91
. . ,.. k8 Kanasar* 83 , .. 89 9 89 Sh3:cah Bh::linroo Vyas 755 Unpopulaled
. . ~ Sharah Bardi 391 Unpopulated
~1 Bhainroo Kheera 7,919 7 7 49 29 20 •• . .. 4 92 Shobhasar P.Pw 7.518 74 7S 444 218 226 10
.. •• Chak Gmbi 11,5";2 Unpopulated •• t. · .
93 94 Rughnathsar 473 Unp(JpulateR
9S Nathaniyan 10,C66 2 2 6 3 3 • • •• • • 96 Nl'l1chhoti Pw 9,469- 33 33 203 113 90 34 25 2 91 B.lsti Chaodan 2.897 4 4 32 16 16
.. . . •• ... 4
= Sharah Teliyao _ ,142 U n pop u J .a I'; d . . ••
Karmisar* P,Pw,Po 4.567 131 216 1,244 627 617 . 117 "110 •• 145 . 15 100 Blichbasar~ P,Pw IO,L91 107 108 597 319 278 95 76
. . .. •• 19 1
RURAL PRIMARY CENSUS ABSTRACT"
WORKBRS NON-r-~--------------------________ --A ____________ ------------__ ~ ______ ~VVORKERS
-rota! workers (I-IX) I II m IV
r--J.-..,--A-.. ,--A-.. r-"-, r-A--.
M PM PM FMFMF
·V
M F
VI
M F
vn VIll IX x Code No.
~ r-..A-, r---A--.. ,..----A--,,.-A--..
M F M FMF?vI F
(15) (16) (17) (lS) (19) (20) (21) (22) (23) (24) (25) (26) (27) (28) (29) (30) (31) (32) (33) (34) (35) (36) (1)
217
43 2.90
j8 76 47
202 113
178 90
17 SO 99 48
128
1.247 179 69
71 3'
192 453
18 1S3
3
68 8
~8 201
It.
166 2jO
193
4-184
452 53 26
52 49
lO~ 48
10 48 82 67
129
685 151 48
28 12
92 260
12 36
16 .. 367 41
S5 145 202
203
5 107
S5 70 46
122 107
172 51
152 238
190
4 168
61 51 26
39 49
105 48
8 ]0 36 46 28 82 29 41 97 122
87 402 56 147 4 45
49 26
168 402
18 ]51
18 2
385 • 45
27 11
92 253
12 36
16
309 46
2
20
10
2
.. .. 2
.. 1 · .
1 · .
•• · . ..
· . 1
· . 2
••
••
•.. 1
• • 1
2
.. ••
9
..
• • ••
2 1
•• 11
.. 1,007 I 79
• • 50
1 •• · .
.-. 9 • • .O'
. . -•• • •
• •
..
. .. •• · .
.. ..
••
. . ••
· .
266 · . 3
. ..
.. ,..
· . · . .. ••
.. .. ...
27 56 26
.. 29 53
3 4 1
62 4
2 24
9 13 47
2 13
19 21 14
••
14 14
• •
.. 29 4
17 21
14 2
Unpopulated Unpopulated
Unpopulated 3 •• Unpopulated . ., ..
14 8
Unpopulated Unpopulated 1
12
Unpopulated
· . 1
19 2
. . •• . .
1 .. 1
4
••
. . . .
• •
Unpopulated 6 · . •• 2
"UnpoPul"o°ted··
Unpop ulaled .. .~. .. I •• •• Unpopulated Unpopulated
Unpopulated •••• •• 5 •• U npopu lat e d Unpopulated
• • .. . . •• Unpopulated Unpopulated . . . .
. . . . . . Unpopu£ated
55 •• . . •• . . . .
. . • •
•• ••
. . . . · . · .
· . ..
•• • •
•• ••
•• • •
. . · .
.. ••
... 17
• •
• • 54
. . 1
1 12
.. 10 6 7
10 8
15 7
• • 3
• • • •
• •
••
3 -
• •
••
•• .. .
• • .. .. 1
J . .
..
••
• •
3 -
•• • • 2
3 1
60 10
3 ••
... 9 25 •• 19 2
.. 2 2 .. . .
• •
J 1 · .
8 J
1
• • 2
10 9 2
73 1 45 15 12 2 1
•• 1
•• 12 2 • •
1 •• •• • • 3 .. :. 31 2
· .. .:. ... .. • •
· . 1
••
2 ••
3
19 2 •.•
3 •• •• •• , •• 28 1
73 147 240
156
27 289
142 125 266
107
52 358
51 52 53 ~ 5' 56 57 58 59 60
44 49
61 62 63 64 65
36 41 23 32
133 82
123 54
5 41 87 41
107
747 ]41
51
42 12
134 202
11 65
45 8
219 118
246 103
159 70
66 67 68 69 70
10 71 29 72 95 73 26 74
) 18 15
16 789 77 142 78
63 19 80
81 62 82 3' 83
84 B'
86 212 87 316 88
89 90
8 91 190 92
93 94
3 95
74 96 16 97
98 250 99 231 100
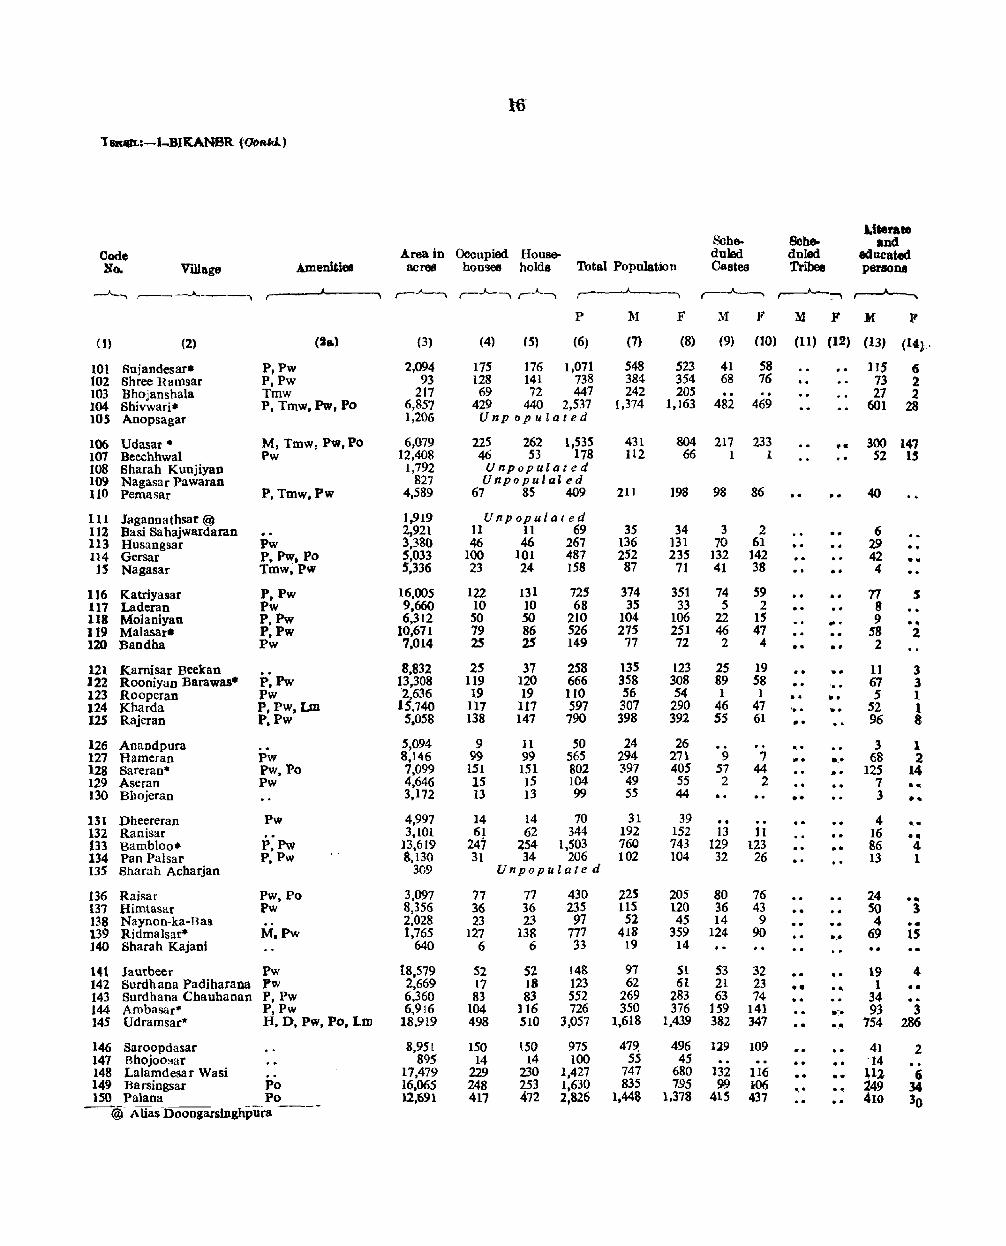
'J __ :-l-BIKANBR t~ftCd.)
.uter ... Sche- Seh. and
Code Area in Ocoupied House- duled doled educated No. Village Amenitiea acrQIJ houses holds Total Population Castes Tribes persona
~ r----.A. ,- r-~ ,-J-, ,-"-, ,-__ ..A. __ , r---.A--... ,----1'----, r--"----.
P M F M ft' M F' 1f F
(I) (2) (2a) (3) (4) (5) (6) (7) (8) (9) (10) (ll) (12) (13) (14} ..
lOt Suj andes ar. P,Pw 2,094 175 176 1,071 548 523 41 58 .. 115 6 t02 Shree R all1sar P,Pw 93 128 141 738 384 354 68 76 .. 73 2 103 Bhojanshala Tmw 217 69 72 447 242 205 27 2 104 Shivwari$ P, Tmw, Pw, Po 6,857 429 440 2,537 1,374 1,163 482 469 601 28 105 Anopsagar 1,206 Unpopulated
106 Udasar • M, Tmw, Pw, Po 6,079 225 262 1,535 431 S04 217 233 •• 300 147 107 Beechhwal Pw 12,408 46 53 178 112 66 1 1 .. 52 IS 108 Sharah Kunjiyan 1,792 Unpopulated 109 Nagasar Pawaran 827 UnpopulaZ ed IlO Pemasar P, Tmw,Pw 4,589 67 85 409 211 198 98 86 •• • • 40
III Jagannathsar @ 1,919 Unpopulated 112 Basi Sahajwardaran 2,921 II 11 69 35 34 3 2 •• 6 113 Husangsar Pw 3,380 46 46 267 136 )31 70 61 .. • • 29 • • lt4 Gersar P,Pw.Po 5,033 100 101 487 252 235 132 J42 · . 42 . .. 15 Nagasar Trow; Pw S,336 23 24 158 87 71 41 38 • • 4
116 Katriyasar P,Pw 16,005 122 131 72S 374 351 74 59 •• n s 117 Laderan Pw 9,660 10 ]0 68 35 33 5 2 .. S IlS Molaniyan P,Pw 6,3l2 50 50 210 104 106 22 15 ... 9 •• 119 Malasar. P,Pw 10,671 79 86 526 275 251 46 47 58 2 120 Bandba Pw 7,014 2S 2S 149 77 72 1 4 .. •• 2
121 Kamisar Bcekan P: Pw 8,832 25 37 258 135 123 25 19 · . •• 11 3
122 Rooniyan Barawas· 13,308 119 120 666 358 308 89 58 ' .. 67 3 123 Rooperan Pw -2636 19 19 110 S6 54 I 1 . . •• 5 1 124 Kharda P, Pw. Lm 15,740 117 117 597 307 290 46 47 ' .. .. 52 I 125 Rajeran P.Pw 5,058 138 147 790 398 392 S5 61 •• 96 8
126 Anandpura 5,094 9 11 50 24 26 .. 3 1 127 Harneran Pw 8.146 99 99 565 294 271 9 1 ... •• 68 2 128 Sareran· Pw. Po 7,099 151 151 802 397 405 57 44 ,.. 125 14-129 Aseran Pw 4,646 15 )5 104 49 S5 2 2 7 .... 130 Bhojeran 3.172 13 13 99 55 44 .. .-. 3 •• HI Dheereran Pw 4,997 14 14 70 31 39 .. 4 .. .. 132 Ranisar 3,tOl 61 62 344 192 152 13 11 · . 16 ." 133 sambloo. P,Pw 13,619 247 454 1,503 760 743 129 123 •• 86 4 134 Pan Palsar P.Pw &,130 31 34 206 102 104 32 26 · . 13 1 135 Sharah Acbarjan 309 UnpQPulate d
136 Raisar Pw,Po 3,097 77 77 430 22S 205 80 76 24 •• 137 Himtasar Pw 8,356 36 36 235 115 120 36 43 .. · . so :4 138 Naynon-ka-Has 2,028 23 23 97 52 45 14 9 .. .. 4 . . 139 Ridmalsar* M.Pw 1,765 127 138 777 418 359 124 90 0 •• 69 IS 140 Sharah Kajani 640 6 6 33 19 14 ••
14t Jautbeer Pw 18,579 52 S2 14& 97 51 53 32 .. 19 4 142 Surdh ana Padiharaoa Pw 2,669 17 18 123 62 61 21 23 .11 · .. 1 •• 143 Surdhana Chaubanan P,Pw 6,360 83 83 552 269 283 63 74 34 144 Ambasar* P,Pw 6.916 104 116 726 350 376 159 141 --:. 93 3 145 Udramsar* H. D, Pw. Po, Lm 18,919 498 510 3,057 1,618 1,439 382 347 .. . ... 754 286
146 Saroopdasar 8,951 150 l50 975 479, 496 119 109 · . 41 2 141 Bbojoo!-lar 895 14 14 100 55 45 · . · . '14 148 Lalamdesar Wasi 17,479 229 230 1,427 747 680 132 116 .. UZ (; 149 Barsingsar Po 16,065 248 253 1.630 835 795 99 106 ~. · . 249 34 ISO Palana Po 12,691 417 472 2,826 1,443 1,378 415 437 .. 410 30
__._@ Alias Doongarsinghpura -----

17
WnRICERS
Total Workers (I-IX) 1 II In IV V VI
r-~ ......---"-----. (~ ,...-A----. ~
M F M F M F M F M F
(1.5) (16) 07) (IS} ~191 (20) (21) (22) (23) (24)
285 200 121 639
312 62
112
63 218 34 134 188 )17 34 1L 28
242 170 87
122 185 37 II 60 10
81 107 81
18 18 18 18 83 53 37 S3
155 138 110 79 48 31 40 :as
210 20 6l
159 42
175 19
1 150 . .
lOS 16 44 63 042
172 8 I 5
74 2 68 2 212 J71 lSI 164
36 l~ 35 29 180 186 1i2 182 234 2.26 226 220
IS 16 168 167 193 114 33 37 35 31
20 122 436 63
12 96
390 'i8
6 16 139 151 168 214 29 33 30 29
20 93
278 2.8
71 .31 23
11 94
353 25
1
1
. .
9
1 2
1
... 2
••
1
.. •• 2
.. .. 2
23 4
.. 3
• •
•• 1 2
3
••
..
...
22
.. ._.
.. ••
.. .. ...
..
· . • •
2 6
22 39
47
2
16 2
97
80 1
27 56 4 2
"
13 72
5 20
4 5
9 21 20 4 5
4 SO 7
19 13
12
3 9
145
. . 7
3 2
15
4 2
2 3S 2
~~
M F M F
(25) (26) (21) (28)
42 .. 14 75
22 1
5
2
13 6
Unpopulated 26 . . . .
Unpopulated Unpopulated
Uupounlated
· . 2
· . '0
••
.. J .. o •
1 .. 65
Unpopulated
RURAL PRIMARY CENSUS ABBTUCT
Vll VII! IX
Nol'IWORKERS
Code X No.
,_......--, .----"---l ~.---'---. -~
M F M FMF M F
(29) (30) (31) (32) (33) (34) (35) (36) (l)
16 1
27
14 ...
13
I 4 ..
13
9 . . 3
I 2
23 2
24
It'
5
6
3
4 1 5 5 .. 69 4
83 •• 201 4D
39 S
2
. . • • •• 45 2 1
. .
..
.' ..
.. • 0
4 3
4
2 1J
. . 2 I
J 2
1 •• 1 2
.. 7 1 2
.. 2 9 2 4 1
5 • 0
35 22
263 460 ]01 184 2,W 102 121 171 lOl 735 921 104
lOS
419 682 ]06 50 55 107
JO& 109
99 Il1 110
III 17 J6 Ul 53 78 113 97 97 114 39 4() US'
164 15 43
116 3S
176 14
105 101 72
116 117 118 Il~ 120
61 121 121 146 137 122 20 25 123
127 104 :24 164 .66 US
9 ]0 126 126 104 127 204 191 128
16 18 129 20 13 136
11 70
324 39
107 61 29
27 56
353 76
III 132 133 134 135
118 14 23-
213 II
2 1
]2 176
8 161 11
2 1
]2 148 . 8 •• .. .. · . .. . 105
8
203 Il9 33
183 6
U6 137 133 139 140
64 1 4 1 43 19 38 14
156 159 145 152 180 124 116 29 7S0 S22 437 30S
26l 231 27 19
• 35 421 451 483 170 577
1$1 213 15 13
404 397 308 394 190 501
4 4
16 22
1
s ..
... 3 3 7 6
2 •• 1 2
1
· . 76
Sl1
.. 53
2
6 30 97
24 12 20 30 19
1 4
83 106
14 6 I
87 S
o • .. 10
2
· . 53
•• · ,
113
15 1
· . 17
1 42
IS
6 8
18
.. 20
. . 26
~
Z 36
11
49 I 1 1
IS 5 22 14
40 2 . .
4 2 9
18 13
33 50 19 42
ill 124 170 252 838 917
2]8 28
3]2 384 {)78
265 26
253 al2 801
141 142 '43 141 14$
146 147 148 149 150
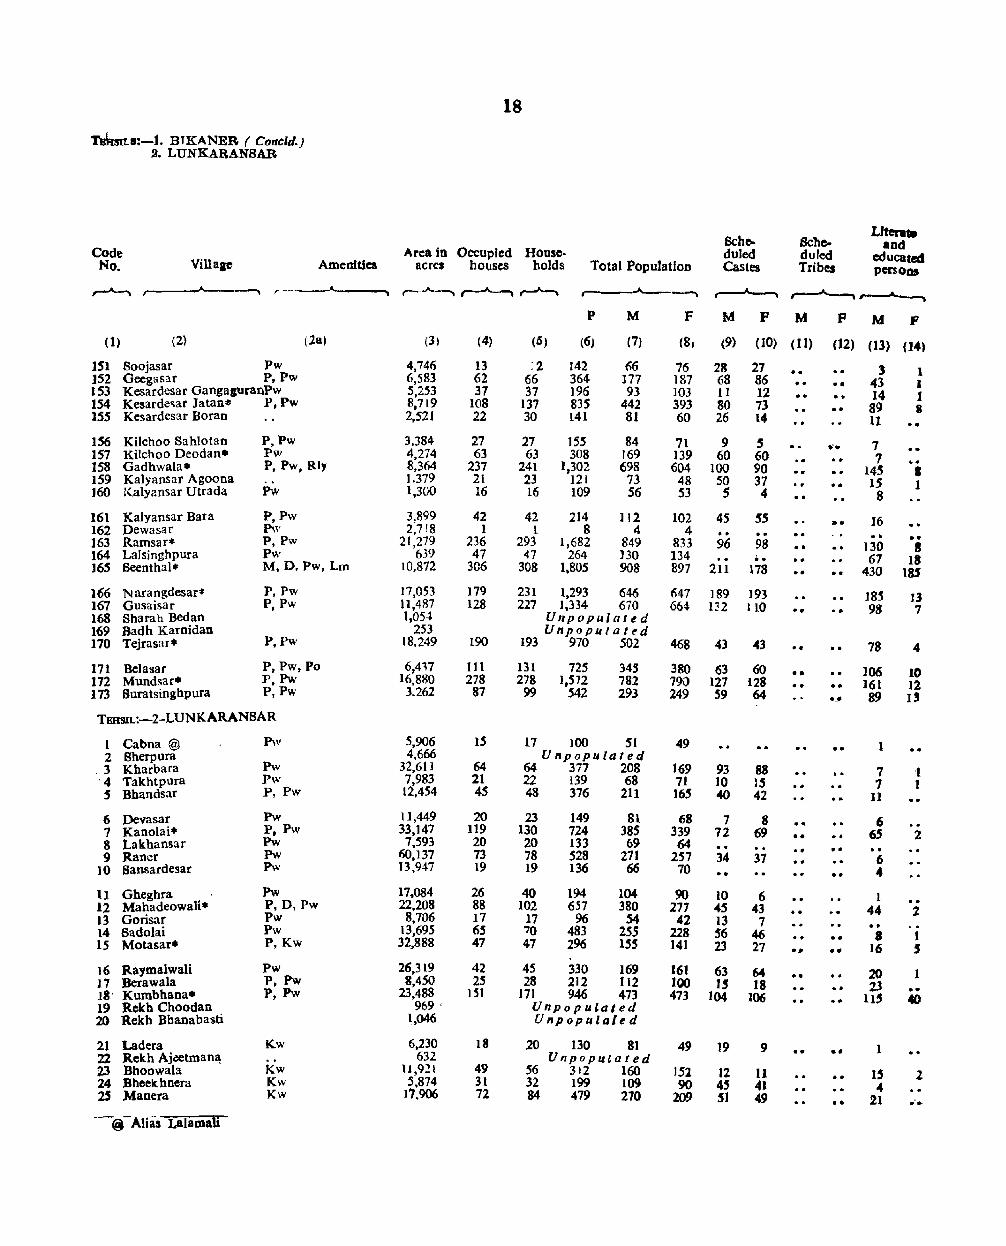
~SILI:-t. BTKANER ( Concltl.j .9. LUNKARANSAR
Code No. Village Amenfdca
~ ._~ r-'-~
(1) (2) (2a)
lSI Soojasar Pw 152 Oeegas~r P, Pw 153 Kesardesar GangaguranPw 154 Kesardec;ar Jatan* P,Pw 155 Kesardesar Boran
156 Kilchoo Sahlotan p.Pw IS7 Kilchoo Deodan. Pw 158 Gadhwala. P, Pw, Rly 159 Kalyansar Agoona 160 Kalyansar Utrada Pw
161 Kalyansar Bara P,Pw 162 Dewasar Pw 163 Ramsar* P, Pw 164 LaIsinghpura Pw ]65 Seenthal* M, D. Pw, Lro
166 'N arangdesar* P,Pw 167 Gusaisar P,Pw 168 Sharah Bedan 169 Badh Karnidan 170 Tejrasar* P,Pw
171 Belasar P, Pw, Po 172 Mundsar· P,Pw 173 Suratsinghpura P,Pw
ThHSIL:-2-LUNKARANSAR
1 Cabna @ Pw 2 8berpura
.3 Kharbara Pw '4 Takhtpura Pw 5 Bhandsar P, Pw
6 Devasar Pw 7 Kanolai· P, Pw 8 Lakhansar Pw 9 Raner Pw
10 Sansardesar Pw
11 Gheghra Pw .2 Mahade.owali • P.D,Pw 13 Gorisar Pw 14 Sadolai Pw IS Malasar. P, Kw
16 Raymalwali Pw 17 Berawala P, Pw IS- Kumbhana* P, Pw 19 Rekb Choodan 20 Rekh Bbanabasti
21 Ladera Kw 22 Rekh Aj~tmana: 23 Bhoowala Kw 24 Bheekhnera Kw 25 Manera Kw
--@-AliasLalamali
18
Area in Occupied House· acres houses holds Total Population
...---........ -~~~ ,..--Jo-----.
P M F
(31 (4) (6) (6) (7) (8,
4,746 13 :2 142 66 76 6,583 62 66 364 177 )87 .5,253 37 37 196 93 ]03 8,719 108 137 835 442 393 2.521 22 30 141 81 60
3,384 27 27 155 84 71 4,274 63 63 308 169 139 8,364 237 241 1,302 698 604 1.379 21 23 121 73 48 1,300 16 16 109 S6 53
3.899 42 42 214 112 102 2;7r8 1 1 8 4 4
21,279 236 293 1,682 849 833 639 47 47 264 130 134
10.872 306 308 1,805 908 897
17,053 179 231 1.293 646 647 11,487 128 227 1,334 670 664 1,054 Unpopulated
253 Unpopulated 18,249 190 193 910 502 468
6,417 III 131 725 34S 380 16,880 278 278 1,572 782 790
.1.262 87 99 542 293 249
5,906 15 17 )00 51 49 4,666 Unpopulated
32,61 ] 64 64 377 208 169 7,983 21 22 139 68 71 12.454 45 48 376 211 165
ll,449 20 23 149 81 68 33.147 119 130 724 38S 339 7,593 20 20 133 69 64
60,137 73 78 528 271 257 13,947 19 19 136 66 70
17.084 26 40 194 104 90 22.208 88 102 657 380 277
8.706 17 17 96 54 42 13,695 65 70 483 2SS 228 32,888 47 47 296 ISS J41
26,319 42 45 330 169 161 8,450 25 28 212 112 100
23.488 lSI 171 946 473 473 969 ' Unpopulated
1,046 Unpopulaled
6,230 18 20 130 81 49 632 Unpopulated
11,921 49 S6 312 160 151 5,874 31 32 199 109 90
17.906 72 84 479 270 209
Schc. Sche-Lftera.
and duled duled educated Castes Tribes persoQS
.. ~, ..
M F M F M F
(9) (l0) (11) (12) (13) (14)
28 27 · . 3 1 68 86 · . •• 43 I tl 12 •• · . 14 1 80 73 .It 89 B 26 14 · . 11 . .. 9 5 .-_ 7
60 60 · . 7 100 90
.. .. 14' I 50 37 · . •• 15 1 S 4 8
45 S5 .. 16 o • . . 96 98 ••
.0 130 8 . . •• · . 67 ]8 211 178 .It 430 ISS ]89 193 18S I3 132 110 · . .. 98 7
43 43 .. 78 4
63 60 •• o • 106 10 127 128 · . .. 161 12 59 64 "_. 89 I'
.. 1 .. 93 88 7 '1 10 '5 7 1 40 42 II
7 8 6 72 69 •• • 0
~ 2 .. · .. 34 37 • • 6 · . .. 10 6 1 45 43 44 2 13 7 .. 56 46 · . •• S t 23 27 •• 16 ~
. _
63 M •• 20 1 U 18 · . 23
104 106 11' 40 · . ••
19 9 ... •• 1
12 11 U 1 45 41 .. 51 49 21 • • .'.

19
r----------------------------------A-------Total workers
(I-IX) I II III IV v ~~
M F M F M F M F
VI
RURAL PRIMARY CENSUS ABST RACT
NON---------------""'1 WORKlR~
VlI VIII IX x
M F M F M F M F
Code No.
(15) (16) (17) (18) (19) (20) (21) (22) (23) (24) (25) (2(1) (27) (28) (29) (30) (31) (32) (33) (34) (35) (36) (0
48 54 47 53 100 126 54 62 . . 61 9 31 8
251 174 132 152 2 5' 20 49 1
45 to 26 118 7 9! 4 •• 419 . 309 256 219
43 20 1 J 2 37 34 14 34
67 3
52J 61
428
36 31 1
559 43-l 55 45
240 301
16
539 52
130
382 409 349 332 410 364 365 351
313 10 222 3
158 155 74 455 509 419 148 159 108
21
132 42
114
55 229
44 173
33
66 228 27
140 89
96 58
280
60
JOO 73
185
8
26 I
• 0
14
98 3(1
108
32 203
21 93 18
3 40 29 180 3 22 4 )19 6 86
I . .
. . 2 1
88 45
259
48
99 73
i84
57 ~68 122
8
]2 1
•• 2
29 3 4 6
1
2 I
• • 3 J 7
41 · .
· . 4
1
1 ••
. .
••
..
•• 2
o •
o.
1 .. . . •• 1
.. .. 31
..
... .. . .
e •
. .. ••
. . .. • •
. . 00
••
J I 45 64 30 1 86 20 2 14
19 10 15 3
22R 90 30 18 23
36 2
56 2
34
I 13
52
12 22 18
13
27 6 2
21 19 23 79 15
26 38 5
20 3
5 11
20 I
18 3
73
77 3
7
61 17 9
11
· . 1 · . · .
· . · .
2
7
10
1 2 ! 3
9 I •• Unpopulated U np 0 p u l a led
2 3
Unpopulated .. -. ..
1 . . . .
. . . . ..
2
UnpoPlllated Unpopulated
12 Unpopulated
· .
4
• 0
o.
• 0
..
16
6 3
II 6
20
17 l2
11
5 6 4
• •
3
2
. .
4
10
••
5
3
22
..
1
8
5
J3
7
15
5 29
2
5 . .
58 37
15 II ••
15
15 8 2
18 28
• 0
3
1
1 6 ••
6
1
3 2
.. 9 ••
1
18 22 151 77 6. 152 32 94 153
191 219 154 30 40 ISS
39 61 156 51 132 ]57
279 295 158 30 28 159 19 19 160
45 66 ) 3
328 274 69 79
480 657
264 238 :!60 300
189 458
187 225 327 28L ]45 90
24
76 26 97
49
1e,9 71
157
26 42 156 338 25 64 98 257 33 70
38 87 ]52 248 27 39
115 224 66 135
73 160 54 100
193 472
21 49
60 152 36 88 85 208
161 162 163 164 165
166 J67 168 169 17(}
171 172 173
I 2 3 4 S
6 1 8 9
10
11 12 13 14 15
J6 17 18 Ig-20
21 22 23 24 2S
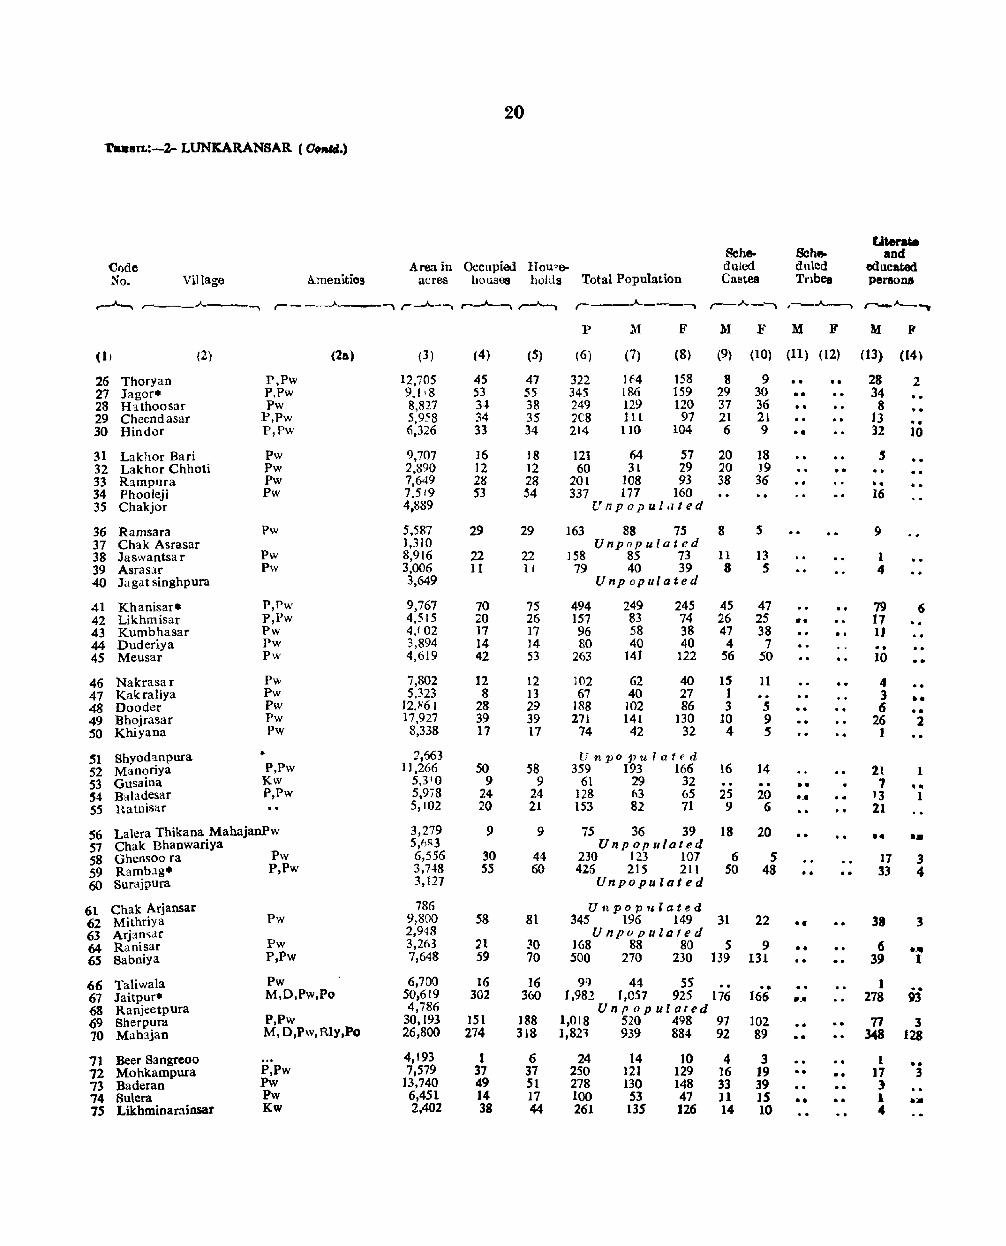
20
TuSlL:-2- LUNKARANSAR (0."*'.)
titerat. Sehe- Sche- aDd
Code Aren in Occupied IToll~e- dilled dnled educated So. Village Amenities acres houses holds Total Population Castes Tribes per&on.&
~ r-~ __ .A--, r-- """"\ r-A..-, ,....._.;.._. ,.--A-, r---.A.--~ r--.A------. ,-..A..---., r--A..__~
P .M F M F M F M If
(11 (2) (2a) (3 ) (4) (5) (6) (7) (8) (9) (10) (ll) (12) (13) (14)
25 Thoryan P,Pw 12,705 45 41 322 lf4 158 8 9 •• • • 28 2 21 Jagor. P,Pw 9.1·8 53 55 345 186 159 29 30 •• 34 · . 28 H:l.thoosar Pw 8,827 3 .. 38 249 129 120 37 36 · . 8 · . 29 Cheendasar P,Pw 5,958 34 35 2C8 III 97 21 21 13 •• 30 Hindor P,Pw 6,326 33 34 214 110 104 6 9 •• 32 10
31 Lakhor Bari Pw 9,707 ]6 18 121 64 51 20 18 · . , · . 32 Lakhor Chhoti Pw 2,890 J2 12 60 31 29 20 J9 • • . . · . 33 Rampura Pw 7,649 28 28 201 108 93 38 36 • 0 · . 34 Phooieji Pw 7.519 S3 54 337 177 160 16 35 Chakjor 4,889 U II pop u 1 ,I ted
36 Ramsara Pw 5.587 29 29 163 88 75 8 S ~ 37 Chak Asrasar ],310 Unpopulated 38 Jaswantsar Pw 8,916 22 22 )58 85 73 11 13 1 · . 39 Asrasar Pw 3,006 11 11 79 40 39 8 5 4 40 Jagat singhpura 3,649 Unpopulated
41 Khanisar. P,Pw 9,767 70 7S 494 249 245 45 47 · . 79 6 42 Likhmisar P,Pw 4,515 20 26 157 83 74 26 25 ,... 17 · . 43 Kumbhasar Pw 4,( 02 17 17 96 58 38 47 38 · . 11 . . 44 Duderiya Pw 3,894 14 ]4 80 40 40 4 7 .. . . 45 Meusar Pw 4,619 42 53 263 141 122 56 50 · . 10 ••
46 Nakrasar Pw 7,802 12 12 )02 62 40 IS 11 · . 4 47 Kakraliya Pw 5,323 8 13 67 40 27 1 3 •• 48 Dooder Pw 12)'61 28 29 188 102 86 3 5 .. . . 6 •• 49 Bhojrasar Pw 17,927 39 39 271 14l ]30 10 9 · . 26 2 50 Khiyana Pw 8,338 17 17 74 42 32 4 5 J
51 Shyod3.npura .. '2,663 Unp o 1)uiated 52 Manoriya P,Pw 11,266 50 58 359 193 166 16 14 21 1 53 Gusaina Kw 5,3 10 9 9 61 29 32 •• 7 •• 54 Baladesar P,Pw 5,9i8 24 24 ]28 (\3 65 25 20 ._. 13 1 55 Hatnisar 5,102 20 21 153 82 71 9 6 21
S6 Lalera Thikana MahajanPw 3,279 9 9 75 36 39 18 20 •• ._. 57 Chak Bhanwariya 5,f,I~3 Unp op u/ated 58 Ghensoo ra Pw 6,556 30 44 230 123 107 6 S 17 3 59 Ramb.lg· P,Pw 3,748 5S 60 426 215 211 50 48 33 4 60 Surajpura 3,127 Unpopulated
61 Chak Arjansar 786 Unpopulated 62 Mithriya Pw 9,800 58 81 345 196 149 31 22 •• o • 38 3 63 Arjan"ar 2,948 Unpopulated 64 Ranisar Pw 3,263 21 ~O 168 88 80 5 9 00 6 ._. 65 8abniya P,Pw 7,648 59 70 500 270 230 139 131 · . 39 1
66 Taliwala Pw 6,7DO 16 16 9rJ 44 55 •• I Jaitpur. M,D,Pw,Po 50,619 302 360 1,982 1,057 925 176 166
.. 67 II_. 278 93 68 Ranjeetpura 4,786 Unpopulated 69 Sherpura P,Pw 30,193 151 188 1,018 520 498 97 102 · . .. 77 3 70 Mah3.jan M, D,Pw, Rly,Po 26,800 274 318 1,821 939 884 92 89 .. 348 128
71 Beer Sangreoo 4,t93 I 6 24 14 10 4 3 .. 1 •• n Mohkampura P,Pw 7,579 31 37 250 121 129 16 19 .. •• 17 3 73 Baderan Pw 13,740 49 51 278 130 148 33 39 ) 74 Suiera Pw 6,451 14 17 100 S3 47 II IS •• o. 1 .:. 1S Likhminarainsar Kw 2,402 38 44 261 135 126 14 10 4
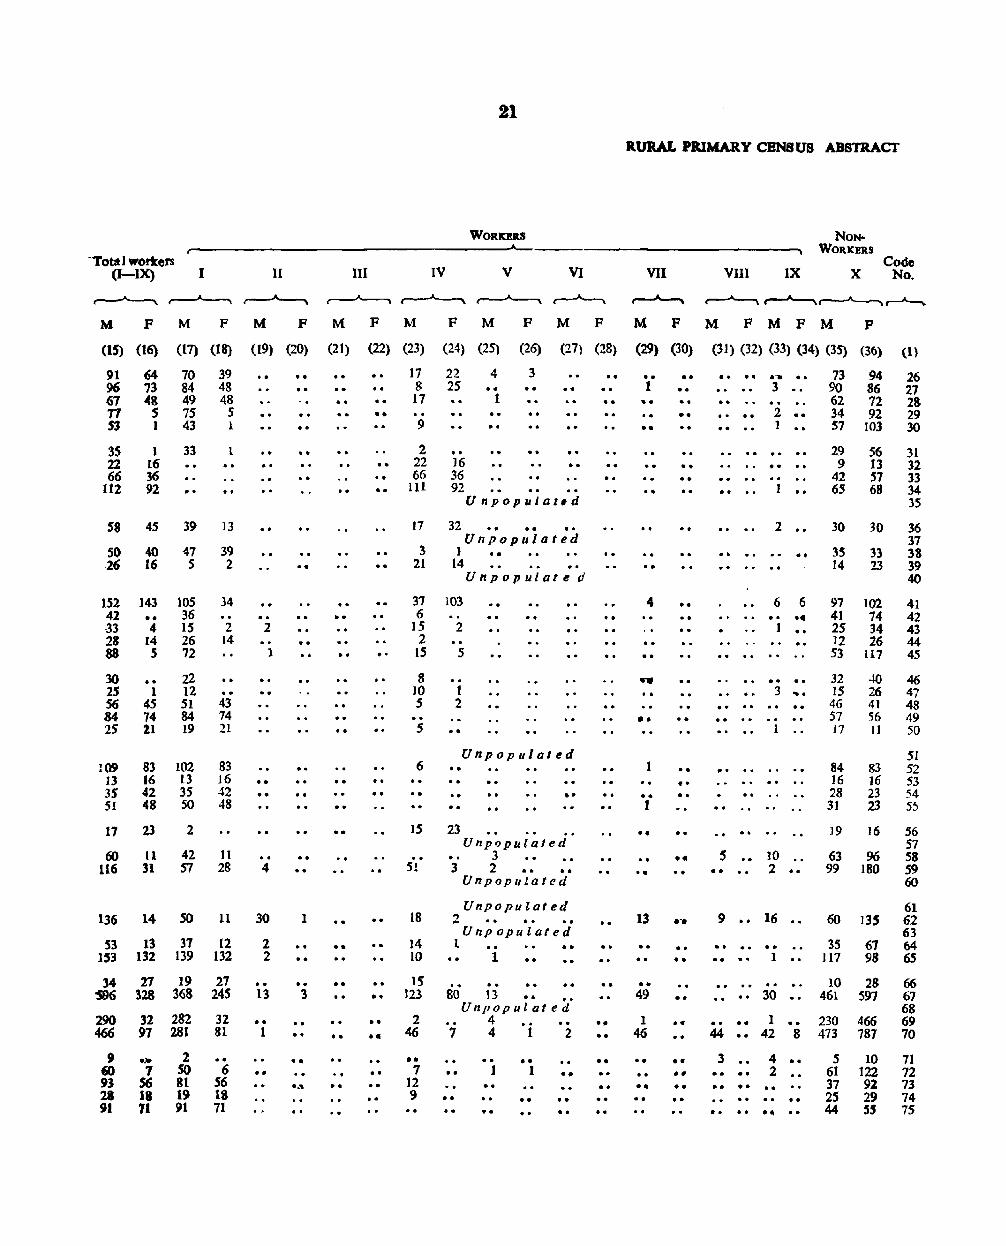
lotal workers (I-IX) I II
~~~
M F M F M F
(IS) (16) (17) (18) (19) (20)
91 96 67 71 S3
35 22 66
tl2
58
50 -26
152 42 J3 28 ~
30 2S 56 .84 25
:09 13 35 51
17
60 116
64 73 48
S 1
1 16 36 92
45
40 16
143 •• 4
14 S
•• I
45 74 21
70 84 49 75 43
33
. . 39
47 5
105 36 IS 26 72
22 12 51 84 19
83 102 16 13 42 3S 48 50
II 31
2
42 57
39 48 48
5 1
1
13
39 2
34
2 14
43 14 21
83 16 42 48
n 28
136 14 SO II
53 13 37 12 153 132 139 132
34 'S96
290 466
9 Q) 91 21 91
rr 19 328 368
32 282 97 281
•• 7
56 18 11
2 SO 81 19 91
27 245
32 81
. . 6
S6 18 71
'0
· .
· . 2
1
· .
. .
4
30
2 2
. . 13
o •
1
••
• •
o.
• 0
• 0
••
· .
· .
1
· . 3
• • ....
21
WORDIlS
III IV V VI
~~~r--'--.
M F M F M F M F
(21) (22) (23) (24) (25) (26) (27) (28)
· . . . ••
• • .. ..
. . · .
.. ..
• 0
• • .. ••
••
•• .. ••
•• • • .-.
. . •• ..
o •
]7 8 17
9
2 22 66 III
17
3 21
22 25
.. 16 36 92
4 3 •• • • ..
1 . . . . .0 • 0
••
U npopuJat,d
32 •• •• •• Unpopulated
J •• 14 .0
Unpopulate d
37 103 6 . .
]5 2 2
IS 5
8 10 5
5
6
.. 15
18
14 10
lS )23
2 46
•• 7
J2 9
1 2
· . • • • 0
· . 23
Unpopulated
••
Unpopulated '0 3 3 2 ••
Unpoputa ted
Unpopulated 2, • • ••
Unpopulated 1 ••
1 •• .. · . . . .. ..
80 13 •• •• Unpopulated
4 7 4 • i 2
•• . . 1 I •• ••
•• • • •• •• •• ..
.. •• ..
.. • 0
· .
· . • •
. . •• • •
• •
•• ..
RURAL PRIMARY CENSUS ABSTRACT
VII
\
M F
(29) (30)
•• I ... ••
· . .. · . · . 4
· . · . · . ••
1 . . .. t
•• . . .. 13
.. . . • • 49
1 46
•• . . ••
•• . . . . • •
•• . . .. · .
•• o • · .
..
•• •• · . . . ... o •
.-.
. . ••
• •
•• . . • • •• •• . .
VIII IX
NONWORKERS
X Code
No.
~. 4 ,~~
M FMFM P
(31) (32) (33) (34) (35) (36) (1)
· . . . ........ 3 . . .. 2 •• · . 1
• • . .
2 o. · . •• . .
6 6 •• . .
.. 3 .. 0 · . . . . . · . ]
.0
· . 5 10
•• 2 ••
9 16
· . •• . . 1
30
•• 8
3 4 •• • • 2
•• • • . . •• . .. ,.
73 90 62 34 57
29 9
42 65
30
3~ 14
94 86 72 92
103
S6 13 57 68
30
33 23
97 102 41 74 25 34 12 26 53 il7
32 IS 46 57 17
84 16 28 3]
.to 26 41 56 I J
83 16 23 23
]9 16
63 96 99 180
60 135
35 61 117 98
10 28 461 597
230 466 473 787
5 61 37 2S 44
10 122 91 29 55
26 27 28 29 30
31 32 33 34 35
36 37 38 39 40
41 42 43 44 45
46 47 48 49 50
51 52 53 54 5~
56 57 58 S9 60
61 62 63 64 65
66 67 68 69 70
71 72 73 74 7S

TtrnSIL:-2-LU'NKARANSAI. (C6nf".,
Litera"" Seho- Sohe- and
Code Area in occupied House. duled duled eduoated
No. Village Amenitie. 6,('res houses holds Total ropulation Castes Tribes persons
t'..A..-.,_ r----.A..--.. r-----..A..---~ r--..A.._-.., ,.---"-, ,.A---" , ___ A __ -, ,.-_..A.-_, r-..A..--, r--.A._ ..
p AI F M F M F M F
(I> (2) (2a) (3) (4) (5) (6) ('I) (8) (9) (10) (11) (12) (13) (14)
76 Delana Chhota Pw 8,289 6 6 28 18 10 " . . . 77 Delana Bara P,Pw 12,520 64 74 418 243 17S 57 49 . " 50 .. 78 Rekh Meghana 2,073 Unpopulated
79 Fhooldesar P,Pw 4,895 81 81 464 235 229 28 33 16 .. " 80 Khokhrana* P,Pw 12,62.0 103 109 599 319 280 117 107 .. 46
81 :8irbana Kw 4,050 38 44 318 166 152 71 72 12 82 Motalai P,Kw 12,413 M 66 507 270 237 3t 30 27 .. 83 Lakhawar Pw 7,593 21 27 215 103 112 5 " . 84 Ajeetmana P,Kw 3,995 70 71 470 246 224 76 72 28 1
85 Kamali Kw 4,069 8 8 57 16 31 I o •
86 Ambaran 6,414 Unpopulated 87 Rajasar Bhatiyao. P,Kw 3(.,810 176 181 1,032 555 477 159 151 76 7 88 Kunda .. l' .403 4 4 26 15 11 2 89 Kelan P,Pw 35,479 192 202 1.297 689 608 85 82
0"
55 1 90 Sardarpura " . 22,013 29 29 183 98 85 •• S •• 91 Makrasar P,Pw 8, 1I2 79 101 590 292 298 50 46 .0 90 7 92 Binjarwali P,Pw 13,563 59 67 344 20l 143 96 94 .0 ._- 7 •• 93 Musalki Pw 3,020 23 23 115 59 S6 94 Sobhalai p,Pw 4.794 57 59 357 190 167 35 33 '.
23 ..• 95 Khileriya P,Pw 6,560 56 60 348 186 162 15 9 23 ... 96 .Aloda • 0 2li91 3 4 25 12 13 3 6 3 97 Bhobiya @ 1,394 Unpopulated 98 Lalera Patta Khinyera Kw 3,579 12 12 97 52 45 13 9 .. 7 99 Ganta 4,000 1 1 4 4
.~
• 0 o • . . 1 100 Bhojawas 2,347 Unpopulated
101 Sarah Hameerwas I.R5~ Unpopulated 102 Udesiya Pw 2,~·~9 ]9 19 113 61 52 73 26 103 Sarah B oochawas 1,9H Unpopulated 104 sarah Netawas 9SG l' n pop U l ate d 105 Unchaira Tk 3,7 j 2 1 9 42 26 16 •• 1 o.
106 Sarah Khatiyawas 1,083 Unpopulated 107 S'lrah Beechharwas 1, "765 Unpopulated 108 Kheenyera P,Pw 4,743 98 108 650 35~ 296 182 180 93 9 109 Bhadwan Kw 4,165 39 45 263 134 129 19 23 o. 24 1 110 Muklera 1,874 2 2 12 5 7 2 2 • 0 -_-111 Doodiwali Pw 2,705 43 48 304 161 ]43 11 12 12 ... 112 Bodhwali. r, Kw 13,~·it) 52 61 339 189 150 40 38 • • 8 .. 113 Haphasar Pw 10, '99 30 31 148 79 69 4 4 .. •• . . 114 Kistoor-iya Pw 9,952 17 17 38 27 It 11 o. o • 4 115 B.lmanwali p.Pw 4,333 44 57 283 147 136
. .. 19 13 36 1
It6 Jaisa (',059 38 45 231 122 109 15 l3 26 1 117 Mahrana P 2,970 15 16 80 46 34 I 1 11 3 118 Sad hera 3,°55 7 7 56 27 29 3 1 119 Dheerera* P, RIy, Po, To 3,821 54 56 298 143 155 27 24 35 I 120 Uttamdesar Pw 8,036 72 79 319 191 188
.. 29 26 o • 47 S
121 Dulmera P, Pw, Rly. Po, To 7,510 79 120 602 337 265 ... , 62 121 27 I- • 0
122 Hansera Kw 7,837 54 61 2Rl 158 123 36 34 .. 22 :2 .. 123 Khari P,Pw 7,133 70 90 458 231 227 31 40 45 3 124 Kujti* P,Pw IS,05S 62 71 357 192
.~
165 25 28 42 I 125 Kakar lchha 3,117 Unpopulated
@r'Alias-Ratanpura

23
aURAL PRIMAR.Y CEN8US ABSTRACt
WORJCnS NON-
~------------------------.... ----------~--------------------------------~ ~oaKERs -Total worken Code (l-JX) I n m IV V VI vn VUI IX X No, ,.., __ .A~_.... ,--~
~ ,'-___'.&'---~~r-~
p M F M F M F M F M F M P (IS) (16) (17) (18) (19) (20) (21) (22) (23) (24) (25) (26) (27) (28) (29) (30) (31) (32) (33) (34) (35) (36) (I)
11 139
170 177
91 134 75
J31 18
338 12
-424 59
184 110 36 91
Itl
.8
27 .. 37
14
182 71 3
• 26
. . 9S
53
38 107
10
138
315 42
lOS 75
4 61
3
a
9 118
162 173
76 112
73 127 13
230 6
302 41
137 ]09 33 81
104
3
14 4
18 24
9 11
14 132 12 64 2 2
- 86 68 83 117 23 117 41 37 34 .8 2 7 80 64 70
81 26 16 8!J
]32
J78 ~
131 113
64 23 17 83 73
78 23 15 68 65
90 30 36 48 16 100 SI 92
8 25
94
53
38 101 10
135
3e8 42
100 74
4 61
3
18
8
8 12
2
68 23 33 2
6]
64-23 17 43 38
78 33 16 36
••
2
..
. .
••
7
2
. .
. .
.... . .
.. •• ..
.. 4 ...
2 ••
2 19
S J
12 22
2 3 5
67 6
100 18
35 1 3
10 5
8
6
2
40 4 1
2
J 2 I
16 )4
26 14
22 20
. . . -. 1 •• . • Unpopulated
•• ••
• • .. .. .. . .
Unpopulat~d 2 9
.. . . . 4 3
•• 5 I
. .
.. . . ..
Unpopulotpd 3 5
J
Un p' 0 p ,; i • t e·d Unpopu loted .. Unpopulated Unpopulated
•• Unpopulated Unpopulated
4 I 1 1
..
.. 40 35
8
..
. .
..
2
3 IS .. Un"opular.~d
..
..
5
••
." • • .. 1
11
13 .. 4
. _. ••
.5 3
..
7
34 2 2
..
. . ..
.. I
..
..
.~
..
.. .
•• .. . . .. .. . . · . . · .
• • . .
• • • •
. .
. .
.. . .
2 ••
3 •• 2 1
2
._. ._ . 1 •• ..
21 1 •• 6
8 ••
••
3
••
1
3
... ... 8 3 •• 5 2 ••
44
24 4 5
) .. 1 . . 1 3
.59 4 26 2
4 I
7 2 104 149
65 229 142 18'
74 99 136 231 28 74
liS' 117 8 21
217 3
265 39
108 91 23 99 7S
339 JJ
293 43
193 68 56
163 101
16 77 78 79 80
81 82 83 84 85
86 87 88 89 90
91 92 93 94 95
4 10 96 91
25 37 98 99
100
101 24 34 102
103 104
12 7 105
106 107
172 282 JOB 63 117 109
2 , 110
15 15 Jll 72 127 112 38 32 113 9 9 Jl4
67 72 US
41 20 11 58 58
45 1 J 12 72
115
116 117 11. 119 120
159 175 III 64 87 122. 93 21 I 123 79 JJ4 124
]25

24
T.HSIL:-2-LUNKARANSAR (Colldd. t
Literate I3chc- Sche- and
Code Area in Occupied House. duled duled educated No. Village Amenities acres houses hold~ Total Population Castes Tribes persoDl
,.-. ....._'"""\r---~ ~~-. ~ ~ ,---I'---, ~7
P M F M F M F M P
(J) (2) (2a) (3) (4) (5) (6) (7) (8) (9) (10) (11) (12) (13) (14)
126 Sumana p.Pw 8,246 94- 107 696 362 334 79 78 62 I 127 lakharwala 3,014 Unpopulaled J28 Lunke: ransar. M,D, V ,Pw.Rly ,Fo,LIn 23,575 3j9 468 2,791 1,453 1,338 194 184 668 284 129 Rojhan. Kw 6.291 52 52 344 180 164 28 34 3 .. 130 Seniwala Kw 5,576 24 28 145 82 63 .. 9 -.. 131 Udana Kw 7,589 8 8 57 28 29 .. 2 131 Kakarwala. P,Pw 13,425 80 83 516 291 225 40 37 49 1 133 Tejaua 5,299 Unpopu/att d 134 Bhandera Pw, Po 7,890 36 36 224 111 113 39 30 ""iii 9 .~ 135 bhom Malkisar 3,4.21 Unpopulated
136 Peepcra P,Pw 5,362 76 88 492 280 212 49 42 91 J3 131 Malkisar P, Pw, Rly. Po 17,370 112 121 694 371 317 59 54 50 6 138 Sooi* Pw 23,965 110 119 764 399 365 132 128 •• 0 5'9 5 139 Dulchasar Pw 8,639 3S 35 222 105 117 30 35 .. 5 I 140 Bakhoosar Pw 4,96' 46 49 263 140 123 45 44 17 •• 141 Shekhsar· M,D, Pw 22,753 247 262 1,629 852 777 130 121 264 46 142 Kapoorisar. M,Pw 12,111 129 1St 946 496 450 166 21 143 Goplan· P,Pw 12,011 52 62 342 !S1 ISS 32 23 46 IS 144 Nathwana P,Pw 6,935 115 134 800 422 378 81 75 100 .. 145 Kisnasar P,Pw i2,031 48 52 329 158 J7J 27 23 48
146 Kalwas Pw 5,713 33 34 182 99 83 26 23 9 147 Uch.hrangdesar Kw 4,307 21 26 87 41 46 19 21 3 • • 148 Jogiyasan Pw 1,121 57 62 403 220 183 .. 34 3 l49 Basti Delwan 1,179 21 21 136 72 64 12 · . J~ Kalkal Mulclera 3,582 Unpopulated
151 Sahajrasar P,P", 20,015 146 183 931 492 439 lOS 94 82 6 152 Basi Chaman 4,811 Unpopulated 153 Bbanipura 3,558 Unp opula Ie d 154 Adsar Pw 10,403 67 79 403 2'1 182 44 35 29 8 155 Rawansar· P,Pw 4,J54 40 42 189 JOt 88 21 18 34 3
156 Karnisar 759 7 8 40 21 19 1 .. l2 f 151 Nathoosar Pw 5,541 28 32 180 94 86 29 26 6 .. J58 Chatldsar Pw 2,540 17 19 91 40 51 14 6 10 .. 1S9 Nakodesar Pw 6,694 68 74 264 149 115 40 29 . ~ 26
Khafarsar Pw 2,661 f1 86 4() 40 • • 160 12 7
161 Koobiya 3,016 UnpopulGfl H2 Garabdesar* P,Pw 22,243 124 148 856 446 410 l66 154 99 21 163 Kaloo. H. D, Pw. Po 32,910 589 638 3,669 1,794 1,875 158 153 780 '12 J64 Rajpura Hudan Pw 8,890 60 72 387 201 186 77 73 .~. 10 1 165 Manafarsar P,Pw 3,377 58 62 341 176 165 26 29 22 2
166 Dheerdan Pw 10,014 45 S4 247 132 115 23 15 42 3 161 Pachara @ 1 P,PW 11,227 83 85 472 245 227 30 25 69 6 168 Pandoosar P,Pw S,165 81 90 521 270 251 34 29 71 , 169 Rajesar*@ 2 p. D, Pw 12,889 120 no 753 378 37' 85 76 51 S 170 Chhatasar P,Kw 7,834 35 39 252 lI8 134 .!3 31 •• 39 S
17l Kagasar P 5,750 36 39 270 ISO 120 13 7 .~ 42 .' {!y j Alias Amarpura. @ l Alias Karnlsa'
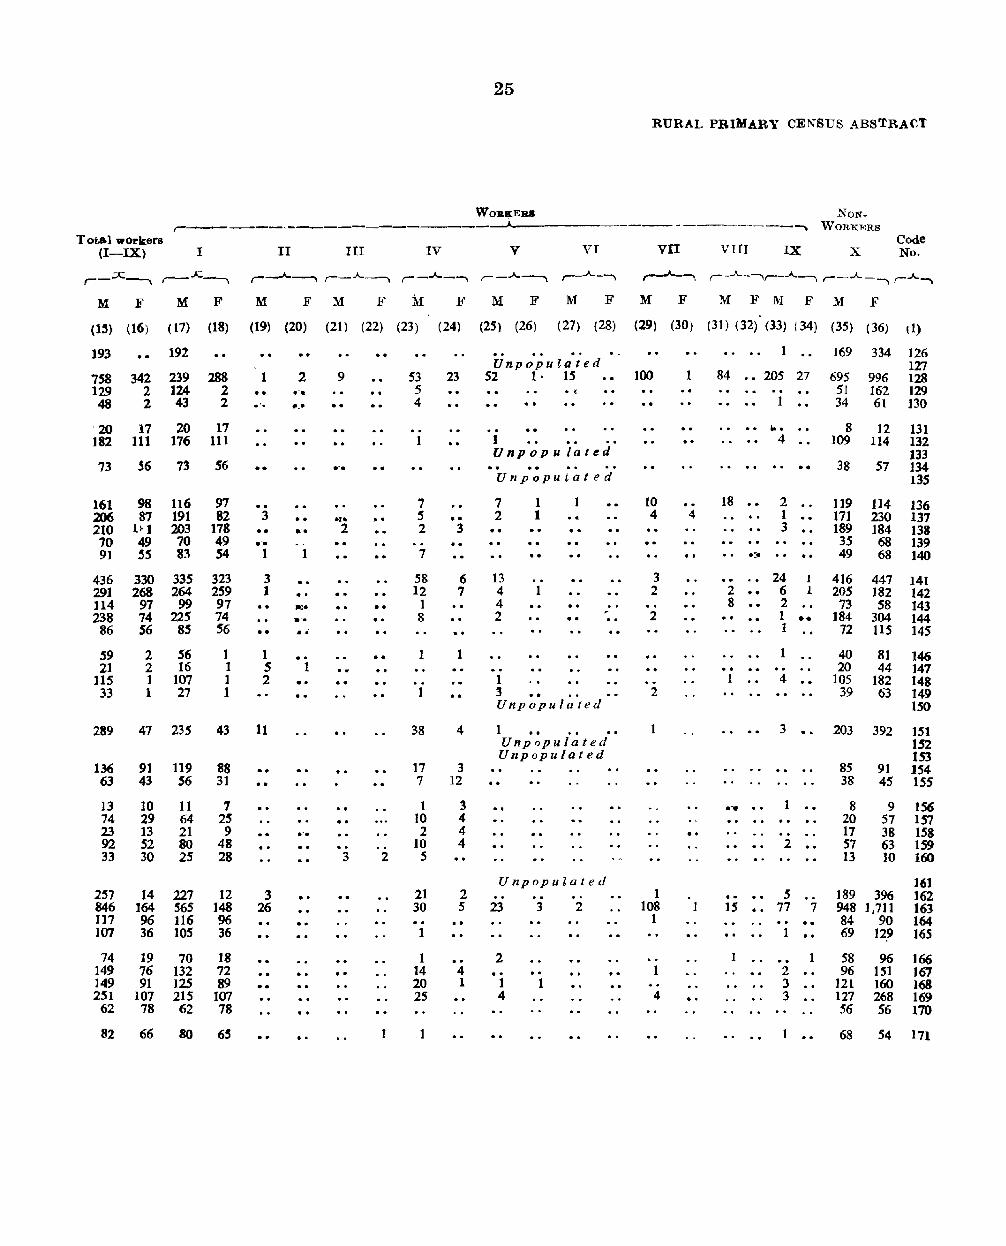
Total workers (I-IX)
M F
,'--I
M F
II
M F M
25
III IV v
F If M
VI
F M
RURAL PRIMARY CENSUS ABSTRACt
~ON-----'-----~ WORKERS
vn VIII IX x
F M F M F l\i F M F
Code No.
(IS> (16) (17) (I8) (19) (20) (21) (22) (23) (24) (25) (26) (27) (28) (29) (30) (31) (32) (33) (34) (35) (36) 11)
193
758 129 48
.. 342
2 2
192
239 288 124 2 43 2
'20 17 20 17 182 111 176 111
73 56 73 S6
161 98 116 97 206 87 191 82 210 1~1 203 178 70 49 70 49 91 55 83 54
436 330 335 323 291 268 264 259 ll4 97 99 97 238 74 225 74
86 S6 8S S6
59 21
115 33
289
136 63
2 S6 2 16 1 107 1 27
1 I 1 1
41 235 43
91 119 88 43 56 31
13 10 11 7 74 29 64 2S 23 13 21 9 92 52 80 48 33 30 25 28
257 846 117 107
14 227 164 565 96 116 36 105
12 148 96 36
74 19 70 18 149 76 132 72 ]49 91 125 89 251 107 215 107
62 78 62 78
82 66 80 6S
1
. '.
••
3 •• .'. I
3 1 · . · . 1 5 2
11
..
· .
3 26
2
.,.
• • . ' . · '
1
.::. _'. · .' 1
• •
.-.
. .
9
.-. . .
..
..
.. 3 2
..
..
I
53 5 4
1
7 5 2
7
58 12
1 8
1
1
23
.. 3 . . 6 7
1
38 4
17 3 7 12
1 10 2
10 5'
21 30
1
I 14 20 25
3 4 4 4
2 5'
4 1
Unpopulated 52 1 . 15 . ~ . .
1 Unpop u lated . . Unpoputated
7 2
• •
13 4 4 2
1
1 I
1
1 · . · .
· . ••
3 Unpopulated
1 Unpopulated Unpopulated
..
Unpopulated
23
2
1 4
..
3 2
1
100
..
10 4
3 2
2
2
1
1 108
1
1
4
1
..
4
..
1
84 •• 20S 27
1
169 334 126 127
695 996 128 5I 162 129 34 61 130
... 8 12 131 4 109 114 132
133 •• 38 57 134
135
18 2 119 114 136 I 3
171 230 137 189 184 138 35 68 139 49 68 140
24 I 2 •• 6 1
416 447 141 20S 182 142
8 2 73 58 143 1 .,. 1
1 .. 1 4
3
.-. 2
5
184 304 144 72 115 145
40 81 146 20 44 147
105 182 148 39 63 149
150
203 392 151 IS2 153
85 91 154 38 45 155
8 9 156 20 57 157 17 38 158 57 63 159 13 10 160
]5 •• 77 7 189 396 948 1,711 84 90 69 129
161 162 163 164 165
I
••
1 58 96 166 2 96 151 J67 3 121 160 l~ 3 127 268 169
56 56 170
68 54 171
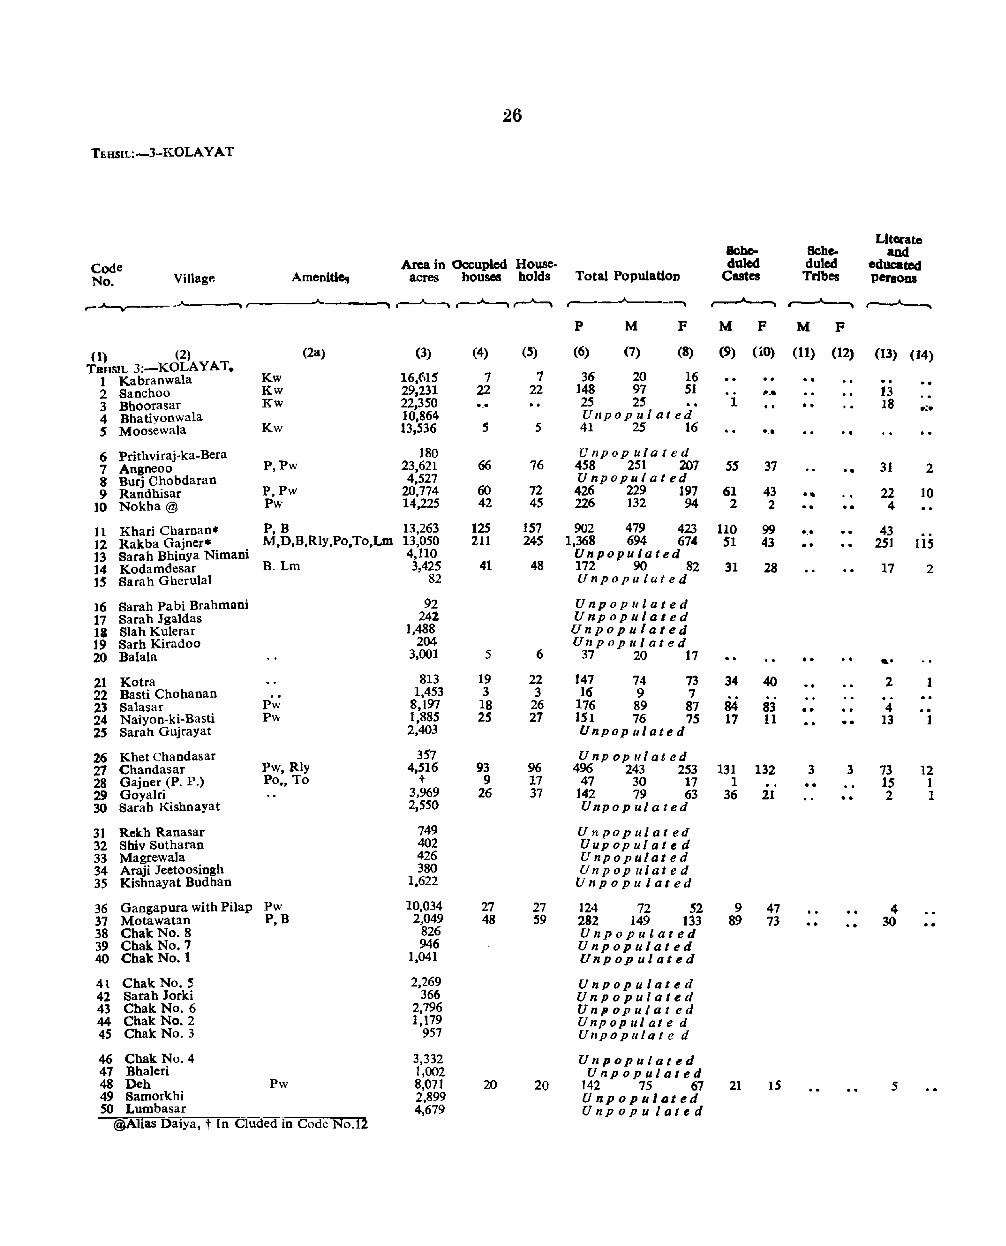
26
TEHSIL:-3-KOLA Y A T
LltCl'ate Iche- Sche- and
Code Area in Occupied House- duled duled educated No. Village': Amenities acres houses holds Total Population Castes TrIbes per,ODS
.-~ .A • ..... -~.--'--~ ~~ ~ ,.-----"-~-""'"'I A r---"----t ~ • r
P M F M F M F
(I) (2) (2&) (3) (4) (5) (6) (7) (8) (9) (iO) (11) (12) (13) (14) TBHSIL 3:-KOLAYAT.
Kw 16.615 7 7 36 20 16 1 Kabranwala ° " . " · . Kw 29,231 22 22 148 97 51
'0
2 Sanchoo "' .. 13 3 Bhoorasar Kw 22,350 o_" 25 25 1 · . 18 ..::. 4 Bhativonwala 10,864 Unpopulated 5 Moosewala Kw 13,536 5 5 41 25 16 0 .• · . 6 Prithviraj-ka-Bera 180 Unpopulated 7 Angneoo P,Pw 23,621 66 76 458 251 UJ7 SS 37 .. 31 2 8 Burj Chobdaran 4,527 Unpopulated 9 Randhisar P,Pw 20,774 60 72 426 229 197 61 43 •• 22 10
10 Nokha @ Pw 14,225 42 45 226 132 94 2 2 · . o. 4
11 Khari Charnan* P,B 13,263 125 157 902 479 423 110 99 0." 43 12 Rakba Gajner* M,D,B,Rly,Po,To,Lm 13,050 211 245 1,368 694 674 51 43 • • • • 251 I1S 13 Sarah Bhinya Nimani 4,110 Unpopulated 14 Kodamdesar B. Lrn 3,425 41 48 172 90 82 31 28 17 2 l~ Sarah Gherulal 82 Unpopulated
16 Sarah Pabi Brahmani 92 Unpopulated 17 Sarah Jgaldas 242 Unpopulated 18 Slah Kulerar 1,488 Unpopulated 19 Sarh Kiradoo 204 Unpopulated 20 Balala 3,001 5 6 37 20 17 • • ._.
21 Kotra 813 19 22 147 74 73 34 40 2 1 22 Basti Chohanan 1,453 3 3 16 9 7 2) Salasar Pw 8,197 18 26 176 89 87 84 83 ._" 4 .. 24 Naiyon-ki-Basti p\\ 1,885 25 27 151 76 7S 17 n •• 13 1 2S Sarah Gujrayat 2,403 Unpop ulated
26 Khet Chandasar 357 Unpopulated 27 Chandasar Pw, Rly 4,516 93 96 496 243 253 131 132 3 3 73 12 28 Gajner (P. P.) Po., To t 9 17 47 30 17 1 •• 15 1 29 Goyalri 3,%9 26 37 142 79 63 36 21 • • 2 1 30 Sarah Kishnayat 2,550 Unpopulated
31 Rekh Ranasar 749 Unpopulated 32 Shiv Sutharan 402 Uupopulated 33 Magrewala 426 Unpopulat ed 34 Araji Jeetoosingh 380 Unpop ulated 35 Kishnayat Budhan 1,622 Unpopu Zated
36 Gangapura with Pilap Pw 10,034 27 27 124 72 52 9 47 4 37 Motawatan P,B 2,049 48 59 282 149 133 89 73 .0 • 0 30 38 Chak No.8 826 Unpopulated 39 Chak No.7 946 Unpopulated 40 Chak No.1 1,041 Unpopulated
4l Chak No. S 2,269 Unpopulated 42 Sarah Jorki 366 Unpopulated 43 Chak No.6 2,796 UnJlopulat ed 44 Chak No.2 1,179 Unpopulate d 45 Chak No.3 957 Unpopulate d
46 Chak No.4 3,332 Unpopulated 47 Bhaleri 1,002 Unpopulated 48 Deh Pw 8,07] 20 20 142 75 67 21 15 5 49 Samorkhi 2,899 Unpopulated 50 Lumbasar 4,679 Unpopu laled
@AIias Daiya, t [n Cluded in Code No.12
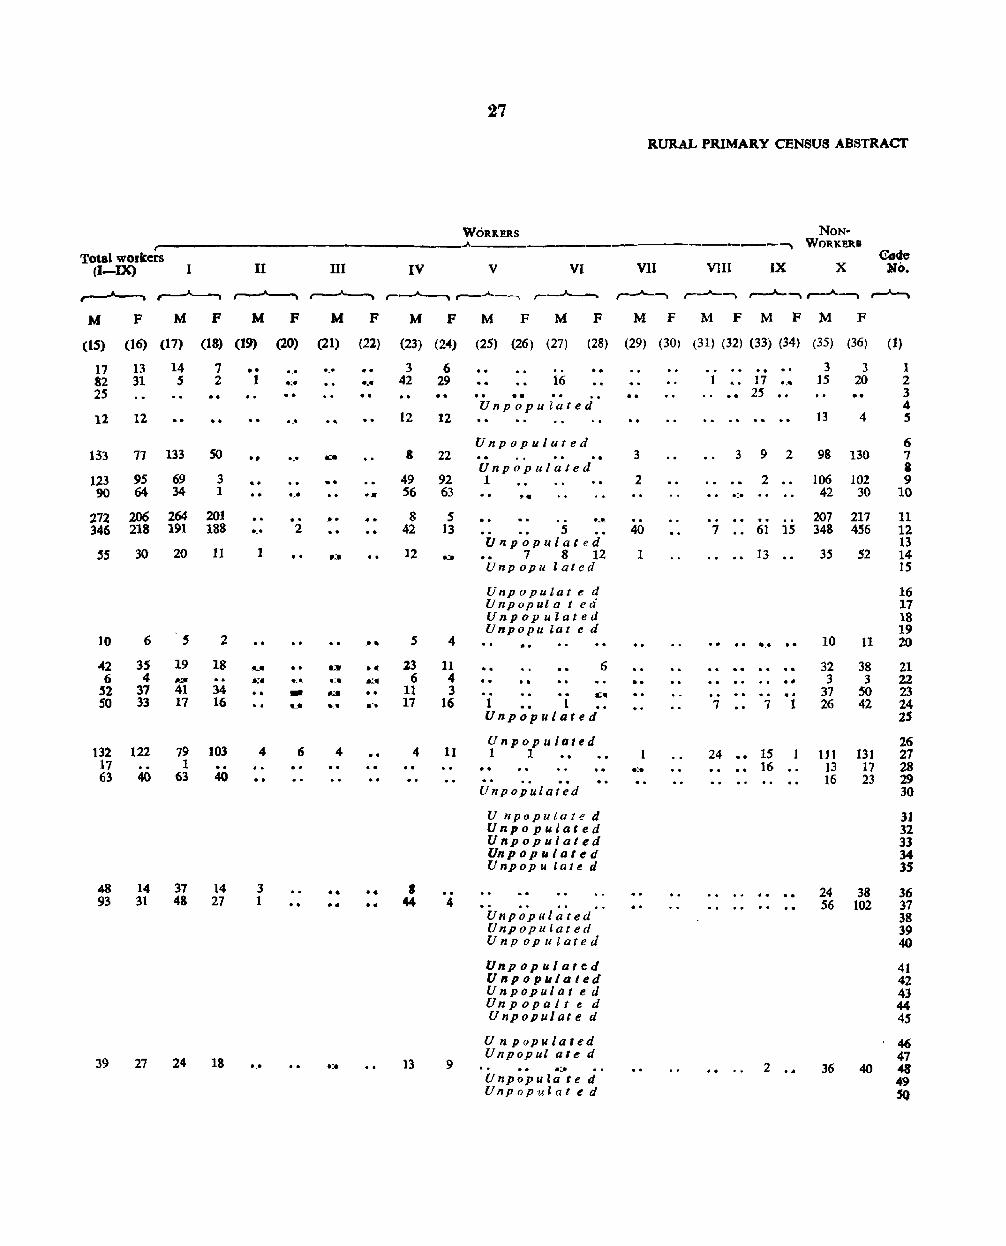
Total wOlters (I-IX) 1 II III IV
II , M F M F M F M F M F
27
WORJlERS
v VI
M F M F
RURAL PRIMARY CENSUS ABSTRACI'
'--------~
VII VUJ IX
NONWORKERS
x
M F M F M F M F
GJ4e No.
(15) (16) (17) (18) (19) (20) (21) (22) (23) (24) (25) (26) (27) (28) (29) (30) (31) (32) (33) (34) (35) (36) (l)
17 13 14 82 31 5 2S
12 12
133
123 90
71 133
95 69 64 34
7 2
'0
so 3 1
272 206 264 201 346 218 191 188
'S 30 20 11
10 6
42 35 6 4
'2 37 50 33
132 122 17 63 40
S
19 .. .:. 41 17
2
18
34 16
79 103 1
63 40
48 93
14 31 14 31 48 27
39 27 24 18
•• 1
.,.
. .
'.'
1
..
. . .. 4
3 1
'.'
'.' . ';_.
._.
'.'
' .. · . 2
· .
· . e_" -... 6
. .
.. .. .. . .
.. ._ .~ ...
.."
4
•• ..
.:.
..
•• .~ .. .. •..
•• ••
3 6 42 29
• • 12 12
8
49 S6
8 42
12
5
23 6
11 17
4
S 44
13
22
92 63
S 13
4
11 4 3
16
11
4
9
•• 16
•• • • Unpopulated
Unpopulated .. Unpopulated 1 ...
._e. 5
Unpopulated 7 8 12
Unpopu la/ed
Unpopular e d Unpopul a t ed Unpopulated Unpopu lat e d
.. . . . .. . .. 1 1 Unpopulated
Unpopulated 1 1 •• ..
Unpopulated
U npopulate d Unpopulated Unpopulated Un pop u I ate d Unpopu late d
Unpop ul a ted Unpopulated Unpopulated
6
Unpopulated Unpopulated UnpopuJat e d Unpopalt e d Unpopulate d
Unpopulated Unpopul ale d .:. Unpopula te d Unpopulat e d
3
2
40
1
..
1
. .
7
7
17 .... •• 2S
.. 392
2 .~ .
3 3 15 20 .. 13 4
98 130
106 102 42 30
207 217 61 IS 348 4S6
13 35 52
. . ... . . . ... . .
7 1
10
32 3
37 26
11
38 3
50 42
24 •• IS 1 111 131 •• 16 13 17
16 23
24 38 56 102
1 2 3 4 S
6 7 a 9
10
11 12 13 14 15
16 17 18 19 20
21 22 23 24 2S
26 27 28 29 30
31 32 33 34 35
36 37 38 39 40
41 42 43 44 45
46 47
2 •• 36 40 48 49 SO
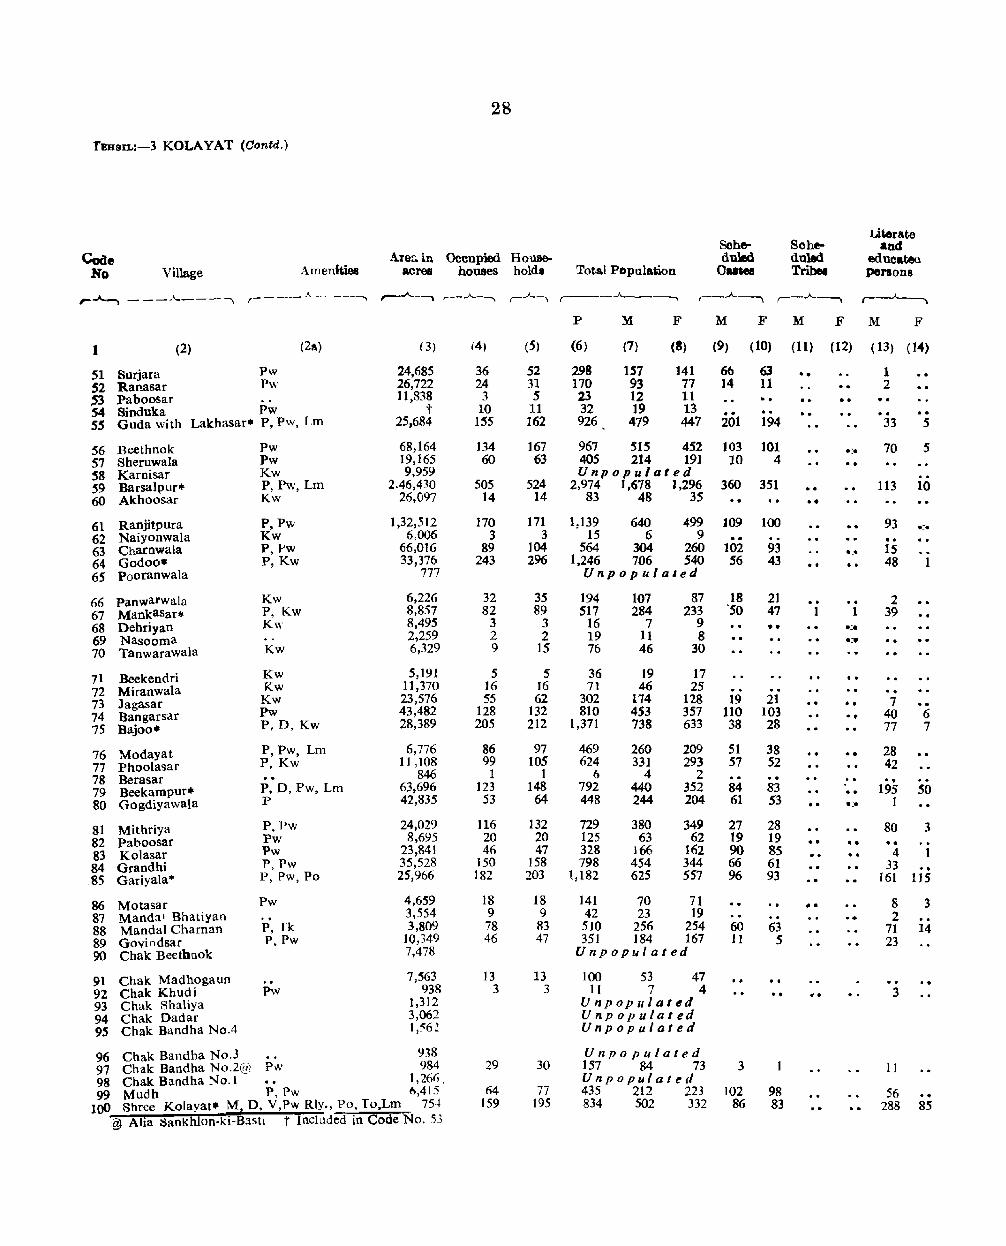
28
TEHSn.:-3 KOLA YA T (Oontd.)
Literate Sche- Scb~ and
Code Are~in Ocoupied House- duled dllled edna.teo No Village Amenities acres houses holda Total Populauon O~ Tribel penons
,..~ - ---"----, ,- -- -- .'- -' ----, r--.A.._-, ___ _A...._--._, ,-..A--, ,--__ ..A-_--.. ,-_..A----,. ,--..A-_, ,_..A----,.
P M F M F M F M F
1 (2) (2a) (3) (4) (5) (6) (7) (8) (9) (10) (11) (12) ( 13) (14)
51 Surjara Pw 24,685 36 52 298 157 141 66 63 .. 1 S2 Ranasar Pw 26,722 24 31 170 93 77 14 11 .. 2 .53 Paboosar 11,838 3 5 23 12 11 .. •• 54 Sinduka Pw t 10 11 32 19 13 . . .. . . . . 5S Guda with Lakhasar* P, Pw, Lm 25,684 ISS 162 926 479 447 201 194 33 5
56 Beethnok Pw 68,164 134 167 967 51S 452 103 101 .:. 70 5 57 Sheruwala Pw 19,165 60 63 405 214 191 10 4 · . 58 Karnisar Kw 9,959 Unpopulated 59 Barsalpur* P, Pw, Lm 2.46,430 505 524 2,974 1,618 1,296 360 351 · . 113 10 60 Akhoosar Kw 26,097 14 14 83 48 35 · . • •
61 Ranjitpura P,Pw J ,32,:512 170 171 1,139 640 499 109 100 93 .:. 62 Naiyonwaia Kw 6,006 3 3 15 6 9 · . 63 Charnwala P,l-'w 66,016 89 104 564 304 260 102 93 "." 15 64 Godoo. P,Kw 33,376 243 296 1,246 706 540 56 43 · . 48 1 65 pooranwaia 777 Unpopulated
66 Panwarwala Kw 6,226 32 35 194 107 87 18 21 2 67 Mankasar* P, Kw 8,857 82 89 517 284 233 '50 47 I 1 39 68 Dehriyan Kw 8,495 3 3 16 7 9 •. 0 . .:. 69 Nasooma 2,259 2 2 19 11 8 .:. · . 70 Tanwarawala Kw 6,329 9 15 76 46 30
71 Beekendri Kw 5,191 5 5 36 19 17
72 Miranwaia Kw 11,370 16 16 71 46 25 Kw 23,576 55 62 302 174 128 · .
73 Jagasar 19 21 • • 7 74 Bangarsar Pw 43,482 128 132 810 453 357 110 103 40 6
P,D,Kw 28,389 205 212 1,371 738 633 38 28 · ,
75 Bajoo. 77 7
76 Modayat P, Pw, Lm 6,776 86 97 469 260 209 51 38 · . • • 28 77 Phoolasar P,Kw 11 ,108 99 105 624 331 293 57 52 42 78 Berasar 846 1 I 6 4 2
P, D, Pw, Lm 63,696 123 148 792 440 352 · . · .
79 Beekampur. 84 83 195 50 80 Gogdiyawala p 42,835 53 64 448 244 204 61 53 · . .:. 1
81 Mithriya P, Pw 24,029 116 132 729 380 349 27 28 80 3 82 Paboosar Pw 8,695 20 20 125 63 62 19 19 .. •• o.
83 Kolasar Pw 23,841 46 47 328 166 162 90 85 4 1 84 Grandhi P, Pw 35,528 ]50 158 798 454 344 66 61 33
P, PW,Po 25,966 182 203 1,182 625 557 96 ..
.85 GariyaIa'" 93 161 lJ5
86 Motasar Pw 4,659 18 18 141 70 71 •• 8 3 87 Mandai Bhatiyan .. 3,554 9 9 42 23 19 2 88 MandaI Charnan P, Tk 3,809 78 83 510 256 254 60 63 71 14 89 Govindsar P,Pw ]0,349 46 47 351 ]84 167 11 5 23 90 Chak Beethnok 7,478 Unpopulated
91 Chak Madhogaun 7,563 13 13 100 53 47 · . 92 Chak Khudi pw 938 3 3 11 7 4 .. 3
1,312 " . 93 Chak Shaliya Unpopulat~d
94 Chak Dadar 3,062 Unpopulated 9S Chak Bandha No.4 1,"'61 Unpopulated
% Chak Bandha No.3 938 Unpopulated 97 Chak Bandha No.2@ Pw 984 29 30 157 84 73 3 11 98 Chak Bandha No.1 1,26(j . Unpopulated 99 Mudh P, Pw 6,415 h4 77 435 212 223 102 98 56
100 Shree Kolayat. M, D, V,Pw Rly., Po, To,Lm 75+ 159 195 834 502 332 86 83 288 85 .. @ AHa 8ank:hlon-ki-Bastl t Included in Code No. 53

29
RURAL PRIMARY CENSUS ABSTRACT
WOttERS NON~
Total workers r----------------------------------A--________________ . _______________ ~ WORKER~
(I-IX) I
M F M F
(IS) (16) (17) (18)
111 67 11 12
304
366 142
1,083 35
471 S
216 S04
74 189
4 9
30
18 27
101 311 451
72 46
56 21 16 20 . .
3 196
12 2 266 136
215 316 148 135 54 1
656 592 295 20 18 12
286 5
147 372
169
142 322
34 56 145 133
S 2 4 2
11 20
13 17 19 16 79 62
180 135 308 211
32
44 69
7 61
5
10 2
Sl 49 39
]46 126 102 47 214 195 184 134
3 2 3 /. 282 10 244 2 169 103 102 20
242 40
III 211 333
237 219 237 26 22 12 86 92 69
138 52 41 229 219 201
52 44 21 5 17 11 J2 1
. 161 145 89 24 114 107 83 22
41 4
27 2
31 4
14 2
51 34 33 10
128 148 77 146 . '294 105 37 34
II ITI IV v VI vu VIII Code
IX X No
M F M F M F M F M F M F M F M F M F
(19) (20) (21) (22) (23)
51 48
24) (25) (26) (21) (28) (29) (30) (31) (32) (33) (34) (35) (36) (1)
51 52 53 54 55
..
••
. . . .
2
...
8
.0 I
7 3
.. 1
.. .. . .
11
35
4S 26
1 60
35 120
. .
88 134 o.
eo
Unpopulated 410 361 1
17 8
254 5
103
• • 199 5
68 152 303
Unpopulated
18 27 39 83
2 5 7 4
10 12
I 3 11 17 40 28
179 131 182 268
43 79 27 61
8 65 83
18 13 19 17
205 97 75 24
29 38 5 lO
. . . .
o •
• 0
. .
. .
. . 1
71 114 4 ~n 51 32
Unpopulated
10 13
Unpopu/~ted Unpopuloled Unpopulated
Un11opulat~ d 24 18 ••
Unpopulated 47 2 21 41 16
3
••
••
••
.. . .
.-.
••
..
6
. . 2
3 • 0
12
•• · . 1 3
••
. . 3 I 3
2 ..
· . 9
24
2S
· . .. .. 0
••
..
· .
• •
6
• 0 4 .0 ." . ~ .0 1
..:. 12 7 .. 68
46 26 1 7
175
149 72
595 13
69 31 II to
251
177 56 S6 57
58 640 59
15 60
4 •• 99 •• 169 1
88 202
213 4
In 168
61 62 63 64 65
1
.. •• 3
27
.. . . 33 53 66 •• 17 I 95 88 67
• 0
3 4 68 2 4 69
16 13 70
t 19
4 71 6 72
I 67 49 23 1 ., 136 177 74
325 75 55 1 287
1 2
28 1
114 83 76 117 98 71
1 78 158 342 79 75 lOt 80
•• 23 138 112 81 23 36 82 55 76 83
• • • • 11 • • 177 206 84 1 6 J 292 328 85
2
2 I
18 27 86 6 8 87 89 109 88 70 60 89
90
12 20 91 3 2 92
93 94 95
96 27 39 97
98 4 R4 75 99
11 .. 184 24 208 227 100

ThHSIL:-3-KOLAY AT (OOf'lU.)
Code No. Village Ameoid.es
90
Area in Occupied House-acres houses holds Total Population
Schc-doled CaMet
Scheduled Tribes
Utarate ud
educated perIODS
,-......__,_.. ___ ..A'-__ --.... ,..., ___ 4 ____ ..... , ~, .... ,,..-A--. ,., - __ """-..... __ ...... ~,...........,.. ~
(1) (2)
101 Inda-ka-Bala 100 Chak Chani 103 Chani 104 Arajinala 105 Sheesha
106 Akasar. 107 Megbasar 108 Kolasar 109 Bbolasar Budhan 110 Bbolasar Chauhan
III Handla Raolotan 112 Handla Bhatiyan 113 Bhayla 114 Kokha Khalsa 115 Motha Charnan
116 Sarah Kabadiyan 117 Jhajho. 118 Khet1ai Burj 119 Khetlai Budhan 120 Kotti
121 Chat Sethiya 122 Chat Mulajman
(2&)
'0
p. Pw, Lm
M.D,Pw, Lm Pw P,Pw,Po P.Pw,Lm
P,Pw P,Pw
Pw P,Pw
M,D,Po,Lm
P
123 Chat -Oujar Sinlhwala 124 Dayatara. P ,PwLm 25 Sarah Punolai
126 Sarah Beekolal 127 MandaI Bandha 128 MandaI Raolatan 129 Bhatiya Bandhan 130 Girajsar·
131 Bera Dedawatan 132 Sora 133 Dadoo-ka-Gaon 134 Nagrasara-135 Nokhra
136 Modya 137 T.okla 138 Khariya Patawatan 139 Udat 140 Khariya Malinath
141 Bhom Hemsingh 142 Bhom Akhesingh 143 Bhom Naharsingh 144 Thoomli 145 Hadan-
146 147 148 149 ISO
Bhane-ka-Gaon* Ladkhan@ Raoneri Chhaneri Kanya-ki-Basti
@ Alias Nayapon
o. P,D,V,Pw,Lm
Kw P,Pw Pw P,Pw P,Pw
Pw
Pw Pw Pw
Kw P,Pw
P,Lm Pw Pw
Pw
(3)
4,529 1,197
11,089 746
2,894
11,629 11,938
4,094 677
4,315
4,641 5,428
46 269
6.138
310 32,221
7,703 2,289 7,484
4,003 3,133 1.688
12.402 2,159
1,644 2,500 2,334-2,046
58,337
2.860 55.681 5,111 9434
20'887 , 12'511 15.921 7.186 3,684 9,364
1,110 329
1,445 1,764
16,401
8,362 8,778 3,245 3,164 1,175
(4)
16
99
2
124 61 82
135 3
50 57
32 23
269 8
79
151
2 1
275
15 139 18 67
115
10 28 47 23 40
16
5 121
93 30 17 20
5
P
(6)
M
(7)
F M F M PM P
(5) (8) (9) (10) (11) (12) (13) (14)
21 94 55 39 23 22
96
2
Unpopulated 99 556 300 256 107
Unpopulated 2 6 4 2 2
180 61 98
135 3
1,103 284 619 705
19
551 121 294 406
11
552 163 325 299
8
S3 243 113 130 67 385 20.+ 181
Unpopulated 32 208 93 115 ~ 1~ W ~
Unpopulated 305 1,663 863 800
10 52 27 25 Unpopulahd
105 S64 287 277
Unpopulated Unpopul ated Unpop u lated
186 1,059 540 519 Unpopulated
Unpopulated 2 12 6 6 ) 954
Unpop .dat.d
155 47 75 87
168 45 75 81
19 20 28 18
27 36 2 5
210 198 .. 92 92
196 189
. . ••
314 1,733 928 80S 245 233
15 154
18 73
134
10 33 57 31 38
72 681 86
403 797
66 196 350 183 235
43 362 47
225 432
34 1]1 183 101 127
29 7 319 105 39 II
178 30 365 173
32 7 85 34
]67 117 82 17
108
8 III 11 23
172
9 36 93 12 ..
17 97 55 42 23 14 Unpopulated Unpopulilted
5 33 14 19 131 796 416 380 139 ]46
118 30 17 20 5
696 202 100 119 17
380 114 55 63 8
316 88 45 56 9
90 29
7 .. 64 21 .. 5
0'
••
• • 4
.-.
• •
••
-.. _r.
.;:0
o __
•• .~-..
._;.
2
20
202 27
133 32 4
. ~.J 3
.:-
3S 2
36
51 23 44 13
11 I 30 2
153 30 S t
92 9
140 23
- .. .~
2
2 128
..
.ra
..:.
-.. .;_. • • .0
1 46
2 58 93
3 3 I 3 7
2
4-74
37 9 9 8 1
••
12
,.., -9
••
2 7
J. .~.
1
••
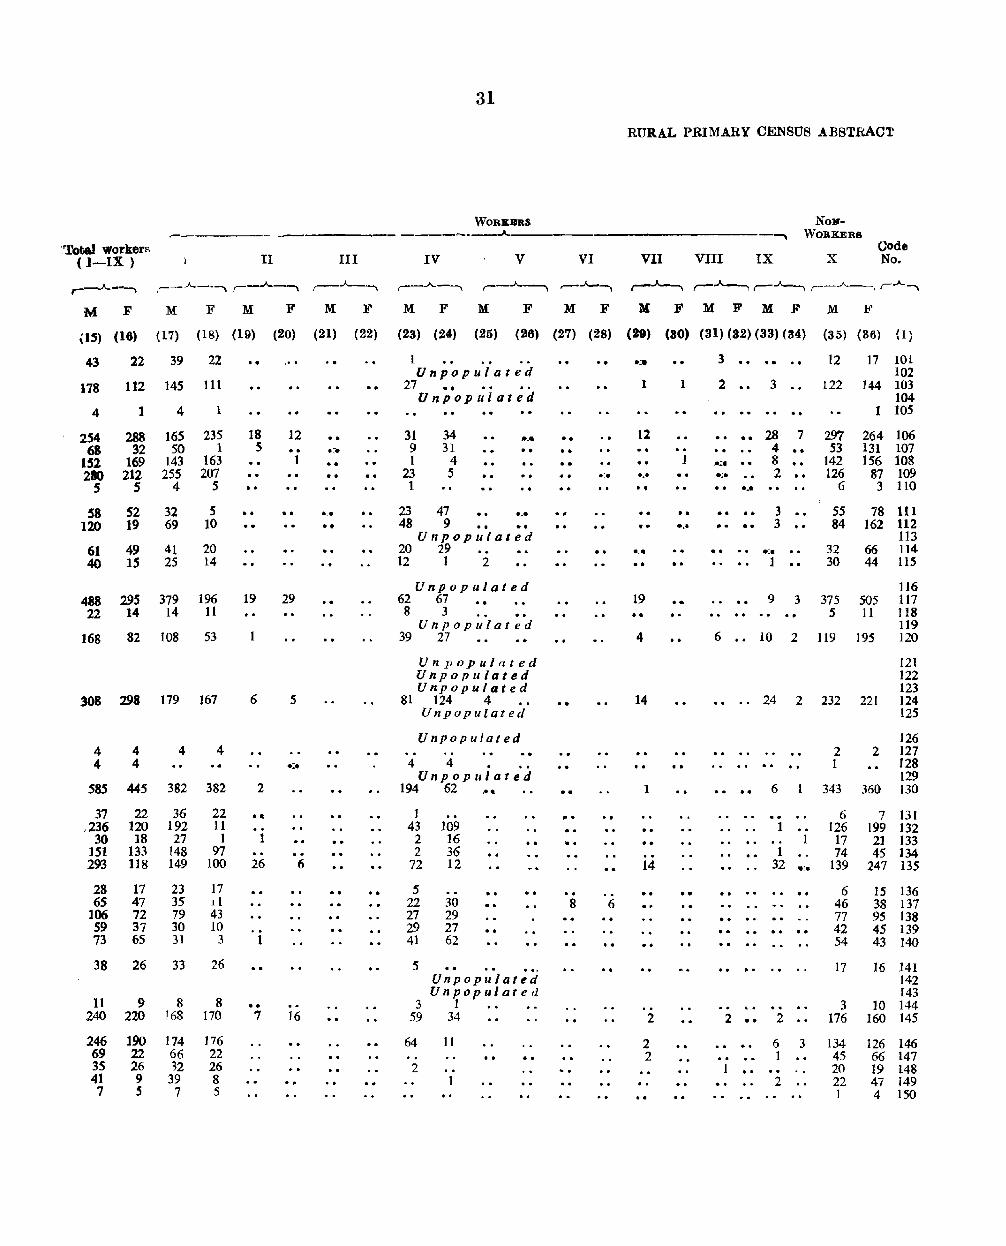
,r.rotal workers (l-IX)
M F M F M
II III
F M F
31
WOBItBRS _______ A __
IV V
1\1 F 1\1 F
VI
RURAL PRIMARY CENSUS ABSTRACT
VII
r-~
M F
NON-___ WORKERS
VIII IX x
1\1 F M F M F
Oode No.
,IS) (16) (17) (18) (19) (20) (21) (22) (23) (24) (25) (26) (27) (28) (29) (30) (31) (32) (33) (34) (35) (36) {l)
43
178
4
2S4 68
152 280
5
22 39 22
112 145 111
141
58 120
61 40
288 32
169 212
5
52 19
49 IS
165 50
143 255
4
32 69
41 25
235 1
163 207
5
5 10
20 14
488 29S 379 196 22 14 14 11
168 82 108 53
308 298 179 167
4 4 4 4
585 44S
37 ~ 236
30 151 293
22 120 18
133 118
4 4
382 382
36 192 27
148 149
22 11 1
97 100
28 17 23 17 6S 47 35 d
106 72 79 43 S9 37 30 10 73 65 31 3
38 26 33 26
11 9 8 8 240 220 168 170
246 190 174 176 69 22 66 22 3S 26 32 26 41 9 39 8 757 5
. "
18 5
• •
, ..
12
1
19 29
1
6
2
.~
1
26
1
.. 7
5
6
16
..
..
. :'-.
.0
o. .. 0,. o.
..
..
1 Unpopulated
27 •• Unpopulated
31 9 1
23 1
34 31
4 5
.... o.
23 47 0 0 •
48 9 •• Unpopulated
20 29 12 1 2
Unpopulated 62 67
8 3 Unpopulated
39 27 .0
Unpopulated Unpopulated Unpopulated
81 124 4 Unpopulated
Unpopulated
4 4 Unpopulated
194 62 ,0,
J 43 109
2 16 2 36
72 12
S 22 30 27 29 29 27 41 62
S
. .
Unpopulated Unpopulated
3 1 • • • _ 59 34
64 11
2
..
o. . . 0'0
0_
o.
••
,. .
8 6 . "
. ..:_.
1
12 · . · . ·0" · . ••
0., • 0
19 .. 4
14
1
• 0
14
..
2
2 2
• 0
1
1
• 0
0 0"
..
..
3
2 3
..
12 17 101 102
122 144 103 104
1 105
.0 28 7 297 53
142 126
6
264 106 131 107 156 108
._. .. . . ... . .
6
4 •• S 2
3 3
.,;.
1
55 84
32 30
87 109 3 110
78 162
66 44
111 H2 113 114 115
116 9 3 375 505 117
5 II 118 119
10 2 119 195 120
121 122 123
• • •. 24 2 232 221 124
•• 6 1
.. 1
1 32 It:.
· . · . o. .. · .
2 1
343
6 126 17 74
139
125
126 2 127
128 129
360 130
7 131 199 132 21 133 45 134
247 135
6 15 136 46 38 137 77 9S 138 42 45 139 54 43 140
17 16 141 142 143
3 10 144 2 00 2 176 160 145
· . 1
6 3 134 126 146 1 45 66 147
20 19 148 2 22 47 149
I 4 ISO
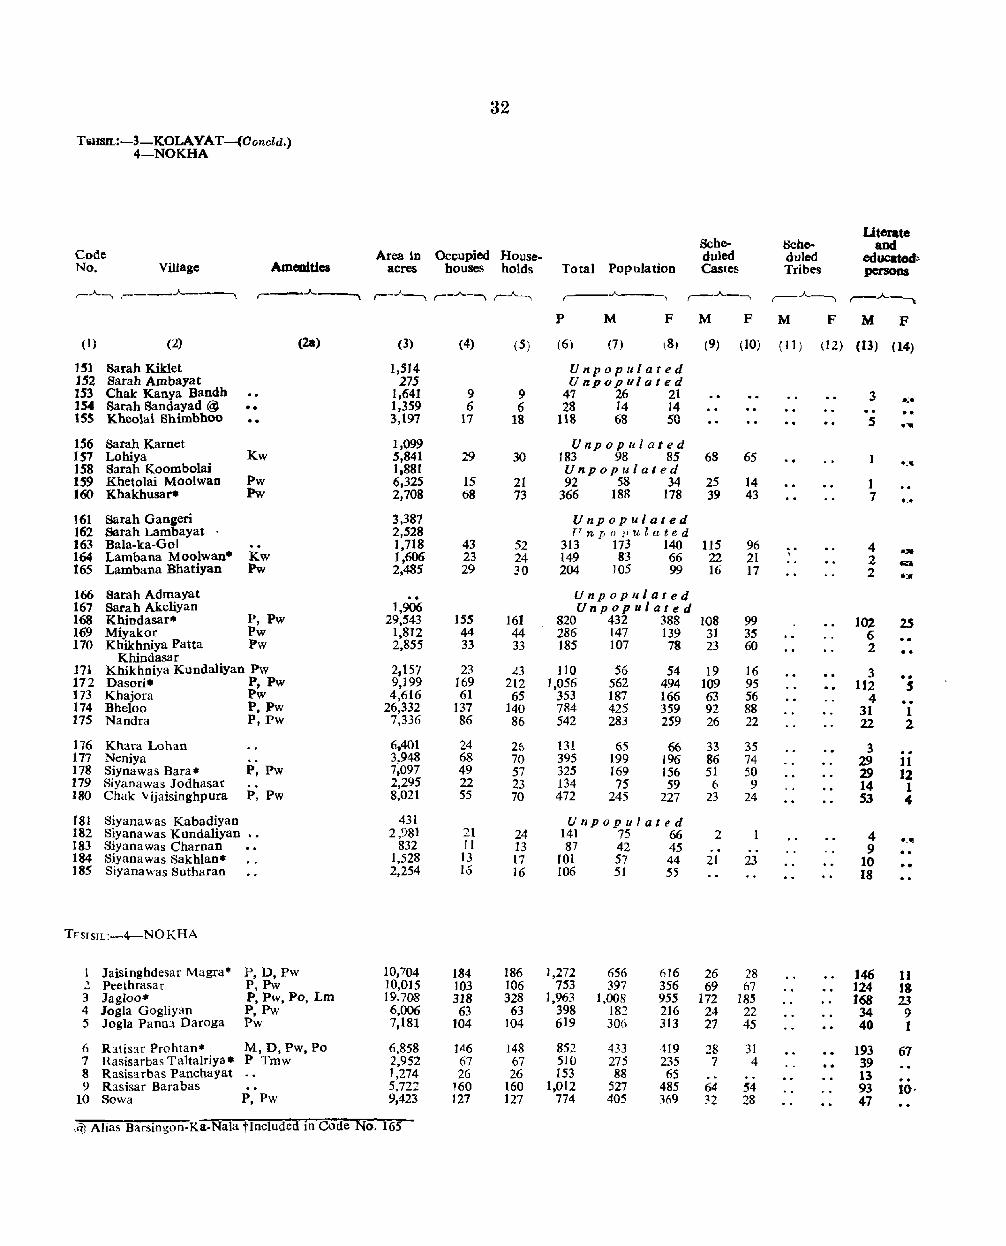
TliHSIL:-3-KOLAYAT--(Ooncld.} 4-NOKHA
Code No. Village Amenities
r-..A..-., ,-- ,--_..A..-----.
(l) (2) (28)
13'1 Sarah Kiklet 152 Sarah Ambayat 153 Chat Kanya Bandh 154 Sarah Sandayad @ •• lSS Kheolai Shimbhoo .. 156 Sarah Karnet IS7 Lohiya Kw 158 Satah Koombolaj 159 Khetolai Moolwan Pw 160 Khakhusar* Pw
161 Sarah Gangeri 162 Sarah Lambayat 163 Baia-ka-Gol 164 Lambana Moolwan· Kw 165 Lambana Bhatiyan Pw
166 Sarah Admayat 167 Sarah Akeliyan 168 Khindasar'" P, Pw 169 Miyakor Pw 170 Khikhniya Patta Pw
Khindasar 171 Khikhniya Kundaliyan Pw 172 Dasori * P, Pw 173 Khajora Pw 174 Bheloo P,Pw 175 Nandra P,Pw
176 Khara Lohan 177 Neniya 178 Siynawas Bara. P, Pw 179 Siyanawas Jodhasar 180 Chak v ijaisinghpura P, Pw
18] Siyana was Kabadiyan ]82 Siyanawas Kundaliyan •• 183 Siyanawas Charnan 184 Siyanawas Sakhlan* 185 Siyanawas Sutharan
TESISIL:-4--NOKHA
Jaisinghdesar Magra· P, D, Pw .2 Peethrasar P,Pw 3 Jagloo* P, Pw, Po, Lm 4 Jogla Gogliyan p.Pw 5 Jogla Pann:.! Daroga Pw
6 Ratisar Prohtan* M. D, Pw. Po 7 Hasisarbas Tahalriya * P Tmw 8 Rasis:trbas Panchayat 9 Rasisar Barabas
10 Sow a P, Pw
32
Area in Occupied House-acres houses holds
,--'_-., ,--_.A.._-., ,..A..-.,
(3) (4) (5)
1,514 275
1,641 9 9 1,359 6 6 3,197 17 18
1,099 5,841 29 30 1,881 6,325 15 21 2,708 68 73
3,387 2,528 1.718 43 52 1,606 23 24 2.485 29 JO
.. 1,906
29,543 155 161 1.812 44 44 2,855 33 33
2,157 23 23 9,199 169 212 4,616 61 65
26,332 137 140 7,336 86 86
6,401 24 26 3,948 68 70 7,097 49 57 2,295 22 23 8,021 55 70
431 2,981 21 24
832 11 13 1,528 13 17 2,254 16 ]6
10,704 184 186 10,015 103 106 19.708 318 328 6.006 63 63 7,181 104 104
6,858 146 148 2.952 67 67 1,274 26 26 5,72'2 160 160 9,423 127 127
\~ Alias Barsingon-Ka-Nala tlncluded in Code No. 165
Literate Sche- Hebe- and duled duled educatoct.
Total Population Castes Tribes persons
,--..A..--., ,--"----., r--.A..-...
P M F M F M F M F
(6) (7) (8, (9) (10) (11) ( 12) (13) ( 14)
Unpopulated Unpopulated
47 26 21 3 .':. 28 14 14
• e, 118 68 50 S . ... Unpopulated
183 98 85 68 65 1 .:. Unpopulated 92 58 34 25 14 1
366 18S 178 39 43 7 "_e
Unpopulated Fnpol'ulated
313 173 140 115 96 4 -. 149 83 66 22 21 \
2 to:i1I 204 105 99 16 17 2 .:c
Unpopulated Unpopulated
820 432 388 108 99 102 2S 286 147 139 31 35 6 185 107 78 23 60 2 .. 110 56 54 19 16 3 · . 1,056 562 494 109 95 112 S 353 187 166 63 56 4 784 425 359 92 88 31 1 542 283 259 26 22 22 2
131 65 66 33 35 3 395 199 196 86 74 29 11 325 169 156 51 50 29 12 134 75 59 6 9 14 1 472 245 227 23 24 S3 4
Unpopulated 141 75 66 2 4 .:01 87 42 45 9 · . 101 57 44 21 23 10 eO!
106 51 55 18
1.272 656 616 26 28 146 11 753 397 356 69 67 124 13
].963 1,008 955 172 185 168 23 398 182 216 24 22 34 9 619 306 313 27 45 40 1
852 433 419 28 31 193 61 510 275 235 7 4 39 153 88 65 13
1,012 527 485 64 54 93 10, 774 405 369 32 28 47
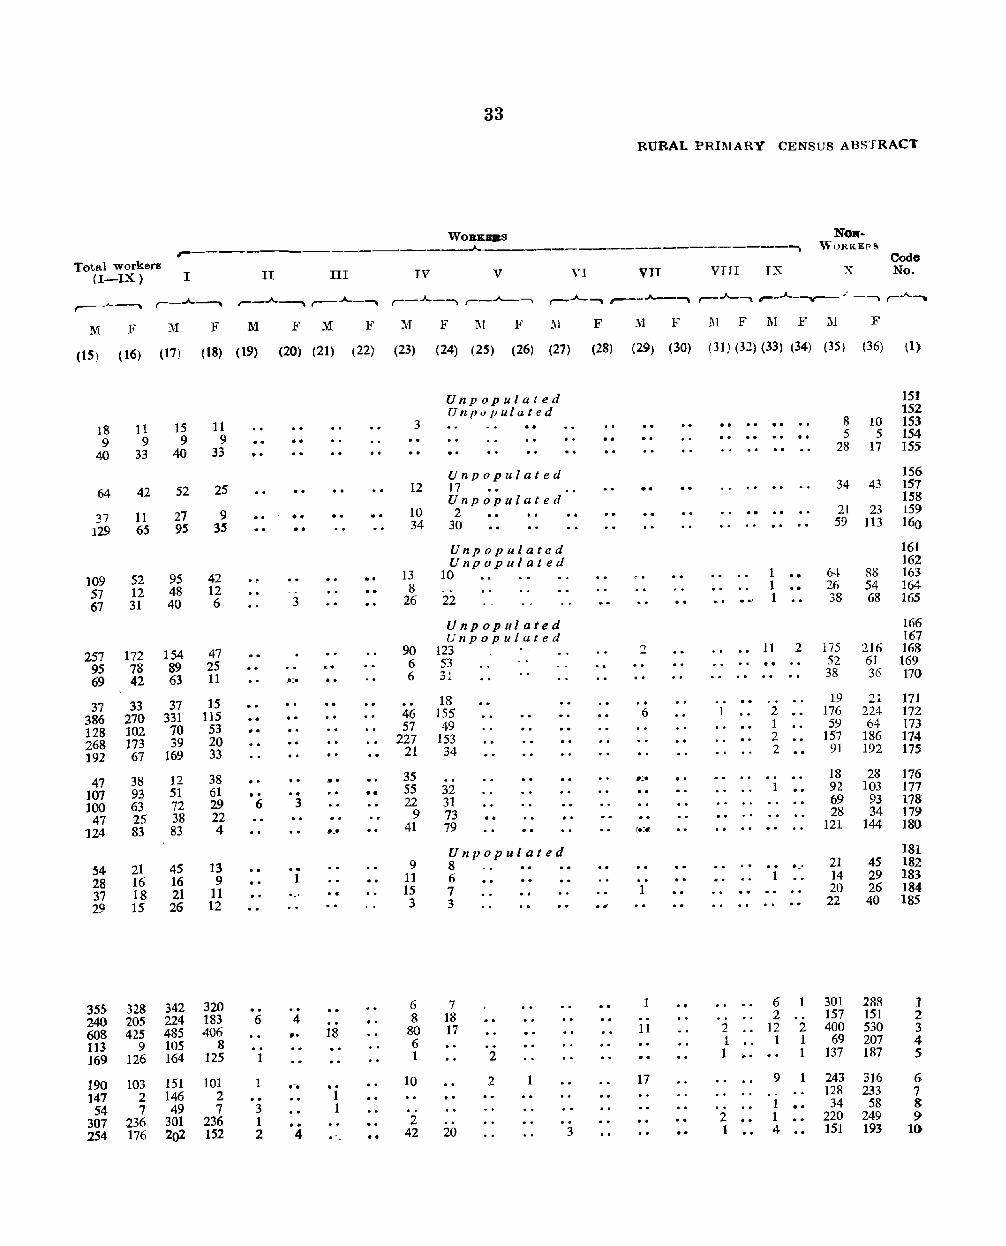
33
RURAL PRBJARY CENSUS ABSTRACT
WolUtBas NOJl-
,.. ~------------------~ WORKEr~
Total workers Code
(I-IX) I II III IV V Y1 VII VIII IX X No.
,--------. ,_..A.---,. r--..A.--,. r--.A. ___ ,..,-A_, .. _.J..__--") ,---.A_ __ ,.-__ .A.----. ,---...A...-, ,.--..A__-v--- _' --. ,.A... __
M F M F M ~' M :F !If F 1\1 F M F }i F 1\1 F 1\1 F 1\1 F
(15) (16) (17) (18) ( 19) (20) (21) (22) (23) (24) (25) (26) (27) (28) (29) (30) (31) (32) (33) (34) (35) (36) \1)
Unpopulated 151 Unpopulated 152
]8 11 15 11 3 .. .. 8 10 153
9 9 9 9 5 5 154
40 33 40 33 . . .. 28 17 155
Unpopulated 156
64 42 52 25 12 17 •• . . 34 43 151 Unpopulated 158
'37 11 27 9 •• lD 2 . . . . . . 21 23 159
129 65 95 3S •• 34 30 59 113 160
Unpopulated 161 Unpopulated 162
109 52 95 42 · . 13 10 1 64- 88 163
57 12 48 12 · . 8 1 .~. 26 54 164
67 31 40 6 3 26 22 1 38 68 165
Unpopulated 166 Unpopulated 167
257 172 154 47 90 123 . - 2 11 2 175 216 168
95 78 89 25 6 53 52 61 169
69 42 63 11 _o:_. 6 31 38 36 170
37 33 37 15 18 .. 19 21 171
386 270 331 115 .. 46 155 6 1 2 176 224 172
128 102 70 53 · . 57 49 1 59 64- 173
268 173 39 20 227 153 2 157 186 174
192 67 169 33 21 34 2 91 192 175
47 38 12 38 · . ... 35 .:. 18 28 176
107 93 51 61 ° • · . .~. 55 32 1 92 103 177
100 63 72 29 6 3 22 31 69 93 178
47 25 38 22 9 73 28 34 179
124 83 83 4 .-_. 41 79 t.:fI! 121 144 180
Unpopulated 181
54 21 45 13 · . 9 8 . .. • • • • o_, 21 45 182
28 16 16 9 1 11 6 1 14 29 183
37 18 21 11 .::. · . 15 7 1 20 26 184
29 15 26 12 3 3 . ., 22 40 185
355 328 342 320 6 7 1 .. 6 1 301 288 I
240 205 224 183 6 4 8 18 2 157 151 2
608 425 485 406 ... 18 80 17 11 2 12 2 400 530 3
113 9 105 8 6 1 1 1 69 207 4
169 126 164 125 1 1 2 1 ~ . 1 137 187 5
190 103 151 101 1 .-:-. · . 10 2 1 17 9 1 243 316 6 ]47 2 146 2 1 128 233 7 54 7 49 7 3 1 1 34 S8 8
307 236 301 236 1 · . 2 2 1 220 249 9
254 176 202 152 2 4 · -. •• 42 20 3 1 4 151 193 1()
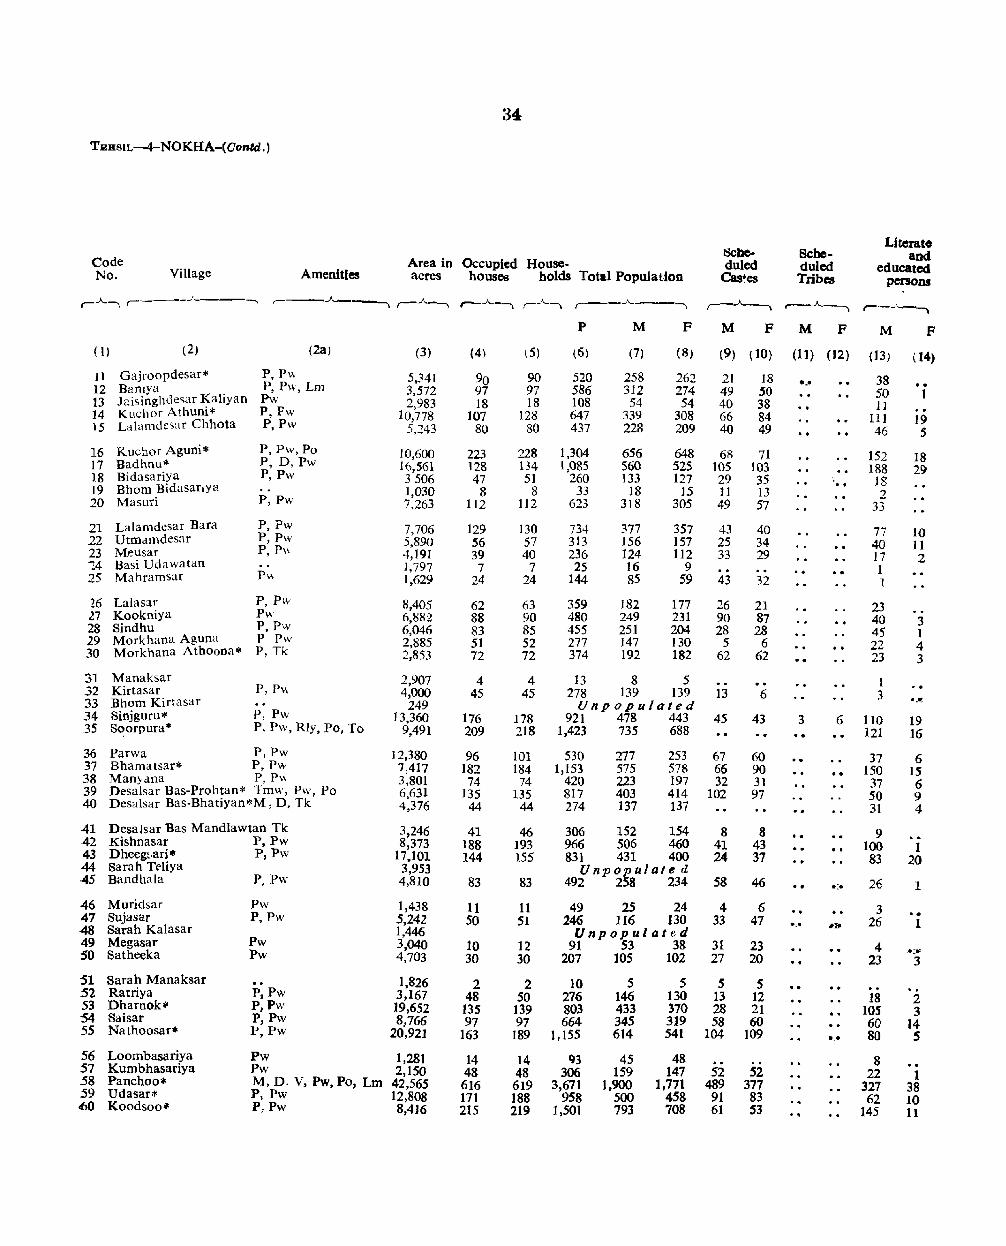
34:
T1ilBSIL-4-NOKHA-( Ooned.)
Literato IScbe- Sche- and Code Area in Occupied House- doled doled educated No. Village Amenities acres houses holds Total Population Cas~es Tribes persons
r-..A-, ,-___ J ______ ,-_.A--., r--..A.--,. r--.A.-, ,-_.A_, ,-__ _.A_ __ , , _ _.A_-,
r----"-------, r---'~
P M F M F M F M F
(I) (2) (2a) (3) (4) (5) (6) (7) (8) (9) (10) (11) (12) (3) ( 14)
11 Gajroopdesar* p,p", 5.341 90 90 520 258 262 21 18 ._" 38 12 Bamya , P, Pw, Lm 3,572 97 97 586 312 274 49 SO 50 1 13 Jai5inghde<;ar Kaltyan Pw 2,983 18 18 108 54 54 40 38 11 14 Kuchor Athuni* P,Fw 10,778 107 128 647 339 308 66 84 111 19 15 Lalamdc<;ar Chhota P,Pw 5,243 80 80 437 228 209 40 49 46 5
16 Kucher Aguni* P, Pw, Po 10,600 223 228 1,304 656 648 68 71 152 ]8 17 Badhnu* P, D, Pw 16,561 ]28 134 1,085 560 525 105 103 188 29 18 Bidasariya P,Pw 3506 47 51 260 133 127 29 35 " 18 .. 19 Bhom Bidasar,ya 1,030 8 8 33 18 15 11 13 2 20 Masuri P,Pw 7,263 112 112 623 318 305 49 57 33
21 Lalamdesar Bara P,Pw 7,706 129 130 734 377 357 43 40 77 10 22 Utmamdesar P,Pw 5,890 56 57 313 156 157 25 34 40 11 23 Meusar P, p\\ 4,191 39 40 236 124 112 33 29 17 2 ;4 Basi Udawatan 1,797 7 7 25 16 9 1 25 Mahramsar Pv. 1,629 24 24 144 85 59 43 32 1
26 Lalasar P,Pw 8,405 62 63 359 182 177 26 21 23 }'7 Kookniya Pw 6,882 88 90 480 249 231 90 87 40 3 28 Sindhu P,Pw 6,046 83 85 455 251 204 28 28 45 1 29 Morkhana Aguna P Pw 2,885 51 52 277 147 130 5 6 22 4 30 Morkhana Athoona* P,Tk 2,853 72 72 374 192 182 62 62 23 3
31 Manaksar 2,907 4 4 13 8 5 .. I 32 Kirtasar P, p", 4,000 45 45 278 139 139 13 6 3 .... 33 Bhom Kirtasar 249 Unpopulated 34 Sinjguru* P, Pw 13,360 176 178 921 478 443 45 43 3 6 110 19 35 S~orpura· P, Pw, Rly, Po, To 9,491 209 218 1,423 735 688 " . 121 16
36 Parwa P, Pw 12,380 96 101 530 277 253 67 60 37 6 37 Bhamatsar* P,Pw 7,417 182 184 1,153 575 578 66 90 150 15 38 Man),dna P, p\\ 3,801 74 74 420 223 197 32 31 37 6 39 Desaisar Bas-Prohtan* Tmw, Pw, Po 6,631 135 135 817 403 414 102 97 50 9 40 Desalsar Bas-Bhatiyan*M, D. Tk 4,376 44 44 274 137 137 31 4
41 Desalsar Bas Mandlawtan Tk 3,246 41 46 306 152 154 8 8 · . 9 42 Kishnasar P,Pw 8,373 188 193 966 506 460 41 43 100 I 43 Dheeg~,ari* P,Pw 17.101 144 155 831 431 400 24 37 · . 83 20 44 Sarah TeUya 3,953 Unpopula/~ d ,45 Bandhala P,Pw 4,810 83 83 492 258 234 58 46 · . .:. 26 1
46 Muridsar Pw 1,438 11 11 49 25 24 4 6 3 .. 47 Sujasar P,Pw 5,242 50 51 246 116 130 33 47 ._" #II> 26 1 48 Sarah Kalasar 1,446 Unpopulated 49 Megasar Pw 3,040 to 12 91 53 38 31 23 4 .. :-50 Satheeka Pw 4,703 30 30 207 lOS 102 27 20 23 3
51 Sarah Manaksar .. 1,826 2 2 10 5 5 5 5 '-" 52 Ratriya P, Pw 3,167 48 50 276 146 130 13 12 18 2 53 Dharnok* PiPw 19,652 135 139 803 433 370 28 21 lOS 3 54 Saisar P,Pw 8,766 97 97 664 345 3)9 58 60 60 14 55 Nathoosar* P, Pw 20,921 163 189 1,155 614 541 104 109 .~. 80 S 56 Loombasariya Pw 1,281 14 14 93 45 48 8 .. 57 Kumbhasariya Pw 2,150 48 48 306 159 147 52 52 22 1 58 Panchoo* M, D. V. Pw, Po, Lm 42,565 616 619 3,671 1,900 1,771 489 377 327 38 59 Udasar* p.Pw 12,B08 171 188 958 500 458 91 83 .. 62 10 ~ Koodsoo'" P,Pw 8,416 215 219 1,501 793 708 61 S3 145 II

Total workers (I-IX) 1 II III
36
WORKERS
IV v VI
RURAL PRIMARY CE~BUS ABSTRACT
vn VI11 IX
NON-~ WORKERS
x Code No
~ ,-..A----. ~ ,---A-----. r---"-----. ,--..A-..-.. ~ r--"--, ;- -.A-, ,-J-, r- :.J..__, r-.A.
M P M F M F M F M F M F M F M F M F MF F
(15) (16) (17) (18) (19) (20) (21) (22) (23) (24) (25) (26) (27) (28) (29) (30) (31) (32) (33) (34) {35} (36) (l)
159 126 183 171
27 20 187 207 144 152
146 123 146 149 26 20
174 196 96 141
360 350 321 338 314 296 276 281
78 77 17 32 12 5 10 5
182 192 151 103
202 202 89 92 73 61 11 5 53 32
l03 104 J49 136 141 85
79 48 113 50
8 84
2$9 414
159 JZ5 139 205 69
. . 55
2S1 331
98 311
17 41 15
190 189 ~9 92 70 60 10 5 53 32
96 99 107 118 89 77 66 43 81 47
S 7S
245 361
123 283 121 188 44
S2
243 321
93 308
17 39 8
7S 14 66 14 ~ 138 134 79 2S8 145 250 138
196 186 178 171
\8 75
33 51
2 76
~ 23 97
J,115 ~ 443
11 87
11 15
11 58
30 41
2 2 29 71
156 2~O 104 167 194 293
12 IS 60 92
895 1,012 180 lOS 266 398
11 78
11 8
2 29
150 80
167
12 59
888 167 241
••
2 1
· . 1
.. 1 1
· .
· . 1
.. 9
3
.. 2
.. .. 8 2
••
.. ••
8
.. I
. .
. .
•• 2
t 10
4 2 ..
I
. .
. .
.. ....
. .
..
12 31
1 9
44
14 9
58 2
30
10 2S
2
5 27 49 11 31
3
3 22
to 4
11 15 45
89
13 . . 1
5 10 8 S 3
..
. . 1
1
.. 1 .. .
.-. •• .. ..
8 3 ... •• Unpqpulated
33 8 2 I 9
22 22 16 13 IS
3 1 .. .. 6
I . . ••
7 •• 1 •. 113 S6 2 1
1 5 •• Unpopul at ed
7 7
]3 8 .-. • • Unpopulated
3 •• 10 7
I 14 30 S9
8 3
42 91 41
.. 6
24 26
1 3
13 IS
.. ..
••
1 1
1 ._.
2 ..
...
4 s
.0
••
2
. . ..
t ... ..
..
.. . .
.. 1 .-.
].
.. .. • •
1 3
1
2 1
1 7
2
3
27
1
4 40
1
. .
I 3 ••
2 2
24 29
3
2 2
2 10 3
3 2 1
1
2 9
10 9 1 2 9
1
2 J
2 1
99 136 129 103 27 34
152 lOt 84 57
11 12 J3 14 1~
Z96 298 16 246 229 17
55 So 18 6 10 19
136 113 20
175 67 51 5
32
ISS 65 5~ 4
27
79 73 100 9~ 110 119 68 82 19 132
55
189 321
118 250
84 ]98 68
5 84
192 357
15S 267 180 373 122
77 140
21 22 23 l4 :z5
26 27 28 29 30
~ 33 34 3$
~ 31 ;J -40
37 2 212 322 6 2 173 255
41 42 4' ~
2 62 48
1 1
3 2 6 1
7 13 41 43
20 27 54 87
3 70
182 146 251
3 101 214 215 347
4J
46
II 49 50
.. .. 22 62
785 194 350
36 81
876 278 442
1 25 7 4
3
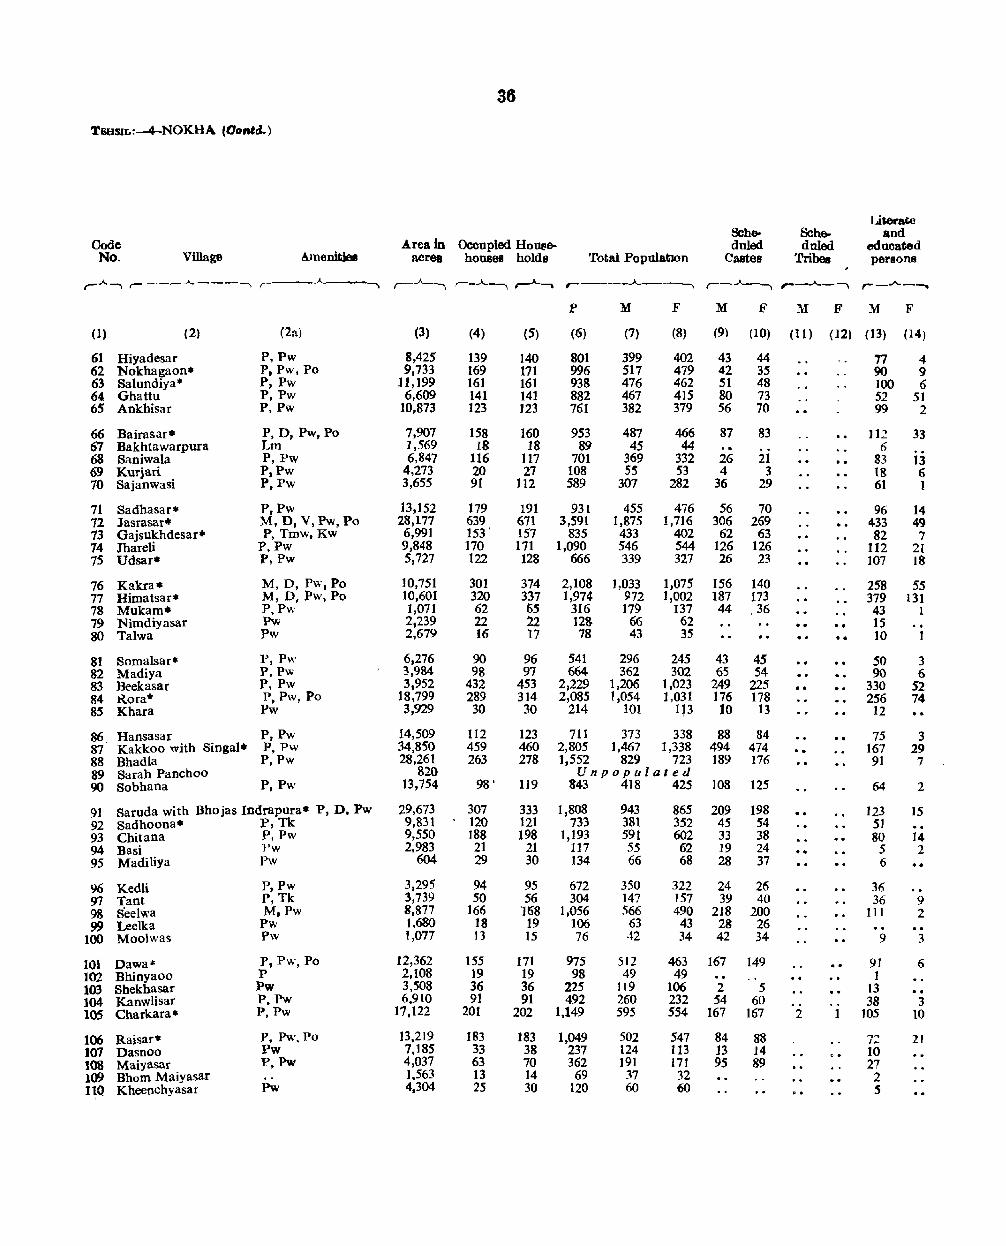
36
T8HSIL~-4-NOKHA (Do_a.)
l.iterate Sche- 8che- and
Code Area in Occupied Hout'&- dnled duled educated No. Village Amenit1el acrea houses holds Total Popolatxm Castes Tribes persons
r A -., r- -----.\...---, ,-__ ..A__------, ,-_A_, ,.--~ ,..-A-_, ,--____ ...A
-., ,-_..A.._, ,---..A.._, r-..A..--.
p M F M F M F M F
(1) (2) (2a) (3) (4) (5) (6) (7) (8) (9) (10) (11 ) ( J2) (13) (14)
61 Hiyadesar P,Pw 8,425 139 140 801 399 402 43 44 77 4 62 Nokhagaon* P, Pw, Po 9,733 169 171 996 517 479 42 35 90 9 63 Salundiya* P,Pw 11,199 161 161 938 476 462 51 48 100 6 64 Ghattu P,Pw 6,609 141 141 882 467 415 80 73 52 51 65 Ankhisar P,Pw 10,873 123 J23 761 382 379 56 70 99 2
66 Bairasar· P, D, Pw, Po 7,907 158 160 953 487 466 87 83 112 33 67 Bakhta warpura Lm 1,569 18 18 89 45 44 6 68 Saniwala P,Pw 6,847 116 117 701 369 332 26 21 · . 83 13 69 Kurjari P,Pw 4,273 20 21 108 55 53 4 3 18 6 70 Sajanwasi P,Pw 3,655 91 112 589 307 282 36 29 61 I
71 Sadhasar* P,Pw 13,152 179 191 931 455 476 56 70 96 14 72 Jasrasar· M, D, V, Pw, Po 28,177 639 671 3,591 1,875 1,716 306 269 433 49 73 Gajsukhdesar* P, Tmw, Kw 6,991 153' 151 835 433 402 62 63 82 7 74 Jhareli P,Pw 9,848 170 171 1,090 546 544 126 126 112 21 75 Udsar· P,Pw 5,721 122 128 666 339 327 26 23 107 IS
76 Kakra. M, D, Pw, Po 10,751 301 374 2,108 1,033 1,075 156 140 258 55 77 Himatsar* M, D, Pw, Po 10,601 320 337 1,974 972 1,002 187 173 379 131 78 Mukam· P,Pw 1,071 62 65 316 179 137 44 36 43 1 79 Nimdiyasar Pw 2,239 22 22 128 66 62
• 0 15
80 Talwa Pw 2,679 16 17 78 43 35 · . 10
81 Somalsar* P,Pw 6,276 90 96 541 296 245 43 45 50 3 82 Madiya p, Pw 3,984 98 97 664 362 302 65 54 90 6 83 Beekasar P, Pw 3,952 432 453 2,229 1,206 1,023 249 225 .. 330 52 84 Kora* P, Pw, Po 18,799 289 314 2,085 1,054 1,031 176 178 256 74 85 Khara Pw 3,929 30 30 214 101 113 10 13 12
86 Hansasar P,Pw 14,509 112 123 711 313 338 88 84 · . 15 3 87 Kakkoo with Singal. P, Pw 34,850 459 460 2,805 1,467 1,338 494 414 .0 161 29 88 Bhadla P, Pw 28,261 263 218 1,552 829 723 189 176 • 0 91 7 89 Sarah Panchoo 820 Unpopulated 90 Sobhana P,Pw 13,754 98' 119 843 418 425 108 125 64 2
91 Saruda with Bhojas Indrapura. P, D. Pw 29,613 301 333 1,808 943 865 2Q9 198 123 15 92 Sadhoona. P, Tk 9,831 120 121 733 381 352 45 54 51 93 Chitana P,Pw 9,550 J88 198 1,193 591 602 33 38 80 14 94 Basi }'w 2,983 21 21 111 55 62 19 24 o. S 2 95 Madiliya Pw 604 29 30 134 66 68 28 31 6
96 Kedli P,Pw 3,295 94 95 612 350 322 24 26 36 97 Tant P,Tk 3,739 50 56 304 147 157 39 40 36 9 98 S'eelwa M,Pw 8,877 166 'Hi8 1,056 566 490 218 200 III 2 99 Leelka Pw 1.680 18 19 106 63 43 28 26
100 Moolwas Pw t,077 13 15 76 42 34 42 34 9 3
101 Dawa'" P, Pw, Po 12,362 155 ]71 975 512 463 161 149 .. 91 6 102 Bhinyaoo p 2,108 19 19 98 49 49 1 103 Shekhasar Pw 3,508 36 36 225 119 106 2 5 13 104 Kanwlisar P.PW 6,910 91 91 492 260 232 54 60 38 3 lOS Charkara. P, Pw 17,122 201 202 1.149 595 554 167 167 2 1 105 10
106 Raisar" p. Pw, Po 13.219 183 183 1,049 502 547 84 88 ... " 21 I ...
107 Dasnoo Pw 7,185 33 38 237 124 113 13 14 10 108 M~iyasar P,Pw 4,037 63 70 362 191 171 95 89 27 109 Shom Maiyasar ],563 13 14 69 ?o7 32 2 I~Q Kheeochyasar Pw 4,304 25 30 120 60 60 S
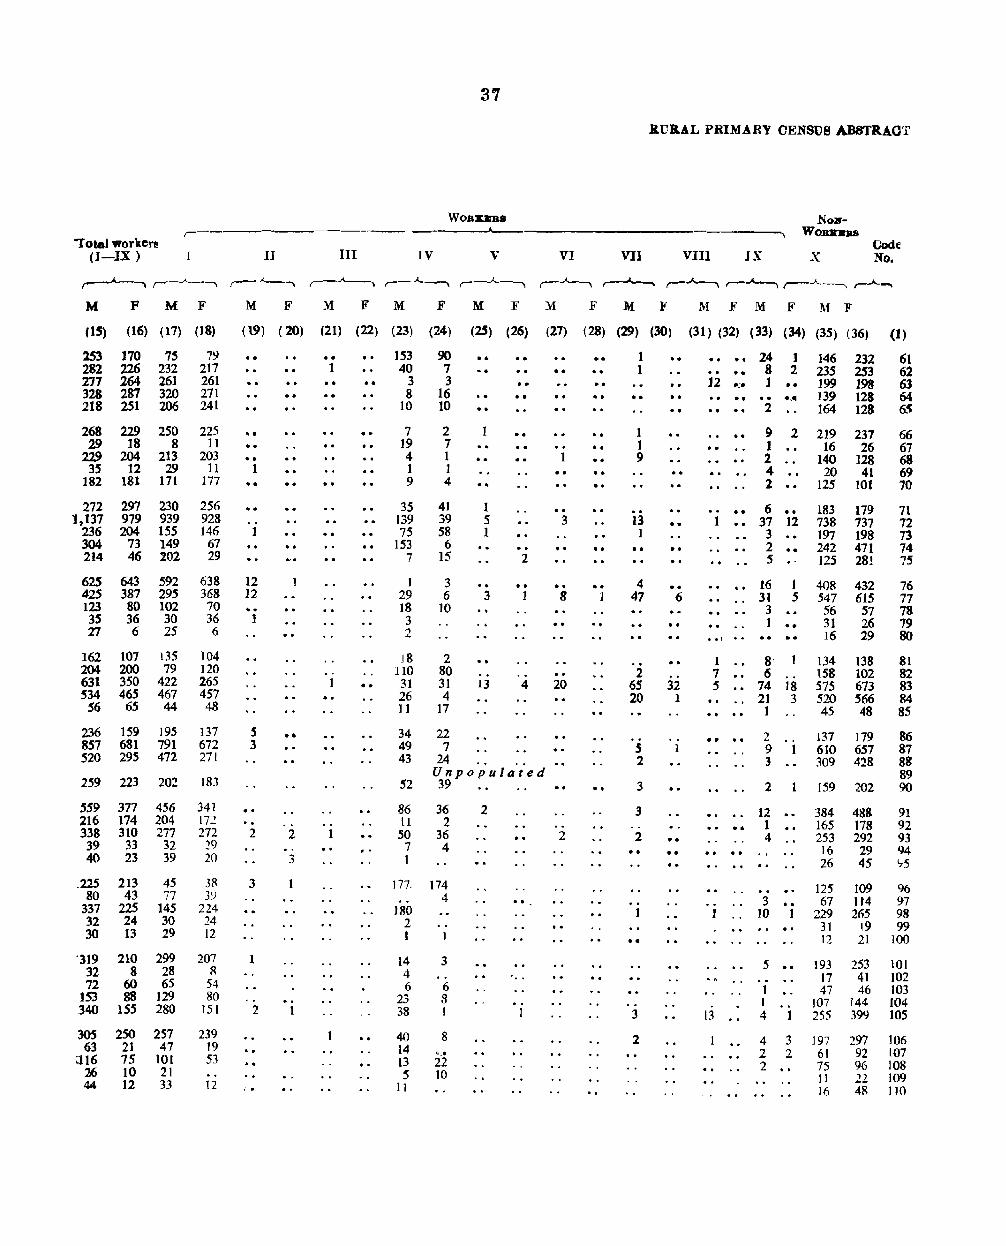
"Total 'Workers (I-IX)
M F M F
II
M F
3'1
WOBEJm8
III lV V
)1 F M F M F M
VI
.R.UIlAL PRIMARY OENSUS ABSTRAOT
VIl
.F M F
VIII IX
Nol'fWOldtBllS
Code: X No.
1\1 FM F MF
(IS) (Hi) (17) (18) (19) (lO) (21) (22) (23) (24) (25) (26) (27) (28) (29) (30) (31) (32) (33) (34) (35) (36) (1)
lS3 170 7S 282 226 232 Z'/7 264 261 328 287 320 218 251 206
268 229 250 29 18 8
219 204 213 3S 12 29
182 18t 171
272 291 230 1,137 979 939
236 204 155 304 73 149 214 46 202
615 425 123 35 27
643 387 80 36 6
592 295 102 30 25
162 107 135 204 200 79 631 350 422 534 465 467 56 65 44
236 159 ]95 857 681 791 520 295 472
259 223 202
79 217 261 271 241
225 11
203 11
]77
256 928 146
67 29
638 368
70 36 6
104 120 265 457 48
137 672 271
183
559 377 456 34 I 216 174 204 172 338 310 277 272 39 33 32 29 40 23 39 20
_225 80
337 32 30
213 43
225 24 13
45 77
145 30 29
3R 3')
224 24 12
-319 210 299 207 32 8 28 R 72 60 65 54
153 88 129 80 340 155 280 151
)OS 250 257 239 63 21 47 19
;116 75 101 53 26 10 21 44 12 33 12
.. .
· .. •• •• · .. 1 ••
1
12 12 ...
1
5 3
· . 2
3
1
••
••
2
3
.. 2 1
· .
.. . 1 · . ..
.. · . · ..
· . 1 ..
. . I
153 40
3 8
10
7 19 4 1 9
35 139 7S
153 7
1 29 18
3 2
]8 110
31 26 ] 1
90 7 3
16 10
2 7 1 1 4
41 39 58 6
15
3 6
10
2 80 31 4
17
22 7
..
1
.. 1 5 1
3
13
· . · .
2
· . 1
4
34 49 43
52
24 Unpopulated 39
86 36 11 2 50 36 7 4 1
In
)80 2 1
14 4 6
23 38
40 14 13 5
11
174 4
3
6 S 1
8 .. 22 10
2
. . 1
.. ••
· . · . • •
1 · . . . 3
8
· .
20
..
· . · . 2
1 1
.. 1 1 9
13 1
• •
4 47
2 65 20
5 2
3
3 - -2
.. I
••
3
2
· . • •
.. · . .. 6
· . .. 32
1
· . 1
••
•• 24 1 2
146 232 235 253
61 62 63 64 6..~
." 12 0
..
1
• • I
1 7 S
••
.. ..
••
8 1 •• . .. 2
9 2 1 2 4 2
6 37 12 3 2 •• S 0"
16 I 31 5
3 1 .. 8- 1 6
74 18 21 3 I . "
2 9 1 3
2 1
12 1 4
199 193 139 128 164 128
219 237 16 26
140 128 20 41
125 101
183 179 738 737 197 198 242 471 125 281
408 547 56 31 16
432 615
57 26 29
134 138 158 102 575 673 520 566 45 48
137 179 610 657 309 428
159 202
66 67 68 69 70
71 72 73 74 75
76 77 78 79 80
81 82 83 84 85
86 81 88 89 90
384 488 91 165 178 92 253 292 93 . . .. ]6 29 94 26 45 <,.5
.. .. I
13
3 10
5
1 1 4
125 67
229 31 12
109 114 265
19 21
96 97 98 99
100
193 253 101 17 41 102 47 46 103
]07 144 104 255 399 105
4 3 197 297 ]06 2 2 61 92 t07 2 75 96 108
11 22 109 16 48 110
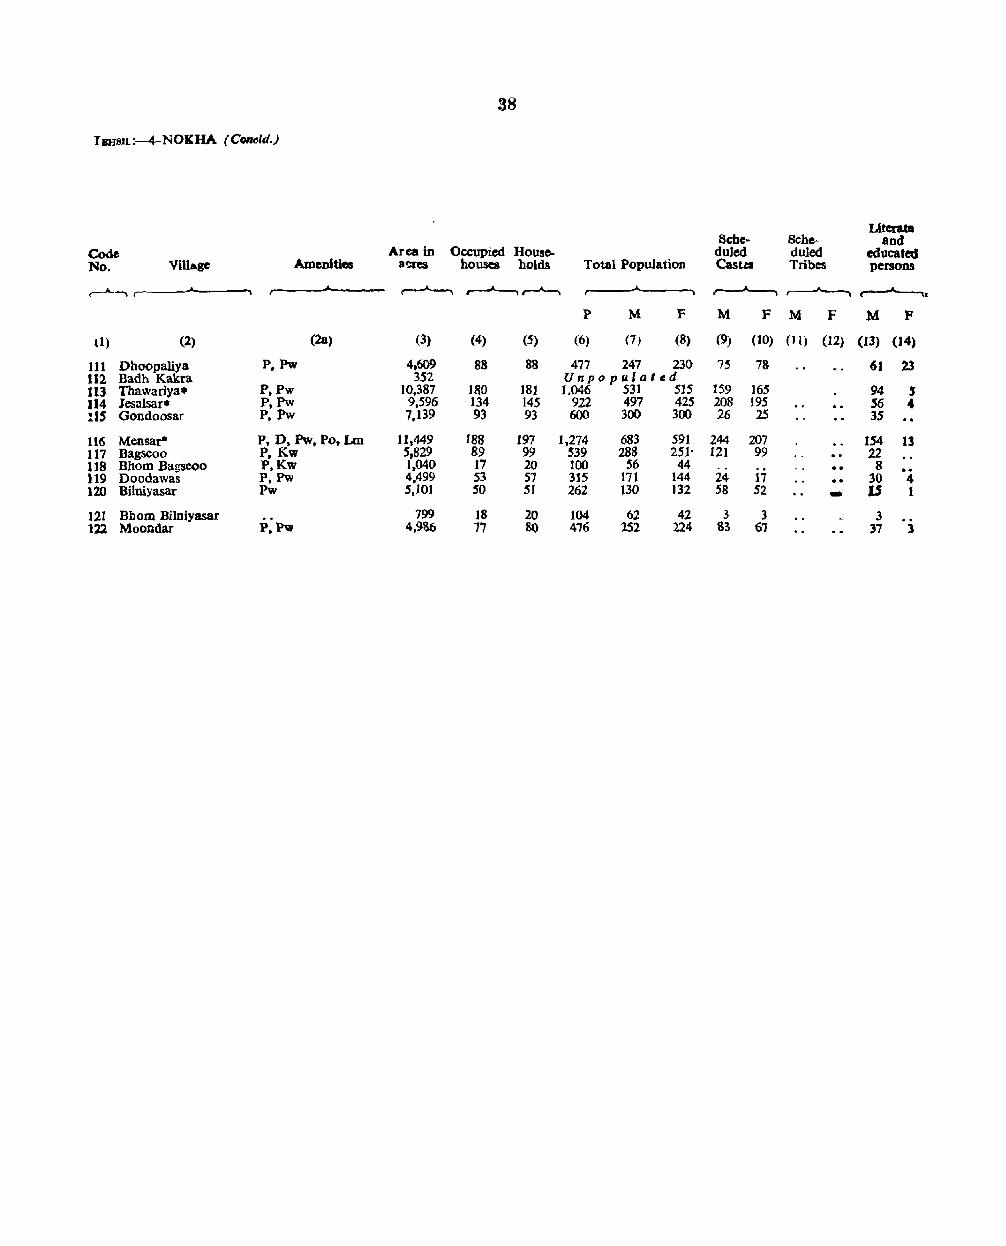
38
JBHstL:-4-NOKHA (Con(}ld.)
Literata 8che- Bche- and
Code Area in Ocx:upied House- duled duled educated No. Village Amenities a<:res houses holds Total Population Casus Tribes persons
,--J--~ ,J., " , ,-J--., .........--'---~ " 1 t 0
P M F M F M F M F
tl) (2) (2a) (3) (4) (5) (6) (7) (8) (9) (to) (II) (12) (13) (14)
Ul Dhoopaliya P,PW 4.609 88 88 477 247 230 7S 78 61 23 tt2 Badh Kakra 352 Unpopulated 113 Thawariya. p.Pw 10,387 180 181 1.046 53] 515 1$9 16S' 94 J Jl4 Jesalsar· P,Pw 9,596 134 145 922 497 425 208 195 56 .. :15 Gondoosar P,Pw 7,139 93 93 600 300 300 26 25 35
116 Mensar- P, D, Pw. Po, Lm 11,449 188 197 1,274 683 591 244 207 154 13 II7 Bagseoo p. Kw 5,829 89 99 539 288 251' 121 99 22 118 Bhom Bagseoo P.Kw 1.040 17 20 100 56 44 .. 8 .. 119 Doodawas P.PW 4.499 53 57 315 171 144 24 17 30 4 120 Bilniyasar Pw 5,101 SO 51 262 130 132 58 52 - 1$ I
12) Bbom Bilniyasar 799 18 20 104 62 42 3 3 3 ]22 Moondar P.PW 4,986 17 80 476 252 n4 83 6'J 37 1
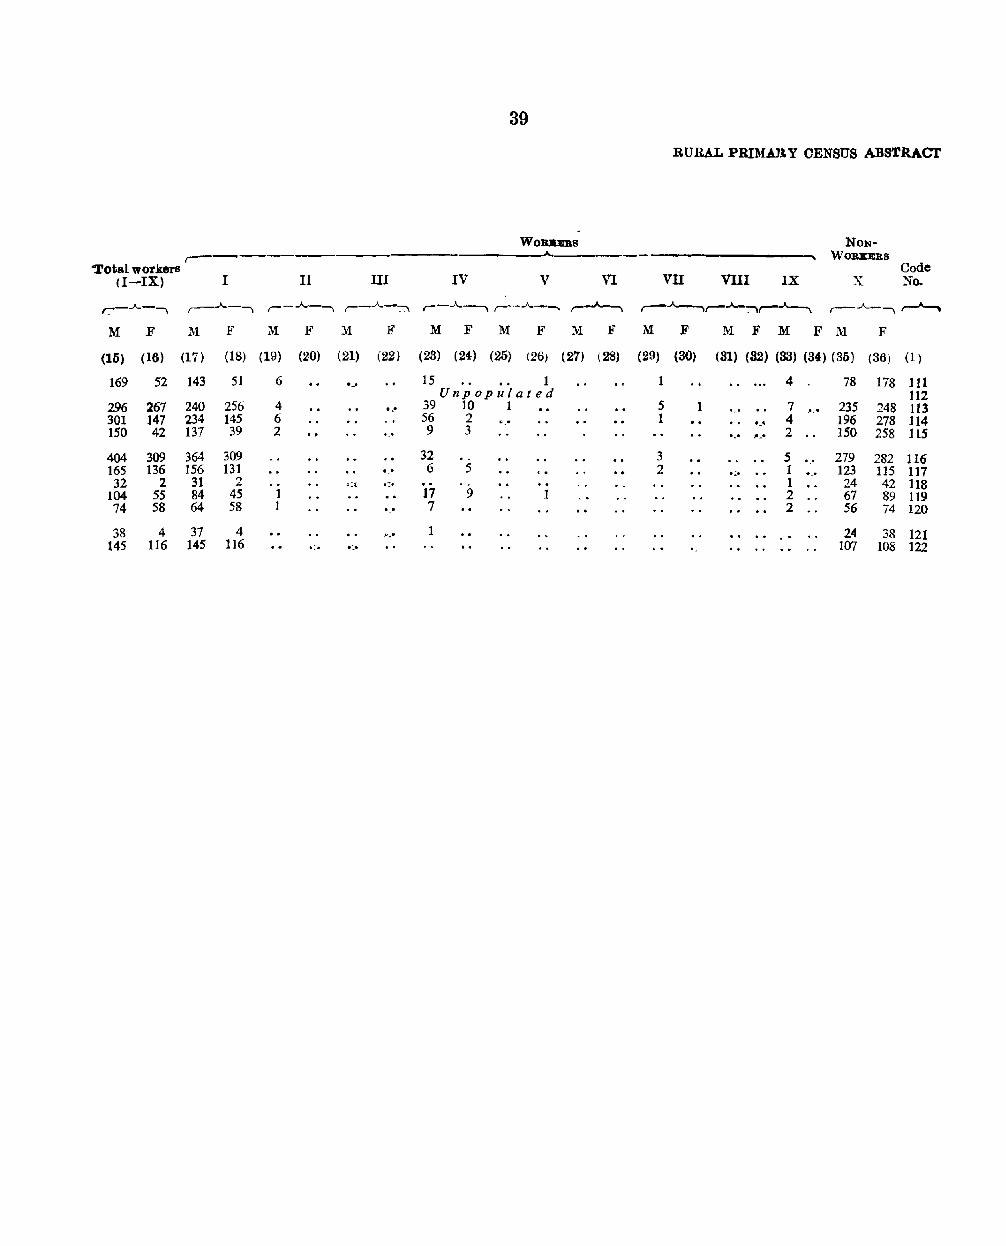
39
RURAL PRIMAlt Y OENSUS ABSTRAcr
WOBIBBS NON-,.----- WORKERS
Total workers Code (I-IX) I II III IV V VI VII Vlli IX X No.
r-..A..-, ,--..A..-, ,_..A.._, r-..A..~ r--~r-..A..--... r-~ ,--.....___,r-~~ r-..A..-,~
M F M F M F M F M F M F :M F M F M F M F M F
(16) (16) (17) (18) (19) (20) (21) (22) (23) (24) (25) (26) (27) (28) (29) (30) (31) (82) (83) (34) (35) (36) (1 )
169 52 143 51 6 "_. 15 1 1 4 78 178 111 Unpopulated 112
296 267 240 256 4 1." 39 10 1 5 1 .". 7 ,IT· 235 248 113 301 147 234 145 6 56 2 ".1 1 I.' 4 196 278 114 150 42 137 39 2 I_I '-' 9 3 ".1 !':.. 2 ISO 258 115
404 309 364 309 32 3 5 I.' 279 282 116 165 136 156 131 "_" 6 5 2 .~. 1 ._' 123 115 117 32 2 31 2 -cl:~ .:::. 1 24 42 118
104 55 84 45 1 17 9 1 2 67 89 119 74 58 64 58 1 ,_" 7 2 56 74 120
38 4 37 4 .,,_... 1 24 38 121 145 116 145 116 . :. .: . 107 108 122
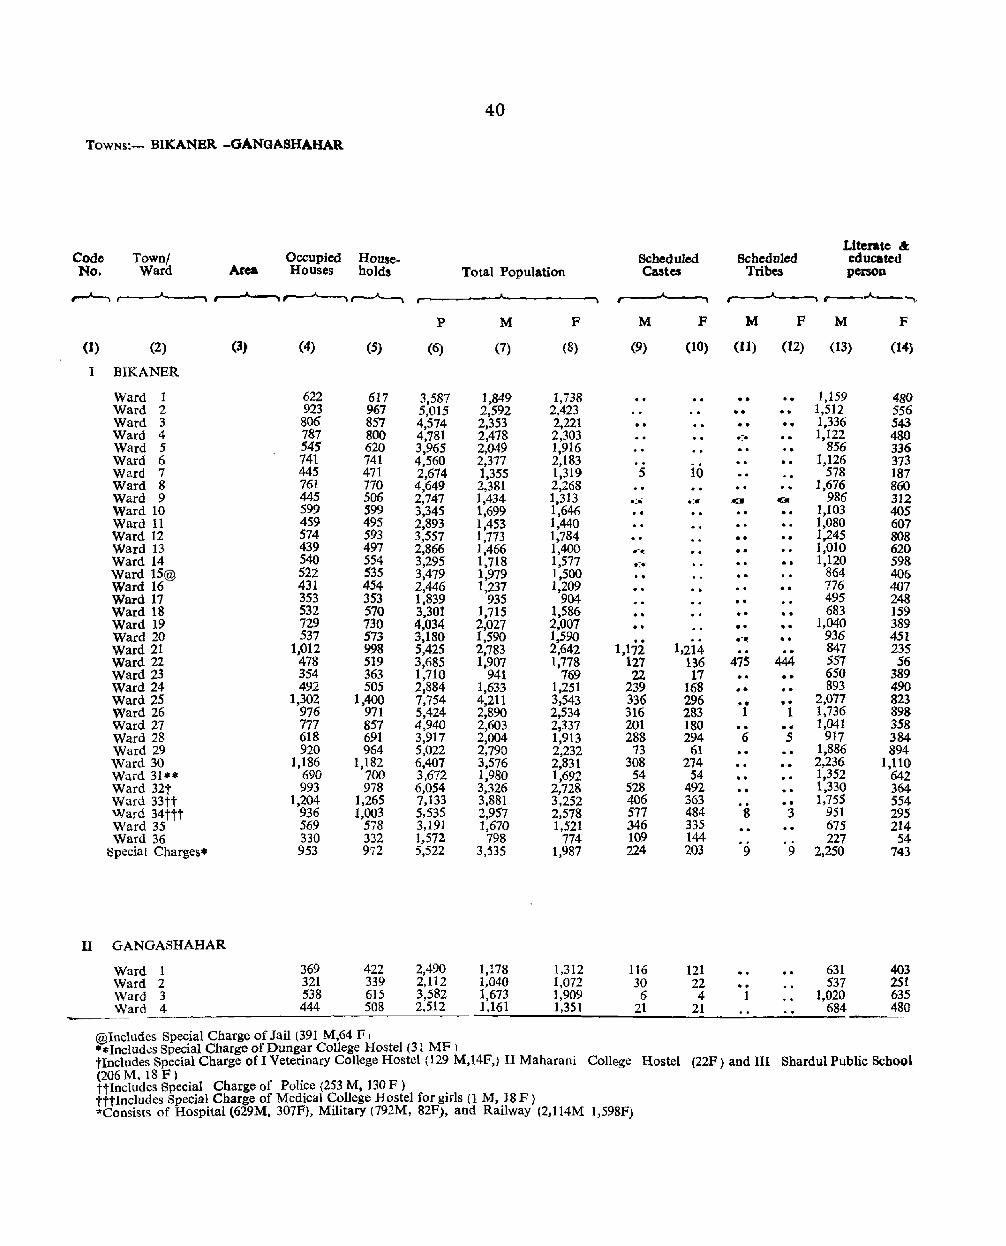
40
TOWNS:- BIKANBR -GANGASHAHAR.
Literate & Code Town! Occupied House- Scheduled Scheduled educated No. Ward Area Houses holds Total Population Castes Tribes person
,..-J--. ... \~~ , J.. r----A..-,"""
P M F M F M F M F
(I) (2) (3) (4) (5) (6) (7) (8) (9) (10) (11) (12) (13) (14}
I BIKANER
Ward 1 622 617 3,587 1,849 1,738 •• 1,159 480 Ward 2 923 967 5,015 2.592 2,423 •• • • 1,512 556 Ward 3 806 857 4,574 2,353 2,221 . . • • '. 1,336 543 Ward 4 787 800 4,"181 2,478 2,303 .:-. 1,122 480 Ward 5 54S 620 3,965 2,049 1,916 856 336 Ward 6 741 741 4,560 2,377 2,183 . . · . 1,126 373 Ward 7 445 471 2,674 1,355 1,319 5 10 578 187 Ward 8 761 770 4,649 2,381 2,268 · . · ~ 1,676 860 Ward 9 445 506 2,747 1,434 1,313 . .::. .::. .orw CM 986 312 Ward 10 599 S99 3,345 1,699 1,646 · . · . 1,103 40S Ward 11 459 495 2,893 1,453 1,440 1,080 607 Ward 12 574 593 3,557 1,773 1,784 • • .. 1,245 808 Ward 13 439 497 2,866 1,466 1,400 • =-~ .. 1,010 620 Ward 14 540 554 3,295 1,718 1,577 .::_. 1,120 598 Ward 15@ 522 535 3,479 1,979 1,500 864 406 Ward 16 431 454 2,446 1,237 1,209 776 407 Ward 17 353 353 1,839 935 904 · . 495 248 Ward 18 532 570 3.301 1,715 1,586 · . · . 683 159 Ward 19 729 730 4,034 2,027 2,007 . . o. · . 1,040 389 Ward 20 537 573 3,180 1,590 1,590 ..
l,2i4 .-~ 936 451
Ward 21 1,012 998 5,425 2,783 2,642 1,172 847 235 Ward 22 478 519 3,685 1,907 1,778 127 136 475 444 557 56 Ward 23 354 363 1,710 941 769 22 17 .. 00 6S0 389 Ward 24 492 505 2,884 1,633 1,251 239 168 •• · . 893 490 Ward 25 1,302 1,400 7,754 4,211 3,543 336 296 _. " · . 2,077 823 Ward 26 976 971 5,424 2,890 2,534 316 283 1 1 1,736 898 Ward 27 777 857 4,940 2,603 2,337 201 180 .. 1,041 358 Ward 28 618 691 3,917 2,004 1,913 288 294 6 5 917 384 Ward 29 920 964 5,022 2,790 2,232 73 61 1,886 894 Ward 30 1,186 1,182 6,407 3,576 2,831 308 274 2,236 1,110 Ward 31** 690 700 3,672 1,980 1,692 54 54 · . 1,352 642 Ward 32t 993 978 6,054 3,326 2,128 528 492 .. 1,330 364 Ward 33tt 1,204 1,265 7,133 3,881 3.252 406 363 · . 1,755 554 Ward 34ttt 936 1,003 5,535 2,957 2.578 577 484 8 3 951 295 Ward 35 569 578 3,191 1,670 1,521 346 335 675 214 Ward 36 330 332 1,572 798 774 109 144 227 54
Special Charges. 953 972 5,522 3,535 1,987 224 203 9 9 2,250 743
II GANGASHAHAR
Ward 1 369 422 2,490 1,178 1,312 116 121 631 403 Ward 2 321 339 2,112 1,040 1,072 30 22 •• 537 251 Ward 3 538 615 3,582 1.673 1,909 6 4 1 1,020 635 Ward 4 444 508 2,512 _1_;.,_16_1 __ _.,;1,~35_1 ___ .::.21~_--=2:.:.1 _ __.::....:..._...:..: _ _.:6:.:....;84 480 ----- --------------------------------- ------
@lncludes Special Charge of Jail (391 M,64 F I **Includ~s Special Charge of Dungar College Hostel (31 MF) tIncludes Special Charge of! Veterinary College Hostel {129 M,14F,) II Maharani College Hostel (22F) and III Shardul Public School (206M. l8 F) ttlncludes Special Charge of Police (253 M, 130 F) tttlncludes Specia~ Charge of Medical ~,?l1ege Hostel for girls (1 M, .18 F ) "'Consists of Hospltal (629M, 307F), Mllitary (792M, 82P), and Railway (2,114M 1,598F)
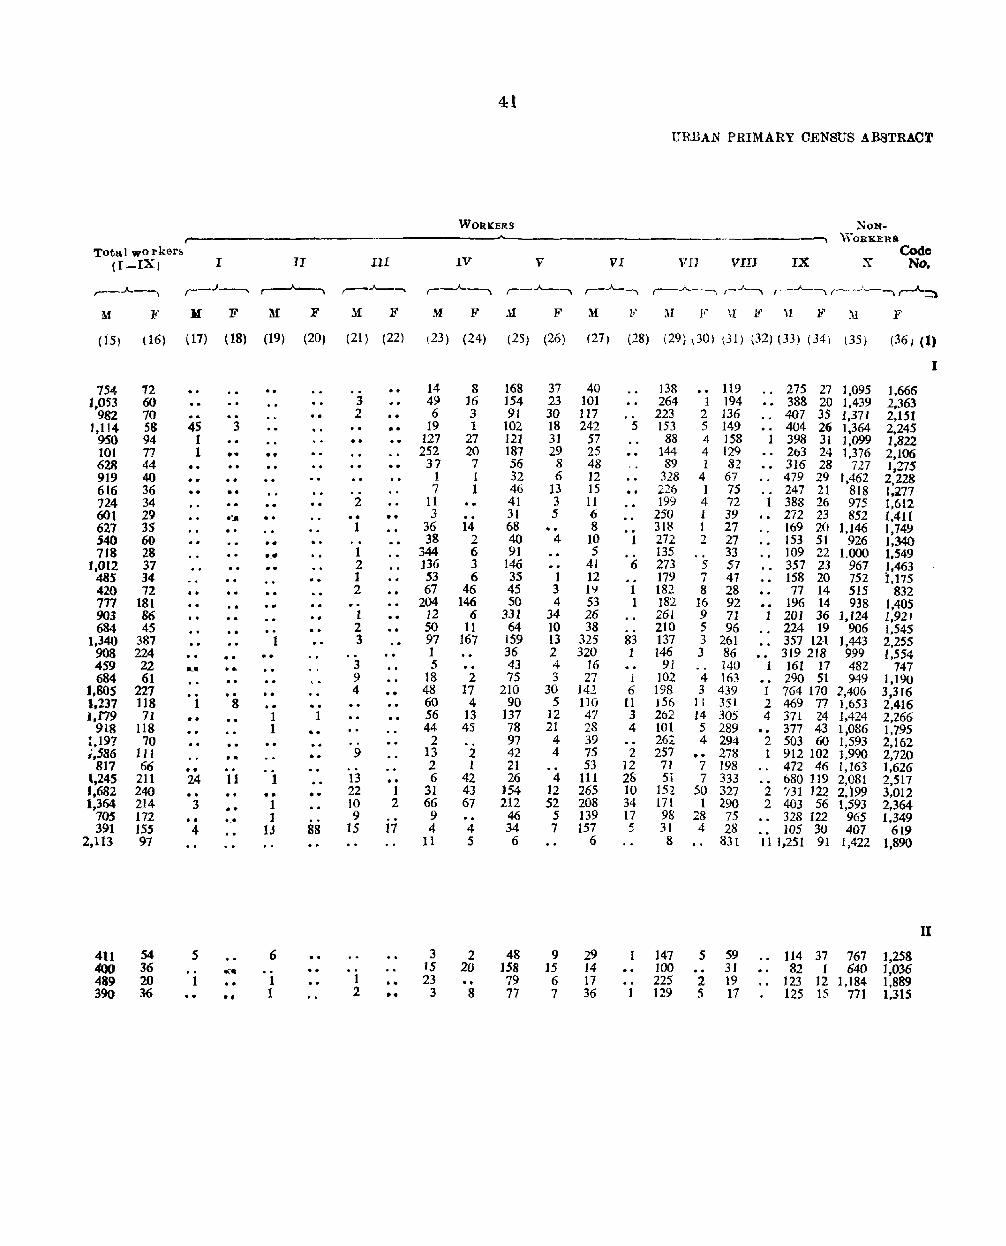
Total ,,0 r ker:; {I-IX)
,-_..A..-, M
( 15)
754-1,05)
982 1,114
950 101 628 919 616 724 601 627 j4()
718 1,012
485 420 7n 903 684
1,340 908 459 684
1,805 1.237 1.179
918 1,197 ~,586
817 \,245 1.682 1,364
70S 391
2,113
411 400 489 390
1<'
(16)
12 60 70 58 94 77 44 40 36 34 29 35 60 28 37 34 72
181 86 45
387 224 22 61
227 118 71
118 70
111 66
211 240 214 172 ISS 97
54 36 20 36
I
,-"" ___ }{
(17)
45 I 1 o. o. ..
..
a_a
1 ..
•• 24
3 • 0
4
5
1
F
(18)
3
•• • 0
••
....
. . .. .. . .
8
... 11
... ._ .
.;::.
••
II
~
M
(19)
o.
.. •• ._.
... 1
1 1
1 .. 1 1
1J
6
1 1
F
(20)
· .
· . 1 · . .. o •
88
III
~-..
M
(21)
3 2
.0
2 o. 1
1 2 1 2
1 2 3
3 9 4
9
13 22 JO 9
15
1 2
F
(22)
.0
..
..
.. 1 2
17
._ .
41
WOQ.KERS
IV
,_..A.._,
M
(23)
14 49 6
19 127 252 37
1 7
11 3
36 38
344 136 53 67
204 12 50 97 1 5
18 48 60 56 44
2 13 2 6
31 66 9 4
11
3 15 23
3
1<'
(24)
8 16 3 1
27 20 7 1 1 ..
14 2 6 3 6
46 146
6 11
167
2 17
4 13 45
2 1
42 43 67
4 5
2 20 ..
8
V
,_..A.._,
M
(25)
168 J54 91
102 121 187 56 32 46 41 31 68 40 91
146 35 45 50
331 64
159 36 43 75
210 90
137 78 97 42 21 26
154 212
46 34 6
48 158 79 77
F
(26)
37 23 30 18 31 29
8 6
13 3 5 .. 4
1 3 4
34 10 13 2 4 3
30 5
12 21
4 4
4 12 52
5 7
9 15 6 7
URBAN PRIMARY CENSUS ABSTRACT
NON-
~ "·OBKI!:R8 Code
VI vn VIII IX X No.
,_..A-, ,--..A._~, r-..A., r--"-, ,--'--, ,...._~
M
(27)
40 101 117 242
57 25 48 12 15 11 6 8
10 5
41 12 1':J 53 26 38
325 320
16 27
142 llO 47 28 39 75 53 III 265 208 139 157
6
29 14 17 36
l_j' :\I F \f If' U F :\1 F
(28) (29} \30) (31) (32) (33) (34) (35} (36) (1)
138 264
223 5 153
88 144 89
328 226 ]99
250 318 272 135
6 273 179
1 182 1 182
261 2]0
83 137 1 146
91 1 102 6 198
11 156 3 2()2 4 101
26:2 2 257
12 71 28 51 10 152 34 171 17 98
t: 31 J
8
1 147 100 225
1 129
119 1 ]94
2 136 5 149 4 158 4 129 I 82
4 67 ] 75 4 72 1 39 1 27 2 27
33 5 57 .. 47 I
8 28 16 92 9 71 5 96 3 261 3 86
140 4 163 3 439 II 351 14 305 5 289 4 294 .. 278 7 198 7 333
50 327 1 290
28 75 4 28
831
5 59 31
2 19 5 17
275 27 1,095 ],666 388 20 1,439 2,363 407 35 1,371 2,151 404 26 1,364 2,245
1 398 31 1,099 1,822 203 24 1,376 2,106 316 28 727 1.275 479 29 1,462 2,228 247 21 818 1.277
1 388 26 975 1,612 .. 272 23 852 1,411 169 20 1,146 1,749 153 51 926 1,340 109 22 1.000 1,549 357 23 967 } ,463 158 20 752 1,175 77 14 515 832
196 14 938 1,405 1 201 36 1,124 1,92'
224 19 906 1,545 357 121 ],443 2,255 319 218 999 1,554 161 17 482 741 290 51 949 1,190
1 764 170 2,406 3,316 2 469 77 1,653 2.416 4 371 24 1,424 2,266 .. 377 43 1,086 1,795 2 503 60 1,593 2,162 1 912 102 1,990 2,720
472 46 1,163 1,626 680 119 2,081 2,511
2 731 122 2,)99 3,012 2 403 56 1,593 2,364
328 122 965 1.349 105 30 407 619
11 1,251 91 1,422 1,890
114 37 767 1,258 82 J 640 1,036
123 12 1,184 1,889 125 15 771 l,31S
I
u
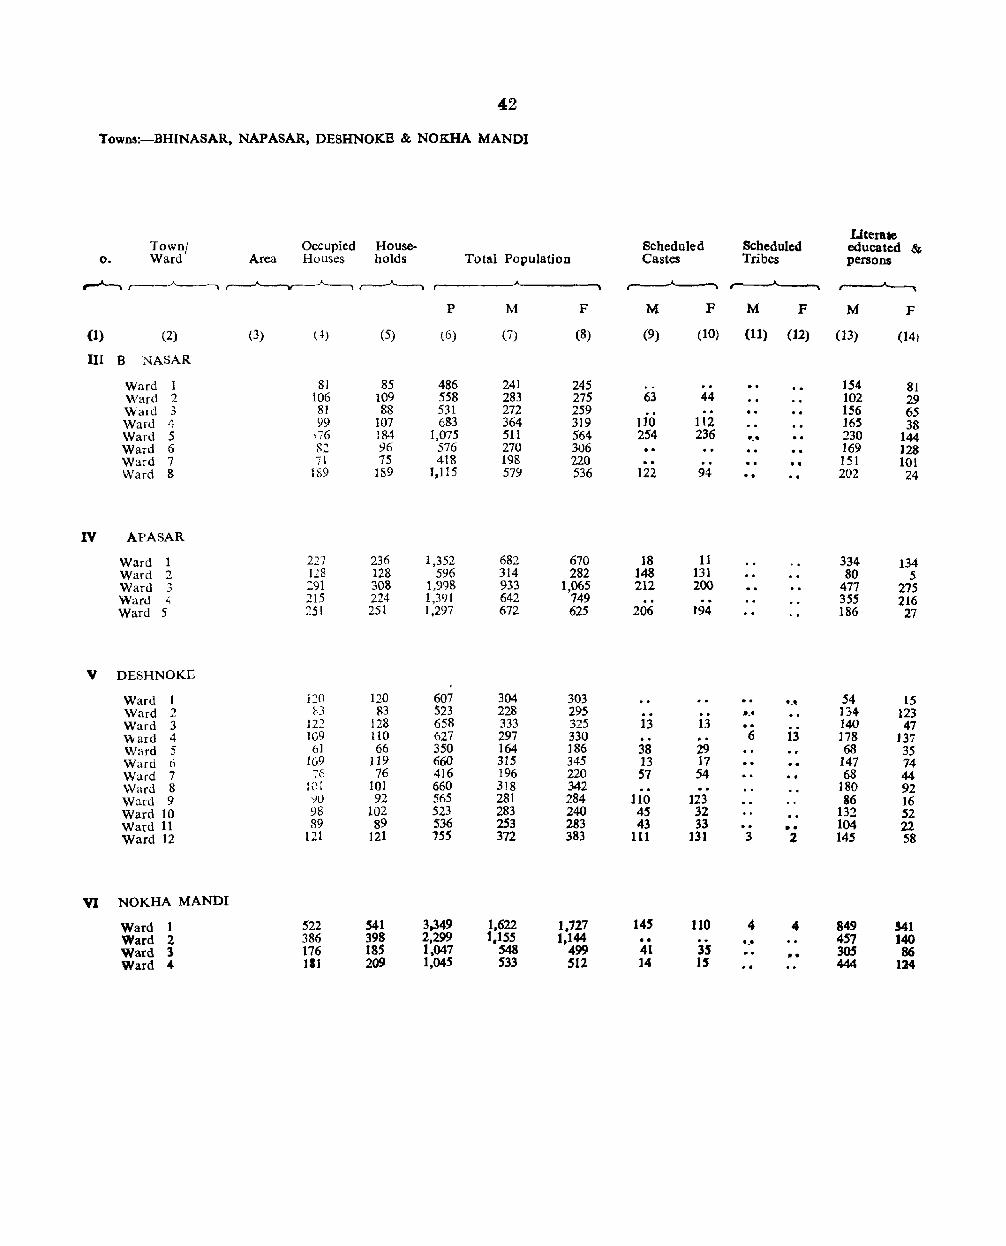
42
Towns:-BHINASAR, NAPASAR, DESHNOKB & NOKHA MANDl
Town! Occupied House-o. Ward Area Houses holds
~~ r-----'---. ,.----'----y--~ ~
(1) (2)
III B NASAR
Ward 1 Ward 2 Wald 3 Ward '1-Ward 5 Ward 6 Ward 7 Ward 8
IV APASAR
Ward Ward 2 Ward
., _, Ward .; Ward 5
V DESHNOKE
Ward I Ward 2 Ward 3 \\' ard 4 W3rd 5 Ward 6 Ward 7 Ward 8 Ward 9 Ward 10 Ward 11 Ward 12
VI NOKHA MANDl
Ward 1 Ward 2 Ward 3 Ward ..
(3) (-+)
81 106
81 99
,76 K2 7l
189
227 128 :91 215 251
i:~O (.J
122 109 61
IG9 76
lC~ ')[)
98 89
121
522 386 176 111
(5)
85 109 88
107 184 96 75
189
236 128 308 224 251
120 83
128 110 66
119 76
101 92
102 89
121
541 398 185 209
P
(6)
486 558 531 683
1,075 576 418
1,115
1,352 596
1,998 1,391 1,297
607 523 658 627 350 660 416 660 5(;5 523 536 155
3,349 2,299 1,047 1.045
Total Population
M
(7)
241 283 272 364 511 270 198 579
682 314 933 642 672
304 228 333 297 164 315 196 318 281 283 253 372
1,622 t,155
548 533
F
(8)
245 275 259 319 564 306 :220 536
670 282
1,065 749 625
303 295 325 330 186 345 220 342 284 240 283 383
1,727 1,144
499 512
Scheduled Castes
M
(9)
63
110 254 .. 122
18 148 212
206
13
38 13 57
110 45 43
111
145
41 14
F
(10)
44
112 236
94
11 131 200
194
13
29 17 54
123 32 33
131
110
3S 15
Scheduled Tribes
A
M F
(11) (12)
._. ..
• °
.:. -_" · . 6 13
•• 3 2
4 4 o_. ._. • 0
Literate educated & persons
~
M
(13)
]54 102 156 16S 230 169 151 202
334 80
477 355 186
54 134 ]40 178 68
147 68
180 86
132 104 145
849 457 305 444
F
(14)
81 29 65 38
144 128 101 24
134 5
275 216
27
15 123 47
137 35 74 44 92 16 52 22 58
541 140 86
124
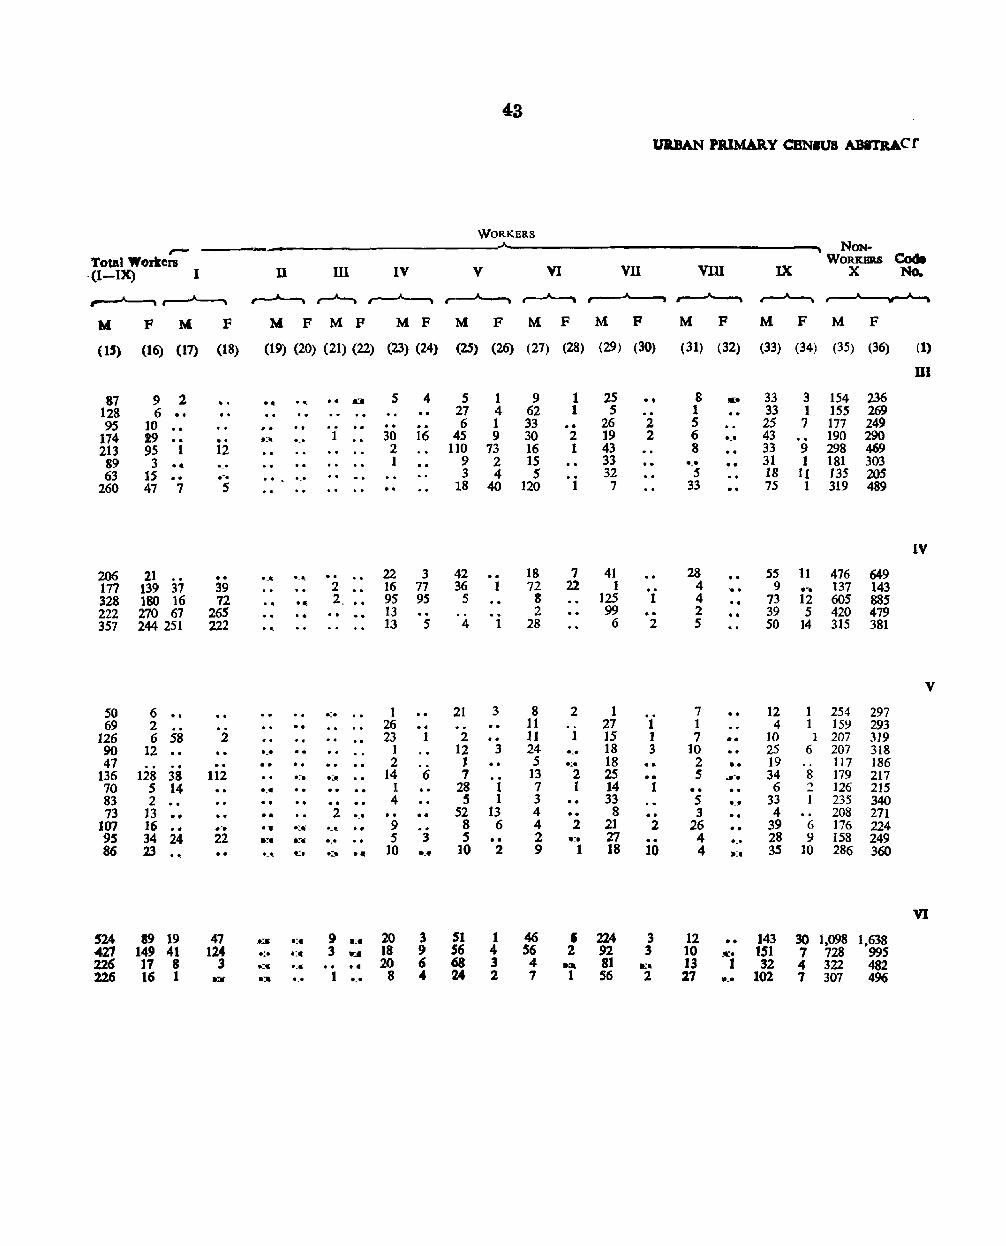
,..Total Workers -(I-IX) 1
~. _ ___.JA,-_
N F F
D ill IV
M F M F M F M
43
WORKERS
v VI VII
F M F M F
URBAN PIUMAR.Y CBNlU8 ABlTRACr
YIn
M F
IX
NONWORKBR.S Code
X No-
M F M F
(15) (16) (17) (IS) (19) (20) (21) (22) (23) (24) (25) (26) (27) (28) (29) (30) (31) (32) (33) (34) (35) (36) (1)
87 128 95
. 174 213 89 63
260
9 2 6 ••
10 19 9S 1
3 •• IS 47 7
206 21 177 139 37 328 180 16 222 270 67 357 244 251
50 69
126 90 47
136 70 83 73
107 9S 86
524 421 226 126
6 2 6 5S
12
128 38 5 14 2
13 ". 16 •• 34 24 23 ,_~
89 19 149 41 17 8 16 1
.. .
" . 12 ,_. .-, 5
00
39 72
265 222
2 .. 112
.0. 22 • 0
47 124
3
.. .~
.. .._ ...
'_'"
, . . "_
••
._01 '0. •• 0" ._ ..
• .:c .:.
'_"
o.
00 .. o •
o •
.:-. 00
o 0
o_oI
'00
o. A:lI
1
. . . . 2 •• 2,
.0 2 o_o
"'_t; ••
o_o . .:., ..
9' .~. 3 ..-..
o_" I o_o
s
30 2 1
4
16
22 3 16 77 9S 95 13 13 5
1 26 23
I 2
14 I 4
9 5
10
20 18 20
8
, . 1
6 . , •• 3
3 9 6 ..
S 1 21 4 6 1
45 9 110 73
9 2 3 4
18 40
42 36
5
4
21
2 12
J 1
28 5
52 8 5
10
51 56 68 24
1
1
3
3
1 1
13 6 .. 2
1 4 3 2
9 62 33 30 16 15 5
120
18 72
S 2
28
8 11 11 24 5
13 1 3 4 4 2 9
46 56 4 7
1 1
2 1
. , 1
7 22
2 . . 1
O_" ..:. 2 t
2
, 2
25 5
26 19 43 33 32 7
41 1
125 99 6
1 21 15 18 18 25 14 33
8 21 27 18
224 92 81 56
•• 2 2
"_'
1
2
" . 1 1 3
•• 1
2 .. 10
3 3
8 1 5 6 8 ._. 5
33
28 4 4 2 5
7 1 7
10 2 5 .0. S 3
26 4 4
12 10 13 27
.: . "_. '0' .0
'0 ,
.0 ._o
•• o_"
•• ~.
1 ,,_"
33 33 2S 43 33 31 18 75
55 9
73 39 50
12 4
10 25 19 34 6
33 4
.39 28 35
143 151 32
102
.3 1 7
, . 9 1
11 1
11 e-. 12 5
14
154 236 155 269 177 249 190 290 298 469 181 303 135 205 319 489
476 649 137 143 605 885 420 479 315 381
1 254 297 293 319 318 186 217 215 340 271 224 249 360
1 159 1 207
6 207 117 179 126 235 208 176 158 286
.. 8 2 1
6 9
10
30 1.098 1,638 7 728 995 4 322 482 7 307 496
HI
IV
v
VI

OTHER CENSUS TABLES
Bika. 1

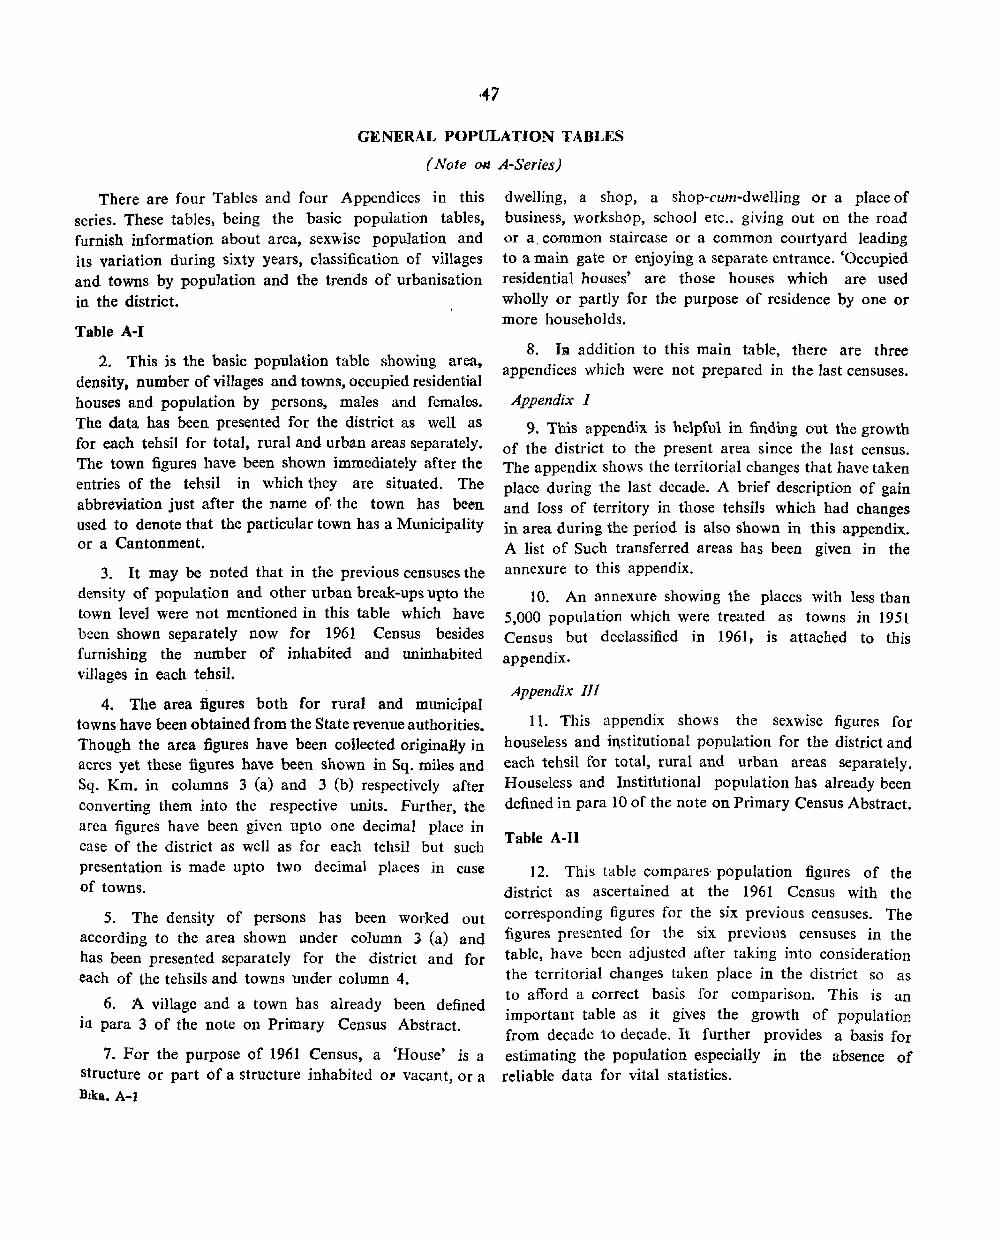
GENERAL POPULATION TABLES
(Note ON A-Series)
There are four Tables and four Appendices in this series. These tables, being the basic population tables, furnish information about area, sexwise population and its variation during sixty years, classification of villages and towns by population and the trends of urbanisation in the district.
Table A-I
2. This is the basic population table showing area, density, Dumber of villages and towns, occupied residential houses and population by persons, males and females. The d.ata has been presented for the district as well as for each tehsil for total, rural.and urban areas separately. The town figures have been shown immediately after the entries of the tehsil in which they are situated. The abbreviation just after the name of. the town has been used to denote that the particular town has a Municipality or a Cantonment.
3. It may be noted that in the previous censuses the density of population and other urban break-ups upto the town level were not mentioned in this table which have been shown separately now for 1961 Census besides furnishing the number of inhabited and uninhabited villages in each tehsil.
4. The area figures both for rural and municipal towns have been obtained from the State revenue authorities. Though the area figures have been collected originaJ.ly in acres yet these figures have been shown in Sq. miles and Sq. Km. in columns 3 (a) and 3 (b) respectively after converting them into the respective units. Further, the area figures have been given upto one decimal place in case of the district as well as for each tehsil but such presentation is made upto two decimal places in case of towns.
5. The density of persons has been worked out according to the area shown under column 3 (a) and has been presented separately for the district and for each of the tehsils and towns under column 4.
6. A village and a town has already been defined in para 3 of the note on Primary Census Abstract.
7. For the purpose of 1961 Census, a 'House' is a structure or part of a structure inhabited 01' vacant, or a Btka. A-I
dwelling, a shop, a shop~cum-dwelling or a place of business, workshop, school etc.. giving out on the road or a, common staircase or a common courtyard leading to a main gate or enjoying a separate entrance. 'Occupied residential houses' are those houses which are used wholly or partly for the purpose of residence by one or more households.
8. lR addition to this main table, there are three appendices which were not prepared in the last censuses.
Appendix I
9. This appendix is helpful in finding out the growth of the district to the present area since the last census. The appendix shows the territorial changes that have taken place during the last decade. A brief description of gain and loss of territory in those tehsils which had changes in area during the period is also shown in this appendix. A list of Such transferred areas has been given in the annexure to this appendix.
10. An annexure showing the places with less than 5,000 population which were treated as towns in 1951 Census but declassified in 1961, is attached to this appendix.
Appendix III
11. This appendix shows the sexwise figures for houseless and iqstitutional population for the district and each tehsil for total, rural and urban areas separately. Houseless and Institutional population has already been defined in para 10 of the note on Primary Census Abstract.
Table A-II
12. This table compares' population figures of the district as ascertained at the 1961 Census with the corresponding figures for the six previous censuses. The ligures presented for the six previous censuses in the table, have been adjusted after taking into consideration the territorial changes taken place in the district so as to afford a correct basis for comparison. This is an important table as it gives the growth of popUlation from decade to decade. It further provides a basis for estimating the popUlation especially in the absence of reliable data for vital statistics.
The main change in this table over 1951 Census is that the percentage variation has also been mentioned from decade to decade.
13. The appendix attached to this table shows the population for the district as well as for each tehsil according to their territorial jurisdiction in 1951 besides furnishing the changes in area and the population involved in those changes that have taken place during the last decade. The details of transfers of areas and population in every case have been given in the footnote separately.
Table A-ru 14. This table furnishes the sexwise total rural
population together with the number of inhabited villages for the district as well as for each tehsil arranged into seven population size groups viz., less than 200, 200-499, 500-999, 1,000-1,999, 2,000-4,999, 5,000-9,999 and 10,000 and above.
15. The main changes in this table over 1951 Census are (i) the group less than 500 has now been split up into two groups viz., less than 200 and 200-499 and (m it relates only to villages while in 1951 Census it related to villages and towns both.
Table A-IV
16. This table shows the growth of each town in the district since 1901 together with its sexwise population. It further furnishes the information regarding decade variation in population and its percentage. For the pnrpose of this table all the towns have been classified into the
43
following six classes according Class I Class II Class III Class IV Class V Class VI
to population:-1,00,000 and above
50,000 - 99,999 20,000 - 49,999 10,000 - 19,999 5,000 - 9,999
Less than 5,000
17. The district totals for a class have been given followed by the various towns in that particular Class. Column No.2 of the table presents the name of the town and just under it the area of that town has been given both in Sq. miles and Sq. Km. The status of the town is separately shown in column No. 3 in an abbr~viated form.
18. The main object of this table as indicated above is to show the growth of towns as towns and not how certain places have been converted into towns from vilJages as such the figures against towns have been shown for those decades only in which they were recognised as towns. The district population for all classes during the previous decades has been arrived at after adding the population of those places which were treated as towns in the corresponding decade but now declassified. As such if a town had not been treated as town in all the previous censuses, it is indicated as declassified in those particular censuses. Towns treated for the first time in 1951 Census have been asterisked*.
19. The change in this table over 1951 Census is that the areas of towns as well as the percentage of decade variations of total population of the towns have been additionally shown in the present census.
)G. A separate volume-Part II-A incorporating the General Population Tables for the State and the districts have been issued in which the concepts used have also been discussed.
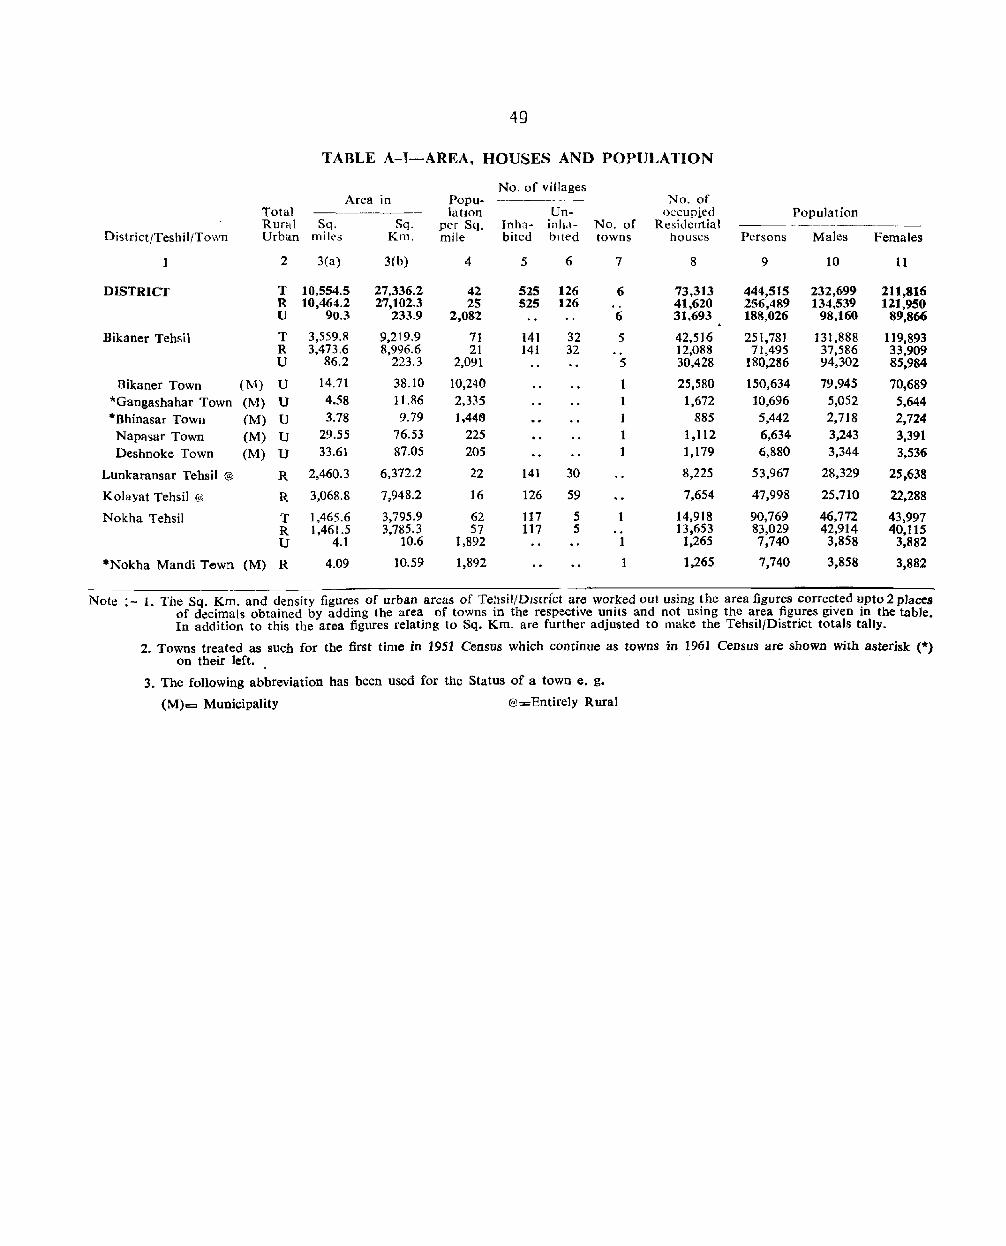
49
TABLE A-I-AREA, HOUSES AND POPULATION
No. of villages Area in Popu- --------~--~- No. of
Total -~-----.-~ latlOD Un- o<:cupied Population Rural Sq. Sq. per Sq. Inh<"i- inliLI- No. of Residcrrtial ---~-------
District/Teshil/Town Urban milt's Km. mile bited blted towns houses Persons Males Females
1 2 3(a) 3(b) 4 5 6 7 8 9 10 II
DISTRICT T 10,554.5 27,336.2 42 525 126 6 73,313 444,515 232,699 211,816 R 10,464.2 27,102.3 2S 525 126 41,620 256,489 134,539 121,950 U 90.3 233.9 2,082 6 31,693 188,026 98,160 89,866
Bikaner Tehsil T 3,559.R 9,219.9 71 141 32 5 42,516 251,781 131,888 119,893 R 3,473.6 8,996.6 21 141 32 12,088 71,495 37,586 33,909 U 86.2 223.3 2,091 5 30,428 180,2M 94,302 85,984
Bikaner Town (M) U 14.71 38.10 10,240 1 25,580 150,634 79,945 70,689 *Gangashahar Town (M) U 4.58 11.R6 2,335 1 1,672 10,696 5,052 5,644 *Bhinasar Town (M) U 3.78 9.79 1,4419 1 885 5,442 2,718 2,724
Napasar Town (M) U 29.55 76.53 225 1 1,112 6,634 3,243 3,391 Deshnoke Town (M) U 33.61 87.05 205 1 1,179 6,880 3,344 3,536
Lunkaransar Tehsil @ R 2,460.3 6,372.2 22 141 30 8,225 53,967 28,329 25,638
Kolayat Tehsil @ R 3,068.8 7,948.2 16 126 59 7,654 47.998 25,710 22.288
Nokha Tehsil T 1,465.6 3,795.9 62 117 5 1 14,918 90,769 46,772 43,997 R 1,461.5 3.785.3 57 117 5 13,653 83,029 42,914 40,115 U 4.1 10.6 1,892 1 1,265 7,740 3,858 3,882
*Nokha Mandi Tewn (M) R 4.09 10.59 1,892 1 1.265 7,740 3,858 3,882
Note :- 1. The Sq. Km. and density figures of urban areas of Tehsil/OJS[rfct are worked out using the area figures corrected upto 2 places of decimals obtained by adding the area of towns in the respective units and not using the area figures given in the table. In addition to this the area figures relating to Sq. Km. are further adjusted to make the Tehsil/District totals tally.
2. Towns treated as such for the first time in 1951 Census which continue as towns in 1961 Census are shown with asterisk (*) On their left.
3. The following abbreviation has been used for the Status of a town e. g.
(M)= Municipality @=Entirely Rural

·~o
APPENDIX I TO TABLE A-I
Statement showing 1951 territorial onits constituting the present set up of the district 1.
(Only those names/areas which have undergoMe chang.es since 1951. have been shown below)
Details of gain in territories Details of IDss in territories
Area Area (+> Gain 1951 Symbol Symbol Net area (-) Loss
District! Territorial No. Brief Des- Sq. Sq. No. Brief Des- Sq. Sq. Tehl>iJ Units cription miles Km. cription miles Km. Sq. miles Sq. Km.
1 2 3 3a 4 5 6 6a 7 8 9 10
DISTRICT Bikaner 1 43 villages and 3 N.A. N.A. <+) N.A. (+) N . .4. District hamlets viz. Akalwa-
la, Gulamwala and Maganwala trans-ferred from former Bap Tehsil of Jai-sal mer District
Bikaner Bikaner 1 village Mudsar 26.4 68.4 <+> 26.4 <+) 68.4 Tehsil Tehsil (Code No. 109)
transferred from Nokha Tehsil
Kolayat KoJayat 2 43 villages and 3 N.A. N.A. (+> N.A. (+) N.A. Tehsil Tehsil hamlets viz. Akalwa-
la, Guiaillwala and Maganwala trans-ferred from former Bap Tehsll of Jai-salmer District
Nokha Nokha 1 vmnge Mudsar 26.4 68.4 (-) 26.4 (-) 68.4 Tehsil Tehsil (€tide No. '~O9)
transferred to Bikaner Tehsil
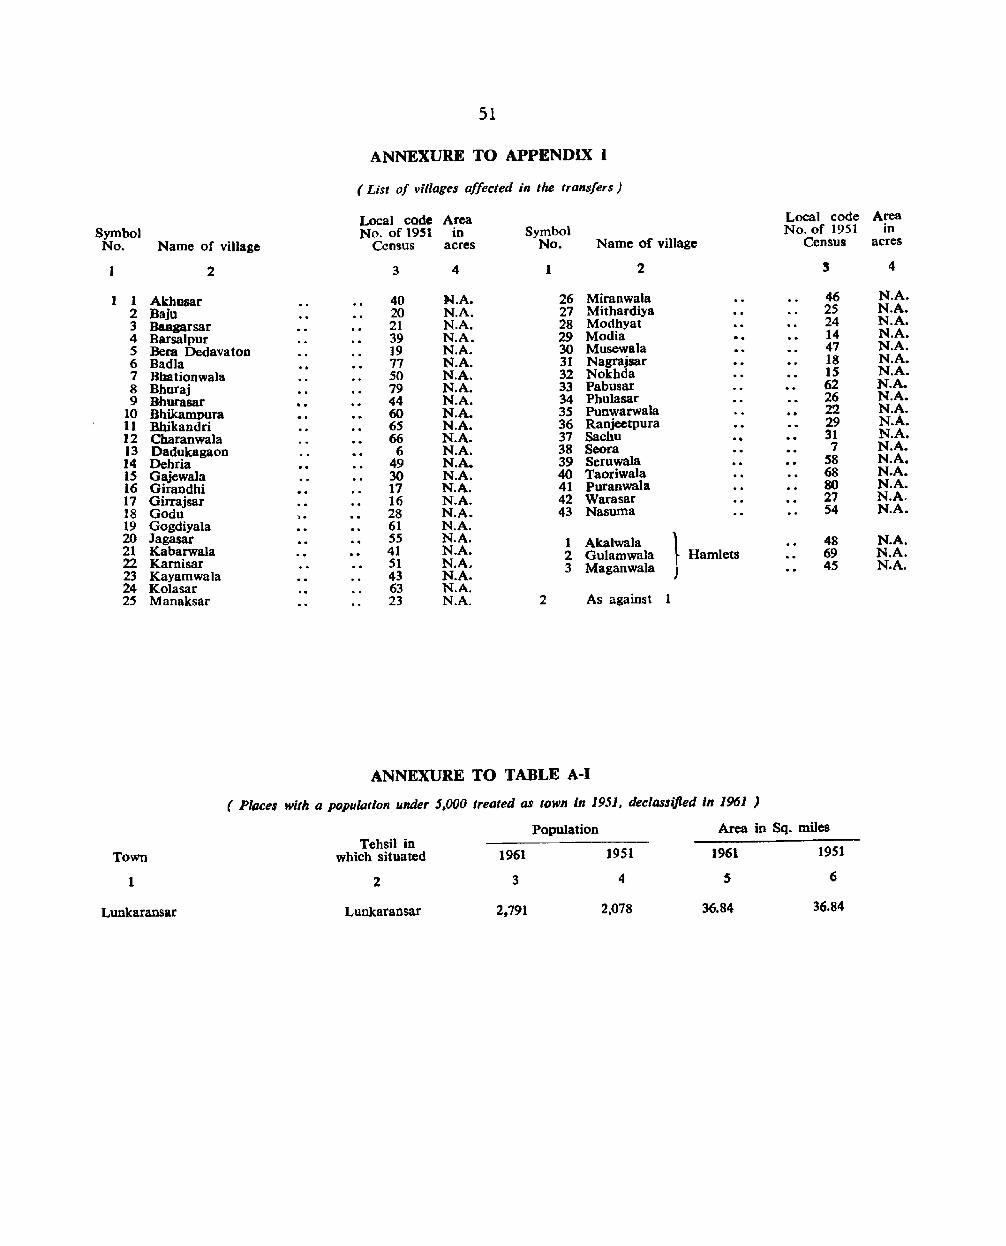
51
ANNEXURE TO APPENDIX 1
( List of villages affected in the trallsfers)
Local code Area Local code Symbol No. of 1951 in Symbol No. of 1951 No. Name of village Census acres No. Name of village Census
1 2 3 4 1 2 5
1 1 Akhusar 40 :N.A. 26 Miranwala 46 2 Baju 20 N.A. 27 Mithardiya 25 3 BaBgarsar 21 N.A. 28 Modhyat 24 4 Barsalpur 39 N.A. 29 Modia .. 14 5 Bera Dedavaton 19 N.A. 30 Musewala 47 6 BadIa 77 N.A. 31 Nagrajsar 18 7 Bbationwala 50 N.A. 32 Nokhda IS 8 Dburaj 79 N.A. 33 Pabusar 62 9 Bhurasar 44 N.A. 34 Phulasar 26
10 Dhikarnpura 60 N.A. 35 Punwarwala 22 H Bhikandri 65 N.A. 36 Ranjeetpura 29 12 Charanwala 66 N.A. 37 Sachu 31 13 Dadukagaon 6 N.A. 38 Seora 7 14 Debria 49 N.A. 39 Seruwala 58 15 Gajewala 30 N.A. 40 Taoriwala 68 16 Girandhi 17 N.A. 41 Puranwala 80 17 Girrajsar 16 N.A. 42 Warasar 27 18 Godu > • 28 N.A. 43 Nasuma 54 19 Gogdiyala 61 N.A. 20 Jagasar 55 N.A. 1 Akalwala } 48 21 Kabarwala 41 N.A. 22 Kamisar 51 N.A. 2 Gulamwala Hamlets 69
23 Kayamwala 43 N.A. 3 Maganwala 45
24 Kolasar 63 N.A. 25 Manaksar 23 N.A. 2 As against 1
ANNEXURE TO TABLE A-I
( Places with a population under 5.000 treated as town in 1951 t declassifted In 1961 )
Town
1
Lunkaransar
Tehsil in which situated
2
Lunkaransar
1961
3
2,791
Population
1951
4
2,078
Area in Sq. miles
1961
S
36.84
1951
6
36.84
Area in
acres
4
N.A. N.A. N.A. N.A. N.A. N.A. N.A. N.A. N.A. N.A. N.A. N.A. N.A. N.A. N.A. N.A. N.A. N.A.
N.A. N.A. N.A.

52
APPENDIX III TO TABLE A-I
Houseless and Institutional Population
Total Houseless Population Institutional population
Rural District/Tebsil Urban Persons Males Females Persons Males Females
1 2 3 4 5 6 7 8
DISTRICT T 633 542 91 2.413 2,139 274
R 243 179 64 946 860 86
U 390 363 27 1,467 1,279 188
Bikaner Tebsil T 440 389 SI 1.904 1,687 217
R SO 26 24 460 431 29
U 390 363 27 1,444 1,256 188
Lunkaransar Tebsil* R 72 66 (:i 84 46 38
Kotayat Tebsi1* .. R 116 85 31 298 292 6
Nokha Tehsil T 5 2 3 127 114 13
R 5 2 3 104 91 13 23 23
U
* Entirely Rural
TABLE A-II-VARIATION IN POPULATION DURING SIXTY YEARS (1901-1961)
Percentage Decade decade
District Year Persons variation variation Males Females
1 2 3 4 S 6 7
BIKANER 1901 190,457 99,407 91,050
1911 206,770 + 16,313 + 8.57 108,583 98,187
1921 198,652 8,118 3.93 105,365 93,287
1931 234,882 + 36,230 + 18.24 124,256 110,626
1941 315,418 + 80,536 + 34.29 169,264 ' 146,154
1951 343.091 + 27,673 + 8.77 178,257 164.834
1961 444,515 + 101,424 + 29.56 232,699 211,816
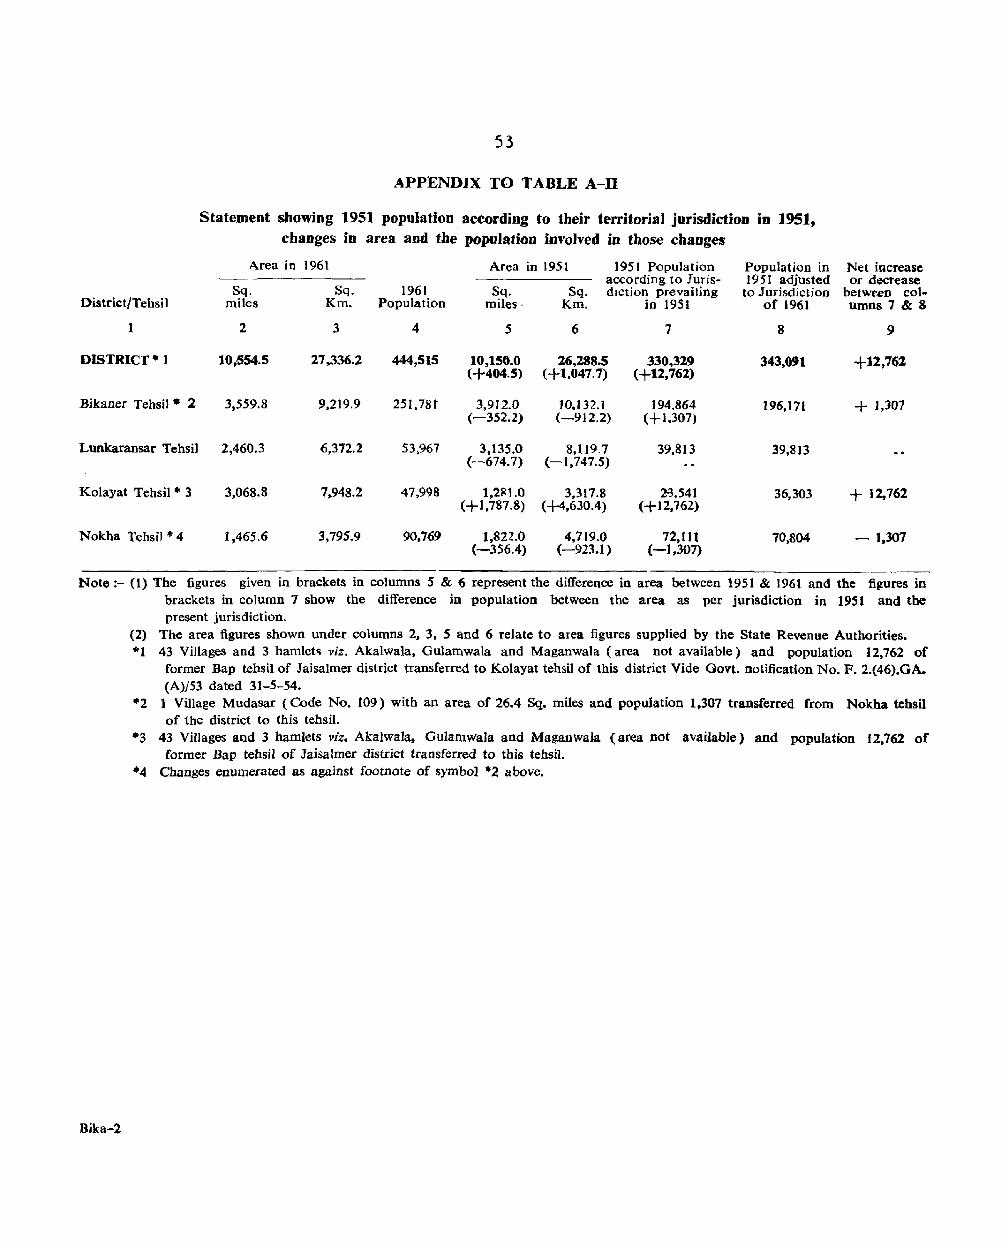
53
APPENDJX TO TABLE A-D
Statement showing 1951 population _ according to their territorial jurisdiction in 1951, changes in area and the population involved in those changes
Area in 1961 Area in 1951 1951 Population Population in Net increase according to Iuris- 1951 adjusted or decrease
Sq. Sq. 1961 to Jurisdiction between co] .. Sq. Sq. diction prevailing District/Tehsil miles Km. Population miles, Km. in 1951 of 1961 umns7&8
1 2 3 4 5 6 7 8 9
DISTRICT-l 10,554.5 27,336.2 444,515 10,150.0 26,288.5 330,319 343,091 +12,762 (+404.5) (+1,047.7) (+12,762)
Bikaner Tehsil· 2 3,559.8 9,219.9 25I,7St 3,912.0 10,02.1 J94.864 196.171 + ),307 (-352.2) (-912.2) (+1.307)
Lunkaransar Tehsil 2,460.3 6,372.2 53,967 3,135.0 8,119_7 39.813 39,813 (-674.7) (-1,747.5)
Kolayat Tehsil· 3 3,068.8 7,948.2 47,998 1,2Rl.0 3.317.8 2-3,541 36,303 + 12,762 <+1,787.8) (-1-4,630.4) <+12,762)
Nokha Tehsil'" 4 1,465.6 3.795.9 90.769 1.822.0 4.719.0 72,111 70,804 - 1.307 (-356.4) (-923.1) (-1,307)
Note :- (l) The figures given in brackets in columns 5 & 6 represent the difference in area between 1951 & 1961 and the figures in brackets in column 7 show the difference in population between the area as per jurisdiction in 1951 and the present jurisdiction.
Bika-2
(2) The area figures shown under columns 2. 3. 5 and 6 relate to area figures supplied by the State Revenue Authorit;es. *1 43 Villages and 3 hamlet~ viz. Akalwala. Gulamwala and Maganwala (area not available) and population 12,762 of
former Bap tehsil of Jaisalmer district transferred to Kolayat tehsil of this district Vide Govt. notification No. F. 2.(46).GA. (A)J53 dated 31-5-54.
*2 1 Village Mudasar (Code No. 109) with an area of 26.4 Sq. miles and population 1,307 transferred from Nokha tehsil of the district to this tehsil.
-3 43 Villages and 3 hamlets viz. Akalwa]at GulamwaJa and MaganwaIa (area not available) and population 12,762 of former Bap tehsil of Jaisalmer district transferred to this tehsil.
-4 Changes enumerated as against footnote of symbol *2 above.
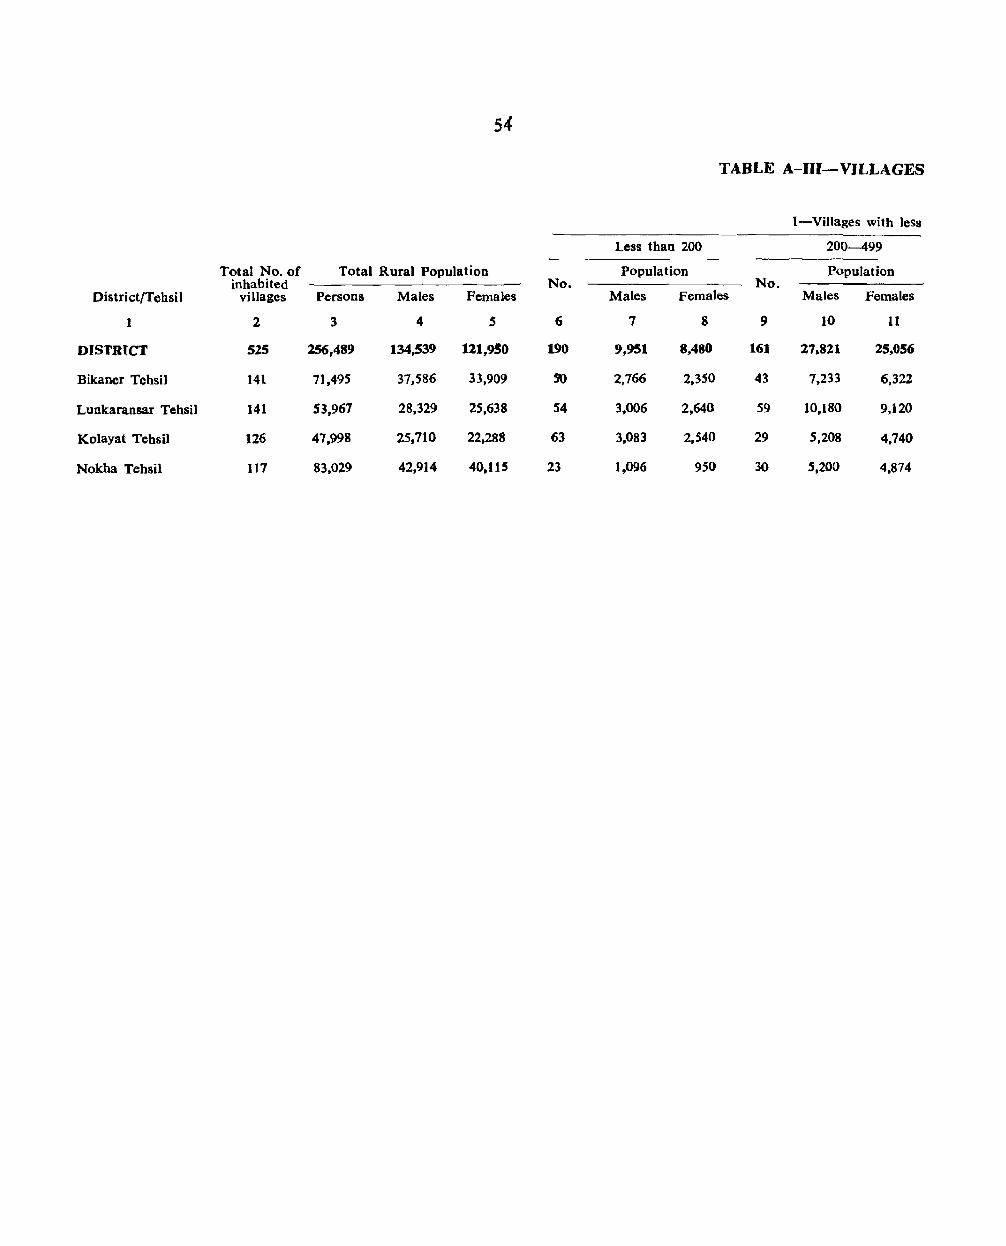
54
TABLE A-Ill-VILLAGES
[-Villages with less
Less than 200 200-499
Total No. of Total Rural Population Population Population inhabited No. No.
District/Tehsil villages Persons Males Females Males Females Males Females
1 2 3 4 5 6 7 8 9 10 II
DISTRICT 525 256,489 134,539 121,950 190 9,951 8.480 161 27.8Zl 25.056
Bikaner Tehsil 141 71.495 37.586 33,909 ~ 2,766 2,350 43 7,233 6,322
Lunkaransar Tehsil 141 53,967 28.329 25,638 S4 3.006 2,640 59 10.180 9,120
Kolayat Tehsil 126 47,998 25,710 22.288 63 3,083 2,540 29 5,208 4,740
Nokha Tehsil 1J7 83.029 42,914 40,115 23 1,096 950 30 5,200 4.874
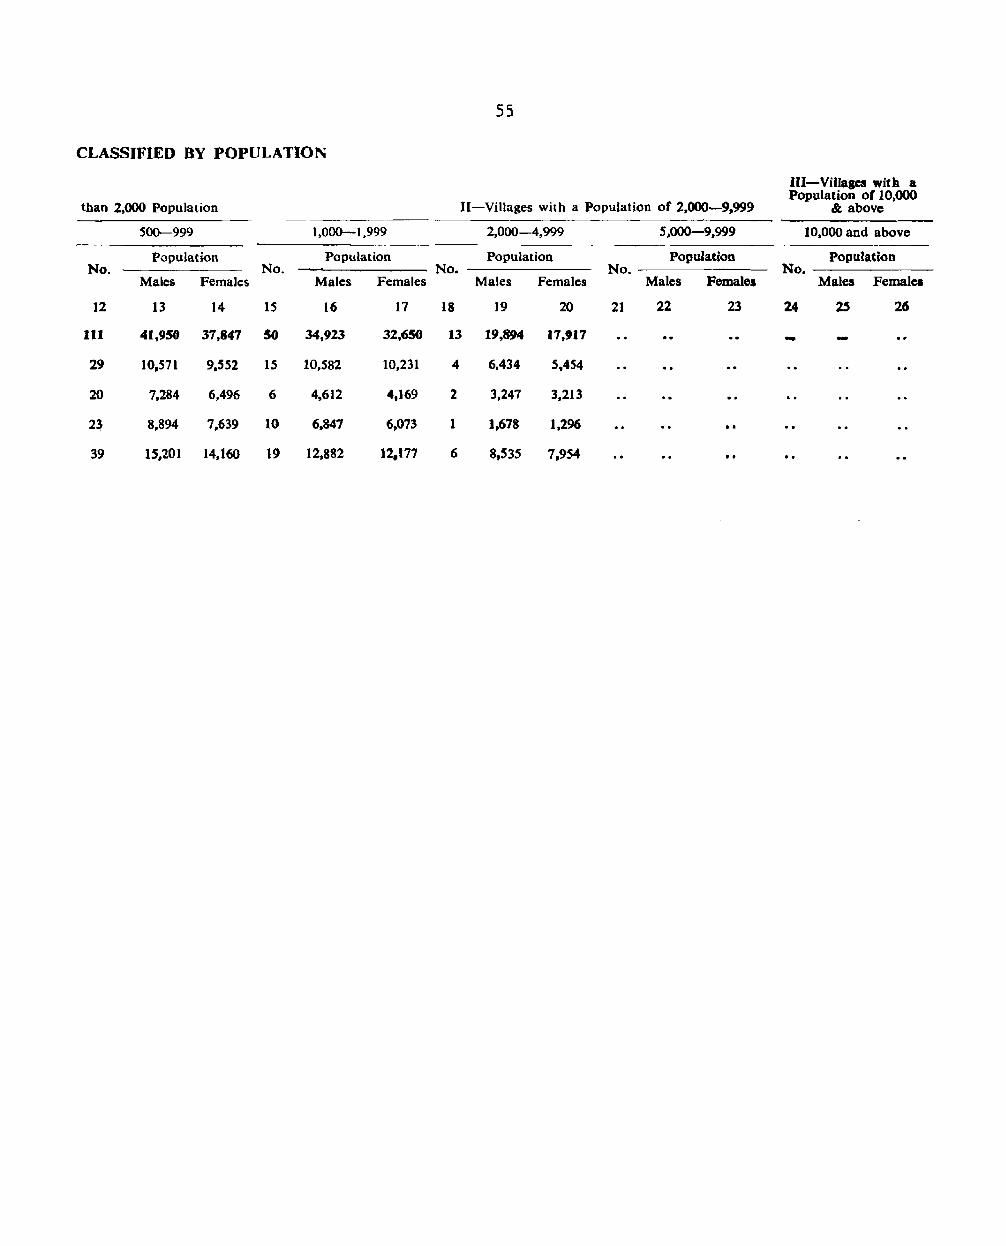
55
CLASSIFIED BY POPULATION
III-ViIlagcs wita a
II-Villages with a Population of 2.000-9t999 Population of 10.000
than 2,000 Population & above
500-999 1.000-1,999 2,000-4,999 5,000-9,999 10,000 and above
Population Population Population Population Population No. No. No. No. No.
Males Females Males Females Males Females Males Females Males Femalea
12 13 14 15 16 17 18 19 20 21 22 23 24 25 26
111 41,950 37,847 50 34,923 32,650 13 19,894 17,917 -29 10,571 9.552 15 10,582 10,231 4 6,434 5,454
20 7,284 6,496 6 4,612 4,169 2 3,247 3,213
2~ 8,894 7,639 10 6.847 6,073 1 1,678 1,296
39 15,201 14.160 19 12,882 12,t17 6 8,535 7,954 .. . .
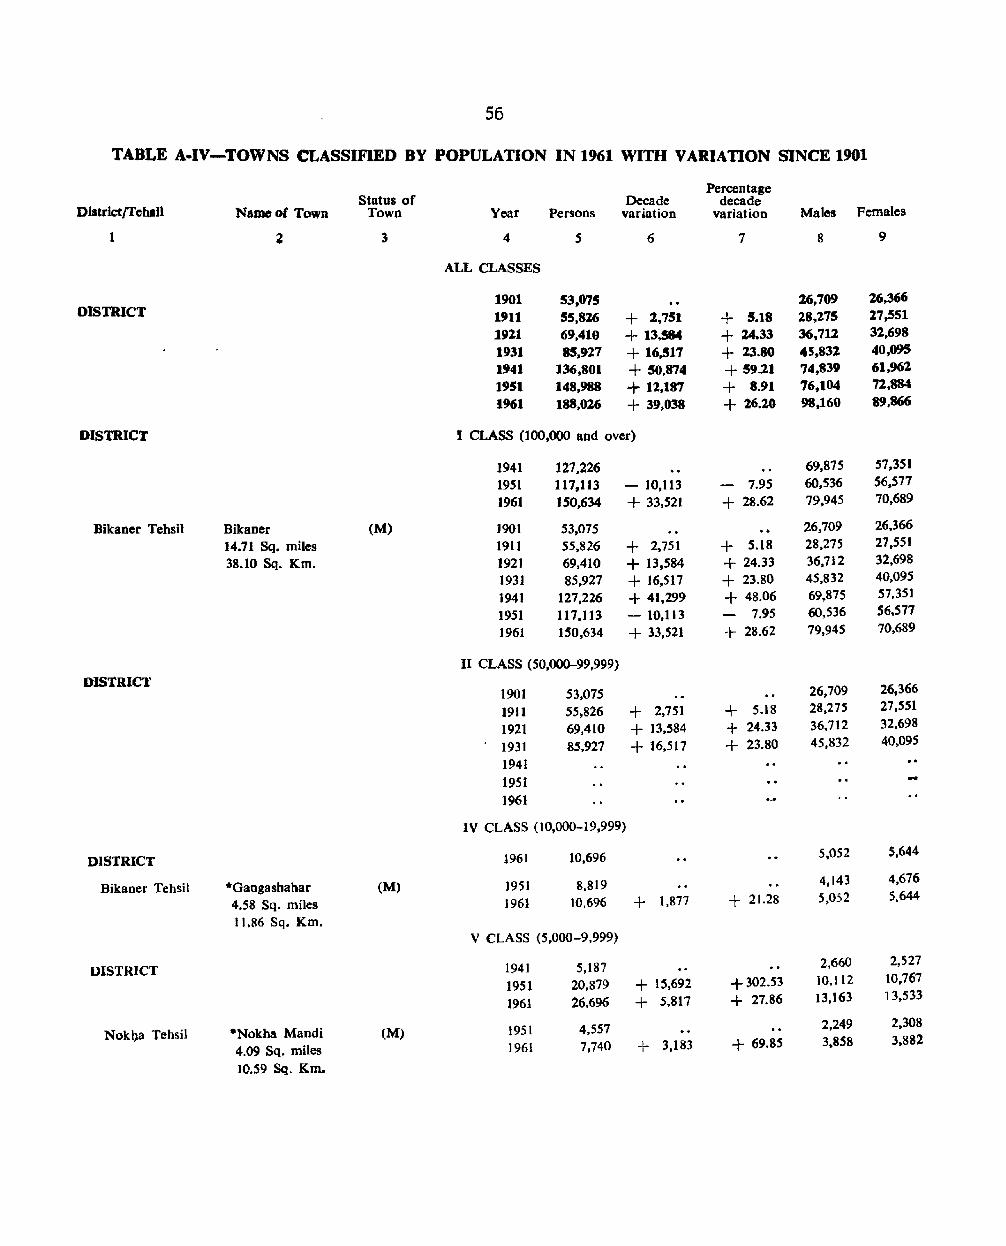
56
TABLE A-IV-TOWNS CLASSIFIED BY POPULATION IN 1961 WITH VARIATION SINCE 1901
Status of Percentage
Decade decade District/TcbJU Name of Town Town Year Persons variation variation Males Females
1 ~ 3 4 S 6 7 8 9
ALL CLASSES
1901 S3,075 %6,709 26.366 DISTRICT I'll 55,826 + %,751 + 5.18 28,27S 27,551
1921 69,410 + 13,584 + 24.33 36,712 32,698
1931 85,927 + 16.!17 + 23.80 45,832 40,095
1941 136,801 + 50,874 + 59.21 74,839 61,962
1951 148,988 + 12,187 + 8.91 76,104 72,884
1961 188,026 + 39,038 + %6.20 98 t1 6'0 89,866
DISTRICT I CLASS (100,000 and over)
1941 127,226 69,875 57,351
1951 117,113 - 10,113 7.95 60,536 56,S77
1961 150,634 + 33,521 + 28.62 79,945 70,689
Bikaner Tehsil Bikaner (M) 1901 53,075 26.709 26,366
14.71 Sq. miles 1911 55,826 + 2.751 + 5.18 28,27S 27,551
38.10 Sq. Km. 1921 69,410 + 13,584 + 24.33 36,712 32.698
1931 85,927 + 16,517 + 23.80 45,832 40,095
1941 127,226 + 41,299 + 48.06 69.875 57,351
1951 117,113 - 10.113 7.95 60,536 56.571
1961 150,634 + 33,521 +- 28.62 79,945 70,689
II CLASS (50,000-99,999)
DlSTRIC1' 26,709 26,366 1901 53,075
1911 55.826 + 2,751 + 5.18 28,275 27,551
1921 69.410 + 13,584 + 24.33 36.712 32.698
1931 85,927 + 16.517 + 23.80 45,tB2 40,095
1941
1951 -1961
IV CLASS (10,000-19,999)
DISTRICT 1961 10,696 5,052 5.644
Bikaner Tehsil *Gangashahar (M) ]951 8.819 4,143 4.676
4.58 Sq. miles 1961 10.696 + 1,877 + 21.28 5,052 5.644
1 1.86 Sq. Km. V CLASS (5,000-9,999)
DISTRICT 1941 5,187 2,660 2,527
1951 20,879 + 15,692 +302.53 10,112 10,767
1961 26,696 + 5,817 + 27.86 13,163 13,533
Nokl)a Tehsil ·Nokha Mandi (M) 1951 4,557 2,249 2.308
4.09 Sq. miles 1961 7,740 + 3,183 + 69.85 3,858 3.882
10.59 Sq. Km.

57
TABLE A-IV-TOWNS CLASSIFIED BY POPULA'I1JON IN 19(;1 WITH VARIATION SINCE 1901-Concld.
Percentage Status of Decade decade
District/TehsiI Name of Town Town Year Persons variation variation Males Females
2 3 .. 5 6 7 8 9
Bikaner Tehsil Deshnoke (M) 1941 5,187 2,660 2.5:27 33.61 Sq. miles 1951 6,203 + 1,016 + 19.59 2,995 3,208
1961 6,880 + 677 + 10.91 3,344 3,.536
Bikaner Tehsil Napasar (M) 1941 4,388 2,304 2,084 29.55 Sq. miles 1951 5,857 + ].469 + 33.18 2,974 ~.883 76.53 Sq. Km. 1961 6.634 + 777 + 13.27 3,243 3,391
Bikaner Tehsil *Bhinasar (M) 1951 4.361 2,097 2,264 3.78 Sq. miles 1961 5,442 + 1,081 + 24.79 2.718 2,724 9.79 Sq. Km.
DISTRICT VI CLASS (Less than 5.000)
1941 4.388 2,304 2,084 1951 10,996 + 6.608 + 1S0.59 5,456 5,540 1961
Note:- The district totals for each class of town relating to the years 1901 to 1951 do not correspond with the totals that would be arrived at by adding of the population figures of various towns relating to each census year. This is because that the district figures relating to the past census yean also contained the population of those places which were classified as towns in the various censuses.
Town treated as such for the first time which continue as towns in 1961 Census are shown with an asterisk (*) on their left. M = Municipality.

'Tehail
1
Luokaransar
-Largely conjectural
Name of Town
2
• Lunkaransar
58
APPENDIX TO TABLE A .. IV
Towns in 1951 declassified in 1961 ( No new town was added in 1961 )
Sq. miles
3
36.84
Area" (1951)
Sq. Km.
4
9S.42
1961
S
2,791
Population
19S1
6
2,078

59
ECONOMIC TABLES
(Note on B-Series)
In 1951 Census Reports, the popUlation was classified on the concept of 'dependency' which has been changed to that of 'workers' and 'non-workers' at the current Census. The change in the concept will be helpful in finding out the realistic picture of the economic activity of those important sections of household workers who otherwise have been left out of account in the past censuses.
2. This series has been divided into two parts viz., (i) General Economic Tables and (ii) Household Economic Tables.
(i) GENERAL ECONOMIC TABLES
3. There are 9 General Economic Tables in this series. The first 3 tables distribute the working and non-working population by economic activity correlated with sex, age and edu.cational levels. A more elaborate classification of workers by industry according to the Standard Industrial Classification is presented in Table B-IV while it has been shown by occupation in Table B-V. Table B-VI provides information about those occupations of National Classification which attract educated personnel in urban areas. Another Table B-VII shows the classification of workers by secondary work and the last two tables distribute the non-workers by sex, age and eight broad classes according to the activities pursued by them.
Tab1e B-J
4. This is a basic economic table prepared on the basis of Primary Census Abstract. In this table the population has been divided into nine industrial categories of workers based on Indian Standard Industrial Classification and a separate category of non-workers (detailed classification of which are available in Table B-IX in Part II-B (ii) of State Census Report) further classified into sex and broad age-groups viz. 0-14, 15-34, 35-59 and 60 +. The classification of workers and non-workers by specific age-groups, is a special feature of 1961 Census. The age-groups correspond to the different stages of life which have special significance with reference to capacity to work viz., children, young persons, midd1e aged and elderly persons. Detailed classification of non-workers is, however, given in Table B-IX.
5. This table presents data sepaJ'ately for total, rural and urban population of the district while those for tehsils for rural areas only. Another Table B-II showing such information for each town is not reproduced in this book and has been given in Part II-B (i) of State Census Report.
Table 8-m
6. This table has been compiled into two parts. Part A deals with urban population of the district classified into nine industrial categories of workers and a separate category of non-workers cross tabulated by literacy and various educational levels. Part B refers to rural popUlation of the district as well as for each tehsil where educational levels have been confined only to two categories viz., Primary or Junior Basic and Matriculation and above. It is an important table indicating employment of persons of diffe. rent educational standards amongst the various categories of workers. The educational qualifications of available man-power can be assessed with the help of this table.
Table B-IV
7. This table has been presented in three parts. Part A deals with the industrial classification of worker of persons at work at household industry separately for total, rural and urban parts of the district, showing the figures for divisions and major groups of Indian Standard Industrial Classification. Divisionwise figures for each tehsil in case of its rural areas are also shown.
8. Part B of this table provides the data regarding industrial classification by sex and class of worker of persons at work in non-household industry, trade, business, profession or service for total and urban areas of the district by divisions and major groups.
9. In Part C of this table the data has been furnished for industrial classification by sex and divisions, major and minor groups of persons at work other than cultivation for total and urban areas of the district. Such data for rural part of each tehsil is also presented in the supplementry table to B-IV Part-C by divisions only.
10. This table is quite important as it furnishes employment position in respect of various sectors of economy not only indicatjng the class of the workers viz., employer, employee, single worker, family worker but also by different branches of industry according to divisions and major groups is Parts A and B and also by minor groups of Indian Standard Industrial Clnssifi~ cation in Part C.
11. As the information included in Pa rt C of this table is quite voluminous, the minor groups having figures less than 1 % of the total workers of the respective division (less than 0.5% in case of division 2&3) have been excluded and relegated to the Appendix attached to this part of the table.

] 2. The Standard Industrial Classification. reproduced as an appendix at the end of note on this series describes in detail the various codes used for divisions, major and minor groups.
Table B-V
13. This is a new table and has been compiled for total and urban population by sex in order to provide information regarding occupational classification in the district engaged in production other than cultivation, further classified into divisions and groups on the basis of the National Classification of Occupations. Under each group the detailed occupational families are shown. Families having less than 1 % of workers of the respective division (less than 0.5% in case of families under division 7~8) are not given in this table but are shown in an appendix attached at the end of this table. A fly leaf showing appropriate industrial category is also given in place of industrial category appearing in the table due to insufficient description given in the enumeration slip for industry or coding mistake. The occupational classification of persons engaged in non-agricultural pursuits has been further detailed according to various categories of workers. The categories of workers are same as adopted for Primary Census Abstract.
14. In this table cross tabulation of industry and occupation has been made for the first time while such information was combined in the previous censuses.
Table B-VI
15. This is a new table prepared for the first time in 1961 Census and provides information about those occupations which attract educated persennel. It has been prepared only for urban areas of the district upto divisional level of the National Classification of Occupations. The workers under each occupational division have been classified by broad age-groups viz.,. 0-14, 15-34, 35-59 and 60 and above. The age-groups have been further classified according to educational levels as adopted in Economic Table B-III Part A. However, the figures for total workers under each occupational division have been provided for total only and not for different age-groups. It may be noted. that total workers for each occupational division in this table corresponds to the total workers of urban areas in Table B-V.
Table B-VII
16. This table has been compiled into two parts. Part A presents persons working -principally (i) as cultivators (in as agricultural labourers or (iii) at household industry classified by sex and by the nature of their secondary work (i) at household industry (ii) as cultivator or (iii) as agricultural labourer. Such data hJ.s been presented in this part by divisions and major groups separately for the total, roral and urban parts of the district and by divisions only in case of rural part of each tehsil.
60
17. In case a worker is engaged in two or more kinds of work, the work consuming the larger portion of time has been treated his principal work while another consuming larger portion of his time considered his secondary work.
18. Part B of this table presents the industrial classification by sex of persons working in non-household industry, trade, business, profession or service who are also engaged in household industry, Such data has been presented in this part of the table by principal work and additional work based on divisions and major groups for the district as a whole while it has been shown by divisions only in Case of each tehsil for its rural areas.
Table B-VIII
19. This is a new table prepared for the first time in the current Census. This table presents the distribution of unemployed persons aged 15 and above by sex and educational levels. It has been compiled into two parts. Part A relates to urban areas and is presented for the district as a whole. Part B relates to rural areas and is presented upto tehsil level.
20. The number of unemployed in Part A of this table have been further split up by (i) persons seeking employment for the first time and (ii) persons employed before but now out of employment and seeking work. The age--groups in the first case are 15-19, 20-24, 25-29, 30-34 and 35+ which are modified in the second case as 15-19, 20-24, 25-34, 35-44, 45-59 and 60+.
21. The break-up of educational levels is much elaborate in Part A which is the same as given in Table B-III Part A while such educational levels are confined only to (i) Primary or Junior Basic and (n) Matriculation and above, in Part B of this Table.
Table B-IX
22. This table presents the distribution of nonworking population by broad age-groups and eight classes of non-workers based on the recoDlmendation of the United Nations Organisation. In this table data has been shown for total, rural and urban areas of the district separately and upto tehsil level for rural areas QQ}y. Such information on the non-working popUlation ~ad never been compiled before.
J. (ii) HOUSEHOLD ECONOMIC TABLES
23. There are 8 Household Economic Tables in this series compiled in the current Census which is a first attempt for collecting economic data on the basis of households in addition to what is colJected for each individual. In a predominantly agricultural State where most of the population is in rural areas and where much of the goods produced are consumed by the population itself, collection of information purely on the

basis of individuals tends to go slightly out of focus unless such information is supplemented by information on economic activities of the household as an entity. A decision was, therefore, taken that the information relating to the economic activities of the majority of households 'Viz., cultivation activities and household industry should be collected at the current Ctnsus.
24. A household Schedule was used at the Census 1961 for this purpose. In the Part I of this Schedule, information on the extent of land cultivated by the household, either owned or held from Government or held from private persons or institutions for payment in money, kind or share, and extent of land given to private persons for cultivation for payment in money, kind or share was collected. Besides, nature of house· hold industry conducted by the household [\nd the duration of the industry in a year alongwith number of family workers and hired workers engaged in cultivation or household industry or in both was also collected.
25. All these tables have been prepared on the basis of 20% sample of households.
Table 8-X
26. This table is prepared on a 20% sample of households and is presented for the district total, rural and urban areij-s separately and upto tehsil level for rural areas only. The sample households have been classified into four categories viz., (i) households engaged neither in Cultivation nor Household Industry, (ij) households engaged in Cultivation only. (iii) households engaged in Household Industry only and (iv) households engaged both in Cultivation and Household Industry. Thus, the table divides all the households in three important sectors of economic activity.
27. Cultivation includes ownership, tenancy cultivation and agricultural labour. The Household Industry relates to production, processing, servicing or repairing and in,cludes making and selling of goods.
Table B-XI
28. This table presents data for the district total, rural and urban areas separately and upto tehsil level for rural areas only. In this table a more detailed examination of the cultivating households, which have been separa ted in the previous table, has been made. Such households have been cbssified according to the size of land cultivated and cross tabulated by the interest in land cultivated. The sizes of land in acres are given as less than 1, 1.0-2.4, 2.5-4.9, 5.0-7.4, 7.5-9.9, 10.0-12.4, 12.5-14.9, 15.0-29.9, 30.0-49.9, 50+ and unspecified.
29. The interest in land cultivated has been classified into the following three categories :-
(a) entirely owned or held from Government,
Bika.3
61
(b) entirely held fl em private persons or in<;titlltiom f0l' pa),ment in money, kind or share, arid
(c) partly held from Government and partly from private persons for payment in money, kind or share.
30. Abbreviations .(a), (b) and (c) have been used in place of legends for interest in land cultivated under column 1 of the table and the same have been spelt out at the bottom of the table.
Table B-XU
31. In this table the data has been shown for the district total, rural and urban areas separately and also up to tehsil level for rural areas only. The table will facilitate a further study of households which are engaged only in cultivation, as each household having a particular size of holding mentioned in Table B-XI has been cross tabulated with reference to the number of persons working in cultivation. The holding has been grouped into the following size ranges (in acres); less than 1, LO-2.4, 2.5-4.9, 5.0-7.4, 7.5-9.9. 10.0-12.4, 12.5-14.9, 15.0-29.9, 30.0-49.9 and 50+ and unspecified.
32. In case of household where more than one person is working, the number of family workers and hired workers have been separated. Family workers have also been separately tabulated by sex.
Table B-XIII
33. This table is presented separately for rural and urban areas of the district. The table shows the distribution of sample households engaged both in Cultivation and Household Industry classified by size of land cultivated and by size of Household Industry. The Household Industries have been classified according to the code numbers of divisions 0, I, 2 & 3 and their major groups of Indian Standard Industrial Classification (for detailed description see Appendix at the end of the note on this series). It throws light on Household Industries which are carried on as an ancillary to culti· vation in different parts of the district.
Table B-XIV
34. In this table the data has been presented for the total, rural and urban household'l separately for the district and relates to households engaged only in Household Industry. The table has been prepared in two parts:-
Part A:-Jt relates to -households c1assifietl by major groups of principal Household Industry and number of persons engaged in each, grouped under 1, 2, 3-5, 6-10 and more than 10 persons. The Household Industries
have been classified according to the code number of divisions 0, 1, 2 & 3 and their major groups of Indian Standard Industrial Classification (for detailed description of code numbers see Appendix at the end of the note on this series).
Part B:-It relates to households classified by minor groups of principal Household Industry. In cases where there are more than one Household Industry under a minor group, sub-minor group numbers in four digits have been given.
Table 8-XV
35. This table has been prepared for households engaged both in Cultivation and Household Industry. The data has been shown separately for total, rural and urban areas of the district. Tehsilwise break-ups for rural areas only could not be given here due to short of space, however, the same is available in Part III of State Census Report. In this table, an analysis has been made of persons working in these households with reference to size of holding. In cases where more than one person is employed, the number of family workers and hired workers are separately given. Similar data in respect of households engaged in Cultivation only has already been given in Table B-XII. A comparison between this table and Table B-XII will show how the combination of Household Industry with Cultivation effects the employment position. This table helps to establish a co-relation between the Household Industry and the scale of Cultivation.
Table B-XVI
36. This table is confined only to Household Industry and the data has been presented separately for the district total, rural and urban areas. The data in respect of Households engaged in Household Industry only or both in Household Industry and Cultivation are given separately. Household Industry is classified according to period of working of the industry grouped under 1-3 months, 4-6 months, 7-9 months and 10 months to one
year and under each category number of households number of family workers and number of hired workers are given. This table thus, furnishes important data on the seasonality of various household industries and yields inferences on the seasonality of Household Indus .. try with seasonality of Cultivation.
37. The major groups of Household Industry having less than 10% of the figures of the respective division which have been omitted from the table are shown in the Appendix at the end of the table. For detailed description of divisions and major groups of Household Industry see Appendix at the end of the note on this series.
Table 8-XVII
38. The data in this table has been presented separately for the district total, rural and urban areas. The family sizes of sample households have been classified according to single member, 2-3 members, 4-6 members, 7-9 members and 10 members and over. It may be-noted that although the 'Census Household' is not exactly the same as 'Family' to the extent that it may also include unrelatea persons residing with the family during the census count, yet this table gives a general idea of the family sizes as in the majority of families outsiders are likely to be insignificant.
39. The sample households have also been classified by economic activity by work in cultivation or household industry. Households engaged in cultivation have been further classified by size of land holding. Classification by economic activity as well as by size of land holding is presented only for rural areas while classification by size of households is presented for total and urban areas.
40. Separate volumes Part U-B (i) & (ii) for General Economic Tables and Part III for Household Economic Tables have been issued in which the various concepts used, have been discussed in detail.
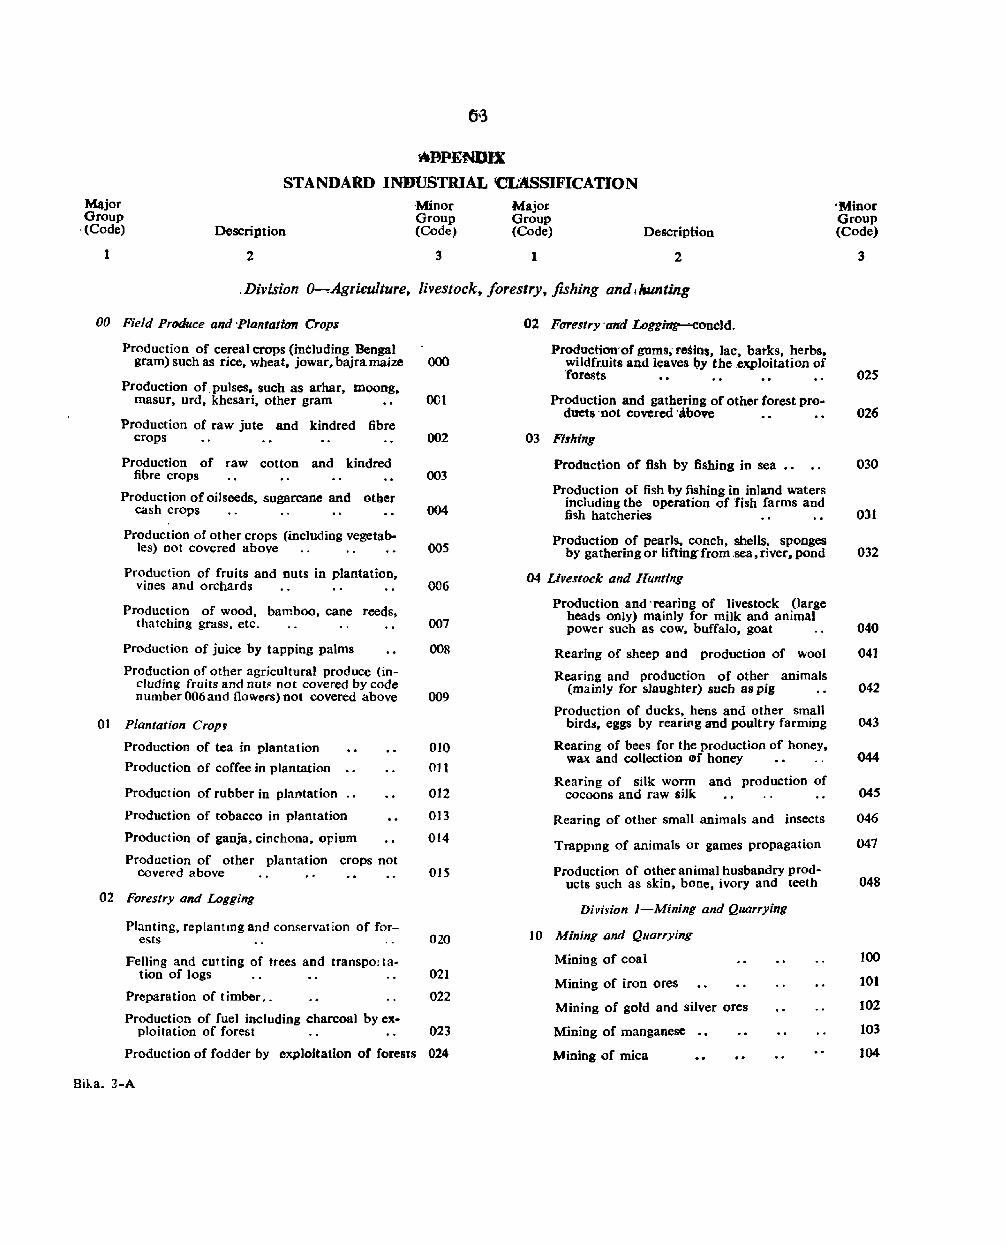
14tBPENDlX
STANDARD INDUSTRIAL 'CIA4SSIFICATION Major Group
,(Code)
1
Description
2
'Minor Group (Code,
3
Major Group (Code)
1
Description
2
_ Division ~Aglieulture, livestock, forestry, fishing and j /umting
00 Field Produce and -Plantatftm Crops
Production of cereal crops (including Bengal gram) such as rice, wheat, jowar, bajra maize
Production of_pulses. such as arhar, aloong, masur, urd. khesari. other gram
Production of raw jute and kindred fibre crops
Production of raw cotton and kindred fibre crops
Production of oil seeds. sugarcane and otaer cash crops
Production of other crops (incJuding vegetables) Dot covered above
Production of fruits and nuts in plantation, vines and orchards
Production of wood, bamboo, cane reeds, thatching grass, etc.
PrOduction of juice by tapping palms
Production of other agricultural produce (including fruits and nuts not covered by code number 006 and flowers) not covered above
Ol Plantation Crop~
Production of tea in plantation
Production of coffee in plantation
Production of rubber in plantation
Production of tobacco in plantation
Production of ganja, cinchona, opium
Production of other plantation crops not cover(>d above
02 Forestry and Logging
Planting, replantmg and conservation of forests
Felling and cutting of trees and transporta-
000
001
002
003
004
oos
006
007
008
009
010
011
012
013
014
015
020
tion of logs 021
Preparation of timber.. 022
Production of fuel including charcoal by ex-ploitation of forest 023
Production of fodder by exploitation of forests 024
Bika. 2-A
02 F(1'f'estry -tmd Logg;"g......cone1d.
Produetion-of gums; reSins, lac, batks, herbs. wildfr.uits and leaves by the .exploitation of forests
Production and gathering of other forest produets 'not covered -above
03 Fishing
Production of fish by fishing in sea
Production of fish by fishing in inland waters including the operation of fish farms and fish hatcheries
Production of pearls. conch, shells, sponges by gatherin_g or lifting- from .sea, river. pond
04 Livestock and Hunting
Production and -rearing of livestock (large heads only) mainly for milk and animal power such as cow. buffalo, goat
Rearing of sheep and production of wool
Rearing and production of other animals (mainly for slaughter) such as pig
Production of ducks, hens and other sman birds, eggs by rearing and poultry farming
Rearing of bees for the prodUction of honey, wax and collection Cl)f honey
Rearing of silk worm and production of cocoons and raw siJk
Rearing of other small animals and insects
Trappmg of animals or games propagation
Production of other animal husbandry prod-ucts such as skin, bone. ivory and teeth
Division I-Mining and Quarrying
J 0 Mining and Quarrying
Mining of coal
Mining of iron ores
Mining of gold and silver ores
Mining of manganese
t.4ining of mica
'Minor Group (Code)
3
025
026
030
031
032
040
041
042
043
044
045
046
047
048
100
101
102
103
104
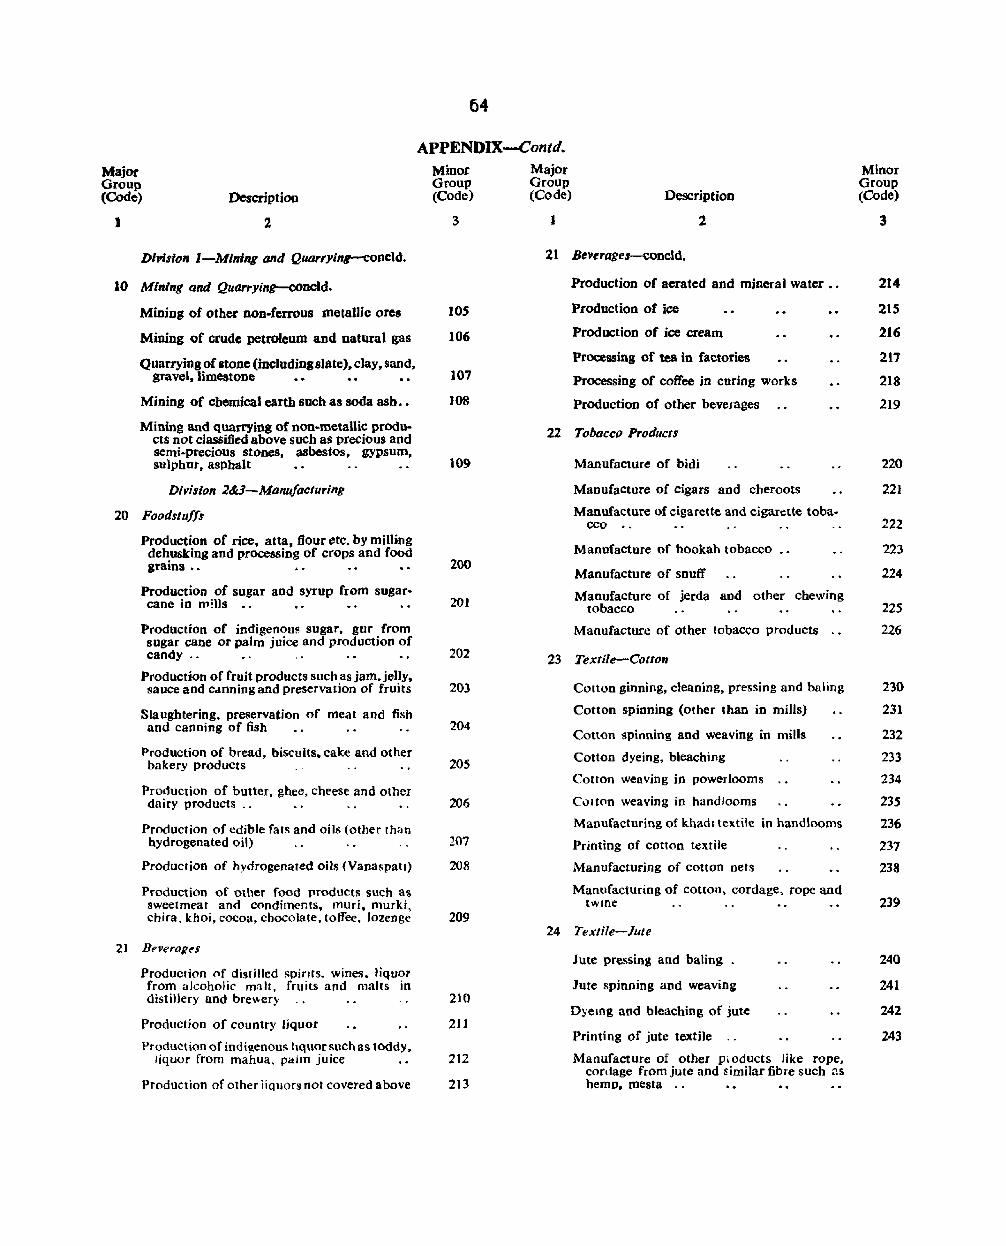
Major Group (Code) Description
2 1
DIvision I-Mining and Quarryin,r-concld.
10 Mining and Quarrying-concld.
Mining of other non-ferrous llletaUic ores
Mining of crude petroleum and natural gas
Quarrying of stone (including slate). clay, sand, gravel, limestone
Mining of cbemical earth such as soda ash ••
Mining and quarrying of non-metallic products not clasSified above such a~ precious and semi.precious stones. asbestos. gypsum, sulphur. asphalt
Divis/on 2&.3-Manufactur/ng
20 Foodstuffs
Production of rice, atta, flour etc. by milling dehusldng and processing of crops and food grains ••
Production of sugar aod syrup from sugarcane in ll'Ims •.
Production of indigenou!! sugar, gur from sugar cane or palm juice and production of candy ..
Production of fruit products such as jam, jelly, sauce and cdnningand preservation of fruits
Slaughtering. preservation of meat and fish and canning of fish
Production of bread. biscuits, cake and other bakery products
Production of butter, ghee, cheese and other dairy products ..
Production of edible fats and oils (other thah hydrogenated oil)
Production of hydrogenated oils (Vanaspall)
Production of other food products such as sweetmeat and condiments, muri. murki, chira. khOi, cocoa, chocolate, toffee. IOlenge
21 BpveraFu
Produclion of distilled spints. wines. liquor from alcoholic malt, fruits and malts in distillery and bre"ery
Production of country liquor
Production of indi~enous liquor such as tOddy. liquor from mahua. palm juice
Production of other liquors not covered above
64
APPENDIX-Contd. Minot Group (Code)
3
lOS
106
107
108
109
200
201
202
203
204
205
206
207
208
209
210
211
212
213
Major Group (Code) Description
1 2
21 Bellerages-concld.
Production of aerated and mineral water ••
Production of ice
Production of ice cream
Processing of tea in factories
Processing of coffee in curing works
Production of other beverages
22 Tobacco Products
Manufacture of bidi
Manufacture of Cigars and cheroots
Manufacture of cigarette and cigarette tobacco "
Manufacture of hookah tobacco
Manufacture of snuff
Manufacture of jerda and other chewing tobacco
Manufacture of other tobacco products "
23 Textile-Cotton
Cotton ginning, cleaning. pressing and baling
Cotton spinning (other than in mills)
Cotton spinning and weaving in mitis
Cotton dyeing, bleaching
Cotton weaving in powerlooms
Cotton weaving in hand looms
Manufacturing of khadl textile in hand looms
Printing of cotton textile
Manufacturing of cotton nets
Manufacturing of cotton, cordage, rope and twme
24 Textile-Jute
Jute pressing and baling
Jute spinning and weaving
Dyemg and bleaching of jute
Printi ng of jute textile
Manufacture of other Pi oducts like rope, cordage from jute and ~imilar fibre such ~s hemD. mesta ..
Minor Group (Code)
3
214
215
216
217
218
219
220
221
222
223
224
225
226
230
231
232
233
234
235
236
237
238
239
240
241
242
243
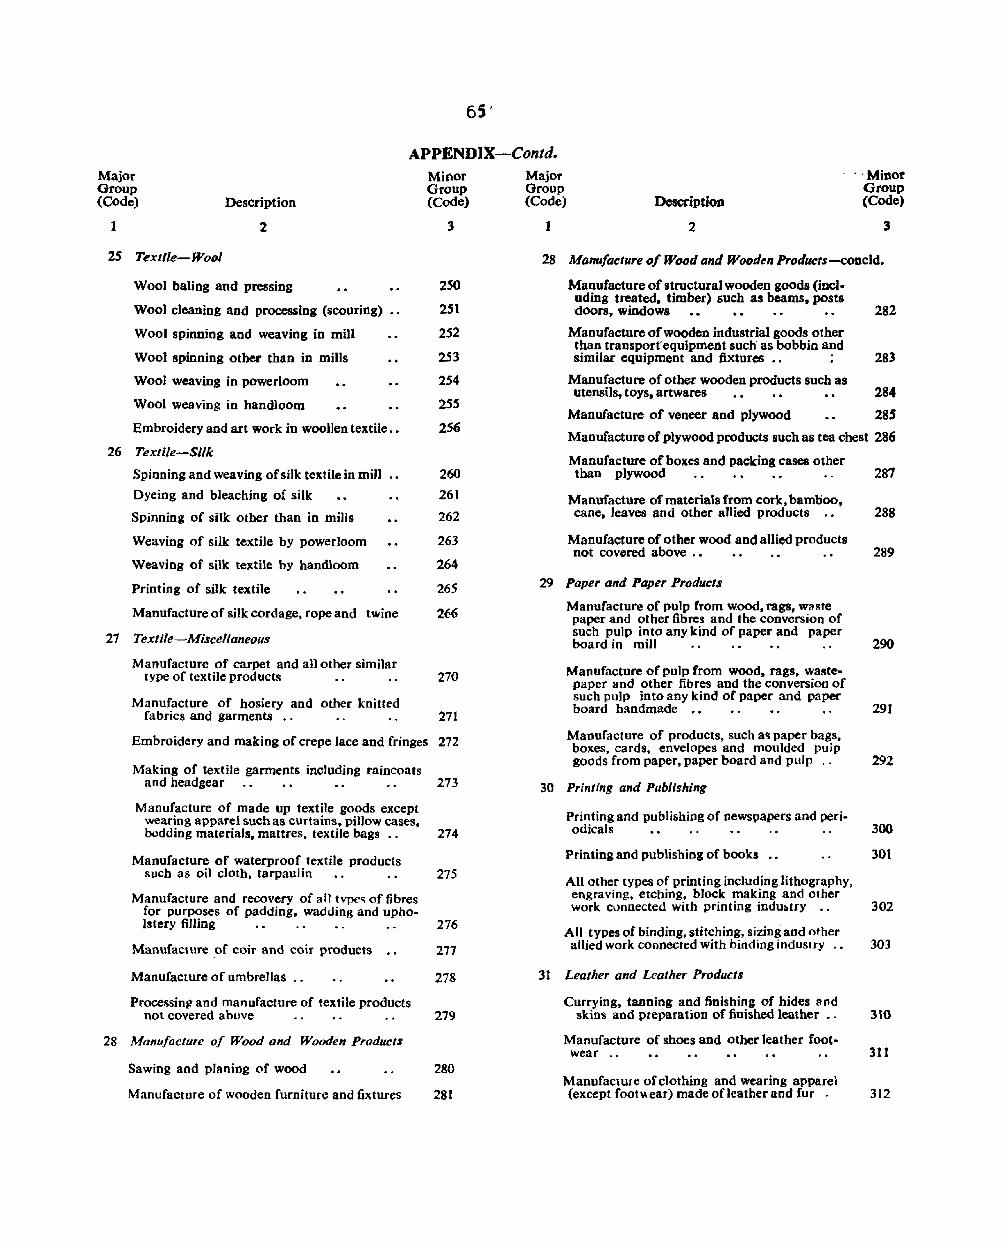
65'
APP:ENDIX-Contd. Major Group (Code) Description
1 2
25 Textile-Wool
Wool baling and pressing
Wool cleaning and processing (scouring)
Wool spinning and weaving in mill
Wool spinning other than in mills
Wool weaving in powerloom
Wool weaving in handloom
Embroidery and art work in woollen textile ..
26 Textile-Silk
Spinning and weaving ofsi1k textile in mill
Dyeing and bleaching of silk
Spinning of silk other than in mills
Weaving of silk textile by powerloom
Weaving of silk textile by handloom
Printing of silk textile
Manufacture of silk cordage, rope and twine
27 Textile-Miscellaneous
Manufacture of carpet and aU other simjlar type of textile products
Manufacture of hosiery and other knitted fabrics and garments .,
Minor Group (Code)
3
250
251
252
253
254
255
256
260
261
262
263
264
265
266
270
271
Embroidery and making of crepe lace and fringes 272
Making of textile garments including raincoats and headgear . . . . . . . . 273
Manufacture of made up textile goods except wearing apparel such as curtains. pillow cases, bedding materials. mattres, textile bags .. 274
Manufacture of waterproof textile products such as oil cloth, tarpaulin 275
Manufacture and recovery of all tvpec:; of fibres for purposes of padding. wadding and upho-lstery filling 276
Manufacture ,of coir and coir products 277
Manufacture of umbrellas ..
Processinll and manufacture of textile products not covered above
28 Manufacture of Wood and Wooden Products
Sawing and planing of wood
Manufacture of wooden furniture and fixtures
278
279
280
281
Major Group (Code) Description
2
-, Minor Group (Code)
1 3
28 Manufacture 0/ Wood and Wooden Products-coDcld.
Manufacture of structural wooden goods (incl-uding treated. timber) such as beams, posts doors, windows •• 282
Manufacture of wooden industrial goods other than transport' equipment such as bobbin and similar equipment and fixtures •• : 283
Manufacture of other wooden products such as utensils, toys, art wares • • . • . . 284
Manufacture of veneer and plywood 28S
Manufacture of plywood products such as tea chest 286
Manufacture of boxes and packing cases other than plywood
Manufacture of materials from cork. bamboo, cane. leaves and other allied products ..
Manufacture of other wood and allied products not covered above .•
29 Paper and Paper Products
Manufacture of pulp from wood. rags, Wl'ste paper and other fibres and the conversion of such pulp into any kind of paper and paper board in mill . . . . . . . .
Manufacture of pulp from wood. rags, wastepaper and other fibres and the conversion of such pulp into any kind of paper and paper board handmade •.
MaI)ufacture of products, such 8'1 paper bags. boxes, cards, envelopes and moulded puip goods from paper, paper board and pulp
30 Printing and Publishing
Printing and publishing of newspapers and peri-
287
288
289
290
291
292
odicals 300
Printing and publishing of books •. 301
All other types of printing including lithography, engraving, etching, block making and orher work cllnnected with printing indulttry • . 302
All types of binding, stitching, sizing and other allied work connected with binding induslry .. 303
31 Leather and Leather Products
Currying, tanning and finishing of hides and skins and preparation of finished leather ..
Manufacture of shoes and other leather footwear ..
Manufac\Use of clothing and wearing apparel (except foot"ear) made oflcather and fur .
310
311
312

66
AP·PENDD:--Contd. Major <Jroup '(Code) Description
2 1
3J -Leather a1ld Leather ProdMcts-concld.
Manufacture ofleather products (except those covered by code Nos, 311, 9-12), .uch as leather upholstery, suitcases., p0cket. books, cigarette aDd key cases. purses. saddlery. whip aod other articles • • • •
Repair of shoes and other leatber footwear
Repair of an other leather products except footwear
32 'Rubber. Petroleum and Coal Products
Manufacture of tyres and tubes
Manufacture of rubber footwear
Manufacture of rubber goods used for industrial purpose
Manufacture of all kinds of other rubber products from natural or synthetic rubber including rubber raincoat
Productions of petroleum, kerosene and other petroleum products in petroleum refineries
Production of coaltar and coke in coke oven
Manufacture of other coal and coaltar products not covered elsewhere
33 Chemicals and Chemical Products
Manufacture of basic industrial chemicals such as acids. alkalis and their salts not el8(!where specified
Manufacture of dyes, paints, colours and varnishes
Manufacture of fertilizers
Manufacture of ammunition, ex.pIOSlve~ and fire works
Manufacture of matches
Manufacture of medicines, pharmaceutical preparations, perfumes, cosmetics and other toilet preparations except soap
Manufacture of soap and other wdshing and cleaning compounds
Manufacture of turpentine, synthetic, resin and pla!'tic products and materials (including synthetic rubber)
Manufacture of common salt
Manufacture of other chemicals and chemical products not c.JVe'ed above (including inedible oils and fal!»
Minor Group (Code)
3
313
314
315
320
321
322
323
324
325
326
330
331
332
333
334
335
336
337
338
339
Major Group (Code) Description
Minor Group (Code)
J 2 3
34 Non-metallic Mineral Products other tho" ,Petroleum and Coal
Manufacture of structural c1ay products such as bricks. tiles
Manufacture of cement and cement, products
Manufacture of" lime ~.
Manufacture of structural stone goods, stone dressing and stone crushing
Manufacture of stonewares. other than images
Manufacture of stone images
Manufacture of plaster of paris and its products
Manufacture of asbesto~ products
Manufacture of mica products
35 Manufacture of earthenware and earthen pottery
Manufacture of chinaware and crockery
Manufacture of porcelain and its products
Manufacture of glass bangles and beads
Manufacture of gla's apparatus
Manufacture of earthen image, busts and statues
M mufacture of earthen toys "nd artwares exceDt those coverd by code No 355
Manufacture of glass and glass product<; except optical and photographic lenMll' and glass products covered above
Manufacture of other non-metallic mineral products nm elsewh.:re speCified
36 Basic Metals and their prnduclS exc"p' Machinery and Transport Eq'tipment
Manufacture of iron and s' eel includ IDIl .,melting, relining. rolling, cIlnvert>ion Into baSIC
340
341
342
343
344
345
346
347
348
350
351
352
353
354
355
356
357
359
forms such as bIllets, blooms, tubes, rods 360
Manufacture includlDg smelting, refining of non-ferrous metals and alloys in basic forms 36]
Manufacture of armaments 362
Manufacture of structural steel products such as joist, rail, sheet, plate _. 363
Manufacture of iron and steel furniture 364
Manufacture of brass and bell metal products 365
Manufacture of aluminium products 366

Major Group (Code) Description
1 2
36 Basic Metals and their Products except Machinery and Transport EqUipment-concld.
Manufacture of metal products (other than of iron brass, bell metal and aluminium) such as tin can
Enamelling, galvanising, plating (including electroplating) polishing and welding of metal products
Manufacture of sundry hardwares such as G.I. pipe, wire net, bolt, screw. bucket. cutlery (This will also include the manufadure of sundry ferrous engineering products done by jobbing engineering concerns which can Dot be classified in major groups 36, 37, 38 and 39)
37 Machinery ( All kinds other than Transport) and Electrical Equipment
Manufacture and as~embling of machinery (other than electrical) except textile machinery
Manufacture and assembling of prime mover and boilers, other than electrical equipment, such as diesel engines. road rollers. tractors
Manufacture of machine tools
Manufacture of textile machinery and accessories
Manufacture of heavy electrical machinery and equipment such as motors, genefators. transformers
Manufacture of electric lamps and fans ..
Manufacture of insulated wires and cables
Manufacture of all kinds of battery
Manufacture of electronic equipment such as radio, microphone ..
Manufacture of electric machinery and apparatus, appliances not specified above
38 Transport Equipment
Manufacture, assembly and repairing of locomotives
Manufacture of wagons. coaches. tramways and other rail road equipment other than that covered by code No. 363
Manufacture and assembling of motor vehicles of all types (excepting motor engines)
Manufacture of motor vehicles engines parts and accessories
Repairing and servicing of motor vehicles
67
APPENDIX-Contd. MinOt' Group (Code)
:3
367
368
369
370
371
372
373
374
375
376
377
378
379
380
381
382
383
384
Major Group (Code) Description
2
38 Transport Equipment-concld.
Manufacture of bicycles and tricycles and accessories such as saddle. seat frame, gear
Building and repairing of water transport equipment such as ships, boats and manufacture of marine engines
Manufacture and repair of air transport equipment including aeroplanes. aeroengines
Repairing of bicycles and tricycles
Manufacture of other transport equipment not covered above such as animal drawn and hand drawn vehicles
39 Miscellaneous Manufacturing Industries
Manufacture of optical instruments and lense&, opthalmic goods and photographic equipment and supplies
Manufacture of scientific, medical and surgical instruments and equipment and supplies
Assembling and repairing of watches and clocks
Manufacture of jewellery. silverware and wares using gold and other precious metals
Manufacture and tuning of musical instruments
Manufacture of stationery articles not covered elsewhere such as pencil, penholder, fountainpen
Manufacture of sports goods
Manufacture and repair work of goods not assignable to any other group
Division 4-Construction
40 Construction
Contruction and maintenance of buildings including erection, fiooring, decorative constructions. electrical & sanitary installations
Construction and maintenance of roads. railways. bridges. tunnels
Construction and maintenance of telegraph and telephone lines
Construction and maintenance of water ways and water reservoirs such as bund, embankments, dam, canal. tank, tubewells. wells
Division 5-Electricity, Gas, Water and Sanitary Services
50 Electricity and Gas
Generation and transmission electric energy
Minor Group (Code)
3
385
386
387
388
389
390
391
392
393
394
395
396
399
400
401
402
403
500
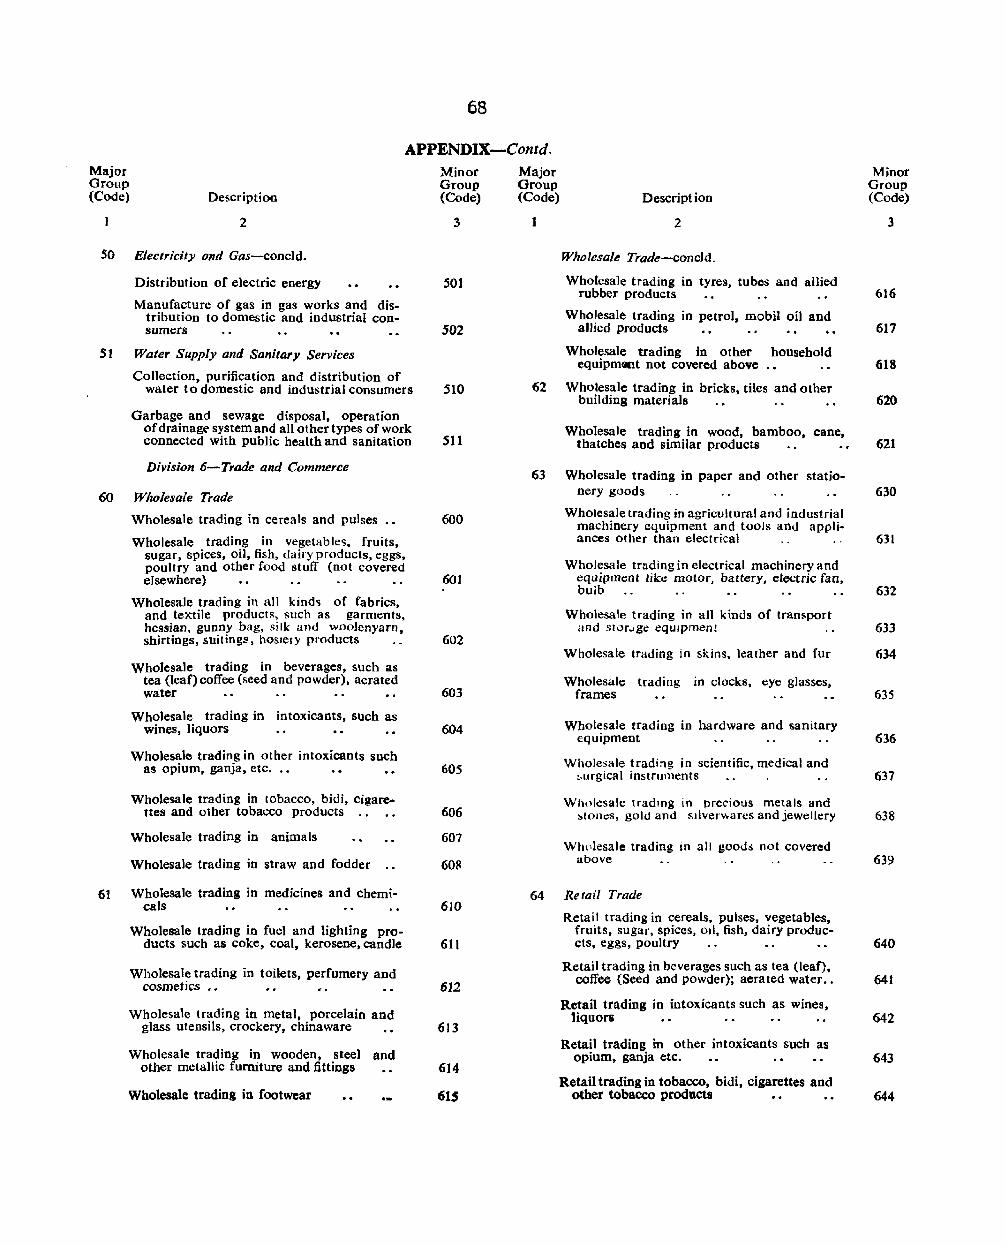
68
APPENDIX-Comd. Major Group (Code) Description
2
SO Electricity ond Gas-concld.
Distribution of electric energy
Manufacture of gas in gas works and dis· tribution to domestic and industrial con. sumers
51 Water Supply and Sanitary Services
Collection, purification and distribution of water to domestic and industrial consumers
Garbage and sewage disposal, operation of drainag(' system and all other types of work connected with public health and sanitation
Division 6-Trade and Commerce
60 Wholesale Trade
Wholesale trading in cereals and pulses
Wholesale trading in vegetables. fruits, sugar, spices, oil, fish, dairy products, eggs, poultry and other food stuff (not covered elsewhere)
Wholesale trading in all kind.. of fabrics, and textile products, such as garments, hessian. gunny bag, silk and woo]enyarn, shirtings, suiting:;. hosiery products
Wholesale trading in beverages, such as tea (leaf) coffee (seed and powder), aerated water
Wholesale trading in intoxicants, such as wines, liquors
Wholesale trading in other intoxicants such as opium, ganja, etc. ..
Wholesale trading in tobacco, bidi, cigarettes and other tobacco products
Wholesale trading in animals
Wholesale trading in straw and fodder
61 Wholesale trading in medicines and chemi-cals
Wholesale trading in fuel and lighting pro· ducts such as coke, coal, kerosene, candle
Wholesale trading in toilets, perfumery and cosmetics .•
Wholesale trading in metal, porcelain and glass utensils, crockery, chinaware
Wholesale trading in wooden, steel and oilier metallic furniture and fittings
Wholesale trading in footwear
Minor Group (Code)
3
501
502
510
511
600
601
602
603
604
605
606
607
608
610
611
612
613
614
615
Major Group (Code)
1
Descript ion
2
Wholesale Trade-concJd.
Wholesale trading in tyres, tubes and allied rubber products
Wholesale trading in petrol, mobil oil and aUied products
Wholesale trading in other household equipmCJCt not covered above
62 Wholesale trading in bricks, tiles and other building materials
Wholesale trading in wood, bamboo, cane, thatches and similar products
63 Wholesale trading in paper and other stationery goods
Wholesale trading in agricultural and industrial machinery equipment and tools and appli· ances other than electrical
Wholesale trtlding in electrical machinery and equipment like motor, battery, electric fan, bulb
Wholesale trading in aU kinds of transport and slOr ... ge eqUipment
Minor Group (Code)
3
616
617
618
620
621
630
631
632
633
Wholesale trading in skins, leather and fur 634
Wholesale trading in clocks, eye glasses, frames
Wholesale trading in hardware and sanitary equipment
Wholesale trading in scientific, medical and ~,urgical instruments
Wholesale trading in precious metals and ~tones, gold and sllver~ares and jewellery
Wlwlesale trading in all goods not covered above
64 Re tail Trade
Retail trading in cereals, pulses. vegetables, fruits, sugar, spices, oIl, fish, dairy produccts, eggs, poultry
Retail trading in beverages such as tea (leaf), coffee (Seed and powder); aerated water ..
Retail trading in intoxicants such as wines. liquors
Retail trading in other intoxicants such as opium, ganja etc.
Retail trading in tobacco, bidi, cigarettes and other tobacco products
635
636
637
638
639
640
641
642
643
644

APPENDIX....:-contd. Major Group (Oode)
I
Description
2
Retail Trade-concld.
Retail trading in fuel such as coke, coal, firewood aod kerosene
Retail trading in food stuffs like sweetmeat condiments, cakes, biscuits, etc.
Retail trading in animals
Retail trading in straw and fodder
65 Retail trading in fi~res. yarns, dhoti, saree, ready made garments of cottOD, wool, silk and other textiles and hOF,iery products, (this includes retail trading in piecegoods of cotton, wool, silk and other textiles) ••
Retail trading in toilet goods, perfumes and cosmetics
Retail trading in medicines and chemicals ..
Retail trading in footwear, head-gear such as hat, umbrella. shoes and chappals
Retail trading in tyres. tubes and allied rubber products
Retail trading in petrol, mobiloil and allied products
66 Retail trading in wooden, steel and other metallic furniture and fittings
Retail trading in stationery goods and paper
Retail trading in metal, porcelain and glass utensils
Retail trading in earthenware and earthen toys
Retail trading in other household equipment not covered above
67 Retail trading in bricks, tiles and other building materials
Retail trading in hardware and sanitary equipment
Retail trading in wood, bamboo cane, bark and thatches
Retail trading in other building materials ••
68 Retail trading in agricultural and industrial machinery equipment, tools and appliances
Bika. 4
Retail trading in transport Bnd storage equipments
Retail trading in electrical goods like electric fan, bulb, etc.
Retail trading in skins, leather and furs and their products excluding footwear and headgear
Minor Group (Code)
3
645
646
647
648
650
651
652
653
654
6SS
660
661
662
663
664
670
671
672
673
680
681
682
683
Major Group (Code) Description
1 2
Retail Trade-concld.
Retail trading in clock and watch, eye glass, fram.e .. •. .• •. . .
Retail trading in scientific.· medical and surgical instruments
Retail trading in precious stones and jewellery
Retail trading, in musical instruments, gramophone record, pictures and paintings including curio ciealinl
BoOk-selling
Retail trading in goods unspecified
69 Trade and Commerce Miscellaneous
Importing and exporting of goods and commodities
Real estate and properties
Stocks, shares and futures
Providents and insuraD£CS
MODeY~ lending ,(jnd1lenoas)
Banking- and similar type of financial operation
A IlCtioneering
Distribution of motion pictures
All other activities connected with trade and commerce not covered above, including hiring,out of durabJe goods such as electric fan. microphone, rickshaw, etc.
Minor Group (Code)
3
684
685
686
687
688
689
690
691
692
693
694
695
696
697
699
Division 7-Transport, Storage and Communication 70 Transport
Transportin, by raHways ••
Transportin,'by-tramwayand bus service
Transporting by motor vehicles (other than onuribus)
Transporting by-road through other means of transport such as hackney carriage, bullockcar.t, ekka
Animal transporting by animals such as horses, elephant, mule, camel ••
Transporting by man sucb as carrying of I uggage, handcart driving, rickshaw pulling, cycle rickshaw driving
Transporting by boat, steamer. fcrry. etc. by river oanu,
700
70J
702
703
704
70S
706
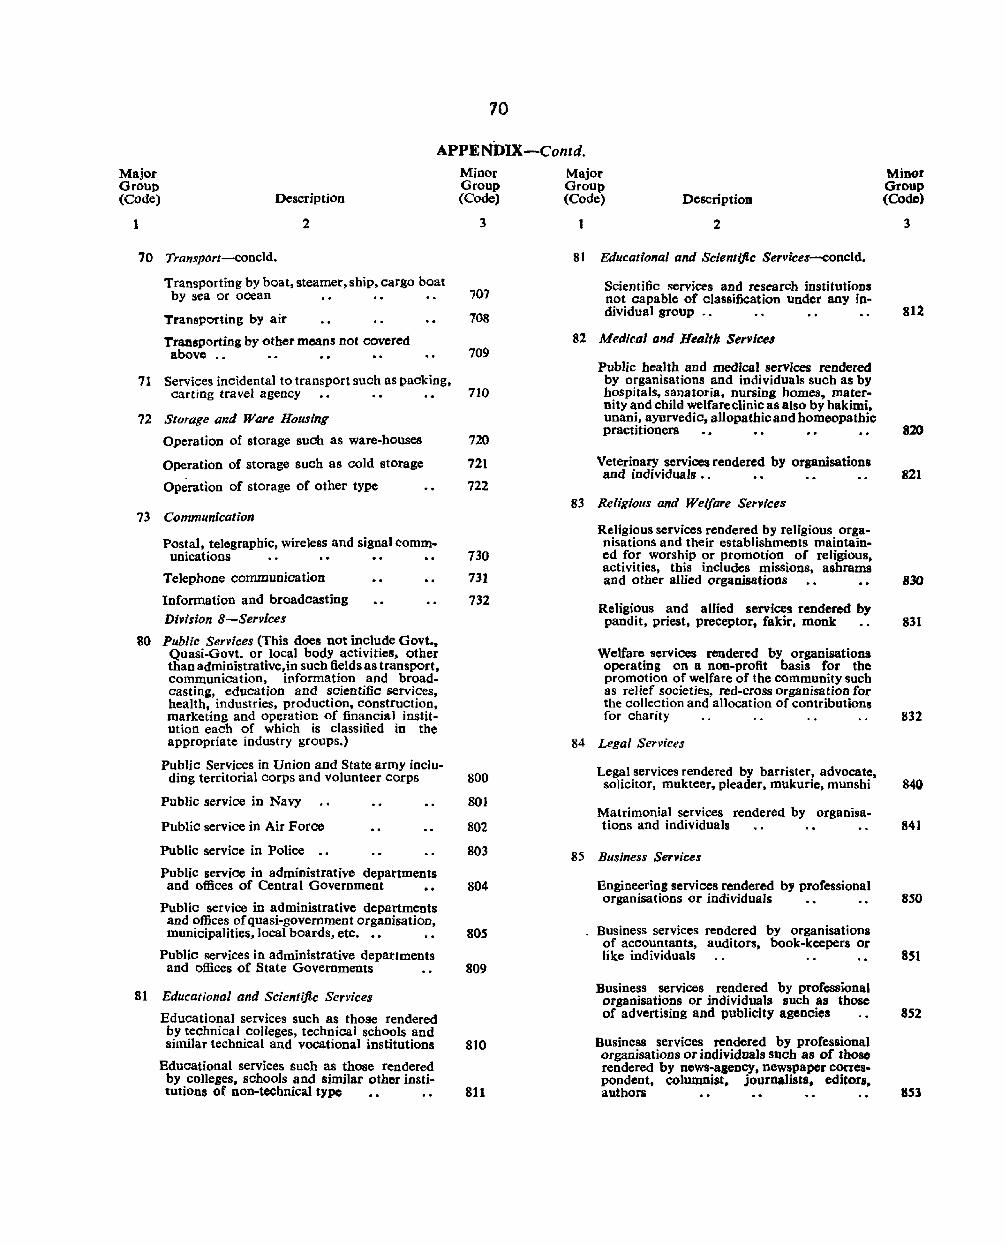
10
APPENIlIX-Contd. Major Group (Code)
1
Description
2
70 Transport-coneld.
Transporting by boat, steamer, ship. cargo boat by sea or oCean
Transporting by air
Transporting by other means not covered above .•
71 Services inCidental to transport such as packing.
Minor Group (Code)
3
707
708
709
carting travel agency 710
72 Storage and Ware Housing
Operation of storage such as ware-houses 720
Operation of storage such as cold storage 721
Operation of storage of other type 722
73 Comm'4nication
Postal, telegraphic, wireless and signal comm-unications
Telephone communication
Information and broadcasting Division 8~Services
SO Public Services (This does not include Govt •• Quasi-Govt. or local body activities, other than administrative,in such fields as transport, communication, information and broadcasting, education and scientific services, health, industries, production, construction, marketing and operation of financial institution each of which is classilied in the appropriate industry groups.)
Public Services in Union and State army inclu-ding territorial corps and volunteer corps
Public service in Navy
Public service in Air Force
Public service in Police •.
Public service in administrative departments and offices of Central Government
Public service in administrative departments and offices of quasi-government organisation, municipalities,local boards, etc. • •
Public services in administrative departments and offices of State Governments
81 Educational and Scientific Services
Educational services such as those rendered by technical colleges, technical schools and similar technical and vocational institutions
Educational services such as those rendered by colleges, schools and similar other institutions of non-technical type
730
731
732
SOO
801
802
803
804
80S
809
810
S11
Major Group (Code) Descriptioll
1 2
81 Educational and Scientiflc Services-concld.
Scientific services and research institutioDs not capable of olassification under any individual group ..
82 Medical and Health Service'
Public health and medical services rendered by organisations and individuals such as by hospitals. sanatoria. nursing homes, maternity and child welfare clinic as also by hakimi, unani, ayurvedict allopathic and homeopathic practitioners
Veterinary sel'Vices rendered by organisations and individuals ••
83 Reli'gious and Welfare Services
Religious services rendered by religious organisations and their establishments maintained for worship or promotion of religious. activities, this includes missions. ashrams and other allied organisations
Religious and allied services rendered by pandit. priest, preceptor, fakir, monk ..
Welfare services rendered by organisations operating on a non-profit basis for the promotion of welfare of the community such as relief societies. red-cross organisation for the collection and allocation of contributions for charity
84 Legal Services
Legal services rendered by barrister, advocate, solicitor, mukteer, pleader, mukurie, munshi
Matrimonial services rendered by organisations and individuals
85 Business Services
Engineering services rendered by professional organisations or individuals
Business services rendered by organisations of accountants, auditors. book-keepers or like individuals
Business services rendered by professional organisations or individuals such as those of advertising and publicity agenoies •.
Business services rendered by professional organisations or individuals such as of those rendered by news-agency, newspaper correspondent, columnist, journalists. editors, authors
Minor Group (Code)
3
812
820
821
830
831
832
840
841
850
851
852
853

~pPENmX-Concld.
~ajor '-Group ,(CQde) Description
: I 2
'86 Community Ser'liees and Trade atld 'Labour Associations
Services rendered by trade associations. chambers, of oommelice. trade unions and similar other organisations
~Scrvices rendered by civic, social, cultural, politi~1 and ftaterm!'1 organisations ..such as
. rate payCHs association, club.1librpry
Community services' sll£h as-' those rendered by pubJic librarie~, museums,rbotanicaland zoolbgical gardens etc.
~87 Recreation Services,'
Production of motion rpicture :an-d allied sctvices such as proeessing editing, .etc. . .
Re¢reation services renderedby.cincma!houses b&' exhibition. of motiODipicuuea •.
tRecreation services,rendered ,?y,organiSations ;and" mdividuals.,sucb;asrtlmso ·of theatres. opera conwames, baUoLand daming Parties. musicians, exhibitioDB~.circus, carnivals •.
Recreation services rendered' by indoor and outdoor sports by organisations and individuals including horse. motor, etc, racing
~88 Personal Services
Bib ....
Services rendered te households s1ileb as . those .by domestic servants,'woks
Minor Group ,(Code)
:J
.861
862
810
,811
·872
873
,-880
Major GrotJP (Code) :Description
2
''8'8 Personal'Senl/clI8-eoDcld.
'Services rendered to'households suches those by governess, tutor. private secretary
SeEvtces, rendered by hotel$. boarding houses, eatiDa Ibouses, cafes, restauraJUS and similar other Of83llisations to . provide lodgina a'J'd boarding facilities
Laumh'y seEv.ic..nendere4. I b~ organisations and .. individual •• this, includes all types of
,cleaning, dyeing bleaching, dry cleaning, ·ser;wees '
I Hair. dressing, other services rendered by or_nj.hon aad individuals, such as those by tbarber, bah'drasing saloon and beauty shops
~ServiC8Sreadered by portrait and commercial photOiraphic studios
) 89 Services (not elsewhere classifted)
8erYices rendered by organisatioDs or individuals not elsewhere classified
Minor Group
• (Code)
3
881
882
883
884
885
890
lJiiIilion 9-Actlviriel ,not (adequately described
·,90 Activities unsP"Cifted and not adequately described including activities of such individuals who fail to,pcovide,sufficient information abQut Itbeir lindustrial affiliation to enable them ItO! be .classified;
:Fresh_entrantslto ·tbe lLabolir :Market
900
999

72
TABLE B-I~WORKERS AND NON-WORKERS CLASSIFJED
WORKERS .~ ~-
I II III In Mining, Quarrymg. LIvestock, Forestry. Fishing, Hunting,
As Plantations. AI Agricultural Orchards and
Total Total population Total workers Cultivator Labourer Allied activities Rural Ago-
District/Tehsll Urban group Persons Males Females Males Females Males Females Males Females Males Females
1 2 S 04 5 6 7 8 9 10 11 12 13 14
DI"iTRICT Total Total 444,515 232,699 211,816 120,652 54,754 57,962 40,344 653 309 2,028 348 0-14 197,738 103,857 93,881 9,344 6,922 5.940 5.452 93 33 53 20
15-34 141,183 73,811 67,372 63,482 29,288 29,262 22,213 405 178 1.382 258 35-59 81,488 43,167 38,321 40,556 16,389 18,515 11,345 130 83 567 66 60+ 23.681 11,639 12.042 7,255 2,149 4,234 1,330 2S 15 26 4
Age not 425 225 200 15 6 II 4 stated
Rural Total ~t489 134.539 121,950 78,890 49,266 57.293 39.397 626 220 1,891 328 0-14 114.347 59.608 54,739 8,~23 6,704 5.887 5,371 82 18 49 19
15-34 81.472 42.554 38,918 40.731 26.629 28.986 21,733 398 133 1.310 249 35-59 46.284 24,861 21,423 24,381 14,146 18.274 11,006 125 60 511 5R 60+ 13,980 7,302 6,678 5.241 1,781 4.136 1,283 21 9 21 2
Age not 406 214 J92 14 6 10 4 stated
Urban Total 188,026 98,160 89,866 41.762 5,488 669 947 27 89 137 20 0-14 83.391 44.249 39,142 821 218 53 81 11 15 4
15-34 59,711 31,257 28,454 22,751 2.659 276 480 7 45 72 9 35-59 35,204 18,306 16,898 16.175 2.243 241 339 5 23 56 8 60+ 9,701 4.337 5,364 2,014 368 98 4/ 4 6 5 2
Age not 19 11 8 stated
Bikancr Tehsil Rural Total 71,495 37,586 33,909 21.720 13.667 13,842 11 ,055 273 85 1,827 323 0-14 31.006 16.254 14,752 1,859 1.662 1,324 1,496 36 6 2S 14
15-34 23,272 12,314 10,958 11,621 7,192 6,953 5.886 173 48 1,277 249 35-59 13,028 6,908 6,120 6,757 4,]46 4,47] 3,206 48 26 504 58 60+ 4,091 2,065 2,026 1,483 667 1,094 467 16 5 21 2 , ;" c( 98 4S 53
stated
Lunkaranaar Tehai1 Rural Total 53.967 28,329 25,638 16,192 6,561 12,515 5,769 130 13 16 3 0-14 24,559 12,750 11,809 1,706 833 ],365 744 12 3 3
15-34 16.877 8,799 8,078 8A13 3,795 6.377 3,389 79 10 9 35-59 9,690 5,272 4,418 5,145 1.825 4,021 1,559 36 3 4
60+ 2,763 i ,'to I 1,296 923 108 749 77 3
Age not 78 41 37 5 3 statcd
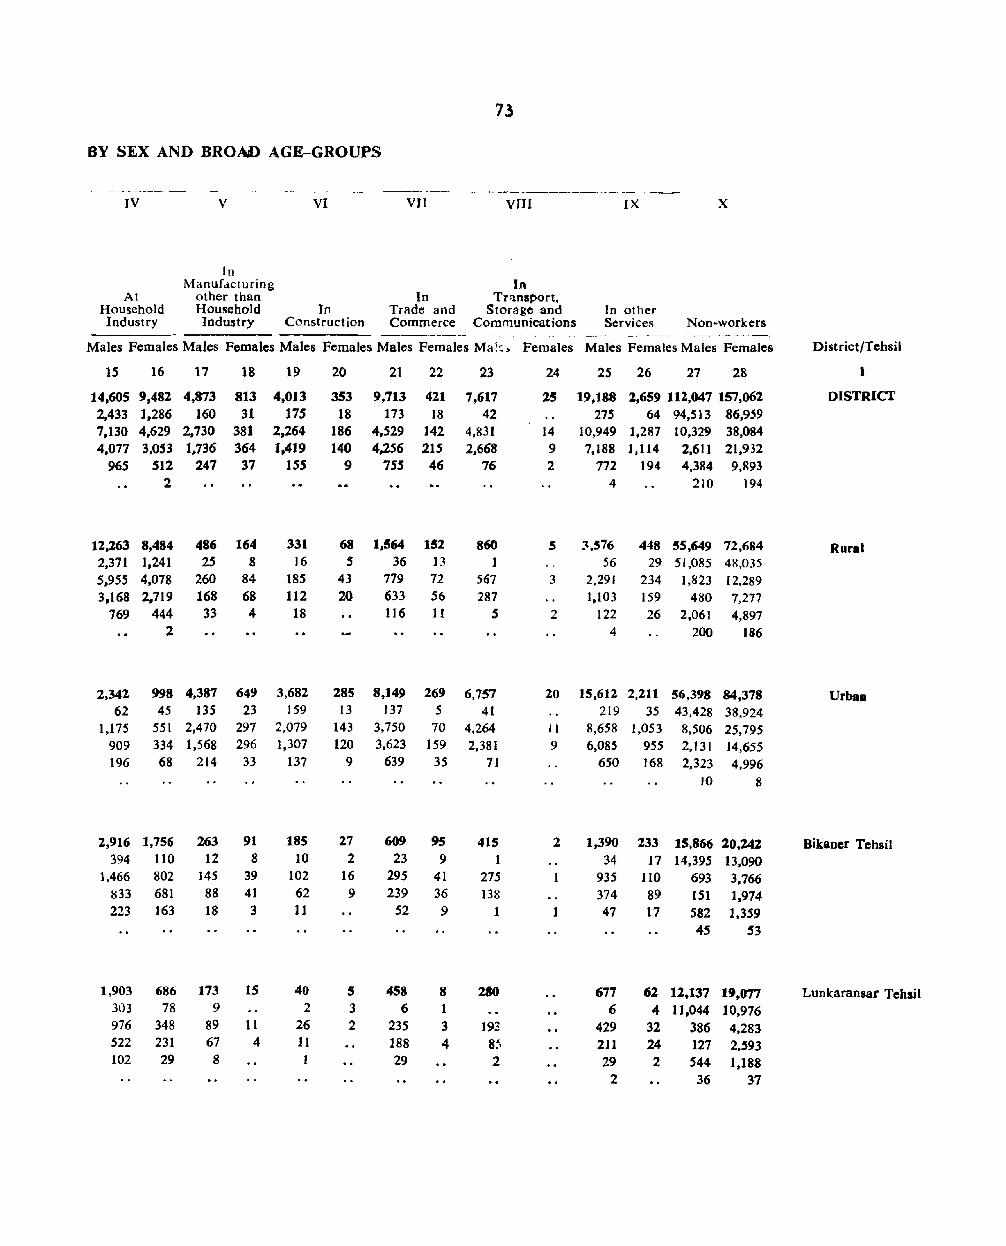
73
BY SEX AND BROAD AGE-GROUPS
-~- --------- -_---- ------~---------------
IV V VI VIl VJII IX x
In Manufdcturing In
At other than In Tl'lnaport. Household Household In Trade and Storage and In other Industry Industry Construction Commerce Communications Services Non-workers
~---- ----Males Females Males Females Males Females Males Females Ma~~~ Females Males Females Males Females District/Tchsil
15 16 17 18 19 20 21 22 23 24 25 26 27 28 1
14.605 9.482 4,873 813 4,013 353 9,713 421 7,617 25 19.188 2,659 112,047 157,062 DISTRICf
2,433 1,286 160 31 175 18 173 18 42 275 64 94,513 86,959 7,130 4,629 2,730 381 2,264 186 4,529 142 4,831 14 10.949 1,287 10,329 38,084 4,077 3,053 1,736 364 1,419 140 4,256 215 2,668 9 7,188 1,114 2.61 I 21,932
965 512 247 37 ISS 9 755 46 76 2 172 194 4,384 9,893 2 4 210 194
12,263 8,484 486 164 331 68 1,564 152 860 5 3.576 448 55,649 72,684 Rural 2,371 1,241 25 8 16 5 36 13 1 56 29 51,085 48,035 5,955 4,078 260 84 185 43 779 72 567 3 2,291 234 1,823 12.289 3,168 2.719 168 68 112 20 633 56 287 1.103 159 480 7,277
769 444 33 4 18 116 11 S 2 122 26 2,061 4,897 2 4 200 186
2,342 998 4,387 649 3,682 285 8,149 269 6,757 20 15,6]2 2,211 56,398 84,378 Urbao 62 45 13S 23 159 13 137 5 41 219 35 43.428 38,924
1,175 5S1 2,470 297 2.079 143 3,750 70 4,264 II 8,658 1,053 8,506 25,795 909 334 1.568 296 1,307 120 3,623 159 2,381 9 6,085 955 2,131 ]4,655 196 68 214 33 137 9 639 35 71 650 168 2,323 4,996
10 8
2,916 1,756 263 91 185 27 609 95 415 2 1,390 233 15,866 20.242 Bikflncr TcbsiJ 394 110 12 8 10 2 23 9 34 17 14,395 13,090
1.466 802 145 39 102 16 295 41 275 935 110 693 3,766 ~33 681 88 41 62 9 239 36 138 374 89 151 1,974 223 163 18 3 11 52 9 1 1 47 17 582 1,359
45 53
1,903 686 173 15 40 5 458 8 280 677 62 12,137 19,077 Lunkaransar Tehail 303 78 9 2 3 6 1 6 4 Il,044 10,976 976 348 89 11 26 2 235 3 193 429 32 386 4,283 522 231 67 4 11 188 4 8:, 211 24 127 2,593 102 29 8 29 2 29 2 544 1,188
2 36 37

':74
"If ABLE B-I-WORKERS AND 'NON-WOltK'ERB iCLASSIFIBJ)
WORfi:RS
.I II III In Minins. Quarrying, Livestock, Forestry, Fishing. Hunting,
As Plantations, · ... 5 ,i\lricul tural Orchards and
!'fota. Total population Total wotkol's 'Gultivator Labourer rAllied activiti08
f Diltrict/Tehsil !Rural Urban
Age-group Persons Males Females Males Females 'Males 'Females Males,Fern~es Males Females
J 2 3 4 S 6 7 8 9 10 '11 12 13 14
ko)ayat Tehsil Rural Total 47,* 25,71.0 22,288 16,H3 10.736 lAl.J59 _S~17 US '9(;. ·4 0-14 21,046 11,062 9,984 2,1S1 1,513 1.,011 802 20 9 2
1S-34 15,617 8,415 7.202 8.164 5.780 5.169 ~227 77 59. 11 35-59 8,764 4.881 3.883 4,790 3,On ~~35 1,634 17 26 I
60+ 2.546- 1,339 1.207 1,007 368 743 174 I 2 Age Dot 25 13 12 1 :2
stated
'Notha ITehsil Rural Total 83,029 42,914 40,115 '24,865 18,302 2~7f7 rBi17l6 ID11 26 44 2 0-14 37,736 19,542 18.194 2,807 2,696 2.187 2,329 14 3 19 .2
15-34 25,706 13,026 12,680 12,.533 9,862 1().481 9,231 69 16 23 35-59 14.802 7,800 7J002 7,689 -5.102 6',341 4.607 24 5 .2
60+ 4,5SO 2,431 2,149 1.828 ,638 1,550 565 1 2 .Age not lOS 115 90 .'8 4 t) -4
atated
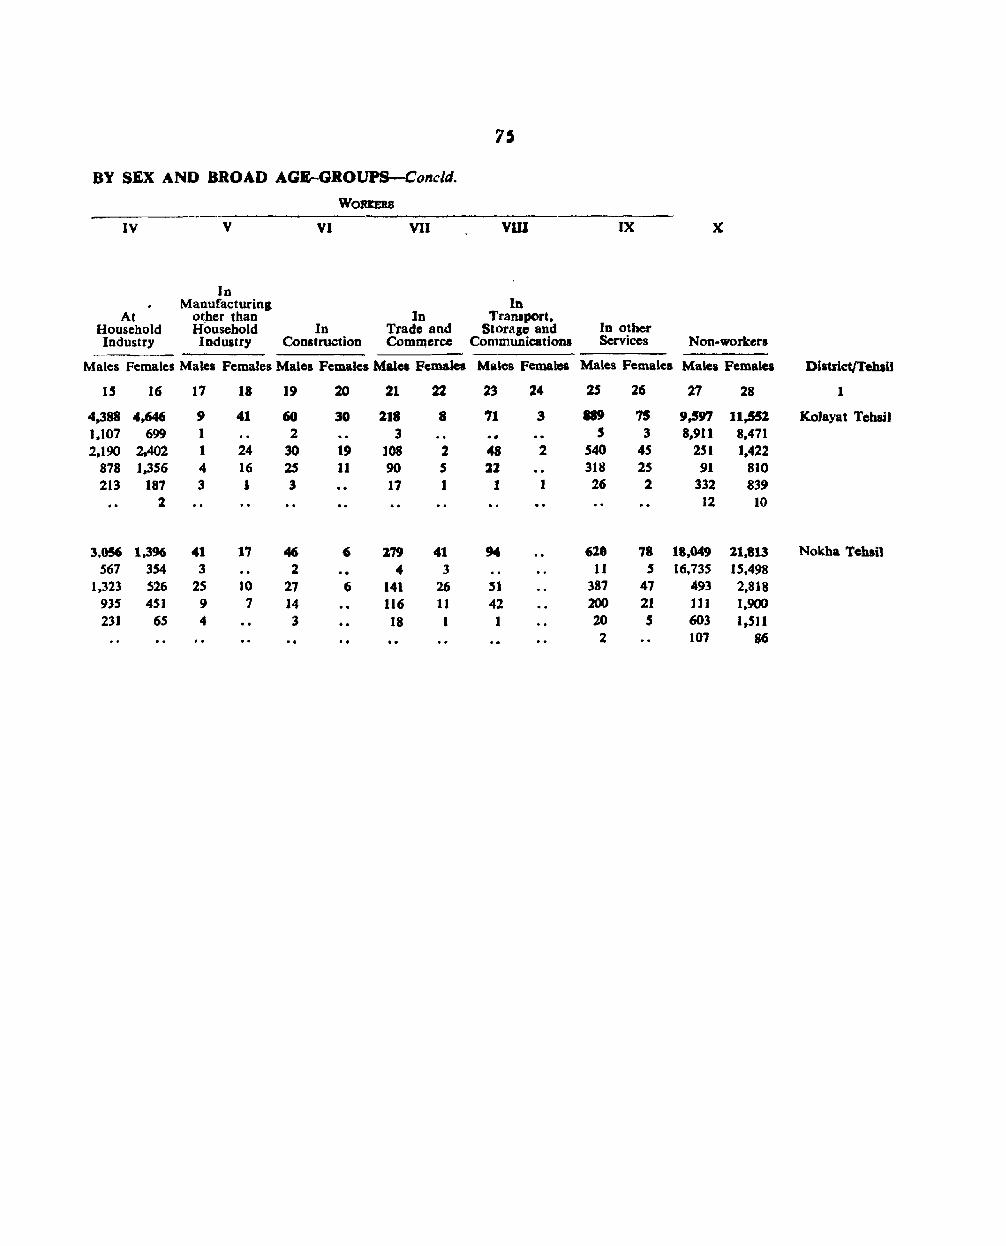
75
BY SEX AND BROAD AGE-GROUPS-Concld.
WOREERS
IV V VI VII vw IX x
In Manufacturina 1ft
At other than In Tral1Jport. Household Household In Trade and Storago and In other Industry Industry Construction ComIQcrcc Communications Services Non-workers
Males Females Males Females Males Females Males Females Males FemalOi Males Females Males Females District/Tehsil
IS 16 17 18 19 20 21 22 23 24 25 26 27 28 1
4,388 4,646 9 41 60 30 218 8 '1 3 889 75 9,597 11,552 KoJayat Tehan t.107 699 1 2 3 .. S 3 8,911 8.471 2.190 2,402 1 24 30 19 108 2 48 2 S40 45 251 1,422
878 1,356 4 16 2S 11 90 5 22 318 25 91 810 213 187 3 I 3 17 I 1 I 26 2 332 839 .. 2 12 10
3.056 1,396 41 17 46 (; m 41 94 610 78 18,049 11,813 Nokba Tehsil 567 354 3 2 4 3 11 5 16,735 15.498
1.323 526 25 10 27 6 141 26 ,. 387 47 493 2,818 9J5 451 9 7 14 116 11 42 200 21 111 1.900 231 65 4 3 18 I 1 20 5 603 1,511
2 107 86
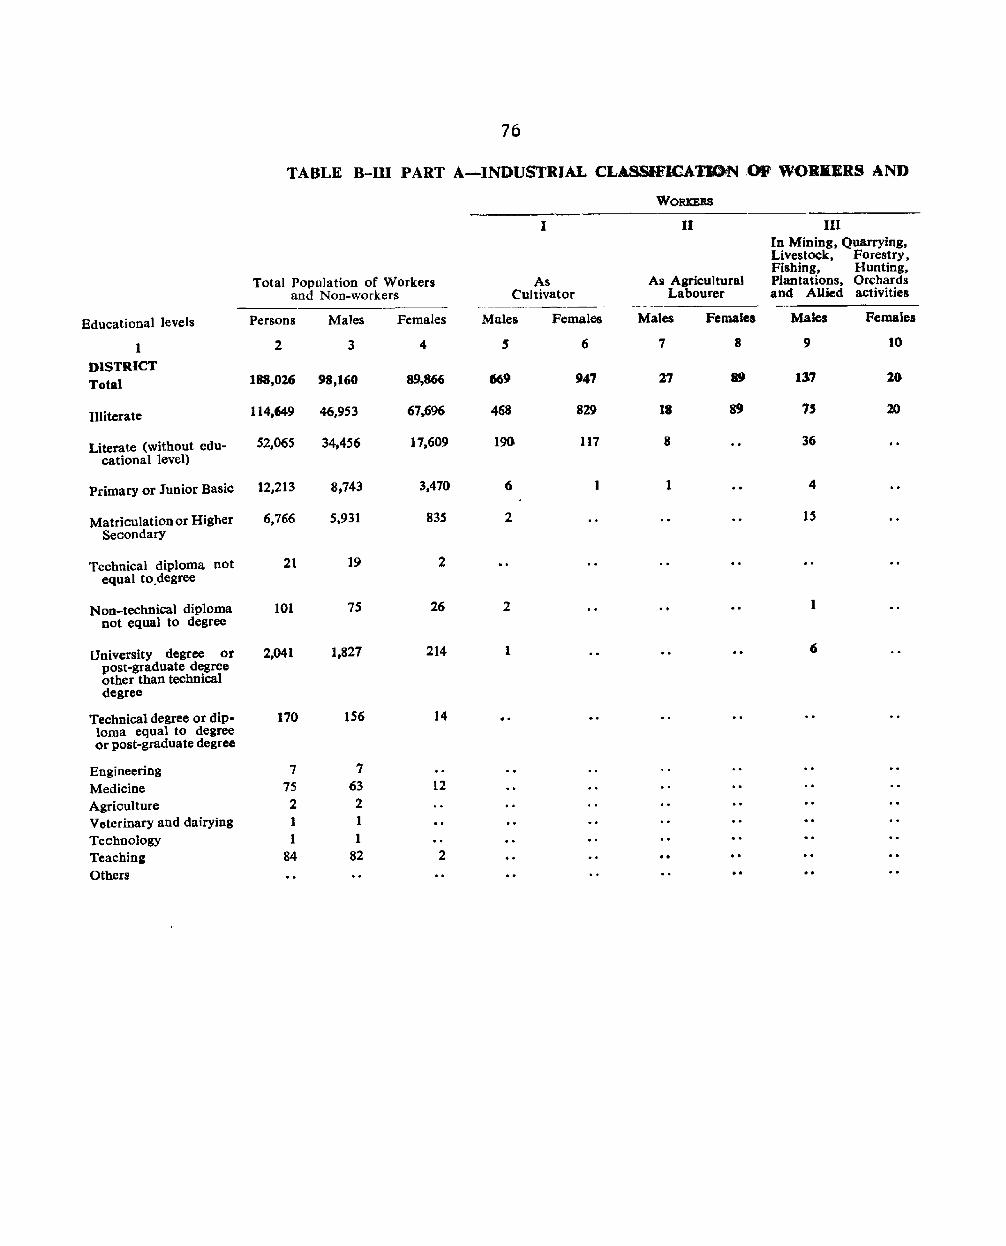
Educational levels
1 DISTRICT Total
Illiterate
Literate (without educational level)
Primary or Junior Basic
Matriculation or Higher Secondary
Technical diploma not equal to. degree
Non-technical diploma not equal to degree
University degree or post-graduate degree other than technical degree
Technical degree or diploma equal to degree or post-graduate degree
Engineering Medicine Agriculture Veterinary and dairying Technology Teaching Otben
76
TABLE 8-m PART A-INDUSTRIAL CLASSIFICATDN ,OF WORKERS AND
Total Population of Workers and Non-workers
Persons
2
188,016
114,649
52,065
12,213
6,766
21
101
2,041
170
7 75 2 1 1
84
Males
3
98,160
46,953
34A56
8,743
5,931
19
75
1,827
156
7 63 2 1 1
82
Females
4
89.,866
67.696
17,609
3,470
835
2
26
214
14
12
2
WORKERS
I II III In Mining, Quarrying, Livestock. Forestry. Fishing, Hunting,
As As Agricultural Plantations. Orchards Cultivator Labourer and Allied activities
---~-~--~~- -
Males Females Males Females Males Females
S 6 7 8 9 10
669 947 '17 89 137 'lD
468 829 18 89 75 20
J9() 117 8 36
6 I 1 4
2 15
2 I
1 6
..
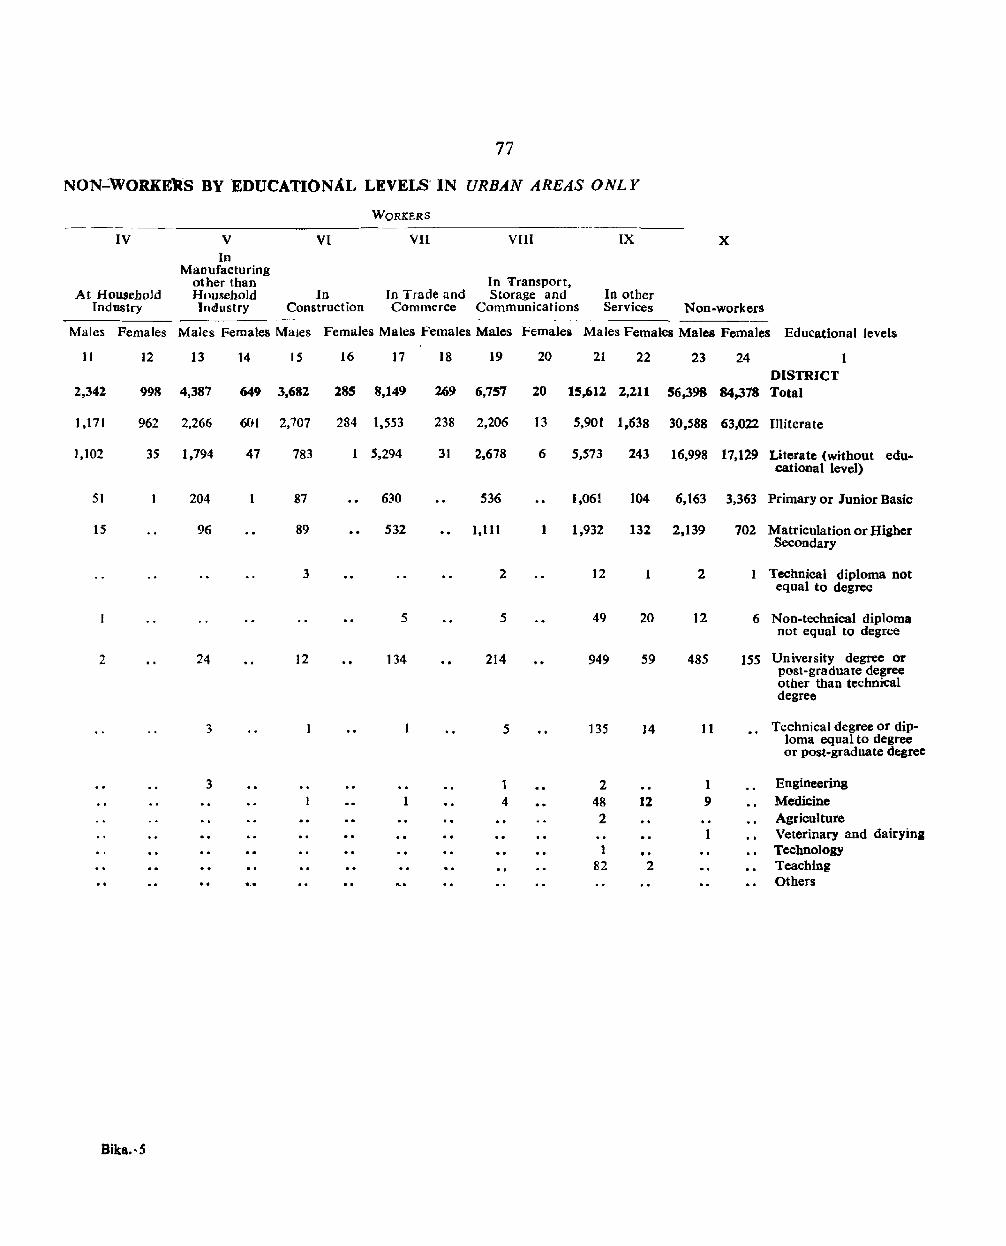
77
NON"':'WORKO·S BY EDUCATIONAL LEVELS· IN URBAN AREAS ONLY
WORKERS
IV V VI VII vm IX X In
Manufacturing other than In Transport,
At Household HousehoJd In In Trade and Storage and In other Industry Industry Construction Commerce Communications Services Non-workers
-~~~---
Males Females Males Females Males Females Males Females Males Females Males Females Males Females Educational levels
11 12 13 14 IS 16 17 18 19 20 21 22 23 24 1 DISTRICT
2,342 998 4,387 649 3,682 285 8,149 269 6,757 20 15,612 2,211 56,398 84,378 Total
1,171 962 2,266 601 2,707 284 1,553 238 2,206 13 5,901 1,638 30,588 63,022 Illiterate
1,102 35 1,794 47 783 1 5,294 31 2,678 6 5,573 243 16,998 17,129 Literate (without edu-cational level)
51 204 87 630 536 1,061 104 6.163 3,363 Primary or Junior Basic
15 96 89 532 1.111 1 1,932 132 2,139 702 Matriculation or Higher Secondary
3 2 ]2 1 2 Technical diploma not equal to degree
5 5 49 20 12 6 Non-technical diploma not equal to degree
2 24 12 134 214 949 59 485 155 University degree or post-graduate degree other than technical degree
3 1 5 135 14 11 Technical degree or dip-loma equal to degree or post-graduate degree
3 1 2 1 Engineering
4 48 12 9 Medicine 2 Agriculture
1 Veterinary and dairying 1 .. Technology
82 2 Teaching Others
Bika.,S
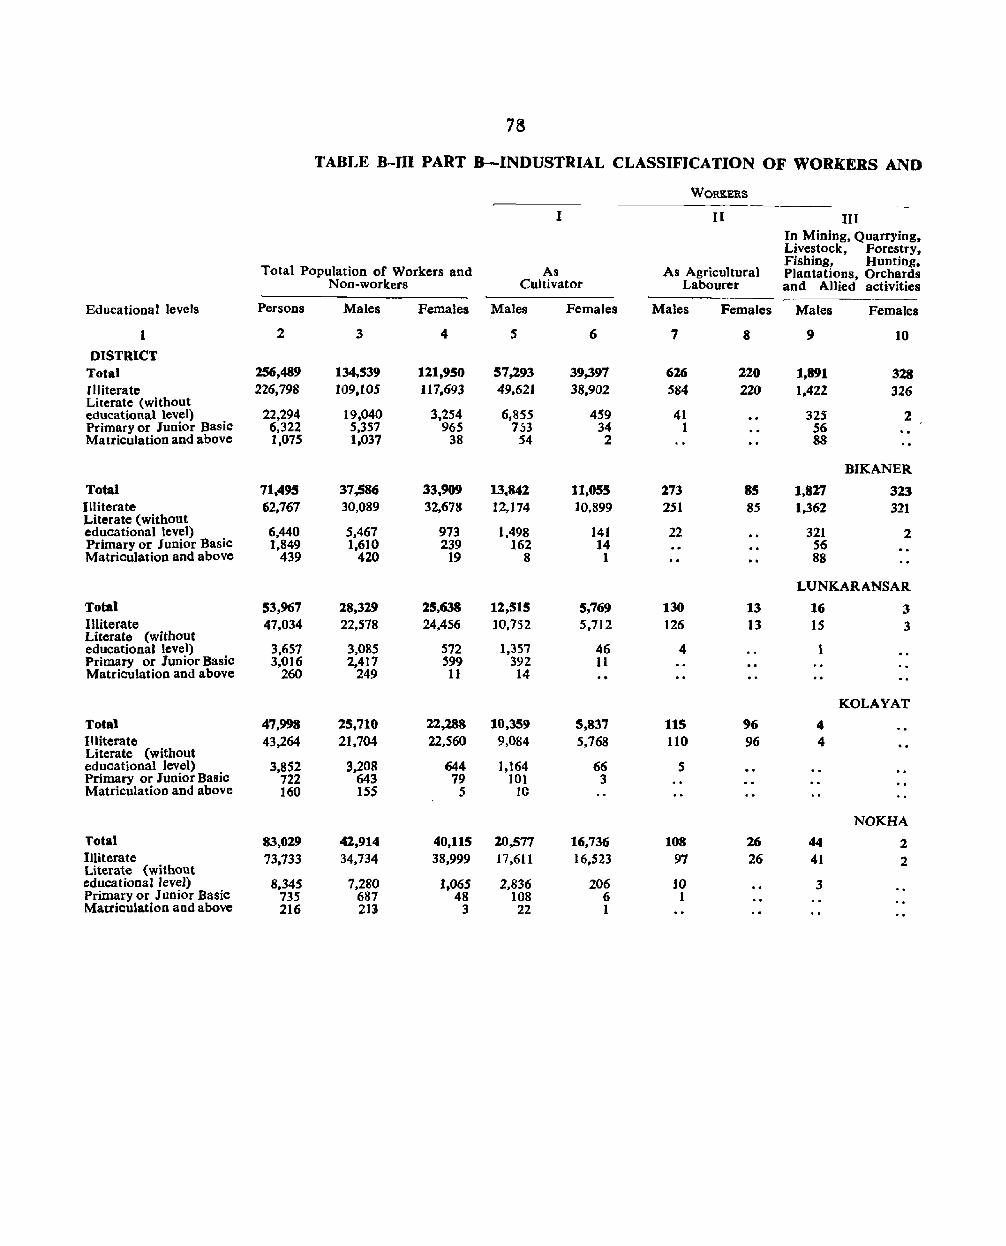
78
TABLE B-m PART B-INDUSTRIAL CLASSIFICATION OF WORKERS AND
WORKERS
I II III In Mining. Quarrying, Livestock. Forestry,
Total Population of Workers and As As Agricultural Fishing, Huntjng. Plantations, Orchards
Non-workers Cultivator Labourer and Allied activities
Educational levels Persons Males Females Males Females Males Females Males Females
1 2 3 4 S 6 7 8 9 10
DISTRICT Total 256,489 134,539 121,950 57,293 39,397 626 220 1,891 328 Illiterate 226,798 109.105 117,693 49,621 38,902 584 220 1,422 326 Literate (without
19,040 6,855 459 41 325 educational level) 22,294 3,254 2 Primary or Junior Basic 6,322 5.357 965 753 34 1 56 Matriculation and above 1,075 1.037 38 54 2 88
BIKANER
Total 71.495 37,586 33,909 13,842 11,055 273 85 1,827 323 Illiterate 62,767 30,089 32,678 12,174 Literate (without
10,899 251 85 1,362 321
educational level) 6,440 5,467 973 1,498 141 22 321 2 Primary or Junior Basic 1,849 1,610 239 162 14 56 Matriculation and above 439 420 19 8 I 88
LUNKARANSAR
Total 53,967 28,329 25,638 12,515 5,769 130 13 16 3 Illiterate Literate (without
47,034 22,578 24,456 10,752 5,712 ]26 13 15 3
1,357 4 1 educational level) 3,lls7 3,085 572 46 Primary or Junior Basic 3,016 2,417 S99 392 11 Matriculation and above 260 249 11 14
KOLAYAT
Total 47,998 25,710 22,288 10,359 5,837 115 96 4 Illiterate 43,264 Literate (without
21,704 22,560 9,084 5.768 110 96 4
educational level) 3.852 3,208 644 l,t64 66 S Primary or Junior Basic 722 643 79 ]01 3 Matriculation and above ]60 ISS 5 10
NOKHA Total 83,029 42,914 40,115 20.577 16,736 108 26 44 2 IJ1iterate 73,733 34,734 38,999 17.611 16,523 97 26 41 2 Literate (without educational level) 8.345 7,280 1,065 2,836 206 10 3 Primary or Junior Basic 735 687 48 108 6 1 Matriculation and above 216 21l 3 22 1
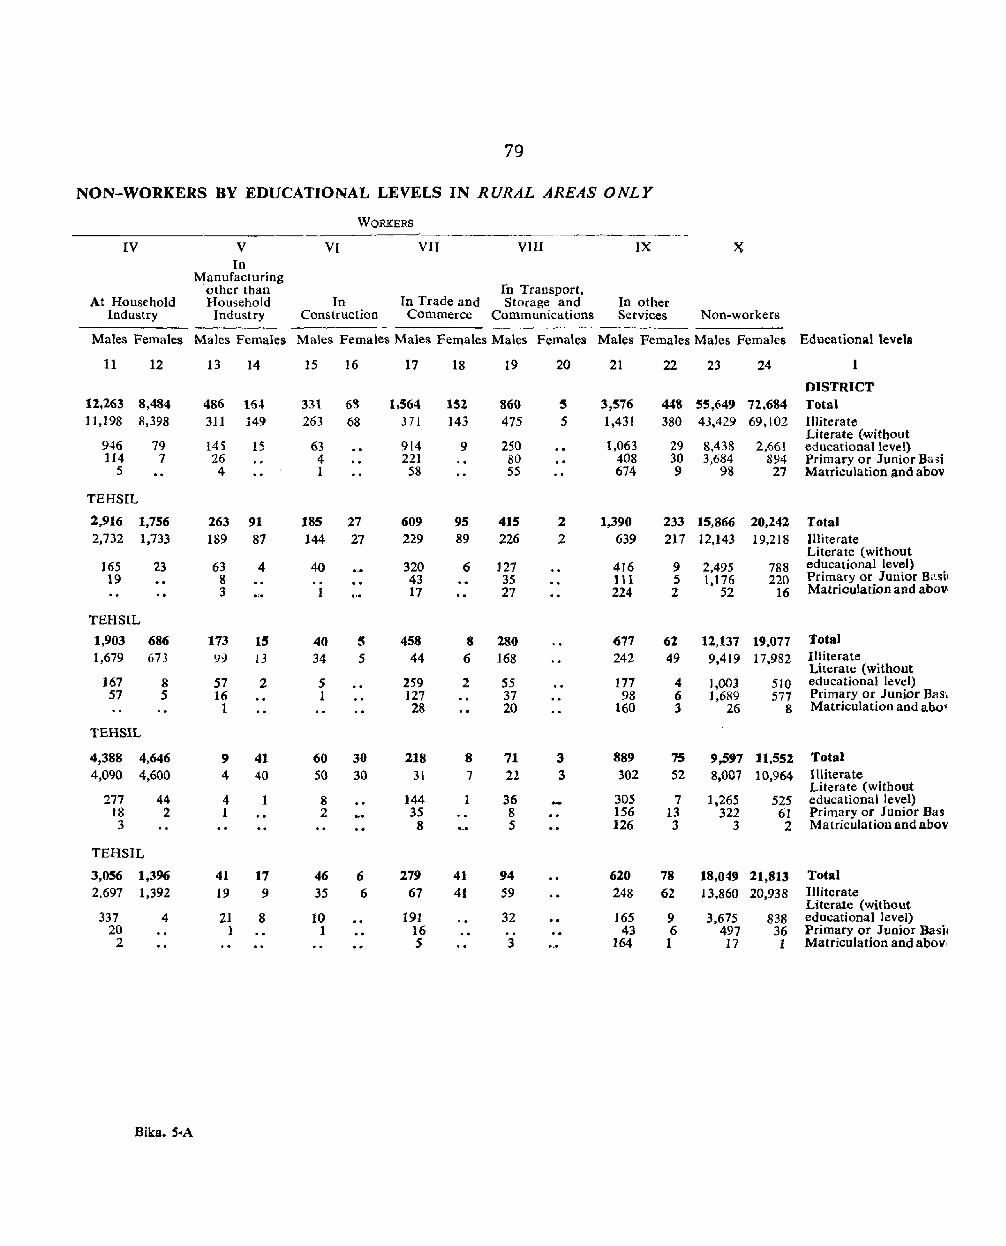
79
NON-WORKERS BY EDUCATIONAL LEVELS IN RURAL AREAS ONLY
WORKERS
IV V VI VII VIII IX In
l'vfanufacturing In Transport, other than
At Household Household In In Trade and Storage and In other Industry Industry Construction Commerce Communications Services Non-workers
---~--~
Males Females Males Females Males Females Males Females Males Females Males Females Males Females Educational level.
11 12 13 14 15 16 17 18 19 20 21 22 23 24 1
DISTRICT 12,263 8,484 486 Hi.1 331 61J 1,564 152 860 5 3,576 448 55.649 72,684 Total 11,198 8,398 311 149 263 68 371 143 475 5 1,431 380 43,429 69,102 Illiterate
Literate (without 9-t6 79 145 15 63 914 9 250 1,063 29 8,438 2,661 educational level) 114 7 26 4 221 80 408 30 3,684 894 Primary or Junior Ba si
5 4 1 58 55 674 9 98 27 Matriculation and abov,
TEHSIL
2,916 1,756 263 91 185 27 609 95 415 2 1,390 233 15,866 20,242 Total 2,732 1,733 189 87 144 27 229 89 226 2 639 217 12,143 19.218 ll1iterate
Literate (without 165 23 63 4 40 320 6 ]27 416 9 2.495 788 educational level) 19 8 43 35 Itl 5 1.176 220 Primary or Junior Basil
3 1 17 27 224 2 52 16 Matriculation and abov
TEHSIL
1,903 686 173 15 40 5 458 8 280 677 62 12,137 19,077 Total 1,679 673 1)9 l3 34 5 44 6 168 242 49 9,419 17,982 Illiterate
Literate (without 167 8 57 2 5 259 2 55 177 4 ],003 510 educational level) 57 5 Hi 1 ]27 37 98 6 1,689 577 Primary or Junior Bas.
1 28 20 160 3 26 8 Matriculation and abo1
TEHSIL
4,388 4,646 9 41 60 30 218 8 71 3 889 75 9,597 11,552 Total 4,090 4,600 4 40 50 30 31 7 22 3 302 52 8,007 10,964 Illiterate
Literate (without 277 44 4 1 8 144 1 36 305 7 1,265 525 educational level)
18 2 1 2 35 8 156 13 322 6] Primary or Junior Bas 3 8 5 126 3 3 2 Matriculation and abov
TEHSIL
3,056 1,396 41 17 46 6 279 41 94 620 78 18,049 21,813 Total 2,697 1,392 19 9 35 6 67 41 59 248 62 13,860 20,938 Illiterate
Literate (without 337 4 21 8 10 191 32 165 9 3,675 838 educational level)
20 1 1 16 43 6 497 36 Primary or Junior Basil 2 S 3 164 1 17 1 Matriculation and abovi
Bika. S~A
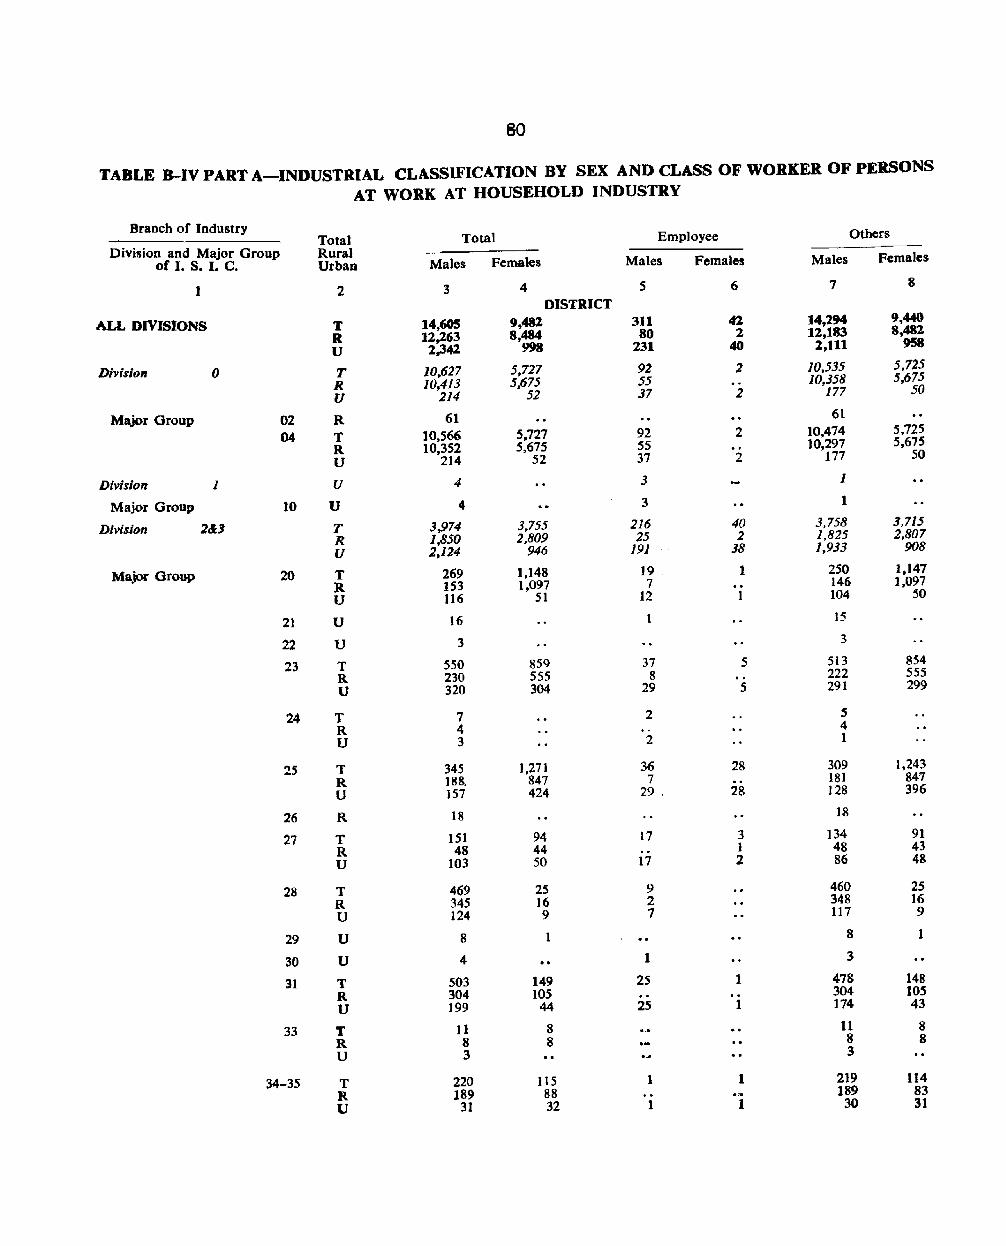
80
TABLE B-IV PART A-INDUSTRIAL CLASSIFICATION BY SEX AND CLASS OF WORKER OF PERSONS AT WORK AT HOUSEHOLD INDUSTRY
Branch of Industry Total Total Employee Others
Division and Major Group Rural of I. S. I. C. Urban Males Females Males Females Males Females
1 2 3 4 5 6 7 8
DISTRICT
ALL DIVISIONS T 14,605 9,482 311 42 14,294 9,440
R 12.263 8,484 80 2 12,183 8,482
U 2,342 998 231 40 2,111 958
Division 0 T 10,627 5,727 92 2 10,535 5,725
R ]0,413 5,675 55 .. 10,358 5,675
U 214 52 37 2 177 50
Major Group 02 R 61 61
04 T 10,566 5,727 92 2 10,474 5,725
R 10,352 5,675 55 10,297 5.675
U 214 52 37 2 177 50
Division 1 U 4 3 1
Major Group 10 U 4 3 1
Division 2&3 T 3,974 3,755 216 40 3,758 3,715
R 1,850 2,809 25 2 1.825 2.807
U 2.124 946 191 38 1,933 908
Major Group 20 T 269 1,148 19 , 1 250 1.147 R 153 1,097 7 .. 146 1,097 U 116 51 12 1 104 50
21 U 16 15
22 U 3 3
23 T 550 859 37 5 513 854 R 230 555 8 222 555 U 320 304 29 5 291 299
24 T 7 2 5 R 4 .. 4 U 3 2 1
25 T 345 1,271 36 28 309 1.243 R 188. 847 7 181 847 U }57 424 29 28 128 396
26 R 18 18
27 T 151 94 17 3 134 91 R 48 44 1 48 43 U 103 50 17 2 86 48
28 T 469 25 9 460 25 R 345 16 2 348 16 U 124 9 7 117 9
29 U 8 8 1
30 U 4 1 3
31 T 503 149 25 1 478 148 R 304 lOS 304 lOS U 199 44 25 1 174 43
33 T 11 8 11 8 R 8 8 8 8 U 3 3
34-35 T 220 115 1 1 219 114 R 189 88 .'" 189 83 U 31 32 1 1 30 31
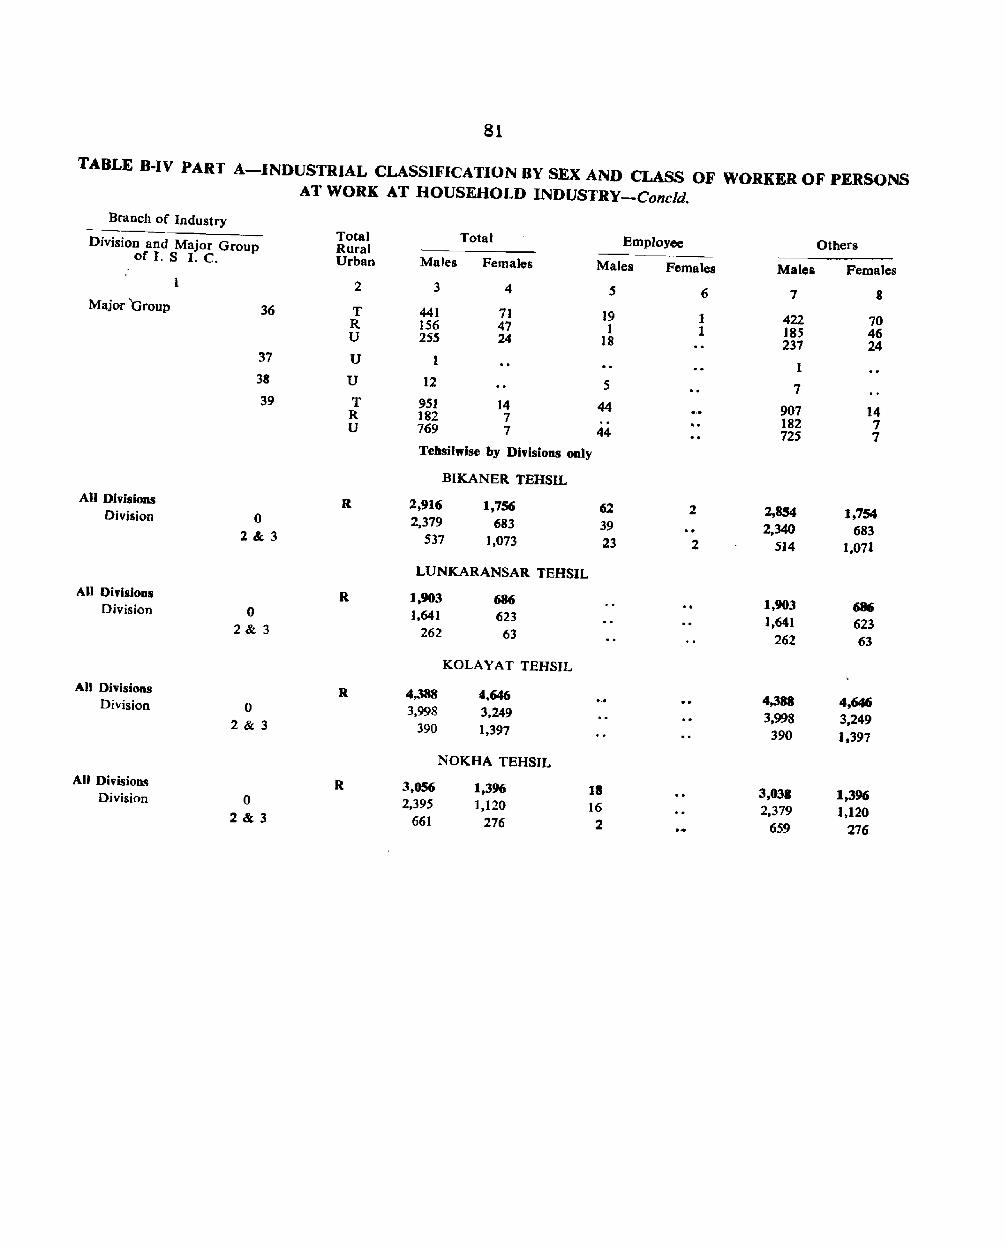
81
TABLE B-IV PART A-INDUSTRIAL CLASSIFICATION BY SEX AND CLASS OF WORKER OF PERSONS AT WORK AT HOUSEHOLD INDUSTRY-Concld.
Branch of Industry Total Total Employee Others Division and Major Group Rural
of I. S 1. C. Urban Males Females Males Females Males Females 1 2 3 4 5 6 7 8
Major Group 36 T 441 71 19 1 422 70 R 156 47 1 1 185 46 U 25S 24 18 237 24 37 U 1 1 38 U 12 5 7 39 T 951 14 44 907 14 R 182 7 182 7 U 769 7 44 725 7
Tebsilwise by Divisions only
BIKANER TEHSIL
All Divisions R 2,916 1,756 62 2 2,854 1,754 Division 0 2,379 683 39 2,340 683 2 & 3 537 1,073 23 2 5J4 1,071
LUNKARANSAR TEHSIL
All Divisions R 1,903 686 1.903 686 Division 0 ].641 623 1.641 623 2 & 3 262 63 262 63
KOLA Y AT TEHSIL
All Divisions R 4,388 4.646 4,388 4,646 Division 0 3,998 3,249 3,998 3.249 2 & 3 390 1,397 390 1.397
NOKHA TEHSIL All Divisions R 3.056 1,396 11 3,03' 1,396 Division 0 2,395 1,120 16 2,379 1,120 2 & 3 661 276 2 ... 659 276
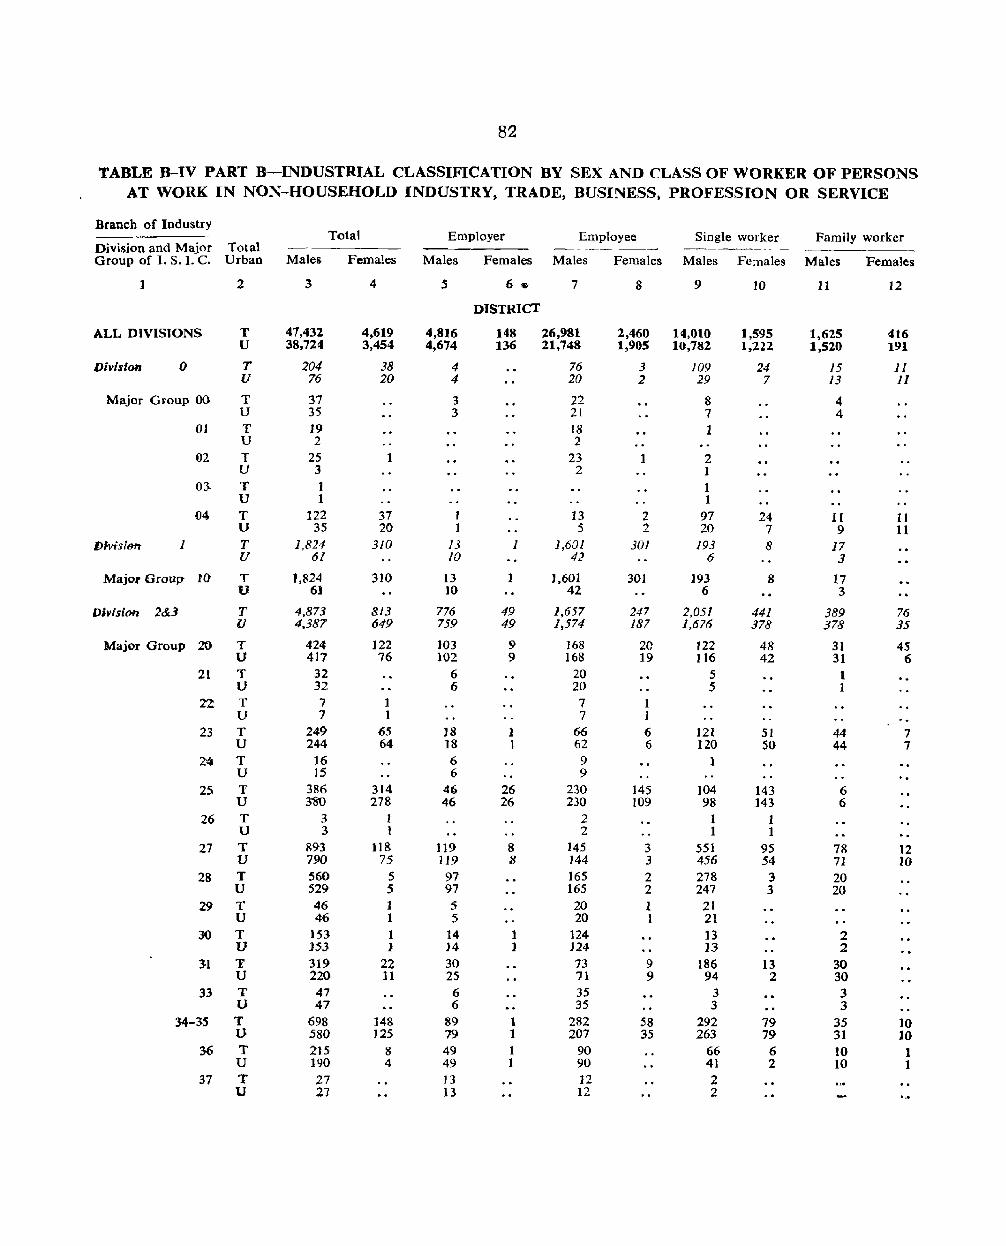
82
TABLE B-IV PART B-INDUSTRIAL CLASSIFICATION BY SEX AND CLASS OF WORKER OF PERSONS AT WORK IN NON-HOUSEHOLD INDUSTRY, TRADE, BUSINESS, PROFESSION OR SERVICE
Branch of Industry Total Employer Employee Single worker Family worker
Division and Major Total ~------ ~-- ---~~---
Group of 1. S. 1. C. Urban Males Females Males Females Males Females Males Fe:nales Males Females
1 2 3 4 5 6 $ 7 8 9 10 11 12
DISTRICT
ALL DIVISIONS T 47,432 4,619 4,816 148 26,981 2,460 14,010 1,595 1,625 416 U 38.724 3,454 4,674 136 21,748 1,905 10,782 1,222 1,520 191
Division 0 T 204 38 4 76 3 109 24 15 JI U 76 20 4 20 2 29 7 13 11
Major Group 00 T 37 3 22 8 4 U 35 3 21 7 4
OJ T 19 18 1 U 2 2
02 T 25 1 23 1 2 U 3 2 I
OJ T 1 1 U 1 1
{)4 T 122 37 , 13 2 97 24 11 1 I U 35 20 1 5 2 20 7 9 11
Dlvisilm 1 T 1,824 310 13 1 1,601 301 193 8 17 U 6! JO 42 6 3
Major Group' to T },824 310 13 1,601 301 193 8 17 U 61 10 42 6 3
Divisi{Ht 1&3 T 4,873 813 776 49 1,657 247 2,051 441 389 76 V 4,387 649 759 49 1,574 187 1,676 378 378 35
Major Group 20 T 424 122 103 9 168 20 122 48 31 45 U 417 76 102 9 168 19 116 42 31 6
21 T 32 6 20 5 1 .. U 32 6 20 5 1
22 T 7 1 7 U 7 1 7
23 T 249 65 ]8 1 66 6 ]21 51 44 7 U 244 64 18 1 62 6 120 50 44 7
24 T 16 6 9 1 U 15 6 9
25- T 386 314 46 26 230 145 104 143 6 U 38'0 278 46 26 230 109 98 143 6
26 T 3 1 2 1 1 U 3 1 2 1 1
27 T R93 118 119 8 145 3 551 95 78 12 U 790 75 119 8 144 3 456 54 71 10
28 T 560 5 97 165 2 278 3 20 U 529 5 97 165 2 247 3 20
29 T 46 1 5 20 1 21 U 46 1 5 20 1 21
30 T 153 I 14 1 124 13 2 U J5J 1 }4 1 124- 13 2
31 T 319 22 30 73 9 186 13 30 U 220 11 25 71 9 94 2 30
33 T 47 6 35 3 3 U 47 6 35 3 3
34-35 T 698 148 89 1 282 58 292 79 35 10 U 580 ]25 79 1 207 35 263 79 31 10
36 T 215 8 49 1 90 66 6 10 1 U 190 4 49 1 90 41 2 10 1
37 T 27 13 12 2 U 27 13 12 2 '.'
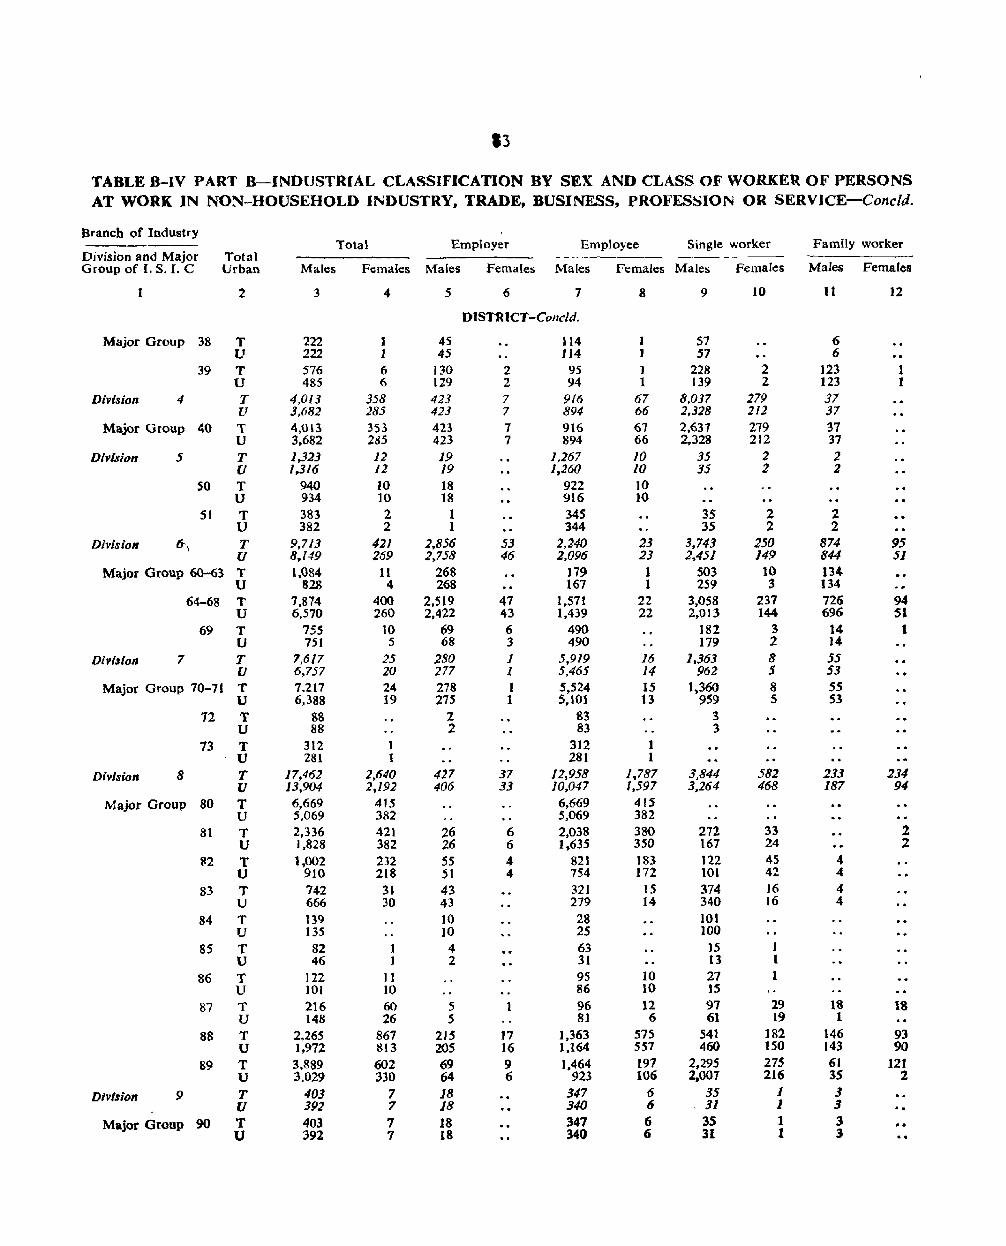
13
TABLE B-IV PART B-INDUSTRIAL CLASSIFICATION BY SEX AND CLASS OF WORKER OF PERSONS AT WORK IN NON-HOUSEHOLD INDUSTRY, TRADE, BUSINESS, PROFESSION OR SERVICE-Concld.
Branch of Industry Total Employer Employee Single worker Family worker
Division and Major Total Group of I. S. I. C Urban Males Females Males Females Males Females Males Females Males Females
I 2 3 4 5 6 7 8 9 10 11 ]2
DISTRICT-Cone/d.
Major Group 38 T 222 1 45 114 1 57 6 U 222 1 45 114 1 57 6
39 T 576 6 130 2 95 1 228 2 )23 1 U 485 6 129 2 94 1 139 2 123 1
Division 4 T 4,013 358 423 7 916 67 8,037 279 37 U 3,682 285 423 7 894 66 2,328 212 37
Major Group 40 T 4.0l3 353 423 7 916 67 2,631 279 37 U 3,682 285 423 7 894 66 2,328 212 37
Division 5 T 1.323 12 19 1,267 10 35 2 2 U 1,316 J2 19 1,260 10 35 2 2
SO T 940 IO 18 922 ]0 U 934 10 18 916 ]0
51 T 383 2 1 345 35 2 2 U 382 2 1 344 35 2 2
Division 6--., T 9,713 421 2.856 53 2,240 23 3,743 250 874 95 U 8,149 269 2.758 46 2,096 23 2.451 149 844 51
Major Group 60-63 T 1.084 11 268 179 1 503 10 134-U 828 4 268 167 1 259 3 134
64-68 T 7,874 400 2,519 47 1,571 22 3,058 237 726 94 U 6,570 260 2,422 43 1,439 22 2.013 144 696 51
69 T 755 10 69 6 490 182 3 14 1 U 751 5 68 3 490 179 2 14
Division 7 T 7,617 25 280 1 5,919 16 1.363 8 55 U 6,757 20 277 1 5,465 14 962 5 53
Major Group 70-7 t T 7.217 24 278 I 5,524 15 1,360 8 55 U 6,388 19 275 1 5,101 13 959 .5 53
12 T 88 2 83 3 U 88 2 83 3
73 T 312 1 3]2 1 U 281 1 281 1
Division 8 T 17,462 2,640 427 37 12,958 1,787 3,844 582 233 234 U 13,904 2,192 406 33 10,047 1,597 3,264 468 187 94
Major Group 80 T 6,669 415 6,669 415 U 5,069 382 5,069 382
81 T 2,336 421 26 6 2,038 380 272 33 2 U 1,828 382 26 6 1,635 350 167 24 2
~2 T 1,002 232 55 4 821 183 122 45 4 U 910 218 51 4 754 172 101 42 4
83 T 742 31 43 32J 15 374 16 4 U 666 30 43 279 14 340 16 4
84 T 139 ]0 28 101 U 135 10 25 100
85 T 82 1 4 63 15 J U 46 ] 2 31 13 I
86 T 122 11 95 10 27 1 U 101 10 86 10 15
87 T 216 60 5 1 96 12 91 29 18 18 U 148 26 5 81 6 61 19 1
88 T 2,265 867 2J5 ]7 1,363 575 541 182 146 93 U 1;972 813 205 16 1,164 557 460 150 143 90
89 T 3,889 602 69 9 1,464 197 2,295 275 61 121 U 3.029 330 64 6 923 106 2,001 216 35 2
Division 9 T 403 7 18 347 6 35 1 3 U 392 7 18 340 6 ' 31 1 3 -.
Major Group 90 T 403 7 18 347 6 3S 1 3 U 392 7 18 340 6 31 1 3
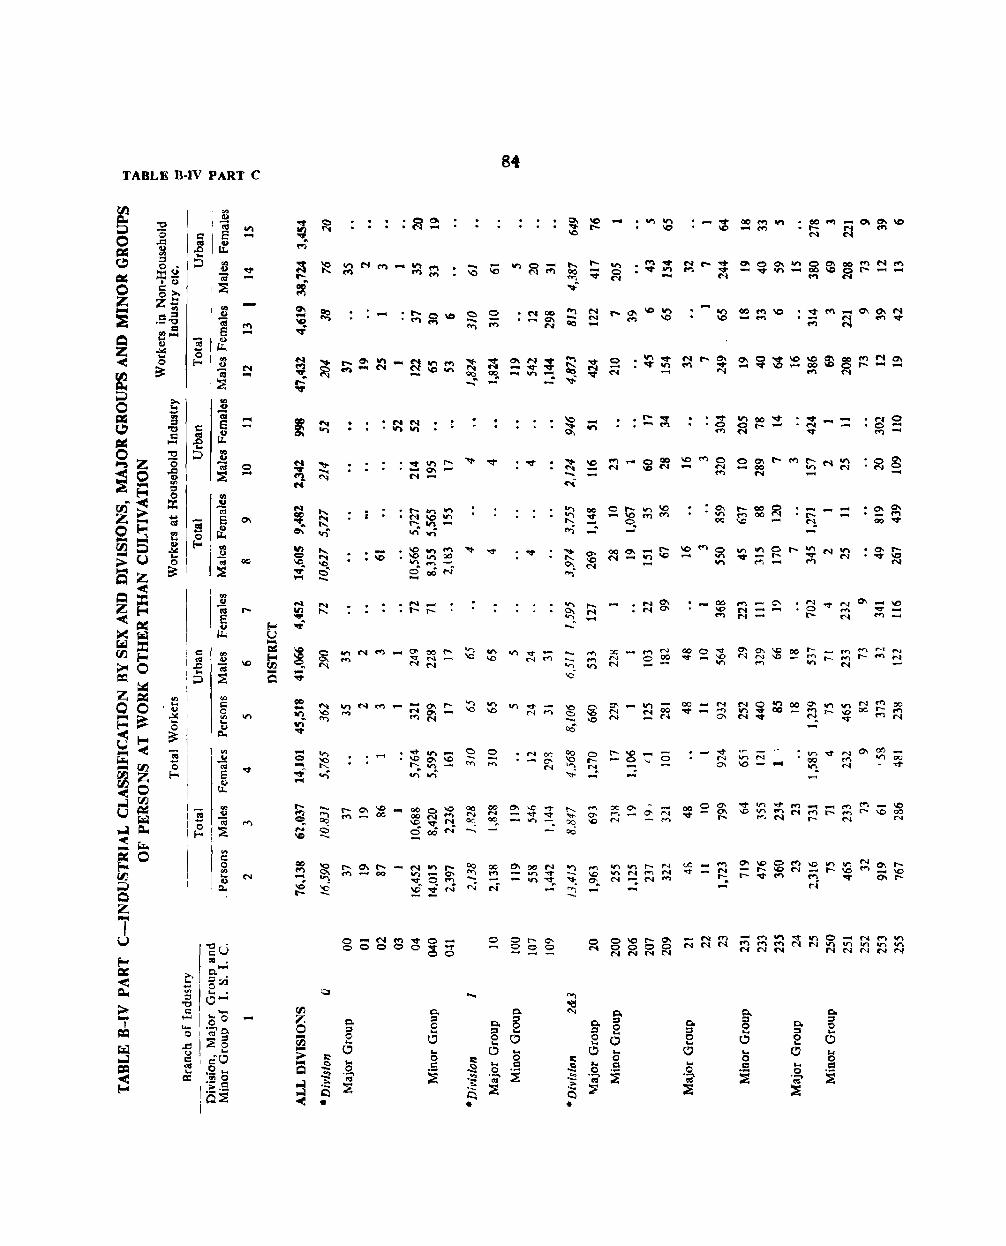
TABLE B-IV PART C
I~ J" ,~
I-I '" 1-!~
N -.... .-.
Q -
-
.... => .... ~ ....
:\0
... o .5 ::s
84
-• '0
~ .. ;!; 0\ ~ .; -...~ V'l-:" -. - ....
o 86 g -
V\ on r-- N (JO "'N~N .qN~Nt'f") -
00 ::I o .. o ... o
c
~
0\;1:: oo~
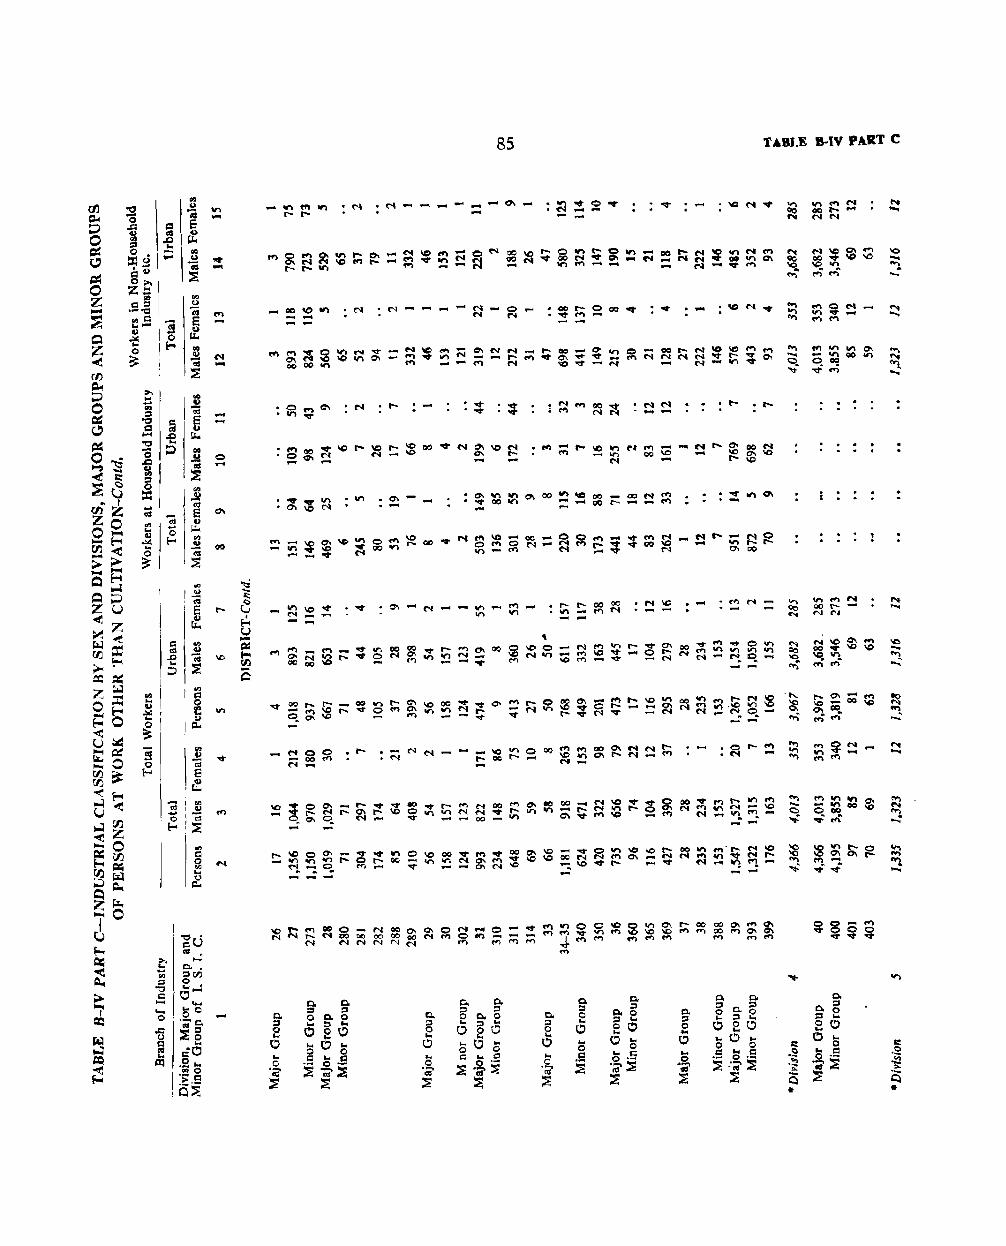
E '" ::I
"0 c ..... .... o
.Q u c
~
VI -.... -
Col --.... o -
-
85 TABLE B-IV PA.RT C
-~O~~~~~_~~~-ON~~~O~~OVl-~~M~VlN~ ~~~\Ctf)to--~""=:!~~ ~",""~~:!~_~:::N~""~:qO\ ~
_GO~V\ -- ---
r--
-
, 0\
, .... -or
·O\ ...... N ..... -
NN
tf);;::l""'~~r,f~::ON
. -'I,
• to-
OIDO_NrrI""r-VO\ 00""""""" OVI :::§1N."_ .... ~ .... _O_~NrrlV\VI,,,1I"I .. _, \0 f"I"') "'1:2"' ('.I M ~ N._ ~ - -
\C~~~~~~~~~~~~;~~~~~~~~§~~~Sq~~ - _-to- ~ ~ ~ ~ ~ ~ :2 ~ ~ ~ ~ i ~ ~ $ ~ ~ ~ ~ i3 ~ ~ ~ ~ ~ &::-~ Ei ~ ~~~ -~
~N~~i~~~~~~S~~- .... ~~~~~~~$~~~~~~ N NNNNN ~ MMM ~MM MMM M M~
.. o ';' :E
.. o .... o:l
::E
....
0-
2 o
0. ;;;)
!:loO ::s .. eo o .. o ... 1':1 o ._
';;' ~ ::E
... o ._ :E
.....
. .
I() ..... "l ....

TABLE II-IV PART C
." Q
tcl~ I r~ I~ -I
N ---
-
86
00 -- . --• Q\ • N . -
00 -- • N N ..........
~- --
~~~~~g~~~~~ .....

Bilea. 6-A
IU IOj
E Q)
~
fI.t C o (/) ... ~
"C • cU lIS • -0.. :ltll o 0"" .... 0 0
._, 0. I:U~ ~O ... cO
.9 ... .. 0 .- c >._ Q~
'" -
f"\ -N
--o -
00
-
87
. -
0.
~e eo o ... o .. c o ._ 'Cii'~ ~
TABLB 8-1V PART C
u -o Z
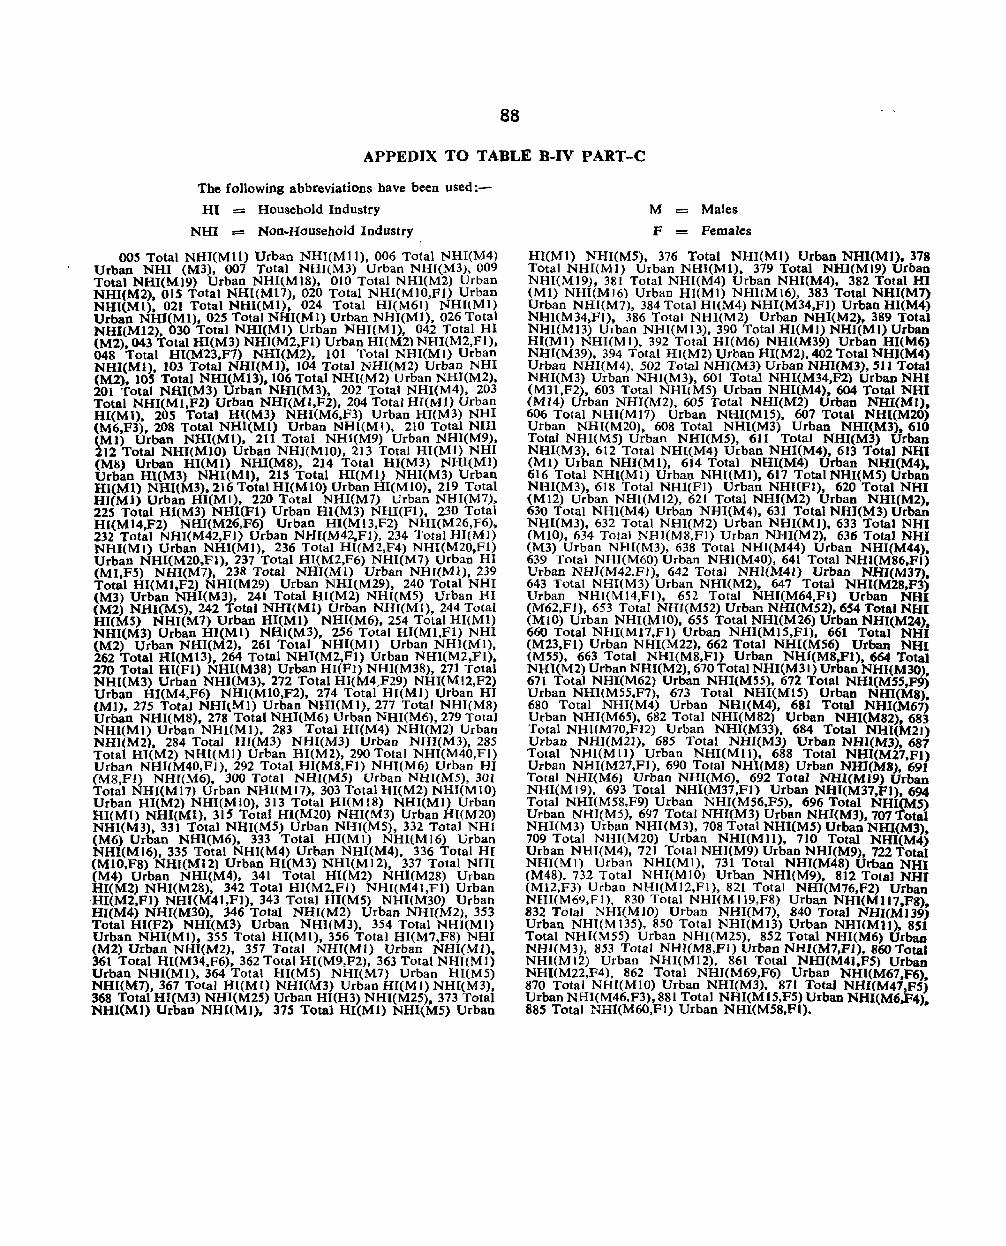
88
APPEDIX TO TABLE B-IV PART-C
The following abbreviations have been used:
HI = Household Industry
NHI ::::0 Non~Household Industry
OOS Total NHI(Ml1) Urban NHI(Mll), 006 Total NHI(M4) Urban NHI (M3), 007 Total NHl(M3) Urban NHI(M3). 009 Total NHI(MI9) Urban NHI(MI8), 010 Total NHI(M2) Urban NHI(M2). OIS Total NHI(M17), 020 Total NHI(MIO,Fl) Urban NHI(MI). 021 Total NHI(Ml). 024 Total HI(M61) NHHMI) Urban NHI(Ml), 025 Total NHI(Ml) Urban NHI(MI). 026 Total NHI(M12). 030 Total NHI(MJ) Urban NHI(MI). 042 Total HI (M2).043 Total HI(M3) NHI(M2,Fl) Urban HI(M2) NHI(M2,FI), 048 Total HI(M23,F1) NHI(M2). 101 Total NHI(MI) Urban NHI(Ml), 103 Total NHI(Ml), 104 Total NHI(M2) Urban NHI (M2). 105 Total NHI(M13). 106 Total NHI(M2) Urban NHI(M2). 201 Total NHI(M3) Urban NHl(M3). 202 Total NHI(M4), 203 Total NHI(Ml,F2) Urban NH1(Ml,F2), 204 Total HI(MO Urban HI(Ml), 20S Total Hl(M3) NHI(M6,F3) Urban HI(M3) NHI (M6.F3). 208 Total NHI(Ml) Urban NHI(MI). 210 Total NHI (MI) Urban NHI(Ml). 211 Total NHI(M9) Urban NHI(M9), 212 Total NHI(MIO) Urban NHI(MlO), 213 Total Hl(l\IIl) NHI (M8) Urban HI(MI) NHI(M8), 214 Total HI(M3) l"lHI(l\IIl) Urban HI(M3) NHI(Ml). 215 Total HI(Ml) NHI(M3) Urban BI(M!) NBI(M3). 216 Total HI(MIO) Urban HI(MIO). 219 Total BI(Ml) Urban BI(MI). 220 Total NHI(M7) Urban NHI(M7), 225 Total HI(M3) NHl(Fl) Urban llI(M3) NHI(Fl). 230 Total HI(M14,F2) NHI(M26,F6) Urban HI(M13,F2) NHI(M26,F6), 232 Total NHI(M42,FJ) Urban NHI(M42,Fl). 234 Total HI{Ml) NHI(Ml) Urban NHI(Ml), 236 Total HI(M2,F4) NHI(M20,FI) Urban NHI(M20.Fl), 237 Total Hl(M2,F6) NHI(M7) Urban HI (MI,F5) NHI(M7), 238 Total NHJ{Ml) Urban NHl(Ml), 239 Total HI(Ml.F2) NHI(M29) Urban NHI(M29), 240 Total NHI (M3) Urban NHI(M3), 241 Total HI(M2) NHI(M5) Urban HI (M2) NHI(M5), 242 Total NHI(Ml) Urban NHI(Ml), 244 Total HI(MS) NHI(M7) Urban HI(Ml) NHI(M6), 254 Total HI(Ml) NHI(M3) Urban HI(MI) NHI(M3). 256 Total HI(MI,FI) NHI (M2) Urban NHI(M2). 261 Total NHI(Ml) Urban NHJ(MI). 262 Total RI(Ml3), 264 Total NHI(M2.FI) Urban NHI(M2.FI). 270 Total HI(Fi) NHI(M38) Urban HI(FI) NHI(M38), 271 Total NHI(M3) Urban NHI(M3). 272 Total HI(M4_F29) NHI(M12,F2) Urban HI(M4,F6) NHI(MIO,F2), 274 Total HI(MI) Urban HI (MI). 275 Total NHI(Ml) Urban NHI(MI), 277 Total NHI(M8) Urban NHI(M8). 278 Total NHI(M6) Urban NHI(M6), 279 Total NHI(Ml) Urban NHI(Ml}. 283 Total HI(M4) NHI(M2) Urban NH1(M2). 284 Tota] HI(M3) NHI(M3) Urban NHI(MJ), 285 Total Hl(M2) NHI(MI) Urban HI(M2), 290 Total NHI(M40,FI) Urban NHI(M40,FJ), 292 Total HI(M8,FI) NHI(M6) Urban HI (M8,FI) NHI(M6). 300 Total NHl(M5) Urban NHI(M5), 301 Total NHI(MI7) Urban NHHMI7). 303 Total HI(M2) NHI(MlO) Urban HI(M2) NHI(MIO), 313 Total Hl(M18) NHI(MI) Urban HI(Ml) NHI(Ml), 315 Total HI(M20) NHI(M3) Urban HI(M20) NHI(M3). 331 Total NHI(M5) Urban NHI(MS). 332 Total NHI (M6) Urban NHI(M6). 333 Total HI(Ml) NHI(MI6) Urban NHI(Mt6), 335 Total NHI(M4) Urban NHI(M4), 336 Total HI (MIO,F8) NHI(MI2) Urban HI{M3) NHl(M12), 337 Total NHI (M4) Urban NHI(M4). 341 Total Hl(M2) NHI(M28) Urban HI(M2) NHI(M28). 342 Total HI(M2,FI) NHI(M41,FI) Urban -HI(M2.Fl) NHI(M41,FI), 343 Total HI(M5) NHI(M30) Urban HI(M4) NHI(M30). 346 Total NHI(M2) Urban NHI(M2}, 353 Total HI(Fl) NHI(M3) Urban NHI(M3). 354 Total NHl(Ml) Urban NHI(Ml), 355 Total RI(Ml). 356 Total HI(M7,F8) NHI (M2) Urban NHI(M2), 357 Total NHl(Ml) Urban NHI(Ml). 361 Total Hl(M34.F6), 362 Total Hl(M9,F2), 363 Total NHl{MI) Urban NHI(Ml), 364 Total 1I1(M5) NHI(M7) Urban HI(M5) NHI(M7). 367 Total HI(Mf) NHI(M3) Urban HI(MI) NHI(M3). 368 Total HI(M3) NHI(M25) Urban HI(H3) NHI(M2S). 373 Total NHI(Ml) Urban NHl(MI). 375 Total Hl(MI) NHI(MS) Urban
M _ Males
F - Females
Hl(Ml) NHI(MS), 376 Total NHI(Ml) Urban NHl(Ml). 378 Total NHI(Ml) Urban NHI(Ml). 379 Total NHI(M19) Urban NHI(M19), 381 Total NHI(M4) Urban NHI(M4), 382 Total HI (MI) NHI(MI6) Urban Hl(Ml) NH}(MI6), 383 Total NHI(M7) Urban NHI(M7), 384 Total HI(M4) NHI(M34,Fl) Urban HI(M4) NHl(M34.Fl), 386 Total NHI(M2) Urban NHI(M2), 389 Total NHI(M13) Urban NHI(MI3). 390 Total HI(MI) NHI(MI) Urban HI(MI) NHI(Ml), 392 Total HI(M6) NHI(M39) Urban HI(M6) NHI(M39). 394 Total HI(M2) Urban HI(M2). 402 Total NHI(M4) Urban NHI(M4), 502 Total NHJ(M3) Ueban NHI(M3), .511 Total NHI(M3) Urban NHI(M3), 601 Total NHI(M34,F2) Urban NHI (M3I,F2), 603 Total NHI( MS) Urban NHI(M4), 604 Total NHI (MI4) Urban NHI(M2), 605 Total NHI(M2) Urban Nm(Ml), 606 Total NHI(MI7) Urban NHI(M15), 607 Total NHI(M20) Urban NHI(M20). 608 Total NHI(M3) Urban NHI(M3).610 Total NHI(M5) Urban NHI(M5), 611 Total NHI{M3) Urban NHI(M3), 612 Total NHI(M4) Urban NHI(M4), 613 Total NHI (MI) Urban NHI(Ml), 614 Total NHI(M4) Urban NHI(M4). 616 Total NHI(Ml) Urban NHI(Ml), 617 Total NHI(MS) Urban NHI(M3). 618 Total NHI(Fl) Urban NHI(FJ), 620 Total NHI (MI2) Urban NHI(MI2), 621 Total NHI(M2) Urban NHI(M2). 630 Total NHI(M4) Urban NHI(M4), 631 Total NHI(M3) Urban NHI(M3). 632 Total NHI(M2) Urban NHI(Ml), 633 Total NHI (MIO), 634 Tota] NHI(M8.FI) Urban NHI(M2), 636 Total NHI (M3) Urban NHI(M3), 638 Total NHI(M44) Urban NHI(M44). 639 Total NH1(M60) Urban NHI(M40), 641 Total NHI(M86.Fl) Urban NHI(M42,FI), 642 Total NHl{M41} Urban NHI(M37), 643 Total NHI(M3) Urban NHI(M2), 647 Total NHI(M28.F3) Urban NHI(M14,Fl), 652 Total NHI(M64,FJ) Urban NHI (M62,Fl), 653 Total NHI(MS2) Urban NHI(M52).654 Total NHI (M10) Urban NHI(MIO), 655 Total NHI(M26) Urban NHI(M24). 660 Total NHl(M17,Fl) Urban NHI(M15,Fl), 661 Total NHI (M23,Fl) Urban NHI(M22). 662 Total NHI(MS6) Urban NHI (M5S). 663 Total NHI(M8,Fl) Urban NHI(M8.Fl), 664 Total NHI(M2) Urban NHI(M2), 670 Total NHI(M3I) Urban NHI(M30). 671 Total NHI(M62) Urban NHI(M55), 672 Total NHI(M55.F9) Urban NHI{M55.F7), 673 Total NHI(MlS) Urban NHI(M8). 680 Total NHI(M4) Urban NHI(M4), 681 Total NHI(M67) Urban NHI(M65). 682 Total NHI(M82) Urban NHI(M82), 683 Total NHHM70.FI2) Urban NHI(M33), 684 Total NHI(M21) Urban NHI(M2I), 685 Total NHI(M3) Urban NHI(M3). 687 Total NHI(Mll) Urban NHI(Mll). 688 Total NHI(M27,FJ) Urban NHI(M27,Fl), 690 Total NHI(M8) Urban NHI(M8), 691 Total NHI(M6) Urban NHI(M6). 692 Total NHI(MI9) Urban NHI(MI9), 693 Total NHI(M37,FI) Urban NHI(M37.FJ). 694 Total NHI(M58,F9) Urban NHI(M56,F5). 696 Total NHI(MS) Urban NHI(M5), 697 Totai NHI(M3) Urban NHI(M3). 707 Total NHI(M3) Urban NHl(M3), 708 Total NHI(M5) Urban NHI(M3). 709 Total NHI(M20) Urban NHI(Mll). 710 Total NHI(M4) Urban NHI{M4), 721 Total NHI(M9) Urban NHI(M9), 722 Total NHI(Ml) Urban NHI(MI), 731 Total NHI(M48) Urban NHI (M48). 732 Total NHI(MIO} Urban NHI(M9). 812 Total NHI (M12,F3) Urban NHJ(MJ2.FI), 821 Total NHI(M76,F2) Urban NHl(M69,FI). 830 Total NHI(MIl9,F8) Urban NHI(M117,F8), B32 Total NHI(MIO) Urban NHI(M7), 840 Total NHI(MI39) Urban NHl(M 135), 850 Total NHI(MI3) Urban NHHMlJ), 851 Total NHHMS5) Urban NHI(M25), 852 Total NHI(M6) Urban NHI{M3), 853 Total NHI(M8,FI) Urban NHI(M7.FJ). 860 Total NHI(Ml:!) Urban NHI(M12). 861 Total NHI(M41,FS) Urban NHI(M22,F4), 862 Total NHI(M69,F6) Urban NHI(M67,F6). 870 Total NHI(MIO) Urban NHI(M3), 871 Total NHI(M47.F5) Urban NHI(M46.F3), 88t Total NHI(MI5,F5) Urban NHI(M6,F4), 885 Total NHI(M60,Fl) Urban NHI(M58,FI).

89
SUPPLEMENTARY TABLE TO TABLE B-IV PART-C
TehsUwise Industrial cltisificatioo by sex and divisions of persons at work other th .. cultivation in rural areas ooly
Workers at Worker. in Non-Branch of Industry Total Workers Household Industry Household Industry etc.
Division of I.S.I.e. Persons Males Females Males Females Males Females
I 2 3 4 5 6 7 8
BIKANER TEHSIL
All Di,isions Total 10,132 7,60S 2.527 2.916 1,756 4,689 771 D~vision 0 3,145 2,449 696 2,379 683 70 13
1 2.067 1,757 310 1.751 310 2&3 1,964 800 1,164 537 1,073 263 91
4 212 185 27 18S 21 6 734 609 95 609 95 7 417 415 2 415 2 8 1,623 1,390 233 1,390 233
LUNKARANSAR TEHSIL
All Divisions Total 4,326 3.547 779 1,903 686 I.S44 93
Division 0 2,281 1.655 626 1,641 623 14 3 1 2 2 2
2&3 513 435 78 262 63 173 15 4 45 40 5 40 5 6 466 458 8 458 8 7 280 280 280 8 735 673 62 673 62 9 4 " 4
KOLA Y AT TEHSIL
All Divisions Total 10.442 5.639 4.803 4.388 4.646 1,251 157 Division 0 7,251 4,002 3,249 3,998 3,249 4
2&3 1.837 399 1,438 390 1.397 9 41 4 90 60 30 60 30 5 6 6 6 6 226 218 8 218 8
7 74 71 3 71 3
8 958 883 75 883 7S
NOKHA TEHSIL
All Db-bloDs Total 5,720 4,180 1,540 3,056 1.396 1,124 144
DivisioD 0 3.S57 2,435 1,122 2.395 1,120 40 2
1 4 4 4
2&:3 995 102 293 661 276 41 17
4 52 46 6 46 6
S 1 1 I
6 320 219 41 279 41
7 94 94 92
8 690 612 78 612 78
9 7 7 7
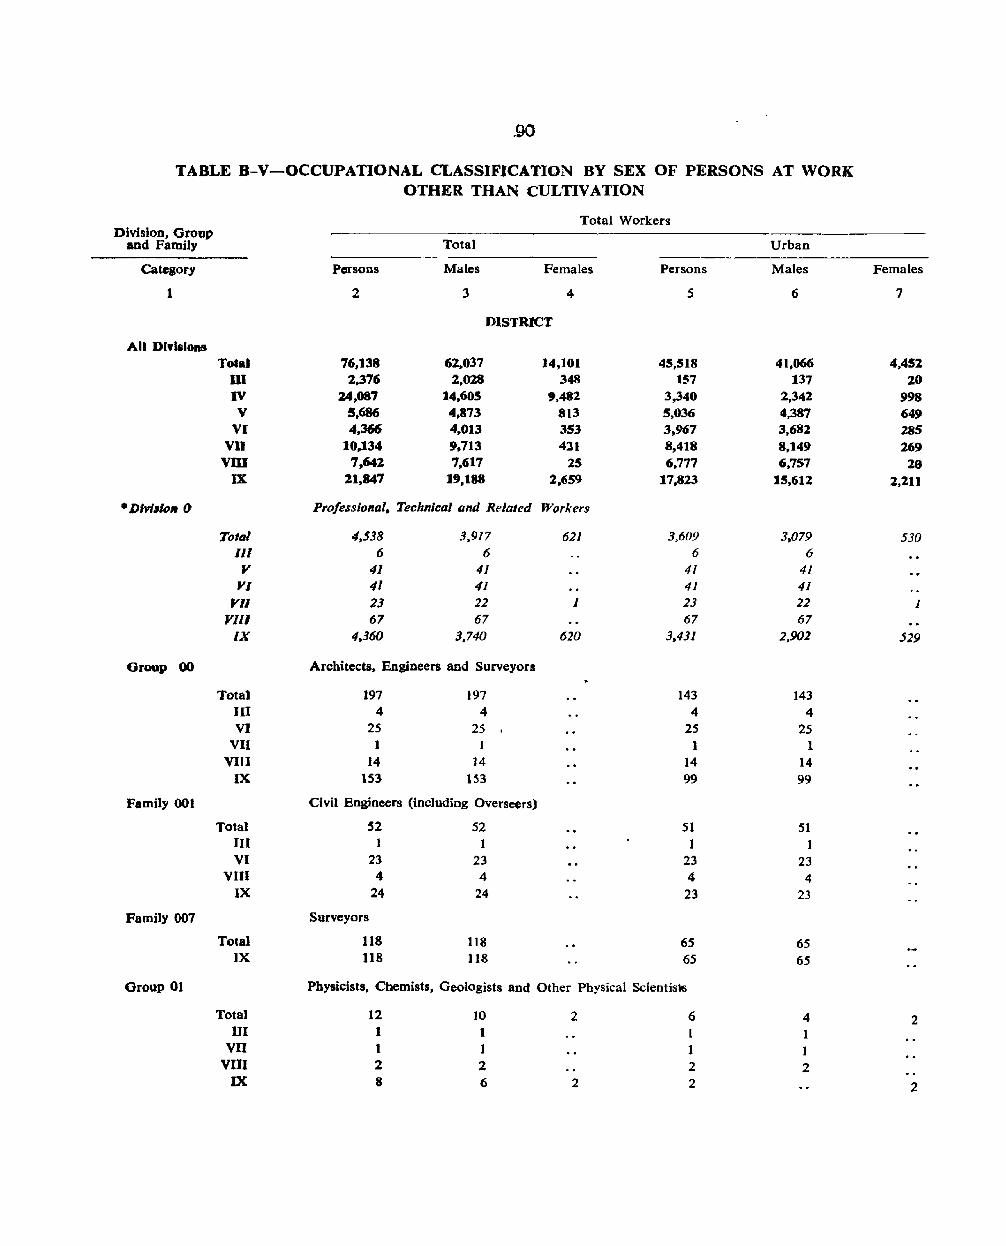
.90
TABLE B-V-OCCUPATIONAL CLASSIFICATION BY SEX OF PERSONS AT WORK OTHER THAN CULTIVATION
Total Workers Division, Group
and Family Total Urban
Category Persons Males Females Persons Males Females
I 2 3 4 5 6 7
DISTRICT
All 01,,1.10115 Tot.1 76,138 62.037 14,101 45,518 41,066 4,452
UI 2.376 2,028 348 1~7 137 20 IV 24,087 14,605 ',482 3,340 2,342 998
V 5.686 4,873 813 5,036 4,387 649 VI 4,366 4,013 353 3,967 3,68:1 285
VO 10.134 9.713 421 8,418 8,149 269 vm 7,642 7,617 2S 6,777 6,757 29
]X 21,847 19.188 2.659 17,823 15,612 2,211
• Divllio. () Professional. Technical and Related Workers
Total 4.538 3.917 621 3,609 3.079 530 III 6 6 6 6
Y 41 41 41 41 YI 41 41 41 41
VII 23 22 J 23 22 1 J'1l1 67 67 67 67
IX 4,360 3,740 620 3.431 2.902 529
Group 00 Architects. Engineers and Surveyors
Total 197 197 143 143 III 4 4 4 4 VI 25 25 , 2S 25
VII 1 I 1 1 VIn 14 14 14 14
IX 153 153 99 99
Family 001 Civil Engineers (including Overseers)
Total 52 52 51 51 III 1 I J 1 VI 23 23 23 23
VIII 4 4 4 4 IX 24 24 23 23
Family 007 Surveyors
Total 118 118 65 65 IX 118 118 65 65
Group 01 Physicists, Chemists. Geologists and Other Physical Scientis-.
Tota) 12 10 2 6 4 2 m 1 I I 1
VII I I 1 1 VIII 2 2 2 2 IX 8 6 2 2 2
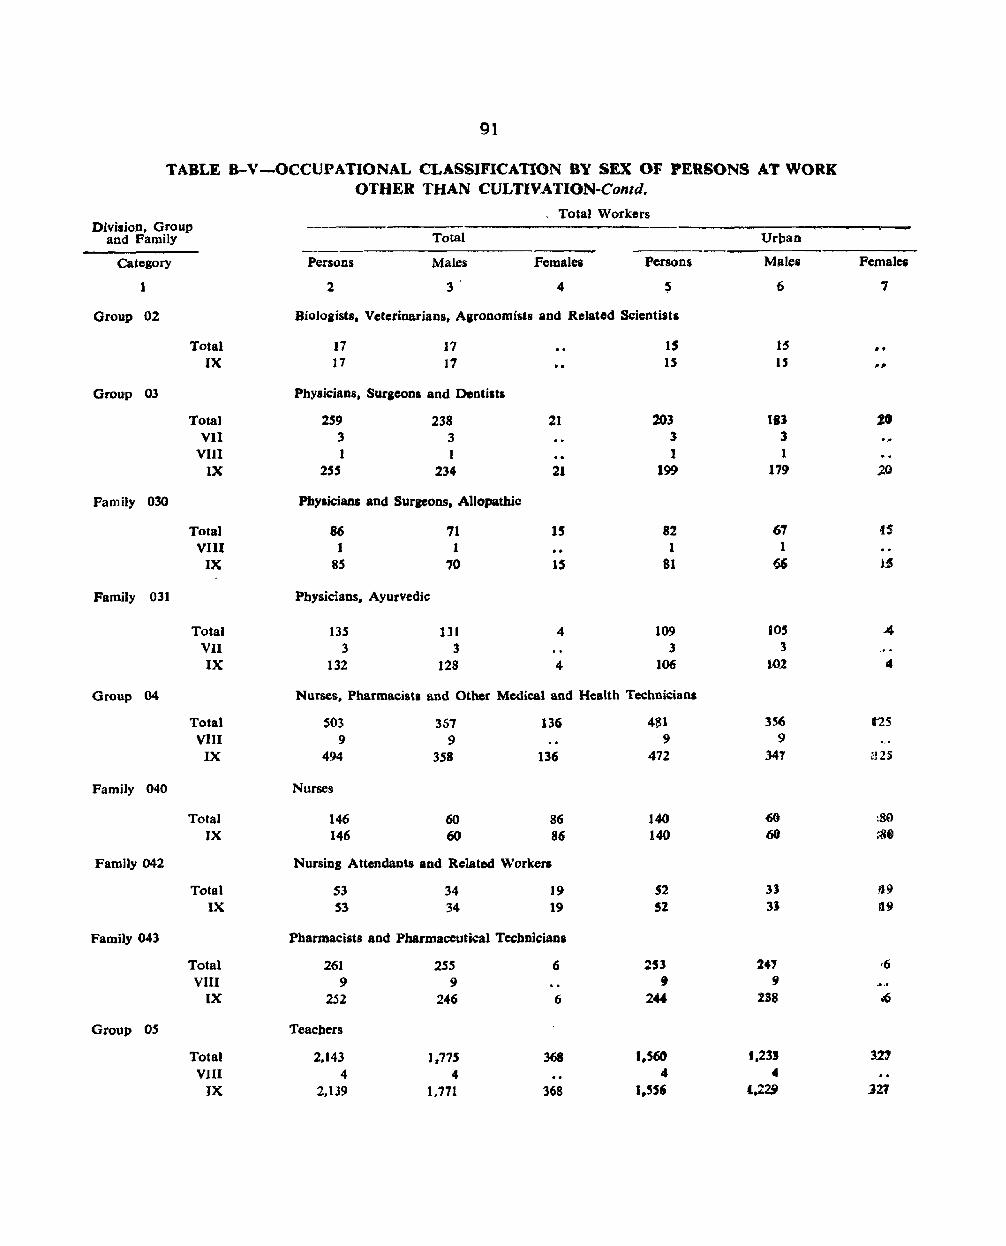
91
TABLE B-V-OCCUPATIONAL CLASSIFICATION BY SEX OF PERSONS AT WORK OTHER THAN CULTIVATION-Contd.
, Total Workers Division. Group
Total and Family Urban
Category Persons Males Females Persons Millea Females
1 2 3' 4 ~ 6 7
Group 02 Biologists. Veterinarians, A,ronomists and Related Scientists
Total 17 17 15 15 •• IX 17 17 .. IS U ."
Group 03 Physicians, Suraoons and Dcntists
Tota) 2S9 238 21 203 til %. VII 3 3 3 3 ...
VIII I 1 1 1
IX 2SS 234 21 199 17~ .20
Family 030 Physicians and Surgeons. Allopathic
Total 86 71 15 82 61 (S
VIII I 1 1 1
IX Ss 70 is 81 66 J$
Family 031 Physicians. Ayurvedic
Total 135 1 J 1 4 109 lOS .4 VII 3 3 3 3 IX 132 128 4 106 10.2 4
Group 04 Nurses, Pharmacists and Other Medical and Health Technicians
Total 503 351 136 481 356 t2S VIII 9 9 9 9
IX 494 358 136 472 341 filS
Family 040 Nurses
Total 146 60 86 140 60 :80
IX 146 60 86 140 6Q ;.8. Family 042 Nursing Attendants and Related Workers
Total 53 34 19 52 3J 119 IX 53 34 19 52 3l 119
Family 043 Pharmacists and Pharmaceutical Tecbnicians
Total 261 255 6 2'3 24' ,6
VIII 9 9 , 9 IX 2.52 246 6 24" lBS .'6
Group OS Teaehers
Total 2,143 1,715 368 I.S6O 1,231 321 VIII 4 4 4 •
IX 2,139 1,771 368 1.5" 1.229 127
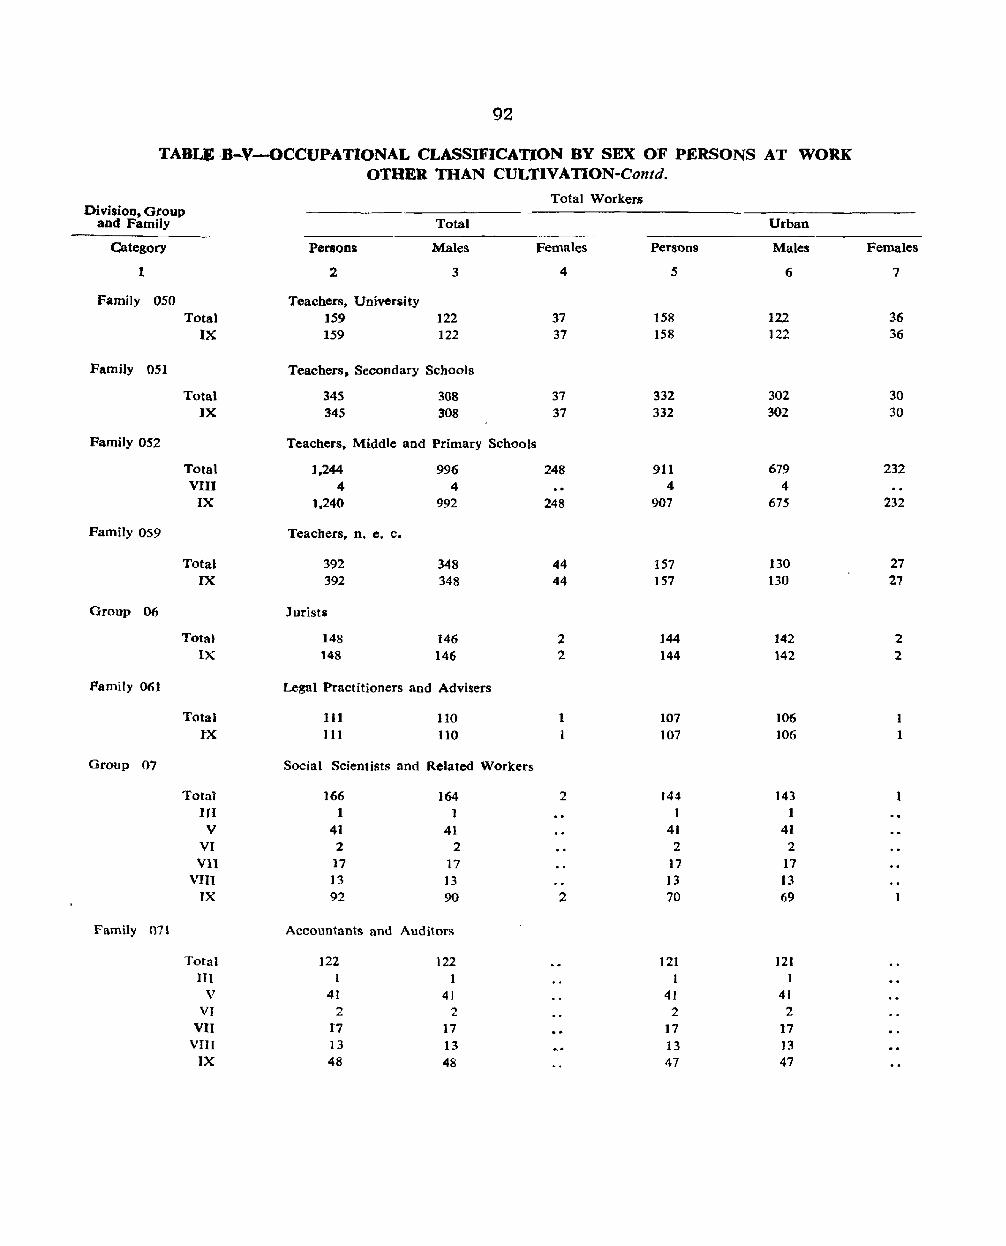
92
TABL8 ·B-V-OCCUPATIONAL CLASSIFICATION BY SEX OF PERSONS AT WORK OTHER THAN CULTIVATION-Contd.
Total Workers Division, Group
and Family Total Urban
Category Persons Males Females Persons Males Females
1 2 3 4 5 6 7
Family 050 Teachers, University Total 159 122 37 158 122 36
IX 159 122 37 158 122 36
Family 051 Teachers. Secondary Schools
Total 345 308 37 332 302 30 IX 345 308 37 332 302 30
Family 052 Teachers. Middle and Primary Schools
Total 1,244 996 248 911 679 232 VIII 4 4 4 4
IX 1.240 992 248 907 675 232
Family 059 Teachers, n. e. c.
Total 392 348 44 157 130 27 IX 392 348 44 IS7 130 27
Group 06 Jurists
Total 148 146 2 144 142 2 IX 148 146 2 144 142 2
Family 06] Legal Practitioners and Advisers
Total 111 llO 1 107 106 I IX III 110 107 106 1
Group 07 Social Scientists and Related Workers
Total 166 164 2 144 143 1 III 1 1 1 I
V 41 41 41 41 VI 2 2 2 2 Vll 17 17 17 17
VIII 13 J3 13 13 IX 92 90 2 70 69 1
Family 071 Accountants and Auditors
Total 122 122 121 121 III I
V 41 41 41 41 VI 2 2 2 2
VII 17 17 .. 17 17 VIII 13 13 13 13
IX 48 48 47 47
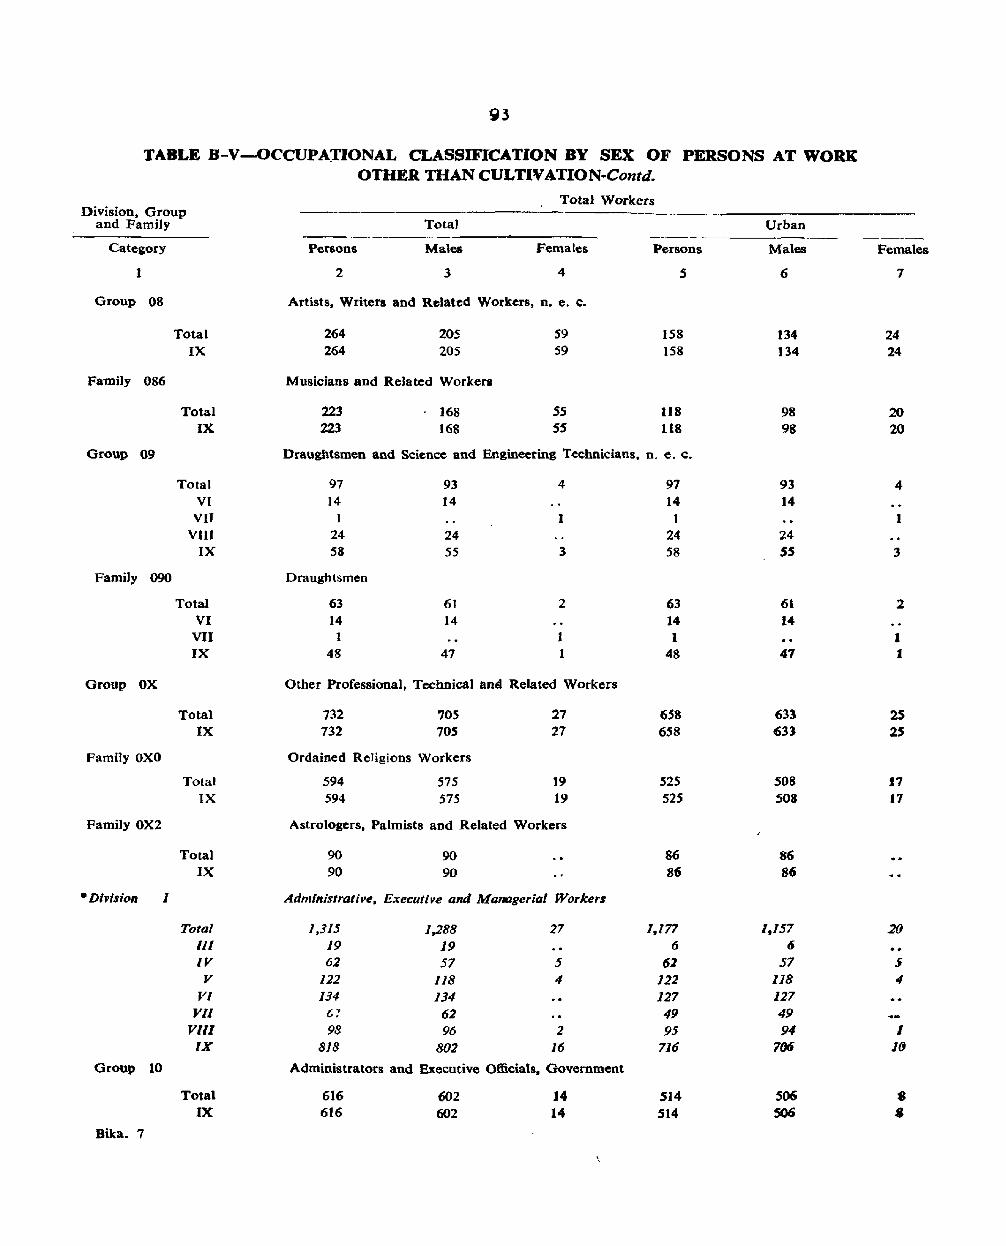
93
TABLE B-V-OCCUPA:rIONAL CLASSIFICATION BY SEX OF PERSONS AT WORK OTHER THAN CULTW ATION-Contd.
Total Workers Division. Group
and Family Total Urban ------
Category Persons Males Females Persons Males Females
1 2 3 4 5 6 7
Group 08 Artists. Writers and Related Workers, n. e. c.
Total 264 205 59 158 134 24 IX 264 205 S9 158 134 24
Family 086 Musicians and Related Workers
Total 223 168 55 118 98 20 IX 223 168 SS 118 98 20
Group 09 Draughtsmen aod Science and Engineering Technicians. n. e. c.
Total 97 93 4 97 93 4 VI ]4 ]4 14 14
VII J 1 1 I VIII 24 24 24 24
IX 58 55 3 58 5S 3
Family 090 Draughtsmen
Total 63 61 2 63 61 2 VI 14 14 14 14 VII 1 1 1 J IX 48 47 1 48 47 I
Group OX Other Professional, Technical aoei Related Workers
Total 732 705 27 658 633 2S IX 732 705 27 658 633 25
Family OXO Ordained Religions Workers
Total 594 575 19 525 50S 11 IX 594 575 19 525 503 17
Family OX2 Astrologers, Palmists and Related Workers
Total 90 90 86 86 IX 90 90 86 86
• Division 1 Administrative. Executive and Managerial Workers
Total 1.315 1.288 27 1,177 1,157 20 III 19 19 6 6 .. IV 62 57 5 62 57 .i V 122 118 4 122 118 4
VI 134 134 127 127 Vll 6'! 62 49 49
Vll1 98 96 2 95 94 I IX 8/8 802 16 716 7(J6 J(j
Group 10 Administrators and Executive Officials. Government
Total 616 602 14 514 S06 :8 IX 616 602 14 514 S06 •
Bika. 7
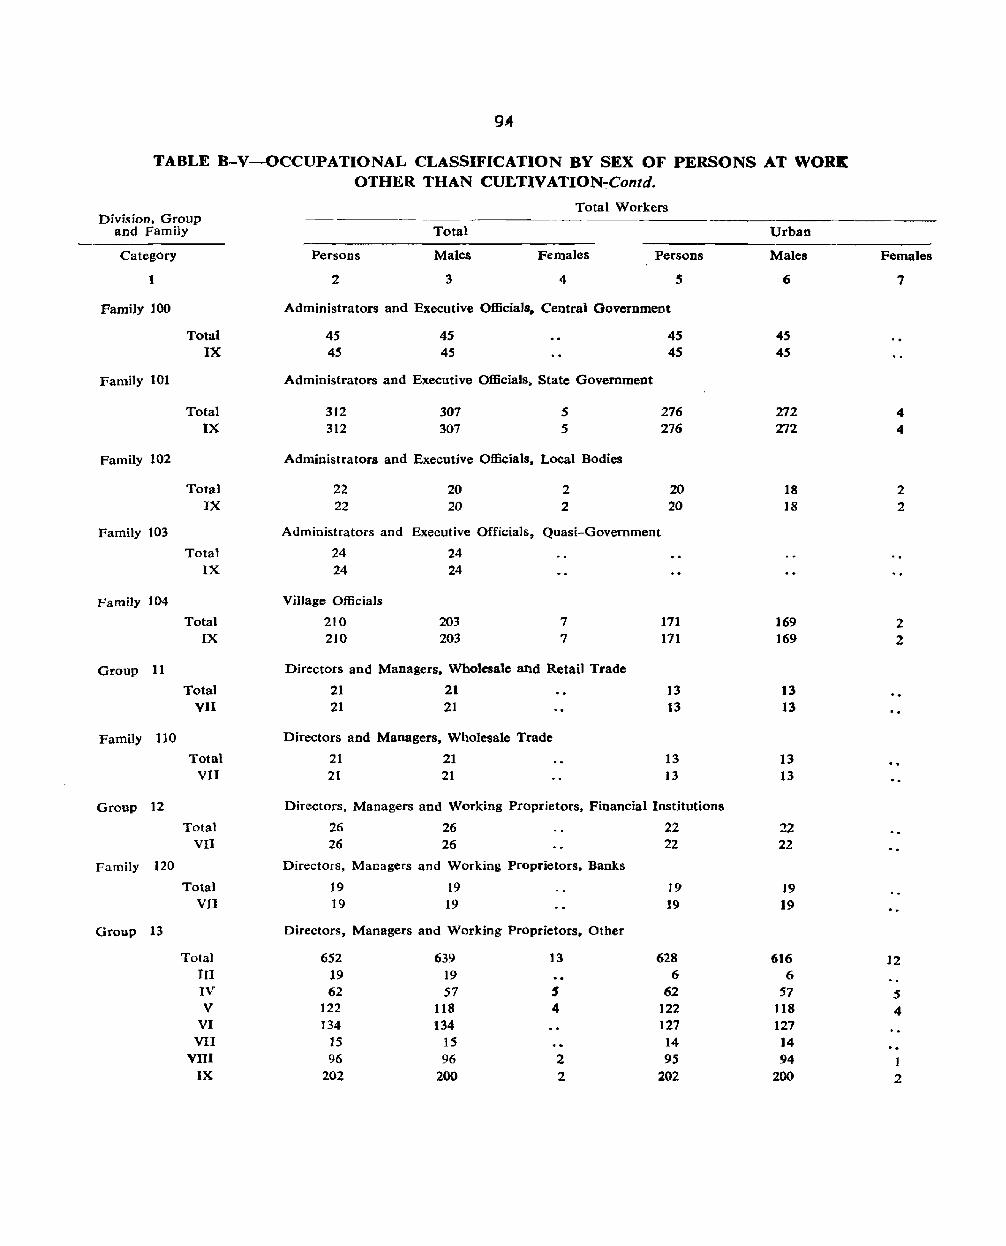
9.41
TABLE B-V-OCCUPATIONAL CLASSIFICATION BY SEX OF PERSONS AT WORK OTHER THAN CULTIV ATION-:Contd.
Total Workers Division, Group
and Family Total Urban
Category Persons Males Females Persons Males Females
t 2 3 4 5 6 7
Fami1y 100 Administrators and Executive Officials" Central Government
Total 45 45 4S 4S IX 4S 45 45 45
Family 101 Administrators and Executive Officials. State Government
Total 312 307 5 276 272 4 IX 312 307 5 276 272 4
Family 102 Administrators and Executive Officials, Local Bodies
Total 22 20 2 20 18 2 IX 22 20 2 20 18 2
Family 103 Administrators and Executive Officials, Quasi-Government
Total 24 24 · . IX 24 24
Family 104 VilJage Officials
Total 210 203 7 171 169 2 IX 210 203 7 171 169 2
Group 11 Directors and Managers, Wholesale and Retail Trade
Total 21 21 13 13 VII 21 21 13 13 · .
Family 110 Directors and Managers, Wholesale Trade
Total 21 21 13 13 · . VII 21 21 13 13
Group 12 Directors. Managers and Working Proprietors, Financial Institutions
Total 26 26 22 ::!2 VII 26 26 22 22
Family 120 Directors, Managers and Workine Proprietors, Banks
Total 19 19 J9 J9 VII 19 19 19 19
Group 13 Directors, Managers and Working Proprietors. Other
Total 652 639 13 628 616 12 III 19 19 6 6 IV 62 57 5 62 57 5 V 122 118 4 122 118 4
VI 134 134 127 127 VII 15 15 14 14
VIII 96 96 2 95 94 1 IX 202 200 2 202 200 2

95
TABLE B-V-OCCtJPATlONAL CLASSIFICATION BY SEX OF PERSONS AT WORK OTHER THAN CULTIVATION-Contd.
Division. Group and Family
category
1
Family 131
Family ]33
Family ]34
Total VI
Total IV V
Total VIII
Persons
2
Total
Males
3
Total Workers
Females Persons
4 5
Directors. Managers and Working Proprietors. Construction
129 129
129
129
122 122
Directors. Managers and Working Proprietors, Manufacturing 18) 174 9 183 62 57 5 62
121 117 4 121
Urban
Males
6
122 122
J74 57
117
DirectorS, Managers and Working Proprietors. Transport and Communication
92 92
90 90
2 2
89 89
88 88
Females
7
9 S 4
1 I
Family 135 Djrectors. Managers and Working Proprietors, Recreation Entertainment and Catering Services
Family 136
Family 139
• Division 2
Group 20
Bib. 7-A
Total VIII IX
Total VII IX
Total III
V VI
VII IX
Total III IV V
VI VII
PIll IX
Total III IV V
VI VII
VIII IX
188 6
182
186 6
180
2
2
188 6
182
Directors, Managers and Working Proprietors. Other Services
22 12 10
22 12 10
Directors, Managers and Working Proprietors. n. e. c.
31 13
5 3 9
31 13
1
5 3 9
ClericaJ and Related Work us
6.302 102 15
172 /49 888
1,257 3,719
6,159 102 /5
171 148 887
1.257 3,579
Book-keepers and Cashiers
1.263 ].265 10 10
6 6 90
14 .599
66 483
89 14
599 66
481
143
I J J
140
3
2
22 12 10
19 2 1 5 2 9
5.489 20 13
171 147 808
1.202 3,OOB
l.l61 3 6 90 14
552 60
436
186 6
180
22 12 10
19 2 1 5 2 9
5.366 20 13
170 146 807
1.202 3.008
1.158 3 6
89 14
552 60
434
2
2
123
1 }
1
120
3
2
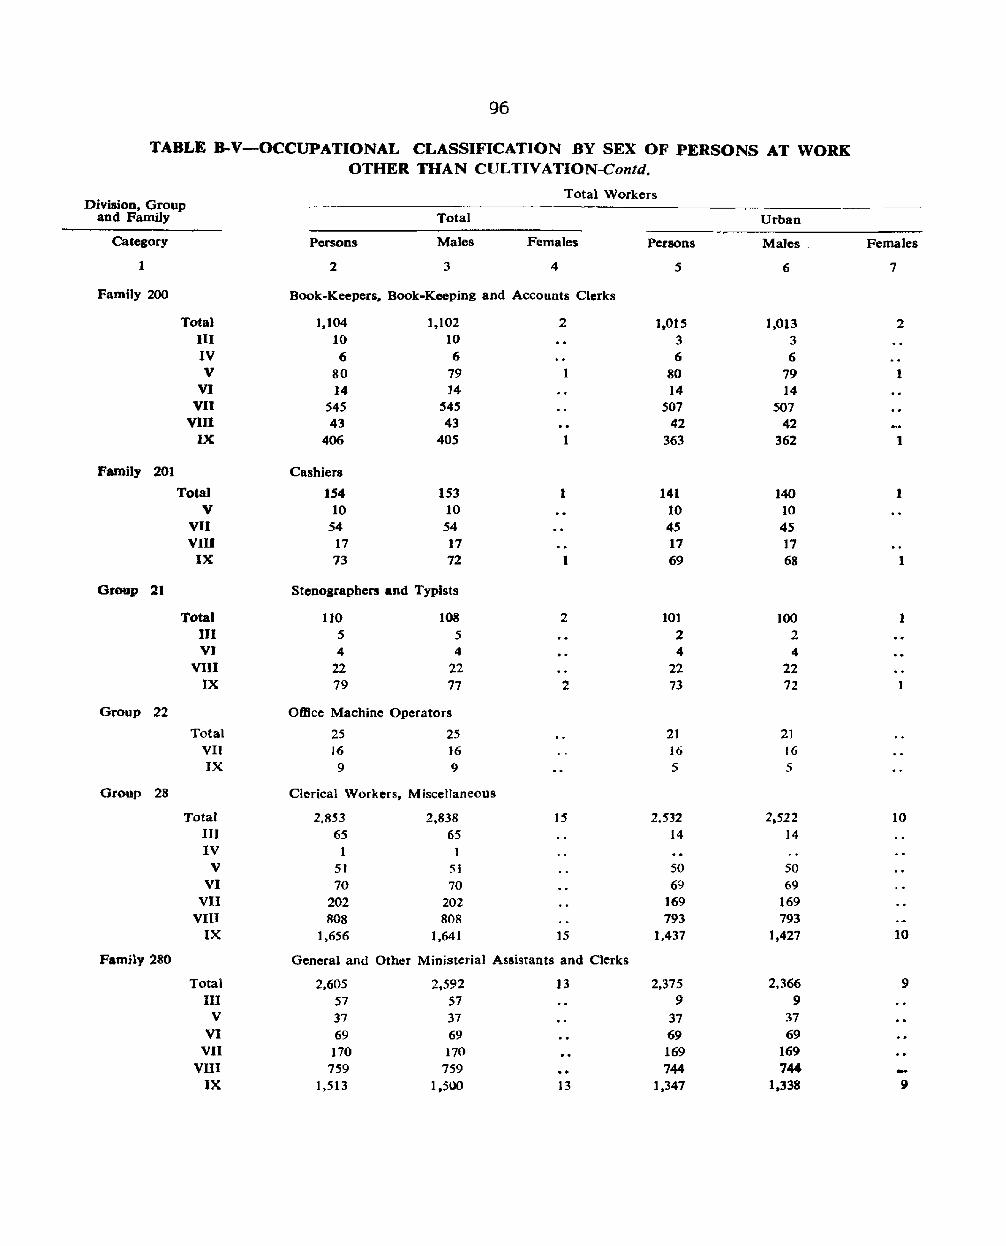
96
TABLE B-V-OCCUPATIONAL CLASSIFICATION BY SEX OF PERSONS AT WORK OTHER THAN CUL TIVATION-Contd.
Division. Group and Family Total
Total Workers
Urban
Category Persons Males Females Persons Males, Females
1 2 3 4 5 6 7
Family 200 Book-Keepers, Book-Keeping and Accounts Clerks
Total 1.104 1,102 2 1.Ot5 1.013 2 III 10 10 3 3 IV 6 6 6 6 V 80 79 1 80 79 1
VI 14 ]4 14 14 VII 545 545 507 S07
VIII 43 43 42 42 IX 406 405 1 363 362 1
Family 201 Cashiers
Total IS4 IS3 1 141 140 1 V 10 10 10 10
VII 54 54 4S 45 VIII 17 17 17 17
IX 73 72 1 69 68 1
Group 21 Stenographers and Typists
Total 110 lOS 2 101 100 1 III 5 5 2 2 VI 4 4 4 4
VIII 22 22 22 22 IX 79 77 2 73 72 1
Group 22 Office Machine Operators
Total 25 25 21 21 VII 16 16 16 16
IX 9 9 5 5
Group 28 Clerical Workers, Miscellaneous
Total 2,853 2,838 ]5 2,532 2.522 10 III 65 65 14 14 IV 1
V 5f 51 50 50 VI 70 70 69 69
VII 202 202 169 169 VIII 80S 808 793 793
IX 1,656 1,641 15 1,437 1,427 10
Family 280 General and Other Ministerial Assistants and Clerks
Total 2,605 2,592 13 2,375 2,366 9 III 57 57 9 9
V 37 37 37 37 VI 69 69 69 69
VII 170 170 169 169 VIII 759 759 744 744
IX 1,513 1,500 13 1.347 1.338 9

97
TABLE B-V-OCCUPATIONAL CLASSIFICATION BY SEX OF PERSONS AT WORK OTHER THAN CULTIVATION-Contd.
Total Workers Division, Group
and Family Total Urban
Category Persons Males Females Persons Males Females
1 2 3 4 5 6 7
Family 289 Miscellaneous Office Workers including Record i<cepers. Muharrers. Despatchers. Packers and Binders of Office Papers
Total 248 246 2 157 156 1
III 8 8 5 5 IV 1 1 .. V 14 14 13 13
VI 1 1 VII 32 32
vln 49 49 49 49 IX 143 141 2 90 89 I
Group 29 Unskilled Office Workers
Total 2,046 1.923 123 1,674 I.S6S t09
HI 22 22 1 1 IV 8 8 1 7 V 31 .31 31 31
VI 61 60 1 60 59 1 VII 71 70 1 71 70 1
VIII 361 361 327 327 IX 1,492 1,371 121 ] .. 177 1.070 107
Family 290 Office Attendants, Ushers. Han Porters etc., n. e. c.
Total 2.046 1,923 123 1 .. 674 1,565 109
III 22 22 1 I
IV R 8 7 7 V 31 31 31 31
VI 61 60 1 60 59 1
VII 71 70 I 71 70 I
VIII 361 361 327 327 IX 1.492 1,311 121 1.177 1,070 107
• Division 3 Sales Workers
Total 8,945 8,567 378 7,437 7.195 242
IV 7 5 2 7 5 2
V 65 63 2 65 63 2
VII 8.808 8.434 374 7,319 7,075 238
Vlll 34 34 34 34
IX 31 31 18 18
Group 30 Working Proprietors, Wholesale and Retail Trade
Total 6,919 6,631 288 5,590 5,392 198
VII 6,893 6.605 288 5,564 5,366 198
VIII 17 17 17 11 IX 9 9 9 9

98
TABLE B-V-OCCUPATIONAL CLASSIFICATION BY SEX OF PERSONS AT WORK OTHER THAN CULTIVATION-Contd.
Total Workers Division, Group
and Family Total Urban
Category Persom; Males Females Persons Males Females
1 2 3 4 5 6 7
Family 300 WoRing proprietors, Wholesale Trade
Total 932 925 7 719 718 1 VU 932 925 7 719 718 1
Family 301 Working Proprietors, Retail Trade
Total 5,987 5706 281 4.871 4,674 197 vn· 5.961 5,680 281 4.84S 4,648 197
VIII 17 17 17 17 IX 9 9 9 9
Group 31 Insurance and Real Estate Salesmen~ Salesmen of Securities and Services and Auctioneers
Total 76 60 16 57 41 16 VII 63 47 16 57 41 16 IX 13 13
Group 32 Commercial Travellers and Manufacturers Agents
Total 226 226 186 )R6 V 1 I
VII 216 216 176 ]76 IX 9 9 9 9
Family 321 Manufacturers' Agents
Total ]87 187 IR5 ]SS VII 178 178 176 176 IX 9 9 9 9
Group 33 Salesmen, Shop Assistants and Related Worken
Total 1,617 1,588 29 1,54~ 1,514 26 IV 7 5 2 7 5 2 V 64 62 2 64 62 2
VII 1,529 1.504 25 ] .452 1,430 22 VIII 17 17 17 17
Family 330 Salesmen and Shop Assistants, Wholesale and Retail Trade
Total 1,236 .,230 6 1,202 1,198 4 IV 7 5 2 7 5 2
V 54 52 2 54 52 2 VII 1,171 1.169 2 ],137 ],137
VIII 4 4 4 4

99
TABLE B-V-OCCUPATIONAL CLASSIFICATION BY SEX OF fERSONS AT WORK OTHER THAN CULTIVATION-Contd.
Total Workers Division, Group
and Family Total Urban
Category Persons Males Females Persons Males Females
2 3 4 5 6 7
Family 331 Hawkers. Pedlars and Street Venders
Total 375 352 23 333 311 22 V 10 10 10 10
VII 357 334 23 315 293 22 VIII 8 8 8 8
Group 34 Money-Lenders and Pawn-Brokers
Total 107 62 45 64 62 2
Vll 107 62 45 64 62 2
Family 340 Money Lenders (including Indigenous Bankers)
Total 104 59 4S 61 59 ·2 VII 104 59 45 61 59 2
• Division 4 Farmers, Fishermen, Hunters. Loggers and Related Workers
Total J7.606 11,025 6,58/ 464 388 76
III 219 180 39 78 58 20 IV 17,12P lJ.620 6,500 263 210 53 V 51 10 41 12 10 2 VI 6 6 6 6
Vll 93 93
Vlll 21 21 12 12 IX 96 95 I 93 92 1
Group 40 Farmers and Farm Managers
• Tolal 32 25 7 32 25 7
I1r 10 9 I 10 9 1
IV 22 16 6 22 16 6
Group 4] Farm Workers
Total ]7.443 10,869 6,574 427 358 69 HI 171 :;:133 38 63 44 19
IV 17,098 10,604 6,494 241 194 47
V 51 ]0 41 12 10 2 VI 6 6 6 6
VIII 21 21 12 12 IX 96 95 1 93 92 1
Family 411 Farm Workers. Animals, Birds and Insects Reariog
Total 17.192 10,621 6,571 282 215 67 III J 16 79 37 41 22 19
IV 17,033 10,539 6,494 237 190 47
v 43 3 40 4 3 1
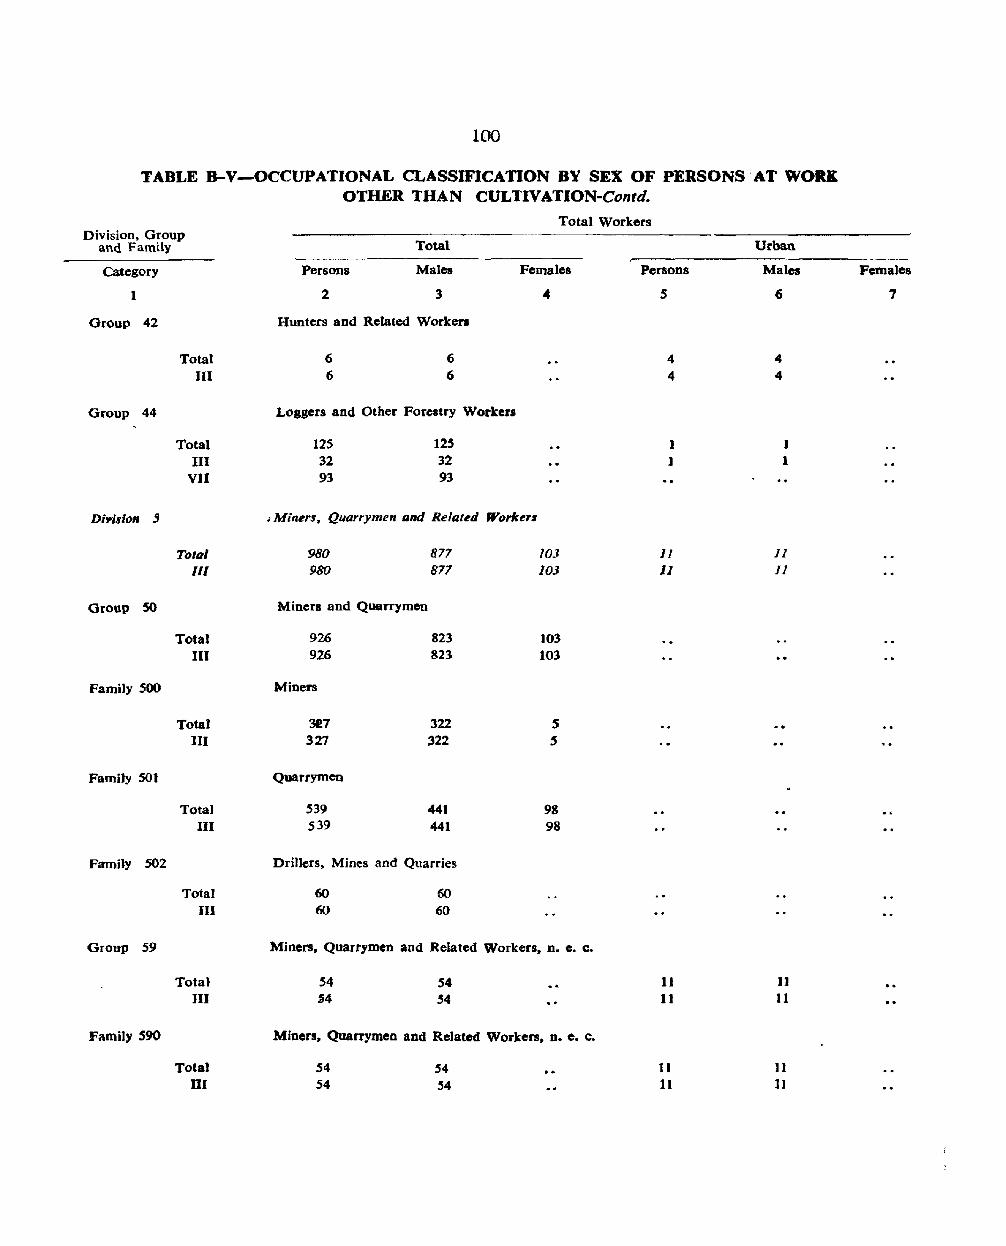
100
TABLE B-V-OCCUPATIONAL CLASSIFICATION BY SEX OF PERSONS 'AT WORK OTHER THAN CULTIV ATION-Contd.
Total Workers Division. Group
Total Urban and Family
category Persons Males Females Persons Males Females
1 2 3 4 5 6 7
Group 42 Hunters and Related Worken
Total 6 6 4 4 III 6 6 4 4
Group 44 Loggers and Other Forestry Worker.
Total 125 125 I J DI 32 32 J 1
VII 93 93
D;-p;8ion 5 J Miners. Quarrymen and Related Workers
Total 980 877 103 ]/ II
111 980 877 103 11 11
Group SO Miners and Quarrymen
Total 926 823 103 III 926 823 103
Family SOO Miners
Total 3e7 322 S III 327 322 ,
Family SOl Quarrymen
Total S39 441 98 III S39 441 98
Family S02 Drillers. Mines and Quarries
Total 60 60 III 60 60
Group S9 Mioers, Quarrymen and Related Workers, n. e. c.
Total S4 S4 o· 11 ))
III §4 S4 11 11
FamiJy 590 Miners. Quarrymeo and Related Workers, n. c. c.
Tota) 54 S4 11 Jl
III S4 S4 11 11

101
TABLE B-V-OCCUPATIONAL CLASSIFICATION BY SEX OF PERSONS AT WORK OTHER THAN CULTIVATION-Contd.
Total Workers Division, Group
and Family Total Urban - - -~ - --~--~- ~-~ --- -~- _--------
Category Persons Males Females Persons. Males Females
1 2 3 4 5 6 7
... Division 6 Workers in Transport and Communication Occupations
Total 2,915 2,909 6 2.438 2,432 6
TIl 53 53 1 1
Vl 22 22 22 21 Vlf 2/ 21 21 21
Vlll 2,665 2,659 6 2,258 2,251 6
lX 154 154 136 136
Group 61 Deck and Engine-Room Ratings (Ship), Barge Crews and Boatmen
Total 10 10 10 10 VIII 10 10 10 10
Group 63 Drivers and Firemen, Railway Engine
Total 205 205 183 183
VIII 205 205 183 183
Family 630 Drivers
Total 92 92 78 78
VIII 92 92 78 78
Family 631 Firemen
Total 113 113 lOS lOS
VIII 113 113 105 lOS
Group 64 Drivers, Road Transport
Total 1,838 1,835 3 1,609 1,606 1
III 53 53 1 1
VI 22 22 22 22 VII 21 21 21 21
VIII 1,600 1,597 3 1,441 1,438 1
IX 142 142 124 124
Family 641 Motor Vehicle and Motor Cycle Drivers
Total 500 500 402 402
III 22 22 VI 8 8 8 8
VIII 393 393 327 327
IX 77 77 67 67
Family 643 Animal Drawn Vehicle Drivers
Total 1,001 998 3 926 923 3
III 4 4 1 1
VI 12 12 12 12
VIII 985 982 3 913 910 1
Family 649 Drivers. Road Transport. n. e. c. (including }laUd and DoH Bearers)
Total 335 335 281 281
III 27 27 VI 2 2 2 2.
VII 21 21 21 21
VIII 220 220 201 201
IX 65 65 57 57
Bika 23
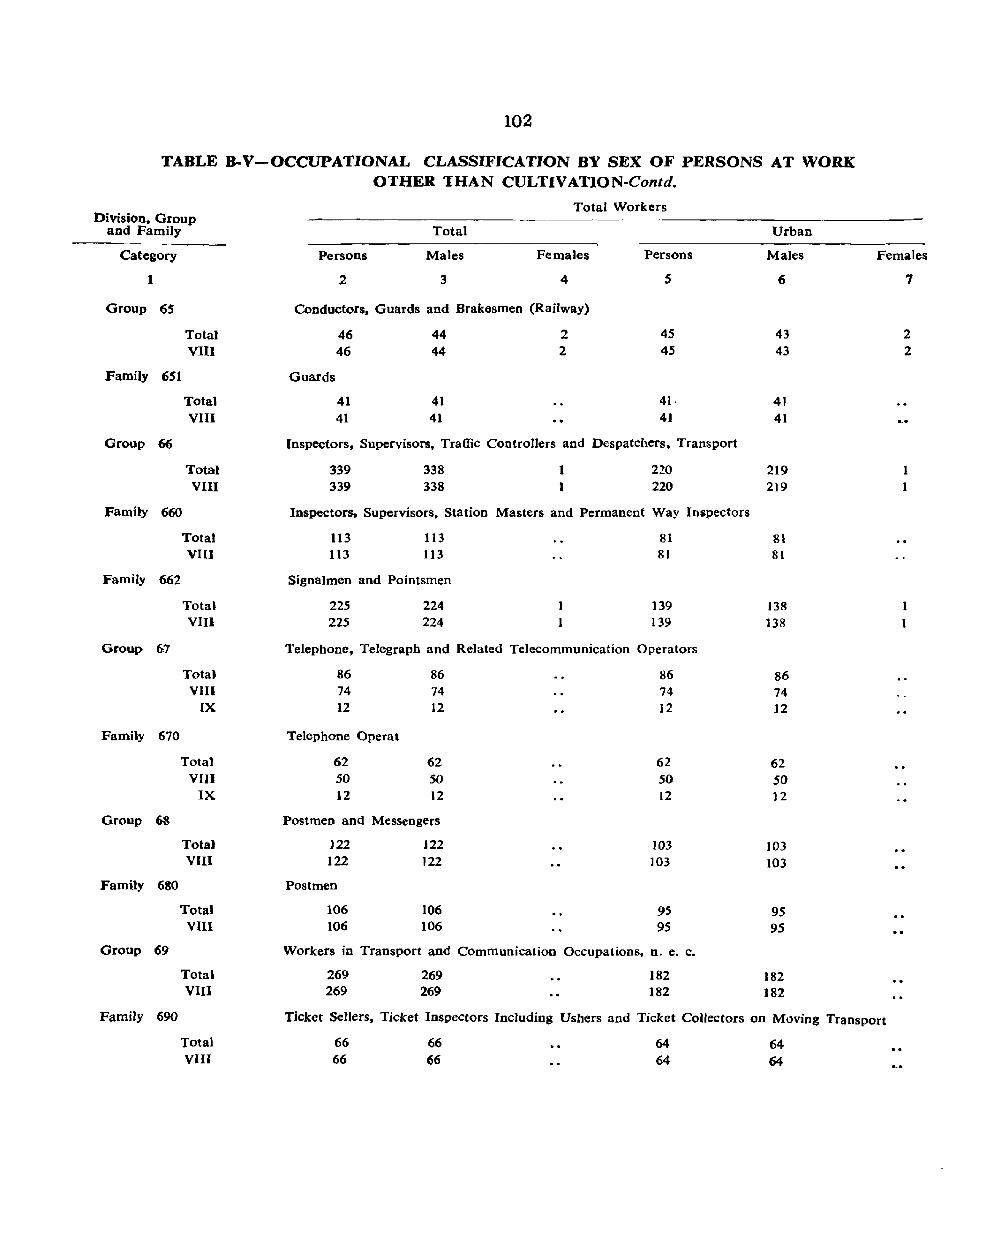
102
TABLE B-V-OCCUPATIONAL CLASSIFICATION BY SEX OF PERSONS AT WORK OTHER THAN CULTIVATION-Contd.
Division. Group and Famny
Category
1
Group 6S
Total VIII
Family 651
Total VIII
Group 66
Total VIII
Family 660
Tota) VIII
FamiJy 662
Total VIII
GJ'oup 67
Tota) VIII
IX
Family 670
Total Vln
IX
Group 68
Tota) VIII
Family 630
Total VIII
Group 69
Total VIII
TotaJ Workers
Total
Persons Males Females Persons
2 3 4 s
Conductors. Guards and Brak6smen (Railway)
Guards
46 46
41 41
44 44
41 41
2 2
45 45
41· 41
Inspectors, Supervisors, Traffic Controllers and Despatchers. Transport
339 339
338 338
1 I
220 220
Inspectors, Supervisors, Station Masters and Permanent Way In5pectors
113 113
113 113
Signalmen and Pointsmen
225 225
224 224
81 81
139 139
Telephone, Telegraph and Related Telecommunication Operators
86 74 12
Telephone Operat
62 50 12
86 74 12
62 50 12
Postmen and Messengers
J22 122
Postmen
106 106
]22 122
106 106
86 74 12
62 50 12
103 ]03
95 95
Workers in Transport and Communication Occupations, n. e. c.
269 269
269 269
182 182
Urban
Males
6
43 43
41 41
219 219
81 81
138
138
86 74 12
62 50 12
103 103
95 95
182 182
Females
7
2 2
1 1
Family 690 Ticket Sellers. Ticket Inspectors Including Ushers and Ticket CoUectors on Moving Transport
Total VIII
66 66
66 66
64 64
64 64

103
TABLE B-V-OCCUPATIONAL CLASSIFICATION BY SEX OF PERSONS AT WORK OTHER THAN CULTIVATION-Contd .
• .I. - ,.
To,tal Worke'rs Division, Group
i I •
and family Total Urban
caf~gory Persons Males Females Persons Males Females
1 2 3 4 5 6 7
Family 692 Workers in Transport Occupations, D.e.c.
1'otal,:: 132 132 63 63 VIl~:- 1'32 132 63 63
I
Family 693 Inspectors, Traffic Controllers ana Despatchers, Communication
Tot'll} 137 37 i1.7 27 \ VIII '37 37 !2.7 27
• Division 7-8 Craftsmen, Prodilclion Process Workers and Labourers, n. e. c.
Total " 24,'868 19;9112 4,926 "11/,089 15,859 2,230 I
'671 ' ')06 III 877 27. 27 IV 6,881 3,907 2,974 2,993 2,056 937 V 5,198 4.436 762 4.588 3,951 637
VI 3,980 3.629 351 3,590 3,307 283 Vll 170 126 44 138 lIO 28
VITI 3,062 3,048 14 2,701 2,69/ 10 IX 4,700 4,125 575 4,052 3,717 335
Group 70 Spinners, Wiavers. Knitters, Dyers and Related Workers .. : ~! n
'Total 3.540 1,403 2,137 1.712 973 739 IV 2,678 891 1,787 863 474 389 V 844 512 332 831 499 332
VII 18 18 18 18
Family 700 Fabre Preparers; Ginners, Cleaners. Scourers, e. t.c." '
TO~;;tl' ; 647 248 399 645 246 399 , IV . 216 33 183 214 31 183 V 431 215 216 431 215 216
Family 702 Spinners. Piecers and Winders
Totar t~143 '114' 1.029 245 44 201 IV 1,017 76 941 119 6 113 V 109 38 71 109 38 71
VII 11 17 11 11 , '
Family 704 Drawers and W;eavers
Total 796 432 364 192 116 16 IV 671 311 354 80 74 6 V. 124 115 9 III 102 9
Vil I 1 1 1
Family 706 Bleachers. Dyers and Finishers (excluding Printers)
Total 666 4'24 242' 444 404 40 IV 576 360 216 354 340 14
V: 90 64 26 90 64 26

104
TABLE 8-V-OCCUPATIONAL CLASSIFICATION BY SEX OF PERSONS AT WORK OTHER THAN CULTIVATION-Contd.
Division, Group and Family Total
Total Workers
Urban
Category Persons Males Females Persons Males Females
1 2 3 4 5 6 7 • f '
Family 709 Spinners, Weavers. Knitters, Dyers and Related Workers, n. e. c.
Total 284 183 101 186 103 83 IV 194 103 91 96 23 73 V 90 80 10 90 80 10
Group 71 Tailors. Cutters. Furriers and Related Workers
Total 1,511 ),011 500 1,234 857 377 IV 505 160 345 424 121 303 V 999 845 154 804 731 73
VIII 7 6 1 6 5 1
Family 710 Tailors, Dress Makers and Garment Makers
Total 1.481 1 1,010 471 1,230 857 373 479 159 320
\ ,. t~
IV 424 . 121 303 V 995 845 150 800 731 69
VIII 7 6 1 6 5 1
Group 72 Leather Cutters, Lasters and Sewers (Except Gloves Garments) and Related Workers
Total 1,078 835 243 522 400 122 IV 726 501 225 283 168 115 V 351 333 18 239 232 7
VII 1 1
Family 720 Shoe Makers and Shoe Repairers
Total 755 605 150 508 387 121 IV 452 319 133 283 168 lI5 V 303 286 17 225 219 6
Group 729 Leather Cutters, Lasters and Sewers (Except Gloves and Garments) and Related Workers, D.e.c.
. Total 307 214 93 14 13 1 IV 258 166 92 V 48 47 1 14 13 I
VII 1 1
Group 73 Furnacemen. Rollers. Drawers, Moulders and Related Metal Making and Treating Workers
Total 719 651 68 4661 447 19 III 2 2 IV 455 395 60 229 215 14
V 163 155 8 145 140 S . : VI S 8 8 8
VIII 91 91 84 84 -

105
TABLE B-V-OCCUPATIONAL CLASSIFICATION BY SEX OF PERSONS AT WORK OTHER THAN CULTIVATION-Contd.
Div~on. Group -a . Family Total
Total Workers
Urban
Category Persons Males Females Persons Males Females
I 2 3 4 5 6 7
Family 733 Blacksmiths. Hammersmiths and Forgemen
Total 697 629 68 447 428 19 III 2 2 IV 455 395 60 229 215 14 V ]63 ]55 8 145 140 5
VI 8 8 8 8 VIII 69 69 65 6S
Group 74 Precision Instrument Makers, Watch Makers, Jewellers and Related Workers
Total 1.347 1.339 8 1,070 1.069 1 IV 874 867 7 689 689 V 469 468 1 381 380 1
VII 4 4
Family 741 Jewel1ers. Goldsmiths and Silversmiths
Total 1.295 1,287 8 1,0]8 ],017 IV 868 86J 7 683 683 V 423 422 1 335 334 I
VI 4 4
Group 75 Too)~Makers. Machinists, Plumbers. Welders. Platers and Related Workers
Total 1,969 1.949 10 1.873 1.855 18 III 49 49 2 2 IV 95 81 14 82 70 12
V 274 271 3 274 271 3 VII 36 36 _35 35 ....
VIII 1.140 1.139 1 1.124 1.123 I IX 375 373 :2 356 354 2
Family 750 Fitter-Machinists. Tool-makers and Machine Tool Setters
Total 338 336 2 281 279 2 III 38 38 IV I I V 2 2 2 2
VIII 288 288 274 274 IX 9 9 5 5
Family 751 Machine Tool Operators
Total 313 312 I 304 303 I III 6 6 IV 3 3 3 3 V 45 45 4S 45
VIII 145 145 145 145 IX 114 113 1 111 110 I
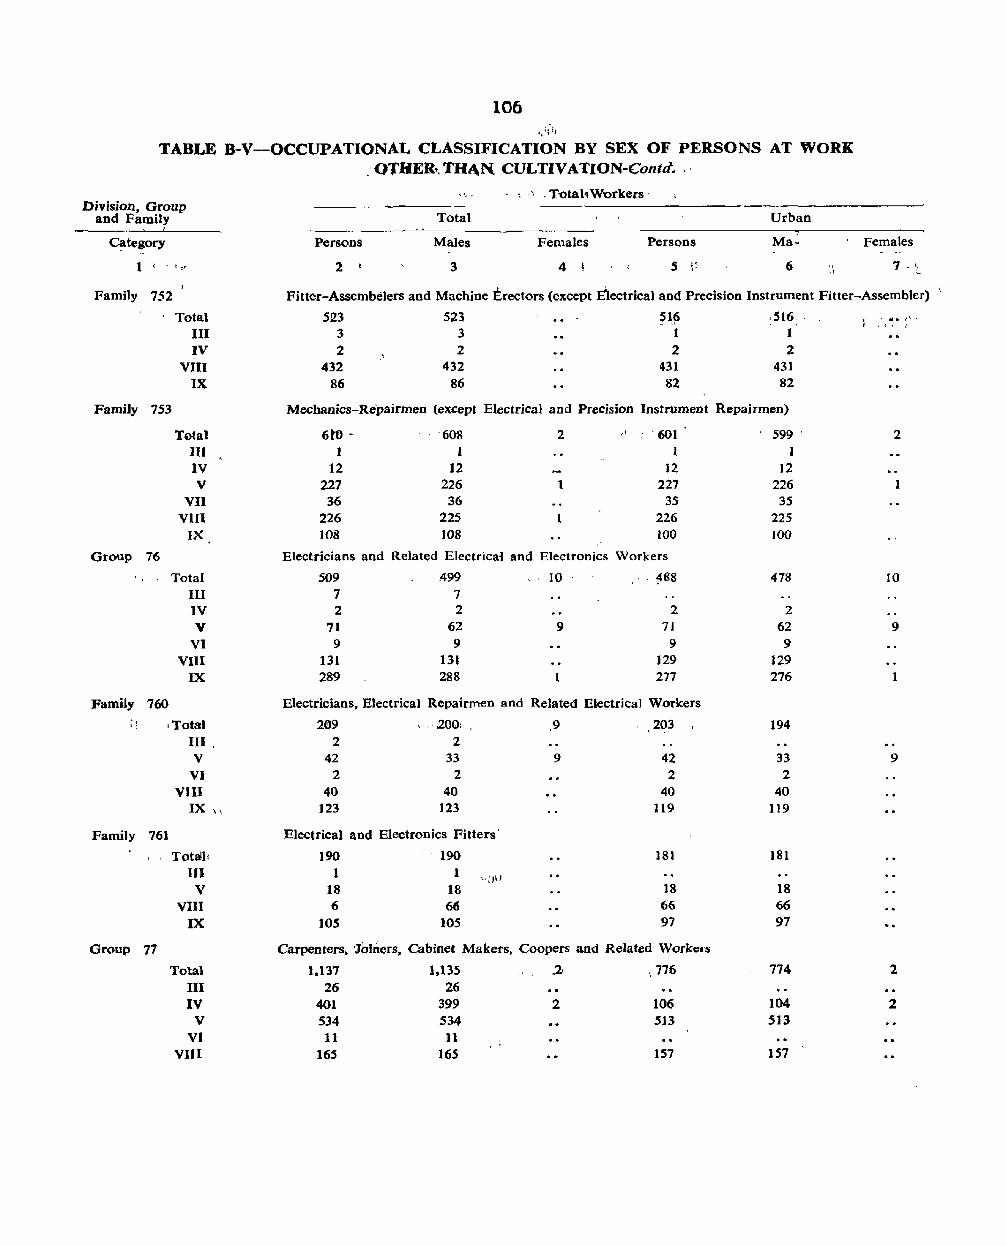
106
TABLE B-V-OCCUPATIONAL CLASSIFICATION BY SEX OF PERSONS AT WORK .O'fHER~, THt\N CULTIVATION-Contd. "
Division, Group and Family
Category
1 ' ., '"
Family 752
Total III IV
VIII IX
Family 753
Total 111 IV V
VII VIII
IX
Group 76
Total III IV V
VI VIII
IX
Family 760 " ,Total I;
III " V
VI VIII
IX \\
Family 761
Totalll III
V VIn
IX
Group 77
Total III IV
V VI
VIII
" \ . Totah W'Otkecs '
Total Urban
Persons Males Females Persons Ma~ Females
2 3 4 I 5 F 6 "
Fitter-Assembelers and Machine Erectors (except :Electrical and Precision Instrument Fitter-Assembler)
523 523 ~L.~ .516, . , ~. I" ,{, ,.
3 3 1 1 2.' 2 2 2
432 432 431 431 86 86 82 82
Mechanics-Repairmen (except Electrical and Precision Instrument Repairmen)
6ro - '608 2 ,I .- . 601 599 2 I I I
12 12 12 12 227 226 t 227 226 I 36 36 35 35
226 225 1 226 225 108 108 ; 100 100
Electricians and Related Electrica-i and Electronics Workers
509 499 10 ~88 478 JO 7 7 2 2 2 2
71 62 9 71 62 9 9 9 9 9
131 131 129 129 289 288 1 277 276 1
Electricians, Electrical Repairmen and Related Electrical Workers
209 ,,' lOO, ,9 203 194 2 2
42 33 9 42 33 9 2 2 2 2
40 40 40 40 123 123 119 119
Electrical and Electronics Fitters'
190 190 181 181
I 1 ,<)u 18 18 18 18 6 66 66 66
105 105 97 97
Carpenters. 'Jbiners, Cabinet Makers. Coopers and ReJated Work~Hi
1.137 1.135 ,2> " 776 774 2 26 26
401 399 2 106 104 2 534 534 513 513 11 11
165 165 157 157
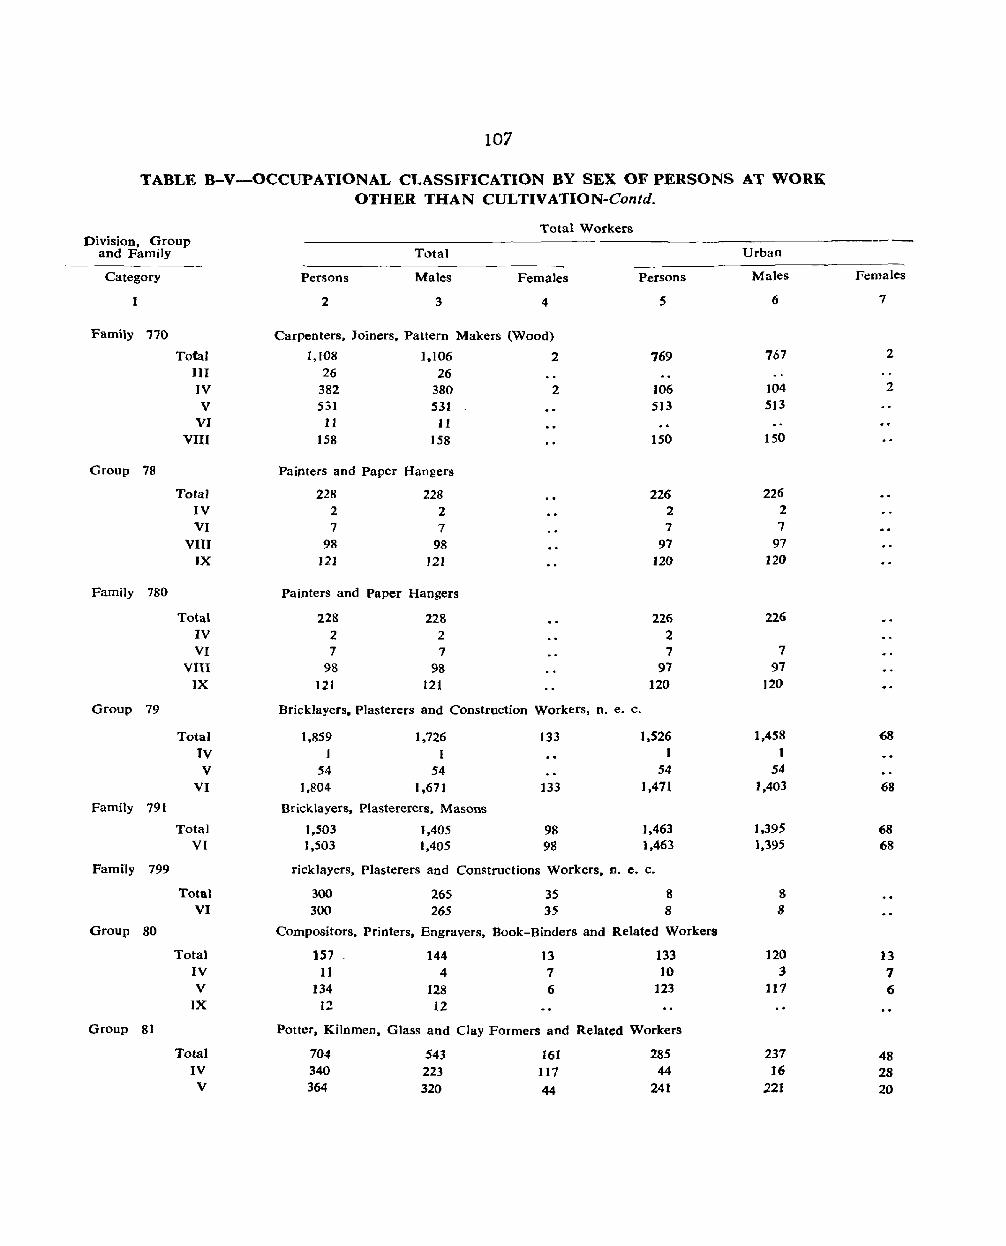
107
TABLE B-V-OCCUPATIONAL CLASSIFICATION BY SEX OF PERSONS AT WORK OTHER THAN CULTIVATION-Contd.
Total Workers Division, Group
and Family Total Urban
Category Persons Males Females Persons Males Females
2 3 4 5 6 7
Family 770 Carpenters. Joiners, Pattern Makers (Wood)
Total 1,108 1.106 2 769 767 2
III 26 26 IV 382 380 2 106 104 2
V 531 531 513 5J3 VI 11 11
VIII 158 158 150 150
Group 78 Painters and Paper Hangers
Total 22R 228 226 226 IV 2 2 2 2
VI 7 7 7 7
VIII 98 98 97 97 IX 121 J2J 120 120
Family 780 Painters and Paper Hangers
Total 228 228 226 226 IV 2 2 2 VI 7 7 7 7
VIII 98 98 91 97 IX 121 121 120 120
Group 79 Bricklayers. Plasterers and Construction Workers, n. e. c.
Total 1,859 1,726 133 1,526 1,458 68
IV 1 1 V 54 54 54 54
VI 1.804 1,671 133 1.471 1,403 68
Family 791 Bricklayers, Plastererers. Masons
Total 1,503 1,405 98 1,463 1.395 68 VI 1,503 1,405 98 1,463 1.395 68
Family 799 ricklayers, Plasterers and Constructions Workers, n. e. c.
Total 300 265 3S 8 S VI 300 265 35 8 S
Group 80 Compositors, Printers. Engravers, Book-Binders and Related Workers
Total 157 144 13 133 120 13 IV 11 4 7 10 3 7 V 134 128 6 123 111 6
IX 11 12
Group 81 Potter. Kilnmen. Glass and Clay Formers and Related Workers
Tota] 704 543 161 285 237 48 IV 340 223 117 44 16 28 V 364 320 44 241 .221 20
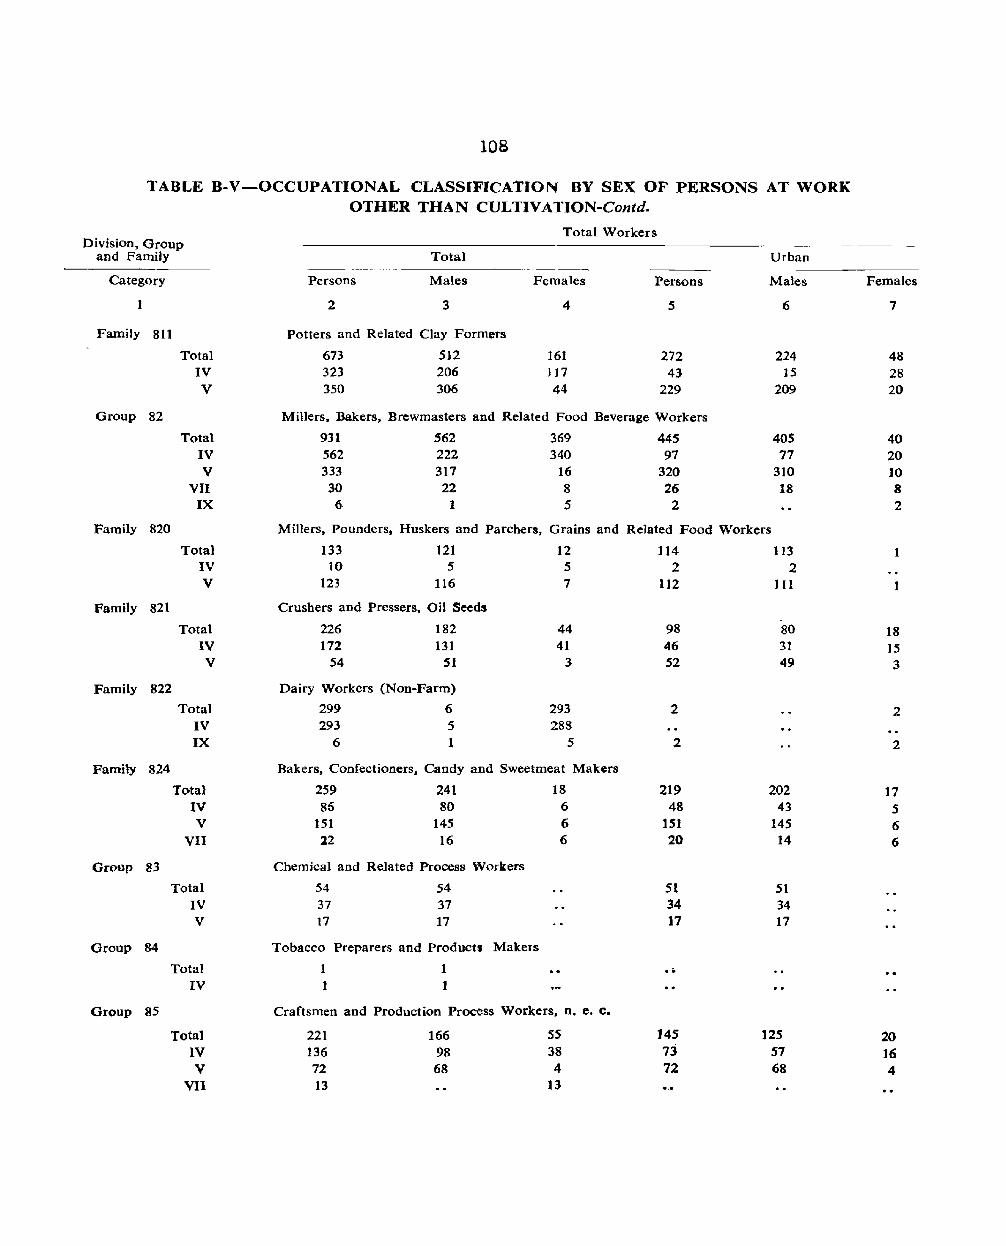
108
TABLE B-V-OCCUPATIONAL CLASSIFICATION BY SEX OF PERSONS AT WORK OTHER THAN CULTIVATION-Contd.
Total Workers Division, Group
and FamiJy ---------------------------- ---_---------
Category
I
Family 811
Group
Family
Family
Family
Family
Group
Group
Group
82
820
821
Total IV V
Total IV V
VII IX
Total IV V
Total IV V
822
824
83
84
85
Total IV IX
Total IV V
VII
Total IV V
Total IV
Total IV V
VII
Total ----_
Persons Males Females Persons
2 3 4 5
Potters and Related Clay Formers
673 512 161 272 323 206 J 17 43 350 306 44 229
Millers. Bakers, Brewmasters and Related Food Beverage Workers
931 562 333 30
6
562 222 317 22
1
369 340
16 8 5
445 97
320 26
2
Urban
Males
6
224 15
209
405 77
310 18
Miners. Pounders, Huskers and ParcherSt Grains and Related Food Workers
133 121 12 10 5 5
123 116 7
Crushers and Pressers. Oil Seeds
226 182 44 172 131 41
54 51 3
Dairy Workers (Non-Farm)
299 6 293 293 5 288
6 1 5
Bakers, Confectioners, Candy and Sweetmeat Makers
259 241 86 80
151 145 22 16
Chemjcal and Related Process Workers
54 54 37 37 17 17
Tobacco Preparers and Products Makers
1 1
1 I
18 6 6 6
Craftsmen and Production Process Workers. n. e. c.
221 136 72 13
166 98 68
55 38 4
13
114 2
112
98 46 52
2
2
219 48
151 20
51 34 17
...
145 7j 72
113 2
III
-80 31 49
202 43
145 14
51 34 17
125 57 68
Females
7
48 28 20
40 20 10 8 2
1
18 )5 3
2
2
17 5 6 6
20 16 4
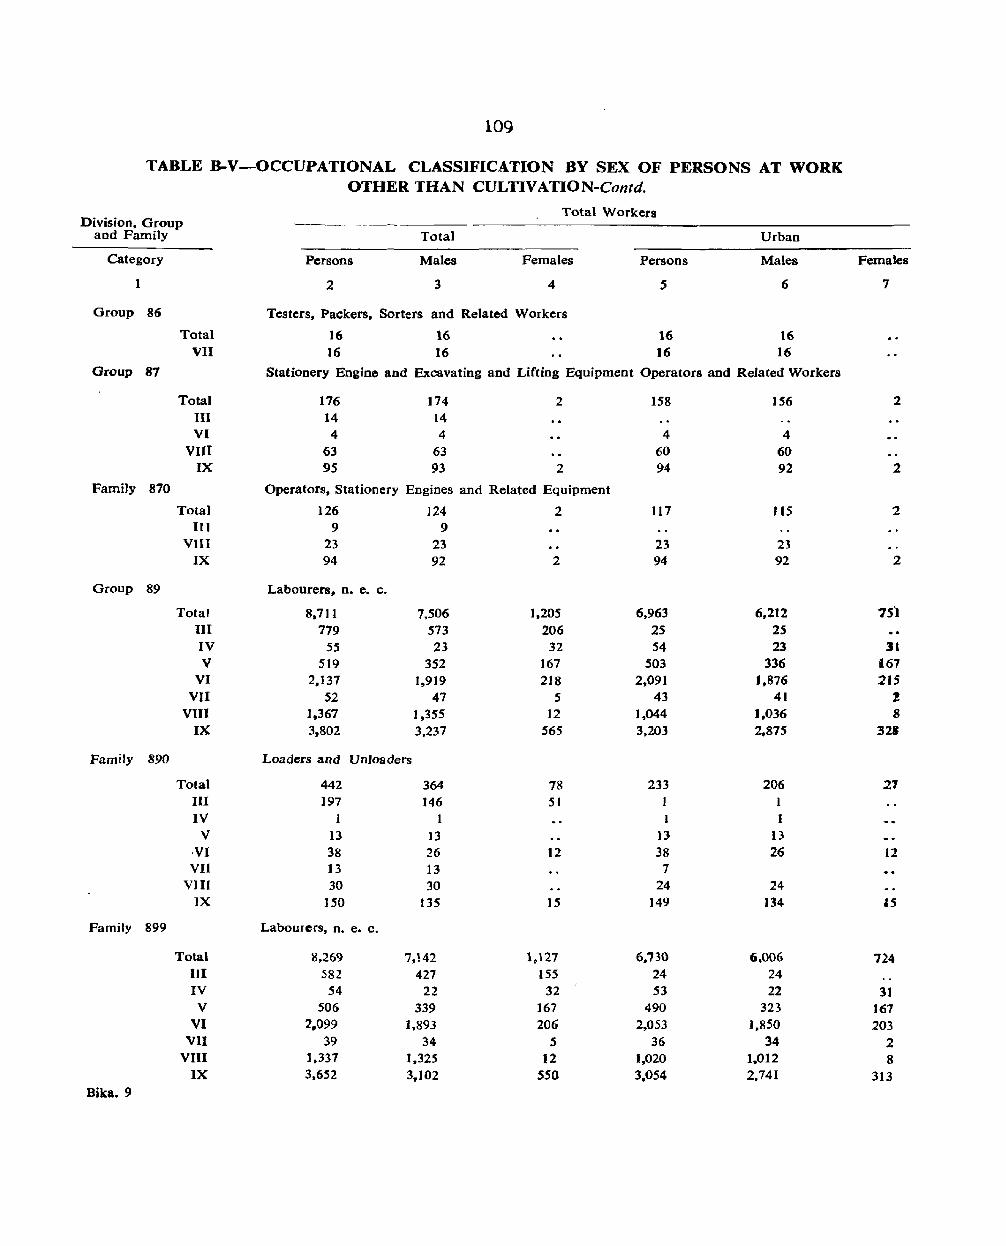
109
TABLE B-V-OCCUPATIONAL CLASSIFICATION BY SEX OF PERSONS AT WORK OTHER THAN CULTIVATION-Contd.
Division, Group Total Workers
and Family Total Urban
Category Persons Males Females Persons Males Females
1 2 3 4 S 6 7
Group 86 Testers. Packers. Sorters and Related Workers
Total 16 16 16 16 VII 16 16 16 16
Group 87 Stationery Engine and Excavating and Lifting Equipment Operators and Related Workers
Total 176 174 2 158 156 2 III 14 14 VI 4 4 4 4
VIII 63 63 60 60 IX 95 93 2 94 92 2
FamiJy 870 Operators, Stationery Engines and Related Equipment
Total 126 ]24 2 117 115 2 III 9 9
VIII 23 23 23 2:J IX 94 92 2 94 92 2
Group 89 Labourers, o. e. c.
Total 8.711 7,506 1.205 6.963 6.212 75) III 779 573 206 25 25 IV 55 23 32 54 23 31 V 519 352 167 503 336 '67
VI 2.137 1,919 218 2,091 ',876 215 VII 52 47 5 43 41 l
VUI 1,367 1,355 12 1,044 1.036 8 IX 3,802 3,237 565 3.203 2,875 321
Family 890 Loaders aDd UDloaders
Total 442 364 78 233 206 21 III 197 146 51 1 IV 1 1 I I
V 13 13 13 13 ,VI 38 26 ]2 38 26 12 VII 13 13 7
VII[ 30 30 24 24 IX 150 ]35 15 149 134 IS
Family 899 Labourers, D. e. c.
Total 8.269 7,!42 1.\27 6,730 6.006 724 IJI 582 427 155 24 24 IV 54 22 32 53 22 31
V 506 339 167 490 323 167 VI 2.099 1,893 206 2,053 1.850 203
VII 39 34 5 36 34 2 VIII 1,337 1.325 12 1,020 1.012 8
IX 3.652 3,102 550 3.054 2,741 313 Bika. 9
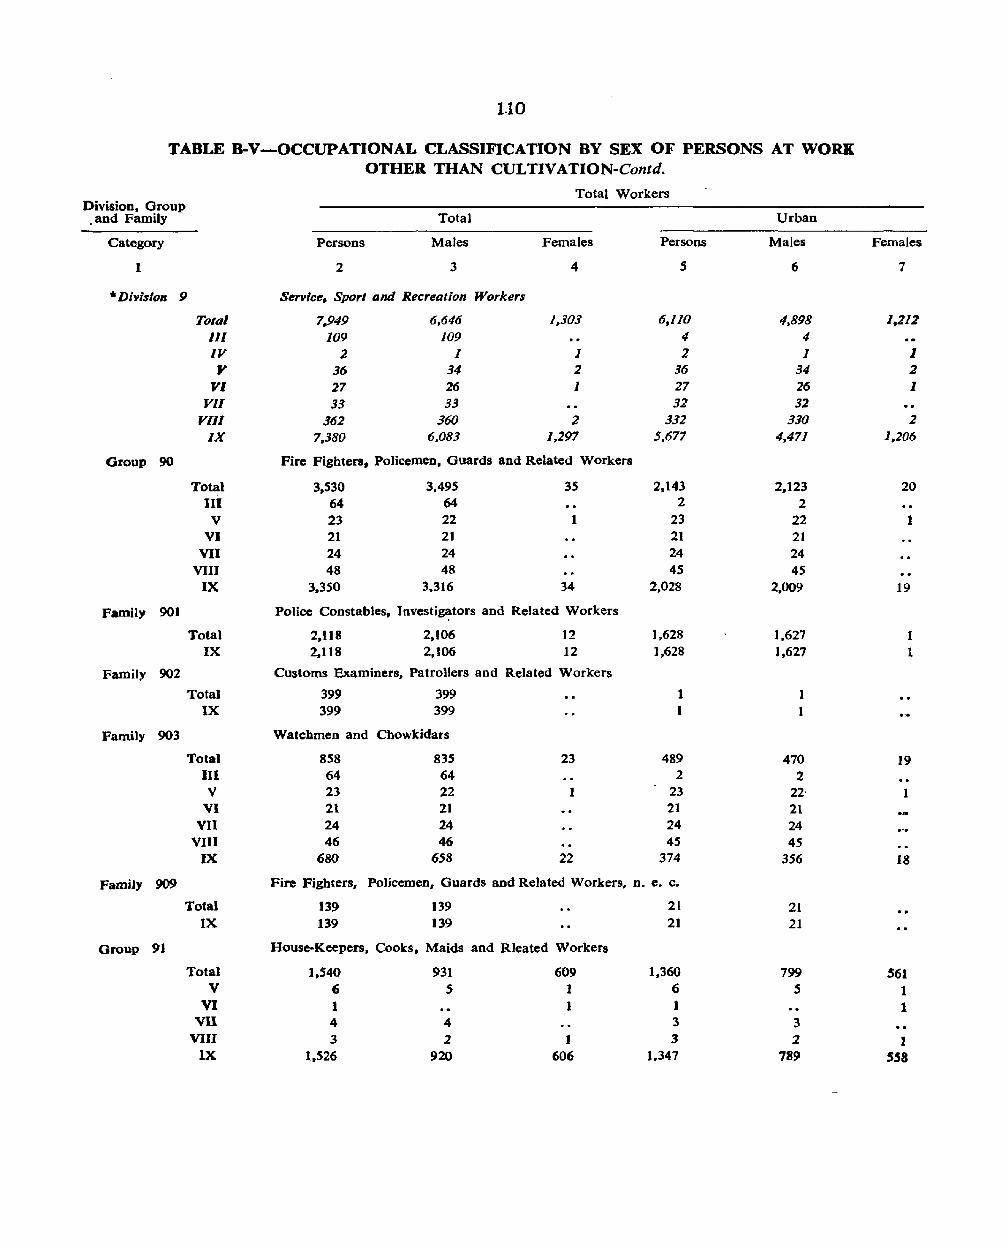
1.10
TABLE 8-V-OCCUPATIONAL CLASSIFICATION BY SEX OF PERSONS AT WORK OTHER THAN CULTIVATION-Contd.
Total Workers Division, Group ,and Family Total Urban
Category Persons Males Females Persons Males Females
I 2 3 4 S 6 7
* Dfv;sion 9 Service, Spor' and Recreation Workers
Total 7.949 6,646 1,303 6,110 4,898 1,212 III 109 109 4 4 IV 2 1 1 2 1 1 y 36 34 2 36 34 2
VI 27 26 1 27 26 1 VII 33 33 32 32
VIII 362 360 2 332 330 2 IX 7,380 6,083 1,297 5,677 4,471 1.206
Group 90 Fire Fighters, Policemeo. Guards aod Related Workers
Total 3,530 3.495 35 2,143 2.123 20 III 64 64 2 2 V 23 22 I 23 22 1
VI 21 21 21 21 VII 24 24 24 24
VIII 48 48 4S 45 IX 3,350 3,316 34 2,028 2,()()9 19
Family 901 Police Constables, Investig~tors aod Related Workers
Total 2,118 2,106 12 1,628 1,627 1 IX 2.118 2,106 12 1,628 1,627 1
Family 902 Customs Examiners, Patrollers and Related Workers
Total 399 399 1 1 IX 399 399 1
Family 903 Watchmen and Chowkidars
Total 858 835 23 489 470 19 III 64 64 2 2 V 23 22 1 23 22· 1
VI 21 21 21 21 VII 24 24 24 24
VIII 46 46 45 45 IX 680 658 22 374 356 18
Family 909 Fire Fighters, PoHcemen. Guards and Related Workers, n. e. c.
Total 139 139 21 21 IX 139 139 21 21
Group 91 House-Keepers, Cooks, Maids and Rleated Workers
Total 1,540 931 609 1,360 799 561 V 6 5 1 6 5 1
VI 1 1 1 1 VII 4 4 3 3
VIII 3 2 1 3 2 1 IX 1.526 920 606 1,347 789 558

111
TABLE B-V-OCCUPATIONAL CI .. ASSIFICATION BY SEX OF PERSONS AT WORK OTHER THAN CULTIVATION-Contd.
Division, Group Total Workers
and Family Total Urban --
Category Persons Males Females Persons Males Females
1 2 3 4 5 6 1
Family 911 Cooks. Cook-Bearers (Domestic and Institutional)
Total 527 340 187 485 320 165 V 6 5 1 6 5 1
VI 1 1 1 1 VII 4 4 3 3
VIII 3 2 1 3 2 IX 513 329 184 472 310 162
Family 912 Butlers, Bearers, Waiters, Maids and Other Servants (Domestic)
Total 961 549 412 858 468 390 IX 961 549 412 858 468 390
Group 92 Waiters. Bartenders and Related Workers
Total 130 126 4 87 83 4 ]11 43 43
VIII 2 2 2 2 IX 8S 81 4 85 81 4
Family 920 Waiters, Bartenders and Related Workers (Institutional)
Total 130 126 4 87 83 4 III 43 43
VIII 2 2 2 2 IX 8S 81 4 85 81 4
Group 93 Building Care-Takers. Cleaners and Related Workers
Total 1,864 1,333 531 1.724 1.216 S08 lJI 2 2 2 2 IV 2 1 1 2 1 I V 7 7 7 7
VI 5 5 5 5 VII 5 5 5 5
VIU 309 308 1 282 281 1 IX 1,534 1.005 529 1.421 915 506
Family 931 Cleaners, Sweepers and Watermcn
Total 1,858 1.327 53! 1.724 1.216 508 III 2 2 2 2 IV 2 1 1 2 1 1 V 7 7 7 7
VI 5 5 S S VII 5 5 5 5
VIII 309 308 1 282 281 1 IX 1.528 999 529 1.421 915 506
Group 94 Barbers, Hairdressers, Beauticians and Related Worken·
Total 526 518 8 440 436 4 IX 526 518 8 440 436 4
Bika.9-A
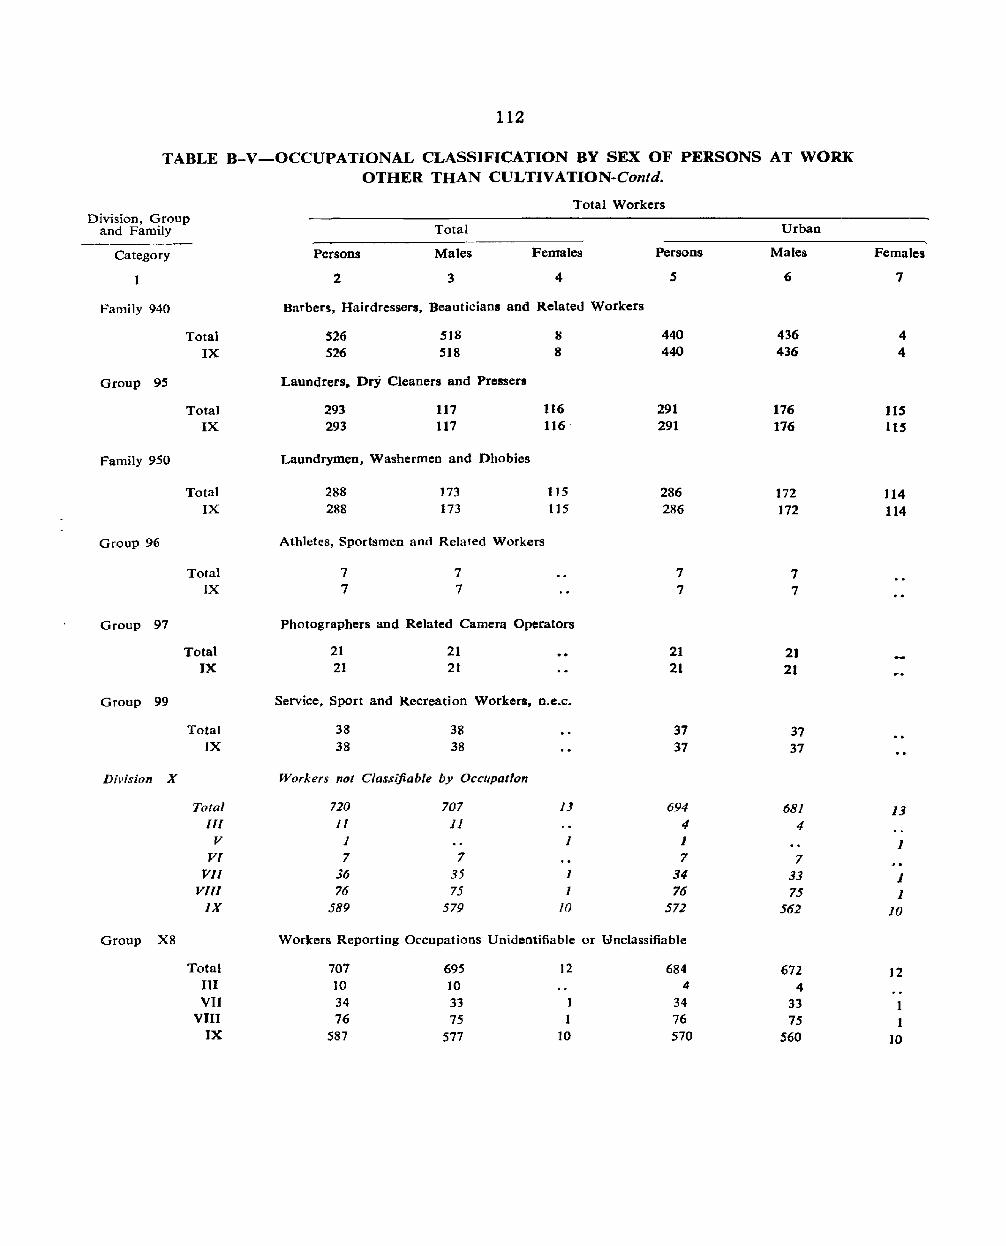
112
TABLE B-V-OCCUPATIONAL CLASSIFICATION BY SEX OF PERSONS AT WORK OTHER THAN CULTIVATION-Contd.
Total Workers Division, Group
and Family Total Urban
Category Persons Males Females Persons Males Females
1 2 3 4 5 6 7
Family 940 Barbers, Hairdressers. Beauticians and Related Workers
Total 526 518 8 440 436 4 IX 526 518 8 440 436 4
Group 9S Laundrers_ Dry Cleaners and Pressers
Total 293 117 116 291 176 IlS IX 293 117 116 291 176 ItS
Family 950 Laundrymen, Washermen and Dhobies
Total 288 173 115 286 172 114 IX 288 173 115 286 172 114
Group 96 Athletes, Sportsmen and Related Workers
Total 7 7 7 7 IX 7 7 7 7
Group 97 Photographers and Related Camera Operators
Total 21 21 21 21 IX 21 21 21 21
Group 99 Service. Sport and Recreation Workers. D.e.C.
Total 38 38 37 37 IX 38 38 37 37
Division X Workers not Classifiable by Occupation
Total 720 707 JJ 694 68J 13 Iff II 11 4 4
V 1 1 I 1 Vl 7 7 7 7
VIl 36 35 I 34 33 1 Vlll 76 75 1 76 75 1
IX 589 579 10 572 562 10
Group X8 Workers Reporting Occupations Unidentifiable or 'Wnclassifiable
Total 701 695 12 684 672 12 III 10 10 4 4 VII 34 33 1 34 33 1
VIn 76 75 1 76 75 1 IX 587 577 10 570 560 10
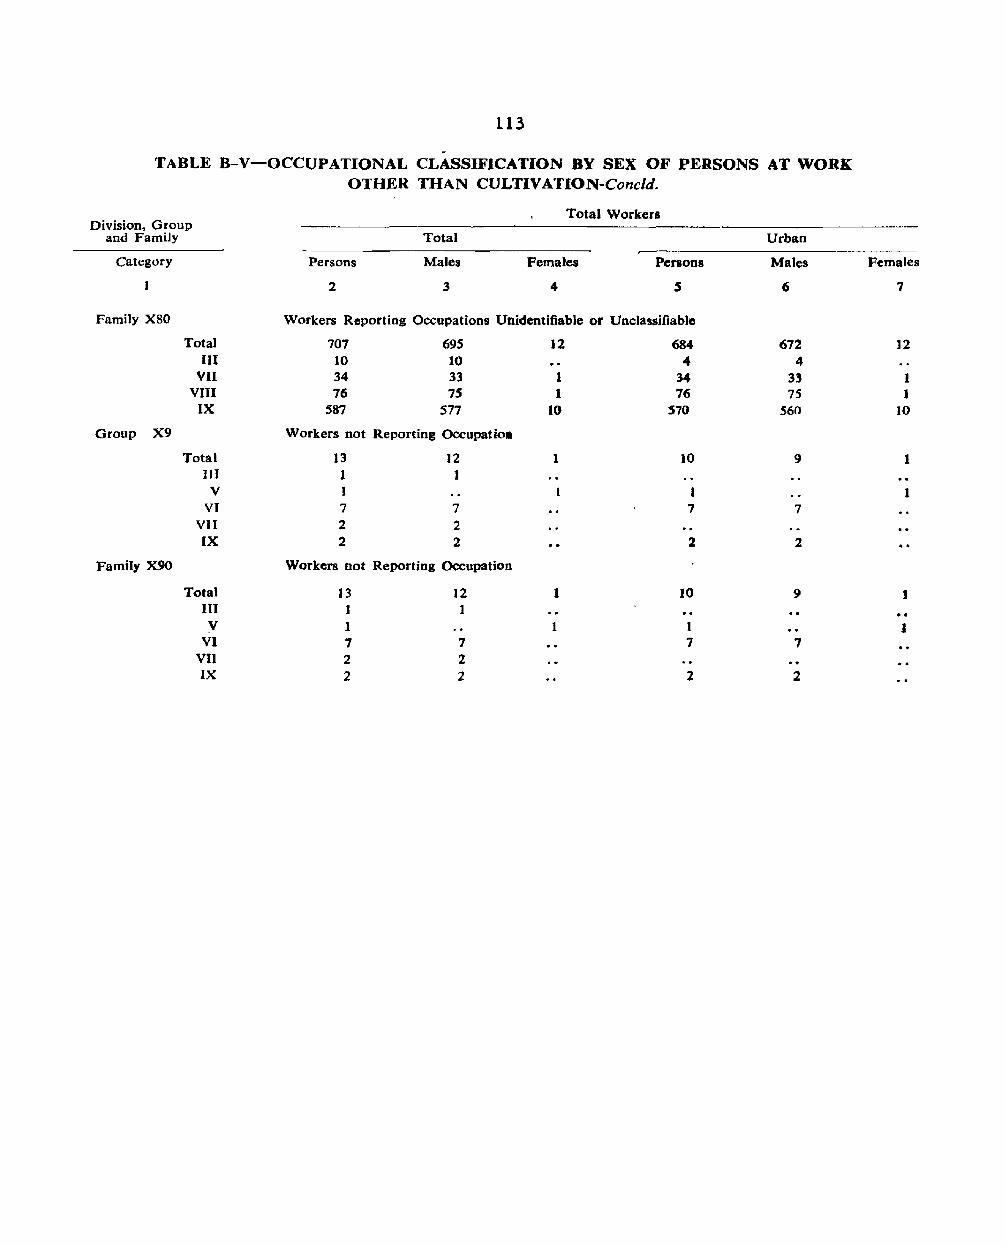
113
-TABLE B-V-OCCUPATIONAL CLASSIFICATION BY SEX OF PERSONS AT WORK
OTHER THAN CULTIVATION-Concld.
Total Workers Division, Group
and Family Total Urban
Category Persons Males Females Penons Males Females
J 2 3 4 S (; 7
Family X80 Workers Reporting Occupations Unidentifiable or Unclassifiable
Total 707 695 12 684 672 12 III 10 10 4 4
VII 34 33 I 34 33 1 VIII 76 75 1 76 75 1
IX 587 517 10 S70 560 to
Group X9 Workers not Reporting Occupatio.
Total 13 12 1 10 9 1 III 1 1
V I 1 1 VI 7 7 7 7
VII 2 2 IX 2 2 2 2
Family X90 Workers not Reporting Occupation
Total 13 12 1 10 9 I III J 1 V 1 1 1 1
VI 7 7 7 7 VIJ 2 2 IX 2 2 2 2
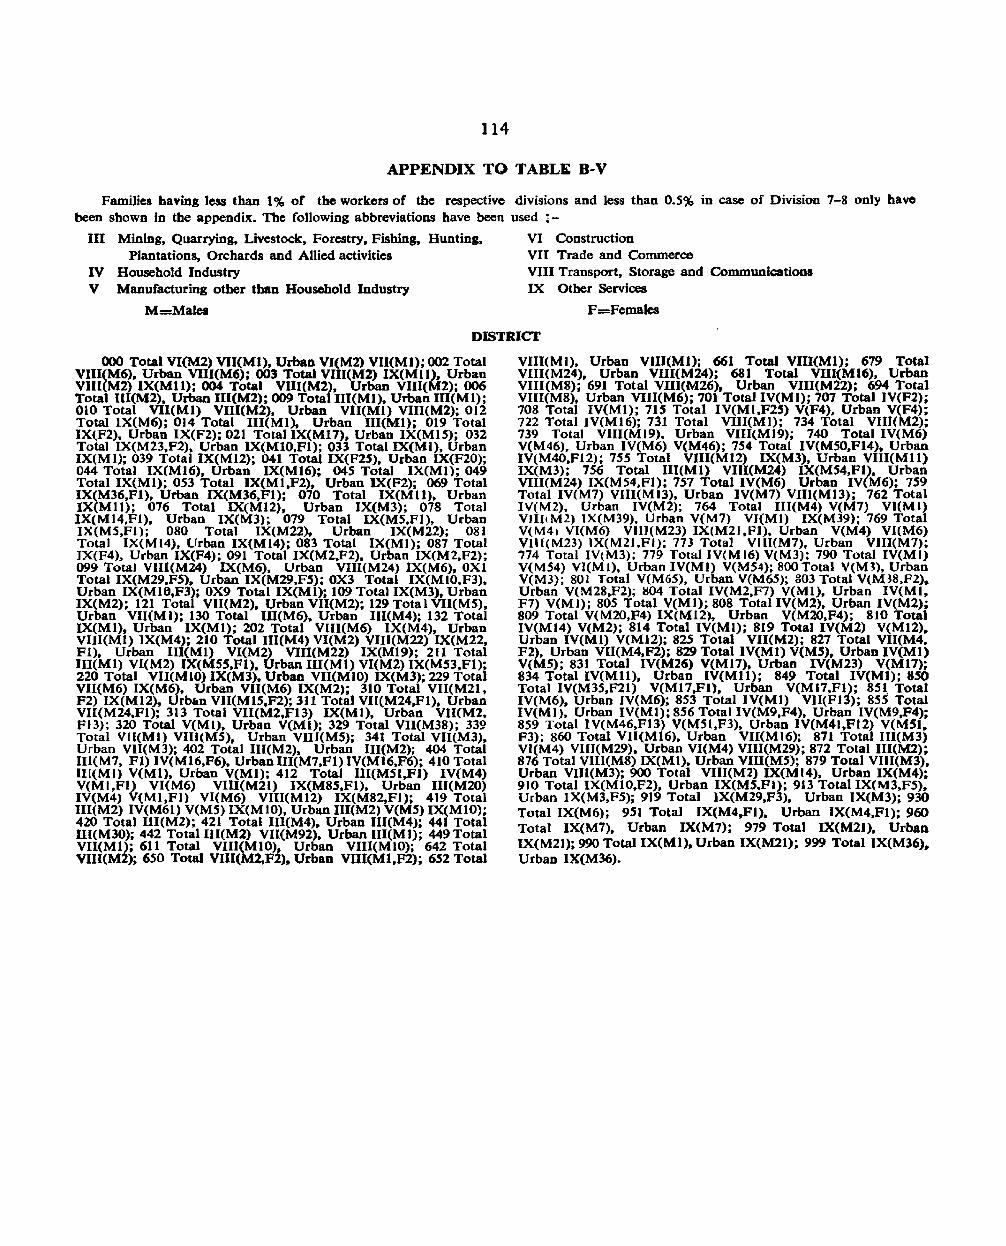
114
APPENDIX TO TABLE B-V
Families having less than t% of the workers of the respective divisions and less than 0.5% in case of Division 7-8 only have been shown in the appendix. The following abbreviations have been used ~-
III Mining. Quarrying. Livestock. Forestry. Fishing, Hunting, Plantations, Orchards and Allied activities
IV Household Industry V Manufacturing other than Household Industry
M=Males
VI Construction VII Trade and Commerce VIII Transport, Storage and Communieations IX Other Services
F=Females
DISTRICT
000 Total VI(M2) VII(MI). Urban VI(M2) VII(MI); 002 Total VIII(M6). Urban VIII(M6); 003 Total VUI(M2) IX(Mll). Urban VIII(M2) IX(Mll); 004 Total VIU(Ml). Urban VIII(M2); 006 Total UI(M2). Urban III(M2); 009 Total III(MI). Urban III(Ml); 010 Total VII(Ml) VIII(M2), Urban VII(MJ) VIII(M2); 012 Total IX(M6); 014 Total III(MI). Urban III(MI); 019 Total IX(F2). Urban IX(F2); 021 Total IX(M17). Urban IX(M15); 032 Total IX(M23.F2). Urban IX(MIO.Fl); 033 Total IX(MI), Urban IX(M I); 039 Total IX(M12); 041 Total lX(F2S), Urban lX(F20); 044 Total IX(M16). Urban IX(MI6); 045 Total IX(Ml); 049 Total IX(MI); 053 Total IX(Ml.F2). Urban IX(F2); 069 Total IX(M36.Fl). Urban IX(M36.Fl); 070 Total IX(Mll). Urban IX(Mll); 076 Total IX(M12), Urban IX(M3); 078 Total lX(MI4.Fl). Urban IX(M3); 079 Total IX(M5.Fl). Urban IX(MS.Fl); 080 Total IX(M22). Urban IX(M22); 081 Total IX(MI4). Urban IX(MI4); 083 Total IX(MJ); 087 Total IX(F4). Urban IX(F4); 091 Total IX(M2.F2), Urban IX(M2.F2); 099 Total VIII(M24) IX(M6), Urban VUI(M24) IX(M6). OXl Total IX(M29.F5). Urban IX(M29,F5); OX3 Total IX(MIO.F3). Urban IX(M16,F3); OX9 Total IX(MI); 109 Total IX(M3). Urban lX{M2); 121 Total VII(M2). Urban VII(M2); 129 Total VII{M5). Urban VII(Ml); 130 Total I1I(M6). Urban IlI(M4); 132 Total IX(MI). Urban IX(MI); 202 Total VIII(M6) IX(M4), Urban VIII(Ml) ]X{M4); 210 Total I1I(M4) VI(M2) VIII(M22) IX(M22. Fl). Urban III(Ml) VI(M2) VIII(M22) IX(MI9); 211 Total III(MI) VI(M2) IX(MS5.Fl). Urban III(Mt) VI(M2) IX(M53.Fl); 220 Total VII(MIO) IX(M3). Urban VII(MIO) IX(M3); 229 Total VII(M6) IX(M6). Urban VII(M6) IX(M2); 310 Total VU(M21, F2) IX(MI2), Urb&n VII(M15.F2); 311 Total VII(M24,Fl), Urban VII(M24.Fl); 313 Total VII(M2.F13) lX(Ml). Urban VlI(M2. FI3); 320 Total V(MI). Urban V(Ml); 329 Total VII(M38); 339 Total VII(Ml) VIII(MS). Urban VIII(MS); 341 Total VII(M3), Urban VU(M3); 402 Total III(M2). Urban III(M2); 404 Total UI(M7. FI) IV(MI6,F6). Urban III(M7.Fl) IV(MI6,F6); 410 Total IH(MI) V(Ml), Urban V(Ml); 412 Total IIl(MSl,Fl) IV(M4) V(MI,Fl) VI(M6) VIII(M21) IX(M85,Fl). Urban I11(M20) IV(M4) V(MI.Fl) VI(M6) VlII(MI2) IX(M82,FI); 419 Total III(M2) IV(M61) V(M5) IX(MIO). Urban III(M2) V(M5) IX(MI0); 420 Total Ill(M2); 421 Total IlI(M4). Urban III(M4); 441 Total IIl(M30); 442 TotalIII(M2) VII(M92). Urban lIl(MI); 449 Total VII(Ml); 611 Total VIII(MIO). Urban VIII(MlO); 642 Total VIII(M2); 650 Total VIIl(M2,F2). Urban VIII(Ml.F2); 652 Total
VIlI{MI). Urban VIII(Ml); 661 Total VIII(Ml); 679 Total VIlI(M24), Urban VIII(M24); 681 Total VIII(MI6). Urban VIII(M8); 691 Total VIII(M26), Urban VIII(M22); 694 Total VIII(M8). Urban VIII(M6); 701 Total IV(Ml); 707 Total IV(F2); 708 Total IV(Ml); 71S Total IV(MI.F2S) V(F4). Urban V(F4); 722 Total IV(MI6); 731 Total VIII(Ml): 734 Total VIII(M2); 739 Total VlII(MI9). Urban VIII(M19); 740 Total IV(M6) V(M46). Urban IV(M6) V(M46); 754 Total IV(M50.FI4), Urban IV(M40.F12); 755 Total VlII(M12) IX(M3). Urban VIII(M11) IX(M3); 756 Total IlI(Ml) VIII(M24) IX(M54,FI). Urban VIII(M24) IX(M54.Fl); 757 Total IV(M6) Urban IV(M6): 759 Total IV(M7) VIlI(MI3). Urban IV(M7) VIIl(M13); 762 Total IV(M2). Urban IV(M2); 764 Total I1I(M4) V(M7) VI(MI) VIIIIM2) lX(M39). Urban V(M7) VI(Ml) IX(M39); 769 Total V(M41 VI(M6) VIlI(M23) IX(M2I,Pl). Urban V(M4) VI(M6) VlIl(M23) lX(M21.FI); 773 Total VIlI(M7). Urban VIII(M7); 774 Total IVlM3); 779 TotaIIV(MI6) V(M3); 790 Total IV(MI) V(MS4) VI(Ml). Urban IV(Ml) V(MS4); 800 Total V(MJ), Urban V(MJ); 801 Total V(M6S). Urban V(M6S}; 803 Total V(M38.Fl)" Urban V(M28,F2); H04 Total IV(M2.F7) V(MI). Urban IV(MI. F7) V(Ml); 805 Total V(Ml); 808 Total IV(M2). Urban IV(M2); 809 Total V(M20.F4) IX(M12). Urban V(M20.F4); 810 Total IV(M14) V(M2): 814 Total1V(Ml); 819 Total IV(M2) V(M12). Urban IV(M I) V(M12); 825 Total VII(M2); 827 Total VII(M4. F2), Urban VU(M4.F2); 829 Total IV(Ml) V(MS). Urban IV(Ml) V(M5); 831 Total IV(M26) V(MI7). Urban IV(M23) V(MI7); 834 Total IV(Mll). Urban (V(MIl); 849 Total IV(Ml): 850 Total IV(M3S.F21) V(M17.Fl), Urban V(MI7.Fl); 851. Total IV(M6). Urban JV(M6); 853 Total IV(MI) VII(F13); 855 Total IV(MI). Urban IV(MI); 856 Total IV(M9,F4). Urban IV(M9.F4); 859 Total IV(M46.F13) V(M51.F3). Urban IV(M41.F12) V(M51. F3); 860 Total VII(MI6). Urban VII(MI6): 871 Total lII(M3) VI(M4) VIII(M29). Urban VI(M4) VIlI(M29): 872 Total IlI(M2); 876 Total VIIl(M8) IX(Ml). Urban VIII(M5); 819 Total VIIl(M3). Urban VIII(M3); 900 Total VIII(M2) IX(M 14). Urban IX(M4); 910 Total IX(MI0.F2). Urban IX(MS.FI); 913 Total IX(M3.F5). Urban IX(M3,F5); 919 Total IX(M29.F3). Urban IX(M3); 930 Total IX(M6); 951 Total IX(M4,F1). Urban lX(M4,Fl); 960 Total IX(M7). Urban IX(M7); 979 Total IX(M21). Urban IX(M21); 990 Total IX(MI), Urban IX(M21); 999 Total IX(M36) .. Urban IX(M36).
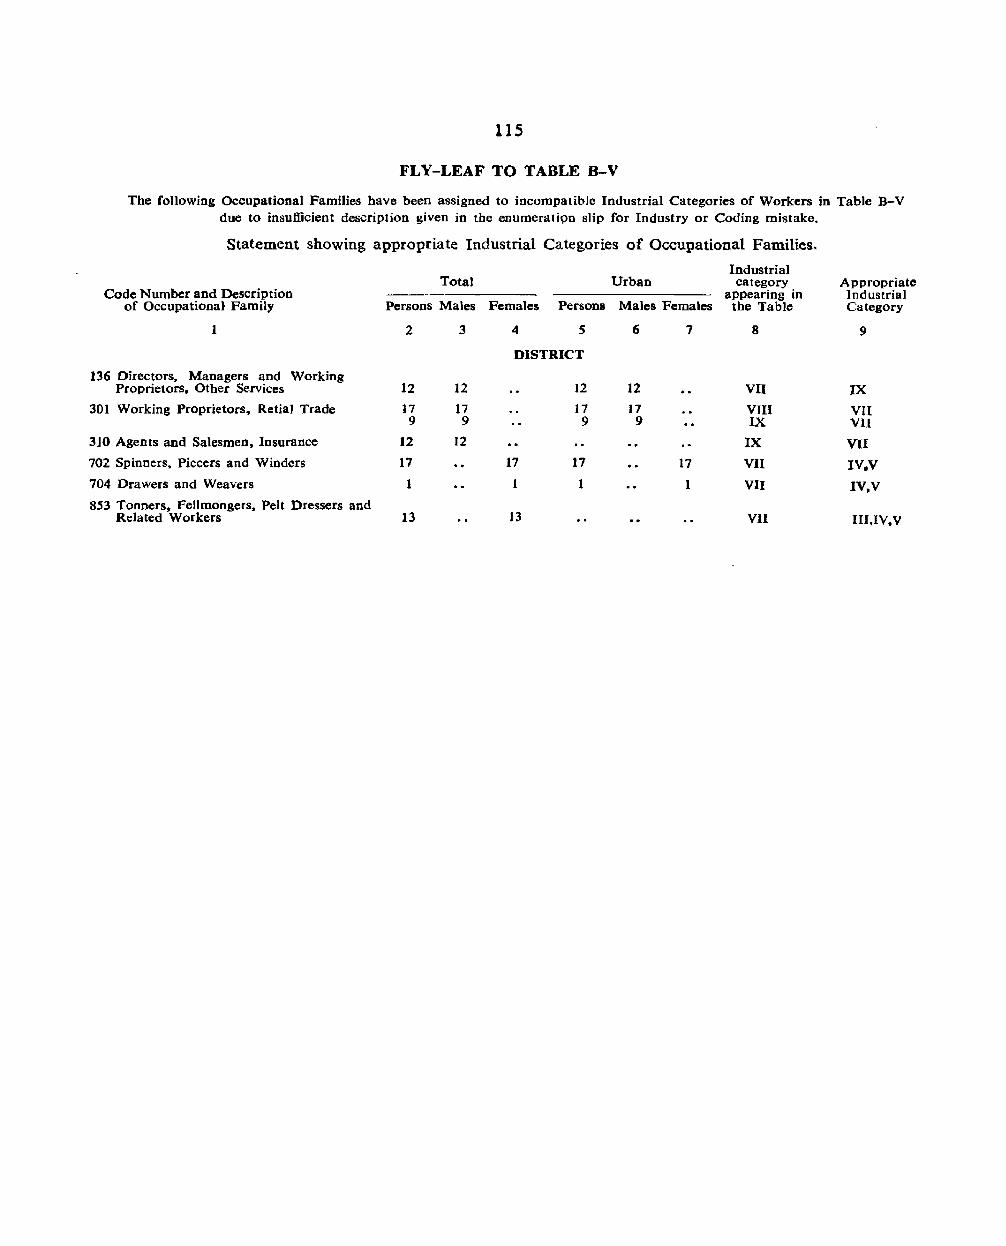
115
FLY-LEAF TO TABLE B-V
The following Occupational Families have been assigned to incompatible Industrial Categories of Workers in Table B-V due to insufficient description given in the enumeratipn slip for Industry or Coding mistake.
Statement showing appropriate Industrial Categories of Occupational Families.
Industrial Total Urban category Appropriate
Code Number and Description appearing in Industrial of Occupational Family Persons Males Females Persons Males Females the Table Category
1 2 3 4 5 6 7 8 9
DISTRICT
136 Directors. Managers and Working Proprietors, Other Services 12 12 12 12 VII IX
301 Working Proprietors. Retial Trade 17 17 17 17 VIII VII 9 9 9 9 IX VII
3JO Agents and Salesmen, Insurance 12 12 IX VII 702 Spinners, Piecers and Winders 17 17 17 17 VII IV.V
704 Drawers and Weavers 1 1 1 VII IV.V
853 Tonners, Fellmongers. Pelt Dressers and Related Workers 13 13 VII III.IV. V
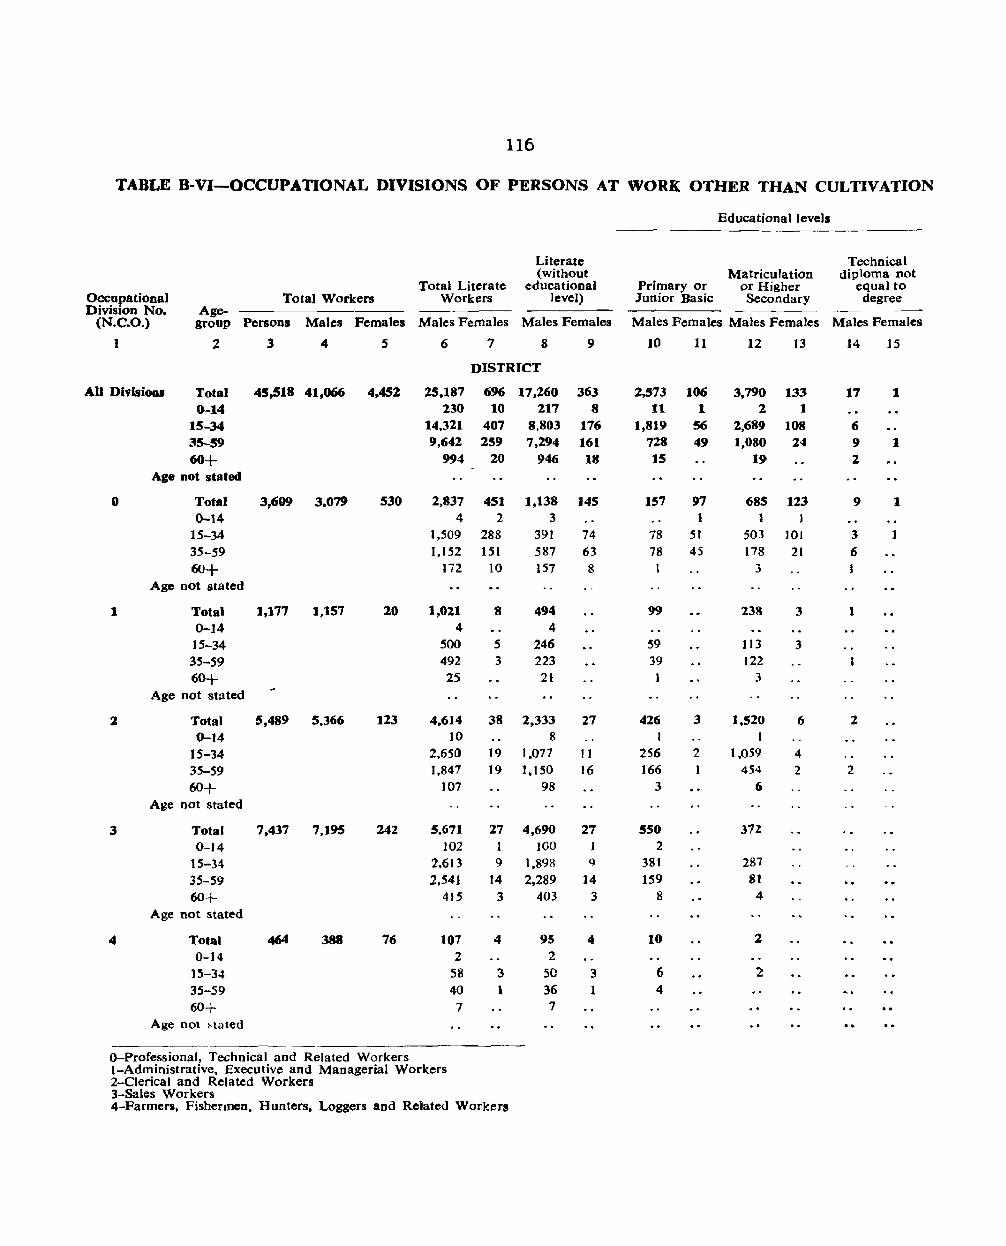
116
TABLE 8-VI-OCCUPATIONAL DIVISIONS OF PERSONS AT WORK OTHER THAN CULTIVATION
Educational levels
Literate Technical (without Matriculation diploma not
Total Literate educational Primary or or Higher equal to Occupational Total Workers Workers level) Junior Basic Secondary degree Division No. Age-
(N.C.O.) group Persons Males Females Males Females Males Females MaJes Females Males Females Males Females
I 2 3 4 5 6 7 8 9 )0 II 12 13 14 15
DISTRICT
All DiYisiODJ Total 45,518 41,066 4.452 25,187 696 17,260 363 2,573 106 3,790 133 17 1 0-14 230 10 217 8 11 1 2 1
15-34 14,321 407 8,803 176 1.819 56 2,689 108 6 35-59 9,642 259 7,294 161 728 49 1,080 24 9 1
60+ 994 20 946 18 15 19 2 Age not stated
0 Total 3,609 3.079 530 2,837 451 1,138 145 157 97 685 123 9 1 0-14 4 2 3 I )
IS-34 1,509 288 391 74 78 51 503 101 3 1
3S-S9 ],152 lSI 587 63 78 45 178 21 6
60+ 172. 10 151 & 3 Age not stated
1 Total 1,177 1,157 20 1,021 8 494 99 238 3 1 0-14 4 4 IS-34 SOD S 246 S9 1I3 3 3S-59 492 3 223 39 122
60+ 25 21 3
Age not stated
::z Total 5,489 5,366 113 4.614 38 2,333 27 426 3 1,520 6 2 0-14 ]0 8 1 I
15-34 2,650 19 1.077 1 t 256 2 1,059 4
3S-59 ],847 ]9 1,150 16 166 454 2 2
60+ 101 98 3 6
Age not stated
3 Total 7,437 7,195 24Z 5,671 27 4,690 27 550 37Z 0-14 ]02 100 2
15-34 2,613 9 1.89R l) 381 287 35-59 2,S41 14 2.289 14 159 81
60+ 415 3 403 3 8 4 Age not stated
4 Total 464 388 76 101 4 9S 4 10 2 0-14 2 2
15-34 58 3 50 3 6 2
35-59 40 1 36 1 4 .,. 60+ 7 7
Age not :-tuted
O-Professional, Technical and Related Workers I-Administrative, Executive and Managerial Workers 2-Clerical and Related Workers 3-Sales Workers 4-Farmers. Fishermen. Hunters, Loggers and Related Workers
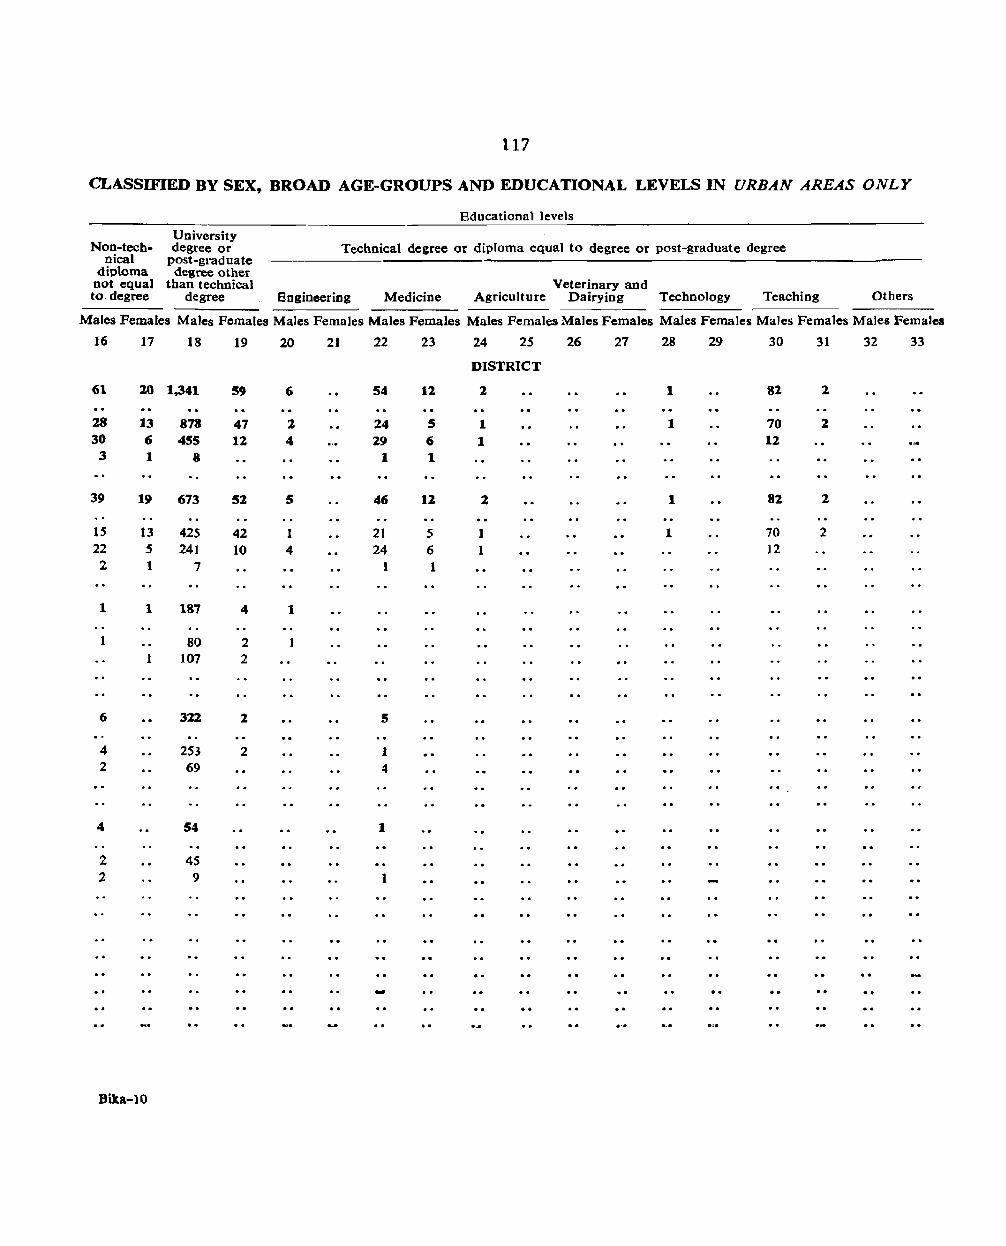
117
CLASSIFIED BY SEX, BROAD AGE-GROUPS AND EDUCATIONAL LEVELS IN URBAN AREAS ONLY
Educational levels
Non-tech-University degree or Technical degree or diploma equal to degree or post-graduate degree
nical post-graduate diploma degree other
not equal than technical Veterinary and to. degree degree Engineering Medicine Agriculture Dairying Technology Teaching Others
Males Females Males Females Males Females Males Females Males Females Males Females Males Females Males Females Males Females
16
61
28 30
3
39
15 22
2
1
1
6
4 2
4
2 2
17
20
13 6 1
19
13 5 1
1
1
Bika-lO
18
1,341
878 4SS
8
673
425 241
7
187
80 107
322
253 69
S4
45 9
..
19 20 21
59 6
47 2 12 4
52 5
42 I 10 4
4 1
2 2
2
2
22
54
24 29
1
46
21 24
I
5
1 4
1
1
-
23 24 25
DISTRICT
11 2
5 1 6 1 1
11 2
5 1 6 1 1
. ...
26 27 28 29 30 31 32 33
1 82 2
1 70 2 12
1 82 2
1 70 2 12
..
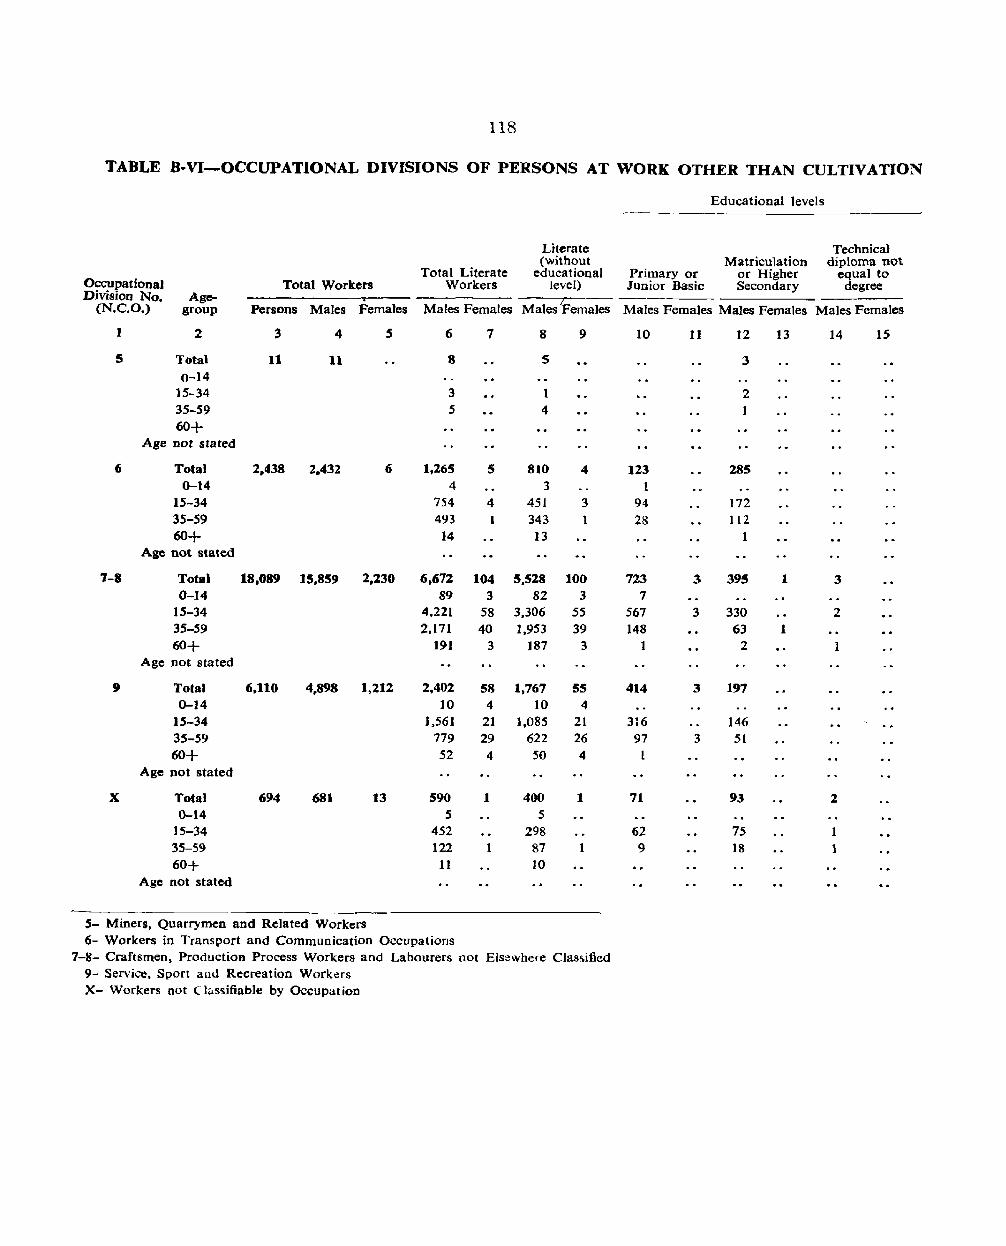
118
TABLE 8-Vl-OCCUPATIONAL DIVISIONS OF PERSONS AT WORK OTHER THAN CULTIVATION
Educational levels
Literate Technical (without Matriculation diploma not
Total Literate educational Primary or or Higher equal to Occupational Total Workers Workers level) Junior Basic Secondary degree Division No. Age-
Males Females (N.C.O.) group Persons Males Females Males Females Males Females Males Females Males Females
I 2 3 4 S 6 7 8 9 10 11 12 13 14 15
5 Total 11 11 8 5 3 0-14 ..
15-34 3 1 2 35-59 5 4
60+ Age Dot stated
(; Total 2.438 2.432 6 1,265 5 810 4 123 285 0-14 4 3 1
15-34 754 4 451 3 94 172 35-59 493 343 1 28 112 60+ 14 13 1
Age not stated
7-8 Total 18.089 15,859 2.230 6.672 104 5,528 100 723 3 395 1 3 0-14 89 3 82 3 7
15-34 4.221 58 3,306 55 567 3 330 2 35-59 2,171 40 1,953 39 148 63 1 60+ 191 3 187 3 1 2 1
Age not stated , Total 6.110 4,898 1.212 2,402 58 1,767 55 414 3 197 0-14 10 4 10 4
15-34 J ,561 21 ],085 21 316 146 35-59 779 29 622 26 97 3 51 60+ 52 4 50 4 1
Age not stated
X Total 694 681 13 590 1 400 1 71 93 2 0-14 5 5
15-34 452 298 62 75 1 35-59 122 1 87 1 9 18 1 60+ 11 10
Age not stated
5- Miners, Quarrymen and Related Workers 6- Workers in Transport and Communication Occupations
7-8- Craftsmen, Production Process Workers and Labourers not Elsewhere Classified 9- Service, Sport and Recreation Work<!rs X- Workers not Ch .. ssifiable by Occupation
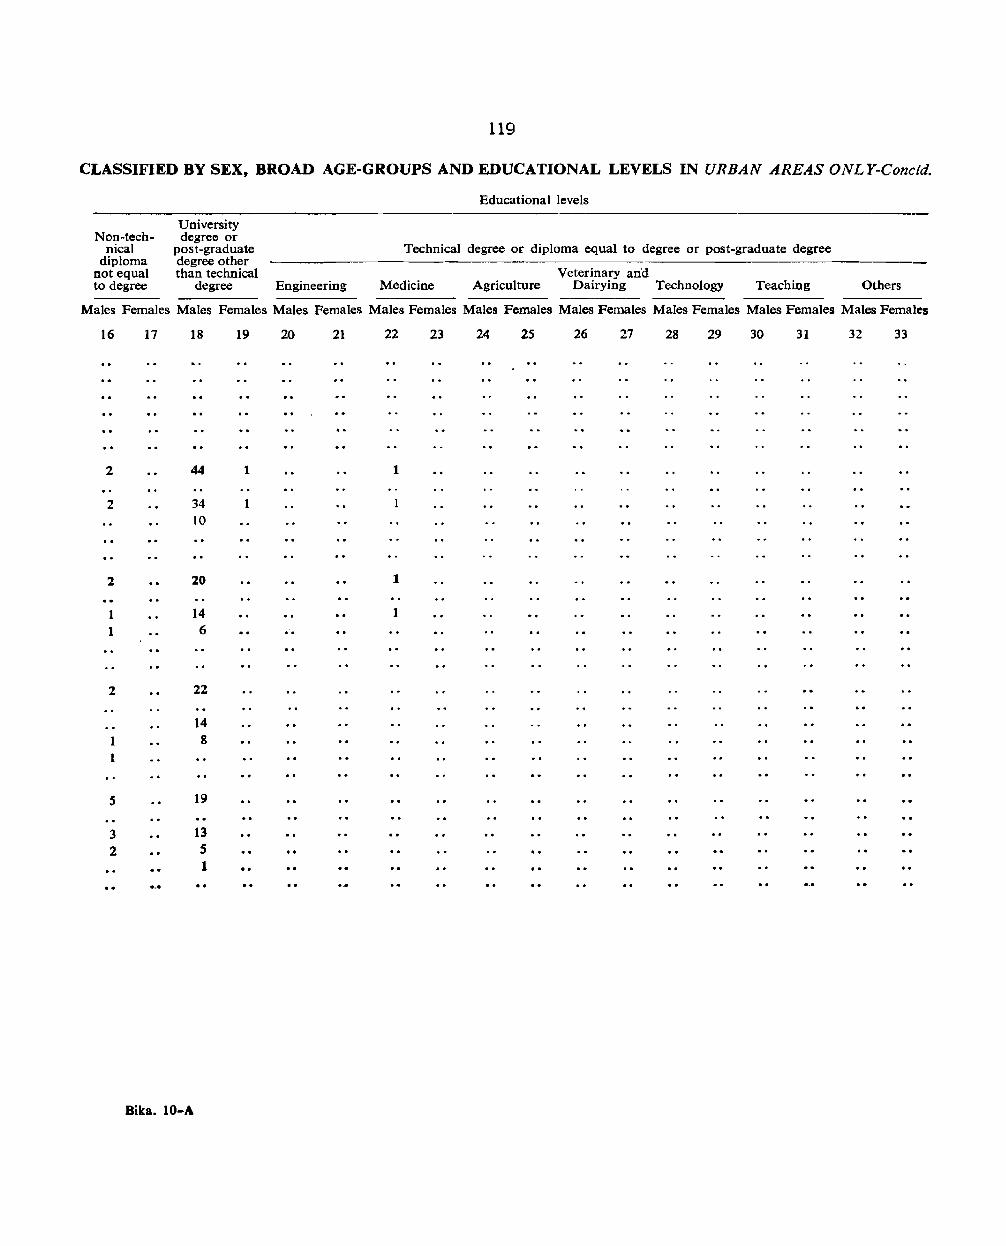
119
CLASSIFIED BY SEX, BROAD AGE-GROUPS AND EDUCATIONAL LEVELS IN URBAN AREAS ONLY-Concld.
Non-technical
diploma not equal to degree
University degree or
post-graduate degree other than technical
degree Engineering
Educational levels
Technical degree or diploma equal to degree or post-graduate degree
Veterinary ana Medicine Agriculture Dairying Technology Teaching Others
Males Females Males Females Males Females Males Females Males Females Males Females Males Females Males Females Males Females
16
2
2
2
1 1
2
1 1
5
3 2
17 18
44
34 10
20
14 6
22
14 8
19
13 5 1
Bika. lO-A
19 20 21 22 23 24 25 26 27 28 29 30 31 32 33
1 I
1
1
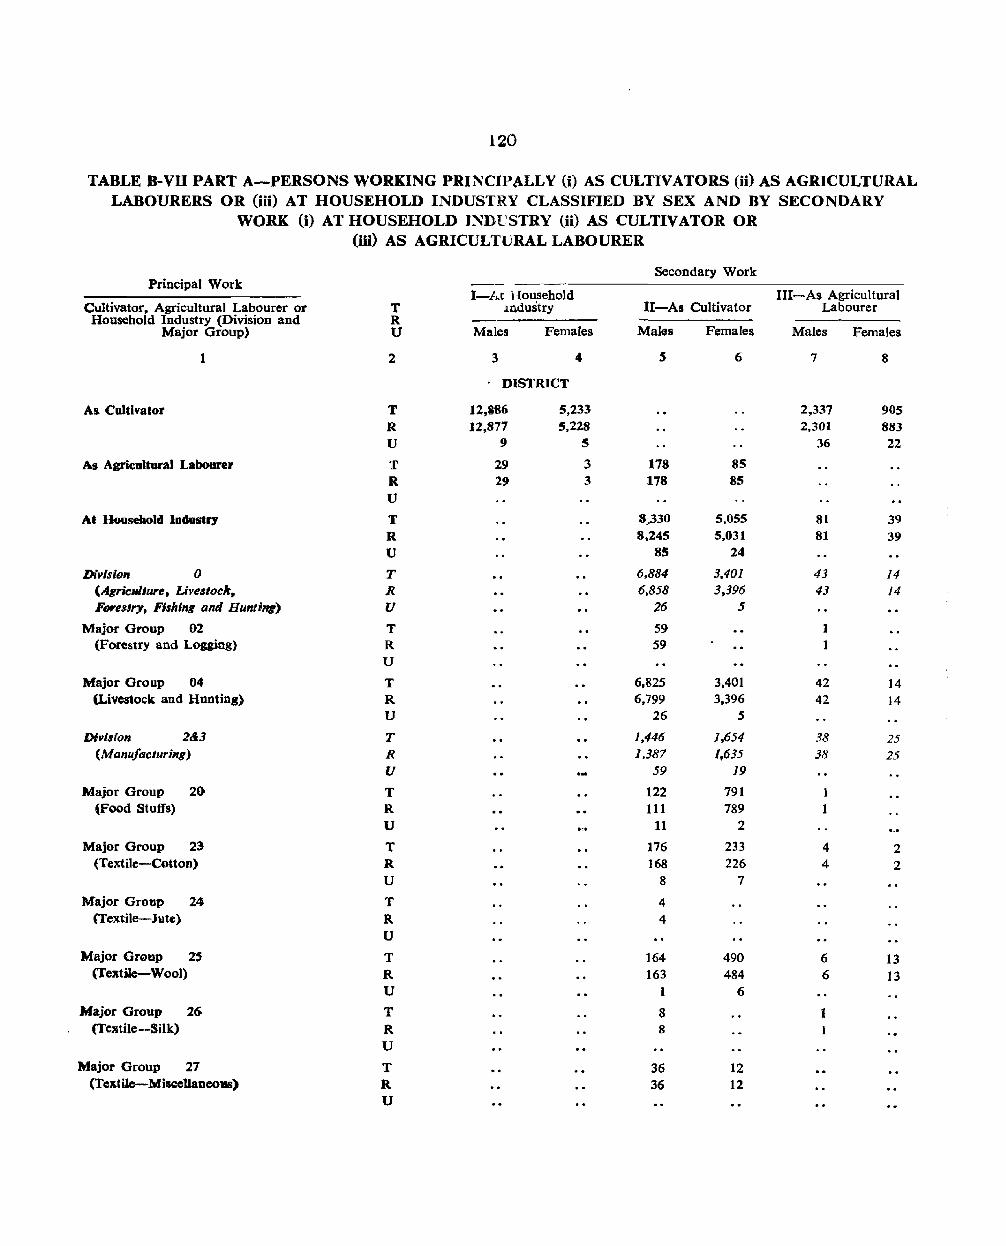
120
TABLE B-VII PART A-PERSONS WORKING PRINCIP(\LLY (i) AS CULTIVATORS (ii) AS AGRICULTURAL LABOURERS OR (iii) AT HOUSEHOLD INDUSTRY CLASSIFIED BY SEX AND BY SECONDARY
WORK (i) AT HOUSEHOLD JNDVSTRY (ii) AS CULTIVATOR OR (iii) AS AGRICULTURAL LABOURER
Secondary Work Principal Work
I-At Household III-As Agricultural Cultivator, Agricultural Labourer or T industry II-As Cultivator Labourer
Household Industry (Division and R Major Group) U Males Females Males Females Males Females
1 2 3 4 S 6 7 8
DISTRICT
As Cultivator T 12,386 5,233 2,337 905 R 12.877 5,228 2,301 883
U 9 5 36 22
As Agricultural Labourer T 29 3 178 85 R 29 3 178 85
U
At Housebold Industry T 8,330 5,055 81 39
R 8.245 5,031 81 39
U 85 24
DivisilHl 0 T 6.884 3,401 43 14 (,4gricllllure. Livestock, R 6.858 3,396 43 14 Fonslry, Fishing and Hunti.) U 26 5
Major Group 02 T 59 1 (Forestry and Logging) R 59 1
U
Major Group 04 T 6,825 3,401 42 14 (Livestock and Hunting) R 6,799 3,396 42 14
U 26 5
DWision 2&.3 T 1.446 1,654 38 25 (Manuj{lcluring) R 1,387 1,635 38 25
U 59 19
Major Group 20 T 122 791 1 ~Food Stuffs) R 111 789 1
U 11 2
Major Group 23 T 176 233 4 2 (Textile-Cotton) R 168 226 4 2
U 8 7
Major Group 24 T 4 (Textile-Jute) R 4
U
Major Group 25 T ]64 490 6 13 (Textile-Wool) R 163 484 6 13
U 1 6
Major Group 26 T 8 1 (Textile--Silk) R 8 1
U
Major Group 27 T 36 ]2 (Tcxtile-Mi.&f:cUaneollS) R 36 12
U
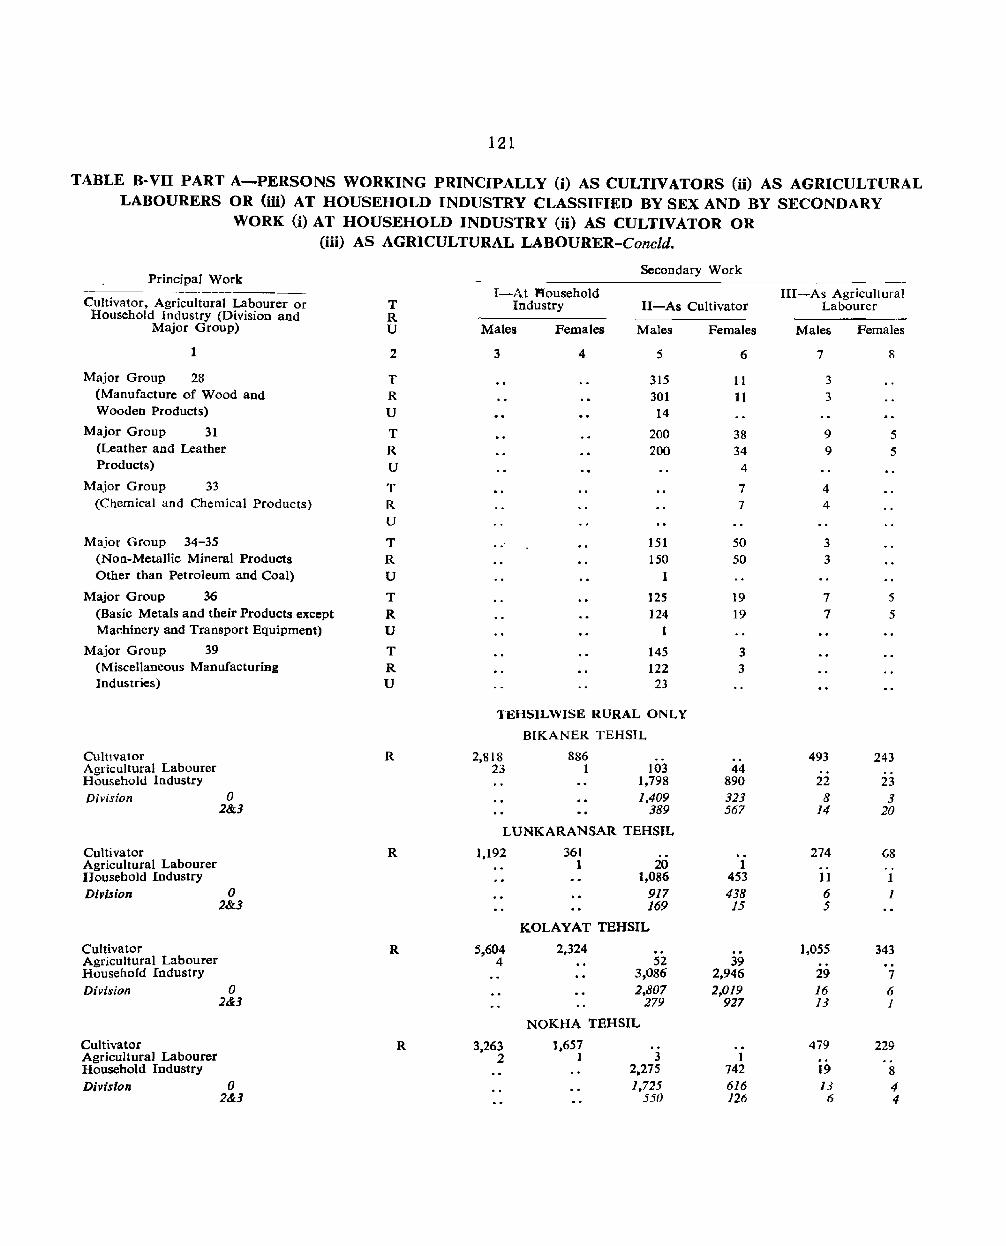
121
TABLE B-VII PART A-PERSONS WORKING PRINCIPALLY 0) AS CULTIVATORS (ii) AS AGRICULTURAL LABOURERS OR (iii) AT HOUSEHOLD INDUSTRY CLASSIFIED BY SEX AND BY SECONDARY
WORK (i) AT HOUSEHOLD INDUSTRY (ii) AS CULTIVATOR OR (iii) AS AGRICULTURAL LABOURER-Concld.
Principal Work
Cultivator. Agricultural Labourer or Household Industry (Division and
Major Group)
1
Major Group 28 (Manufacture of Wood and Wooden Products)
Major Group 31 (Leather and Leather Products)
Major Group 33 (Chemical and Chemical Products)
Major Group 34-35 (Non-Metallic Mineral Products Other than Petroleum and Coal)
Major Group 36 (Basic Metals and their Products except Machinery and Transport Equipment)
Major Group 39 (Miscellaneous Manufacturing Industries)
CultlVator Agricultural Labourer Household Industry Division 0
Cultivator Agricultural Labourer Household Industry
2&3
Division 0
Cultivator Agricultural Labourer Household Industry
2&3
Division 0
Cultivator Agricultural Labourer Household Industry
2&3
Division 0 2&3
T R U
2
T R U
T R
U
T R U
T R U
T R U
T R U
R
R
R
R
Secondary Work
I-At lIousehold Industry II-As Cultivator
Males Females
3 4
Males
5
315 301 14
200 200
151 150
1
125 124
1
145 122
23
TEHSILWISE RURAL ONLY
BIKANER TEHSIL
2,818 23
886 1 103
1,798 1,409
389
LUNKARANSAR TEHSIL
1,192 361 1 20
1,086 917 169
KOLAYAT TEHSIL
5,604 2,324 4 52
3,263 2
3,086 2.807
279
NOKHA TEHSIL
1,657 1 3
2.275 1.725
550
Females
6
11 11
38 34
4
7 7
50 50
19 19
3 3
44 890 323 567
1 453 438 15
39 2,946 2,019
927
]
742 616 126
III-As Agricultural Labourer
Males
7
3
3
9 9
4 4
3 3
7 7
493
22 8
14
274
11 6 5
1.055
29 16 13
479
19 13
6
Females
8
5 5
5 5
243
23 3
20
(,8
1 1
343
7 6 1
229
8
4 4
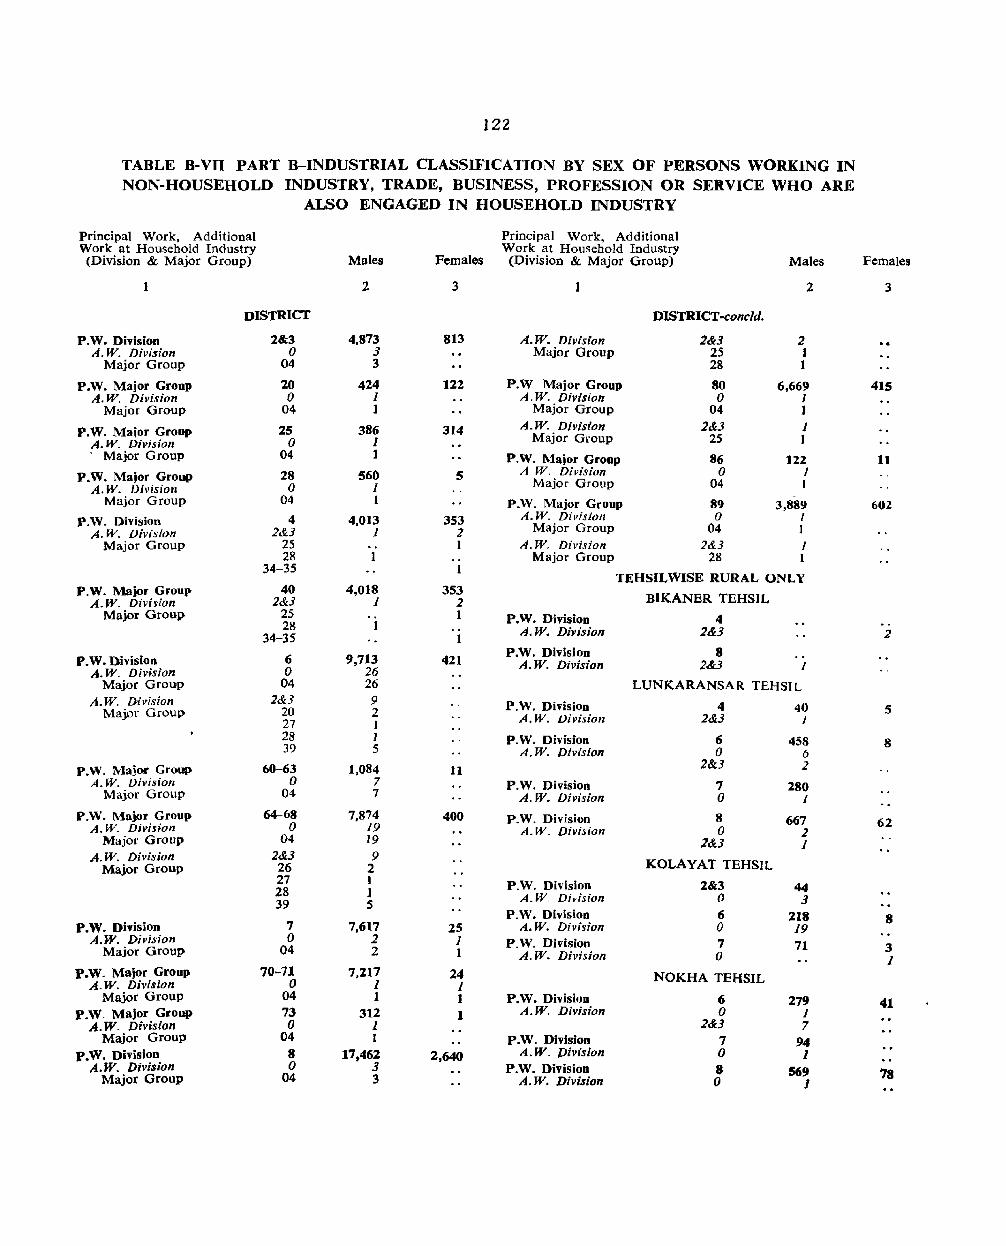
122
TABLE B-Vn PART B-INDUSTRIAL CLASSIFICATION BY SEX OF PERSONS WORKING IN NON-HOUSEHOLD INDUSTRY, TRADE, BUSINESS, PROFESSION OR SERVICE WHO ARE
ALSO ENGAGED IN HOUSEHOLD INDUSTRY
Principal Work, Additional Work at Household Industry
(Division & Major Group)
1
P.W. Division
DISTRICT
2&3 A. W. Division
Major Group
P.W. Major Group A. W. Division
Major Group
P.W. Major Group A. W. Division
Major Group
P.W. Major Group A. W. Division
Major Group
P.W. Division A. W. Division
Major Group
P. W. Major Group A.W. Diviyion
Major Group
P.W. Division A. W. Division
Major Group A. W. Division
Major Group
P. W. Major Group A. W. Division
Major Group
P.W. Major Group A. W. Division
Major Group A. W. Division
Major Group
P. W. Dil'ision A.W. Division
Major Group
P.W. Major Group A. W. Division
Major Group P.W. Major Group
A. W. Division Major Group
P.W. Division A.W. Division
Major Group
o 04
20 o
04
25 o
04
28 o
04
4 2&3
25 28
34-35
40 2&3
25 28
34-35
6 o
04 2&3
20 27 28 39
60-63 o
04
64-68 o
04 2&3 26 27 28 39
7 o
04
70-71 o
04 73 o
04 8 o
04
Males
2
4,873 3 3
424 1 1
386 I 1
560 1 1
4,013 1
1
4,018 1
1
9,713 26 26 9 2 1 1 5
1,084 7 7
7,874 19 19
9 2 1 1 5
7,617 2 2
7,217 1 1
312 1 1
17.462 3 3
Principal Work, Additional Work at Household Industry
Females (Division & Major Group) Males
3 1 2
813
122
314
5
353 2 1
1
353 2 1
1
421
11
400
25 1 1
24 1 1 1
2,640
A. W. Division Major Group
P.W Major Group A. W. Division
Major Group A.W. Division
Major Group
P.W. Major Group A W. Division
Major Group
P.W. Major Group A. W. Division
Major Group
DISTRICT-cone/d.
2&3 25 28
80 o
04 2&3
25
86 o
04
89 o
04
2 I 1
6,669 1 1 1 1
122 1 1
-3,889
I 1
A. W. Division 2&3 I Major Group 28 1
TEHSILWISE RURAL ONLY
BIKANER TEHSIL
P.W. Division 4 A. W. Division 2&3
P.W. Division 8 A. W. Division 2&3 1
P.W. Division A. W. Division
P. W. Division A. W. Division
P.W. Division A. W. Division
P.W. Division A.W. Division
P.W. Division A. W. Division
P.W. Division A. W. Division
P.W. Divisi()n A. W. Division
P.W. Division A. W. Division
P. W. Division A. W. Division
P.W. Division A. W. Division
LUNKARANSAR TEHSIL
4 2&3
6 o
2&3
7 o 8 o
2&3
KOLAYAT TEHSIL
2&3 (1
6 o 7 o
NOKHA TEHSIL
6 o
2&3 7 o 8 o
40 1
458 6 2
280 J
667 2 1
44 3
218 19 71
279 1 7
94 1
569 1
Females
3
415
11
602
2
5
8
62
8
3 1
41
78

123
TABLE B-VIII PART A-PERSONS UNEMPLOYED AGED 15 AND ABOVE BY SEX, BROAD AGEGROUPS AND EDUCATIONAL LEVEL~ IN URBAN AREAS ONLY
. Seeking employment for the first time ------------------
Age-groups
Total 15-19 20-24 25-29 30-34 Sl. No. Educational levels
'I
Total unemployed
P
2
M
3
F
4
M F M F M F M F M F
1 2 3
4 5
6
7
8
9
i ii iii iv v
vi vii
SI. No.
1 2 3
4 5 6 7 8
9 1
ii iii iv v
vi vii
Total Illiterate Literate (without educational level) Primary or Junior Basic Matriculation or Higher Secondary Technical diploma not equal to degree Non-technical diploma not equal to degree University degree or post-graduate degree other than Technical degree Technical degree or diploma equal to degree or post-graduate degree Engineering Medicine Agriculture Veterinary & Dairying Technology Teaching Others
Seeking employment for the first time-conc1d.
713 203
371 82
53
693 191
368 80
50
I 1
3 3
5 6
20 265 12 77
3 123 2 38
3 26
1
DISTRICT
11 6
2
3
7 8
99 31
46 11
II
1
1
9 10
54 16
25 4
9
1
1
11 12
26
8
13 2
2
1
13 14
17 4
9 3
1
1
1
Persons employed before but now out of employment and seeking work -----------------
Age-groups Age-groups ---' -------------- ---- ---~-.--------
Age not stated Total 15-19 20-24 25-34 35-44 45-59 60+ Age not stated
M F M F M F M F M F M F M F M F M F M F
15 16 17 18 19 20 21 22 23 24 25 26 27 28 29 30 31 32 33 34
69 8 428 9 56 100 77 2 75 77 1 43 5 18 6 114 6 19 25 10 25 16 19 5
30 245 3 14 51 53 2 44 60 23 18 2 42 15 14 8 3 1
3 2.t 8 9 .5- 2 1
2


125
TABLE B-VIII PART B-PERSONS UNEMPLOYED AGED 15 AND ABOVE BY SEX AND EDUCATIONAL LEVELS IN RURAL AREAS ONLY
unemployeds by educational levels ------~~--
Literate (without Primary or Matriculation Total unemployed Illiterate educational level) Junior Basic and above
-------District/Tehsil P M F P M F P M F P M F P M F
1 2 3 4 5 6 7 8 9 10 11 12 13 14 15 16
DISTRICT 25 24 1 15 12 1 8 8 3 3 1 1
Bikaner Tehsil 20 19 1 11 10 1 6 6 2 2 1 I Lukaransar Tehsil :3 3 2 2 I 1 Kolayat Tehsil 2 2 1 1 1 Nokha Tehsil
Bika-ll
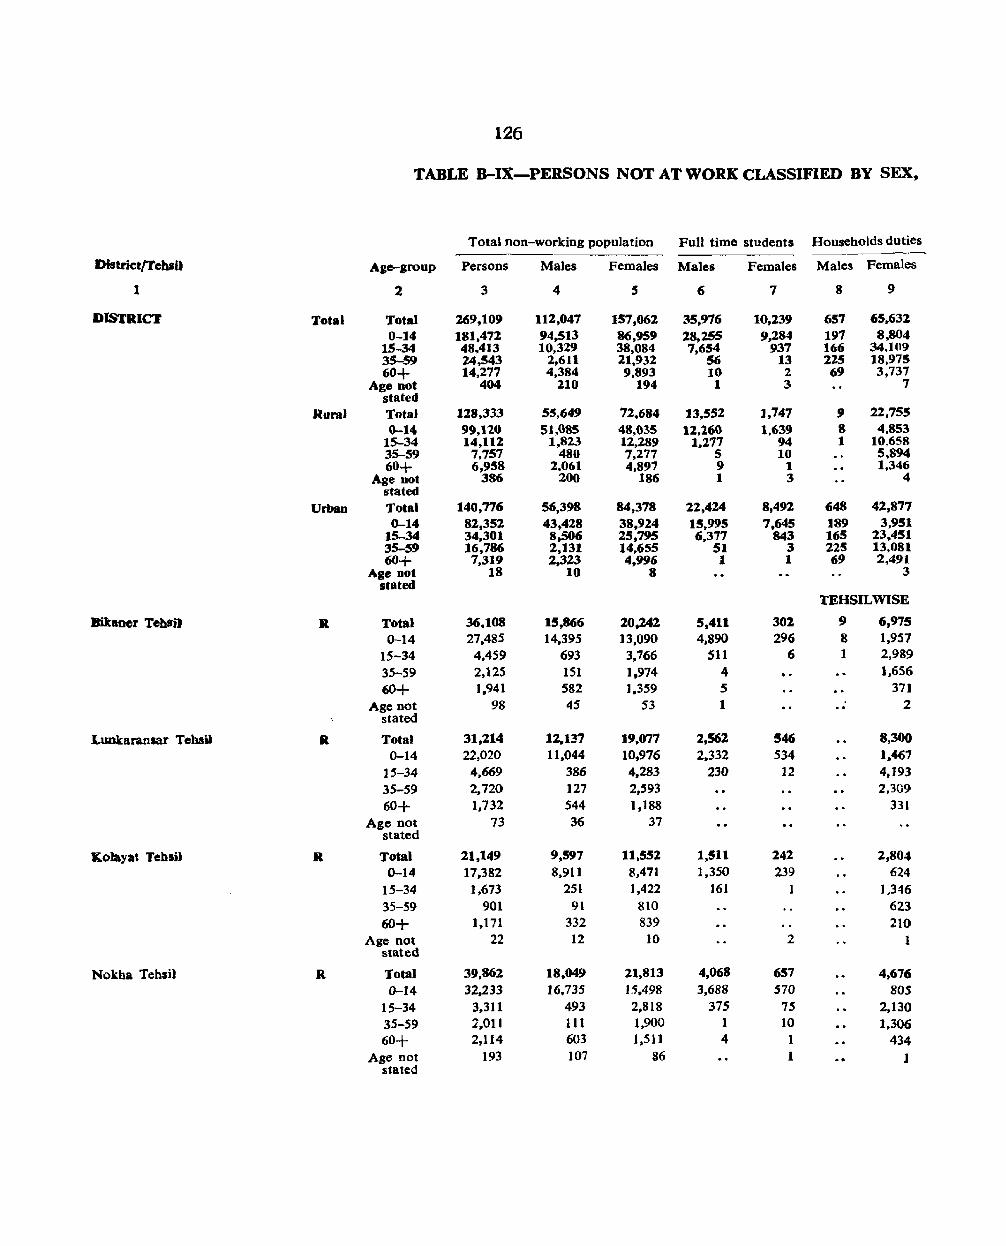
126
TABLE B-IX-PERSONS NOT AT WORK CLASSIFIED BY SEX,
Total non-working population Full time students Households duties
District/TebsU Age-group Persons Males Females Males Females Males Females
I 2 3 4 S 6 7 8 9
DISTRICT Tota' Total 269,109 11%,047 157,062 35.976 10,239 657 65,631
0-14 181,472 94,513 86,959 28,255 9,284 197 8,804 15-34 48,413 10,329 38,084 7,654 937 166 34.109 35-59 24,543 l,6U 21,932 S6 13 225 18,975 60+ 14,277 4,384 9,893 10 2 69 3.737
Age not 404 :nO 194 1 3 7 stated
Rural Total 128,333 55,649 72.684 13.552 ],747 9 22.755
0-14 99,120 51,G85 48,G35 12,260 1.639 8 4.853 15-34 14,112 1,823 12,289 1.277 94 1 10,658 35-59 7.757 480 7.277 5 10 5,894 60+ 6,958 2.061 4,897 9 1 1.346
Age not 386 200 186 1 3 4 stated
Urban 1'otal 140,776 56,398 84,378 22,424 8,492 648 42,877 0-14 82,352 43,428 38,924 15,995 7.645 189 3.951
15-34 34,301 8,506 25,795 6,377 843 165 23,451 35-59 16.786 2.131 14.655 51 3 225 13,081 60+ 7.319 2,323 4.996 1 1 69 2,491
Age Dot 18 10 8 3 stated
TEHSILWlSE
Bikaner TehS'r'l R Total 36,108 15,866 20,242 5,411 302 9 6,975
0-14 27.485 14,395 13.090 4,890 296 8 1.957 15-34 4.459 693 3.766 511 6 1 2,989
35-59 2.12S lSI 1,974 4 1,656
60+ 1.941 582 1.359 5 371
Age not stated
98 4S 53 1 .. 2
Lunkaransar Tehsat R Total 31,214 12.137 19.071 2,562 546 8.300 0-14 22,020 11.044 10,976 2.332 534 1.467
15-34 4.669 386 4,283 230 12 4.J93 35-59 2,720 127 2,593 2,309
60+ 1,732 544 1,188 331
Age not stated
73 36 37
Kolayat Tebait R Total 21,149 9,597 11,552 1,511 242 2,804 0-14 17.382 8,911 8,471 1.350 239 624
15-34 1,673 251 1,422 161 1 1,346 35-59 901 91 810 623
60+ ].171 332 839 210 Age not 22 12 10 2 1
stated
Nokha TehsH R Total 39,862 18,049 21.813 4,068 657 4,676 0-14 32,233 16.735 15.498 3,688 570 80S
15-34 3,311 493 2.818 375 75 2,130 35-59 2.011 111 1.900 1 10 1.306 60+ 2,114 603 1,511 4 1 434
Age not 193 107 86 1 1 stated
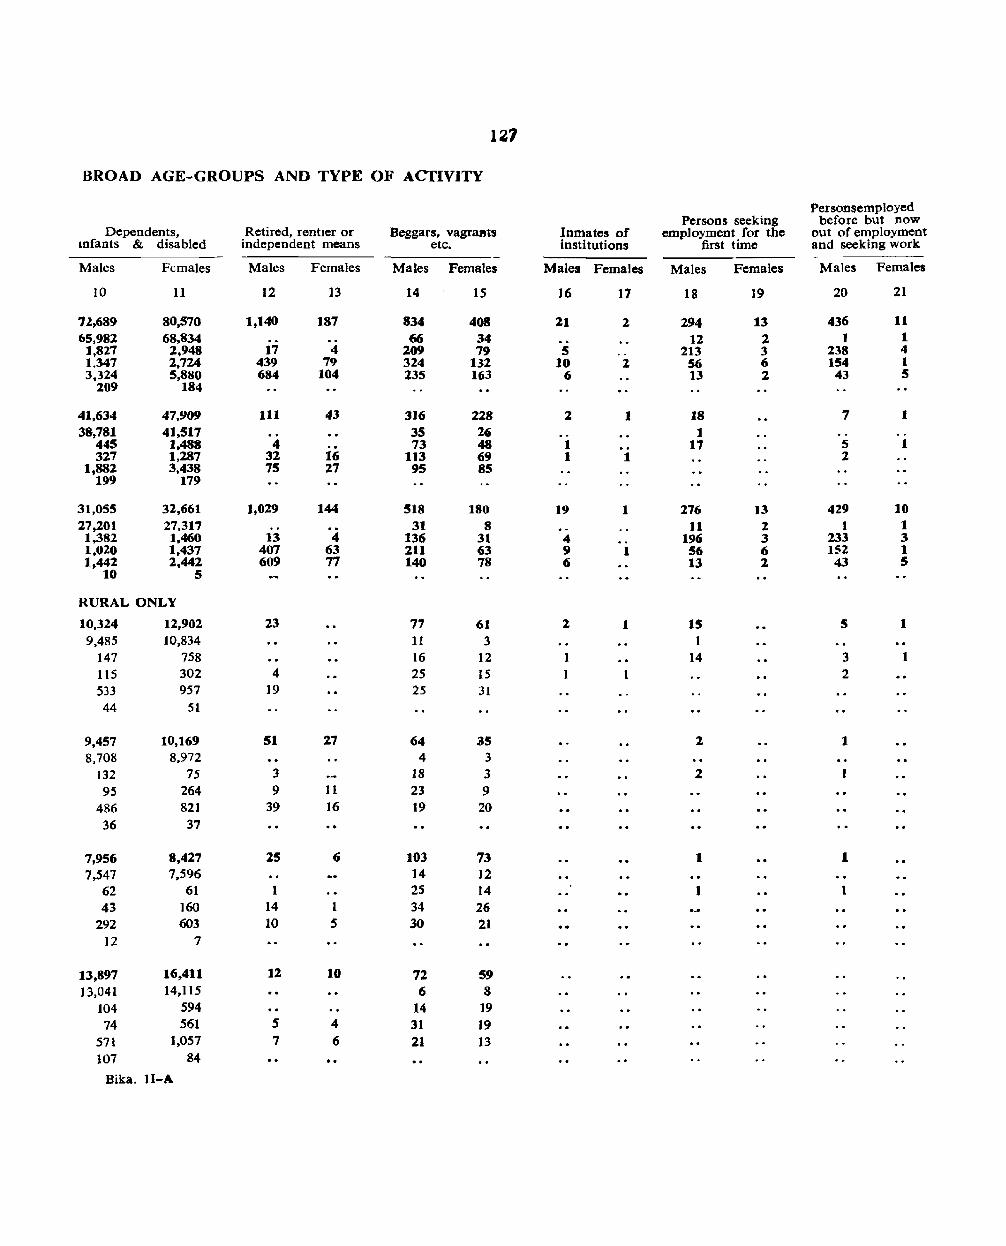
lz7
BROAD AGE-GROUPS AND TYPE OF ACTIVITY
Personsemployed Persons seeking before but now
Dependents. Retired. rentter or Beggars, vagraBts Inmates of employment for the out of employment lOfants & disabled independent means etc. insti tuti ons first time and seeking work
Males Females Males Females Males Females Males Females Males Females Males Females
10 11 12 13 14 15 16 17 18 19 20 21
71.,689 80,570 1,140 187 834 408 21 2 294 13 436 11 65.982 68.834 66 34 12 2 1 1
1,827 2,948 17 4 209 79 5 213 3 238 4 1,347 2,724 439 79 324 132 10 2. 56 6 154 I 3,324 5,880 684 104 :US 163 6 13 2 43 5
2,09 184
41,634 47,909 111 43 316 228 2 1 18 7 1 38.781 41,517 35 26 1
445 1.488 4 73 48 1 17 5 1 327 1,287 32 16 113 69 1 1 2
1,882 3,438 75 27 95 85 199 179
31,055 32,661 1,029 144 518 180 19 1 276 13 429 10 27,201 27.317 31 8 11 2 1 1
1.382 1,460 13 4 136 31 4 196 3 233 3 1,020 1,437 407 63 211 63 9 1 56 6 152 1 1,442 2.442 609 77 140 78 I) 13 2 43 5
10 5
RURAL ONLY
10,324 12,902 23 77 61 2 1 15 5 1 9,485 10,834 U 3 1
147 758 16 12 14 3 1
115 302 4 25 15 1 1 2 533 957 19 25 31 44 51
9,457 10,169 51 27 64 oilS 2 1 8,708 8,972 4 3
132 75 3 18 3 2 95 264 9 11 23 9
486 821 39 16 19 20 36 37
7,956 8,427 25 6 103 73 1 1 7,547 7,596 14 12
62 61 1 25 14 1 I
43 160 14 1 34 26 292 603 10 5 30 21
12 7
13,897 16,411 12 10 72 59 13,041 14,115 6 8
104 594 14 19 74 561 , 4 31 19
571 1,057 7 6 21 13 107 84
Bika. lI-A
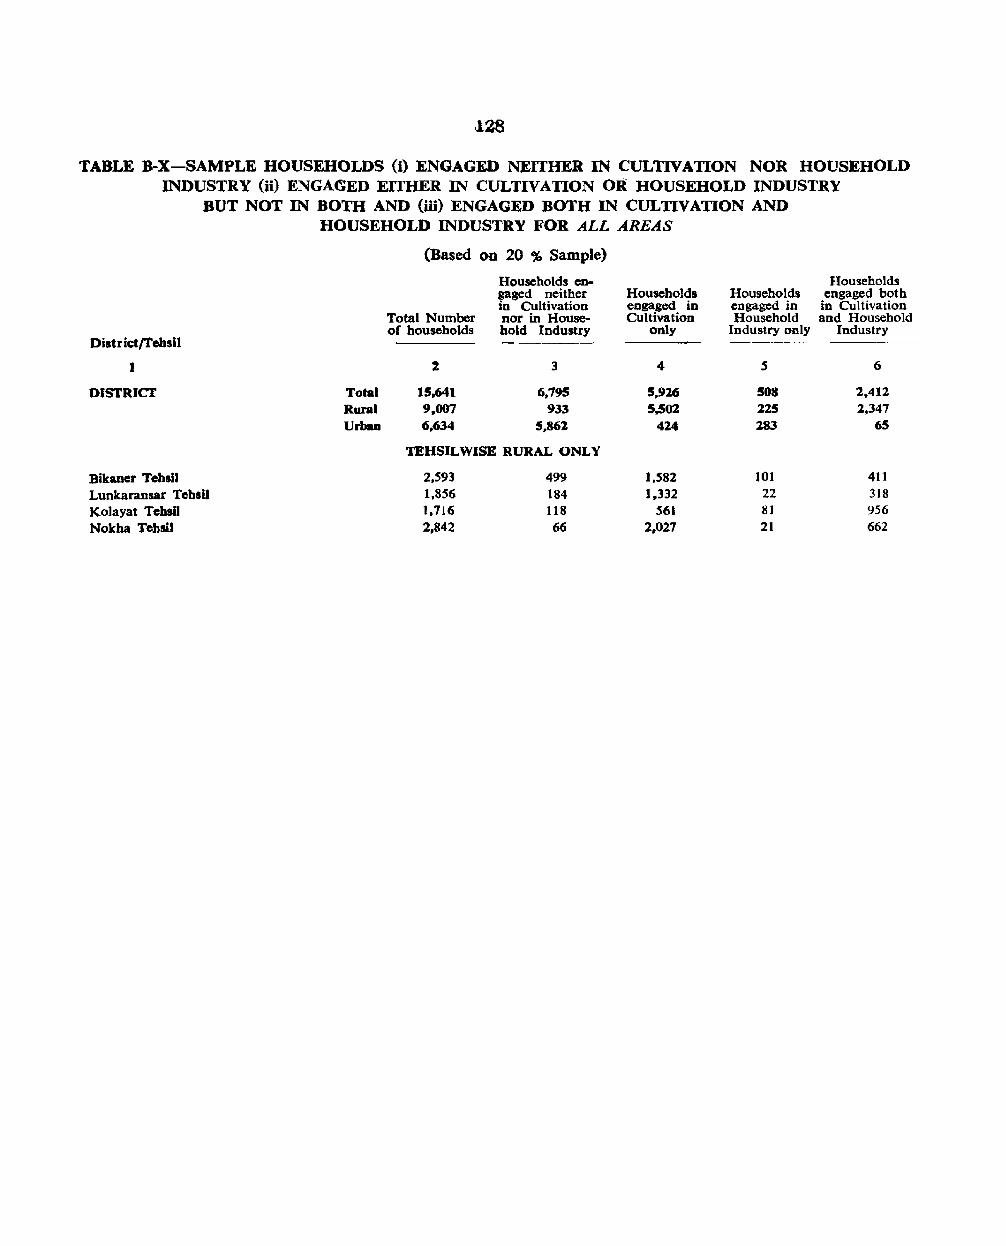
l28
TABLE B-X-SAMPLE HOUSEHOLDS (i) ENGAGED NEITHER IN CULTIVATION NOR HOUSEHOLD INDUSTRY (ii) ENGAt;ED EITHER IN CULTIVATION OR HOUSEHOLD INDUSTRY
BUT NOT IN BOTH AND (iii) ENGAGED BOTH IN CULTIVATION AND
Distric:tfl'ebsit
I
DISTRict
Bikaner TehsU Lunkaransar TebaU Ko]ayat Tebail Nokha Tehsil
HOUSEHOLD INDUSTRY FOR ALL AREAS
(Based on 20 % Sample)
Households en-gaged neither Households in Cultivation engaged in
Total Number nor in House- Cultivation of households bold Industry only
% 3 4
Total 15,641 6,795 5,926 Rural 9,007 933 5.s0l Urbaa 6.634 5.861 424
TEHSILWISE RURAL ONLY
2,593 499 1.582 1.856 184 ),332 1.716 118 561 2,842 66 2.027
Households engaged in Household
Industry only
S
508 225 283
101 22 81 21
Households engaged both
in Cultivation and Household
Industry
6
2,412 2.347
65
411 318 956 662
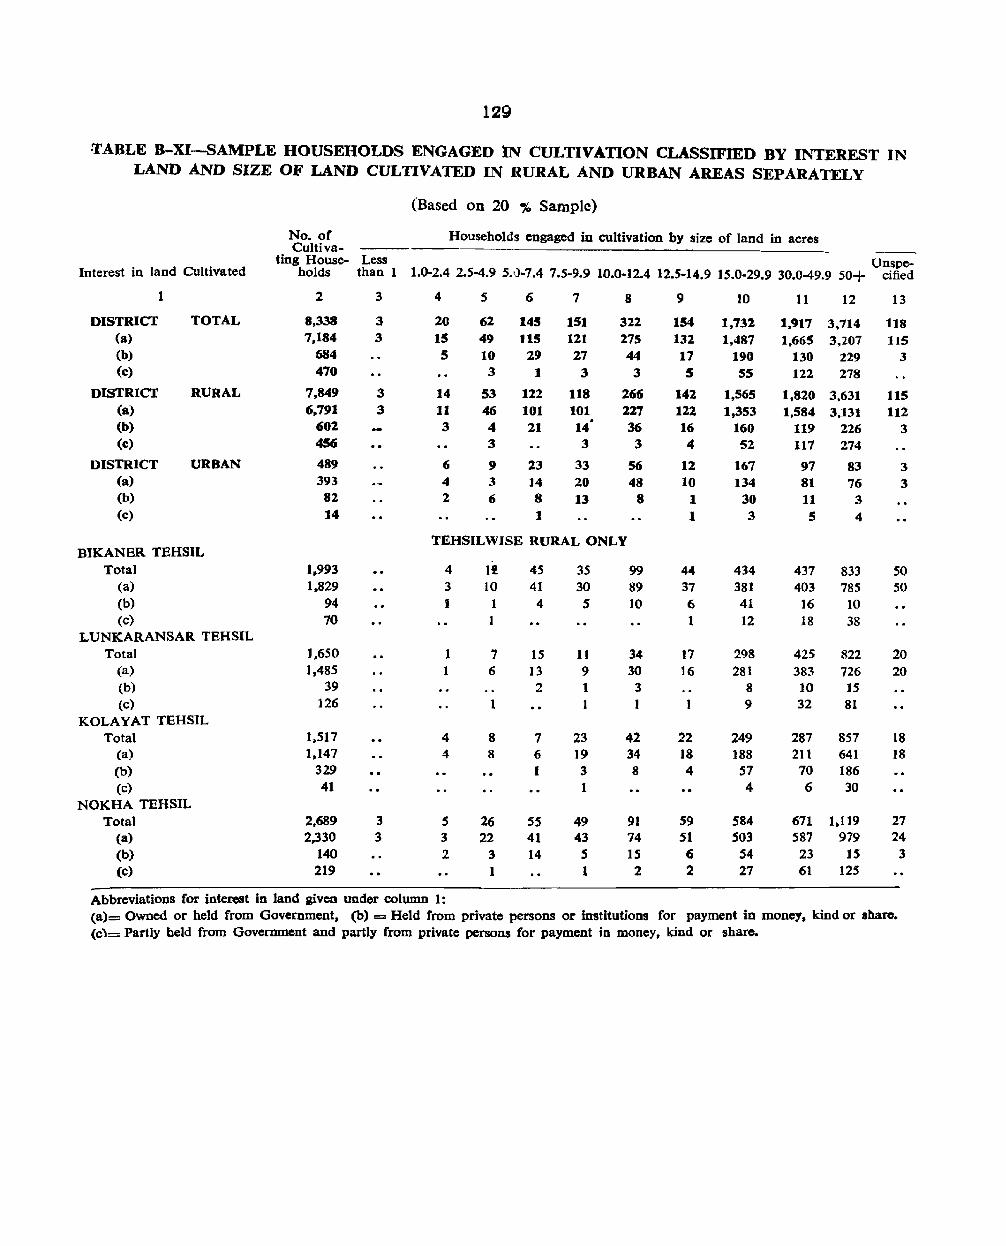
129
!TABLE B-XI-SAMPLE HOUSEHOLDS ENGAGED 'IN CULTIVATION CLASSIFIED BY INTEREST IN LAND AND SIZE OF LAND CULTIVATED IN RURAL AND URBAN AREAS SEPARATELY
(Based on 20 ~ Sample)
No. or Households engaged in cultivation by size of land in acres Cultiva-
ting House- Less Unspe-Interest in land Cultivated holds than 1 1.0-2.4 2.5-4.9 5.\)..7.4 7.5-9.9 10.0-12.4 12.5-14.9 15.0-29.9 30.0-49.9 50+ cified
1 2 3 4 5 6 7 8 9 10 11 12 13
DISTRICT TOTAL 8.338 3 20 62 145 151 322 154 1,732 1,917 3,714 118 (a) 7,184 3 15 49 115 121 275 132 1.487 1,665 3,207 liS (b) 684 5 10 29 27 44 17 190 130 229 3 (c) 470 3 I 3 3 5 55 122 278
DISTRICf RURAL 7,849 3 14 S3 Il2 118 266 142 1,565 1,820 3.631 115 (a) 6.791 3 11 46 101 101 227 122 1,353 1,584 3,131 112
602 3 4 .
36 16 160 (b) 21 14 119 226 3 (e) 4S6 3 3 3 4 52 117 274
DISTRICT URBAN 489 6 9 23 33 56 12 167 97 83 3 (a) 393 4 3 14 20 48 10 134 81 76 3 (b) 82 2 6 8 13 8 1 30 11 3 (c) 14 1 1 3 5 4
TEHSILWISE RURAL ONLY BIKANER TEHSIL
Total 1,993 4 It 45 35 99 44 434 437 833 50 (a) 1.829 3 10 41 30 89 37 381 403 785 50 (b) 94 I 1 4 5 10 6 41 16 ]0 (c) 70 1 12 18 38
LUNKARANSAR TEHSIL Total 1,650 1 7 15 11 34 17 298 425 822 20
(a) 1,485 6 13 9 30 16 28t 383 726 20 (b) 39 2 1 3 8 10 15 (c) 126 1 I 1 1 9 32 81
KOLAYAT TEHSIL Total 1,517 4 8 7 23 42 22 249 287 857 18
(a) 1.147 4 8 6 19 34 18 188 211 641 18 (b) 329 I 3 8 4 57 70 186 (c) 41 1 4 6 30
NOKHA TEHSIL Total 2.689 3 5 26 5S 49 91 59 584 671 1.119 27
(a) 2,330 3 3 22 41 43 74 51 503 587 979 24 (b) 140 2 3 14 5 15 6 54 23 IS 3 (c) 219 1 1 2 2 27 61 125
Abbreviations for interest in land given under column 1: (a)= Owned or held from Government, (b) = Held from private persons or institutions for payment in money, kind or ahate. (c)= Partly held from Government and partly from private persons for payment in money. kind or share.
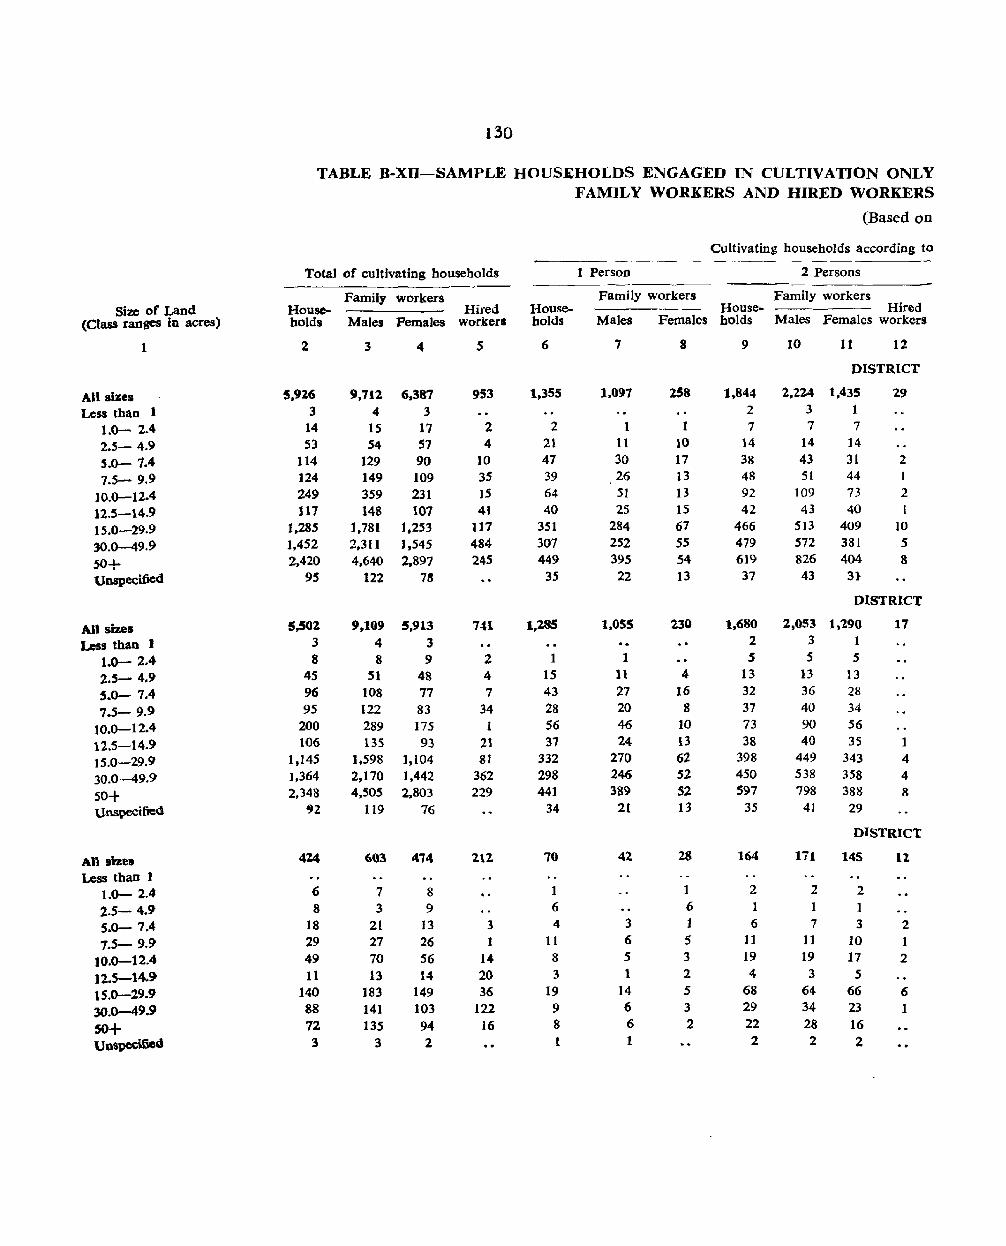
Size of Land (Class ranges in acres)
1
All sizes Less than 1
1.0- 2.4 2.5- 4.9 5.0-1.4 7.5- 9.9
10.0-12.4 12.5-14.9 15.0-29.9 30.0-49.9
50+ Unspecified
All sizes Less than I
1.0- 2.4 2.5- 4.9 s.o- 7.4 7.5- 9.9
10.0-12.4 12.5-14.9 t5.0-29.9 30.0-49.9
50+ Unspecified
AU sizes Less than I
1.0- 2.4 2.5- 4.9 5.0- 7.4 7.5- 9.9
10.0-12.4 ]2.5-14.9 15.0-29.9 30.0-49.9 50+ Uospcei.fied
130
TABLE B-XII-SAMPLE HOUSEHOLDS ENGAGED IN CULTIVATION ONLY FAMILY WORKERS AND HIRED WORKERS
(Based on
Cultivating households according to -----------------------
Total of cultivating households
Family workers House- Hired House-holds Males Females workers bolds
2
5,926 3
14 53
114 124 249 117
1.285 ],452 2.420
95
5,502 3 8
45 96 95
200 106
] ,145 ],364 2,348
'2 414
6 8
18 29 49 11
140 88 72 3
3
9.712 4
15 54
129 149 359 148
1.781 2,311 4.640
122
9,109 4 8
51 108 122 289 135
1.598 2,170 4,505
119
4
6.387 3
17 57 90 109 231 107
1.253 1,545 2,897
78
5.913 3 9
48 77 83 175 93
1,104 1.442 2.803
76
603 414
7 8 3 9
21 13 27 26 70 56 13 14
183 149 141 103 135 94
3 2
5
953
2 4
10 3S 15 41
117 484 245
741
2 4 7
34 1
21 81
362 229
212
3 I
14 20 36
122 16
6
1,355
2 21 47 39 64 40
351 307 449
35
1,185
1 15 43 28 56 31
332 298 441
34
70
1 6 4
11 8 3
19 9 8 1
1 Person 2 Persons
Family workers Family workers House- Hired
Males Fetnales bolds Males Females workers
7
1 11 30 26 51 25
284 252 395 22
1.055 .. 1
11 27 20 46 24
270 246 389
21
42
3 6 5 1
14 6 6 1
8
258
1 10 17 ]3 I3 15 67 55 54 13
230
4 16
8 10 13 62 52 52 13
28
1 6 j
5 3 2 5 3 2
9
1.844 2 7
14 38 48 92 42
466 479 619 37
1,680 2 5
13 32 37 73 38
398 450 597
35
164
2 1 6
11 19 4
68 29 22 2
]0 11 12
DISTRICT
2,224 1,435 3 1 7 7
14 14 43 31 51 44
109 73 43 40
513 409 572 381 826 404 43 3}
29
2 I
2
10 5 8
DISTRICT
2,053 1,290 3 1 5 5
13 13 36 28 40 34 90 56 40 3S
449 343 538 358 798 388
41 29
17
1 4 4 8
DISTRICT
171 145
2 2 1 1 7 3
11 10 19 17
3 5 64 66 34 23 28 16 2 2
12
2 1 2
6 1

131
CLASSIFIED BY SIZE OF LAND CULTIVATED AND NUMBER OF IN RURAL AND URBAN AREAS SEPARATELY
20 % Sample)
number of persons engaged in cultivation
3-5 Persons 6-10 Persons More than 10 Persons
Family workers Family workers
Unspecified
Households
Family workers Hired House- Hired House- Hired House- Hired
Size of Land (Cra'!<; ranges
in acres) Males Females workers holds Males Females workers bolds Males Females workers bolds workars
13
TOTAL
14
2,26, 4,840 1 1 5 7
18 29 22 41 27 52 82 171 31 67
414 818 566 1,173
I,OF3 2,437 20 44
RURAL
2,118 1 2
17 16 23 65 28
368 527
1,051 20
URBAN
151
3 1 6 4
17 3
46 39 32
4.556 1 2
27 30 46
142 61
731 1.100 2.372
44
284
5 2
II 6
29 6
87 73 65
15 16
3,377 133 2 9 2
33 4 31 2 39
113 9 47
635 17 854 37
1,588 62 26
3.159 2 4
31 22 32 89 42
567 801
1,543 26
218
5 2 9 7
24 5
68 53 45
84
2 4 2
7 18 51
49
9
10 19 11
17 18 19
409 1.462 1,247
5 15 11 6 19 12 9 28 32 2 :I 3
45 156 131 87 299 246
252 923 804 3 J3 8
381 1,365
5 5 5 2
40 79
242 3
28
1 4
5 8
10
15 15
11 9
139 276 887
13
97
4 17
17 23 36
1.169
11 8
20 3
121 225 173
8
78
4 12
to 21 31
20
78
5 9 3
9 27 25
53
5 9
4 15 20
25
3
5 12
5
21
33
1
2
6 11 13
30
1 5
10 13
3
1
22
89
4 10 15 59
80
1
1 9
10 59
9
3 1 5
23
70
1
2 11 9
47
65
1
II 6
47
2
3
24
693
25
40 75
405 148
583
25
20 6S
325 148
110
20 10 80
.,'
25
16
2 3 2
3 2 4
8
1 I
2
4
8
2 2
1 2
26 1
20 All sizes Less than 1
1.0- 2.4 2.5- 4.9
1 5.0- 7.4 7.5- 9.9
1 10.0-12.4 12.5-14.9
6 15.0-29.9 10 30.0-49.9 2 50+
4
1
1
2
Unspecified
All sizes Less than 1
1.0- 2.4 2.5- 4.9 5.0- 7.4 7.5- 9.9
10.0-12.4 12.5-14.9 15.0-29.9 30.0-49.9 SO+ Unspecified
16 All sizes Less than 1
1.0- 2.4 2.5- 4.9
1 S.O- 7.4 7.5- 9.9
10.0-12.4 12.5-14.9
5 15.0-29.9 10 30.0-49.9
50+ Unspecified
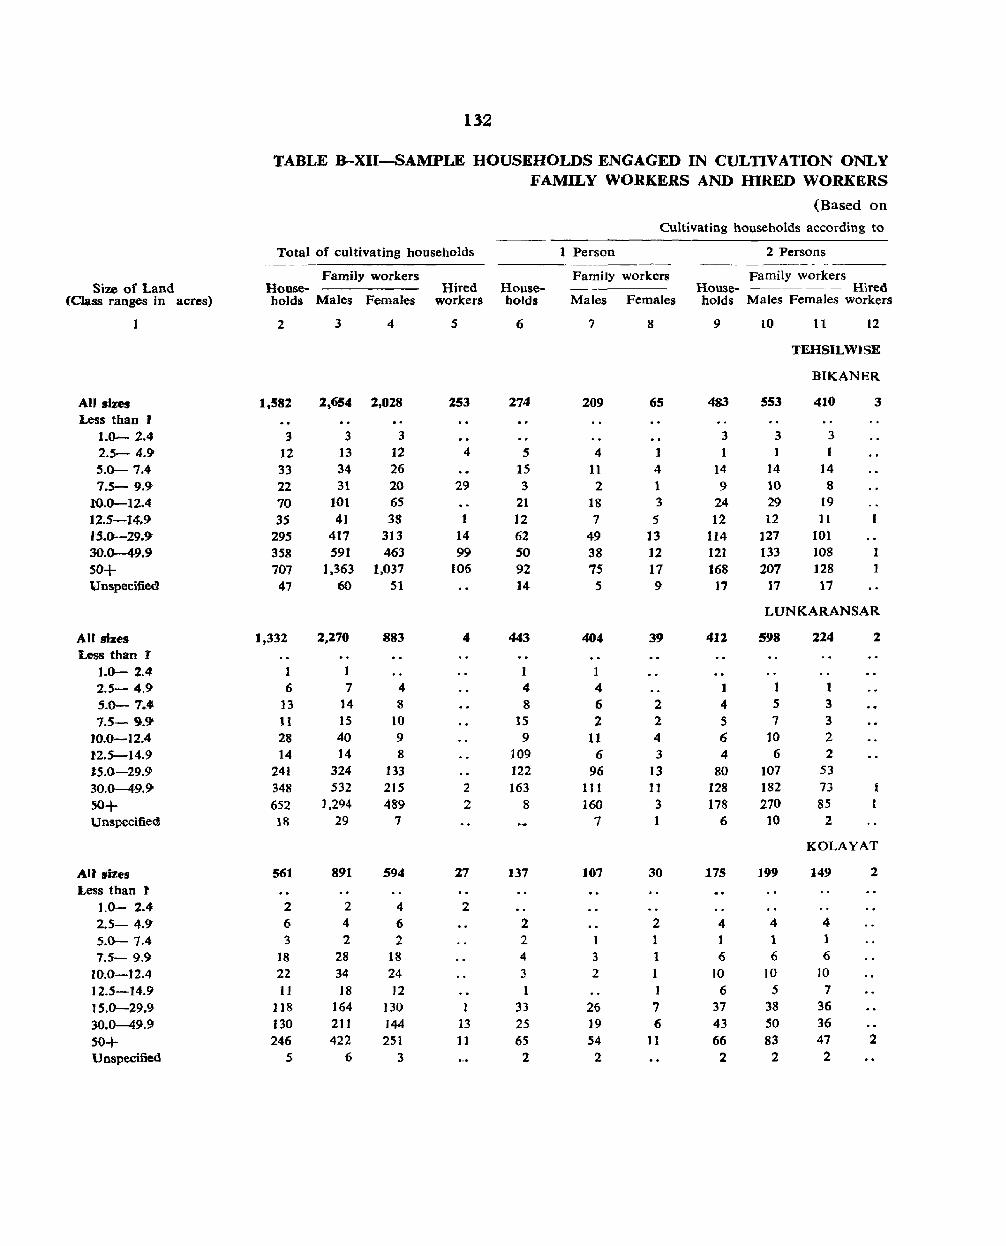
Size of Land (Class ranges in acres)
1
All sizes Less than J
1.0- 2.4 2.5- 4.9 5.0- 7.4 7.5- 9.9
1'0.0-12.4 12.5-14.9 J5.0--29.9 30.0-49.9 50+ Unspecified
All sizes Less than r
1.0- 2.4 2.5- 4.9 5.0- 7.4 7.5- 9'.9-
}O.6-12.4 12.5-14.9 15.0-29.9 30.0-49.9-50+ Unspecified
AU sizes Less than )'
1.0- 2.4 2.5- 4.9 5.0- 7.4 1.5- 9.9
10.0-12.4 12.5-14.9 15.0-29.9 30.0-49.9 50+ Unspecified
13-2
TABLE B-XII-SAMPLE HOUSEHOLDS ENGAGED IN CULTIVATION ONLY FAMILY WORKERS AND HIl~ED WORKERS
Total of cultivating households
Family workers
1 Person
(Based on
Cultivating households according to
2 Persons ---
FamiJy workers Family workers House- Hired House- House- Hired holds Males Females workers holds Males Females holds Males Females workers
2
1,582
3 12 33 22 70 3S
295 358 701 47
3
2,654
3 13 34 31
101 41
417 591
1,363 60
1,332 2,270
1 6 7
13 14 11 15 28 40 14 14
241 324 348 532 652 1,294 18 29
561
2 6 3
18 22 11
118 130 246
5
891
2 4 2
28 34 18
164 21] 422
6
4
2,028
3 12 26 20 65 38
313 463
1,037 51
883
4 8
10 9 8
133 215 489
7
594
4 6
2 18 24 ]2
)30 144 251
3
5
253
4
29
1 14 99
106
4
2
2
27
2
13 11
6
274
5 15 3
21 12 62 SO 92 14
443
1 4 8
15 9
109 122 163
8
137
2 2 4 3 1
33 25 65
2
7
209
4 11 2
18 7
49 38 75
5
404
1 4 6 2
11 6
96 III 160
7
107
3 2
26 19 54
2
8
65
1 4 1 3
5 13 ]2 17 9
39
2 2 4 3
13
11 3 1
30
2 1 1
I 7 6
11
9
483
3 1
14 9
24 12
114 121 168 17
411
1 4 5 6 4
80 128 178
6
175
4
6 10
6 37 43 66
2
10
553
3 1
]4 10 29 12
127 133 207
17
11 12
TEHSILW1SE
BIKANER
410
3
14 8
19 11
101 108 128 17
3
1
1
LUNKARANSAR
598
1 5 7
10 6
101 182
270 10
199
4 1 6
10 5
38 50 83
2
224
1 3 3 2 2
53 73 85
2
:z
1
KOLAYAT
149
4 1 6
10
7 36 36 47 2
2
2
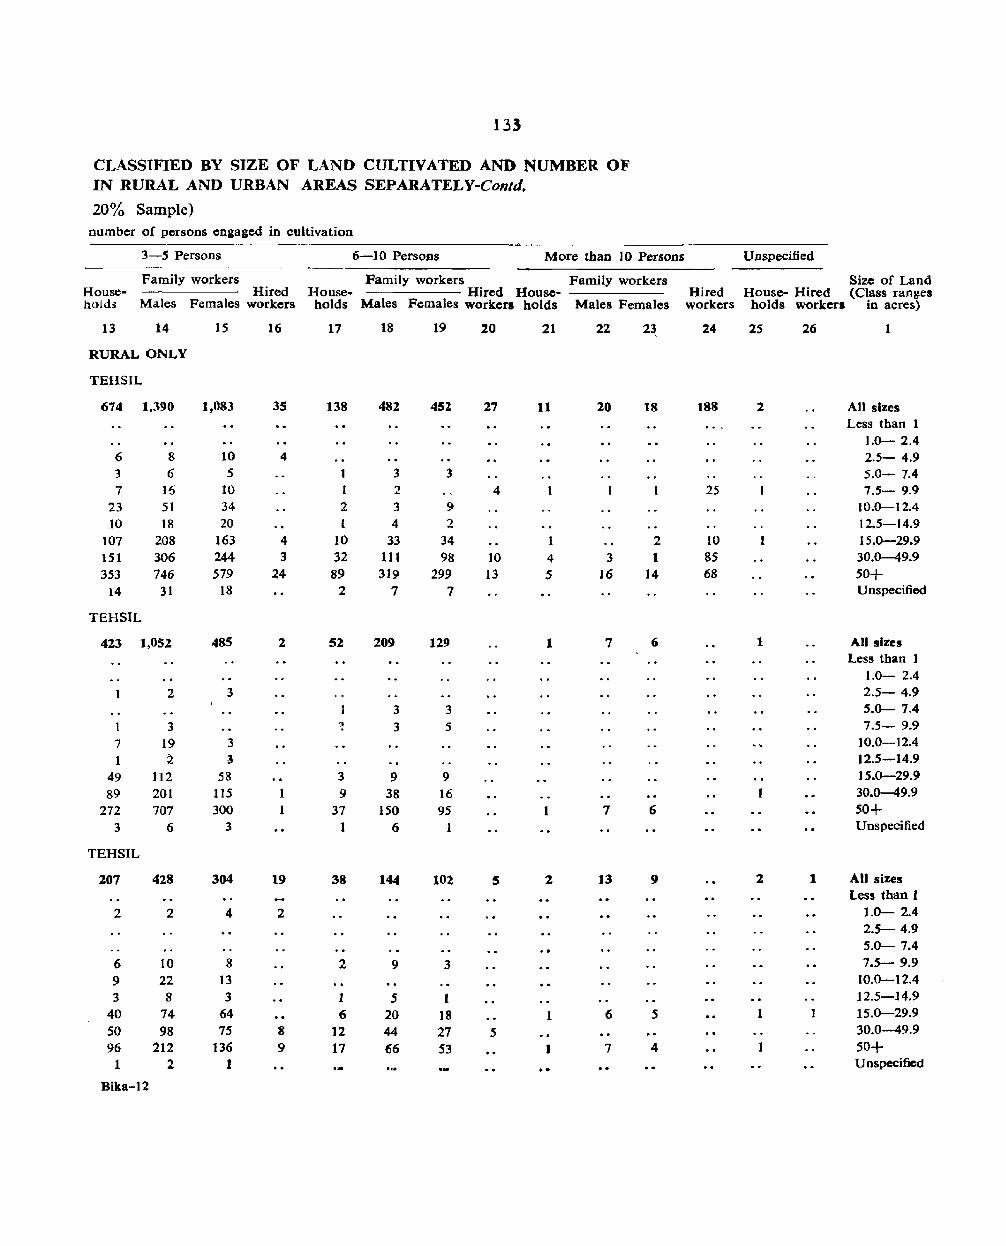
133
CLASSIFIED BY SIZE OF LAND CULTIVATED AND NUMBER OF IN RURAL AND URBAN AREAS SEPARATELY-Con/d.
20% Sample) number of persons engaged in cultivation
3-5 Persons 6-10 Persons M ore than JO Persons Unspecified
Family workers Family wqrkers Family workers Size of Land House- Hired House- Hired House- Hired House- Hired (Class ranges hold~ Males Females workers holds Males Females workers bolds Males Females workers holds workers in acres)
13 14 15 16 17 18 19 20 21 22 23 24 25 26 1
RURAL ONLY
TEHSIL
674 1,390 1,083 35 138 482 452 27 11 20 18 188 2 All sizes Less than
],0- 2.4 6 8 10 4 2.5- 4.9 3 6 5 3 3 5.0- 7.4 7 16 10 I 2 4 25 7.5- 9.9
23 51 34 2 3 9 10.0-12.4 10 18 20 4 2 12.5-14.9
107 208 163 4 10 33 34 1 2 10 I 15.0-29.9 151 306 244 3 32 III 98 10 4 3 1 85 30.0-49.9 353 746 579 24 89 319 299 I3 5 J6 14 68 50+
14 31 18 2 7 7 Unspecified
TEHSIL
423 1,052 485 2 52 209 129 1 7 6 1 All sizes Less than 1
1.0- 2.4 2 3 2.5- 4.9
3 3 5.0- 7.4 3 1 3 5 7.5- 9.9
7 19 3 10.0-12.4
1 2 ;\ 12.5-14.9
49 112 58 3 9 9 15.0-29.9
89 201 115 1 9 38 16 1 30.0-49.9
272 707 300 1 37 150 95 1 7 6 50+ 3 6 3 1 6 Unspecified
TEHSIL
207 428 304 19 38 144 102 5 2 13 9 :z 1 All sizes Less than 1
2 2 4 2 1.0- 2.4 2.5- 4.9 5.0- 7.4
6 10 8 2 9 3 7.5- 9.9
9 22 13 10.0-12.4
3 8 3 1 5 1 12.5-14.9 40 74 64 6 20 18 1 6 5 1 15.0-29.9
50 98 75 8 12 44 27 5 30.0-49.9
96 212 136 9 17 66 53 1 7 4 50+ 1 2 1 .. Unspecified
Bika-12
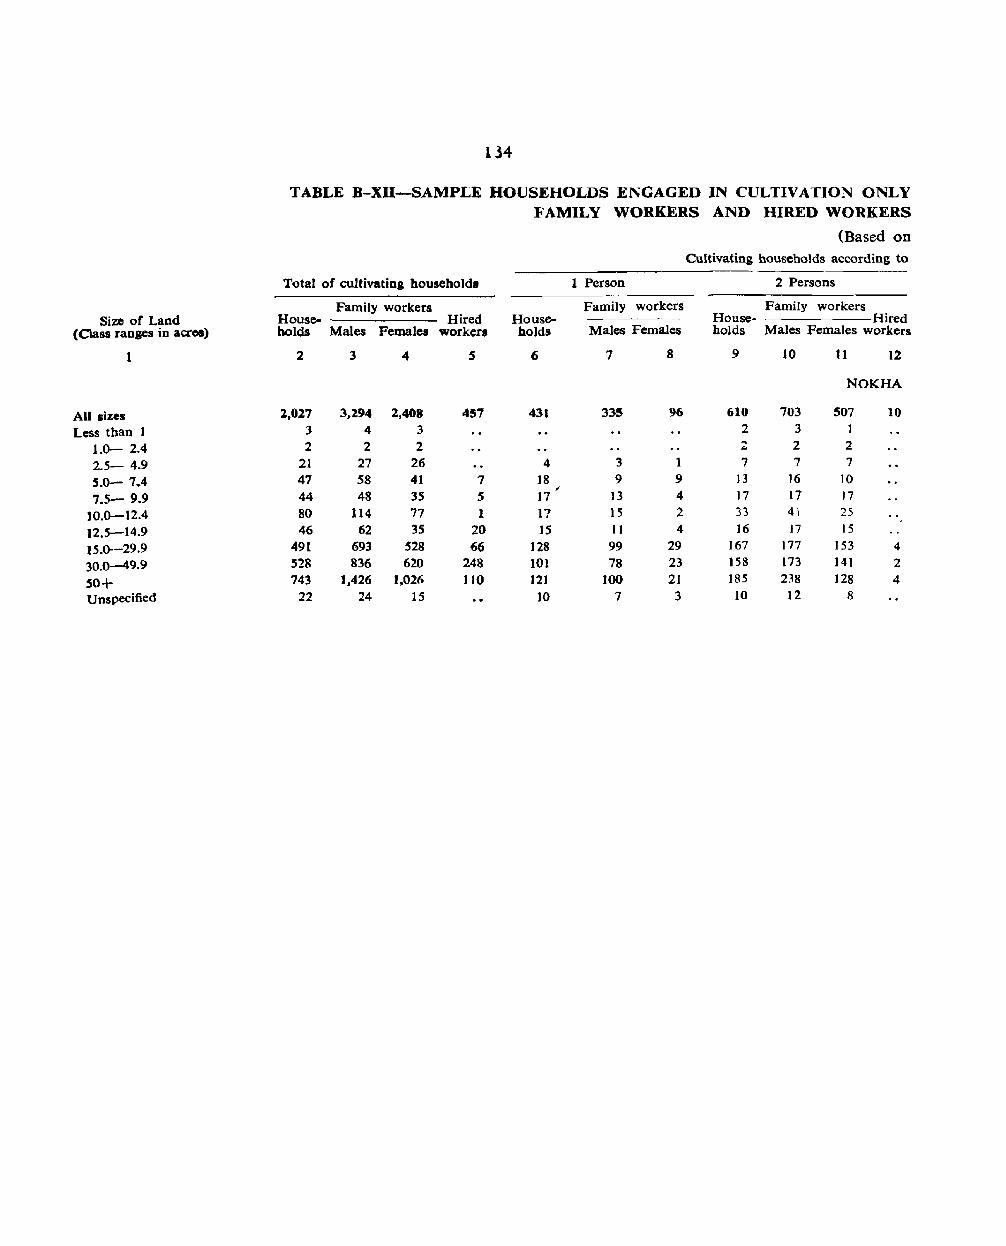
134
TABLE B-XII-SAMPLE HOUSEHOLDS ENGAGED IN CULTIVATION ONLY FAMILY WORKERS AND HIRED WORKERS
(Based on Cultivating households according to
Total of cultivating household. 1 Person 2 Persons
Family workers Family workers Family workers Size of Land House- Hired House- House- Hired
(Class ranges in aa'cs) holds Males Females workers bolds Males Females holds Males Females workers
1 2 3 4 S 6 7 8 9 10 11 12
NOKHA
All sizes 1,027 3,294 2,408 4S7 431 335 96 610 703 507 10
Less than 1 3 4 3 2 3 ]
1.0- 2.4 2 2 2 ,.
2 2 "-
2.S- 4.9 21 27 26 4 3 1 7 7 7
5.0- 7.4 47 58 41 7 ]8 9 9 13 16 10
48 ~
7.5- 9.9 44 35 S 17 13 4 17 17 17
10.0-12.4 80 114 77 1 17 15 2 33 41 25
12.5-14.9 46 62 35 20 IS 11 4 ]6 J7 15
15.0--29.9 491 693 528 66 128 99 29 ]67 177 ]53 4
30.0-49.9 528 836 620 248 101 78 23 158 173 141 2
50+ 743 1.426 1,026 110 121 100 21 185 238 128 4
Unspecified 22 24 15 10 7 3 10 12 8
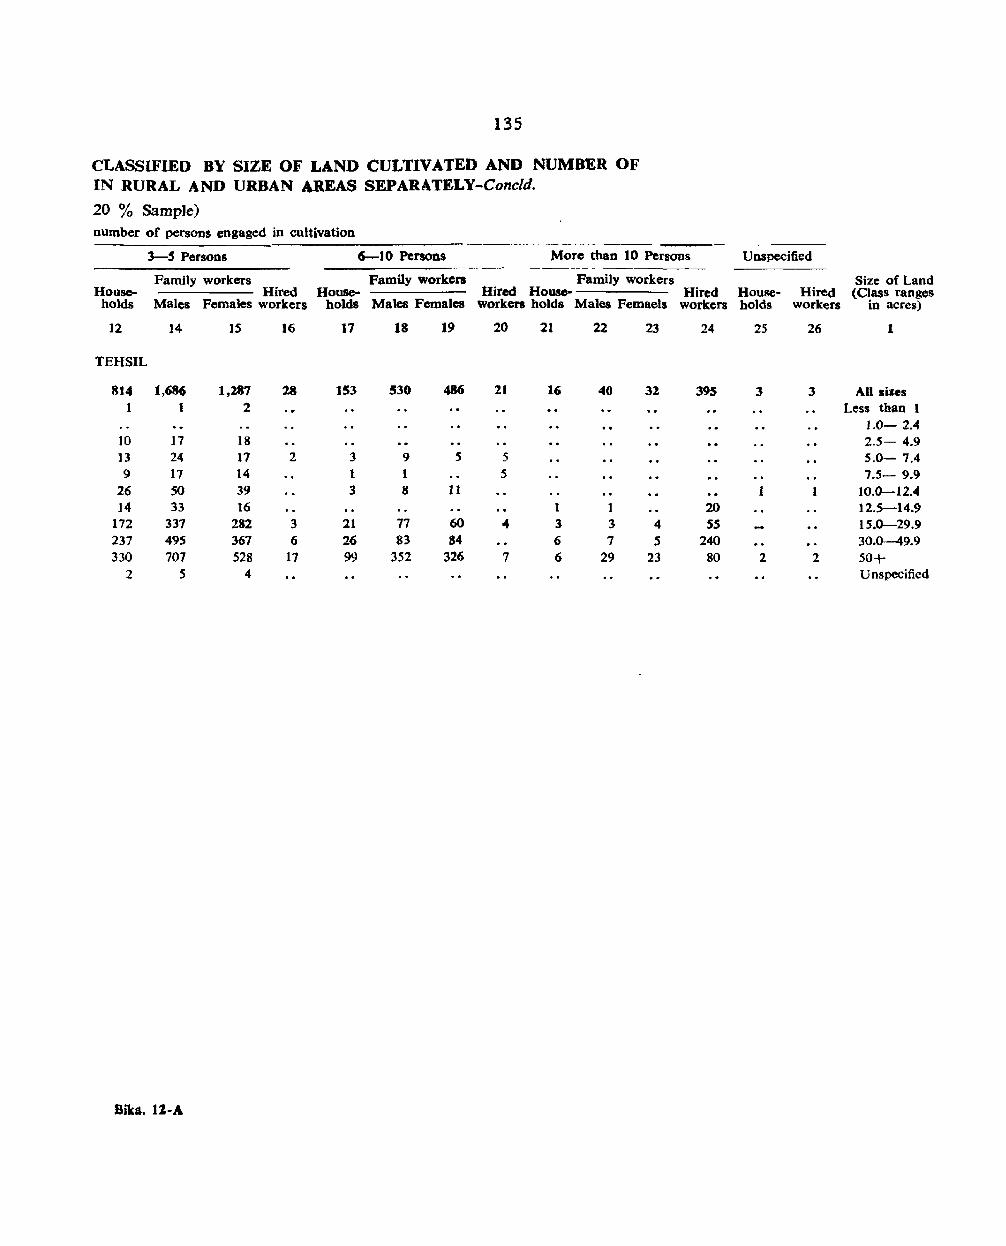
135
CLASSIFIED BY SIZE OF LAND CULTIVATED AND NUMBER OF IN RURAL AND URBAN AREAS SEPARATELY-Concld.
20 % Sample) number of persons engaged in cultivation
3-5 Persons 6-10 Persons More than 10 Persons Unspecified
Family workers Family worken Family workers Size of Land House- Hired House- aired House- Hired House- Hired (Class ranges
holds Males Females workers holds Mates Females workon holds Males Femaels workers holds workers in acres)
12 14 IS 16 17 18 19 20 21 22 23 24 25 26 1
TEHSIL
814 1,686 1,187 28 153 530 486 21 16 40 31 395 3 3 All sixes 1 1 2 Less than I
1.0- 2.4 10 17 18 2.5- 4.9 13 24 17 2 3 9 5 5 5.0- 7.4 9 17 14 1 1 5 7.5- 9.9
26 50 39 3 8 11 1 I 10.0-12.4 14 33 16 1 1 20 12.5-14.9
172 337 282 3 21 77 60 4 3 3 4 S5 15.0-29.9 237 495 367 6 26 83 84 6 7 5 240 30.0--49.9 330 707 528 17 99 352 326 7 6 29 23 80 2 2 50+
2 5 4 Unspecified
Bika. 12-.\


137
TABLE B-XID-SAMPLE HOUSEHOLDS ENGAGED BOTH IN CULTIVATION AND HOUSEHOL() INDUSTRY SHOWING SIZE OF LAND CULTIVATED CLASSIFIED BY PRINCIPAL
HOUSEHOLD INDUSTRY IN RURAL AND t,JRBAN AREAS SEPARATELY
(Based on 20 % Sample)
Number of households by size in acres of land cultivated Total No. -------~-
Codo No. of Division and Major of House- Less Unsp· Group of t. S. I. C. holds than 1 1.0-2.4 2.5-4.9 5.0·7.4 7.5·9.9 10.0-12.4 12.5-14.9 15.0-29.9 30.0-49.9 50+ ecified
1 2 3 4 5 6 7 8 9 10 11 12 13
DISTRICT RURAL
AU ladustr't's 1.347 6 8 16 23 66 36 410 456 1.283 23 Divuion 0 1,925 6 3 19 14 53 29 304 365 1.115 17
Major Group 04 1,925 6 3 19 14 53 29 304 365 t .115 17 Divt"s;on 2&3 422 5 7 9 J3 7 Jl6 91 168 6
Major Group 20 39 J 8 10 J9 23 98 3 2 2 1 24 13 5J 2 24 J I 25 64 2 2 20 19 20 27 14 1 3 2 S 28 63 2 :2 10 14 34 31 5S 2 4 18 12 18
34-35 26 1 I 12 7 4 36 28 3 3 2 9 7 3 1 39 34 2 2 12 7 10
DIS'fRICT URBAN
A 11 Industries (is 1 5 4 7 1 27 9 1J
Division 0 9 1 2 2 4 Major Group 04 9 I 2 2 4
Division 2&::3 56 1 5 4 " 1 25 7 7 Major Group 20 3 2 1
21 I 1 23 5 1 2 2 25 27 1 1 3 3 1 11 4 3 27 3 1 2 28 2 1 1 31 4 3 I
34-35 2 1 1 36 1 1 39 8 2 , 1
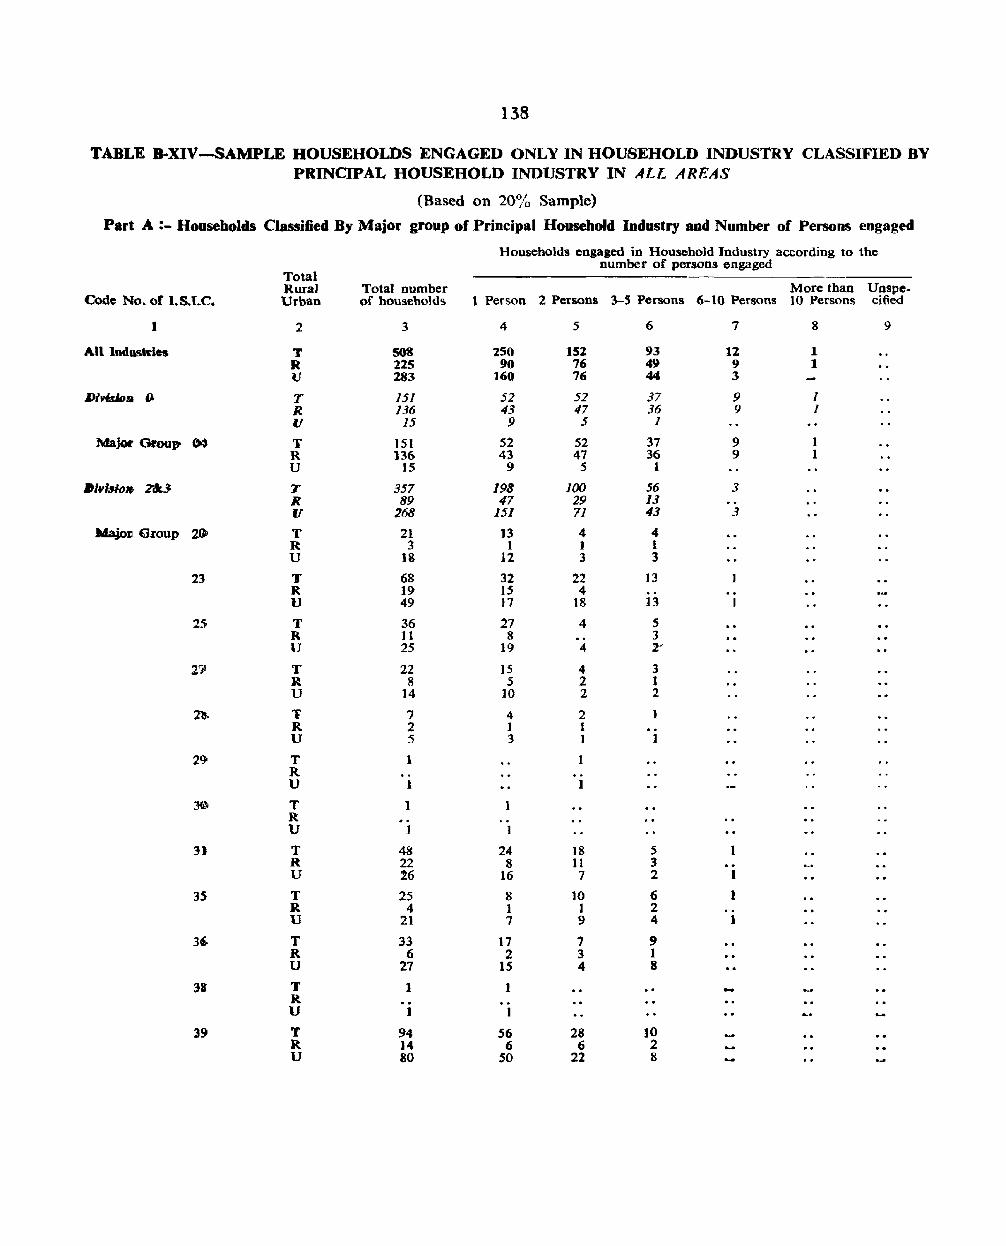
138
TABLE B-XIV-SAMPLE HOUSEHOLDS ENGAGED ONLY IN HOUSEHOLD INDUSTRY CLASSIFIED BY PRINCIPAL HOUSEHOLD INDUSTRY IN ALL AREAS
(Based on 20% Sample)
Part A :- Households Classified By Major group of Principal Household Industry and Number of Persons engaged
Households engaged in Household Industry according to the number of persons engaged
Total Rural Total number More thaD Unspe-
Code No. of I.s..I.C. Urban of households 1 Person 2 Persons 3-S Persons 6-10 Persons 10 Persons cified
I 2 3 4 5 6 7 8 9
All Induskles T 508 250 152 93 12 1 R 225 90 76 49 9 1 U 283 160 76 44 3
lJivls.lDlI. 0 T 151 52 52 37 9 1 R 136 43 47 36 9 1 U 15 9 5 1
Majoc Group M T 151 52 52 37 9 1 R 136 43 47 36 9 1 U 15 9 5 I
J)i¥IHoIt 2'&:3' T 357 198 100 56 3 R 89 47 29 13 fl 268 151 71 43 3
~1l Gl'OUp 2@ T 21 ]3 4 4 R 3 1 1 1 U 18 12 3 3
23 T 68 32 22 13 R 19 15 4 .. U 49 17 18 13 1
25 T 36 27 4 5 R 11 8 3 U 25 19 4 ~.
T 22 15 4 3 R 8 5 2 1 U 14 10 2 2
'l' 7 4 2 } R 2 I I U 5 3 I I
29 T I I R U 1 J
30 T 1 R U 1 I
:n T 48 24 18 5 1 R 22 8 11 3 U 16 16 7 2 I
35 T 25 8 10 6 1 .R 4 1 1 2 U 21 7 9 4 1
3' T 33 17 7 9 R 6 2 3 1 U 27 15 4 8
38- T ] 1 -R U 1 I
39 T 94 56 28 10 R 14 6 6 2 U 80 50 22 8
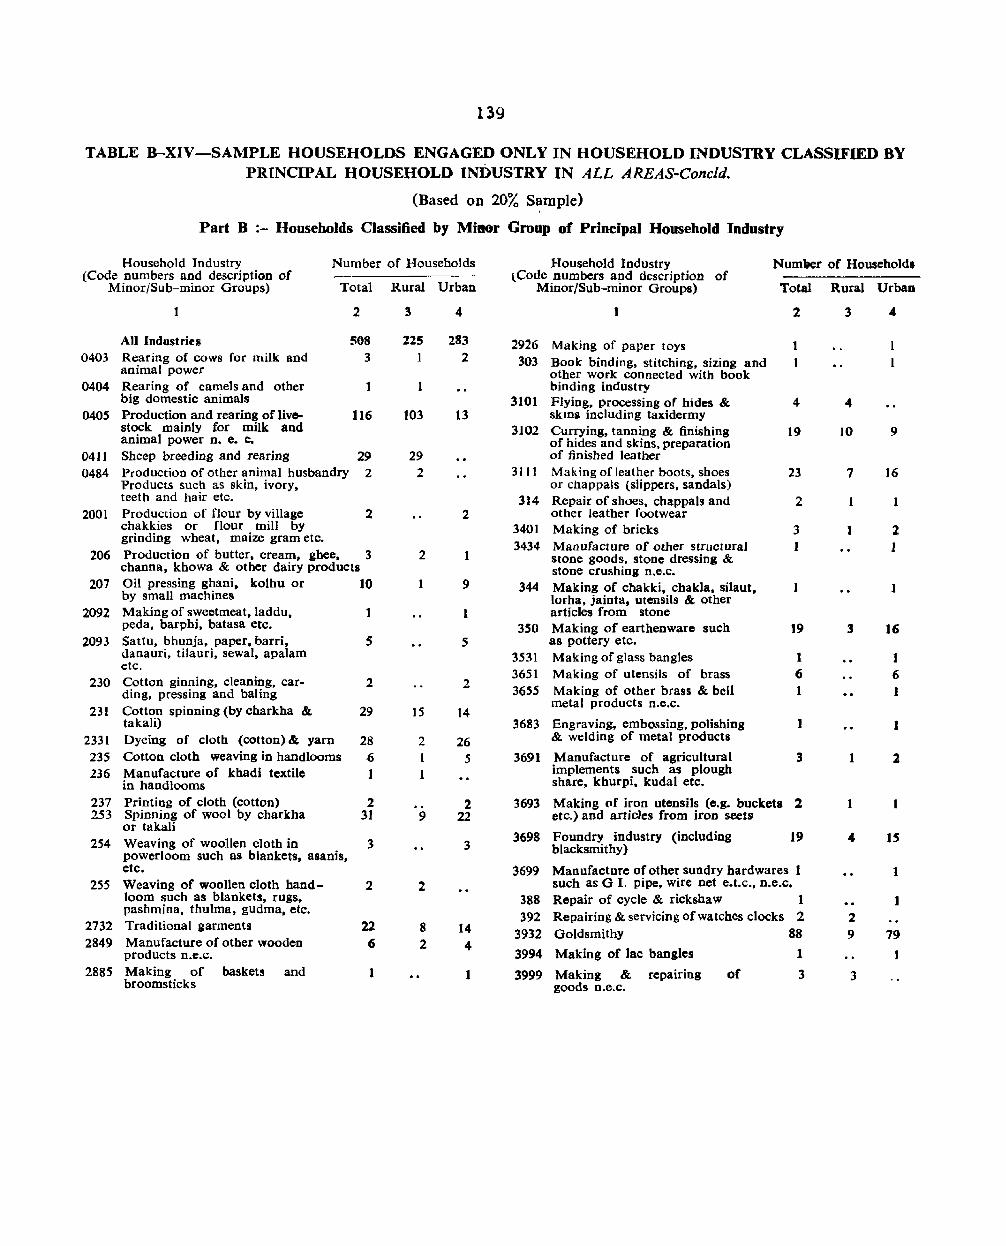
139
TABLE B-XIV-SAMPLE HOUSEHOLDS ENGAGED ONLY IN HOUSEHOLD INDUSTRY CLASSIFIED BY PRINCIPAL HOUSEHOLD INDUSTRY IN ALL AREAS-Concld.
(Based on 20% Sample)
Part B .- Households Classified by Minor Group of Principal Household Industry
Household Industry (Code numbers and description of
Minor/Sub-minor Groups)
Number of Households
Total Rural Urban
1 2
All Industries 508 0403 Rearing of cows for milk and 3
animal power 0404 Rearing of camels and other 1
big domestic animals 0405 Production and rearing of live- 116
stock mainly for milk and animal power n. e. c.
0411 Sheep breeding and rearing 29 0484 Production of other animal husbandry 2
Products such as skin, ivory. teeth and hair etc.
2001 Production of flour by village 2 chakkies or flour mill by grinding wheat, maize gram etc.
206 Production of butter. cream. ghee. 3 channa. khowa & other dairy products
207 Oil pressing ghani, kolhu or 10 by small machines
2092 Making of sweetmeat, laddu. 1 peda, barphi, batasa etc.
2093 Sattu, bhunja, paper. barri, S danauri, tilauri, sewal. apalam etc.
230 Cotton ginning, cleaning, car- 2 ding, pressing and baling
231 Cotton spinning (by charkha & 29 takali)
2331 Dyeing of cloth (cotton) & yarn 28 235 Cotton cloth weaving in handloorns 6 236 Manufacture of khadi textile 1
in handlooms 237 Printing of cloth (cotton) 2 253 Spinning of wool by charkha 31
or takaH 254 Weaving of woollen cloth in 3
powerloom such as blankets, asanis. etc.
255 Weaving of woollen cloth hand- 2 loom such as blankets, rugs, pashmina, thulma. gudma, etc.
2732 Traditional garments 22 2849 Manufacture of other wooden 6
products n.e.c. 2885 Making of baskets and I
broomsticks
3 4
225 283 2
1
103 13
29 2
2
2
1 9
I
5
2
15 14
2 26 5
1
2 9 22
3
2
8 14 2 4
I
Household Industry l Code numbers apd description of
Minor/Sub-minor Groups)
Numl"er of Households
Total Rural Urban
1
2926 Making of paper toys 303
3101
3102
3111
314
3401 3434
344
3S0
3531 3651 3655
Book binding, stitching, Sizing and other work connected with book binding industry Flying, proceSSing of hides & skIDS including taxidermy Currying, tanning & finishing of hides and skins, preparation of finished leather Making of leather boots, shoes or chappals (slippers, sandals) Repair of shoes. chappals and other leather footwear Making of bricks Manufacture of other structural stone goods, stone dreSSing & stone crushing n.e.c. MakiDg of chakki, chakla, silaut, lorha, jainta, utensils & other articles from stone Making of earthenware such as pottery etc. Making of glass bangles Making of utensils of brass Making of other brass & bell metal products n.e.c.
2
4
19
23
2
3
I
19
1 6 1
3683 Engraving, embossing, polishing I & welding of metal products
3691 Manufacture of agricultural 3 implements such as plough share. khurpi, kudal etc.
3693 Making of iron utensils (e.g. buckets 2 etc.) and articles from iron seets
3698 Foundry industry (including 19 blacksmithy)
3699 Manufacture of other sundry hard wares 1 such as G I. pipe. wire net e.t.c., n.e.c.
388 Repair of cycle & rickshaw 1 392 Repairing & servicing of watches clocks 2
3932 Goldsmithy 88
3994 Making of lac bangles I
3999 Making & repairing of 3 goods n.e.c.
3
4
10
7
1
3
1
1
4
2 9
3
4
1 1
9
16
1
2 1
1
16
1 6 1
1
2
t
1
I
79

140
TABLE B-XV-SAMPLE HOUSEHOLDS ENGAGED BOTH IN CULTIVATION AND HOUSEHOLD
(Based on
Total of cultivating households Cultivating households which are also engaged in
1 Person household industry 2 Persons
Family workers Family workers Family workers Size of Land House- Hired House- House- Hired
(Class ranges in acres) holds Males Females workers bolds Males Females bolds Males Females workers
1 2 3 4 S 6 7 8 9 10 11 12
DISTRICT
All sizes 2.412 5,097 3.437 128 224 194 30 631 766 494 2
Less than 1 1.0- 2.4 6 12 5 2 2
2.5- 4.9 9 12 8 2 2 5 4 6
5.0- 7.4 31 44 22 9 8 1 12 15 9
7.5- 9.9 27 38 19 7 5 2 14 18 10
10.0-12.4 73 121 75 3 13 12 1 25 30 20
12.5-14.9 37 63 44 4 4 II II 1 1
15.0-29.9 447 819 505 29 64 56 8 140 168 liZ
30.0-49.9 465 892 601 29 49 44 5 144 167 121
50+ 1,294 3.046 2.135 67 70 S9 11 272 344 198 2 Unspecified 23 50 23 4 2 2 8 9 7
DISTRICT
All sizes 2,347 4,975 3,335 113 223 194 29 744 474 2
Less than 1 1.0- 2.4 6 12 5 2 2
2.5- 4.9 8 12 6 2 2 4 4 4
5.0- 7.4 26 38 16 9 8 1 8 11 5
7.5- 9.9 23 33 15 7 5 2 11 14 8
JO.0-12.4 66 112 66 3 13 12 I 21 26 16
12.5-14.9 36 62 42 4 4 11 11 11
15.0--29.9 420 763 467 24 64 S6 8 133 161 105
30.0-49.9 456 876 583 21 48 44 4 144 167 121
50+ 1,283 3,017 2,112 65 70 59 11 270 341 197 2
U DSpeci.fied! 23 50 23 4 2 2 8 9 7
DISTRICT
AU sizes 65 122 102 15 1 1 21 22 20 Less than 1
1.0- 2.4 2.5- 4.9 1 2 1 2
5.0- 7.4 5 6 6 4 4 4
7.5- 9.9 4 5 4 3 4 2
10.0-12.4 7 9 9 4 4 4
12.5-14.9 I 1 2 15.0--29.9 27 56 38 5 7 7 7
30.0-49.9 9 16 18 8 1 1
50+ 11 29 23 2 2 3 1
Unspecified
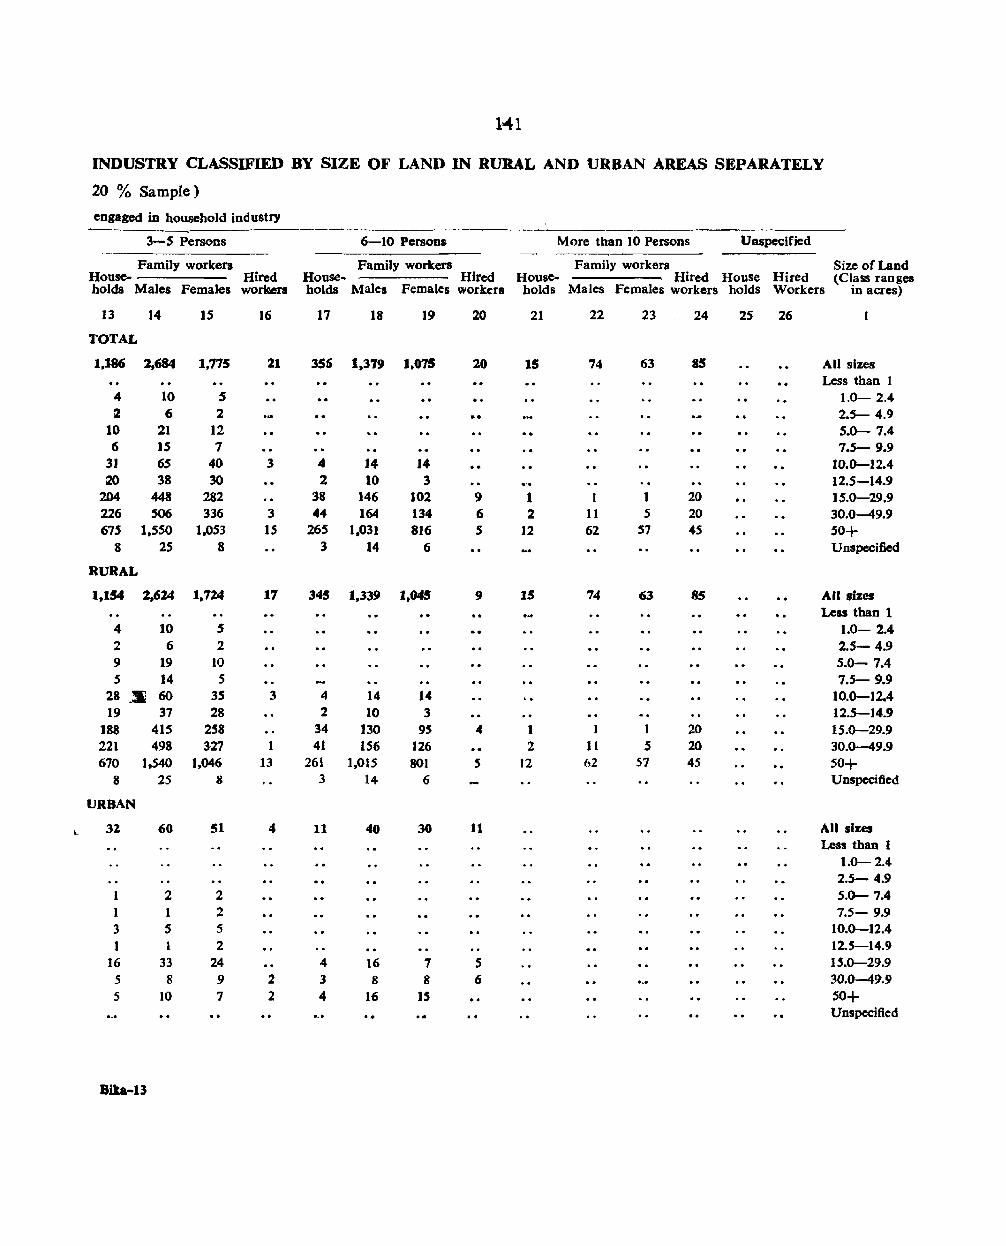
HI
INDUSTRY CLASSIFIED BY SIZE OF LAND IN RURAL AND URBAN AREAS SEPARATELY
20 % Sample)
engaged in household industry
3 ...... 5 Persons 6-10 Persons M ore than 10 Persons Unspecified
Family workers Family workers Family workers Size of Land House- Hired House- Hired House- Hired House Hired (Class ranges holds Males Females workler. holds Males Females workers holds Males Females workers holds Workers in acres)
13 14 15 16 17 18 19 20 21 22 23 24 25 26 1
TOTAL
1,186 2,QJ4 1,175 21 356 1,319 1.075 20 15 74 63 85 All sizes Less than 1
4 10 5 1.0- 2.4 rz 6 2 2.5- 4.9
10 21 12 5.0- 7.4 6 15 7 7.5- 9.9
31 65 40 3 4 14 14 10.0-12.4 20 38 30 2 10 3 12.5-14.9
204 448 282 38 146 102 9 1 1 1 20 15.0-29.9 226 S06 336 3 44 164 134 6 2 11 5 20 30.0-49.9 675 1,550 1,053 15 265 1,031 816 5 12 62 57 4S 50+
8 25 8 3 14 6 Unspecified
RURAL
1,154 2,624 1.724 17 345 1.339 1,045 9 IS 74 63 8S All sizes .. .. Less than 1 4 10 5 1.0- 2.4 2 6 2 2.5- 4.9 9 19 10 5.0- 7.4 5 14 5 7.5- 9.9
28 _!Ii 60 35 3 4 14 14 10.0-12.4 19 37 28 2 10 3 12.5-14.9
188 415 258 34 130 95 4 1 1 1 20 15.0-29.9 221 498 327 1 41 156 126 2 11 5 20 30.0-49.9 670 1,540 1.046 13 261 1,015 801 5 12 62 57 45 50+
8 25 8 3 14 6 Unspecified
URBAN
iL 32 60 51 4 11 40 30 11 All sizes Less than I
1.0- 2.4 2.5- 4.9
1 2 2 5.0- 7.4 1 1 2 7.5- 9.9 3 5 5 10.0-12.4 1 1 2 12.5-14.9
16 33 24 4 Hi 7 5 15.0-29.9 5 8 9 2 3 8 8 6 30.0-49.9 5 10 7 2 4 16 IS 50+ .. Unspecified
Bila-13

142
TABLE B-XVI-SAMPLE PRINCIPAL HOUSEHOLD INDUSTRY CLASSIFIED BY PERIOD OF WORKING
( Based on
Total 1 to 3 months 4 to 6 months ----------
Total Family workers Family workers Family workers Rural House~ Hired House- Hired House- Hired
Code No. Urban holds Males Females workers holds Males Females workers holds Males Females workers
2 3 4 5 6 7 8 9 10 11 12 13 14
DISTRICT
All IodpstrleJ Total 2,920 5,733 3,763 133 2-2 31 25 252 451 344 14 (a) 2.411 5,097 3,437 128 15 lS 23 229 438 328 14 (b) 508 636 326 5 7 Ii 2 23 13 16
Rural 2,572 5,262 3,527 117 16 23 24 2'6 408 300 14 (a) 2,347 4,975 3,335 113 14 22 22 209 405 294 14 (b) 225 287 192 4 2 1 2 7 3 6
Urban 348 471 236 16 6 8 1 36 43 44 (a) 65 122 102 15 1 3 1 20 33 34 (b) 283 349 134 1 5 5 16 10 10
• Division 0 Total 2,085 4,423 2,855 33 2 2 1 68 139 67 2 (0) 1.934 4,209 2,715 31 2 2 I 67 139 66 2 (b) 151 214 140 2 1 I
Rural 2.061 4,392 2,837 27 2 2 1 64 133 63 2 (0) 1,925 4,191 2,706 25 2 2 J 63 133 61 2 (b) 136 201 131 2 1 1
Urban 24 31 18 6 4 6 4 (a) 9 18 9 6 4 6 4 (b) 15 13 9
Major Group 04 Total 2.085 4,423 2.855 33 2 2 1 68 139 67 2 (a) ],934 4,209 2,715 31 2 2 1 67 139 66 2 (b) 151 214 140 2 1 1
Rural 2.061 4,392 2,837 27 2 2 I 64 133 63 2 (a) 1,925 4.191 2,706 25 2 2 I 63 133 62 2 (b) 136 201 131 2 1 1
Urban 24 31 18 6 4 6 4 (a) 9 18 9 6 4 6 4 (b) 15 13 9
Dillision 2&3 Total 835 1,310 908 100 20 29 24 184 312 277 11 (a) 478 888 722 97 J3 23 22 162 299 262 12 (b) 357 422 186 3 7 6 2 22 13 15
Rural 511 870 690 90 14 21 23 152 275 237 12 (a) 422 784 629 88 J2 20 21 146 272 232 12 (b) 89 86 61 2 2 1 2 6 3 .5
Urban 314 440 218 10 6 8 1 32 37 40 (a) 56 104 93 9 1 3 1 16 27 30 (b) 268 336 125 1 5 5 16 }O 10
Major Group 23 Total 171 242 251 59 6 10 11 45 81 83 10 (a) ]03 187 182 59 6 10 11 38 76 78 10 (b) 68 55 69 7 5 5
Rural 117 186 190 59 6 10 11 38 73 76 10 (a) 98 IRO 173 59 6 10 11 36 73 74 10 (b) ]9 6 17 2 2
Urban 54 56 fil 7 8 7 (a) 5 7 9 2 3 4 (b) 49 49 52 5 5 .3
(a) : - With cultivation (0) :- Without cultivation

143
AND TOTAL NUMBER OF WORKERS ENGAGED IN HOUSEHOLD INDUSTRY IN ALL AREAS
20 % Sample)
7 to 9 months 10 months to 1 year Unspecified
House-Family workers Family workers
Hired House- Hired House-Family worker'
Hired holds Males Females workers holds Males Females workers hold. Males Females workers Code No.
15 16 17 18 19 20 21 22 23 24 25 26 1
TOTAl.
164 282 198 7 2.327 4.688 3-,025 82 155 281 171 30 All Industries )41 266 178 7 1.918 4,143 2,763 80 109 225 145 27 23 16 20 409 545 262 :2 46 56 26 3
U8 218 142 2.099 4.376 2.910 73 123 237 lSI 30 111 212 135 1,906 4,120 2.743 72 107 216 141 27
7 6 7 193 256 167 1 16 21 10 3
46 64 S6 7 228 312 lI5 9 32 44 10 30 54 43 7 12 23 20 8 2 9 4 16 10 13 216 289 95 1 30 35 16
42 75 33 2 1,885 4,033 2.647 28 SS 174 107 1 Division 0 40 75 3/ 2 1,746 3,830 2,516 27 79 163 101
2 2 139 203 131 J 9 II 6 I
39 72 31 2 1,871 4,015 2,638 24 85 170 104 1 38 72 30 2 1,744 3,824 2,514 23 78 160 99 1 1 127 191 124 I 7 JO 5 1
3 3 2 14 18 9 4 3 4 3 2 3 I 2 6 2 4 I 3 2 1 I 12 12 7 2 1 1
42 75 33 2 1,885 4,033 2.647 28 88 174 107 I Major Group 04 40 75 31 2 1,746 3,830 2,516 27 79 163 lOt
2 2 139 203 131 J 9 J 1 6
39 72 31 1.871 4.0J5 2,638 24 85 170 104 38 72 30 1,744 :1.824 2.514 23 7R 160 99
J 1 127 191 124 1 7 10 5
3 3 2 2 14 18 9 4 3 4 3 2 3 1 2 2 6 2 4 I 3 2 J 1 12- 12 7 2 I 1
122 207 165 5 442 655 378 54 67 107 64 29 • Divis/oil 2<13 IO} 191 147 5 172 313 247 53 30 62 44 27 21 16 18 270 342 131 I 37 45 20 2
79 146 III 5 228 36/ 272 49 38 67 47 29 73 140 105 5 162 296 229 49 29 56 42 27 6 6 6 66 65 43 9 11 5 1
43 61 54 214 294 }06 5 29 40 17 28 51 42 /0 /7 18 4 J 6 2 15 10 12 204 277 88 ) 28 34 15
31 50 51 83 90 98 49 6 11 8 Major Group 23 25 48 44 32 46 45 49 2 7 4
6 2 7 51 44 53 4 4 4
23 44 41 48 52 58 49 2 7 4 22 44 39 32 46 45 49 2 7 4
2 16 6 13
8 6 }O 35 38 40 4 .. 4 3 4 5 . . .. 5 2 S 35 38 40 4 4 4
Bika.I3-A
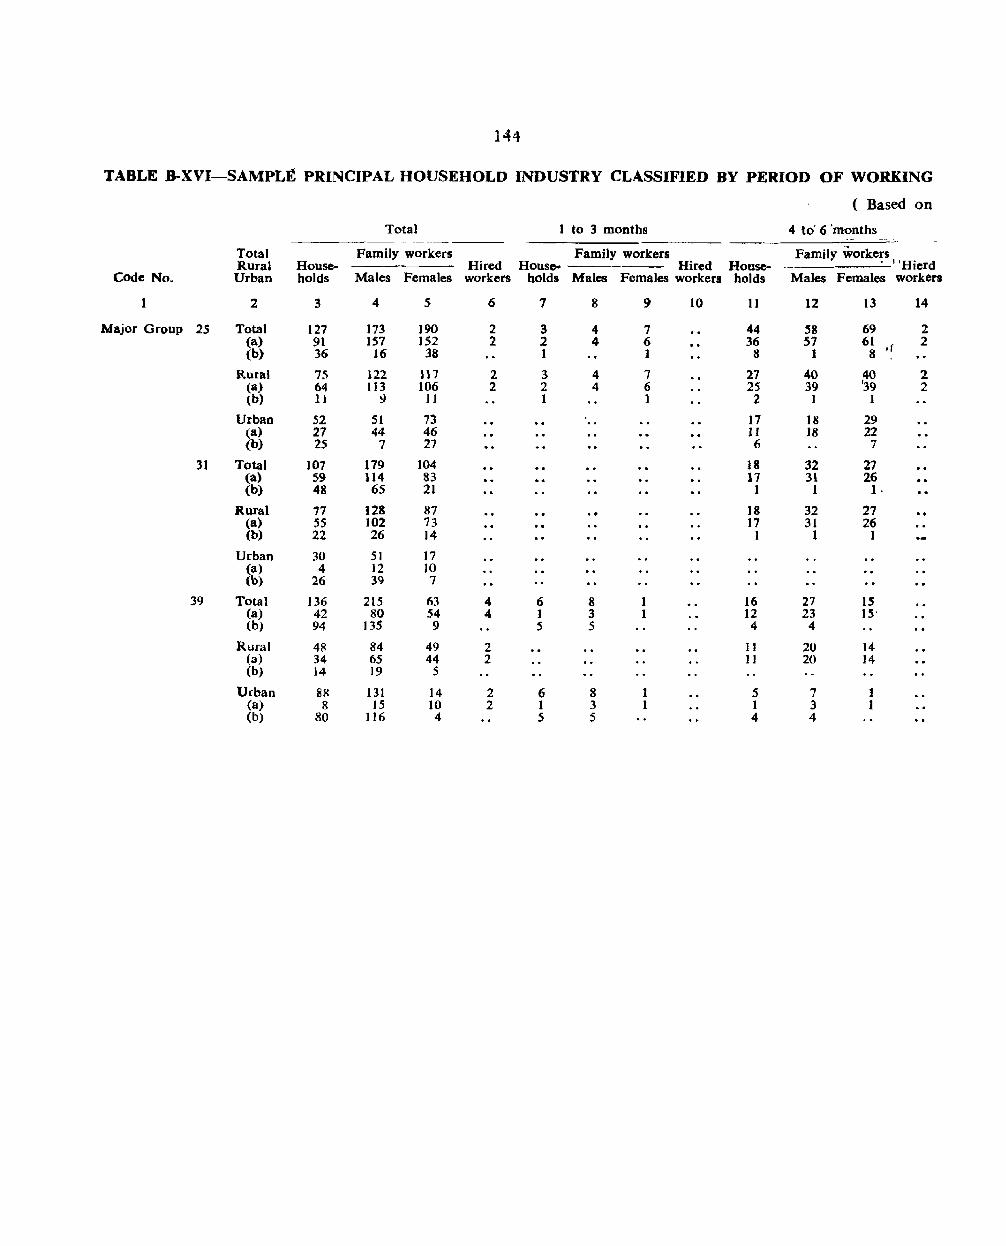
144
TABLE B-XVI-SAMPLE PRINCIPAL HOUSEHOLD INDUSTRY CLASSIFIED BY PERIOD OF WORKING
( Based on
Total 1 to 3 months 4 to' 6 'months
Total Family workers Family workers Family workers Rural HouseM Hired House- Hired House- . "Hicrd
Code No. Urban holds Males Females workers holds Males Females workers holds Males Females workers
1 2 3 4 5 6 7 8 9 10 II 12 13 14
Major Group 2S Total 127 ]73 190 2 3 4 7 44 58 69 2 (a) 91 157 152 2 2 4 6 36 51 61 , i 2 (b) 36 16 38 1 1 8 1 8
RUral 75 122 117 2 3 4 7 27 40 140 2
(a) 64 113 106 2 2 4 6 25 39 39 2 (b) 11 9 ) 1 1 I 2 I 1
Urban 52 51 73 17 ]8 29 (a) 27 44 46 1I 18 22 (b) 25 7 27 6 7
31 Total 107 179 104 18 32 27 (a) 59 114 83 17 31 26 (b) 48 65 21 1 1 1·
Rural 77 128 87 18 32 27 (a) 5S 102 73 17 31 26 (b) 22 26 14 1 1 1
Urban 30 51 17 (a) 4 12 )0 (b) 26 39 7
39 Total 136 215 63 4 6 8 1 16 27 15 (a) 42 80 54 4 ] 3 1 12 23 15' (b) 94 135 9 5 5 4 4
Rural 48 84 49 2 11 20 14 (a) 34 65 44 2 11 20 14 (b) 14 19 5
Urban 88 131 14 2 6 8 1 5 7 1 (a) 8 15 10 2 1 3 1 I 3 1 (b) 80 116 4 5 5 4 4

145
AND TOTAL NUMBER OF WORKERS ENGAGED IN HOUSEHOLD INDUSTRY IN ALL AREAS-Concld.
20 % Sample)
7 to 9 months 10 months to I year Unspecified ~~-~---- --~ -
Family workers Family workers Family workers House· Hired House· - Hired House- Hired holds Males Females workers holds Males Females workers holds Males Females workers Code No.
15 16 17 18 19 20 21 22 23 24 25 26 I
36 51 52 36 49 47 8 11 15 Major Group 2S 30 51 44 17 3S 30 6 10 11
6 8 19 14 17 2 1 4
17 29 25 21 38 32 7 II 13 16 29 24 15 31 26 6 10 11 1 1 6 7 6 I 1 2
19 22 27 15 11 15 2 14 22 20 2 4 4 5 7 13 7 11 2
15 32 26 57 90 41 11 2S 10 31 14 31 25 21 41 24 7 11 8
1 1 1 36 49 17 10 14 2
11 20 J6 41 65 36 7 11 8 10 19 IS 21 41 24 7 11 8 1 I 1 20 24 12
4 12 10 16 2S 5 10 14 2 4 12 10
16 25 5 10 14 2 ... 8 15 2 92 138 38 2 14 17 7 2 39 3 7 2 19 33 29 2 7 14 7 2 5 8 73 lOS 9 7 13
2 3 2 26 43 26 9 18 7 2 2 3 2 14 28 21 7 14 7 2
12 15 5 2 4
6 12 66 95 12 2 5 9 1 4 .5 .5 8 2 .5 8 61 90 4 5 9

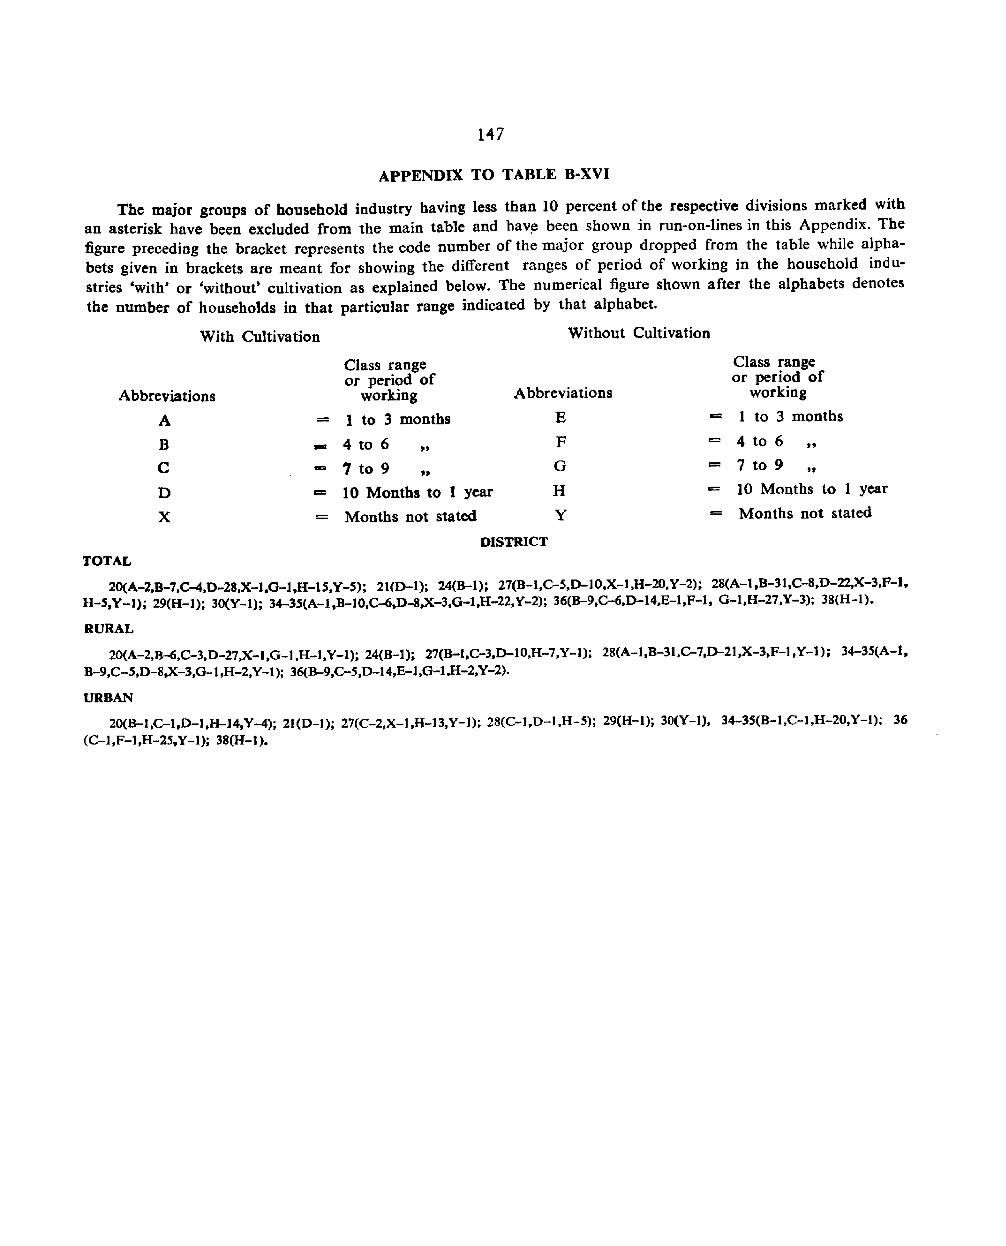
1047
APPENDIX TO TABLE BMXVI
The major groups of household industry having less than 10 percent of the respective divisions marked with an asterisk have been excluded from the main table and hav~ been shown in runMon-lines in this Appendix. The figure preceding the bracket represents the code number of the major group dropped from the table while alphabets given in brackets are meant for showing the different ranges of period of working in the household ind ustries 'with' or 'without' cultivation as explained below. The numerical figure shown after the alphabets denotes the number of households in that particular range indica ted by that alphabet.
With Cultivation
. Abbreviations
A
B
C
D
X
TOTAL
-=
Without Cultivation
Class range or period of
working Abbreviations
1 to 3 months E == 4 to 6 F =
" 7 to 9 G ==
" 10 Months to I year H ==
Months not stated y == DISTRICT
Class range or period of
working
1 to 3 months
4 to 6 " 7 to 9 " 10 Months to 1 year
Months not stated
20(A-2.B-7,C-4.D-28.X-l.G-l,H-lS,Y-S); 21(D-l); 24(B-l); 27(B-l.C-S,D-lO,X-l,H-20,Y-2); 28(A-l,B-31,C-S,D-22,X-3.F-l. H-S,Y-I); 29(H-l); 30(Y-I); 34-3SlA-l,B-lO,C-6,D-s,x-3.G-l.H-22.Y-2); 36(B-9.C-6,D-14.E-I,F-l, G-l,H-27.Y-3); 38(H-l).
RURAL
20(A-2,B-6,C-3.D-27,X-I,G-l.H-l,Y-l); 24(B-I); 27(B-l,C-3.D-IO,H-7.Y-l); 28(A-l,B-31,C-7,D-2I,X-3,F-l.Y-l); 34-35(A-l. B-9.C-S.D-S,x-3.0-1,H-2.Y-l); 36(B-9,C-5,D-14,E-l.G-l.H-2,Y-2).
URBAN
20(B-l.C-l.D-I.H-14,Y-4); 21(D-l); 27(C-2.X-l.H-13,Y-l); 2S(C-l.D-l,H-S); 29(H-l); 30(Y-J), 34-35(B-I,C-l,H-20,Y-l); 36 (C-l,F-J,H-25,Y-l); 38(H-l).
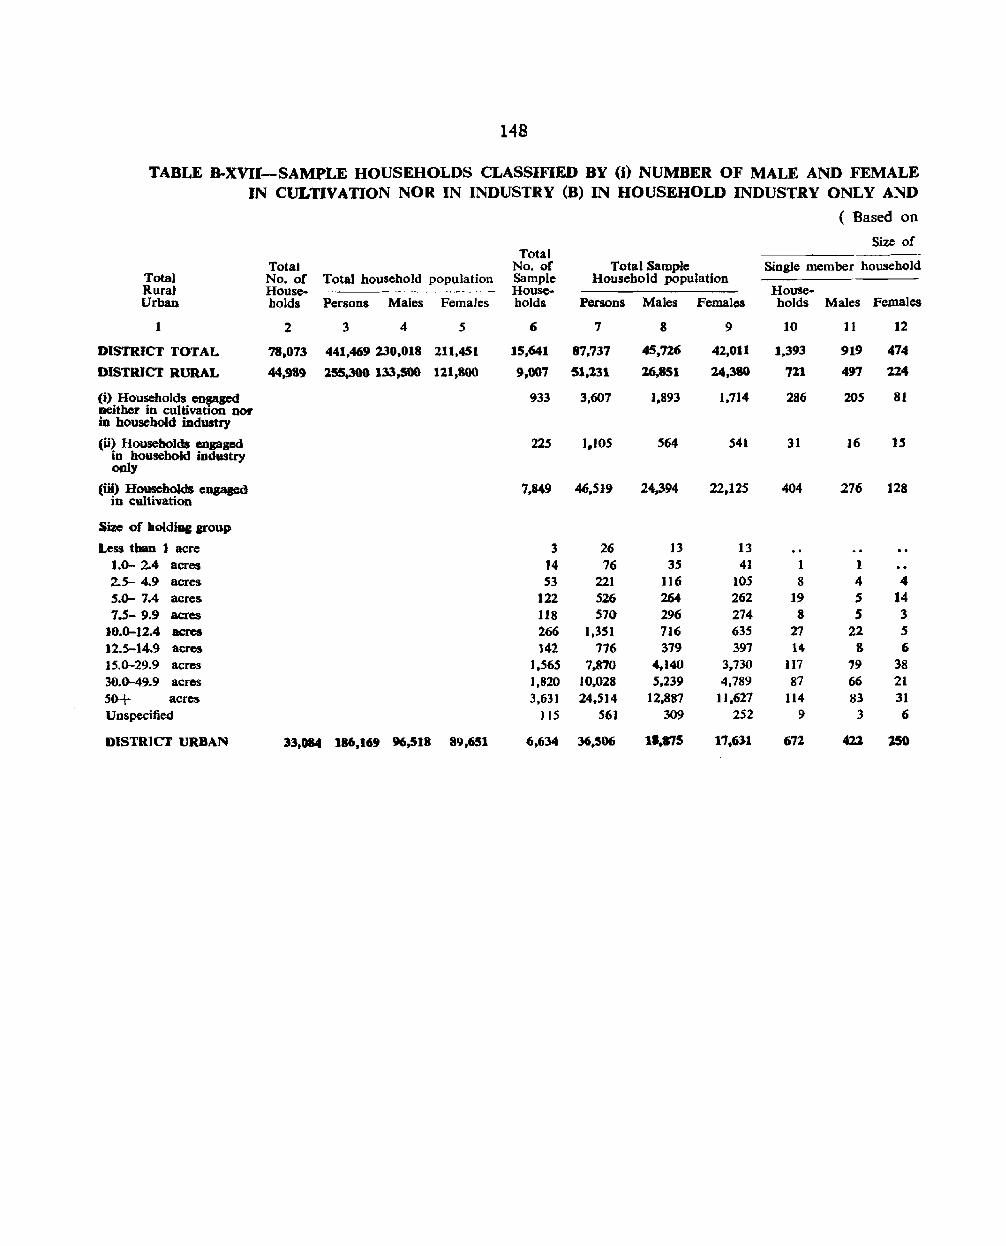
148
TABLE B-XVII-SAMPLE HOUSEHOLDS CLASSIFIED BY (0 NUMBER OF MALE AND FEMALE IN CULTIVATION NOR IN INDUSTRY (B) IN HOUSEHOLD INDUSTRY ONLY AND
( Based on
Size of Total
Total No. of Total Sample Single member household Total No. of Total household population Sample Household population Rura) House- --~~~-~~-~ -- House- House-Urban holds Persons Males Females holds Persons Males Females holds Males Females
1 2 3 4 5 6 7 S 9 10 11 12
DISTRICT TOTAL 78,073 441.469 :130,018 211.451 15,641 87.737 45,726 42,011 1.393 919 474
DISTRICT RURAL 44,989 lSS,300 133,500 121,800 9,007 51,231 :16,851 14,3S0 711 497 224
(i) Households engaged 933 3.607 1,893 1.114 286 lOS 81 neither in cultivation 001' in household industry
(ti) Households engaged 225 1,105 564 541 31 16 15 in household industry only
(iii) Households enaagcd 7.849 46.51-9 24.394 22,125 404 276 128 in cultivation
Size of iloidiDg group
Less tban 1 acre 3 26 13 13 1.0- 24 acres 14 76 35 41 1 1 2.5- 4.9 acres 53 221 116 105 8 4 4 5.0- 7.4 acres 122 526 264 262 19 S 14 7.5- 9.9 acres 118 570 296 274 8 5 3
10.0-12.4 acres 266 1.351 716 635 27 22 5 )2.5-14.9 acres 142 776 379 397 14 & 6 15.0-29.9 acres 1.565 7,870 4.140 3,730 II? 19 38 30.0-49.9 acres 1,820 10,028 5.239 4,789 87 66 21
5tH- acres 3,631 24.514 12.887 11.627 114 83 31 Unspecified }IS 561 309 252 9 3 6
DISTRICT URBAN 33.084 186,169 96,518 89.6!1 6,634 36.506 11.175 17.631 67:1 4ll l50
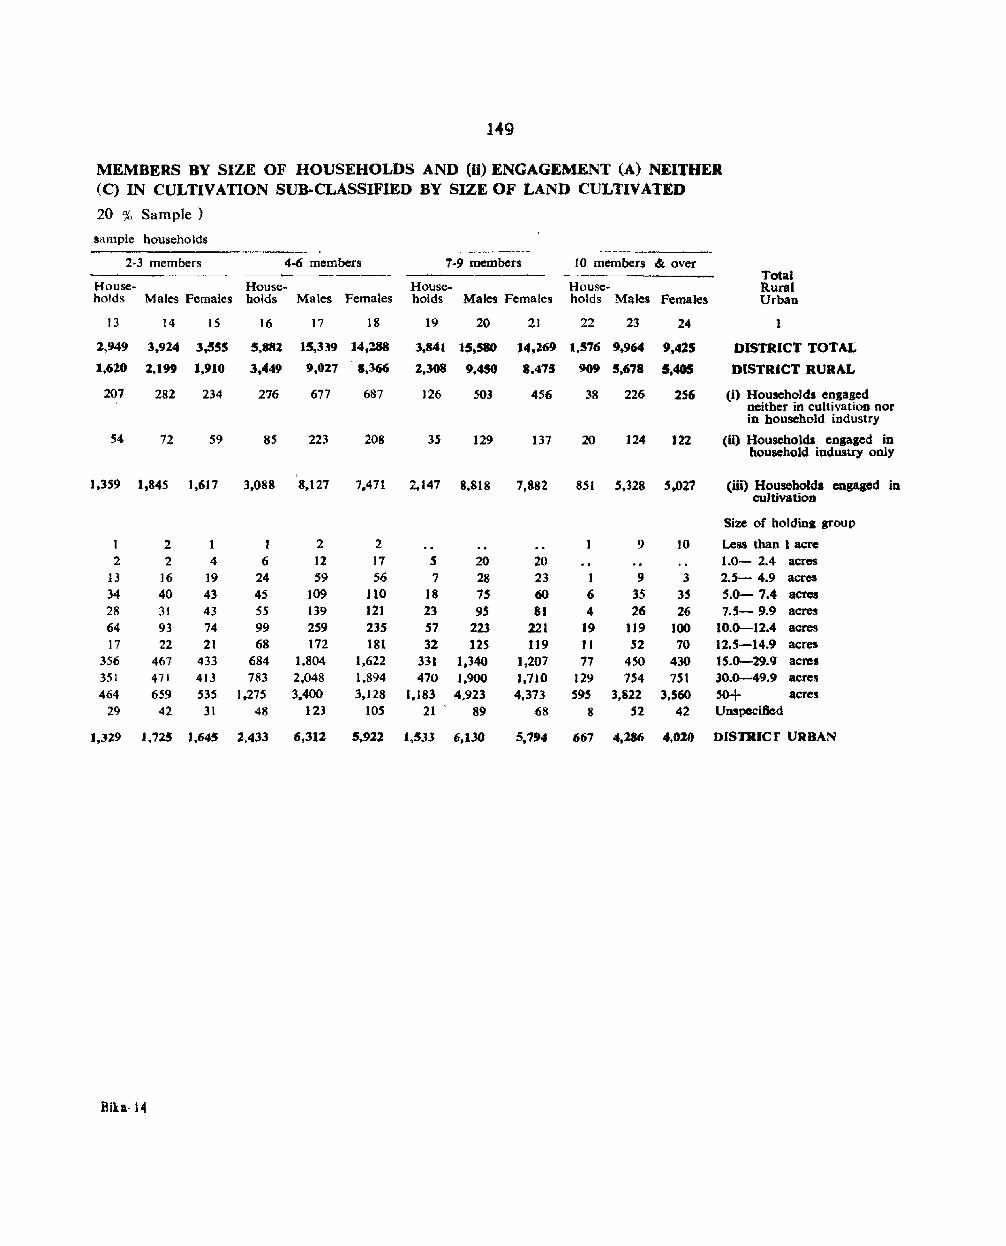
1~9
MEMBERS BY SIZE OF HOUSEHOLDS AND (ii) ENGAGEMENT (A) NEITHER (C) IN CULTIVATION SUB-CLASSIFIED BY SIZE OF LAND CULTIVATED
20 % Sample)
sample households ~---~ --.-----
2·3 members 4-6 members 7·9 members ro members " over ----~----- Total
House- House- House- House- Rural holds Males Females holds Males Females holds· Males Females holds Males Females Urban
13 14 15 16 17 ]8 19 20 21 22 23 24 1
1.949 3,924 3,555 S,88l IS.339 14,:!88 3.84l 15,580 14;269 1.516 9,964 9,425 DISTRICT TOTAL
1.620 2.199 1,910 3,449 9.017 8.366 2,308 9.450 8.475 909 5,678 5,405 DISTRICT RURAL
207 282 234 276 677 687 126 .503 456 38 226 256 (i) Households engaged neither in cultivation nor in household industry
54 72 59 85 223 208 35 129 137 20 124 122 <il} Households engaged io household industry only
1,359 1,845 1,617 3.088 8,127 7.471 2.147 8.818 7.882 851 5,328 5;027 (iii) Households COPied in cuJtivation
Size of hoI dine group
I 2 I I 2 2 1 9 to Less than 1 acre 2 2 4 6 12 J7 S 20 20 1.0- 2.4 acres
13 16 ]9 24 59 56 7 28 23 ] 9 3 2.'- 4.9 acres 34 40 43 45 109 110 18 75 60 6 35 35 5.0- 7.4 acres 28 31 43 5S 139 121 23 9S 81 4 26 26 7.5- 9.9 a~ 64 93 74 99 259 235 57 223 221 19 119 too 10.0-12.4 acres 17 22 21 68 172 181 32 125 119 II 52 70 12.5-14.9 acres
356 467 433 684 1,804 1,622 331 1,340 1,207 77 450 430 15.0-29.9 acres 351 471 413 783 2,048 1,894 470 1,900 J.710 129 754 7'1 30.0-49.9 acres 464 659 535 1.275 3.400 3,128 1.183 4,923 4.373 S95 3,822 3,560 50+ acres
29 42 31 48 123 105 21 89 68 8 52 42 Unspecified
t.329 1.725 1.645 2,433 6.311 5.922 1,533 6.130 5,194 667 4.186 4,Oll) DISTRIC r URBAN
Blh·14

150
SOCIAL AND CULTURAL TABLES
( Note on C-Series )
There are 8 tables in this series relating to Social and Cultural aspects. Table C-I has been prepared from Household Schedules on the basis of 20 per cent sample. All the other tables in this series are based on full count and give data regarding age, sex, marital status and education, separately for rural and urban areas, single year. age returns •. mo~her tOD~ue in alph.abetic~l order, religIon and classIficatton by lIteracy and llldustnal category of w"rkers and non-workers among Scheduled Castes and Scheduled Tribes for the district.
2. All the tables of this series have been reproduced in this book except Table C-VI on Bilingualism which can be seen in Part U-C (i) of the State Census Report wherein all tables of this series are contained.
Table C-I
3. This table is prepared on 20% sample from the Census Population Record Part II of the Household Schedule separately for the total, rural and urban areas of the district. The table is of sociological interest as it indicates the strength of the joint family system. It gives the composition of a household by family and non-family members. The family members have been classified into heads of household (who could be males or females) and their spouses, married sons and other married relations and never married, widowed and divorced or separated relations. As the definition of a census household also included outsiders residing with the family during enumeration, such persons have been shown in the table as unrelated persons.
4. The sample households of the rural areas have been classified into 3 categories viz. households engaged neither in cultivation nor in household industry, engaged in household industry only and engaged in cultivation. The households engaged in cultivation have further been classified by size of land holdings.
Table C-JI
5. This is an important demographic table prepared on full count. It distributes the popUlation by sex, age and marital status. The data has been presented for the district separately for rural and urban areas while those for tehsils for rural areas only. The population has been distributed into 14 age-groups which is further classified into four types of marital status viz. never married, married, widowed, divorced or separated. The age-groups followed in this table largely conform to the international requirements recommended by the United Nations Organisation.
6. This table is likely to be useful for studying the trends in the age of marriage. The data compiled here can be very well used for studying mortality in different marital statuses and also in different age-groups. The
data on married females by age-groups can be utilised for forecasting the future births from age specific birth rates. All the persons falling in age-group 0-9* have been treated as 'Never Married' for the purpose of this table.
Table C-III
7. This table distributes the total population by age, sex and educational levels. The popUlation has been distributed in to qUinquenial age·groups upto the age of 34 and the age-groups 35-44, 45-59 and 60+. The table has been compiled into three parts. Part A relates to all areas, Part B for urban areas of the district while Part C deals with rural areas down to tehsillevel. In Part 'A' and 'c' the educational levels are confined only to (i) Primary or Junior Basic and (ii) Matriculation & above while in Part 'B' these educational levels are much more elaborate as shown in Table B-III Part 'A'.
8. Thjs table can he utilised to measure the growth of literacy in the population as a whole as well as in urban and rural areas separately and in the different age-groups smce the last Census. The table is of special interest to the educational authorities for future planning and also to study the public attitudes towards adult edueation. In 1951 Census data was provided only about illiterate and literate classified into different age-groups on 10 per cent sample.
Table C-IV
9. This table has been prepared on full count and presents the distribution of popUlation by single year ages (0 to 100) and by sex. The age in year completed on 1-3-1961 bas been given but the infants who could Dot complete one year on 1-3-1961 have been shown under the age '0' while all old persons aged above hundred have been clubbed together and are shown against item 'Over hundred.' The data has only been presented for the district as a whole, its urban and rural breakups can be seen in Part II-C 0) of State Census Report.
10. The data presented in this demographic table is useful for the Census Actuary for computing mortality rates from the age data of the earlier censuses and for the preparation of life tables. It also provides data for studying bias in age returns at the Census.
Table C-V
11. This table presents data separately for total, rural and urban population of the district and only for total for tehsils classified by sex of persons speaking a particular language or a dialect as mother tongue. The mother tongues are arranged in this table in an alphabetical order.
-Marital Status of this group finds place in a separate monograph-Child Marriages in Rajasthan.
151
12 According to Census 1961 'Mother Tongue' is the language or dialect spoken in childhood by the person's mother to the person or mainly spoken in the household.
13. This table is of great interest to philologists in view of a large variety of languages and dialects spoken in the district and will be of great assistance for ensuring the implementation of the various safeguards granted to the linguistic minorities under the constitution.
Table C-VII
14. In this table the population has been distributed in six main religions and the figures of all other religions including the figures of those having 'Indefinite belief' such as Atheists and Agnostics have been clubbed together and noted under headilng 'Other Religions and Persuasions'. Separate heading 'Religion Dot stated' has also been Provided for those who do not follow any religion and have given out only their nationalities such as Goans, Israelists, Italians etc.
Bika. 14-A
15. The data of this important sociological table has been presented separately for total, rural and urban areas of the district and also for each tehsil.
Table C-VnI
16. This is a new table compiled in the 1961 Census and presents data separately for total, rural and urban areas of the district and further up to tehsil level for rural areas only. It has been prepared into two parts A & B. Part A presents the data of Scheduled Castes and Part B of Scheduled Tribes.
17. It gives the distribution of population by literacy classification of workers into difi'ere,Bt industrial categories no based the Standard Industrial Classification and non-workers. Literacy figures of these communi ties given for the first time in the present Census.
18. In 1951 Census data for Sched1.11ed Castes and -Scheduled Tribes was provided only about total number of persons belonging to Scheduled Castes and Scheduled Tribes c1assified by sex for the districts and upto sub-division.

152
TABLE C-I-COMPOSITION OF SAMPLE HOUSEHOLDS BY RELATIONSHIP TO HEAD OF FAMILY CLASSIFIED BY SIZE OF LAND CULTIVATED
Composition of Households
Never married, Spouses of widowed and Unrela-
Total Total sample household Heads of Heads of divorced or sep- ted per-No. of population households households Married relations arated relations sons Sample House- Other Other
District holdl Persons Males Females M P M F Sons Males Females M F M F
I 2 3 4 S 6 7 8 9 10 11 12 13 14 IS 16
DISTRICT TOTAL 15.641 87,737 45,726 42,011 14,284 1,340 13 11,570 4,899 1,849 8,581 24,386 20.438 295 81
DISTRICT RURAL 9,007 51,231 26,851 24,380 8,420 573 8 6,731 3,084 1,136 5,310 14,089 11,734 114 32
(i) Households engaged 933 3.607 1,893 1,714 770 160 469 96 57 269 929 798 41 18 neither in cultivati-on nor in household industry
(ii) Households engaged l25 1,105 564 541 195 30 .. 148 51 24 100 291 263 3 in household indus-try only
(iii) Households engaged 7,849 46,519 24,394 22,125 7,455 383 8 6,114 2,937 1,055 4,941 12,869 10,673 70 14 in cultivation
Size of holding group
Less than 1 acre 3 26 13 ]3 2 ] .. 2 4 ]0 6 1.0- 2.4 acres 14 76 35 41 14 11 6 12 15 18 2.5- 4.9 acres 53 221 116 lOS 41 6 40 11 2 15 56 44 5.0- 7.4 acres 122 526 264 262 96 26 81 27 14 48 127 107 7.5- 9.9 acres 118 570 296 274 109 9 97 23 6 45 157 123 1
10.0-12.4 acres 266 1,351 716 635 251 15 207 S3 30 122 380 289 2 2 12.5-14.9 acres 142 776 379 397 125 17 106 38 14 71 202 203 2 15.0-29.9 acres ].565 7,870 4.140 3,730 1,460 100 4 1,175 340 107 628 2,218 1,825 11 2 30.0-49.9 acres 1,820 10,028 5,239 4,789 1,727 92 3 1.430 534 149 905 2.814 2,362 12 50+ acres 3,631 24,514 12,387 11,627 3,518 109 1 2,882 1.876 720 3,OSI 6,731 5,576 41 9
Unspecified 115 561 309 252 106 8 83 29 12 40 159 120 3 1
DISTRICT URBAN 6.634 36,506 18,875 17,631 5,864 767 5 4,839 1.815 713 3,272 10,297 8,704 181 49
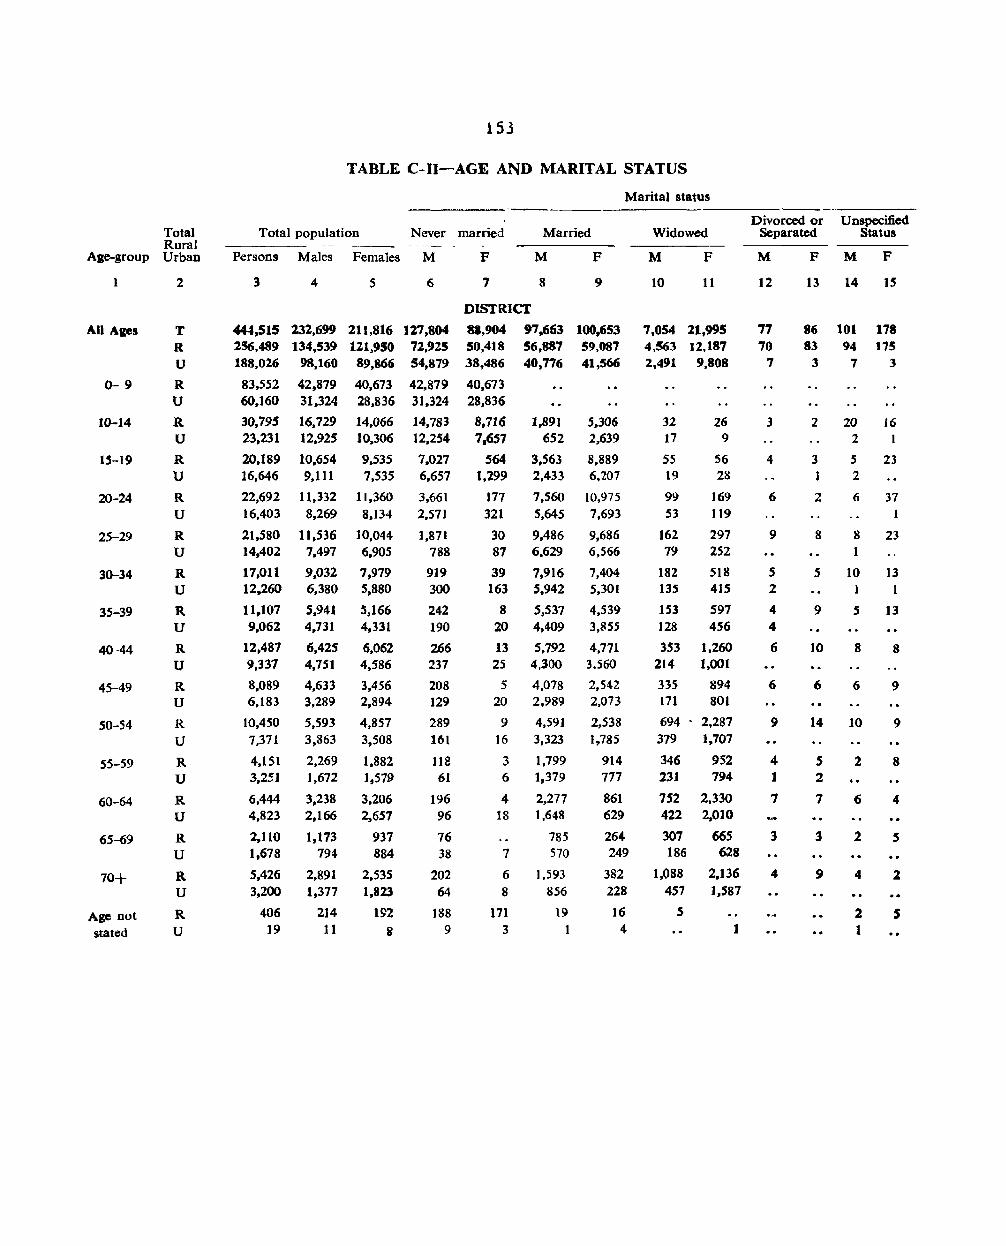
Total Rural
Ase-group Urban
1
All Alles
0- 9
10-14
15-19
20-24
25-29
30-34
35-39
40-44
45-49
50-54
55-59
60-64
65-69
70+
Age not stated
2
T R U
R U
R U
R U
R
U
R U
R U
R U
R U
R U
R U
R U
R U
R U
R U
R U
153
TABLE C-II~AGE AND MARITAL STATUS
Total population ---
Persons Males Females
3 4 5
444,515 232,699 211,816 256,489 134,539 121,950 188,026 98,160 89,866
83,552 60,160
30,195 23,231
20,189 16,646
22,692 16,403
21,580 14,402
17,011 12,260
11.107 9,062
12,487 9,337
8.089 6.183
10,450 7,371
4.151 3.251
6.444 4.823
2,110 1,678
5,426 3,200
406 19
42,879 31.324
16,729 12,925
10,654 9.111
11.332 8,269
11,536 7.497
9,032 6,380
5.941 4,731
6,425 4,751
4,633 3,289
5,593 3,363
2,269 1.672
3,238 2,166
1,173 794
2,891 1,377
214 11
40,673 28,836
14.066 10.306
9,535 7,535
11,360 8,134
10.044 6,905
7,979 5.880
5,166 4,331
6,062 4.586
3,456 2,894
4,857 3,508
1,882 1,579
3.206 2,657
937 884
2,535 1,823
1~2
8
Marital status
Never married Married Widowed
M F M F M F
6 7 8 9 10 II
DtSTRICI'
127,804 72,925 54,879
42,879 31.324
14,783 12,254
7.027 6.657
3,661 2.571
1,871 788
919 300
242 190
266 237
208 129
289 161
118 61
196 96
76 38
202 64
188 9
81,904 50,418 38,486
40,673 28,836
8,716 7.657
564 1,299
177 321
30 87
39 163
8 20
13 25
5 20
9
16
3 6
4 18
7
6 8
171 3
97,663 100,653 56,887 59,087 40 t776 41,566
1.89J 652
3,563 2,433
7,560 5.645
9.486 6,629
7.916 5,942
5,537 4,409
5,792 4,300
4,078 2.989
4,591 3,323
1,799 1,379
2,277 1,648
785 570
1,593 856
19
5,306 2.639
8,889 6.207
10,975 7,693
9,686 6,566
7,404 5,301
4,539 3,855
4,771 3,560
2,542 2.073
2,538 1,785
914 777
861 629
264 249
382 228
16 4
7,054 21,995 4,563 12,187 2,491 9,808
32 26 17 9
55 56 19 28
99 169 S3 119
162 297 79 252
182 518 135 415
153 597 128 456
353 1,260 214 1.001
335 894 171 801
694 2,287 379 1.707
346 952 231 794
752 2,330 422 2,010
307 665 186 628
1,088 2,136 457 J.587
5 1
Divorced or Separated
M F
12
77 70
7
3
4
6
9
S 2
4 4
6
6
9
4 I
7
3
4
13
86 83
3
2
3
2
8
5
9
10
6
14
5 2
7
3
9
Unspecified Status
M F
14
101 94
7
20 2
5 2
6
8 1
10 1
5
8
6
10
2
6
2
4
2 1
15
178 175
3
16 I
23
37
23
13 1
13
8
9
9
8
4
s
2
s
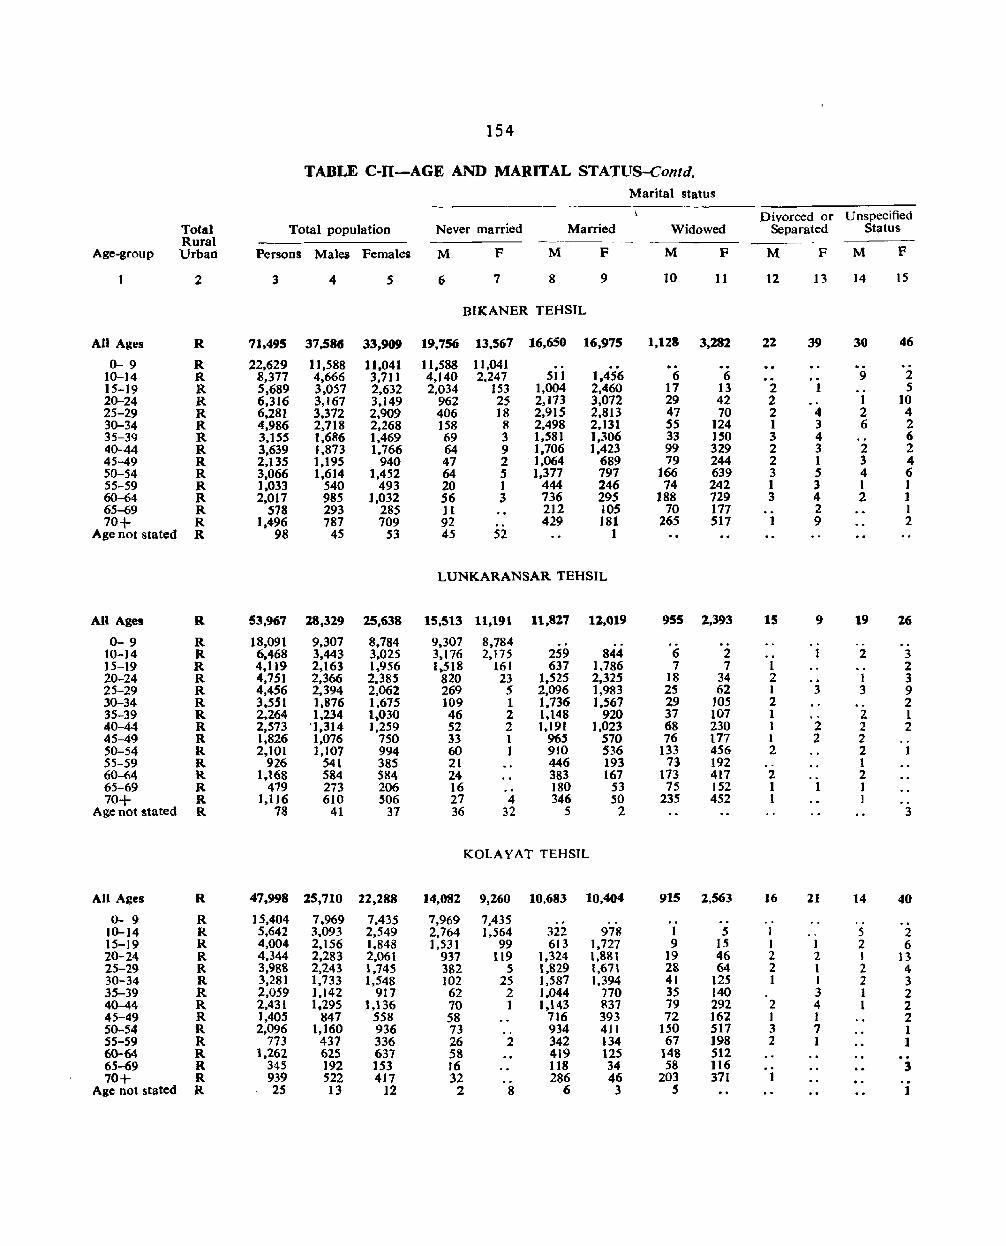
154
TABLE C-ll-AGE AND MARITAL STATUS-Contd. Marital status
Divorced or Unspecified Total Total population Never married Married Widowed Separated Status Rural -----
Age-group Urban Persons Males Females M F M F M F M F M F
2 3 4 5 6 7 8 9 10 11 12 13 14 15
BIKANER TEHSIL
AU Ages R 71,495 37.5BG 33,909 19,756 13.567 16,650 16,975 1.128 3,282 22 39 30 46
0-9 R 22,629 11,588 11,041 11,588 11,041 10-14 R 8,377 4,666 3,711 4,140 2,247 511 1.456 6 6 9 2 15-]9 R 5,689 3,057 2,632 2,034 153 1,004 2,460 17 13 2 1 5 20-24 R 6,316 3,167 3.149 962 25 2,173 3.072 29 42 2 1 10 25-29 R 6.281 3.372 2.909 406 18 2.915 2.813 47 70 2 4 2 4 30-34 R 4,986 2.718 2.268 158 8 2,498 2,131 55 124 1 3 6 2 35-39 R 3,155 1,686 1,469 69 3 1,581 1,306 33 150 3 4 6 40-44 R 3,639 1,873 1.766 64 9 1,706 1,423 99 329 2 3 2 2 45-49 R 2,135 1.195 940 47 2 1,064 689 79 244 2 1 3 4 50-54 R 3.066 1,6]4 1,452 64 5 1,377 797 166 639 3 5 4 6 55-59 R ].033 540 493 20 1 444 246 74 242 1 3 1 1 60-64 R 2.017 985 1,032 56 3 736 295 188 729 3 4 2 )
65-69 R 578 293 285 11 212 105 70 177 2 I 70+ R 1,496 787 709 92 .. 429 181 265 517 1 9 2
Age not stated R 98 45 53 45 52 1
LUNKARANSAR TEHSIL
All Agq R 53.967 18,319 25,638 15.513 11,191 11,817 11,019 955 1,393 15 9 19 26
0-9 R 18,091 9,307 8.784 9.307 8,784 .. .. 10-14 R 6.468 3.443 3.025 3.176 2,175 259 844 6 2 .. 2 3 15-19 R 4.119 2,163 1,956 1,518 161 637 1,786 7 7 1 2 20-24 R 4.751 2.366 2.385 820 23 1.525 2,325 18 34 2 1 3 25-29 R 4,456 2.394 2.062 269 5 2,096 1.983 25 62 I 3 3 9 30-34 R 3,551 1.876 1,615 J09 1 1.736 1,567 29 105 2 2 35-39 R 2.264 1.234 1,030 46 2 1.148 920 37 107 1 2 1 40-44 R 2,573 ').314 1,259 52 2 1.191 1,023 68 230 1 2 2 2 45-49 R 1.826 1,076 750 33 1 965 570 76 177 1 2 2 .. SO-54 R 2,101 1,107 994 60 1 910 536 133 456 2 2 1 55-59 R 926 541 385 21 446 193 73 192 1 60-64 R 1.168 584 584 24 383 167 173 417 2 2 65-69 R 479 273 206 ]6 180 53 75 152 1 1 1 70+ R l,lJ6 610 506 27 4 346 50 235 452 1 1
Age not stated R 78 41 37 36 32 5 2 3
KOLA Y AT TEHSIL
All Ages R 47.998 25,710 22,288 14,082 9,260 10.683 10,404 915 2.563 16 21 14 40
0-9 R 15,404 7.969 7,435 7,969 7,435 .. . . . . . . 10-)4 R 5.642 3,093 2,549 2,764 1,564 322 97g I 5 J .. 5 2 15-]9 R 4,004 2,156 1.848 1,531 99 613 ],721 9 15 1 ] 2 6 20-24 R 4.344 2,283 2,061 937 119 1,324 1,881 19 46 2 2 1 13 25-29 R 3,988 2,243 1.745 382 5 1,829 1,671 22 64 2 1 2 4 30-34 R 3,281 1,733 1,548 102 25 1,587 1,394 41 125 1 I 2 3 35-39 R 2,059 1,142 917 62 2 1.044 770 35 140 3 1 2 40-44 R 2,431 1,295 1.136 70 1 1,143 R37 79 292 2 4 1 2 45-49 R 1,405 847 558 58 716 393 72 162 1 1 2 50-54 R 2,096 1.160 936 73 .. 934 411 150 517 3 7 1 55-59 R 773 437 336 26 2 342 ]34 67 198 2 1 1 60-64 R 1,262 625 637 58 419 125 148 512 65-69 R 345 192 153 16 118 34 58 116 3 70+ R 939 522 417 32 .. 286 46 203 371 1
Age not stated R 25 13 12 2 8 6 3 5 1
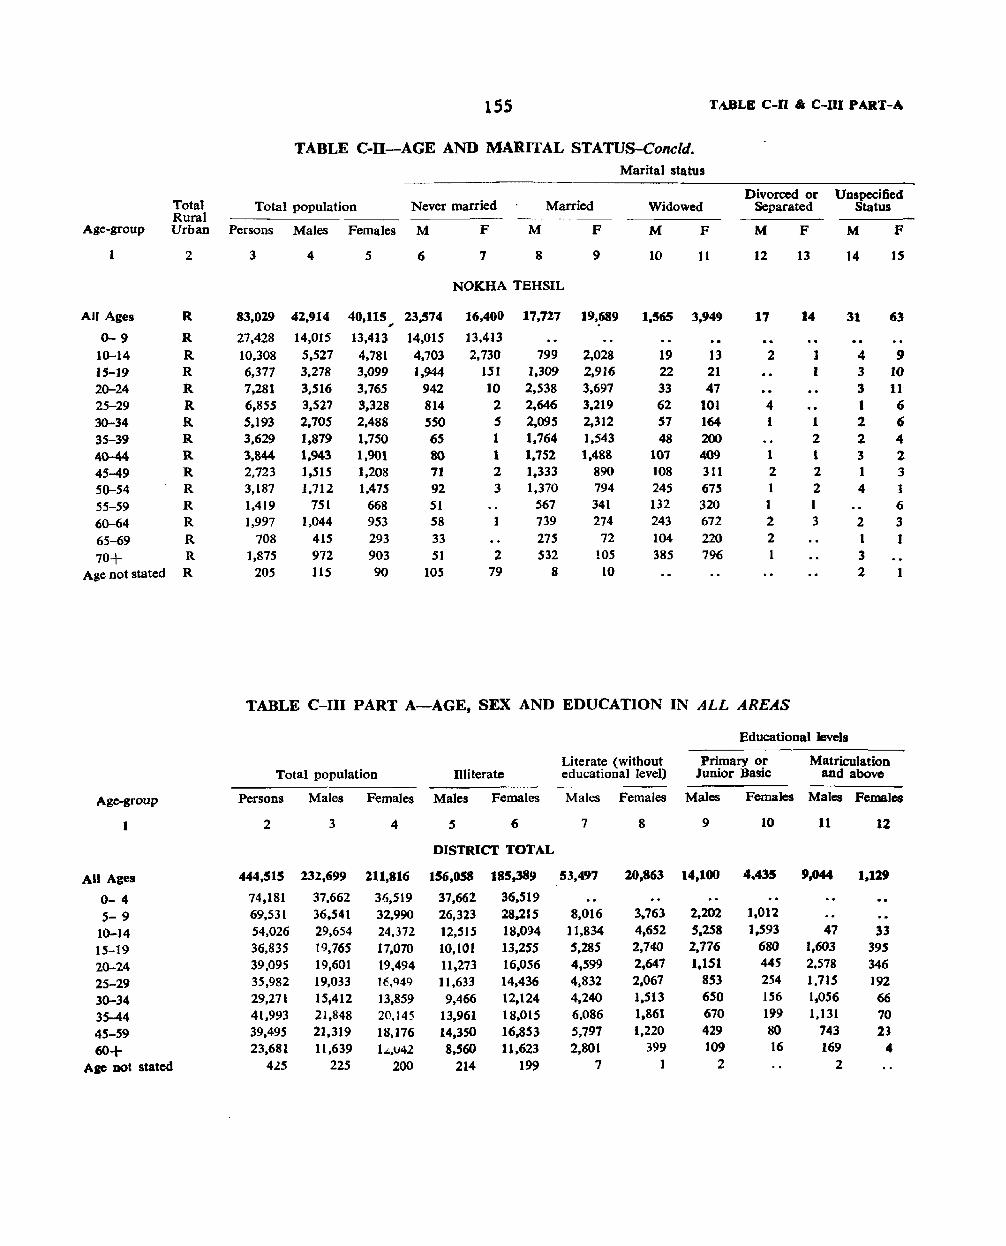
155 TABLE C-D " C-III PART-A
TABLE C-ll-AGE AND MARITAL STATUS-Cone/d. Marital status
Divorced or Unspecified Total Total population Never married Married Widowed Separated Status Rural
Age-group Urban Persons Males Females M F M F M F M F M F
1 2 3 4 5 6 7 8 9 10 11 12 13 14 IS
NOKHA TEHSIL
All Ages R 83,029 42,914 40,115 _, 23.574 16,400 17,727 19,689 1.565 3,949 17 14 31 63
0-9 R 27,428 14,015 13,413 14.015 13.413 10-14 R 10,308 5,527 4,781 4.703 2,730 799 2,028 19 13 2 1 4 9 15-19 R 6,377 3.278 3.099 1,944 151 1.309 2.916 22 21 I 3 10 20-24 R 7.281 3,516 3,765 942 10 2,538 3,697 33 47 3 11 25-29 R 6,855 3,527 3,328 814 2 2.646 3.219 62 101 4 1 6 30-34 R 5.193 2,705 2,488 550 5 2.095 2,312 57 164 1 1 2 6 35-39 R 3.629 1,879 1,750 65 1 1.764 1.543 48 200 2 2 4 4{)-44 R 3,844 1.943 1,901 SO 1 1,752 1,488 107 409 1 1 3 2 45-49 R 2,723 1,515 1.208 71 2 1,333 890 108 311 2 2 1 3 50-54 R 3,187 1,712 1,475 92 3 1.370 794 245 675 2 4 1 55-59 R 1,419 751 668 51 567 341 132 320 1 I 6 60-64 R 1,997 1,044 953 58 1 739 274 243 672 2 3 2 3 65-69 R 708 415 293 33 275 72 104 220 2 1 1
70+ R 1,875 972 903 51 2 532 105 385 796 1 3 Age not stated R 205 115 90 105 79 8 10 2 1
TABLE C-III PART A-AGE, SEX AND EDUCATION IN ALL AREAS
Educational levels
Literate (without Primary or Matriculation Total population llliterate educational level) Junior Basic and above
Age-group Persons Males Females Males Females Males Females Males Females Males Females
I 2 3 4 5 6 7 8 9 10 11 12
DISTRICT TOTAL
All Ages 444.515 232,699 211,816 156.058 185,389 53,497 20,863 14,100 4.435 9,044 1,129
0- 4 74,181 37,662 36,519 37,662 36,519
5- 9 69,531 36,541 32,990 26,323 28.215 8.016 3.763 2,202 1,012
10-14 54,026 29,654 24,372 ]2,515 18,0~4 11,834 4,652 5.258 1.593 47 33
15-19 36,835 I 9,765 17,070 10.tOl 13,255 5,285 2,740 2.776 680 1,60.3 395
20-24 39,095 19,601 19,494 11,273 16,056 4,599 2,647 1,151 445 2.578 346
25-29 35,982 19,033 16,949 11,633 14.436 4,832 2,067 853 254 1.715 192
30-34 29,271 ]5,412 13,859 9,466 12,124 4,240 1.513 650 156 1,056 66
35-44 41,993 21,848 20.145 13,961 18,015 6,086 1.861 670 199 1.131 70
45-59 39,495 21,319 ]8,176 14,350 16.853 5,797 1.220 429 80 743 23
60+ 23.681 11,639 1 ... ,U4l 8,560 ll,623 2,801 399 109 16 169 4
ASC Dot stated 415 225 200 214 199 7 1 2 2

156
TABLE C-1I1 PART B-AGE, SEX AND EDUCATION IN URBAN AREAS ONLY
Educational levels ~--~-- ---- - --~ ----- -~~--~--
Technical Non-techn ica I diploma not diploma not
Literate (without Primary or Matriculation or equal to equal to Total popUlation IUiterate educational level) Junior Basic Higher Secondary degree degree
---~--- --- - -ABC-group Persons Males Females Males Females Males Females Males Females Males Females Males Females Males Females
2 3 4 5 6 1 8 9 10 11 12 13 14 IS 16
DISTRICT URBAN
All Aiel 188.026 98,160 19,866 4tI.9Sl 67,696 34.457 17.609 8,743 3.470 5,930 835 19 :1 7S . let
0-4 30.455 15,661 14,78S 15,667 14,788 5-9 29,705 15.657 14.048 9,732 10,357 4.701 2,962 l.224 729
10-14 23.231 12,925 )0.306 2,131 5.178 7.117 3,905 3.030 1,191 47 32 .. 1S-19 16.646 9,111 1,535 2.231 4.246 3,542 2.343 1,848 562 1.387 344 2 20-24 ]6,403 8,269 8,134 2.426 S.2l6 2,923 2.227 764 360 1,637 226 3 1 ]5 4 25-29 14,402 7.497 6,905 2,494 4.740 2,981 1.761 552 218 974 129 1 8 10 30-34 12.260 6.380 5.880 2,204 4.385 2,801 1.294 431 137 595 4S 2 16 1 35-44 18,399 9,482 8,917 3,718 7,006 4,263 1,659 475 184 686 46 5 1 20 4 45-59 16.805 8,824 1.981 3,659 6,780 4.135 1,106 322 73 481 12 6 12 3
60+ 9,701 4,337 5,364 2,083 4,992 1,992 352 96 16 123 1 2 4 2 Aae not stated 19 11 8 8 8 2 1
Educational levels
University Technical degree or diploma equal to degree or post-graduate degree degree or 'post- .~--~-
graduate degree Veterinary other than tech- and
nical degree Engineering Medicine Agriculture dairying Technology Teaching Others ._------ - ----- ------- ~
Ale·sroup Males Females Males Females Males Females Males Females Males Females Males Females Males Females Males Females
1 17 18 19 20 21 22 23 24 25 26 27 28 29 30 31 32
AU Ages 1,827 ll4 7 63 12 2 1 82 2
0- 4-S- 9
10-14 ]5-19 93 38 8
20-24 451 98 I 7 I 40 25-29 467 44 1 6 2 13
30-34 30~ 16 1 Ii 2 9
35-44 289 14 3 14 3 9
45-59 ]89 .. 15 3 3
6O-t- 35 2 .. Age nOt staled
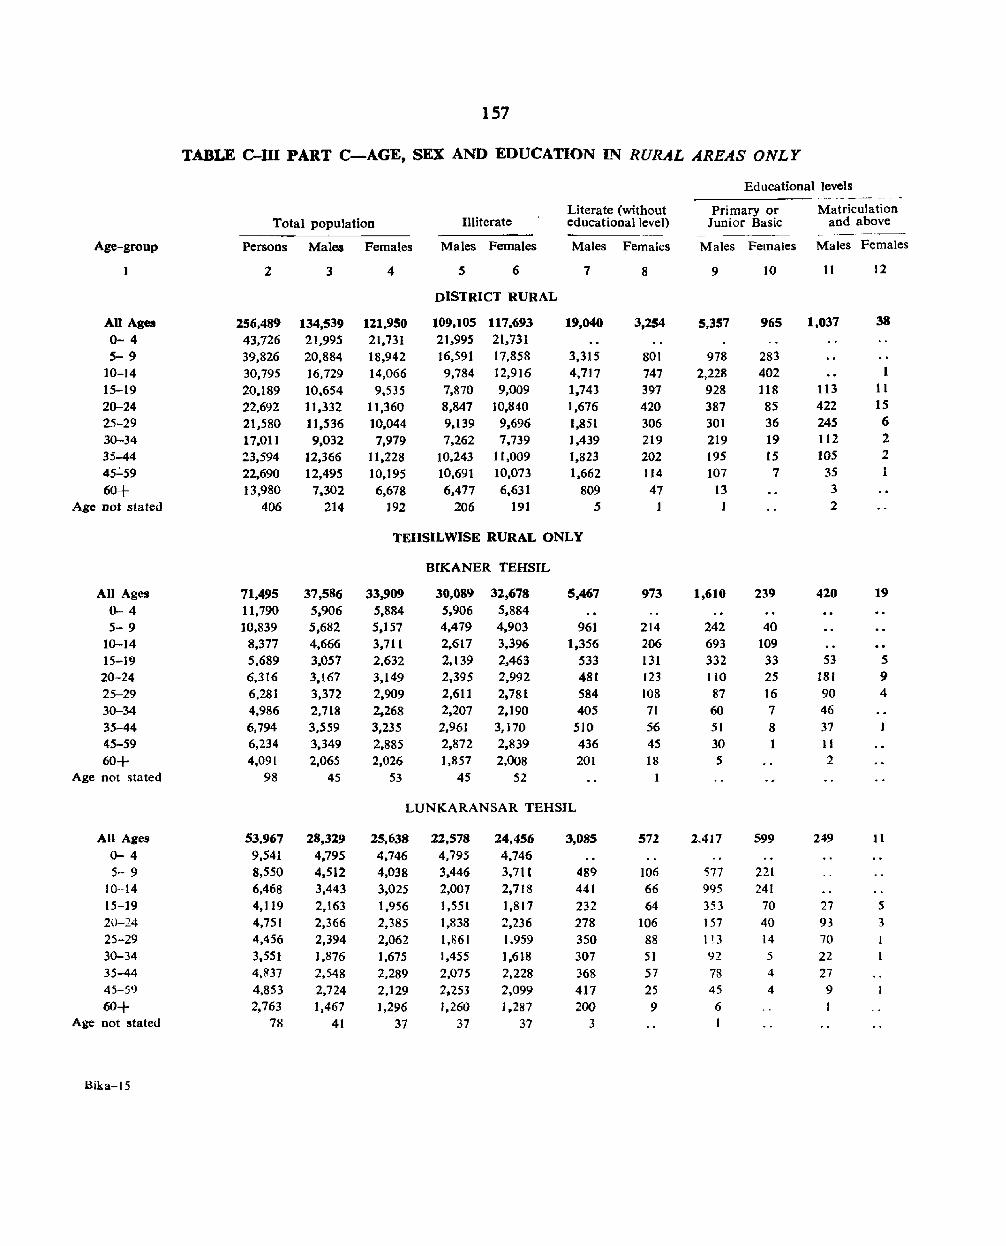
157
TABLE c-m PART C-AGE, SEX AND EDUCATION IN RURAL AREAS ONLY
Educational levels ----- --
Literate (without Primary or Matriculation Total population Illiterate educational level) Junior Basic and above
Age-group Persons Males Females Males Females Males Females Males Females Males Females
2 3 4 5 6 7 8 9 10 11 12
DISTRICT RURAL
All Ages 256,489 134.539 121,950 109,105 117,693 19,040 3,254 5,357 965 1,037 38
0- 4 43,726 21,995 21.731 21,995 21,731 S- 9 39,826 20,884 18.942 16,591 17.858 3,315 801 978 283
10-14 30,795 16,729 14,066 9,784 12,916 4,717 747 2,228 402 1
15-19 20.189 10.654 9.535 7.870 9,009 1.743 397 928 118 113 11
20-24 22,692 11,332 11,360 8,847 10,840 1,676 420 387 8S 422 15
25-29 21,580 11.536 10,044 9,139 9,696 1,851 306 301 36 245 6
30-34 17.011 9,032 7,979 7,262 7,739 1.439 219 219 19 112 2
35-44 23,594 12,366 If ,228 10.243 11,009 1,823 202 195 15 105 2
45":"59 22,690 12,495 10,]95 10,691 10,073 1.662 114 107 7 35
60+ 13,980 7.302 6,678 6,477 6.631 809 47 13 3 Age DOt stated 406 214 192 206 191 5 2
TEHSILWISE RURAL ONLY
BfKANER TEHSIL
All Ages 71,495 37,586 33.909 30.089 32,678 5,467 973 1,610 239 420 19 0-4 11,790 5,906 5.884 5,906 5,884 5- 9 10,839 5,682 5,157 4,479 4.903 961 214 242 40
10-14 8.377 4,666 3.711 2,617 3,396 1,356 206 693 109 15-1~ 5,689 3,057 2.632 2,139 2.463 533 131 332 33 53 5 20-24 6,3t6 3,167 3,149 2,395 2,992 481 123 110 25 181 9 25-29 6.281 3,372 2,909 2,611 2.781 584 108 87 16 90 4 30-34 4,986 2.7l8 2,268 2,207 2,190 405 71 60 7 46 35-44 6,794 3,559 3,235 2,961 3,170 510 56 51 8 37 45-59 6,234 3,349 2,885 2,872 2,839 436 45 30 1 II
60+ 4,091 2,065 2,026 1,857 2,008 201 18 5 2 Age DOt stated 98 45 53 45 52
LUNKARANSAR TEHSIL
All Ages 53.967 28,329 25,638 22,578 24,456 3,085 S72 2,417 599 249 Jl
0-4 9,541 4,795 4,746 4.795 4.746 5- 9 8,550 4,512 4,038 3,446 3.711 489 106 'i77 221
10--14 6,468 3,443 3,025 2,007 2,718 441 66 995 241 15-19 4,119 2,163 1,956 1,551 1,817 232 64 353 70 27 5 20-24 4,751 2,366 2,385 1.838 2.236 278 106 157 40 93 3
25-29 4,456 2,394 2,062 1,861 1.959 350 88 1!3 14 70 30-34 3.551 1,876 1,675 1.455 1,618 307 51 92 5 22 35-44 4.R37 2.548 2.289 2,075 2,228 368 57 78 4 27 45-59 4,853 2,724 2,129 2.253 2,099 417 25 45 4 9 60+ 2.763 1,467 ],296 1,260 1.287 200 9 6
Age not stated 78 41 37 37 37 3
Bika-15
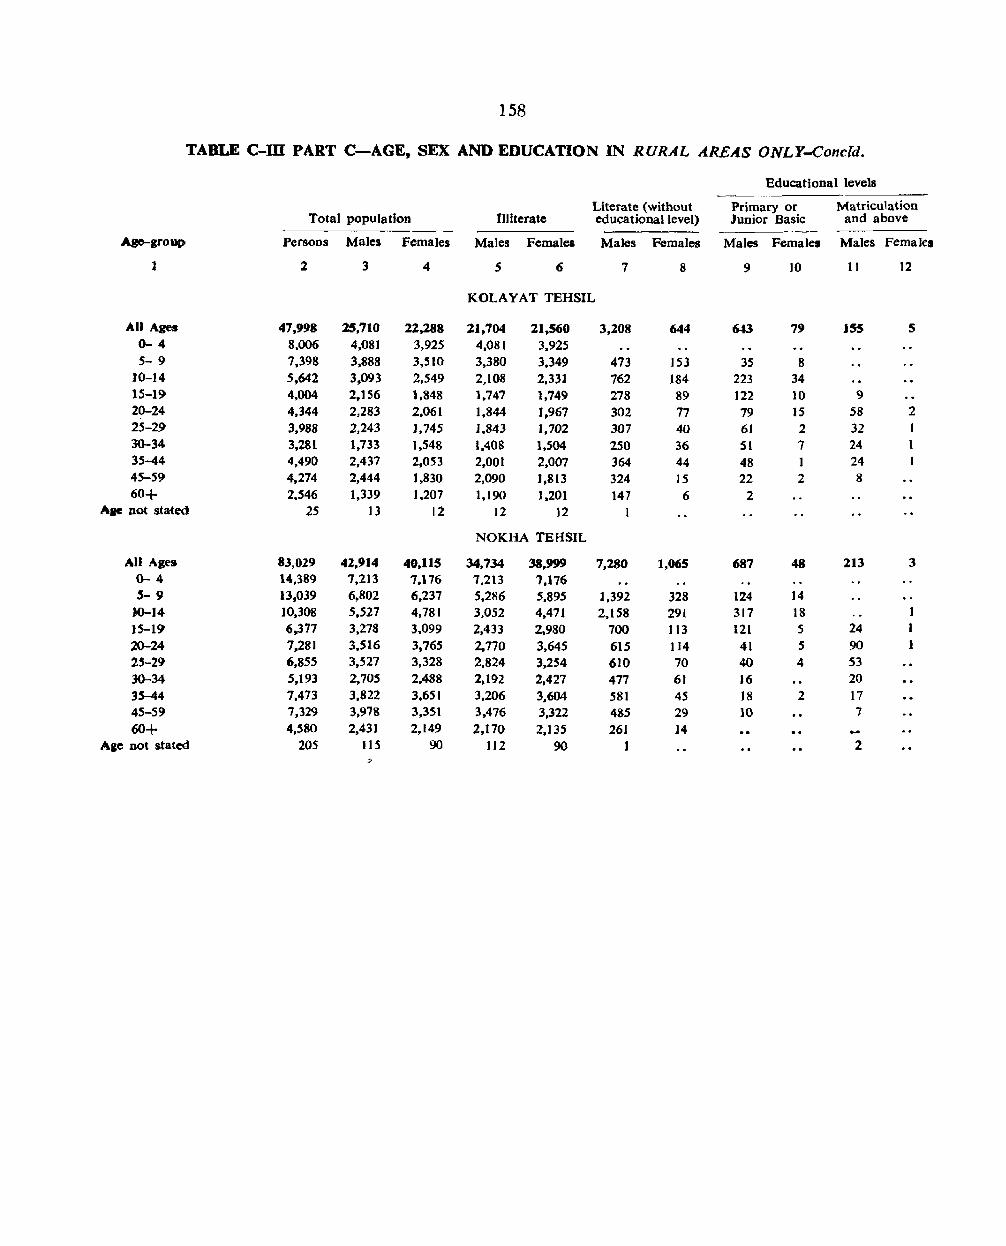
158
TABLE C-ID PART C-AGE, SEX AND EDUCATION IN RURAL AREA.S ONLY-Concld.
Educational levels
Literate (without Primary or Matriculation Total poPulation Illiterate educational level) Junior Basic and above
ABO-group Persons Males Females Males Females Males Females Males Femalea Males Females
1 2 3 4 S 6 7 8 9 ]0 11 12
KOLAYAT TEHSIL
All Ages 47.998 25,710 22.288 21,704 21,560 3,208 644 643 79 155 5 0-4 8,006 4,081 3,925 4,081 3.925 5- 9 7,398 3,888 3,510 3,380 3,349 473 ]53 35 8
JO-14 5,642 3,093 2.549 2,108 2,331 762 184 223 34 15-19 4.004 2,156 1,848 ],747 1,749 278 89 ]22 10 9 20-24 4,344 2,283 2,061 1,844 1.967 302 17 79 IS 58 2 25-29- 3,988 2,243 1,745 1,843 1,702 307 40 61 2 32 I 30-34 3.281 1,733 1,548 1,408 1,504 250 36 SI 7 24 1 35-44 4,490 2,437 2,053 2.001 2,007 364 44 48 1 24 45-59- 4.274 2,444 1,830 2,090 1,813 324 15 22 2 8 60+ 2,546 1,339 J,207 1,190 1,201 141 6 2
.'lac not stated 25 13 12 12 12 I
NOKHA TEHSIL
All Ages 83,029 42,914 40.115 34,734 38,999 7,280 1.065 687 48 213 3 0-4 14,389 ',213 ',176 7.213 7,176 5-9 13.039 6,802 6,237 5,286 5,895 1,392 328 124 14
)0-14 10,308 5,527 4,781 3.052 4,471 2,158 291 317 ]8 1 lS-l~ 6,377 3,278 3.099 2,433 2.980 700 113 121 5 24 1 20-24 7.281 3,516 3,765 2,770 3,645 615 Jl4 41 5 90 1 25-29 6.855 3,527 3,328 2.824 3.254 610 70 40 4 53 30-34 5,193 2,705 2.488 2.192 2.427 477 61 16 20 3'-44 7.473 3,822 3.651 3,206 3.604 581 45 18 2 17 45-59 7,329 3,978 3,351 3,476 3,322 485 29 10 7
60+ 4.580 2,431 2,149 2.170 2.135 26) 14 ... ABe not stated 205 115 90 112 90 1 2
:>

159
TABLE C-IV-SINGLE YEAR AGE RETURNS
Single Single Singte Year Total Year Total Year Total Age Age Age
Females Return Males Females Return Males Females Return Males
1 2 3 1 2 3 1 2 3
DISTRICT
AU Ap. 232,699 211,816
0 8,476 8,070 35 6,887 6.719 70 1.928 2,058 ) 5,703 5.312 36 1~137 852 71 90 58 2 7.888 7.578 37 837 512 72 190 137 3 8.014 8,187 38 1,158 879 73 71 (i0
4 7,581 7,372 39 653 535 74 70 70 5 9,096 8,004 40 8,168 8,621 75 497 448 6 8.120 7,230 41 528 353 76 62 43 7 7.006 6,527 42 1,2-45 799 77 76 42 8 7.274 6,612 43 532 401 78 III 61 9 5.045 4,617 44 703 474 79 51 27
)0 9.172 7.494 45 5.499 4,653 80 734 890 11 4.658 4,002 46 616 425 81 20 21 12 6,963 5,414 47 524 317 82 SO 43 J3 4,639 4,104 48 816 568 83 18 J8 14 4,222 3,358 49 467 387 84 17 14 15 5,855 4,618 50 7,294 7,095 85 10'; 121 16 3,905 3.635 51 455 242 86 18 16 17 2.799 2,556 52 831 464 87 11 II 18 5,133 4,673 53 390 249 88 IS 13 19 2,073 1,588 54 486 31S 89 6 6 20 7,003 9,126 55 2.392 2.384 90 72 132 21 2,8SI 2,275 56 436 277 91 2 3 22 4.701 4,274 57 346 215 92 4 3 23 2.600 1,965 58 432 313 93 I 3 24 2.446 1,854 59 335 272 94 2 1 25 9.406 9.828 60 4.456 5,137 95 17 14 26 2,890 2,085 61 239 206 96 5 5 27 2.673 1~81R 62 359 267 91 3 28 2.927 2.377 63 167 101 98 2 7 29 1.137 841 64 183 152 99 2 7
30 10,026 10,384 65 1.280 1,376 100 10 22 31 876 469 66 188 113 Over 100 1· 4@ 32 2.366 1,652 67 180 90 Age not 225 2eO 33 1.081 570 68 177 131 stated 34 1,063 784 69 142 111
• Includes I of J OS age. @ Includes 1 each of 102t lOS & 2 of 106 ages.
Bika. IS-A

l'AItUt c-v
,0 CilZ
o -
1"'1
-"<t
• 10 . --
N::;::N .... ....,N~\CINo\'" \0 ~ -
160
,_
• N ·0 -c.r
& . .... N o \0 "'l--
· ~ · .... ~
co. · -q -
~ u ,5 '0 o u c CI$ :a c .....
.s o "0 'fa -:::s o '" <I)
'': ..... c :::s 8
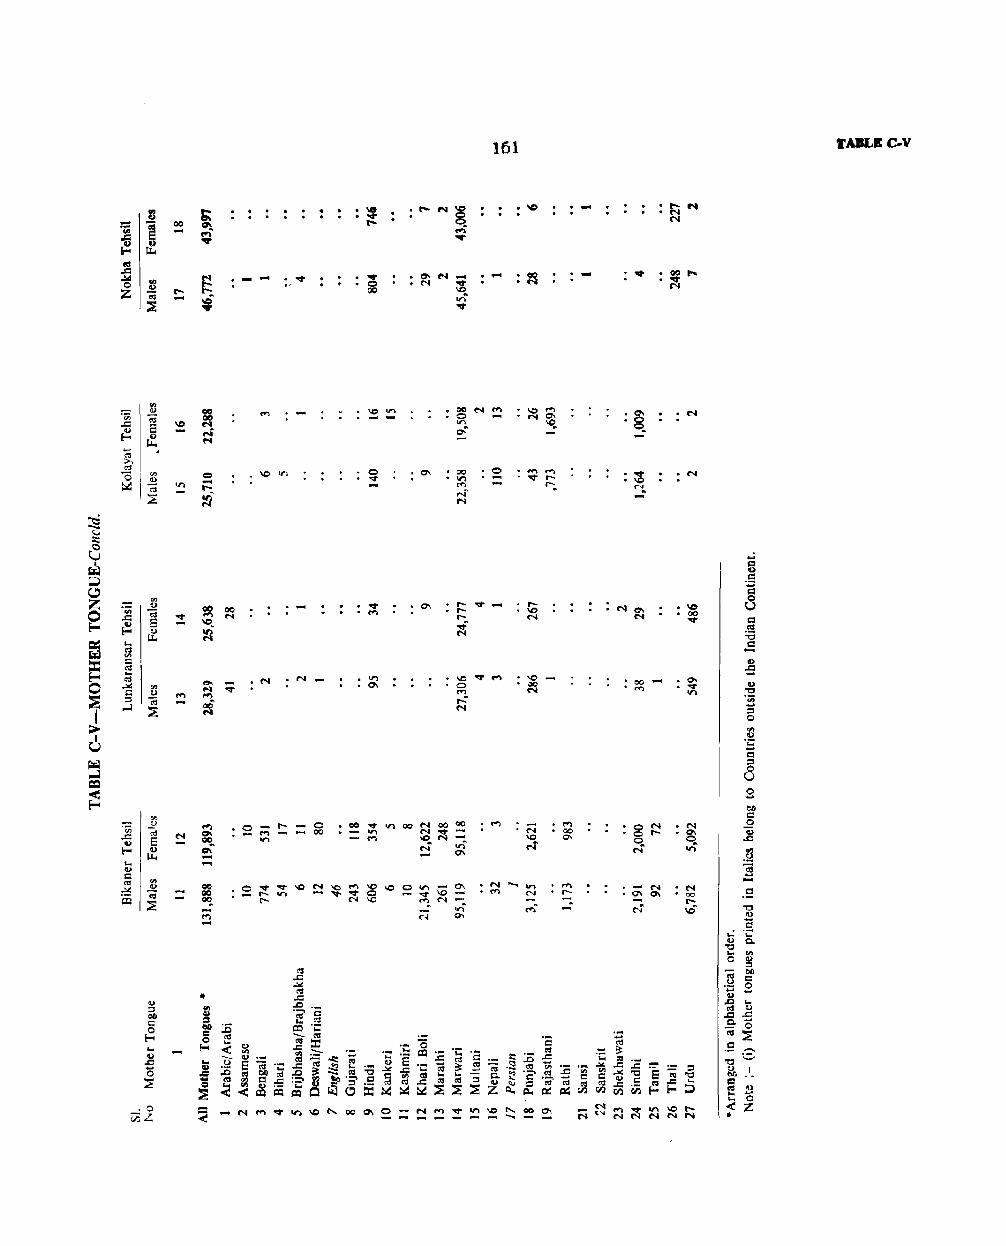
rJ - 1 ... ~ ~ ~ ..104
'" 0 G)
Z -; ~
00
r-....
~ -
.... -
-
1;\ ~ ~
~ ,
00 00 ac:. .... t") -
. --
N
. 'IT
. ....
o 00
• \0 · ... e-
· ... · 0 oo
· .... · ~
• 00
roo- N IC
~
'" • IN
~ • N ....
'IT ~ on "IT
• 00 • Y'I
M , .... r N
161
\0
. - .~
-. -
..... • 00
0'\
~ ,_ -
.~ ... IN
.... • 00 ..... N
....
& • IN
-IN
• IC • 00 ....
00 -M
N 00 r-\IS
"0 ~ =
G)
-5 G) "0 °00
-= o .., G)
-5 I::l :::I
8 o -
c
CQ 'I)
t: '0 <z •
TABLE C-V


.... o
~ ~ z
-N
0--00 -f""' -
N .....
.....
o -
N
.... -';;; .s:: ~
o .....
o 00 -~ N
• -';;; ~
'q; ..s:: ~ ~
..s:: ~ Z
163 TABLE C-Vll
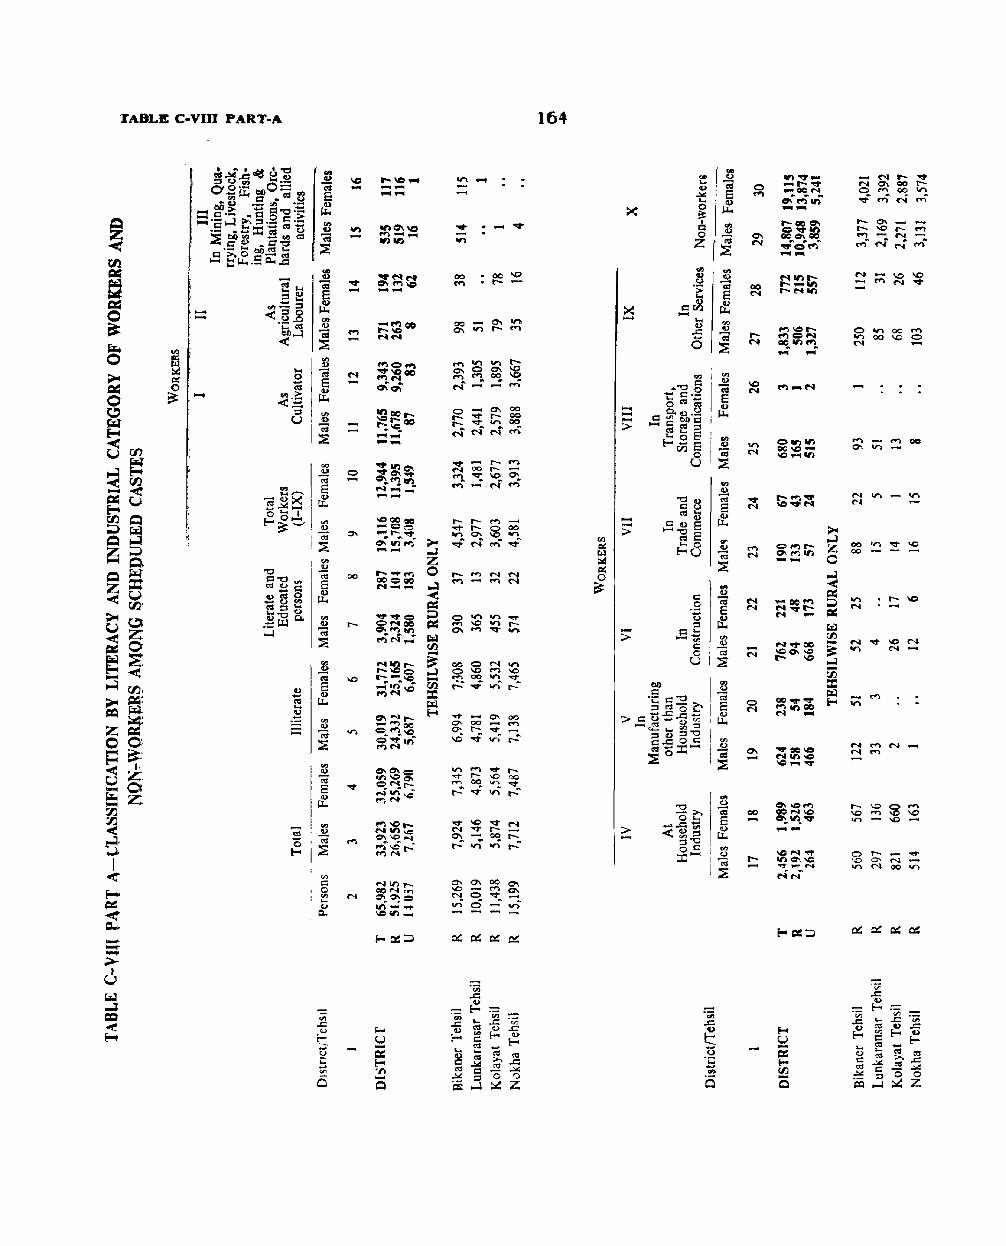
TABLE C-VIIl PART-A
-.... o ~ ...,>
<3 ::J u
on c:
,0
"" ..... ~
~ ....
.... ....
o
00
~ u -~ E-o Of) -Q
....
........... ~ .... on
00 .oo\Q M .r-
...,. 0\ 00 Q'o. OCI ~ ("f"l 0' t- ...r ...... ...o.,;.,;r.:
~~;:!:M 0\ ~~rr-: &n Vl r-. ...
164
x
--->
-..... >
-->
I~
I
.... co 5 o
c: .9 ti ::J
1=1'" -1;;; c: o
U
'" I~ IE Ia!
00 N
00
~~~~ 0"",,00"l ";-~N""
t-O\_..-.t t- \0 t- ..., ("f") -- N" .....-.I
~"'NNt"')"
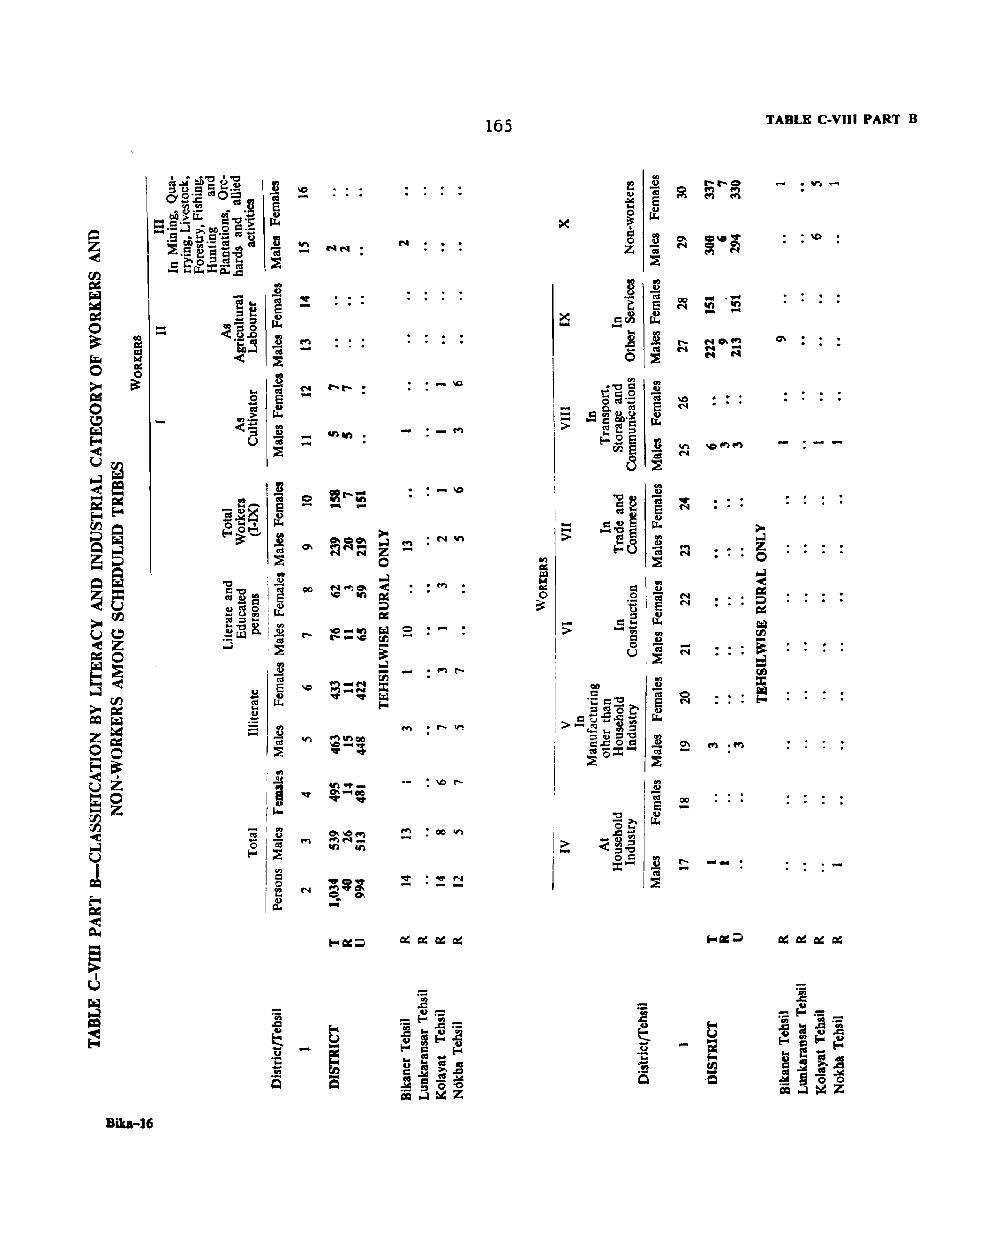
Bika-16
.... -
'" c ,~
I ... rf
VI -
('I ....
--C) ....
....
~N •
""'1"-- :
. .
"'" -
· . .
• .... \0
• _ f"'I
• .... IC
00 on
-.:I' N -
165
:><: -
I~ I
1-->
-> I
i I I> ,-I
-N
0'1 -00 -r--
-
-..... WI WI ....
. . . .
-- .
! -'Q
TABLE C-VIII PART B
-
-

166
HOUSING TABLES
(Note on E-SeriesJ
There are five tables in this series prepared for the first time in this census which have been extracted from the House List prepared at the time of house numbering and house listing operations in 1960. Out of these, four tables viz. E-I~ E-II~ E-IV, E-V relate to housing conditions and furnish data for the purposes for which the houses are used, the tenure on which they are occupied by the househo1ds, material of construction of walls and roofs and the households classified by number of members and by number of rooms occupied by them. The data in these tables has been shown for the dIstrict as well as for each tehsi1 separately for total, rural and urban areas.
2. Another table (E-IlI) on industrial establishments also prepared from the ho use lists gives a break-up by industry and the fuel used cross-tabulated by the size of establishments, is not presented here for want of space and can be seen in Part IV-B of the State Census Report which presents all the tables of this series. However, the data regarding number of establishments contained in this table is separately compiled down to village level which has been presented in a separate list of industrial establishments.
Table E-I
3. This table has been prepared on full count and furnishes figures of census houses separately for total, rural and urban areas of the district and tehsils and towns with a population of 50,000 or more classified into different categories according to the uses to which they are put. The houses which were found vacant at the tim@ of houselisting have also been shown separately as such. The following are th~ various types of houses into which occupied houses have been classified :-
Dwellings, shop-cum-dwellings, workshop-cum-dwelIings, hotels, hostels, sarais, dharamshalas, tourist homes and inspection houses, shops excluding eating houses, business houses and offices, factories regIstered under the Factories Act and worksheds and workshops not so registered, schools and other educational institutions including training classes, coaching and shop classes, restaurants, sweetmeat shops and eating places, places of entertainment and community gathering (Panchayat Ghar), public health and medical institu lions, hospitals, health centres, doctors clinics, dispensaries, etc.
4. Occupied census houses which do not fall in any of the above categories have been classed as 'Others', e.g. temple, mosque, church, cowshed, motor garage, water-hut, engine room, store room, grass shed .
. 5. The concepts and definitions of the terms occuring in the table are given below:-
A "Census house" is a structure or part of a structure inhabited or vacant, or a dwelling, a shop, a shop-
cum-dwelling, or a place of business, workshop, school etc. with a separate entrance. '
A "Census household" is a group of persons who commonly live together in the same census house and take their meals from a common mess unless the exigendes of work prevent them from doing so.
A "shop" or a "workshCjd" is a place where articles are sold for cash or for credit.
A "Workshop" is a place where some kind of production, processing, repair or servicing such as paper-making, shoe-making tailoring, cycle-repairing, motor-servicing, halwai's shop, pottery-making~ goldsmithy, blacksmithy, etc., are undertaken or where goods or articles are made and sold, and is not a factory registered under the Factories Act.
A "Factory" is a large workshop which has been registered under the Indian Factories Act.
HBusiaess houses" are those premises where transactions in money or other articles take place such as banks etc.
Table E-H
6. This table has been prepared on the basis of 20 per cent sample of households used as dwellings. shopcum~dwellings, workshop~cum-dwellings and dwelJings with other uses. Shop-cum-dwellings and workshop-cumdwellings are census houses which are partly used for residential or dwelling purposes and partly used as a shop or workshop. Dwellings with other uses are census houses such as offices, schools, temples, mosques etc. which are partly used for residential purposes by watchmen or uttendents. The total number of households given in column 4 of thIS table gives the total of such samples classified into the aforementioned tour categories of dwellings. which have been further classified according to their tenure status. whether owned or rented, separately for the total, rural and urban areas of the district and also for tehsils and towns with a popUlation of 50,000 or more.
7. The following concepts and definition have been used in respect of tenure status:-
The term 'owned' was considered to be a situation when a household was living in its own house or a house duly mortagaged to it by some of its debtor.
The term 'rented' meant a situation when a household was found living in a house taken on rent from a landlord or in a house that was taken on lease or in a house for which no rent was being paid with the consent of the landlord.
Table E-IV 8. This table has been prepared on 20 per cent sample
of households used as dwellings, shop-cum-dwel1ings, workshop-cum-dwellings and dwellings with other uses.

1(;)7
The total number of houses given in column 3 of this table gives the totals of all such sampled household. The material out of which most of the walls are made or where a house consists of separate structures, each made of different materials, the material out of which the walls of the main bedrooms, are made has been classified into the following nine categories:-
(1) Grass, leaves, reeds or bamboo (2) Timber (3) Mud (4) Unburnt bricks (5) Burnt bricks (6) C. I. Sheets or other metal sheets (7) Stone (8) Cement concrete (9) All other material
9. The material out of which most of the outer roof exposed to the weather is made, i.e., tiles, thatch, corrugated Iron, zinc or asbestos cement sheets or concrete, etc., or in the case of multistoreyed building, the material out of which the intermediate floor or floors is made, has been classified into the following seven categories:-
(1) Grass, leaves, reeds thatch, wood or bamboo (2) Tiles, slate, shingle (3) Corrugated iron, zinc or other metal sheets (4) Asbestos cement sheets (5) Brick and lime (6) Concrete and stone slabs (7) All other material
10. This table has been presented separately for total, rural and urban areas of the district and also for tehsils and towns with a population of 50,000 or more.
Table E-V
11. This table has been prepared on 20 percent sample of households used as dwellings, shop-cumdwellings, workshop-cum-dweUnigs and dwellings with other uses. The figures given in column 3 of this table are the totals of all such sampled households. The sex break-up of the total number of members occupying such sampled households have been further classified into the following six categories showing the number of
Bika.16-A
households and number of occupants by sex in each category:-
(i) no regular room Pi) one room
(lii) two rooms (iv) three rooms (v) four rooms
(vi). five rooms or more 12. This table has been prepared separately for the
total, rural and urban areas of the district and also for tehsHs and towns with a population of 50,000 or more.
LIst of Industrial Establishments
13. This table gives the number of establish. ments and the number of workers in each branch of industry classified by minor groups of Indian Standard Industrial Classification (for detailed description see appendix to the Explanatory Note on B-Series). The data is presented in the ascending order of the minor groups showing the figures in the brackets first for the number of establishments and second for the number of workers employed. The information has been extracted from the house list prepared at the time of house numbering and house listing operations in 1960.
14. The data is presented for the district and each tehsil for total, rural and urban areas as well as for each village and town separately. A summary of number of industrial establishments by workers employed has been given separately for the district, tehsils and towns in the begining of this table. The table has been presented in cun-on-lines and the villages are shown both by their n~mes and Code. numb~rs. The Code nu~ber of the villages wIll be helpful In fmdlI~g out the locatIon of the village in the tehsil maps. Villages which do not have any industrial establishments as well as those industry minor groups for which there are no figures in village or town or tehsil have been excluded from the list.
15. The data for some seasonal industries which were not actually working during the period of house listing has not been included. The number of workers also includes the proprietor and the other household members who were working in the industry during the week preceeding the enumerators' visit.

TABLE I1:-J
IC -11"1 -
N -
o ....
00
b ; ~ -Q
168
00 DO
~
<3 ....
o -
o ....
-.;;; ..c ~
"" ..c ~ o Z

169
TABLE E-II-TENURE STATUS OF SAMPLE CENSUS HOUSEHOLDS LIVING IN CENSUS HOlJSE'"
LJSED AS DWELLINGS
( Based on 20 % Sample)
Households in CenslIs Houses used as District/Tehsil Total or city with a Dwelling population of Rural Tenure Total No. of Shop-cum- Workshop-cum· with OIher 50,000 or more Urban Status Households Dwelling Dwelling Dwellmg uses
1 2 3 4 5 6 7 8
DISTRICT TOTAL Total 16,121 16,030 39 45 7 Owned 13,490 13,428 22 37 3 Rented 2,631 2,602 11 8 4
RURAL Total 9,297 9,281 3 7 6 Owned 9,054 9,043 3 6 2 Rented 243 238 I 4
URBAN Total 6,824 6.749 36 38 I Owned 4,436 4,385 19 31 I Rented 2,388 2.364 17 7
Bikaner Tehsil T Total 9,124 9,035 39 43 7 Owned 6,752 6,691 22 36 3 Rented 2,372 2,344 17 7 4
R Total 2,554 2,539 3 6 6 Owned 2,508 2,497 3 6 2 Rented 46 42 4
U Total 6,570 6,496 36 37 t Owned 4,244 4,194 19 30 I Rented 2,326 2,302 17 7
Bikaner City U Total 5,528 5,456 3S 36 Owned 3,347 3,29& 19 29 Rented 2,181 2,158 16 7
Lunkaransar Tehsil* R Total 1,905 1,904 I Owned 1,814 1,814 Rented 91 90
Nokha Tehsil* R Total 1,803 1,803 Owned 1,748 1.748 Rented 55 55
Kolayat Tehsil T Total 3,289 3,288 Owned 3,176 3,t7:5 Rented 113 113
R Total 3,035 3,035 Owned 2,984 2,984 Rented 51 51
U Total 254 253 J Owned 192 191 1 Rented 62 62
~-~~~~
·Entirely Rural
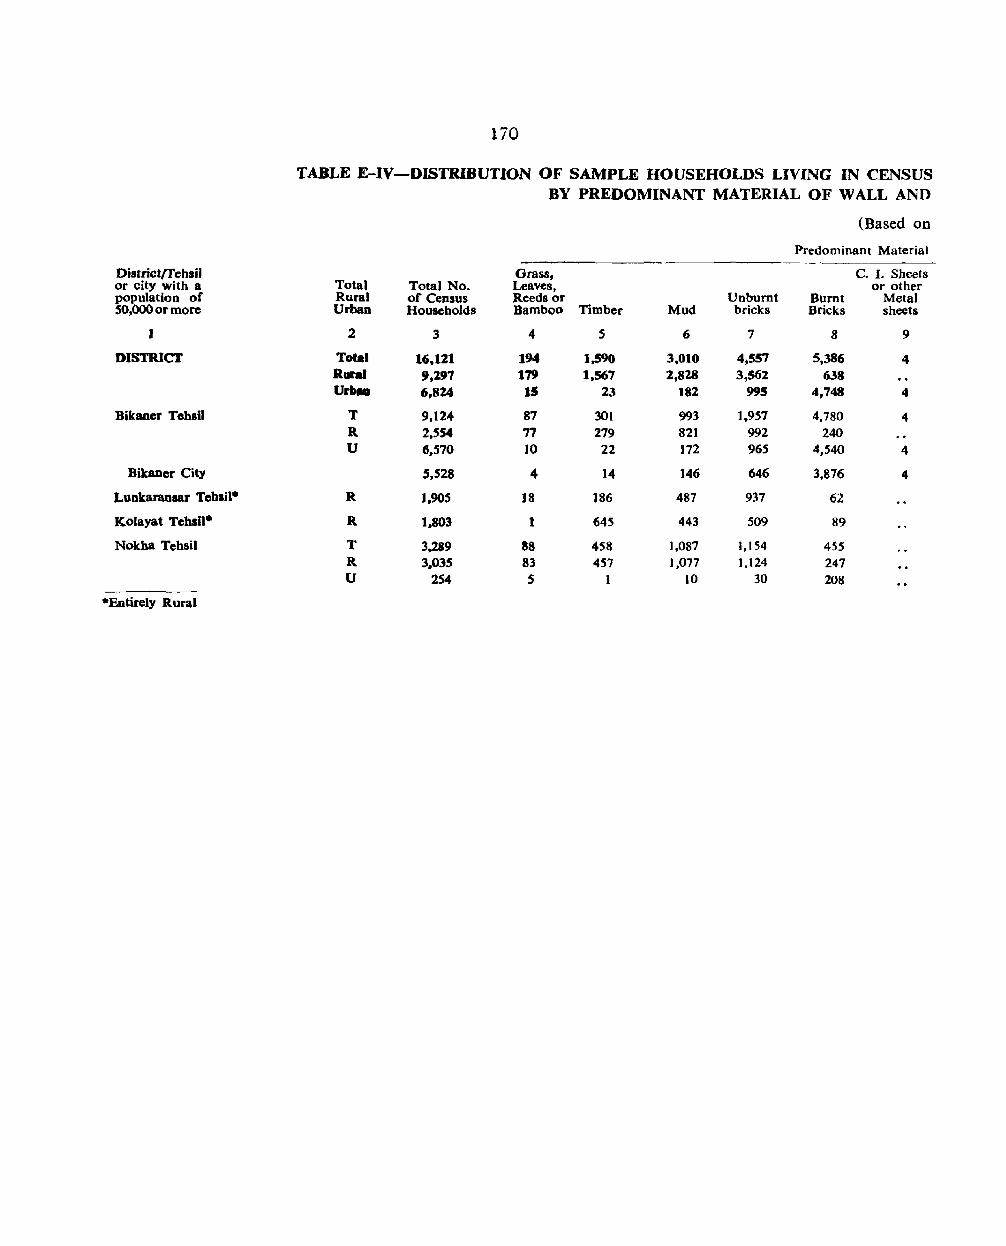
170
TABLE E-IV-DISTRIBUTION OF SAMPLE HOUSEHOLDS LIVING IN CENSUS BY PREDOMINANT MATERIAL OF WALL AND
(Based on
Predominant Material
Districtrrehsil Grass, C. I. Sheets or city with a Total Total No. Leaves, or other population of Rural of Census Reeds or Unburnt Burnt Metal 50,000 or more Urban Households Bamboo Timber Mud bricks Bricks sheets
J 2 3 4 5 6 7 8 9
DISTRlcr Total 16,121 194 1.590 3,010 4,557 5,386 4 Rural ',197 179 1.567 2,818 3,561 638 VrbaD 6,814 15 23 182 995 4,748 4
Bikaoer Tehail T 9,124 87 301 993 1,957 4,780 4 R 2.554 77 279 821 992 240 V 6.570 10 22 172 965 4,540 4
BikaDer City ',S28 4 14 146 646 3.876 4
Lunkaranaar Tehln· R ),9OS 18 J86 487 937 62
Kolayat TehaU· R 1,803 J 645 443 509 89
Nokba Tehsil T 3.289 88 458 1,087 1,154 455 R 3,035 83 457 1,077 1,124 247 U 254 S 1 10 30 208
*Entirely Rural
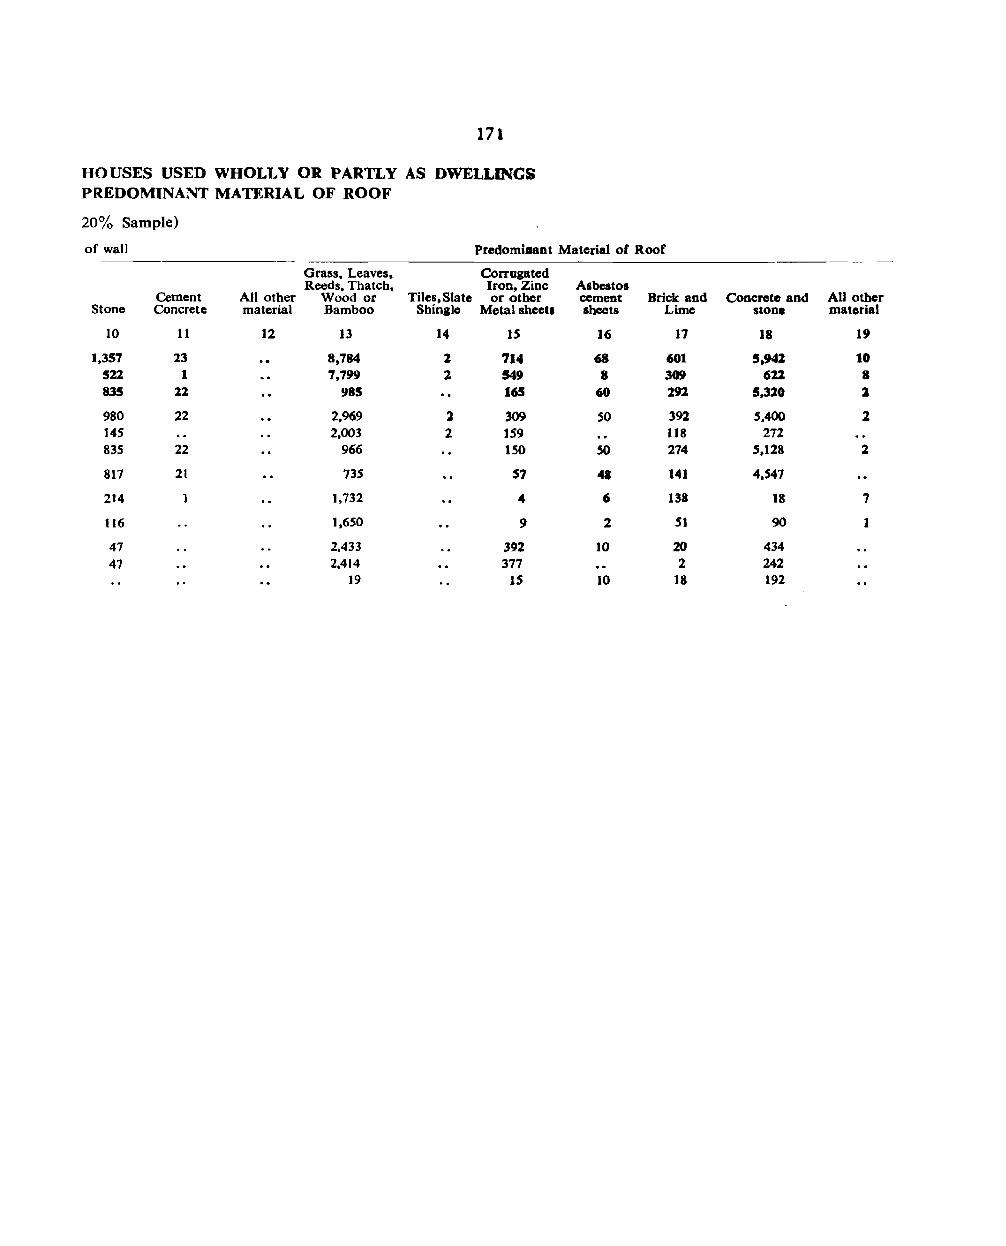
171
HOUSES USED WHOLLY OR PARTLY AS DWELLINGS PREDOMINANT MATERIAL OF ROOF
20% Sample)
of wall Predomillant Material of Roof
Grass. Leaves. Corrugated Reeds. Thatch,
Tiles, Slate Iron, Zinc Asbestos
Cement All other Wood or or other cement Brick and Concrete and All other Stone Concrete material Bamboo Shingle Metal shee" sheets Lime stone material
10 11 12 13 14 IS 16 17 18 19
1,357 13 8,784 :1 714 68 601 '.942 10 5n 1 7,799 2 549 8 309 611 I 83S 11 985 165 60 291. 5,320 :1
980 22 2.969 l 309 SO 392 5.400 2 145 UJ03 2 159 118 272 835 22 966 ISO SO 274 5.128 2
817 21 735 51 41 141 4,547
214 1 ].732 4 6 138 18 7
116 ],650 9 2 51 90 1
47 2,433 392 10 20 434 47 2,414 377 2 242
19 IS 10 18 192
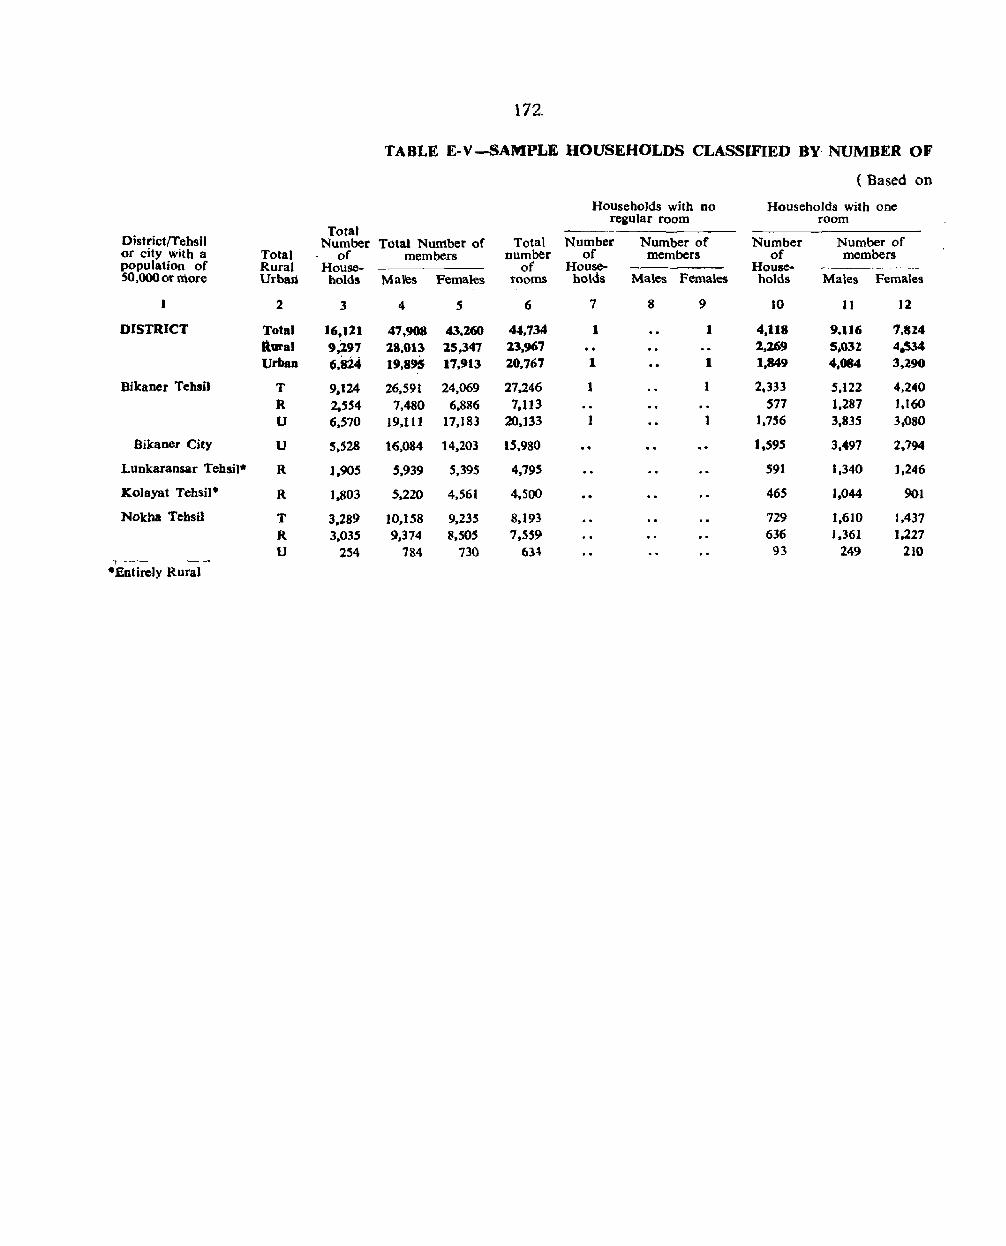
172.
TABLE E-V-SAMPLE HOUSEHOLDS CLASSIFIED BY. NUMBER OF
( Based on
Households with no Households with one regular room room
District/TehsiJ Total
Number Total Nurrtber of Total Number Number of Number Number of or city with a Total of members number of members of members population of Rural House- o( House- House-SO.OOOOt' more Urban holds Males Females rooms holds Males Females holds Males Females
2 3 4 5 6 7 8 9 10 11 12
DISTRICT Total 16.121 47,908 43.260 44.734 1 1 4.118 9.116 7,814 ltural 9,297 28.013 25,347 23.967 2,269 5.031 4.534 Urban 6.824 19.895 17,913 20.767 1 1 1.849 4.084 3.290
Bikaner TehsiJ T 9.124 26.591 24.069 27.246 I 1 2.333 5,122 4,240
R 2.554 7,480 6,886 7,113 S77 1,287 1.160 U 6.570 19,1ll 17,183 20.133 1 1 1.756 3.835 3.080
Bikaoer City U 5.528 16.084 14,203 1S,980 19S9S 3,497 2.794
Luokaraosar Tebsi1* R 1,905 S,939 5,395 4.795 591 1,340 1,24-6
Kolayat Tehsn- R 1.803 5.220 4.561 4,500 465 1,044 901
Nokha TehsU T 3,289 10.158 9.235 8.193 729 1.610 1.437 R 3.035 9.374 8,505 7,559 636 ].361 1,227 U 254 784 730 63~ 93 249 2)0 ,
-Entirely Rural
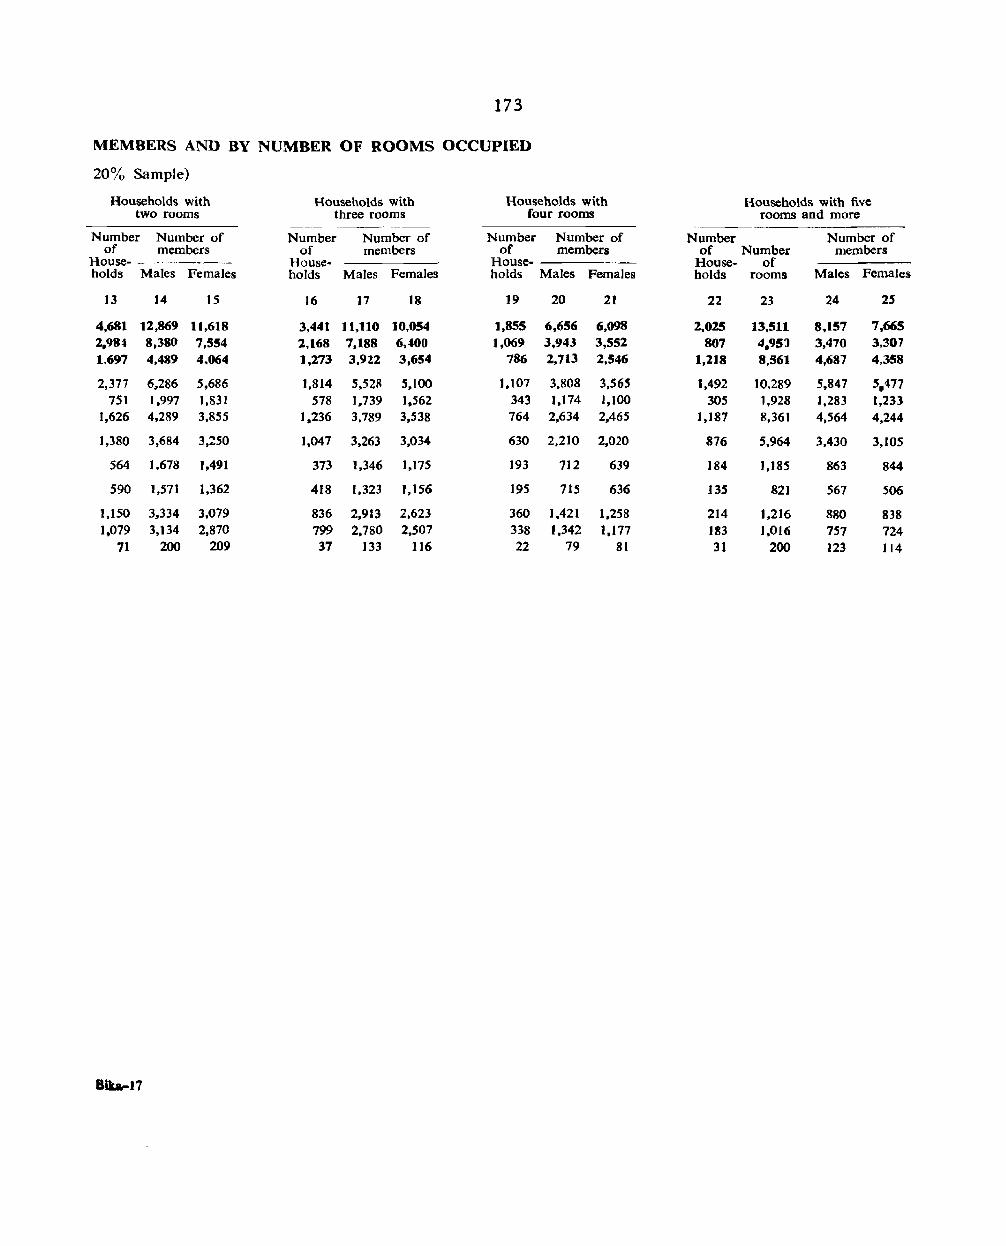
173
MEMBERS AND BY NUMBER OF ROOMS OCCUPIED
20% Sample)
Households with Households with Households with Households with five two rooms three rooms four rooms rooms and more
Number Number of Number Number of Number Number of Number Number of of members of members of members of Number members
House- House- House- House- of holds Males Females holds Males Females holds Males Females holds rooms Males Females
13 14 15 16 17 18 19 20 21 22 23 24 25
4,681 12,869 11.618 3,441 11,110 10,054 1,855 6,656 6.098 2,025 13.511 8,157 7,665 2.98t 8,380 7,554 2.168 7.188 6,"'00 1,069 3.943 3,552 807 4.95:1 3,470 3.307 1.697 4,489 4.064 1,273 3,922 3,654 786 2,713 2,546 1,2]8 8,561 4,687 4.358
2,377 6.286 5,686 1,814 5,528 5.100 1.107 3,808 3,565 1,492 10,289 5.847 5,477 751 1.997 1,831 578 1.739 1.562 343 1,174 1,100 305 1,928 1,283 1,233
],626 4,289 3,855 ].236 3,789 3,538 764 2,634 2,465 1,187 8,361 4.564 4,244
1,380 3,684 3,~50 1.047 3,263 3,034 630 2,210 2.020 876 5,964 3,430 3.105
564 1,678 1.491 373 1.346 l.t75 193 712 639 184 1,185 863 844
590 1.571 1.362 418 1.323 1,156 195 715 636 135 821 567 506
],150 3,334 3,079 836 2,913 2,623 360 1.421 1.258 214 1.216 880 838 1,079 3,134 2,870 799 2.780 2.507 338 1.342 1.177 liB 1,016 757 724
71 200 209 37 133 116 22 79 81 31 200 123 114
Bib-17

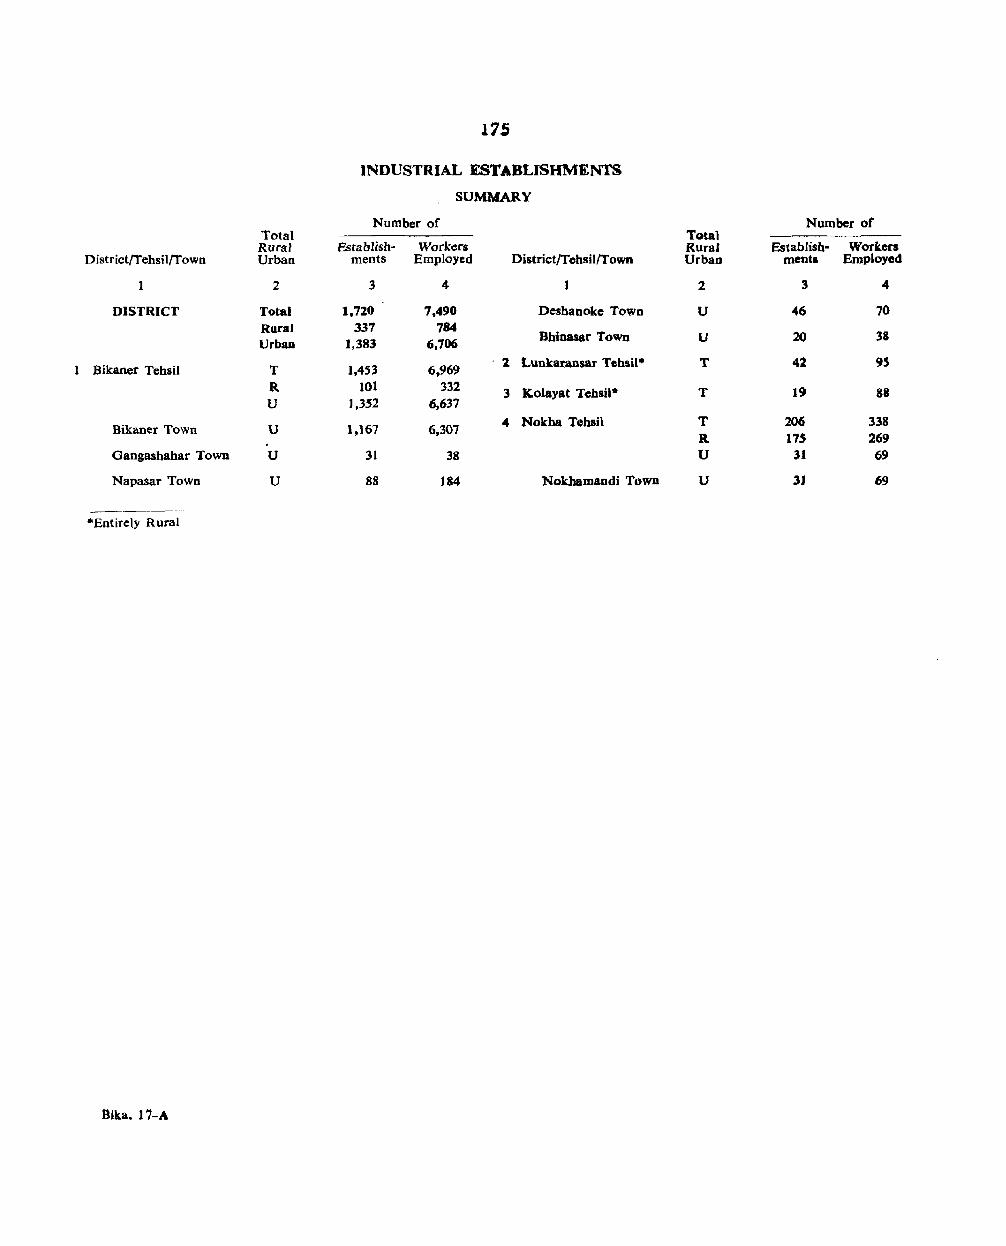
17S
INDUSTRIAL ESTABLISHMENTS
SUMMARY
Number of Number of Total Total Rural Establish- Workers Rural Establish- Worken
District/Tehsil/Town Urban ments Employed District/TehsillTown Urban mentl Employed
1 2 3 4 J 2 3 4
DISTRICT Total 1.720 7,490 Deshanoke Town U 46 70 Rural 331 784
Bhinasar Town 20 38 Urbaa 1.383 6,706 U
1 Bikaner Tehsil T 1.453 6,969 1 Lunkaransar Tehsil· T 42 95
R 101 332 3 kolayat Tehail* T 19 88 U J,352 6.637
Bikaner Town U 1,167 6,307 4 Nokha Tehsil T 206 338 R I7S 269
Gangashahar Town U 31 38 U 31 69
Napasar Town U 88 184 Nokhamandi Town U .3J 69
-Entirely Rural
Bika. 17-A
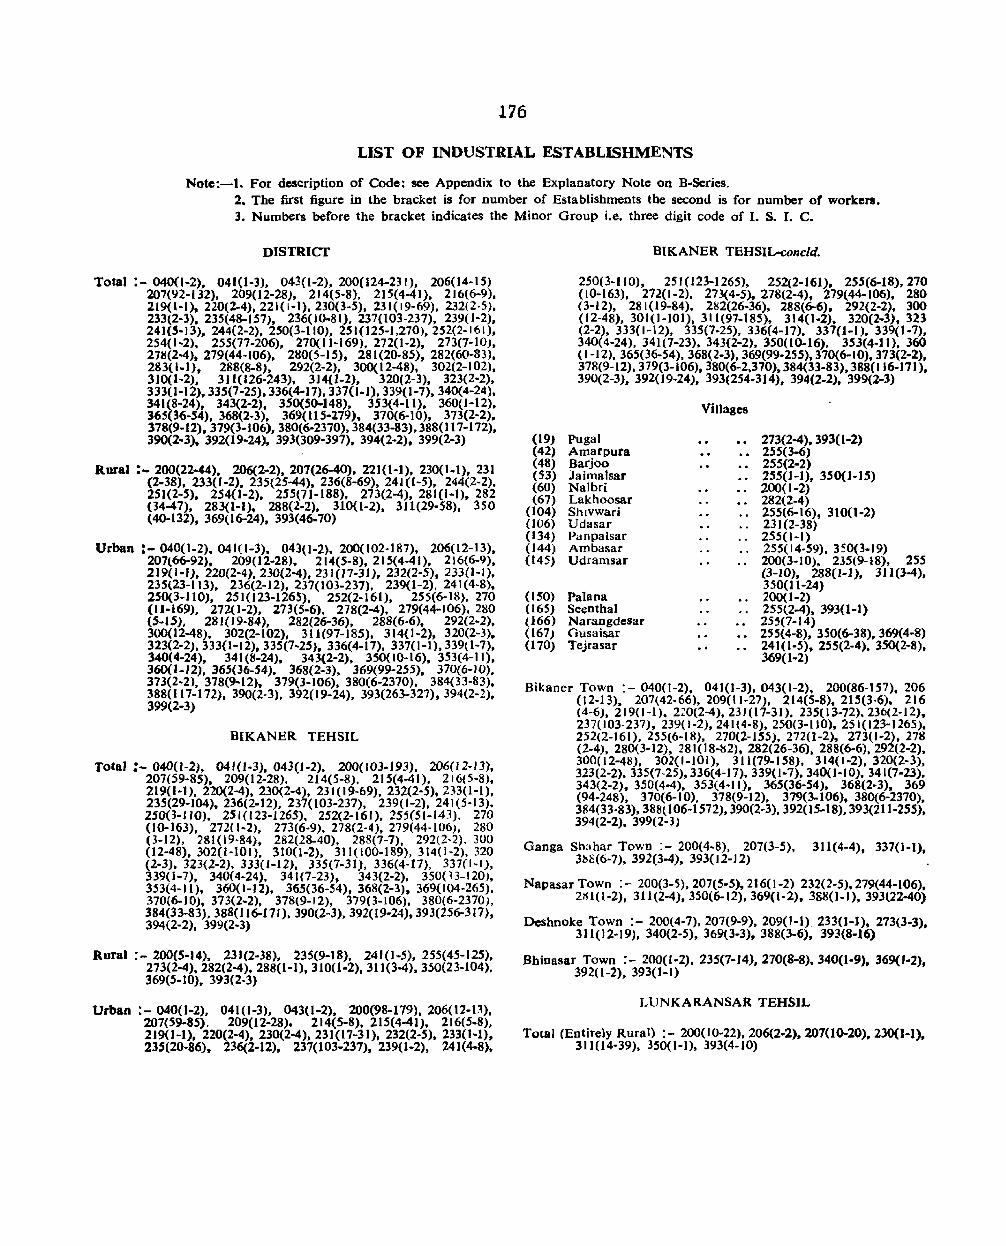
176
LIST OF INDUSTRIAL ESTABLISHMENTS
Note:-1. For description of Code: see Appendix to the Explanatory Note on B~Series. 2. The first figure in the bracket is for number of Establishments the second is for number of workers. 3. Numbers before the bracket indicates the Minor Group i.e. three digit code of I. S. I. C.
DISTRICf
Total :- 040(1-2), 041(1-3), 043{1-2), 200(124-231), 206(14-15) 207(92-132), 209(12-28), 214(5-8). 215{4-41). 216(6-9). 219(1-1), 220(2-4),221(1-1), 230{3-5), 231{19-69), 232(2-5), 233(2-3), 235(48-157). 236( 10-81), 237(103-237), 239( 1-2), 241(5-13), 244(2-2), 250(3-110), 251(125-1,270).252(2-161), 254(1-2), 255(77-206), 270(11-169), 2720-2), 273(7-1O}, 278(2-4), 279(44-106), 2MO(5-15), 281(20-85), 282(60-83), 283(1-1), 288{8-8), 292(2-2), 300{1 2-48), 302(2-102), 310(1-2), 311(126-243). 3J4(1-2), 320(2-3), 323(2-2), 333(l-l2). 335(7-25). 336(4-17), 337(1-1), 339(1-7), 340{4-24), 341(8-24), 343(2-2), 350(50-148), 353(4-11). 360(1-12). 365(36-54), 368(2-3). 369(115-279), 370(6-10), 373(2-2), 378(9-12),379(3-106),380(6-2370).384(33-83).388(117-172). 390(2-3), 392(19-24), 393(309-397). 394(2-2). 399(2-3)
Rural : .. 200(22-44). 206(2-2), 207(26-40). 221(1-1), 230(1-1), 231 (2-38), 233(1-2). 235(2544), 236(8-69), 241(1-5), 244(2-2). 251(2-5). 254(1-2), 255(71-188), 273(2-4), 281 (I-I), 282 (34-47), 283(1-1), 288(2-2), 310(1-2), 311(29-58), 350 (40-132), 369(16-24), 393(46-70)
Urban :- 040(1-2). 041(1-3), 043(1-2). 200(102-187), 206(12-13), 207(66-92), 209(12-28). 214(5-8), 215(4-41). 216(6-9), 2J9(1-1), 220(2-4).230(2-4),231(17-31). 232(2-5), 233(1-1). 235(23-113). 236(2-12). 237(103-237), 239(1-2), 241(4-8), 250(3-110). 251(123-1265). 252(2-161). 255(6-18), 270 (11-169), 272(1-2). 273(5-6), 278(2-4), 279(44-106), 280 (5-15), 281(19-84), 282(26-36). 288(6-6). 292(2-2), 300(12-48). 302(2-102), 311(97-185), 314(1-2), 320(2-3). 323(2-2).333(1-12).335(7-25), 336(4-17), 337(1-1),339(1-7), 340(4-24). 341(8-24), 343(2-2). 350(10-16), 353(4-1 J), 360(1-12), 365(36-54), 368(2-3), 369(99-255). 370(6-10). 373(2-2), 378(9-12), 379(3-106), 380(6-2370), 384(33-83). 388(117-172). 390(2-3), 392(19-24), 393(263-327), 394(2-2), 399(2-3)
BIKANER TEHSIL
Total :- 0400-2), 041(1-3), 043(1-2). 200(103-193), 206(l2-13). 207(59-85). 209(12-28), 214(5-8). 215(4-41), 216(5-8). 219(1-1),220(2-4). 230(2-4), 231(19-69),232(2-5). 233(I-l), 235(29-104),236(2-12), 237(103-237), 239(1-2), 241(5-13). 250(3-' 10). 251(123-1265), 252(2-161), 255(51-143), 270 (10-163), 272( 1-2), 273(6-9), 278(2-4), 279(44-106}, 280 (3-12), 281 (19-84). 282(28-40), 288(7-7), 292(2-2), 300 (12-48),302{J-IOI), 310(1-2), 311(100-189), 314(1-2). 320 (2-3), 323(2-2). 333(1-12), 335(7-31), 336(4-17), 337(1.'), 339(1-7), 340(4-24), 341(7-23), 343(2-2), 350(B-120), 353(4-11). 360(1-12), 365(36-54), 368(2-3), 369(104-265), 370(6-10). 373(2-2), 378(9-12), 379(3-106), 380(6-2370), 384(33-83),388(116-171), 390(2-3).392(19-24).393(256-317), 394(2-2). 399(2~3)
Rura) :- 200(5-14). 231(2-38), 235(9-18), 241(1-5), 255(45-125). 273(2-4),282(2-4). 288(1-1),31O(1-2),311(3-4).350{23-104), 369(5-10). 393(2-3)
Urban :- 040(1-2). 041(1-3), 043(1-2), 200(98-179), 206(12-0), 207(59-85), 209(12-28). 214(5-8), 215(4-41), 216(5-8), 219(1-1), 220(2-4), 230(2-4),231(17-31), 232(2-5), 233(1-1), 235(20-86), 236(2-12). 237(103-237). 239(1-2), 241(4-8).
BIKANER TEHSIL-concld.
250(3-110), 251(123-1265). 252(2-161). 255(6-18),270 (10-163), 272(1-2), 273(4-5). 278(2-4), 279(44-106), 280 (3-12), 281 (19-84), 282(26-36), 288(6-6). 292(2-2), 300 (12-48), 301(1-101). 311(97-185), 314(1-2). 320(2-3), 323 (2-2), 333(1-12), 335(7.25), 336(4-17). 337{J-1). 339(1-7), 340(4-24). 341(7-23), 343(2-2). 350(10-16), 353(4-1 I). 360 (1-12), 365(36-54), 368(2-3),369(99-255).370(6-10). 373(2-2), 378(9-12),379(3-106),380(6-2,370).384(33-83).388(116-111 ). 390(2-3). 392(19·24). 393(254-314). 394(2-2). 399(2-3)
(19) Pugal (42) Amarpura (48) Barjoo (53) Jaimalsar (60) Nalbri (67) Lakhoosar
(104) Shlvwari (106) Udasar (134) Panpalsar (144) Ambasar (145) Udramsar
(150) Palana (165) Seenthal (166) Narangdesar (167) Gusaisar (170) Tejrasar
Villages
273(2-4). 393( 1-2) 255(3-6) 255(2-2) 255(1-1). 350(]-J5) 200(1-2) 282(2-4)
.. 255(6-16). 310(1-2)
.. 23J(2-38} . _ 255(1-1) .. 255(14-59), 3~0(3-19) .. 200(3-10). 235(9-18). 255
(3-JO), 288(1-1), 311(34), 350(11-24)
•. 200(1-2) . . 255(2-4), 393(1-1) •• 255(7-14)
255(4-8), 350(6-38),369(4-8) 241(1-5). 255(2-4), 350(2-8). 369(1-2)
Bikaner Town : - 040(1-2). 04](1-3), 043(1-2). 200(86-157), 206 (12-13). 207(42.66), 209(11-27), 214(5-8). 215(3·6). 216 (4-6), 219(1-1). 220(2-4), 23J(l7-31), 235(13-72).236(2-12), 237(103·237). 239(1-2).241(4-8), 250(3-1l0), 251(123-]265). 252(2-161), 255(6-18), 270(2-155). 272(1-2), 273(1-2), 278 (2-4), 280(3-]2), 281(18-ts2). 282(26-36), 288(6-6),292(2-2). 300(12-48). 302(1-101), 311(79-158), 314(1-2),320(2-3), 323(2-2). 335(7<25).336(4-17). 339(1-7). 340(1-10). 341(7-23). 343(2-2), 350(4-4), 353(4-11), 365(36-54), 368(2-3), 369 (94-248), 370(6-10), 378(9-12), 379(3-106), 380(6-2370). 384(33·83), 388l106-1572), 390(2-3),392(15-18),393(211-255), 394(2-2), 399(2-3)
Ganga Shahar Town :- 200(4-8). 207(3-5), 311(4-4), 337(1-]), 31)0(6-7). 392(3-4), 39302-J2)
Napasar Town : - 200(3-5).207(5-5),216(1-2) 232(2-5).279(44-106), 2xl(I-2), 311(2-4).350(6-12),369(1-2), 388(1-1), 393(22-40)
Deshnoke Town :- 200(4-7).207(9-9), 209(1-1),233(1-1). 273(3-3). 311(12-19), 340(2-5), 369(3-3), 388(3-6). 393(8-16)
Bhinasar Town :- 200(1-2), 235(7-14).270(8-8),340(1-9). 369(1·2). 392(1-2), 393(1-1)
LUNKARANSAR TEHSIL
Total (Entirely Rural) :- 200(10-22),206(2-2).207(10-20).230(1-1). 311(14-39). 350(1-0. 393(4·10)
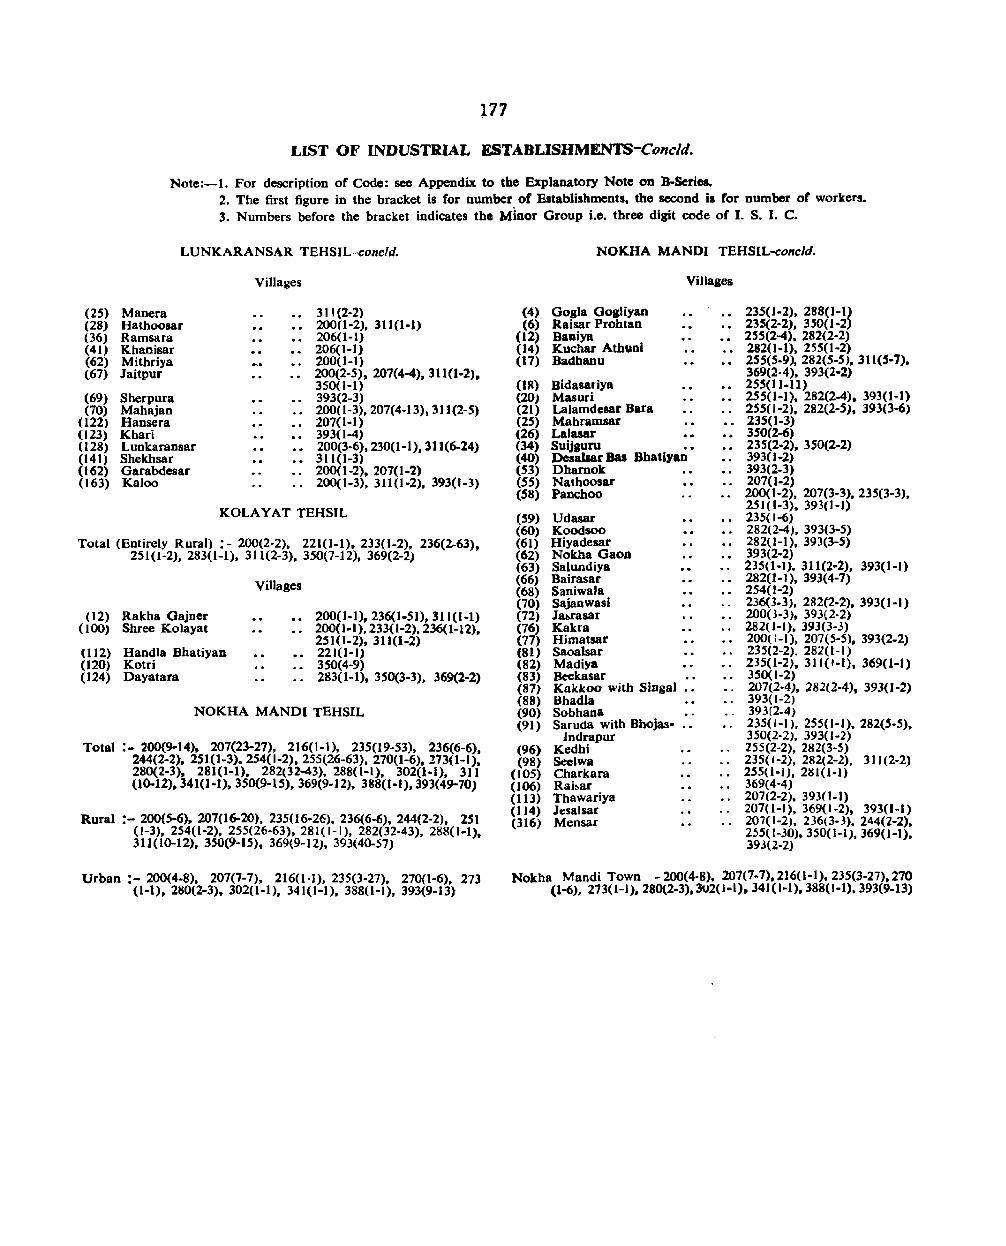
177
LIST OF INDUSTRIAL ESTABLISHMENTS-Concld.
Note:-1. For description of Code: see Appendix to the Explanatory Note OD B-Series. 2. The first figure in the bracket is for number of Establishments, the second is for Dumber of workers. 3. Numbers before the bracket indicates the Minor Group i.c. three digit code of I. S. I. C.
LUNKARANSAR TEHSIL-concld.
(25) Manera (28) Hathoosar (36) Ramsara (41) Khanisar (62) Mithriya (67) Jaitpur
(69) Sherpura (70) Mahajan
(122) Hansera (123) Khari (128) Lunkaransar (141) Shekhsar (162) Garabdesar (163) Kaloo
Villages
311(2-2) 200(1-2), 311(1-1) 206(1-1) 206(1-1) 200(1-1) 200(2-5), 207(4 .... ), 311(1-2). 350( 1-1) 393(2-3) 200(1-3),207(4-13).311(2-5) 207(1-1) 393(1-4) 200(3-6),230(1-1).311(6-24) 311(1-3) 200( 1·2). 207(1-2) 200(1-3), 311(1-2). 3930-3)
KOLAYAT TEHSIL
Total (Entirely Rura)) : - 200(2-2), 221(1-1). 233(1-2), 236(~63), 251(1-2), 283(1-1), 311(2-3}, 350(7-12), 369(2-2)
(12) Rakha Oajner (100) Shree Kolayat
(112) Handla Bhatiyan (l20) Kotri (124) Dayatara
Villages
200(l-1),236(1-51),31I(1-l} 200(1-1),233(1-2),236(l-l2}. 251(1-2). 311(1-2) 221(1-1) 350(4-9) 283(1-1), 350(3-3), 369(2-2)
NOKHA MANDl TEHSIL
Total :- 200(9-14). 207(23-27), 216(1-1), 235(19-53), 236(6-6). 244(2-2), 251(1-3). 254(1-2}, 255(26-63), 270(1-6).273(1-1), 280(2-3), 281(1-1). 282(32-43), 288(1-1), 302(1-1), 311 (l0-12), 341(1-1), 350(9-15), 369(9-12). 388(1-1),393(49-70)
Rural :- 200(5-6). 207(16-20), 235(16-26), 236(6-6). 244(2-2). 251 (l-3), 254(1-2), 255(26-63). 281( I-I). 282(32-43). 288( H), 311(10-12), 350(9-15), 369(9-12), 393(40-57)
Urban :- 200(4-8), 207(7-7), 216(1-1), 235(3-27). 270(1-6). 273 (I-I), 280(2-3). 302(1-1), 341(1-1), 388(1-1), 393(9-13)
(4) (6)
(12) (14) (17)
(1R) (20) (21) (25) (26) (34) (40) (53) (55) (58)
(59) (60) (61) (62) (63) (66) (68) (70) (72) (76) (77) (81) (82) (83) (87) (88) (90) (91)
(96) (98)
(105) (106) (113) (114) (316)
NOK.HA MANDl TEHSIL-concld.
Villages
Oogla OogJiyan Raisar Prohtan BaDiya Kuchar Athuni Badhanu
Bidasariya Masud Lalamdesar Bara Mahramsar Lalasar Suijguru •• Desalsar Bas Bhatiyan Dhamok Nathoosar Panchoo
Udasar Koodsoo Hiyadesar Nokha GaoD Salundiya Bairasar Sllniwala Sajanwasi J~rasar Kakra Himatsar Saoalsar Madiya Beekasar Kakkoo with Singa) •• BhadJa Sobhana Saruda with Bhojas- .•
Indrapur Kedhi Seelwa Charkara Rai!>ar Thawariya Jesalsar Mensar
235( 1-1), 288(1-1) 23S(2-2). 350( 1-2) 255(2-4), 282(2-2) 282(1-1), 255(1-2) 255(5-9), 282(5-5 J, 31 1 (S-7). 369(2-4), 393(2-2) 255(11-11) 255(1-1). 282(2-4), 393(1-1) 255(1-2), 282(2-5), 393(3-6) 235(1-3) 350(2-6) 235(2-2), 350(2-2) 393(1-2) 393(2-3) 207(1-2) 200(1-2), 207(3-3).235(3-3), 25](1-3), 393(1-1) 235(1-6) 282(2-4), 393(3-5) 282(1-1), 393(3-5) 393(2-2) 235(1-1), 311(2-2), 393(1-1) 282(1-1), 393(4-7} 254(1-2)
.. 236(3-3), 282(2-2), 393(1-1) 200(3-3). 393{2-2)
.. 282(1-1), 393(3-.) 200(1-1), 207(5-5), 393(2-2) 235(2-2). 282(1-1) 235(1-2). 311(1-1), 369(1-1) 350(l-2}
.. 207(2-4), 282(2-4), 393(1-2) 393( 1-2) 393(2-4)
•. 235(1-1), 255(1-1).282(5-5). 350(2-2), 393(1-2) 255(2-2), 282(3-5) 235(1-2}. 282(2-2), 3] 1(2-2) 255(1-1), 281(1-1) 369(4-4)
. . 207(2-2). 393(1-1) 207(1-1), 369(1-2), 393(1-1)
.. 207(1-2). 236<3-3). 244(2-2). 255(1-30).350(1-1).369(1-1), 393(2-2)
Nokha Mandi Town - 200(4-8), 207{7-7), 216(1-1),235(3-27),270 (1-6), 273(1-1).280(2-3).302(1-1).341(1-1),388(1-1),393(9-13)
178
SPECIAL TABLES FOR SCHEDULED CASTES AND SCHEDULED TRIBES
(Note on SeT, SC and ST Series)
There are 8 Tables in this series specially prepared for the population of Scheduled Castes and Scheduled Tribes in the district. No special table was prepared for these classes during 1951 Census. The only information collected at that time was the aggregate strength of Scheduled Castes and Scheduled Tribes for the district and sub-divisions. However, together more information for these communities which have been safeguarded in the constitution, special tables have been devised and presented in this series. Part V-A of the State Census Report gives information for the State on this subject.
Table SeT-I
2. This table presents the industrial classification of persons of Scheduled Castes and Scheduled Tribes at work and non-workers by sex. In other words, this table presents caste/tribe wise (arranged in alphabetical order) break-up of the data shown in Table C-VIII. This table has been compiled in two parts. Part A deals with the Scheduled Caste popUlation showing the data for each Schedu~ed. Caste separately in rural and urban areas of the dIstrIct.
3. Special study regarding the number of persons of Scheduled Castes engaged in unwholesome occupations like tanning, currying of hides and skins, scavenging is also conducted. The number of workers shown in these occupations as well as in other industria) categories is on the basis of their principal work.
4. Part B of this table refers to Scheduled TrIbes population and presents the data for each Scheduled Tnbe separately in rural and urban areas of the district.
S. A fly-leaf showing the sexwise break-up for Scheduled Castes and Scheduled Tribes in the district as well as for each tehsil is also attached which presents data separately for total, rural and urban areas. Figures of such Scheduled Castes and Scheduled Tribes have also been given for each village and town in the Primary Census Abstract.
Table SeT-II
6. This table distributes the population of Scheduled Castes and Scheduled Tribes according to their marital status of never married, married, widowed, divorced or separated and unspecified status under the age-groups of 0-14, 15-44 ,and 45+. The total population of these classes acccording to their marital status is also shown separately of all age~groups.
7. This table has been presented in two parts. Part A gives such information for each Scheduled Caste and Part B relates to each Scheduled Tribe providing such information for the district.
8. This is an important demographic table. The age marital status data in the case of Scheduled
,Tribes give an indication whether the tribal population is decreasing, stable or increasing.
Table SeT-III
9. This table presents the distribution of the population of Scheduled Castes and Scheduled Tribes by sex and educational levels. The table has been compiled in two parts. Part A has been further classified in two parts. Part A (i) provides such type of data for each Scheduled Caste in urban areas only while Part A (ii) presents similar data for urban areas for each Scheduled Tribe.
10. Part B of this table provides the simi1ar information as in Part A for rural areas only, being classified in two parts. Part B (i) deals with Scheduled Castes while Part B (ii) refers to Scheduled Tribes.
11. In case of urban areas the data has been given for educational standards as in Table B-III Part A while such data has been shown for mere literate primary or junior basic and matriculation and above in case of rural areas as in Table B-III Part B.
12. This is an important table, the data of which can be proved very useful for the education department as it throws light on the spread of education among these communities in the rural and urban areas separately. The data will also be helpful to the department for awarding scholarships to the members of these communities.
Table SCT-IV
13. This table presents a distribution of the population of Scheduled Castes and Scheduled Tribes according to their religion. This table is compiled in two parts. Part A provides religionwise data for each Scheduled Caste in the district showing the rural and urban figures together. Similar type of information has been presented for Scheduled Tribes in Part B of this tabJe. It may be noted that tbe members of Scheduled Castes can be either Hindus or Sikhs while members of Scheduled Tribes may profess different religions.
Table SCT-V
14. This table presents a detailed examination of the rural cultivating households of the Scheduled Castes and Scheduled Tribes and is based on 20% sample. Such households have been classified in various groups according to the size of land cultivated and cross tabulated by the interest in land cultivattd.
15. This table is similar to that of household economic table B-XI and is compiled in two parts. Part A presents such data for Scheduled Castes while Part B provides such information for Scheduled Tribes.

179
Table. SC-I
16. This table presents data for students and unemployed persons in non-working population of Scheduled Castes. This is further classified according to the broad educational levels consisting of literates, primary or junior basic and matriculation 'and above.
17. The data has been, shown separately for the district total. rural and urban areas and further down to tehsil level in case of rural areas only. It is very useful table at it indicateS' the numerical strength of students and unemployed persons among the Scheduled Castes.
Table ST-I 18. Scheduled Tribes have their own peculiar langua
ges and dialects. Tbis is due to the fact that this table is prepared showing the number of speakers of tbat
subsidiary language of those members of Scheduled Tribes who bave moved out of their homes and as a result of contact with the local persons speak some otber subsidiary language to the mother tongue. The number of persons speaking such subsidiary languages have been shown sex-wise in run-on-lines. The data has been presented separately for the district total, rural and urban areas for the each Scheduled Tribe.
Table ST-II
19. This table presents data for students and unemployed persons in the non-working population for each individual Scheduled Tribe. The data bas been shown separately for district total, rural and ~rban areas. T~i.s table is an important one as it tbrows light ~n. ~hc;, progress of education and the unemployment posItIon for each individual tribe.
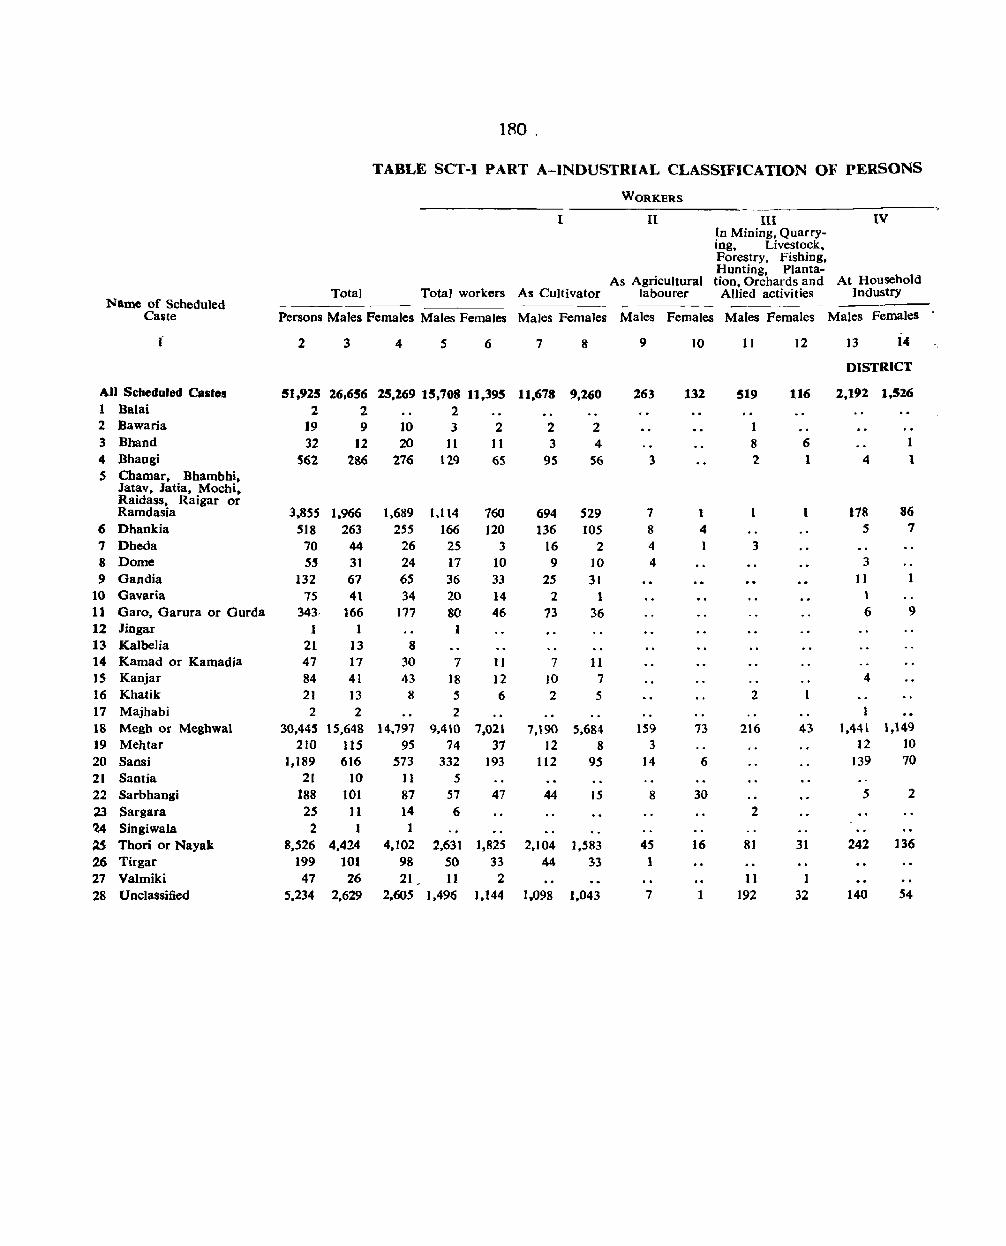
180 .
TABLE SCT-I PART A-INDUSTRIAL CLASSIFICATION OF PERSONS
WORKERS
I II III IV In Mining, Quarry-ing, Livestock. Forestry, Fishing,
As Agricultural Hunting, Planta-
At Household tion. Orchards and Total Total workers As Cultivator labourer Allied activities Industry
Name of Scheduled Calilte Persons Males Females Males Females Males Females Males Females Males Females Males Females
f 2 3 4 5 6 7 8 9 10 11 12 13 14
DISTRICT
All Scheduled Castes 51,925 26,656 25.269 15,708 11,395 11,678 9,260 263 132 519 116 2,192 1,526 1 Balai 2 2 2 2 Bawaria 19 9 10 3 2 2 2 I 3 Bhand 32 12 20 11 11 3 4 8 6 1 4 Bhangi 562 2&6 276 129 6S 9S S6 3 2 1 4 t 5 Chamar. Bhambhi.
Jatav, Jatia, Mochi. Raidass. Raigar or
86 Ramdasia 3.855 1.966 1,689 J,1l4 760 694 529 7 1 1 1 178 6 Dhankia 5J8 263 255 166 120 136 105 8 4 5 7 7 Dheda 70 44 26 25 3 16 2 4 3 8 Dome 5~ 31 24 17 10 9 ]0 4 3 9 Gandia 132 67 65 36 33 25 31 11
10 Gavaria 75 41 34 20 14 2 1 1
11 Garo, Garura or Gurda 343, 166 177 80 46 73 36 6 9 12 Jjngar 1 1 13 Kalbelia 21 13 8 14 Kamad or Kamadia 47 17 30 7 II 7 11 )S Kanjar 84 41 43 18 12 10 7 4 16 Khatik 21 13 8 5 6 2 5 2
17 Majhabi 2 2 2 1
18 Megh Or Meghwal 30.44~ 15,648 14.797 9.410 7,021 7,190 5.684 159 73 216 43 1,441 1;149 )9 Mehtar 210 115 95 74 37 12 8 3 12 JO
20 Sansi 1.189 616 573 332 193 112 95 ]4 6 J39 70
21 Santia 21 10 Jl 5 22 Sarbhangi 188 101 87 57 47 44 ]5 8 30 5 2
23 Sargara 2S 11 14 6 2 OW Singiwala 2 1
~ Thori or Nayak 8.526 4,424 4,102 2.631 1,825 2,104 1.583 45 16 81 31 242 136
:2.6 Tirgar 199 101 98 50 33 44 33 1 27 Valmiki 47 26 21 11 2 11 1 28 Unclassified 5.234 2.629 2,605 1.496 1,144 1,098 1,043 7 1 192 32 140 54

181
AT WORK AND NON-WORKERS BY SEX FOR SCHEDULED CASTES
WORKERS Workers In Special Occupations
V VI VII VIII IX X
In Manufacturing In
other than In Transport, Tanning and Household In Trade and Storage and In Currying of hides Industry Construction Commerce Communications Other Services Non-workers and skins Scavenging
Males Females Males Females Males Females Males Females Males Females Males Females Males Females Males Females
J5 16 17 18 19 20 21 22 23 24 ,25 26 27 28 29 30
RURAL
158 54 94 48 133 43 165 1 506 215 10,948 13,874 114 57 41 II 2
6 8 9
6 19 7 157 211 I 14
Bika-1S
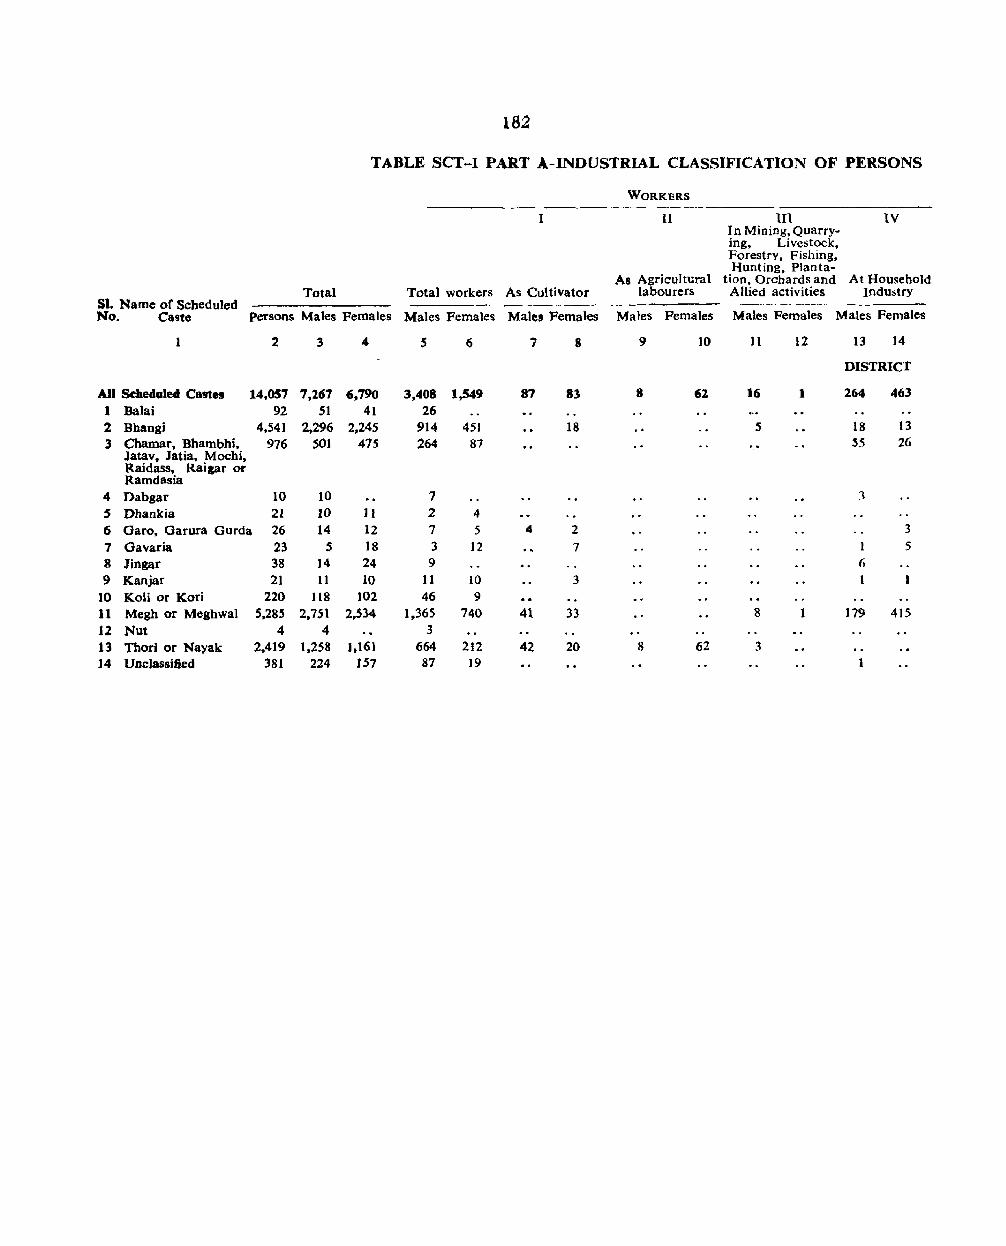
182
TABLE SCT-I PART A-INDUSTRIAL CLASSIFICATION OF PERSONS
WORKERS
I II III IV In Mining, Quarry· iog, Livestock. Forestry, Fishing, Hunting. Planta-
As Agricultural tion, Orchards and At Household Total Total workers As Cultivator labourers Allied activities Industry
51. Name of Scheduled ----- -- _-----No. Caste persons Males Females Males Females Males Females Males Females Males Females Males Females
1 2 3 4 5 6 7 8 9 10 II 12 13 14
DISTRICT
All Scheduled Castes 14,057 7,267 6,790 3,408 1~9 87 83 8 62 16 I 264 463
1 Balai 92 51 41 26 2 Bhangi 4,541 2,296 2,245 914 451 18 5 18 13
3 Chamar, Bbambhi. 976 501 415 264 87 .. S5 26 Jatav, Jatia, Mochi. Raidass, Raigar or Ramdasia
4 Dabgar 10 10 7 3
S Dhankia 21 10 11 2 4
6 Garo. Garura Gurda 26 14 12 7 5 4 2 3
7 Gavaria 23 S 18 3 12 7 5 8 Jingar 38 14 24 9 6
9 Kanjar 21 11 10 11 10 3 10 Koli or Kori 220 118 102 46 9 11 Megh or Meghwal 5.285 2.751 2,534 1,365 740 41 33 8 1 179 415
12 Nut 4 4 3
13 Thori or Nayak 2.419 1.258 I t 161 664 212 42 20 8 62 3 14 Unclassified 381 224 157 87 ]9 1
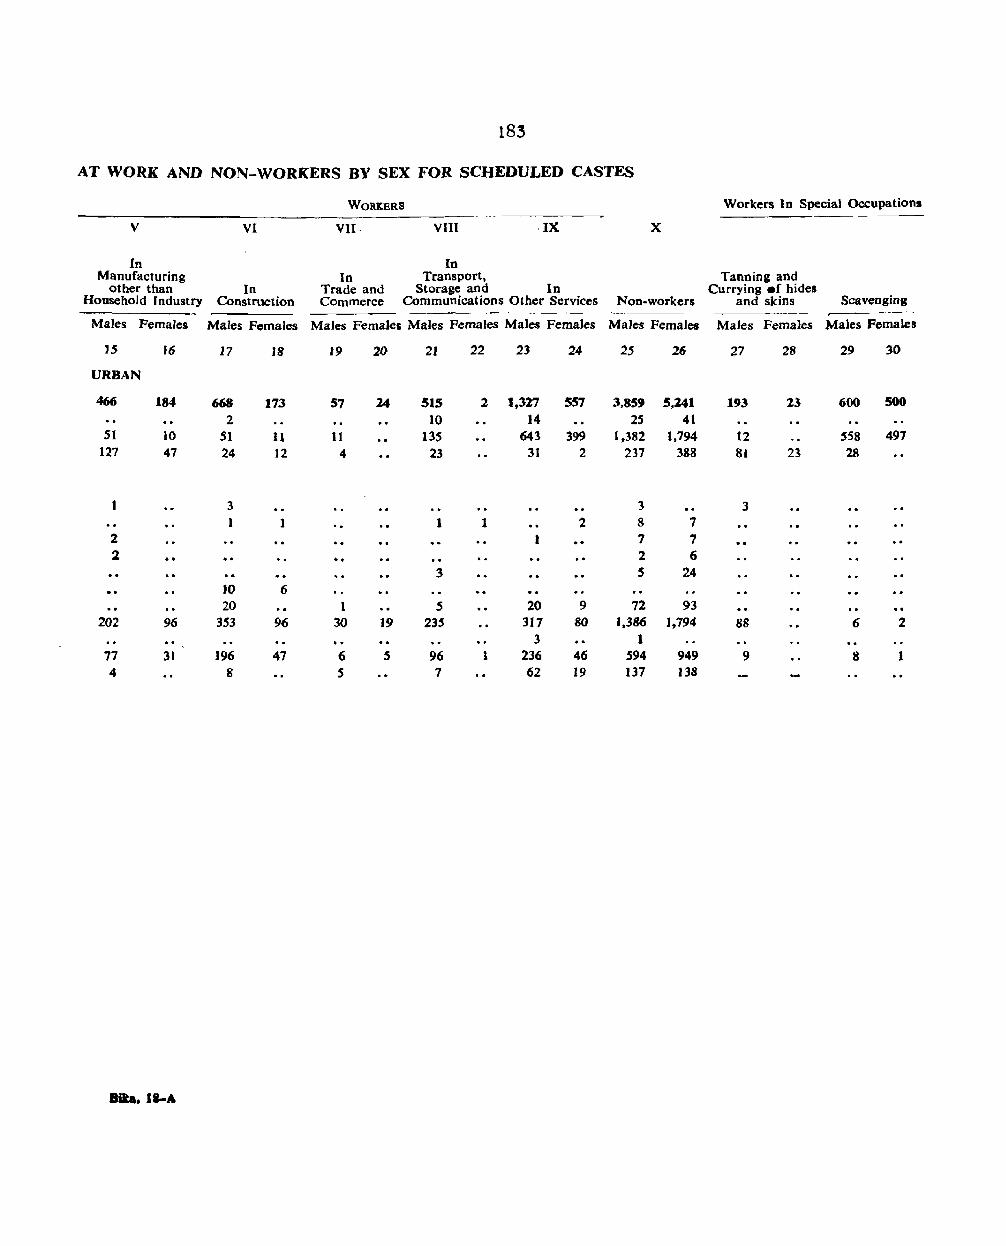
183
AT WORK AND NON-WORKERS BY SEX FOR SCHEDULED CASTES
WORKERS Workers 1n Special Occupations
V VI VIl- VIII ,IX X
In In Manufacturing In Transport, Tanning and
other than In Trade and Storage and In Currying .f hides Household Industry Construction Commerce Communications Other Services Non-workers and skins Scavenging
Males Females MaJes Females Males Females Males Females Males Females Males Females Males Females Males Females
15 16 17 18 19 20 21 22 23 24 25 26 27 28 29 30
URBAN
466 184 668 173 57 14 SIS 2 1,327 557 3.859 5,241 193 23 600 500
2 10 14 25 41 51 10 51 11 11 135 643 399 1,382 1.794 12 S58 497
127 47 24 12 4 23 31 2 237 388 81 23 28
I 3 3 3 1 1 1 1 2 8 7
2 .. 1 7 7 2 .. 2 6
3 5 24 10 6 20 1 5 20 9 72 93
202 96 353 96 30 19 235 317 80 1.386 1,794 88 6 2 .. 3 1 77 31 196 47 6 5 96 1 236 46 594 949 9 8 1 4 8 5 7 62 19 137 J38
8ita. II-A

184
TABLE SCT-J PART B-INDUSTRIAL CLASSIFICATION OF PERSONS AT WORK AND NON-WORKERS BY SEX FOR SCHEDULED TRIBES
WORQRS
II III IV In Mining.Quarry-ing, Livestock, Forestry, Fishing. Hunting, Planta-
At Household As Agricultural tions. Orchards and
Sl. Name of Scheduled Total Total workers As Cultivator Labourer Allied activities Industry
No. Tribe Persons Males Females Males Females Males Females Males Females Males Females Males Females
I 2 3 4 5 6 7 8 9 10 11 12 13 14
DISTRICT RURAL
An SCbeduled Tribes 40 26 14 20 7 S 7 2 1 1 BhiJ 9 6 3 2 1 1 ] 1 2 Mina 23 17 6 15 1 2 1 1 3 Unc1assified 8 3 5 3 5 2 5 1
DISTRICT URBAN
All Scbeduled Tribes 994 S13 481 219 IS1 . _. .. 1 Bhil 1 1 1 '"
., .. ... - '.' 2 Mina 973 501 472 210 148 .. 3 Unclassified 20 11 9 8 3
WORKERS
v VI VII Vin IX X
In Manufacturing In
other than In Transport, In Household In Trade and Storage and Other
Industry Construction Commerce Communications Services Non-workers 81. Name of Scheduled No. Tribe Males Females Males Females Males Females Males Females Males Females Males Females
1 1S 16 17 18 19 20 21 22 23 24 25 26
DISTRICT RURAL
All SCbeduled Tribes 3 9 6 7 1 Bhil - - 4 2 2 Mina 3 9 2 , 3 Unclassified
DISTRICT URBAN
All Scbeduled Tribes 3 .. 3 213 151 294 330 1 Bhil 1 2 Mina 3 3 204 148 291 324 3 Unclassified .. 8 3 3 ,

185
seT-I-FLY LEAF
Total Scheduled Castes Scheduled Tribes Rural
District/Tehsil Urban Males Females Males Females
1 2 3 4 5 6
DISTRICT T 33,923 32,059 539 495 R . 26.656 25.269 26 14 U 7,267 6,790 513 481
Bikaper Tehsil T 14.991 13,975 522 478 R 7,924 7,345 13 1 U 7,067 6,630 509 477
Lunkaransar Tehsil T 5.146 4.873 R 5,146 4,873 U
Kolayat Tehsil T 5,874 5,564 8 6 R 5.874 5,564 8 6 U
Nokhli\ Tebsil T 7.912 7,647 9 11 R 7,712 7,487 5 7 U 200 160 4 4

186
TABLE seT-II PART A-AGE AND MARITAL
Total Population
Divorced or Unspecified Total Never Married Married Widowed separated status
SI. Name of ------No. Scheduled Caste Persoos Males Females Males Females Males Females Males Females Males Females Males Females
2 3 4 5 6 7 8 9 10 11 12 13 14 IS
DISTRICT
All Scbeduled Castes 65,981 33,913 32.059 17,446 13,481 15,462 15,619 967 2,889 16 18 32 32 1 BaJai 94 53 41 32 27 20 13 I 1 2 Bawaria 19 9 10 6 6 3 4 . . •• 3 Bhand 32 12 20 2 8 10 10 2 4 Bhangi 5,103 2,582 2,521 1.430 1.277 1,047 1,035 55 208 1 5 Chamar. Bhambbi. Jatav,
1atia. Mocbi. Raidass, Raigar or Ramdasia 4,831 2,467 2.364 1.262 1,046 1,132 1.124 69 193 3 I
6 Dabgar 10 10 3 6 1 7 Dhankia 539 273 266 125 86 137 144 10 35 1 1 8 Dheda 70 44 26 19 8 20 14 5 4 9 Dome 55 31 24 17 8 12 11 2 5
10 Gandia 132 67 65 39 32 27 28 1 S 11 Garo, Garura or Gorda 369 J80 189 99 90 74 73 7 26 12 Gavaria 98 46 52 25 24 20 25 1 3 13 Jingar 39 IS 24 S 12 10 9 3 14 J{albeIia 21 13 8 10 4 3 4 15 Kamad or Kamadia 47 17 30 10 16 7 13 1 16 Kanjar 105 52 53 27 16 2S 33 4 17 Khatik 21 13 8 7 2 5 6 1 18 Koli or Kori 220 J!8 102 60 33 52 S4 6 J5 19 Majhabi 2 2 2 20 Megh or Meghwal 35,730 18,399 17,331 9.334 7.029 8,481 8,584 554 1,694 8 6 22 18 21 Mehtar 210 115 95 62 42 47 4S 4 6 2 2 22 Nut 4 4 1 3 23 Sansi 1.189 616 573 284 230 302 293 29 49 24 Santia 21 10 11 4 5 5 4 1 2 25 Sarbhangi 188 101 87 59 34 40 45 1 8 1 26 Sargara 25 II 14 5 9 6 5 27 Singiwala 2 1 1 1 1 28 Thod or Nayalt 10.945 5,682 5,263 2,927 2,234 2,610 2,601 138 415 3 8 4 S 29 Tirgar 199 101 98 51 34 48 55 2 9 30 Valmiki 47 26 21 16 9 9 11 I I 31 Unclassified 5,615 2,853 2,762 1.413 1.160 1,300 1,386 78 199 1 11 1 6

187
STATUS FOR SCHEDULED CASTES
Age 0-14
Divorced or Unspecified Total Never Married Married Widowed separated status
~-~------~ - - --- Name of Sl. Males Females Males Females Males Females Males Females Males Females Males Females Scheduled Caste No.
16 17 18 19 20 21 22 23 24 25 26 27 2 1
TOTAL
15,520 15,069 14,903 13,190 582 1,848 11 16 2 1 22 14 All Scheduled Castes
27 30 27 27 3 Balai 1 6 6 6 6 Bawaria 2 1 8 1 8 Bhand 3
1,316 1,307 1,286 1,217 30 89 Bhangi 4 Cbamar. Bbambhi. Jatav, 5
1,109 1,160 1,077 1,025 29 133 Jatia, Mochi, Raidas!,
1 3 I Raigar or Ramdasia 3 3 Dabgar 6
]09 99 104 79 4 19 .. 1 Dhankia 7 17 9 16 8 1 1 Dheda 8 20 1 t 16 8 4 2 Dome 9 37 34 37 32 2 Gandia 10 91 100 88 90 3 10 Garo, Garura or Gurda 11 24 25 23 24 1 Gavaria 12
5 13 5 12 1 Jingar 13 9 4 9 4 Kalbelia 14 9 19 9 16 3 Kamad or Kamadia IS
22 21 21 16 1 5 Kanjar 16 7 2 6 2 1 Khatik 17
56 34 52 31 4 3 Koli or Kori 18 1 Majhabi 19
8,225 7,901 7,901 6.884 301 998 5 8 2 16 10 Megh or Mcghwal 20 56 47 55 42 .5 Mehtar 21
1 1 Nut 22 282 286 246 225 36 60 1 Sansi 23
4 5 3 5 1 .. Santia 24
52 37 50 34 2 3 Sarbhangi 25 5 9 5 9 Sargara 26
Singiwala 27 2,641 2,563 2,521 2,200 116 360 2 3 2 Thori or Nayak 28
49 41 47 33 2 8 Tirgar 29 14 9 14- 9 Valmiki 30
1.322 1.289 1.2i 3 1,144 47 142 2 2 Unclassified 31
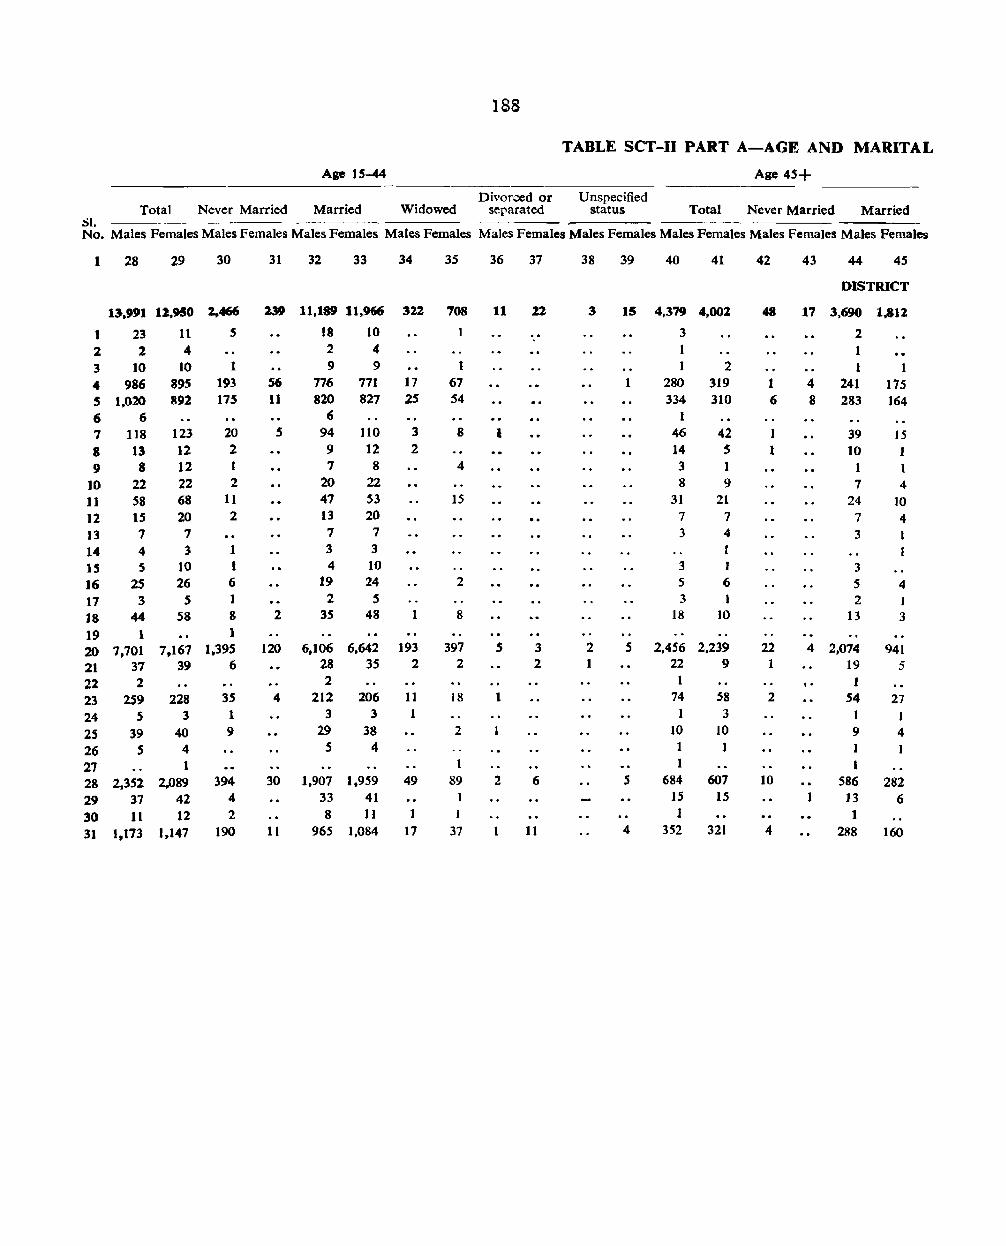
Age 15-44
Total Never Married Married ,sl.
188
Divorced or Widowed separated
TABLE SCT-II PART A-AGE AND MARITAL
Age 45+
Unspecified status Total Never Married Married
No. Males Females Males Females Males Females Males Females Males Females Males Females Males Females Males Females Males Females
I 28 29 30
13.991 12.950 1,466
I 2
23 2
11 4
5
3 10 10 1 4 986 895 193 5 •• 020 892 175 6 6 7 118 123 20 8 13 12 2 9 8 12 I
)0 22 22 2 11 58 68 II 12 15 20 2 13 7 7 14 4 3 1 15 5 10 I 16 25 26 6
17 3 5 1 18 44 58 8
19 1 20 7,701
1
7,167 1,395 21 37 39 6 22 2 23 259 228 24 5 3 2S 39 40 26 5 4 21 1 28 2,352 2,089 29 37 42 30 11 12 31 1,173 1,147
35 1 9
394 4 2
190
31 32 33 34
239 11,189 11,966 322
56 11
5
2
120
4
30
11
18 10 2 4 9 9
776 771 17 820 827 25
6 94 110 3
9 12 2 7 8
20 22 47 53 13 20 7 7 3 3 4 10
19 24 2 5
35 48
6.106 6,642 28 35 2
212 206 3 3
29 38 5 4
1,907 1,959 33 41 8 11
965 1,084
1
193 2
11 1
49
1 17
35
10S 1
I 67 54
8
4
15
2
8
397 2
18
2
1 89
I
37
36 37
11
I ..
s
1
2
22
3 2
6
11
38 39
3
2 1
IS
1
S
s
4
40 41
4.379 4,002
3 1 1 2
280 319 334 310
I 46 42 14 S 3 1 8 9
31 21 7 7 3 4
3 1 5 6 3
18 10
2.456 2.239 22 9
I 74
1 10 1 1
684 15 1
352
58 3
10 1
607 15
321
42
48
1 6
1 1
22 1
2
10
4
43 44 4S
DISTRICT
17 3,690 1.812
2 I 1 1
4 241 175 8 283 164
39 15 10 1
1 1 7 4
24 10 7 4 3 1
3 5 2
13
4 I 3
4 2,074 19
941 5 ..
1
1 54
1 9 I
1 586
J3 1
288
27 I 4 1
282 6
160

189
STATUS FOR SCHEDULED CASTES-Cone/d.
Age 45+ Age not stated
Divorced or Unspecified Divorced or Unspecified Widowed separated status Total Never Married Married Widowed separated status
---_ -~---------.- ------~---
Males Females Males Females Males Females Males Females Males Females Males Females Males Females Males Females Males Females
46 47 48 49 50 51 52 53 54 55 56 57 58 59 60 61 62 63
TOTAL
632 2,165 3 5 6 3 33 38 29 35 1 3 2 1
1 2
I 3 38 140 4 44 138 4 2 4 2 5
1 6 6 27 2 2 7 3 4 8 2 9 1 5 10 7 II 11
3 12 3 13
14 I 15 2 16
I 17
5 7 18 19
356 1,289 2 3 3 17 24 16 21 3 1 20
2 4 21 22
18 30 1 1 1 23 2 24
1 6 25 26 27
85 323 2 2 5 4 2 4 1 2 28
2 8 29 30
59 161 1 6 5 6 S 31
Btka-19
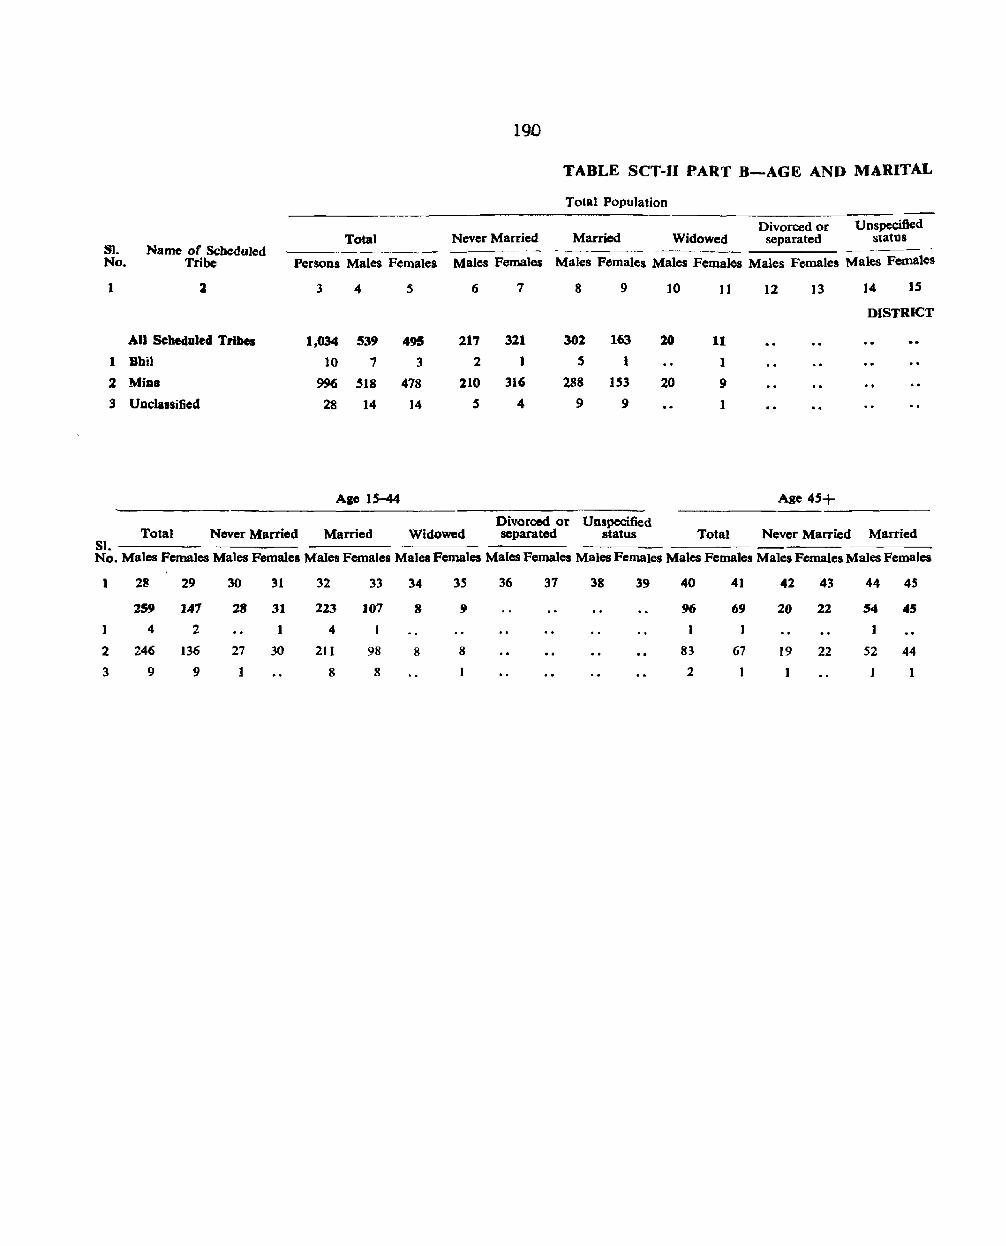
190
TABLE seT-II PART B-AGE AND MARITAL
Total Population
Divorced or Unspecified Total Never Married Married Widowed separated slatus
S. Name of Scheduled -------No. Tribe Persons Males Females Males Females Males Females Males Females Males Females Males Females
1 2 3 4 5 6 7 8 9 10 11 12 13 14 IS
DISTRICT
All Beheduled Tribe. 1,034 539 495 217 321 302 163 20 11
1 Bbil 10 7 3 2 1 5 1 1
2 MiA8 996 .s18 478 210 316 288 IS3 20 9
:3 UDclanified 28 14 14 oS 4 9 9 1
Agcl5-44 Age 45+
Divorced or Unspecified Total Never Married Married Widowed separated status Total Never Married Married
Sl. No. Males Females Males Females Males Females Males Females Males Females Males Females Mates Females Males Females Males Females
} 2~ 29 30 31 32 33 34 3S 36 37 38 39 40 41 42 43 44 4S
259 147 28 31 223 J07 8 9 96 69 20 22 54 45
] 4 2 J 4
2 246 136 27 30 211 98 8 8 83 67 19 22 52 44
3 9 9 1 8 8 2 1 1 1
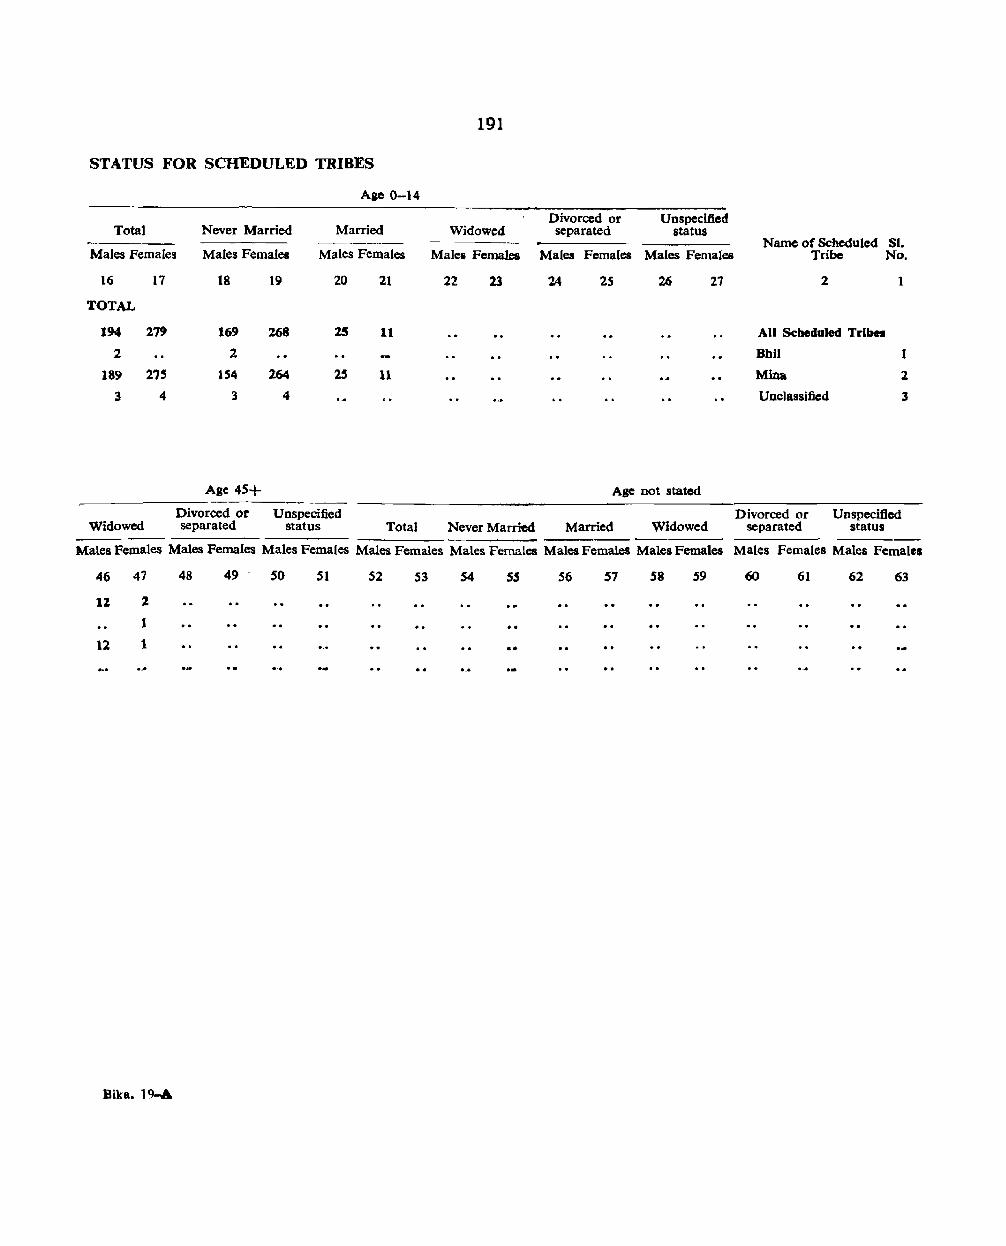
STATUS FOR SCHEDULED TRIBES
Total
Males Females
16 17
TOTAL
194 279
2
189 275
3 4
Never Married
Males Females
18 19
169 268
2
154 264
3 4
Age 45+
Age 0-14
Married
Males Females
20 21
25 11
2.S 11
----------------Divorced or Unspecified
Widowed separated status Total
191
Widowed
Malei Females
22 13
Never Married
Divorced or separated
Unspecified status
Males Females Males Females
24 25 26 27
Age not stated
Married Widowed
Name of Scheduled St. Tribe No.
2
All Scheduled Tribes
Bhil
Mina
Unclassified
1
1
2
3
Divorced or Unspecified separated status
Males Females Males Females Males Females Males Females Males Females Males Females Males Females Males Females Males Females
46 47 48 49 50 51 52 53 54 55 56 57 58 59 60 61 62 63
lZ 2
1
12 1 .. . .. o_o
Bika. 19 ....
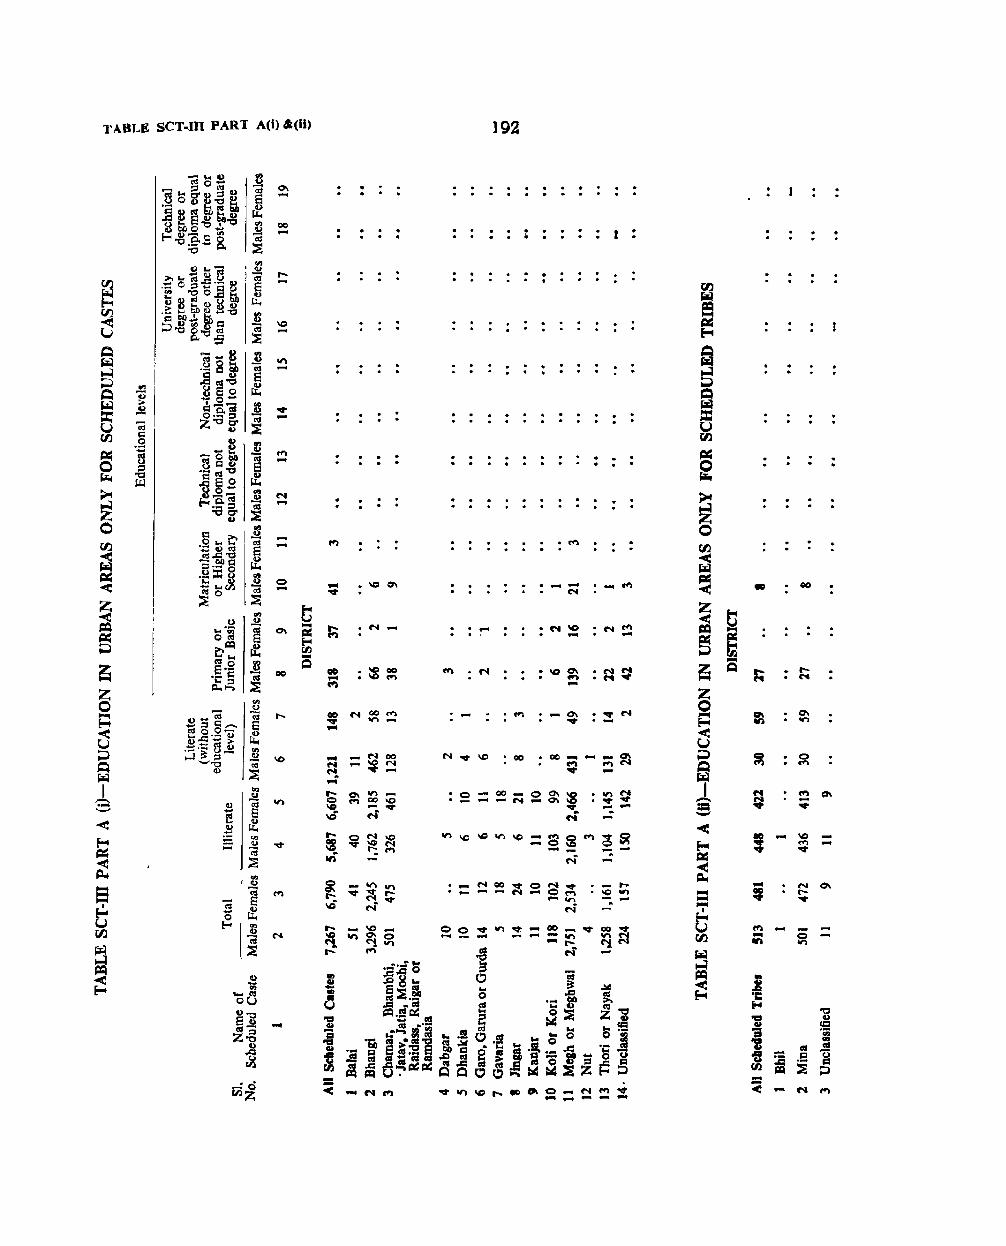
TABLE seT-III PART A(i) ,*(Ii)
0\ ....
00 ....
• ....
N ....
.... -o -
-
192
. ..
.....
• r"l
. --N
• •
. .
-~
C"IIO ·N~ .... -
. - ~
: ~ ~ --. -
• • 00
· ,... • N
• 0\ • on
• 0 · ~
• .

193 TABl,E SCT-I11 PART B l)) .. (Ii)
TABLE SCT-III PART B (i)-EDUCATION IN~RURAL AREAS ONLY FOR SCHEDULED CASTES
Literate Educational levels (without
educational Primary or Matriculation Tota1 Illiterate level) Junior Basic and above
Name of Scheduled Caste Males Females Males Females Males Females Males Females Males Females
1 2 3 4 , 6 7 8 9 )0 11
DISTRICT
All Scheduled Castel 26,656 25,269 24,332 25,165 1,829 100 48;\ 4 12
I Balai 2 1 1 2 Bawaria 9 10 6 10 3
3 Bhand 12 20 11 19 1 1
4 Bhangi 286 276 259 274 21 2 6
S Chamar, Bhambhi. Jatav, Jatia, Mochi, Raidass. Raipr or Ramdasia 1,966 1.889 1.661 1.876 147 13 153 5
6 Dbankia 263 255 231 25' 32
7 Dbeda 44 26 36 26 4 4 8 Dome 31 24 28 24 3 9 Gandia 67 65 62 6S 4 1
10 Garo. Garura or Gurda 166 177 97 168 62 9 7
II Gavaria 41 34 41 34 12 Jingar 1 1
13 Kabelia 13 8 13 8
14 Kamad or Kamadia 17 30 13 30 4 14 Kanjar 41 43 40 43 1
16 Khatik 13 8 7 8 6
11 Majhabi 2 2
15 Megh or Megbwal U.~ 14,797 14.321 14,744 1.172 S3 151 4
J9 MehtaI' US 95 104 93 9 2 J 1
20 Sansi 616 5'73 590 572 22 1 4
21 Santia 10 11 10 11
22 Sarbhangi 101 87 99 87 2
23 Sargara 11 14 8 14 1 2
14 Singiwala 1 1 1 1
25 Thori or Nayak 4,424 4,102 4.222 4.092 186 9 16 1
26 Tirgar 101 98 84 98 16 1
27 Valmiki 26 21 2S 21 1 28 Unclassified 2,629 2,60S 2,360 2,592 130 10 137 3 2
TABLE SCf-m PART B Oi)-EDUCATION IN RURAL AREAS ONLY FOR SCHEDULED TRIBES
DISTRIct
Total 16 14 15 11 11 2 1
1 Bhil 6 3 6 3
2 Mina J7 6 6 3 11 2
3 Unclassified 3 S 3 S

194
-TABLE seT-IV PART A-RELIGION FOR SCH'tDULED CASTES
Religions
Total Hindus Sikh. Rural SI.
No. Name of Scheduled caste Urban Persons Males Femal~s Males Females Males Females
1 2 3 4 5 6 7 8 9
DISTRICT
All Scheduled CMteI RlU'8J 51.925 26.656 25,269 26,653 25.269 3 Urban 14.057 7~7 6.790 7,267 6,790
1 Balai Rural 2 2 2. Urban 92 51 41 51 41
2 Bawaria Rural 19 9 10 9 10 3 Bhand Rural 32 12 20 12 20
4 Bhangi Rural 562 286 276 286 276 Urban 4.541 2.296 2.245 2.296 2.245
S Chamar. Bhambbi, lataY• latia. Mochi. Raidass. Raigar or
Rural Ramdasia 3,855 1,966 1,889 1,96S ~889 1 Urban 976 501 475 501 475
6 Dabgar Urban 10 10 10
7 Dhanlcia Rural 518 263 255 263 25S Urban 21 10 11 10 11
8 Dbeda Rural 70 44 26 44 26
9 Dome Rural S5 31 24 31 24
10 Gandia Rural 132 67 6; 67 65
11 Garo, Garura Or Gurda Rural 343 166 177 166 177 Urban 26 14 Il 14 12
12 Gavaria Rural 75 41 34 41 34 Urban 23 5 18 5 18
13 Jingar Rural 1 1 1 Urban 38 14 24 14 24
14 Kalbelia Rural 21 13 8 13 8
lS Kamad or Kamadia Rural 47 17 30 17 30
16 Kanjar Rural 84 41 43 41 43 Urban 21 11 10 II 10
17 Kbatik Rural 21 13 8 13 8
18 Koli or Kori Urban 220 118 102 118 102
19 Majhabi Rural 2 2 2
20 Megh or Meghwal Rural 30.445 15,648 14.797 15,648 14,797 Urban 5.285 2,751 2,534 2,7S1 2,534
21 Mebtar Rural 210 115 95 115 9S
22 Nut Urban 4 4 4
23 Sansi Rural 1.189 616 573 616 573
24 Santia Rural 21 10 11 10 II
25 Sarbhangi Rural 188 101 87 101 87
26 Sargara Rural 2S II 14 11 14
27 Singiwala Rural 2 1 1 1 I
28 Thori or Nayak Rural 8,526 4,424 4,102 4.424 4.102 Urban 2.419 1.258 1,161 1,258 1,161
29 Tirgar Rural 199 101 98 101 98
30 Valmiki Rural 47 26 21 26 21
31 U Dclassified Rural 5,234 2,629 2,605 2,629 2,605 Urban 381 224 157 224 157
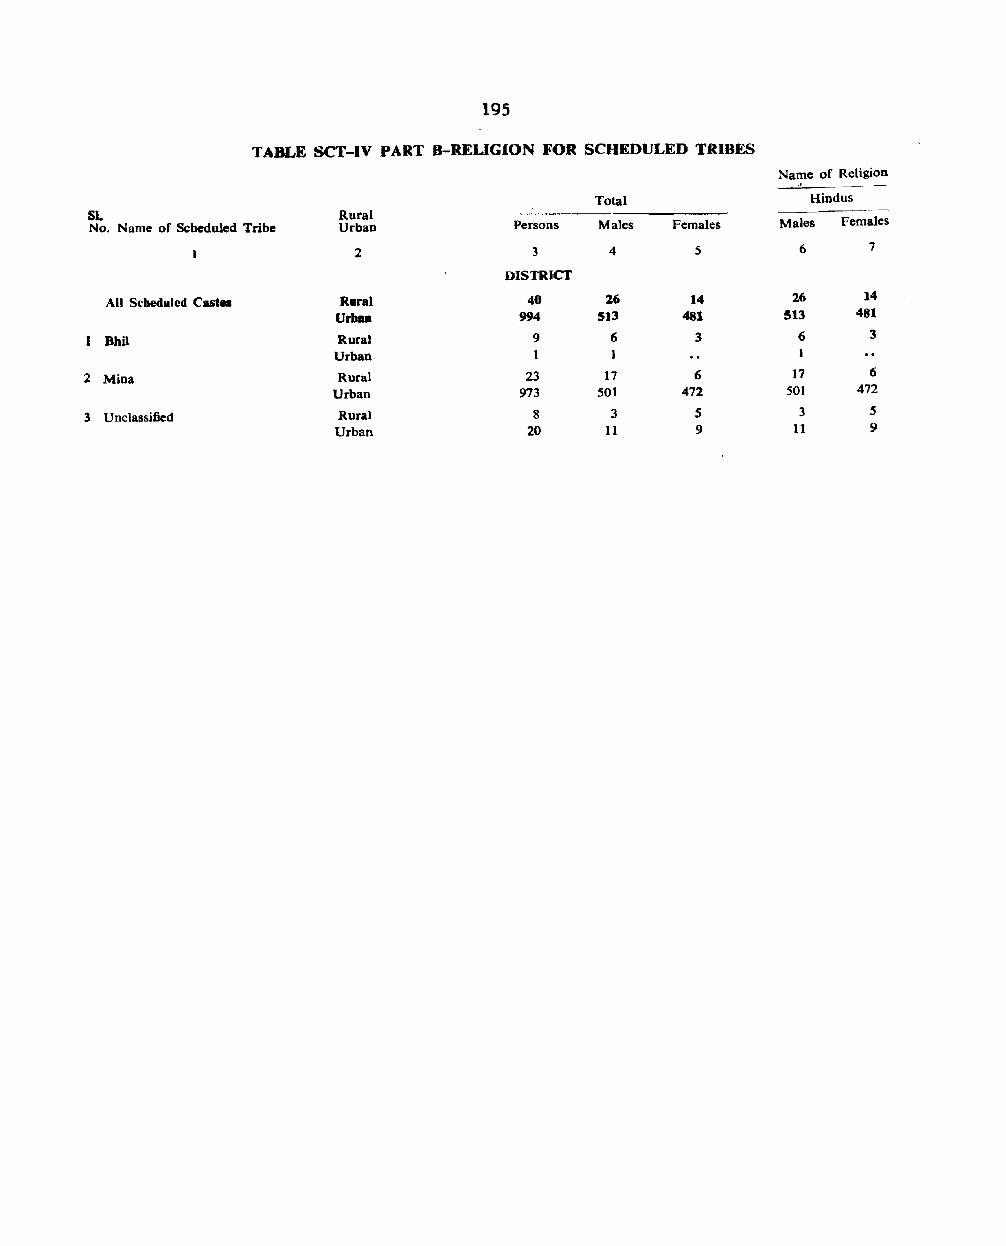
195
TABLE SCT-IV PART B-RELIGION FOR SCHEDULED TRIBES
Name of Religion ~
Total Hindus Sl. Rural No. Name of Scheduled Tribe Urban Persons Males Females Males Females
2 3 4 5 6 7
DISTRICT
All Scheduled Cast .. Rural 40 26 14 26 14
UrbaD 994 513 481 513 481
I BhiJ Rural 9 6 3 6 3
Urban 1 1
2 Mina Rural 23 17 6 17 6
Urban 973 SOl 472 501 472
3 Unclassifi~d Rural 8 3 5 3 5
Urban 20 11 9 11 9

TABLE SCT-V PART-A" B 196
TABLE SCT-V PART A-SAMPLE HOUSEHOLDS ENGAGED IN CULTIVATION CLASSIFIED BY INTEREST IN LAND AND SIZE OF LAND CULTIVATED IN RURAL AREAS ONLY FOR SCHEDULED CASTES
(Based on 20% Sample)
No. of Cultiva- Households engaged in cultivation by size of land in acres
ting house- Less Unspe-
Interest in land cultivated bolds than 1 1.0-2.4 2.5-4.9 5.0-7.4 7.5-9.9 10.0-12.4 12.5-14.9 15.0-29.9 30.0-49.9 50+ cified
1 2 3 4 5 6 7 8 9 10 11 12 13
DISTRICT
Total 1.611 3 10 46 37 63 34 450 427 512 39
] Owned or held from Government 1.345 ] 8 37 3J 49 24 360 358 440 37
2 Held from private person Of institutions for payment in money. kind or share 180 2 2 9 5 14 9 6S 35 37 2
3 Partly held from Govt. and partly from private persons for payment in money. kind or share 96 1 1 25 34 35
TABLE SCT-V PART B-SAMPLE HOUSEHOLDS ENGAGED IN CULTIVATION CLASSIFIED BY INTEREST IN LAND AND SIZE OF LAND CULTIVATED IN RURAL AREAS ONLY FOR SCHEDULED TRIBES
(Based on 20% Sample)
No. of CuItiva- Households engaged in cultivation by size of land in acres
ting -------house- Less Unspe~
Interest tn land cultivated holds than 1 1.0-2.4 2.5-4.9 5.0-7.4 7.5-9.9 10.0-12.4 12.5-14.9 15.0-29.9 30.0-49.9 50+ cified
Total
1 Owned or held from Government
2 Held from private person or institutions for payment in money. kind or share
3 Partly held from Govt. and partly from private persons for payment in money. kind or share
2
2
2
3 4 5 6
DISTRICT
1
1
7 8 9 10 II 12 13
1
I
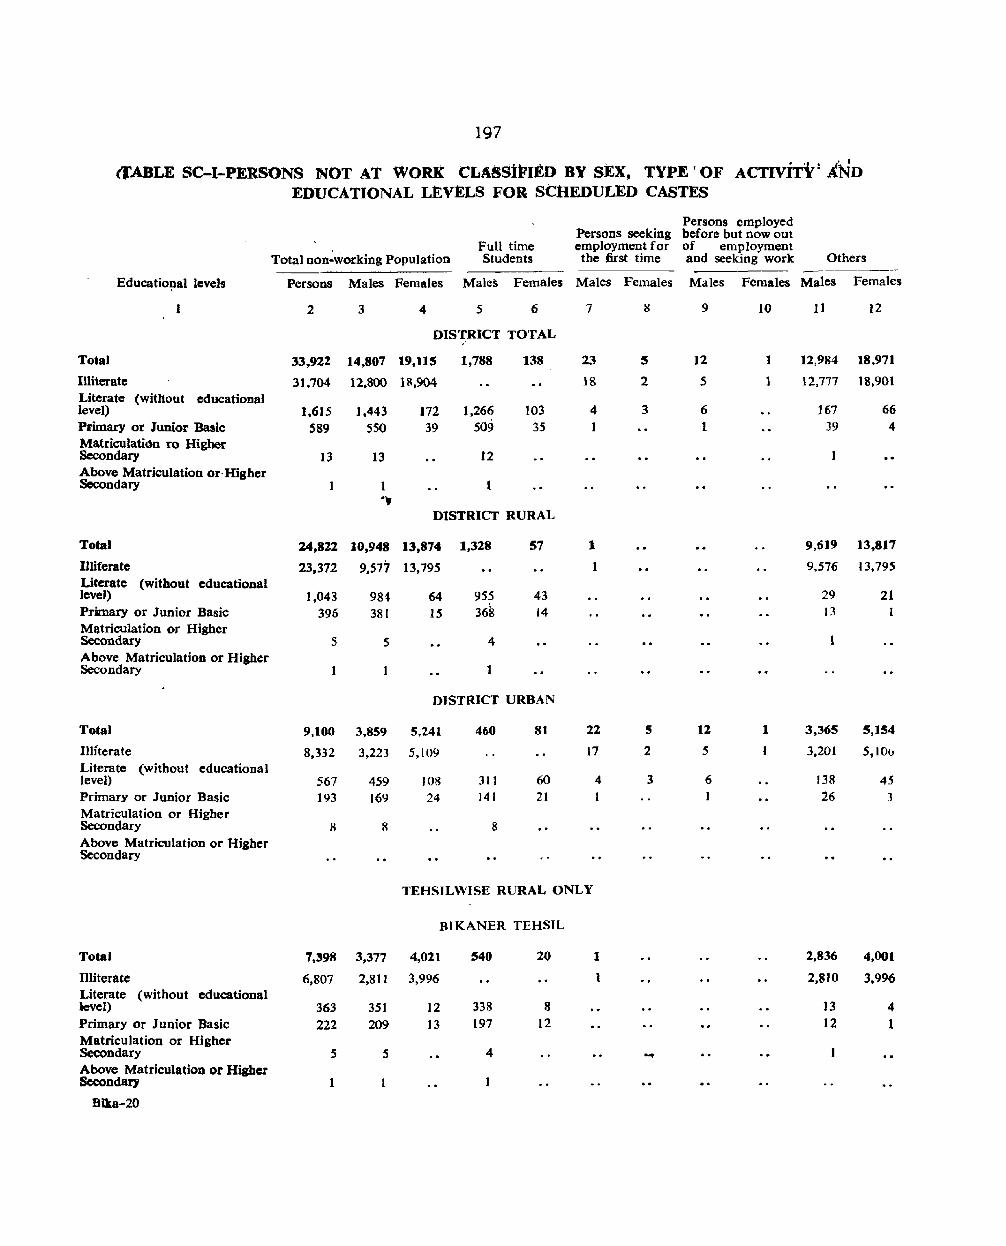
197
(fABLE SC-I-PERSONS NOT AT WORK CLA8StFItD BY SEX, TYPE 'OF ACTIViTY I A:ND EDUCATIONAL LkVELS FOR SClIEDULED CASTES
Persons seeking Persons employed before but now out
Total non~workjng Population Full time employment for of employment Students the first time and seeking work Others
~---~
Educatio~al levels Persons Males Females Males Females Males Females Males Females Males Females
1 2 3 4 5 6 7 8 9 10 11 12
DISTRICT TOTAL
Total 33,922 14,807 19,115 1,788 138 23 5 12 I 12,984 18.971
Illiterate 31.704 12,800 18,904 18 2 5 1 12,777 HI,90t Literate (without educational level) 1.615 1.443 172 1,266 103 4 3 6 167 66 Primary or Junior Basic S89 550 39 509 35 1 1 39 4 Matriculatidn ro Higher Secondary 13 13 12 1 Above Matrj~ulation or- Higher Secondary 1 I 1 .,
DISTRICT RURAL
Total 24,S12 10,948 13,874 1,328 57 1 9,619 13,817
IJIiterate 23.372 9.577 13,795 1 9,576 13,795 Literate (without educational level) 1,043 98~ 64 955 43 29 21 Primary or Junior Basic 396 381 15 368 14 13
Matriculation or Higher Secondary 5 5 4 Above Matriculation or Higher Secondary 1
DISTRICT URBAN
Total 9,100 3,859 5,241 460 81 22 5 II 1 3,365 5,154
Illiterate 8,332 3.223 5.109 17 2 5 3.201 5,100 Literate (without educational level) 567 459 108 311 60 4 3 6 138 45 Primary or Junior Basic 193 169 24 141 21 I 26 J
Matriculation or Higher Secondary 8 8 8 Above Matriculation or Higher Secondary
TEHSILWISE RURAL ONLY
BI KANER TEHSIL
Total 7,398 3.377 4,021 540 20 1 2.836 4,001
Illiterate 6,807 2,811 3.996 2,810 3.996 Literate (without educational level) 363 351 12 338 8 13 4 Primary or Junior Basic 222 209 J3 197 12 12 1 Matriculation or Higher Secondary 5 5 4 ... 1 Above Matriculation or Higher Secondary
BIka-20

198
TABLE SC-I-PERSONS NOT AT WORK CLASSIFIED BY SEX, TYPE OF ACTIVITY AND EDUCATIONAL LEVELS FOR SCHEDULED CASTES-Concld.
Persons employed Persons seeking before but now out
Fun time employment for of employment Total non-working population Students the first time and seeking work Others
Educational levels Persons Males Females Males Females Males Females Males Females Males Females
1 2 3 4 5 6 7 8 9 10 11 12
LUNKARANSAR TEHSIL
Total 5,561 2.169 3.392 215 7 1,954 3,385
Illiterate 5,332 1,950 3,382 1,950 3,382 Literate (Without educational level) 106 98 8 95- 5 3 '3
Primary or Junior Basic 123 121 2 120 2 Matriculation or Higher Secondary Above Matriculation or Higber Secondary
KOLAYAT TEHSIL
Total 5,158 2,271 2,887 247 17 2,024 2,870
Illiterate 4,879 2,020 2,859 2,020 2,859 Literate (Without educational level) 242 214 28 210 17 4 11 Primary or Junior Baste 37 37 37 Matriculation or Higher Secondary .. Above Matriculation or Higher Secondary ..
NOKHA TEHSIL
Total 6,705 3,131 3,574 326 13 2,805 3.561
IUiterate 6,354 2,796 3,558 2,796 3.552 Literate (without educational level) 337 321 16 312 13 9 3 Primary or Junior Basic 14 14 14 Matriculation or Higber Secondary Above Matriculation or Higher Secondary ..
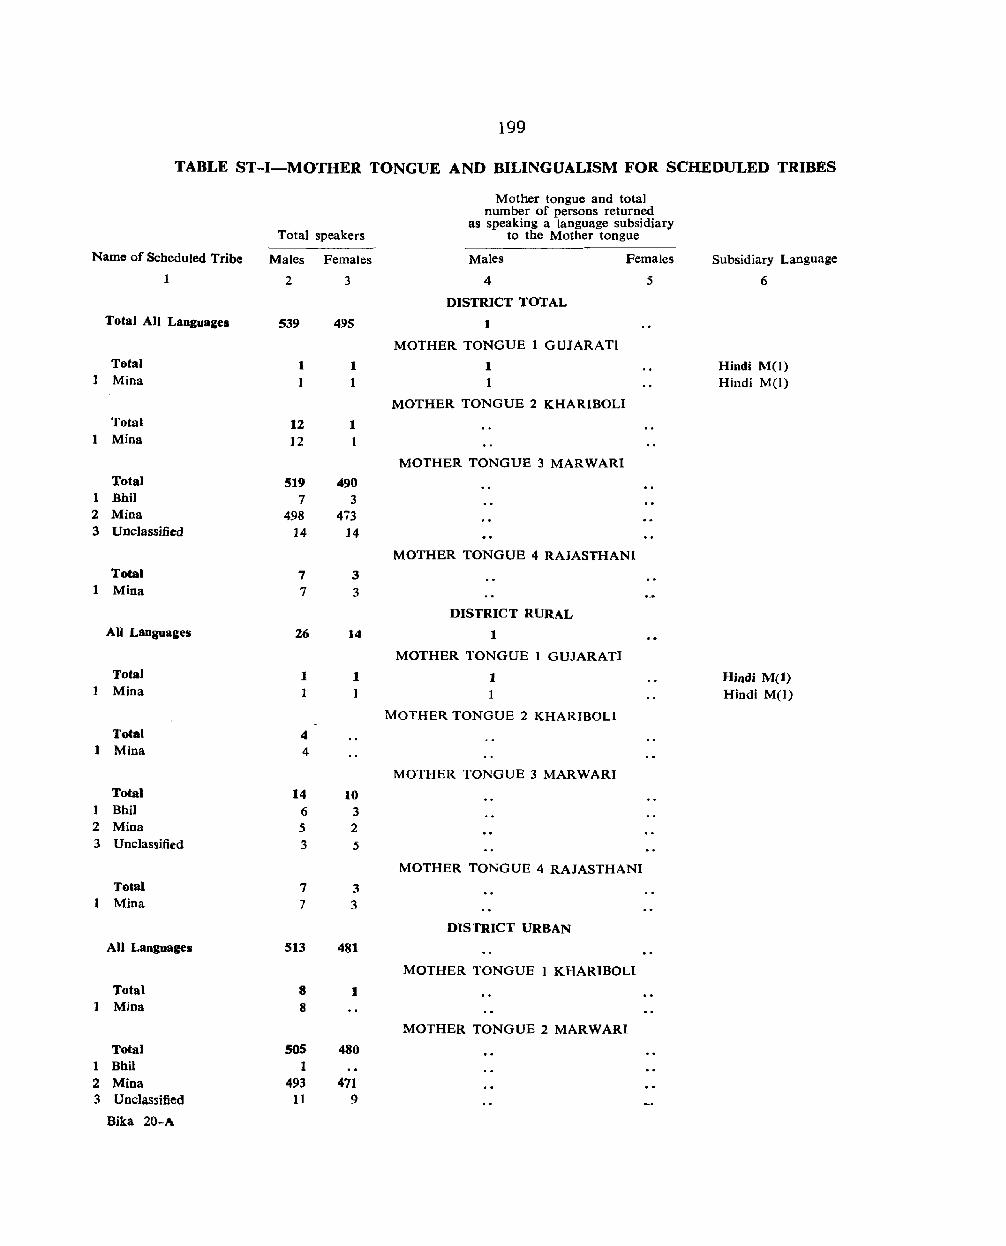
199
TABLE ST-I-MOTHER TONGUE AND BILINGUALISM FOR SCHEDULED TRIBES
Mother tongue and total number of persons returned
as speaking a language subsidiary Total speakers to the Mother tongue
Name of Scheduled Tribe Males Females Males Females Subsidiary Language
1 2 3 4 5 6
DISTRICT TOTAL
Total All Languages 539 495 1
MOTHER TONGUE 1 GUJARATl
Total 1 1 1 Hindi M(I) 1 Mina 1 1 1 Hindi M(I)
MOTHER TONGUE 2 KHARIBOLI
Total 12 1 1 Mina 12
MOTHER TONGUE 3 MARWARI Total 519 490
1 BhiJ 7 3 2 Mina 498 4;3 3 Unclassified 14 14
MOTHER TONGUE 4 RAJASTHANI
Total 7 3 1 Mina 7 3
DISTRICT RURAL
AU Languages 26 14 1
MOTHER TONGUE 1 GUJARATI
Total 1 1 1 Hindi M(l) 1 Mina 1 1 1 Hindi M(l)
MOTHER TONGUE 2 KHARIBOLI Total 4
1 Mina 4
MOTHER TONGUE 3 MARWARI
Total 14 10 Bhil 6 3
2 Mina 5 2 3 Unclassified 3 5
MOTHER TONGUE 4 RAJASTHANI
Total 7 3 I Mina 7 3
DIS TRICT URBAN
All Languages 513 481
MOTHER TONGUE 1 KHARIBOLl
Total 8 1 1 Mina 8
MOTHER TONGUE 2 MARWARI
Total 50S 480 1 Bhil 1 2 Mina 493 471 3 Unclassified 11 9
Bika 20-A
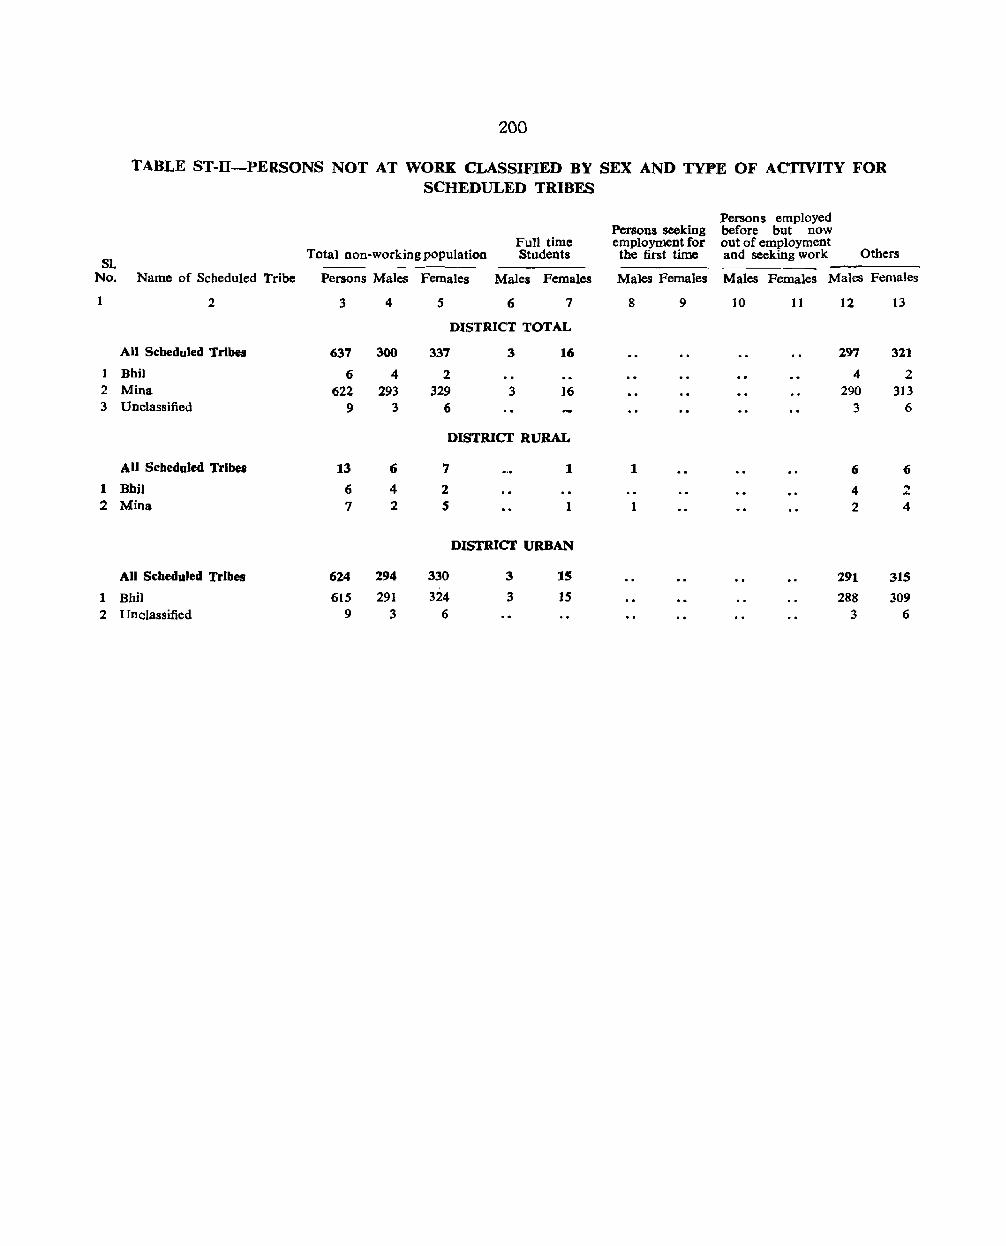
200
TABLE ST-II-PERSONS NOT AT WORK CLASSIFIED BY SEX AND TYPE OF ACTIVITY FOR SCHEDULED TRIBES
Persons employed Persons seeking before but now
Full time employment for out of employment Total non-working population Students the first time and seeking work Others
S1. No. Name of Scheduled Tribe Persons Males Females Males Females Males Females Males Females Males Females
1 2 3 4 5 6 7 8 9 10 11 12 13
DISTRICT TOTAL
AU Scbeduled Tribes 637 300 337 3 16 297 321
J Bhil 6 4 2 4 2 2 Mina 622 293 329 3 16 290 313 3 Unclassified 9 3 6 3 6
DISTRICI'RURAL
All Scheduled Tribes 13 (; 7 1 1 6 (j
1 Bbil 6 4 2 4 ~ ... 2 Mioa 7 2 S 1 1 2 4
DISTRICI' URBAN
All Scl1eduled Tribes 624 294 330 3 15 291 315
1 Bhil 615 291 324 3 IS 288 309 2 I Tn classified 9 3 6 3 6

SECTION III
VILLAGE DIRECTORY
&
SOME OFFICIAL STATISTICS

VILLAGE DffiECTORY

205
VILLAG:R DIRECTORY
( Note)
Data collected for the Census 1961 at the village level has already been presented in the Primary Census Abstract. As an ancillary project, some additional information was also colJected through a Village Information Schedule, specially desigped by this office,. and is presented in this Village Directory. Information in this directory and what has been pr~sented in the official statistics and the maps may in certain cases be found to be conflicting. The reason, obviously lies in the fact that data has been collected from different sources~
The Directory gives information about the major crop, the distance in miles from the nearest Primary School, Hospital or Dispensary, Railway Station, Post Office, Bus Stand and Police Station for each village. Such information was not collected for unpopulated villages. Where information was not received for a particular item an indication to this effect has been made by putting a '-'.
With a view to assist the reader to locate the viUages easily, they have been presented here alpha-
'bftically. The names of the villages have also been g~en In the Devnagri Script. The names o~ the villages found to be printed wrongly in the Pnmary Census Abstract have been corrected here.
Crop which has the largest area under cultivation has been treated as the major crop of a vill:;tge. and the following abbreviations have been used to mdlcate it in Column No.2 :-
W-Wheat G-Gram J -Jowar B - Barley Bj -Bajra
M - Maize R- Rice P - Pulses T-Til
WG - Wheat Gram (Gochana) WB - Wheat Barley (Gojara) BG - Barley Gram (Bejar) Md - Mustard
C - Cotton

Code No. & Name of Village
1
BIKANER TEHSIL
40 Abharawala ~".,~
34 Adoori ~~
71 Akariyala ~n;f.~nqsr
29 Akkasar 'MCfCfiT 13~
3 Alladin-k:l-Bera ~~~r~1';{ n ittT
42 Amarpura ~;r(~T
144 Ambasar ~qT~~
126 Anandpura en~o:~~
lOS Anopsagar ~;{lq~:nll~
129 Aseran etlij'U~
100 Bachhasar ;raT~~
169 Badh Karoidan 'It, cp: .. '~r~
2
P
P
T
P
p
T
p
p
63 Badrasar P ~{R
28 Ballar ;rpe~
133 Bamloo P .~Cf~
120 Bandha P ii~
51 Bandranwala P ~F~Uif""lcm
49 Barala P "U~
48 Barjoo P
'R:'ii 149 Barsingsar
if{req«~ 112 Basi P
Sahajwardaran -Ta'} «&~il(~fUi(
97 Basti Chaodan ~o1 :qfi!i:sr;r
107 Beechhwal T ~rw
20Q
VILLAGE DIRECTORY
Distance in miles from nearest
~ o
3 s 6
Unpopulated
6 6 6 6
S s s s S
UnpopuJated
18 18 68 18 18
8 40 40 20 o
o 19 S 6 1
12 2 2
Unpopulated
7 7 6
o 8 8 o
Unpopulated
o 10 8 16 J6
80 30 30
o 16 14 14 o
3 ]0 3 3 12
6 33 33 33 7
4 30 30 30 6
o 32 32 32 s
o
s 10 10 10 10
8 8 8 8 3
4 4 .. 4 4
6
5
18
20
6
14
8
6
10
J4
]2
33
30
25
J1
6
4
Code No. & Name of VilJaac
I 2
BIKANBR TEHSIL-contd.
171 Belasar ~~«(
4 Beriyawali itf{~8t
91 Bhaioroo Kbeera ~.~ 7ilKr
65 Bhairoo Pawa ~~ (Hen
43 Bhanipura llT;r'l!J{J
46 BhaDwatanwala ¥fiWtfJ'ilCJrtIJ'
103 Bhojanshala m~~,eT
130 Bhojeran ~t~~"T~
]47 Bbojoosar ~t~e(
93 Cbak Garbi :qii i1~r«'
38 Cbakosa :qcnrer
35 CbhangoJiya O'~"'tft;s~
J J Chhatargarh .5{~
75 Dadoosar ~TiliJ(
S9 Daiya ~~T
26 Dantor <::;:ffl(
73 Daudsar <{rof.\~{
so Deensar ~1~«'{
68 Derjogran ~~)m:,;r
162 Dewasar ~~(
13 I Dbeereran 1:'ft~
17 Dhodba ml!lT
82 DhoJera No. I t:il~u ff. \
p
T
p
P
p
Bj
P
P
Bj
p
Bj
Bj
p
p
P
T
P
Distance in miles from nearel'
3 6 7 8
o 1 o o
2S 25 7S 25 2S
8 16 8 16 3 ]6
8 8 16 1 8
, 40 40 32 6 6
10 40 40 25 20 25
333 3 3
12 1 1 12
Unpopulated
52 52 52 8 8 8
Unpopulated
o 6 6 6 6 6
6 4 4 4 12
o 70 20 30 30
o 5 5 5 s 5
Unpopulated
Unpopulated
3 3 3 3 3 16
14 1 1 14
8 54 54 )0 o 10
8 20 6 6 6

Code No. &: Name of Village
1 2
BIKANBR TEHSIL-contd.
83 Dholera No. 2 "')~tr W{.. ,
85 Dholel a M aghji
~r "1ft 86 Dholera Pemji
~~n itII~ 158 Gadhwala
i(fff"~ 24 Ganeshwali
.-fQt:(ATtft 25 Gangajali
'1;:l1T~
152 Geegasar .-ftqrV(
114 Gersar ~m:
39 Gogliwala ..,)tl~')~
61 Gol Pratapsingh tJ)~ Wqra~
27 Gulam AUiwala ~rJJ ~il1crt~
167 Gusaisar ~qTt~
127 Hameran (~T;;:r
81 Harkhasar Wagodan ~~lV( ~r<lm;;:r
137 Himtasar ~~mU{
213 Husangsar &~rlf~
III Jagannathsar alias Doongarsinghpura lSItlutlq~{ ri t'~u«wgu
74 Jagdewala 61l1'lqt~
S3 Jaimalsar .. GA{ilU{
78 JaJalsar ~~
66 Jalwani Noorsar ~;fi ~~U{
8ib.21-A
p
p
p
p
P
p
p
p
p
p
p
p
T
p
Bj
207
VILLAGE nIRECTORY-Contd.
Distance in miles from nearest
3 4 s 6 7
6 20 6 6 6
Unpopulated
Unpopulated
060 6 o
8 8 SO 8 8
6 8 56 6 6
066 6
088 o 8
6 6 50 6 6
Unpopulated
30 30 30
o s 6 6
14 1 o
Unpopulated
7 3 7 7
9 9 4 4 3
Unpopulated
o 6 3 6 6
o o 10 o o
o 1 1 I 1
o 15 3
8
6
6
8
6
6
8
6
30
6
12
7
9
6
10
J
J5
Code No. & Name of Village
2
BIKANER TEHSIL-contd.
71 Jamsar P (3(TII~
141 laurbeer ~~ij"1~
31 Jhurkiya ~~~~r
41 Jodhasar P ~f,;rr:a(
12 Kakrala Cfi~T~'
69 Kaiasar Bj Clir~r«(
t 59 Kalyansar Agoona P Cf.~~lif~ I3PlffT
161 Kalyansar Bara P ~~TrrU{ ~r
160 Kalyansar Utrada P ~~<t~~ a:&T'«
88 Kanasar P
52 Kaoni P r.tT~;fi
S Karamwala CIi~ifCl!m
18 Karanpura T
~""!JU 99 Karmisar P
<E~;r')~ 121 Karnisar Beekan P
Cf;~il1«~ ;ft~ 41 Karnisar Bhatiyan Bj
CRif){{{ ~r~lJTot 116 Katriyasar P
~~~tf~ 1 S 5 Kesardcsar Boran P
~~~~ ait~ IS3 Kesardesar P
Gangaguran iti~.q( 1T;I1T!1n"
154 Kesardesar Jatan P t~6{ IIIt~Tw{
87- Khara P '«ru
124 Kharda P ~
23 Kheel'Sar P ~{~
Distance in miles from nearest
3 4 s
o o o
2 8 2
Unpopulated
56
o 52 52
o 28 12
4
044
144
080
o 18 18
Unpopulated
6 54 54
o 3 3
2 10 8
8 38 38
o 4 12
2 10 6
2. 10 4
o 16 8
.. 4 4
o i8
6 6 56
... ... £ 6
o
8
20
12
12
" 4
4
o
18
6
o
8
38
12
10
10
10
4
6
6
7 8
o o
8 8
16 20
o 12
12 12
4 16
16
4 16
o 10
6 18
4 6
10 to
10 38
12 12
10 10
10 10
10 10
o 4
6 20
6 6
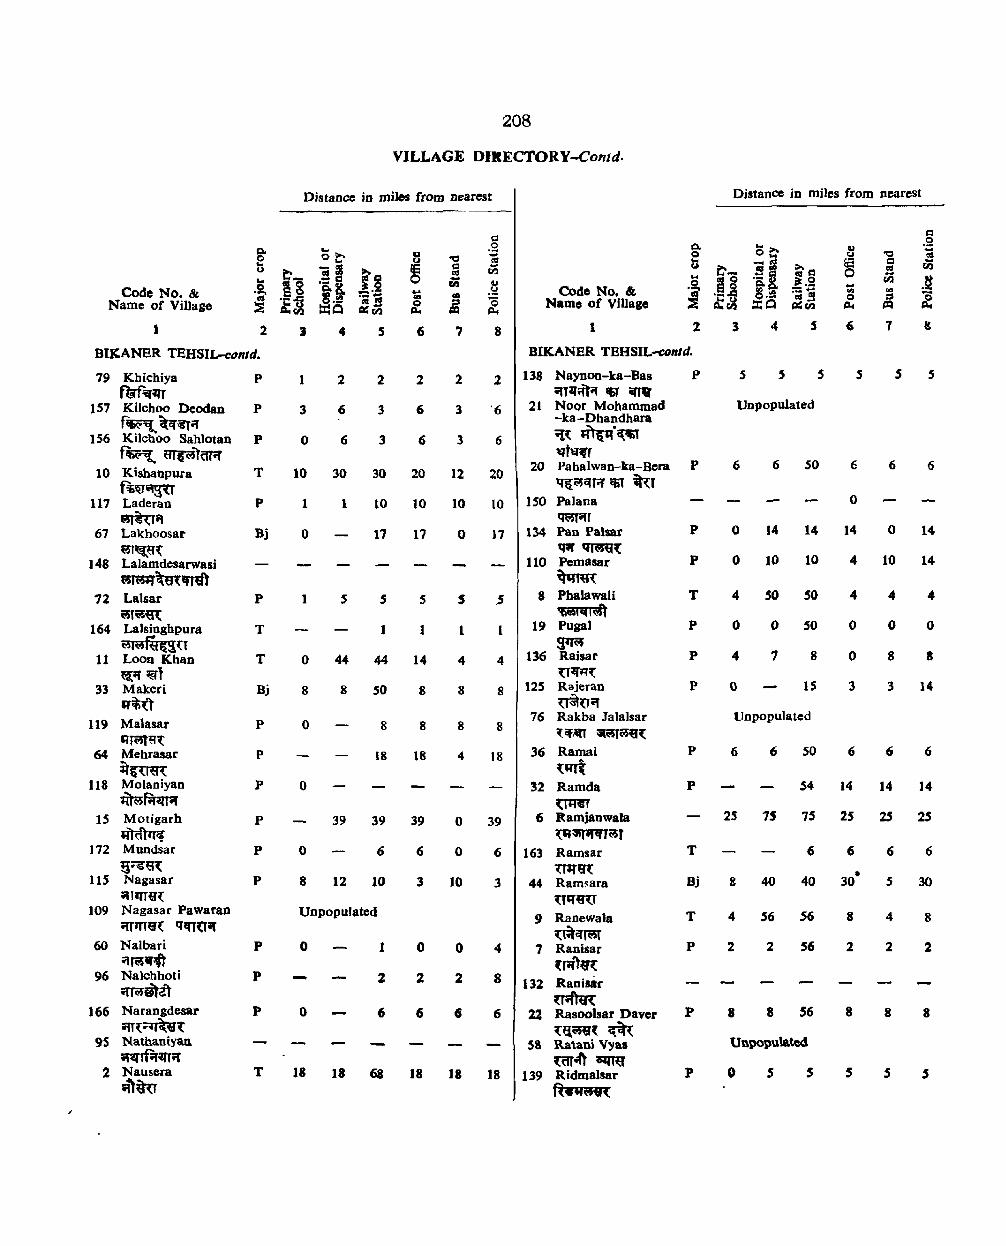
Code No. & Name of Village
J 2
BIICANER TEHSIL-contd.
79 Kbichiya rm",~
IS7 Kilchoo Deodan ~~Cf~",
1 S6 Ki)cboo Sah10tan fl6~ ffi1"0TffliF
10 Kishanpura Ri~ .. 3U
117 Laderan
~T" 67 Lakhoosar
wr~e't: 148 Lalamdesarwasi
t;srm:r?rn\~e1 12 Lalsar
8l~-«{
164 Lalsinghpura ~~U
11 Loon Khan ~;r :!St
33 Makeri lJiti(t
119 Malasar IJllQa,(
64 Mehrasar it(U~
118 Molaniyan mwf;r~
IS Motigarh mcl)'rrCf
172 Mundsar 5~~~
115 Nagasar ~lQ'Hn
109 Nagasar Pawat'an ;:rr'mJ( q~HJif
60 Nalbari ilrijlJ.4t
96 Nalcbhoti i{JwBtit
166 Narangdesar ;n~r.rbrt
95 Nathani.yan ;WrA~;r
2 Nausera
~"iju
p
p
p
T
P
Bj
P
T
T
Bj
p
p
p
p
p
p
p
p
p
T
208
VILLAGE DIltECTORY-Contd.
Distance in roUes from nearest
1 2 2
3 6 3
o 6 3
10 30 30
1 1 10
o 11
1 S 5
1
o 44 44
8 8 SO
o 8
18
o
39 39
o 6
8 12 10
Unpopulated
o 1
2
o 6
18 18 68
6
2
6
6
20
10
17
s
J
14
8
8
18
39
6
3
o
2
6
18
7
2
3
3
12
10
o
1
4
8
8
4
o
o
10
o 2
6
J8
8
2
'6
6
20
10
)7
.5
1
4
8
8
18
39
6
3
4
8
6
18
Code No. &. Namo of Villago
1
BIKANER TBHSIL-COlltd.
138 Naynon-ka-Bas P ~T~;{t~ IV ilTV
21 Noor Mohammad -ka-Dhandhara ~~ m'(I(~ 141,.."r
20 Pahalwan-ka-Bera P tJ&~cn", ctiT itu
150 Palana qt;Sf;n
134 Pan Palsat P q;r ~~
110 Pemasar P
~'"~ 8 Phalawali ~mt
19 Puga] ~(;$
136 Raisar U~~{
125 Rajeran uito~
76 Rakba Jalalsar ~ Cf,1i1T ~~r(>5U~
36 Ramai ~~
32 Ramda UIRf
(; Kamjanwala ~~(l5r
163 Ramsar mrQ{
44 Ram~ara
{Tq~U
9 Ranewala ~r.tq~
7 Ranisar (r~1«{
132 Rani .... ~r~{
22 Rasoolsar Daver {ij,wV~ ~{
5S Ratani Vyas m~~
139 Ridmalsar fl ... ,,¥(
T
P
p
p
p
p
T
Bj
T
P
p
p
Distance in miles from nearest
5 5
Unpopulated
6 6 50
o 14 14
o 10 10
.. SO 50
o 0 50
4 1 8
o IS
Unpopulated
6 6 SO
54
25 75 7S
6
g 40 40
4 S6 S6
2 2 S6
8 8 56
Unpopulated
o s
... ... o ~
6
s
6
o
14
4
4
o
o
3
6
14
25
6
8
2
8
s
S 5
6 6
o 14
10 14
.. 4
o o
8 a
3 14
6 6
14 14
2S 2S
6 6
5 30
4 8
2 2
8 8
S

Code No. & Name of Village
1
BIKANER TEHSIL-COlltd.
122 Rooniyan Baewas P m-~li( '~iif\V
123 ,Roopeean P ~Uif
94 RUlhna thsar ~ ... r~u'{
30 Samme ,ala Bj fJ~~<ir~'
128 Sareran P rnT;r
146 Saroopdesar ;e-~~9{
J4 Satasar ~aTIJ~
70 Sawaisar Bj ~fCntq~
165 Seentbal ~'N'~
135 Sharab Acharjan w({ arqf(atTif
90 Sharah Bardi ~{& "'Hit
54 Sharah Barela ~T{( lff~~T
168 Sharah Bedan ~f{ it1{Te;
89 Sharah Bhaioroo Vyas ~« ~ 81f1'V
57 Sharah Brahminan f(fl~ i(~IJTI;:r
80 Sharah Dholera U(~ ~~U
62 Sharah Jatan ~( Gll~'I
140 Sharah Kajani ~ <R~;ft
JOB Sharah Kunjiyan _~~ ~~9(
84 Sharab Roopayat ~~
55 Sbarah Sutharan Gopalan ~( i'ltUil f(~
209
VILLAGE DIREcroRY-Contd.
Distance in miles from nearest
~~ _ftI
sa '~8. o.'i!a tI;O
Code No. &:: Name of Villaae
, Distance in miles from nearest
-OIl
£ 4 s 6 7 8 I 2 3 s 6 8
o 19 2 2 20
14 1 J IS
Unpopulated
62 20 20 20
to o o
2 28 10 10 10 10
002 2 o 2
Unpopulated
Unpopulated
Unpopulated
Unpopulated
Unpopulated
Unpopulated
Unpopulated
Unpopulated
Unpopulated
Unpopulated
BIKANER TEHSIL-conc/d.
gil Sharah Teliyan ~ ~fi5~
104 Shivwari fttlf~~
92 Shobhasar .rt~~~
102 Shree Ramsar ~, ~nrU{
I Siyasar Cbogao ~r~~ ...
37 Siyasar Panchkosa ftr:qr~ q;:~~qr
151 Soojasar
~~ 4S Soorasar
«um: 101 Sujandesar
~iIJ(d:q~ 173 Suratsinghpura
~~~«r@J 143 Surdhana
Chauhanan Ht~T r4t(fiflt=t
142 Surdhana Padiharana fi~;rr q~r.rr
56 Sutharan Makdan ~r;y qf~Cf;:r
170 Tejrasar ~r~
16 Tharusar
"'~~ 106 Udasar
~~~
145 Udramsar ~r~m
p
p
p
8j
p
Bj
p
T
p
p
Bj
p
T
p
LUNKARANSAR. TEHSIL
IS4 Adsar P en~~
84 Ajeetmana T ri~ql1lT
96 Aloda T ~
86 Ambarrun ~
Unpopulated
044 o 4 4
o 10 3 10 o 12
033 3 o 3
3 68 68 18 18 )8
12 46 46 10 6 )0
3 3 3 8
44 44 44 20 8 20
o 3 S 2 2 2
o 6 6 o 6
o 10 4 10 10 10
1 10 .. 10 JO 10
Unpopulated
o 2 6 6 6
10 41 41 4) 10 41
066 o 6 8
o 0 6 0 0 5
4 4 16 US 44 16
o 24 24 24 6 24
3 18 18 18 18 18
Unpopulated

2lQ
VILLAGE DIRECI'ORY-Contd.
Distance ill miles from nearest
Code No. &: Name of Village
I 2 3 4 5
LUNKARANSAR TEHSIL-contd.
63 Arjansar ~ .. ~
39 Asrasar 8fqn~~
73 Baderan ~
140 Bakhoosar iR<@~
54 Baladesar .T(lST~
liS Bemanwali .Tlf"·ffi5'l'
152 Basi Cbarnan .,iT :ctRGJfOf
149 Basti Delw8D iffift ~(fl;r
71 Beer Sangreoo .1 .. 9'~
17 Berawala ~crr~T
109 BhadwaD RT1{ClTif
134 Bhandera ¥fi~u
5 Bhandsar ~r;:s~{
153 Bhanipura ~Tif')au
24 Bheekbllcra ~l§~tT
97 Bhobiya atlas Ratanpura ~nr~r ~t6~ UJ~
100 Bhojawas m-.T'fT«
49 Bhojrasar ~~T&
135 shorn Malkisar ~f'l qw~'l~
23 Bhoowala ~cnwr
92 Billjarwali fiI::3I(Cfltofi
81 Birbana f~ .. r
Unpopulated
687
p 4 10 10
T 4 38 22
T 077
T o 30 4
Unpopulated
T I I I
p J 6 4
T o 10 32
T 1 14 14
p 4 10 4
T o 24 16
Unpopulated
Bj 4 18 J8
Unpopulated
Unpopulated
T 4 10 10
Unpopulated
Bj S 18 18
T o 20 10
T 2 18 18
6 8
8 1 7
10 }o 10
14 14 22
7 10 7
4 30
1 1 1
4 18 6
32 10 30
14 14 14
o to 10
24 24 24
18 o 16
10 JO
18 4 20
12 8 20
18 18 18
Code No. '" Name of Village
I 2
Distance in miles from nearelt
3 4 s 6 7 8
LUNKARANSAR TEHSIL-contd.
61 Chak Arjansar
""'~ eR:~~t{ 37 Chak Asrasar
:q11i et«ua~
57 Chak Bhanwadya ~~ -.r·~R~r
35 Chakjor :q~)~
158 Chaodsar =ifr:t{fR
29 Cbecndasar ~~
170 Chhatasar ~;n«\
77 DeJana Bara ti.lSj.tf ~
76 Delaua Chhota ~;rr~
6 Devasar ~(
J 66 Dheerdan 'I:t')'(~ T;:r
119 Dheerera ':ft~~r
48 Dooder
~ 111 Doodiwali
~ttcn~ 44 Duderiya
~ J 39 Dlltcbasar
!t'S-:qyU~ 121 Dulmera
~ 1 Gabna alias
La lawa Ii 'l~T dlfi~ ~mcfm)
99 Gaota i1t;n
162 Garahdesar ~n:~
It Gbeghra ~
58 Gbensoora it"au
T
Bj
T
p
Bj
T
Bj
T
T
p
T
p
T
T
T
T
p
Unpopulated
Unpopulated
Unpopulated
Unpopulated
1 7 J9 7 7 19
3 20 25 30 24 30
o 8 18 8 8 18
o 12 12 12 12 12
4 8 S I 8
6 24 24 24 ]6 24
I 2 10 10 o 18
o 14 0 o 14
4 10 10 10 10 10
6 18 18 18 18
4 12 12 34 12 12
4 38 22 14 14 22
o 6 0 o 6
14 so
4 12 12 12
o 11 18 11 o 18
10 10 30 30 14 40
432 3 10 2
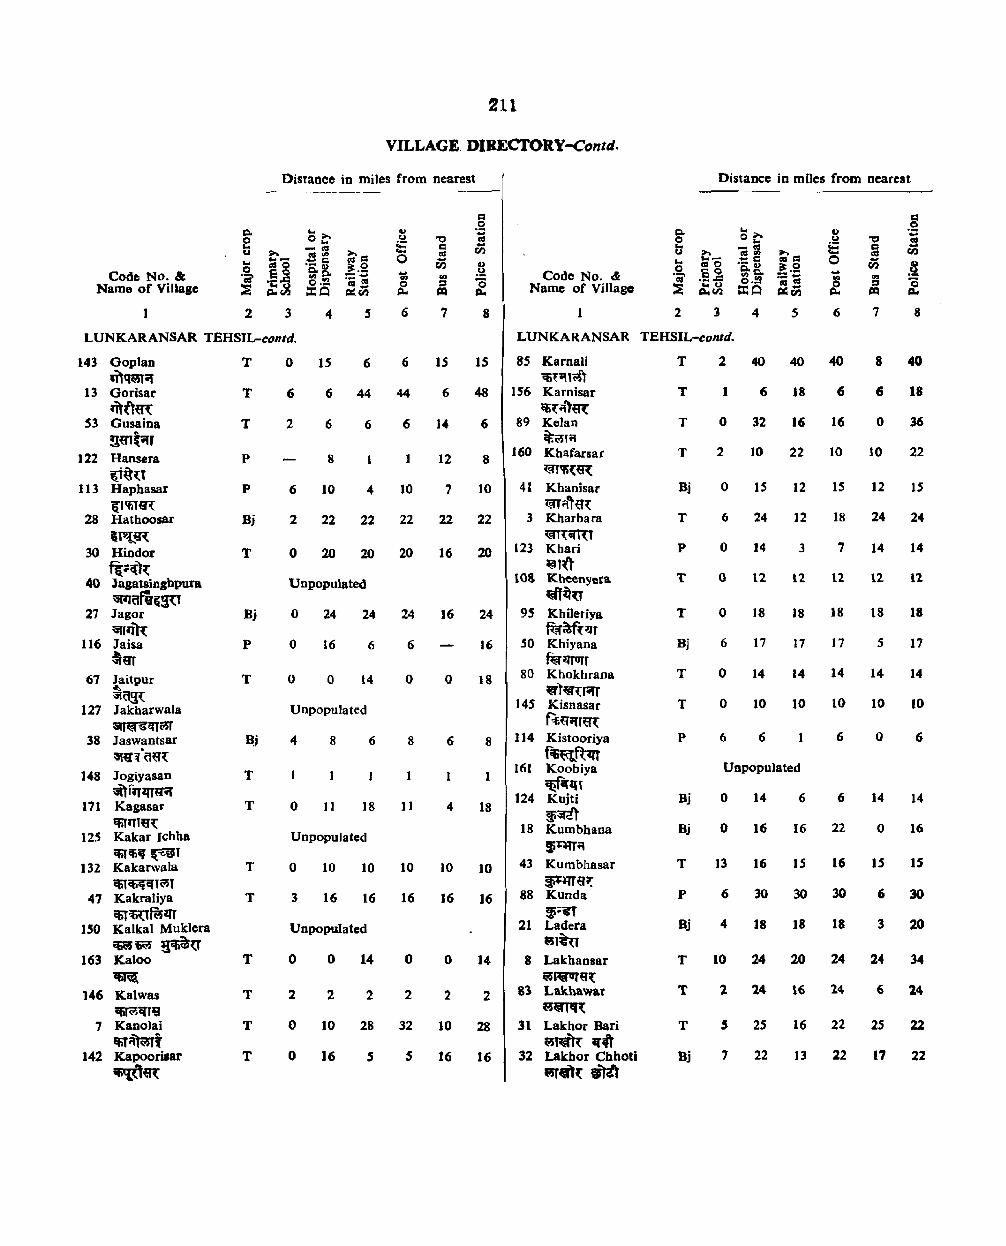
Code No. &; Name of Village
1 2
211
VILLAGE. DIRECTORY-Contd.
Distance in miJes from nearest
3 6
"0 C as -en rtJ ::s ~
,7
= .2 -as -en
.~ '0 ...
8
Code No. eft Name of Village
1 2
Distance in miles from nearest
5
II U
E o
6
"0 C as -en
~ 7 8
LUNKARANSAR TEHSIL-contd. LUNKARANSAR TEHSIL-conld.
143 Goplan
"'~if 13 Gorisar 'ih:1~
S3 Gusaina !!trTtilr
122 Hansera ~i~~t
113 Haphasar (ftfiTtR
28 Hathoosar
'r~~~ 30 Hindor
fio:«)( 40 JagatsiD,bpura
~rv~SU 27 Jagor
"f,liR 116 Jaba
~trr 67 Jaitpur
~
~a~ 127 Jakharwala
~qy~r 38 Jaswantsar
~«:{a«{
148 Jogiyasan ~)flf~gif
171 Kagasat ~1T19(
125 Kakar Ichha ClifC64i ~r
132 Kakarwala ifil~T~T
47 KakraJiya ~<6Um~
ISO Kalkal Muklera UlK'l ~eu
163 KaIoo
~ 146 Kalwas
C6TWilHI 7 Kanolai
EfiT~t 142 Kapooritar
~«(
T
T
T
p
p
Bj
T
Bj
p
T
B' .J
T
T
T
T
T
T
T
T
o IS 6 6
6 6 44 44
266 6
8
6 10 4 10
2 22 22 22
o 20 20 20
Unpopulated
o 24 24 24
o t6 6 6
o 0 14 o
Unpopulated
4 8 6 8
1 1
o 11 18 11
U opopulated
o 10 10 10
3 16 16 16
Unpopulated
o o 14 o
2 2 2 2
o 10 28 32
o 16 S s
IS
6
14
12
7
22
16
16
o
6
4
10
16
o
2
15 85 Karnali CIi'f;niS)
48 IS6 Karnisar qj{intR:
6 89 Kelan
8
10
22
20
24
16
18
8
1
18
10
16
14
2
~fil 160 Khafarsar
~~{q~
41 Khanisar mrfhR
3 Kharbara :~~m::iftu
123 Khari ~t~
103 Kheenyera ~~U
9S Khileriya fflr~fp"T
50 Khiyana ~~rurr
80 Khokhrana @t'~H:r-fT
145 Kisnasar ~tTifTij'{
114 Kistooriya f~~
161 Koobiya ~~l
124 Kujti ~~
18 Kumbhana !f~0\
43 Kumbhasar panq~
88 Kunda ~;~
21 Ladera 1151~
8 Lakhansar Ci6'tvarQ(
Sl Lakhawar i'J~Tl!f~
10 28 31 Lakhor Bari
~Vt{ if'" 16 16 32 Lakhor Cbhoti
arci'r~iittt
T
T
T
T
Bj
T
p
T
T
Bj
T
T
p
Bj
Bj
T
p
Bj
T
T
T
Bj
2 40 40 40 8 40
1 6 18 6 6 18
o 32 16 16 o 36
2 10 22 10 10 22
o 15 12 IS 12 tS
6 24 12 18 24 24
o 14 3 7 14 14
o 12 12 12 12 12
o 18 18 18 18 18
6 17 17 17 5 17
o 14 14 14 14 14
o 10 10 10 10 10
6 6 6 o 6
Unpopulated
o 14 6 6 14 14
o 16 16 22 o 16
13 16 IS 16 15 IS
6 30 30 30 6 30
4 J8 18 18 3 20
10 24 20 24 24 34
1 14 16 24 6 14
2S 16 22 25 22
7 22 13 22 17 22

Code No. &: Name of Village
1 2 3 4 5
LUNKARANSAR TBHSIL-contd.
98' 'Lalera Patta Khinyera mr~ qll
firiRr S6 Lalera Thikana
Mahajan ~~~r Jf~'~i(
75 Likhminarainsar fw@'Ift;rrUliOJ~{
42 Likhmisar ~a~
]28 ' Lunkaransar ~~;re"{
12 Mahadeowali q{mcrr~1
70 Mahajan
"'T~i{ 117 Mahrana
~6{Tifr 91 Makrasar
q<i~Hf{
137 Malkisar q-~1ib"~{
165 Manafarsar II'liffq:j"{U~
25 Manera ~{T
52 Maooriya ~;{tR~r
45 Meusar itde"{
61 Mithriya f;ro:-6~T
72 Mohkampura
I{'W~~T R2 Motalai
Jl'T2f5F( 15 Motasar
ift c!t (f"{ , 110 Muklera
~~t 93', Musalki
!J6W<il 1S9 Nakodesar
i(.~~{
p
p
T
T
T
p
p
T
T
Bj
p
T
p
Bj
T
T
T
T
T
3 16 16
6 7 6
1 JO 10
o ]8 16
o o o
o o 40
6 o o
o 15 4
o 28 14
o 16 o
o 33 12
2 20 16
o 4 4
7 14 14
7 4
064
o 20 20
o 26 26
6 18 18
3 22' 14
7 22
VILLAG~ DIucroR~-Contd.
6 7 8
Code No. & Name-'of Village
1 2
Distance in miJe1l from nearest
3 4· 5
-"" o ~
6 7
LUNKARANSAR TEHSIL-contd.
16 16
7 6
)0 9
18 16
o o
40 11
o 12
4
14 o
I) 16
16 16
20 o
4 20
14 15
10 4
4 ]8
20 10
26 12
18 18
14 14
lO~ 10
] 6 46 Nak rasa r
7
10
18
o
44
o
15
14
16
16
16
20
14
28
6
21
26
]8
22
22
a:{Tifj{r«~
157 Nathoosar
"r~«f: ]44 Nathwana
;rJlfCn''U 167 Pachara alias
Amarpura q:ouU ~~ :a{3t~~T
168 <, Pandoosar qT~~
136· Pee~ra tfiq{l
79 Phooldes3T
'11:~~{ 34 Phooleji
~~~1 87 Rajasar Bhatiyan
U~T~t ~tfe~Tif 16' Rajasar alias
Karnisar {T~n~{ :aCfi~ "t{il;1~
164 Rajpura Hudan U~~I :§~if
59 Rambag t'r JI il'TfT
33 Rampura ~Tq~,
36 Ramsara U'IV{f
9 Raner U:t~
64 Ranisar iTi{'l~~
68 lanjeetpura '{1JI~~T
55 Ratnlsar ~~~'hH:
155 Rawansar ,~qt.{
]6 Rayma}wali U~q,~'l'
22 Rekh Ajeetmana
~~ ~ .stl'~"f .. r
T
T
T
P
T
p
Bj
Bj
T
p
Bj
T
p
T
T
T
5 18 )8 ]8 17 18
2 4 H! 4 4 )8
o 6 6 6 6 6
o 6 16 16 10 24
o 4 14 14 10 24
o 13 13 .13
o 4 4 o 4. '
6 21 6 24 10 21
o 30 16 18 o ~O
o o 14 16
2 12 )0 ]2 12 J 2
(l 7 6 7 6
4 19' 12 26 12 ]9
4 15 S 28 8 ]5
IS 22 22 15 40
5 10 6 8 34
UnpoPIJI~lted
2 6 6 6 6
o 6 18 6 6 )8
3 10 30 30 10 30
Unpopulated
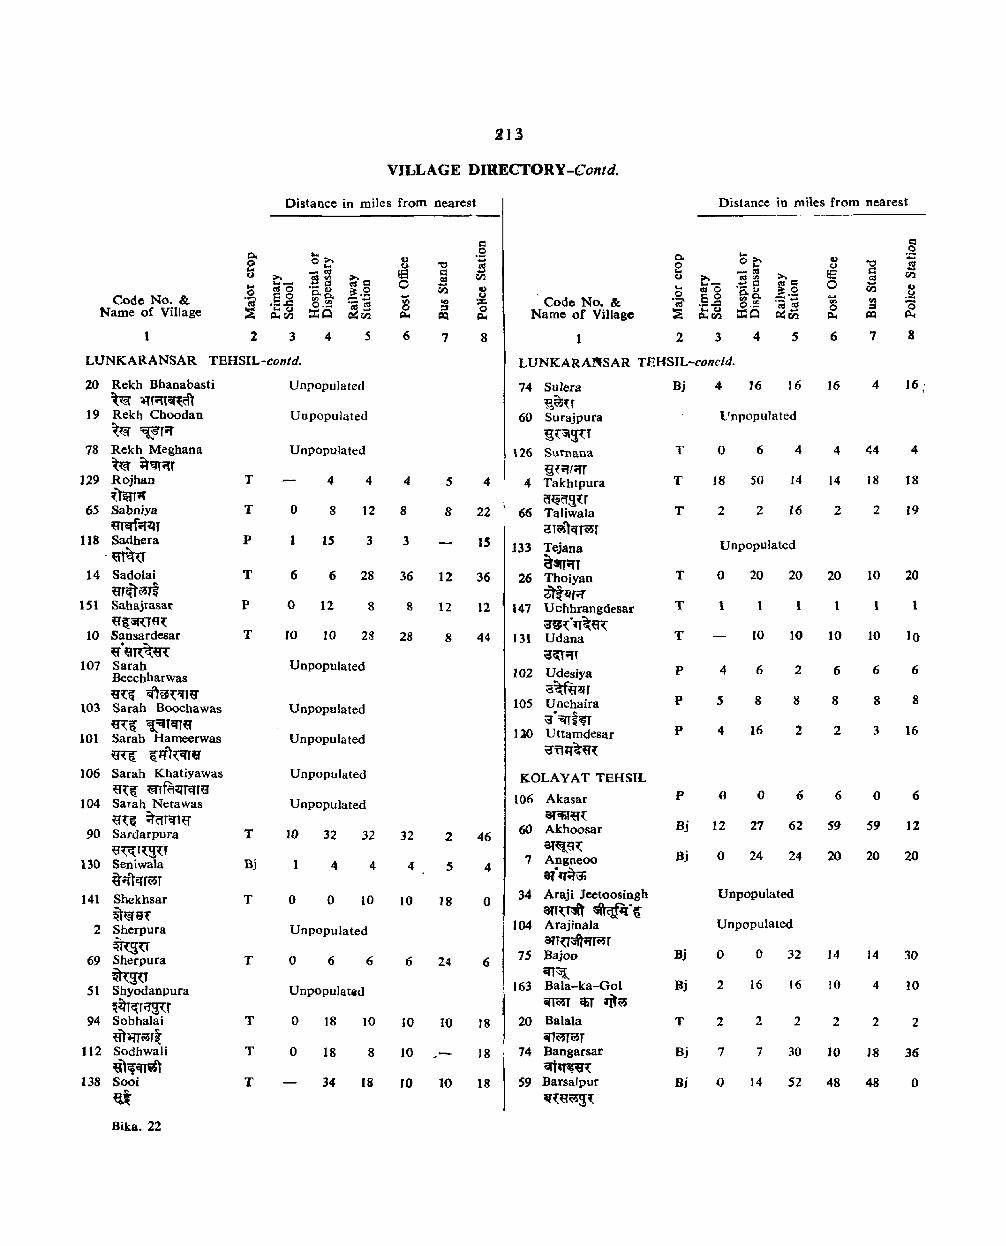
213
VILLAGE DIRECTORY-Contd.
Code No. & Name of Village
1 2
Distance in miles from nearest
3 4 5
8 IE o
~ 6 7
CI .9 -cd
tiJ B ~ o p..
8
LUNKARANSAR TEHSIL-contd.
20 Rekh Bhanabasti =t~ ~:n;n~c:fi
19 Rekh Choodan
~ ~\Srit 78 Rekh ~eghana
=t~ if~ifr 129 Rojban
it~if 65 Sabniya
~fif~T
T
T
118 Sacihera P -~
14 Sadolai T ~~ri'
151 Sahajrasar P ~&aro6~
10 Sansardesar T ~r"~~m
107 Sarah Beechharwas qt:ii' CifiiHiflU
103 Sarah Boochawas U~& '{~TerrU
101 Sarah Hameerwas tJ~ &ff1{CfTq
106 Sarah Khatiyawas U~& ~rRl~Tqrtf
104 Sarah Netawas ~Hii' ~(fTtntr
90 Sardarpura T
~~t:\T~~U 130 Seniwala Bj
«iI'lcm?r 141 Shekhsar T
~~e{ 2 Sherpura
'" ~{~U 69 Sherpura T
iUG~' S 1 Shyodanpura
~~Ftr~f 94 Sobhalai T
«tm~rt 112 Sodbwali T
~lfq{.n 138 Sooi T
{it Bika.22
Unpopulated
Unpopulated
Unpopulated
4 4 4 5 4
o 8 12 8 8 22
1 15 3 3 IS
6 6 28 36 12 36
o 12 8 8 12 12
to IO 28 28 8 44
Unpopulated
Unpopulated
Unpopulated
Unpopulated
Unpopulated
10 32 32 32 2 46
1 4 4 4 5 4
o o 10 10 18 o
Unpopulated
o 6 6 6 24 6
Unpopulatid
o 18 10 10 10 18
o 18 8 10 18
34 18 to 10 18
Distance in miles from nearest
Code No. & Name of Village
1
i=:'-... eso .2. eo
<':I ._..c :::a ct~
2 3 4 5
LUNKARAl'fSAR TEHSIL-concld.
74 Sulera !!~U
60 Surajpura ~~~g~t
\26 Surnana ~~ift;rr
4 Takhtpura a~~aU
66 TaJiwala cms'lerT<15f
133 Tejana a~i{T
26 Thoiyan ittlJrif
147 Uchhrangdesar \3"fJ(q"it:~\
131 Udana \3"~t:(t
102 Udesiya a~~r
105 Unchaira \3". 'qri",
llO Uttamdesar a~ql~{
KOLA Y AT TEHSIL
106 Akasar lMifiT~~
60 Akhoosar
eR'l~H:: 7 Angneoo
aiq~i3i 34 Araji Jeetoosingh
atn:nft ~.{ 104 ArajinaJa
arfu~;:rr(iiJr 75 Bajoo
crf'iI_ 163 Baia-ka-Gol
iflWT <liT ~~ 20 Balala
if1~r 14 Bangarsar
qt~~~ S9 Barsalpur
q~Q~g~
Bj
T
T
T
T
T
T
p
p
p
p
Bj
Bj
Bj
Hj
T
Bj
Bj
4 16 16
1I opopu! a ted
o 6 4
18 50 14
2 2 16
Unpopulated
o 20 20
1 1 1
10 ]0
4 6 2
588
4 16 2
o 6
12 27 62
o 24 24
Unpopulated
Unpopulated
o o 32
2 16 16
2 2 2
7 7 30
o 14 52
..... V> o p..
6
16
4
14
2
20
1
10
6
8
2
6
S9
20
J4
10
2
10
48
7 8
4 J 6 ;
44 4
18 18
2 19
10 20
1 1
10 10
6 6
8 8
3 16
o 6
59 12
20 20
14 30
4 10
2 2
J8 36
48 o

214
VILLAGE DmECTORY-Contd.
Distance in miles from nearest
Code No. & Name of Village
1 2 3 5
KOLA Y AT TEHSIL-contd.
22 Basti Chohanan .~,. ~~r;no;
79 Beekampur -tt~I1~
71 Beekendri ifiEf.;:stt
56 Beethnok i[too;)<Ii
131 Bera Dedawatan itu ~Iqalo;
78 Berasar ~O~~
47 Bhaleri ~~(T
]46 Bhane-ka-Gaon ~T;r <fiT ~t~
129 Bhatiya Bandhan ~~l{f Gr"ijT
4 BhatiyonwaJa mf~~)",qr~
113 BhayJa ~l~(i5T
174 Bheloo
~ 109 Bholasar Budhan
..:t)wHI~ ~\elr", 110 Bholasar Chauhan
~~~~ :q"~,~ 142 Bhom Akhesingh mil a:r;gf~i& 141 Bhorn Hemsingh
~)q ~f~'( 143 Bhorn Naharsingh
~m ;rfi{~R" ( 3 Bhoorasar
'i~r~~ 8 Burj Chobdaran
~~r- ~1i(((t(1;r 98 Chak Bandha
No.1 :oti:i if'~ ;(. ,
p
Bj
Bj
OJ
Bj
Bj
Bj
Bj
p
Bj
Bj
97 Chak Bandha Bj No.2 aJia$ Sankhlon-ki-Basti . . ~
=ot<fi If $l(f If . "t n ~)iJ 'iI"t ~1
3 3 2
o o 56
8 ]4 42
o 16 16
2 21 32
6 18 so
Unpopulated
o 18 18
Unpopulated
Unpopulated
Unpopulated
o 40 40
o 14 5
1 14 5
Unpopulated
6 24 24
Unpopulated
]6 80 RO
Unpopulated
Unpopulated
2 7 7
8 !8 o
! 6
3
16
42
16
21
50
18
40
3
3
24
80
7
3
16
42
6
16
12
4
o
20
10
58
4
c o ..... -S I:'Il
8 ~ 8
32
14
6
16
35
4
25
5
5
10
16
Code No. & Name of Village
1
KOLAYAT TEHSIL-conld.
96 Chak Bandha No.3 :qCfi ir" \ell ;:( • ~
95 Chak Bandha No.4 ~'b .·~t ;f. 'It
90 Chak Beethnok :ot<li i("~ilTC);
t02 Chak Chani :q<li :qt;:ft
94 Chak Dadar :q.fi ;sy~
123 Chak GujarsinghwaJa 'ili6 ~~ffI'~qrwT
153 Chak Kanya Bandh :qq; <fji=lJT Gf' "l
92 Chak Khuddi 'ff<fi ~~~
91 Chak Madhogarh :qqj qf~
122 Chak Mulajrnan ~~ ijWT~
40 Chak No.1 ~ ;r'. ,
44 Chak No.2 =i'.f'i If' "t
45 Chak No.3 :qI1i ~ ~
46 Chak No.4 'ql5;:r V
41 Chak No.5 :o:t'6 :if' '\
43 Chak No.6 :q11i" ,
39 Chak No.7 =i'.fCfi iJ' IS
38 Chak No. 8 :q~ ;J' c;
121 Chat Sethiya :q'6 ~T
Bj
Bj
Bj
4 93 Chak Sha!iya :q'li m~~
180 Chak Vijaisinghpura
:q'Cli~~~
Bj
Distance in miles from nearest
3 5 6 8
Unpopulated
Unpopulated
Unpopulated
Unpopulated
Unpopulated
Unpopulated
4 15 15 15 4 4
4 12 12 12 12 10
2 14 14 14 6 6
Unpopulated
Unpopulated
Unpopulated
Unpopulated
Unpopulated
UnpopUlated
Unpopulated
Unpopulated
Unpopulated
Unpopulated
Unpopulated
o 3 9 3 3 22

Code No. & Name of Village
1
KOLAYAT TEHSIL-contd.
27 Chandasar ~rm
103 Chani aqT;fi
63 Charanwala :q1~iJcrr~r
149 Chhaneri ~t\'
133 Dadoo-ka-Gaon
lfTfl C6T ~ 172_Dasori
~dAt 124 Dayatara
~~Hi~::r 48 Deh
~ 68 Dehriyan
~~f~lIr-f 28 Gajner (P~P.)
INI~~ (q't. q't) 36 Gangapura with
Pilap i{f1T~ ~~ f'OOq'
85 Gariyala lfT~Twr
130 Girajsar fitu~~
64 Godoo
m~ 80 Gogdiyawala
t'ltrrfu'lIT erT wr 89 Govindsar ~~«~
29 Goyalri (1)lf(:5~
84 Grandhi J(r:;:~
55 Guda with Lakhasar ~~ Jf~ (:5T~r~
145 Hadan fZ~lOl
112 Handla Bhatiyan ~~~r ~,f2~
III Handla Raolotan ~~ U~ffiq
Bika, 22-A
T
Bj
Bj
Bj
Bj
Bj
Bj
Bj
Bj
T
Bj
Bj
Bj
Bj
8j
Bj
Bj
Bj
Bj
Bj
Bj
215
VILLaGE DIRECTORY -Contd.
Distance in miles from nearest
>. .. -tUO 8 0 .-~ "'0
Q..OO
3.
1
o
o
6
2
o
o
4
6
1
o
o
o
o
o
4
o
o
o
o
o
1
5
8
22
,12
4
10
7
80
]0
30
o
16
6
22
4
36
8
6
5
5
o
5
50
22
30
32
10
7
80
1
10
30
34
so
48
22
4
36
8
14
12
11
8 !8 o
6
1
5
21-
22
14
32
10
7
80
o
10
o
4
50
16
22
4
6
8
14
]2
11
7 8
I 1
7
24 24
o 8
2 2
o 20
o o
7 7
50 6
o o
10 10
o 16
4 16
30 16
16
]0 10
4 4
6 51
8 8
2 10
] )S
o 14
Code No. & Name of VilIa&e
I 2
KOLA Y AT TEHSIL-contd.
101 Inda-ka-Bala ~;GT <fiT Gl'Tw{
73 Jagasar ~lml~
117 Jhajhoo
~ Kabranwala Cfj!l'U 01 erl (:5T
150 Kanya-ki-Basti ~"~T cfit iifEQ"t
58 Karnisar ~~'l'R
173 Khajora
~:it'T 160 Kbakhusar
~mm: 176 Kbara Laban
~U ~~rit
8j
Bj
Bj
Bj
Bj
Bj
Bj
11 Khari Charnan Bj ~~~ ~R~l;r
140 Khariya MaHnatb Bj '8Tft~T ~~
138 Khariya Patawatan Bj ~~~T qrererffiif
26 Khet Chandasar ~('f liIr"'5rij'~
119 Khetolai Budhan
~afti5rt !1U"' U8 Khetolai Burj Bj
~al(:5f{ ~~~ 159 Khetolai Moolwan Bj
ig~(:5,t ~~ ISS Khetolai Shimbhoo Bj ~~ f~+~
171 Khikhniya Bj Kundaliyan fur~~T ~·~·w~lo:r
170 Khikhniya Patta Bj Khindasar f{g~ti{~ q~
~r~ 168 Kbindasar Bj
fiF~T(R 35 Kishnayat Budhan
fCfjwiJr~('f ~~
Distance in miles from nearest
3 4 s 6 7 8
222 2 2 20
IS 22 47 47 47 10
o 0 6 o o 22
6 22 56 52 52 6
17 17 11 3 3
Unpopulated
2 2 38 38 o 25
2 14 14 14 o 10
2 34 20 17 2
o 10 6 6 6 6
8 18 18 18 10 10
9 23 23 23 10 IS
Unpopulated
Unpopulated
888 8 8 8
688 8 5 6
2 10 10 10 2 2
4 30 30 4 20
4 30 30 4 20
o 25 30 30 o 20
Unpopulated
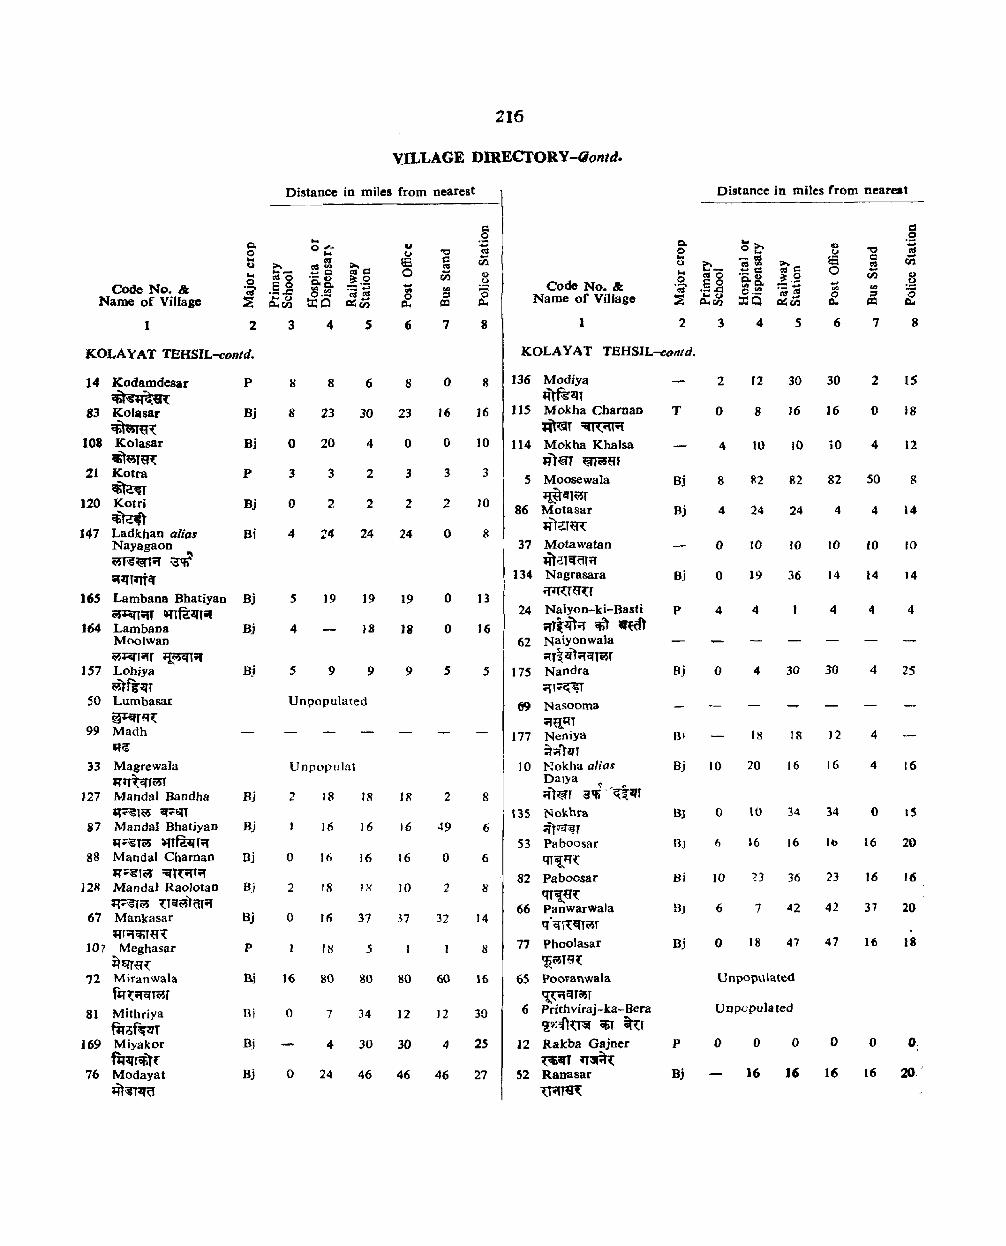
Code No. It. Name of Village
I 2
KOLA YAT TEHSIL-contd.
14 Kodamdesar P cj)Ma:r«(
83 Kolasar Bj ~twr:m:
108 Kolasar Bj liEleT9l:
21 Kotra P ~~
120 Kotri Bj iti~
147 Ladkhan auns Bi Nayagaon m~~;r ~rl ~~TfTti!f
165 Lambana Bhatiyan 9j ~r;:rr Q{lR;~;(
164 LambaDa Bj Moolwan ~~'i(r ii.;:;scnif
157 Lohiya Bj ~tg-~r
50 Lumbasar ~CfT~~
99 Madh 'Ie
33 Magrewa]a IJqtcTT~T
t27 Mandai Bandha 'l~I(lS ~~
87 Manda] BhatiyaD ~F;gTw ~ta~T~
88 Mandai Charnan 1J;:;g1i5 :ql{i{T;f
J 2R Manda} RaolotaD ~F~~ ~Ti!I~l~T;{
67 Mankasar ;rTif<JiHrt
107 Meghasar ~f{f~~
72 Miranwala flf~if'n~T
81 Mithriya fit¢f~aT
169 Miyakor ftr~raJjT(
76 Modayat ~~~i3
Hj
Bj
Bj
Bj
8j
p
Hi
Bj
Bj
216
VILLAGE DIREctORY -fJontd.
Distance in mi1es from nearest
3 4 s
S 8 6
8 23 30
o 20 4
3 3 2
022
4 14 24
5 19 ]9
4 )8
5 9 9
Unpopulated
UnpopuJat
2 18 18
16 J6
o 16 16
2 rs
o Jf; 37
18 5
u u IE o -... ~
8
23
o
3
2
24
19
18
9
18
16
16
10
37
7
o
16
o
3
2
o
o
o
s
2
49
o
2
32
8
8
16
10
3
10
8
13
16
5
8
6
6
8
14
8
16 80 80 80 60 16
o 7 34 12 12 30
4 30 30 4 25
o 24 46 46 46 27
Code No. & Name of Village
1 2
KOLA Y AT TBHSIL-conld.
136 Modiya ~fs~n
115 Mokha Cbarnan "';stT ~IV\lo:{
114 Mokha Khalsa JTf€H ~~n
5 Moosewala ~qlCi5r
86 Motasar ~T.'~«{
37 Motawatan lit~ICJat;:r
134 Nagrasara ;ptu~r
24 Naiyon-ki-Basti ;rrt~<l Cf)'t ~cn
62 Naiyonwala ;:r,~~tO:{Cf'i5T
175 Nandra c:rl;:~
(!9 Nasooma o:fti':fT
177 Neoiya :t.,'i"~l
10 Nokha alias Dal)a ~ ;:r)~r aqj.' '~~r
\35 Nokhra ;J);rq~r
S3 Paboosar qT"_~{
82 Pabocsar tJT{e'{
66 Panwarwala q'ql~~~r
77 Phoolasar ~~TH~
65 PooFanwala 'i,\o:{cfTCJ5T
6 Prithviraj-ka-Bera 'l~~\l~ Cilir ~r
T
8j
Bj
OJ
p
Bj
Bj
BJ
Bi
Bj
) 2 Rakba Gajner P ~ ,,~~
S2 Ranasar Bj 'UiI~
Distance in miles from nearest
3 4 5
2 '2 30
o 8 J6
4 10 10
8 ~2 82
4 24 24
o 10 10
o 19 36
4 4
o 4 30
IS HI
10 20 16
o 10 34
6 J6 16
10 36
6 7 42
o ]8 47
Unpopulated
Unpopulated
o o o
16 16
-rll o c..
6
30
J6
10
82
4
JO
14
4
30
}2
16
34
10
23
42
47
o
16
8
2 IS
o 18
4 12
50 8
4 14
10
14 14
4 4
4 25
4
4 16
o 1S
16 20
16 16
37 20
16 18
o 0,
16 20 I
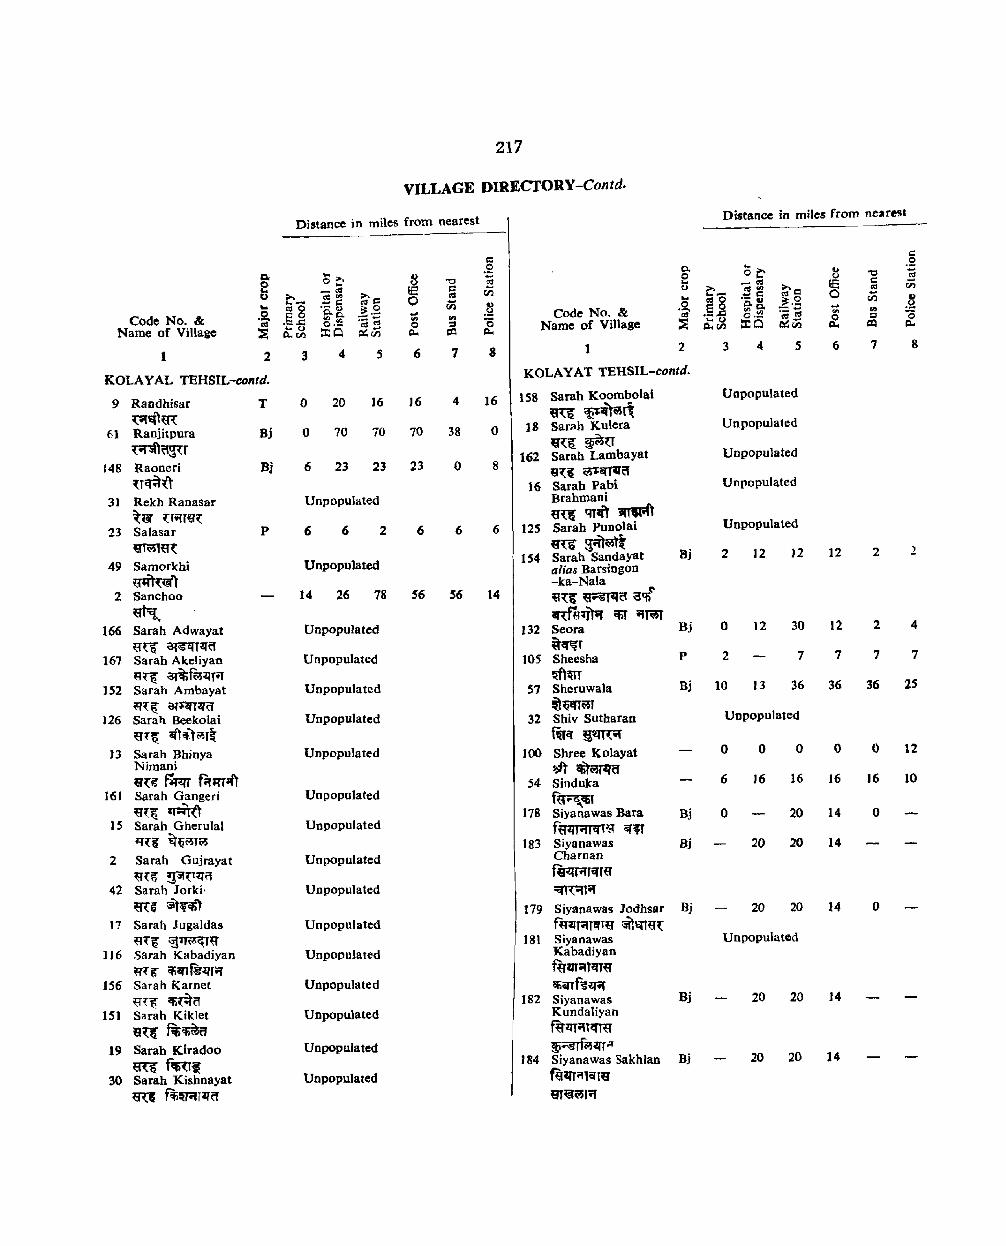
217
VILLAGE DIRECTORY -Contd.
Distance in miles from nearest Distance in miles from nearest
c c: .2 0. ... .2
Co o~ oe- u -0;
e 8 "U ~ 0 C.> '0
_CU ij3 c: ... -~ IE c ~
Vl 0 .... ~m >'0 cu
u >. <IS"" ~g <IS ... - :=c 0 ... ... - ..... c: 0 - ... e8 ~.2 Vl u ... s8 .- II) til .~ 0 o.U - .2
.s, 0.0. ~.- ~ Code No. &, 'a;- mOo - ... ... Code No. & "'"" :-:::~ ." '"
._ .c: o.!!o: .- t'tI .., '0
<IS ._ .c: 0._ 0 ::I Q Name of Village ~
.... u «$ ... i.. c
Name of Village ~ "0 ::cO
cU_ Jl.tcn ::to ~00 !:Q e:Lo 0..00 a::Vl 0.. c:o e:Lo
1 2 3 4 5 6 7 8 1 2 3, 4 5 6 7 8
KOLA VAL TEHSIL-contd. KOLAY AT TEHSIL-contd,
9 Randhisar T 0 20 16 16 4 ]6 158 Sarah Koombolai Unpopulated
~')«"{ ~ ~i\" Unpopulated 61 Ranjitpura Bj 0 70 70 70 38 0 18 Sarah Kulera
~~~r '3~6: ~(r
148 Raoneri Bj 6 23 23 23 0 8 162 Sarah Lamhayat Unpopulated
~r~it ~~~ C;P:~tr5
16 Sarah Pabi Unpopulated
31 Rekh Ranasar Unpopulated Brahmani
~R ~Ti(r~~ ~'(( qril) ~ 23 Salasar P 6 6 2 6 6 6 125 Sarah PuDolai Unpopulated
~TUt «« ~~ 2 49 Samorkhi Unpopulated 154 Sarah Sandayat Hi 2 12 12 ]2 2
alias Barsingon «'fR:~ -ka-Nala
2 Sanchoo 14 26 78 56 56 14 ~~t~o ~q:r ~~ .ue~i)~ q;r i(TWT
166 Sarah Adwayat Unpopulated 132 Seora Bj 0 12 30 12 2 4
~~ ~~o it~f 167 Sarah Akeliyan Unpopulated 105 Sheesha p 2 7 7 7 7
~ r~ at~f(;~Tif ~~T ]52 Sarah Ambayat Unpopulated 57 Sheruwala Bj 10 13 36 36 36 25
~H" ~ ,*HlT~(J ~qq'm 126 Saran Beekolai Unpopulated 32 Shiv Sutbaran Unpopulated
~H~ i1'h")~T~ f~", ~ 13 Sarah Bhinya Unpopulated 100 Shree Kolayat 0 0 0 0 0 12
Nimani ~ <lit~r~a 8{g ~ r.t'm-tfi 54 Sinduka 6 16 16 16 16 10
161 Sarah Gangeri Unpopulated f«;:~<iT ~r& ,,;:tr~ 178 Siyanawas Bara Bj 0 20 14 0
15 Sarah Gherulal Unpopulated f~T;rrqT~ ~~ ~n:i i.t~~T(; 183 Siyanawas Bj 20 20 14
2 Sarah Gujrayat Unpopulated Charnan
~{ij ~J~{llJ('j f6~t;rqr«
42 Sarah Jorki- Unpopulated :;;n~Ti'{
~U ~T'ifi) 179 Sjyanawas Jodhsar Bj 20 20 14 0
17 Sarah Jugaldas Unpopulated f"1I1;rlarT~ ~"lt«~ ~'{~ ~;w:~r~ 181 Siyanawas Unpopulated
1J6 Sarah Kabadiyan Unpopulated Kabadiyan
"'{~ ~ifI~.llr~ fum .. ti'f'~ 156 Sarah Karnet Unpopulated <6GfTf~~
{If'6 q;{~" 182 Siyanawas Bj 20 20 14
151 Sarah Kiklet Unpopulated Kundaliyan
U'q" fii'li~5 fu~T"T~~
19 Sarah Kiradoo Unpopulated ~:;:;grf(;5lJT "
~f~~ 184 Siyana was :sa.khlan Bj 20 20 14
30 Sarah Kishnayat Unpopulated fg:qr"'TarrU
~ fe6~r~o Uf~wl~
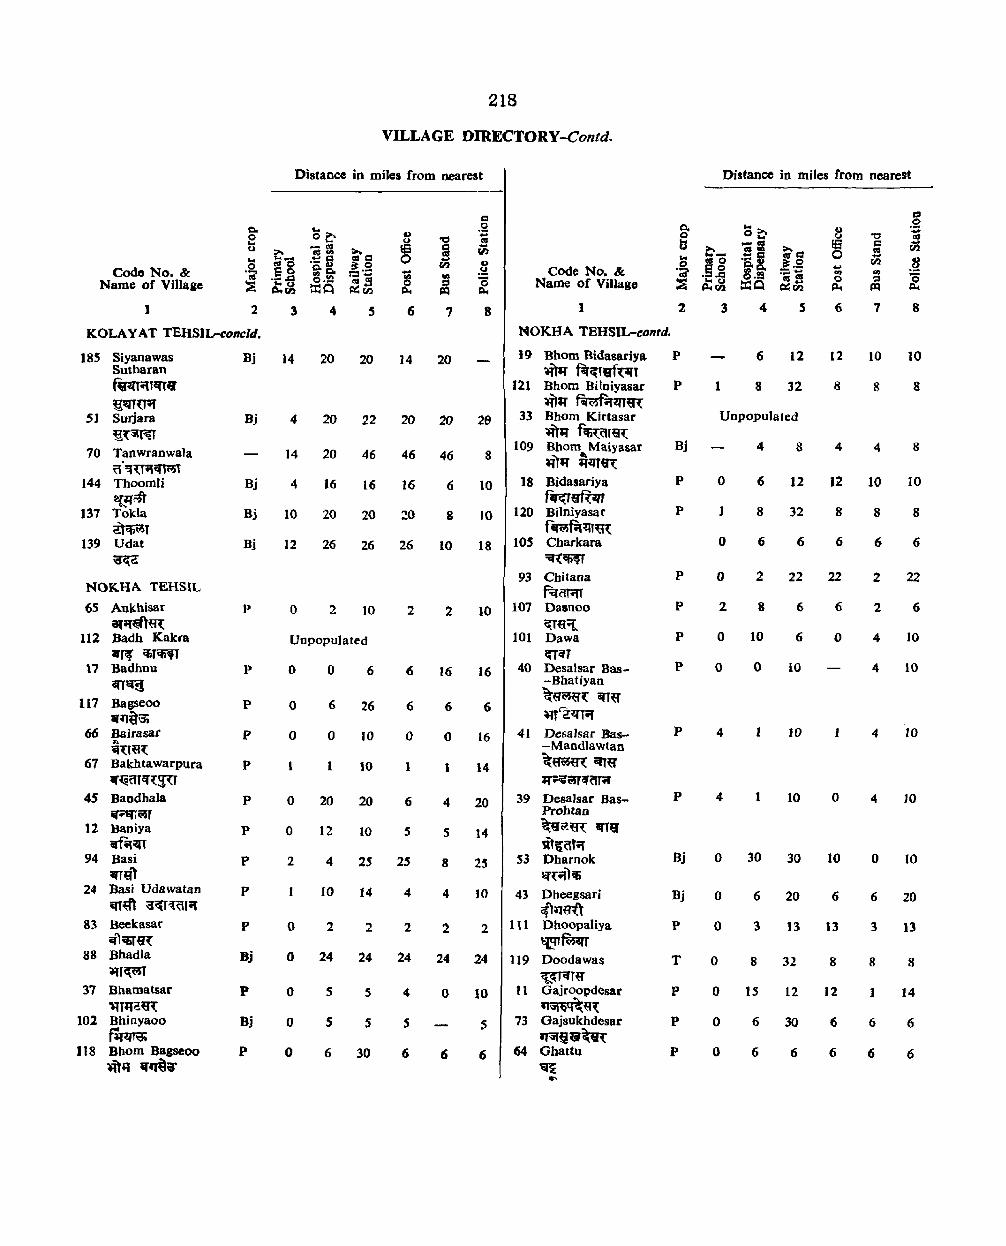
Code No. & Name of Village
J 2
KOLA Y AT TEHSIL-concld.
185 Siyanaw8s Bj Sutbaran RP.rtillCfTV «'-lTUiT
5J Suoara Bj ~~~
70 Tanwranwala q' ~~i(qrc;n
144 Thoomli Bj ~.,r:ft
137 Toida Bj ~T
139 Udat Bj ~~
NOKHA TEHSIL
6S Ankbisar ati(~m.:
112 Badh Kakta .~ iir~
\7 Badhnu arrl:l~
117 Bagseoo iHlij'S;
66 Bairasat ~
iI~~~ 67 Bakhtawarpura
.~arq~~
45 BandhaJa ~wr
12 Baniya ... ~~n
94 Basi iiIT~il
24 Basi Udawatan cn~ ;a~ 1~nil
83 Beekasar il'1Cifif~
88 Bhadla ¥fr~r
37 Bhamatsar \lHH~
102 Bhinyaoo ~;:J;
It 8 Bhom Bagseoo ~q il"fJiI.
p
p
p
p
p
p
p
p
p
p
Bj
p
Bj
p
218
VILLAGE DmECTORY-Contd.
Distance in miJes from nearest
4 5 6 7
14 20 20 14 20
4 20 22 20 20
14 20 46 46 46
4 16 16 16 6
10 20 20 8
12 26 26 26 10
o 2 10 2 2
Unpopulated
o o 6 16
o 6 26 6 6
o o 10 o o
1 1 10 1 I
o 20 20 6 4
o 12 10 s 5
2 4 2S 25 8
10 14 4 4
o 2 2 2 2
o 24 24 24 24
o 5 5 4 o
o s 5 s
o 6 30 6 6
c .2 -= o I) u
~ 8
29
8
to
10
18
10
16
6
16
14
20
14
25
JO
2
24
10
5
6
Code No. & Name of Village
I 2
NOKHA TEHSIL-contd.
19 Bhom Bidasariya P mq fif~l9f~1
121 Bhom Bitniyasar P ma:r f~~~
33 Bbom Kirtasar ~ f~rQ~
109 Bhom Maiyasar Bj illq q~r«'{
18 Bidasariya P f~9~
120 Bilniyasar P f~f;{~f~'{
105 Charkara =i.f{~
93 Cbitana fqar.n
107 Da8noo
~e~ 101 Dawa
~.,r
40 Desalsar Bas-Bbatiyao ~~( iIl« ilt~~rif
41 Desalsar Bas-Mandlawtan ~~~ iIl« lfP~qor;:r
39 Desa)sar BasProbtan ~q~{R iff" -snwalif
53 Dbarnok ~{il'Ofi
43 Dheegsarj ~ila~
111 Ohoopaliya
~tmu 1) 9 Dooda was
~nT 11 Gajroopdesar
tI~{f'{ 73 Gajsukhdesar ~Q5~
64 Ghattu ~
'""
p
p
p
p
p
p
Bj
Bj
p
T
p
p
p
Distance in miles from nearest
3 4
6 12
1 8 32
Unpopulated
4 8
o 6 12
8 32
o 6 6
o 2 22
2 8 6
o 10 6
o o 10
4 I 10
4 1 10
o 30 30
o 6 20
o 3 13
o 8
o 15 12
o 6 30
o 6 6
... .., o Il..
6
12
8
4
12
8
6
22
6
o
I
o
10
6
13
8
12
6
6
8
10 10
8 8
4 8
10 10
8 8
6 6
2 22
2 6
4 10
4 10
4 10
4 to
o 10
6 20
3 13
8 8
1 14
6 6
6 6
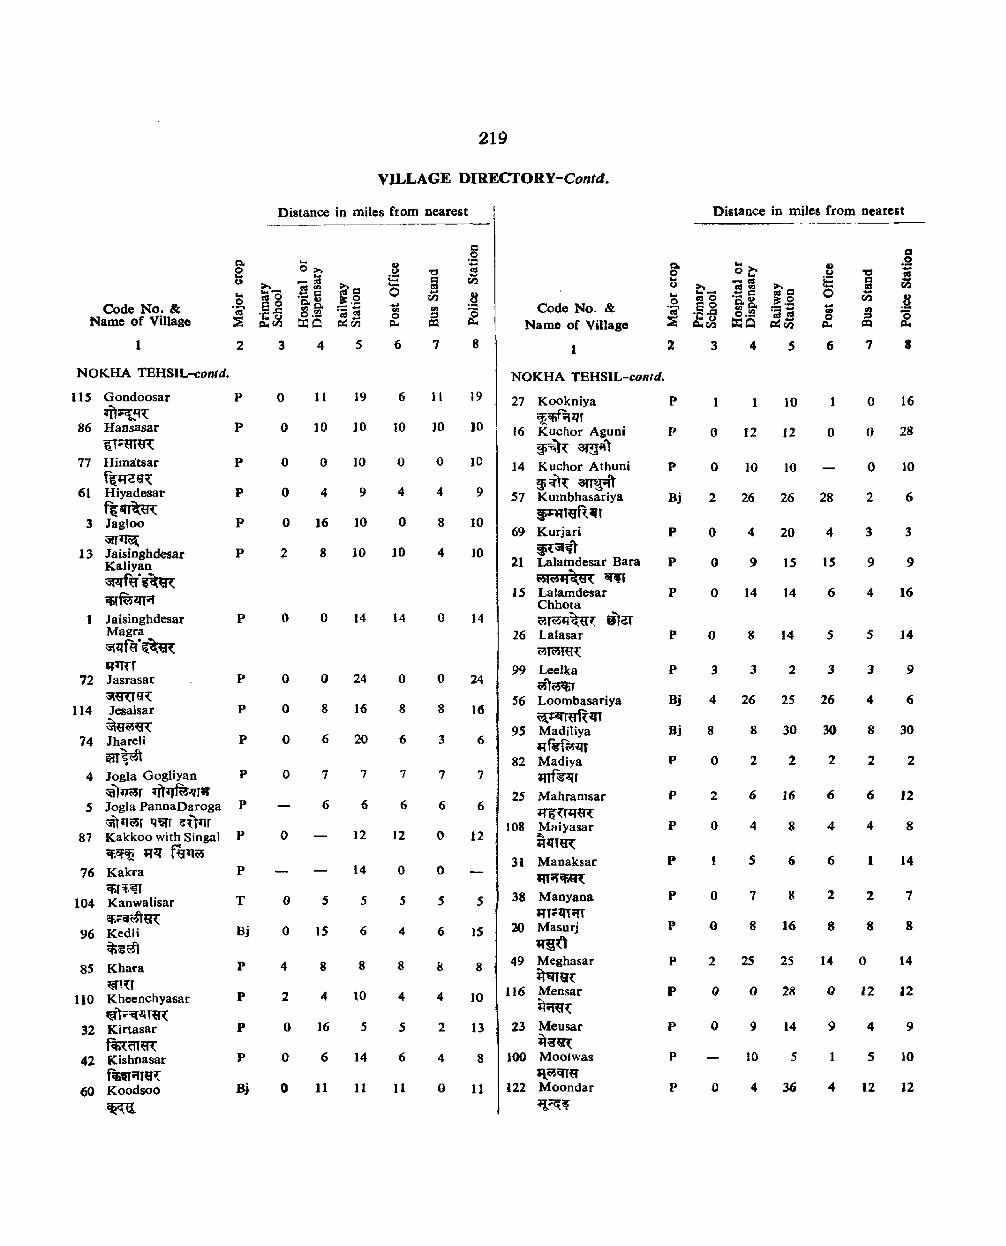
Code No. & Name of Village
1
NOKHA TEHSIL-colltd.
2
115 Gondoosar P ~~q~
86 Hansasar P ~T~m«{
77 Hima:tsar P f~JfGQ~
61 Hiyadesar P f(~t:R:
3 Jagloo P ~rTffil;
13 Jaisingbdesar P Kaliyan ~f~'~~ itiTft?lITii
1 Jaisinghdesar P Magra ~m'~
72 Jasrasar P ~«ug~
114 Jesalsar P ~~~~
74 Jhareli P m~tfr .
4 Jogla Gogliyan P 'i1)i1i~r m~~J;r
5 JogIa PannaDaroga P ~TtT(lSr q~ i!UllT
87 Kakkoo with SingaJ P if.Cf~ ;r~ fqllw
76 Kak£a P CliT'f·~
104 Kanwalisar T ilfi~q~9l:
96 Kedli Bj ~:gm
85 Khat"a P ~,~,
110 Kheenchyasar P ~);:=i.f1.lT~(
32 Kirtasar P f~~Tt:R:
42 Kishnasar P f.~i1re~
60 Koodsoo Bj
~r.::a
219
VILLAGE DIRECTORY-Contd.
Distance in miles from nearest
3 4 5 6 7
o II 19 6 11
o 10 10 10 10
o 0 10 o o
049 4 4
o 16 ]0 o 8
2 8 10 10 4
() 0 14 14 o
o 0 24 o o
o 8 16 8 8
o 6 20 6 3
077 7 7
6 6 6 6
o 12 12 o
14 o o
055 5
o 15 6 4 6
488 8
2 4 to 4 4
o 16 5 5 2
o 6 14 6 4
o 11 11 11 o
8
19
)0
10
9
10
10
14
24
16
6
7
6
12
IS
8
10
13
8
11
Code No. & Name of Village
1
NOKHA TEHSIL-contd.
27 Kookniya ~<fif;t~r
16 Kuchor Aguni ~~)\ am"')
14 Kuchor Athuni ~ i{T~ a:rr~ .. 't
57 Kumbhasariya ~l«ft~t
69 Kurjari ~:sr~1
21 Lalamdesar Bara wlw"l:g~ iff'
15 Lalamdesar Chhota wT~&1~~H 8li!T
26 Lalasar ~TWm~
99 Leelka ~1(i5~
56 Loombasariya ~ij'ft~
9S Madiliya 'i'f~~~r
82 Madiya mf:s:qr
25 Mahramsar tr6Uif~
108 Mltiyasar ~
il~l~
31 Manaksar qr;:r~
38 Manyana il'r:;:~ifT
20 Masurj ;rg(\
49 Meghasar it'qlQ{
116 Mensar i'ti{~~
23 Meusar it~~
100 Moolwas It~CfT~
122 Moondar ~~~
2
P
P
P
Bj
p
p
p
P
p
Bj
Bj
p
p
p
p
p
P
p
p
p
p
p
Distance in miles from nearest
3 4 s
1 1 10
o 12 12
o 10 10
2 26 26
o 4 20
o 9 15
o 14 14
o g 14
3 J 2
4 26 25
8 8 30
022
2 6 16
048
S 6
078
o 8 16
2 25 2S
() () 28
o 9 14
10 5
o 4 36
II) u E o
6
1
o
28
4
IS
6
s
3
26
2
6
4
6
2
8
14
i)
9
1
4
I
o 16
o 28
o 10
2 6
3 3
9 9
4 16
5 14
J 9
4 6
8 30
2 2
6 J2
4 8
1 14
2 7
8 8
o 14
12 12
4 9
5 10
12 12

Code No. & Name of Village
1
NOKHA TEHSIL-contd.
29 Morkhana Aguna .m:~r et!lifl
30 Morkbaaa Athoona .u\~JiI'T Of2f_;;T
47 Mujasar ~HH
78 Mukam !!<fiflJ
46 Muridsar ~r{t=R:
5S Nathoosar ij'1~.g(
79 Nimdiyasar fofiIf;s~~\
62 Nokhagaon ~cr
58 Panchoo
'It" 36 Parwa
qf~Cff
2 Peethrasar tft~nQ\
106 Raisar \r~~~
9 Rasisar Barabas Ulj't~ ~I«
8 Rasisarbas Panchayat Ua1'~~ q'~~6
7 Rasisarbas Talriya udt~\ifr~ am~~T
6 Rasisar prohtan ~Tdtij-{ ~;;
.52 Ratriya \ra~lIT
84 Rora mr
71 Sadhasar ml:lf~
92 Sadboona
m~ 54 Saisar
ertffi: 70 Sajanwasi
~OOO~
2
p
p
Bj
p
Bj
p
p
Bj
p
Bj
p
p
p
p
p
Bj
P
p
p
Bj
Bj
220
VILLAGE DIRECTORY-ConcM.
Distance in miles from nearest
3 5 6
o .5 s o
o .5 .5 5 o
o 6 14 2 o
o
6 14 12
o 6 26 6 6
I 1 to 1
o 3 3 o o
o '0 20 o o
o 7 4 3 o
o 2 4 4
o 6 6 o 6
4 4 o
4 4 o
o 4 4 o
o o 4 o o
o 26 26 8 2
o 2 2 o 2
o 7 20 7 7
o 4 20 20 o
o 10 30 10 4
o 7 22 7 3
8
14
14
24
24
6
10
3
7
12
6
4
4
4
4
8
2
7
20
7
Code No. & Name of Villago
1 2.
NOKHA TEHSIL-concld.
IS) Salundiya ~~~T
68 Saniwala ~Tfitqr<i5T
48 Sarah Kalasar ~~ ~r«{
51 Sarah Manaksar ~ mil<fitrt
89 Sarah Panchoo ~{~ qt'ii
44 Sarah Teliya ffi:(i:tf~
91 Saruda with Bhojas Indrapura m~ q~ .,)~m
~(r 50 Satheeka
milGfil 98 Seelwa
«"~qr 103 Shekhasar
~~q( 28 Sindhu
fer:rl 34 Slnjguru
ftr;:~~'6 9i Sobhaoa
~r~r 81 Somalsar
~JfWtR: 3S Soorpura
ij.{~ 10 Sowa
~rrn 80 Talwa
ffl~'" 97 Tanta <!T~
113 Thawariya !tlTcrf~~' ~
S9 Udasar ~~
75 Udsar ~t
22 Utma:mdesar :atlqlil~
p
p
P
Bj
Bj
P
p
p
Bj
p
p
p
p
Bj
P
Bj
Bj
p
Distance in miles from nearest
3 5 6 7
065 6 6
o 4 14 5 5
Unpopulated
Unpopulated
Unpopulated
o 0 26 26
2 25 25 12 o
o 10 5 5
399 9 9
047 7 o
o 12 3 3 9
o 26 26 26 26
033 3 o
o 8 0 o 4
o 23 8 8 o
1 10 1 1
086 3 6
o 6 20 6 4
o 12 12 6 o
o 4 18 4 2
o 8 13 6 8
C!I o .~ -u.1
8
10
26
12
10
9
16
10
26
3
11
14
10
14
8
6
18
8

SOME OFFICIAL STATISTICS

223
SOME OFFICIAL STATISTICS
(Note)
Presented in this section are some tables relating to statistics collected from various official agencies. They cover subjects like rainfall, land utilisation, area and production under crops, livestock, agricultural implements, factories, employment situation and power. Information about consumption of intoxicants, educational
and medical facilities, motor vehicles, progress of co-operative societies, development blocks and panchayat samities is also given in this section. A Jist of fairs c'elebrated in the district and the data relating to the electoral participation and preferences for the first two general elections also form a part of this section.

224
RAINFALL 1951-1960
y E A R S (in ems.) Normal
TehsB Rainfall 1951 1952 1953 19S4 1955 1956 1957 1958 1959 1960
2 3 4 S 6 7 8 9 10 Il 12
Bikaner 29.13 22.02 21.64 18.19 35.20 30.30 31.78 18.42 22.34 55.22 16.05 Lunkaransar 23.42 13.08 25.53 33.91 17.\S 19.46 33.30 27.05 35.10 27.81 26.15 Kolayat N.A. 23.22 ]2.47 22.33 25.04 21.03 14.33 14.94 16.54 8.92 ]9.2]
Nokha 27.33 22.78 15.04 54.76 19:74 39.29 21.82 23.88 31.41 14.43 20.10 --------
N.A. = Not Available Source ._ The Board of Revenue (Land Records), Rajasthan.
LAND UTILISATION
CLASSIFfCATION OF REPORTING AREA (in '000 acres) ----_......- --- - -_---- -----_--- -
Total Not available for cultivation Geographical Other area according Land put to Barren and uncultivated Area Total
to village non-agricultural unculturable land excluding Culturable Fallow Net area sown more cropped Yeats papers Forests use land fallow land waste land sown than once area
2 3 4 5 6 7 8 9 10 1I
1951-52 6,220 262 437 60 3,431 775 ],254 1,254 1952-53 6,220 19 262 419 60 3,431 464 1,565 1,565 1953-54 6,220 19 58 63 24 4,471 668 917 Neg. 917 1954-55 6,220 )9 lI5 63 ]9 4,533 619 852 Neg. 852 1955-56 6,220 20 135 18 19 4,499 582 947 Neg. 941 1956-57 6.604 20 136 J93 19 4.521 724 985 Neg. 985 1957-58 6,12l 20 134 18 19 4,874 817 839 839 1958-59 6,72] 20 130 18 21 4.869 823 840 Neg. 840 1959-60 6.721 20 130 18 35 4,809 667 1.042 1,042 1960-61 6,741 20 134 20 36 4,833 603 1,095 1,095
Neg. = Negligible Source : - Directorate of Economics and Statistics, Rajasthan.
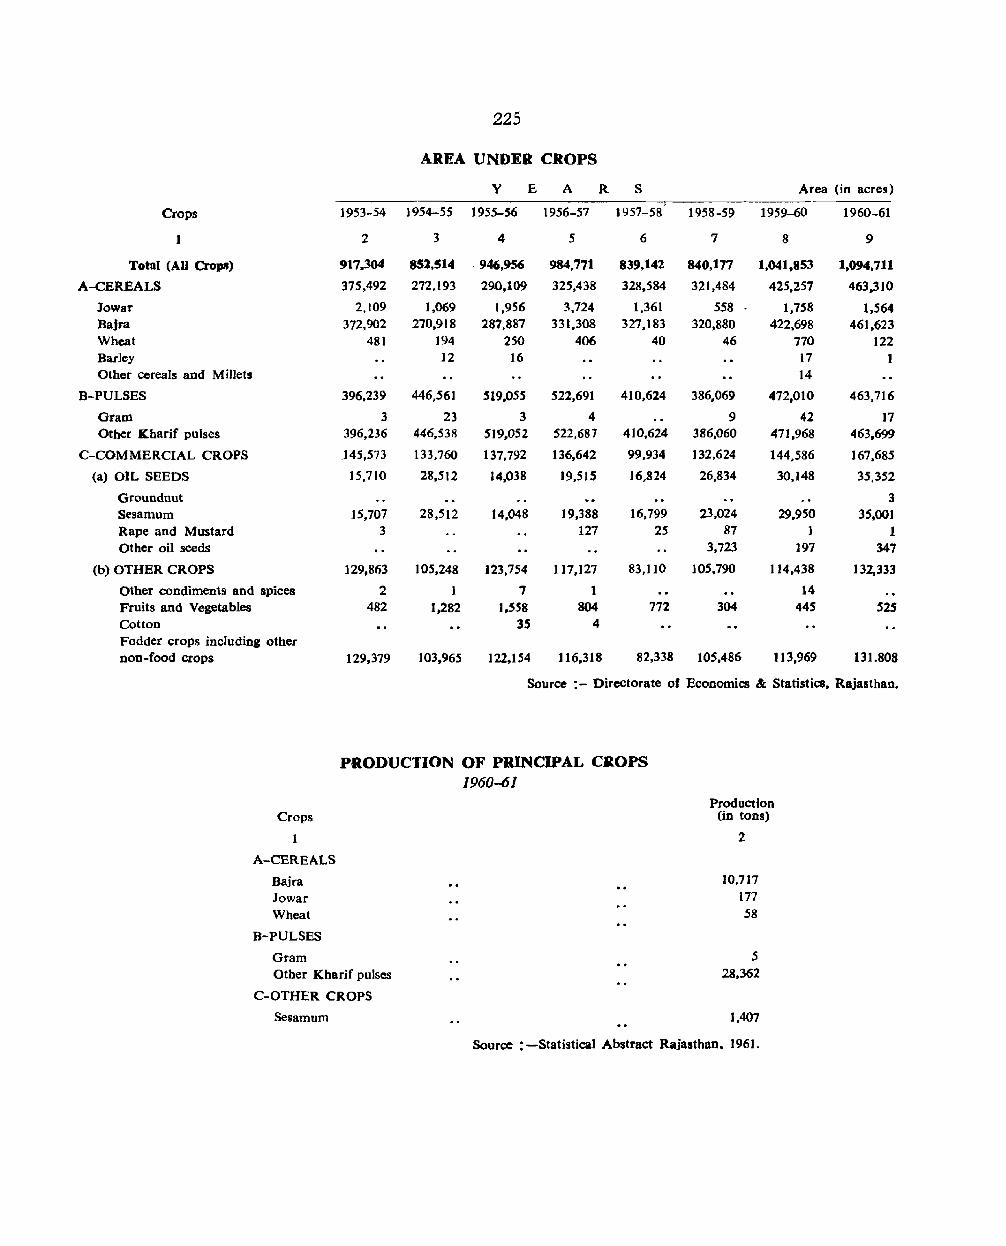
225
AREA UNDER CROPS
y E A R S Area (in acres)
Crops 1953-54 1954-55 1955-56 1956-57 1957-58 1958-59 1959-60 1960-61
I 2 3 4 5 6 7 8 9
Total (AU CroIM) 917,,304 851.514 - 946,956 984.771 839,142 840,177 1,041,853 1,094.711
A-CEREALS 375,492 272.193 290,109 325,438 328,584 321,484 425.257 463,310
Jowar 2,109 1,069 1,956 3.724 1,361 558 . 1,758 1.564 Bajra 372,902 270,918 287,887 331,308 327,183 320,880 422,698 461,623 Wheat 481 194 250 406 40 46 770 122 Bar]ey 12 16 17 1 Other cereals and M iJlets 14
B-PULSES 396,239 446,561 519.055 522,691 410,624 386.069 472,010 463,716
Gram 3 23 3 4 9 42 17 Other Kharif pulses 396,236 446,538 519,052 522,681 410.624 386,060 411,968 463,699
C-COMMERCIAL CROPS 145,573 133.760 137.792 136,642 99.934 132,624 144,586 161.685
(a) OIL SEEDS 15,710 28.512 14,038 19,515 16,824 26,834 30,148 35,352
Groundnut 3 Sesamum 15,701 28,512 14,048 19,388 16,799 23,024 29.950 35,001 Rape and Mustard 3 127 25 87 1 1 Other oil seeds 3,723 197 347
(b) OTHER CROPS 129,863 105,248 123,754 117.127 83,110 105,790 114,438 132,333
Other condiments and spices 2 1 7 1 14 Fruits and Vegetables 482 1.282 1.558 804 712 304 445 525 Cotton 35 4 Fodder crops including other non-food crops 129,379 103,965 122,1 S4 116,318 82,338 105,486 113.969 131.808
Source :- Directorate of Economics & Statistics. Rajasthan.
Crops
1
A-CEREALS Bajra Jowar Wheat
B-PULSES
Gram
PRODUCTION OF PRINCIPAL CROPS 1960-61
Other Kharjf pulses
C-OTHER CROPS
Seliamum
Production (in tons)
2
10,717 177 .58
.5 28,362
1,407
Source : -Statistical Abstract Rajasthan. 1961.
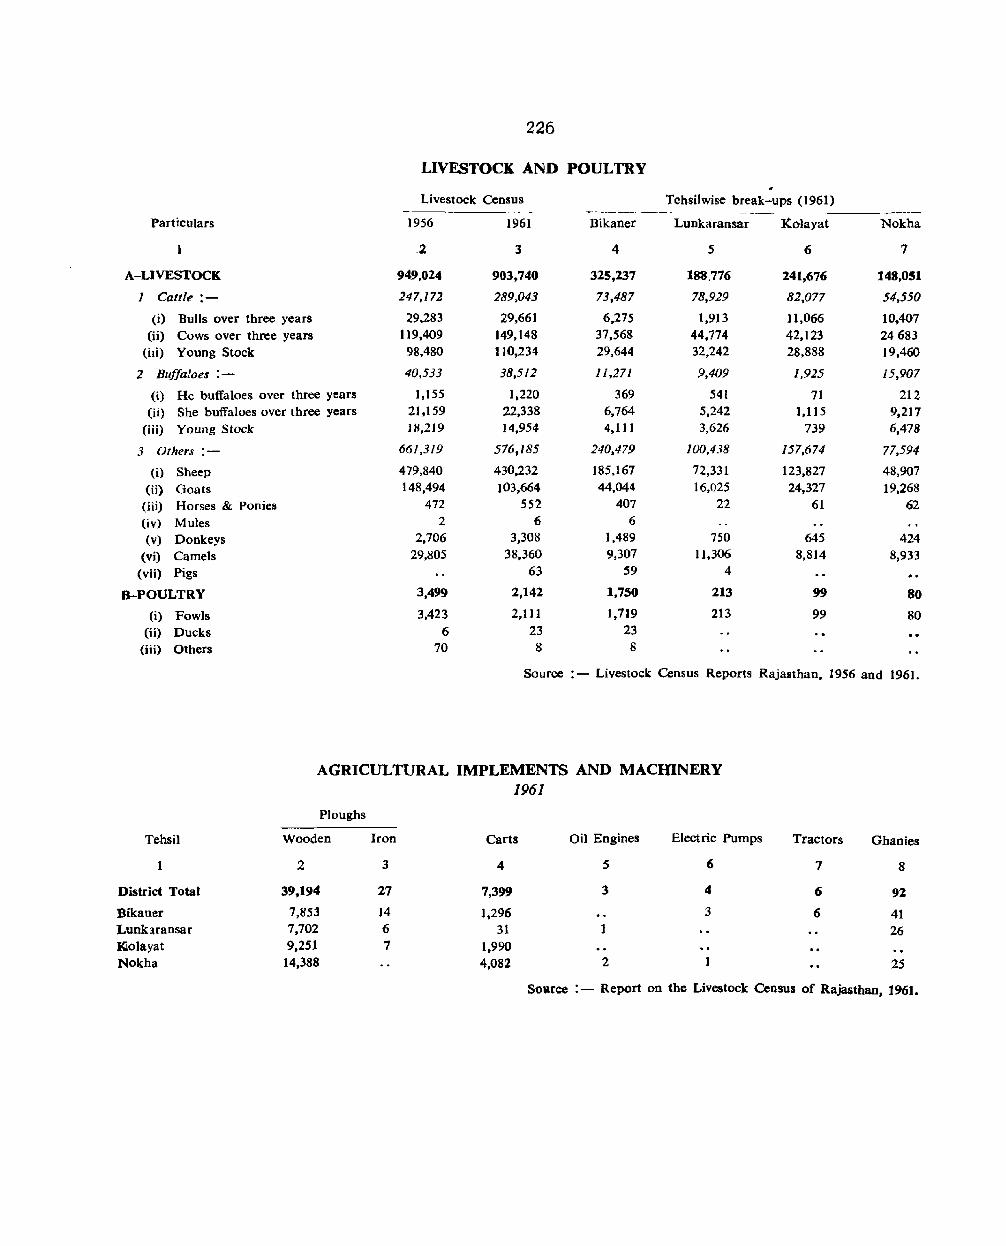
226
LIVESTOCK AND POULTRY
Livestock Census Tehsilwise break-ups (1961) ~------
Particulars 1956 1961 Bikaner Lunkaransar I(olayat Nokha
.2 3 4 5 6 7
A-LIVESTOCK 949,024 903,740 325,237 188.776 241,676 148,051
I Cattle :- 247,172 289,043 73,487 78,929 82,077 54,550
(i) Bulls over three years 29,283 29,661 6,275 1,913 11,066 10,407 (ii) Cows over three years 119,409 149,148 37,568 44.774 42,123 24683
(iii) Young Stock 98.480 1 )0,234 29,644 32,242 28,888 )9,460
2 Buffaloes :- 40,533 38,512 1l,271 9,409 1,925 15,907
(i) He buffaloes over three years ),155 1,220 369 541 71 212 (ii) She buffaloes over three years 21,159 22,338 6,764 5,242 ].115 9,217
(iii) Young Stock IH,219 J4,954 4,11 J 3,626 739 6,478
3 Others :- 661,319 576,185 240,479 lOO,4j8 157,674 77,594
(i) Sheep 479,840 430,232 185.167 72,331 123,827 48,907
(ti) Goats 148,494 103,664 44,044 16,025 24,327 19,268
(iii) Horses & Ponies 472 552 407 22 61 62 (iv) Mules 2 6 6
(v) Donkeys 2,706 3,308 1,489 750 645 424 (vi) Camels 29,805 38,360 9,307 11.306 8,814 8,933
(vii) Pigs 63 59 4
B-POULTRY 3,499 2,142 1,750 213 99 80
(i) Fowls 3,423 2,111 1,7]9 213 99 80 (ii) Ducks 6 23 23
(iii) Others 70 8 8
Source :- Livestock Census Reports Rajasthan, 1956 and 1961.
AGRICULTURAL IMPLEMENTS AND MACIDNERY 196/
Ploughs
Tehsil Wooden Iron Carts Oil Engines Electric Pumps Tractors Ghanies
1 2 3 4 5 6 7 8
District Total 39,194 27 7,399 3 4 6 92
Bikaner 7,853 14 1,296 3 6 41 Lunkaransar 7,702 6 31 26 ~olayat 9,251 7 1,990 Nokha 14,388 4.082 2 1 25
SOllIce :- Report on the Livestock Census of Rajasthan, 1961.

227
REGISTERED FACTORIES (As on 31st December, 1961)
Name of Factory
1
Bikaner Loco Carriage & Wagon Workshop Rajasthan State Electricity Board. Power House Mis. Ram Chandra Harsukhlal Wool Merchants Vishwanath Sharma, Industrial area MIs. Sohanlal Prabhu Dayal Wool Cleaning Factory Doogursee & Sons Shri Gopal Gauri Shankar Wool Merchants. No.1. Jassusar Gate Workshop Electrical & Mechanical Department Government Press Bikaner Woolen Mills, Industrial area NathuJal Bhairu Bux & Co., Wool Merchants Jaichandlal Ghan Shyamdass & Co. Rajasthan Woolen Press Walker Angaria & Co. M/s. Jugal Kishore Ganeshilal Wool Merchants Mis. Shri Mahaveec Wool Merchant Mis. Kamalsingh Narendra Kumar Rajasthan Woolen Mills, Jassusar Gate Shri Gopal Gauri Shankar Woo) Merchants, No. 2 Jassusar Gate Rajasthan Rubber & Chemical Private Ltd. Rajasthan Wool Traders Bharat Metal Iron Works Mundra Metal Wprks Indian Steel Rolling Mills, Rani Bazar Ganesh Woolen Pressing Co. Mohta Ayurvedic Rashayan Shala near Station Road Ahmed Bux Jahooruddin Iron & Steel Works Mis. Jethmal Mohanlal Wool Merchants Mis. Gordhan Das Ratan)al Wool Merchants . Hirachand Asha Ram &. Co; Wool Cleaning Factory Rajasthan Industrial Corporation Mangal Hosiery Mi1Is Private Ltd. Bikaner Woolen Press. Industrial area Pabudan Champalal Wool Merchants Rajkumar Wool Merchant Nathmal Hassadas Keshumal Harish Chandra, Naya Shahar Gangaram Satyanarain Wool Merchants Chunimal Ghyan Shyam Das, Rani Bazar Hiralal Lekhraj Wool Merchants Mis. Radha Kishan Manaklal Wool Merchants Ram Kishan Ram Dayal Wool Merchants HiralaI Dev Kishan Wool Merchants Mathura Das Khusal Wool Cleaning Factory MIs. Lalchand Shiv Pratap Wool Merchants MIS. Kasiram Sewaram Wool Merchants Bhanwarlal Omprakash Educational Press Shri Kishan Gopal Tiles Factory, Rani Bazar The Rampuria Ice Factory Bikaner Chemical Co. M/s. Bikaner Polythene Products Ratanlal Kishanla) Wool M~rcbant~ Shri Mahaveer Carding Co. Mangal Mudranalaya Maheshwari Printing Press Lokmat Press. Hospital Road Bikaner Cold Storage Co. M/s. Chauthmal Khusaldas & Co. Burmah Shell Depot Co. Rajasthan Timber Supplying Co. Bikaner Band Saw Machine Laxmi Printing Press Mis. Chhotulal Ramdeo Saw Mm. Chand Printing Press Gopal Printing Press Rajasthan Mudranalaya Satish Printing Press Jawahar Press, Jai! Road
Location
2
Bikaner
I,
.. .. " .. "
"
"
.' .. " >. .,
..
..
.' " .. ,.
.. .. " ,. ,. t.
" " " ..
"
No. of workers
employed
3
1,639 28'7 75 75 75 75 75 75 74 41 38 38 37 37 37 37 37 37 37 37 36 30 29 27 23 18 16 15 15 15 15 15 14 14 13 13 13 13 13 IJ 13 13 13 13 13 13 13 12 Jl J1 9 8 7 7 7 7 7 6 5 5 4 4 4 3 3 3 2 2 2
Source :- The Office of the Chief Inspector of Factories .& Boilers. Rajasthan.

228
EMPLOYMENT SITUATION 1961
Particulars
Applicants registered during the year Vacancies notified during the year Applicants placed during the year Employers using the Employment Exchange Applicants on the live register at the end of the year
(a) Professional. technical & related workers (b) Administrative, executive & managerial workers (c) Clerical & related workers (d) Farmers, fisherman, hunters. beggers & related workers (e) Workers in transport & communication occupations (f) Craftsmen, production, process workers & labourers not elsewhere classified (8) Service sports &" recreation workers (h) Workers not classified by occupations
Number
2
7,642 1,681 1.225
396 3,149
172 14
124 17 84 54
172 2,512
Source . - The Directorate of Employment, Rajasthan.
GENERATION AND CONSUMPTION OF ELECTRICITY 1959-60
Particulars
1
A- Electricity Generated B- Tota) Consumption of Electricity
(a) Domestic (i) Heat and Small power
(il) Light and fans (b) COmmercial
(i) Heat aDd Sman power (jj) Light and fans
(c) Industrial (i) Low and medium voltale
(ii) High voltage (d) Public lighting (e) Irrigation (f) Public water works and sewage pumping
Bikaner Power House
(in million Kwh.)
2
16.395 10.84~
0.452 ].280
0.452 1.280
3.158 0.088 0.562 0.006 3.570
Source :- Public ElCi;:tricity Supply-All Iddia Statistics (1959-60), Central Water and Power Commission. Simla.
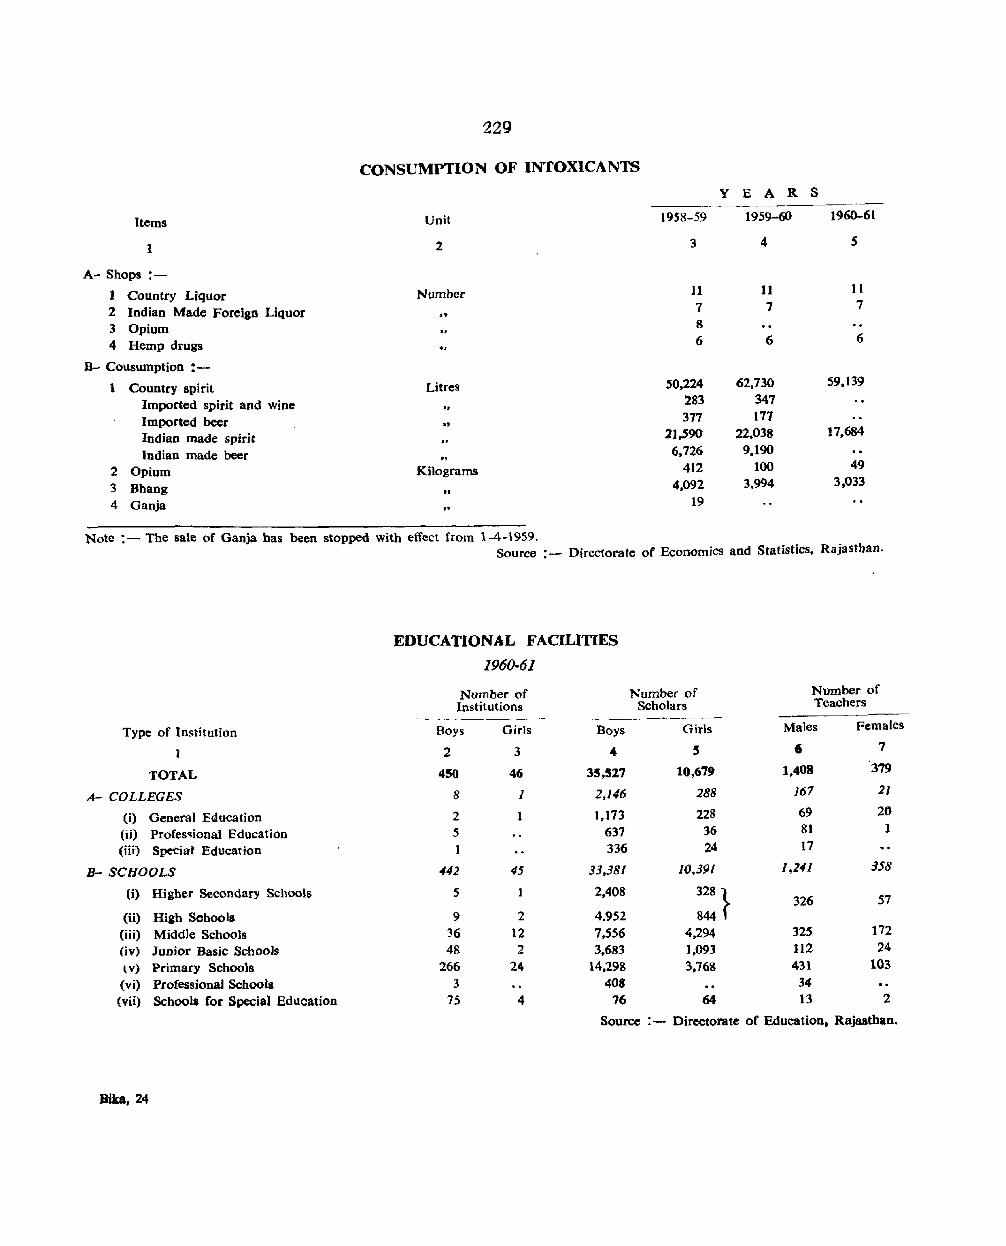
229
CONSUMPTION OF INTOXICANTS y E A R S
Items Unit 1958-59 1959-60 1960-61
1 2 3 4 S
A- Shops :-
1 Country Liquor Number 11 11 11
2 Indian Made Foreign Liquor It 7 7 7
3 Opium .. 8
4 Hemp drugs .. 6 6 6
B- Cousumption :-
1 Country spirit Litres 50.224 62.730 59,139
Imported spirit and wine .. 283 347
Imported beer .. 377 177
Indian made spirit ,. 21,590 22,038 17,684
Indian made beer ., 6.726 9,190
2 Opium Kilograms 412 100 49
3 Bhang 4,092 3,994 3,033 .. 4 Ganja .. 19
Note :- The sale of Ganja bas been stopped with effect from 1-4-1959. Source :- Directorate of Economics and Statistics, Rajastban.
EDUCATIONAL FACILITIES
1960-61
Number of Number of Number of Institutions Scholars Teachers
Type of Institution Boys Girls Boys Girls Males Females
2 3 4 S 6 7
TOTAL 450 46 35,517 10,679 1,408 379
A- COLLEGES 8 I 2,146 288 167 21
(i) General EGocation 2 ),173 228 69 20
(ii) Profes"lional Education 5 637 36 81 1
(iii) Speciat Education 336 24 17
B- SCHOOLS 442 45 33.381 10,391 1,241 358
(i) Higher Secondary Schools 5 2.408 328 } 326 57
Oi) High Schools 9 2 4,952 844 (iii) Middle Schools 36 12 7,556 4,294 325 172
(iv) Junior Basic Schoo), 48 2 3,683 1,093 1I2 24
~v) Primary Schools 266 24 14,298 3.168 431 103
(vi) Professional Schools 3 408 34
(vii) Schoola for Special Education 75 4 76 64 13 2
Source :- Directorate of Education. Rajasthan.
Bit., 24

230
GOVERNMENT PUBLIC HOSPITALS AND DISPENSARIES 1960
Particulars
A-HOSPITALS
P. B. M. Men's Hospital, Blkaner P. B. M. Women's Hospital, Bikaner G. O. J. T. B. Hospital. Bjkaner Government Hospital, Napasar Police Line Hospital, Bikaner Government Hospital, Gajner
B-DISPENSARIES
City Dispensary No. I, Bikaner City~ Dispensary No.2. Bikaner
Type of Vehicles
I
Total
Private Cars and Jeeps Prlvate Buses Motor Cycles & Tricycle Rickshaws • Contract and Taxi Carriages . Stage Carriages • Public Carriers . Private Carriers • Tractors • Others
Reds
2
31<;
284 101
6 4 6
Pa rheu lar:.
I
B-DISPFNSARIES-conc/d.
Fort Outdoor Dis?ensary, Bikaner Government Dispensary. Deshooke Government Dispensary, Gangashabar Himtasar Lunkaransar Kolayat Palana Lalgarh Government Dispensary, saruda Kaloo Aid Post
Beds
2
Source:- Directorate of Medical & Health Services, Rajasthan.
MOTOR VEHICLES ON ROAD
y E A R S (Number)
1957 1958 1959 1960 1961
2 3 4' .5 6
983 1,064 1,132 1,262 1,)12
525 551 580 6] 1 620 20 20 21 34 35
137 165 180 194 213
3 3 3 10
53 64 71 106 109
116 125 129 154 156
36 36 40 43 47
24 26 30 31 34
69 14 78 89 88
Source : - The Directorate of Transport. Rajasthan.

Type of Societiel Number
2
Total )2,0
Centra] Co-operati\'e Bank: 1 Agricultural Credit SOCieties 144 Non-Agricultural Credit Societiel 6 Primary Marketing Societies % Marketing Societies (Non-plan) 3 Milk Supply Societieg 4 Agricultural Non-Credit Societies 15 Non-Agricultural Non-Credit Societies 11 Housing Societies 4 Weavers Societies 2S Co-operative Stores 40 Other Industrial Societies 37 District Institute
. 1
SocietieJ under Liquidation 27
231
CO-OPERATIVE SOCIETIES (As Vn 30th June. 196])
Share Working Capital Capital
Members (Rs.) (Rs.)
3 4 5
12,175 1,148,664 . ",199,311
644 312,250 1.944,457
7,831 J41,724 608,60J
4.559 365.909 1,093,586
232 39,530 77.780 83 6,992 14,706 65 )0,790 20,790
256 17,075 61,986 462 53,529 92.319
60 1,700 1.700
636 27,435 84,987
3.795 74,412 80,722
989 78,644 181,286
157 2,404 18,674 36,392
Loans Loans AdV(lncect Recove~ Deposits Borrowings
(Rs.) (Rs.) (Rs.) (Rs.)
6 7 8 9
1,574,477 1,385,319 904,408 2.192,037
1,159,082 376,036 218,827 1,411,868
400,031 146.606 14,059 452,820
989,866 861.386 671,522 4.625 38,250
11,698 7,546 3,900 10,000
9.900 1,291 44.911 38.790
57,082 5.785
102.642
17,718
SDurce : - The Registrar Co-operative Societies, Rajasthan.
Stoeb
Nokha Kolayat Bikaner
Year of opening
2
1955-56 1958-59 1960-61
COMMUNITY DEVELOPMENT BLOCKS {As on 31-12-1961}
Area covered
Stage Sq. Miles Sq. Kms.
3 4 5
II Stage 1.466 3.797 I Stage 1,846 4,781
,t 3,557 9,213
Number of Rural vjJ]ages population covered served ('000)
6 7
123 72 185 35 181 54
N. B. :- Area, viUaees and population based on 195J Census. Source :- Development Department, Rajasthan.
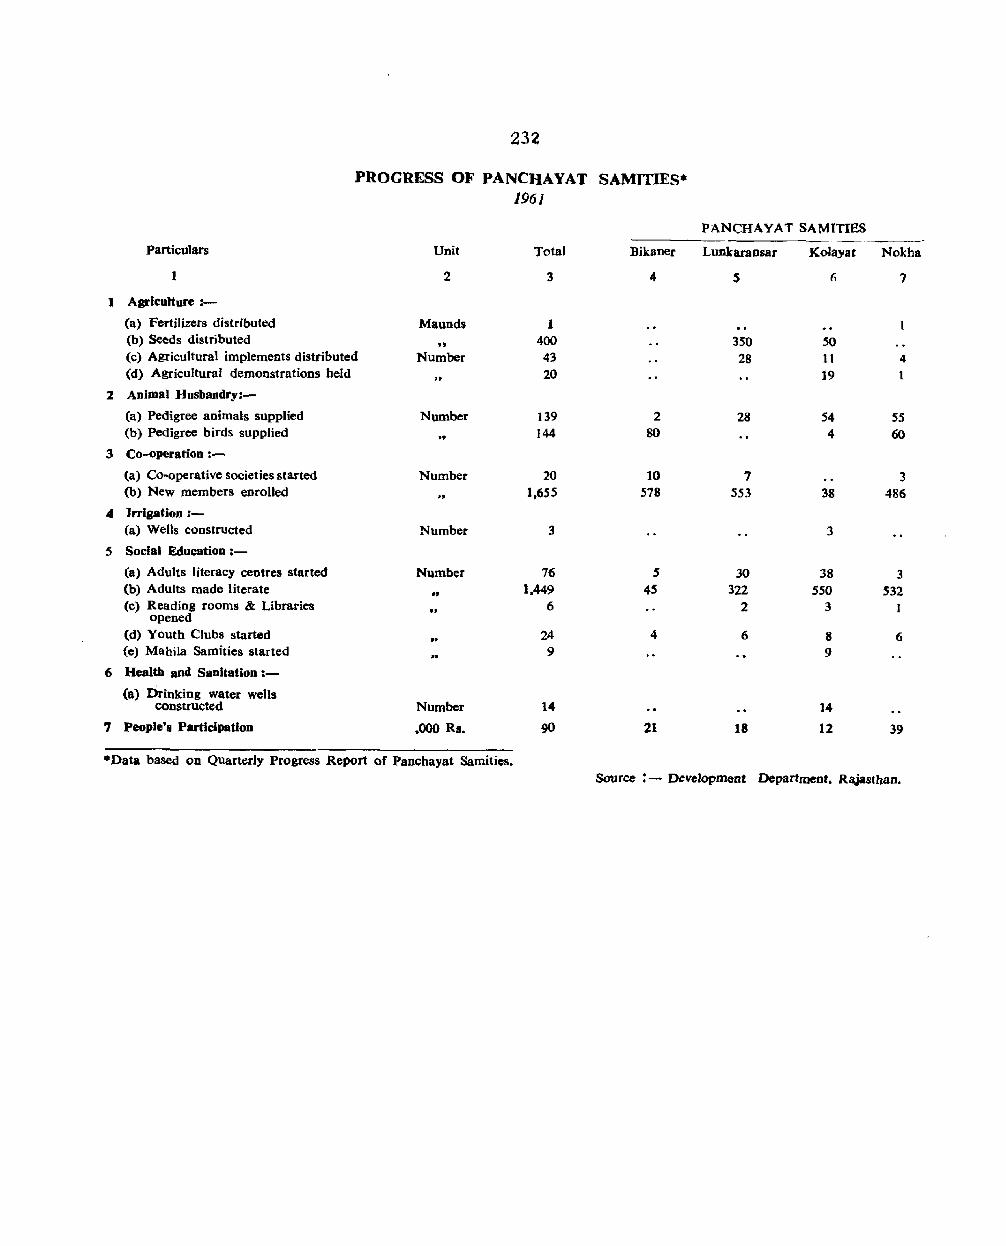
232
PROGRESS OF PANCHAYAT S AMITIES * 196}
PANCHAYAT SAMITIBS
Particulars Unit Tota) Bikaner Lunkaransar Ko)ayat Nokha
1 2 3 4 S (i 7
1 Agriculture :-
(a) Fertilizers distributed Maunds 1 (b) Seeds distributed ,; 400 350 SO (c) Agricultural implements distributed Number 43 28 11 4 (d) Agricultural demonstrations held .. 20 19 1
2 Animal Husbandry:-
(a) Pedigree animals supplied Number 139 2 28 54 55 (b) Pedigree birds supplied .. 144 80 4 60
3 Co-operation :-
(a) Co-operative societies started Number 20 10 7 3 (b) New members enrolled ., 1,655 578 553 38 486
4 Irrigation :-(a) Wells constructed Number 3 3
5 Social Education:-
(a) Adults literacy centres started Number 76 5 30 38 3 (b) Adults made literate ., 1.449 45 322 550 532 (c) Reading rooms & Libraries
opened ., 6 2 3
(d) Youth Clubs started ., 24 4 6 8 6 (e) Mahila Samities started .. 9 9
6 Health and Sanitation:-
(a) Drinking water wells constructed Number 14 14
7 People's Participation ,000 Rs. 90 21 18 12 39
*Data based on QUarterly Progress Report of Panchayat Samities. Source : - Development Department, Rajasthan.
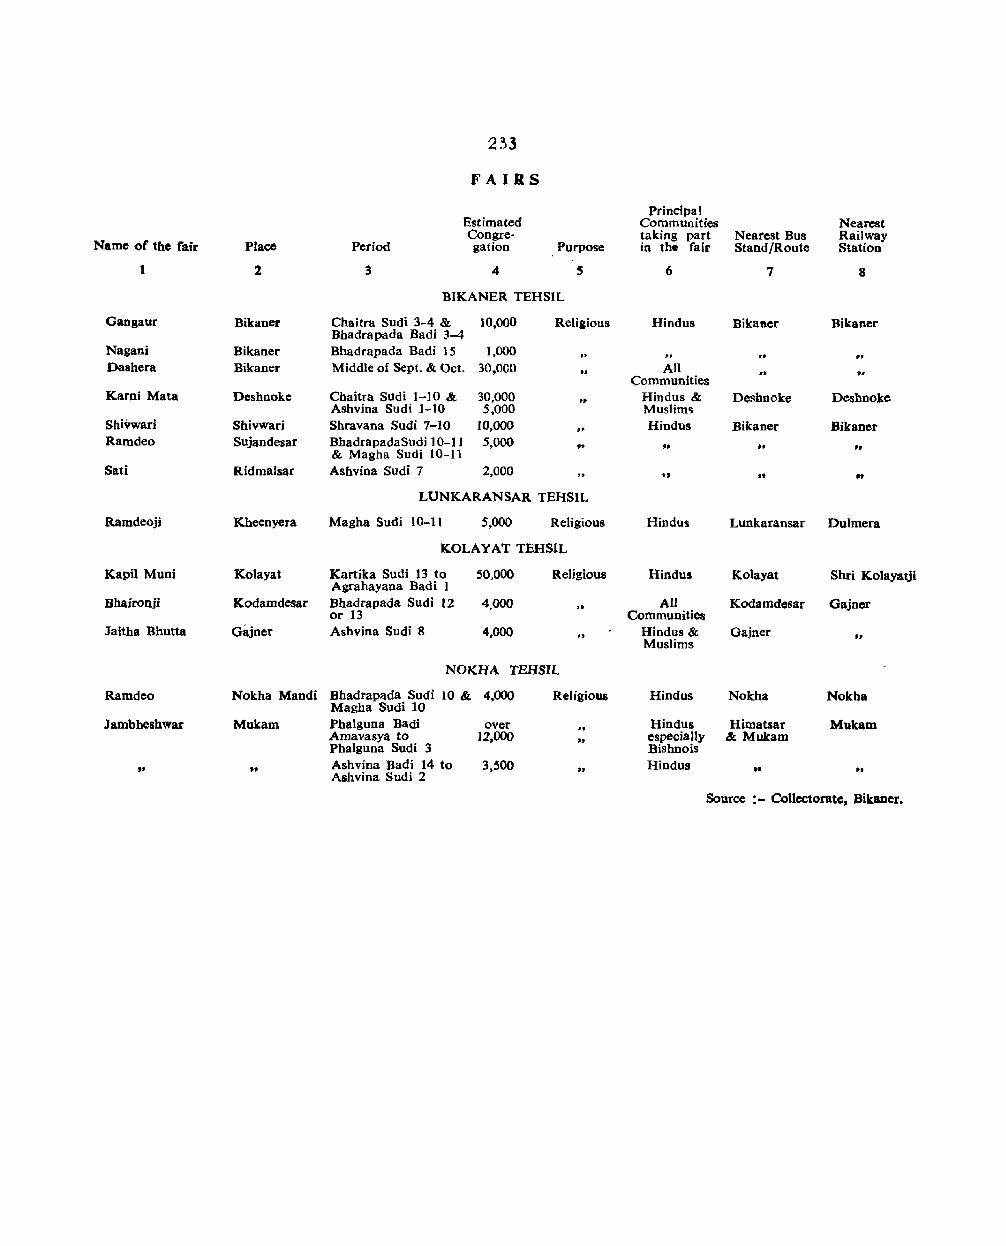
Name of the fair
I
Gao gaur
Nagani Dashera
Karni Mata
ShiVwari Ramdeo
Sali
Ramdeoji
Kapil Muni
Bhaironji
Jaitha Bhutta
Ramdeo
Jambheshwar
t.
Place
2
Bikaner
Bikaner Bikaner
Deshnoke
Shivwari Sujandesar
RidmaIsar
Kbeenyera
Kolayat
Kodamdesar
Period
233
FAIRS
Estimated Congregation Purpose
3 4
BIKANER TEHSIL
s
Chaitra Sudi 3-4 & Bhadrapada Badi 3-4 Bhadrapada Badi 15 Middle of Sept. & Oct.
Chaitra Sudi 1-10 & Ashvina Sud; 1-10 Shravana Sudi 7-10 BhadrapadaSudi 10-1 J & Magha Sudi 10-11 Ashvina Sudi 7
10,000
],000
30,000
30,000 5,000
10,000 5,000
2.000
Religious
.. .. t.
,.
.. LUNKARANSAR TEHSIL
Magha Sudi 10-11 5,000 Religious
KOLAY AT TEHSIL
Kartika Sudi 13 to Agrahayana Badi I Bhadrapada Sudi 12 Or 13 Ashvina Sudi 8
50,000
4.000
4,000
Religious
.. "
NOKHA TEHSIL
Nokha Mandi Bhadrap~da Sudi 10 & 4,000 Magha Sudi 10
Religious
Mukam Phalguna Badi Amavasya to Phalguoa Sudi 3 Ashvina Badi 14 to Ashvina Sudi 2
over 12,000
3,500
., 'J
II
Principal Communities taking part in th. fair
6
Hindus
" All
Communities Hindus & Muslim'; Hindus
.,
Hindus
Hindus
All Communities
Hindus & Muslims
Hindus
Hindus especially Bishnois Hindus
Nearest Bus Stand/Route
7
Bikaftcr
,. .. Deshnoke
Bikaner ., It
Lunkaransar
Kolayat
Kodamdesar
Gajner
Nokha
Himatsar &. Mukam
••
Nearest Railway Station
8
Bikaner
., • •
Deshnoke
Bikaner It
"
Dulmera
Shri Ko)ayatji
Gajner
..
Nokha
Mukam
••
Source :- Collectoratc, Bikancr.

Number Pa .. ticu1ar~ of seats
2
Assembly Constituencies
Bikaner City 1 Nokha 1 Bikl\n~t' Tehii 1 1
Particulars
1
Assembly Constituencies
Bikaner City Lunkaransar Nokha
234
FIRST GENERAL ELECTIONS 1952
Percentage of voting preferences
Ram Percontage Rajya
Eleclornte of Polling Congress Parishad Jansangh SooiaHst Independent
3
54,913 53,562 49.421
Number of seats
2
1 1 2
4 ! 6 '1 8 9
45,~ UU 18,~ 8,3 9.3. 4 .~
39.7 27.1 .. 72.9
44.1 29,) 7.9 62.8
Source : - El<;cticn Oep~rtmwnt. R~jaathan.
SECOND GENERAL ELECTIONS 1957
Electorates Percentage
Men Women of polling Congress
3 4 5 6
23.946 22.405 50.9 22.9
22,275 22,275 33.4 32.5
47,668 42,293 36.2 21.5
Source
Percentage of voting preferences ~---
Praja Jan Socialist
Sangh Party Independent
7 8 9
5.1 51.2 20.8 67.5
13.7 64.8
: - Election Department. Rajasthan.
SECflON IV
DISTRICT &- TEHSIL MAPS


DISTRICT AND TEHSIL MAPS
(Note)
The district and tehsil maps presented in this section have been prepared and presented for the first time. They form a part of the Census Atlas and have been reproduced here specially with a view to help the reader to locate the places mentioned In the Primary Census Abstract and the Village
Directory. The villages have been shown by code numbers in the tehsil maps.
The maps have been photographicaUy reduced to their present size from the original revenue maps and the scale and graticules have been worked out as approximately as possible.
The following is the list of references used for all the maps •
OISTRICT Hq.
TEHSIL Hq.
... "TIONAL HIGH"WAV
TAR ROAD
METALLED ROAD
GRAVELLED ROAD
FA IR-WE AT HE R ROA D
BROAD GAUGE LINE
METER GAuGE LIlliE
RIVEA.
H'LI. S
POLICE STATION
POST. TEt.£GRAPH OFFICE
POST OFFICE
TELEPHONE
DISPENSAR,(
REST HOUSE
COLLEGE
HIGt1,or H!G HE Ii SEC ONOARY SCHOOL
•
®
.pt
®
® @
®
I. wORKERS
CULTIVATO~
a AGRICULTURAL LABOuRER
iii 'lit MINING, QUARRYING, LIVESTOCK, FORESTRV,
FISH!NG, HUNTING & PLANTATIONS, ORCHARDS
& ALLIED ACTIVITIES
i", AT H 0 us E'H 0 L DIN 0 U S T R V
II' I lit M A !If U F ACT URI N·G 0 THE R T H A III H 0 U 5 I H 0 L D
InDUSTRY
"I tilt CONSTRUCTION
vii ,N ".ADE a COMMERCE
,iii fl't TRANSPORT, STORAGE • COMMUNICATIOIlfS
t. . tljf OT Hii R SERVICES
.2. NON WORKERS
~-
'C001i NOll. OF VII.LAGES WITH POPULAPON ~.OOO'"
.. AVE BEEN UNDER-LINED AS 73
CODE Nos. OF VILLAGES WIT .. POPULATION 2000 T
HAVE SEEN UNDER-LINED DOUBLE AS
CODE Nos. OF UNPOPULATED VtLLAG£S ARE PuT
~N AECTANGLES AS
~ . .. L)\~
~ r==J ". -I~ml ,.


RAJASTHAN
/ i
PAKI.TAN i
!
"" ./
.~
/ ........ . . ...... . /' .... . ". ./ ... . / \
~
\ ~
\ \
II \, ................. :-:'. ..,
I
O. oJ 0 D H PUR
~
I I
{ .": , ........ . \....... J , .... \ .....
\
Dist. Bikaner 111111 I I I r I I 0 \5 10 15 20 U 30 n 40 .. ,
M I L E S
111111 I I I I I I 0 10 20 30 40 50 10
KILOMETRES
o. G A N G A NAG A R
lunkaranaaf
D. CHURU
10 A.,.nljarh

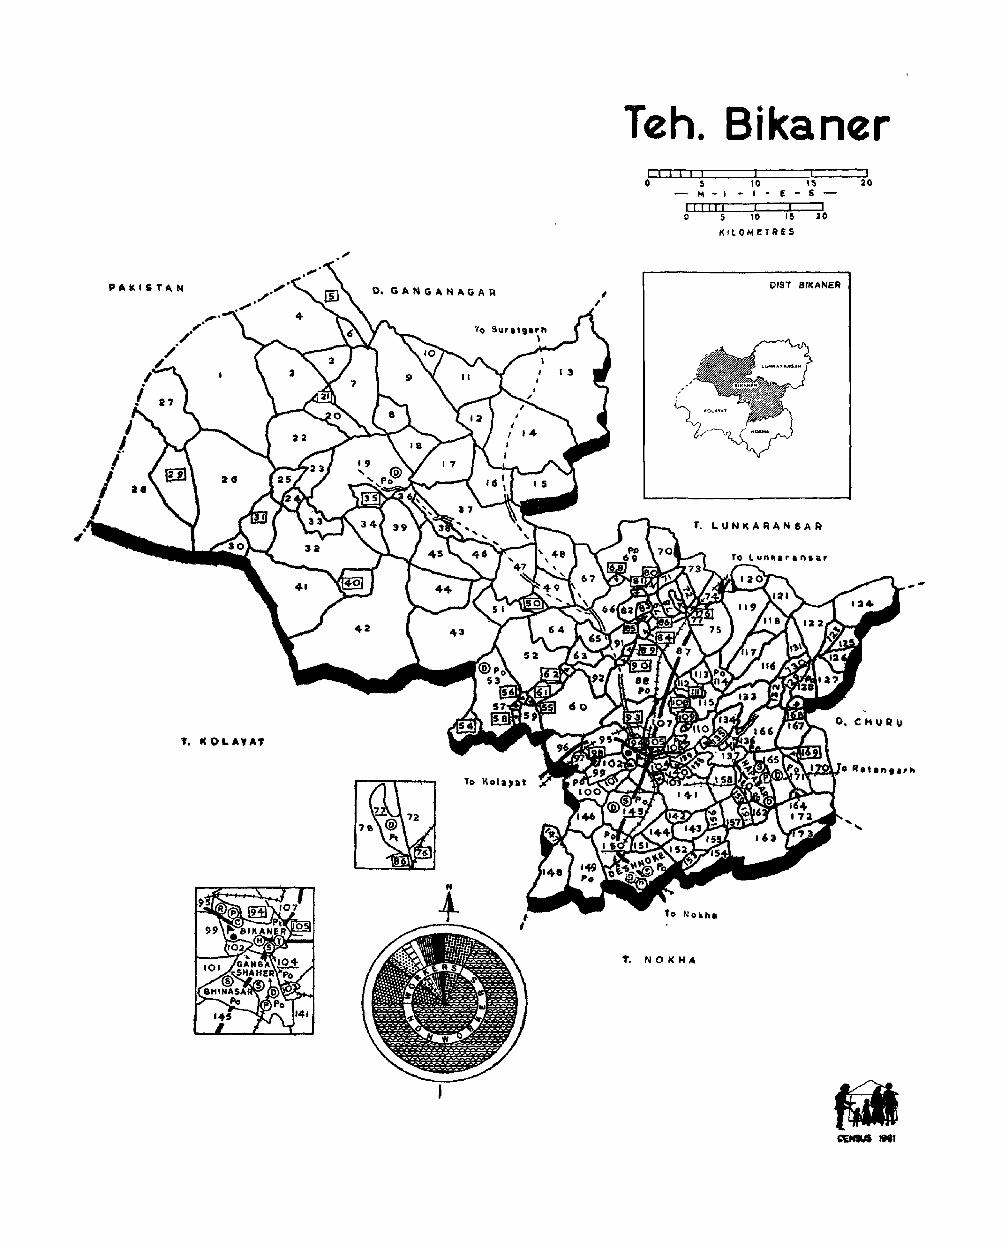
PAKISTAN
T. KOLAYAT
O. G A N G A NAG Po ~
'(0 SlIrat"r'" \
To ~ola)at
Teh. Bikaner I I I I I I I I 0 5 10 n 20
- M - I - I - f: - s II IIII I I I 0 5 11) )5 JO
KILOMETRES
OIST BIKANER
T. L U N Ie A RAN S A R
.....
CHUR ...
Not.h.
T. NO K H"

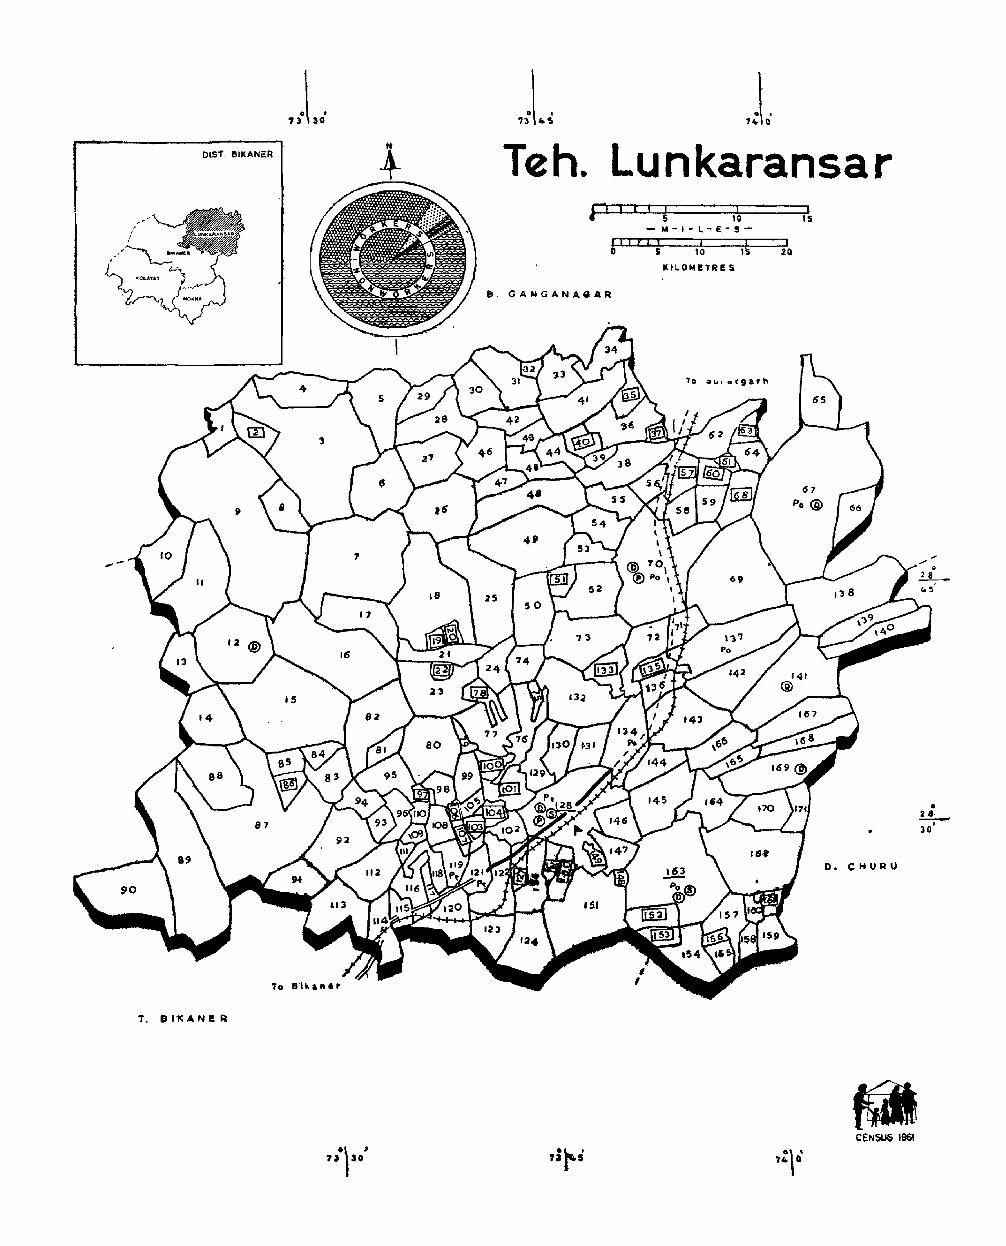
0\ ' '3 30 0\ .
'13 4 ... .1. 7<10 0
OIS1'. BIKANER Teh. Lunkaransar 15
, I I I I J o 5 10 15 2Q
I(ILON!TRI!: S
e. GANGANAeAR
10 ; ..... • rga-rh
• .!.!.:._. 30'
D. CHURU
T. 8 lle A N I! R
CENSUQ 1961
73 SO .\ I . "'" . U r ' 7.,. 0 .\ '

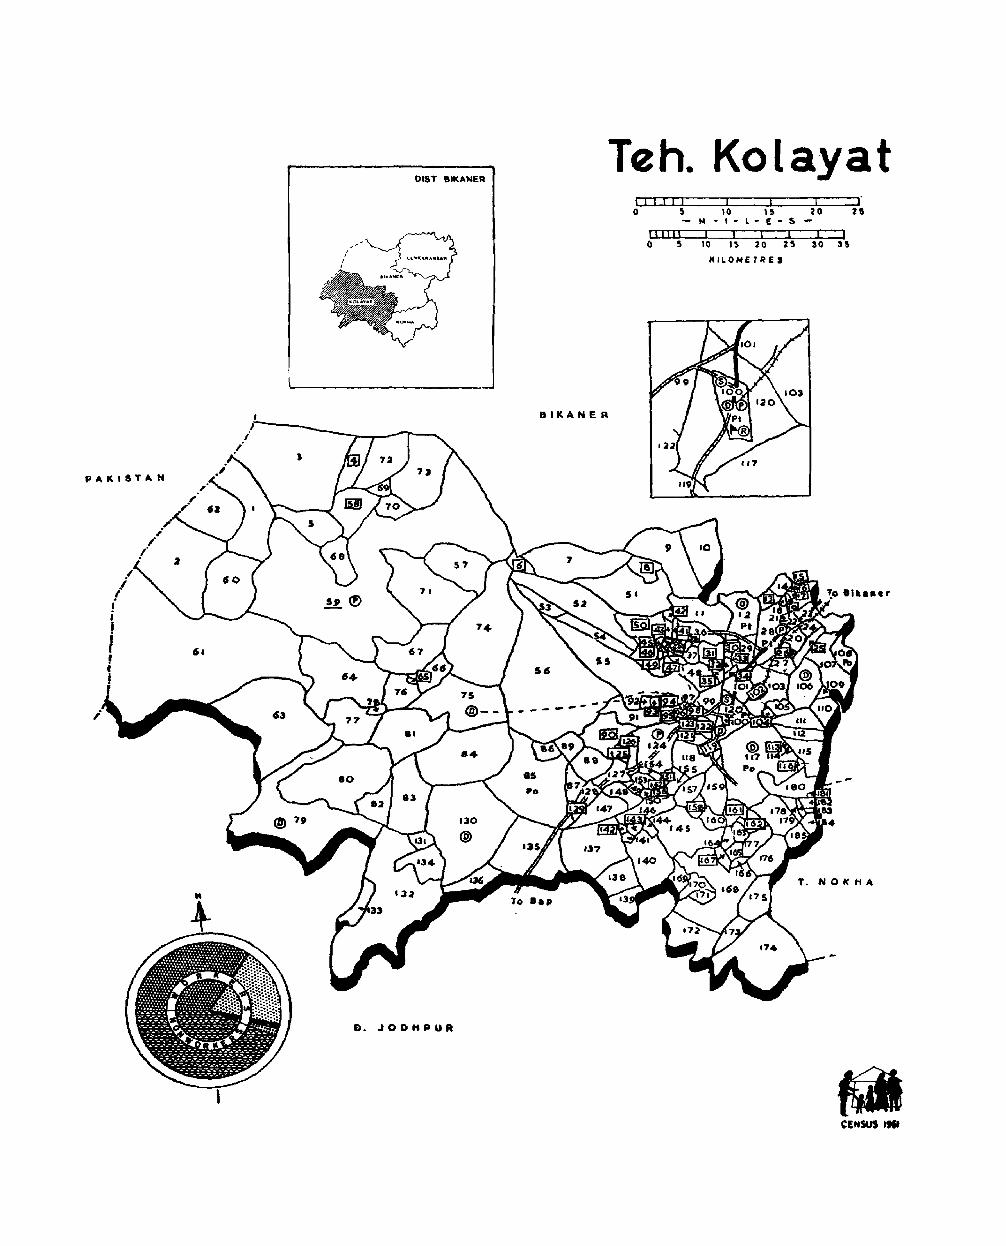
OIST 81KANER Teh. Ko[ayat
I J I I I I J ! I )
0 $ 10 U 10 2S
"" - I - L - E - s (I II II I ! I ] ! I 0 $ 1O 15 20 2S 30 35
KILOMETRES
BIKANER
PAKISTAN
D • .J 0 D H PUR


• 27 --, .1
• -ll 10'
T. KOl.AVAT
D. JODHPUR
f
"t DIST. 8IKANER
·t . fI;"
.1 , nLo
T. BIKA·HEA
D NAG"""
., . '~ '~
Teh. Nokha' r r j I ,. j. 3 r
" O' I 10 -N-I-L·I-S-
I I j I I , li J
" ... -I t
• at -.-SO

Related Documents