CENSUS 1961 DISTRICT CENSUS HANDBOOK UTTAR PRADESH !-UTTARKASHI DISTRIC:T L UCKNOW: Superintendent, Printing and Stationery, U. P. (India) 1965 Frice. Rs.1O.00]

Welcome message from author
This document is posted to help you gain knowledge. Please leave a comment to let me know what you think about it! Share it to your friends and learn new things together.
Transcript

CENSUS 1961
DISTRICT CENSUS HANDBOOK
UTTAR PRADESH
!-UTTARKASHI DISTRIC:T
L UCKNOW: Superintendent, Printing and Stationery, U. P. (India)
1965
Frice. Rs.1O.00]


"Preface
Introduction
A-I
Appendix
Appendix
Appendix
A-II
Appendix
.A-III
A-IV
B-1 & II
B-III
B-IV
B-V
B_VI
CONTENTS
i-CENSUS TABLES
A-GENERAL POPULATION TABLES
Area, Houses and Population
I-Statement showing 1951 Tel'ritorial Units constituting the present 1961 set-up of the District
II-Number ofViUages with a Population of 5,000 and over and Towns with a Population. under 5,000
III-Houseless and Institutional Population
Variation in"Population during Sixty Years
1951 Population according to the territorial jurisdiction in 1951 and changes in area and popu~tion involved in those changes
Villages Classified by Population
Towns (and Town-groups) classified by Population in 1961 with Variation since 1941
B..-GENERAL ECONOMIC TABLES
Workers and Non-workers classified by Sex and broad Age-groups
Part A--Industrial Classification of Workers and Non-workers by Educational Levels in Urban Areas only .
Part B-Industrial Classification of Workers and Non-workers by Educational Levels in Rural Areas only
Part A-Industrial Classification by Sex and Class of Worker of Persons at Work at Household Industry
Pages
I
III
5
5
6
6
7
7
8
9
12
16
18
22
Part B-Industrial Classification by Sex and Class of Worker of Pellons at Work 26 in Non-household Industry, Trade, Business, Profession or Service
Part C-Industrial Classification by Sex and Divisions, Major Groups and Minor 34 Groups of Persons at Work other than Cultivation
Occupational Classification by Sex of Persons at Work other than Cultivation
Occupation.al Divisions of Persons at Work other than Cultivation classified by Sex, broad Age-groups and Educational Levels in Urban Areas only
49
72

B-VIII
B-IX
C-II
C-I11
C-V
C-VII
Fly-leaf
SCT-I
SCT-III
SC-l
ii
J;>art A-Persons unemployed, aged 15 and above, by Sex, broad Age-groups and Educational Levels in Urban Areas only
Part B-Persons unemployed, aged 15 and above by Sex and Educational Levels in Rural Areas only
Persons not at Work classified by Sex, broad Age-groups and Type of Activity
C-SOCIAL AND CULTURAL TABLES
Age and Marital Status
Part B-Age, Sex and Education in Urban Areas only
Part C-Age, Sex and Education in Rural Areas only
Mother Tongue
Religion
SCT & SC-SPECIALTABLES FOR SCHEDULED CASTES
Part A-Industrial Classification of Persons at -Work and Non-workers by Sex for Scheduled Castes
Part A-Education in Urban Areas only for Scheduled Castes
Part B-Education in Rural Areas only for ~cheduled Castes
~rsons not at Work classified by Sex, Type of Activity and Educational Levels for Scheduled Castes
II-OFFICIAL STATISTICS
1. Statistics of Rainfall and Temperature
I' I-Rainfall
l'2-Mean Max!mum and Mean Minimum, Highest and Lowest Temperature
2. Vital Statistics
S. Agricultural Statistics
S'l-Principal Crops-Distri1>ution of Crops
3'2-Lalld Utilization
3',3-Agriculture Extension Scheme
3:4-~ersons Cultivating Land under different Sizes of Holdings
S'S-:CrOp-wise Gross Area irrigated
4. Statistics of Household Industries
Pages:.
78
78
80<
86
92-
92
94·
94
97
93.,
100
100
101
105-
105
106
107
107
107
108.
108
109-

5. Statistics of Factories
5'1-Growth of Factories
5'2-Number of workers in each Establishment
6. Administrative Statistics
iii
6' I-Criminal Justice-No. of Criminal Cases Tried
6'2-Criminal Justice-Persons Convicted or Bound Over
6' 3-Strength of Police, 1960
6'4-Statistics of Jails
6' 5:::'_Co-operative Societies
6'6-Excise and Motor Spirit Tax
6'7-Re~eipt of Entertainment Tax, and Land Revenue
6'8-Registered Documents and Value of Properties Transferred
7. Public Health and Medical Statistics
Pages
"lO9
109-
110
110
III
III
112
112
112
7' I-List of Hospitals and Dispensaries 1960-61 113
7'2-Maternity and Child Welfare Centres, Family Planning Centres, Rural Health qentres 114
7·3-T. B. Clinics & Anti-Adulteration 1959-60 114
8. Education Statistics
S·l-Educational Institutions and Pupils
8'2-List of Higher Secondary Schools, 1960-61
9. Statistics of Public Entertainment, Press and Journals
9'I-Printing Presses and News Papers
9'2-Cinemas
10. Communication Statistics including Waterways
10' I-Length of Metalled and Un metalled Roads Maintained by Public Authorities as on December 31, 1960
lO'2-Names of Waterways (Navigable Rivers) as on December, 31. 1960
10'3-Polymetrical Table of Di~tances of Block Headquarters
10'4-List of Railway S~tions
IO'5-List of Post Offices
11. Statistics of Local Bodies Receipts and Expenditure
12. Statistics of Community Development
13. Calendar of Important Events
14. Prices of Staple Food-stuffs Month by Month
15. Statistics of Banks and Insuranace
115
115
116-
116
116-
116
111
117
117
lIS'
119,
120
120

15' I-Statistics of Bank s
15'2-Statistics of Insurance
16. Statistics of Livestock
iv
17. Statistics of Fairs, Festivals and Village Markets
17' I-List of Fairs
l7'2-List of Festivals
17'3-List of Hats and BtaZIlt's
18. Handicrafts Survey
Pages
120
120
121
124
130
131
IS· I-List of Rural Crafts and Number of Persons employed in Production iSI
IS'2-Distribution of Artisan Communities 132
IS'3-Materials uiled, Source of Design, Manufacture and Marketing of Manufactured 133 articles
19. Statistics of Major a.nd Medium Projects taken up for execution during the I, II and III Plans 133
20. Statistics of Wages
III-VILLAGE DIRECTORY
1. Definition of Column Headincs
2. Alphabetical list of villages of Tahsil Puraula
3. Directory of Tahllil Puraula
~. Alphabetical list ofyillal:es of Tahsil Rajgarhi
5. Directory of Tahsil Rajgarhi
'6. Alphabetical list of yillages of Tahsil Dunda
7. Directory of Tahsil Dunda
8. Alphabetical list of villages of Tahsil Bhatwari
9. Directory of Tahsil Bhatwari
10. Directory of Bhatwari Notified Area (Urban)
IV-LIST OF INDUSTRIAL ESTABLISHMENTS
Number of Establishments Classified by Minor Groups of Industrial Classification
V-APPENDIX
Gazette 'Notifications of changes in Boundaries during the decade 1951-61
133
iii
vi
viii
xx
xxii
xxxii
xxxiv
xlix • 1
Ivi
Iix
lxii

PREFACE
Districtwise village statistics have been published at most of the Censuses. A list showing the population of villages in each district was published after the 1891 Census. No such list was brought out in 1901. In 1911 Village Directories were prepared for all districts, but cou~d be published only for thirteen -on account of the outbreak of the First World War. At the 1921 Census they were published for all districts in the form of District Census Statistics. In 1931 they were compiled for all districts, but were not published owing to -financial stringency, leading to loss of valuable data. At the 1941 Census even
• though restricted tabulation was undertaken on account of the Second vVorld War, yet the utility of District Census Statistics was recognized and they were pub
_lished. At the Census of 1951 two volumes were brought out for each district:the District Cens,!s Handbook and the District Population Statistics. Govern.ment have decided to continue the publication of District Census Handbooks. The'1961 District Census Handbooks contain more data than ever published
before. Village Directorie.s, besides giving the population of villages by industrial categories, also contain useful information about schools, hospitals, post offices, etc. .
As revised District Gazetteers are going to be published, introductory
:matter in the District Census Handbooks has been given in brief to avoid duplication.
Information for the District Census Handbooks was collected mainly from
three sources viz., State Tabulation Office, District Officers, Heads of Depart~ ments and their district level officers. In all cases confirmation has been obtained
from Heads of Departments concerned. I am extremely grateful ~to District Officers and the various Heads of Departments for their wholehearted cooperation in furnishing the desired information.
It is hoped that the District Census Handbooks will prove useful to the various Government departments and scholars.
Th~ printing of the Handbooks commenced from August, 1963.
Lucknow: Dated: September 2, 1963.
P. P. BHA TNAGAR Superintendent of Oensus Operatwns,
Uttar Pradesh.


INTRODUCTION
1. The District
1. The newly formed district of Uttar
l(ashi has been constituted from the old
Rawain tahsil of district Tehri Garhwal. The district is perched at the extreme northern edge of the ~ tate and on the western corner of the newly formed 'Uttarakhand division.
On the north it touches Himachal Pradesh
for most of the distance and Tibet in the rest. To the west it is bounded by district
Dehra Dun, in the south by district Tehri Garh wal and in the east by district Chamoli. The area according to the Surveyor General, India is 7,816 Sq. Km. (3,018 Sq. miles).
~. The district comprises 4 tahsils Pura~' ula, Rajgarhi, Dunda and Bhatwari. The tahsil-wise areas are not available. But from the rna p it can be said that Bhatwari is the
largest tahsil and Dunda the smallest. The district 'has only one town Uttar Kashi N.A. which was accorded the urban status in the 1951 Census.
3. Roads provide the main communication system for this hilly border district. It lies about 94 miles from the rail head at Rishikesh. The motor road from Tehri to Uttar Kashi, though quite smooth, can sustain
single way traffic. Bhaldiana, 13 miles from
T ehri is an important junction providing link to Lamgaon through Bhaldiana.Lamgaon
Road. Dharasu, at a distance of27 miles from Tehri is the other important station providing'
way to Barkot and Yamnotri through DharasuBarkot motor road. It is about 10 hours
journey by bus from Rishikesh to Uttar Kashi. The 18 ~miles long motor road [rom Uttar
Kashi to Bhatwari has been constructed
recently.
4. The district lies in the upper spurs of the Himalayan Range, comprising seemingly endless series of ridges and valleys. Each
ridge or spur leads up to another in a tortuous chain and each valley is a stream bed. The
heights of the mountain peaks near the Indo· Tibetan border range from 20,000 to 23,000 feet above th'= sea level. Generally the upper parts of the ridges that bound the valley are forest
clad and on the sloping hill sides lie a chain of sparsely populated villages with cultivation intersperSed with patches of bush or inferior
forest. The general direction of the main
ridges is from north-east to south·west radiating from the lofty peaks. Both the two most
important rivers of the State originate in this district. The Ganga, initially called Bhagirathi rises in a glaciar called Gaumukh at a height of 13,570 feet. The Yamuna rises from west of the Bandarpunch peak.
Yamunotri and Gangotri near the sources of the two rivers, are important places of pilgrimage.

IV
5. The important rivers of the district
are the Bhagirathi (Ganga), and the Yamuna.
The other rivers are the tributaries Jahnavi of Bhagirathi (Ganga) and Kamal, Rupin, Supin
(Tons), Hanuman Ganga, and Kedar Ganga.
Kashi. The forest produce varies according:to the altitudes from 4,000 to 9,000 feet Chir
and Deodar and from 10,000 to 15,000 feet
Gulmashi, Darmol, Kora, Bagra, Khurc,ha,
and Paran. The bogiyals, Kedarkanta, daisy,
butter cups, Michael Nals, trefoil, anemona etc.
are ~he varieties of flora which make this-area a florists paradise. Tahsil Puraula has the
famous valley of flowers known as 'Hari ki:
6. Three distinct groups of rocks occur ' in this district; pertaining to the three princi
pal mountainous zones. They are (i) the sedimentary rocks in the lesser Himalayas,
(li) metarmorphics in the axis of the great Himala yan ranges and for some distance on
its sides, and (iii) Tibetan groups in the troughs immediately behind the axis of the great Himalayan range. Soap stone is reported in good quantity near the village Bangaon in
Reserve Forest area in Dharasu Range. No other minerals have come to notice so far.
Dun'.
7. The climate varies according to heights. It is quite diversified ranging from tropical to severe cold. Valley areas are quite hot during summer while places at high altitudes record a
temperature below freezing point during winters. Snow falls as low as at 4,000 feet in
the winter. The river valleys experience
iI~tense damp cold aI!d mist, succeeded by considerable l}eat as the day advances. The
resultant conditions are favourable to fever.
The temperature and rainfall data are not
available. The rains, however, break earlie.r
than in the plains and are heavier at the foot of the hills and the foot of the snows.
8. Forests abound in this hill district and
are controlled by the Forest Division, Uttar
9. The important wild animals found_ in the forests are Tiger, black bear, deer, monk /
deer, TOOr, black monkey and porcupine.
There are also beautiful birds with beautiful
and soft feathers which fetch good price. They are peasants, green pigeon, black partridges,_ Dhakor, J.li ural and K oklan.
10. In the greater part of the district
there are two harvests rabi and kharif. The
chief crops of the rabi are wheat and barley
and that of kharif rice, jhangora and mandua. Potatoes are also largely grown.
2. Statistics
A-General Population
1. The district occupies the 6th position in area and last position in population in the
whole State. The table giving variation in
popUlation since 1901 shows that there has been an increase in population since 1 ~31, the
percentage increase being the highest during,

th~ decade (1951-1961). The population rose
by 122,836 during this period giving, a per-centage increase of 15'8 which is lower than
the State average of 16'7. The order of
tahsils by population is Dunda, Bhatwari,
Puraula and Rajgarhl.
2. The area of this district according to
the Surveyor General of India is 7,816 Sq. Km. (3,018 Sq. miles). Accordingly the density of population is 15 per Sq. Km. (41
per Sq. !nile).
3. The district has 671 villages of which 662 are inhabited and 9 un-inhabited. The average population per inhabited village is 182. Most of the villages are small sized i.e. with population less than 500. The number of such villages is 63'8 (96'4 per cent).
The percentage of medium sized villages
with a population between 500-1,999 is 3'6. There are no large sized villages with a
population of 2,000 and over. More than
four-fifths of the rural population (87'4 per
cent) lives in s'malI sized villages with a
population of less than 500. The remaining
12'6 per cent of population resides in slight
ly bigger villages having population between 500-1,999.
4. There is only one town of class VI
having population of less than '5,000 in the
district. The percentage of urban population
m the district is only 2'2.
5. The sex ratio i.e. number of females
per 1,000 males in 1961 is 964 in the district,
v distinctively higher than the State average of
909. The sex ratio in its rural areas is 977
and in its urban areas 517. The disparity between the two is noteworthy.
6. General Population Tables A-I to A-IV
and their appendices have been reproduced
in the volume.
B-Economic
1. Workers-The population of the dis-_.
triet is distributed between workers and non-
workers in the ratio of 6£'0: 31'0. It is nearl y in reverse order to the eorrespon.ding
ratio of workers and non-workers in the State as a whole (39'1 ~ 60'9). Among workers 87'5 per cent work as Cultivators and Agri
cultural Labourers. Next come Household
Industry and Manufacturing claiming 3'4
and 0'2 respectively. IIi other' categories the number of workers is very small. Female
participation is highly significant in the dis
trict. Female workers comprise 48'5 per cent
of the total workers. Female participation in
agricultural and non-agricultural activities is 97'2 per cent and 2'8 per cent respectively.
2. Of the rural population, 69'4 p~r cent
are workers and 30'6 per cent non-workers. The corresponding figures for the urban are
52'2 and 47'8 respectively. Thus, the propo
rtion of workers is smaller in towns than
in villages. Among rural workers 88'5 per
cent are Cultivators and Agricultural La
bourers, and workers engaged in non-agricul-

VI
tural activities account for 11·5. There is a preponderance of non-agricultural workers in
the urban, their percentage being 69'9 as
against a percentage of 30'1 in agricultural sector. The important non-agricultural cate-
gories of. workers in the urban area are Other Services, Household Industry and other Ma
nufactures and Construction. The percentage <)f workers in Other Services is 38'4, in House
hold Industry an~ other Manufactures 11'5,
and in Construction 10'0.
3. The larg~st number of workers is in the
age-group 15-34 accounting for 48'4 per cent
followed by the next age-group 35-59 which
accounts for 37'1 per cent. The percentage
of workers below the age of 15 is 8'4 and {
that in the .age 60 and over is 6'1. The
population of workers in lower and higher
age-groups is quite small.
4. The largest number of persons in Industries other than Cultivation is in construction and maintenance of roads, Railways,
bridges and tunnel (2,115), followed by Production and Rearing of Livestock mainly for
milk and animal power such as cow, buffalo,
goat etc. (1,235) and felling and cutting of trees
and transportation of logs (999). Occupa-
. tionally the bulk of the workers comprises
General Labourers (2,060), Farmers and Farm-managers, animals, birds, and insects
.rearing (1,070) and Tailors, Dressmakers'and
·Garmentmakers (574).
5. . Non-workers-These constitute 31'0 per cent of the total population. The per-
centages of non-workers among the males and females are approximately equal, at 49'8 and
50'2 respectively. Mostly the' non-workers
(83'7 per cent) are in the age-group 0-14, being mostly infants and dependents. In all other age-groups females are predominantly engaged in household duties. The distribution pattern of non-workers among males and females is very dissimilar. Among male nonworkers 30'3 per cent are fuil-titne students and 68'5 per cent dependents who jointly account
for 98'8 per cent, as against the ~orresponding
figures among female non-workers are 2'6, 88'2
and 90'8 respectively. Higher percentage of
dependents among males is explained by their
absence from household duties whodaim a
negligible percentage as against 8'9 per cent
among females.
6. The more i!Ilportant General Economic
Tables of the B-Series have been reproduced.
C~Social and Cultural
1. Literacy·-The percentage literacy in the total population is 15'6 as against the
State average of 17'7. The district ranks 37th
in literacy in the whole State. Literacy
percentage among males is 28' 7 and among
females 1'9. There has been an improvement both in male and female literacy during the
last decade. Of the total number of literates
66'4 per cent are without any educational
standard, 29'0 per cent are of primary or junior Basic Standard and 4'6 per cent of
High School standard and above.

VII
2. The percentage of literacy in the rural
population is 14'7 as against 57'0 in the
urban. In the rural area 27'5 per cent males
,and 1'5 per cent females are literate while'
. in the urban 70-8 per cent males and 30'3 per cent females.
3. Age Structure and Marital Status
Persons in the age-group 15-34 account for 34'9 per cent of the population, followed by 5-14 (19'9 percent), 35-54(22'9 per cent), 0-4-(1l'9 per cent), and 55 and over (10'4 per cent). The population of the district is progressive
,as the percentage of persons in young and
very young age-groups is 31'8 as against a
small percentage of 10'4 of elderly persons
(55 years and above).
4. The percentages of never married,
married and widowed or divorced persons are
38'4, 54'0, and 7'6 respectively. The correspond
ing figures for rural areas are 38'0,54'3 and 7'7 and for urban 49'9, 44'9 and 4'9. Among males 43-9 per cent are never married, 52'4 per cent married, and 3'7 per cent widowed
or divorced. Among females 32'5 per cent are never married, 55'7 per cent married and
11'8 per cent widowed or divorced. Of the
married males 0'5 per cent are in the agegroup O-H, 59'3 per cent in the age-group 15-34, 32'5 per cent in the age-group 35-54 and 6'7 per cent in the age-group 55 and above. Among males and females aged 35 and over, 3'6 per cent of the males and only 0'3
per cent of the females are never married. In
'the rural and urban areas separately, th~
respective percentages are males 3'2 and females· 0'2 in the former and males 16'8 and
females 0'4 in urban. The percentage of malei
and females 'of ages 0-14 returned as -married is 0,8 and 2'7 respectively. This shows early marriage is still prevalent.
- 5. Language-Garhwali has been return
ed as mother-tongue of 84'8 per cent popula
tion, and Hindi of 13'1 per cent. The _number
of persons who returned other languages &i
their mother-tongue is insignificant. Garhwali is the main language Ipok.en .y
85'0 per cent of the rural population, followei
by Hindi 13'0 per cent. In the urban popula.tion Garhwali (71'9 per cent), Hindi (18'l per cent), Punjabi (3'0 per cent), Bengali
(1'3 per cent) .and Nepali (1'0 per cent) are
the main languages.
6. Religion-Of the total population of the district 99'5 per cent are Hindus and 0'2 per cent Muslims. The absolute number of pesons belonging to other religions are Sikhs
51, Christian~ 1, Buddhists 274, Jains 25. The
Jains and Christians, small in number, mainly
live in rural areas.
Of the rural population 99'6 per cent are
Hindus and 0'2 per cent Muslims. The corresponding figures for the urban are 96'6 and 2'0. The number of persons belonging to other religions is insignificant in rural areal; Sikhs ·comprising 1-4 per ce~t reside in the
urban sector.
7. Scheduled Castes-They constitute
21-1 per cent of the. total population. The

VIII
important scheduled castes in order of popula- for the urban are 48'S, 41'8, 5'3 and 4'4 res
tion in the district are Shilpkar 90'4 per cent, pectively.
Chamar 4'9 per cent, Bajgi 2'8 per cent and
Dom 1'5 per cent, They are mostly concentrated in the - rural areas and only 1'1 per
cent 'live in towns,
8, The more important Social and Cultural Tables of C-Series have been reproduced.
D-M igration
1. Among the people enumerated III the district, 89'7 per cent were born within the
district 8'4 per cent in other districts of the state, I-I per cent in other parts of the country
and 0'6 per cent in other countries Among those from other countries, 465
are from Nepal, 175 from Pakistan
and 1 from U,K, The immigrants from
Pakistan are mostly displaced persons. The duration of residenGe of 52'7 per cent of the _
immigrants is over 10 years. The rural areas have 95'6 per cent of immigrants and the
remaining 4'4 per cent were returned from the
urban, ' Of the immigrants 26-9 per cent are males and 73'1 per cent females. The percentage of workers and non-workers is
85'4 and 14-6 respectively. Among 'workers 78'4 per cent work as Cultivators and Agricultural Labourers, followed by 6'4 per cent in Construction and 4'7 per cent III
Other Services_
2. Of the rural population 90'6 per cent
were born within the district, 7'7 per cent
ill other districts of the State, 1'1 per cent
ill other paz:ts of the country and 0'5 per cent
ill other countries, The corresponding figures
3. Ofthe immigrants from adjacent States,
1,092 persons (males 711, females 381) a
from Himachal Pradesh, 170 (males 129, females
,41) from Punjab, 20 (Males' 13, females 7) from Delhi, 16 (males 14, females 2) from
Bihar and 10 (males 9, females 1) from Madhya Pradesh. The number of immigrants from
other districts of the States is 44,779 (males
12,041, females 32,738).
4. Migration Tables have not been reproduced.
E-Housing and Establishment
1. Workshops anQ Factories-There
is no registered factory in the <;listrict.
2. The total number of unregistered work
shops and factories is 796-792 in the rural.
and 4 in the urban as against the State average of 4,460. Uttar Kashi is one of the 12 districts in "the State having workshops and factories below 2,000. In the rural areas
the largest number of the workshops and
factories (674) are engaged in the production
of rice atta, flour etc., by milling, dehusking
and. processing of crops and food grains followed by production of other food products
such as sweetmeat and condiments, muri,
murki, chira, khoi, cocoa, chocolate, toffee,
lozenge (43). In the urba~, area the largest
number of workshops a~d factories (3) are
engaged in wool .weaving in power-loom
followed by manufacture of su'ndry hardwares..

such- as G.I. pIpe, WIre net, bolt, screw,
bucket, cutlery.
3. The predominant working-group in the rural and urban areas both is single per
worker accounting for 93-0 per cent and 75'0
cent !espectively. Next important workin~-group
in the urban area is 20-49 (25'0 per cent). The other working-groups in the rural areas
are insignificant.
4. In both villages and towns most of the
establishments are run by other power. J'he
percentage of such establishments is 87'5 in
the rural areas and 100 per cent in the urban.
5.' Walls and Roofs-Stone is the predominant material of house walls in the villages, 98'3 per cent . households in ru~al areas and 94'6 per cent in urban areas bve in such types of houses. Households living
in houses with grass, leav~s, reeds or bamboo walls are also numerous in the towns, accoun
ting for 3'9 per cent. jiles, slate and shin~le are the most predominant roofing materIal
in th~ rural and urban areas accounting for 62'2 per cent and 51'6 per cent respectively,
followed by grass leaves, thatch or. bamb?o
in rural 35' 7 per cent. Corrugated iron, zinc or other metal sheets also constitute the roofing
materials in the urban areas accounting for 24'6 per cent followed by all other material
9'2 per cent. On account of moderately heavy rainfall in the district, roofs are mostly flat.
6. Size of Household and Density of
Persons per Room.-The average size -of
IX
househ91d living in· two rooms are pred~ minant accounting for 39'8 per cent, followed
by those living in one room which accounts. 23'9 per cent. There are no households which have no regular room to live in. The percentage of households living in 5 roo-ms
or more is 9'4.
7. In the rural area the average density of persons per room is 3'7 while in urban areas the percentage is 1'8. Considering households. occupying one room Qnly, the average size in rural and urban areas both is 3'6.
Housing and Establishment Tables have: not been reproduced.
3. Presentation of data
Statistics and other information in this
volume have been presented in the following order:-
I-Census Tables-, General Population
Tables, Economic Tables, Social and Cultural Tables ;'nd Scheduled Caste Tables.
II-Official Statistics- Rainfall and Temperature, Vital Statistics, Agriculture and Irrigation, H01,lsehold Industries, Registered
Factories, Administration, Public Health and
Medical, Education, Public Entertainment,
Presses and Journals, Communication, Local
Bodies, qommunity Development; Calendar of
Important Events, Pn, -(" Staple Food
stuffs, Banks and Insurance, Llv ... dtock, Fairs and

_ Festivals, Handicrafts, Majol' and Medium
Projects, and Wages.
m-Village Directory-Definition of Column Headings and for each tahsiJ an Alphabetical List of Villages and Village Directory giving data in respect of all villages and t?wns by sex of total population, Scheduled Caste popu-
lation, literate population, working population by categories of workers and non-workers.
x
. IV-List of Industriql EstablishmentsNumber of establishments in each village or block by the 3-digit industrial code.
V-Appendix-Gazette Notification of changes in boundaries during the decade 1951-1961.
Besides the above, one map for the District and one for each tahsil have been included
in the District Census Handbook.

PART I
CENSUS TABLES


A-SERIES G:bNERAL POPULATION TABLES


5 A-SBB.IBS
A-I-Area. Houses and Population
Area in Number of villages Number Population Total ,.----~---,. Population r---~-. Number of -"-- - .... District/Tahsill Rural per Sq. of occupied
City/Town Urban Sq. Sq. mile In- Un- towns residential Persons Males Females miles Km. habited in-habited . houses
1 2 3a 3b 4 5 6 7 8 9 10 11 UTTAR KASm
DISTRICT T N.A. N.A. N.A. 662 9 1 24,387 122,836 62,534 60,302 R N.A. N.A. N.A. 662 9 23,667 120,159 60,769 59,390 U 4'6 12'0 577 1 720 2,677 1,765 912
*Pulau!a TahSIl T N.A. N.A. N.A. 168 2 4,979 28,226 15,154 13,072
*Rajgarhi Tahsil T N.A. N.A. N.A. 176 5,214 29,703 15,645 14,058
*Dul,da Tahsil T N.A. N.A. N.A. 222 5 9,048 43,471 20,362 23,109
Bhatwari Tahsil T N.A. N.A. N.A. 96 2 5,146 21,436 11,373 10,063 R N.A. N.A. N.A. 96 2 4,426 18,759 9,608 9,151 U 4'6 12'0 577 720 2,677 1,765 912
Uttar Kashi Notified Area 4:64 12'02 577 720 2,677 1,765 912
,~o(e-I In columns 3b and 4, the Sq. Kilometre and density figures lespectlVely of urban areas ot tahsils and District are worked out usinO' the area figures corrected upto 2 plaees of decimals obtained by adding the aleas of towns 10 the respectlVe units and not ~Sll1g the area figures given in the Table. In addition to this, the figules lelating to Sq. Km. are fmther adjusted to make the tahsils and District totals agree.
2 According to Surveyor General, India the area of District Uttar Kashi is 3,018'0 Sq. miles (7,816'6 Sq. KID.) 3 N.A.-Not available
4: In tahsils marked * 'R' lS the same as 'T' as there is no urban area
APPENDIX I
Statement showing 1951 Tert'itorial U_nits constituting the present 1961 set-up ~f the Distri,t (Only those names/areas which have undergone change since 1951, have been shown below)
District/Tahsil
1 UTTAR KASHI
DISTRICT'
Puraula Tahsil
Rajgarhl Tahsil
Dunda Tabsil
Bhatwari TahSIl
Details of gain in territories --.A-. ____ -----, _
1951 Territorial units Brief
description
2 3
Newly formed by transfer of Rawain Tahsil from Tehri Garhwal District
Newly formed by transfer of a portion of former Rawai n Tahsil of Tehri Garhwal District
.Do
Do
Do
Area ...---"---...... Sq. miles Sq. Km.
4
N.A.
N.A.
N.A.
N.A.
N.A.
5
N.A.
N.A.
N.A.
N.A.
N.A.-Not available
Details of loss in territories r---.. ---"'----......
Net area (Gain +) (Loss -) Area
Brief description Sq. miles Sq. Km. Sq. miles Sq. Kw.
6 7 8 9 10
+N.A. + N.A.
+ N.A. + N.A.
+ N.A· + N.A.
-! N.A. + N.A.
+ N.A .. + N.A.

CBNSUS TABLES 6
APPENDIX II
Number of Villages with a Population of 5,000 and over and Towns with a Population under ?,OOO
VIllages with population of 5,000 and over Towns with population under 5,000 ,-------"- -------, ,-----_---"------,
Percentage to District!Tabsil Number Population total rural Number Population
Percentage to total urban populatiOD of 'the Stale
populatIon of li1e State
2 3 4
UTTAR KASHI DISTRICT'
Bhat\\'ari Tahsil
Note-Units of Territory "hieh ha\e n_othmg to show for this statement have been excluded
APPENDIX III
Houseless and Institutional Population
Total Houseless population Rural ,-----"---------.,
Urban District/Tahsil
Persons Males Females
2 3 4 5
UTTAR KASHi DISTRICT T 144 144
R 144 144
U
*Puraula Tahsil T
*Rajgarhi Tahsil T 44 44
*Dunda Tahsil -T
Bhatwari Tahsil T 100 100
R lOa 100
U
In tahsils marked '*' 'R' is the same a~ '1" as there IS no urban area
5 6
2,677
2,677
7
InstItutional populati()n ,_..--__ _Jo._ ____
Persons Males Female,
6 7 H
1,125 995 130
932 807 125
193 188 5
248 226 22
102 80 22
490 432 58
285 257 28'
92 69 23
193 188 5

7 A-SERIBS
A-II-Variation in Population during Sixty·Years
, Decade Percentage Year Persons
variation decade Males Females variation
2 3 4 5 6
UTT A R KASHI DISTRICT 1901 69,209 34,143 34,866
1911 77,429 + 8,220 + 11·88 38,213 39,216
1921 81,958 + 4,529 + 5·85 40,282 41,676
1931 89,978 + 8,020 + 9·79 44:,611 45,367
1941 102,280 + 12,302 + 13·67 51,iS8 50,522
1951 106,058 + 3,778 + 3·69 53,214 52,844
1961 122,836 + 16,778 + 15·82 62,53.J. 60,302
APPENDIX
'1951 Populati?n according to the territorial jurisdiction in 1951 and 'changes in area and population involved in those changes
Area in 1961 *Area in 1951 1951 Population Population in Net increase or IllSlllctJTabsil
,-___ .A... __ -, ,-____ ..A-____ according to ju- 1951 adjusted decrease bet-
1961 risdiction plC- tojmisdlctlOn wecn Columns Sq. miles Sq. Km. Population Sq. ollies Sq.-Km. vailing in 1951 of 1961 7 and 8
2 3 5 6 7 8 9
UTI AR KASHI DISTRICT N.A. N.A. 122,836 106,058 +106,058
(+N.A.) (+N.A.J ( +106,058)
Puraula Tabsil N.A. N.A. 28,226 N.A. N.A.
Rajgarhi Tab,il N.A. N.A. 29,703 N.A. N.A.
Dunda Tabsil N.A. N.A. 43,471 N.A. N.A.
Bhatwari Tahsil N.A. N.A. 21,436 N.A. N.A.
Note-*(I) Newly formed distrrict after 1951 Census from tbe former Ra\Vain Tahsil (area not available) transferred from Tehri Carhwal District vide G. O. no .• :)06/IC, dated 24-2-60.
(2) N.A.-··Not available

CENSUS TABLES
D iatrict (Tahsil
UTTAR KASHI DISTRICT
Puraula Tahsil
Rajgarhi Tahsil
Dunda Tahsil.
Bhatwari Tahsil
District/Tahsil
UTTARKASHI DISTRICT
Puraula --rahsil
Rajgarhi Tahsil
Dunda Tahsil
Bhatwari Tahsil
8
A-III-Villages classifid by Population,
I-Villages with less than 2,000 population r
Total Less than 200 200-499 500-999 Number ,..----"--., ,..-___ .A.
ot Total rural inhabited poulatlOn Population Population Population villages
No. ,..- No. r--"----.. No. ,---.....____, Pel sons Males Females Males Females Males Females Males Females
2 3 4 5 6 7 8 9 LO
662 120,159 60,769 59,390 448 24,285 24,032 190 28,838
168 28,226 15,154 13,072 124 7,294 6,282 41 6,883
176 29,703 15,645 14,058 129 6,977 6,600 38 5,540
222 43,471 20,362 23,109 137 6,865 7,645 75 10,459
9G 18,759 9,608 9,151 58 3,149 3,505 36 5,956
I-Villages with less than II-Villages with a population of 2,000-9,999 2,000 pop"lati"n-(condd.) ,----"- -..
1,000-1,999 2,000-4,999 5,000-9,999 .....__----.. ,..--- ,..--
No. Population Population Population
,...---"'---. No •. No.
Males FeOlales Males Females Males Females
15 16 17 .18 19 2. 21 22 23
1 722 319
722 319
II 12 13 14
27,892 23 6,924 7,147
5,862 3 977 928
4,832 8 2,406 2,257
12,012 10 3,038 3,452
5,136 2 503 510
III-Villages with a population of 10,000 and above
~----..
10,000 and above ,..-----"------..
No.
24
Population ,.--.-A------,
Males Females
25 26

9 A-SEBIBS
A-lV-Towns and Town Groups classified by Population in 1961 with Variation since 1941
Decade Percentage Name of Town Status of town Year Persons variation decade Males Females
variation
2 3 5 6 7 (j
Class VI-(Less than 5,000)
Uttar Kashi N.A. 1951 1,205 685 520 '
:\rea in Sq. miles 4.64/Sq. Km. 12·02'
1961 2.677 + 1,472 + 122·16 1,765 912


B-SERIES GENERAL ECONOMIC TABLES

<:: BNSOS TABIJ!.S 12
B-1 and B-II-Workers and Non-workers in District and Towns classified
WORKERS
r--------------------------------~ I II III
Total Population Total Workers As Cultivator As Agricultural In Mining, Labourer Quarrying, Live-
stock, Forestry, Age-group Fishing, Hunting
and Plantations, Orchards and allied activities
,_.----~--- r- r-~ ,-__.._---,
Persoll$ Males Females Males Females Males Females Males Females Males Females
2 3 4 5 6 7 8 9 10 11 12
District
TOTAL 122,836 62,534 60,302 43,563 41,186 33,820 39,691 4ft 321 2,098 81
0-14 39,004 20,088 18,916 2,809 4,288 2,282 3,935 34- 34 78 70
15-34 42,859 21,459 21,400 20,721 ·20,296 14,723 19,628 244 185 ',445 7
35-59 32,~B4 l7,191 15,493 16,947 14,5()1 14,()62 14, l()6 144 Ba 547 1:
60+ 8,252 3,773 .J.,479 3,083 2,097 2,752 :l,018 22 14 28
Age not stated 37 23 14 3 4 4
Rural
TOTAL 120,159 60,769 59,391'1 42,482 40,870 33,706 39,443 418 286 2,081 80 0-14 38,149 19,595 18,554 2,770 4,273 2,277 3,923 33 33 78 70
15-34 41,771 20,693 21,078 20,091 20,143 14,683 19,505 232 170 1,436 7 35-59 32,088 16,771 15,317 16,576 14,371 14,008 14,008 133 ~O 540 :3 60+ 8,114 3,687- 4,427 3,042 2,079 2,737 2,003 20 13 27 Age not stated 37 23 14 3 4 4
Urban
TOTAL 2,677 1,765 912 1,081 316 114 248 26 35 17 1
0-14 855 493 362 39 15 5 12
15-34 1,088 766 '322 630 153 40 123 12 15 9
35-59 596 420 176 371 130 54 98 II la 7
60+ 138 86 52 41 18 15 15 2
Age Dot stated

by Sex and Broad Age-groups
.._--.----~
At Houmehold In Manufacturing lndstry other than
Household Industry
13 B-SERIES
WORKERS ------------------ -----,
VI VII VIn IX X
In Construction In Trade and In Transport, In Other Services NON-WORKERS Commerce Storage and
Communications
,..-----"--...., r---........ -----,
Males Females Males Females Males Females Males Females Males Females Males Females Males Females
13 14 15 16 17 18 19 20 21 22 23 24 25 26
T"tai
1,306 977 161 8 2,64;0 402 9 209 1,983 99 18,971 19,116
225 245 6 83 - 4 2 4 93 2 17,279 14,128
769 .J.12 ~1 5 1,82~ 201 3 135 1,289 56 738 1,104
644 265 58 694 174 2 67 557 35 244 992
16tl 55 6 2 39 22 2 3 43 6 690 2,382
-1 20 10
Areas
1,717 961 107 7 2,50() 339 9 152 1,462 84 18,287 18,520
222 243 5 79 4 2 4 68 2 16,825 14,281
721 403 55 5 1,730 176 3 95 963 50 602 935
609 260 42 657 141 2 50 396 27 195 946
165 55 5 34 17 2 3 34, 5 645 2,348
20 10
Areas
89 16 54 1 140 63 57 521 15 684 596
3 2 4 25 454 347
48 9 36 94 25 40 326 6 136 169
35 5 16 37 33 17 161 8 49 46
3 5 5 9 45 34

C6NSUS TABLES 14"
B-1 and B-II-Workers and Non-workers in District and Towns classified
WORKERS ~----------~
I II III
- Tota I Population Total Workers As Cultivator As Agricultural In Mining, Labourer Quarrying, Live-
Age-group stock, Forestry, Fishing, Hunting, and Plantations, Orchards and allied activities
r- --"------, r----"---.. r---""'______' ,----"-~-.......
Persons Males Females Males Females Males Females Males Females Males Females
1 2 3 4 5 6 7 8 9 10 11 12
Uttar Kashi
'1'OTAL 2,677 1,765 912 1,081 316 114 248 26 35 17 1
0-14 855 493 362 39 IS 5 12
15-34 1,088 766 322 630 153 40 123 12 15 9
35-59 596 420 176 371 130 54 98 11 111 7
60+ 138 86 52 41 18 15 15 2
Age not stated

)5 B-SERIES
by Se~ aDd; Broacl Age-groups-Gondd.
WORKERS '- ._--------------------,
IV V VI VII VIII IX X
At Household In Manufacturing In Construction In Trade and In Transport, In Other Services NON-WORKERS Industry . other than Commerce Storage and
Household Communications Industry
......... ,-----"-.----, r---.-"'---., ~._,._.---. ,--_ -.. ..A----!.._. ~-.A-.~ ,.----...... _- ..... Males Females Males Females Males Females Males Females Males Females Males Females Male~ Females
13 14 15 16 17 18 19 20 21 22 23 24 25 26
N. A.
89 16 54 1 140 63 57 521 15 68! 596
3 2 4 25 454 347
48 9 36 94 25 40 326 6 136 169
35 5 16 37 33 17 161 8 49 46
3 5 5 9 1 45 34

CENSUS TABLES
Educational Levels
Total
Illiterate
Literate WIthout educational level
Primary 01 Junior Basic
High School or Higher Secondary
Technical diploma not equal to degree
Non-technical diploma not equal to degree
University de::(ree Or post-graduate degree other than technical degree
Technical degree or diploma equal to degree graduate degree
or post-
Engineering
Medicine
AgricultUre
Veterinary and D<\iryin~
Technology
Teaching
Otber1
•
Total PopUlation of ·Workers and Non
workers
16
B-III-Part A-Industrial Classification of
Educational Levels in
WORKERS
------_._---------------------'
As Cultivator
II
Ai Agricultural
Labourer
III
In Mining, Quarrying, Livestock, Forestry, Fishing, Hunting and Plantations, OrchaIds and allied activiites
IV
At Household Industry
--"-------._ ,___.,.._____, r-~ ,----J.,_~ -,---..A. __ ~ Persons Males Females Males Females Males Females Males Females Males Females
2 3 4 5 6 7 8 9 10 II 12
2,677 .1,755 912 114 248 26 35 17 1 89 16
l,i51 515 636 36 202 22 35 2 24 15
706 546 160 51 35 4 4 41
533 444 89 22 11 5 22 j
214 195 19 5 3 2
2 2
63 56 7 2 P.!
7 6
2 2
4 3

Workers and Non-workers by Urban Areas only
V
In Manufacturing other than House
hold Industry
--r----"'----~
Males Females
13 14
54 1
16
23
7
7
VI
In Construction
,---~""__-~
Males Females
15 16
140
40
26
23
40
8
2
2
WORKERS
VII
In Trade and Commerce
,-----"----,
Males Females
17 18
63
3
33
14
13
17
VIII
In Transport, Storage and
Communications
r----_,_-~
Males Females
19 20
57
22
22
8
4
IX
In Other Services
,.--__._---.
Males Females
21 22
521 15
96 7
151
130 4
98 3
42
1
3
X
NON-WORKERS
,....---"---.
Males Females
23 24
684 596
254 376
191 124
213 73
23 16
3 7

CENSUS 'tABLES 18
B-1 II-Part B-Industrial Classification of Educational Levels ia
WORKERS
r-- ---~
I II III IV
Total Population of As Cultivator As Agricultural In Mining, At Household Educational Levels Workers and Labourer Quarrying, Live- Iodustry
Non-workers stock, Forestry Fishing, Hunting and Plantations,
Orchards and allied activities
-, ,.---A--_, ,---"---, ,.....- ,.--~
Persons Males Females Males Females Male!! Females Males Females Males Females
1 2 3 4 5 6 7 8 9 10 11 12
District
Total 120,159 60,769 59,390 33,706 39,443 418 286 2,081 80 1,717 961
Illiterate 102,544 44,057 58,487 25,022 39,018 335 279 1,23l 78 1,305 943
Literate (without educa-tionallevel) 12,012 11,372 640 6,622 304 76 7 395 2 304 7
Primary or Junior Basic 5,009 4,766 243 2,032 120 7 :H7 105 11
High School and above 594 574 20 30 108 3
Puraula
Total 28,226 15,154 13,072 8,810 8,817 167 132 788 4 235 41
Illiterate 24,772 11,924 12,848 7,199 8,752 167 132 551 4 195 37 Literate (without educa-tionallevel) 2,526 2,377_ 149 I, ~07 41 103 3:1 2
Primary or Junior Basic 795 726 69 298 24 107 6 2
High School and above 133 127 6 6 27
Rajgarbi
Total. 29,703 15,645 14,058 9,515 9,209 95 25 145 1 413 168
Illiterate 25,367 11,537 13,830 7,203 9,131 70 18 51 332 165 Literate (without educa-
tional level) 2,829 2,670 159 1,684 59 18 7 26 58
Primary or Junior Basic 1,348 1,288 60 621 18 7 56 27 2
High School and above 159 150 9 7 12

19 B-SBlUES
Workers and Non-workers by Rural Areas only
WORKERS I ':-------- ...---."-__ ...-._-------,
V VI VII VIII IX X
In Manufacturing In Construction In Trade and In Transport, In Other Services NON-WORKERS other than Commerce Storage and Household Communications lndustry
r---"A---... r-~----' ,---"----, ,-~ ..-- ---, , '
Males Females Males Females Males Fem~les Males Females Males Females Males Females
13 14 15 16 17 18 19 20 21 22 23 24
Rural
107 7 2,500 339 9 152 1,462 84 18,287 18,520
6+ 4 1,578 63 7 93 421 66 13,945 18,{)92
32 2 561 147 26 305 3 2,90+ 314
II 265 109 25 461 11 1,404 99
96 20 8 275 4 34 1.5
Tansil
19 634 103 1 76 319 31 3,943 4,046
13 474 19 63 140 22 3,103 3,901
4 123 46 7 71 683 104
2 31 33 5 91 6 153 37
6 5 77 2 4 4
Tahsil
37 4 832 89 2 30 351 12 4,133 4,631
22 4 504 19 14 99 9 3,223 4,501
13 189 31 7 54 590 92
2 98 30 5 127 315 38
41 9 4 71 2 5 6

CENSUS '1'ABLK~
Educational Levels
1
Total
Illiterate
Literate (without educa-tional level)
Primary or Junior Basic
High School and above
Total
Illiterate -
., Literate (without edutllt-t ional level)
primary or Junior Basic
:Kigh School and above
Total Population of Workers and Non-workers
,-----_ .......
20
1
As Cultivator
B-Ill-Part B-Industrial Classification of
Educational Levels in
II
As Agricultural Labourer
WORKERS
III
In Mining, Q}larrying, Livestock, :Forestry,
Fishing, Hunting and Plantations,
Orchards and allied activities
IV
. At Household Industry
Persons Males Females Males Feni.al~ Males Females Males. Females Males Females
2 3 4 5 6 7 8 9 10 11 12
Dunda
43,471 20,362 23,109 10,615 15,332 146 129 499 74 866 651 37,564 14,688 22,876 7,759 15,113 88 129 269 72 640 642
3,65oJ: 3,496 158 2,022 150 58 121 2 162 3 2,123 2,048 75 822 69 79 63 6
130 130 12 3f}
Bhatwari
111,759 9,603 9,151 4,766 6,C8S 10 649 1 198 101 14,841 5,908 8,933 2,861 6,022 10 360 138 89 3,003 2,829 174 1,609 54 145 51 1
743 704 39 291 9 105 9 172 167 5 5 39

'Vi orkers an,d Non-workers by
Rural Areas only-Concld. WORKERS
~,--------------.------------~---------
V
"In Manufacturing other than Household
Industry
-A..__......,
Males Females
13 14
Tahsil
24 2
14
7 2
3
'Tahsil
27 1
15
8
4
VI
In Construction
,----"-----,
Males Females
15 16
468
286
94
82
6
566
314
155
54
43
VII
In TfaPeand Comlnerce
,-_""____"'"
Males Females
17 18
108 6
23 6
38
42
5
39
2
32
4
21
,---------------------~
r-
VIII
In Transp~rt, Storage and
Communications
Males Females
19 20
29
9
6
13
17
7
6
2
2
IX
In Other Services
...... Males Females
21 22
374 30
101 29
54
151
68
358 • 11
81 6
126
92 4
59
B-SERIES ,
X
NON-WORKERS
,..--..J.-
Males Females
23 24
7,233 6,885
5,499 6,885
934
793
7
2,978 2,952
2,120 2,805
697 118
143 24
18 5

CENSUS TABLES 22
B-IV-Part A-Industrial Classification by Sex and Class of Worker of Persons at Work at Household Industry
Branch of Industry Division and Major Group of
1. s. 1. c. ~
ALL DIVISIONS
Division O-Agriculture, Livestock, Forestry, Fishing and Hunting
Major Group 04-Livestock and hunting
Divisions 2 & 3-Manufacturing
Major~ Group 20-Foodstufl's
Total Rural Urban
2
T
R
u
T
R
T
R
R
u
R
U
Total -'----.
Males Fem~les
3 4
1,806 977
1,717 961
89 16
630 521
630 521
521
630 521
1,176 456
1,087 440
89 16
70 9
43 9
27
Employee Others -"-----, r--_..A.. -_.--,
Males Females Males Females
5 6 7 8
57 9 1,749 968
47 9 1,670 952
10 79 16
32 2 598 519
32 2 598 519
32 2 598 519
32 2 598 . 519
25 7 1,151 449
15 7 1,072 433
10 79 16
8 62 9
3 40 9
5 22

23 . B-SERIES
B-IV-Part A-Industrial Classification by Sex and Class of Worker of Persons at Work at Household Industry-Contd.
Total Employee Others .----"--____ .-__ ..A.. __ ..,... r---'-
Branch of Industry Total Division and Major Group of Rural Males
I. S. I. C. Urban Females Males Females Males Females
2 3 4 5 6 7 8
Major Groups 23-;-Textile-cotton T 26 36 26 35 .. R 25 34 25 33
U 2
24-Textile-jute T 3 3
3 3
25-Textile-wool T 185 lSI 2 183 151
R 172 141 2 170 141
U 13 10 13 10
27-Textile-miscellaneous T 402 149 5 6 397 143
R 383 146 2 6 381 140
U 19 3 3 16 3
28-Manufacture of wood and T 153 54 2 151 5,!-'
wooden products R 146 54 2 144 54
U 7 --- 7

CENSUS TABLES 24
I!-IV-Part A-Inustrial Classification by Sex and Class of Worker of Persons at Work at Household Industry-Coneld.
Branch of Indus!ry Division and Major Group of
1. S. I. C.
Major Groups 31-Leather and leather products
32-Rubber, petroleum and coal products
34-35-Non-metallic mineral products other than petroleum and coal
36-Basic metals and their products except ll!'achinery and transport eqUIpment
39-Miscellaneous Manufac-turing Industries
Total Rural Urban
2
T
R
u
T
U
T
R
T
R
U
T
R
U
1. S. I. C.-Indian standard Industrial Classification
Total ,..--_ ...... _ ......
Males Females
4
63 22 .. 59 22
9 4
9 4
182 27
174 27
8
83 3
73 3
10
Employee Others ,.--,.A.., __ --.. ,.,.-_ __.JI"", ___ ....
Males Females Males Females
5 6 7 8
62 22
58 22
4
9 4
9 4
5 177 27
3 171 27
2 6
2 81 .3
2 71 3
10

25 B-SERIES
- B-IV-Part A-Industrial.Cla.,!sification by Sex and Class of Worker of Persons at Work a t Household Indus~y by Tahsils (Rural only) ..
Total Employee Others
Branch of Indust~y ,-___ ..A-____ ,
,----"----, ,-- --'-- ---, Males Female$ Males Females Males Females
Division of 1. S. 1. C.
:! .) 4 5 6 7
District Rural
Total 1,717 961 47 9 1,670 952
iDivisions O-Agriculture, Livestock, Forestry, Fishing and 630 521 32 2 598 519 Hunting
2 & 3-Manufacturing 1,087 440 ~15 7 -1,072 433
Puraula Tahsil
Total 235 41 15 4 22.0 37
-Divisions O-Agriculture, Livestock, forestry, Fishing and 86 21 11 75 20 Hunting
2 &' 3-Manufacturing 149 20 4 3 145 17
Rajgarhi Tahsil
Total 418 168 21 397 168
Divisions O-Agriculture, Livestock, Forestry, Fishing and 249 131 17 232 131 Hunting
2 & 3-Manufacturing 169 37 4 165 37
Dunda Tahsil
Total 866 651 7 4 859 647
Divisions O-Agriculture, Livestock, Forestry, Fishing and 260 351 260 351 Hunting
2 & 3-Manufacturing 606 300 7 4 599 296
Bhatwari Tahsil
Total 198 101 4 1 194 100
Dh'isions O-Agriculture, Livestock, Forestry, Fishing and 35 18. 4 31 17 Hunting
2 & 3-Manufacturing 163 83 163 83
1. S. I. C.-Indian Standard Industrial Classification

CENSUS TABLES 26
.B-IV-Part B-Industrial Classification by Sex and Class of WOfker, of Persons at Work in NODhousehold Industry, Trade, Business, Profes!,ion or Service
Branch oflndustry Division and Majol Group oj
1. S. 1. C.
ALL DIVISIONS
Division a-Agriculture, Livestock, Foreslry, Fishing and Hunting
Major Groups OO-Field produce and plantatIOn ClOpS
02-Fotestry and logging
03-Fishing
04-Livestock and hun-ting
Division I-Mining and Quarrying
Major Group 10-Mining and quarrying
L ivisions 2 & 3-Manufacturing
Total Urban
2
T
11
T
U
T
U
T
U
T
U
T
U
T
U
T
U
T
U
Total Employer Employee Single Worker Family Worke. r-'--"'--_' ,---A-~ ,-__ ..A...-_.... ,..--...A. __ -.
'Males Females. Males Females Males Females Males Females Males Female>
3
7,493
852 1
2,093
16
92
7
1,892
7
2
107
5
1
5
161
54
4·
197
17
81
1
8
72
8
1
5
392
24
28
3
4
2
23
26
2
6 7
3 6,500
735
1,969
13
84
5
1,833
6
2
50
3
1
3
85
43
8
55
17
8
1
5
2
2
1
9
545
88
84
4
35
45
2
2
42
9
10
121
59
3
56
6
56
5
12
11
8
12
18
14
14

27 B-SBRllIS
B-IV-Part B-Industrial Classification by Sex and Class of Worker of Persons at Work in Non-" household Industry, ,Trade, "Business, Profession or Service-Contd.
Branch of Industry Division and Major Group of
I. S. I. C
Major Groups 20-Foodstuffs
23-.Jfextile-cotton
25-Textile-wool
27-Textile-millcellaneous
28-Manufacture of wood and wooden products
31-Leather and leather products
33-Chemicals and chemical products
36-Basic metals and their pro-ducts except machinery and transport equipment
37-Machinery (all kinds other than transport) and elec-trical equipment
Total Urban
2
T
U
T
U
T
U
T
U
T
U
T
U
T
U
T
U
T
U
,
Total Employer Employee Single Worker ~ ,--~ ,---"-~
Males Females Males Females Males Females Males Females
3
19
5
4
3
4
23
Z
58
37
11
2
2
19
4 5 6
5
2 5
9
7
12
3
3
3
3
8
2
36
29
2
2
11
8 9
2
10
19
7
7
10
2
4
Family Worker ~--~
Males Females
II 12
1
2

CENSUS TABLES 28
B-IV-Part B-Industrial Classification by Sex and Class of Worker of Persons at Work in Nonhousehold Industry, T~ade. Business, Profession or Service-Contd.
Branch of Industry DiviSIOn and Major Group of
1. S. 1. C.
Major Groups 38-Transport equipment
39-Miscellar.eous manufac-turing Industries
Division 4-Construction
Major Group 40-Construction
Division 5-Electricity, Gas, Water S,:nitary Services
and
Major Group 51-Water supply and sani-tary services
Division 6-Trade and Commerce
Major Groups 60-63-Wholesale trade
64-68-Retai1 trade
Total Urban
2
T
U
T
U
T
U
T
U
T
U'-
T
U
T
U
T
U
T
U
Total Employer Employee Single Worker Family Worker ,.--.A-_........ ,.-___.IIro..____. r--_.A.--. ,-__ .A. __ -...
Males Fema\es Males Females Males Fcmales Males Fertlales Males Females
3
19
2
2,640
140
2,640
140
22
19
22
19
402
63
4
3
397
60
4
3
3
3
3
9
."
9
5
4
122
9
122
9
161
7
161
7
6
3
3
7
7
2,413
108
2,413
108
13
10
13
13
156
48
4
3
151
45
8
... \,
3
3
3
3
9
3
100
_ 23
100
23
9
9
9
9
60
6
60
6
10
2
2
II
, ...
5
5
5
25
2
25
2
12
4

'29 B-SERIES
B-IV-Part B-Industrial Classification by Sex and Class of Worker of Persons at Work iu Nonhousehold Industry) Trade) Business, Profession or Service-Contd.
Branch of Industry -Division and Major Group of
I. S.1. c.
MajorUroup 69-Trade and commerce miscellaneous
Division 7-Transport, Storage and Com-trlfnication
Major Groups 70-71-Transport
72-Storage and warehousing
73-Cornmunicadon
-Division 8-Services
Majar Groups 80':__Public services ,
8l-Educational and Scienti-fic set vices
Majur Group 28-Medical and' Health s~rvi ces
Total Urban
2
T
U
T
U
T
U
T
U
T
U
T
u
T
U
T
U
u
-Total r---"----,
Males
3
209
57
161
47
5
2
43
8
1,938
499
542
249
379
4,
150
34
Females
4
96
12
15
8
Employer ,.----"----,
Males
:>
4
2
2
50
1
2
2
3
Females
6
Employee ,.---...... __,
Males
7
157
47
111
39
3
43
8
1,685
462
542
249
373
40
144
33
Females
8
42
12
15
8
13
Smgle Worker Family Worker ,.--_--"----, ,.---....____, Males Females Males Females
9 10 11 12
47 1
8
47
8
198 54 5
33 3
6
6
3

CBNSUS TA'BLBS 30
B~IV~Part B-Industrial Classification by Sex and Class of Worker of Persons at Work in Nonhousehold Industry, Trade, Business, Profession or Service-Condd.
Branch of Industry Division and Major Group of
. 1. S. 1. c.
Major Groups 83-Religious and Welfare services
84-Legal services
85-Business services
8C-Community services and trade and labour associations
87-Recreation services
8S-Personal services
89-Services (not elsewhere classified)
Divi$ion 9-Activities not adequately described
Major Group 9O-Activities unspecified and not adequately described including new entrants to the labour market
Total Employer Employee Single Worker Family Worker r----"-----., r---.A.----, r----"---___ ,---"---...,., r----"---,,",",
Total Urban Males Female. Males Females Males Females Males Females Males Females
2 3 4 5 6 7 8 9 10 11 12
T 47 5 29 17 5
U 12 12
T 10 9
U 7 7
T 39 39
U
T 91 3 ':11 3
U 3 3
T 1I0 45 34 5 75 40
U 2 2
T 484 8 45 399 6 35 2 5
U 123 2 117 2 2 3
T 86 7 25 61 7
U 24 24
T 23 1 19 3
U 3 3
T 23 19 3
U 3 3
I. S. I. C.":"'Imlian Standard Industrial ClasJijication

31 B-SBRIBS
B-IV-Part B-Industrial Classification by Sex and Class of Worker of Persons at Work in Non-household Industry, Trade, Business, Profession or Service by Tahsils (Rural only)
i1ranch of industry Division of 1. S. 1. C.
ALL DIVISIONS
Ulvisions O-Agriculture, Livestock, Forestry, Fishing and Hunting
I-Mining and Quarrying
2 & 3-Manufacturing
4-Construction
5-Electricity, Gas, Water and Sanitary Services
6-Trade and Commerce
7-Transport, Storage and Communi-cation
8-Services
9-Activities not adequately described
ALL DIVISIONS
Divisions O-Agriculture, Livestock, Forestry, Fishing and Bunting
I-Mining and Quarrying
2 & 3-Manufacturing
4-Construction
5-Electricity, Gas, Water and Sanitary Services
6-Trade and Commerce
7-Transport, Storage and Communi-cation
a-Services
Y-Activities not adequately described
Total Employer Employee Single Worker Family Worker ~~ ~~ r---_..A..._-...... ,-__ .A.-__ --. r----"----,
Males Females Males Females Males Females Males Females Males Females
2 4 5 6 7 8 9 10 11
District Rural
6,641 180 • 368 3 5,755 .38 "157 121 51 la
2,077 80 25 1,9)6 7 8t 59 12 14
4: 2 2
107 7 ·2+ 42 33 6 8
2,500 113 2,305 77 5
3 3
339 9 15~ 3 108 54 2 ·23 4
152 2 110 39
1,439 84 49 1,223 30 165 54 2
20 16 3
Pura1lla Tahsil
1,999 36 101 1 1,008 20 84 15 6
788 4 11 772 4: 4
19 5 8 5
634: 20 607 7
103 58 41 2 2
76 50 26
363 31 7 316 16 38 15 2
61 14 2

CBNSUS TABLES 32
B-IV-Part B-Industrial ClassificatioD by Sex and Class of Worker of Persons at Work in Non-household . Industry, Trade, Business, Profession or Service by Tab-slls (Ruralonly)-Contd.
Total Employer E[lIployee Single Worker Family Worker
Branch of Industry r---..A.--, ~ r---"---.. r---.A--------....
DivisIOn of Males Females Males Females 1. S. 1. C.
Males Females Males Females Males Female.
2 '3 4 5 6 7 8 9 10 II
Rajgarbi Tahsil
ALL DIVISIONS 1,48t 19 118 2 1,294 6 71 11
Divisions O-Agriculture, Livestock, Forestry, Fishing 141 1 5 1'36
and Hunting
I-Mining and Q).tarrying 4 2 2
2 & 3-Manufacturing 37 4 14 11 12 4
4-Construction 832 36 790 6
5-Electricity, Gas, Water and Sanitary Services
6-Trade and Commerce 89 2 38 2 42 8
7-Transport, Storage and Comrnuni- 30 29 '"
cation
8-Services 349 12 24 282 6 43 6
9-Activities not adequately described
Duuda Tahsil
ALL DIVISIONS 1,502 112 88 1,210 5 170 89 34 18
Divisions O-Agriculture, Livestock, Forestry, Fishina '
and Hunting " 499 74 449 2 38 58 11 14
I-Mining and Quarrying
2 & 3-Manufacturing 24 2 2 11 8 3
4-ConstructiOJl 4(j8 28 392 43 5
5-Electricity, Gas, Water and Samtary Services
6-Trade and Commerce 108 6 47 21 25 2 15 4
7-Transport, Storage and Communi- 29 .,. 20 8 cation
8-Services 372 30 9 316 2 47 28
9-Activities not adequately' described 2

B-SElI.IEI
. B-IV-Part B-Industrial Classification by Sex and Class of Worker of Persons at Work in Non-household Industry, Trade, Business, Profession or Service by Tahsils (Rural only)-CJncLd.
Branch of Industry DIvISIOn of I. S. I. C.
ALL DIVJSIONS
Divisions -O-Agriculture, Livestock, Forestry, Fishing and H untiIJ,g
I-Mining and Quarrying
2&3-Manufacturing
4-Construction
5-Electricity, Gas, Water and Sanitary Services
6-Trade and Commerce
7-Transport, Storage and Communi-cation
8-Services
9-Activities not adequately described
Total Employer Employee Single Worker Family Worker ,--..A.. __ -,' ,-__ ..A----. ~~ ,-- ,-__ .A-__ .....
Males Females Males Females Males Females Males Females Males Females
2 3 4 5 6 7 8 9 10 11
Bhatwari Tahsil
1,656 13 61 1,453 7 132 6 10
649 8 599 42
27 3 12 8 4
566 29 516 21
2 2
39 11 4 19 5
17 II 5
355 II 9 309 6 37 5
I. S. I. C.-Indian Standard Industrial Classification.

CBN~Us TABLES
Diviswn o
Major Group 00
Minor Groups 005
006
008
009
Major Group 02
Minor Groups 020
021
022
023
024
025
026
.Major Group 03
Minor Group 031
Major Group 04
Minor Groups 040
041
34
B-IV~Part C-Industrial Classification by Sex and Divisions, Major Groups
Branch of Industry Division, Major GIOUp and Minor Group of I. S. 1. C.
ALL DIVISIONS
Agriculture, Livestock, Forestry, Fishing and Hunting
Field Produce and Plantalion ~rops
Production of other crop~ (including vegetables)
Production of fruits and nuts in plantation, vines and orchards
Production of juice by tappins palms
Production of other agricultural produce (including fruits and nuts not vJ\T~red by code number 006 and flowers)
Forestry and Logging
Planting, replanting and conservation of forests
Felling and cutting of trees and transportation of logs
Preparation of timber
Prodmction of fuel including charcoal by exploitation of forest
Total .---------- -'
Total ,.......--~--~
Persons Males Female:;
2
10,473
3,325
93
20
62
5
6
1,900
438
999
388
30
3
9,299
2,723
92
20
62
5
5
1,892
437
999
382
4
1,174
602
8
6
Production of fodder by exploitation of forests 5
Production of gums, resins, lac, b:nks, herbs, wild fruits and leaves by the exploitatio n of forest~ 29
30
5
28
II
2
2
Production and gathering of other forest products not c')vered above
Fishing
Production offish by fishing in inland waters including the operation of fish farms and fish hatcheries
Livestock and Hunting
Production and rearing of livestock (large heads only) mainly for milk and animal power such as cow, buffalo, goat .
Rearing of sheep and production of wool
11
2
2
1,330
1,235
94
737
662
74
592
573
20
048 Production of other animal husbandry produets such as skin, bone, ivory and teeth
Division 1
Major Group 10
Minor Group 107
Divisions 2 & 3
Major Group 20
Mit;or Groups 200
Mining and Quarrying
Mining and Quarrying
Quarrying of stone (including slate), clay, sand, gravel, limestone
Manufacturing
Foodstuffs
Production of rice, atta, flour, etc. by milling dehusking and processing of crops and foodgrains
20 I Production of sugar and syrup from sugarcane in mills
203 Production of fruit products; such as jam, jelly, sauce and canning and preservation offruits
5
5
5
1,801
9il
48
2
5
5
5
1,337
89
39
2
464
9
9

35 B-SERIE
and Minor Groups of Persons at Work other than Cultivation
Workers Workers at Household Industry Workers in Non-household Industry, etc. Branch of Industry
--- ~ r-- ~-----. Division, Major Group
and Minor Group of
Urban Total Urban Total Urban I. S. I. C. ,-___ .Jo-____ ~
~__..___., ,____.,.._-----.., ,.- -, r----"----.
Persons Males Females Males Females Males Females Males Females Males Females
5 6 7 8 9 10 11 12 13 14 15
974 941 33 1.806 977 89 16 7,493 197 852 17 ALL DIVISIONS
17 16 1 630 521 2,093 81 16 1 Diuision 0
8 7 , .. 92 7 -I Major Grou~ 00
20 Minor Groups 005
2 2 62 2 006
5 008
I) 5 5 5 009
7 7 1,892 8 7 Major Group 02
437 I Minor Groups 020
999 021
382 6 022
30 023
" 5 .024
28 025
7 7 II 7 026
2 Major Group 03
2 Minor Group 031
630 521 107 72 Major Group 04-
574 501 88 72 Minor Groups 040
56 20 18 041
048
5 1 Division 1
5 Major Group 10
5 Minor Group 107
160 143 17 1,176 456 89 16 161 8 54 Divisions 2 & 3
32- 32 70 9 27 19 9 Major Groups 20
32 9 7 Minor Group 200
201
2 203

CBNSUS'tABLRS 36
B-IV-Part C-Industrial Classification hy Sex and Divisions, Major Groups
Branch of Industry T,otal -...J
DivislOn, Major Group and Mmor Group of I. S. I. C. Total
r-----, --"---- ---, Persons Males Females
2 3 4
Minor Groups 204 Slaughtering, preservation of meat and fish and canning of fish 2 2
205 Production of bread, biscuits; cake and other bakery products
Major Group
Minor Groups
Major Group
Minor Groups
Major Group
209
23
230
231
233
235
236
24
241
244
25
Minor Groups 251
Major Group
Minor Groups
Major Group
Minor Groups
Major Group
Minor Groups
253
255
27
271
272
273
28
281
282
284
288
289
31
310
311
Production of other food products such as sweetmeat and condiments muri murki, 'chira, khoi, cocoa, chocolate, toffee, lozenge "
Tel.'tile-Cotton
Cotton ginning, cleaning, pressing and baling
Cotton spinning (other than in mills)
Cotton dyeing, bleaching
Cotton weavlOg in handlooms
Manufacturing of khadi textile in handlooms
Textile-Jute
Jute spmning and weaving
Manufacture of other products like rope, cordage from jute and similar fibre such as hemp, mesta
Textile-Wool
Wool cleaning and processing (scouring)
Wool spinning other than in mills
Wool weaving in handloom
Textile-Miscellaneous ... Manufacture of hosiery and other knitted fahrics and garments
Embroidery and making of crepe lace and fringes
Making of textile garments including raincoats and headgear
Manufacture of Wood and Wooden Products
Manufacture of wooden furniture and fixtures
Manufacture of structural wooden goods (including treated timber) such as beams, posts, doors, windows
Manufacture of other wooden products such as utensils, toys artwares
Manufacture of materials from cork, bamboo, cane, leaves and other allied products
Manuf~cture of other wood and allied products not covered above
Leather and Leather Products
Currying, tanning and finishing of hides and skins and preparation of finished leather
Manufacture (Jf shoes and other leather footwear
44
66
29
5
30
3
2
341
4
~38
9
576
2
1
573
265
53
79
116
16
100
18
74
312 Manufacture (except footweal) of clothing and wearing apparel made of leather and fur
313
314
Manufacture of leather products (eJ{cept those covered by code Nos. 311, 312) such as 3 leather upholstery, sUltcases, Focket books, cigarette and key cases, purses, saddlery, whip and other atticles
Repair of shoes and other leather footwear 4
44
30
5
3
20
3
189
118
70
425
425
211
51
79
65
15
74
11
58
2
2
36
24
2
10
152
3
120
2~
151
2
148
54
2
51
26
7
16
2

37 B-SBRlES
and Minor Groups of Persons at Work other than Cultivation-Contd. I
Workers Workers at Household Industry Workers in Non-household Industry, etc. Branch of Industry "'- __.__
--. DIVIsIOn, Major Group
Urban Total Urban Total Urban and Minor Group of
1. s. 1. c . r- ,---~ ...----"-----. ,...---..-" ,.--Persons Males Females Males Females Males Females Males Females Males Females
5 6 7 8 9 IO 11 12 13 14- 15
2 Minor Groups 204
205
29 29 37 26 7 3 209
6 4 2 26 36 2 4 3 Major Group 23
Minor Groups 230
2 :l 4 24 2 231
~ 2 233
2 2 18 10 2 2 235
I 236
3 Major Group 24 ... ~ Minol' Groups 241
2 244
24- 14 10 185 151 13 10 Ij, Major Group 25
1 3 Minor Groups 251
23 13 10 U8 120 13 II:! 253
67 28 3 255
24 21 3 402 149 19 3 :i.3 L 2 Major Group 27
2 Minor Groups 271
272
24 21 3 402 146 19 3 23 2 2 273
~4 44 153 54 7 58 37 Major Group 28
12 12 34 2 17 12 Minor Groups 281
23 23 50 7 29 16 282
284
63 51 2 288
9 9 6 9 9 289
4 4 63 22 4 11 4 Major Group 31
5 11 2 Minor Groups 310
2 2 58 16 2 311
312
2 313
2 2 2 2 314

CENSUS TABLES 38
B-IV-Part C-Industrial Classification by Sex and Divisions, Major Groups
Major Group 32
Minor Group 322
Major Group 33
Minor Group 335
Major Groups 34-35
Minor Group 350
Major Group 36
Minor Groups 360
362
365
368
Branch of Industry Division, Major Group and Minor GrouP of I. S. I. C.
Rubber, Petroleum and Coal Products
Manufacture of rubber goods used for industrial purpose
Chemicals and Chemical Products
Manufacture of medicines, pharmaceutical preparations, perfumes, cosmetics and other toilet preparations except soap
Non-metallic Mineral Products other than PetlOleum and Coal
MaIllufacture of earthenware and earthen pottery
Basic Metals and their Products except Machinery and Transport Equipment
Manufacture of iron and steel including smelting, refining, rolling, conversion into basic forms such as billets, blooms, tubes, rods
Manufacture of armaments
Manufacture of brass and bell metal product,
Enamelling, galvanising, plating (including electroplating) polishing and welding of metal products
Total r- -------------- --'
Total ,- ...., Persons Males Females
2
3
3
13
13
228
5
4
34
3
3
2
2
9
9
201
5
4
29
3
4
4
4
27
5
369 Manufacture of sundry hardwares such as G. I. pipe, wire net, bolt, screw, bucket, 182 cutlery (This will also include the manufacture of sundry ferrous engineering products done by jobbing engineering concerns which cannot be classified in major gl oups 36, 37,
160 22
38 and 39)
Major Group 37 Machinery (All kinds other than Transport) and Electrical equipment
Minor Group 378 Manufacture of electronic equipment such as radio, microphone
Major Group 38 Transport Equipment
Mino. Group 388 Repairing of bicycles and tricycles
Major Group 39
Minor Group 393
Diuision 4
Major Group 40
Minor Groups 400
401
402
403
Division 5
Major Group 51
Minor Group 511
Miscellaneous Manufacturing Industries
Manufacture of jewellery, silverware and wares using gold and other precious metals
Construction
Construction
Construction and maintenance of buildings including erection, fiooring, decorative con-structions, electrical and sanitary installations
Construction and maintenance of roads, railways, bridges, tunnels
Construction and maintenance of telegraph and telephone lines
Construction and maintenance of water ways and water reservoirs such as bund, embankments, dam, canal, tank, tubewells, wells
Electricity, Gas, Water and Sanitary Services
Water Supply and Sanitary Services
Garbage and sewage disposal, operation of drainage system and all other .types of work connected with public health and sanitation
105
105
2,640
2,640
392
, 2,115
3
130
25
25
25
102
102
2,640
2,640
392
2,115
3
130
22
22
22
3
3
3
3
3

39 B-SEBIBS
and Minor Groups of Persons at Work other than Cultivation-Con/d.
Worked
Urban ...------"- ----. Persons Males Females
5 6 7
3 2
3 2
8 8
5 5
3 3
... \
12 12
12 12
140 140
140 140
36 36
104 104
22 19 3
22 19 3
22 19 3
Workers at Household Industry
Total
Males Females
8 9
9 4
9 4
182 27
5
4
22 5
2
149 22
83 3
83 '3
Urban r---..A-... ~
Males Females
10 11
I
8
5
3
10
10
Workers in Nor.-household Industry, etc. Branch of Industry ...------_..A-_____ --. Total
r---'""'----, Males Females
12 13
2
2
19
7
11
19
19
2,640.
2,640
392
2,115
'3
130
J!2 3
22 3
22 :3
Urban ...--__ .A-__ --.
Males Females
14 15
2
2
2
2
140
140
36
104
19 3
19 3
19 3
Division, Major Group and Minor Group of
I. S. 1. C.
-!Major Group 32
Minor Group 32!
Major Group 33
Minor Group 335
Major Groups 34-3~
Minor.Group 350
Major Group 36
Minor Groups 360
362
365
368
369'
Major Group 37
Minor Group 378 Major Group 38
Minor Group 388
Major Group 39
Minor Group 393 .
Division 4
Major Group 40
Minor Groups 400
40}
402
403
Division 5
Maior Group 51
Minor Group 511

CENSUS TABLBB 40
B-IV-Part C-llidustrial Classification by Sex and Divis~ons, Major Grollps
Dillision 6
Major Group 60-63
Minor Groups 600
621
630
Major Group 64-68
Minor Groups 640
Major Group
Minor Group
Division
641
644
645
646
647
648
650
651
652
662
685
686
688-
689
69
690
7
Branch of Industry Division, Major Group and Minor Group of I. S. I. C.
Trade and Commerce
Wholesale Trade
Wholesale tradiag in cereals and pulses
Wholesale trading m wood, bamboo, cane, thatches and similar products
Wholesale trading in paper and other stationery goods
Retail Trade
Retail trading in cereals, pulses, vegetables, fruits, sugar, spices, oil, fish, dairy products, eggs, poultry
Retail trading in beverages such as tea (leal), coffee (seed and powder), aerated water
Retail trading in tobacco, bidi, cigarettes and other tobacco products
Retail trading in fuel such as coke, coal, firewood and k<;rosene
Retail trading in foodstuffi like sweetmeat condiments, cakes, biscuits, etc.
Retail trading in animals
Retail trading in straw and fodder
Retail trading in fibres, yarns, dhotl, saree, readymade garments of cotton, wool, silk and other textiles and hosiery products; (this includes retail trading in piecegoods of cotton, wool, silk and other textiles) ,
Retail trading in toilet goods, perfumes and cosmetics
Retail trading in medicines and chemicals
Retail trading in metal, porcelain and glass utensils
Retail trading in scientific, medical and surgical instruments
Retail trading in precious stones and jewellery
Book-selling
Retail trading in goods unspecified I
Trade and Commerc~ Miscellaneous
Importing and exporting of goods and commodities,
Transport, Storage and Communication
Major Group 70-71 Transport
Minor Groups 700 ' Transporting by railways
701 Transporting by tramway and bus service
702 Transporting by motor vehicles (other than omnibus)
703 Transporting by road through other means of transport such as hackney carriage, bullock cart, ekka
704 Animal traasporting b) animals such as horses, elephant, mule, camel
705 Transporti~g by man such as carrying of luggage, hand cart driving, rickshaw pulling, cycle rickshaw driving
,709 Transportmg by other means not covered above
Total
Total r----J.--__,._--~----.
Persons Males Females
411
4
2
406
153
4
2
7
4
11
2
69
28
3
3
2
2
17
99
209
161
12
:'I
19
73
52
2
402
4
2
397
153
4
2
7
4
10
2
69
23
3
2
2
2
17
97
209
161
12
3
19
73
52
3 4
9
9
5
2

41 B-SERIES
and Minor Groups of Persons at Work other than Cultivation-Contd. I
WorkeIS ~
Persons
5
63
3
2
60
17
2
2
4
9
6
2
17
57
47
4
3
22
17
Urban ..... Males
6
63
3
2
60
17
2
2
4
9
6
2
17
57
47
4
3
22
17
--.
Females
7
Workers at Household Industry r------~
Total Urban ~ r--__A,..~---.
Males Females Males Females
8 9 10 11
Workers in Non-household Industry, etc. Branch of Industry Division, Major Group and Minor Group of
Total Urban I. S. I. C . r----.,...,.,_________ ,-----..A---.,
Males Females Males Females
12
402
4
2
397
153
4
2
7
4
10
2
69
23
3
2
2
2
17
13
9
9
5
97 2
209
161
12
3
19
73
52
14
63
3
2
60
17
2
2
4
9
6
2
17
57
47
4
3
22
17
15
Dillision 6
Major Group 60-63
Minor GIOUpS 600 .
621
630
Major Group 64-68
Minor Groups 640
Major Group
Minor Group
Dillmon
641
644
645
646
647
648
650
651
652
662
685
686
688
689
69
690
7
Major Group 70-71
Minor Groups 700
701
702
703
704
705
709

CENSUS TAB:t;JI.S
Major Group 72
Minor Groups 720
722
Major Group 73
Minor Groups 730
732
Division 8
Major Group 80
Minor Groups 803
804
805
809
Major Group 81
Minor Groul's 810
l:lll
42
B-IV -Part C-Industrial Classification by Sex and Divisions, Major Groups
Branch of Industry Division, Major Group and Minor Group of I. S. I. C.
Storage and Ware Housing
Operation of storage such as ware-houses
Operation of storage of other type
Communication
Postal, telegraphic, wireless and signal communications
Information and broadcasting
Services
Public Services
Public service in Police
Public service in administrative departments and offices of Central Government
Public service in administrative departments and offices of quasi-government organisation, municipalities, local boards, etc.
Public service in administrative departments and offices of State Governments
Educll.tional and Scientific Services
Educational ser\'lces such as those rendered by techmcal colleges, technical schools and SImIlar tecbmcal and vocatIonal mstitutions
Educational serVIces such as those rendered by colleges, schools and similar other institutions of non-techhIcal type
Total ,-----------'
Total ,----_ ....... ,---- -' Persons Males Females
2
:>
2
3
4'3
41
2
2,034
542
255
15
5
267
394
65
328
3
5
2
3
43
41
2
1,938
542
255
15
5
267
379
65
313
4
96
15
15
812 Scientific serVIces and research instItutions not capable of classification under any
Major Group 82
Minor Groups 820
821
Major Group 83
Minor Groups 830
831
832
Major Group 8-1-
Minor Group 840
Major Group 85
Minor Groups 5!;O
851
Major Group 86
mdIvldual gIOUp
Medical and Health Services
Public health and medical services rendered by organisations and individuals such as . by hospitals, sanatoria, nursing homes, maternity and child welfare clinic as also by hakimi, unani, ayurvedic. allopathic and homeopathic practitioners
Veterinary services rendered by organisations and individuals
Religious and Welfare SerVICes
Religious services rendered hy religious organisations and their establishments maintained for worship or promotion of religious activities, this includes missions, ashrams and other allied organisations
Religious and allied services rendered by pandit, priest, preceptor, fakIr, monk
\""elfare services rendered by OIganisations of'erating on a non-profit basis for the promotion of weifale of the commuDIty such as relief societies, red-cross organisation for the collection and allocation of contributions for charity
163
147
16
52
24
26
2
Legal Services 10
Legal services rendered by barrister, ad"ocate, solicitor, mukhtiar, pleader, mukurie, munshi 10
Business Services 39
Engineering selvices rendered by professional organisations or individuals 7
Business services rendered by organisatIOns of accountants, auditoIs, book-keepers or like 32 individuals
Community Services and Trade and Labour Associations 94
150
134
16
47
19
26
2
10
10
39
7
32
9J
i3
13
5
5
3

43 B-SEIUBS
and MiDor Gro1lps of Persons at Work other than C1l1tivation-Contd.
Workers Workers at Household Industry Workel1l in Non-household Industry,etc. Bra nch of Industry Divlsion, Major Group
Urban Total Urban Total Urban and Minor Group of
1. S. 1. C. ~ ....... _------. ..... r--__"'__~ ,-----.....____, ~ Pe.gollS Males Females Males Females Males Females Males Females Males Females
5 6 7 8 9 10 11 12 13 14: 15
2 2 5 2 Major Group 72
2 Minor Groups 720
2 2 3 2 722 8 8 43 8 Major Group 73
6 (, 41 6 Minor Groups 730
2 2 2 2 732
511 499 12 1,938 96 499 12 Di.ision 8
:',49 249 5.j.2 249 Major Group 80 146 146 255 146 Minor Groups 803
4 4 15 4 804
5 805
98 98 267 98 806 54 46 8 379 15 46 8 Ma]or Group 81
65 Minor Groups'BIO
54 46 8 313 15 46 B 811
812
34 S~ 150 13 ~H Major Group 82
3u 30 134 13 30 Minor G coups 320
-} 4- 16 4 821
1:.: n: 47 5 12 MajcrGroup 83
". 5 19 5 5 Minor Groups 830
6 6 26 6 831
2 832
7 7 10 Major Group B4
i 7 10 7 Minor Group 840
39 Major Group 85
7 Minor GroUpll 850
32 851
3 3 91 3 3 Major Group 86

CBNSUS 'l'ABLBI
Minor Groups 860
861
862
Major Group 87
Minor Group 872
Major Group 88
Minor GroupS' 880
881
882
883
884
Major Group 89
Minor Group 890
Division, 9
Major Group 90
Minor Group 900
44
B-IV-Part C-Industrial ClassificatioD by Sex and DivisioDs, Major Groups
Total Branch oflndustry r---------__ .-_--'
Division, Major Group and Minor Group of I. S. I. C. Total r------"'----__ __
Persons
1 2
Services rendered by trade associations ,chambers of commerce, trade unions and similar 3 other organisati ons
Services rendered by civic, social, cultural, political and fraternal organisations such as 2 rate payers association, club; library
Community services such as those rendered by public libraries, museums, botanical and 89 zoological gardens, etc.
Recreation Services 155
Recreation services rendered by organisations and individuals such as those of theatres, 155 opera companies, ballet and dancing parties, musicians, exhibitions, circus, carnivals
Personal Services 492
Services rendered to households such as those by qomestic servants, cooks
Services rendered to households such as those by governess, tutor, private secretary
Services rendered by hotels, boarding houses, eating houses, cafes, restaurants and similar other organisations to plovide lodging and boarding facilities
Laundry services rendeled by organisations and individoals, this includes all types of c1eamng, dyeing, bleaching, dry cleaning, services
Hair dressing, other services rendered by organisation and individuals such as those by barber, hairdressing saloon and beauty shops
Services (not elsewhere classified)
Services rendered by organisations or individuals not elsewhere classified
Activities not adequately described
Activities unspecified and not adequately described,_{this includes new entrants to the labour market)
Activities unspecified, and not ~dequately described including activities of such individuals who fall to prOVIde sufficient information about their industrial affiliation to enable them to be classified
304
3
159
7
19
93
93
23
23
23
Males
3
3
88
llO
110
484
298
3
159
6
18
86
86
23
23
23
Females
4
2
45
45
8
6
7
---------------------I. S. I. C.-Indian Standard Industrial Classification

45
and Minor Groups of Persons at Work other thaD Cultivation-Gondd.
'Workers Workers at Household Industry '''___
Urban Total Urban ,---"----.. ........
Persons Males Females Males Females Males Females
5 6 7 8 9 10 11
3 3
3 1 2
3 2
125 123 2
73 71 2
38 38
6 6
7 7
24 24
24 24
3 3
3 3
3 3
Workers in Non-household Industry, etc. Branch of Industry
Total r----"'----, Males F eIll31es
12 13
3
!
88
llO 45
110 45
484 S
298 6
3
159
6
IS
86 7
86 7
23
23
23
Urban
Division, Major Croup and Minor Group of
I.~. 1. C. ,---'--......., Males Females
14 15
Minor Groups 860
861
3 862
2 Major Group 87
2 Minor Group 872
123 2 Major Group 88
71 2 Minor Groups 880
881
31'1 882':'::
6 883
7 884
24 Major Group 89
24 Minor Group 890
J Division ~
S Major Group 90-
Minor Group gol)
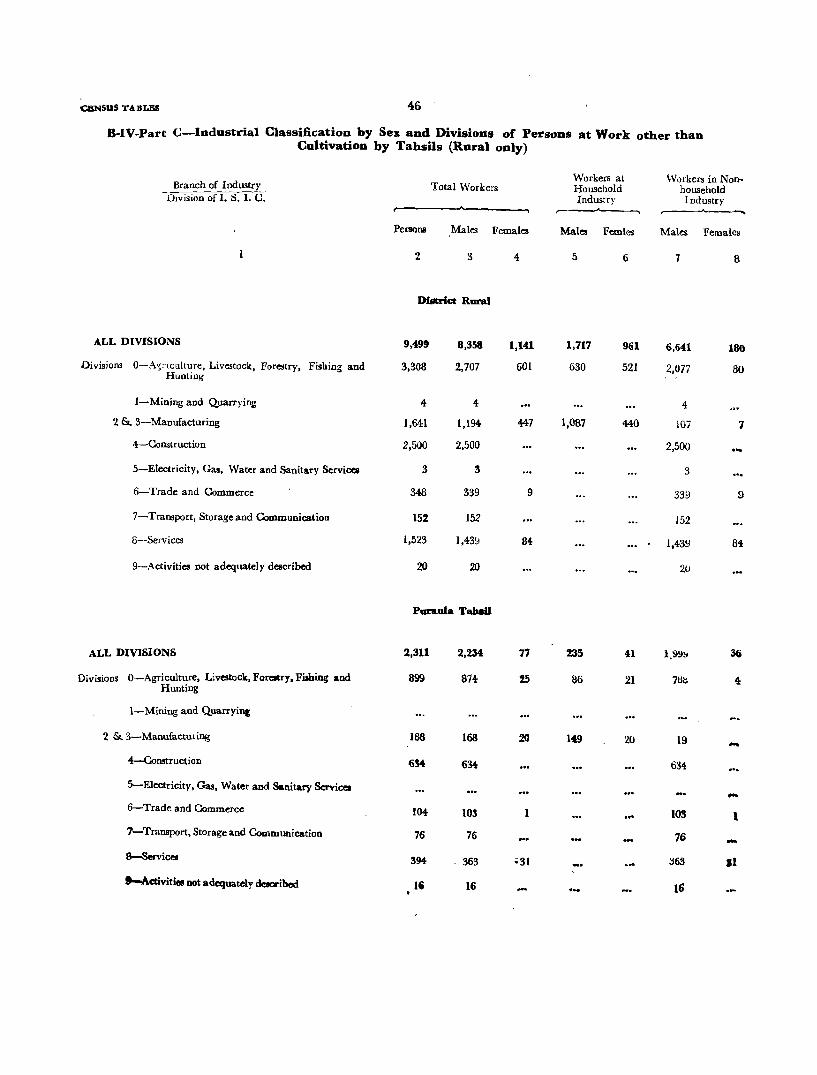
QlNSUS 'l'ABLBII 46
B-IV-Part C-Industrial Classification b)' Sex and DivisioDs of Persons at Work other than Cultivation b)' Tahsils (Rural onl)')
Branch of Industry DIvision of 1. S. I. C.
ALL DIVISIONS
Divisions O-A~nclliture, Livestock, Forestry, Fishing and Hunting
I-Mining and Quarrying
2 &. 3-Manufacturing
4-Construction
5-Electricity, Gas, Water and Sanitary Service.
6-Trade and Commerce
7-Transport, Storage and Communication
8-Services
9-Activities not adequately described
ALL DIVISIONS
Divisions O-Agriculture, Livestock, Foreltry. FiJbing and Hunting
I-Mining and QuarrYinc
2 & 3-Manufacturing
4-Constructioll
5-Electricity, Gas, Water and Sanitary Services
6-Trade and Commerce
1-Transport, Storage and Colllmunication
8-Services
t-Activities not adequately described
'Iota I Workers
Persolll Males Females
2 3 4
District Rural
9,499
3,308
4
1,64:1
2,500
3
348
15%
1,523
20
8.358
2.707
4
1,194
2,500
3
339
152
1,43~
20
Paraala TaMil
2.311
899
188
104
76
394
16
2.234
874
168
634
103
76
363
16
1,141
601
447
9
84
77
%5
·31
Workers at Household Industry
Males Fernles
5 6
1,717
630
1,087
235
86
1~9
._
961
521
41
21
20
Workers in Nonhousehold Industry
,------..A ...
Males Females
7 8
6,641
2,077
4
lV7
2,500
3
339
152
1,439
2u
7Bo
19
634
103
76
::l63
16
180
80
7
9
84
4
--I
-,I

47 B-SBllIBS
B-IV-Part C-Industrial Classification, by Sex and Divisions of Jlersons at Work other tbilln Cultivation by Tahsils (R~ral only)-Contd.
Workers at Workers in Non-Branch of Industry Total Workers Household Household
Division of 1. S. I. C. Industry Industry ,,----.A. ---. ~ Persons Males Females Males Females Males Females
2 3 4 5 6 7 8
Rajgarhi Tahsil
.ALL DIVISIONS 2,089 1,902 187 418 168 1,484 19
Divisions O-Agriculture, Livestock, Forestry, Fishing and 522 390 132 249 131 141 Hunting
I-Mining and Quarrying 4 4- 4
2 & 3-Manufactunng 247 206 41 169 37 37 4
4-Construction 832 832 832 I
5-Electricity, Gas, Water and Sanitary Services
6,t Trade and Commerce 91 89 2 89 2 .. # '_I
7-Transport, Storage and Corumunicatioll 30 30 30
&-Services 361 349 12 349 12
9-Activities not ad.equ!!tely described
Dunda Tahsil
ALL DIVISIONS 3,131 2,368 763 866 651 1,502 112
'-Divisions O-Agriculture, Livestock, Forestry, Fishing and 1,184 759 425 260 351 499 74 Hunting
I-Mining and Quarrying ,
2 & 3-Manufacturing 932 630 302 606 300 24 2
4--Construction 468 468 468
5-Electricity, Gas, Water and Sanitary Services ,
6 6-Trade and Commerce 114- 108 6 108
7-Transport, Storage and Communicatioll 29 29 29
8--Services 402 372 30 372 30
'9-Activities not adequately described 2 2 2

CBNSUS TAB~BS 48
B-IV-Part C-Industrial Classification by Sex and Divisions of Persons at Work other th.an Cultivation by Tahsils (Rural only)-Concld.
Branch of Industry DivisIOn of I. S. I. C.
ALL DIVISIONS
Divisions O-Agricultu.re, Livestock, Forestry, Fishing and ,Huntmg
I-~ining and QjJarryiog·
2 & 3-Manufacturing
4-Construction
5-Electricity, Gas, Water and Sanitary Services
6-Trade and Commerce
7-Transport, Storage and Communication
8-Services
9-Activities oot adequately described
1. S. I. C.-Indian Stan~ard Industrial Classifieatioll.
Total Workers
Persons Males
2 3
Bhatwari Tahsil
1,968
703
274
566
2
39
17
366
1,854
684
190
566
2
39
17
355
Females
4,
114
19
84
II
Workers at Workers in Non-Household household
Industry Industry ,---.....__-, ,--_,.__ ..... Males Females Males Females.
5 6 7 8
198 101 1,656 13
35 18 649
- ... -163 83 27
566
2
39
17 -. 355 11
}:

49 B-SaBIJ$S
B-V-Occupational Classification by Sex ot Persons at Work other than Cultivation
Total Workers Total Workers Division. Group ,- Division, Group ,-~-and FamHy of Total Urban and Family of Total Urban
N.C.O. ,...---__,_-~ ---. N.C.O. ,- ,--~ Persons Males FeD;lales Persons Males Females Category Persons Males Females Persons Males Females. Categpry
2 3 4 5 6 7 2 3 4 5 6' 7
ALL DIVISIONS, FaD;lily 003 Electrical Engineers
ToQif 10.473 9,299 1,174 974 941 33 To~al
III 2,179 . 2,098 81 18 17 1 . VIII -
.IV 2,783 1,806 977 105 89 16 FaD;lily ()07 Surveyors
V '169 161 8 55 S4 1 Total 4 4 •
VI 2,640 2,640 140 140
63 VI 2 2 2 2 VII 411 402 9 63
vm 209 209 5'1 ;''1 IX 2 2 2 2
IX 2,082 1,983 99 536 521 15 Famlly OO::J Architects, Engineers and Surveyors, n. e. c.
Division 0 Professional, Technical and Related Workers Total 2 2 2 2
V 2 2 2 2 Total 836 757 79 149 . 138 11
GROUP 01 CHEMISTS, PHYSICISTS, GEOLOGISTS AND "III 5 5 3 3 OTHER PHYSICAL SCIENTISTS
V 2 2 2 2 Total
vi 57 57 24 24 VII #
Vll 2 2 Family 011 Pharmaceutical Chemists
'!IJ1l 1 TOtal
IX 769 690 79 120 109 11 VII . 1
GROUP 00 ARcHITECTS, ENGINEERS AND SURVEYORS GROUP 02 BIOLOGISTS. VETERINARIANS AGRONO-MISTS AND RELATED SCIENTISTS
Tot'al 59 59 21 21 Total 8 I; 6 6
V 2 2 2 2 ~II 5 5 3 3
VI 49 49 19 19 IX ·3 3 3 3 VlIl ;1
IX 7 7 Family 021 Veterinarians
Total 2 2 2 2
family 001 Civil Engineers (mcluding o,_verseers) IX 2 2 2 2
Total 52 52 17 17 Family (123
VI 47 47 17 17 Total 5 5 \ ........ 3 3 ... IX 5 5·
III 5 ~ a· 5

CBNSUS TABLES 50
'B-V-Occupational Classification by Sex of Persons at Work other than, Cultivation-Contd.
Divisio{l, Group llnd Family of
N.C.O. Category
Family 029
Total
IX
-GROUP 03
Total
IX
Family 030
To:al
Ix
Family 031
Tota1
IX
Family 032
Total
IX
Family 033
'Total
IX
-QROUP04
1'otal
IX
,Family,~
Total.
IX
Total Workers . ,..---______ '. __ ..A., ___ _
Total Urban
Persons Males Females Persons Males Females
• 2 3 4 5 6 7
Biologlsts, Veterinarians, Agronomists and Related Scientists, n. e. c.
PHYSICIANS, SURGEONS AND I?ENTISTS
45 44 9 8
45 44 9 8
Physicians and Surgeons, Allopathic
9 8 6 5
9 8 ·6 5
Physicians, Ayurvedic
33 33 ~ 3
33 33 3 3
Physicians, Homeopathic
2 2
2 2
Physicians, 'Others
NURSES, PHARMACISTS AND OrHER MEDICAL AND HEAL11I TECHNICIANI)
101 87 14 24 23
101 87 14 24 23
Nurses
24 20 4:
~ 20 4: t I
Division, Group and Family of
N.C.O. Category
Family_041
Total
IX
Family 042
Total
IX -Family 043
rotal
IX
Family 044
Total
IX
Family 046
Total
IX'
Family 049
Total
IX
GROUP 05
Total
IX
Family 051
Total
IX
Total Workers
Total
..A.~ ________ __
Urban r------ ... -"-- r----,--......._ ......... Persons Males Females P6rsons Males Felllalei
2 3 4 5 6 7
Midwives and Health Visitors
2 2
2 2
Nursing Attendants and Related Workers
47 39 8 15 15
47 39 8 15 l~ ,
Pharmacists and Pharmaceutical Technicians
13 13 3 3
13 13 3 3
Vaccinators
7 7 2 2
7 7 2 ~
Sanitation Technicians
7 7 2 2
7 7 2' 2
Medical and Health Technicialll. cluding Laboratory Assistants)
D. c. c. (ex-
1
1 -~CHERS
394 379 15 Sf 46 8
394 379 15 54 t6 8
Teachers, Secondary Schools
24 24 23 23
24 24 23 23

51 B-sBRIBll
B-V-Occupati-onal Classification by Sex of Persons at Work other than CuitivatiQD-Contd.
.lJivision, Group and Family of
. N.q.O. Category
Family 052
Total
IX
Family 0~9
Total
IX
,GROUP 06
Total
IX
Family 061
. Total
IX
Family 062
Total
.IX
Family 069
Total
IX
GROUP 07
Total
VII
IX
Totai Workers r-'--------.A.. ______ ---, Division, Group Urban and Family of Total
---------'-------, N. C. O . Persons Males Females Persons Males Females Category
2 3 4 6 7
Teachers, Middle and Primary Schools
248 235 13 28
248 235 13 28
Teachers, n. e. c.
122 120 ,2 3
122 120 2 3
'" JURISTS
18 18 9
18 18 9
Legal Practitioners and Advisers
7 7 5
7 7 5
La w Assistants
-i! 2 2
2 2 2
20
20
3
9
9
5
5
2
2
Jurists and Legal Technicia~, n. c. c. (including Petition Writers) •
9
9
9
9
2
2
2
2
SOCIAL SCIENTISTS ANP RELATED WOR·KERS
6 6
5 5
8
8
Family 071
Total
VII
IX
GROUP 08
Total
IX
Family 083
Total
IX
FamIly 086
Total
IX
Family 087
Total
IX
GROU£> 09
Total
VJ
IX
Family 090
Total
VI
Total Workers
Total Urban .----"------.... ,---__,.._._---.
Persons Males Females Persons Males Females
2 3 5 6
Acr.ountants and AuditOrs
6 6
5 5
ARTISTS,. WRITERS AND RELATED WORKERS
120
120
71
71
49
49
2
2
~inters, Decorators and. Commercial 1rtists
Musicians and Related Worketi-
113
67
67
, 46
46
Dancers and Related Workers
6
6
3
3
3
3
DRAUGHTSMEN AND SCIENCE AND ENGINEERING TEQHNlCIANS. N. E. b.
9 9 5 5
8 8 5 5
Draughtsmen
B 8 5 5
8 8 5 5
1
1
7

~NSUS 1'AB'foB8 52
B-V-OCGupational Classifi.cation by Sell: of Persons at Work other than Cultivation-CoRtd.
Division. Group and Family of
N. C. O. Category
Family 099
Total
IX
GROUP OX
Total
IX
Total
IX
FamilyOXI
Total
IX
Family OX2
Total
IX
FamilyOX3
Total
IX
amilyOX9
IX
Total Work.ers ~---------------~----------------~
Total Urban
Persons Males Females Persons Males Females
2 3 4 5 6
Science and Engineering Technicians. n. e. c.
OTHER PROFESSIONAL. TECHNICAL AND RELATED WORKERS
75 75 18 18
75 75 IB 18
Ordained Religious Workers
50 50 5 5
50 50 5 5
Non-ordained Religious Workers
20 20 11 11
20 20 11 11
Astrologers, Palmists and Related Workers
3 3
3 3
Librarians. Archivists and Related Workers
1
7
Other ProfesSional. Technical and Related Wor~ kers. n. e. c.
Total Workers Division, Group r---------.... -.--_____ , ..
and Family of Total Urban N. C. O. .... ,--.A. _____ __.
Category
Division 1
Total
III
IV
v
VI
VIl
VIll
IX
GROUP 10
Total
III
VI
VIII
IX
Family 100
Total
IX
Family 101
Total
JII
VI
VIII
IX
Persons Males FemaJes Persons Males Fema.les,
-2 3 4 5 6 7
Administrative. Exec;tive and Managerial Workers
478 470 8 60 ,59 I
26 26
4 4
9 9 2-
179 179 2lJ 20
2 2
2 2 I 1
256 252 4 37 36 1
ADMINISTRATORS AND EXECUTIVE OFFICIALS. GOVERNMENT
198
10
11
176
194
10
11
172
Administrators Government
10 lO
10 10 ,
4 24 23
4 24 23
and Executive Officials, Central
Administrators and Executive Officials, State. Government
94 93 20 19
10 10
11 II
12 71 20 19

53
B-V--Occllpational Classifie,tion by Sez or Per.on. at Wo:rk other than Cultivation-Cantd.
Division, Group and Family of
N.C.O. Ca.tekory
Family 102
Total
IX
'Family 103
Total
IX
Family 104
Totil
IX
GROUP 11
Total
VII
Family 111
Total
VII
GR.oUP 13
Total
III
IV
V
VI
VIII
IX
Total Workers r---Total Urban
r--
Persons Males Females Persons Males Females
2 3 4 5 6 7
Administrators and· Executive .officials, Local Bodies
1
Administrators and Executive .offi$!ials, Q)lui~ GovernrnCIlt
2 2
2 2
Village Officials
91 88 3 3 3
91 88 3, :r 3
DIRECTORS AND MANAGERS, WHOLE· SALE AND R~TAIL TRADE
2 2
2 2
£hrectols and Managers, Retail Trade
2 2
2 , 2
DlREGrORS, MANAGERS AND WORKING PROPRIET.oRS, .oTHER
278 274 4 36 36
16 16
4 4
9 9 2 2
168 168 20 20
80 80 13 13
Division, Group and Family of
N.C • .o. Category
Family 130
Total
III
Family 131
Total
VI
Family 133
Total
IV
V
Family 134
Total
VIII
Family 135
Total
IX
Family 136
Total
IX
Total Worken ""'"-
Total Urban ,_ £
~ Persons Males Feinales Persons Males Females
2 3 4 5 6 7
Directors, Managers and Working Proprietors Mining, Quarrying and Well Drilling
Hi 16
16 16
Directors, Managers and Working Proprietors. Construction
168 168
168 168
20
20
20
20
Directors, Managers and Working Proprietors. Manufacturinl:
13 9 2 2
2 2
Directors, Managers and Working Proprietors. Transport and Communication
Directors, Managers and Working Proprietors, :Recreation, EntertainmCIlt and Catering Services
77 77 10 10
77 77 10 10
Directors, Manacers and Working Proprietors. Other Servic:ea '
3 3 3 3
3 3 3 3

CISNSUS 'I'ABLJ!S 5" s: V -Occupational Classification by Sex of Per.ons at Work other than Cultivation-Contd . •
Total Workers Total Workers Division, Group
,.--___ ---.A..-Division; Group ,-- --.
and Family of Total Urban and Family of Total Urban N.C.O. r--~ N.C.O. -'--
"--~ Category Persons Males Females Persons Males FemaleB Category Persons Males Females Persons Males Females
2 3 4 5 6 7 .1 2 3 4 5 6 7
Division 2 Clerical and Related Workers Family 201 Cashiers
Total 583 583 139 139 Total 2 2 2 2
III 171 171 3 3 IX % 2 2 2
V 1 1 Family 202 Ticket ~ellers, Ticket Inspectors including Ushers
129 129 37 37 and. TIcket Collectors (excludina those 0 . VI movIng transport) '" n
VII 10 10 2 2 Total 6 6 3 3
VIll 10 10 7 7 VIII 4 4 2 2
,x_ 262 262 90 90 IX 2 2
GROUP 21 STENOGRAPHERS AND TYPISTS GROUP 20 BOOK-KEEPERS AND CASHIERS
Total 31 37 10. 10
Total 64 64: 17 17 III 3 3
III 19 19 VI 17 17 4 4
V 1 VIII
2 2 -IX 16 16 5 5 VI 7 7
VII 8 8 Family 210 Stenographers
VIII 4 4 2 2 Total 4- 4 2 2
IX 25 25 13 13 VI 2 2
Family 200 Book-keepers, -Book-keeping and Accounts Clet:ks IX 2 2
Total 56 56 12 12
Family 211 Typists III 19 19
V Total 33 33 8 8
III 3 3 VI 7 7 2 2
VI 15 15 3 3 VII 8 8 VIII
IX 21 21 10 10 IX 14- 14 4 4

55 B-SERIES
B-V-Occupational Classification by Sell: of Persons at Work other than Cultivation-Contd.
Total Workers Division. Group .---------..._-----------. Division, Group and Family of 1'otal Urban and Family of
N. C. O. ~----"----..... , .. '------. N. C. O. Category Persons Males Females Persons Males Females
2 3 5 6 7
GROUP 22 OFFICE MACHINE OPERATORS
Total 2 2 2 2
VI 2 2 2 2
Family 229 Office Machine Operators. n. e. c.
Total 2 2 2 2
VI 2 2 2.
{}ROUP28 CLERICAL WORKERS, MISCELLANEOUS
Total 307 307 69 69
III 131 131 3 3
VI 78 78 22 22
VII 2. 2 2 2
VIII 3 3 3 3
IX 93 93 39 39
Family 280 General and other Ministerial Assistants and Clerks
Total 210 210 31 31
III 79 79
VI 52 52
IX 79 79 31 31
Category
Family 289
Total
III
VI
VII
VIII
IX
GROUP 29
Total
III
VI
VIII
IX
Family 290
Total
III
VI
VIII
IX
DivisiDn 3
Total
VII
Total Workers
Total Urban
Persons Males Females Persons Males Females
2 3 4: 5 6 7
Miscellaneous Office Workers including RecordKeepers, Muharrers, Despatcherll, Packers and Binders of Office Papers
97
52
26
2
3
14
97
52
26
2
3
14
38
3
22
2
3
8
UNSKILLED OFFICE WORKERS
173 173 41
18 18
25 25 7
2 2
128 128 33
38
3
22
2
3
8
41
7
1
33 .....
Office Attendants including Peons, Messengers. Ushers, Hall Porters, DUrWallS, etc., n. e. c.
173 173
18 18
25 25
128 128
Salu Workers
397
397
388
388
9
9
41 41
7 7
1 1
33 33
61 61
61 61

CBNSUS TDLBS 56
B-V_Occupational Classification by Sex of Persons at Work other than Cultivation-Contd.
Division, Group and Family of
N. C.O. Category
GROUP 30
Total
VII
Family 300
Total
VII
Family 301
Total
VII
GROUP 32
Total
VII
Family 321
Total
VII
GROUP 33
Total
VII
Family 330
Total
VII
Total Workers r-------------.--~-------------~ Urban Total
Persons Males Females Persons Mak$· Females
2 3 4 5 6 7
WORKING PROPRIETORS, WHOLESALE AND RETAIL TRADE
285 9 55 55
294 285 9 55 55
Working Proprietors, Wholesale Trade
2 2
2 2
Working Proprietors, Retail Trade
292
292
283
283
9
9
54
54
54
54
COMMERCIAL TRAVELLERS AND MANU· FACTURERS' AGENTS
2 2
2 2
Ma.nufacturers' Agents
2 2
2 2 ... SALESMEN, SHOP ASSISTANTS AND RELAED .WORKERS
97 97 6 6
97 97 6
Salesmen and Shop Assistants, Wholesale and Retail Trade
89 89 6 6
89 89 6 6
Total Workers Division, Group r---------------"'-------- ------'~.
Total Urban and Family of N. C. O. Category
Family 331
Total
VII
GROUP 34
Total
VII
Family 340
Total
VII
Dillision 4
Total
III
IV
VIlI
IX
GROUP 40
Total
III
IV
Family 402
Total
III
.-----"--------. r-- --'--_--""
Persons Males Females Persons Males Females.
2 3 5 6 7
Hawkers, Pedlars and Street Vendors
8 8
8 8.
MONEY-LENDERS AND PAWN-BROKERS
4
4
Money-lenders (including Indigenous Bankers)
4
Farmers, Fisiurm,n, Hunters, Loggers and Relat,d Workers
·3,074 2,450 624 9
1,821 1,743 78 9
1,250 704 546
2 2
1 1
FARMERS AND FARM MANAGERS
1,082
24
1,058
650
22
628
432
2
430
2
2
8
8
Farm Managers, Inspectors and Overseers
12 12 .~.
12 12
1
1
-

57 }-: 1 I< J:e.
B--V-Occupatiooal Classification by Sea of Person. at Work other ~ CqltivatioD--Gontd.
Division, Group and Family of
N.C.O. Category
I
F.amily 404
Total
III
'IV
GROUP 41
Total
III
IV
VIII
IX
Family 410
Total
III
Family 411
Total
III
IV
Family 412
Total
III
VIII
IX
Family 413
Total
III
Total Workers --.
Total Urban ....._..--.
Persons Males Females Persons M~ks F~es
2 3 4 5 6 7
Farmers and Farm Managers. Animals. Birds and IIlSOCIS Rearing
·1,070 638 432 2
12 10 2 2
1,058 628 430
;FARM WORJ_{ERS
452 264 188 4
258 186 72 4
191 7::' 116
2 2
Farm Machinery Operators
26 26
26 26
FarlIl Workers, Animals. Birds and Insects Rearing
346 162 184
159 87 72
187 75 112
Gardeners (malis)
62 62 4 4
59 !l9 4 4
2 2
1
Tappers (Palm, Rubber trees etc.
4 4
4 4
Division. Group and Family of
N.C.O. Category
1
Family 415
Total
III
f~ily 419
Total
III
IV
GROUP 43
Total
III
Family 439
Total
III
GROUP 44
Total
III
IV
Family 440
Total
III
Family 441
Total
III
Total Workers r----------,----___ ~ ____ __ Total Urban
.-----"------.." ,.-----"-_.-----Persons Males Females Persons Males Females
2 3 5 6
Plantation Labourers
3 3
3 3
farm Workers, n. e. c.
11 7
7 7
FISHERMEN AND RJ!.I.,AT~D WORKERS
I
Fishermen and Related Workers. n. e. c.
1 1
7
LOGGERS AND OTHER FORESTRY WORKERS
1.539 1,535 2 2
1,538 1,534 2 2
Ie
Forest Rangers and Related Workers
139 139
139 139
Harvesters and Gatherers 01 forest Products including Lac (e:l<cept Logs)
38 38
38 38

CENSUS T .ABLBS 58
B-V-Occupational Classification by Sex of Persons at Work other than Cultivation-Contd.
Division, Group and Family of
N.C.O. Category
Family 442
'Total
III
Family 443
Total
III
IV·<
Family 449
Total
III
Division 5
Total
III
GROUP 50
Total
III
Family 502
Total
III
Diflision 6
T~tal "_ --- - --~ ,---'-
III
VI
FIll
IX
Total Workers
Total Urban ~,------~------~ Persons·. -Males Females' - Persons Males Females
2 3 4 5 6 7
Log Fellers and Wood Cutten
443 439
443 439
Charcoal Burners and forest Product Proccessers
22 22
21 21
Loggers and Other Forestry Workers, n. e. c.
897
897
897
897
Miners, Qu~rr)T1IIn and R,lated Worl;lr,
1
1
I
I
I
I
MINERS AND·QUARRYMEN
1
Drillers, Mines and Q,larrica
1
1
I
1
1
1
Workers in Transport and Communication Occupation$
194· . .~194 38 38
31 31 1 I
5 5 2 2
138 138 30 30
20 26 5 6 I
Division, Group and Family of
N.C.O. Category
GROUP 64
Total
VIII
IX
Family 641
Total
VIII
IX
Family 643
Total
VIn
Family 649
Total
VIII
GROUP 66
Total
VIIl
Family 660
Total
VIII
Total Workers
Total Urban r------~----_, . --. Persons Males Females Persons Males Females
2 3 4 5 6 7
DRIVERS, ROAD TRANSPORT
101 101 29 29
99 99 27 27
2 2 2 2
Motor Vehicle and Motor Cycle Drivers
5 5 3 3
3 3
2 2 2 2
Animal Drawn Vehicle Drivers
93 93 23 23
93 93 23 23
Drivers, Road Transport, n. c. c. (including Palki and Doli Bearers)
3 3 , ... 3 3
3 3
INSPECTORS, SUPERVISORS, TRAFFIC CONTROLLERS AND DESPATCHERS. TRANSPORT
Inspectors, Supervisors and Station Masters
1 1

59 B-6:BB.IBS
B-V-Occupational Classification by Ses of Persons at Work other than C:ultivation-Contd.
Total Workers .'Division, Group .and Family of Total Urban
Division, Group and Family of
N. C. O. ____ --..... --.---.. r-----~~---~~_, N.C.O. Category Persons Males Females Persons Males Femalea
2 3 4 5 6 7
'GROUP 68 POSTMEN AND MESSENGERS Family 693
~ Total 80 80 9 9 Total
III 31 31 1 VIIi
VI 5· ' - ,- .5, -2 ·2 Divirion 7-8
VIII,· 26 26 3 3 Total
IX 18 18 3 3 III
IV
'Family 680 Po"tmen V
Total 24 24 3 3 VI
VIII 24 24 3 3 VIlI
IX
Family 681 Messengers (including Dak Peons)
GROUP 70
'" Total 56 56 6 6
_III 31 31 Total
·VI 5 5 2 2 IV
, VIII 2 2 V
I,X 18 18 3 3 Family 700
GROUP 69 WORKERS IN TRANSPORT AND COMMU-NICATION OCCUPATIONS, N. E. C.
Total
IV
'Total 12 12
VIII 12 12 V
Family 702
Family 690 Ticket Sellers and Ticket Inspectors including Ushers and Ticket Collectors on Moving Transport Total
Tota! IV
VIII V
Total Workers
Total Urban
Persons Males Females Persons Males F.emalcs
2 3 4 5 6 7
Inspectors, Traffic Controllers and Despatchers, Communication
11 11
11 11
Craftsmen, Production Process Workers and Labourers. nol dsewher, classified
4,161 3,716 . 445 276 259 17
28 25 3
1,529 1,102 427 105 89 16
157 149 8 51 50 1
2,251 2,251 52 52
54 54 18 18
142 135 7 50 SO
SPINNERS, WEAVERS, KNITTERS, DYERS AND RELATED WORKERS
340 171 169 33 16 17
::,331 164 167 30 14 16
9 7 2 3 2 I
Fibre Preparers, Ginners, Cleaners, Seourers, etc.
20 14
19 5 14
Spinners, Piecers and Winders
172 57 115 12 12
171 57 114 11 11
1 1

CENSUS TABLES 60
B-V-Occupational Classifictions by Ses: of Persons at Work other tbap Cultivation-Cont~.
Total Workers Total Workers Division, Group Division. Group and Family of Total Urban and Family of Total Urban
N.C.O. ,- r-- N. C. O. .....-----'----, ,-
Category Person. Males Females Persons Males Females Category Persons Males Females Persons Males Females·
2 3 4 5 6 7 2 3 4 5 6 7
Family 704 Drawers and Weavers Family 715 SeweJ'S. Embroiderers and Darners, Textile and
Fur Products
Total 121 90 31 Total
IV 115 85 30
IV V 6 5
GROUP 72 LEATHER CUTTERS. LASTERS AND Family 706 Bleacners, Dyers and' Finisners (excluding Printers) SEWERS (EXCEPT GLOVES AND GAR-
MENTS) AND RELATED WORKERS
Total 4 3 Total 97 75 22 4 4
IV 4 3 IV 81 63 18 4 4
Family 707 Knitters and Lace Makers V 16 12 4
Total 3 3 Family 720" > Shoe makers and Shoe repairers
IV 3 3
Total 96 74 22 4 4
Family 708 Carpet Makers and Finishers IV 80 62 18 4 4
Total 20 15 5 19 14 5 V 16 12 4
IV 19 14 5 18 13 5
V Family 729 Leather Cutters, Lasters and.Sewers (Except Gloves.
and Garments) and Related Workers. o. e. c.
GROUP 71 TAILORS. CUTTERS, FURRmRS AND Total RELATED WORKERS
IV
Total 575 428 147 22 22
GROUP 73 FURNACEMEN, ROLLERS. DRAWERS. . IV 549 404 145 19 19 MOULDERS AND RELATED METAL MAK-
ING AND TREATING WORKERS V 26 24 2 3 3
Total 197 174 23 9 9 Family 710 Tailors. Dress Makers and Garment Makers
IV 180 157 23 8 8
Total 574 428 146 22 22 V 12 12
IV 548 404 144 19 19
26 24 2 3 3 VI 5 5 V

61
B.V-Occupadonal Classification by Sex of Persons at Work other than CllltivatioD-Contd.
Division, Group and Family of
N.C.O. Category
Family 733
Total
IV
V
VI
'GROUP 74
Total
IV
V
Fanuly 741
Total
IV
V
,GROUP 75
Total
IV V
VI
Family 750
Total
V
Family 751
Total
V
Family 753
Total
VI
Total Workers ~---------.---.~
Total - Urban ,-____ ..A-___ -. ,.--__ -"-__ ___
Persons Males Females Persons Males Females
2 3 4 5 6
Blacksmiths, Hammersrniths aod Forgemen
197
180
12
5
174
157
12
5
23
23
9
8
9
8
7
PRECISION INSTRUMENT MAKERS, WATCH MAKERS, JEWELLERS AND RE-LATED WORKERS
106 103 3 13 13
87 1)4 3 11 II
I~ J!J 2 ~
Je.,;cllers, GoldsmIths and Silversmiths
IUb 103 :3 13 13
117 84 :3 II II
1'1 I!) 2 2
TOOL-MAKERS, MACHINISTS, PLUMBERS. WELDERS, PLA TERS AND RELATED WORKERS
7 7 :3 3
[> 5 2 2
fiter-Machlnlsts, Tool-makers and Machine Tool Senors
Machine Tool Operator
Mechanics-Repairmen (Excel,t Electrical and Precision Instrument Repairmen)
Division, Group and Family of
N. C. O. Category
Family 754
Total
V
Family 759
Total
IV
GROUP 76
Total
.V
VII
Family 762
Total
V
FamrIy 76-1:
Total
VI
Total Workers ,-,----------"-,--_._-----. Total Urban
.-------"-----. ,----__..._-----. Persons Males Females Persons Males Females
2 3 4 5 6 7
Sheet Metal Workers
3 3
3 3
Tool-Makers, Machinists, Plumbers, .Welders, Platers and Related Workers, n. e. c. (Including Metal-engravers other than printing)
ELECTRICIANS AND REL4.TED ELECTRICAL AND ELECTRONICS WORKERS
2 2
Mechanics-Repairmen, Radio and Television
Linemen and Cable Jointers
1
GROUP 77 CARPENTERS, JOINERS, CABINET MAKERS, C')OPERS \ND REL<\TED WORKERS
Total 182 177 5 41 41
III 16 13 3
IV 86 84 2 7 7
V 50 50 32 32
VI 30 30 2 2

CltNtUS T.lRLBS 62
B-V--OCC:UpatiOlial ClassiJicatioD by Sex of Persons at Work other thaD Cultivatioll-Gootd.
Division. Group and Family of
N.C.O. Cat~ory
family 770
Total
m
IV
V
VI
Family 172
Total
III
GROl'P 78
Total
V
\1
Family 780
Total
V
VI
GROUP 79
Tata'
VI
Family 791
Total
VI
Family 794
Total
VI
Total Workers r-
-Total Urhan
-- r--PerSQ[lS Males Females Persons Males Females
2 3 4 5 6
Carpenteu. Joinel1. Pattern Makers (Wood}
168 166 2 41 +1
2 2
86 84- 2 7 7
50 50 32 32
30 30 2 2
Sawyers and Wood Working Machinista
14 11 :3
14 II 3
PAINTERS AND PAPER HAt-iGERS
2 2
Painters and Paper Hangers
2 2 I
1
7
BRICKLAYERS, PLASTERERS AND CONSTRUCTION WORKERS. N. E. C.
335
335
335
335 9
9
Bricklayers. Plasterers, Masons
325
325
325
325
Hut Builders and Thatcher.
:3
S
3
I
9
9
9
9
Division, Group and FamHy of
N. C.O. Catf'.gory
Family 795
Total
VI
Family 799
Total
VI
GROUPSI
Total
IV
Family 811
Total
IV
GROUP 82
Total
IV
v
Family 1320
Total
v
Total Worker, r- ---_.,
Total Urban .,.--_-"'-_---, ,----_-"------..-Persons Males Felllaies Persons Males Fem ales..
2 3 4 .5 6 'j
WelJ Diggers
5 5
5 5
Bricklayers, kers, n. e. c.
Plasterels and Construction Wor-
2 2
2 2
POTTERS, KILNMEN, GLASS AND CLAY FORMERS AND RELATED WORKERS
13 9
13 9
Potters and Related Clay formen
13 9
13 9
MILLERS, BAKERS. BREWMASTERS AND. RELETED FOOE AND BEVERAGE WORKES_
94 85 9 31 31
68 9 .26 26
17 17 5 5
Millers. Pounders. Huskel'll and Parchen, Graills. and Related Food Workers
39 9 3 3
41 32 9 2 2
7 7

63 HHU ..
B-V-Occupational Classification by Sea of Persons at Work other than Culti~ation-Conld.
Total Workers Total Workers
Division, Group r- Division, Group r-
and Family of Total Urban and Family of Total Urban
N.C.O. r- N.C.O. ,...-- ,--
Category Persons Males Females Penons Males Females Category Persons Males Females Persons Males Females
2 3 4 5 6 7 2 3 4 5 6
Family 824 Bakers, Confectioners, Candy and Sweetmeat Family 860 Checkers, Testers, Sorters, Weighers and Counter Makers
Total 42 42 27 27 Total 2 2 2 2
IV 36 36 24 24 VIII
V 6 6 3 3 IX
Family 825 Makers of Aerated Water and Brewers GROUP 87 ~TATIONARY ENGINE AND EXCAVATING AND LIFTING EQUIPMENT QPERATORS AND RELATED WORKERS
Total 2 2
V 2 2 Total
IX Family 827 Butchers
Total 2 2 Family 870 Operators, Stationary Engines and Related
V 2 2 Equipment
Total
GROUP 85 CRAFTSMEN AND PRODUarION PROCESS WORKERS, N. E. C. IX
Total 124 68 56
'124 68 56 GROUP 89 LABOURERS, N. E. C.
IV
Family 8M! Basketry Weavers and Related Workers Total 2,01l4 2,077 7 106 106
III 1% It Total 120 68 52
V
IV 120 68 52
VI 1,878 1,1S7' 40 40 Family 8!'>3 Tanners, Fellmongers, Pelt Dressen and Related
Workers VIII 53 51 17 17
Total 4 4 IX 140 I!S 7 48 48
IV 4 4
GROUP 86 TESTERS, PACKERS, SORTERS AND RE- Family 890 Loaders and Unloaden LATED WORKERS
Total 2 2 2 2 Total 24 24 19 19
VlII VIIJ 111 1. 17 17
IX IX 6 i 2 2

CBNIlUIi TA:aLBS 64
B-V-Occupational Classification by Sex of Persons at Work other than Cultivation-Contd.
Division, Group and Family of
N.C.O. Category
Family 899
Total
III
V
vi
VIII
IX
Dtrlision 9
Total
III
VI
VIII
lX
GROUP 90
Total
III
V
Vlll
IX
Family 901
Total
IX
Total Workers
Total Urban -.... ,.....----"'----,
Persons' Males Females Persons Males Females
2 3 4 5
Labourers, n. e. c.
2,060 2,053 7 87
12 12
1,878 1,878 40 • 35 35
134 127 7 46
Service, Sport and Recreation -Workers
741
94
19
2
626
732
94
19
2
617
9 240
1
5
1
9 233
6
87
40
46
237
1
5
1
230
7
.. ~
3
3
FIRE FIGHTERS, POLICEMEN, GUARDS AND RELATED WORKERS
401 400 155 155
93 93
16 16 5 5
291 290 148 148
Police Constables, Investigators and Related WOrke!s
193 193 131 134
193 193 134 134
Division, Group and Family of
N. C. O. Category
Family 903
Total
III
VI
VIII
IX
Family 909
Total
IX
GROUP 91
Total
IX
Family 910
Total
IX
Family 911
Total
IX
Family 912
Total
Total Workers r----___________ J~ ______________ ~
Total Ulban ,.-- . ---"----~ ,..... ----"--_-----Persons Males Females Persons Males Females
2 3 4 5 6 7
Wa~chmen and Chaukidars
207 206 20 20
93 93
16 16 5 5
97 96 13 13
Fire Fighters, Policemen, Guards and Rdated Workers, n. e. c.
BOUSE KEEPERS, COOKS, MAIDS AND RELATED WORKERS
269 266 3 52 49 3
269 266 3 52 49 3
House Keepers, Matrons, Stewards (Domestic and Institutional)
14 14
14 14
Cooks, Cook-Bearers (Domestic and Institutional)
158 158 31
158 158 31 31
Butlers, Bearers, Waiters, Maids and Other Servants (Domestic)
95 92 3 19 16 3
95 92 3 19 16 s

65 B-SBBllIS
B-V-Occupadonal Classification by Sex of Persons at Work other than Cultivation-Concld.
Division, Group and Family of
N.C. O. Category
Family 919
Total
IX
GROUP 92
Total
IX
Family 920
Total
IX
GROUP 93
Total
III'
VI
VIII
IX
Family 931
Total
III
VI
VIII
IX
CROUP 94
Total
IX
Total Workers .- ---.,
Total Urban -"- r----""
Persons Males Females Persons Males Females
2 3 4 5 6 7
Ayas, Nurse-maids
2 2 2
2 2 2 2
WAITERS, BARTENDERS AND RELATED WORKERS
Waiters, Bartenders and Related Workers (Institutional)
BUILDING CARE-TAKERS, CLEANERS AND RELATED WORKERS
42 39 3 19 19
3 3
37 34 3 19 19
Cleaners, Sweepers and Watermen
42 39 3 19 19
3 3
37 34 3 19 19
BARBERS, HAIRDRESSERS, BEAUTICIANS AND RELATED WORKERS
20 19 7 7
ao 19 7 7
-- N. C. O.-National Classification of Occupations
Total Workers Division, Group r-'----- -"----and Family of Total Urban
N.C. O . .-----.....__------, ...----"-----. Categry Persons Males Females PerSons Males Females
Family 940
Total
IX
GROUP 95
Total
IX
Family 950
Total
IX
Division X
Total
11l
IX
GROUP X8
Total
III
IX
Family X80
Total
III
IX
2 3 5 6 7
Barbers, Hairdressers, Beauticians and Related Workers
20
20
19
19
7
7
7
7
LAUNDERERS, DRY-CLEANERS AND PRESSERS
8 7 6 6
8 7 6 6
Laundrymen, Washelmen and Dhobies
8 7 6 6
8 7 6 6
Workers not Clalsijiable by Occupation
8 8 1 1
2 2
6 6 1 1
WORKERS REPORTING OCCUPATION UNIDENTIFIABLE OR UNCLASSIFLABLE
8
2 2
b
WOlkers reporting Occupations UnidentIfiable or Undassluable
8 8
2 2
6 6 i 1

CENSUS TABLlSS 66
B-V-Occupational Classification~by Sex of Persons at Work other than Cultivation by",TahsUs (Rural only)
Division Total Workers Division Total Workers No. of ,-----"-..__ _______ No. of ,.----- .__~
N.C.O. N.C. O. Category Persons Males Females Category Persons Males Females
2 3 4 1 2 3 4
DlSTR1CT RURAL Dillision 2 Clerical and &lated Workers
ALL DIVISIONS Total 444 444
Total 9,499 8,358 1,141 III 168 168
III 2,161 2,081 80 V
IV 2,678 1,717 961 VI 92 92
V 114 107 7 VII 8 8
VI 2,500 2,500 VIII 3 3
VII 348 339 9 IX 172 172
VIII 152 152 Dillision 3 Sales Workers
. IX 1,546 1,462 84
DirJision 0 Professional, Technical and Related Work"s Total 336 321 9
Ti)tlt .. 687 619 68 VII 336 327 9
III 2 2 Dillision 4 FDTl1Iers, Fishermen, Hunters, Logglrs and &laud Warms VI 33 33
VII Z 2 - Total 3,065 2,442 623
VIII c· l III 1,812 1,735 77 IX 649 581 68 IV 1,250 704 546
Diaisian I Administratwe, E,,"utille and Managerial Worker. VIII 2 2
Total 41S 411 7 IX 1 1 -III 26 26
DilIisitHa 6 Workers ill Transport and Communication IV 4: 4: OeCll.pations
V 7 7 Total 156 156
VI 159 159· m 30 30
VrT 2 2 VI ~ 3
VIII VIII lOB 108
lX 219 216 3 JX 15 15


CBNSUS 'l'ABLRS 68
Division No. of
N. C. O. Category
DiviJion 4
Total
III
IV
DiIIiJion 6
Total
III
VIII
lJiviJion 7 8
Total
III
IV
V
VI
VIII
IX
DitJision 9
Total
HI
IX
B.V- Occupational Classification by Sex of Persons at Work otber tban Cultivation By TabsUs (Rural only)-Contd.'
Total Workers
Persons Males Females
2 3 4
Farmers; Fishermen, Hunters, Loggers and Related Workers
805 784 21
677 676
128 108 20
Workers in Transport and Communication Occupations
55 55
9 9
46 46
Crajt.sm8n, Production Process Warkers, and Labourers not elsewhere clasSified
813 790 23
6 3 3
146 127 19
18 18
588 588
Division No. of
N. C. O. Category
Division X
Total
III
IX
ALL DIVISIONS
Total
III
IV
V
VI
VII
VIII
IX
Total Workers
Persons Males
2 3
Workers not Classifiable by Occupation
5 5
2 2
3
RAJGA~HI TAHSIL
2,089 1,902
146 145
586 418
41 37
832 832
91 89
30 30
363 351
Females
187
16B
4
2
12
30 30 Division 0 Professional, T schnical and Related Workers
25 24 1
Total 167 157 10 S".vic,. Sport rmd Recreation Worker~
III
195 155 of VI 16 16
4-3 43 VIII 1
116 112 4 IX 14~ 139 10.

69 B-sB1U.
B-V-Occupational Classification by Su' of Persons at Work other than Cultivation b" Tahsils (Rural onl" )-Contd.
Division Total Workers Division Total Workers No. of No. of r-- ,__,
N.C.O. N.C.O. -Category Persons Males Females Category Persons Males Females
2 3 4 2 3 4
Division 1 Administrative, Executive and Managerial Worklrs Division 7-8 Craftsmen, Production ProcesS' Workers, and Labourers not eleswhere classified
Total 107 106 1 Total 995 952 43
III 4 4
VI 39 III 11 11
39
VII IV 204 166 38
VIII V 41 37 4-
IX 62 61 VI 737 737
Division '2 Clerical and Related Worklrs IX 2 1
Total 97 97 Division 9 Service, Sport and Recreation Warkers
III 17 17 Total 103 103
VI 34 34 III 9 9
VII 2 2 .VI 3 3
IX 44 44 IX 91 91
Division 3 Sales Workers
Division X Workers not Classifiable by Occupation Total 88 86 2
VII 88 86 2 Total 2 2
Division 4 Farmers, Fishlrmen, Related Worklrs
Hunters, Loggers and IX 2 2
Tot!1l 482 351 131 DUNDA TAHSIL
III 97 96
IV 382 252 130 ALL DIVISIONS
VIII 2 2 Total 3,131 2,368 7113
IX III 573 499 74
Division 6 Workers in Transport and Communication IV 1,517 866 651 Occupations Total 48 48 V 26 24 2
III 7 7 VI 468 468
VI 3 3 VII 114 108 . 6
VIII 26 26 VIII 29 29
IX 12 12 IX 404 374 3()

CIIINSUS 'l'ABLl!S 70
B-V-occupational Classification by Sex of Persons at Work other than Cultivation by Tahsils (Rural only)-Col'ltd.
Division Total Workers Dwision Total ""orkers No. of
,---_....___ __ No. of ,..... N.C.O. N.C.O.
Category Persons Males Females Category Persons Males Females
2. 3 4: 2- :) 4
Division 0 Professional, Technical and Related Workers Di&isiotl 6 Workers in Transport and Communication Occupations
Totjll 195 169 26
2 Total 30 30
VI 2
VII III 8 8
IX 192 166 26 VIII • 22 22
Djyjsion 1 Administrative, Executive and Managerial Workers
Totd 118 116 2 DivisiolJ 7-8 Craftsmen, Production Procesl' Workers and
5 5 iAbOZJr8TS not elsewhere clasSified
III
IV 2 2 Total 1,270 995 275
V '3 '3 IV 828 557 271
VI 41 41
V 22 2Q 2
IX 67 67 \'J. 409 409
Division 2 Clerical 'and Relal,d Workln VIII ;, :3
TObSl 103 103
IX B 6 2 IU 53 53
V Division 9 Ssrvice. ,Sport tmd Recreation Workers
VI 12 12
VII Total 136 134 ....
VIU 3 3 1lI 21 27
IX 33 33
VI 4 't Division 3 Sal" Warkers
Total 112 106 6 ViII 1 1
VlI 112 106 6 IX )04 102 2
Divisillll 4 [larmers, Fishermen, Humers, !.egg",: alld &lated Warkm
.. Total 1,167 715 452 Division X It' Qrkerl not Classifiable by Occupation
dIll 480 406 74
tV 687 309 378, Total

71
B-V-OccupatioDal ClassificatioD by Sex of perSODS at Work other thaD CultlvatioD by Tahsils (RuraloDly)-Concld.

CBNSUS TABLES 72
B-VI-Occapational Divisions of Persons at Work other than Cultivation classified by'
Educational Levels
Occupational Age-group Total Workers Total Literate PrImary High School Technical Division No. Literate (without or Junior or Higher diploma not (N. C. 0.) Workers educational Basic Secondary equal to
level) degree .A. __ ---..
,-_.A---"\ ,---.,.,.._~ .----"-----... r---"----. r---"----,
Persons Males Females M F M F M F M F M F
2 3 4 [> 6 7 8 9 10 11 12 13 14 15
All Division. Total 974 941 33 738 10 300 1 209 5 167 3 2
0-14 35 33 2 20 19
15-34 593 578 15 451 4 159 125 128 2
35-59 320 306 14- 253 6 112 81 4 38
60+ 26 24- 2 14 10 2 1
0- Professional, Technical and Related Workers Total 149 138 11 95 7 7 16 4 36 2 l
0-14
15-34 61 2 2 8 1 29
35-59 29 5 3 6 3 7
60+ 5 2 2 1
1- Administrative, Execu-tIve and MaDAierial Workerl Total 60 59 1 58 1 13 17 16 1
0-14
15-34 25 2 7 10
35-59 32 10 10 6
60+ 1
2- Clerical and Related Workers Total 139 139 136 18 37 72 1
Q-14 ... 15-34 106 11 31 57
35-59 30 7 6 15
60+

73
Sell, Broad Age-groups and Educational Levels in Urban Areas only
Non-technical diploma not
equal to degree
,--_Jo-_"'-'I
M F
16 17
1
University degree or post-graduate
degree other than technical degree
,.....--"-___,
M
18
53
36
17
29
21
8
12
6
6
8
6
2
F
19
,----r-Engineering
,.....-------. M F
20 21
2
2
2
2
Educational Levels
Technical degree or diplclma equal to degree or post-graduate degree
Medicine
M
22
3
1
2
3
2
F
1
1
Agriculture
...---.. M F
24 25
---------------- ----, Veterinary Technology Teaching Others
and Dairying ,.............. ,......--1'--, ,......,.,.____,
M F M F M F M F
26 27 29 30 31 32 33
1 AU DI.~
1
1
.... 2:'

CBNSUS'l'AJlLBS 74
B-VI-Occupational Divisions of Pe-rsona at Work other than Cultivation classified by
Occupational Division No. (N. C. 0.)
3-Sales Workers
"'I-Farmers, Fishermen, Hunters, Loggers and Related Workers
"5-Miners, Ql.larrymen and Related Workers
"6-Workers in Transport and Communication Occupations
Age-group
2
Total
0-14
15-34
35-59
60+
Total
0-14
15-34
35-59
60+
Total
0-14
15-34
35-59
60+
Total
0-14
15-34
35-59
60+
Total Workers Total Literate Workers
r- -..-, ,--_,._____, Persons Males Females M F
3 4 5 6 7
61 61 61
25
32 4
9 8 I 7 I
4
2
1 I 1
38 38 31
20
11
Educational Levels
Literate Primary High School Technical (without or Junior or Higher diploma not
educational Basic Secondary equal to level) degree ,...........-.. ,...........-.. r---"---\ ....-----"----,
M F M F M F M F
8 9 10 11 12 13 14 15
33 16 12
7 9 9
22 7 3
4
3 3 1 1
3
2
1
1 ..
19 7 4
10 5 4
9 2

75 B-SEaIBi
;Ses, , Broad Age-groups and Educational Levels in Urban Areas only-Contd.
....... Non-technical University degree diploma not or post-graduate ,..-
equal to degree degree other than Engineering technical degree
e .---'----. ,..-_.....---, .---'---.
M F M F M F
·.6 17 18 19 20 21
1
Educational Levels
Technical degree or diploma equal to degree or post-graduate degree .---------~.---------------~---------~--------~
Medicine Agriculture
,..---"---0 r--.A.----,
M F M F
22 23 24 25
Veterinary and
Dairying ,--"-___ M F
26 27
Technology' Teaching Others
,...--"'--..._ M F
2B 29 30 31 32 33
.. ~
3
4
5
6

amsus TABLBS 76
B-VI-Occupatiooal Divisioos of Persoos at Wor" other than Cultivation. c:lasswed by:
occupational DivislOD No.
(N. C. 0.)
1
7-8-Otaftsmen, Production Process Workers, aod Labouters,. nol dJewhere· c11lS1iued
9-Set\l\ce. Sport and Recreation Workers
X-Worken . not C1assi. fiable by Occupation
Age-group
'2
Total
0-14
15-34
35-59
60+
Total
0-14
15-34
55-59
60+
Total
0-14
15-34
35--59
60 ...
Total Workers
-- -. Persom Males Fetnales
3 4- r,
276 25i 11
240 257 J
1 1
N. C. O.-NaJirmal Clauijitatiott oj ~i_
Total LIterate ,",Vorkers
,.--......... --.... M F
6 7
141 1
1
95
42
3
207
19
ll~
7-l
1
Literate (~thout
educational level)
s 9
~9 I
1
67
29
2
108
HI
60
30
Educational Levels r---------------.--------PIimary
or Junior Basic
10 11
:is
23
12
77
39
37
High &<1001 Technlcllol or Higher diploma nol" Secondary equal to
degree
12 13 14 15·
..
4
.... ~ ,
20
14
6

77
. Sex, Broad Age-groups and Educational Levels in Urban Areas only-Concld.
Educational Levels ici~
Non-tec.hnical University degree Technical degree or diploma equal to degree or post-graduate degree oZO
diploQla not or post-graduate r- -"-----------------------. ·~.§O equal to degree degree other than Engineering Medicine Agriculture Veterinary Technology Teaching Others it·:1l •
technical degree and CJ.~Z
Dairying OO~
,_. ,.--~ ,_......,._.., r--"'---> ~
.....--"-___ r-•• .A... ...... ...--"-........
M F M F M F M F M F M F M F M F M F
16 17 18 19 20 21 22 23 24 25 26 27 28 29 30 31 32 33 1
1
1
2
I'
1 x
... ~

GENSUS 'l'ABLES
Educational Levels
'TOTAL
Illiterate
LIterate (without educational level)
Primary or Junior BasIC
High School or Higher Secondary
Technical diploma not equal to degree
Non-technical diploma not equal to degree
University degree or post-graduate degree other than technical degree
Technical degree or diploma equal to degree or post-graduate degree
Engineering
Medicine
Agriculture
Veterinary aDd Dairying
Technology
Teaching
Others
District/Tahsil
District Total
Puraum Tahsil
"Rajgarlti Tahsil
Dunda Tahsil
Ehat wari Tahsil
78
B-VIll-Part A- Persons Unemployed, a!ed 15 ana above, by Ses,
Seeking Employment for the -~---------
Age r------
Total Unemployed Total 15-19 20-24 25-29 30-34
,--_..___., ,...--..A._--.. r---"-___' ,--_,.,A.._ ........ ,..--,.,A.._~ ,--_..A..---, p M F ,M F M F M F M F M F
2 3 4, 5 6 7 8 9 10 11 12 13 14
13 18 9 2 3 1
ti 6 4
10 10 4
2 2
... -
B-VllI-Part B-Persons UaempJoyed, age4 15 and above
Rural Unemployed by r-
Total Unemployed Iliitera:te -.. r- -"-------.
Persons Males Females Persons Males Females
2 3 4 5 6 7
22 22 10 10
12 12 7 '7
7 7
1 1
2 2 2 2

79 B-SBRIBS
:.Broad Age-groups and Educational Levels in Urban Areas only
'nrst time --------, groups ---------.
15
3
2
35+
16
Age not atated
....---J---o M F
17 18
Total
,.----... M
19
9
2
6
F
20
Persons employed before but now out of employment and seeking work -"- ------------""""
Age-groups . -----.
15-19 20-24 25-34 35-44 45-59 ' 60+ Age not stated
~ ,..----...-....... ,..----... ........ r-~--. ,.-~ ,..._..,..._._, ~
M F M F M F M F M F M ,oF M F
21 22 23 24 25 26 27 28 29 30 31 32 33 34
1 1 3 4
2 2
<by Sex and EduCAtional Levels in Rural Areas only
Educational Levels ---------_ ..... -Literate (without educational level)
Persons
8
5
2
3
Males
9
5
2
3
Females
to
Primary or Junior Basic r-Person; Males
11 12
5 5
2
3 3
----------------------"""" High School and above
, ,.-
Females Persons Males Females
13 14 15 16
2 2
• 1 1 •

'C)lNSUS T ABLBS 80
B-IX-Pe",sODS Dot at Work classified by Se3. ••
Total Non-working population Full-time students Household duties Dependents, infants and disabled
Age-group ,- ,_..-""",-.. __., ,--_ ...... Persons Males Fc:maICl Males Females Males Females Males Females_
2 3 4 5 6 7 8 9 10
Dilltriet:
Total Sa,087 18,971 19,116 5,7S. 4ts 1 1,707 12,99' 16,M--
0-14 31,907 17,279 14,6%8 5,:415 475 157 11,959 13,996.
15-34 1,842 738 1,104 439 20 606 266 477
35-59 1,236 244 992 437 137 540-
60+ 3,072 690 2,382 50J 616 1,845.
Age not stated 30 20 to 20 10
Dishiet·
Total 36,807 18,287 18,520 5,4:00 386 1.520 12,768 16,592 0-14 31,106 16,825 ·14,281 5,085 378 155 11.738 13,748 .
15-34 1,537 602 935 315 8 451 263 475 35-59 1,141 195 946 409 135 531 60+ 2,'l93 645 2,'348 505 612 1,828 .&.ge not stated 30 20 10 20 10·
District-
Total 1,280 '14 5tf; 314 lOt 1 187 2JO 276 0-14 801 454 347 230 97 2 2'!1 248
15-34 305 136 169 124 12 155 3 2-35-59 95 49 46 28 2 g. 60+ 79 45 34, 2 4 17-Age not stated

81
Broad Age-po.,. aD" Type .f AetWkJ
Retired, rentiers 0 r Beggars, vagrants, Inmates of penal, Persons seeking emp- Persons emplo}ed before, independent means etc. mental and chari- loyment for the but now out of employment
table. institutions ftrst tilDe and seeking work oA.-----. ,- ..... Age-group
Males Females Males Females Males Females Males Females Males Females
11 12 13 14 15 16 17 18 19 20
Total
10 10 164 35 2 I 15 'rI Total
3 2 0-]4
7 ']2 .. ~ 13 ]5-34
5 86 14- 2 3 11 35-59
5 9 68 21 60+
Age DOt stated
Rural
10 8 83 IS 2 1 6 18 Total
% 0-14
7 6 11 15-34-
5 49 6 2 4- 35-59
5 8 27 7 60+
Age not ~ed~
U..,_
2 81 22 t • Total
3 0-14-
6 % 15-34
37 8 3 7 35-59
41 14 60+
Age not stated

9lN1ql TABLBI 82
B-IX-PersoD8 Dot at Work classified by Sex,
Total Non-working population Full-tune students Household duties Del-endents, mfants and dIsabled
,.------"-------. ,.---"" ,...-.----"----. Age-group Persons Males Females Males - Females Males Females Males Females
2 3 4 5 6 7 8 9 10
District
Total 36,807 18,287 18,520 5,400 386 1,520 12,168 16,592
0-14 31,106 16,825 14,281 5,085 378 155 11,738 13,748
15-34 1,537 602 935 315 8 451 263 475
35-59 1,141 5~5 946 409 135 531
60+ 2,993 645 2,348 505 612 1,828
Age not stated 30 20 10 20 10
Puraula
Total 7,989 3,943 4,046 1,039 119 543 2,881 3,382 0-14 6,622 3,556 3,066 938 116 35 2,616 2,915
15-34 392 147 245 101 3 194 35 47 35-59 314 ,53 259 167 48 91
60+ 652 176 476 147 173 329 ,\;e not stated 9 9 9
Rajgarhi Total 8,770 4,133 4,631 1,179 113 23 2,941 4,501 0-14 7,175 3,75' 3,418 1,091 113 2 2,666 3,303
15-34 354 1%7 227 88 7 35 220 35-59 357 48 309 14- 43 295 60+ 876 19S 683
189 683 Age not stated 8 Ii
8
DUDd. Total 14,118 7,233 6,885 2,138 15 738 5,073 6,122 0-14 12,284 6,81% 5,472 2,106 15 III 4,706 5,346 15-34 554 202 352 32 177 169 175 35-59 309 46 263 170 33 90 -60+ 959 171 188 280 163 501 Age not stated 12 2 10 2 10
Bhatwa'!"i Total 5,930 2,978 2,952 1,044 139 216 1,873 2,587 0-14 5,025 2,700 2,325 950 134 7 1,750 2,184
15-34 237 126 III 94 5 73 24 33 35-59 161 46 115 58 II 55 ~+ 506 105 401 78 87 315 Afle not stated

83
i8ro~d Age-groups and Type of Activity by Tahsils (Rural only)
Retired, rentiers or independent means
r
Males
11
10
-"Tahsil
"Tahsil
5
5
1
1
-Tahsil
5
2
3
"Tahsil
3
3
- Females
12
8
8
8
3
Beggars, vagrants, etc.
,----"----....... Males Females
13 14
83 13
7
49 6
27 7
6 1
4
5
2 3
16 10
Il 3
5 7 ..•
56 2
6
32 2 18
Inmates of penal, Persons seeking emp-mental and chari- loyment for the table institutions first time
,-__ --.A._--,
Males Females Males Females
15 16 17 18
2 1 .. •
6
2
2 1 2
2
2
:2
2
2
2
B-SlIBIlS'
Persons employed before, but now out of employment
and seeking work ,- Age-group Males Females
19 20
18 Total
0-14
2 15-34
11 35-59
4 60+ 1 Age not stated
12 Total
2 0-14-
8 15-34
1 35-59
60+
Age not stated
5 Total 0-14
2 15-34-
3 35-59
60+
Age not stated
1 Total
0-14
15-34 35-59
60+
Age not stated
Total
0-14
15-34 35-59
60+
Age not stated


C-SERIES SOCIAL AND CULTURAL TABLES

CBNSUS TABLES 86
C-II-Age aDel
Mantal Status r-----------------Age-group Total PopulatiOi. Never Marned .A-______ -.
,.------"-,-----., Persons Males Femal~ Males Females
2 3 4 5 6
District
All Ages 120,159 60,769 5',39() 26,532 19,202. 0- 9 27,320 13,679 13,611 13,679 13,641
10-14 10,829 5,916 -4,913 5,749 4,396 15-19 10,520 4,908 5,612 3,411 919 20-24 10,985 5,44-6 5,539 1,787 121 25-29 IO,45{) 5,3H 5,109 753 44 30-34 9,816 4,998 4,818 470 22 35-39 8,052 4,303 3,749 225 18 40--44 6,865 3,425 3,440 130 8 45-49 6,341 3,3!:!l 2,950 101 7 50-54 6,391 3,329 3,062 97 7 55-59 4,439 ~,323 2,110 43 3 . 60-64 3,939 1,850 2,089 32 3 65-69 1,836 887 949 21 1 70+ 2,339 950 1,389 14 2 Age not stated 37 23 14 20 10
Puraula
AU Ales 28,226 1·5,154 13,072 6,076 4,303· 0- 9 6,099 3,008 3,091 10-14 3,008 3,091 2,459 1,370 1,089 1,299 15-19 2,394 920 1,273 1,121 811 20-24 218 2,751 1,525 1,226 471 36 25-29 2,691 1,467 1,224 231 12 30-34 2,570 1,403 1,167 35-39 100 1 I 2,030 1,161 869 48 5 40-44 1,751 895 856 30 1 45-49 1,459 883 576 50-54 28 2 1,479 823 656 26 55-59 3 907 530 377 5 60-64 876 451 425 3 65-69 297 153 144 3 1 70+ 452 201 251 4 2-Age not stated II 11 9

87 C-IIIBIlIE§.
Marital Status
Marital Status
Married Widowed Divorced or Separated Unspecified Status Age· group-;------"------..,. !--lales Fen.ales
,-:Males
.----........ Females
,...-___ -..J-__ ---,
Males Females
,--___ ~J..... _____ ___..
Males Females
7 B 9 10 11 12 13 14
31,986 33,176 1,996 6,850 255 154 8 All Ale ...
0- 9
1l>" • 515 2 2 10-14
1,480 4,662 6 16 II 15 15-19
3,602 5,361 32 32 25 24 20-24-
4,492 4,985 62 54 34 24 2 25-29
4,405 4,627 81 148 42 20 30-34
3,934 3,479 120 234, 24 17 35-39
3,149 2,994 131 424 15 14 .. 0-44-
3,110 2,293 153 639 27 II 45-49
2,925 2,029 267 1,018 40 8 50-54
2,032 1,116 230 993 18 4 55-59·
1,475 746 335 1,332 8 8 60-64
646 200 216 743 4 3 2 65-69
569 165 362 1,217 5 4 70+
3 4 Ag.c not stated
Tahsil
7,435 471 1,282 52 50 2 All Ages 8,548 0-9
10-14 71 168 15-19
461 897 1 1 5
10 9 3 12 20-24 1,041 1,169 25-29
15 8 10 6 1,211 1,197
35 7 10 30-34
1,268 1,111 28 35-39 6 8 1,073 798 34 57
99 4 2 40-44 826 754 35 45-49
120 9 1 813 453 33
211 6 2 50-54 713 440 78 55-59 488 216 34 160 3
60-64
348 160 98 264 2
1M 1 65-69
113 38 36 70+ 214 1
120 34 77 Age not stated
2 , ..
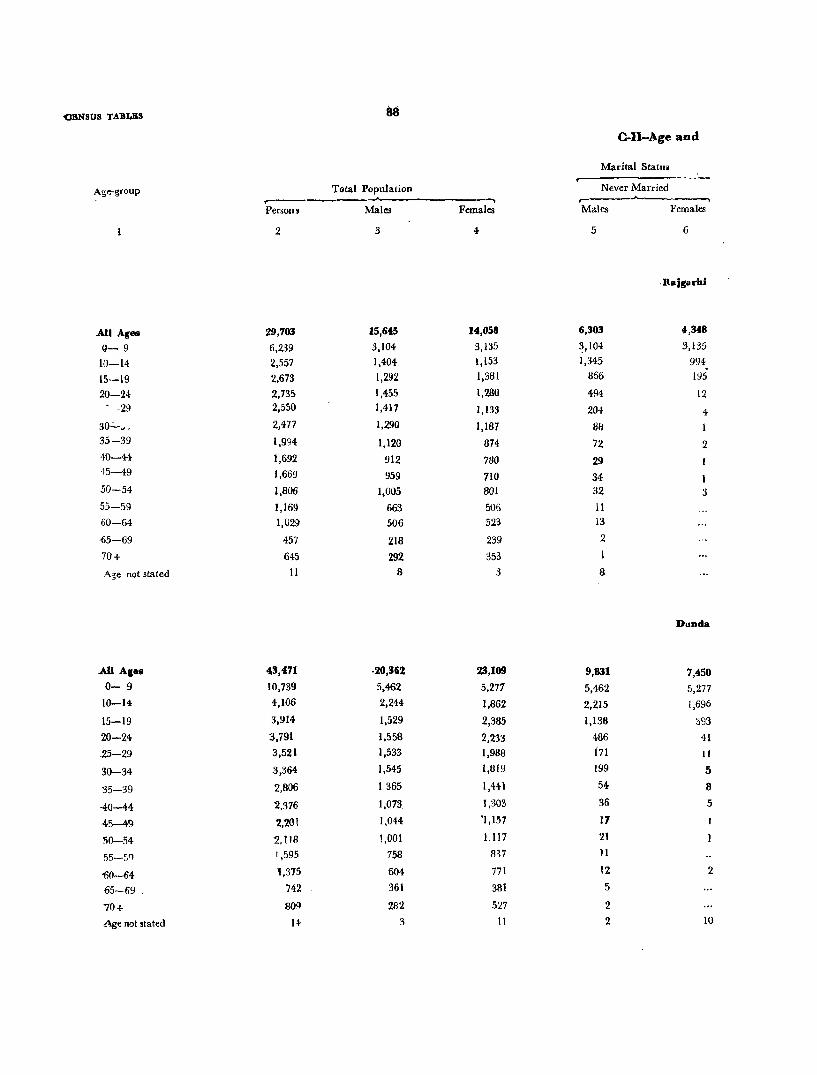
OBNSUS TABLES
CoIl-Age and
Marital Statui
Age-group Total Population ~------------- ~
Never Married ,..... ___ .A-. __ ---.
Persons Males Females Males Females
2 3 4 5 6
,Rajgarbi
AU Ages 29,703 15,645 14,058 6,303 1,348
u- 9 6,239 3,104 3,135 ~,104 3,135
10-14 2,557 1,404 1,133 1,345 994
13-19 2,673 1,292 1,381 866 195
20-24 2,735 1,455 1,280 494 12 - -29 2,550 1,417 1,133 204 4
30':"~. 2,477 1,290 1,187 88 1 35-39 1,994 1,120 874 72 2 40-44 1,692 912 7S0 29 ,t5-49 1,669 g59 710 34 1 50-54 1,806 1,005 801 32 3 55-59 1,169 663 506 11
60-64 1,029 506 523 13
-65-69 457 218 239 2
70+ 64:5 292 353 1
Age not stated 11 8 3 8
Dunda
.AU Ales 43,471 ·20,362 23,109 9,831 7,450 0- 9 10,739 5,462 5,277 5,462 5,277
10-14 4,106 2,244 1,862 2,215 1,696
15-19 3,914 1,529 2,385 1,136 :193
20-24- 3,791 1.558 2,233 486 41
.25-29 3,521 1,533 1,988 i71 11
30-34 3,364- 1,545 1,819 199 5
35-39 2,806 1365 1,441 54 a '40-44 2.376 1.073 1,303 36 5
45-49 2.201 1,044- '1,157 17
50-54 2,116 1,001 1,117 21
55-5'1 1,595 758 837 II
'fjO-64 1,375 604 771 12 2
65-69 , 742 361 381 5
70+ ~O9 282 527 2
Age not stated u- 3 11 2 10

Marital Status-Contd.
Mantal Status
~-------'-----------------~----.---------, Marded WIdowed Divorced or Sepa,ated r-'----...A...---~----, r----...-A----~
,--__ --A... ____ --.._
Males Females Males Females Males Females
7 B 9 10 11 12
-Tahsil
8,761 8,176 517 1,519 64 15
57 159
419 1;IBI 6 3 2
945 1,260 6 6 10 2
1,IB7 1,1l5 IB 12 ·B 2
1,164 1,154 22 31 16
1,019 B37 23 34 6
B49 702 31 77 3
BB4 576 36 130 5 3
902 569 60 22B 11
586 304 64 202 2
405 212 87 309 2
159 50 57 188
185 54 lOG 299
3
Tahsil
"9,745 12,756 702 2,844 84 53
28 165
383 1,979 10 8 3
1,057 2,177 g 12 6 2
1,33+ 1,951 18 15 10 10
1,315 1.749 21 . 58 10 6
1,253 1,317 50 III 8 5
990 1,101 42 187 5 10
~67 873 53 276 7 7
875 685 89 430 16 I
641. 392 98 442 8, 3
482 2+8 108 518 2 3
254 74 100 305 2
.165 44 114 480 2
Unspecified Status ,-~-----"" Maes Females
13 14
6
2
Age-group
All Ages
0- 9
10-14 15-19
%0-24-
25-29
30-34
35-39 40-44
45-49
50-54
55-59
60-64
65-69
70+
Aile not stated
All Ages
0- 9
10-14 15-19
20-24
25-29
30-34-
35-39 40-44 45-49
50-54 55-59 60-64
65-69
70+
Age not stated

CENSUS TABLES
Age-group
AU Alles
0- 9
10-14 15-19 20-24 25-29 30-34,
35-39
40-44
45-49 50-54
55-59 60-54
65-69
70+ Age not stated
All Ages
0-9
10-14 15-19
20-24 25-29 30-34
35-39
40-44-
45-49 50-54
55-59
60-64 65-69
70+
Age not ~tated
,.---Persons
2
18,759
4,243 1,707 1,539 1,708
1,688 1,405
1,222 1,045
1,012 988
768
659
340 433
1
2,677
590
265 321
273
280 214
191
136
118 95
56
68 23
47
90
Total PopulatIOn
Males
3
9,608
2,105 898
814 908
924 760
657 545
505 500 372
289
155 175
1
1,765
313
180
242 188
196 140
126
98
91 64
41
43 13
30
C-lI-Age and.!.
Marital Status ~------~--
Never Married r------"-----,
Females Males Females
5 6
Bhatwari.
9,151 4,322 3,101
2,138 2,105 2,13B
809 890 786
725 596 113
800 336 32
764 147 17
64:5 83 5
565 51 3 501 35
507 22 3 488 18 396 16 2 370 4
185 II
258 7
Distriet
912 933 402 277 313 277
85 178 84
79 221 35 85 83 4
84 34 1
74 19 65 15
38 9
27 8
31 13
15 10
25 7 10 6
17 17

91 C-SIIBIBS
Marital Status--Condd.
Marital Status __....." .. __...___..-._----.. Age-group
Married Widowed Divorced or Separated Unspecified Status ""------"'---.......-., r---___..._-----... r----~ r---..A---__ ~
Males Females Males Females Males Females Males Females
7 s 10 11 12 13 14
Tahsil
4,932 4,80~ 2M 1,285 55 3Ci All Ages
...... 0- 9
2 23 HI-l4
217 605 2 5 15-19
559 755 7 5 6 8 20-24
760 722 11 19 6 6 25-2.9
658 613 10 24 9 3 30-34
589 527 13 32 4 3 35-39
484 437 23 61 3 2 40-44-
446 391 31 113 6 45--49
435 3% 40 149 7 4- 50-54
317 204- 34 189 5 55-59
240 126 42 24-1 3 2 60-64
120 38 23 146 65-69
99 33 55 224 4 70+
Age not sta ted
UJ:ban
415 48 92 4 3 AU ACes 788
0- 9
10-14 2
43 2 15-19 19
104 81 1 20-24
Hil 83 1 25-29
119 69 2 5 30--34-
106 56 5 8 35-39
85 32 4- 6 40-44-
82 15 1 11 45-49
8 15 50-54
43 16 2 8
55-59 29 7
24 7 12 18 60-£4
t) 2 I 8 65-fi9
8 4 5 13 70+ Age not stated

"CB NSUs TA:a:wu 92
C-UI-Part B- Age, Sex aDd
Educational levels r-
Age-group Total Population Literate (without Primary Matriculation Technical
Illiterate educational or or diploma not level) Junior Basic Higher S~condary equal to
degree
,- -. ,---"""""-"'""""1 r--J---.... r---"--__... r-_J.-_~ ,--_.J<;._~
p M F M F M F M F M F M F
I 2 :> 4 5 6 7 B , 10 11 12 13 14
All Ages 2,677 1,765 912 515 636 546 160 ,"4 89 195 19 %
()- 4 323 166 157 166 157
5- 9 ~67 147 120 65 81 81 38 I
10-14 265 180 85 23 30 74 28 8~ 27
15-19 321 242 79 58 42 43 15 1~1 18 7 4
20-24 273 188 85 35 46 49 17 50 15 48 4
25-29 280 196 84 36 45 53 20 17 11 61 6
30-34 214 140 74 21 50 41 13 31 6 22 3
35-44 327 224 103 45 78 80 16 il 8 %4-
45-59 269 196 73 43 59 80 10 SI % 26 60+ 138 86 52 23 48 45 3 a 7 'I\ge not stated
C-lII-Part C-Age, Sex auel
Total Populatio. llliterate
Age-group r-- ""'- ____, r----j._.-~
Persons Males Females Males Females
2 3 4- 5 6
All Ages 120,159 it ,76' 59,39() 44,057 58,487
0- 4 14,252 7,018 7,234 7,IH8 7,234
5- 9 13,068 6,661 6,407 5,389 6,262
10-14 10,829 5,916 4,913 2,980 4,728
15-19 10,520 -4,,908 5,612 2,964 5,475
20-24 10,985 5,446 5,539 3,271 5,379
25-29 10,450 5,341 5,109 3,472 4,985
30-34 9,816 4,998 4,818 3,440 4,763
35-44 14,917 7,728 7,189 5,475 7,134
45-59 17,171 9,043 8,12f1 7,073 8,098
\ 60+ 8,114 3,687 4,427 2,954 4,415
Age not stated 37 23 14 21 14

93
EducatioD .iD UrbaD Areas ODl,
Educational Levels
Non-technical diploma not
equal to degree
University degree or post-graduate
degree other than technical degree
Technical degree or diploma equal 10 degree or post-graduate de~ree r- _-.A.
Engineering Medicine Agriculture Veterinary Technology Teaching Others and dairying
r---"""___'_"'"
M F r-~ ,---"-___.., r---.A.~ r-~---. ,...--'---. M' F M F M F M F M F
r---""----. M F
,.--_..A..----.
M F
15 16 17 18 19 20 21 22 23 24 25 27 211 29 30 31 32
1 - 7 2 3 1 1
5 3 9 2
22 2 10 2 2
8
2
EdueatioD iD aural Areas oal,
Educational Levels -"-
Literate (without Primary or Junior Matriculation and aoove wucational level) Basic Age-lroup
r- -___ .A.------, r-
Males Females Males Females Males :Females
7 8 9 10 11 12
11,372 640 4,766 243 574 28 AU AJes ~4
1,138 135 . 134 If) !)-9
.,790 139 1,1-i6 46 100H
983 83 9+2 51 }9 3 15-19
1,123 103 89() 51 l62 " 20-24
1,161 83 529 33 179 8 ~2S
1,114 25 365 29 79 1 ~-:H
1,734 32 441 21 78 2 35-H
1,663 28 2& 2 42 45-~!J
665 12 M H 00+
1 Ag-e oot _ted'
c-SERIE.. ..
Age-grou~
AlIA,es 0-4-
5- 9
10-14 15-19
2()-24
25-29
30-34 35-44 45-,')9
6ll+
Age not stateo±

GBN8US TAlJl>BS
Di:itrict
Uistrict Total
Rural
Urban
94:
C-V -Mother:-Tongue
iet"ial Mother-Tongue Total No. r------"------'- -..
Penons Male$ Female!
2 3 4 5
Total 122,836 AlghaniI KabuliJPakhto/
62,534 60,302
Pashto/Pathani I I 2 Assamese 2 I 3 Awadhi 3 3 4- Bashahri 61 36 25 5 Bayari I I 0 Bengali 50!; 285 223 7 Bengani 8 8 8 Bhojpuri I ! 9 BhatIa-Unspecified 9 4 5
10 Bihari 6 6 II Bilaspuri/Kahluri 6 6 12 Braj Bhasha/Braj Bhakha 2 2 13 Garhwab 104,109 49,391 54,7 18 14 Gazipuri 1 1 15 Gorkhali 25 21 4-16 Gujrati 4 4 17 GUlffiUkhi I I 18 Hindi 16,069 11,179 4,890 19 Jad 288 149 139 20 Jaunsari 21 21 21 Kanauri 66 43 23 22 Kangri 132 114- 18 2~ Kannada 3 3 24 Kashmiri 7 7 25 Kumauni 217 185 32 26 Malya1am 2 2 27 Mandeali 128 128 28 Marathi I 1 29 Marchha 7 4- 3 30 Marwari 2 2 31 Nepali 4'30 408 22 32 Onya. 2 2 33 Pahar1-Unspecified 127 51 76 34- Parsain 10 8 2 35 Punjabi 268 215 53 36 Purbi 1 1 37 Suketi 5 5 38 Te1gu 4- 4-39 Tibetan 65 37 28 40 Urdu 229 210 19 -4:1 Utkali 3 3 4% Wai Ala 1 I
C-VlI-
Names of Religions arranged Total
Buddhists Christians Hindus ,----..".._-~
Males Females ~~ ,..--_ ....... ___, ,----"----. PenoIlS Male» Females Males Females Males Females
2
122,836
120,159
2,617
3
6%,534
66,769
1,76S
4-
60,502
59,390
91%
5
144
144
6 7 8
131 1
13G
9
62,195
60,489
1,706
10
60,048
59,168
880

95
,(Alphabetical Order)
Rural Urban r-- ...... ----. r-------~-----'-~ Pelsons Males Females Persons Males Females
6 7 8 9 10 II
1%0,159 60,769 59,390 2,677 1,765 912
1 2
3 3 GI 3b 25
1 I 475 26U 215 3~ 25 1;1
8 8 1 1 9 4 5 4 oJ: Z 2 6 b 2 2
102,185 41\ \79 006 1,924 1,21% 712 1
25 21 4 ~ 4 1 1
15,578 10,830 4,748 491 349 142 288 149 139
21 21 66 43 23
132 114 18 3 3
7 7 141 125 16 76 60 Hi
2 2 128 128
7 4 3 2 2
402 382 20 28 26 2 2 2
127 51 76 10 8 2
188 163 25 80 52 28 1 1
5 5 .. 4 4
61 36 25 4 1 3 213 194 I!:J 16 16
3 3 1 1
:ReligioD
in Alphabetical order '---_._-------------------
Jains Muslims Sikhs .,.--..A-__ -. r----- _.,A..~ __ ______'" r-
Males Females Males Females ~1ales Females
11 12 13 14 15 16
18 7 143 99 33 II
18 7 106 82 11 3
37 17 22 15
Other Religions and Persuasions
,.--___ .A. __ -.
Males Females
17 18
C-S.!IlIES
Rel igion not stated
,....-___ ..,A... ___ .....
Males Females
19 20


SCT & SC-SERIES SPECIAL TABLES FOR SCHEDULED CASTES
Fly leaf to Table SCT-I-Part A-Showing the Population of Scheduled Castes of each Tahsil
District /Tahsil
District Total
Puraula Tahsil
Rajgarhi Tahsil
Dunda Tahsil
Bhatwari Tahsil
Population r----------------. Persons Males Females
2 3 4
25,958 13,605 12,353
4,694 2,621 2,073
7,791 4,\28 3,663
10,618 5,363 5,250
2,855 1,488 1,367

QNsus TABLES 98
SCT -I-Part A-Industrial Classification of Persons at Work.
WORKERS
II III Serial Name of Total Population Total Workers As. A"i. In Mining, No. Scheduled Castes (I-IX) Cultivator Agncu!tulal Quarrying, Llve-Labourer stock, Forestry,
Fishing, Hunting and Plantations, Orchards and allied activities r----.wAa. ____ -, ,...-_Ji-__ -"" ,.----"----... ,--__ ...A..._~ r-----J-~___"' p M F M F M F M F M F
2 3 4 5 6 7 8 9 1(J 11 12 13
DISTRICT. TOTAL 25,663 13,440 12,223 9,954 8,727 7,823 8,083 230 130 187 8
Badi 4 2 2 2 2
2 &jgi 729 342 387 210 201 136 194
3 Balmiki 16 13 3 6
4 Chamar, Dhusia, Jhusia, 1,272 684 588 !H9 -542 483 534 12 or Jatava
5 Dhangar 2 2 2
6 Dom 394 200 194 107 174 78 162 2 2
7 Domar 8 8 II 8
8 Kori 34 10 24 10 .24 10 24
9 Shilpkar 23,204- 12,187 11,017 9,098 7.776 ~7,1l6 7,166 228 128 174- 7
DJ8TRKlT-
TQTAL 295 165 130 109 '4 12 27 23 32
Balmiki 36 24 12 18 3
2 Chamar, Dhusia, JhUlia cr Jatava
5 3 2
3 Dhobi 8 7 4 .... 4 Sbilpkar 246 m 115 Btl C50 12 27 23 31

99
aDd Non-workers by Sex for Scheduled Castes
WORKERS ,-------
IV V At Household In Manufac-
Industry turing other than Household Industry
,----"--~ ,--__ ..A.. __ ~
M F M F
i.J. 15 16 17
RURAL
VI In
Construction
,.-~_..A..~._--.
M F
IS 19
1,002 69 S 420
1
20 2 12
24 8
2
15 9 10
...
942 421 65 5 397
URBAN
20 !I
20 9
VII In Trade
and Commerce
,---.-'--~
M F
20 21
3
3
VIII Transport, Storage and
Communications
,.-------" M F
22 23
7
7
3
IX In
Other Services
24 25
213
2
39 7
5
:2
166 49
41
ill 3
19 2
SCT-SERlBS
Workers in Special Occupations
X ,---,,____-_ ..... --- .... NON-WORKERS Tanning and Sca,'cnging
Currymg of Hides
and Skins
,-__ J.-_~ ~.--.,A..._~ r--.A.~
M F M f -M F
26 27 28 29 30 31
3,486 3,496
132 186
7 3
165 46
93 20
3,089 3,241
filS 18
9 18
2
45 55

(JENSUS TABLES 100
SCT-I1I-Part A (i)-Education in Urban Areas only for Scheduled Castes
Serial No.
1
2
3
4
Name of Scheduled Caste
2
TOTAL
Balmiki
Chamar, Dhusia, Jhusia or Jatava
Dhobi
Shilpkar
Total Illiterate
3 4 5 6
165 138 183 114
24 12 19 II
3 2 2
7 3
m 115 81 lOG
Literate (without
educational level)
,-_.A...~
M F
7 8
43 16
5
2
2
34 Ii
Educational Levels ,- _________ ,,A.. ___ ,
Primary High Technical Non-tech- UnivelSlty Techmca, or School diploma not meal dlp- degree degree or
Junior Basic or equal to lama not 01 post- dIploma HIgher degree equal to graduate equal to
9
%t
2
3
15
Secondary deglee deglee degree
10 11 12
other than or post technIcal gladuate
deglee deglee
M F
13 14 15 16 17 18 19 20,
SCT-III-Part B (i)-Education in Rural Areaa only for Scheduled Castes
Educational Levela ,-_____ ,A.. __ ' __ ---.
!'>erial Name of Total Illiterate Literate (without Primary or High School No. Scheduled Caste educational level) JUUIor i::aslc and above
,--_ ....... ------. ,--...... ___, ,.--_.A.~ ,-__ .A. __ --, ,-__ .A. __ ""
Malea Fetnales Males Femala Males Females Males Females Males females
2 3 4 5 6 7 8 9 10 II 12
TOTAL 13,440 12,%%3 11,710 12,158 1,098 584 14 5fi 1
Badi 2 % % %
2 Bajgi 342 337 337 387 4
:3 Balmiki 13 3 1% 3
-4 Chamar, Dhusia, Jhuaia 684 588 652 582 25 6 7 or Jatava
5 Dhangar % 2
6 Vom 200 194 197 Ig4 3
7 Domar I S
8 Karl 10 %4 10 24
'9 Shilpkar 12,187 11,011 10,500 10,~58 1,055 44 576 14 51i

lUI SCT-sERISS-
SC-I-PersoDS Dot at Work classified by Sex, Type of Activity and Educational Levels for Scheduled Castes
EducatIOnal Levels
TOTAL
Illiterate
Literate (without educational level)
Primary Or Junior Basic
High School or Higher Secon-dary
Above High School or Higher Secondary
TOTAL
Illiterate
Literate (without educational level)
Primary or Junior Basic·
High School orYHigher Secon-dary
Above High School or Higher Secondary
TOTAL
Illiterate
Literate (without educational le\'el)
Primary or Junior Ba!ic
Hi!:(h School or Higher Secon-dary
Above High School or Higher Secondary
Total Non-working Population
r-------"--------., Persons Males Females
2 3 4
7,104 3,542 3,562
6,488 2,985 3,503
364 314 50
220· 211 9
31 31
',982 3,486 3,496
6,409 2,958 3,451
335 297 38
207 200 7
31 31
122 56 tifi
79 27 52
29 17 1.2
13 11 2
Full-time Students
r---"------. Males Females
5 6
District Total
810 71
276 19
301 45
202 7
31
District Rural
793 57
276 19
289 33
197 5
31
District Urban
17 14
12 12
5 2
Persons seeking employment for the nrst time
,----"------, Males Females
7
13
7
5
4
2
9
5
4
Persons employed before bUl now out of
empio)ment and seeklllg work
Others
,---..... ----., ,-___ .A-___ -,
Males Females Males Female~
9 10 II 12
5 2,714 3,491
2 :.1,706 3,484
6 5
2 2 2
2 2,687 3,439
2 2,679 3,432
6 5
2 2
3 27 52
27 52
2


PART n
OFFICIAL STATISTICS


Particulars
1
Number of Rainy' days
Mon~hly Rainfall
})articulars
NuroLel' of Ramy days
Monthl y Ra i nfall
"N.A.-Not Available
January
2
4
67
August
9
N.A.
10.5
Table l' J-Rainfall
February
3
September
10
N A.
MarcA
4
I
October
11
N.A.
April
5
N.A.
November
12
N.A.
..
RAINPALL AND TEMPERATCltB
May
6
N.A.
"
December
13
N.A.
"
June
7
N.A.
July
i
N.A.
Annual
14
N."".
Source- Board of Revenue U. -p.
Table l'2-Meeo Maximum add Mean Minimum, Highest and Lowest Temperatare
INFORMA'fION NOT AVAILARLF

OPPICIAL stATISTICS
Particulars
Live Births
2 Birth Rate per 1,000 of Population
:3 Female Births per 1,000 male births
4- Deaths
5 Death Rate
6 Female Deaths per 1,000 male deaths
106
Table l-Vitat Statistics-1960
Death by Age-groups - .... ---.-- --------... Total Rural Urban Age-group Total Rural Urban->
2 3 4 5 6 7 IS
Males 993 985 8 under I year Males 25 25 Females 932 923 9 Females 13 13
1-5 Males 159 159 Females 120 120
Males 8'2 8'3 3,7 5-10 Males 83 83 Females 7-7 7'8 4'1 Females 76 76
10-15 Males 57 57 Females 55 55
938 937 1,125 15-20 Males 61 61 Females 58 58
20-30 Males , 84 78 6 Males 771 760 11 Females 80 76 2 Females 704 691 13 30-40 Males 88 88
Females 80 76 2 40-50 Males 78 74 4
Males 12'6 12-7 8-4 Females 92 89 3 Females 11-8 U-S 15-7 50-60 Males 67 66 1
Femal<;s 73 68 5 60 and above Males 69 69
913 909 1,182 Females 57 56 }
Deaths from selected causes ,...._---Causes
9
Cholera
S?lallpox
Plague
Fevers
Dysentry or Diarrhoea
Respiratory diseases
Injuries
All other causes
.... ----,,_---..:.....---_~ Totat
10
743
279
230
18
205
Rural
11
720
279
229
IS
205
-Urban
12
23
Source-Director of Medical and Health ServiCes, U, I>:'_

107 AGJtlCUL'I'UR.a
INFORMATION NOT AV AlL ABLE
Table a'l-Land UtBisation
INFORMATION NOT AVAILABLE
Table 3'3-Agriculture E'!tension Scheme
Particulars )9!i!) 19!i6 1957 1958 1959 19c(}
:I. 3 " 5 6 7
1 Improved seed distributed (mds.) 23 147 1,121 1,483 1,366 1,58&
2 Area SOWn with improved seeds (acres) 30 340 2,614 2,432 4,703 9,316
3 I rrigation (acres) l,200 2,200 2,250 2,270 5,792 8,686
4- Number of improved;agricultural imple- 39 47 114 ments distributed
5 Number of Agricultural demonstrations 10 115 140 162 207 450
ti Quantity of cbemicals and other fertilizers 56 105 89 293 358- 2,679-distributed (mds.)
7 Area under green manure (acres) 3 .6 11 22 30
8 Area under Japanese method of 50 H2 200 326 876 I,WS cultivation (acres)
9 Alea under U. P. wheat cultivation (acres) 100 216 351 578 1,312 1,534-
10 Area under line sowing (acres) 50 200 415 960 2,377 1,538:
11 Area covered with gardens and fruit trees, 30 119 222 376 557 l,Sl4-etc. (acres)
12 Area of banjar land brought under 3,000 3,012 3,OJ8 6,040 5,745 5,60& cultivation (acres)
13 Number of competitors under crop ... 207 109 12 33' competitions
14- NUffiper of Veterinary bo~jtal! and Live- 2 7 7 7 9 !tock Centres
15 Number of Artificial Insemination centres
16 Number of Poultry Breeding centres 3 ,'j 15
17 Amount of Taqavi distributed for milch 2.1<t5 5,tlO6 2,070 20,600 cattle (Rs.)
Not~-Da~a for the yl:af 19!) I to 1954 are not available Souret-District Agriculture OIiceT

<l'flFICtAL STATISTICS 108
Table 3'4-;rer8Olls Culuvatilll!l Land under dift'erellt Sizes of Holdhlgs
Size of Holding 19~1 19:'>2, 1953 19M l%f> 195G 1\157 1958 1959 1960
2 3 4 5 6 7 !l !I 10 11
Above IOU acres
50-100 .. 25- 5U
20- 25 .. 15- 20 .. to- 15 .. 152 152 152 152 152 152 152 }52 ·152 1.')2
5- 10 " 699 702 727 713 716 721 724 725 723
1-, :; 3,906 H,989 9,009 9,087 9,108 10,194 10,390 11,309 Il,OB9 12,906
tlelow 1 acre ~,439 3,469 3,486 -3,499 3,529 3,559 3,589 3,598 3,608 3,646
Source-District Officer_
Table 3'5-Crop-wise Gross Area Irrigated
INFORMATION NOT AVAILABLE

lO~ PACTOBIIiS
Table 4-Statistics of Household Indu.stry
Puraula Tahsil Rajgarhi Tahsil Dunda Tahsil BhalWal'i Tahsil District Major GiOUp (Rural) (Rural) \Kmal) (RUlal) Urban
No. of 1. S. 1. C. ,..--------. r----_,._~ ...---_"'_-----., r---..A."-_-. ,..--"""__'
Males Females Males Females Males Females Males Female!i Males Females
2 3 4- 5 b 7 8 9 10 11
04-Llvestock and huntIng 86 21 349 lJl 260 351 35 13
lO-;vlinmg and quarrying 14
20-} oodstufl's e 3 III 2 27 ::J
23-T extJle-cotton 8 2 6 2 3 10 27 2
24-Textlle-jute 2 .. 25-Textile-\\001 :'12 16 <I ICO 98 24 :)~ 13 10
26-Textlle-sllk 4:5
27-'rextlle-misedLineous 6 56 21 220 103 62 .6 19 3
28-Nlanufacture of wood a.od wooden 13 2 39 83 51 Ll 7 ploducts
31-Leather and leather plOd~cts 7 2 10 3 41 17 4
3%-Rubuer. petroleum and coal ploducts
34--35-Non-metall1c cUHlecal products 8 3 other than petLOieum and coal
36-Basie metals and their ploduets except ll:l 2 1:1 99 21 38 { 8 machmerr and tranSpoll equ1p-ment
39-Miscellaneolls rnanufacturmg lUdustr)' 14 21 35 2 3 10
I.S,I.C --Indlan Standard Industrial C1asslE""tlOn
Table 5'l-Growth of Factorie.
NIL
Table 5'2-Number of Workers in Each Establishment
~IL

OFFICIAL STATISTICS 110
Table 6'1-Criminal Justice-Number of Cdwinal Cases Tried
Particulars 1960
A-5ERIOUS ORIMES
I-Cognizable cases
(a) Olfences against State, public tranquilIty, safety and Justice
tb) Senous Offences agamst persons (el Senous Ofiences agamst person and propert}'
or agamst property only
II-Non-cognizable cases
(a) Offences against State, public tranquility, safety and justice
(Ii) Senous offences agamst persons (c) Serious offences a~amst per'lon and
property or agamst property only
Total I and II
B-MINOR Of FE NOES
i-Cognizable Cases
(a) Minor offences agamst person (6) Mmor offences against property (e) Otner offence not specified above
II-Noll-cognizable cases
(a) Min0f offences agaimt person (b) Minor offences agamst property (c) Other offences not specified above
Total I and II
2
119
73 46
:>0
38
6 6
169
598
503 5
90
51
24, 12 15
649
Source-DiStrict Ojiice~,-
Table 6'2-Criminal justice-Persons'Convicted or Bound Over
S!. ~o.
1
2
3
4
5
6
7
8
9 10
11
12
13
Offences or Nature of Proceedings
2
Offences against public tranquility
Murder
Culpable homicide
Rape
Hurt with aggravating circumstances
Hurt with criminal force or assault
Dacoity
Robbery
Theft Other offences against the Indian Penal
Keeping the peace
Excise laws
Municipal laws
Code
1960
3
47
I
8
16
298 97
6
5
(Number)
Source-District Oftlcer-

III APWINISTR ILn"~
Table 6'3-Suength of Poliee, 1960
Description of the staff ____ J..._-__ Sl. Name of Police Station No. Sub-inspt'r.tors Head Constables Con~tabk~
2 3 4
P.S. \Jtt .. r Kashi 2 2 2 1'.S. Barkot
3 O.P. Raj Garhi
4- O.P. Pur aula
5 O.P. Dharasu
6 Check Post, Nilong
7 Prosecuting Branch
8 D. C. R. S.
9 Fixed guard for Collectorate 3 10 Reader to D. S. P.
11 Radio Station Messenger
12 Civil Emergency Rese~ve 4
13 L. 1. U. (D. 1. R.) 2 14 Contingtnt Reserve
15 A. P. P. O. M. T.
Total '23 1119
Source-Inspector General of Police, U. p_
Table 6'4-Statistic8 of Jails
INl"ORMATlON NOT AVAILABLE

.1'1'IClAL STATISTICS
Receipt of
II!
Table 6'S-Co-operative S6Ciedes
Description
1
Number of Primary Societies
2 Number of Co -operative Federations
3 Number of members in Primary Soeietiei
-4 Number of members in Co-operative Federations
5
6
7
(a) Share capital of Co-opelative Societies
(b) Reserve and other Funds
(a) Share Capital of Co-operative Federations
(b) Reserve and other Funds
Loans advanced by Agriculture Credit Societies
8 Share capital of the Co-operative Bank
1959-60
2
94
2,442
37,212
65,314
Source-Registrar Co-operati\e ,Societies, D.P.
Table o'o-Excise and Motor Spirit Tax
NOT AVAILABLE
~- Table 6'7-Receipt of Entertainment Tax and Land Revenue
(Figures in Rupees)
1951-52
%
195%·53
g
1953-54 1954-55 1955·56 1956-57 1957-58 1958-59 1959-60
4 5 6 7 8 9 10
Entertainment T,,-x 571 III 449 245
2 86,2(1S
Source-Entertainment Tax ~t1d Bettir;g Tax CommissiEmer. U.P. and Board of Re~enue, UP.

113 ADMINXSTRA. TIVE, HEALTH AND MBDICA,&
Table 6'8- Registered Docum.ents and Value of Properties Transferred
No. of Number of Registrations Aggregate value of propert)" Total Total of Total Total Year Registration ,---------'-- --, Transferred by registered amount of other receipts expenditure
offices Immoveable Moveable documents (Ks.) ordinary receipts property. property Wills ,----_-"- --. fees
r----~-____. Affectmg Affecting Total (Rs.) (Rs.) (Rs.) (Rs.) Compulsory Optional Immoveable Moveable
property property
2 3 4 5 6 7 B 9 10 II 12 13
1951 54 24 84,,257 ·24,749 109,006 1,177 142 1,319 300
1952 88 13 2 74,825 74,825 211,131 1,243 211 1,454 300
1953 77 11 28,650 61,)81 136,306 816 99 914 300
1954 46 13 31,275 15,600 46,875 660 101 761 300
1955 55 9 40,785 16,550 57,335 671 112 783 300
1956 1 61 9 50,855 11,300 62,155 704- 126 829 300
1957 1 72 23 36,415 12,280 48,695 977 135 1,112 300
1958 4.3 13 51,450 15,050 66,500 1,295 118 1,413 300
1959 :15 13 35,160 4,290 39,450 744 63 807 300
1960 42 55 2 83,250 7,150 90,400 1,292 89 1,380
Source-Inspector General of Registration, U. P.
Table "I-List of Hospitals and Dispensaries 1960--61
. Serial No.
2
3
4
5
fi
7
'8
"9
Name of Hospita1fDispensaries
2
District Hospital, Uttar Kashi
Dunda Dispensary
Bhatwari Dispensary
HaTsil Dispensary
Purau1a Dispensary
Nau~aon Dispensary
Barkot Dispensary
Arakot Dispensary
Compouders Unit, Nilong
Beds
3
8
4
4
4
Maintained by Government' Local BodyfPrivate
4
Government
do
do
do
d.
do
do
do
do
Source-Director of Medical and Health Services, U. P

'OPPICIAL STATISTICS 114
Table 7'2-Mate:raity and Child Welfare OeIlters,'l'amily Piannhag Center, Rural Health Centres,
Maternity and Child Welfare Centre$
r-----------~-------------~ Name of Health Centres
Puraula
Natowar
Naugaon
Gadoli
Dawal
Kuthar
Maneri
Jhala
1
Bhaunkoli
Beds
2
Family Planning Centl'CI
Name of Health Centres
3
Puola Tahsils
Rajgarbi Tahsil
Naugaon
Dunda Tahsil
Bbatwari Tahsil
Rural Health Centres
r---------,--___ _ Beds Name of Health Centres Bed~,
5 6
Puraula
Naugaon
Dharasv
Bhatwari
Source-District Officer
Table "3-T, B. Clinics and Anti-Adulteration 1959-60
NOT AVAILABLE

Serial No.
2
Serial No.
1
2
3
4
5
6
.115
Table 8'1-Edaeatioaal hastltlltiODS aDd Pupils
1959-60 Class of Institutions r- --.....
No. of No. of Institution Pupils
2
UniversIty and Degree Colleges
Inter Colleges and Higher Secondary Schools 2 410
Junior High Schools 12 683
Training Schools
Technical Schools
Other Schools and Colleges 180 5,991
Source-District Officer
Table 8'2-List of Higher Secondary Schools 1960-61
Name of Higher Secondary Schools No. of Teachers No. of Pupils .---_ ...... _--
Males Females Males Females
2 3 5 6
Date of Establishment
7
Government Inter College 17 1 1914
High School, Puraula 8 77 1960
Source-District Inspector of Schools

O,PICU,I. STA.TISTICS 116
Table 9'1-Printing Presses and Newspapers
NIL
Table 9'2-Cinemas
NIL
Table 10' I-Length of Metalled and Un-metalled Roads Maintained by Public Authorities as on December 31, 1960
Name of Public Authority Metalled Un-metalled Total Name of important Bridges roads roads roads (Kms.) (Kms.) (Kms.)
2 3 4 5
P.W. D. 245 245 N.A.
.2 Notified Area N.A • N.A. N.A. N.A.
N.A.-Not available Source-District Officer
Table to'2-Names of waterways (Navigable Rivers) as aD December, 31,1960
INFORMATION NOT AVAILABLE

117 COMMUNICA'l'IOM
Table 10'3-Polymetrical Table of Distances of Block Headquarters
(Distance in Kms.)
Name of Blocks r-----. --------__,._----------------...-...., Headquarters of N. E. S., Shadow Dunda
Block in the District Bhatwari Purola Rajgarh
2 3 4 5
Dunda 43 96 82
2 Bhatwari 43 139 125
3 Puraula 96 139 34
4 Rajgarhi 82 125 34
Source....,...Diilr ict Officer
Table IO'4-List of Railway Stations
NIL
Table IO'S-List of Post Offices
Serial Name of Post Office 1961 Serial Name of Post Office 1961 No. Code No. No. Code No.
1 2 3 1 2 3
ParaDIa Tahsil 6 Chhajula 80
Puraula 138 7 Dikholi 184 8 Khalshi 216
Rajgarhi Tahsil 9 Jogat Talla ~19
2 Rajgarhi 43 Bhatwari Tabid 3 Barkot 86 4 Kadari 157
10 Gangotri 5 Dunda Tahsil 11 Jhala 8
12 Bhatwari 24 Dunda 25 13 Naugaon 63
Source-Post Master General, U.P

OfPlCIAL !>TATISTICS 1I8
Tabe l1-Stati.dc8 of Local Bodies Receipts and &penditure
Name of Local
Bodies
Notified Area
2 Panchayats (all gaon Panchayats,ofthe district)
Name of Local Bodies
Notified Area
2 panchayats (all gaon Panchayats of the' district)
(Figures in RupelS}
1950-51 1951-52 1952-53 1953-54 1954-55
Receipt Expenditure Receipt Expenditure Receipt Expenditure Receipt Expenditure Receipt Expenditure·
2 3 4- 5 6 7 8 9 10 11
4,432 3,609 7,093 5,716 10,562 8,834: 7,842 5,691 12,895 1'0,461
7,443 5,941 10,272 8,752 13,454 9,202 13,992 14,893 20,278 18,626.
1955-56 1956-57 1957-58 1958-59 1959-60
r----.,......_----, ,..-----"----.---. r----J....--~ r----_,._--~ ,----~ __ __. Receipt Expenditure Receipt Expenditure Receipt Expenditure Receipt Expenditure Receipt Expenditure
12 13 14 15 16 17 18 19 20 21
14,817 10,105 12,8')7 8,122 11,629 10,018 23,739 12,195 22,177 13,500
203,562 198,716 205,725 35,002 327,123 327,214 322,644 321,567 319,303 295,60.'
Source-District Officer

U9
Table 12-S .. ti .... of Co ..... aliity Development Serial Particulars
No.· 1 2
Distribution of Kharif seeds (in maunds) (a) Paddy (b) Maize
(cl Cotton (d) Others
2 Distribution of Rabi seeds (in maunds) (a) Wheat (b) Bayley (c) (kam (d) Pea
3 Distribution of Chemicals and other type of Manures (in maunds)(a) Nitrogenous (b) Phosphates (c) Others
4 Total number of agricultural implements supplied
5 Total number of exhibitions held
6
7
8
9
10 11
12 13
14 15
16
17
18 19
20
21
22 23 24 25 26 27 28 29 30
31 32
33
Total area of paddy under Japanese method of cultivation (in acres)
Total area of wheat under Uttar Pradesh method of cultivation (in acres)
Total area of green manure cultivation (in acres)
Reclamation of cultivable waste land for agriculture (in acres)
Increased area for gardens (in acres)
Total number of fruit trees planted
Pres~rvation of land from soil erosion by various methods (in acres)
Increase in the irrigation acreage of land by various means of irrigation (in acres)
Distribution of Bulls of pure breed
Animals vaccinated
Distribution of Poultry of pure breed
Cattle artificially inseminated
Wells built
Hand pumps fitted
Wells repaired
Pucca sewerage (in yards)
Lanes made pucca
Soak pits dug
Persons vaccinated
Maternity centres opened
Schools opened.
Libraries, Reading-rooms and information centres opened
Adults made literate
Radio sets installed
Youth associations formed
Panch a yatgha r constructed
Pucca roads construcled (in miles)
Kachcha roads constructed (in miles)
34 Pucca roads repaired (in miles)
35
36 37
'38
39 <W -41
Kachcha roads repaired (in miles)
Culverts constructed
Panchayat tax realized (in rupees)
Houses constructed for Harijans
Women Welfare Societies formed
Members enlisted in the Women Welfare Societies
Cottage Industry centres opened
COMMUNITY DBVBJ.O,MBNlt
1956
3
31 1
5 58 15
58
2
40 3,904-
5
5
668
2,825
I
1
190 8
2
3,000
1960
4
566 5
12 1,768
175 5
55 41 10
593
26 2-
1,435 3,345-
212 75
445
65,618
368
961 25
3,354
375
64
40(}
2,494 6,836
9< 13o.
82
2,366-54 64 43
153
Source-District Ofticel"

-OFFICIAL STATISTIC! .120
Table 13-Calendar of Important Events
Year Description of Events
2
1881 (i) First road constructed upto Gangotri (ii) Construction of Dak Bangalow at Jamgla, HaNil, Bhatuani and Uttarkashi
1897 Silo cultural System introduced'
1907 Forest Settlement of Rai Bahadur Pt. Ram Dutt Tewari
1912 Severe famine
1919 Severe outbreak of cholera and Influenza
1922 (i) Flood (ii) Settlement (Land records)
1924 Unprecedented rains and floods
1930 Revolt in Rawain against the rules of Tehri Garhwal
1942 Settlement (Land records)
1945 Floods
1949 (il Merging of Tehri State in Uttar Pradesh (ii) Renovation of Gangotri Temple
1957 Construction of Dharasu Dunda and Uttar Kashi Motor road
1958 Establishment offruit Nursery
1959 Opening of Dharasu Barkot Motor Road
1%0 (i) Establishment of separate district of Uttarkashi
(ii) Formation of Tahsil Bhatwari, Dunda, Puraula and Rajgarhi
Source-District Officer
Table 14-Monthly Whole-sale Prices-1951 to 1960
NOT AVAILABLE
Table 15'1-Statistics of Banks
NIL
'Iable 15'2-Statistics of Insurance-1960
NIL

121
Table 16.......st.ti.tlc.· ofl.lvestock
Particulan
({I) Cows and Bulls-
(A) Males over 3 years
(i) Breeding bulls i.e. ,- entire males over 3 years kept or used for breeding purpose only
(ii) Working bullocks, i.e., bullocks and uncastrated males over 3 years kept for work only
( iii) Bulls and bullocks over 3 years not in use for breeding or work
.{B) F6males over 3 years
(i) Breeding cows, i.e., cows over 3 years kept for breeding Of milk pro duction
(ii) Cows over 3 years used for work only
(iii) Other cows over 3 years not in use for work or breeding purposes
'.(C) Young-stock (3 years and under)-
(i) Under one year
{ii) One to 3 years
Malt's
Femalea
Total
[n milk
Dry
Not calved
Male.
Females
Total
Males
Females
Total
Males
Females
Total
Total
2
~7,462
51,544
'9,006
35,220
298
34,719
203
34,825
34,248
11,785
17,829
4,634
219
358
12,242
16,719
28,961
6,828
8,911
15,739
5,414
7,808
13,222
. . _. . ~ . LIVBSTOCI\
1961 ~/
Rural Urban
3 4-
47,398 64
51,233 311
98,456 550
35,220
298
34,719
203
34,631 194
34,060 188
1l,691 94
17,748 81
4,621 13
219
352 6
12,178 64
16,602 117
28,780 181
6,789 39
8,848 63
15,637 102
5,389 25
·7,754 54
13,143 7.

e •• 1ClIAL STA TlSTICS
Table I6-Stati.tic& of Live.tock-Contd.
(U) Buffaloes-
(A) Males OVIT' 3 years
Particulars
Male.
Females
Total
(i) Breeding bulls, -i.e., entire males over 3 years kept or used for breeding purpose only
.(ii) Working bullocks, i.e., bullocks and uncastrated males over :3 years kept for work only
(iii) Bulls and bullocks over 3 years not in use for breeding or work
(8) Plmales· oll,r 3 years
(i) Breeding cows, i.e., cows over 3 year. kept for. breeding or milk production
In milk
IJry
Not calved
(ii) Cows over 3 years used for work only
(iii) Other cows over 3 years not in use for work or breeding purposes
(e) Young-stock (3 years and under) Males
Females
Total
(i) Under one year Males
Females
Total
(ii) One to 3 years Males
Females
To&al
Total
2
1,520
25,654
27,174
653
571
55
29
18,804
18,741
8,002
8,634
2,105
10
53
867
6,850
7,717
529
3,284
3,813
338
~,566
3,!IOt
1961
--Rural Urban.
3 4
1,517 3
25,540 114
27,057 117
"53
571
55
29
18,716 86
18,657 84
7,954 .4~
8,599 35
2,104
8 2.
51 2.
864 3.
6,824 26
7,688 2!}'
529
3,274 10·
3,803 1-0·'
335 3
3,550 Hi
3,885 1~

(ID)Sheep-
(IV) Goats-
(V) Ducks-
(VI) Poultry-
Table
Particulars
(i) Up to one year-
(ii) Over one year
(i) Up to ODe year-
(ii) Over ODe year
Ducks
Drakes
Duckling'
Hen$
Cocks
Chickens
123
16-Statistic. of
Males
Females
Total
Males
Females
Total
Li"estock-Condcl.
Total
2
12,428
11,164
33,396
f1,760
1l,743
~8,770
35,075
43,845
1,009
444
939
1960
Rural
3
12,428
11,157
33,385
44,542
11,743
8,770
35,065
43,835
989
433
908
LIVB&1'e_1
Urban
4
1
11
18:
II}
1&
20
11
31
Source-Director of Animal Husbandary, U.p·

O),'l'ICIAL STATISTICS 1'24
Table 17'l-List of Serial Name of the Fair Name of Village{ Name ()f Development Month and Date Name of Festival, if any. No. Tuwn Block of the Fair' with which connected
2 3 4 5 6
PaDula I Vishwat Sankranti Khaladi Puraula Vaisakha Badi 1
2 Moltari Moltari Badi 4
Pahari Janki 5 3 Bishu Khaniyosani
" Badi 4-5 Doni t. Ot Badi 3 Jabbd
" Badi 2-4 4- Mawi Sundari Jyais tha Sudi 5
Puraula " No date fixed
Bhankoli
:5 Thala Osala .. Asadha Sudi 15
Jobbol " Sravana Badi 4
Fatari " .. Sudi 12
Lawari Sudi 14 Bhilari ., Sudi 5 Masri .. to Sudi 6
~ Odas Jakbandi Devta-ka-Mela Kumola .. " Sudi 5 Rama .. Sudi 6-7
7 Jattar Bokal "
Sudi 5
Bhotanu " Badi 1
Dewara Bhaodra Badi
S Bhadra Kali Devi-ka-Mela Binai Bhadra
9 Jagra Kotigaon "
Chi~wa " " . Arokote
" Bhotanu
It " Natowar
" Deojani
Kharsari It "
Rajgarbi 10 Jatra Dakhyat Gaon Naugaon Vaisakha Badi 2
Sarnol " Jyaistha Sudi 2
... ; "{haul Than .. Asadha Badi 1 12 Davrana Tiyan .. Badi 30 13 Molthat Dawal
" Sudi·l " 14 Tansa Kantari Badi 30 .. It
15 Tunger Kalojgaon .. Sudi 2

125 .,AI1\S AND l'l:ISTIVALS
_FIPrs Distance from
Purpose, (worship of Estimated Nearest Railway the Railway or Commodities brought Deity, Bath, Urs, Cattle Congregation Station .. r Bus Bus Station to the fair for sale
fair, etc.) Station (in Km.)
7 tl 9 10 11
Tahsil
Worship of Nag Devta 1,000 Barkot B. S. 24 Toys, sweets, religious pictures and articles of general rnerchand iae
Worship of Odasu Devla 2,500 " 30 II
2,500 30
Di~play of Dhanush and Ban 1,500 58 "
2,000 66 " 1,500 69
" 4,000 26 Blankets, baskets, rnedicines, honey, rubber and
clay toys,
4,000 "
24 "
6,000 26
Display of Danush and Ban 350 88 Sweets and toys
" 350 69
" 350 77
350 83
350 _" 59
350- 66
Worship ofGdas Devta 1;000 21 Toys, sweets and articles of general merchandise
2,000 ,; 34- " 400 101
400 66
600 " 34
-Worship of Bhadra Kali Dev 1 1,000 24:
1,500 40 "
400 94-
500 110
400 ~6
600 56
1,000 47 "
400 38 "
- Tahsil
Worship ef Shi, a 3,000 .. 8 Rubber. and wooden toys, baskets, reli"'ious photos, and articles of gen-=ral rnerchandise '"
Worship of ,Rarn~k Devi 2,500 H
Worship of deity 2,000 " 10
Worship of Devi 4,000 " 54
WorshijJ cf.Chhilora Nag 1'1500 " 35
"Worship of Devi 1,000 " ~8
800 " '35

OPFlCIAL STATISTICS 126
- Table 17'1-List of'
Serial Name of the Fair Name of Village! Name of Deveillpment Month and Date Name of Festival, if any,
No. Town Block of the Fair witl;l Wh,Ch connected
2 3 4 5 6
16 Thaul Koti Banal Naugaoo Sravana Badi 3
17 Chhilora Dewal Sravana
18 Durwashtmi Ga:r Bhadra
19 Dew [ang Gair " Kartika Diwali
Koti Banal
-20 Gangaoi Nandgaon Magha Badi 30
Dunda_
21 Dhanari Pujargaoo Pujargaon Dunda Vaiaskha Badi 7
Darmali " 22 Bishtpatti '>Iagun Chir,yali Saroth "
Sudi 15
Nagani
23 Gauri Ra\ntal RavantaI " Badi 3
Adani
-Jaspur " Margaol'l
24 Barsali Garh Garh
Gow
Malli
Bareti " " Barsa!i "
25 Gajnakhathur Thati RamaH Bareth " Asvina Sudi 14
. Garh ThaIi
KandiyaIgaon " 26 Gajnakhathur Narpar Barethi Asvina
New Hundiyana
,Naipar
Mathi Dhaneti t'
Pokhriyal Gaon
Bhatwari<
27 Fulali Barsoo Bhatwari Asadha and Sravana
Dwari'
Raithal " " Agora
Dasara

'Fairs-Contd.
Purpose, (Worship of Estimated Nearest Railway Deity, Bath, Urs, Cattle Congregation Station or Bus
fair, etc.)
7
Worship ot Devl
Worshih of Chhilora Nag
Tahsil
Worship of Devi
Valsakl)i
" Worship of Devi
"
" " ..
»
Worship of Deity
.. "
Tahsil
Worship of Deity
..
8
'2',000
2,500
1,000
2,500
3,000
2:000
600
800
3,000
3,00(J
1,200
1,200
1,200
1,300
60u
600
800
600
800
1,200
1,200
1,300
-1,200
1,300
1,200
1,200
1,000
80·J
600
900
600
600
Station
9
Barkot B.S.
Duuda B.S.
" Nagun B.S.
"
"
" .. Raturi Sera B.S.
" .. " ..
Bhaldiyana B.S.
" .. " ..
Uttar Kashi B.S.
127
Distance from the Railway or Bus Station
(in Km.)
10
13
42 ~
42
13
8
6
6
4
4
1~'
13
13
13
6
6
()
6
6
19
19
19-
21
21
2l
21
21
N.A.
FAIRS AND FESTIVALS
Commodities brought to the fair for sale
11
Rubber and wooden tOyS, baskets, religious photos andarticles of general merchandise
" .. ,.
.. .. ..
Toys and sweet~
"
..

-onCIAL sTATIstICS
:Serial llJo.
2B
29
.30
.31
Name of the Fair
2
Bhadranj
Baliraj
Makar Sank ranti
Basant Panchi
N.A_Not available
Name of Villag'J, Town
3
Saku
Gajo!i
Bhaunkoli
Naugaon
Dandalka
Pilonk
Bajori
Mar pur
Kishanpur
128
Name of Developlllent Block
4
Bhatwari
OJ
..
.. .. .. .. ..
Ottar Kashi Notified Area
t;
Mondt and Date of the Fait'
5
Asadha and Sravan",
" "
Bhadra
Agr",hayana
January 14
Magha Sudi 5
Table! 17'1-List of
Name of Festival, if any. with which conn~cted
5
Makar Sanl:ranti
Basant Panchmi

Fa'rs-Condd.
Purpose, (worship of Deity, Bath, Urs, Cattle
fair, etc.)
7
'Worship of Deity
..
.. .. ..
Estimated Congregation
8
900
600 600
500
600
800
.Sheep or generally taken out 500 for bath
Worship 700 .. 900
.Bath in [he ri\er 3,000
.. 3,000
Nearest Railway Station or Bus
Station
9
Uttar Kashi B.S.
..
..
129
Distance from the Railway or
Bus Station (in Km.)
10
N.A.
"
l'AlllS AND 1:1ll1STrVAI 8
Commodities brought to the Fair for sale
11
Toys and sweets
.. ..
.. "
..
.. Woollen goods, blankets,.baskets mediclDes, toys, sweetS, etc.
Source-District Officer

OFPICIAL STATISTICS
Serial No.
2
3
4
5
6
7
8
9
10
11
12
13
14
15
16
17
18
19
20
21
22
23
24
25
26
27
28
29
Naml' ot' festivals
2
Ram Naumi
Baisakhi Purnima
Ganga or Jeth Dussehra
Nag Panchmi
Raksha Bandhan
Janam Ashtmi
Hartalika Teej
Ganesh Chaturdashi
Allant Chaturdashi
Pitra Visarjan Amavasya
Durga Naumi
Vijaya Dashmi (Dussehra)
Dhan Teras
Chhoti Diwali (Narak Chaudas)
Deepawali
Goverdhan Puja (Annkoot)
Bhaiya Dooj
Gopashtmi
Kartiki Purnamashi
Makar Sankranti
Rasant Panchmi
Shivratri
Holi
Id-uz-Zuha
Moharram
Chehllum
Barawafat
~ habe-e-Barat
Id-ul-Fitar
130
Table 17'2- List of Festivals
Date of Occ.asion
Chaitra Sudi
Vaisakha Sudi
Jyaistha Sudi
Sravana Sudi
Bhadra Badi
" Sudi
"
Asvina Badi
" Sudi
Kartika Badi
Sudi
14th January
Magha Sudi
Phalguna Badi
Sudi
10th of Zilhij
9
15
10
5
15
8
3
4
14
30
9
10
13
14
30
2
8
15
II
5
13
15
10th of Moharram
20th of Safar
12th of Rabi-ul-Awwa1
14th of Shahan
lst of Shawwal
Whether observed by all, by a particu1a~ community or people of particular religion.
4
Hindu
..
"
Muslim
"
" .. S&lurc~-nistrict Offic~r

lS1 HATS A.ND BAZAa.s
Table 17'3--List of Hats and Bazars (Rttral)
NIL
Table I8'I-List of Rural ~rafts and Number of Persons Employed in Production
Number of Persons Employed in Production Name of Craft Number of Villages ,----------"'-------------.
Persons Males Females
2 3 4 5
Cotton Textiles 3 5 5
Leather Footwear 42 319 255 64
Basketry 35 580 495 85
Pottery 4 13 10 3
Brass and Copper-ware 2 4 3
Woollen Blanket 23 273 174- 99
Woollen Carpet 21 208 128 80

OgglCI,AL STATISTICS
Name of Craft
Cotton Textiles
Leather Footwear
Basketry
'Pottery
Brass and Copper-wa~e
Woollen Blanket
Woollen Carpet
132
Table 18'1-Distribution of Artisan Communities
Name of Caste or Community
2
Harijan
Kol
Chamar
Bajgi
Dom
Ruria
Chamar
Kolta
Harijan
Rajput
Shilpkar
Brahmin
Sanslya
Ringara
Kumhar
Tamta
Kolta
Kol
Rajput
Shilpkar
Kolta
Kol
Bajgi
Kari
Bhotiya
Number of
Villages surveyed
3
2
42
10
2
4
2
5
10
3
2
4
2
14
7
8
8
.2
.2
Approximate
number of familIes
4
3
191
32
3
33
10
3
3-9
187
40
10
18
2
9
2
59
27
20
15
73
27
16
3
3
Total Number of Workers ~------~----------~ Persons Males Females
5 6 7
2 2
3 3
319 255 64
54 29 25
7 5 2
90 90
11 11
7 4 3
63 48 15
234 219 15
71 51 20
13 10 3
25 25
5 3 2
13 10 3
4 3
146 86 60
57 18 39
40 40
~O 30
126 75 51
47 28 19
20 17 3
4 4
11 4 7
Number of families working under
co-operation
8
Number of fan:lilies working in own houses
Number of famibo
working in workshops set up by
their employers
9 10
3
191
32
3
33
10
3
39
187
40
10
18
2
9
2
59
27
20
15
73
27
16
3
3

133 HANDICRAl'TS.
Table lS'3-Materials used, Source of Design, Manufacture and Marketing of Maaufactured Articles
Name of Craft No. of Villages Source of Design No. of Villages
Name of Article Name of Main engaged in ,- which produce Ma.terial Ma.nufacture for sale in
Traditional AU olners open markets
1 2- 3 4- 5 6 7
Cotton Telltiles Chadar Cotton·ya.rn :3 B 3
Bendi 1 I 1
Leather Feotwear Shoe Leather 42 42 42
Chappal .. 2 2 2
Basketry Basket Ringal and Khaiur leaves 35 35 35
Kandi .. 13 13 n Ghilta 13 13 13
Pitarey 4 4 4
Pottery Gharey Clay :3 3 :3
Chilam 3 3 :>,
KaWJree .. j
Surahi I
Handi.
Diya
Matka 1
Buss and Copper-ware Banta Brass 2 N.A. 2
Dol chi 2 N.h. 2. .. Gagar Cop per 2 N.A. 2
Woollen Blanket Blanket Wa<ll 23 23 23
Wo.llen {Jarpet Carprt 2.1 i1 21 "
Table 19-5tatistics of Major and Medium Projects taken up for )~secution Duri~ the I, II and tIl Plans
NIL
Table 20- Statistics of 'Wags \
NOT AVAILABLE
No. of Villages-where there
are Co-opera-live Societies..
8


PART III
VILLAGE DIRECTORY


ill
DEFINITIONS OF COLUMN HEADINGS OF THE VILl..AGE DIRECTORY
Village ordinarily means a revenue mauta,
whether inhabited or uninhabited. If some structures and population come into existence at a place which lies within the boundaries of two or more revenue mauzas, the locality has been treated as a separate Census Village and the portions covered in it are excluded from the revenue mauZas concerned. -
Town means any Corporation, Municipality, Notified Area, Cantonment, and includes a locality which. though not in itself a local body, is part of a town_group, and also any place which has (a) a population of at least 5,000 (b) at least three-fourths of
the population dependent on non-agricultural
means ofliyelihood, and (c) a density of at least 1,000
persons per square mile.
City means a town or a town-group having a popUlation of one lakh and above.
Notations
E-Electrifie d
R-Connected by Road
Rly-Connected by Railw~y
Riv-River
L-Library
Mp-Medical Practitioner
Hos-Hospital
Mew-Maternity and Child Welfare Centre
H-Higher Seconliary School
Po-Post Office
Occupied House means a structure or part of a building, used wholly or partly as human dwelling, and having a separate main exit.
Household means a group of persons, who Commonly live together and take their meals from a COmmon kitchen, unless exigencies of work prevent any of them from doing so.
Total population includes household poputatioA, institutional popUlation and houseless popUlation.
Scheduled Castes the 66 Scheduled Castes as
defined in the President's The Scheduled Castes and
Seheduled Tribes Lists (Modification) Order, 1956.
Literate means a person above the age of five Who can read as well as write.
Worker means a person gainfully employed in any economic activity and is actually working, super
vising or directing the work.
WORKING POPULATION HAS BEEN DIVIDED INTO
THE FOLLOWING IX CATEGORIES
Category-I working as cultivator, i.e., engaged in cultivation, including effective supervision and direcion ofland owned or held.
Category-II working as Agricultural labourer, i.e., working in some one else's land for wages in
cash or kind.
Category-III working in Mining, Quarrying, Livestock, Forestry, Fishing, Hunting, Plantations,
Orchards and allied activities.
Category-IV working at Household industry, i.e;', an industry, not on the scale of a registered factory, conducted by the head of the household himself and/or mainly members of the household at home or within the village in rural areas and only at home in urban areas, with or without hired labour.
Category-V working in Manufacturing other than Household Industry, i.e., engaged in production, fabrication, processing, repairs or servicing ()f any kind, not included in Household industry.

Category-VI working in Construction, i:e.~ engaged in construction and maintenance of bUlldmgs. roads, railways, bridges, tunnels, telegraph and telephone lines, dams, canals, tanks, tube wells, etc.
Category-VII working in Trade and Commerce, i.e., engaged in buying and :>eUing, import and
export banking, insurance, stocks, shares, etc. , , '
Category-VIII working in Transport, Storage and Communication, i.e., engaged in transport by man, a~imal, air, water, road, rail, etc. in warehousing; Post and Telegraphs; Telephones; and Information and Broadcasting.
Category-IX working in Other Services Le., engaged in public, administrative, educational and scientific. medical and health. religious. welfare, legal, business, community, recreation, personal and other miscellaneous services, etc.
iY
Non-worker (Category-X) means a person who
is not doing any productive work. The following
have been treated as Non-workers.
(i) a whole time student not doing any work;
(ii) a house worker not engaged in any remune
rative work;
(iii) a dependent including infant or child not attending school, old or disabled person not doing any work;
(iv) a retired person (not re-employed), rents, royalty or dividend receiver, not doing any work;
(v) a beggar, vagrant or an independent woman
of unspecified source of income ;
(vi) a convict in jail (not an under trial) Or inmate of penal, mental or charitable institution;
(vii) a person' in search of employment for the first time, and
(viii) a person having worked before but now out of employment and .seeking fresh employment.

PURAULA TAHSIL

Sl. No.
Name of Village
1
1 Alasu 2 Arakote
3 Bainol
4- Balawat
5 Bamsu
6 Bari 7 Barnali 8 Basti Palli
9 Basti Walli
10 Bengal
11 Bhadrali
12 Bhakoli 13 Bhankwakdi
14 Bhitari 15 Bhotanu
16 Binai
2
17 Bingathera MalIa
18 Bingthera Talla 19 Bingsari
20 Chada
21 Chamrota 22 Chandeli 23 Chaptari
24 Chhab Ala
25 Chhani
26 Dagoli 27 Dakara 28 Dandagaon 29 Dangangaon
30 Daumana
31 Deojani 32 Deoti 33 Dewa Dhung
34 Dewal 35 Dewara
36 Dhampur 37 Dhamti 38 Dhara 39 Dhara 40 Dhatmir-
vi
ALPHABETICAL LIST OF VILLAGES
SI. No. in Village
Directory
3
7 16 55
6
30
5B
12
104
103
22
118
163 24-66
IB
152
158 159 32
129
164 151
144-126 95
15 133
37 44
137
38 25
125 69 50
123
17
10
til
85
PURAULA TAHSIL
SI. No.
Name of Village
2
41 Dhokari
42 Dhokhariyani 43 Dikalgaon 44 Dingari
45 Dobhalgaon
46 Doni
47 Duchanu 48 Fatari
49 Gainchawangaon 50 Gain
51 Gangar
52 Gaul 53 Gchiyan
54 Ghundada 55 Gokal
56 Gudiyatgaon t,7 Gurari
58 Guwalgaon
59 Hadwari 60 Haltari
61 Huduli 62 Jabanu 63 Jagata 64 Jakhol
65 Jhutari
66 Kalap 67 KaIih 68 Kamara.
69 Kamarha 70 Kantari
71 Kasla
72 Karda
73 KasIaun 74 Khaladi 75 Khana
76 Khandiyalgaon 77 Khaniya'Sani
78 Kharkia Sem 79 Kharsari 80 Kherami
81. No. in Village
Direct.ory
3
112 98
107 92 35
65
2 75 49
160
84 96 3
122 11
101
48
62 59 45
157
39
4 74 9
52 13
148
46
153
78
136
94 145
61
109 67
114 34
33
SI. No.
Name of V iIlage
81 Kimdara 82 Kiranu
83 Kiroli "-84 Kofara
85 Koma
86' Kotgaon 87 Koti 88; Kukera 89 Kumar Kot 90 Kumola
91 Kunara
92 Kurara 93 Lamkoti 94 Lawari
95 Lawatari
96 Lodrala
97 Mahargaon
98 Maljyani
99 Mairiyana 100 Makhan
101 Makori 102 Malkot
103 Masri
104 Matta Malia 105 Mautar
106 Moltari
2
107 Moltari Rajput Pari lOB Monda
109 Nag JhaUa
110 , Nailari
III Nanai
112 N~towar
113 Natri
114 Naud
115 Nuranu
116 Odatha
117 Osala
118 Painsar
119 Panigaon Gaunri 120 Pasha
SI No.in Village
Directory
3
93
19
132
143
'&9
124 23
117
142
43 130
113 79
91
42 III
20 134
139
14 128
63 115 54
116 106
8
lOB 154
31
53 149
141 57
29 82
47 155 41

!Vii
ALPHABETIOAL LIST OF VILLAGBS
PURAULA TAHSIL-Gncld.
81. No. in 81. No. in 81. No. in Sol. Name of Village Village S1. Name of Village Village S1. Name of Village Village No. Directory No. Directory No. Directory
2 3 2 3 2 3
121 PaunMalla 71 146 Saur 86 170 Hariki Deon F. 3 (2)
122 Paun Talla 70 147 Sawa 60 171 Istaragarh F. 3 (3)
123 Paunti 97 148 Sawani 77 172 Jakh F. 5 (1) 124 Pawali 21 149 Sewehangaon 51 173 Jarmo1a F. 4 (2) 125 Pawani 83 150 Sbri Kot 121 174 Kasedi F. I (1)
126 Peteri 28 151 Sidari 88 175 Kulni F. 2 (3) 127 Pokhari 40 152 Sikaru 135 176 Khunigarh F. 4(4)' 128 Para 105 153 Sirga 72 177 Lambathach F. 1 (4) 129 Pujali 68 154 Suil 150 178 Lunagarh F.4(3) 130 Pujali Khaladi 146 155 Sukadalla 119 179 Moldi F. 1 (6)
131 Pujali Kumol 140 156 Sunali 120 180 Mori F.4(6) 132 Purola 138 157 SUDkundi 73 181 Nasana F.4{7} 133 ' Ramalgaon 36 158 Syaluka 99 1B2 Pajudhar F. 1 (3) 134 Rana 102 159 Thaduga 161 183 Rikhoti F.:> (2) 135 Ratari 131 160 Thakaradi 127 184 Ringali F. 4 (1)
136 Raun 100 16l Thali 26 185 Sandhara' F.2 (4) 137 Regeha BO 162 Thali 162 186 Sandhra F.4(5) 138 Salva 56 163 Thapli 5 187 Sankriyad F.2(5) 139 Sankari 87 16-1: Udkoti IlO 18B Taluka F. 3 (I) 140 Sank Khala 147 FOREST RANGE
141 Sar 90 165 Asna F. 2 (2)
142 Saras 27 166 Balcha F. 1 (2) U3 Satagaon 64 167 Chnda Dokbar F.6(1) 144 Satudi 76 168 Chhatari F. 1 (5) .145 Saundari 156 169 Deota F. 2(1)

VILLAGE.
PURAULA TAHSIL
Occu-Seriai Name of Village Number Area pied House- Total Population Scheduled Literate and
No. (Notations for a~enities) of in Resi- holds Castes ed ucate'd persons Hamlets acres dential
Houses
,.---..,.. ~....__ ........ ,--....___, P M F M F M F
2 3 4 5 6 7 8 9 10 11 12 13
PURAULA BLOCK
1 Kiranu 3 99 46 46 372 224 148 18 6 52 3 2 Duchanu 1 48 21 21 182 87 95 4 4 ·22 3 Gchiyan 1 46 29 30 147 71 76 19 7 21 4-4 Jagata 1 40 20 20 150 73 77 3 4 14 5 Thapli I 13 4 4 29 10 19
6 Balawat 1 45 14 14 104 48 56 1.(-7 Alasu 1 5 2 2 10 8 2 1 8 Monda 1 73 18 19 126 67 59 15 9 Jhutari 1 156 24 25 178 89 89 29 2
10 Dhara 1 19 7 8 41 24 17 6
11 Gokal 1 68 12 15 120 60 60 13 12 Bamali 1 32 8 8 53 27 26 11 13 Kalih I 66 23 23 185 102 83 12 14 Makori 1- 89 21 21 143 68 75 14 15 Dagoli 1 40 21 23 174 91 83 6 2 49
16 Arakote Riv, Mp, Has. I 51 44 46 364 228 136 16 8 83 20 17 Dhamti 2 177 32 32 228 109 119 24 .. 18 Bhotanu I 70 29 29 213 88 125 5 3 38 8 19 KiroH 1 53 15 15 98 46 52 24 2 20 Maijyani 2 57 50 50 121 81 40 4 8 15
21 Pawali 2 33 20 20 286 163 123 II -is 7 22 Bengal 3 39 18 18 137 65 72 8 23 Kukera 1 64 22 22 161 84 77 4- 4 24 Bhankwakdi 2 64 32 32 172 87 85 4, 13 1 25 Deoti 2 22 18 18 95 43 47 17 5
26 Thali 2 58 19 19 129 67 62 19 27 Saras 2 61 19 19 130 80 50 19 28 Peteri 2 30 12 12 90 42 48 12 29 Odatha 2 42 26 26 173 81 92 18 2 30 Bamsu 3 45 22 22 163 81 82 11 7 25 1
31 Nanai 2 135 51 51 197 108 89 11 7 41 1 32 Bingsari 1 72 32 32 171 103 68 7 4 36 1 33 Kherami 1 42 11 11 67 37 30 1 34 Kharsari 2 110 35 35 192 103 89 16 11 34 1 35 Dobhalgaon Mp. 2 86 27 27 154 81 73 37 5
36 Ramalgaon 1 51 13 13 50 27 23 11 1 37 Dandagaon 1 23 10 10 64 34 30 15 1 38 Deojani 3 260 74 74 \474 242 232 2 5 33 39 Jabanu 1 48 5 5 2'2 11 11 11 11 40 Pokhari 1 80 15 15 85 38 47 2
41 Pasha 1 59 17 17 93 45 48 3 42 Lodrala 43 Kunara 1 86 13 13 85 41 44 6 44 Dangangoan
1 43 14 14 68 35 33 5 45 Haltari 1 201 62 62 331 167 164 34- 20 13 '"
1 70 20 :w 100 49 51 12

· "-loll
Ola:EcTOR 1l
RURAL'
WORKERS
,---,.....--->-- NON-Total Woriers
" ' -- WORKERS (I-IX)
I II III IV V VI VII VIII IX X Serjal No.
____..,.____, ,....--. ,........,._._. ~
,........._. ,....-J'--o ,~ ~ ,---""'__~
M F M F M F M F M F M F M F M F M F M F M F
14 15 16 17 18 19 20 21 22 23 24 25 26 27 28 29 30 31 32 33 34 35
PURAULA BLOCK
169 93 87 93 18 1 14 ~9 55 55 1
59 59 57 59 I 1 ... 28 36 2 <+7 57 34 56 2. 5 1 1 2 24 19 3 52 56 52 56 21 21 4
6 14 6 14 4: 5 5
32 39 32 39 16 17 6
2 2 2 2 6 7
43 36 42 36 1 24 23 II
'0 65 58 65 2 29 24: !l
12 13 11 13 a·:· 12 4 10
38 47 38 47 22 13 11
14 16 14 16 13 10 12
66 60 57 60 1 8 36 23 13
oH 49 44 49 24 26 14
57 56 46 54 6 2 2 3 34 27 15
176 77 29 60 8 11 6 5 89 4 11 4-7 6 52 59 16
66 77 40 69 8 8 3 5 10 ,(,3 42 17
52 87 43 85 2 2 5 2 36 38 18
28 35 24 35 1 2 1 18 17 19
74 31 19 22 5 9 28 5 3 14 7 9 20
134 92 49 83 47 9 8 25 3 29. 31 21
37 8 23 7 4 10 1 28 64 • 22
44 18 27 16 17 2 40 59 23
i2 19 33 13 10 11 6 5 2 1 25 66 24
27 19 20 18 4: 2 1 .1 21 28 25 --32 39 32 39
35 23 26
43 39 35 37 2 2 4 37 11 27
27 25 26 25 15 23 28
51 60 44- 60 2 4 30 32 ,29
4!J 43 46 39 4 1 1 32 9 30
92 59 49 54 5 5 12 1 7 1 4 13 16 30 31 74 49 49 45 ] 3 3 ..... 2 ]6 3 29 ]9 32 26 24 25 24 1 II ij 33 71 58 39 52 5 5 12 8 6 32 31 34 46 35 26 32 1 2 4: 6 2 5 35 38 35
19 18 f8 16. 2 8 5 36
24 21 24 21 ... . .. 10 9 37
177 164 166 161 3 3 4 4 65 68 38
7 -4 7 4 4 7 39
23 26 23 26 15 21 40
'30 27 30 27 15 21 41
24 24 23 24 17 20 ,(,2
24 23 24 23 II 10 43,
1\4 97 114 97 53 67 44
35 31 35 31 14 20 45

x
VILLAGE
PUR AULA. TAHSIL
Occu-Serial Name of Village Number Area pied House- Total Population SchedUled Literate and
No. (Notations for amenitiee) of in Res i- holds Castes educated. persons Hamlets aeres dential
Houses
,--- ,--....;..____., ,.....----..... P M F M F M F
1 2 3 4 5 6 7 8 9 10 11 12 13
46 Kamarha 1 10 1 1 6 4 2 1 47 Painsar 1 73 18 18 119 68 51 7 48 Gurari 1 80 27 28 165 98 67 10 10 45 49 Gainehwangaon :2 137 36 36 181 95 86 37 1 50 Dewara t 57 34 34 166 87 79 42 36 29 7
51 Sewchangaon 1 41 10 10 70 36 34 3 52 Kalap 1 162 47 47 276 158 118 2 2 23 53 Natowar Riv,Mp, Mew. :2 35 44 44 191 104 87 26 20 47 4 54 Mautar 1 69 22 22 126 70 56 4 3 25 I 55 Bainol :2 30 9 9 69 35 34 3
56 Salva 3 114 43 43 255 140 115 18 57 Nuranu 1 66 16 16 129 77 52 4 58 Bari 1 72 38 38 231 129 102 89 60 9 59 Hadwari I 191 28 28 197 100 97 18 18 - 5 60 Sawa Riv. 1 70 20 20 122 75 47 37 23 6
61 Khana RIV. 1 69 21 21 159 71 88 11 14 4 62 Guwalgaon 1 32 4 4 48 25 23 9 12 3 63 Masri 1 234 67 67 438 223 215 59 51 10 64 Satagaon 1 170 43 43 255 134 121 71 54 15 65 Doni Riv. 1 206 63 63 418 227 191 91 62 43
66 Bhitari 1 424 101 102 616 318 298 86 70 17 67 Khaniya. Sani 1 193 58 58 326 166 160 24 68 Pujali 1 59 20 20 138 73 65 12 69 Dewal 1 31 6 6 39 25 14 1 70 Paun Talla 1 42 17 17 129 57 72 7
71 Paun MalIa 1 43 19 19 108 52 56 5 4 12 72. Sirga 1 135 33 33 194 106 88 11 4 9 73 Sunkundi 1 85 21 21 109 58 51 3 2 I 74, Jakhol 1 263 124 124 657 347 310 55 61 54 4 75 Fatari 1 142 75 75 412 204 208 28 31 43
76 Satudl 1 57 25 25 1I8 59 59 2 77 Sawani 1 24 10 10 48 23 25 .. 4 78 Kasla 1 87 32 32 179 78 101 13 18 6 79 Lawari 2 255 85 85 464 220 244 26 31 21 80 Regeha 1 104 37 37 200 101 99 18
81 Dhara 1 93 33 33 193 83 110 16 82 Osala 1 134 49 49 246 139 107 40 31 I 83 Pawani t 59 22 22 1I5 59 56 7 3 84 Gangar Riv. I 143 50 50 258 137 121 22 22 4 85 Dhiumir 1 90 57 58 326 177 149 2 I 20
86 Saur 1 123 40 40 230 126 104 39 19 2 87 Sankari 1 21 11 11 74 38 36 1 3 88 Sidari 1 119 33 33 197 106 91 8 7 1 89 Kotgaon 1 167 48 48 292 157 135 4 7 2 90 Sar 1 112 48 53 167 91 76 44.- 40 19

xi
Ollt1$C'tORY
.aURAL-Gontd.
WORKERS
NON-;fota1 Worken WORKERS
(I-IX) I II III IV V VI VII VIII IX X Serial
No.
,~ ,.--------. r--J'---, ~ ,.....~ ~~ ~ ~ ,.......-..... .---------.. M F M F M F M F M F M F M F M F M F M F M F
.J4 15 16 17 18 19 20 21 22 23 24 25 26 27 28 29 30 31 32 33 34 35
4- 2 4 2 46 44 30 40 30 3 1 24 21 47 71 46 66 46 3 1 1 27 21 48 64 62 53 61 2 4 31 24 49 60 40 37 40 23 27 39 50
21 21' 20, /21 .. 15 13 51 118 84 113 84 4 1 40 34 52 69 41 29 39 , .. II 2 3 7 16 35 46 53 44 29 21 28 1 7 3 2 10 26 27 54 29 20 29 20 6 14 55
'103 76 87 76 9 2 3 37 39 56 58 45 53 45 19 7 57 81 73 78 73 2 48 29 58 72 51 71 51 1 28 46 59 46 29 45 29 1 29 18 60
56 59 56 59 ... 15 29 61 16 14 16 14 9 9 62
175 141 17:- 141 48 72 63 94 82 2~2 40, 39 64
155 119 14' 4 2 4 72 72 65 20
222 201 20~ 201 17 96 97 66 124: 129 124 129 42 31 67 48 42 43 42 2 3 25 23 68 'f~, 11 12 11 13 3 69 42 53 42 53 15 19 70
40 35 39 35 1 12 21 71 85 61 82 60 3 21 27 72 47 44 47 44 11 7 73 '279 238 274 238 4 68 72 74
108 111 106 110 1 96 97 75
52 49 52 49 7 10 76 19 18 19 18 4 7 77 55 61 55 61 ... 23 40 78 144 154 144 154 76 90 79 59 56 59 56 42 43 80
60 72 60 72 23 38 81 li5 89 115 89 24 18 82
53 49 53 49 6 7 83 104 103 103 103 33 18 84 150 117 148 117 27 32 85
107 86 106 86 19 18 86 27 28 23 28 2 2 11 8 87 86 74 85 7~ 20 17 88
128 120 126 120 2 29 15 89 76 66 73 66 1 15 10 90

zii
VILLAGE
PURAULA TAHSIL
Occu-Serial Name of Village Number Area pied House- Total Population Scheduled Literate and No. (Notations for amenities) of in Reaj- holds Castes educated persons.
Hamlets acres dential Houses
,--_ ..... _---, r----"'------.. ,---------.
P M F M F M F
2 3 4 5 6 7 8 9 10 11 12 l3.
Lawatari I 106 25 29 119 67 52 12 7 13 91
1 1M 22 25 125 62 63 8 <1 15 92 Dingari
1 60 '20 20 93 41 52 9 2 93 Kimdara
1 40 10 12 77 41 36 3 2 9 94 K,as1aun
1 32 14 14 67 37 30 5 95 Chhani
96 Gaul 1 21 8 '8 44 26 18 5
97 Paunti 1 101 31 31 145 81 64 5 5 IS
98 Dhokhariyani 2 30 11 12 55 25 30 2 ' 4 99 Sya1uka 2 102 38 42 181 85 96 16 16 9
100 Raun 1 78 22 22 88 46 42 7 S 15
101 Gudiyatgaon Riv, Mp. 4 218 142 142 632 312 32 5 22 102 18 102 R'i!.na 3 159 67 67 322 61 161 I 21 91 46 i 103 Bastl WaHi 1 44 10 11 56 29 27 5 3 10 1 104 Bastl Pani 1 74 27 28 150 78 72 22 20 12 105 pora Riv,Mp. 2 164- 70 70 350 177 173 30 35 89 9
106 Moltari Rajput. Pari 1 39 22 22 81 44 37 4 4 ~ 107 Dikalgaon 1 48 15 16 68 30 38 3 lOB Nag Jballa 1 35 14 14 61 29 32 7 109 Khandiyalgaon r 386 87 87 398 205 193 24 22 35 2 110 Udkoti 1 56 19 19 76 37 39 29 31 6
111 Mahargaon 1 201 53 53 254 It) 144- 8 II 26 112 Dhokari 1 48 3 3 14 J 5 2 113 Lamkoti 1 41 17 17 71 37 34 6 8 7 c ... 114 Kharkia Sem 2 36 36 36 156 } 8 68 9 10 43 1 115 Matta Malia I 172 53 53 124 3 4 50 t
116 Moltari 1 35 12 13 41 22 19 22 19 6 1 117 KumarKot 1 8 8 37 20 17 16 3 118 Bhadrali Riv, Mp. 2 ." 6 24 24 92 47 45 28 2'" 9 'r; 119 Sukadalla 2 t 31 37 37 223 157 66 144 8 40 1 120 Sunali 2 91 50 51 262 129 133 68 41 40 4-
121 Shri Kot 1 53 22 25 132 68 64 68 34- 9 122 Gbundada Mp. 1 46 22 23 135 74 61 51 31 17 123 Dhampur I 31 22 24 87 42 45 42 35 10 124- Kati 1 BS 22 23 99 49 50 11 8 23 125 Dewa DhulJg 2 59 34 35 192 121 71 47 34 21
126 Chhabala 46 12 13 60 31 29 5 6 13 127 Thakaradi 34 II II 51 33 18 20 18 7 128 Malkot 78 Un-inhabited 129 Chada 40 JO II 62 34 28 25 20 B 130 Kurara 150 35 3B 197 112 85 32 27 31
131 Ratad 1 15 6 6 32 16 16 5 132 Kafara 1 32 19 19 169 88 81 8 11 19 2' 133 Dakara 1 76 43 43 238 119 119 13 17 16 2 IH Mairiyana 1 58 24 24 115 59 56 13 II 17 135 SikalU 1 48 9 9 61 35 26 2 1 7


xiv
VILLAGE
PURAULA TAHSIL
Occu-Serial Name of Village Number Area pied House- Total Population Scheduled Li terate and No. (Notations for amenities) of in Resi- holds Castes educated persons
Hamlets acres dential Houses
~ r--j.....--
P M F M F M 1<
2 3 4 5 6 7 8 9 10 11 12 13
136 Karda 132 31 31 166 88 78 12 11 21 137 Daumana 44 11 II 50 24 26 12 9 4 138 Purola Riv, Mp, Mew, H, Po. 130 70 102 471 299 172 34 48 159 37 139 Makhan 17 19 19 104 77 27 26 11 15 1 140 Pujali KUIllal 72 32 36 158 87 71 23 29 34 2
141 Nauri 1 84 29 29 109 47 62 2-l-
142 Kumal 2 167 55 55 344 19-1- 150 47 70 78
143 Koma Mp. 1 27 18 22 107 47 60 13 18 13
144: Chaptari 1 47 22 22 75 37 38 19 23 .-
145 Khaladi 4 170 60 60 307 152 155 19 11 43 2
146 Pujali Khaladi 1 47 II 14 65 35 30 13 14 9 147 Sank Khala 1 72 12 12 93 48 4:5 5 148 Kamara 1 64 19 19 60 31 29 3 2 2 149 Natri 1 99 46 46 266 152 IH 7 8 41 150 Suil 1 82 31 31 166 100 66 11 6 17
151 Chandeli 1 71 50 50 293 179 114 12 8 53 7 152 Bioai 1 67 21 31 lSI 73 78 9 9 24 153 Kantari 2 125 51 66 364 179 185 28 25 56 154 Nailari 1 39 10 16 86 50 36 2 5 20 155 Panigaon Gaunri 1 39 58 58 315 162 153 68 73 13
156 Si.undari 48 15 15 110 85 25 4 3 II 1 157 Huduli 187 42 42 221 118 103 44 46 25 2 15d Bingathera MalIa 25 23 23 100 72 28 7 4 159 Bingathera Talla 57 Un-inhabited 160 Gamd 43 4 4 25 24 10
161 Thaduga 78 47 47 221 115 106 24 25 16
TO r AL OF PURAULA BLOCK 203 13,700 4,737 4,863 26,816 14,178 12,638 2,434 1,929 3,078 217
PART OF NAUGAON BLOCK
162 Thali 85 29 29 195 109 86 32 30 6 163 Bhakoli 292 83 83 483 242 241 75 71 10 164 Chamrota 62 23 23 116 64 52 39 33 2
TOTAL OF PART OF NAUGAON 3 BLOCK
439 135 135 794 415 379 146 134 18
FOREST RNNGE
165 F1 (\) Kasedi 1 33,126 3 3 3 3 3 166 FI (2) Balcha ···1 Inclu-
Un-inh .. bited 167 FI (3) Pajudhar Un-inhabited 168 FI (4) Lambathach
... }ded in Un-inhabited ••• I FI(I}
169 Fl (5) Chhatari ... J Un-inhabited
170 FI (61 Maldi 1 1 2 171 F2(1) Deota Un-inhabited 172 F2 (2) Asna 40,991 Un-inhabited 173 F2 (3) Kulni Un-inbabited 174 F2 (4) Sandhara 49 49 255 244 11 17 7 53

xv
DIRECTORY I
RURAL-Contd.
WORKERS
,....--_ ... _ NON-Total Workers WORKERS
(I-IX) • I II III IV V VI VII VIII IX X Serial
No .
.---"----. r--...._ ..... .....-."--0 .---. ,--"'""""'~ ,-~ .---. ------. ,..-~ ~ .--"""'-__,..
M F M F M F M F M F M F M .. F M F M F M F M F
14 15 16 17 18 19 20 21 22 23 24 25 26 27 28 29 30 31 32 33 3-1 35
71 52 61 51 10 1 17 26 136 16 19 12 16 I I 3 2 8 7 137
261 123 86 117 2 2 16 11 2, .2 94 11 3 36 2 38 49 138 65 20 30 19 3 30 2 1 12 7 139 60 53 55 51 5 2 27 18 140
32 41 25 .fI 6 1 15 21 141 155 106 101 104 3 1 2 41 4 3 39 44 142 33 38 2tl 37 1 I 3 14 22 143 32 30 31 30 1 5 8 144
114 110 109 110 2 2 38 45 145
30 24 23 23 2 4 5 6 146 44 38 H 38 4 7 147 28 27 28 27 .. 3 2 148
121 86 87 86 2 4 19 8 31 28 149 76 61 58 58 1 3 .- 16 24 5 150
146 77 65 77 1 58 6 2 13 33 37 151 53 50 50 50 1 2 20 2B 152
118 141 109 141 4 ...• 5 61 44 153 35 23 32 23 2 15 13 154
124 112 120 III 4 38 41 155
79 19 21 19 57 6 6 156 97 76 71 76 2 24 21 27 157
32 II 5 158 61 23 28 23 Un<inhabited 159
24 20 3 160
87 75 76 74 2 9 28 31 161
10,339 8,694 8,469 8,499 157 128 316 1 231 41 19 ... 634 79 1 76 358 24 3,839 3,944:
PART OF NAUGAON BLOCK
82 62 81 62 27 24 162 207 203 192 196 9 2 5 5 35 38 163
53 45 49 41 1 2 2 1 2 II 7 164-
342 310 322 2'1& 10 4 1 3 .. 6 7 73 69
FOREST RANGE
2 2 ... ... 165 Un-inhabited 166 Un-inhabited 167 Un-inhabited 168 Un-inhabited 169
'" .,. .. , 1 '" 170 Un-inhabited 171 Un-inhabitod 172 Un-inhabited 173
240 3 ... 224 3 1 ... ... ... 15 ., . 4 8 174

XH
VILLAGE
PURAULA TAHSIL
Occu-Serial Name of Village Number Area pied House- Total Population Scheduled Literate and No. (Notations for amenities) of in Resi- holds Castes- educated perBOJl&
Hatnlet. acres dential Houses
-. r- .... ,....._._....--., P M F M F M F
2 3 4 5 6 7 8 9 10 11 12 13
175 F2 (5) Sankriyad 1 J 1 1 25 16 9 3 176 F3 (I) Taluka 11 1 1 1 1 1 177 F3 (2) Hariki Doon .,. } 235,519 Un-inhabited 178 F3 (3) Istara Garh IJ 14 14 170 170 16 26 179 F4 (I) Ringali 11 1 1 1 1
F4 (2) Jarmola I
180 ~ I 13 13 49 46 3 3 19 lSI F4 (3) Lunagarh 1 1 5 4 1 2 182- F4 (4) Khunigarh q 39,826 8 8 37 23 14 .. 9 6 183 F4 (5) Sandhra 1 I 4 4 27 15 12 4 3 2 184 F4(6) Mori
1 I 2 2 7 7 7
185 F4 (7) Nasana 1 J 6 6 29 25 4 5 186 F5 (I) Jakh "i) 44,942 Un-inhabited 187 F5 (2) Rikhoti 1 1 1 1 186 F6 (I) Chnda Dokhar 1 1,146 2 2 4 4 3
TOTAL OF FOREST RANGE 15 395,550 167 107 616 561 55 41 10 134 7
TOTAL OF. PURAULA TAHSIL 221 409,689 4,979 5,105 2t1,'22 5 15,154 13,073 2,621 2,072 3,230 224
'Note-Naugaon block is spread over in two tahsils viz., Puraula and Rajgarhi.

xvii
DIRECTORY
-RURAL-Goncld.
WORKERS
__ ------ -- NON-Total Workers WORKERS
(I-IX) II III IV V VI VII VIII IX X Serial
No.
r--__"'_~ __ --""--., ~ ,.--J--. ,...--"---., ,.--J--. ,-~ ~ ,-~ ~ .---"---..
M F M F M F M F M F M F M F M F M F M F M F
14 15 16 17 18 19 20 21 22 23 24 25 26 27 28 29 30 31 32 33 34 35
5 5 3 5 2 .. ... ... ., . 11 4 175 1 1 ... ... ... .. . 176
Un-inhabited 177 170 170 178
\ 1 179
45 ... 45 1 3 180 3 .. 3 1 I 181
18 4 5 4 . ... 13 5 10 182 10 7 9 7 1 5 5 183 4 2 2 3 184
25 3 2 3 2 20 185 Un-inhabited 186
1 1 187 4 4 188
530 22 19 19 ." 471 3 1 24 15 31 33
11,211 9,026 8,810 8,817 167 132 788 4 235 41 19 .. 634 ... 103 1 76 379 31 3,943 4,046


RAJGARHI TAHSIL

SI. No.
Name of Village
Arun
2 Bachangaon
3 Badia
4 Badogi
5 Bagasu
6 Bajalari 7 Bajari 8 Bakbareti
9 Balari 10 Banas
11 Barkot 12 Basrali
13 Beef
14 Bhani 15 Bharunta
16 Bhauntl 17 Bhunargaon .18 Bigradi
19 Bijori
20 Bill
~1 Bingsi
22 Binyali 23 Bisatgaon 24 Bursi 25 Chakragaon
~6 Chaptari
27 Chatri
28 Chbatang 29 Chihti
30 Chopara
31 Chudi
2
32 Dakhayatgaon
33 Dandagaon 34 Dandalgaon
35 Dangurg~on
!l6 Dariwali
37 Dar5gi
38 Dawal
39 Delda
40 Dewadi
81. No. in Village
Directory
3
12 55
72 149
99
123 62
14
98 65
86 52 66
20 118
145 156
27 144
117
III 5
17 162
89
54
18
85
32 139
120 42 39 84 71
108
161
141
26 155
ALPHABETICAL LIST OF VILLAGES
RAJGARHI TAHSIL
SI. No. Name of Village
-ll Dharali
42 Dhari Palli 43 Dharson 44 Dhaunsali
45 Dhuink
46 DUlbil
47 Fefyara
48 Fuldar 49 Furri
50 Fuwangaon
51 Gadoli
52 Gair
53 Gangtari 54 Garh 55 Gatu
2
56 Gaul Banal
57 Gaultharkal 58 Ghandala 59 Ghir
60 Ghund
61 Golari
62 Go08
63 Gudin
64 Halna 65 Himrola
66 Idak 67 Jakhali
68 Jandanu
69 Jarda
70 Jastari
71 Jugadgaon
72 Jumrara
73 Kadari 74 Kalaigaon 75 Kalogi
76 Kanda 77 Kandaun 78 Kandi . 79 Kansaru
80 Kansola
81. No. in Village
Directory
3
23 128 134
150
64 146 59
48
164
25 10
49
142
163
11 58 16
137 . 3
24 36
160 79
132
34 2
16~
119 31
172
15
157 169 130
28 116 152
91 101
SI. No. Name of Village
81 Kar08li
82 Kaslana 83 Kawalgaon 84 Kawalgaon 85 Kesala
86 Khabala
2
87 Khamandi MalH 88 Khamandi Talli 89 KhalJati
90 Khand
91 Khanera 92 Khansi
93 Kharsali 94 Khirmu !:I5 Khuthnor
96 Kim;
97 Kis08 98 Kopnol
99 Koti Banal 100 Koti Manpa
101 Kotla
102 Kottyalgaoll 103 Kufan' 104 Kuni 105 Kunida
106 Kunsala 107 Kupra
108 Kurh
109 Kursil
110 Kuthar
III Kuwa 112 Kuwadi 113 Lodan 114 Majyali
115 Manadgaon
116 Masalgaon
117 Massu 118 Matalla
119 Matari 120 Matiyali
Sl. No 10 Village
Directory
3
29 138
22 167
60
127
158 159
153 47
80
96
67 166 78
113 90
136 13 50
4 100 143 35 37
73 75 8
61
63
122 110 170 103 125
46 41
151 168 109

lUi
ALPHABETICAL LIST OF VILLAGES
RAJGARBI TAHSIL-C07Icld.
51. 51. No. in 51. 51. No. in 51. 51. No. in
Nc>. Name of Village Village No. Name of Village Village No. Name of Village Village , Directory Directory Dircetory
2 3 2 3 2 3
121 MaIda 95 141 Patangani 51 161 Sukana 56
122 Mugara 105 142 Paunt] 94 162 Sunaldi 38
123 Mullagaon 173 143 Pauri 30 163 Sunara 102
12. Muradi 104 144 Pindaki 69 164 Syalab 57
125 Nagangaon 45 145 Pisan 114 165 Tera 121
126 Naini 112 146 Pujargaon 77 166 Than 44 I
127 NaIda 6 147 Raj Garhi 43 167 Thanki 19
128 Nandgaon 83 148 RaIla 70 168 Tholyuka 135
129 Nar}uka 126 149 Rastari 115 169 Tiyan 131
130 Naugaon W7 150 Rikhaunk 148 170 Trikhali 74
131 Naugaon 174 151 Sapata 106 1~1 TUllalka 93
132 Nethergaon 7 152 Sara 87 172 Uprari 88
133 Neuri 140 153 Sarno I 53 173 Vallsadi 81
131 Nishani 68 154 Setwari 154 174 Vatiya 92
135· Odgaon 171 155 Sialna 82 fOREST RANGES
136 Palar 40 156 Sidak 21 175 Jdngal Rari F.l
137 Palata 97 157 Siguni 147 176 Musar Santi F.2
138 Pali), a 76 158 Simalsari I"" 'J
139 Paluka 129 159 Sina 33 140 Pamadi 124 160 Sisala 9

X:lQ1
VILLAGE
RAJGARHI TAHSIL
Occu-
Serial· Name of Village Number Area pied House- Total Population Scheduled Literate and
No. {Notations for amenities) of in Resi- holds Castes educated persons Hamlets acres dential
Houses
r-- r--~"""_-----'
P M F M F M F
2 3 4 5 • 6 7 8 9 10 11 12 13
NAUGAON BLOCK
1 Dhaunsali R.Riv. 7: 9 9 33 17 16 1 1 8
2 ,Jakhali 75 13 13 ']9 27 22 8 8 7 3 Ghund 68 7 7 13 5 8 -- I
4- Kotla 248 13 14 54 30 24 29 20 2 5 Binyali R. 146 15 16 101 55 46 38 33 8
6 Naida 1 U 5 5 36 17 19 6 7 6 7 Nethergaon 1 65 10 12 56 28 28 6 5 9
_ 8 Kurh 1 76 22 ~5 121 60 61 21 25 12 9 Sisala 1 76 4 4 17 7 10 7 --- 2
10 Gair 1 121 46 52 252 124 !28 23 17 09
11 Gaul Banal 1 73 10 13 53 28 25 4 12 Arun 1 35 5 7 35 15 20 13 16 3 13 Kot; Banal '2 143 56 71 309 160 149 64 50 46 8 14 Bakhareti L. 2 125 25 27 144 75 69 15 11 35 2 15 jumlata 1 9 26 30 131 66 65 66 65 6 2
16 Ghandala 1 92 20 22 71 43 28 7 4 6 17 BIsatgaon 1 101 14 15 74 38 36 7 8 -I 13 Chatri 1 126 IS 15 58 32 26 32 26 7 19 Thanki 1 61 17 19 103 52 51 8 7 7 10 Bhani 1 74 3 3 15 8 7 5 7
21 Sidak 1 60 20 20, 117 54 63 13 13 II 22 Kawalgaon 1 64 22 22 143 70 73 1 6 32 2
_ 23 Dharali 1 173 49 51 259 137 122 46 34 45 1 24 Golari Riv. 1 118 28 31 157 75 82 33 37 28 1 25 Gadoli R, Riv,'L, Mew. 1 118 14 14 139 61 78 18 19 19 3
26 Delda 1 33 10 10 116 55 61 27 30 12 17 Bigradi Riv. 1 153 10 10 63 30 33 23 26 5 28 Kanda Riv. 1 120 21 22 160 81 79 6 4 ~I 29 Karnali 1 69 5 8 43 23 20 8 30 Pauri 1 30 3 4 14 6 8 6 8
.31 Jastari 1 29 8 9 47 21 26 21 26 32 Chihti 1 36 8 8 29 13 16 13 16 33 Sina \ 2Q 5 5 22 11 11 IQ 8 ~ 34 Idak 1 276 32 37 153 78 75 15 II 11 35 Kuni R. 1 76 14 15 90 47 43 4 -f 9
~6 Gona R. 1 ISO 28 33 184 95 89 43 3·l 14 37 Kunida 1 26 6 7 31 15 16 1 1 38 Sunaldi Riv. L. 1 287 43 65 314 172 142 17 7 48 4 39 Dandagaon 1 171 26 35 183 93 90 12 12 38 4 40 Palar L. 1 301 59 76 363 196 167 42 33 3:1
41 Mas~u 1 161 25 29 150 74 76 17 12 31 2 42 Dakhayatgaon 1 500 B8 110 502 255 247 45 46 80 2 4-3 Raj Garhi R. Po. 1 645 15 23 'i6 51 25 3 3 4, 8 4~ Thall 1 158 31 34- 156 80 76 8 8 32 45 Nagangaon R. 1 268 102 111 575 280 295 59 61 96 3

~'uiii
DIRECTORY
RURAL
WORKERS
,----------_ _".._---------- NON-Tota~ Workers WORKEI<S
(I-IX) Seria I II Ill' IV V V( 'II[ VIII IX X No.
r--...A..---.. .......--"--, ..---~ ,.--~ ,..---"--, r--~ ,..-Ao ..... ,--• ..A.. ....... ~",_ . ....._ ,.-............ ..--~
M F M F M F M F M F M F M F M F M F M F M F
14 15 16 17 18 19 20 21 22 23 24 25 26 27 28 29 30 31 32 33 30} 35
NAUGAON BLOCK
13 9 9 5 2 4 2 4 7 1 21 14 18 13 1 1 2 6 8 2
5 6 2 5 3 1 2 3 20 l"5 15 12 5 3 10 9 4 36 33 33 30 6 3 19 13 5
13 13 9 12 4 1 4 6 6 24 16 18 15 6 1 4 12 7 45 45 35 41 9 4 15 16 8 7 7 4 7 3 3 9
86 75 83 75 1 38 53 10
24 19 24 19 4 6 11 5 7 12 . 10 13 10 13
2 29 -1:1 13 131 108 128 10il 57 53 56 53 1 18 16 14 56 50 55 50 10 15 15
39 23 39 23 ... 4 5 16 7 13 17 31 23 31 23 5 4 18 27 22 27 22
40 33 40 33 12 18 19 7 4 5 4 2 1 3 20
35 45 35 45 19 18 21 44 45 44 45 26 28 22
105 86 104 84 2 32 36 23 56 53 56 49 4 19 29 24 36 33 21 21 3 10 4 7 25 45 25
40 40 34 37 5 3 1 15 21 26 24 23 20 20 2 3 1 1 6 10 27 53 55 41 52 4 3 2 5 28 24 28 15 11 15 11 8 9 29 5 6 5 6 1 2 30
15 16 13 15 1 6 10 31 11 12 10 12 1 •• 0: 2 4 32 II 7 5 4 5 3 4 33 54 43 36 42 7 8 2 24 32 34 34 28 26 25 8 3 13 15 35
59 54 47 49 2 10 4 36 35 36 13 13 II 13 2 2 3 37
116 94 105 93 10 1 1 56 48 38 70 65 64 62 4 3 2 23 25 39
141 119 135 118 6 1 55 48 40
39 55 34 55 ... 1 4 35 21 41 163 173 158 173 I 2 1 92 74 42 38 11 2 3 22 B 25 43 56 54 54 54 1 24 22 44
188 224 180 223 6 92 71 45

xxiv
VILLAGE
RAJGARHI TAHSIL,
Occu-Se,ia! Name of Village Number Area pied House- Totai Population Scheduled Literate and
No. (Notations for amenities) of in Resi- holds Castes educated persons Hamlets acres dential
Houses
.....__-----. r--~ ....... .----"---.
P M F M F M F
:i 3 4 5 6 7 8 9 10 11 12 13
46 Masalgaon R. 1 270 43 53 244 129 115 19 17 34 47 Khand Riv. 2 276 19 22 136 79 57 52 37 9 48 Furri Riv. 1 166 27 39 182 81 101 15 27 14 49 Gangtari R, Riv, L. 1 100 33 43 215 110 105 53 58 48 50 Kori Manpa 1 128 52 66 372 199 173 56 50 36 ~ ..
51 Patangani 123 18 19 8J 47 38 3 3 3 52 Bas,ah t 133 31 34 l5B 75 83 2", 18 2
·53 Sarnoi R, Riv. 2 645 102 !U5 527 285 242 53 45 44 54 Chaptari I 120 27 30 183 89 94 37 32 20 55 , J3achangaon 1 139 28 30 161 85 76 2a 20 19
56 Sukana 113 22 22 105 54 51 5 57 Syahb 215 53 53 218 107 III 16 12 6 58 Gaul Tharkal 49 10 II 58 25 33 18 59 Fuldar 140 17 17 75 37 38 37 38 1 60 Kesala 178 33 33 164 90 74 14
61 Kursil 1 68 40 4{J 209 108 101 :3 2 8 62 Bajari R,Riv. I 144 is 18 i(JJ 55 48 20 9 8 63 Kuthar R,Riv. 1 234 30 39 219 12:3 96 36 27 39 64 Durbil 1 320 30 37 217 lW 107 31 32 40 65 Banas 1 227 31 33 1'4 79 85 61 64 4
66 Beef R. 1 114 30 37 182 95 87 46 37 24 67 Kharsali R,Riv,L. 3 350 81 104 516 274 242 58 60 104 4 68 Nishani R,Riv. 2 214 45 49 174 86 88 3 3 11 69 Pindaki
, 2 178 30 33 166 90 76 5
70 Rana R, Riv. 1 260 4.1 63 299 161 138 32 30 33
71 Dangurgaon 1 199 24 31 152 82 70 11 11 9 'I
72 Badia 1 179 37 49 222 III III 12 10 13 1 n Kunsala 1 133 11 11 56 37 19 12 74 Trikhali 1 64 16 16 89 45 44 9
75 Kupra R, Riv. I 385 57 57 256 141 115 13 14 33 2
76 Paliya 3 546 59 60 277 148 129 55 54 3f,
77 Pujargaon R, 2 23 8 9 30 20 10 6 78 Khuthnor Mew. 3 339 70 100 477 245 232 30 34 93 79 Halt,a 1 86 17 21 86 37 49 37 49 2 80 Khanera 1 84 37 41 198 97 101 Hi 16 20 -
8t Vansadi 1 163 20 26 130 68 ()2 11 11 8 82 Sialna 1 333 61 61 289 142 147 34 31 25 83 Nandgaon R,Riv, L. 4 44D 107 129 640 329 311 117 99 166 13 84 Dandalgaon I 37 18 21 134 78 56 25 15 25 2 85 Chhatang R, Riv. 1 56 12 12 83 53 30 2 4 18
86 Barkot R. Riv, Hos, Po. 3 340 181 191 1,041 722 319 80 67 281 19 &7 Sara 1 137 16 17 91 46 45 2 2 26 4 88 Uprari 1 109 30 37 194 102 92 6 5 63 14 89 Chakragaon 1 56 15 18 114 58 56 2 2 32 '9-90 Kisna 1 87 36 37 226 III ll5 65 59 30 4-

DV
DIRECTORY ,
RURAL-Contd.
WORKERS
NON· . Total Workers WORKERS Suial
- (I-IX) No .. I II III IV V VI VII VIII IX X
.---. .......____ & ,.....-Jo-..... ,..............., ~ ,-J--. ,....-......., ,-J--. ,....-..., ,.--_..A.. ___
M F M F M F M F M F M F M F M F M 1 :w F M F
14 15 16 17 18 19 20 21 22 23 24 25 26 27 28 29 30 Sl S! 33 34 35
91 78 79 78 5 4 ! 38 37 46 56 44 53 44 2 1 23 13 47 58 79 55 79 3 23 22 48 71 80 51 80 18 % 39 25 49
144 119 133 119 8 3 55 54 50
35 32 27 29 8 3 1% 6 51 60 61 45 61 15 15 22 52
23B 185 235 185 S 47 57 53 69 70 67 69 ! 1 20 24 54 64 59 62 57 ! ! 21 17 55
42 38 42 38 12 13 56 87 82 84 82 ! 20 29 57 18 24 17 23 1 7 9 58 31 30 31 30 6 8 59 63 56 63 55 27 18 60
76 78 76 78 32 23 61 36 28 33 28 2 .. 19 20 62 81 71 79 71 2 42 25 63 76 55 70 55 2 3 34 52 ,64 60 53 53 53 . ,. 4 ; ... 1 19 32 65
59 50 58 50· 1 .. 36 37 66 191 140 157 139 9 10 2 5 7 83 102 67 52 48 51 48 1 34 40 68 56 40 54 40 1 .34 36 69
III .89 103 89 3 3 50 49 70
57 51 55 51 25 19 71 82 74 78 74 2 .. 29 37 72 .. 23 13 16 13 7 14 6 73 27 25 27 25 18 19 74 95 76 89 74 5 2 46 39 75
107 58 106 58 1 41 71 76 18 8 13 8 2 3 2 2 77
172 148 154 147 4 3 8 73 84 78 29 30 29 30 8 19 79 63 61 54 61 6 34 40 80
47 43 47 43 21 19 81 99 111 96 III 2 1 43 36 82
213 181 133 159 12 3 5 12 15 16 3 .17 8 10 116 130 83 52 31 26 26 1 5 21 3 26 25 84 45 20 13 17 2 3 30 8 10 85
612 181 203 180 16 13 1 ... 320 17 3 39 110 138 86 34 26 20 23 3 3 2 1 8 12 19 87 72 49 44 44 3 5 15 8 30 43 88 32 31 25 30 2 1 1 3 26 25 89 79 69 59 69 20 32 46 90

xxvi
VILLAGE
RAJGARm TAHSIL
Occu-Serial Name of "ilIage Number Area pied House- Total Population Scheduled Literate and
No. (Notation. for amenities) of in Resi- holds Castes educated person, Hamlets acres dential
Houses
-..
P M F M F M F
2 3 4 5 6 7 8 9 10 11 12 13
91 Kansaru I 23~ 68 69 333 170 163 22 19 67 8 92 Vatiya I 693 94 102 552 290 262 117 96 75 4: 93 Tunalka R. 1 165 57 61 312 182 130 57 44 51 2 94 Paunti R. 1 310 105 150 730 ;j65 365 186 183 105 6 95 Maida 1 155 34 59 246 113 133 ::>1 40 ::SO
96 Khansi 2 198 49 50 342 173 169 37 39 48 97 Palata 1 173 29 31 171 86 85 28 24 3!> 98 Balari 1 160 19 23 129 62 67 2 40 2 99 Bagasu R. Riv. L. 1 354 60 62 336 181 155 75 57 7U 2
100 Kottyalgaon R. 1 334 37 39 245 130 115 17 12 46 7
101 Kansola 1 164 13 13 59 30 29 30 29 1 102 Sunara R. 2 99 34 34 182 93 89 16 13 29 3 103 Majyali R. 1 296 58 5!l 296 176 120 85 76 22 104 Muradi R. 2 113 '1:7 49 214 127 87 30 27 54 9 105 Mugara 1 78 33 37 157 94 63 33 29 35 8
106 Sapata 1 41 6 6 45 25 20 12 .. 107 Naugaon R. Riv, L, Mp, Mew. '1. 144 8.1 81 391 240 151 46 28 103 i2 108 Dariwali R. 3 68 25 27 156 101 55 44 24 36 109 Matiyali 2 168 36 36 161 81 80 20 23 17 no Kuwadi 2 171 23 21 89 44 45 31 31 3
III Bingsi 1 202 40 42 215 106 109 40 47 18 112 Nami R. 1 40 13 13 76 40 36 !) 3 8 113 Kimi 1 182 28 28 153 73 80 22 .26 13 114 Pisan 1 111 5 5 29 16 13 2 115 Rastari 1 12 9 9 41 22 19 5 3 tt8
, 116 Kandaun R. 1 116 17 17 92 46 46 21 25 2 117 Bill R. Riv. 1 108 30 30 203 135 68 13 7 26 118 Bharunta 1 95 2 2 18 9 9 3 119 Jarda 1 281 52 52 371 220 151 15 6 71 120 Chudi 1 274 10 10 62 30 32 12 14 12
121 Tera 1 150 14 14 76 40 36 6 6 9 122 Kuwa 1 147 22 22 97 53 44 37 33 13 123 Bajalari 1 130 24 ~4 120 66 54 36 24 19 124 Pamadi 1 208 25 25 135 65 70 4 5 7 125 Manadgaon 1 271 15 15 98 45 53 3 3 17
126 '\.aryuka 1 105 19 19 109 53 56 33 29 6 127 Khabala 1 50 20 20 119 62 57 33 33 4 128 Dhari Palli 2 125 22 22 152 74 78 215 129 Paluka 1 110 26 26 117 62 55 38 35 7 130 Kalogi L. 2 457 38 38 200 97 103 27 30 11
131 Tiyan R. 1 130 43 43 251 133 118 57 47 25 132 Himrola 1 109 24 24 135 83 52 10 133 Simal Sari
... 1 44 15 15 101 46 55 41 32 8 7
134 Dharson 1 124 37 37 206 96 110 3 2 18 135 Tho1yuka 1 132 31 31 154 80 74 22 16 13

~Jtyii
DIREO'IOR Y
Il\URAL-Contd.
WORKERS
NON-Total Worken WORKERS
(I-IX) I II III IV V VI, VII vm IX X
&rial No. ,.....----, r---'---. ,........__,
~ ,.-A--, ~ ~ ,.....-....... ~ ,..--.._..."
M F M F M F M F M F M F M F M F M F M F M F
14 15 16 17 18 19 20 21 22 23 24 25 26 27 28 29 30 31 32 33 34 35 1
109 119 96 110 1 8 7 3 61 44 91 192 165 161 164 2 27 1 I 1 98 97 92 128 87 71 87 ... 21 30 5 54 43 93 236 234 226 234 1 I .,. I 5 129 131 94 68 77 67 76 1 1 45 56 95
"l18 105 II5 105 2 55 64 96 65 57 64 57 21 28 97 40 52 39 52 1 22 15 98 122 104 Jl6 99 2 2 2 3 2 59 51 99 84 60 75 59 3 3 2 46 55 100
25 23 25 23 5 6 51 54 42 54 1 101
145 67 b9 66 2 --. 8 42 35 102 I 53 31 53 103 80 40 27 39 3 1 ... ... 18 2 30 47 47 56 33 15 31 5 1 1 4 1 7 8 104-
1 15 38 30 105 16 14 8 14 -.. J I 176 80 83
... 9 6 106 77 6 11 S 34- ti 3 91 32 26 32 25 2 64 71 107 1 ... 10 ~ 49 1 1 62 63 55 62 7 1 10 23 108
33 25 24 25 8 19 17 109 11 20 llO
7S 77 55 76 3 17 34 28 33 28 2 28 32 III 62 66 60 66 1 6 3 1I2 13 12 12 12 1 11 14 lIS 18 18 18 18 3 1 114 4: 1 115
37 39 37 39 110 44 51 44
52 6 9 7 116 6 5 6 5 25 24 117
181 97 105 93 -- 3 4 118 19 15 11 15 2 4 73 1 39 54 Jl9
2 11 17 120 32 26 29 26 2 44 35 33 33 I 2
8 10 121 56 47 56 47 2 5 9 9 122 55 55 53 55 '" 10 7 123 31 36 31 36 10 15 124 14 17 125
47 42 46 42 49 48 49 48 6 14 126 51 57 49 56 ...
13 9 127 1 48 40 46 So 1 23 21 128 73 71 68 67
... I 14 15 129 4 2 24 32 130
87 73 82 72 2 ! 2 46 45 131 57 36 45 31 11 5 34 26 27 23 2 2 3 1 26 16 132 3 12 29 73· 66 66 62 4 4 133
'63 54 52 49 10 5 2 23 44 134-1 17 20 135

xxviii
VlLLAGa
RAJGARHl TAHSIL
Occu-Serial Name of Village Number Area pied House- Total-Population Scheduled g Literate and No. {Notations for amenities) of in kesi- holds Castes educated persall$>
Hamlett .erel dential House.
r-- ,..-~-. r--""_____"_
P M F M F M F
2 3 4- 5 6 7 8 9 10 11 12 13
136 Kopnol L. I 483 120 125 621 328 293 129 89 22 137 Ghir R. I 193 31 32 145 79 66 16 20 14 138 Kaslana R. I -124 25 25 155 79 76 ~4 17 20 139 Chopara I 519 38 38 219 112 107 20 16 4 140 Neuri R. 1 103 21 21 88 45 43 25- 24 3
141 Dawal R, L, Mew. I 167 34 34 193 92 101 II 13 30 142 Garh R. 3 256 37 37 225 109 116 77 70 18 3 143 Kufan I 134 2 2 14 6 II
144 Bijori 1 III 18 18 75 31 44 19 13 5 145 Bhaunti 1 482 30 ' 30 180 94 86 31 21 I
146 Fclyara 1 210 16 19 103 49 54 7 9 8 147 Siguni % 652 36 37 194 92 ID2 II 9 17 148 Rikhaunk I 180 17 17 118 64 54 5 5 18 5 149 Badog L. I 443 22 22 134 80 54 14 10 19 150 Dhuink 1 462 46 46 219 114 !O5 50 41 22 2
lSi Matalla L. 252 7 7 34 17 17 6 152 Kandi 412 24 24 114 51 63 9 4-153 Khanati 389 21 21 93 59 34 13 I 154 Setwari 84 19 19 3:; 17 . 18 3 6 6 3 155 Dewadi 21 8 8 128 65 63 19 11 6
156 Bhunargaon 1 124 6 6 70 43 27 40 23 157 Kadari Po. 1 601 66 66 361 192 169 46 32' 73 6 158 Khamandi Malli 1 279 26 26 192 94 98 8 3 41 159 Khamandi Talli' R. Mp. 1 119 20 20 109 45 64 20 21 24 160 Gudin 1 147 13 13 80 40 40 17 14 9
161 Darogi 1 121 13 13 92 47 45 6 7 16 162 Bursi 1 277 II 11 55 28 27 11 9 9 163 Gatu I 101 20 20 127 65 62 12 9 28 3 164 Fuwangaon 1 ~3 17 17 109 58 51 2 2 10 165 Jandanu 1 373 33 33 157 79 78 26 22 17
166 Khirmu I 213 24 24 149 84 65 18 17 7
167 :Kawalgaon I 104 13 13 66 26 40 I 4 168 Matari I 144 8 II 42 25 17 3 2 5 169 :Kaloigaon 1 103 16 18 75 36 39 2 4 5 170 Lodan 1 271 23 23 143 76 67 14- 10 31
171 Odgaon 1 134 20 20 1I0 ·48 62 8 10 25
172 Jugadgaon 1 164- 18 18 114 48 66 4- 3 1
173 Mullagaon 1 173 23 23 113 49 64 4 2 2
174 Naugaon 1 170 35 35 184 95 89 7 7 3
TOTAL 01' NAUGAON BLOCK '105 32,195 5,209 5,728 29,639 15,581 14,058 4,125 3,663 4,087 228
FOREST RANGE
175 Fl Jangal Rad 1 149,562 5 5 20 20 3 5 176 ' F2 Mugar Santi 1 28,900 44 44 16
TOTAL Op::rOREST RANGE 2 178,462 5 5 64 64 3 21
TOTAL OF RAJGARBI TAHSIL 207 210,657 5,'214 5,733 29,703 15,645 14,058 4,128 3,663 4,101 288-

xxis
:DIRECTORY
'RURAL-Coneld.
WORKERS
,...... NON-Total Workers WORKERS
(I-IX) II III IV V VI VII VIII IX X Serial
No.
,....---.--""---_,. ,--_,.____, ........-"---0 ,-_,.____, ,..---"---, ~ ,...---'---0 ~ .....--'--. ,...--....".___, ,----_,._-~
M F M F M F M F M F M F M F 'M F M F M F M F
14 15 16 17 18 19 20 21 22 23 24 25 26 27 28 29 30 31 32 33 34 35
-280 240 267 227 12 13 1 48 53 136 67 46 48 44 11) 4 2 3 2 12 20 137
64 57 63 57 i }'5 19 138 89 72 85 72 .... 3 23 35 139 41 29 41 29 4 14 140
70 67 66 65 2 22 34 141 79 74 76 74 2 30 42 142 5 8 5 8 I 143
24 28 23 28 "', 1 7 16 144 71 61 67 60 2 ... 2 23 25 14~
35 34 35 34 ... 14 20 B6 65 75 62 75 1 ... '" ... fl··· 2 27 27 147 43 31 34 29 I 3 I I 1 4 21 23 148
. 65 42 46 40 1 2 15 3 15 12 149 91 82 70 79 3 1 13 2 4 1 23 23 150
11 9 11 9 ... 6 8 151 43 35 39 32 2 3 \ 8 28 152 47 26 40 26 2 3 1:2 8 153 16 13 15 13 I 5 154 55 53 54 53 10 10 155
32 20 32 ' 20 ... il 77 156 142 90 107 88 2 4 13 2 I 2 2 11 50 79 157 80 71 80 71 14 27 iSH 38 41 38 41 7 23 159 30 30 29 30 10 10 160
38 30 -* 38 30 9 15 161 20 18 19 18 8 9 16~ 51 43 35 41 7 2 7 14 19 163 49 42 49 42 9 9 164
,67 57 67 57 12 21 165
68 53 68 53 16 12 166 21 26 18 26 3 5 14 167 22 16 22 10 3 1 168 28 31 25 30 3 I 8 8 169 59 54 55 52 4 ;( 17 13 17u
42 46 39 46 6 16 171 33 46 30 45 3 1 15 20 172 42 46 40 44 2 2 7 18 173 74 65 71 63 3 2 21 24 174
.I 1,448 9,421 9,515 9,209 95 25 93 1 418 168 37 4 825 89 2 30 346 12 4,133 4,637
FQREST RANGE
20 8 7 5 175 44 44 176
64 52 7 5
-11,512 9,421 9,515 9,209 95 25 145 1 418 168 37 4 832 89 2 30 351 12 4.133 4,637


DUNDA T ADSIL

Sl. N".
)Jamc of Village
1 Adani 1 Anol
3 ASlal 4 Badhangaon 5 RadIi
6 Badshi 7 Bagi
8 Bagi
9 BagiyaJgaon 10 Bagori
11 Bagsari
12 Baldogi
13 &maoga<>ll
14 Eamnti 15 Banari
16 Bando
17 Bangaon 18 Bankot \9 ¬a QUa 20 Banata Palla
21 Baret
22 Bareth
Z3 Bareth %4, Barethi 25 Baret!
26 Barola "-7 Banali' 23 Ba.un 29 Bhad .. lda 3'\1 Bhaclali \Lagga Malna)
31 Bhamgwalgaon
32 Bhawt
33 Bhaldgaon
34 I:Ihar. ngaon
35 Bhalkot
36 Bnalkot
37 Bhatgaon. 38 Bhatuka Sera
39 Bhatwari
40 Bheti} ara
ALPHABETICAL US'}' OF VILLAGES
81. No. in Villa.gc
Directory
3
14-0 127 152 129 7i
125 193
114 17() 135
1711
215 162
97 88
81
20i 75
75
106 55
204 III
6
221 HI
2(19
197
,223
2 126
188 160
16 177 1117
PUNDA TAHSIL
51. 'No. Name of Villa3e
41 Bhuyar! 4-2 Birpur
4-3 Bugangaon 44 Chakon
45 Chamiyari
4{i Chand pur
2
47 ChaundiyatgaoD
48 Chhajula
49 Chhamroli
50 Cbi1ath
51 6hinaogaon
52 Chinyali
53 Panda
5~ Danda Gaan 55 Da.ng
~ Uargao.
57 Darmali
58 Deoli
59 Dhaneti
60 Dhanpur
61 Dharasu 62 Dharkot
63 Dharkot
64 Dhungaldhar
65 Dhungalgaon
66 Dhungi 67 Dikholi 68 Dikthol
69 Dik UTI Bijpur
70 Dunda
71 Gadoli
72 Gailari
13 Garnari Khash
74 Ganda Banda uri Baijbti 75 Garat
76 Garb 77 Garhthati
78 Garhwalgad
79 Gawana 30 Gaw!! Nag
SI. No. in Village
Directory
3
113 24-17
181
146
142
183 80 52
100
173
117
155
92 45
€5 156
159
202 119
100 93
164 172 179
149 184
180
163 25
90
122 143
150 89
12 205 220 158 54
81. ~o.
Name of Village
81 Genwala 82 Goran
83 Gorsara
84 Gyonoti
85 Gyunla
86 Hadi),ari 87 Hareti
2
8" Hitanutnai Balshi 89 H,tara
91) Hu\di-;ana
91 Indragaol:!
92 Ina
9:1 Jakbar.
94 Jaspur
95 Ja!pur
% Jemar
97 Jeshtwari 98 Jibi"a
99 Jinetb. 100 Joga! Biehla
101 Jagat Talla 102 Jogat Upla
103 Jogiyara 104 Jogyara 105 Jokhani
106 Jugargaon 107 Juguldi 108 Junaga 109 Kainrhogi
110 Kaligaon
HI Kalyani
112 Kamad 113 Karr,ada 114 Kandala
115 Kandi
116 Kansi
117 Kanwa
lIB Kaprara
119 Kathkba. 121} Ka.uda
SI. No. iQ Village
Direetory
3
43 l31
:203
48
8
12B 31
151
110
198
10<: 16Jl
27 +4
145
56
95 72
32 '218
219
217 5a
214 94
207 9
60 101
i69
29 ]92
33 112
96
116
4-32
13~
loa

'S1. No.
Name of Village
121 Kawagadi
122 Kawata 123 Khadra
124 Khalshi
125 Khand
126 Kharwan
127 Khodjalog
128 Khurkot 129 Khurmola 130 Kirun
131 Kot
132 Koti
133 Kuleth
134 Kumarkot 135 . Kumrara
136 Kumrara
137 Kunsi
138 Kuthaldi
139 Ki}ari
140 Kiyari
141 Lagga Bagi
142 Lodara
143 Lolada
144 Mamola
145 Majaph
146 Majbgaon
147 Malana
148 Malli
149 Mandya Sari 150 Mangangaon
151 Mangli Sera 152 .>.-lani Bad
153 Mani Choti
154 Margaon
155 Massun
156 Matali
157 Mathali
158 Matholi
159 Matti
160 Maugha
161 Morgi
162 Musargaon
163 NagaI
164 Nagani Bari
165 Nagani Chati
2
SI. No. in Village
Directory
3
133
79 36
216
137
5 191
:3
53 162
115
139
175 189
42
213 15 98 71
210
73
186
38
57 154
50
28 130 39 85
19 224
222 147
41
7 70
105
201 1M
107 174-47
1\8 120
xxxiii
ALPHABETICAL LIST OF VILLAGES
DUNDA TABSIL-Goncld.
Sl. No. Name of Village
)66 Naipar
167 Neri
168 Newlaon
169 Odkbola
t70 Ollya
171 Pab
2
172 Painimai (Bhawan) 173 Paintber
174 Panchangaon 175 Panjala
176 Panoth
177 Patara 178 Paturi
179 Pipali Rajak
180 Ptal Khanda
IBl Pokhari
182 Pokhariyaigaon 183 Pujargaon
JM Pujanaon
185 Pujargaon
186 Pujyargaon 187 Pujyargaon (Lagga Bagori)
188 Ramoli
189 I:anari
190 Rangni Sera
191 Rauntal 192 Reshgi
193 Rikhangaon 194- Safap 195 Sarta!i
196 Saug~on Sera 197 Saundgaon
198 Saur 199 Shila
200 Shrigaon
201 Shrikot
202 Shrikot
203 Shuri
204- Singangaon
205 Singot
206 Singoti Sera 207 Singuni 208 Somana 209 Sound
210 . Sunargaon
SI. No. in Village
Directory
3
196
124
199
67 40
13 166
36
176 10
33 26
171
161
144
132
200 34
138
157
78 134
69 153
21
141 59
84 211
46
23 20
185 91
194
99
212
64
87 14
22 148
37 51
121
Sl. No. Name of Village
211 '1 aodola
212 Tarakot
213 Thandi
214 Ihati
215 Thatidichli
216 Tipari 217 Tipari 218 Tlppra
219 'l uli)ara 220 Udn
221 Ulan
222 Uprikot
22:1 Uprikot
224 Wan
225 Hangaon (F.R.H.)
226 Bansubara (R.O.)
227 Bareth (F,R.H )
228 Dalmali (F.R.H.) 229 Dharasoo (F.R.H.R.O.)
230 Fold (F.R.H.)
231 Forest Guard Chauki
232 Dhauntri (F.R.H.)
233 Gamari (F.R.H.)
234 Gandabanda urJ Baikot
235 Gaunag (F.D. Chauki)
236 Gawana (F.D. Chauki)
237 jaspur (F.D. Chauki) 238 Nagai (F.D. Chauki)
239 Nakuri.{F.R.I.)
24<l Sheep Farm
241 Sllkuyara (F.R.H.)
<>1. No in Village
Directory
3
74 62
190
165 208
66 10:3 61
123 195
167
1
63
-l:CJ
}'.1. (5)
F.2. (6)
F.I (3)
F.2 (5) F.l (6)
F.2 (8)
F,2 (2) F.3 (1)
F.2 (9) F.2 (7)
F.1 (4)
F.2(6) F.2 (10) F.l (2)
F.2(4)
F.2(I) F.l (1)

xxxiv
VILLAG&.
DUNDA TAHSIL_
Occu-Scheduled Litelate and Nallle of Village Number Area pied House- lotal Population Serial
(Notations for amenitie;) of in Resi- holds Castes ed ucaled pel SOIlS~ No. Hamlets dential acres
Houses
,.--------- ~ ___ ..A..._ .........
P M F M F M F
2 3 4 5 6 7 8 9 10 11 12 13
DUDNA BLOCK
1 Uprikot 1 634 72 72 327 154 173 38 36 38 2 Bharangaon 1 288 84 84- 362 199 163 120 99 49 :3 Khurkot 1 194 14 14 71 38 33 2 2 8 4- Kanwa 1 313 47 47 228 III 117 65 64 33 5 Kharwan 1 195 18 18 99 49 50 19 HI 10 2
6 Bareti R,Riv. 354- 82 82 381 189 lS2 47 54 114 8· 7 Mata1i R,Riv. .567 120 120 547 269 278 57 46 127 5 8 Gyunla 136 38 38 173 77 96 23 24 21 9 Juguldi 341 58 58 284 141 143 28 19 45 10 Panjala 386 62 62 332 173 159 77 60 33
11 Baun 3 592 125 125 520 253 267 51 54 C)2 3 12 Garh 1 1,0 16 16 68 :,2 36 6 4 IS 1 13 Pab 2 312 34 34 20+ 96 108 26 28 27 14 Singot 2 428 39 39 189 93 96 II 7 48 15 Kunsi 1 113 ,28 28 144 61 83 26 29 24-16 Bhatuka Sera 8 Un-inhablted 17 Bugangaon 3 84 19 19 66 35 31 3 19 2 18 Barsali 3 287 56 56 :1(J6 150 156 56 56 73 2 19 Mang1i Sera 1 122 26 26 1~1 +7 84 4- 5 30 8 20 Saundgaon 1 112 1 1 1 2 2 2 2 21 Rangni Sera 20 Un-inhabited 22 Singoti Sera R, Riv. 102 3 3 18 16 2 4- 2 6 23 Saugaon Sera 62 Un-inhabited 24- Birpur R. Riv. 1 92 92 92 395 191 204 69 70 99 7 25 Danda R. Riv .. Hos, Po. 4 910 135 166 755 414 341 55 42 212 14 26 Palara 2 1,000 101 101 573 300 273 49 55 54 6 27 Jakhari 1 83 30 30 1'15 6b 59 66 59 ·1 28 Malana 1 313 3'J 33 155 74 81 34 35 16 29 Kalyani R. 3 470 49 53 284 149 135 67 65 39 30 13hadall Lagga Malna R. 1 35 2 2 10 8 2 6 I 31 Bareti 2 330 40 40 218 100 118 29 22 12 32 fineth 1 235 33 33 157 69 88 8 7 23 33 Panoth R. 2 154 21 21 120 63 57 63 57 17 34 Pujargaon 1 150 22 22 112 50 62 11 12 13 35 }1andu 1 91 18 18 99 45 54 5 5 7 36 Painther
46~ 39 39 174 '5 89 25 18 37 Somana 191 17 17 .~fl 27 31 3. 38 Lolacla 3 I 5 70 10 IO .65 33 32 39 Mandya Sari ISq 21\ 28 156 78 n 19 23 22 19 2
40 Ollya 177 26 26 145 70 '5 3 3 42 41 Masmxa ,1 269 29 29 ItJO 78 82 40 38 18 1 42 Kumrara R. 1 61 8 R 51 26 25 8 1 14 1 43 Genwala R. 2 403 64 64 299 174 125 41 38 78 1 44 ]aspur 2 238 44 44 221 114 107 25 20 29 45 Dan& 1 428 52 52 289 140 149 90 86 27 2'

DIRECTORY
RURAL
Total Workers (I-IX)
M
Ii
107 150 :ll 72 32
124 162 50 88
113
177 18 58 55 46
25 90 20 2
14
118 2t:4
231 .43 38 !i8 3
71 47 36 32 29
65 16 20 44-43
51 18 99 80 89
F
15
122 III
18 77 33
124 196 66 81 96
Hll 24 68 57 61
20 101 42
1
2
120 206
213 43 49 96 2
73 60 :'3 ~)~
29
61 22 22 47 56
52 11 74 70
)00
WORKERS
----------------~----------------
I
M F
15 17
107 122 82 72 14 18 66 72 30 33
88 110 127 178 35 63 81 79
103 96
163 175 )6 23 49 68 53 57 40 95
13 55 19
20 119 42
2 2
10 29
II III
M F M F
18
3 5 I 1 1
2
7
19 20 21
20 7
1 5 13 3 1
••• • >
6 8 3
99 184 26 16 17
126 207 42 42 19 41 67 86 1 2
60 67 45 57 35 31 31 38 27 28
60 55 15 22 20 22 30 47 40 47
36 44 4 9
63 67 69' 57 84 91
2 1
3 2
48 .. 5 J
.,. J
2 2
6 ? 1 2
IV V VI VII VIII IX
M F M F M F M F M F M F
22 23 24 25 26 27 28 29 30 31 32 33
DUNDA BLOCK
47 -39 ...
6 5 1
15 12 12 4 2 1 3
4
6 5 1
6 2 .,. 5 5
6 6
11 2 1
5 I 2 .. , I
Un-inhabited 3 1 3 ,13
2 1 ••.. , ...•
Un-inhabited ... ... .., 12
Un-inhabi ed • 75 84 4 32 21 56
4 6 I
7 7 9 9 2
6 6 1 3 I 2 I 1 2 I
5 5
6 3 9
661 223
17 3 1 7 10 3 8
46
3 15
5
5 2 2
I 5
7
6 12
2
2
3 3
... 1
5 3
6 5 1 1 .. 3
::I 6 1
7 2 38
... 1
3 3 6 ·1
. 1
NONWORKERS
M
34
47 49 17 39 17
65 107 27 53 61)
,6 14 33 :31) 15
10 60 27
2
73 1::0
69 23 36 51 5
29 22 27 18 16
20 11 13 34 27
27 8
75 34 51
X
F
35
51 52 15 40 17
b8 82 3u 62 6:$
86 12 40
'39 22
II 55 42
I
84 135
60 16 32 39
45 28 24 23 25
28 y
10 31 19
30 14 51 37 49
SerialNo.
1
1 2 3 4: 5
6 7 8 9
10
11 12 13 14 15
16. 17 IS 19 20
21 22 23 24 25
26 21 28 29 30
31 32-33 34 35
36 37 38 39 40
41 42 43 44 45.

x:ltXvi
VILLAGE
li>UNDA TAHSIL
Occu-
-Serial Name of VIllage Number Area pied House- Total Population Scheduled Literate and
No. (NotatIOns for amenities) of m Resi- holds Castes educated persons
Hamlets acres dent:al Houses
..---""--- -. r--.,.A..--." ,--....___.. p M F M F M F
2 3 4 5 6 7 8 9 10 II 12 13
46 Sartali 1 178 15 15 95 47 48 39 40 5
47 Nagai 1 166 19 19 86 43 43 3 3 13 .,. 48 Gyonoti R. 1 257 29 29 149 74 75 23 14 15
49 Wan 2 121 31 31 127 67 60 3 2 33 1
50 Majhgaon R. 1 270 59 59 290 150 110 21 13 70 2
51 Sound R. 2 250 22 22 119 61 58 22 17 26
52 Chhamroli 1 102 17 17 78 40 38 8
53 Khurmola 5 647 62 62 273 138 135 ::)3 36 35
54 Gawa Nag R. 3 289 54 54 295 143 152 21 23 65 2
55 Bareth R. 1 268 _ 28 28 162 81 81 28 34 17
56 Jemar 1 296 29 29 143 75 68 9 10 20 2 57 Mainola 2 310 35 35 194 1()13 88 62 52 5 58 Joglyara 1 121 9 9 61 28 33 7 ' 59 Reshgi 1 128 10 10 40 2Q 20 4 4 2 60 Junaga 5 1,477 128 130 684 329 355 132 81 SI 2
61 Tippra 1 147 21 21 106 50 56 13 12 8
62 Tarakot 2 4(;8 36 36 159 84 75 21 21 8
63 Upnkot 1 * 34 36 33 15 18 9 8 5 64 ShUTi 1 165 16 20 89 44 45 14 10 1 65 Dargad 1 121 14 18 94 46 48 22 21 2
66 Tipari 1 714 48 58 279 134 145 33 43 11 67 Oakhola 1 112 13 13 79 44 35 34 35 3 68 Bhadalda 2 263 22 24 149 75 74 23 17 21 1 69 Ramoli R. 1 16 33 36 153 68 85 25 30 17 2 70 Mathali R. 1 264 36 44 258 129 129 29 33 21 1
71 Kiyari 1 246 22 24 113 57 56 11 16 7 77. Jibiya R. 2. 333 43 43 241 ll~ 129 20 17 22 73 Lagga Bagi 1 31 2 2 5 2 3 74 Tandola R Mp. 3 445 62 62 263 143 120 81 67 II 3 75 Banota Pa.lla 1 31 14 14 59 23 36 11 14
76 Banota 011a R. 1 128 2 2 9 5 . 4 2 77 Badli R. 1 611 46 50 242 III 131 42 51 7 78 Pujyargaon R. 2 239 26 28 140 68 72 18 19 23 79 Kawata R. 1 258 24 24 124 64 60 37 33 2 gO Chhajula R. Po. 1 645 60 65 286 152 134 100 87 20
81 Bangaon 2 1,262 96 96 462 247 215 66 64 39 82 Raprara 2 165 35 36 156 75 81 36 52 6 83 Ramada 2 341 48 48 230 109 121 38 40 33 84 Rikhangaon R. I 39 Jl II 59 28 31 6 8 12 85 Mangaogaon R. 1 66 8 11 50 19 31 5 5 7
86 Khadra 1 268 46 46 244 119 1!5 71 66 44-87 ~ingangaon 1 115 7 7 50 30 20 5 2 10 38 BanaIi 2 373 43 54 246 118 128 45 39 4 89 Galat 1 652 46 46 197 93 104 51 58 J..l. 90 Gadoli I 709 34 36 137 73 64 21 14 13
*Area included in village Tarakot Code No. 62

xxxvli
. 'DIRBCTORY
.aVRAL":'Contd.
WORKERS
~------ '- ----~ NON-Total Workers WORKERS
(I-IX) II III IV V VI VII VIII IX X
Serial No.
,--'---, ~ ..... --, ,.-""""'_ ,-""""'_ ,............._ ,...--'---, ..----"---. ~ ~ ,----"--._,
M F M F M F M F M F M F M F M F M F M F M F
14 15 16 17 18 19 20 21 22 23 24 25 26 27 28 29 30 31 32 33 34 35
36 30 . :35 29 I 11 18 % 27 27 22 26 I 2 2 17 16 47 51 ~2 49 49 1 1 1 2 23 23 48 44 49 38 47 2 I 1 1 23 11 49 97 . 101 92 99 I 2 1 53 39 50
40 47 t8 43 :3 4 4 2 2 21 II 51 26 29 25 29 I 14 9 52 99 97 78 87 12 6 2 2 3 3 1 1 39 38 53 79 105 65 96 2 I 5 11 4 64 47 54 57 61 53 57 1 2 3 24 20 55
59 53 58 51 1 2 16 15 56 83 61 flO 59 2 1 23 27 57 16 22 16 22 12 . 11 53 18 17 17 14 ... ... 2 1 2 3 59
124 239 103 226 5 9 12 3 3 205 ,116 60
37 31 30 28 6 3 ... 13 25 61 56 56 54 56 1 28 19 62
8 14 7 11 3 7 4 63 3f) 29 28 29 2 14 16 64 31 29 30 28 15 19 65
106 96 106 94 2 '.': ... 28 49 66 30 24 30 23 1 14 11 67 52 46 48 44 2 2 2 23 28 68 53 64 48 63 2 2 1 1 ." 15 21 69 74 80 47 50 3 4 15 25 4 2 2 55 49 70
41 36 27 12 1 3 10 21 2 1 16 20 7[ 79 89 56 57 2 13 16 19 . 1 3 33 40 72
1 1 1 1 1 2 73 106 74 87 72 12 1 3 4 37 46 74
17 22 13 19 3 3 6 14 75
3 4 3 4 2 76
87 93 74 60 1 ... 8 32 2 2 24 38 77
48 56 43 31 1 4 25 20 16 78
45 37 30 18 1 12 19 2 19 23 79
113 95 82 79 4 2 20 13 6 39 39 80
196 167 129 129 5 16 60 22 51 48 81 59 60 43 48 2 8 14 4 ... 16 21 82 7l 89 62 85 2 5 4 38 32 83 21 22 21 20 2 7 9 84 16 23 15 ~O 3 3 8 85
79 66 73 66 5 40 59 86 16 8 15 8 I 14 12 87 87 87 76 85 B 1 2- 31 41 88 7~ 76 71 74 1 1 20 28 89 -64 46 60 45 I 2 9 18 90

xxxviH
VU,.UGE.
DtJNDA TAHSIL
Occu-Serial Name of Village Number Area pied House- Total Population Scheduled Literate and Nfl .• (Notations for amenities) of in Reai- holds Castes educated pellODl',
Hamlets acres dentlal Houses
~ ,--_._..A-_~ ,_..--..A.._.._
P M F M )' M , 2 3 4 5 6 7 8 9 10 11 12 13
91 Shira 2 399 28 30 142 70 72 36 26 4-92 Dandagaon 1 16 7 7 27 14- 13 8 6 5 93 Dharkot 2 800 102 102 445 228 217 117 III 39 1 94 Jokhani 2 483 51 51 275 134 141 58 69 28 !}.
95 Jeshtwari 4 745 68 68 427 210 217 80 83 26
96 Kandi 1 187 13 13 73 37 . 36 16 13 97 Ilamnti 1 191 28 36 202 95 107 33 43 17 98 Kuthaldi R. 3 232 25 25 124 61 63 8 5 11 99 Shrikot R. 1 445 33 51:1 3U8 147 161 35 38 34
100 Chiloth 2 520 80 80 338 161 177 67 '68 21
101 Kainthogi 1 212 26 26 132 58 74 11 1~ II 102 Indragaon 1 376 41 41 191 90 101 16 .21 15 103 Tipari 1 483 36 36 200 93 107 14 9 16 104 Maugha 1 115 9 9 48 24 24 2 105 Matholi I 370 29 29 169 83 86 20 15 19
106 Baret 1 279 30 30 180 78 102 21 85 3 107 Morgi R. 1 551 65 65 271 119 152 27 36 27 4-108 Kauda 2 240 30 30 137 63 74 34 37 8 109 Dharasu R,Riv,Mcw. 2 138 34 34 156 113 43 6 47 1 110 Hitara R. 1 126 13 13 72 35 37 2 2 16
111 Barethi R.Rvi. 4 264 88 89 335 207 128 58 46 103 12 112 Kandala R. 1 142 35 35 172 87 85 12 '] 39 113 Bhuyara 1 128 9 9 74 37 37 13 12 8 114- Bagi 1 215 29 29 155 63 92 29 :11- 12 1. Wi Kot 1 736 25 25 192 103 89 41 29 17
116 Kansi 1 435 54 58 280 139 141 16 9 40 117 Chmyali R.Riv. 6 1'078 159 171 843 443 400 176 178 186 7 118 NaganiBari R. 1 77 32 32 148 77 71 33 29 23 1 119 Dhanpur R. 1 63 II 11 66 33 33 2 4- JI 2:' 120 Nagam Choti R,Riv. 1 59 10 10 50 25 25 13 1:1 6
121 Sunargaon R,Riv. 2 * 41 41 222 97 125 7 12 37 1 122 Gailal'i R,Riv. 2 47 8 8 43 12 31 6 123 Tulilyara R,Riv. 1 706 22 22 89 46 43 25 22 4 124- Neri R,Riv. 1 287 26 26 101 49 52 2 2 8 125 Badshi R. 2 599 78 78 313 125 188 6 3 36
1 ZfI Bharkot R. 2 414 32 32 156 82 74 12 9 11 127 Anol R. 1 189 39 39 228 134 94 13 1t5 15 128 Hadiyari R,Riv. 1 220 20 20 94 46 48 10 ~ 7 ~;, 129 Badhangaon R,Riv. I 130 ;/.7 27 149 66 83 17 If) 27 I 130 Malli R. 1 300 22 22 It7 55 62 15 I!I 17 ·1
l3} Goran R. 1 t 17 17 52 26 26 I 10 132 Pokhari R. 1 t 8 8 40 9 31 2 ~ 2 13S Kawagadi R. 1 248 10 10 65 28 37 !I !I 2 1M Pujyargaon [L.B] R. 1 t 6 6 28 12 16 1 )3~ 13agori R. J 782 88 89 380 J88 192 47 ... 47 I
-Area included in viJIage Tuliyara Code No. 123 tA;ea included in village Bagori Code No. 135

xxxix
,DIRBCTOlt Y
R UItAL-Ccmld.
WORKERS
--- '--. NON-'Total Workers WORKERS
(I-IX) , II III IV V VI VII VIII IX X Seria}
No. ___ ..... --.
,......_.,...~ '.~ ,............_. ,......._, ~ ~ ,...-J'---. ~
M F M F M F M F U F U F U f M F M 1 M 1 M F
14 15 16 17 18 19 20 21 22 23 24 25 26 27 28 29 30 31 32 3S 34 35
56 5!1 !l2 54 3 1 14 17 91 10 II 10 11 4 2 !Z
171 160 162 157 !I 3 4 57 57 ~ 89 96 80 88 4 6 2 2 2 45 45 M
141 140 125 137 1 2 15 1 69 77 95·
30 22 27 22 2 ... 7 14- 9& 72 73 57 65 11 8 3 23 34- 97 47 43 44- 41 3 2 ... 14 20 98
101 116 .90 115 9 1 ... 1 46 45 99 109 136 91 136 13 4 52 41 100 . 4~ ~9 38 58 6 ... 13 15 101 ~ 72 65 72 ... ... ... 25 29 102 69 74 66 n 1 1 1 24 33 lOa lCJ 19 16 19 ... 8 5 1M 59 55 49 51 1 8 3 2 24 31 1(5
58 74 55 74- 3 ... 20 28 106 91 113 88 112 2 ... 1 28 39 107 41 48 37 46 3 2 I 22 26 106 92 26 11 23 3 1 53 3 3 21 21 17 109 2} 27 19 21 2 14 10 110
156 88 58 67 6 15 26 17 6 16 25 2 5 51 40 111 49 69 43 65 2 4 4 38 16 112-23 32 23 32 14 5 113-41 65 41 . 64 ... 22 27 114 69 70 66 70 3 34 19 11~
!OC 1ll 93 109 1 4 2 ... 2 39 30 116
29~ 287 198 272 13 7 30 29 8 10 5 10 148 113 117 51 50 39 44 '1 7 5 3 2 26 21 118 20 20 . 16 19 1 1 2 13 13 119 13 17 13 17 12 8 120-
63 94 57 94 5 34 31 121 6 6 1:42
6 23 6 23 .. , 35 36 27 34 2 2 4: 11 7 123-
Hi 7 124 33 45 33 45 ... ... 60 144 54 140 5 :i 05 44 125
52 1 1 23 20 126
59 54 56 59 6 4 21 25 127 .. , 113 69 48 64 3 1 2 16 11 128-30 34 23 31 2 1 20 20 129-46 63 40 62 4 1 21 15 130 34 47 33 46
l!> 18 14 18 1 11 8 13t 5 19 4 19 1 ... 4- , 12 J32'
23 24 19 21 2 of 1 5 13 133' 7 13 7 13 5 3 J34-
141 141 93 135 1 32 3 6 3 2 6 48 51 - 135-

:d
VILLAGE
DUNDA TAHSIL
Occu-Total Popuiation &rial Name of Village Number Area pied House- Scheduled literate and
No. (Notations for amenities) of in Resi- holds Castes educated persons Hamlets acres dential
Houses
r---~----' ,---"-----, r--~-'--~
P M F M F M F
2 3 4 5 6 7 8 9 10 11 12 13
136 Kathkhan R. 87 Un-inHabited 137 Khand R. 280 63 63 288 129 159 59 63 21 138 Pujargaon 143 15 15 88 40 48 15 139 Koti 65 8 8 44 16 28 3 140 Adani 11. 400 55 55 215 81 134 36 48 19
141 Rauntal 1 574: 147 147 590 208 382 6 5 83 142 Chand pur 1 148 I l' 3 3 143 Gamari Khash I 102 15 15 63 35 28 12 144: P, pal Khanda 3 88 34 34 132 51 81 4 1 17 145 Jaspur R,Riv. 1 315 42 42 171 93 78 23 14 8
146 Chamiyari R. 1 57 17 17 51 20 31 4 11 1 147 Margaon R,Riv. 2 370 56 56 217 104 113 19 18 30 1 148 Smguni Riv. I 204 33 45 227 105 122 24 26 44 5 149 Dhungl R. 1 309 16 25 127 67 60 16 18 36 3 150 Ganda Banda urf Baijkoti R. 1 56 3 3 16 8 8 3
151 Hitanumal Balshi R,Riv. 3 541 34 36 145 73 72 35 38 14 2 152 Astal R;Riv. 1 239 24 24 115 58 57 16 17 23 153 Ranari R,Riv. 1 171 19 20 108 47 61 19 25 18 3 154 Majaph 1 129 10 10 73 37 36 25 25 13 155 Danda 1 46 13 15 64 31 33 20 23 4
156 Darmali R. 1 106 24 29 138 72 66 52 39 10 1 157 Pujargaon R. 1 270 86 102 412 167 245 70 58 60 2 158 Gawana R. 1 316 38 44 216 95 121 29 23 36 1 159 Deoli 1 104 21 23 105 45 60 6 5 17 160 Bhatgaon 2 220 42 42 212 ·90 122 9 7 56
161 Pipali Rajak R. 2 125 20 21 104 50 54 1 1 30 162 Kimn R. 1 121 15 15 68 30 38 6 2 II 163 Dikl urf Bijpur R. 1 139 10 11 53 21 32 4 :3 9 164 Dharkot I 285 9 9 45 21 24: 4 2 8 I6? Thati R. 1 14:0 77 92 414 191 223 104 113 ' 80 10
166 Painimai(Bhawan) R. 1 512 27 33 151 72 79 5 7 40 5 167 Ulan 1 27 4 5 31 13 18 6 168 Irra 1 314 38 45 190 86 104 9 13 41 9 169 Kaligaon R. 1 235' 23 29 126 65 61 9 5 23 170 BagiyaJgaan R. 1 184 25 26 .138 58 80 5 7 22
171 Paturi R. 2 296 19 30 135 58 77 2 12 172 Dhungal Dhar 1 101 10 11 69 26 43 7 173 Chinangaon 1 108 9 13 59 25 34 4 4 10 174 Musargaon 1 173 4;3 45 199 91 108 2 1 40
-175 Kuleth 1 59 4 4 17 8 9 2
176 Panchangaon 1 344 58 68 301 130 171 7 7 58 1 177 Bhatwari R,MIJ' 2 127 37 42 191 92 99 22 19 53 1 178 Bagsari 1 603 48 52 319 133 186 5 9 58 4 179 Dhungalgaon 1 358 31 38 231 97 134 9 10 34 I 18() Dikthol 1 174 2t 27 110 45 65 4- 7 27

.li
_amORY
:.MJltM.~ ..
WORKERS
,...------------"------------.... NON-·Total Workers WORKERS Serial
(I-IX) No. I II III IV ·V VI VII VIII IX ~.
r-·-"-~-~ ~_Jll._ ...... __ .A.a_,
--"'-'.~ _ A.o .. -.. ~A. __ ,.....-"- __
~-.",,_ . ._. ,.....-"-..., ,..... .... ...., ,--_-"-. ______
M F M F M F M F M F M F M F M F M F ·M F M F
'l~ 15 16 17 18 19 20 21 22 23 24 25 26 27 28 29 30 31 32 33 34 35 1
Pn-inhabited 136 ·95 121 88 118 3 3 2 34 38 137 15 30 15 30 25 18 138 10 19 10 19 6 9 139 56 102 50 95 6 6 25 3:! 140
:174 249 75 245 6 4 72 21 34 133 141 3 3 142
23 24 16 24 6 12 4 143 34 59 18 59 15 17 22 144 60 64 59 64 33 14 145
14 22 1.1 22 ... 4 2 6 9 146 73 88 66 1.17 1 5 1 31 25 147 63 98 62 98 1 .... 42 24 148 36 52 ·36 52 31 8 149 3 8 3 () 5 150
60 61 60 61 13 11 151 33 39 31 39 . 1 25 18 152 27 45 27 45 20 16 153 22 25 :.12 25 'f; 15 11 154 26 27 26 27 5 6 155
48 53 48 53 24 13 156 95 196 93 196 2 72 49 157 59 91 58 91 36 30 158 34 43 32 42 1 11 17 159 41 86 36 85 4 49 36 160
16 31 8 30 6 34 23 161 21 28 21 28 9 10 162 7 27 7 27 14 5 163 3 20 7 20 1 ... ... 13 1: 164
.1%9 158 96 156 3 16 1 4 2 2 4 62 65 . 165
44- 61 39 59 5 2 28 16· 166 11 17 11 17 2 1 167 46 82 39 78 5 3 40 2% 168 30 51 27 51 3 35 10 16~
40 56 38 55 2 18 24 170
38 52 37 50 2 20 %5 171 18 28 16 28 2 8 15 172 15 27 13 25 2 2 10 7 173
·42 77 39 76 I 1 2 49 31 174 5 7 5 7 3 % 175
. 3S I'll 81 I'll .... 2 47 50 176 50 55 32 52 6 2 3 8 42 44 177
.5% 130 45 126 4 4 2 81 56 178
50 : 101 44- 96 5 5 47 33 179
:16 46 23 44 3 2 19 Ig· 180

VU.L&GB.
Dt.'NDA TAHIJI.-
Occu-Name of Village Number Area pied House- Total Population Scheduled Literate and
Serial (Notations for amenitiel) of in Resi- holds Castes educated persolll,
No. Hamlet. acres dential Houses
--. ,.....,.........___, P M F M F M ..
2 3 4 5 6 7 8 9 10 11 12 13-
181 Chakon R. 1 298 49 63 268 104 164 48 49 39 IS 182 Bamangaon R. 3 296 77 101 466 187 275 43 29 73 oi
183 Chaundryatgaon R. 1 187 21 21 95 42 53 10 184 Dikholi R, Po. 1 198 29 29 115 41 74 20 185 Saur R. I 175 41 41 153 63 90 22
186 Lodara R. 1 171 33 33 125 41 84 22 1 187 Bhetiyara R. 2 422 95 95 351 144 207 34 34 57 , 188 Bharkot R. 4 633 134 134 520 250 270 77 72 42 189 Kumarkot 1 254 42 42 209 90 119 1 1 29 190 Thandi 2 202 66 66 365 176 189 9 14 46
191 Khodjalog 1 274 7 7 23 12 11
192 Kamad R. 1 273 91 91 376 178 198 53 ~5 31 193 Bagi R. 1 138 42 42 191 95 96 53 194 Shrigaon Mp. 5 596 121 121 481 194 287 36 47 77 195 Udri R. 1 448 109 119 376 140 236 43 48 28
196 Naipar 241 47 47 165 51 114 15 197 Bhaint 191 41 41 198 84 114 1 12 198 Huldiyana 577 84 84 290 87 203 5 3 18 199 Newgaon 333 85 85 358 130 228 7 6 37 200 Pokhariyalgaon 312 30 30 110 39 71 3 2 12
201 Matti R. 1 345 65 65 237 86 151 29 41 30 202 Dhaneti R. 1 261 62 62 233 80 153 "IS 13 31 203 Gorsara R. 1 138 40 40 189 72 '-, 117 6 4 27 204 Bareth R. 1 295 57 57 208 73 135 17 17 23 205 Garhthati R. 1 106 35 35 121 41 80 2 1 10
206 Bankot 1 153 54 59 239 100 139 5 5 5 207 Jugargaon. 1 199 69 89 313 91 222 5 11 16 208 Thatidichli R. 1 121 63 71 316 133 183 94 122 14 209 Bhaingwa1gaon R. 1 184 22 22 91 29 62 I 2 4 210 Kiyari 1 26 25 25 li9 43 76 7
211 Sarap 167 42 42 210 90 120 6 4 24 212 Shrikot 54 2 2 6 2 4 213 Kumrara Riv. 1,504 70 70 348 173 175 29 23 23 214 Jogyara Riv. 82 26 26 133 56 77 I 4 6 215 BaJdogi 357 33 33 129 59 70 5 7
2Ui Khalshi Po. 2 1,160 201 201 907 377 530 61 80 33 217 Jogatupla Mp. 1 330 107 107 551 195 356 4 4 64 6-218 Jogat Bichla 1 119 39 39 176 75 101 1 1 15 1 219 Jo<at Talla Po. I 361 109 109 472 ]98 274 U 75 17 1 220 Garhwalgad 1 452 100 100 426 161 265 16 23 4
221 Barola 86 8 8 40 19 21 4 2 222 Manichoti 376 46 46 228 100 128 39 58 8 223 Bhaldgaon Riy. 131 14 14 85 39 46 27 29 I 224 :Mani Bari 254 64 64 315 139 176 18 36 28
TOTAL OF DUNDA BLOCS: 305 63,486 8,91'1 9,282 42,_ 19,943 23,CK3 5,328 5,237 5,525 ~

uii
DIRECTORY
-RURAL-egm ... ; ,
WOllKEU
...---- NON-Total Workers WORKERS
(I-IX) I II III IV V VI VII VIII IX X Serial
No.
".-_"""_'--... ,__...._, , r----. r--"---. .--....... ,-- ,.._.._, ~ ,....-.....__,
M F M F M r M , M r M F M F M , M F M F M F
14 15 16 I? 18 19 20 21 22 23 24 ~ 26 27 28 29 30 31 32 33 34 35
6S 120 62 119 1 5 36 44 lin 93 214 87 214 2 2 2 94 61 182 W 41 20 41 22 12 18a 18 51 16 50 2 23 23 184 27 68 27 68 36 22 185
25 57 22 57 1 16 27 186-86 157 79 157 7 58 50 187
167 194 162 192 2 2 83 76 188 54 89 54 89 36 30 189
121 132 I'll 132 55 57 190
8 7 8 7 4 4 191 116 141 lOS 135 10 6 1 62 57 192 54 61 51 541 1 7 2 41 35 193
102 215 86 202 4 2 lO 11 2 92 72 194-68 185 60 185 1 2 3 1 72 51 195
21 80 21 78 2 30 34 196 39 83 36 81 3 2 45 31 197 23 160 21 155 4 1 1 64 43 198 48 167 46 167 2 82 61 199 16 55 15 54 23 16 200
44- 123 38 119 ti 4 42 28 201 33 112 30 112 2 '" J 47 41 202 31 86 24 85 3 3 1 1 41 31 203 26 107 17 101 3 5 2 2 1 47 28 ~M 9 58 7 57 1 1 1 32 22 205
51 ' 97 51 97 49 42 206 34 151 33 151 57 71 207 93 122 80 120 9 3 40 61 208 15 38 15 38 14 24 209 18 50 18 50 25 26 210
47 77 45 76 43 43 211 1 3 1 3 1 1 212 129 125 112 123 5 2 7 5 44 50 213 30 53 28 53 1 1 26 24 214 39 51 37 51 2 20 19 21~
217 347 205 329 3 16 5 2 160 183 216 72 222 61 222 11 123 134 217 40 72 3Q 72 35 29 218 123 197 I'll 194 ';' 2 2 75 77 219 90 194- 90 194 71 71 220
13 14 12 14 1 6 7 221 64 78 63 78 1 36 50 222 2tl 26 • 25 25 13 21 223 81 110 78 no :3 58 6fi 224
1I,7M J6.1!1 10 •• '6 15,323 1_ 1~9 29Ci 71 141 63. 23 2 4.5. .. , 1M , 29 S!9 ZO 7,209 7,651

DUNDA T4HSIL.
Occu-Serial Name of Village Numbet- Area pied lioUle- Total Population Scheduled LJte~ate and
No. (Notation. for amenities) of in Rai- bold. Castes educated persons Hamlets aera _ dential
Ho_
,--""'____"
P M F M F M F
2 5 i 7 8 9 10 11 12 13
FOREST RANGE
225 F. 1 (1) Sdkuyara (F.R.H.) .. ~ 1 %1 %1 74- 69 5 5 21 226 F. I (2) NagaI (F.D. Chauki) Un-inhabited 227 F. 1 (3) Bareth (F.R.H.) ... , Un inhabited :.!28 F. 1 (4) Gauoag (F.D. Cbauki) ... Un-lDbabited -229 F. 1 (5) lIangaoa (F.R.H.) Un-inhabited ,
I 230 F. 1 (6) Dharasoo (F.R.a.R.O.) Ii 17 17 36 30 6 4 2 -231 F. 2 (t) Sheep Farm .
t r 9 9 35 %5 10 18 5
232 F. 2 (2) Forest Guard Chauki 118,732 3 3 6 6 6 233 F. 2 (3) Bansubara (R.O.) 5 5 15 10 5 7 2 234 F. 2 (4) Nakuri (F.R. I) 23 n 83 48 35 7 7 19 +
235 F. 2 (5) Darmali (F.R.H.) 1:i 2J 97 94 5 •... 36 236 F. 2 (6) Gawana (F.D. Chauki) Un-inhabited 237 F. 2 (7) Gandabanda urf Baijkot Ull-mhabited 238 F. 2 (8) Fold (F.R.H.) Un-inhabited 239 F. 2 (9) Gamari (F.R.H.) 30 5V 139 137 % 1% 38
24-0 F. 2 (10) Jaspur (F.D. Chauki) ... J Un-inhabited ~41 F. 3 (1) Dhauntri (F.R.H.) ," Un-inhabited
TOTAL or rOREST RANGE 8 118,732 131 lSI 485 fl' 66 40 13 149 13
TOTAL or DUNDA TAHSIL 313 182,218 9,041 ',41' 43,471 ·20,362 23,109 5,368 5,250 5,674 233

xlv
DIRECTOR.Y
RURAL-Coneld.
WORKERS
,------ .A. -------- ---.. NON-Total Workers WORKERS (I-IX)
Serial II III . IV V VI VII VIII IX X N('. ,--_Jo-_--,.
-~ ~ ~ r:~ ~ ~ ,............._, ,........_....., ..-.....__, M F M F M F M F M F M F M F M F M F M F M F 14 15 16 17 18 19 20 21 22 23 24 25 26 27 28 29 30 31 32 33 34 35
FOREST RANGE
66 5 5 ... 56 '" 9 ... ... ., . .. , S 225 Un-inhabited 226 Un-inhabited 227 Un-inhabited 228 Un-inhabited 229
26 19 7 4 6 230 20 16 3 5 10 231 6 3 3 232 6 6 4 5 233
41 25 2 4 10 25 21 2 7 10 234
93 3 ~3 3 235 Un-inhabited 236 Un-inhabited 237 Un-inhabited 238
137 136 '" .. , ... I ... ~ 239 . ,. ... '" ... . .. .,. . .. Un-inhabited 24()' Un-inhabited 241
395 33 139 9 ... m 3 25 21 1 ... 18 2 15 21 33
13,129 16,221 10,615 15,332 Hi 129 f99 74 166 651 24 2 468 ... 1 .. i 2' 374 3. 7,233 6,885


BHATW ARI TAHSIL


Sl. No.
Name of Village
1 Agora
2 Aleth
3 Athali
4 Aungi
5 Ragori
6 Bagyalgaon
7 Bandeani
8 Barsu
9 Basullga
l() Bayana
11 Bhangeli
12 Bhatwari 13 Bhaunkoli 14 Bhelatipari
15 Bhukki
16 Bonga
17 Bongali
2
18 Chhapliur utj l>hanpur 19 Dandalka 20 Dang
21 Dansala
22 Dharali
23, Dldsari
24 Dllsor
25 Dwari
26 Gajoti
27 Gamdiurgaon
28 Gangotri 29 Gawana
SO Gorsali
31 Gyanja
32 Hinna
33 Hurri
34 Jadung
35 Jakhol
36 Jarnak 37 Jaspur
38 Jaspur
39 JaUl,au
40 )hala
51. No. ill Village
Directory
3
60 97 TI 49 ,(I
71 20 15 68
43
11
24 62 38 33
85 92 96 59 82
61
3 45
78 22
58
67 5
54
26
65
52 32 1
30
47
9 74
36
8
ALPHABETICAL LIST 01 VILLAGES
BHATWARJ TAHSIL
SI. No. Name of Village
41 Jokan
42 Joshiyara
43 Kamar 44 Kaneth
45 Kanka I
46 Kansain
47 Kishanpur
48 Kiyari
2
49 Ko\iyalgaon 50 Kujjan
51 Kumalti
52 Kumriya urf Sunagar 53 Kuroli
54 Ladari
55 Lata
56 Lonthru
57 MalIa 58 Mandoun
59 Maneri
60 Manpur
61 Marari
62 Mastari
63 Mukhaba
64 Nald uri Bondar 65 Natin
66 Naugaon
67 Nelang
68 Netala 69 Nilakot
70 Nismore
71 Pahi
72 Pal a
n Pat a
74 Pilang
75 Pokhri
76 PuraH
77 Raithal
78 Sainj
79 Salang
80 SaId ManjyagaoD
Sl. No. in Village
Directory
3
,27 80
46
50
!Jl
79
95 21 S4 H
29 12 93
83
2.S
44 25 72
51
94
17 88
4
5S 19
63
2
53 76
64
23 16 '70
35 81
7
18
31 34
66
SI. No. Name of Village
81 Salu 82 Sangrali
83 Sara
84 Sarag Palla
S5 Sarag Walla
86 Sari
87 Saura
88 Seku 89 SilJa
90 SIIyan
91 Slror
92 Sukki 93 Syaba
94 Thalan
95 Tiloth
96 Tiyar 97 Uttaraun
2
FOREST RANGE
98 Bhairon Ghati (Forest) 99 Bbarha Gathi
100 Didsari'
101 Dodital
103 Gangnani (Forest)
102 Gangotri (Forest) 10-1, Kaldia
105 Kat Bungalow
106 Leese Ka Junlge 107 Lodbgad
108 Maneri
109 Nagani
lIO SODam
111 l'ttri Junglat
51. No in Village
Directory-
3
41
69
9~
86 87
40 39 57 37 75
48 10
42 89 73
13 56
F. 1(3) F.2(8) F.2(3) F,2(1)
F. 1(4}
F. 1(2l F.2(2)
F,2(5)
F.2(9) F.l(5)
F,2(6)
F,2(4) F, 1(1)
F,2(7}

1
VILLAGE
BHATWAIU TAHSIL
Occu-Serial Name of Village Number Area pied House- Total Population Scheduled Literate and
No. (Notations for amenities) of m Resi- holds Castes educated persons Hamlets aeres dent:al
Houses ,-_.A.. ___ -. ,__""'_'--... ,.---"-----.
P M F M F M F
2 3 4 5 6 7 8 9 10 II 12 13
BHATWARI (TANKUR) BLOCK
I Jadung Riv. 1,069 Un-inhabited
2 Nelang R. 1,063 Un-inhabited
3 Dharali R, Riv. 2 624 27 27 U3 50 63 6 7 19 1
4 Mukhaba Riv, L, Mp. 2 1,647 53 53 253 147 106 23 26 91 5 5 Gangotri R, Riv, Po. 2 36 11 11 12 12 12
6 Bagari R,Riv. 1 45 3 3 17 13 4 2 1 7 Purali 1 450 20 20 95 42 53 6 6 6 1 8 Jhala R, Riv, Mew, Po. 1 616 57 57 222 106 116 28 27 10 ... 9 Jaspur 1 542 25 25 91 37 54 1 1 7
10 Sukk R. 1 1,067 47 47 187 95 92 11 14 27
11 Bhangeli 3 726 52 61 322 236 86 31 27 65 1 12 Kumriya urf SlInagar 1 108 12 14 98 57 41 5 16 3 13 Tiyar 2 1,132 53 55 255 148 107 10 10 36 2 14 Kujjan L. 2 518 44 44 215 130 85 10 5 25 15 Barsu 1 443 50 50 219 108 111 5 4 20 1
16 P"la 3 1,165 50 50 237 168 69 24 21 30 17 Marari 1 140 6 6 20 9 11 18 Raithal 1 1,412 119 119 425 217 208 52 53 73 2 19 Natin 1 210 16 16 64 30 34 8 20 Bandrani 1 244 41 41 140 69 71 11 10 19
21 Kiyari R. 1 256 48 48 181 98 83 1 37 3 22 Dwari 1 465 57 57 173 83 90 11 10 28 3 23 Pahi 1 206 41 42 139 68 71 1 1 35 24 Blntwari R, Riv, L, Mp, Has, Po. 1 347 141 141 441 302 139 19 12 217 25 ~5 Malla R,Riv. 2 735 110 112 430 247 183 89 88 100 10
26 Gorsali 1 1,898 121 121 482 237 245 47 46 85 5 27 Jokar:i 1 218 17 17 48 28 20 3 28 lata R, Riv. 2 227 46 46 143 65 78 1 3 36 2 29 KumaIti 1 190 24 24 84 32 52 1 1 17 30 Jakhol 1 280 38 38 170 78 92 6 ·7 42 5
31 Sainj 1 467 66 66 237 110 127 6 3 76 2 32 Hurri 1 585 34 34 131 59 72 10 9 8 33 Bhukki 1 27 23 23 ' 79 40 39 7 3 6 2 34 Salang 3 792 62 65 231 117 114 10 11 40 7 35 Pilang 1 754 41 58 186 86 100 9
36 Jauralu 1 31 11 13 44 25 19 8 37 Silla 1 554 61 61 175 93 82 12 19 1 38 Bhelatipari R, Riv. 1 531 29 29 79 40 39 3 18 2 39 Saura R, Riv, L, Mp. 1 926 67 67 204 116 88 37 32 54 2 40 Sari 1 249 65 65 225 117 108 13 16 1
41 Salu 1 530 25 25 112 51 61 15 42 Syaba 1 681 41 41 121 61 60 10 43 Bayana 2 :570 45 45 145 70 75 12 12 31 2 44 Lonthri 1 207 36 36 117 58 59 3 1 36 2 45 Didsari R. 1 309 40 41 158 78 80 10 19 33 7

li
GIBBCTORY
.aURAL .
WORKERS
-- NON-Total Worken WORKERS
(I-IX) I II III IV V VI VII VIII IX X
Serial No.
,........-..... ,........-..... r--"--. .......--.. ............... r--"--. ,..--""'__' ,.............. ~
M F M F M F M F M F M F M F M F M F M F M F
14 15 16 17 18 19 20 21 22 23 24 25 26 27 28 29 30 31 32 33 34 35
BHATWARI (TANKUR) BLOCK
Un-inhabited 1 Un-inhabited 2
27 33 26 33 1 23 30 3 114 56 46 • 55 5 3 60 33 50 4
12 5
12 1 1 11 1 3 6 24 32 23 32 1 18 21 7 66 75 59 73 4 2 3 40 41 8 23 39 21 38 1 1 14 15 9 54 65 52 65 1 1 41 27 10
'215 55 62 52 91 3 3 42 1 16 21 31 11 43 25 10 25 29 1 1 2 14 16 12
107 75 52 65 30 9 10 16 1 40 32 13 110 50 31 45 13 5 65 1 20 35 14 73 69 64 69 2 6 1 35 42 15
150 51 34 48 16 5 3 84 10 18 18 16 8 9 8 8 1 1 2 17
167 156 137 155 22 3 1 4 50 52 18 21 26 18 26 2 1 9 8 19 56 58 48 58 8 13 13 20
86 66 49 66 ... 15 1 3 16 2 12 17 21 63 70 57 70 2 2 2 20 20 22 54 56 44 56 2 8 14 15 23
232 76 57 73 19 7 3 69 12 2 63 3 70 63 24 175 120 116 117 2 2 1 32 1 2 21 72 63 25
159 201 157 200 2 78 44 26 27 20 29 20 1 27 38 59 35 58 '2 3 1 27 19 28 22 38 15 37 2 2 1 10 14 29 51 61 43 59 1 2 4 3 27 31 30
72 97 57 95 2 8 3 3 38 30 31 45 50 40 50 2 3 14 22 32 32 24 25 23 7 1 8 15 33 88 78 81 76 5 2 2 29 36 34 77 84 77 84 9 16 35
13 18 12 18 12 1 36 78 72 77 72 1 15 10 37 33 31 25 31 3 , .. 4 7 8 38 92 67 77 64 3 4 10 24 21 39 85 84 85 84 32 24 40
35 46 33 46 16 15 45 52 44 52 41 57 60 56 60 16 8 42 29 43 26 42 2
13 15 43 50 63 49 62 29 16 44 I 28 17 45

Iii
VlLLAGIt
BHATWARI TAHSIL
Oceu-
Serial Name of Village Number Area pied Houae- Total Population Scheduled Literate and No. (Notations for ameDities) of in Resi- hold. Castes educated person..
Hamlet. acres dential Houses
..... _ ~
P M F M F M
2 3 4 5 6 7 8 9 10 11 12 13
46 Kamar I 309 .42 42 175 79 96 4 2 28 I 47 Jamak Riv. 1 390 40 40 177 86 91 13 II 25 2. 48 Si!"~: Riv, L. 2 171 67 67 313 159 154 10 9 82 5 49 Aungi I 238 33 34 III 49 62 '14 10 21 1 50 Kaneth I 87 4 4 16 6 IO 2
51 Maneri R, L, Mew. 2 545 65 65 280 155 125 51 50 76 4 52 Hmna 1 329 35 35 187 101 86 28 25 37 1 53 Netala R.Riv. 1 201 97 97 411 196 215 44 48 87 3 54 Gawana R,Riv. 1 832 82 82 403 232 171 61 47 108 11 55 Nald Uri Bondar 2 430 84 84 401 194 207 3 2 70 2
56 Uttraun R, Riv. 1 456 100 100 500 263 237 10 10 106 5 57 Seku 1 315 2St 29 129 69 60 2 4 18 58 Gajoli 1 386 65 65 293 140 153 55 57 57 59 Dandalka R. I 192 11 II 49 23 26 10 60 Agora R. 1 392 61 61 241 127 114 25 20 60 2
61 Dansala 1 115 18 18 88 43 45 13 62 Bhaunkoli L,Mcw. 1 751 65 65 268 128 140 32 24 45 4 63 Naugaon Po. 1 718 54 55 225 111 114 38 43 40 64 Nisrnore 2 400 64 64 358 184 174 5 8 66 8 65 Gyanja 1 250 44 44 195 102 93 3 2 18 2
66 Said Manjyagaon 1 177 86 86 384 185 199 49 43 62 2 67 Gamdiurgaon I 266 48 48 263 137 126 66 68 Basunga I 184 16 16 84 36 48 2 5 26 2 69 Sangrali I 265 40 4() 209 96 113 12 13 21 70 Pata 1 213 64 64 278 13\ 147 6 'I: 31
71 Bag)algao~ 130 44 44 188 91 97 14 17 22 1 72 Mandoun Riv. 301 53 53 210 97 113 I 46 7 73 Tiloth Riv. 225 46 46 169 68 101 10 16 38 2 74 Jaspur 69 22 23 76 37 39 19 2 75 Siljan 89 13 13 66 33 33 12
76 Nirakot 1 19 5 5 28 13 15 4 77 Athali Riv. 2 -412 66 66 321 170 151 26 20 68 78 Dilsor Riv. I 181 23 23 103 47 56 4 3 15 79 Kansain Riv, L. 1 100 33 33 150 74 76 10 12 36 7 80 Jo~hiyara R:v. I 126 34 34 120 65 55 19 18 44 13
81 Pokhri I 172 20 20 88 40 48 3 4 14 82 Dang 1 103 37 37 ISS 67 88 10 21 28 3. 83 Ladari I 272 31 31 129 53 76 4 4 28 3. 84 Kotiyalgaoll 2 123 43 43 137 55 82 I 1 25 85 Bonga 2 440 112 112 513 240 273 59 58 90 8.
86 Sarag Palla I 21 5 6 22 7 15 2 87 Sarag Walla I 29 5 6 22 8 14 3 88 Ma9tari 1 196 18 13 94 38 56 12 89 'i'halan S 218 58 63 255 92 163 12 13 38 t 90 Sar;~ L. I 296 24 24 119 52 67 26 25 20

H" 'I'
..,l&BCTORY
RURAL-CeIIU.
WORKERS
---. NON-"Total Workers
(I-IX) WORKERS
I II III IV V VI VII VIII IX X Serial No.
..... --........__, :,.--~-~ ,-----, ~ ,........,.._, ,.._..,..._, ~ ,__..___. ,........._. ,----. M F M F M F M F M F M F M F M F M F M F M F
14 15 16 17 18 19 20 21 22 23 24- 25 26 27 28 29 30 31 . 32 33 34 35
49 59 46 59 3 30 37 46 56 60 54 60. 30 31 47 89 88 86 88 3 70 66 48 39 48 32 44 3 4 4 10 14 49 4 7 4 7 2 :3 50
123 94 79 93 2 35 2 5 32 31 51 69 59 46 59 1 17 1 <\ 3'2. 2.7 52
125 152 115 150 3 2 1 6 71 63 53 168 109 96 108 1 4 1 59 7 6<\ 62 54 123 134 90 134 17 3 12 71 73 55
181 166 136 166 32 3 1 8 82 71 56 48 38 32 38 1 1 13 .-~ -.. 21 22 57 90 91 82 91 1 5 50 62 58 14 15 14 15 9 1,1 59 88 70 83 70 2 2 59 4:4 60
14 14 61 29 31 28 31 3 44 50 62 84 90 76 87 4: 2
1 27 41 63 84- 73 81 73 2 2 79 66 64 105 108 95 108 8 2 45 31 65 57 62 54 61 1
126 140 115 139 6 1 4 59 59 66 I 47 33 67 90 93 85 93 4
13 14- 68 23 34 23 34 2 48 47 69 48 66 43 63 3 3 2 10 46 42 70 85 105 69 104 2 1 1
2. 4: 39 33 71 52 64 44 64 45 34 72 52 79 48 79 2 1 1
26 38 73 1 2 1 42 63 38 63 17 9 74 20 30 19 30 15 8 75 18 25 18 25
6 8 6 8 7 7 76 120 109 85 107 19 5 2 9 2 50 42 77 29 39 25 38 3 1 1 18 17 78 36 47 30 45 I I ... 4 38 29 79 37 25 14 22 3 3 1 3 3 12 28 30 80
31 2 1 1 15 17 81 25 31 21
3 2 3 31 "38 82 36 50 27 49
2. I 6 26 33 83 27 43 14 43 1 2
1 2 21 32 84 34 50 27 50 1 2. 1
6 99 88 85 15 25 .. I HI 185 105 159 9
7 86 7 8 7 8 :3 5 87 5 9 5 9 22 25 88
16 31 16 31 ", 53 61 89 .39 102 36 102 I 2 19 23 90 33 44 27 44 I 5

J\v'
VILLAG&
BHATWARI-TAHSIL_
Occu-Scheduled Literate and bella! Name of Village Number Area pied House- Total Population
Castes educated persons No. (Notations for amenities) of in Resi- holds Hamlets acres dential
Houses
'__---"---~ ,...._....__-., ~
P M F M F M F
2 3 4 5 6 7 8 9 10 11 12 13
91 Kankrari 1 106 33 33 187 89 97 45 92 Bongari 1 162 37 37 181 71 110 6 3 36 93 Kuroli 1 157 68 68 282 120 162 10 10 49 94 Manpur 2 314 53 81 370 176 194 45 54 77 95 Kishanpur 4 330 73 111 479 215 264 'i 1 73 2
96 Chhapliur urJ Dhanpur 1 155 22 24 118 52 66 8 10 22 97 Aleth 1 24'3 27 34 170 68 102 11 11 20
TOTAL OF BHATAWARl {TANKUR} BLOCK 122 38,842 4,294 4,418 18,309 9,203 9,106 1,274 1,223 3,490 204
FOREST RANGE
98 F.l (1) Son'lffi .··1 Un-inhabited 99 F. 1 (2) Gangotri (Forest)
.. \ Un-inhabited 100 F. 1 (3) Bhairon Ghati (Forest) .,. Un-inhabited 101 F. I (4) Gangnani (Forest) Un-inhabited 102 F. I (5) Lodhgad Un-inhabited
103 Y.2. (I) Dodital "iI Un-inhabited 104 F. 2 (2) Kaldia 1 1 2 2 2 105 F. 2 (3) Didsari l} 1,026,264 2 2 2 2 1 2 106 F. 2 (4) Nagani q 35 35 77 55 22 13 13 35 107 F. 2 (5) Kot Bungalow 24 24 79 57 22 1 43 14
108 F. 2 (6) Maned
i] 34 34 173 172 32 48 109 F. 2 (7) Uttri Junglat 31 33 107 107 77 110 F. 2 (8) Bharha Garbi 3 4 7 7 2 2 III F.2 (9) Leese ka Jungle 2 2 3 3 1
'fOTAL OF FOREST RANGE 8 1,02&,284 132 135 450 405 45 49 14 I 210 If.
TOTAL OF BBATWARI TAHSIL 130 1,065,126 4,426 4,553 18,759 9,608 9,151 1,323 1,237 3,700 21


lvi
VILLAG&
BHATWARI TAHIIL
Occu-Total Population Scheduled Literate and
'Serial Ward/Mohalla *Area in pied House-
No. 'Enumerator'. Block Sq. milesl Resi- hold. Caates educated petSOlW
Sq.Km. dential HOUles
r--"""___' r--jt..---"I
p M F M F M F
1 2 3 4 5 6 7 8 9 10 11 12
UTTAR KASHI
..I. BHATWARI BLOCK
55 74 74 267 181 86 22 18 106 4:
56 78 78 298 169 129 21 20 liB 22
TOTAL WARD NO.1 152 152 565 350 215 43 38 224 2&
:2 BARAHAT BLOCK
57 206 207 714 481 233 32 25 351 91
58 51 51 205 148 57 7 2 110. 23
59 174 174 64£ 466 180 13 7 361 84
TOTAL WARD NO.2 451 432 1,565 1,095 470 52 34 822 198
"3 GYANSH BLOCK
60 78 78 280 193 87 58 48 122 21
61 59 59 267 127 140 12 10 82 31
TOTAL WARD NO.3 137 137 547 320 227 70 56 204 52
TOTAL UTTAR KASHI N.A. 4'64/12'02 720 721 2,677 1,765 t12 165 130 1,250 276
'*WardfMohalla{Enumerator's B10ckwise area figures not available

lyU
DIRBOTOR'Y
{]R.BAN
WORKERS
,... ---. NON-Total Workers WORKERS
(I-IX) IV I II III V VI _ VII VIII IX - X • Serial
No.
~...._____ ...-------., ,.--"--. ~ ,..-...A....,., ,-~ ,_.....__ .....--..... ~ r-~ r--J\".-~ ,. M F M F M F M F M F M F M F M F M F M F M- F
13 14 15 16 17 18 19 20 21 22 23 24 25 26 27 28 29 30 31 32 33 34
N.A.
1()7 51 16 35 1 5 15 10 4 4 65 74 35
88 57 21 49 5 6 6 4 50 81 72
195 108 37 84 6 11 1 16 10 6 1 8 4 2 115 2 155 107
2
:304 58 21 48 13 5 18 118 3 34 92 9 177 175
94 11 6 9 16 6 10 13 41 2 54 66
297 22 4 17 39 2 16 9 45 3 181 2 169 158
'695 91 31 74 1 14 1 60 2 40 ... 128 58 50 314 13 400 379
3 119 40 8 17 20 23 9 2 80 74 47 72 77 38 73 2 4 4 6 4 1 5 12 55 63
191- 117 46 90 20 23 2 13 4 8 4 1 5 92 129 110
1,081 316 114 248 26 35 17 1 89 16 54 1 140 63 57 521 15 684 596


IV- List of Industrial Establishments
Number of Establishments classified by Minor Groups of Industrial Classification
-'l'otal :
200 (674); 209 (43); 235 (I), 254 (3); 255 (12) ; 273 (10);
281 (I); 283 (I); 284 (I); 311 (II); 350 (1); 369 (30); 393 (8);
Rural:
200 (674); 209 (43); 235 (I); 255 (12); 273 (10); 281 (I) ;
283 (I) ; 284(1) ; 311 (II) ; 350 (I) ; 369 (29); 393 (8) ;
Urban:
254 (40) ; 369 (I) ;
PURAULA. TAHSIL
'l'otal :
200 (40) ; 311 (1) ; 393 (I) ;
_Rural:
200 (40) ; 311 (I): 393 (1);
Ul'bao:
Nil
Villages:
Arakote-200 (I): Barnali-2oo (I) ; Bhotanu- 200 (7) ;
Dagoli-311 (1); Dhokari-200(2) ; Gurari-200 (3); Gudiyatgaon-
200 (3).; Thali-200 (2) ; Kiroli-200 (4) ; Kofara-200.(3); Kantari-
393 (I) ; Moltari Rajput Pari-200 (I); Natn-200 (2); Panigaon
gaunre-200 (6) ; Pora-200 (1) ; Puraula-200 (3) ; Ratri-200 (I) ;
RAJGARHI TAHSIL
TfJtal:
200 (211); 209 (3); .,235 (I); 273 (2); 284 (I); 311 (3) ;
350(1); 369(17);
Rural:
200(211}; 209(3); 235(1); 273(2); 284(1); 311(3);
"369(17) ; 350.(1);
Urban:
Nil
Villages:
Banas-200 (9) ; 369 (2) ; Barkot-200 (11) ; 209 (I) ;
369 (3); Bhani-200 (4) ; 369 (2) ; Bakhareti-200 (2) ;
284 (I); 369 (I); Bagasu- 200 (3); Bljori-200 (.J) ;
Bhaunti-200 (6) ; Bhunargaon-200 (4) ; Dhariwali-
200 (5); Dharson-200· (6); Delda-200 (9) ; Dhuink-200 (17);
Gair-200 (6); Gudin-200 (8); Gatu-ZOO (8); Jestari-
3ti9 (4); Jandanu-200 (I) ; Jugadgaon-200 (4) ; Kanda-
369 (I) ; Kisna-200 (2) ; Khansi-200 (1) ; Kottyalgaon-200 (3) ;
Kuwa-200 (4) ; Kopnol-200 (7); Kufan-200 (2) ; Kandl-
200 (2) ; Kharsali-200 (5); Khmnu-200 (3); Kawalgaon-
200 (4); Matiyali-200 (2) ; 369 (I); Majyali-200 (3) ;
Muradi-200 (3) ; Mugara-273 (2) ; MuJlagaon-200 (6) ;
Neuri- 200 (2) ; Naugaon-200 (6); 235 (1); Palata-200 (8) ;
Paluka-200 (1); Pauri-200 (4) ; Rajgarhl-311 (3); Rikhaunlt-
200 (3); Simalsari-200 (5); 369 (3); Siguni-200 (4); Setwari-
200 (6) ; 350 (1); Sunaldibill-200 (5); Beef-200 (4); Vansadi-
209 (2) ; Bingsi-200 (4) ; Tera-200 (5);
DUNDA TAHSIL
Total:
200 (239); 209(13); 281 (1); 283 (1); 311 (3); 369(3);
393 (4) ;
Rural:
200 (239); 209 (13); 281 (I); 283 (1); 311 (3); 369 (3) ; 393 (4) ;
Urbiln:
Nil
Villages:
Adani-369 (2) ; Badli-200 (2); Bhatwari-200 (3); Bagiyal
goan-2CO (5) ;.209 (I) ; Bhadali (Lagga Malna)-200 (8) ; Bharkot-
200 (14); Bagi-200 (3) ; Bhuyara-200 (5) ; Banari-200 (3) ;
Bagsari-200 (4)'; Bankot-200 (U);; Bhaldgoan-200 (8) ;
Bhatiyara-200 (2) ; Baret-200 (1) ; Chamiyari-200 (3); Bandu-

Ix
Number of Establishments classified by Minor Groups of Industrial Classiiication-Concid.
2(10 (2); Cimlangoan-200 (3) ; Chakon-200 (-1); Chhajula-
200 (7); Chaundi)atgaon-200 (3); Dharasu-209 (4); Dhaneti
:311 (I) ; Dharkot-200 (5); G) unla-200 (3); Garh-200 (I) ;
Gadoli-200 (2); Gailari-2 0 (13) Goran-200 (4); Gorsala-
200 (1); Hadi)uri-200(9); Jeshtwari-200(6); Jaspur-200(4);
Jogat Ta,ia-200 (4) Jogiyara-200 (2) ; Jokhani-200 (2) ;
Jemar - 200 (1); Khadra-200 (4) ; Koti - 369 (I);
Kaprala-2l'O (I); Kiyari-200 (I); Khalshi-ZOO (1);
Kamada- 200 (8); Kumrara-200 (2) ; Mainola-200 (2) ; Majh·
gaon-200 (12); Margaon-200 (I); Newgaon-200 (2); 209 (2) ;
311 (I); 393 (1); NaganJbari-311 (I); Pujargaon-200 (1);
Pujargoan-200 (I); Par:char.goan-2oo (3) ; Panjala-200 (4)
Kuml ara-200 (3) ; Kawata-200 (2) ; Rangni Sara -209 (2) ;
283 (I); Singoti Sera-200 (4) ; Shrigaon-200 (1); Sound-
200 (2) ; ShUIl-200 (3); Sing-at-200 (4) ; Talakot-200 (4);
Thandi-281 (I); Thatidichli-200 (3) ; 209 (I) ; 393 (3) ;
Tuliyara-2oo (I); 209 (3); Tipara-200 (2); Tandola-200 (2) ;
. Wan-200 (8) ; Bamnti-200 (5) ;
BHATWARI TAHSIL
Total:
200 (18-1); 209 (27); 254 (3); 255 (12) ; 273 (8); 311 (4) ;
369 (10) ; 393 (3) ;
Rural:
200 (184); 209(27); 255 (12); 273 (8); 311 (4); 369 (9);
393 (3);
Urban:
254 (3); 369 (I) ;
Villages:
Aungl-200 (4); Athah-200 (I); 36'! (1); Lhaumkoli-
200 (11); 209 (2); Balsu-255 (3) ; Lhal\\dil-:2U(J(I); 393'(1);
B~angdl-200(1); 255(2); 273 (l); 311 (1); Ba)ana-27:l (1);
311 (1); 369(1); Bonga-:WU (5); 255 (2); D,dsz.f1-200 (2);
Dharall-200 (2); Dandalka-200 (2); Daelg-200 (8); 36!J (i);
Gamdiugaon-200 (3) ;209 (2,*); Gangotll-2UO (9); G)anja-200 (:);
393 (I); Gorsali--200 (6); Gojali-200 (3) ; Hlllna-200 (2) ; Johsi
yara-200 (2) ; 273 (I) ; Kuroli-209 (I) ; Kamar-200 (2); KUJjan
-200 (3) ; Kuwalti-200 (5) ; 369 (I) ; KOtyal~aon-200 (4),;-273 (I) ;
Kiyari-273 (1) ; Kishanpur-2()O (3) ; 36Y (1); Kumaria urf Shuna
gar-200 (1) 273 (I) ; Lonth: u-200 (4); Malla-200 (4); 369(1);
Marari-255 (2) ; 200 (4) ; Mukhaba-200 (6); 255 (2); Manpur-
200(1); Mandoun-200 (2); NatiL-200 (2); NeJang-200 (4) ;
Netala-200 (7) ; Naugaon-311 (1); Nismori--200 (3); Nald-200 (7);
PIiang-200 (2); Pala-200 (3); Siror-2l0 (2); Samj-200 (3) ;
Silyan-200 (4); Sari-ZOO (3); Sukki-200 (3); Salu-200 (3) ;
255 (I); 369 (1) ; Salang-200 (7); Saura-200 (3) ; Syaba-200!(4) ;
Sara-200 (4); 273 (2); 311 (I) ; Hurd-200 (6); Tiyar-255 (2) ;
393 (I); T.looth-369 (I) ; Thalan-200 (I) ; Uttataun-200 (5) ;
Basunga-200 (6); 369 (I);
Town:
UTTAR KASHI NOTiFIED AREA
Blo~k no. 1-369 (I) ; Block no. 2-254 (I) ; Block no. ::1--
254 (2);

!xi
Number of Establishments classified by Minor Groups of Industrial Classification
Detailed description of Industrial Code (lVlinor Group) numbers under which the Industrial Establishments are il rranged in the ta hIe.
]\,11001 Group No.
200
209
2%
254
255
273
281
283-
284
311
350
369
393
DescriptIOn as per the Indian Standald Industl'lal Classificahon
2
Production of rice, atta, flour, etc., by mIlling de-husking and processmg of ClOl sand foodgrains
PloductIOn of other food products such as sweetmeat and condiments, muri, mUI ki, chira, khoi, cocoa, chocolate, tofIee, lozenge
Cotton weavmg III handlooms
Wool wca\rng in power loom
Wool weaving in handloom
Making of textile garments including raincoats and headgear
Manufacture of wooden furniture and fixtures
Mar,ufacture of wooden industrial goods other than Hal sport cqu r-mcnt such as bobbin and sImIlar equipment and fixtures
Manufacture of other wooden products such as utensils, toys artwares
Manufacture of shoes and other leather footwear
Manufacture of earthenware and earthen pottery
Manufact1lfe of sundry hardwares, such as G.!. pipe, wire net, bolt, screw, bucket, lutlery, (This will also include the manufacture of sundry ferrous engineering products done by jobbing engineering concerns which cannot be classified in major groups 36, 37, 38 and 39)
Manufacture of jewellery, silverware and ""ares using gold and other precious metal

V-APPENDIX
Gazette Notifications of changes in Boundaries during the decade 1951-61
No. 906/IC-U. P. Gazette dated February 24, 1960-1n exercise of the powers
conferred by section 11 of the United Provinces Land Revenue Act, 1901 (U.P. Act
No. III of 1901). as extended and applied to Tehri Garhwal through Legislative Department
notification no. 3262 (2) XVII-Merger. dated Lucknow, November 30, 1949, the Governer
of Uttar Pradesh is pleased to create, with efiect from the date of the publication of this
notification, a new district, comprising the areas specified in the Schedule to be known as
district Uttar Kashi with headquarters at Uttar Kashi, and to alter with effect from the same
date the limits of the existing district of Tehri Garhwal so as to comprise the existing areas
except those mentioned in the Schedule.
Nothing in this notification shall affect any legal proceedings already commenced
-Qr pending in any court which has hithreto exercised jurisdiction in respect of the said areas.
SCHEDULE
SI. No. Name of Hill Pattis 8l. No. Name of Hill Pattis
1 2 1 2
1 Taknor 16 Thakral 2 Naldkathur 17 Barkot 3 Barahat 18 Gith 4 Baragaddi 19 Bajri 5 Dasgihatar
20 Bangan 6 Bisht Patti
21 8ingtur 7 Bhandarsy un 22 Gadugad .8 Dhanari 23 Panchgain 9 Gamri 24 Fateh-parbat
10' Gajna 25 Athor 1],,:- Dichli
26 Badasu ~2 Barsali
27 Kamal Sarain 13 Mogarsanti
28 Rama Sara in 14 Godarkhated
29 Badiyad 15 Banal
KRISHNA PRINTING PRBSS, ALLD.-P.O. No. 56 CBNsus-1961-1,000 BOOKS.

Related Documents