Distributional Income Indicators in a Micro-Macro Data Integration Perspective Filippo Gregorini (Eurostat, European Commission, Luxembourg) Sigita Grundiza (Eurostat, European Commission, Luxembourg) Pierre Lamarche (Eurostat, European Commission, Luxembourg) Paper prepared for the 34 th IARIW General Conference Dresden, Germany, August 21-27, 2016 Session 2A: Integrating Micro and Macro Approaches to National Income Analysis Time: Monday, August 22, 2016 [Afternoon]

Welcome message from author
This document is posted to help you gain knowledge. Please leave a comment to let me know what you think about it! Share it to your friends and learn new things together.
Transcript
Distributional Income Indicators in a Micro-Macro
Data Integration Perspective
Filippo Gregorini (Eurostat, European Commission, Luxembourg)
Sigita Grundiza (Eurostat, European Commission, Luxembourg)
Pierre Lamarche (Eurostat, European Commission, Luxembourg)
Paper prepared for the 34
th IARIW General Conference
Dresden, Germany, August 21-27, 2016
Session 2A: Integrating Micro and Macro Approaches to National Income Analysis
Time: Monday, August 22, 2016 [Afternoon]
Session 2A: Integrating Micro and Macro Approaches to National Income Analysis
Time: Monday, August 22
Paper prepared for the 34th General Conference of the
International Association for Research in Income and Wealth
Dresden, Germany, August 21-27, 2016
Distributional Income Indicators in a Micro-Macro
Data Integration Perspective
Filippo Gregorini (Eurostat), Sigita Grundiza (Eurostat), Pierre Lamarche (Eurostat)
The opinions expressed in this paper are the sole responsibility of the authors and do not
necessarily reflect those of Eurostat or countries.
Ref. Ares(2016)3983069 - 28/07/2016

2
Paper Abstract
The European Commission aims to bring the social indicators on a par with the
macroeconomic indicators within the European economic governance framework. An
important part of the strategy is availability of harmonised EU level statistical indicators
– integrating macro and micro data - covering the distributional aspects of household
income, consumption and wealth (ICW). The information is crucial to understand the
social impacts of economic developments and policies and economic impacts of social
developments and policies. During recent years Eurostat has carried several
experimental projects to investigate the joint distributions of ICW micro data coming
from household surveys and relevant micro-macro data links. This work of a testing and
experimental nature on improving methodological harmonisation between household
surveys is creating a concrete basis for estimating the distributions of national accounts
aggregates using survey data.

3
Contents Summary ....................................................................................................................................... 4
Introduction ................................................................................................................................... 5
1. ICW distributions – social statistics perspective ....................................................................... 6
2. Micro –macro links for the distribution of income ................................................................. 12
2. 1. Description of the generic differences between micro and macro data ........................... 13
2.2. Assessment of the conceptual links between disposable income components in micro and
macro data ............................................................................................................................... 18
Conclusions ................................................................................................................................. 27
References ................................................................................................................................... 28
Annex 1: Assessment of the conceptual links between disposable income components in EU-
SILC and NA ............................................................................................................................... 29
Annex 2: Coverage rates between the EU-SILC variables at aggregated level and corresponding
accounts from NA ....................................................................................................................... 30

4
Summary
The estimation of joint distribution of Income, Consumption and Wealth is more and more
needed as the inequalities are increasing; the phenomenon requires insights coming from micro-
data.
The perfect dataset embedding simultaneously information on the three dimensions is missing
therefore it is necessary to bring closer different existing micro data collections This can be
achieved thanks to techniques more or less elaborate; already existing results go in the sense of
the economic theory. Such exercises also require a strong plausibility check, as they rely on
strong assumptions. One natural benchmark is the data coming from National Accounts for
consistency and comparability verification.
The regulation on the European System of National and Regional Accounts (ESA 2010,)
foresees delineation of the Household sector (before the data on Households were reported
together with data on Non Profit Institutions Serving Households). However the Household
sector in the National Accounts framework has not the same population coverage as micro-data
surveys, in particular, non-institutional households (not-covered in the EU-SILC), and the
unincorporated enterprises (only party covered in the EU-SILC). These together with specific
data measurement errors (for instance, poor coverage of wealthiest part of the population in the
EU-SILC) are referred in the paper as generic differences between the data sources. The impact
of generic differences is income component specific as well as country specific.
In addition, to the generic differences between the National Accounts (NA) Household sector
and EU-SILC reference population; there are specific differences that are identified in the paper.
In particular, it is possible to conclude that the methodology and data between EU-SILC and
NA household sector, reasonably well lines up for employment income (excluding employers'
social contributions), social benefits other than social transfers in kind, and social contributions
and taxes on income paid. However, medium or low conceptual links are identified for self-
employment income, property income, and taxes on wealth paid. As expected the data expressed
in coverage rates for these items are diverse across the countries. Further plausibility tests and
investigations are needed for these income components.
Low or no conceptual links are identified for income from household production of services for
own consumption, property income paid; employers' social insurance contributions (these three
income components are not part of Disposable Income definition in the EU-SILC); as well as
pension from individual private plans, (this income component is not part of Disposable Income
definition in the NA).
5
Introduction
The European Commission has stressed the need to bring social indicators on a par with
macroeconomic indicators within the macroeconomic governance. A key part of the strategy is
the availability of harmonised statistics at EU level covering the distributional aspects of
household Income, Consumption and Wealth (ICW), considering and taking into account the
work already done by researchers, the EU Member States, OECD, and ECB.
The efforts should help the preparation of integrated analyses, putting together macroeconomic
and social indicators that allow for appropriate assessment of the social impacts of economic
policies and the economic impacts of social policies.
There is nowadays a move towards better collection of the information at household level. At
macro-economic level, the National Accounts provide aggregated figures for household sector
and evolution of the material living standards of the ‘average household’ however no
information on their distribution across the population.
Nevertheless, it is not sufficient to have the aggregated macro level statistics for household
sector as obtained from National Accounts. Further information is needed on: how income
wealth and consumptions are distributed across the population? Who benefits from economic
growth, who is driving the economic growth? Whether savings or debts are having similar
development patterns for the poor and rich populations during the economic shock? These and
many other questions cannot be answered using the national accounts alone. Most importantly is
to see the effect of the economic developments and policies on the different income groups of
households, putting the most emphasis on vulnerable part of society and on other side the richest
part of society. Distributions matter a lot: high indebtedness for housing purposes in the lower
income range has been recently proven to be damaging for the whole economy, for instance.
The information on the population could be obtained using different micro data sources. The
process towards the modernisation of Social Statistics in the EU is continuing and Member
States are putting tremendous efforts to adapt to the changes brought by high and various data
needs, although they face limited resources and collect timelier. These efforts go into the
direction of producing more precise and more efficient statistics for policy making. It involves
also higher comparability of the variables and methodology between different surveys. The
foreseen changes would help making more direct links across different micro data sources.
The first part of the paper is addressing the ICW distributions for households from Social
Statistics perspective. The second part of the paper is devoted to discuss the issues related to
micro-macro data gaps for income.

6
1. ICW distributions – social statistics perspective
When analysing information carried out by micro-data, users often express the need for
extending as much as possible the scope of variables available in one single dataset. Indeed
doing so should increase the possibility of explaining more comprehensively the sociological
and economical phenomena. When it comes to the households' economical behaviours, income,
consumption and wealth (ICW) cannot be regarded as independent from each other; the official
statistics already provide some pieces of information about the distribution of each dimension
but scarcely include elements of the three dimensions in the same micro dataset. As data on
ICW distributions necessarily goes through the use of micro-data, it is essential to focus on the
sources of information at the EU level regarding these three dimensions. So far, the three
available surveys on ICW are the EU Statistics on Income and Living Conditions - EU-SILC
(income), the Household Budget Survey - HBS (consumption) and the Household Finance and
Consumption Survey - HFCS (wealth). The three of them essentially aim at gathering
information on one of the dimensions, along with socio-demographic and possibly partial
information also on the other dimensions. The surveys are run in different manners and different
periodicities in the EU (HFCS only in the euro area). For instance, the EU-SILC is conducted
every year, whereas the periodicity of the HFCS is for most of the countries every three years
and HBS data - collected either yearly or less frequently at national level - are transmitted to
Eurostat every 5 years. Beside the tremendous effort of modernisation already undertaken by the
Member States, the foreseen changes would help in making more direct links across different
micro data sources. As regards the wealth side, there are ongoing discussions under the
auspices of European Statistical Forum1 to promote, at the national level, better cooperation
between the National Statistical Institutes (NSI) and the National Central Bank (NCB) on the
implementation of the Household Finance and Consumption Survey (HFCS).
The main data source for the evaluation of poverty and inequality in the EU is EU-SILC. The
headline indicator to monitor the poverty target in the Europe 2020 strategy is the 'at risk of
poverty or social exclusion' AROPE indicator2. It should be noted that so far indicators on
poverty in the EU are mainly based on the income and do not consider the stock dimension
(assets and liabilities). As the EU-SILC mainly aims at measuring accurately the bottom of the
1 The European Statistical Forum was created in 2013 as a governance body in the relations between the European
Statistical System and the European System of Central Banks.
2 It measures the share of the total population which is at risk of poverty or social exclusion, it refers to the situation
of people either at risk of poverty (measures relative monetary poverty), or severely materially deprived (measures
absolute poverty based on set of items persons have or have not) or living in a household with a very low work
intensity. The data source is EU-SILC (EU Survey on income and living conditions).

7
distribution, it does not oversample the richest part of the population, and would be less
appropriate for an analysis targeting specifically the very top of the income distribution. Also it
contains very limited – if any - insights on the consumption behaviours of the European
households.
Thus, as consumption may be analysed through the Engel curve's theory,3 HBS encompasses
also general information on income. HBS provides the users with very detailed information at
the household level on consumption expenditures, using diaries and COICOP classification for
describing expenses made by the households. The data are transmitted to Eurostat every 5 years
in most of the countries, which may pose an issue regarding timeliness, as the composition of
consumption may be impacted by income shocks.
Finally the HFCS attempts to go further and to be even more comprehensive, as it collects
variables on the different components of gross income, along also with very partial data on
consumption. However, gross income does not fit the cross-country comparison, as fiscal
systems widely vary across European countries and may strongly affect households' behaviours.
It gives information on the repartition of assets (gross or net of debt) among households. Since
the distribution of wealth is highly skewed, it is important to focus on the very top of the
distribution in order to have the most accurate estimation possible. Some of the countries that
have conducted the first wave of the HFCS in 2010 have tried to implement oversampling in
order to address the issue. On the one hand it is essential to bear in mind that the quality of the
analysis strongly depends on the sample when it comes to wealth; on the other hand,
oversampling aims only at solving issues related to the measurement of wealth in the top of the
distribution. Hence oversampling shall not aim at addressing other potential problems, such as
underreporting or capital location in the context of the growing globalization. In other terms,
indicators describing the broad distribution of wealth – such as Gini index or median - should be
affected only slightly by oversampling. Another potential issue is the fact that, from an EU
perspective, the HFCS is up to now limited only to euro area countries; we then have to cope
with possible lack of information for those countries which do not belong to the euro area.
Why would one like to have at the same time income, consumption and wealth at the micro-
level (i.e. the household level)? As stated in the Sen-Stiglitz-Fitoussi report, there is a growing
need for focusing not only on income but also on consumption from the households'
perspective. It is also important to focus on the notion of stock (therefore assets and liabilities)
in order to analyse in a more comprehensive way the resources the households have at their
disposal in order to finance their consumption. In the end, inequalities in terms of living
conditions should be considered as a multi-dimensional issue whose analysis has to encompass
the different variables describing the ability of the households to fulfil its needs.
3 The Engels curve describes how expenditure varies with household income.

8
The first step towards a better integration of ICW variables as a whole in micro-data would be
to have at one's disposal at the same time income and consumption, as saving rates may strongly
reflect the ability of households to finance its consumption and accumulate wealth. The analysis
would mainly focus on the tails of the distribution: on the one hand, low saving rates (possibly
negative saving rates) may reveal households in situation of vulnerability. On the other hand,
the question of the increase of wealth inequalities may be – at least partly – enlightened by
saving rates: in case households with higher permanent income save a bigger fraction of their
income than poorer households, it implies mechanically that the speed of wealth accumulation is
higher for the richest households, thereby leading to an increase of the inequalities.
A first naïve approach consists of merging information coming from EU-SILC and HBS in
order to calculate saving rates broken down by households categories (such as income quintiles,
age groups or household types). Doing this requires to define consistently categories across the
two surveys and to assume that the target populations for both surveys are the same. Then, for
one given category of households, the saving rate may be defined as follows:
∑ ∑
∑
where and respectively stand for disposable income and consumption expenditures for
household .
Figure 1 - Aggregate saving rate in the EU-28 broken down by age of RP
Source: Eurostat, EU-SILC and HBS surveys, 2010.
-5,0%
0,0%
5,0%
10,0%
15,0%
20,0%
25,0%
Less than 30 Between 30and 44
Between 45and 59
60 and more Total

9
As shown on Figure 1, it is possible to analyse the question of saving rates among the
population with respect to the life cycle theory. In the EU, the basic exercise shows that
households whose reference person is less than 30 tend to consume more than they earn (on
aggregate less than 1% of yearly disposable income), while the saving rate increases with age,
reaching its maximum between 45 and 59. Then it decreases after 60, consequently to retirement
and the expected drop in income. However, conversely to the basic life cycle theory, older
people do not seem to dissave a lot, and even tend to keep on accumulating assets. Such
phenomenon may be explained thanks to dynastic models which introduce a preference for
bequests in the utility function of the consumer.
Figure 2 - Aggregate saving rate in the EU-28 broken down by income quintile
Source: Eurostat, EU-SILC and HBS surveys, 2010.
Figure 2 describes the aggregate saving rate broken down by income quintile; as expected, the
saving rate increases as income rises which is consistent with the literature on the topic and the
economical intuition. However, two questions arise from this figure: the first one is related to
the fact that income is defined here as current disposable income, and not the permanent one. It
is therefore not possible to conclude on the difference in accumulation speed along the
permanent income distribution. One would need more insights on the persistence in income
quintiles in the individual lifetime. Also related to the persistence in the income distribution, one
would need to understand the sustainability issue in the first quintile, for which the strongly
negative saving rate has to be financed through either indebtedness or asset sales. Therefore
such a situation may only be temporary for one given household in this quintile.
-35,0%
-25,0%
-15,0%
-5,0%
5,0%
15,0%
25,0%
Q1 Q2 Q3 Q4 Q5

10
Figure 3 - Aggregate saving rate in the EU-28 broken down by household type
Source: Eurostat, EU-SILC and HBS surveys, 2010.
The composition of the household has also a huge effect over its ability to finance its
consumption: as shown in Figure 3, single parents encounter huge difficulties in making ends
meet, as they are in total strongly dissaving over one year (-11%). From this respect, saving
rates may complement the information carried out by consumption unit.
The entire exercise relies on the (strong) assumption that the estimations coming from both
surveys do not suffer from any underreporting phenomenon. Indeed, in case both surveys are
affected by a uniform underreporting phenomenon (i.e. income and consumption are
underreported in the same manner), this implies that the saving rate will be over-estimated. In
the worst case (and most likely) scenario, the underreporting phenomenon is different across the
two surveys, and in that case the effect over the saving rate is a priori undetermined. A first
assessment of the reliability of the exercise consists of comparing the aggregate saving rates
estimated through the surveys with the ones displayed by the National Accounts. Even if there
are strong conceptual differences, we expect at least to show a link between both indicators,
indicating some consistency between the different sources.
-15%
-10%
-5%
0%
5%
10%
15%
20%
25%
Singleperson
Singleperson withdependent
children
Two adults Two adultswith
dependentchildren
Three ormore adults
Three ormore adults
withdependent
children

11
Figure 4 - Comparison of saving rates as given by the surveys and by the National Accounts
Source: Eurostat, 2010.
When comparing the saving rates coming from the different sources (see Figure 4) we can see
that it seems not to be the case. Indeed, the figure shows no clear positive correlation between
the two indicators, as it would have been at first sight expected. While the difference for the EU
as a whole is -6 percentage points (18% for the surveys, 12% for the National Accounts), the
gap may be bigger for some countries (-45 pp for BG, -23 pp for EE). Moreover, the absence of
positive link leaves open the question of the validity of the exercise.
Therefore, moving forward with the question of ICW implies to build a framework that enables
the conceptual comparison of variables coming from the National Accounts with the ones
provided by the surveys. There is a need for a systematic approach that would enable the
comparison between the different sources that would account for all potential conceptual
differences, thereby providing a clear-cut answer to the question of the consistency of the
different sources (hence also confirming the reliability of the exercise). This is one of the aims
of the continuing work on the ICW project; the framework is sketched in the next sections of the
paper.
BE
BG
CZ
DK
DE
EE IE
ES
FR
IT
CY LV
LT HU
NL AT
PL PT
SI
SK
FI
SE
UK EU
-10%
-5%
0%
5%
10%
15%
20%
0% 10% 20% 30% 40% 50%
Saving rates from NA
Saving rates from surveys

12
2. Micro –macro links for the distribution of income
The initiative on linking micro and macro statistics on households is based on the necessity to
understand the links between the circumstances/behaviour/well-being of a set of households
characterised by chosen determinants (the number of persons within the household, the relative
income level as compared to other households in the society etc.) and the situation of
households as the institutional unit in the macroeconomic context.
Therefore, a first step of the exercise is to understand conceptual and generic differences in EU -
SILC and NA as well as specific differences, in particular, for income components, and evaluate
the conceptual comparability based on the underlining methodology. The methodology for
implementation of the EU-SILC is described in the EU-SILC regulation4 "Methodological
guidelines and description of the EU-SILC target variables"5, whereas NA methodology is
described in "European system of accounts ESA 2010"6. The linkage between the two sources
has already been discussed and developed in the Methodological working paper (2013) by
Liviana Mattonetti Eurostat7 that serves as a basis for the comparison of the methodology
between the two sources. The Canberra Group Handbook on Household Income Statistics8 is
also used as a reference guideline is the analysis.
This part is organised as follows: description of the generic differences in the methodology of
the EU –SILC and NA household sector (S.14); assessment of the conceptual links between
GDI (Gross disposable income) components within EU-SILC and NA; the coverage rates for
the GDI income components (in %) and their stability over time. The main aim of this work is
to assess the conceptual comparability of income variables in the two data sources and show
first results how well the data lines up for conceptually similar income variables in EU-SILC
and NA.
4 REGULATION (EC) No 1177/2003 OF THE EUROPEAN PARLIAMENT AND OF THE COUNCIL of 16 June
2003 concerning Community statistics on income and living conditions (EU-SILC): http://eur-lex.europa.eu/legal-
content/EN/TXT/PDF/?uri=CELEX:32003R1177&from=EN 5 Available online of the Eurostat webpage: http://ec.europa.eu/eurostat/statistics-
explained/index.php/EU_statistics_on_income_and_living_conditions_(EU-SILC)_methodology_-
_environment_of_the_dwelling 6 Available online of the Eurostat webpage: http://ec.europa.eu/eurostat/documents/3859598/5925693/KS-02-13-269-
EN.PDF/44cd9d01-bc64-40e5-bd40-d17df0c69334 7 Eurostat, Liviana Mattonetti, European household income by groups of households, 2013:
http://ec.europa.eu/eurostat/documents/3888793/5858173/KS-RA-13-023-EN.PDF 8 Canberra Group Handbook on Household Income Statistics, Second Edition 2011, UN:
http://www.unece.org/fileadmin/DAM/stats/groups/cgh/Canbera_Handbook_2011_WEB.pdf

13
2. 1. Description of the generic differences between micro and macro
data
In the NA the presentation of the Households sector data follows the sequence of accounts and
respects the accounting methodology in the framework. It includes accounts that are estimated
at aggregated level for the purposes of NA but are not directly measurable in the context of
social statistics, for example, employer’s imputed social contributions, Financial Intermediation
Services Indirectly Measured (FISIM) and property income attributed to insurance policy
holders, operating surplus (including imputed rent). The interaction of households with other
institutional sectors within the economy is recorded in the National accounts in a closed
framework. The horizontal consistency across the accounts among the institutional sectors
should be respected, as well as vertical consistency between the non-financial and financial part
of the accounts within the institutional unit. National accounts are not specifically intended to
cover material well-being aspects for the households.
On other side EU-SILC is designed to reflect the income and living conditions of the population
and subpopulation groups.
The main generic differences between EU-SILC and NA could be attributable to the reference
population differences and data measurement issues as described below.
(1) People living in the institutional households
While in National Accounts the population covered in households sector (S.14) "(..) consists of
all persons, national or foreign, who are permanently settled in the economic territory of the
country..." [ESA2010 11.05], in the EU-SILC the reference population consists of all private
households residing in the country, and people living in the institutional households are
therefore excluded. It should be noted, that the extreme wealthiest part of the population is not
well covered by the EU-SILC data. The undercoverage of the wealthiest population could cause
significant data gaps.
(2) Non-profit institutions serving households (S.15)
In National Accounts, "the NPISH sector (S.15) consists of non-profit institutions which are
separate legal entities, which serve households and which are private non-market producers.
Their principal resources are voluntary contributions in cash or in kind from households in their
capacity as consumers, from payments made by general government and from property income.
(…) NPISH sector includes: trade unions, professional or learned societies, consumers’
associations, political parties, churches or religious societies (including those financed but not

14
controlled by governments), and social, cultural, recreational and sports clubs; and charities,
relief and aid organisations financed by voluntary transfers in cash or in kind from other
institutional units." [ESA2010 2.129 – 2.130]
According to the ESA2010 the annual sector accounts data refers to the actual households sector
(S.14) as separated from non-profit institutions serving households - NPISH (S.15). Data should
be provided backwards till 2012. However, some countries have been granted derogations from
the ESA2010 data transmission program9 and are providing S.14 data together with S.15.
Table 1 - Derogations granted for S.14 / S.15 split in ESA2010 transmission program
Derogations granted for S.14 / S.15 split in ESA2010 transmission program
S.14 and S.15 to be provided as total S.14 + S.15
until expiration of the derogation 5MSs
First transmission
in 2017
S.14 and S.15 1MS Transmission at
t+21months
No data on NPISHs are collected in the EU-SILC.
(3) Quasi-corporations
ESA2010 defines quasi-corporations as "entities which keep a complete set of accounts and
have no legal status. They have an economic and financial behaviour that is different from that
of their owners and similar to that of corporations. They are deemed to have autonomy of
decision and are considered as distinct institutional units." [ESA2010 2.13(f)]
Most difficulties in identification of quasi-corporations relate to allocation of producer units
between non-financial/financial corporations (S.11 and S.12) and households (S.14) sectors.
The inclusion of the quasi-corporations in the household sector in the national accounts and the
country specific implementation rules have an influence on the scope and comparability of the
household sector accounts within the National Accounts framework but also makes it difficult to
compare with the micro data stemming from household surveys such as EU-SILC as the
population covered by the two sources is not these same. Two main types of unincorporated
entities - which are not defined in ESA2010 (and in 2008SNA as well) - but are essential for the
quasi-corporations analysis are sole proprietorship and unlimited liability partnership:
(SP) Sole Proprietorship - type of business entity that is owned by one individual
(natural person) and in which there is no legal distinction between the owner
9 ESA 2010 Transmission programme of data: http://ec.europa.eu/eurostat/documents/3859598/5936561/KS-01-13-
429-3A-C-EN.PDF/69e7e68c-661d-44dc-bef3-d0e560403722

15
and the business. The owner receives all profits (subject to taxation specific to
the business) and has unlimited responsibility for all losses and debts.
(UP) Unlimited Liability Partnership - type of business entity in which two or more
individuals manage the business collectively and who are personally liable for
its debts.
Unlimited liability partnerships (UP) are not included in the survey data at all. Sole
proprietorship (SP) are included, however the reliability of these data in the household survey is
an issue to be considered.
International manuals specify only general principles underlying identification of quasi-
corporations. From the theoretical point of view, it is not deemed useful to develop precise
quantitative criteria for allocation of unincorporated units among relevant sectors. SNA2008
states that "experience has shown that countries have difficulty treating unincorporated
enterprises owned by households as quasi-corporations. However, it is not useful to introduce
additional criteria, such as size, into the definition of quasi-corporations owned by households.
If an enterprise is not in fact operated like a corporation and does not have a complete set of
accounts of its own, it cannot and should not be treated as a quasi-corporation however large it
may be". [SNA2008 4.46]
In practice, however, thorough examination of unincorporated units for their compliance with
general theoretical principles underlying delineation of quasi-corporations would require
excessive resources taking into account that detailed information on these units' activities and
management practices is not easily accessible. Thus, reliance on certain simplified benchmarks
in order to take account for practical constraints seems inevitable for the purpose of practical
delineation decisions.
Countries approaches to delineation and measurement of quasi-corporations in national accounts
were investigated by the Eurostat-ECB Task Force on Quarterly Sector Accounts (TF-QSA) by
means of ad-hoc questionnaire in 2010. The results were then integrated by using information
from the survey on the compilation of annual households' current accounts conducted by
Eurostat/OECD Expert Group on Disparities in National Accounts in 2011 for EU countries not
included in the 2010 TF-QSA survey. The collected information were further verified and
amended in the framework of relevant discussions in TF-QSA in 2013-2014.
Overall the results show heterogeneity in both relevance of unincorporated units among EU
Member States and criteria for their classification among relevant institutional sectors.

16
Figure 5 - Share of persons employed in SPs and UPs combined in total employment by enterprises
Country Total unincorporated units
(% of total employment)
A 59.2
B 41.9
C 38.5
D 34.9
E
24.3
F 23.8
G
21.8
H 21.6
I
18.8
J 18.8
K
17.1
L
16.7
M
13.2
N
12.3
O 10.2
P
7.6
Q
6.8
R
6.7
S 6.4
Source: TF-QSA surveys, YYYY.
Table 2 - Member States practices with respect to determination of QC separate from Households
Description Countries Criteria range
No QC identified, all unincorporated enterprises
are recorded in sector S.14 8MSs -
Unincorporated units are allocated in line with
legal form: all sole proprietorships are allocated
into S.14, all partnerships to S.11/S.12
10MSs Legal form only
Unincorporated units with simplified accounting
allocated to S.14; unlimited partnerships with
double entry bookkeeping obligation allocated to
S.11/S.12
1MS
Legal form and
double entry
bookkeeping
obligation
Number of employees is used as delineation
criteria for both sole proprietors and unlimited
partnerships
2MSs (1MS combined with
turnover) 2 to 10 employees
Legal form and number of employees are used
as delineation criteria for sole proprietors only;
unlimited partnerships are fully allocated into
S.11/S.12
4MSs (combined with
turnover)
In 2MSs type of economic
activity is also taken into
account
1 to 50 employees
Legal form and monetary threshold (turnover)
is used as delineation criteria
3MSs (1MS combined with
number of employees)
EUR 1.5 to 10
millions
Source: TF-QSA document – Eurostat C1/NAWG/841

17
Relevance of Unincorporated Units for the calculation of household Gross Disposable
Income
Given that on the basis of the information above in some cases it is practically impossible to
allocate Unincorporated Units between S.11 and S.14 coherently within EU Member States,
what are the practical effects of the inclusion of Unincorporated Units within S.14? The first
step is to analyse the weight of this inclusion in the calculation of B6G. This can be done
indirectly by comparing the results of 2011 TF-QSA survey and Sector Accounts data for the
same year.
Following the definition of employers and own-account workers (S.141 and S.142) provided in
ESA2010 manual – paragraph 2.122 – the "relevance" of mixed income in the calculation of
B6G should be positively correlated with the share of persons employed in Unincorporated
Units as a share of total employment.
Data shows the following:
Source: TF-QSA surveys and Eurostat Database, YYYY.
And the correlation between the two series is +0.77.
Is therefore the value of B3G for S.14 influenced by the "broad" delimitation of S.14 in
ESA2010 in EU Member States where a high share of workers is employed in Unincorporated
Units?
Mixed evidence emerges on this point: the effects of the broad delimitation of S.14 on the
relevance of B3G within B6G components may depend also on the specific characteristics of
unincorporated units within each country – number of employees, for example. Detailed info
would be needed to properly answer the question above beyond use of indirect inference.
(4) Measurement issues in the data
0
10
20
30
40
50
60
C J A B H E K F L S I M P R O
B3G/B6G %
% of EMPL in UU
18
EU-SILC data are based on survey/interview information in all countries, in combination with
register information in several Member States especially for the income variables. A. B.
Atkinson et al. (2015) argued that the use of register data might increase the comparability
between data for income in the NA and EU-SILC; the primary analyses presented in the paper
seem to confirm their point.
During the interviews there could be underreporting issues for the income variables. NA are
compiled using many sources.
In EU-SILC, re-weighting that aims at addressing unit non-response is usually performed by
calibrating the data on the aggregated information (for example on the household types obtained
from CENSUS information). Imputations addressing item non-response are performed on an ad-
hoc basis by NSIs using regression models and/or non-parametric methods, thereby making the
assumption of a Missing At Random (MAR) mechanism.
In NA, imputations are made to create new variables where data simply do not exit (for
example, in order to measure hidden economy), and data corrections are adopted to reach
internal consistency and exhaustiveness [Eurostat, Mattonetti, p. 11].
Generally, the traditional household surveys have difficulties to capture well the income for the
richest part of population.
2.2. Assessment of the conceptual links between disposable income
components in micro and macro data
This part presents the methodological comparison between Disposable Income (GDI) as it is
measured in the EU-SILC and NA. It should be noted, that both sources are treated equally in
this exercise.
In EU-SILC ‘disposable income’ means gross10 income less income tax, regular taxes on
wealth, employees', self-employed and unemployed (if applicable) persons' compulsory social
insurance contributions, employers' social insurance contributions and inter-household transfers
paid [EU-SILC regulation].
In NA household gross disposable income11 is calculated as a sum of compensation to
employees, mixed income (gross), net property income and net current transfers, social benefits
10 ‘gross income’: means the total monetary and non-monetary income received by the household over a specified
‘income reference period’, before deduction of income tax, regular taxes on wealth, employees', self-employed and
unemployed (if applicable) persons' compulsory social insurance contributions and employers' social insurance
contributions, but after including inter-household transfers received [EU-SILC regulation]
11 The balancing items are established both gross and net. They are gross if calculated before deduction of
consumption of fixed capital, and net if calculated after this deduction. It is more significant to express income
balancing items in net terms, as consumption of capital is a call on disposable income which must be met if the
capital stock of the economy is to be maintained [ESA2010; 8.06]
19
other than social transfers in kind, operating surplus (gross), less taxes on income and wealth
and social security contributions.
Following, the comparison should be made between Disposable Income for EU-SILC and Gross
Disposable Income for NA. For simplicity reasons both concepts will be referred to disposable
income (DI) further in the text.
Methodological comparison of EU-SILC and NA DI components
The detailed methodological comparison of income components of DI in the EU-SILC and NA
is presented in the Annex 1. The grouping of the income components was made for this - first
comparison exercise. The results of the assessment are preliminary and need to be further
discussed with the EU-SILC and NA experts. Following the analysis of the specific
methodological differences between the DI components, the strong/ medium conceptual links
are identified for: employee cash or near cash income (excluding employers’ social
contributions); social benefits other than social transfers in kind; and for taxes on income, and
social contributions paid (excluding employers’ social contributions). The medium/ low
conceptual links are identified for: income from self – employment; property income; and taxes
on wealth paid. These six income components are analysed in detail in this part of paper.
Although the main generic and specific differences are identified, the further analysis is needed
to quantify their impact on each DI component.
Relevance of EU-SILC and NA DI components
In this part of the paper the relevance of each income component in total DI is discussed in both,
the NA and EU-SILC DI. The analysis is based on 2013 data as shown in Figure 6. The EU
countries included in the analysis are those for which the relevant detail data are available.
Please note that the share of each income component in total DI might change over the time.
The analysis of the changes of the shares of the income components is not part of this paper.
EU-SILC DI definition does not include the income from household production of services for
own production, that is included in NA GDI definition. The relevance of this item in NA GDI is
varying from country to country (from 0% in Latvia till 15% in Greece). In addition, the EU-
SILC DI definition does not include the property income paid that is part in NA GDI. The share
of the property income paid is smaller than 5% for all countries presented in the Figure 6, except
for Cyprus (9%) and Denmark (6%).
20
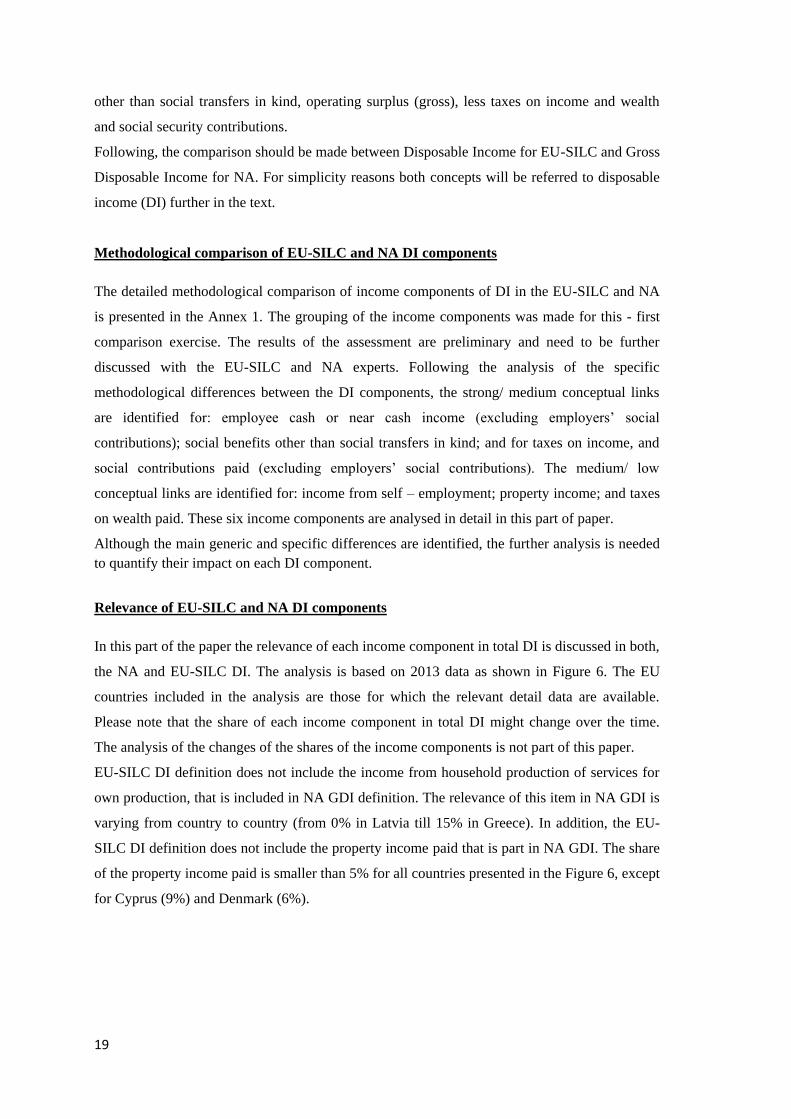
Figure 6 - Share of each income component in EU-SILC DI and NA GDI, 2013,%
Data source: Eurobase (Eurostat) Non-financial transactions [nasa_10_nf_tr]; S14_S15 data for BG, DE, FI,
IE and UK, for others S14; EU-SILC micro data; own calculations (based on the availability of the country
data for each income component)
Figure 6 shows that in EU SILC DI employee income, social benefits other than social transfers
in kind, and social contributions and taxes on income and wealth paid are the largest among the
income components in all the countries. While the relevance of the employee income (excluding
employers' social contributions) is the highest in all the countries also for NA GDI, the
relevance of other income components is country specific and general conclusion cannot be
made.
According to the NA data the largest share of employment income (excluding employers social
contributions) in GDI is in Denmark (slightly above 100% accompanied by largest share of
-1,00
-0,50
0,00
0,50
1,00
1,50
2,00EU
-SIL
C
NA
EU-S
ILC
NA
EU-S
ILC
NA
EU-S
ILC
NA
EU-S
ILC
NA
EU-S
ILC
NA
EU-S
ILC
NA
EU-S
ILC
NA
EU-S
ILC
NA
EU-S
ILC
NA
EU-S
ILC
NA
EU-S
ILC
NA
AT BE BG CY CZ DE DK EE EL ES FI FR
-1,00
-0,50
0,00
0,50
1,00
1,50
2,00
EU-S
ILC
NA
EU-S
ILC
NA
EU-S
ILC
NA
EU-S
ILC
NA
EU-S
ILC
NA
EU-S
ILC
NA
EU-S
ILC
NA
EU-S
ILC
NA
EU-S
ILC
NA
EU-S
ILC
NA
EU-S
ILC
NA
HU IE IT LT LV NL PT SE SI SK UK9. Other current transfers/ Use8. Property income paid/Use6.+7. Social contributions (employers) and taxes on income paid/use and taxes on wealth paid/Use5. Other current transfers/ Resources4. Social benefits other than social transfers in kind/Resources3.Income from household production of services for own consumption /Resources2. Property income/Resources1.2 Income from self-employment /Resources

21
social contributions (excluding employers social contributions) and taxes on income and wealth
paid among the presented countries - 67%), the Netherlands (80%), and Sweden (81%); while
the smallest shares of employment income (excluding employers social contributions) in the
GDI are for Greece (36%). On other side the largest share of employment income in disposable
income according to the EU-SILC data are for Denmark (96%), while the smallest shares are for
- Greece (57%), Italy (63%) and France (67%).
The relevance of self-employment income varies across the countries for both NA and EU-
SILC. The highest shares for the self-employment income in NA GDI are for Slovakia (33%)
and Greece (32%); while in the DI EU-SILC the highest shares for the self-employment income
are for Greece (30%) and Italy (25%).
The share of property income in NA GDI is highest for Lithuania (23%), Germany (22%) while
the share of property income in the EU-SILC DI is highest for France (12%) and Finland (6%).
Share for social benefits other than social transfers in kind in total NA GDI are largest for
Denmark (45%) and Finland (38%). While the relevance for social benefits other than social
transfers in kind in total EU-SILC DI is the most significant for Denmark and Greece (both
43%).
The relevance of other current transfers received in NA GDI is relatively small in all countries,
the highest shares being for the Check republic (7%), Spain (7%), Portugal (7%). Also the share
of the other transfers received in EU-SILC DI is generally low, the highest being for the United
Kingdom (3%).
The relevance of other current transfers paid in NA GDI varies between 0% in Bulgaria till - 8%
in Spain. While this component in EU-SILC DI is lower than 2% in all presented counties.
The share of social contributions (excluding employers’ social contribution) and taxes on
income and wealth varies largely among the counties in both sources. The largest shares in
absolute terms of it in NA GDI are for Denmark (-67%), the Netherlands (-49%), while also in
EU-SILC DI the largest shares are for Denmark (-49%) and the Netherlands (-49%).
The coverage rates for the DI income components
This part presents how well the data lines up from the both sources for DI and its components.
The comparison between the NA aggregates with totals of the EU – SILC variables could be
influenced by both the generic and specific differences in the EU-SILC and NA methodologies,
as well as by their implementation practices in each Member State.
Further in the text the DI components are analysed. The comparison between DI components is
based on both -the level of the coverage between the EU-SILC variables at aggregated level and
corresponding accounts from NA (coverage rates, expressed in %) and their stability over time,

22
measured by standard deviation (SD)12. The both aspects should be taken into account for
further development of the distributional indicators for the income.
Please see Annex 2, for detailed DI and DI components coverage rates and SD for the period
2006-2013.
Figure 7 - CR (2013) and SD (2006-2013) for total disposable income
Data source: Eurobase (Eurostat) Non-financial transactions [nasa_10_nf_tr]; S14_S15 data for AT, DE, FI,
and UK, for others S14; EU-SILC micro data; own calculations (based on the availability of the country data)
Figure 7 shows the coverage rates between the EU-SILC variables at aggregated level and
corresponding accounts from NA (further in the text - coverage rates (CR)) for the DI. In 2013,
the DI coverage rate for the EU Member States varies between 34% in Romania till 103% in
Denmark, the average being 72% (calculated as simple average). The SD varies from 1 pp in
Finland till 7 pp in Bulgaria.
It is expected, that the coverage rate for the employee cash or near cash income is high and
stable, taking into account that the generic differences for this item is mainly referring to the
differences related to the under - coverage of the wealthiest part of population in the EU-SILC.
For this item, countries increasingly use administrative registers for EU-SILC data.
12 The stability over time is measured as standard deviation (SD) for the coverage rates over the period from 2006-
2013 (the availability of country data for these years are taken into account in the calculations). Low values (close to
0 of SD) means that the CR are stable over time, while high values of SD indicates that there is no stability of the CR.
0
1
2
3
4
5
6
7
8
0%
20%
40%
60%
80%
100%
120%
AT BE BG CY CZ DE DK EE EL ES FI FR HR HU IE IT LT LV NL PL PT RO SE SI SK UK
CR (%) 2013 SD 2006 - 2013 (pp), right axis

23
Figure 8 - CR (2013) and SD (2006-2013) for employee cash or near cash income (excluding employers’ social
contributions)
Data source: Eurobase (Eurostat) Non-financial transactions [nasa_10_nf_tr]; EU-SILC micro data; own
calculations (based on the availability of the country data)
In 2013, the coverage rates for employee cash and near cash income (excluding employers’
social contributions) is generally high – average coverage rate being 91% (simple average).
However, the over-coverage (more than 100% for Cyprus; Malta; Estonia; Italy; Belgium and
Sweden) should be analysed further as carefully as low coverage rates. The SD varies from 0 pp
in Finland till 10 pp in Bulgaria.
It is expected that the CR for the social benefits other than social transfers in kind/resources are
good, however the population differences might have impact on this item, mainly referring to
the people living in the institutional households. Also for this item, some countries use might
administrative registers for EU-SILC data.
0
2
4
6
8
10
12
0%
20%
40%
60%
80%
100%
120%
AT BE BG CY CZ DE DK EE EL ES FI FR HR HU IE IT LT LV MT NL PL PT RO SE SI SK UK
CR (%) 2013 SD 2006 - 2013 (pp), right axis
24
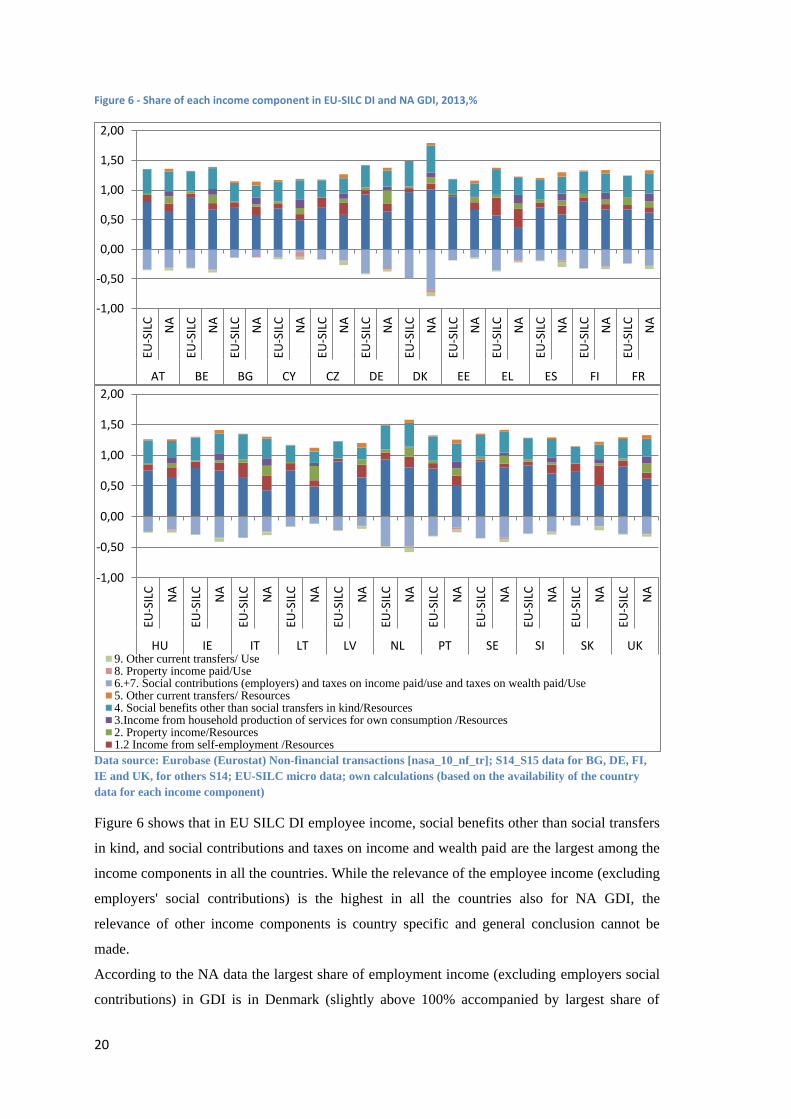
Figure 9 - CR (2013) and SD (2006-2013) for social benefits other than social transfers in kind/resources
Data source: Eurobase (Eurostat) Non-financial transactions [nasa_10_nf_tr], S14_S15 data for AT; DE; IE
;UK;HR; others S14), and EU-SILC micro data; own calculations (based on the availability of the country
data)
The CR for social benefits other than social transfers in kind are generally high – average
coverage is 87% (simple average). However the over-coverage (more than 100% for BG) should
be analysed further as carefully as low coverage rates. The SD varies from 0 pp in Finland till
12 pp in Bulgaria (only for 2 countries SD is higher than 5 pp).
Although the conceptual links for social contributions and taxes on income paid is evaluated as
high/medium, the CR could be influenced by measurement error in the survey data (not
coverage of the wealthiest part of population in EU-SILC).
The CR for social contributions and taxes on income paid (excluding employers’ social
contributions) are generally high – average coverage rate being 85% (simple average).
However, over the time there is more volatility than for cash or near cash income (excluding
employers' social contributions) and for social benefits other than social transfers in kind. The
SD varies from 1 pp in Finland till 11 pp in Bulgaria (for 7 countries SD is higher than 5 pp).
0
2
4
6
8
10
12
14
0%
20%
40%
60%
80%
100%
120%
140%
AT BE BG CY CZ DE DK EE EL ES FI FR HR HU IE IT LT LV NL PL PT RO SE SI SK UK
CR (%) 2013 SD 2006 - 2013 (pp), right axis

25
Figure 10: CR (2013) and SD (2006-2013) for social contributions and taxes on income paid
Data source: Eurobase (Eurostat) Non-financial transactions [nasa_10_nf_tr], S14_S15 data for AT; DE;
IE;UK;HR ; others S14others S14) and EU-SILC micro data; own calculations (based on the availability of the
country data)
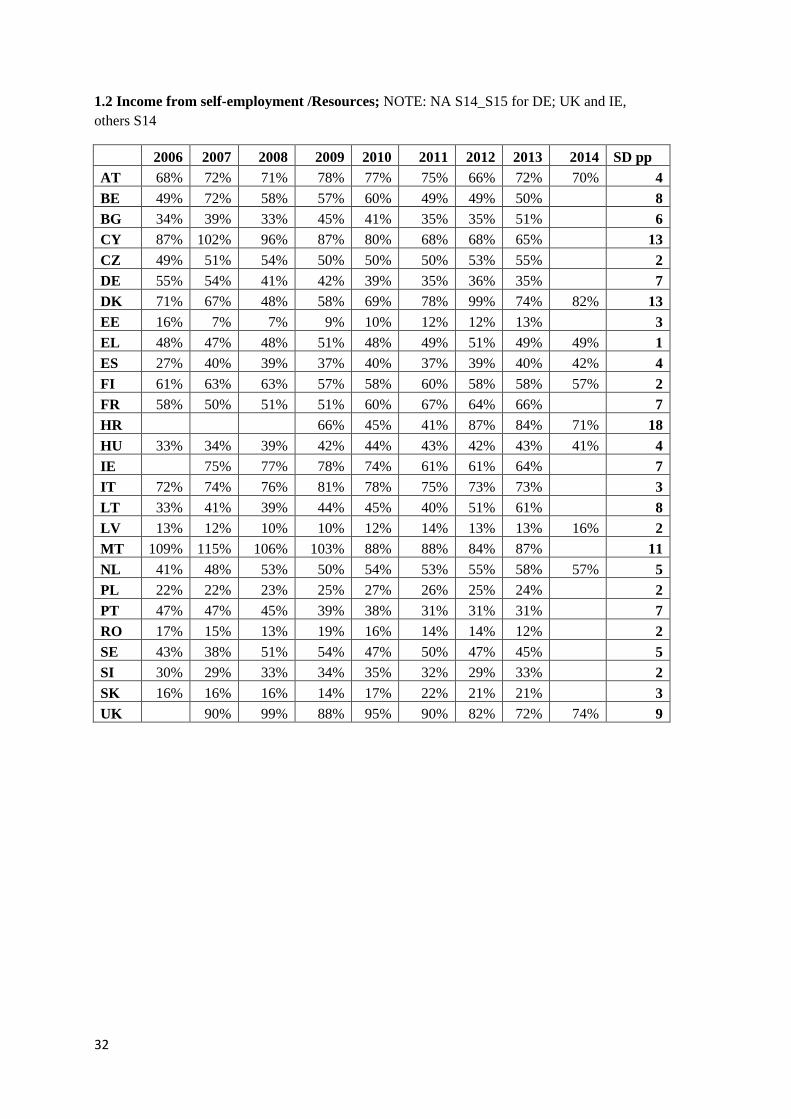
Figure 11 - CR (2013) and SD (2006-2013) for income from self-employment
Data source: Eurobase (Eurostat) Non-financial transactions [nasa_10_nf_tr], S14_S15 data for;DE;IE;UK; ;
others S14others S14) and EU-SILC micro data; own calculations (based on the availability of the country
data)
0
2
4
6
8
10
12
0%
20%
40%
60%
80%
100%
120%
AT BE BG CZ DE DK EE EL ES FI FR HR HU IE IS IT LT LV NL NO PL PT RO SE SI SK UK
CR (%) 2013 SD 2006 - 2013 (pp), right axis
0
2
4
6
8
10
12
14
16
18
20
0%
10%
20%
30%
40%
50%
60%
70%
80%
90%
100%
AT BE BG CY CZ DE DK EE EL ES FI FR HR HU IE IT LT LV MT NL PL PT RO SE SI SK UK
CR (%) 2013 SD 2006 - 2013 (pp), right axis
26
The CR for income from self-employment (excluding employers’ social contributions) are
varying across the countries– average coverage rate being 50% (simple average). The highest
CR are for Malta (87%), Croatia (84%), Denmark (74%), and Italy (73%), the lowest CR are for
Romania (12%), Estonia and Latvia (both 13%). The self-employment income is not only
having very diverse coverage rates across the countries, in addition, it is also volatile over the
years. The SD varies from 1 pp in Greece till 18 pp in Croatia (for 12 countries SD is higher
than 5 pp).
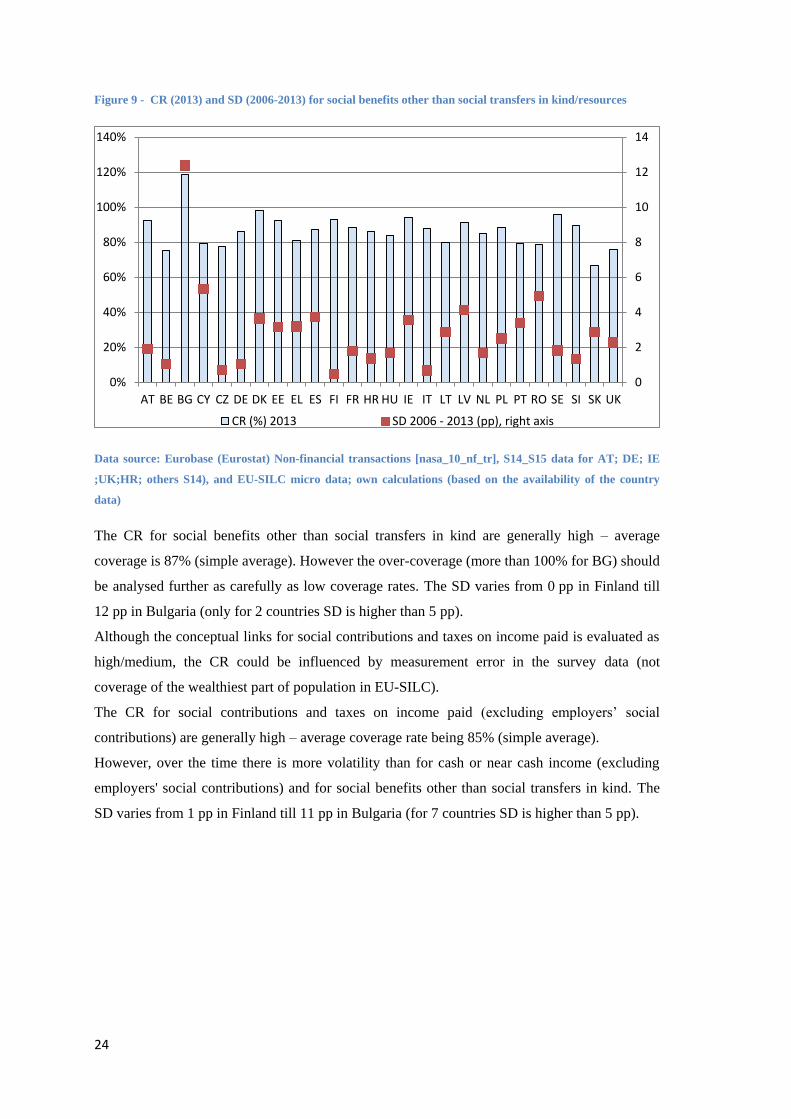
The conceptual links between NA and EU-SILC for property income is evaluated as
medium/low. Similarly, to income from self-employment this income component is also subject
to high impact of generic differences, in particular, for population coverage for the wealthiest
part of the population.
The coverage rates for property income are low – average coverage rate being 29% (simple
average). In 2013, the highest CR are for France (102%), Norway (73%), Slovenia (72%), and
Finland (69%), lowest CR are for Romania (1%), Slovakia (3%), and Lithuania (4%). The SD
varies from 1 pp in the Check Republic, Denmark, Hungary, Slovakia and the United Kingdom
till 25 pp in France (high impact of the CR in 2006 for France, the SD for France for period
from 2007 till 2013 is 6pp) (for 7 countries SD is higher than 5 pp).
Figure 12: CR (2013) and SD (2006-2013) for property income
Data source: Eurobase (Eurostat) Non-financial transactions [nasa_10_nf_tr], S14_S15 data for; AT; DE;IE ;
HR,UK; others S14) and EU-SILC micro data; own calculations (based on the availability of the country data)
0
5
10
15
20
25
30
0%
20%
40%
60%
80%
100%
120%
AT BE BG CY CZ DE DK EE EL ES FI FR HR HU IE IT LT LV NL PL PT RO SE SI SK UK
CR (%) 2013 SD 2006 - 2013 (pp), right axis

27
Conclusions
The micro data show a positive correlation between current income and saving rates,
as expected; the results are also consistent with respect to the life cycle theory. We
are also able to detect sources of vulnerability for lone parents.
The plausibility check does not enable to conclude at this stage. There is a need for
closing the data gap between National Accounts and surveys.
This analysis reveals the issues that need to be addressed for closing micro-macro
data gaps for the European countries. Further plausibility tests, methodological
work, as well as identification of the best practices for both data sources among the
countries should be carried in order to develop robust distributional indicators for
income based on EU-SILC and NA data.
A proper assessment is needed for the impact of inclusion of quasi-corporations in
household sector on the data gaps between micro and macro data. NA data show a
strong positive correlation between shares of employed in unincorporated
enterprises and the weight of mixed income (B3G) in the GDI (B6G).
The results show that for income components that have high/medium conceptual
links between NA and EU-SILC data lines up well in terms of coverage rates and
stability over time: employee income (excluding employers’ social contributions),
social benefits other than social transfers in kind; and social contributions and taxes
on income paid (excluding employers’ social contributions). These income
components are the most relevant for total EU-SILC income for all the countries
analysed. However, this is not the case for the NA GDI income components; the
country results are diverse.
On other side the income components that have medium/low specific conceptual
links are largely varying across the countries for both the coverage rates and their
stability over time: income from self – employment, property income, and taxes on
wealth paid. These income components should be scrutinised in detail before further
distributional indicators are developed.

28
References
1. A B Atkinson, Anne-Catherine Guio and Eric Marlier; Contents Monitoring the evolution of
income poverty and real incomes over time; Centre for Analysis of Social Exclusion; March
2015 London School of Economics
2. D'Orazio, M., Zio, M. D. & Scanu, M., 2006. Statistical matching: Theory and practice. John
Wiley & Sons.
3. Eurostat, European system of accounts, European system of accounts ESA 2010, European
Commission
4. Eurostat, 2013. Statistical matching of EU-SILC and the Household Budget Survey to
compare poverty estimates using income, expenditures and material deprivation, Luxembourg:
European Commission.
5. Eurostat C1/NAWG/841, Treatment of unincorporated businesses as quasi- corporations:
practical delineation rules between households and corporations;
6. Eurostat, Liviana Mattonetti, European household income by groups of households, 2013:
http://ec.europa.eu/eurostat/documents/3888793/5858173/KS-RA-13-023-EN.PDF
7. Regulation (EC) No 1177/2003 of the European Parliament and of the Council of 16 June
2003 concerning Community statistics on income and living conditions (EU-SILC);
8. UNECE, 2011. Canberra Group Handbook on Household Income Statistics. Second Edition
ed. -: United Nations

29
Annex 1: Assessment of the conceptual links between disposable
income components in EU-SILC and NA
EU-SILC DI components NA GDI components Conceptual links
between DI components
within EU-SILC and NA
1.1 Employee income
(wages and salaries)
PY010G: Employee cash or near cash
income
PY021G: Company car
D11/rec: Wages and salaries
(in kind and cash)
Strong/Medium
(excluding employers’
social contributions)
1.2 Income from self-
employment
PY050G: Cash benefits or losses
from self-employment
B3G: Mixed income, gross Medium/Low
2. Property income
HY090G: Interest, dividends, profit
from capital investments in
unincorporated business
HY040G: Income from rental of a
property or land D4/rec: Property income:
Medium/Low
3.Income from
household production
of services for own
consumption
B2g Operating surplus, gross No links
4. Social benefits other
than social transfers in
kind received
HY050G: Family/children related
allowances
HY060G: Social exclusion not
elsewhere classified
PY090G: Unemployment benefits
PY100G: Old-age benefits
PY110G: Survivor’ benefits
PY120G: Sickness benefits
PY130G: Disability benefits
PY140G: Education-related
allowances
HY070G: Housing allowances
D62/rec: Social benefits, other
than social transfers in kind
Strong/Medium
5. Other current
transfers and other
resources received
HY080G: Regular inter-household
cash transfer received
HY110G: Income received by people
aged under 16
PY080G: Pension from individual
private plans
D7/rec: Other current transfers
Low/No
6. Social contributions
and taxes on income
paid
HY140G:Tax on income and social
contributions
D61/use Net social contributions
D51/use: Taxes on income
Strong/Medium
(excluding employers’
social contributions)
7. Taxes on wealth
paid
HY120G Regular taxes on wealth D59/use: Other current taxes Medium/Low
8. Property income
paid
D4/use: Property income No links
9. Other current
transfers paid
HY130G: Regular inter-household
cash transfer paid
D7/use: Other current transfers Low/No

30
Annex 2: Coverage rates between the EU-SILC variables at
aggregated level and corresponding accounts from NA
Data Source: Eurobase (Eurostat) Non-financial transactions [nasa_10_nf_tr], and EU-
SILC micro data, own calculations; (based on the availability of the country data)
Total disposable income NOTE; NA S14_S15 for AT; UK; DE; IE; others S14
2006 2007 2008 2009 2010 2011 2012 2013 SD pp
AT 68% 70% 71% 74% 74% 75% 72% 78% 3
BE 72% 72% 72% 73% 74% 74% 77% 78% 2
BG 54% 72% 74% 78% 69% 67% 71% 77% 7
CY 84% 79% 75% 79% 82% 85% 84% 80% 3
CZ 65% 66% 67% 68% 68% 68% 69% 70% 2
DE 66% 68% 68% 69% 68% 68% 66% 64% 2
DK 95% 99% 96% 98% 100% 99% 100% 103% 2
EE 70% 70% 71% 74% 72% 71% 76% 77% 2
EL 57% 57% 57% 58% 57% 53% 53% 53% 2
ES 63% 76% 77% 76% 74% 73% 74% 73% 4
FI 85% 86% 86% 86% 85% 85% 86% 85% 1
FR 66% 77% 78% 79% 80% 80% 81% 83% 5
HR 63% 59% 57% 55% 57% 3
HU 56% 57% 60% 59% 63% 62% 60% 61% 2
IE 78% 78% 81% 80% 79% 78% 80% 1
IS 100% 95% 101% 97% 99% 93% 93% 94% 3
IT 65% 65% 65% 68% 69% 68% 69% 69% 2
LT 54% 60% 59% 55% 48% 51% 54% 54% 4
LV 53% 60% 59% 60% 60% 63% 62% 65% 3
NL 83% 85% 86% 86% 86% 86% 86% 86% 1
PL 60% 64% 59% 58% 63% 63% 62% 64% 2
PT 61% 60% 59% 60% 58% 58% 59% 59% 1
RO 48% 43% 41% 47% 44% 44% 48% 34% 4
SE 86% 87% 91% 89% 89% 89% 89% 91% 2
SI 71% 71% 72% 73% 74% 74% 74% 76% 2
SK 57% 56% 58% 60% 59% 63% 59% 57% 2
UK 74% 77% 71% 69% 70% 69% 69% 3

31
1.1 Employee income (wages and salaries)/ Resources (NA S14=S14_15)
2006 2007 2008 2009 2010 2011 2012 2013 2014 SD pp
AT 89% 96% 96% 96% 92% 93% 93% 96% 94% 2
BE 97% 95% 96% 97% 98% 98% 101% 101% 2
BG 79% 105% 114% 107% 95% 91% 95% 91% 10
CY 117% 106% 100% 102%
106
% 111% 109% 112% 5
CZ 82% 83% 85% 87% 87% 85% 84% 86% 2
DE 96% 98% 98% 98% 97% 98% 95% 92% 2
DK 94% 94% 94% 94% 97% 94% 96% 98% 96% 2
EE 94% 95% 95% 98% 98% 101% 102% 104% 3
EL 97% 99% 98% 95% 88% 85% 83% 84% 84% 6
ES 84% 93% 91% 90% 88% 88% 87% 87% 89% 2
FI 97% 97% 97% 97% 96% 97% 97% 97% 98% 0
FR 78% 85% 86% 86% 86% 88% 88% 90% 3
HR 70% 68% 65% 65% 67% 2
HU 67% 67% 68% 69% 68% 69% 68% 71% 70% 1
IE 71% 73% 75% 77% 79% 80% 84% 84% 5
IT 99% 99% 98% 98% 99% 99% 100% 101% 1
LT 96% 90% 87% 86% 73% 81% 82% 83% 6
LV 84% 89% 86% 86% 87% 91% 88% 91% 92% 3
NL 101% 106% 106% 105%
105
% 105% 106% 99% 100% 3
PL 95% 102% 90% 89% 95% 97% 95% 98% 4
PT 89% 88% 86% 88% 89% 90% 88% 92% 94% 2
RO 74% 66% 57% 67% 68% 72% 72% 73% 5
SE 94% 94% 96% 98% 98% 99% 99% 101% 2
SI 89% 88% 87% 89% 89% 89% 91% 91% 1
SK 83% 84% 90% 90% 88% 88% 79% 84% 4
UK 93% 99% 92% 93% 96% 91% 91% 93% 3
32
1.2 Income from self-employment /Resources; NOTE: NA S14_S15 for DE; UK and IE,
others S14
2006 2007 2008 2009 2010 2011 2012 2013 2014 SD pp
AT 68% 72% 71% 78% 77% 75% 66% 72% 70% 4
BE 49% 72% 58% 57% 60% 49% 49% 50% 8
BG 34% 39% 33% 45% 41% 35% 35% 51% 6
CY 87% 102% 96% 87% 80% 68% 68% 65% 13
CZ 49% 51% 54% 50% 50% 50% 53% 55% 2
DE 55% 54% 41% 42% 39% 35% 36% 35% 7
DK 71% 67% 48% 58% 69% 78% 99% 74% 82% 13
EE 16% 7% 7% 9% 10% 12% 12% 13% 3
EL 48% 47% 48% 51% 48% 49% 51% 49% 49% 1
ES 27% 40% 39% 37% 40% 37% 39% 40% 42% 4
FI 61% 63% 63% 57% 58% 60% 58% 58% 57% 2
FR 58% 50% 51% 51% 60% 67% 64% 66% 7
HR 66% 45% 41% 87% 84% 71% 18
HU 33% 34% 39% 42% 44% 43% 42% 43% 41% 4
IE 75% 77% 78% 74% 61% 61% 64% 7
IT 72% 74% 76% 81% 78% 75% 73% 73% 3
LT 33% 41% 39% 44% 45% 40% 51% 61% 8
LV 13% 12% 10% 10% 12% 14% 13% 13% 16% 2
MT 109% 115% 106% 103% 88% 88% 84% 87% 11
NL 41% 48% 53% 50% 54% 53% 55% 58% 57% 5
PL 22% 22% 23% 25% 27% 26% 25% 24% 2
PT 47% 47% 45% 39% 38% 31% 31% 31% 7
RO 17% 15% 13% 19% 16% 14% 14% 12% 2
SE 43% 38% 51% 54% 47% 50% 47% 45% 5
SI 30% 29% 33% 34% 35% 32% 29% 33% 2
SK 16% 16% 16% 14% 17% 22% 21% 21% 3
UK 90% 99% 88% 95% 90% 82% 72% 74% 9

33
2. Property income/Resources; NOTE: NA S14_S15 for AT;UK;DE;HR sector; others S14
2006 2007 2008 2009 2010 2011 2012 2013 2014 SD pp
AT 9% 12% 11% 16% 21% 21% 15% 22% 19% 5
BE 24% 20% 17% 20% 19% 16% 20% 20% 2
BG 34% 26% 35% 44% 24% 22% 32% 35% 7
CY 31% 25% 20% 22% 24% 27% 27% 27% 3
CZ 12% 15% 13% 15% 15% 12% 14% 15% 1
DE 16% 14% 12% 15% 14% 14% 13% 13% 1
DK 18% 25% 6% 4% 8% 7% 3% 27% 24% 9
EE 6% 7% 9% 12% 8% 5% 17% 12% 4
EL 46% 29% 29% 42% 43% 40% 25% 29% 36% 7
ES 18% 42% 40% 53% 54% 43% 43% 44% 37% 10
FI 52% 47% 43% 59% 69% 61% 67% 69% 71% 10
FR 27% 94% 90% 100% 110% 104% 106% 102% 25
HR 21% 20% 20% 23% 30% 4
HU 6% 6% 6% 4% 6% 7% 6% 8% 6% 1
IE 46% 35% 36% 26% 25% 27% 33% 35% 7
IT 11% 13% 13% 16% 18% 20% 22% 23% 4
LT 2% 6% 11% 5% 4% 3% 3% 4% 3
LV 2% 5% 7% 4% 2% 5% 7% 7% 8% 2
NL 33% 30% 29% 25% 25% 23% 29% 27% 24% 3
PL 9% 8% 8% 9% 14% 10% 9% 11% 2
PT 10% 9% 9% 14% 12% 13% 16% 19% 3
RO 5% 6% 9% 6% 6% 4% 4% 0% 3
SE 34% 35% 33% 35% 29% 27% 30% 33% 3
SI 28% 28% 33% 36% 42% 42% 47% 72% 13
SK 6% 4% 5% 3% 4% 4% 5% 3% 1
UK 16% 16% 16% 13% 13% 14% 15% 14% 1

34
4. Social benefits other than social transfers in kind/Resources; NOTE: NA sector S14_S15
AT; DE; HR; IE; UK; others S14
2006 2007 2008 2009 2010 2011 2012 2013 2014 SD pp
AT 93% 86% 89% 90% 90% 90% 89% 92% 92% 2
BE 77% 75% 77% 76% 74% 76% 77% 76% 1
BG 74% 89% 91% 101% 82% 90% 93% 118% 12
CY 83% 82% 81% 83% 84% 89% 97% 79% 5
CZ 77% 76% 77% 75% 76% 77% 76% 78% 1
DE 86% 88% 89% 87% 87% 88% 88% 86% 1
DK 86% 87% 90% 90% 93% 94% 95% 98% 94% 4
EE 83% 83% 84% 83% 85% 87% 89% 92% 3
EL 80% 77% 73% 72% 77% 72% 77% 81% 80% 3
ES 74% 81% 83% 82% 81% 82% 87% 87% 86% 4
FI 93% 94% 93% 94% 94% 93% 93% 93% 93% 0
FR 82% 86% 87% 88% 86% 86% 87% 88% 2
HR 85% 87% 83% 84% 86% 1
HU 80% 81% 81% 80% 83% 82% 83% 84% 85% 2
IE 85% 87% 91% 97% 93% 91% 94% 93% 4
IT 88% 90% 89% 89% 89% 89% 89% 88% 1
LT 82% 81% 83% 75% 76% 77% 82% 80% 3
LV 83% 84% 87% 90% 95% 94% 91% 91% 92% 4
NL 86% 89% 90% 90% 90% 89% 87% 85% 88% 2
PL 92% 93% 87% 85% 87% 90% 90% 89% 3
PT 76% 74% 70% 71% 70% 77% 78% 79% 3
RO 88% 83% 78% 74% 75% 74% 74% 79% 5
SE 92% 91% 93% 94% 96% 95% 96% 96% 2
SI 89% 90% 88% 91% 91% 88% 87% 89% 1
SK 77% 74% 76% 74% 72% 72% 71% 67% 3
UK 77% 75% 71% 71% 71% 75% 76% 75% 2

35
6. Social contributions and taxes on income paid/Use; Note: NA sector S14_S15 for
AT;DE;HR; IE, UK; others S14
2006 2007 2008 2009 2010 2011 2012 2013 2014 SD pp
AT 81% 86% 85% 90% 88% 87% 85% 88% 85% 2
BE 78% 76% 72% 77% 72% 74% 74% 73% 2
BG 88% 85% 100% 85% 111% 96% 106% 112% 11
CZ 64% 65% 65% 64% 65% 62% 60% 60% 2
DE 89% 89% 80% 81% 82% 83% 84% 83% 3
DK 76% 75% 75% 74% 75% 73% 76% 76% 72% 1
EE 97% 87% 99% 108% 111% 114% 106% 104% 8
EL 128% 119% 116% 118% 109% 116% 104% 104% 102% 8
ES 63% 73% 73% 78% 79% 76% 74% 76% 78% 5
FI 91% 88% 88% 89% 92% 91% 91% 92% 91% 1
FR 72% 76% 75% 75% 79% 81% 79% 79% 3
HR 84% 84% 75% 77% 77% 4
HU 65% 64% 64% 66% 55% 61% 65% 72% 68% 4
IE 45% 49% 51% 60% 61% 67% 73% 72% 10
IS 73% 71% 78% 72% 66% 66% 69% 70% 4
IT 92% 94% 92% 97% 98% 98% 94% 95% 2
LT 102% 81% 84% 88% 71% 70% 74% 78% 10
LV 91% 97% 99% 99% 96% 103% 94% 96% 99% 3
NL 93% 104% 103% 102% 104% 99% 100% 89% 89% 6
NO 91% 97% 91% 97% 95% 97% 93% 101% 97% 3
PL 92% 86% 83% 87% 88% 89% 85% 87% 3
PT 118% 108% 100% 100% 109% 112% 100% 105% 6
RO 91% 93% 89% 89% 91% 83% 61% 91% 10
SE 85% 83% 82% 89% 86% 87% 87% 90% 3
SI 89% 89% 86% 89% 89% 88% 87% 89% 1
SK 57% 58% 60% 45% 50% 41% 37% 53% 8
UK 70% 76% 72% 72% 77% 74% 72% 67% 3

36
7. Taxes on wealth paid/use; Note: NA sector S14_S15 for DE; HR; UK; others S14
2006 2007 2008 2009 2010 2011 2012 2013 2014
BG 876% 342% 341% 325% 214% 151% 141% 122%
CY 24% 28% 24% 24% 24% 25% 25% 46%
CZ 40% 38% 43% 52% 67% 94% 94% 101%
DE 79% 86% 82% 90% 87% 86% 85% 84%
DK 63% 52% 52% 53% 54% 55% 54% 54% 53%
EL 2% 2% 2% 12% 11% 62% 85% 87% 214%
ES 21% 16% 15% 0% 0% 0% 13% 8% 6%
FI 25% 24% 26% 32% 29% 34% 30% 27% 31%
FR 10% 14% 12% 8% 9% 9% 10% 11%
HR 0% 19% 18% 13% 14%
HU 56% 55% 50% 50% 68% 68% 68% 63% 65%
IT 104% 107% 59% 55% 56% 52% 167% 140%
LT 43% 57% 40% 121% 45% 39% 37% 36%
LV 49% 118% 95% 121% 103% 79% 74% 67% 70%
PL 39% 38% 34% 34% 38% 37% 41% 32%
PT 107% 126% 128% 119% 132% 144% 135% 130%
RO 115% 93% 90% 96% 83% 79% 69% 71%
SE 224% 337% 270% 295% 292% 318% 330% 320%
SI 47% 39% 26% 26% 26% 25% 25% 25%
SK 36% 30% 34% 38% 35% 35% 33% 33%
UK 77% 79% 79% 80% 77% 76% 77% 75%
Related Documents


