Distribution Costs & The Size of Indian Manufacturing Establishments Alessandra Peter, Cian Ruane Stanford University November 3, 2017

Welcome message from author
This document is posted to help you gain knowledge. Please leave a comment to let me know what you think about it! Share it to your friends and learn new things together.
Transcript

Distribution Costs &The Size of Indian Manufacturing
Establishments
Alessandra Peter, Cian Ruane
Stanford University
November 3, 2017

Question
Selling manufactured goods involves costs of distribution:
I Variable: Freight/shipping, insurance, commissions
I Fixed: Finding and contracting with distributors
1. How does low productivity in distribution sectors affectmanufacturing firms in developing countries?
I 2005 India-US TFP gap in Distribution sectors ≈ 8×I 2005 India-US TFP gap in Manufacturing sectors ≈ 4×
2. Can low productivity in distribution sectors explainsurvival of small plants in India?
I Median manufacturing employment in India ≈ 1 (47 in US)
I Constrain larger plants ⇒ enable inefficient plants to survive
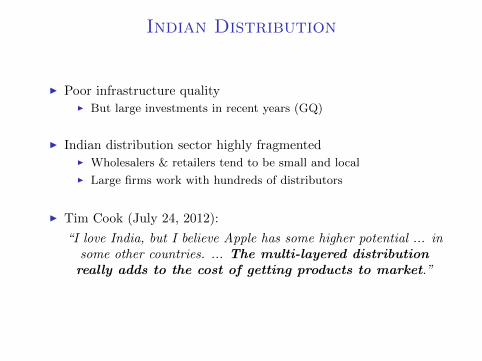
Indian Distribution
I Poor infrastructure qualityI But large investments in recent years (GQ)
I Indian distribution sector highly fragmentedI Wholesalers & retailers tend to be small and local
I Large firms work with hundreds of distributors
I Tim Cook (July 24, 2012):
“I love India, but I believe Apple has some higher potential ... insome other countries. ... The multi-layered distributionreally adds to the cost of getting products to market.”
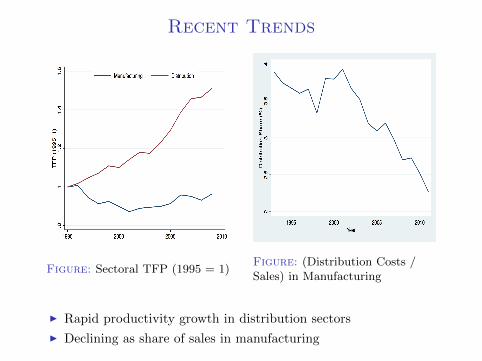
Recent Trends
Figure: Sectoral TFP (1995 = 1)Figure: (Distribution Costs /Sales) in Manufacturing
I Rapid productivity growth in distribution sectors
I Declining as share of sales in manufacturing
What We Do
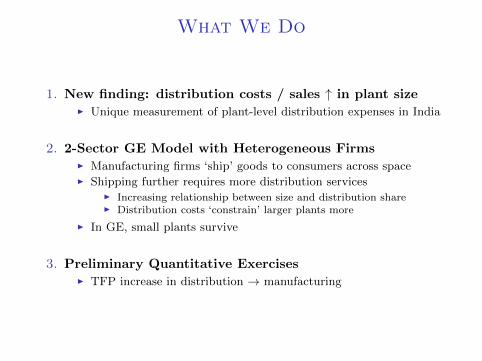
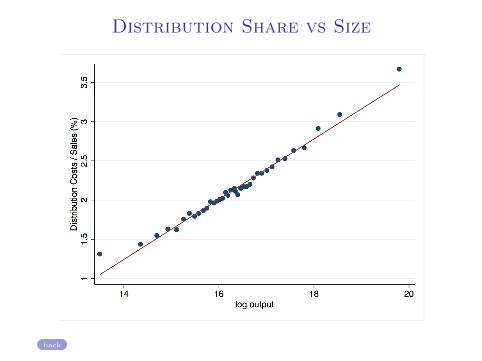
1. New finding: distribution costs / sales ↑ in plant sizeI Unique measurement of plant-level distribution expenses in India
2. 2-Sector GE Model with Heterogeneous FirmsI Manufacturing firms ‘ship’ goods to consumers across spaceI Shipping further requires more distribution services
I Increasing relationship between size and distribution shareI Distribution costs ‘constrain’ larger plants more
I In GE, small plants survive
3. Preliminary Quantitative ExercisesI TFP increase in distribution → manufacturing

Literature
I Firm-size distribution and developmentI Hsieh & Klenow (2009, 2014), Hsieh & Olken (2014),
Bento & Restuccia (2015), Akcigit et al (2016)
I Intranational Trade CostsI Holmes & Stevens (2012), Atkin & Donaldson (2015)
I Model:I Melitz (2003), Arkolakis (2010)
Table of Contents
Data and Empirical Results
Model
Simple Quantitative Exercise

Data: Indian Annual Survey of Industries
I Survey of formal Indian manufacturing plants (1993-2011)I Representative sample > 10 workers Cleaning
I Unique measurement of outward distribution costs:
‘i.e. outward freight, rebate, commission, transit insurance ofgoods sold, packing fees etc’
I Includes variable costs
I Excludes fixed costs: finding distributors, advertising, etc...
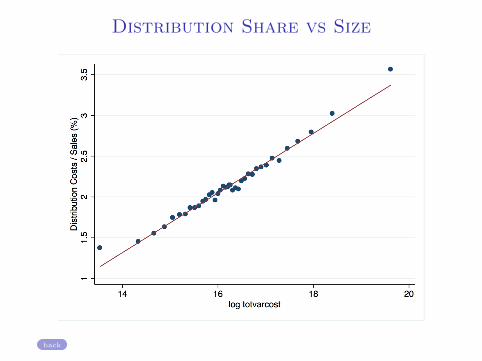
I Distribution share (ds) = distribution expensessales (net of taxes)
I Average share = 2.2%

Distribution Share vs Size (Log-Scale)
Labor Cost, Materials + Fuels Output Robustness

Interpretation
I Rationalize this finding with 2 observations
1. Larger plants ship further (Holmes & Stevens (2012))2. Marginal distribution costs increasing in distance
I Larger plants use distribution services more extensively.
→ particularly affected by productivity in distribution sector.
I Key features we incorporate in our model.

Table of Contents
Data and Empirical Results
Model
Simple Quantitative Exercise
Model Preview
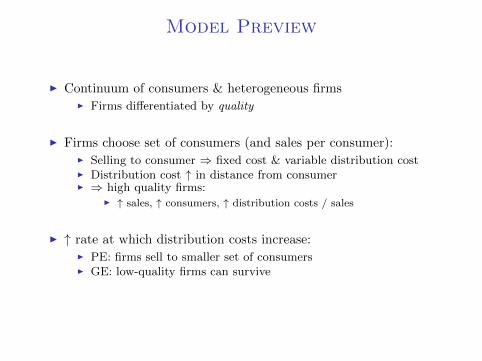
I Continuum of consumers & heterogeneous firmsI Firms differentiated by quality
I Firms choose set of consumers (and sales per consumer):I Selling to consumer ⇒ fixed cost & variable distribution costI Distribution cost ↑ in distance from consumerI ⇒ high quality firms:
I ↑ sales, ↑ consumers, ↑ distribution costs / sales
I ↑ rate at which distribution costs increase:I PE: firms sell to smaller set of consumersI GE: low-quality firms can survive

Environment
I Two sectors: Distribution (D) & Production (Q)I D: perfect competition, technology: D = ADL, price: pD
I Q: monopolistic competition, heterogeneous firms
I Continuum of consumers & firms uniformly distributed on circle:I Circumference = 1
I At each point on the circle:I Mass L of identical consumers (exogenous)I Mass J of heterogeneous firms (endogenous)I Consumers and firms symmetric at every point
I Free entry condition at each point

Consumer’s Problem
I Consumer (l) has CES preferences over available varieties Ωl
maxc(ω)
(∫ω∈Ωl
ψ(ω)c(ω)σ−1σ dω
) σσ−1
s.t
∫ω∈Ωl
p(ω)c(ω)dω ≤ w + π
I ψ(ω) = quality of variety (firm) ω
I Ωl determined in equilibrium
Demand: c(ω) = Pσ−1(w + π) ψ(ω)σ p(ω)−σ
Details

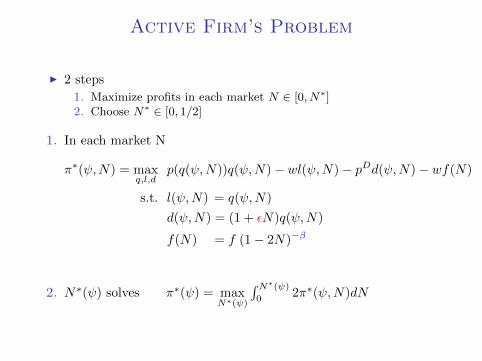
Active Firm’s Problem
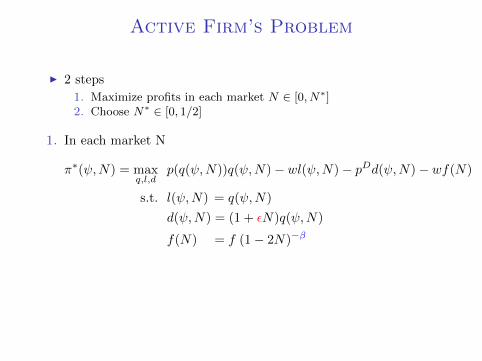
I 2 steps
1. Maximize profits in each market N ∈ [0, N∗]2. Choose N∗ ∈ [0, 1/2]
1. In each market N
π∗(ψ,N) = maxq,l,d
p(q(ψ,N))q(ψ,N)− wl(ψ,N)− pDd(ψ,N)− wf(N)
s.t. l(ψ,N) = q(ψ,N)
d(ψ,N) = (1 + εN)q(ψ,N)
f(N) = f (1− 2N)−β
2. N∗(ψ) solves π∗(ψ) = maxN∗(ψ)
∫ N∗(ψ)
02π∗(ψ,N)dN
Active Firm’s Problem
I 2 steps
1. Maximize profits in each market N ∈ [0, N∗]2. Choose N∗ ∈ [0, 1/2]
1. In each market N
π∗(ψ,N) = maxq,l,d
p(q(ψ,N))q(ψ,N)− wl(ψ,N)− pDd(ψ,N)− wf(N)
s.t. l(ψ,N) = q(ψ,N)
d(ψ,N) = (1 + εN)q(ψ,N)
f(N) = f (1− 2N)−β
2. N∗(ψ) solves π∗(ψ) = maxN∗(ψ)
∫ N∗(ψ)
02π∗(ψ,N)dN
Active Firm’s Problem
I 2 steps
1. Maximize profits in each market N ∈ [0, N∗]2. Choose N∗ ∈ [0, 1/2]
1. In each market N
π∗(ψ,N) = maxq,l,d
p(q(ψ,N))q(ψ,N)− wl(ψ,N)− pDd(ψ,N)− wf(N)
s.t. l(ψ,N) = q(ψ,N)
d(ψ,N) = (1 + εN)q(ψ,N)
f(N) = f (1− 2N)−β
2. N∗(ψ) solves π∗(ψ) = maxN∗(ψ)
∫ N∗(ψ)
02π∗(ψ,N)dN
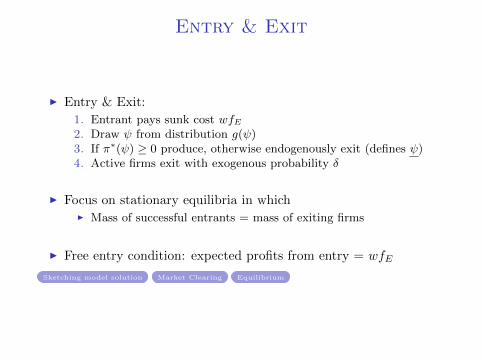
Entry & Exit
I Entry & Exit:
1. Entrant pays sunk cost wfE2. Draw ψ from distribution g(ψ)3. If π∗(ψ) ≥ 0 produce, otherwise endogenously exit (defines ψ)4. Active firms exit with exogenous probability δ
I Focus on stationary equilibria in whichI Mass of successful entrants = mass of exiting firms
I Free entry condition: expected profits from entry = wfE
Sketching model solution Market Clearing Equilibrium
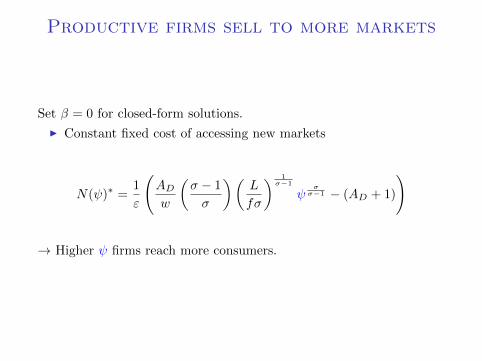
Productive firms sell to more markets
Set β = 0 for closed-form solutions.
I Constant fixed cost of accessing new markets
N(ψ)∗ =1
ε
(ADw
(σ − 1
σ
)(L
fσ
) 1σ−1
ψσσ−1 − (AD + 1)
)
→ Higher ψ firms reach more consumers.

Low ε drives out low TFP firms
N(ψ)∗ =1
ε
(ADw
(σ − 1
σ
)(L
fσ
) 1σ−1
ψσσ−1 − (AD + 1)
)
I Lower εI All active firms sell a further distanceI w ↑ to restore labor market clearing
ψ = w
(1 +
1
AD
)σ−1σ(σf
L
) 1σ(
σ
σ − 1
)σ−1σ
I ψ ↑: low quality firms driven out of the market
Table of Contents
Data and Empirical Results
Model
Simple Quantitative Exercise
Outline
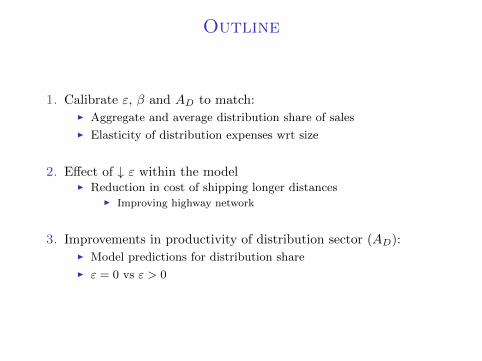
1. Calibrate ε, β and AD to match:I Aggregate and average distribution share of sales
I Elasticity of distribution expenses wrt size
2. Effect of ↓ ε within the modelI Reduction in cost of shipping longer distances
I Improving highway network
3. Improvements in productivity of distribution sector (AD):I Model predictions for distribution share
I ε = 0 vs ε > 0
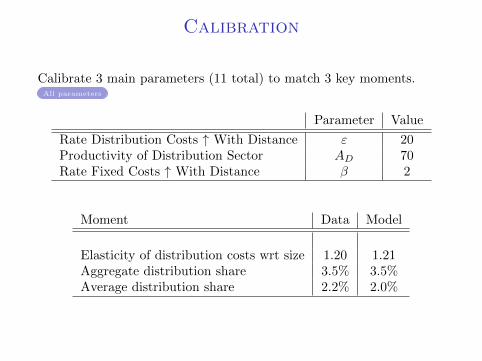
Calibration
Calibrate 3 main parameters (11 total) to match 3 key moments.All parameters
Parameter Value
Rate Distribution Costs ↑ With Distance ε 20Productivity of Distribution Sector AD 70Rate Fixed Costs ↑ With Distance β 2
Moment Data Model
Elasticity of distribution costs wrt size 1.20 1.21Aggregate distribution share 3.5% 3.5%Average distribution share 2.2% 2.0%
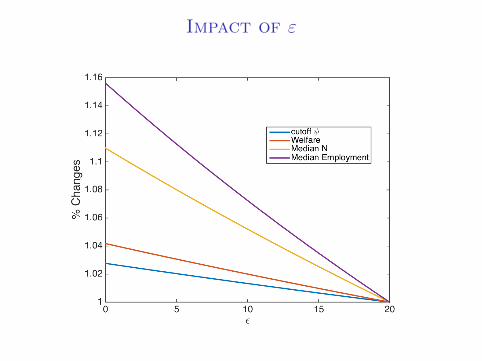
Impact of ε
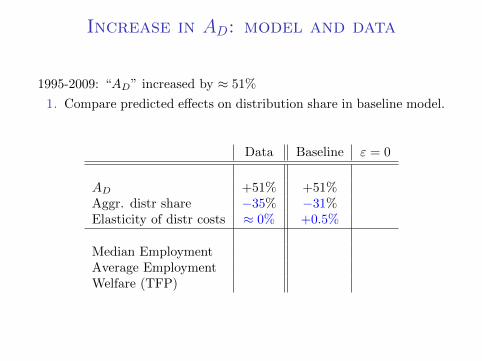
Increase in AD: model and data
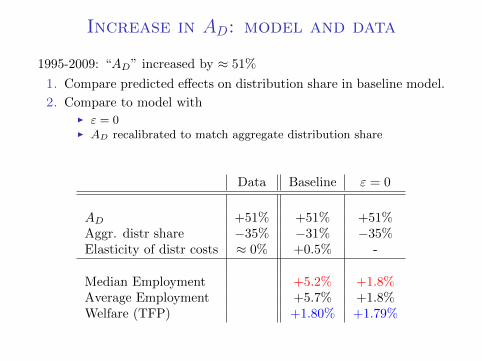
1995-2009: “AD” increased by ≈ 51%
1. Compare predicted effects on distribution share in baseline model.
Data Baseline ε = 0
AD +51% +51%Aggr. distr share −35% −31%Elasticity of distr costs ≈ 0% +0.5%
Median EmploymentAverage EmploymentWelfare (TFP)
Increase in AD: model and data
1995-2009: “AD” increased by ≈ 51%
1. Compare predicted effects on distribution share in baseline model.
2. Compare to model withI ε = 0I AD recalibrated to match aggregate distribution share
Data Baseline ε = 0
AD +51% +51% +51%Aggr. distr share −35% −31% −35%Elasticity of distr costs ≈ 0% +0.5% -
Median Employment +5.2% +1.8%Average Employment +5.7% +1.8%Welfare (TFP) +1.80% +1.79%

Conclusion
1. Stylized FactI Distribution costs non-trivial
I Distribution costs / sales increasing in plant size
2. 2-Sector ModelI Firms sell to consumers & incur distribution costsI Higher quality firms: profitably sell to more distant consumers
I More customers, ↑ total sales, ↑ distribution share of sales
3. Preliminary Quantitative ResultsI ↓ in rate at which distribution costs increase with distance
I ↑ in welfare
I ↑ in median plant size

Next Steps
Focus explicitly on wholesale / retail sector
I Fragmentation ⇒ ↑ fixed costs: related to β graph
I How do we get discipline on this?I NSS Traders Survey (1991 & 1997)
Use variation across time and geography
I Infrastructure improvements (GQ)
I ‘Fragmentation of distribution sector’
I FDI liberalization in distribution sector 2011

THANK YOU

Robustness
I Robust to measure of size & geographic aggregation
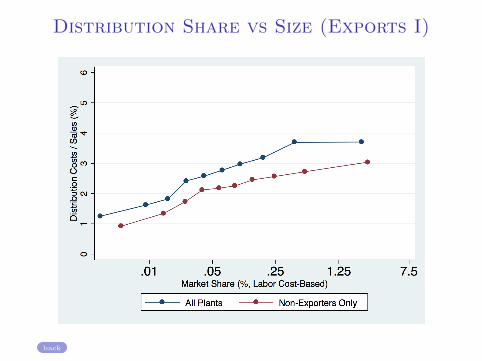
I Not driven by exporters ⇒ intranational distribution costsI Exporters by Decile Distribution Share non-exporters
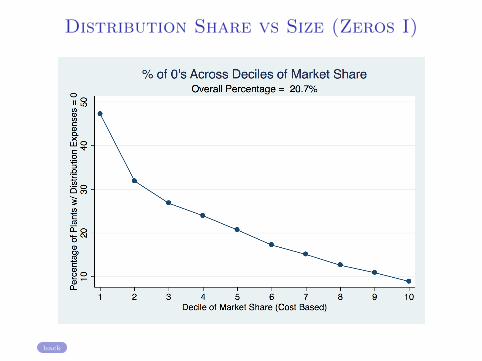
I Not driven by reporting of 0’s (≈ 21.5% of plants)I Zeros by Decile Distribution Share vs Size
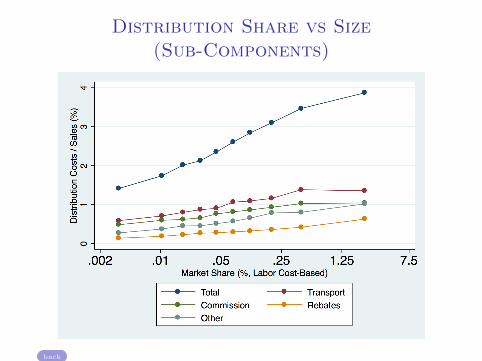
I All components of distribution expenses increase with sizeI Distribution Subcomponents
I Opposite relationship on inward freight costsI Inward Freight Share vs Size
I Different from other inputs (labor, materials):I Labor share decreasing with plant size
back
Other Quotes
I In India, Distribution is God (Harvard Business Review,2012):
“In India, because of fragmented distribution networks, it’sdifficult for a new venture to get its products to a large audience.In the US, innovative companies can bypass delivery problems by
working directly with large consumer-facing hubs such asWal-Mart (old), Amazon (new), or iTunes (new, new), which
allows them to quickly and efficiently reach early adopters”
Back
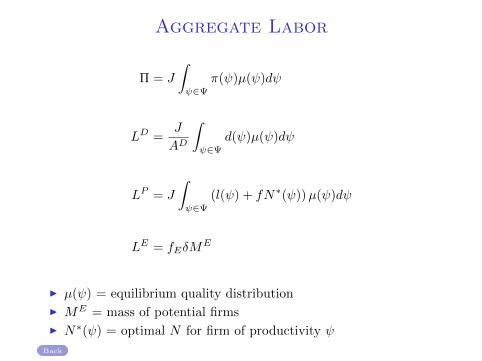
Aggregate Labor
Π = J
∫ψ∈Ψ
π(ψ)µ(ψ)dψ
LD =J
AD
∫ψ∈Ψ
d(ψ)µ(ψ)dψ
LP = J
∫ψ∈Ψ
(l(ψ) + fN∗(ψ))µ(ψ)dψ
LE = fEδME
I µ(ψ) = equilibrium quality distribution
I ME = mass of potential firms
I N∗(ψ) = optimal N for firm of productivity ψ
Back
Distribution Share vs Size
back
Distribution Share vs Size
back
Distribution Share vs Size (Exports I)
back

Distribution Share vs Size (Exports II)
back
Distribution Share vs Size(Sub-Components)
back
Distribution Share vs Size (Zeros I)
back
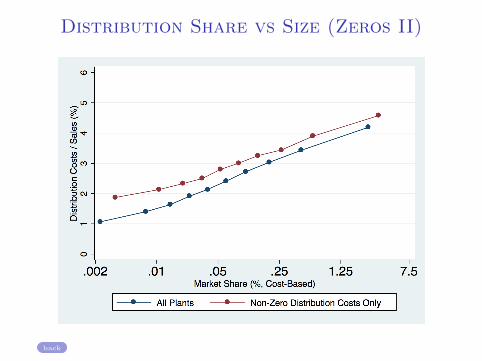
Distribution Share vs Size (Zeros II)
back
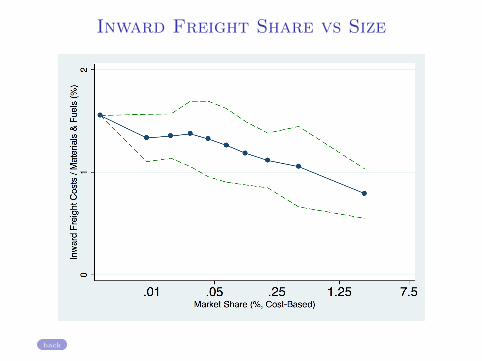
Inward Freight Share vs Size
back
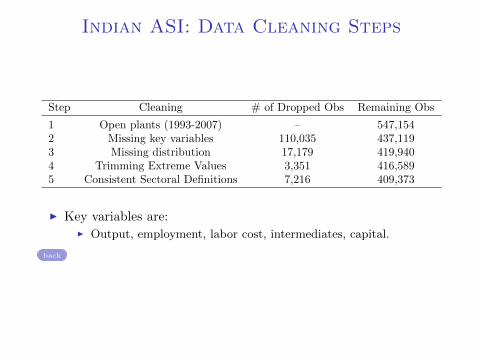
Indian ASI: Data Cleaning Steps
Step Cleaning # of Dropped Obs Remaining Obs
1 Open plants (1993-2007) – 547,1542 Missing key variables 110,035 437,1193 Missing distribution 17,179 419,9404 Trimming Extreme Values 3,351 416,5895 Consistent Sectoral Definitions 7,216 409,373
I Key variables are:I Output, employment, labor cost, intermediates, capital.
back

Sketching solution
I Free entryI average profits = π = 0I consumer’s income = w = GDP per capita
I Demand for good of quality ψ:
c(ψ,N) = w ψσ p(ψ,N)−σ
I Each level of w determinesI Cut-off productivity ψI Total sales (and hence labor demand) of firms with ψ > ψ
I In equilibrium, w is such thatI L = Le + Lp + Ld
I Expected operating profits P (ψ > ψ) πo = wfe
back
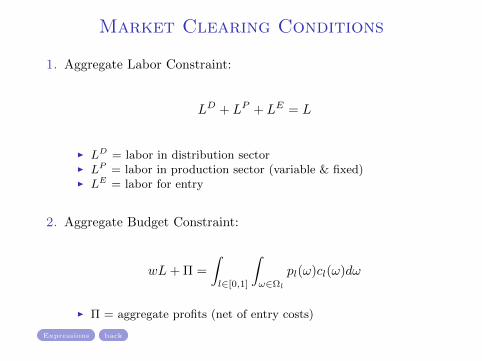
Market Clearing Conditions
1. Aggregate Labor Constraint:
LD + LP + LE = L
I LD = labor in distribution sectorI LP = labor in production sector (variable & fixed)I LE = labor for entry
2. Aggregate Budget Constraint:
wL+ Π =
∫l∈[0,1]
∫ω∈Ωl
pl(ω)cl(ω)dω
I Π = aggregate profits (net of entry costs)
Expressions back
Equilibrium
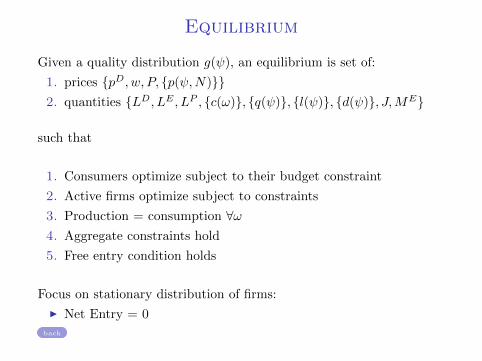
Given a quality distribution g(ψ), an equilibrium is set of:
1. prices pD, w, P, p(ψ,N)2. quantities LD, LE , LP , c(ω), q(ψ), l(ψ), d(ψ), J,ME
such that
1. Consumers optimize subject to their budget constraint
2. Active firms optimize subject to constraints
3. Production = consumption ∀ω4. Aggregate constraints hold
5. Free entry condition holds
Focus on stationary distribution of firms:
I Net Entry = 0
back

————————————————————————————
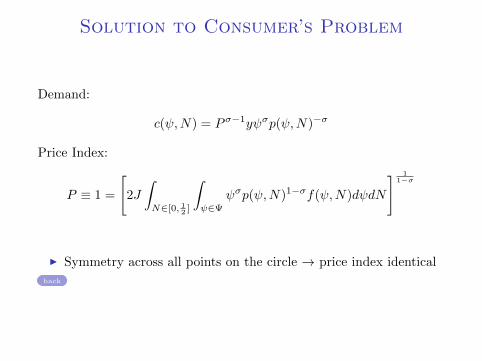
Solution to Consumer’s Problem
Demand:
c(ψ,N) = Pσ−1yψσp(ψ,N)−σ
Price Index:
P ≡ 1 =
[2J
∫N∈[0, 12 ]
∫ψ∈Ψ
ψσp(ψ,N)1−σf(ψ,N)dψdN
] 11−σ
I Symmetry across all points on the circle → price index identical
back
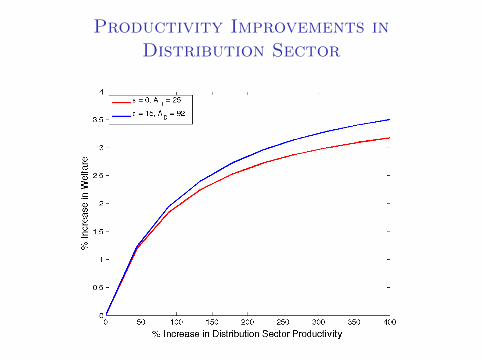
Productivity Improvements inDistribution Sector

Impact of β
back

Calibration
I Distribution of ψ = truncated Pareto (η, ψmin, ψmax)
Parameter Value
Rate Distribution Costs ↑ With Distance ε 20Productivity of Distribution Sector AD 70Rate Fixed Costs ↑ With Distance β 2
ψmin .5ψmax 3
Aggregate Labor L 1Fixed Cost f .01Fixed Entry Cost fE .05Exit Rate δ .05Pareto Shape Parameter η 4.2Elasticity of Substitution σ 3
back
Related Documents