Distribution Channel Analysis : a Guide for Hotels CINDY ESTIS GREEN & MARK V. LOMANNO PUBLISHED BY THE HSMAI FOUNDATION AN AH&LA AND STR SPECIAL REPORT

Welcome message from author
This document is posted to help you gain knowledge. Please leave a comment to let me know what you think about it! Share it to your friends and learn new things together.
Transcript
Distribution Channel Analysis: a Guide for Hotels
Cindy Estis GrEEn & Mark V. LoManno
PubLishEd by thE hsMai Foundation
A N A H & L A A N d S T R S p e c i A L R e p o R T
© 2012 Cindy Estis Green and Mark Lomanno All rights reserved.
The contents of this book may not be reproduced or communicated by any means to individuals, organizations, or to the media without prior written permission from the authors or Joe McInerney at AH&LA. Contact Cindy Estis Green at [email protected] or Joe McInerney at [email protected].
DATA CoLLECTIon
The study was conducted by collecting and analyzing data from various sources, through interviews with almost 200 industry executives, and by undertaking an extensive literature search. Tourism Economics was engaged to examine the economic dynamic in the U.S. hotel industry with a focus on price elasticity of demand. STR provided historical demand data trends on an industrywide level and collected channel mix data from over 25,000 hotels in-cluding monthly room nights, revenue and number of reservations from Janu-ary 2009 through June 2011. They also contributed data from the 2011 HOST report that aggregates 2010 hotel operating expenses by chain scale. The HS-MAI Resort Best Practices Initiative shared distribution data by channel re-flecting upscale and luxury resorts. Expedia and Cornell University provided the comScore data used in the billboard effect study published in April 2011 by the Center for Hospitality Research. ISM Marketing and Norbella supplied advertising spending data and acquired creative from 2010 consumer market-ing campaigns and Kantar Media provided media spending for the same time period. Almost twenty independent or small chain hotels provided marketing spend and guest usage data that was used to analyze revenue-to-cost ratios, ancillary spend, repeat visits and/or lifetime value. Navis supplied study data related to call center conversion rates. Most of the major hotel chains shared average reservation cost information by channel.
The sponsors and data providers were supportive in both study execution and provision of data but did not participate in the analysis and the findings do not necessarily reflect their opinions on the subjects conveyed in the study. The various data sources were synthesized and analyzed by the authors to develop the themes that are reflected in the book.
Distribution Channel Analysis: a Guide for Hotels
Mark V. LoManno
PubLishEd by thE hsMai Foundation
an ah&La and str sPECiaL rEPort
FOUNDATION
PubLishinG PartnErs
Cindy Estis GrEEn&
This book is the third in the Demystifying Distribution series published
by the HSMAI Foundation.
J
J
J
J
J
Published by the hsMAi FoundAtion v
WelcomeDear Fellow Hotel Industry Stakeholders,
Over the past ten years, we have experienced dramatic changes in our industry, perhaps the most challenging of which has been in the area of distribution. The internet as a platform for com-merce, marketing, sales and customer engagement has forever changed our relationship with and among hotel guests, clients, brands, managers, owners and third parties. These changes have had great impact on revenue generation, guest interaction, inventory control, pricing, hotel operating costs and financial return and asset values.
Every distribution channel carries costs and benefits and each one is evolving at an extraordi-nary pace. The online travel agencies are battling it out with search engines and hundreds of hotel brand websites for the consumer’s attention and it is all affecting hotel margins. Google recently entered travel search, Facebook and other social media platforms are a fast-growing exchange for travel information, and the mobile channel is emerging with massive potential. Existing distribution models such as GDSs and the OTAs are likely to evolve or become obsolete in response to the new players, but it is imperative that no matter what distribution channels are used by consumers, that each hotel can attempt to understand the dynamic of each channel and can analyze the costs and benefits in a rational and meaningful way in order to create revenue and profit streams that are sustainable going forward.
Historically, our industry has not faced the distribution challenge efficiently because there has been a lack of solid information on which to make strategic and tactical decisions. As a result, members of our industry may have operated on the basis of anecdotes and vendor-sponsored studies while coping with the pressure of economically challenging times. This lack of data also creates the risk that hotel operating statements do not reflect the true cost of third party distri-bution nor the full value placed on our hotels by the consumer.
The obvious way to address this situation was by commissioning the first, in-depth, independent factual study on this topic. Distribution Channel Analysis: A Guide for Hotels, is the outcome of a collaborative effort that transpired over a two year period. Bringing together independent experts, our industry’s leading associations and data resources, brands and many owners and operators; a coalition to compile and analyze the metrics and implications of this changing land-scape has emerged. With data from over 25,000 hotels and 100 brands representing over three million hotel rooms, brought together by our trusted partners, the hotel industry now has the facts it needs so that each hotel can independently analyze its situation and make the decisions that it deems best for its operations.
Best Regards,
Thomas J. Corcoran Robert A. Alter Mark G. CarrierChairman of the Board Executive Chairman of the Board PresidentFelCor Lodging Trust Sunstone Hotel Investors, Inc. B. F. Saul Company Hospitality Group

Our numbers are impressive:
10,000 members who together
own more than 20,000 hotels
with a combined property value
of almost $130 billion.
Even more significant is the
measurable impact of our many
important initiatives in four key
program areas:
• ProfessionalDevelopment
• Advocacy
• Products&Services
• CommunityInvolvement
These “pillars of progress” are
helping today to build a better
tomorrow for our members and
our industry.
Powerful. Personal. Proactive.
404-816-5759www.aahoa.com
7000PeachtreeDunwoodyRoad,Building#7Atlanta,GA30328-6707
“THE voice of owners in the hospitality industry”
AdvocacyProfessional Development
Products & Services Community Involvement
AsiAn AmericAn Hotel owners AssociAtion
If it impacts the industry, AH&LA’s leading the conversation.
Serving the hospitality industry for a century, AH&LA is the sole national association rep-resenting all sectors and stakeholders in the lodging industry, including individual hotel property members, hotel companies, student and faculty members, and industry suppliers. Headquartered in Washington, D.C., AH&LA provides members with national advocacy on Capitol Hill, public relations and image management, education, research and information, and other value-added services to provide bottom line savings and ensure a positive business climate for the lodging industry. Our partner state associations provide local representation and additional cost-saving benefits to members.
Without AH&LA:• Unions would dictate labor policy and the Employee Free Choice Act would have sailed
through Congress• Online travel companies would have pushed through legislation to obtain their preferential
tax treatment• The Travel Promotion Act and resulting economic stimulus for the lodging industry and US
Economy would not exist• Americans with Disabilities Act requirements would have taken no business considerations
into account and the results would have been untenable for many hotel properties• Save money on valuable products and services from more than a dozen industry partners• Free industry publications and resources, giving you latest news and information• 2 for 1 membership with your state lodging association (in 40 qualifying states)• Discounted registration to industry events to network with key players
Supporting the human talent, research, and initiatives most vital to the progress and prosperity of the lodging industry
The American Hotel & Lodging Educational Foundation is the charitable fund-raising and en-dowed fund-management subsidiary of the American Hotel & Lodging Association. Founded in 1953, this year AH&LEF will fund 1.2 million dollars in domestic academic scholarships, research grants, school-to-career and workforce development programs. For more information, visit www.ahlef.org.
Training the best
Established in 1953 as a nonprofit educational foundation of the American Hotel & Lodging Association, the Educational Institute provides online learning currently used in over 15,000 hotels worldwide, training DVDs, videos, distance learning programs and certification for the industry, while serving as a major source of curriculum and textbooks around the world.
To learn more about becoming a member, visit www.ahla.com/membership.
Bill DeForrest, Immediate Past Chairman
Mark G. Carrier, Past Chairman
Dear Fellow Hoteliers,
The IHG Owners Association represents the diverse interests of the thousands of individual stakeholders in our association and the industry.
We focus on building return on investment for all IHG franchisees, whether members or not, and the strength of our brands and businesses throughout the world. We do this through advocacy for our stakeholders and a true focus on our team members, our communities, the quality of our hotels and the alignment we have with the fine people of Intercontinental Hotels Group.
As the IHG Owners Association, we contributed to this first-ever study to gain a better understanding of the facts and trends in the vital area of distribution. This area, which is crucial to industry revenues, has changed dramatically and is evolving dynamically.
It is important that decisions be made on independent facts, and we believe this report will help all hospitality industry stakeholders become more informed and make better decisions as a result.
We believe this report—compiled, written and published by industry experts—will be a milestone in the education of our members, and will serve as a resource to the entire industry.
Best regards,
Glenn Squires, Chairman
Eva Ferguson, President
“IHG is the only brand I know that has such a strong owners association. Our owners genuinely believe that membership in the Owners Association is the way to get the most out of their brands.”
—Joel Zorrilla, Hoteles Prisma de México (Monterrey)
“As owners, we’ve always been able to command action at the property and/or corporate level. As members of the Owners Association, we can now affect strategies that impact all IHG-brand hotels.”
—Nigel Greenaway, Eureka Funds Management (Sydney)
IHG Owners Association | Three Ravinia Drive, Suite 100 | Atlanta, GA 30346 | 770.604.5555 | www.owners.org
Owners_Letter_ad_r2.indd 1 1/19/12 1:50 PM
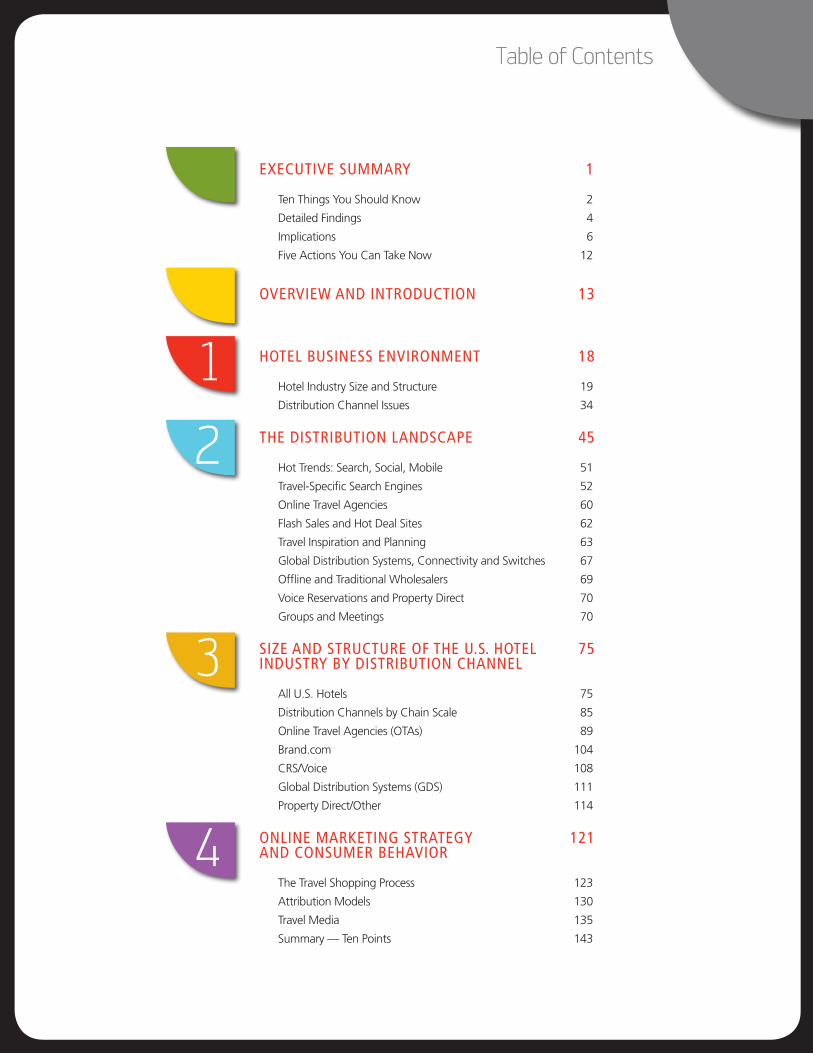
Table of Contents
EXECUTIVE SUMMARY 1
ten things you should Know 2
detailed Findings 4
implications 6
Five Actions you Can take now 12
OVERVIEW AND INTRODUCTION 13
HOTEL BUSINESS ENVIRONMENT 18
hotel industry size and structure 19
distribution Channel issues 34
THE DISTRIBUTION LANDSCAPE 45
hot trends: search, social, Mobile 51
travel-specific search engines 52
online travel Agencies 60
Flash sales and hot deal sites 62
travel inspiration and Planning 63
Global distribution systems, Connectivity and switches 67
offline and traditional Wholesalers 69
Voice Reservations and Property direct 70
Groups and Meetings 70
SIZE AND STRUCTURE OF THE U.S. HOTEL 75 INDUSTRY BY DISTRIBUTION CHANNEL
All u.s. hotels 75
distribution Channels by Chain scale 85
online travel Agencies (otAs) 89
brand.com 104
CRs/Voice 108
Global distribution systems (Gds) 111
Property direct/other 114
ONLINE MARKETING STRATEGY 121 AND CONSUMER BEHAVIOR
the travel shopping Process 123
Attribution Models 130
travel Media 135
summary — ten Points 143
1
2
3
4
© 2012 Cindy Estis Green and Mark Lomanno All rights reserved.
The contents of this book may not be reproduced or communicated by any means to individuals, organizations, or to the media without prior written permission from the authors or Joe McInerney at AH&LA. Contact Cindy Estis Green at [email protected] or Joe McInerney at [email protected].
5 DISTRIBUTION COSTS AND BENEFITS 147
Commission Costs on the P&l 147
Variable Marketing and Reservation Fees by Channel 149
Conversion Rates through direct Channels 152
Revenue-to-Cost Ratios by Marketing Channel 154
Ancillary spend Analysis 155
lifetime Value Analysis 157
Flow-through Analysis by Channel 159
OPTIMAL CHANNEL MIX 169
demand Generators 169
Acquisition, Persuasion and Retention 170
Pricing Patterns 172
optimal Marketing spend 173
ACKNOWLEDGEMENTS 181
GLOSSARY 183
APPENDIX 1 191
APPENDIX 2 199
AUTHORS BIOS 202
INDUSTRY PERSPECTIVES
George brennan, executive Vice President, 119 sales and Marketing, interstate hotels and Resorts
bill Carlson, senior Vice President, Performance Analytics, 144 Choice hotels international
doug Carr, executive director, distribution, 72 Fairmont-Raffles hotels international
bill Carroll, senior lecturer, Cornell university, 120 school of hotel Administration
Mike Conway, senior Vice President, Marketing, 178 Winegardner & hammons hotels & Resorts
George Corbin, Vice President eCommerce 41 strategy & eMarketing, Marriott
dorothy dowling, senior Vice President, 168 Marketing and sales, best Western
Mike Kistner, Chief executive officer, Pegasus solutions 167
dan Kowalewski, Vice President, Revenue Management, 43 Wyndham hotel Group
Flo lugli, executive Vice President, Marketing, 43 Wyndham hotel Group
Melissa Maher, Global Vice President, strategic 73 Accounts and industry Relations, expedia, inc.
Valyn Perini, Chief executive officer, opentravel Alliance 145
Rob torres, Managing director, travel, Google 179
larraine Voll Morris, Vice President edistribution, Marriott 41
6
1 An Ah&lA And stR sPeCiAl RePoRt
Appendix 1
1 An Ah&lA And stR sPeCiAl RePoRt
Executive Summary —Distribution Channel Analysis
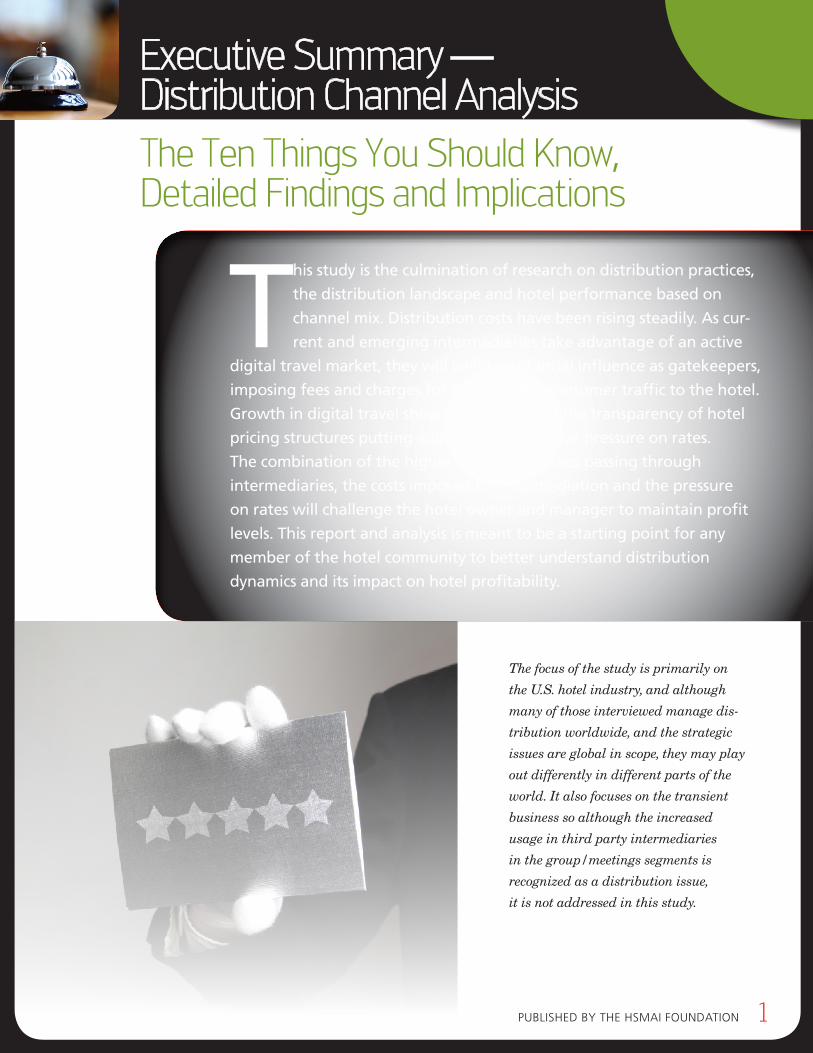
The focus of the study is primarily on
the U.S. hotel industry, and although
many of those interviewed manage dis-
tribution worldwide, and the strategic
issues are global in scope, they may play
out differently in different parts of the
world. It also focuses on the transient
business so although the increased
usage in third party intermediaries
in the group/meetings segments is
recognized as a distribution issue,
it is not addressed in this study.
The Ten Things You Should Know, Detailed Findings and Implications
This study is the culmination of research on distribution practices,
the distribution landscape and hotel performance based on
channel mix. Distribution costs have been rising steadily. As cur-
rent and emerging intermediaries take advantage of an active
digital travel market, they will wield substantial influence as gatekeepers,
imposing fees and charges for directing the consumer traffic to the hotel.
Growth in digital travel shopping will expand the transparency of hotel
pricing structures putting additional competitive pressure on rates.
The combination of the higher booking volumes passing through
intermediaries, the costs imposed for intermediation and the pressure
on rates will challenge the hotel owner and manager to maintain profit
levels. This report and analysis is meant to be a starting point for any
member of the hotel community to better understand distribution
dynamics and its impact on hotel profitability.
Published by the hsMAi FoundAtion 1
2 An Ah&lA And stR sPeCiAl RePoRt
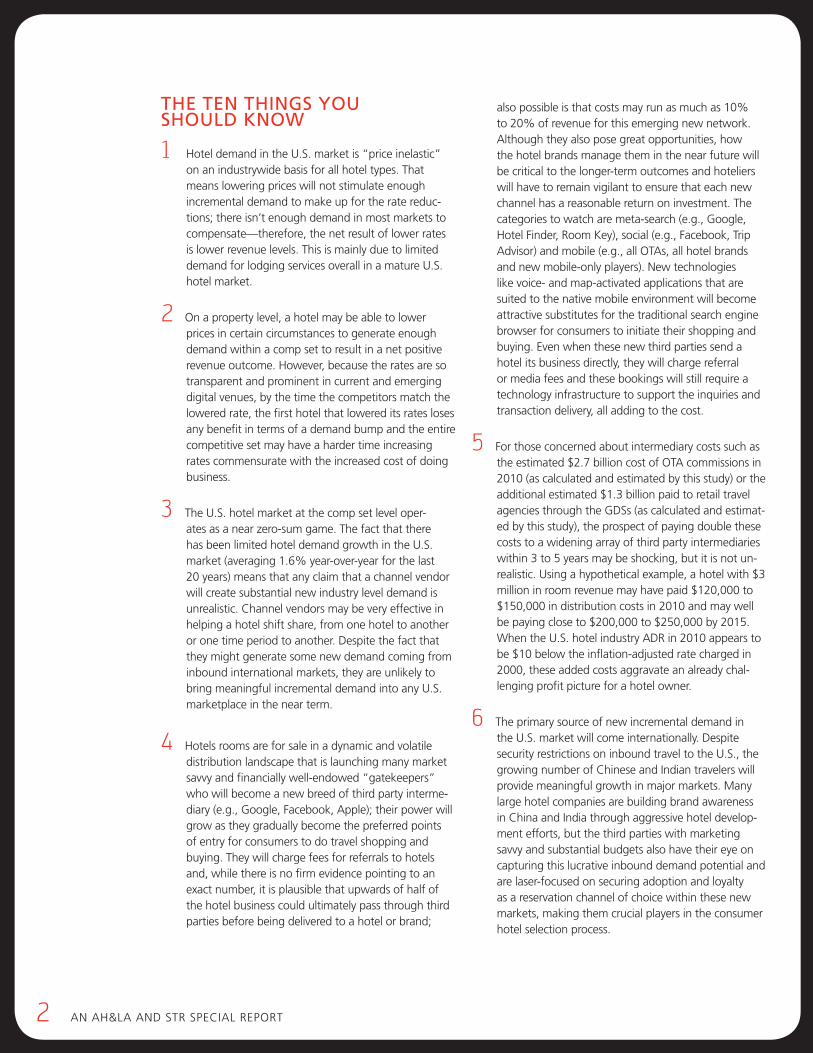
THE TEn THInGs You sHouLD Know
1 hotel demand in the u.s. market is “price inelastic” on an industrywide basis for all hotel types. that means lowering prices will not stimulate enough incremental demand to make up for the rate reduc-tions; there isn’t enough demand in most markets to compensate—therefore, the net result of lower rates is lower revenue levels. this is mainly due to limited demand for lodging services overall in a mature u.s. hotel market.
2 on a property level, a hotel may be able to lower prices in certain circumstances to generate enough demand within a comp set to result in a net positive revenue outcome. however, because the rates are so transparent and prominent in current and emerging digital venues, by the time the competitors match the lowered rate, the first hotel that lowered its rates loses any benefit in terms of a demand bump and the entire competitive set may have a harder time increasing rates commensurate with the increased cost of doing business.
3 the u.s. hotel market at the comp set level oper-ates as a near zero-sum game. the fact that there has been limited hotel demand growth in the u.s. market (averaging 1.6% year-over-year for the last 20 years) means that any claim that a channel vendor will create substantial new industry level demand is unrealistic. Channel vendors may be very effective in helping a hotel shift share, from one hotel to another or one time period to another. despite the fact that they might generate some new demand coming from inbound international markets, they are unlikely to bring meaningful incremental demand into any u.s. marketplace in the near term.
4 hotels rooms are for sale in a dynamic and volatile distribution landscape that is launching many market savvy and financially well-endowed “gatekeepers” who will become a new breed of third party interme-diary (e.g., Google, Facebook, Apple); their power will grow as they gradually become the preferred points of entry for consumers to do travel shopping and buying. they will charge fees for referrals to hotels and, while there is no firm evidence pointing to an exact number, it is plausible that upwards of half of the hotel business could ultimately pass through third parties before being delivered to a hotel or brand;
also possible is that costs may run as much as 10% to 20% of revenue for this emerging new network. Although they also pose great opportunities, how the hotel brands manage them in the near future will be critical to the longer-term outcomes and hoteliers will have to remain vigilant to ensure that each new channel has a reasonable return on investment. the categories to watch are meta-search (e.g., Google, hotel Finder, Room Key), social (e.g., Facebook, trip Advisor) and mobile (e.g., all otAs, all hotel brands and new mobile-only players). new technologies like voice- and map-activated applications that are suited to the native mobile environment will become attractive substitutes for the traditional search engine browser for consumers to initiate their shopping and buying. even when these new third parties send a hotel its business directly, they will charge referral or media fees and these bookings will still require a technology infrastructure to support the inquiries and transaction delivery, all adding to the cost.
5 For those concerned about intermediary costs such as the estimated $2.7 billion cost of otA commissions in 2010 (as calculated and estimated by this study) or the additional estimated $1.3 billion paid to retail travel agencies through the Gdss (as calculated and estimat-ed by this study), the prospect of paying double these costs to a widening array of third party intermediaries within 3 to 5 years may be shocking, but it is not un-realistic. using a hypothetical example, a hotel with $3 million in room revenue may have paid $120,000 to $150,000 in distribution costs in 2010 and may well be paying close to $200,000 to $250,000 by 2015. When the u.s. hotel industry AdR in 2010 appears to be $10 below the inflation-adjusted rate charged in 2000, these added costs aggravate an already chal-lenging profit picture for a hotel owner.
6 the primary source of new incremental demand in the u.s. market will come internationally. despite security restrictions on inbound travel to the u.s., the growing number of Chinese and indian travelers will provide meaningful growth in major markets. Many large hotel companies are building brand awareness in China and india through aggressive hotel develop-ment efforts, but the third parties with marketing savvy and substantial budgets also have their eye on capturing this lucrative inbound demand potential and are laser-focused on securing adoption and loyalty as a reservation channel of choice within these new markets, making them crucial players in the consumer hotel selection process.
Published by the hsMAi FoundAtion 3
Executive Summary
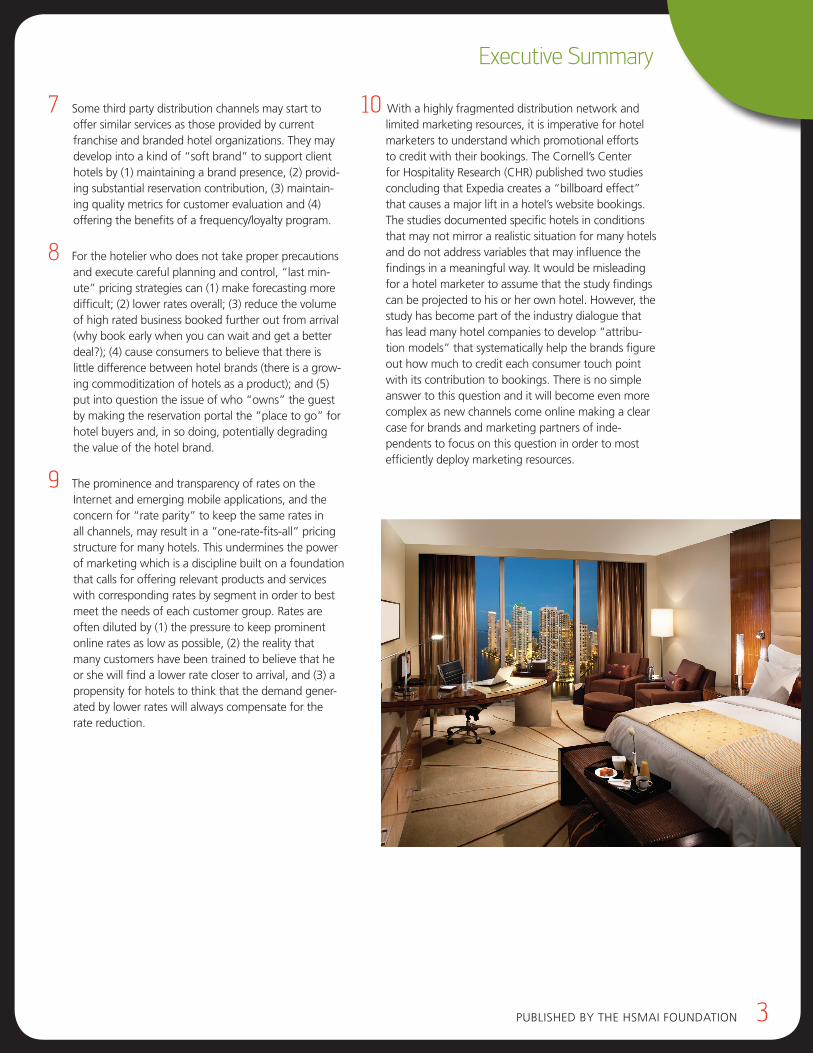
7 some third party distribution channels may start to offer similar services as those provided by current franchise and branded hotel organizations. they may develop into a kind of “soft brand” to support client hotels by (1) maintaining a brand presence, (2) provid-ing substantial reservation contribution, (3) maintain-ing quality metrics for customer evaluation and (4) offering the benefits of a frequency/loyalty program.
8 For the hotelier who does not take proper precautions and execute careful planning and control, “last min-ute” pricing strategies can (1) make forecasting more difficult; (2) lower rates overall; (3) reduce the volume of high rated business booked further out from arrival (why book early when you can wait and get a better deal?); (4) cause consumers to believe that there is little difference between hotel brands (there is a grow-ing commoditization of hotels as a product); and (5) put into question the issue of who “owns” the guest by making the reservation portal the “place to go” for hotel buyers and, in so doing, potentially degrading the value of the hotel brand.
9 the prominence and transparency of rates on the internet and emerging mobile applications, and the concern for “rate parity” to keep the same rates in all channels, may result in a “one-rate-fits-all” pricing structure for many hotels. this undermines the power of marketing which is a discipline built on a foundation that calls for offering relevant products and services with corresponding rates by segment in order to best meet the needs of each customer group. Rates are often diluted by (1) the pressure to keep prominent online rates as low as possible, (2) the reality that many customers have been trained to believe that he or she will find a lower rate closer to arrival, and (3) a propensity for hotels to think that the demand gener-ated by lower rates will always compensate for the rate reduction.
10 With a highly fragmented distribution network and limited marketing resources, it is imperative for hotel marketers to understand which promotional efforts to credit with their bookings. the Cornell’s Center for hospitality Research (ChR) published two studies concluding that expedia creates a “billboard effect” that causes a major lift in a hotel’s website bookings. the studies documented specific hotels in conditions that may not mirror a realistic situation for many hotels and do not address variables that may influence the findings in a meaningful way. it would be misleading for a hotel marketer to assume that the study findings can be projected to his or her own hotel. however, the study has become part of the industry dialogue that has lead many hotel companies to develop “attribu-tion models” that systematically help the brands figure out how much to credit each consumer touch point with its contribution to bookings. there is no simple answer to this question and it will become even more complex as new channels come online making a clear case for brands and marketing partners of inde-pendents to focus on this question in order to most efficiently deploy marketing resources.
4 An Ah&lA And stR sPeCiAl RePoRt
DETAILED FInDInGs Prices, Price Elasticity and demand 4 in the mature u.s. lodging market, with demand
growth for hotel rooms over the last 20 years averag-ing 1.6% per year, and indications that this pattern is likely to continue for the foreseeable future, the primary expectation of hotels from their distribution channel partners will be in shifting demand share, rather than generating new incremental demand.
4 Aggregate hotel room demand was found to be rela-tively inelastic. this is true both at the total u.s. level as well as for each smith travel Research (stR) chain scale category. that means that a reduction in room rate will yield growth in demand, but not enough to offset the lower price charged for the room resulting in a net negative result in room revenue. this generally applies at the property level as well, but can play out differently under certain competitive conditions.
4 if increases in hotel room rates are not at or above the inflation rate, then the price increases year-over-year are not sufficient to cover the increased cost of doing business. When AdR growth was examined over time, the u.s. industrywide AdR in 2010 was approximately $10 below the inflation-adjusted rate charged in 2000.
Channel Production Profile and relationship between Channels4 More than eight in ten room nights (81%) in 2010
were booked through direct channels — voice, brand.com, property direct — as opposed to almost 20% through third party channels (online travel agency or otA, global distribution system or Gds).
4 Greater than one-third (35%) of the hotel room book-ings in 2010 came to the hotel digitally (i.e., brand.com, otA and Gds), up from 33% in 2009. this component is expected to continue its upward trend through 2011.
4 West coast markets tend to have a much higher per-centage of their room nights booked through digital channels than other parts of the country.
4 there appears to be an inverse relationship between customer usage of brand.com and the otA channels. the data showed that when the percentage of book-ings through one of these two channels rose there was a decline in the percentage booked through the other and vice versa. A more detailed analysis of this pattern should be undertaken to better understand the magnitude and nature of the relationship.
4 the flow-through of revenue to gross operating profit (GoP) or net operating income (noi) by channel varies dramatically when the full cost of hotel operations are applied to a hotel’s base revenue. An examina-tion of some chain scale average rates and expenses by channel reveal that some hotels do not attain a high enough average rate in every channel to cover the hotel operating expenses. An analysis of aver-age distribution costs versus average AdR for 2010 indicated that the average contribution to noi for the respective booking channels in the mid-scale limited service hotels had a range of $29 per room night from the highest to lowest channel with an average hotel average daily rate (AdR) of $76.13. the spread for upscale full service hotels was $75 from highest to lowest contribution by channel to noi per room night with a hotel AdR of $132.46. (note: the analysis of marginal costs applied to incremental room revenue is a different model and both models are included in the chapter on distribution Costs and benefits.)
4 length of stay and ancillary spend vary widely by booking channel and can impact revenue and profit and therefore, have a meaningful effect on channel mix evaluation.
individual Channel Profiles4 brand.com continues to capture a larger share of
both the absolute number of rooms booked and the percentage of total rooms booked in year-over-year comparisons representing (in 2010) 16.4% of the demand and 18.5% of the revenue.
4 Central Reservation system (CRs)/Voice share of total rooms booked continued to decline in 2010 as more consumers shifted to digital channels. however, this channel still accounts for more than 13% of all rooms booked and 17% of revenue.
4 Property direct/other remains by far the largest book-ing channel for each chain scale category although it is a mixture of group/meetings, walk-in, contract and other local business so cannot be easily com-pared between hotel segments. however, the erosion caused by digital channels in both demand and room revenue share is dramatic and consistent. nonetheless, in 2010, it contributed 51.4% of demand and 45.9% of revenue.
4 Gds bookings, which are dominated by transient busi-ness travelers, grew substantially in 2010 as the lodging demand in this segment rose rapidly. it represented 8.3% of demand and 10.8% of the revenue in 2010.
Published by the hsMAi FoundAtion 5
Executive Summary
online travel agency (ota) Profile4 otA share of room night bookings grew substantially in
2010 over 2009, representing almost 11% of all room night demand and 7.7% of the revenue.
4 historically the highest percentage of otA penetration had been in the higher end chain scale segments. begin-ning in 2010, the economy and mid-scale chain segments experienced a notable jump in that they captured the highest percentage of rooms booked through otAs of all the chain scale categories.
4 All three of the otA business models (i.e., merchant, retail and opaque) experienced growth in both their demand and room revenue share in 2010 over the prior year. of the three, the retail segment was the fastest growing in 2011 largely driven by booking.com’s entrance and suc-cess in the u.s. market.
4 there has been a recent shift in the percentage of total room revenue booked through the otAs. between 2001 and 2009, the otA share of total room revenue booked experienced big jumps primarily when the economy dipped, and leveled off when lodging demand growth was strong. however, this pattern seems to have changed in 2011, in a year when the economy was recovering and lodging demand rebounded strongly; the otA channel had a notable rise in revenue likely due to strong growth in the retail model, higher rates overall, and the rise in use by the economy and midscale hotel segments.
4 spending on hotel rooms by the guest was estimated by this study to be approximately $2.7 billion higher in 2010 than what was reported on hotel profit and loss (P&l) statements due to the portion of the revenue collected directly by the otA (using the merchant and opaque models) that did not pass through the hotels.
4 When the actual customer spend collected by the otAs (using the merchant and opaque models) is factored into industry room revenues, total overall u.s. average room rates nationally increased about $2.35 in both 2009 and 2010, to more than $100.
4 the otA model, supported by healthy profit margins, is popular in the investment community. For example, in Q3 2011 Priceline’s market capitalization was more than $27 billion, which was almost three times that of any hotel company. ironically, this value transfer from hotel compa-nies to their intermediaries is largely fueled by the hotel fees and commissions making up the majority of the otA profits.
Marketing and distribution strategy4 the two largest consumer media budgets applied in the
promotion of hotels in the united states are spent by otAs and hotel brands. in 2010, the otAs outspent the hotels more than 2-to-1 in tV advertising and almost 4-to-1 in online paid search advertising.
4 Most hotel performance is evaluated on the basis of total room revenue. little is known about how each hotel performs compared to its competitive set in terms of channel mix and how that mix affects overall relative per-formance. lack of data on this subject limits the hotel’s ability to monitor and manage by channel.
4 the online consumer sales path is complex. Although it would be helpful for marketing planning purposes, there has not been an industrywide analysis of online attribu-tion to determine which promotional vehicles should be credited with triggering hotel website (brand.com) book-ings. the only studies published on this topic came from Cornell’s Center for hospitality Research in october 2009 and April 2011, both of which referred to a “billboard effect.” the two ChR “billboard effect” studies docu-ment outcomes, but do not prove causation between a presence on expedia and production of brand.com bookings. While helpful to focus industry discussion on an important topic, neither the April 2011 study nor the earlier “pseudo-experiment” in october 2009 sufficiently tested all the variables involved in the complex issue of identifying and appropriately crediting each of the many touch points that lead to brand.com bookings.
the first “billboard effect” study in october 2009, called a “pseudo-experiment,” looked at brand.com production to see if it increased or not while the four test hotels were cycled on and off expedia. it concluded that a presence on expedia increased brand.com bookings significantly, however, it did not consider the fact that other promo-tional activity was undertaken by those four properties (or their parent brands), and this activity could also have a material effect on brand.com bookings. it also did not test whether ranking the test hotel in a position other than the top of page 1 would make a difference to the number of brand.com bookings. the more comprehen-sive April 2011 study of 1,720 hotel bookings does not give any credit to the other seven to eight travel websites visited by consumers in the run-up to each booking, nor does it evaluate email, offline advertising, banner ads or any other commonly used promotional vehicles, each of which may create the effect of an added “billboard” on a travel shopper’s path. it also does not consider rank placement on the otA. both studies examine expedia in isolation, in an environment where many points of contact play into the outcomes, and neither study fac-tors these other touch points in or out of the consumer decision process. the industry would benefit from a more comprehensive examination of this topic.
4 the three greatest emerging forces in online distribution are: search, social media and mobile. driven by consumer behavior and some large influential online companies such as Google, Facebook and Apple, these three categories are dynamic and volatile and are likely to dramatically change the travel shopping/booking paradigm and, with it, the overall hotel distribution landscape over the next 2-3 years.
6 An Ah&lA And stR sPeCiAl RePoRt
IMpLICATIons oF THE FInDInGsThe online environment imposes constant and significant changes on lodging distribution. Para-doxically, the more diffused consumer Internet usage with its many new emerging website types, the more centralized the players will be that control it. The power will be in the hands of gatekeepers who control consumer access, and many are vying for that position, especially in the travel sector. This doesn’t bode well for a fragmented industry such as lodging that largely divides its ownership, manage-ment, and branding. There are already powerful online media interests (e.g., Google, Facebook, and the OTAs) that are well positioned to control the traffic leading to the demand for hotel rooms. These companies have deep pockets, centralized product and marketing strategies and are rewarded by the investment community for attaining near-monopoly positions. This dynamic can push up the costs of acquiring and retaining demand, and challenge a hotel’s ability to achieve acceptable profit levels; conversely, it can create competition between in-termediaries that can be leveraged to the hotelier’s advantage. To compete effectively and retain control of pricing, inventory, and brand value, the hospital-ity industry has to make a substantial commitment to manage a burgeoning array of transactional and marketing channels and harness its customer relationships, the asset it can control best, more effectively than any third party intermediary. Given the limited demand growth in the mature U.S. lodg-ing market, distribution channel marketing will be a primary tool used to shift existing share among hotels. Proactively managing to an optimal chan-nel mix objective will drive resource decisions for a hotel, and although no one can make a consumer choose a particular channel, a bias can be created for direct channels, primarily through improved content on a hotel’s own website and the applica-tion of consumer intelligence in the shopping and buying processes to favor the use of direct channels. Closely managing channel costs and choosing the best mix of channel partners can refine a distribu-tion strategy to deliver optimal results at a brand
and hotel level.
1. Price Elasticity at the Competitive Set Level the fact that year-over-year growth in hotel room
demand is small (1.6% average since 1990) is a factor at the industry and local market level. saying that this demand is “price inelastic” means that room rate reduc-tions on an industrywide level will not generate enough incremental demand to compensate for the lower room rates and, therefore, will result in eroded industrywide room revenue. however, on a property basis, this price elasticity plays out differently. For example, hotel A can lower its rates and as long as no other hotel matches the lower rate, it is feasible that it can generate enough incremental demand to come out net positive from a room revenue standpoint. unfortunately, hotels b, C, d, and e, in the competitive set, are unlikely to stand by without also lowering their rates to ensure that they get their fair share of the finite demand coming into the comp set. therefore, the result can be that hotel A gets some benefit, reduced by the degree to which the others match the room rate, resulting in all hotels ending up with lower rates and profits. As this dynamic continues over time, all hotels in the comp set may well continue to lower rates to try to be the one hotel in the comp set that gets the short-term bump in demand, but since they are all chasing the same limited demand, it can become a “race to the bottom.” When these rates get so low that a hotel can no longer sustain em-ployment levels and capital reinvestment, it is not good for the hotel, the community in which it operates, or its customers.
2. Its All About Share Shift As demand growth in the mature u.s. lodging industry
typically only varies in a narrow range from year to year, incremental demand brought by any channel partner will be marginal. however, each channel can be viewed for its potential to “share shift” from another hotel in its market, which is the primary method a hotel can use to gain an advantage. otAs are particularly adept at helping a hotel shift share either from one time period to another or from one hotel to another. this facility appears to be the primary reason why hotels have been drawn to work so closely with them. some mistake the contribution from share shifting to be creation of incremental new demand, however, the overall demand patterns recorded for the last 20 years, and consistent for the last 10 since the advent of the otA model, do not support this. due to finite and limited demand, especially at the comp set level, the dynamic usually plays out as a zero sum game. one hotel wins at the expense of the others in their immediate comp set or in the nearby market. but, even so, there is still often “not enough to go around” to those contending for the limited demand.
Published by the hsMAi FoundAtion 7
Executive Summary
sometimes, in a high demand market, several hotels will gain share, but as demand through the otA chan-nel grows in the comp set, since demand for hotel rooms is always finite, at some point, it will divert busi-ness from other channels. the data in the study from 2009 through June 2011 point to brand.com as the primary channel that loses as the otA channel grows; it also appears that when the brand.com channel grows, the otA channel share shrinks. this may occur because both are “fishing in the same pond” and tapping many of the same channel-agnostic online shoppers. hotels should develop the tools to share shift the business from all channels, not limit share shifting just to the otA channel. taking business from a competitor through voice, Gds or brand.com could incur lower transaction fees and may have less of an impact on the AdR. share shifting largely occurs (1) from one hotel to another in the same or a different chain scale, (2) from one time period to another and (3) from one channel to another. in a model where a marketer allocates resources to acquisition, persua-sion, and retention, hotels would benefit by working harder at converting existing traffic from all channels at higher rates (persuasion), and on retention, rather than solely focusing on acquisition which can be most expensive, especially without a strong conversion and retention plan.
3. Costs and Benefits of Distribution each channel carries distribution costs; the range is
wide and can run from 10% to 50% of revenue. hotel owners and managers have not always mea-sured the full cost of distribution consistently and have not factored these costs into channel decisions. too often, when hotels price rooms below marginal and fixed costs with an eye toward cash flow, they will withstand long-term negative effects on rate structure and profit. however, costs in 2010 may look reason-able when compared to where they might be in 2015. the following is a hypothetical scenario using 2010 business volumes and estimated costs and projecting a potential outcome in 2015 with many new intermedi-aries in the hotel sales path.
a. Industry Level: For anyone concerned about the almost $4 billion paid to third parties in 2010 (as estimated in this study), the prospect of paying double that amount within 3-5 years may be shocking, but not unrealistic. When the u.s. hotel industry AdR in 2010 appears to be $10 below the inflation-adjusted rate charged in 2000, these added costs aggravate an already challenging profit picture for a hotel owner.
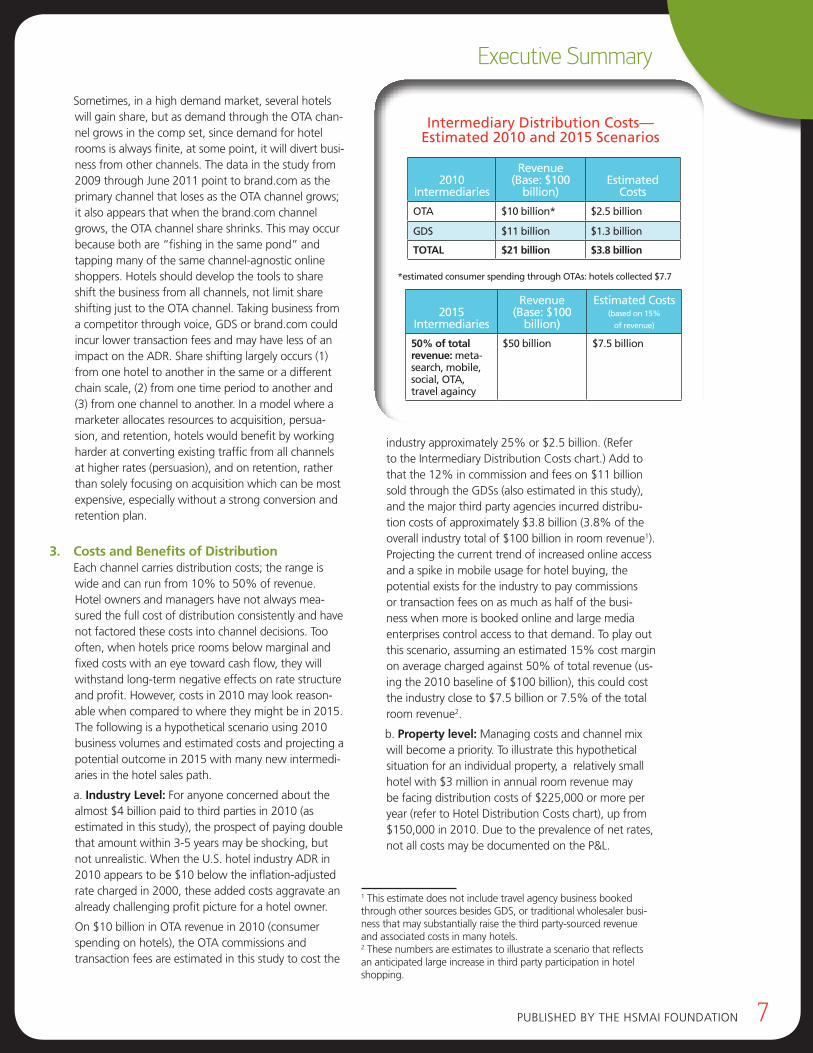
on $10 billion in otA revenue in 2010 (consumer spending on hotels), the otA commissions and transaction fees are estimated in this study to cost the
industry approximately 25% or $2.5 billion. (Refer to the intermediary distribution Costs chart.) Add to that the 12% in commission and fees on $11 billion sold through the Gdss (also estimated in this study), and the major third party agencies incurred distribu-tion costs of approximately $3.8 billion (3.8% of the overall industry total of $100 billion in room revenue1). Projecting the current trend of increased online access and a spike in mobile usage for hotel buying, the potential exists for the industry to pay commissions or transaction fees on as much as half of the busi-ness when more is booked online and large media enterprises control access to that demand. to play out this scenario, assuming an estimated 15% cost margin on average charged against 50% of total revenue (us-ing the 2010 baseline of $100 billion), this could cost the industry close to $7.5 billion or 7.5% of the total room revenue2.
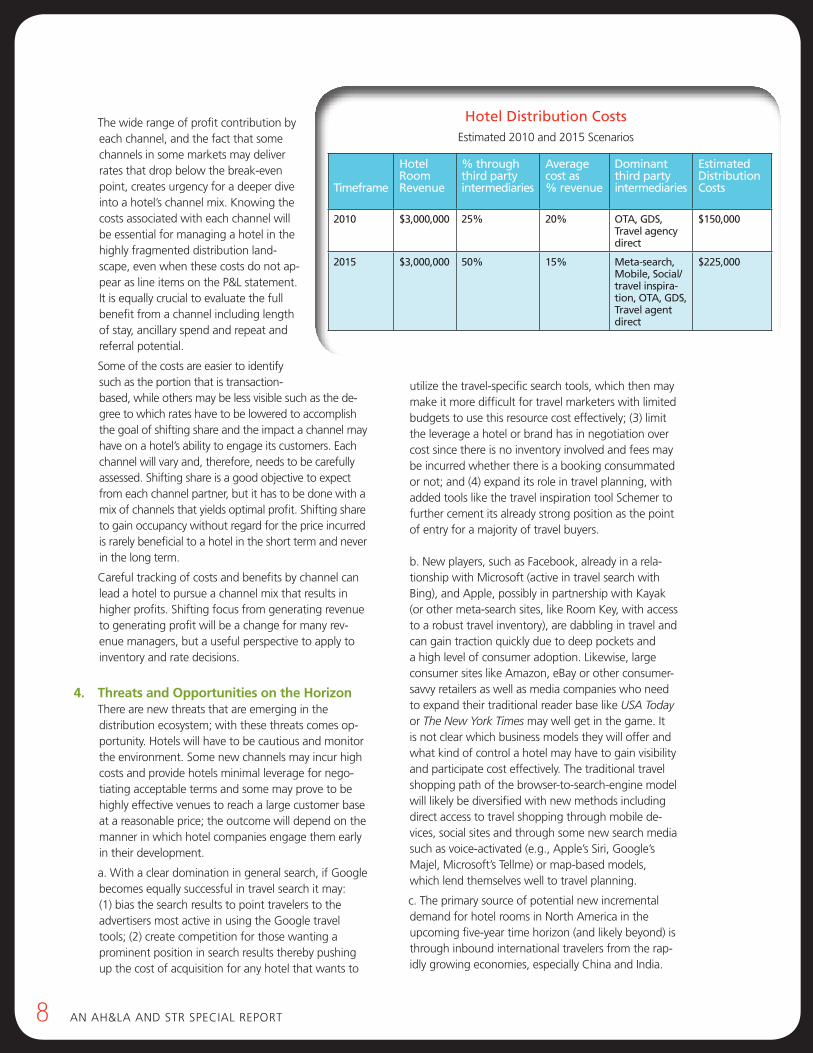
b. Property level: Managing costs and channel mix will become a priority. to illustrate this hypothetical situation for an individual property, a relatively small hotel with $3 million in annual room revenue may be facing distribution costs of $225,000 or more per year (refer to hotel distribution Costs chart), up from $150,000 in 2010. due to the prevalence of net rates, not all costs may be documented on the P&l.
1 this estimate does not include travel agency business booked through other sources besides Gds, or traditional wholesaler busi-ness that may substantially raise the third party-sourced revenue and associated costs in many hotels.2 these numbers are estimates to illustrate a scenario that reflects an anticipated large increase in third party participation in hotel shopping.
*estimated consumer spending through oTAs: hotels collected $7.7
2010
Intermediaries
Revenue(Base: $100
billion)
Estimated
Costs
oTA $10 billion* $2.5 billion
GDs $11 billion $1.3 billion
TOTAL $21 billion $3.8 billion
2015
Intermediaries
Revenue(Base: $100
billion)
Estimated Costs(based on 15%
of revenue)
50% of total revenue: meta-search, mobile, social, oTA, travel againcy
$50 billion $7.5 billion
Intermediary Distribution Costs— Estimated 2010 and 2015 scenarios
8 An Ah&lA And stR sPeCiAl RePoRt
the wide range of profit contribution by each channel, and the fact that some channels in some markets may deliver rates that drop below the break-even point, creates urgency for a deeper dive into a hotel’s channel mix. Knowing the costs associated with each channel will be essential for managing a hotel in the highly fragmented distribution land-scape, even when these costs do not ap-pear as line items on the P&l statement. it is equally crucial to evaluate the full benefit from a channel including length of stay, ancillary spend and repeat and referral potential.
some of the costs are easier to identify such as the portion that is transaction-based, while others may be less visible such as the de-gree to which rates have to be lowered to accomplish the goal of shifting share and the impact a channel may have on a hotel’s ability to engage its customers. each channel will vary and, therefore, needs to be carefully assessed. shifting share is a good objective to expect from each channel partner, but it has to be done with a mix of channels that yields optimal profit. shifting share to gain occupancy without regard for the price incurred is rarely beneficial to a hotel in the short term and never in the long term.
Careful tracking of costs and benefits by channel can lead a hotel to pursue a channel mix that results in higher profits. shifting focus from generating revenue to generating profit will be a change for many rev-enue managers, but a useful perspective to apply to inventory and rate decisions.
4. Threats and Opportunities on the Horizon there are new threats that are emerging in the
distribution ecosystem; with these threats comes op-portunity. hotels will have to be cautious and monitor the environment. some new channels may incur high costs and provide hotels minimal leverage for nego-tiating acceptable terms and some may prove to be highly effective venues to reach a large customer base at a reasonable price; the outcome will depend on the manner in which hotel companies engage them early in their development.
a. With a clear domination in general search, if Google becomes equally successful in travel search it may: (1) bias the search results to point travelers to the advertisers most active in using the Google travel tools; (2) create competition for those wanting a prominent position in search results thereby pushing up the cost of acquisition for any hotel that wants to
utilize the travel-specific search tools, which then may make it more difficult for travel marketers with limited budgets to use this resource cost effectively; (3) limit the leverage a hotel or brand has in negotiation over cost since there is no inventory involved and fees may be incurred whether there is a booking consummated or not; and (4) expand its role in travel planning, with added tools like the travel inspiration tool schemer to further cement its already strong position as the point of entry for a majority of travel buyers. b. new players, such as Facebook, already in a rela-tionship with Microsoft (active in travel search with bing), and Apple, possibly in partnership with Kayak (or other meta-search sites, like Room Key, with access to a robust travel inventory), are dabbling in travel and can gain traction quickly due to deep pockets and a high level of consumer adoption. likewise, large consumer sites like Amazon, ebay or other consumer-savvy retailers as well as media companies who need to expand their traditional reader base like USA Today or The New York Times may well get in the game. it is not clear which business models they will offer and what kind of control a hotel may have to gain visibility and participate cost effectively. the traditional travel shopping path of the browser-to-search-engine model will likely be diversified with new methods including direct access to travel shopping through mobile de-vices, social sites and through some new search media such as voice-activated (e.g., Apple’s siri, Google’s Majel, Microsoft’s tellme) or map-based models, which lend themselves well to travel planning.
c. the primary source of potential new incremental demand for hotel rooms in north America in the upcoming five-year time horizon (and likely beyond) is through inbound international travelers from the rap-idly growing economies, especially China and india.
Timeframe
Hotel Room Revenue
% through third party intermediaries
Average cost as % revenue
Dominant third party intermediaries
Estimated Distribution Costs
2010 $3,000,000 25% 20% oTA, GDs, Travel agency direct
$150,000
2015 $3,000,000 50% 15% Meta-search, Mobile, social/travel inspira-tion, oTA, GDs, Travel agent direct
$225,000
Hotel Distribution Costsestimated 2010 and 2015 scenarios
Published by the hsMAi FoundAtion 9
Executive Summary
sHIFTInG FoCus FRoM GEnERATInG
REvEnuE To GEnERATInG pRoFIT
wILL BE A CHAnGE FoR MAnY
REvEnuE MAnAGERs, BuT A
usEFuL pERspECTIvE To AppLY To
InvEnToRY AnD RATE DECIsIons.
third party vendors may dominate these markets and train the consumers to use them before hotel brands have a chance to gain recognition through their hotel development efforts in those markets. Whoever gets the Chinese and indian consumers in the habit of using them to book travel to europe and the united states may hold onto that position for a long time be-cause early adopted habits may be hard to break. For the secondary or tertiary u.s. markets that are unlikely to benefit from the inbound global demand, there will be some general improvement in demand in all hotel segments as the economy improves.
d. some third party distribution channels with strong marketing positions may choose to offer services similar to those that current franchise and brand organizations may provide. this may create a new type of model that will compete with the legacy franchise and brand op-erators as a kind of “soft brand” based on the strength of the third party’s ability to (1) maintain a brand pres-ence (2) provide a meaningful reservation contribution (3) maintain quality metrics for consumer evaluation and (4) offer the benefits of frequency/loyalty programs.
5. New Priorities in the Distribution Landscape due to the anticipated rapid growth in consumers’ use
of search, mobile and social tools for travel shopping, planning and booking, a hotel has to become con-versant in the multitude of ways these tools may be utilized. each hotel and hotel company should have a plan for how to leverage the opportunities presented. Given how quickly consumers have adopted mobile and social media tools, the need is immediate to develop strategies for each. taking advantage of the native mobile environment and building functionality that is purpose-built for it will be essential to succeed in this space. Although the current mobile apps focus on “last minute deals,” as mobile access grows, more robust capabilities will be demanded by consumers such as voice-activated or map-based capabilities. hotels will benefit from moving away from offering “cheap deals” and into higher value offers tapping mobile’s unique functionality that lends itself so well to travel planning. Mobile users are not likely to use dozens of travel apps so there will be a shakeout at some point, and hotels have to be sure they make the cut. Monitoring and testing the new travel-specific search models will also be important since they are likely to become another major set of portals through which consumers will explore their travel options. social sites are quickly evolving into sales channels. Consumer review sites, Facebook business and fan pages and travel inspiration/trip planning sites with heavy social components will all offer opportunities to travelers to gather information and then refer them to suppliers. search, mobile and social media tools
will need to be mastered for their role in merchan-dising, as information sources, and as commercial transactional platforms. Costs and benefits have to be monitored every step along the way.
6. Consumer Media and Commoditization of Hotel Rooms
Knowing that a dominant theme being conveyed to the consumer in the current marketplace is that last minute bookings typically result in discounted hotel rooms, hotels have to be mindful of the implications that message sends and reinforces with the consumer. it renders hotel rooms to be a commodity purchase with the primary distinguishing feature being price, with secondary consideration for quality level. When hotels provide “last minute” inventory, they are fueling the spread of this message. in the short term, it can reduce rates and profits, but in the long term, it reinforces the message that it is better to wait until the last minute to book a room to get the best rate, and that there is little difference between any hotel at a given quality level — any hotel will serve the same purpose for the traveler. For the hotelier, this (1) makes forecasting more difficult; (2) lowers rates overall; (3) reduces the volume of high rated business booked further out from arrival; (4) causes consumers to believe that there is little differ-ence between hotel brands; and (5) puts into question the issue of who “owns” the guest. besides causing some hotels to operate with a disproportionate amount of marginally profitable business, on an industrywide level, the brand erosion may be one of the most damaging outcomes of the situation. With brand ero-sion comes the associated marginalization of frequent guest programs that are currently vital to the chains for sustaining a recurring profit stream from a base of repeat customers. With third parties pursuing the same customers as hotels, and even deploying similar tactics (best rate guarantees and loyalty programs), the ques-tion of who controls the guest relationship may strongly affect the value proposition of a brand.
10 An Ah&lA And stR sPeCiAl RePoRt
7. The Transparency of the Internet Although the otA channel may only represent 10%
or less of most major hotel chain demand, due to the prominence and transparency of rates on the internet, along with rate parity guidelines, the rates posted on these sites affect those sold through the channels that bring the other 90% of a hotel’s business. the same is likely to hold true for new media sites and mobile applications. Meeting planners, corporate travel managers, citywide attendees, and others will often check the rates offered online through third parties, and those rates will influence the negotiation of rates sold through all other channels. this is a major depar-ture from the “old days” when the rack rate was the anchor and all other rates keyed off that rate. now, hotels set the highly prominent otA rate and the other rates are likely to cascade from that. the public nature of the otA rate, or for that matter any other rates offered online, along with rate parity terms, also limit a hotel from offering a range of customized rates and/or value packages to sub-segments of its customer base so it seems that there is often a “one-rate-fits-all” pric-ing structure. this undermines the power of marketing which is a discipline built on a foundation that calls for offering relevant products and services with cor-responding rates by segment in order to best meet the needs of each customer group. Rates are often diluted by (1) the pressure to keep prominent online rates as low as possible, (2) the reality that many customers have been trained to believe that he or she will find a lower rate closer to arrival, and (3) a propensity for hotels to think that the demand generated by lower rates will always compensate for the rate reduction.
8. Billboard Effect and Online Attribution Models
the number of factors influencing how a hotel book-ing is consummated is large and untested; there has not been a conclusive study in the lodging industry to determine how to independently credit the source(s) of direct bookings to a hotel or hotel brand. because each hotel or hotel brand has its own set of custom-ers, each needs to examine the websites, media, and other promotional vehicles that are part of the travel shopper’s sales path (there are many billboards) and work on testing which one(s) can be credited with affecting the booking decision. this will likely differ by many variables including customer group, hotel brand, hotel type, season, day-of-week and trip purpose. before deploying significant marketing resources to generate online traffic, deepen engagement and trig-ger bookings, the hotel marketer should decide how much credit to apply to each element of an online marketing plan so the resources are most effectively applied to meet the marketer’s objectives.
9. Optimal Channel Mix
each hotel has an optimal channel mix; this is the case whether the hotel is in the u.s. market or anywhere else globally. it is affected by supply and demand; the number of rooms booked through the channel, and at what room rate; the strategy of each competitor; and the position of each hotel in its marketplace. Most of the hotel business in north America remains a “street corner” business. other than destination hotels and resorts, which have their own competitive dynamic, most hotels in highly populated areas compete with their immediate neighbors. understanding the hotel’s potential in its marketplace will drive its tactical ac-tions and refine the decisions of its management in terms of pricing, marketing and yield management. being mindful of the use of discounting to drive demand and the affect it has on overall AdR is at the heart of achieving an optimal channel mix. improving techniques to systematically evaluate merchandising through every channel will go a long way to improving conversion rates on existing traffic even when incre-mental traffic is not available. if a hotel can accurately set objectives for its optimal channel mix, it is more likely to achieve them through better use of marketing resources and more targeted and decisive actions.
10. The Devil We Know, The Devil We Don’t While it is easy for a hotel to agonize over high-cost
channels or limited demand in a market, knowing the available demand generators, the costs and benefits of each, and which ones are a good fit at any given time is the best defense in times of economic adversity. As long as a hotel has control of its inventory and pricing,
10 An Ah&lA And stR sPeCiAl RePoRt
Published by the hsMAi FoundAtion 11
Executive Summary
one of its most crucial marketing decisions will be about its channel mix, which reflects the way in which that inventory is sold. Riskier even than lowering rates, ceding control of inventory (or access to inventory) — such as offering last room availability, especially for low value business — can do great damage to near- and long-term profits if it is not tightly controlled.
there will be many emerging new distribution op-portunities; some will be booking channels, others will be marketing and referral channels. learning how to assess each opportunity is essential given the rapidly changing nature of the distribution environment. With eyes wide open, a hotel management team has to confront its market position, establish its optimal channel mix and use every tool available to achieve its objective. the mature nature of hotel demand in the u.s. market has to be taken into account and hotels have to realize that with a slow-growing market pie, they will spend most of their time shifting share from their competitors, who at the same time will be trying to do the exact same thing to them. historically, hotels have not focused clearly on their channel mix, have not had the metrics or inclination to manage this way, and have not systematically worked on merchandising techniques to improve conversion, retention and ancil-lary spend in each channel.
leveraging new distribution opportunities, knowing they will primarily facilitate share shift, should put a laser focus on managing demand in lockstep with associated costs. in the absence of buoyant demand, the share a hotel gets of that limited demand has to deliver optimal profit. Placing an emphasis on generating ancillary revenue will be part of the centerpiece of a successful hotel’s revenue strategy. Many channel partners will promise to grow a hotel’s “slice” of the comp set “pie,” but each also takes a bite in exchange for helping. this “bite” may also include less visible costs such as the need to impose deeper discounts on the rate in order to accomplish the desired shift in market share. the hotel’s actions determine the size of its slice and how many bites are left after all channel partners are compensated. in the interest of a sustainable profit stream to support a hotel’s employees, its community, and its customers, how much can a hotel keep for itself?
LEvERAgINg NEW DISTRIBuTION
OPPORTuNITIES, KNOWINg
THEy WILL PRIMARILy fACILITATE
SHARE SHIfT, SHOuLD PuT A LASER
fOCuS ON MANAgINg DEMAND IN
LOCKSTEP WITH ASSOCIATED COSTS.
12 An Ah&lA And stR sPeCiAl RePoRt
12345
FIvE ACTIons A CHAIn/BRAnD CAn TAKE now
invest in and develop internal and external low-cost channels with as much control over rates, inventory and branding as possible. if you can only focus on one new thing internally, get your mobile strategy right.
build up programs to expand high margin ancillary revenue streams through centrally controlled channels and facilitate the same for hotels to supplement efforts at the local level.
hold the line as tightly as possible on costs for existing and emerging channels keeping in mind that a growing percentage of the business going forward will pass through intermediaries prior to arriving at brand-con-trolled channels.
Audit every channel to ensure it is capturing the most incremental business possible from all traffic that passes through it; view all channels through the same multi-channel lens the customers use so the management and development of them is integrated. investigate and develop attribution modeling, examining all channels to understand which touch points are contributing to the bookings. tap the intelligence you have about your customers and apply it extensively at every touch point possible to optimize acquisition, persuasion and retention through customer service and merchandising. this may be the primary advantage a hotel chain can leverage when competing with the many new third parties that have strong adoption in consumer markets but limited knowledge of hotel customer’s personal preferences and stay patterns.
FIvE ACTIons A HoTEL MAnAGER oR ownER CAn TAKE now
determine a hotel’s optimal channel mix and manage to that objective. determine the potential for the hotel based on the nature of market demand, competitive behavior and consumer perception. Monitor the hotel’s ability to manage its channels relative to its competitors in the marketplace as well as new channel opportunities that arise in the market. Compare channels in their ability to shift share and the cost they each incur including transaction fees, commissions, impact on rate and impact on customer engagement.
seek out, develop and invest in channels that help acquire, engage, and retain customers and also create sustainable profit streams.
Guard your most valuable assets: a hotel’s pricing structure, inventory and brand — this applies equally to national branded hotels and independents. evaluate channel opportunities carefully before putting these assets at risk. Price smart.
Conduct a systematic audit of every channel to ensure it is functioning at its peak, that the channel and the processes supporting it are designed for the customers it is best suited to serve, and that its position in the dis-tribution ecosystem makes it accessible and compelling in comparison to its competitors.
12345
Published by the hsMAi FoundAtion 13
Overview and Introduction —Distribution Channel Analysis
Published by the hsMAi FoundAtion 13
HIsToRICAL pERspECTIvE on HospITALITY DIsTRIBuTIon MAnAGEMEnT There have long been interme-diaries in hospitality marketing channels. The one with the lon-gest history is the travel agent. This includes retail agents who dealt with consumers directly and wholesalers who created travel packages including hotel stays. By the end of the 1970s, the travel agency chan-nel used the global distribution systems (GDSs) provided by the airlines to facilitate airline bookings. Hotel booking capability was an add-on along with car rental. Travel agencies found electronic booking less costly to their operation and began to insist that all products be available for them through these channels. In the early 1980s, GDS volume was less than 2% of all hotel volume (about 2 million reservations) and by 1999, had grown to more than 20% (40 million reservations). There were two major players, Sabre from American Airlines and Apollo from United Airlines, and several small ones including System One from Eastern, PARS from TWA, and Datas II from Delta.
In the hotel world, there was an early concern that the airline systems did not have a primary interest in offering hotel bookings through their GDSs because the systems were initially de-signed to serve airlines only. Offering hotels for
sale was a necessary evil to the airlines. In order to accommodate travel agent demands and to be where the bookings were, hotel chains had to build expensive interfaces to each of the major GDS systems and ultimately joined together to build The Hotel Industry Switch Company (THISCO) to lower costs and provide more rate and inventory control to the hotel chains. The independents benefited because the third party reservation vendors they used could also use the THISCO switch to gain GDS access. Later, Wiz-com, by Cendant, offered similar GDS connectiv-ity to the hotel industry. The first significant efforts to reach consumers directly, without the travel agent as mediator came in 1994, when TravelWeb by THISCO debuted as the hotel industry’s first consumer website featuring Hyatt Hotels. By 1996, Mar-riott, Hilton, and Hyatt each had its own brand-specific website; the volume of bookings on these sites skyrocketed and the priority from the time of launch had to be managing a high volume of transactions and inquiries.
Distribution Channel Analysis: A Guide
for Hotels is written for hoteliers and
all who support the hotel industry,
to help them manage profitable
businesses in a challenging economic time and
in a dynamic distribution landscape. The insights
conveyed will yield a host of benefits for the
owners, brands and management that sustain
the industry and are the engine for its growth.
The findings are intended to fuel that growth,
and in so doing, will support all those who
gain residual benefit today, and in the future
by facilitating participation in a thriving and
healthy industry.
14 An Ah&lA And stR sPeCiAl RePoRt
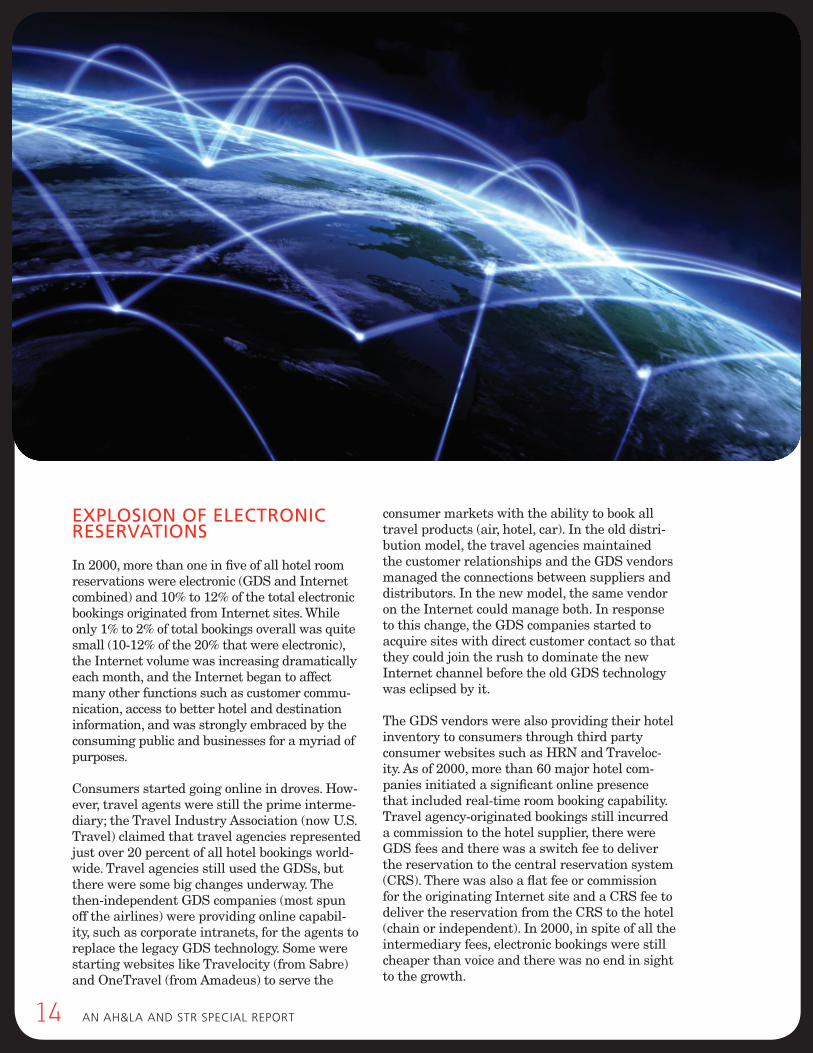
ExpLosIon oF ELECTRonIC REsERvATIons In 2000, more than one in five of all hotel room reservations were electronic (GDS and Internet combined) and 10% to 12% of the total electronic bookings originated from Internet sites. While only 1% to 2% of total bookings overall was quite small (10-12% of the 20% that were electronic), the Internet volume was increasing dramatically each month, and the Internet began to affect many other functions such as customer commu-nication, access to better hotel and destination information, and was strongly embraced by the consuming public and businesses for a myriad of purposes. Consumers started going online in droves. How-ever, travel agents were still the prime interme-diary; the Travel Industry Association (now U.S. Travel) claimed that travel agencies represented just over 20 percent of all hotel bookings world-wide. Travel agencies still used the GDSs, but there were some big changes underway. The then-independent GDS companies (most spun off the airlines) were providing online capabil-ity, such as corporate intranets, for the agents to replace the legacy GDS technology. Some were starting websites like Travelocity (from Sabre) and OneTravel (from Amadeus) to serve the
consumer markets with the ability to book all travel products (air, hotel, car). In the old distri-bution model, the travel agencies maintained the customer relationships and the GDS vendors managed the connections between suppliers and distributors. In the new model, the same vendor on the Internet could manage both. In response to this change, the GDS companies started to acquire sites with direct customer contact so that they could join the rush to dominate the new Internet channel before the old GDS technology was eclipsed by it. The GDS vendors were also providing their hotel inventory to consumers through third party consumer websites such as HRN and Traveloc-ity. As of 2000, more than 60 major hotel com-panies initiated a significant online presence that included real-time room booking capability. Travel agency-originated bookings still incurred a commission to the hotel supplier, there were GDS fees and there was a switch fee to deliver the reservation to the central reservation system (CRS). There was also a flat fee or commission for the originating Internet site and a CRS fee to deliver the reservation from the CRS to the hotel (chain or independent). In 2000, in spite of all the intermediary fees, electronic bookings were still cheaper than voice and there was no end in sight to the growth.
Published by the hsMAi FoundAtion 15
Overview and Introduction – Distribution Channel Analysis
To put the pace of growth into perspective, GDS volume as a percentage of total reservations from 1980 to 2000 multiplied 10 times in 20 years. In 2004, while GDS volume was still rising, Internet volume became explosive, having multiplied (also as a percentage of total bookings) approximately 15 times in only 5 years between 1999 and 2004.
By 2005, the industry was well into the “e-com-merce era”. There were so many types of electronic bookings and associated fees for each that no one could assume any longer that if a booking was transmitted electronically, it must be less costly to deliver. While trying to be more search engine friendly, the large hotel brands were still strug-gling with website architecture that could keep up with the ever-increasing volume of visitors for bookings, information and other activities. Look-to-book ratios which were 100s to 1 in 2005, but started a dramatic ascent that has not yet sub-sided.1 Concurrently, individual hotels, whether chain-affiliated or not, were being driven to make themselves known in the crowded and noisy space of the booming Internet bazaar.
Emerging from 2005 to 2006 was the advent of new sites that traded on dialogue and exchange of ideas and information. Predicted as far back as April 1999 in the book Cluetrain Manifesto,2 the authors saw the Internet not primarily as a shopping mall, but rather as a collection of “water coolers” where conversation dominated the nature of exchange, not just cash trading for products or services. It took more than five years for the online consumers to create the “conversa-tion economy,3” but by 2008, this underlying foun-dation for the hospitality distribution networks was coming into focus and developing rapidly. In the 2008 to 2009 timeframe, there were hundreds of websites that were dependent on consumer dialogue and thousands of interactive discus-sions. There was still plenty of e-commerce, but it is in the context of shared experience, particu-larly when examining the travel networks. Many sites entirely driven by e-commerce in 2005 were now hurriedly adding community elements to encourage visitors to expand their information gathering and talk to each other. They provided 1Pegasus (successor to thisCo) reported look-to-book ratios moved from 100s to 1 for consumer websites in the 2004-2006 timeframe, to 1,000 to 1 in 2007, to 3,000-4,000 to 1 in 2011, with some sites seeing close to 100,000 to 1 ratios. Gds ratios are still in the 100s to 1 range.2levine, locke, searls, Weinberger, Cluetrain Manifesto, Perseus books, 1999.3Armano, david, “It’s the Conversation Economy, Stupid”, businessWeek.com, April 9, 2007.
the opportunity to evaluate travel suppliers, offer suggestions for travel to specific destina-tions or share relevant real-time information like flight delays or weather conditions at particular airports.
The period from 2009 to 2011 was dominated by dramatic growth in the use of social sites for engagement, conversation and, also, transactions. Facebook’s influence on consumers worldwide and the widespread adoption of consumer review sites has made social media a common stop in the travel booking sales path. The entry of the major search players into the travel industry and the sudden shift by consumers to mobile, along with new technologies that facilitate access to on-line content for travel, such as voice and mapping technologies, will create another transforma-tion in the 2012-2015 timeframe. These changes may be driven even more rapidly by a recently discovered and voracious appetite to partici-pate in the travel vertical by large media and consumer product giants such as Apple, Google, Facebook, and Microsoft competing alongside the large existing travel players such as Expedia and Priceline.
THE CuRREnT IssuEs
The Internet has fostered the growth of many new distribution channels and the merging of transaction and interaction-based sites. Each of these offers opportunities and carries costs. At a difficult economic time when rates are not improving commensurate with rising demand, every revenue center and cost in the mix is being scrutinized; in spite of all the data factored into revenue and channel management tools, hotels have not had the business intelligence or the an-alytical models needed to analyze their business on a channel level. The torrent of new channels has not abated, and with the aggressive entry into travel in 2011 of some media and technology giants such as Google, Apple and Facebook, along with many new aspiring startups in the meta-search, online travel agency, mobile, and social media space, hotels can hardly keep up.
16 An Ah&lA And stR sPeCiAl RePoRt
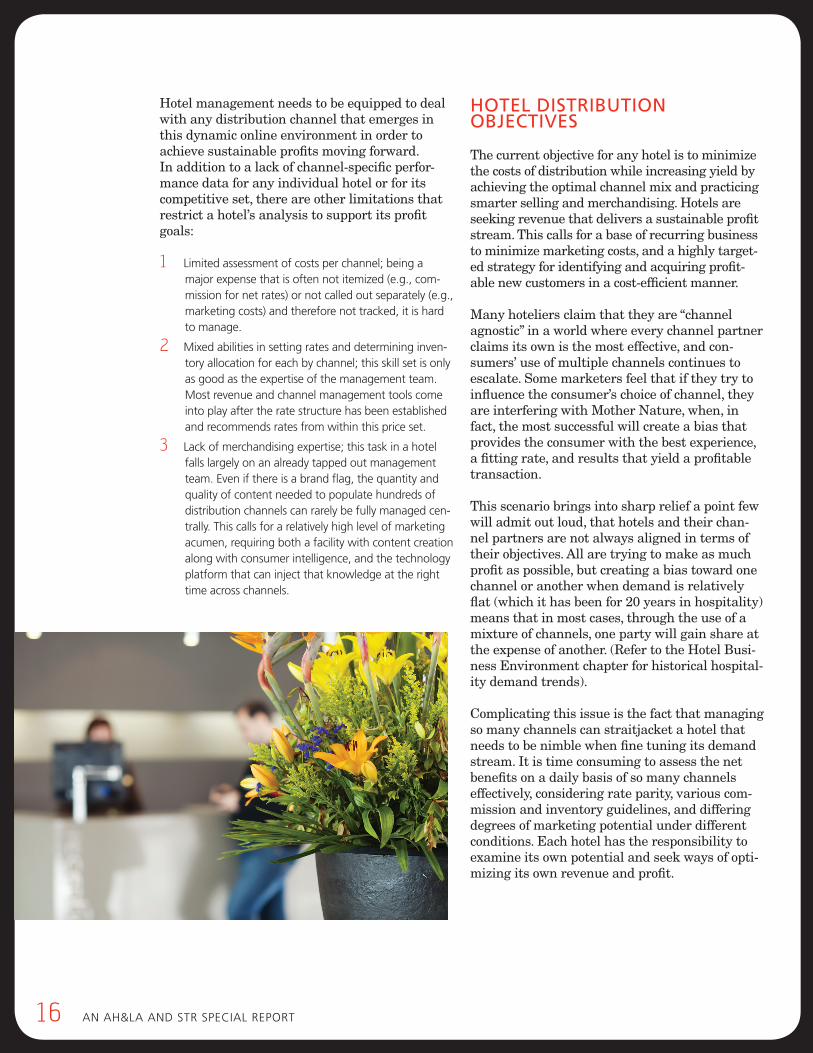
Hotel management needs to be equipped to deal with any distribution channel that emerges in this dynamic online environment in order to achieve sustainable profits moving forward.In addition to a lack of channel-specific perfor-mance data for any individual hotel or for its competitive set, there are other limitations that restrict a hotel’s analysis to support its profit goals:
1 limited assessment of costs per channel; being a major expense that is often not itemized (e.g., com-mission for net rates) or not called out separately (e.g., marketing costs) and therefore not tracked, it is hard to manage.
2 Mixed abilities in setting rates and determining inven-tory allocation for each by channel; this skill set is only as good as the expertise of the management team. Most revenue and channel management tools come into play after the rate structure has been established and recommends rates from within this price set.
3 lack of merchandising expertise; this task in a hotel falls largely on an already tapped out management team. even if there is a brand flag, the quantity and quality of content needed to populate hundreds of distribution channels can rarely be fully managed cen-trally. this calls for a relatively high level of marketing acumen, requiring both a facility with content creation along with consumer intelligence, and the technology platform that can inject that knowledge at the right time across channels.
HoTEL DIsTRIBuTIon oBJECTIvEs
The current objective for any hotel is to minimize the costs of distribution while increasing yield by achieving the optimal channel mix and practicing smarter selling and merchandising. Hotels are seeking revenue that delivers a sustainable profit stream. This calls for a base of recurring business to minimize marketing costs, and a highly target-ed strategy for identifying and acquiring profit-able new customers in a cost-efficient manner.
Many hoteliers claim that they are “channel agnostic” in a world where every channel partner claims its own is the most effective, and con-sumers’ use of multiple channels continues to escalate. Some marketers feel that if they try to influence the consumer’s choice of channel, they are interfering with Mother Nature, when, in fact, the most successful will create a bias that provides the consumer with the best experience, a fitting rate, and results that yield a profitable transaction.
This scenario brings into sharp relief a point few will admit out loud, that hotels and their chan-nel partners are not always aligned in terms of their objectives. All are trying to make as much profit as possible, but creating a bias toward one channel or another when demand is relatively flat (which it has been for 20 years in hospitality) means that in most cases, through the use of a mixture of channels, one party will gain share at the expense of another. (Refer to the Hotel Busi-ness Environment chapter for historical hospital-ity demand trends).
Complicating this issue is the fact that managing so many channels can straitjacket a hotel that needs to be nimble when fine tuning its demand stream. It is time consuming to assess the net benefits on a daily basis of so many channels effectively, considering rate parity, various com-mission and inventory guidelines, and differing degrees of marketing potential under different conditions. Each hotel has the responsibility to examine its own potential and seek ways of opti-mizing its own revenue and profit.
Overview and Introduction – Distribution Channel Analysis
This book discusses the effects of channel mix on profitability and
what the industry can expect in the near term in the distribution
landscape. It reviews the size and structure of the hotel industry at
a high level, with respect to hotel performance and its use of dis-
tribution channels. It also drills down to issues of distribution costs
and benefits, price elasticity, and the evolving roles of marketing,
revenue management and distribution strategy in a dynamic and
volatile online environment.
When it comes to making channel mix decisions,it requires much more than choosing between di-rect channels or third party channels, since eachcategory carries costs and varying degrees ofbenefit. It is advisable to favor the ones (direct orthird party) with revenue streams that yield sus-tainable profit for the hotel. The advent of manynew so-called “direct” connections may produce amixture of high- and low-profit opportunities. Be-coming skilled at assessing which ones — with-out regard for their connectivity platform — willdeliver results at a profit is the challenge in thecurrent environment where channel prolifera-tion is the norm.
The increases in rates that usually accompanyrising demand may be slow to materialize; infact, it is likely to take years. But in the mean-time, in the face of deferred renovations andrepairs and a slowdown in new development, theindustry is driven to squeeze as much lemonadefrom this lemon as possible.
The hotel industry is in a revenue bind at thismoment and it forces a close examination ofevery opportunity to recover the value lost by somany hotels during the recession—real estatevalue, brand fees, lifetime value of the customerbase, employment and tax levels to add value tothe local community.
This is about arming every hotel with the toolsto manage more profitably. Appropriate productsand services offered at a price that makes senseto customers allow hotels to operate profitablyand maintain sustainable revenue streams.Although it may take a significantly different approach by hoteliers to pricing, monitoring pro-duction, as well as measuring and benchmarkingresults, it will take a dramatic change to get dra-matically improved results. And if making thesechanges inoculate the hotel industry againstthe next downturn, it will be good for customers,good for owners, good for management, and goodfor the long-term health of the hotel industry.
Published by the hsMAi FoundAtion 17
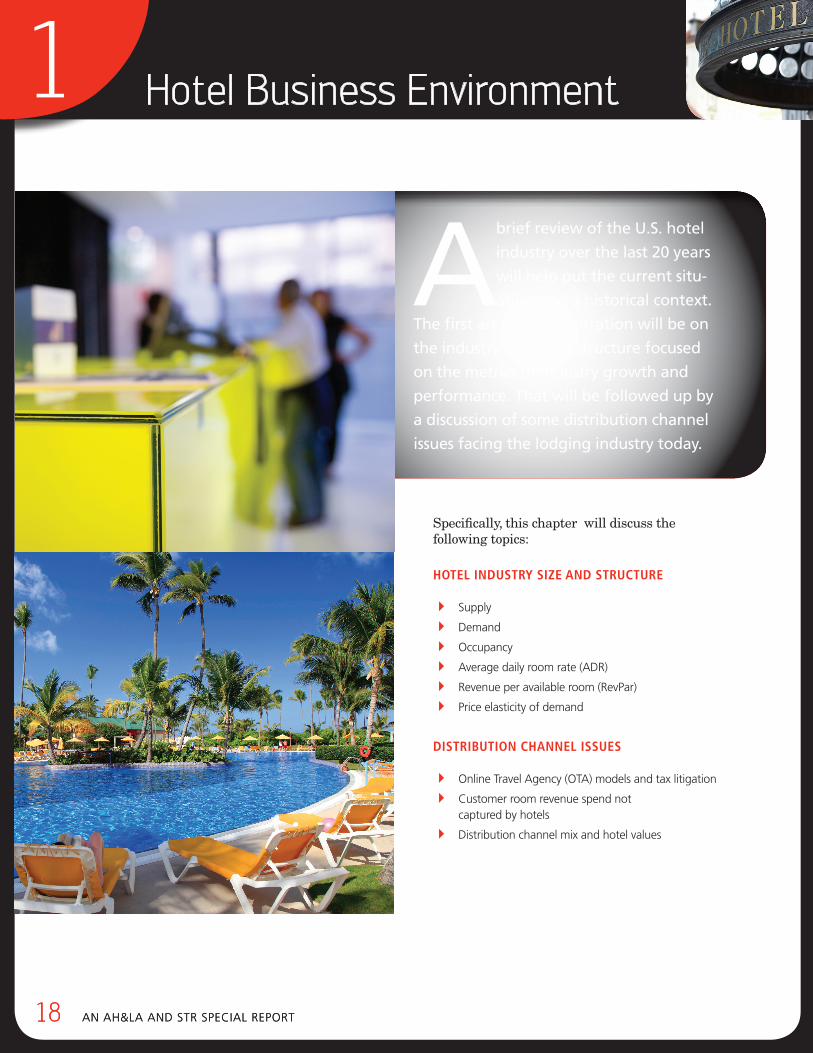
18 AN AH&LA ANd STR SpeciAL RepoRT
Hotel Business Environment1
18 AN AH&LA ANd STR SpeciAL RepoRT
Specifically, this chapter will discuss the following topics:
Hotel Industry sIze and structure
4 Supply
4 demand
4 occupancy
4 Average daily room rate (AdR)
4 Revenue per available room (Revpar)
4 price elasticity of demand
dIstrIbutIon cHannel Issues
4 online Travel Agency (oTA) models and tax litigation
4 customer room revenue spend not captured by hotels
4 distribution channel mix and hotel values
Abrief review of the U.S. hotel
industry over the last 20 years
will help put the current situ-
ation into a historical context.
The first area of concentration will be on
the industry’s size and structure focused
on the metrics of industry growth and
performance. That will be followed up by
a discussion of some distribution channel
issues facing the lodging industry today.
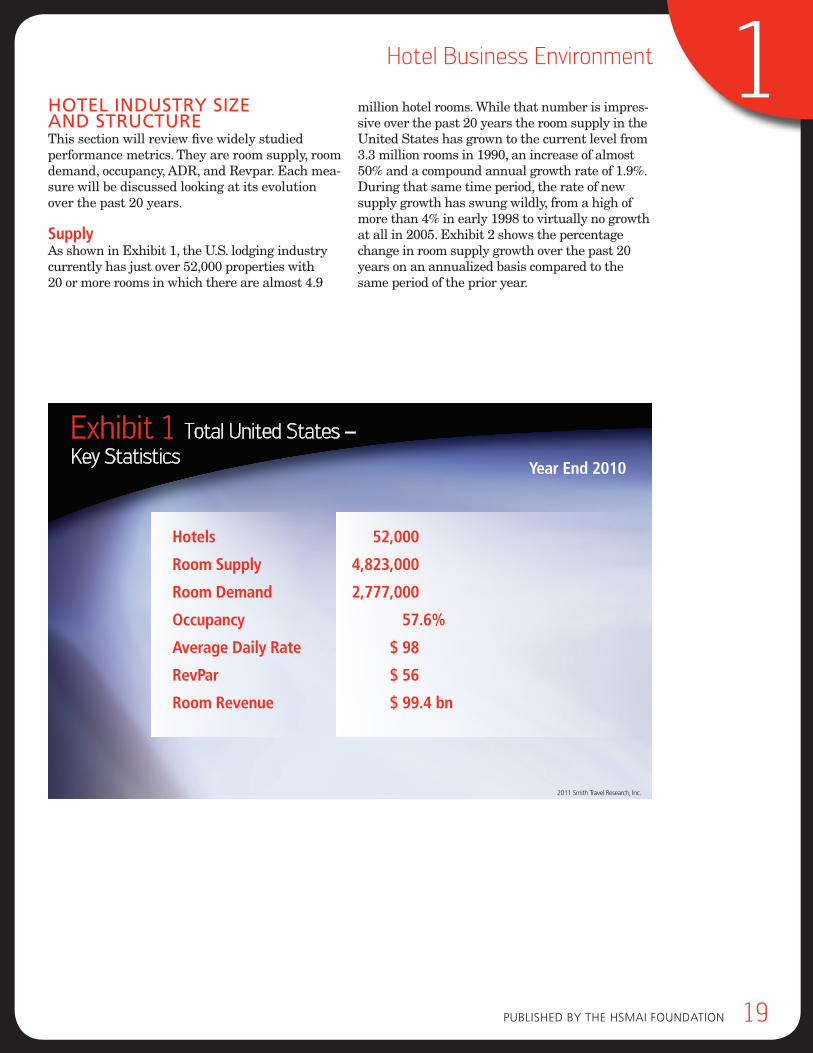
pubLiSHed by THe HSMAi FouNdATioN 19
1Hotel Business Environment
HoTel IndUSTry SIze And STrUcTUreThis section will review five widely studied performance metrics. They are room supply, room demand, occupancy, ADR, and Revpar. Each mea-sure will be discussed looking at its evolution over the past 20 years.
supplyAs shown in Exhibit 1, the U.S. lodging industry currently has just over 52,000 properties with 20 or more rooms in which there are almost 4.9
million hotel rooms. While that number is impres-sive over the past 20 years the room supply in the United States has grown to the current level from 3.3 million rooms in 1990, an increase of almost 50% and a compound annual growth rate of 1.9%. During that same time period, the rate of new supply growth has swung wildly, from a high of more than 4% in early 1998 to virtually no growth at all in 2005. Exhibit 2 shows the percentage change in room supply growth over the past 20 years on an annualized basis compared to the same period of the prior year.
Exhibit 1 Total United States –
Key Statistics
2011 Smith Travel Research, Inc.
Hotels 52,000
Room Supply 4,823,000
Room Demand 2,777,000
Occupancy 57.6%
Average Daily Rate $ 98
RevPar $ 56
Room Revenue $ 99.4 bn
Year End 2010
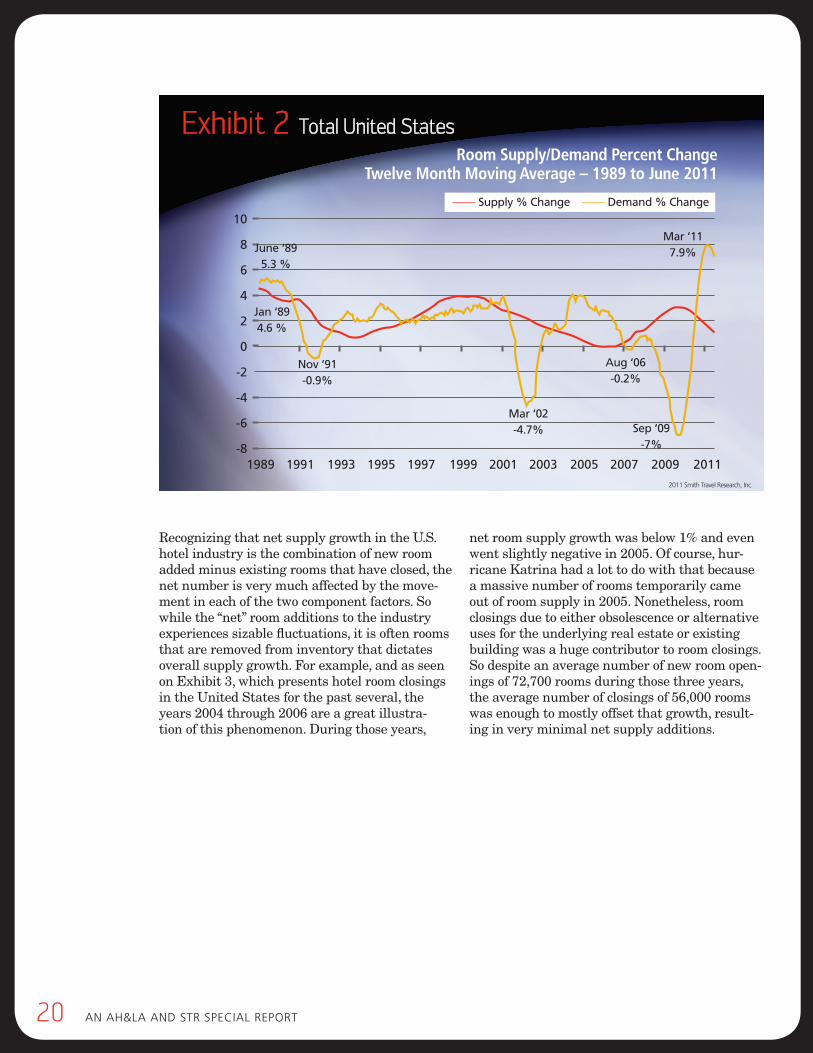
20 AN AH&LA ANd STR SpeciAL RepoRT
Exhibit 2 Total United States
10
8
6
4
2
0
-2
-4
-6
-81989 1991 1993 1995 1997 1999 2001 2003 2005 2007 2009 2011
Room Supply/Demand Percent ChangeTwelve Month Moving Average – 1989 to June 2011
—— Supply % Change —— Demand % Change
2011 Smith Travel Research, Inc.
June ‘895.3 %
Jan ‘894.6 %
Nov ‘91-0.9%
Mar ‘02-4.7%
Aug ‘06-0.2%
Sep ‘09-7%
Mar ‘117.9%
Recognizing that net supply growth in the U.S. hotel industry is the combination of new room added minus existing rooms that have closed, the net number is very much affected by the move-ment in each of the two component factors. So while the “net” room additions to the industry experiences sizable fluctuations, it is often rooms that are removed from inventory that dictates overall supply growth. For example, and as seen on Exhibit 3, which presents hotel room closings in the United States for the past several, the years 2004 through 2006 are a great illustra-tion of this phenomenon. During those years,
net room supply growth was below 1% and even went slightly negative in 2005. Of course, hur-ricane Katrina had a lot to do with that because a massive number of rooms temporarily came out of room supply in 2005. Nonetheless, room closings due to either obsolescence or alternative uses for the underlying real estate or existing building was a huge contributor to room closings. So despite an average number of new room open-ings of 72,700 rooms during those three years, the average number of closings of 56,000 rooms was enough to mostly offset that growth, result-ing in very minimal net supply additions.
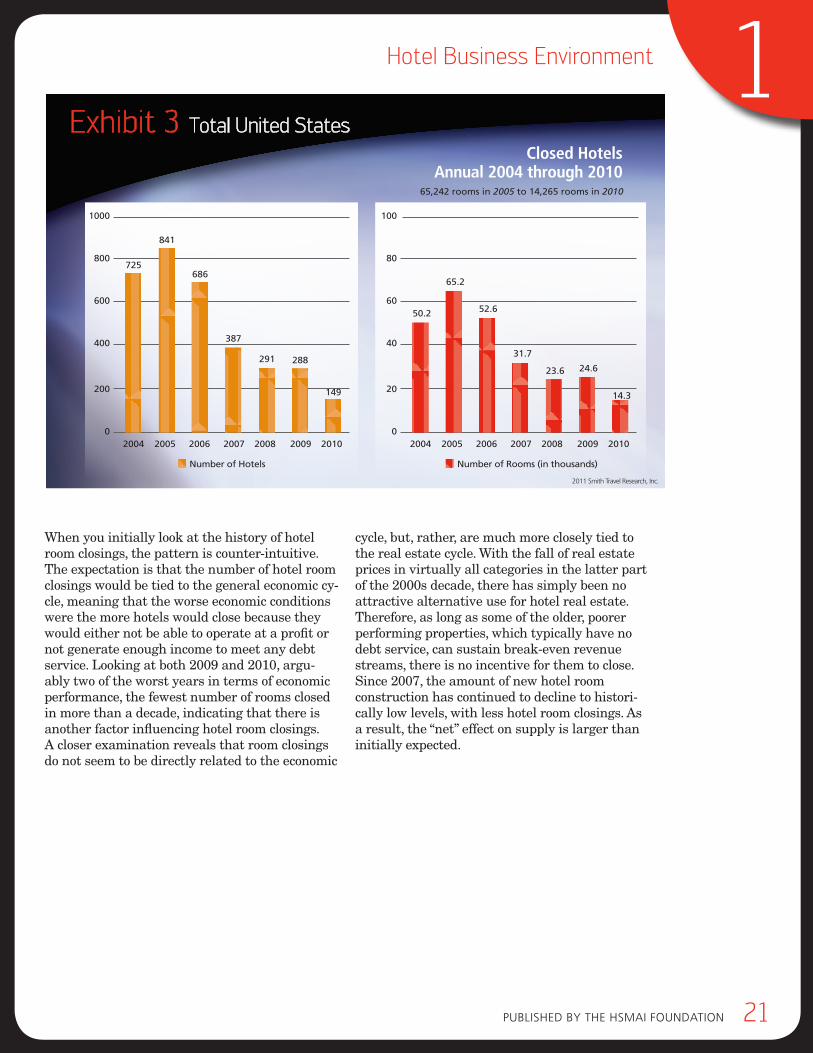
pubLiSHed by THe HSMAi FouNdATioN 21
1Hotel Business Environment
When you initially look at the history of hotel room closings, the pattern is counter-intuitive. The expectation is that the number of hotel room closings would be tied to the general economic cy-cle, meaning that the worse economic conditions were the more hotels would close because they would either not be able to operate at a profit or not generate enough income to meet any debt service. Looking at both 2009 and 2010, argu-ably two of the worst years in terms of economic performance, the fewest number of rooms closed in more than a decade, indicating that there is another factor influencing hotel room closings. A closer examination reveals that room closings do not seem to be directly related to the economic
cycle, but, rather, are much more closely tied to the real estate cycle. With the fall of real estate prices in virtually all categories in the latter part of the 2000s decade, there has simply been no attractive alternative use for hotel real estate. Therefore, as long as some of the older, poorer performing properties, which typically have no debt service, can sustain break-even revenue streams, there is no incentive for them to close. Since 2007, the amount of new hotel room construction has continued to decline to histori-cally low levels, with less hotel room closings. As a result, the “net” effect on supply is larger than initially expected.
Exhibit 3 Total United States
Closed HotelsAnnual 2004 through 2010
2004 2005 2006 2007 2008 2009 2010
Number of Hotels
725
841
686
387
291 288
149
1000
800
600
400
200
0
100
80
60
40
20
0 2004 2005 2006 2007 2008 2009 2010
Number of Rooms (in thousands)
50.2
65.2
52.6
31.7
23.6 24.6
14.3
65,242 rooms in 2005 to 14,265 rooms in 2010
2011 Smith Travel Research, Inc.
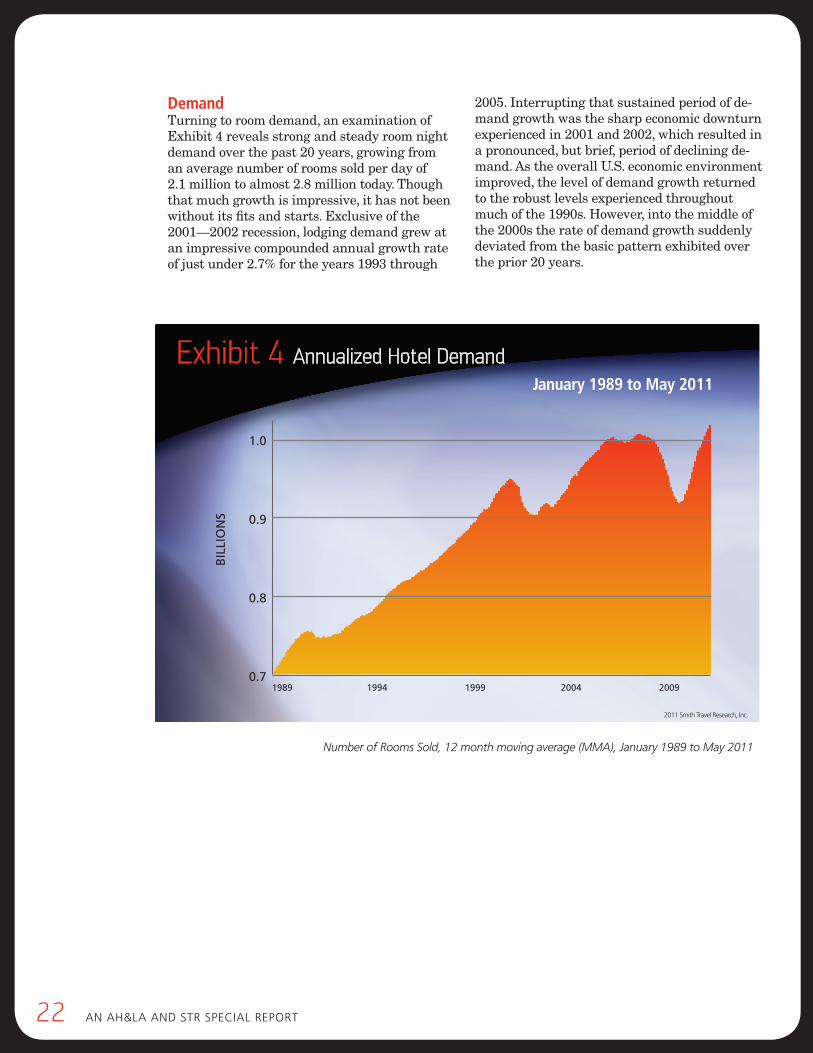
22 AN AH&LA ANd STR SpeciAL RepoRT
demandTurning to room demand, an examination of Exhibit 4 reveals strong and steady room night demand over the past 20 years, growing from an average number of rooms sold per day of 2.1 million to almost 2.8 million today. Though that much growth is impressive, it has not been without its fits and starts. Exclusive of the 2001—2002 recession, lodging demand grew at an impressive compounded annual growth rate of just under 2.7% for the years 1993 through
2005. Interrupting that sustained period of de-mand growth was the sharp economic downturn experienced in 2001 and 2002, which resulted in a pronounced, but brief, period of declining de-mand. As the overall U.S. economic environment improved, the level of demand growth returned to the robust levels experienced throughout much of the 1990s. However, into the middle of the 2000s the rate of demand growth suddenly deviated from the basic pattern exhibited over the prior 20 years.
Exhibit 4 Annualized Hotel Demand
1.0
0.9
0.8
0.71989 1994 1999 2004 2009
January 1989 to May 2011
2011 Smith Travel Research, Inc.
Bil
lio
ns
Number of Rooms Sold, 12 month moving average (MMA), January 1989 to May 2011
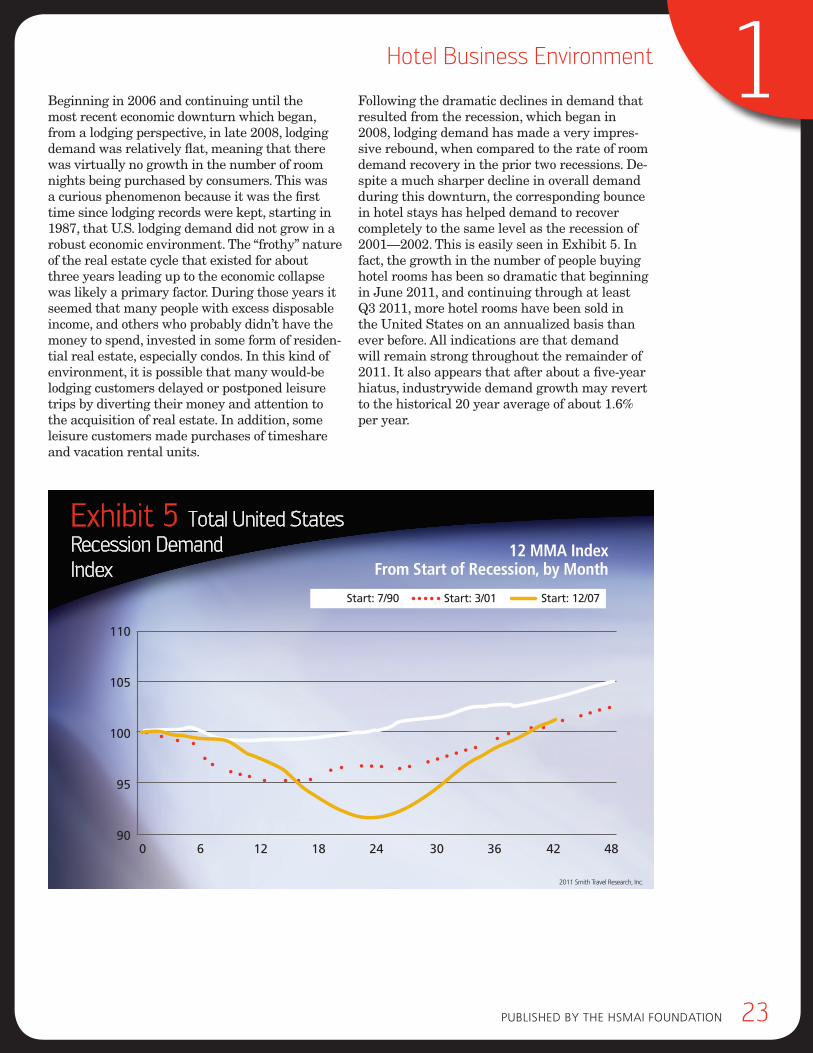
pubLiSHed by THe HSMAi FouNdATioN 23
1Hotel Business Environment
Beginning in 2006 and continuing until the most recent economic downturn which began, from a lodging perspective, in late 2008, lodging demand was relatively flat, meaning that there was virtually no growth in the number of room nights being purchased by consumers. This was a curious phenomenon because it was the first time since lodging records were kept, starting in 1987, that U.S. lodging demand did not grow in a robust economic environment. The “frothy” nature of the real estate cycle that existed for about three years leading up to the economic collapse was likely a primary factor. During those years it seemed that many people with excess disposable income, and others who probably didn’t have the money to spend, invested in some form of residen-tial real estate, especially condos. In this kind of environment, it is possible that many would-be lodging customers delayed or postponed leisure trips by diverting their money and attention to the acquisition of real estate. In addition, some leisure customers made purchases of timeshare and vacation rental units.
Following the dramatic declines in demand that resulted from the recession, which began in 2008, lodging demand has made a very impres-sive rebound, when compared to the rate of room demand recovery in the prior two recessions. De-spite a much sharper decline in overall demand during this downturn, the corresponding bounce in hotel stays has helped demand to recover completely to the same level as the recession of 2001—2002. This is easily seen in Exhibit 5. In fact, the growth in the number of people buying hotel rooms has been so dramatic that beginning in June 2011, and continuing through at least Q3 2011, more hotel rooms have been sold in the United States on an annualized basis than ever before. All indications are that demand will remain strong throughout the remainder of 2011. It also appears that after about a five-year hiatus, industrywide demand growth may revert to the historical 20 year average of about 1.6% per year.
Exhibit 5 Total United States
Recession Demand
Index
110
105
100
95
900 6 12 18 24 30 36 42 48
12 MMA IndexFrom Start of Recession, by Month
Start: 7/90 Start: 3/01 Start: 12/07
2011 Smith Travel Research, Inc.
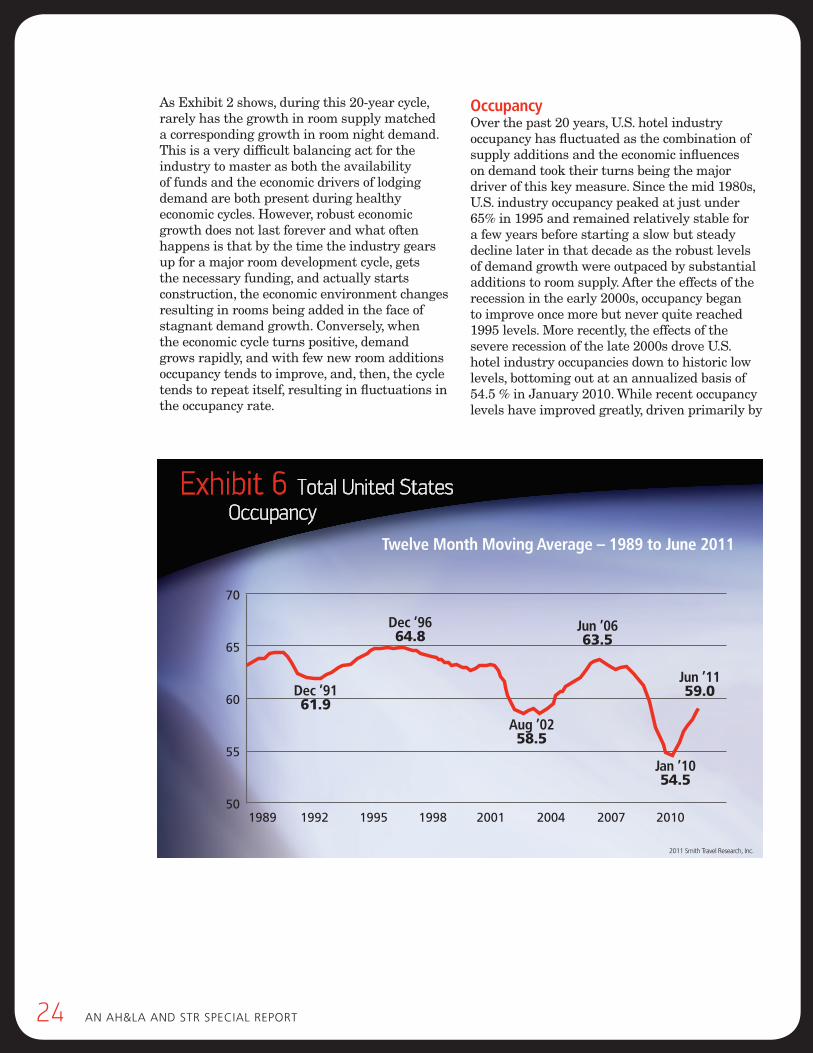
24 AN AH&LA ANd STR SpeciAL RepoRT
As Exhibit 2 shows, during this 20-year cycle, rarely has the growth in room supply matched a corresponding growth in room night demand. This is a very difficult balancing act for the industry to master as both the availability of funds and the economic drivers of lodging demand are both present during healthy economic cycles. However, robust economic growth does not last forever and what often happens is that by the time the industry gears up for a major room development cycle, gets the necessary funding, and actually starts construction, the economic environment changes resulting in rooms being added in the face of stagnant demand growth. Conversely, when the economic cycle turns positive, demand grows rapidly, and with few new room additions occupancy tends to improve, and, then, the cycle tends to repeat itself, resulting in fluctuations in the occupancy rate.
occupancyOver the past 20 years, U.S. hotel industry occupancy has fluctuated as the combination of supply additions and the economic influences on demand took their turns being the major driver of this key measure. Since the mid 1980s, U.S. industry occupancy peaked at just under 65% in 1995 and remained relatively stable for a few years before starting a slow but steady decline later in that decade as the robust levels of demand growth were outpaced by substantial additions to room supply. After the effects of the recession in the early 2000s, occupancy began to improve once more but never quite reached 1995 levels. More recently, the effects of the severe recession of the late 2000s drove U.S. hotel industry occupancies down to historic low levels, bottoming out at an annualized basis of 54.5 % in January 2010. While recent occupancy levels have improved greatly, driven primarily by
Exhibit 6 Total United States
Occupancy
70
65
60
55
501989 1992 1995 1998 2001 2004 2007 2010
Twelve Month Moving Average – 1989 to June 2011
2011 Smith Travel Research, Inc.
Dec ’9161.9
Dec ’9664.8
Aug ’0258.5
Jun ’0663.5
Jun ’1159.0
Jan ’1054.5
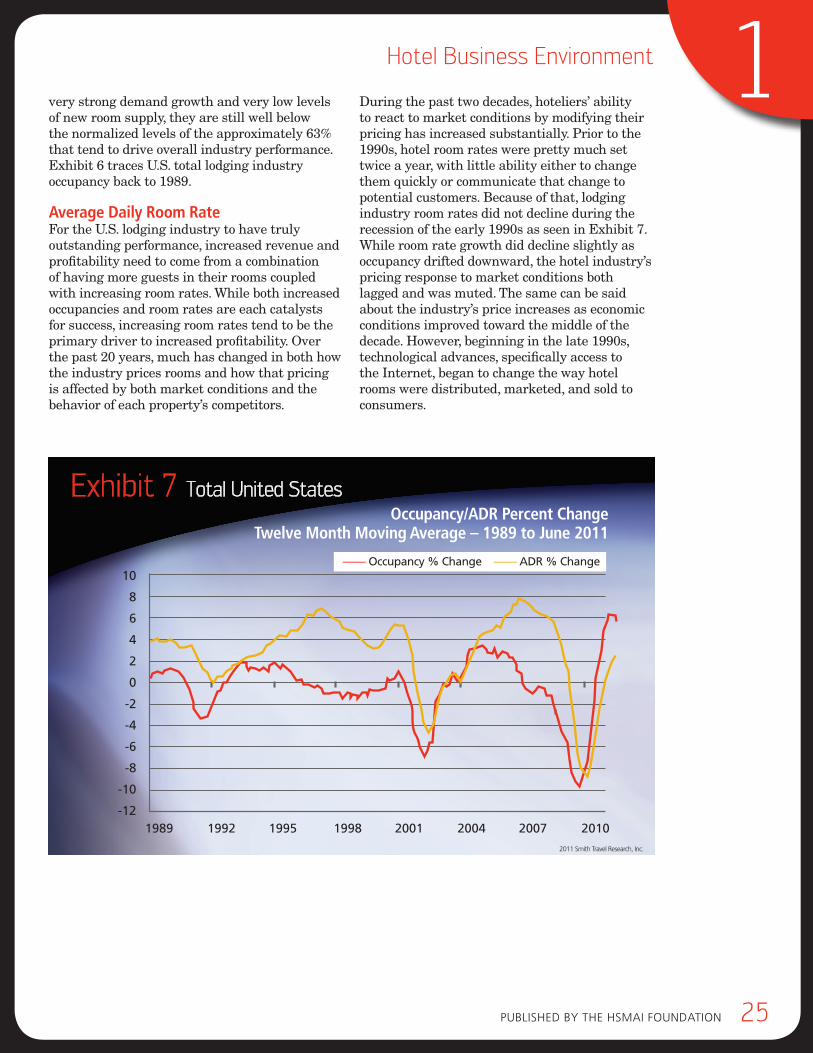
pubLiSHed by THe HSMAi FouNdATioN 25
1Hotel Business Environment
very strong demand growth and very low levels of new room supply, they are still well below the normalized levels of the approximately 63% that tend to drive overall industry performance. Exhibit 6 traces U.S. total lodging industry occupancy back to 1989.
average daily room rateFor the U.S. lodging industry to have truly outstanding performance, increased revenue and profitability need to come from a combination of having more guests in their rooms coupled with increasing room rates. While both increased occupancies and room rates are each catalysts for success, increasing room rates tend to be the primary driver to increased profitability. Over the past 20 years, much has changed in both how the industry prices rooms and how that pricing is affected by both market conditions and the behavior of each property’s competitors.
During the past two decades, hoteliers’ ability to react to market conditions by modifying their pricing has increased substantially. Prior to the 1990s, hotel room rates were pretty much set twice a year, with little ability either to change them quickly or communicate that change to potential customers. Because of that, lodging industry room rates did not decline during the recession of the early 1990s as seen in Exhibit 7. While room rate growth did decline slightly as occupancy drifted downward, the hotel industry’s pricing response to market conditions both lagged and was muted. The same can be said about the industry’s price increases as economic conditions improved toward the middle of the decade. However, beginning in the late 1990s, technological advances, specifically access to the Internet, began to change the way hotel rooms were distributed, marketed, and sold to consumers.
Exhibit 7 Total United States
10
8
6
4
2
0
-2
-4
-6
-8
-10
-121989 1992 1995 1998 2001 2004 2007 2010
Occupancy/ADR Percent ChangeTwelve Month Moving Average – 1989 to June 2011
—— Occupancy % Change —— ADR % Change
2011 Smith Travel Research, Inc.
26 AN AH&LA ANd STR SpeciAL RepoRT
While the lodging industry’s transition to a much more transparent world of pricing was inevitable, the move toward this trend was greatly acceler-ated in 2001. In that year, the combination of an economic downturn and events on 9/11 conspired to accelerate the process toward Internet book-ings in ways that might have been different under different economic conditions. In addition to the changing nature of how potential guests were able to search for and book rooms, the Inter-net gave hotel operators the increased ability to modify their room rates quickly and frequently. In this new world, hoteliers were now able to modify their price offerings in reaction to both market conditions at the same time technologi-cal advances began to give operators a window into their competitors’ actions. Toward the end of 2001, this increased ability to modify pricing resulted in rapidly declining room rates as oc-cupancies fell. The speed with which hotels were collectively able to react to market conditions is clearly seen in Exhibit 6. On the flip side, once in-dustry performance recovered in the middle part of that decade, this new-found ability to modify
room rates seemed to help the industry increase room rates in that robust economic cycle.
As the U.S. economy began to slip into a period of economic malaise again in 2008, hoteliers again reacted quickly to the changing environment. With occupancy declining as room night demand began to grow sluggish, the industrywide drop in pricing was even more immediate and severe than in either of the prior two downturns. In fact, the decline in average room rate reported industrywide was the sharpest percentage drop reported in many decades. In addition to the downward pressure on pricing created by the U.S. economy, another factor was also at play; the increasing tendency of consumers to book rooms at the last minute. With historically low occupan-cies, many rooms remained unfilled, apparently driving hoteliers to embrace new tactics to fill them. Chief among these decision criteria was to offer increasingly large discounts off the price for shorter lead time bookings. This, coupled with immediate visibility to the price behavior of a hotel’s competitors sometimes created a down-ward spiral in pricing. Each property’s ability to recover from and change the booking patterns and pricing behavior that existed since late 2008 will be a key factor affecting the magnitude of the industry’s recovery going forward. Through the first half of 2011, the factors just described have kept room rate increases low, relatively speaking. As Exhibit 8 shows, room rate growth clearly lags behind the occupancy recovery of the past several years. Indeed, this is the first time in the 20-year cycle that the percent increase in pricing has been consistently below the pace of the occupancy recovery.
Indeed, THIS IS THe fIrST TIme
In THe 20-yeAr cycle THAT
THe percenT IncreASe In
prIcIng HAS been conSIS-
TenTly below THe pAce of
THe occUpAncy recovery.
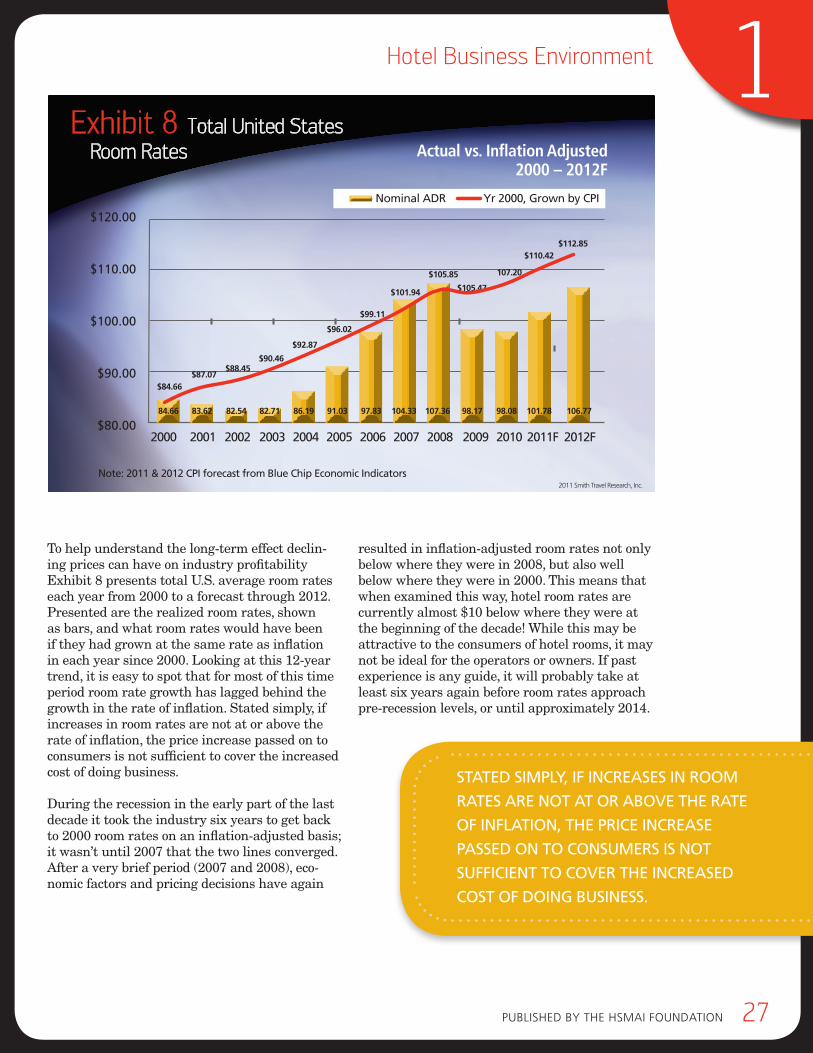
pubLiSHed by THe HSMAi FouNdATioN 27
1Hotel Business Environment
Exhibit 8 Total United States
Room Rates
$120.00
$110.00
$100.00
$90.00
$80.002000 2001 2002 2003 2004 2005 2006 2007 2008 2009 2010 2011F 2012F
Actual vs. Inflation Adjusted2000 – 2012F
—— Nominal ADR —— Yr 2000, Grown by CPI
2011 Smith Travel Research, Inc.
84.66
$84.66
83.6283.62 82.54 82.71 86.19 91.03 104.33 107.3697.83 98.17 98.08 101.78 106.77
$87.07$88.45
$90.46
$92.87
$96.02
$99.11
$101.94
$105.85
$105.47
107.20
$110.42$112.85
Note: 2011 & 2012 CPI forecast from Blue Chip Economic Indicators
To help understand the long-term effect declin-ing prices can have on industry profitability Exhibit 8 presents total U.S. average room rates each year from 2000 to a forecast through 2012. Presented are the realized room rates, shown as bars, and what room rates would have been if they had grown at the same rate as inflation in each year since 2000. Looking at this 12-year trend, it is easy to spot that for most of this time period room rate growth has lagged behind the growth in the rate of inflation. Stated simply, if increases in room rates are not at or above the rate of inflation, the price increase passed on to consumers is not sufficient to cover the increased cost of doing business.
During the recession in the early part of the last decade it took the industry six years to get back to 2000 room rates on an inflation-adjusted basis; it wasn’t until 2007 that the two lines converged. After a very brief period (2007 and 2008), eco-nomic factors and pricing decisions have again
resulted in inflation-adjusted room rates not only below where they were in 2008, but also well below where they were in 2000. This means that when examined this way, hotel room rates are currently almost $10 below where they were at the beginning of the decade! While this may be attractive to the consumers of hotel rooms, it may not be ideal for the operators or owners. If past experience is any guide, it will probably take at least six years again before room rates approach pre-recession levels, or until approximately 2014.
STATed SImply, If IncreASeS In room
rATeS Are noT AT or Above THe rATe
of InflATIon, THe prIce IncreASe
pASSed on To conSUmerS IS noT
SUffIcIenT To cover THe IncreASed
coST of doIng bUSIneSS.
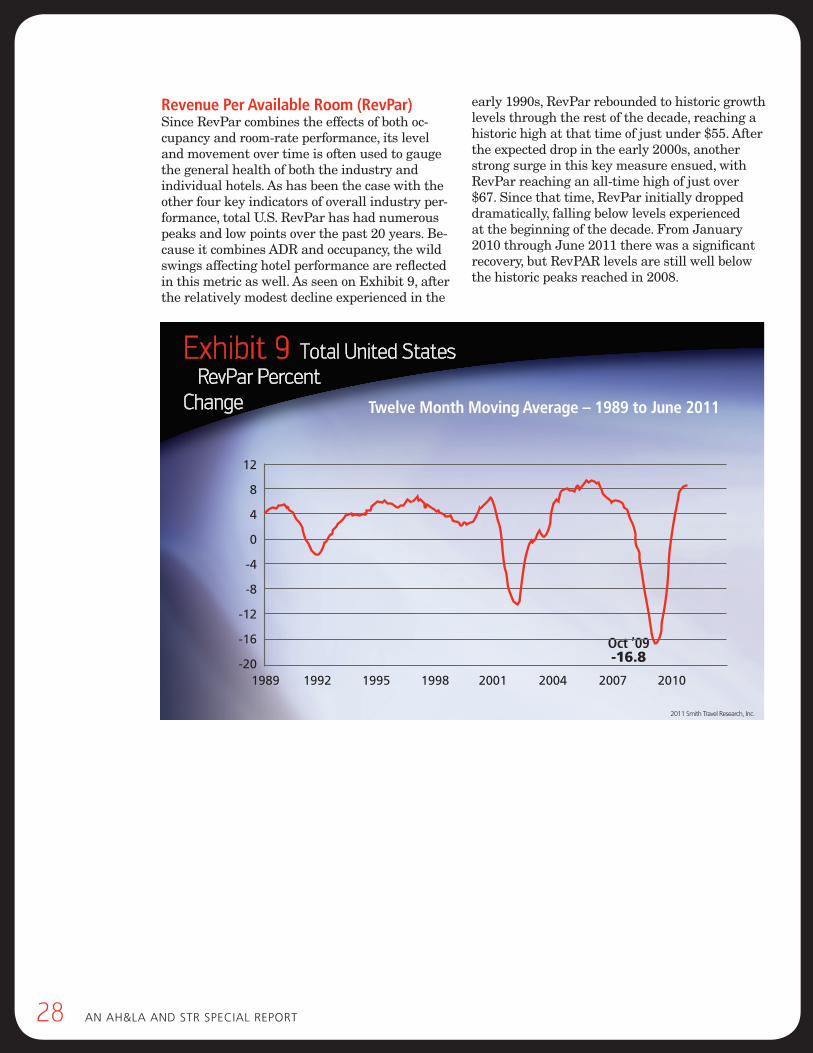
28 AN AH&LA ANd STR SpeciAL RepoRT
revenue Per available room (revPar)Since RevPar combines the effects of both oc-cupancy and room-rate performance, its level and movement over time is often used to gauge the general health of both the industry and individual hotels. As has been the case with the other four key indicators of overall industry per-formance, total U.S. RevPar has had numerous peaks and low points over the past 20 years. Be-cause it combines ADR and occupancy, the wild swings affecting hotel performance are reflected in this metric as well. As seen on Exhibit 9, after the relatively modest decline experienced in the
early 1990s, RevPar rebounded to historic growth levels through the rest of the decade, reaching a historic high at that time of just under $55. After the expected drop in the early 2000s, another strong surge in this key measure ensued, with RevPar reaching an all-time high of just over $67. Since that time, RevPar initially dropped dramatically, falling below levels experienced at the beginning of the decade. From January 2010 through June 2011 there was a significant recovery, but RevPAR levels are still well below the historic peaks reached in 2008.
Exhibit 9 Total United States
RevPar Percent
Change
12
8
4
0
-4
-8
-12
-16
-201989 1992 1995 1998 2001 2004 2007 2010
Twelve Month Moving Average – 1989 to June 2011
2011 Smith Travel Research, Inc.
Oct ’09-16.8
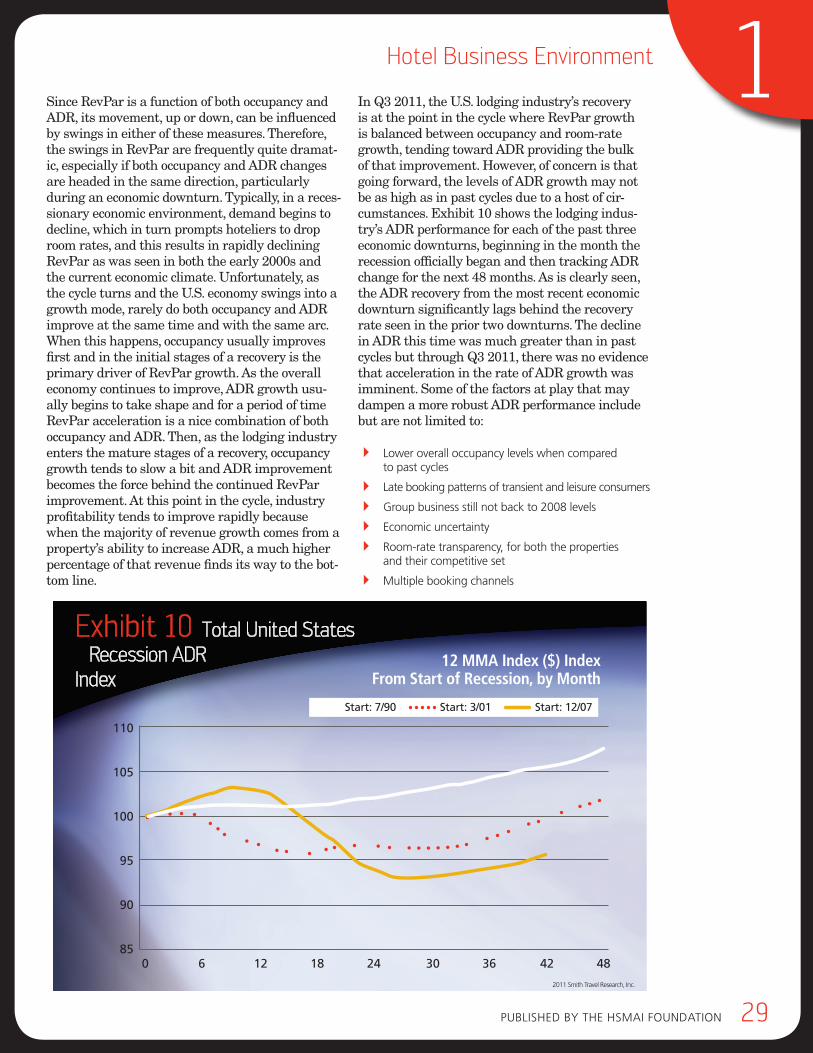
pubLiSHed by THe HSMAi FouNdATioN 29
1Hotel Business Environment
Since RevPar is a function of both occupancy and ADR, its movement, up or down, can be influenced by swings in either of these measures. Therefore, the swings in RevPar are frequently quite dramat-ic, especially if both occupancy and ADR changes are headed in the same direction, particularly during an economic downturn. Typically, in a reces-sionary economic environment, demand begins to decline, which in turn prompts hoteliers to drop room rates, and this results in rapidly declining RevPar as was seen in both the early 2000s and the current economic climate. Unfortunately, as the cycle turns and the U.S. economy swings into a growth mode, rarely do both occupancy and ADR improve at the same time and with the same arc. When this happens, occupancy usually improves first and in the initial stages of a recovery is the primary driver of RevPar growth. As the overall economy continues to improve, ADR growth usu-ally begins to take shape and for a period of time RevPar acceleration is a nice combination of both occupancy and ADR. Then, as the lodging industry enters the mature stages of a recovery, occupancy growth tends to slow a bit and ADR improvement becomes the force behind the continued RevPar improvement. At this point in the cycle, industry profitability tends to improve rapidly because when the majority of revenue growth comes from a property’s ability to increase ADR, a much higher percentage of that revenue finds its way to the bot-tom line.
In Q3 2011, the U.S. lodging industry’s recovery is at the point in the cycle where RevPar growth is balanced between occupancy and room-rate growth, tending toward ADR providing the bulk of that improvement. However, of concern is that going forward, the levels of ADR growth may not be as high as in past cycles due to a host of cir-cumstances. Exhibit 10 shows the lodging indus-try’s ADR performance for each of the past three economic downturns, beginning in the month the recession officially began and then tracking ADR change for the next 48 months. As is clearly seen, the ADR recovery from the most recent economic downturn significantly lags behind the recovery rate seen in the prior two downturns. The decline in ADR this time was much greater than in past cycles but through Q3 2011, there was no evidence that acceleration in the rate of ADR growth was imminent. Some of the factors at play that may dampen a more robust ADR performance include but are not limited to:
4 Lower overall occupancy levels when compared to past cycles
4 Late booking patterns of transient and leisure consumers
4 Group business still not back to 2008 levels
4 economic uncertainty
4 Room-rate transparency, for both the properties and their competitive set
4 Multiple booking channels
Exhibit 10 Total United States
Recession ADR
Index
110
105
100
95
90
850 6 12 18 24 30 36 42 48
12 MMA Index ($) IndexFrom Start of Recession, by Month
Start: 7/90 Start: 3/01 Start: 12/07
2011 Smith Travel Research, Inc.
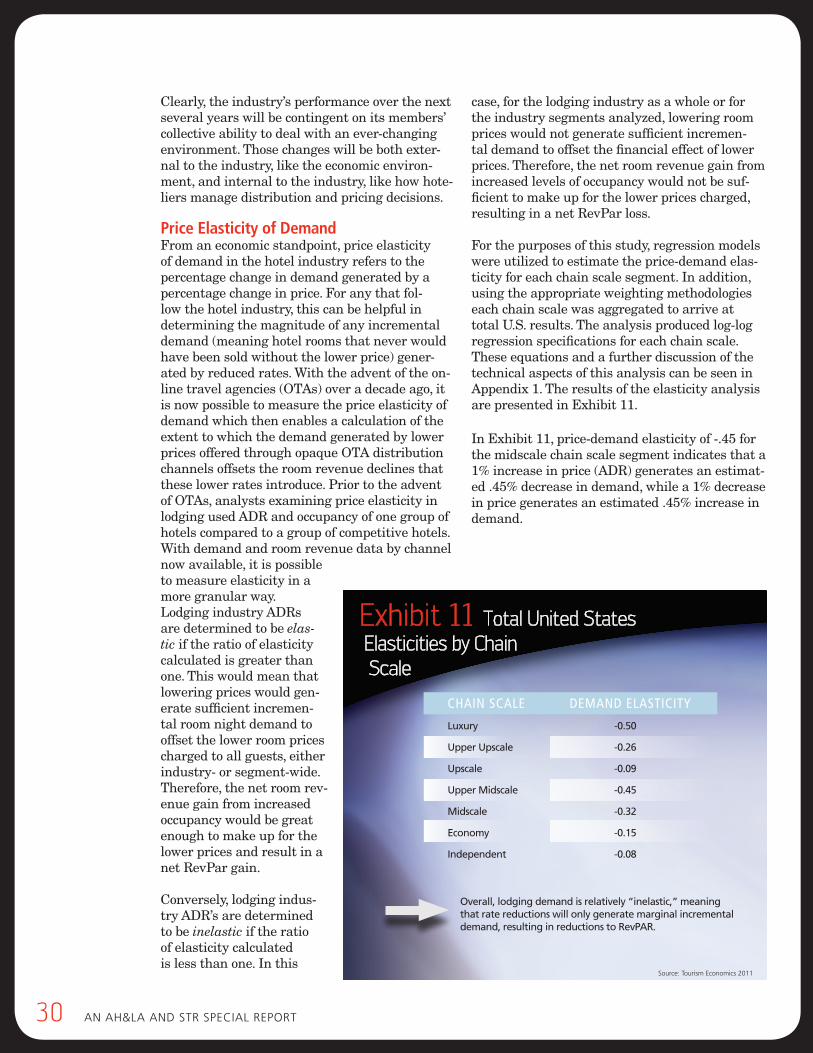
30 AN AH&LA ANd STR SpeciAL RepoRT
Clearly, the industry’s performance over the next several years will be contingent on its members’ collective ability to deal with an ever-changing environment. Those changes will be both exter-nal to the industry, like the economic environ-ment, and internal to the industry, like how hote-liers manage distribution and pricing decisions.
Price elasticity of demandFrom an economic standpoint, price elasticity of demand in the hotel industry refers to the percentage change in demand generated by a percentage change in price. For any that fol-low the hotel industry, this can be helpful in determining the magnitude of any incremental demand (meaning hotel rooms that never would have been sold without the lower price) gener-ated by reduced rates. With the advent of the on-line travel agencies (OTAs) over a decade ago, it is now possible to measure the price elasticity of demand which then enables a calculation of the extent to which the demand generated by lower prices offered through opaque OTA distribution channels offsets the room revenue declines that these lower rates introduce. Prior to the advent of OTAs, analysts examining price elasticity in lodging used ADR and occupancy of one group of hotels compared to a group of competitive hotels. With demand and room revenue data by channel now available, it is possible to measure elasticity in a more granular way. Lodging industry ADRs are determined to be elas-tic if the ratio of elasticity calculated is greater than one. This would mean that lowering prices would gen-erate sufficient incremen-tal room night demand to offset the lower room prices charged to all guests, either industry- or segment-wide. Therefore, the net room rev-enue gain from increased occupancy would be great enough to make up for the lower prices and result in a net RevPar gain.
Conversely, lodging indus-try ADR’s are determined to be inelastic if the ratio of elasticity calculated is less than one. In this
case, for the lodging industry as a whole or for the industry segments analyzed, lowering room prices would not generate sufficient incremen-tal demand to offset the financial effect of lower prices. Therefore, the net room revenue gain from increased levels of occupancy would not be suf-ficient to make up for the lower prices charged, resulting in a net RevPar loss.
For the purposes of this study, regression models were utilized to estimate the price-demand elas-ticity for each chain scale segment. In addition, using the appropriate weighting methodologies each chain scale was aggregated to arrive at total U.S. results. The analysis produced log-log regression specifications for each chain scale. These equations and a further discussion of the technical aspects of this analysis can be seen in Appendix 1. The results of the elasticity analysis are presented in Exhibit 11.
In Exhibit 11, price-demand elasticity of -.45 for the midscale chain scale segment indicates that a 1% increase in price (ADR) generates an estimat-ed .45% decrease in demand, while a 1% decrease in price generates an estimated .45% increase in demand.
Exhibit 11 Total United States
Elasticities by Chain
Scale
Source: Tourism Economics 2011
Overall, lodging demand is relatively “inelastic,” meaning that rate reductions will only generate marginal incremental demand, resulting in reductions to RevPAR.
Chain SCale DemanD elaStiCity
Luxury -0.50
Upper Upscale -0.26
Upscale -0.09
Upper Midscale -0.45
Midscale -0.32
Economy -0.15
Independent -0.08
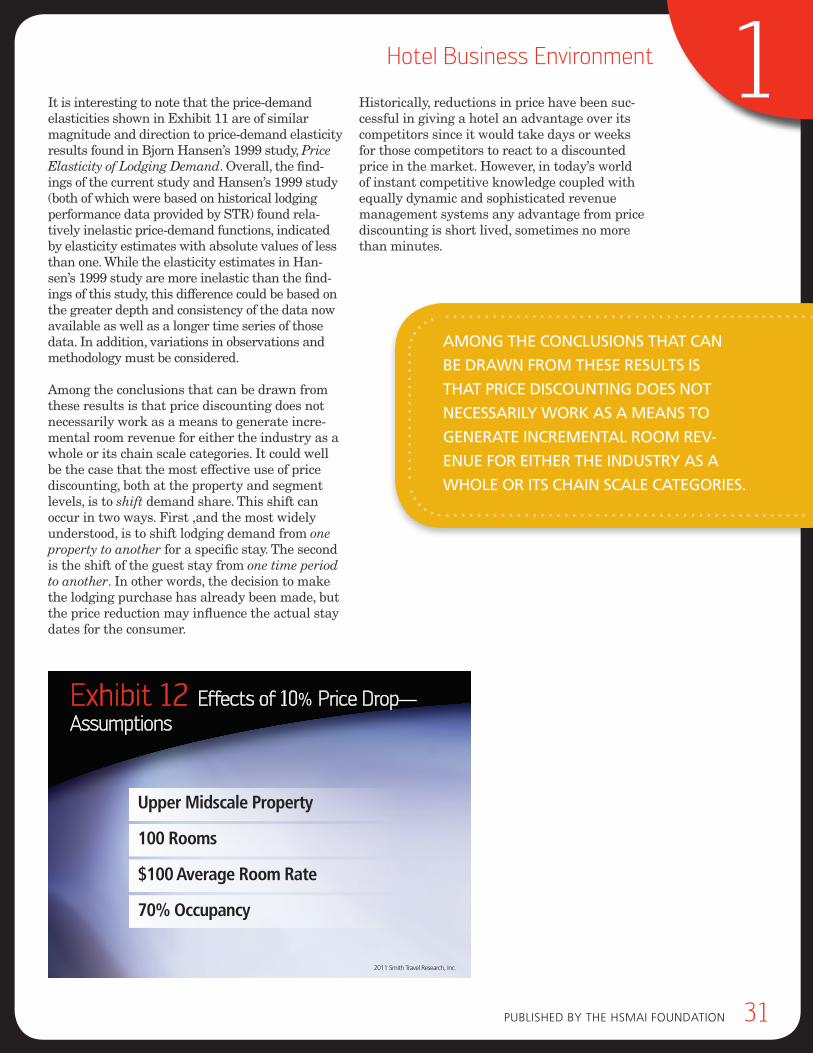
pubLiSHed by THe HSMAi FouNdATioN 31
1Hotel Business Environment
It is interesting to note that the price-demand elasticities shown in Exhibit 11 are of similar magnitude and direction to price-demand elasticity results found in Bjorn Hansen’s 1999 study, Price Elasticity of Lodging Demand. Overall, the find-ings of the current study and Hansen’s 1999 study (both of which were based on historical lodging performance data provided by STR) found rela-tively inelastic price-demand functions, indicated by elasticity estimates with absolute values of less than one. While the elasticity estimates in Han-sen’s 1999 study are more inelastic than the find-ings of this study, this difference could be based on the greater depth and consistency of the data now available as well as a longer time series of those data. In addition, variations in observations and methodology must be considered.
Among the conclusions that can be drawn from these results is that price discounting does not necessarily work as a means to generate incre-mental room revenue for either the industry as a whole or its chain scale categories. It could well be the case that the most effective use of price discounting, both at the property and segment levels, is to shift demand share. This shift can occur in two ways. First ,and the most widely understood, is to shift lodging demand from one property to another for a specific stay. The second is the shift of the guest stay from one time period to another. In other words, the decision to make the lodging purchase has already been made, but the price reduction may influence the actual stay dates for the consumer.
Historically, reductions in price have been suc-cessful in giving a hotel an advantage over its competitors since it would take days or weeks for those competitors to react to a discounted price in the market. However, in today’s world of instant competitive knowledge coupled with equally dynamic and sophisticated revenue management systems any advantage from price discounting is short lived, sometimes no more than minutes.
Among THe conclUSIonS THAT cAn
be drAwn from THeSe reSUlTS IS
THAT prIce dIScoUnTIng doeS noT
neceSSArIly work AS A meAnS To
generATe IncremenTAl room rev-
enUe for eITHer THe IndUSTry AS A
wHole or ITS cHAIn ScAle cATegorIeS.
Exhibit 12 Effects of 10% Price Drop— Assumptions
2011 Smith Travel Research, Inc.
Upper Midscale Property
100 Rooms
$100 Average Room Rate
70% Occupancy

32 AN AH&LA ANd STR SpeciAL RepoRT
While the price elasticity analysis was done at the chain scale and not the property level, it can still be illustrative, especially from an educa-tional standpoint, to apply the finding at the property level. As such, the case study illustrates price reductions at an upper midscale hotel (see assumptions in Exhibit 12).
In addition, the assumption is that the property is trying to determine the net effect of a 10% price reduction on overall RevPar. Applying the demand elasticity results of -0.45 (refer to Ex-
hibit 11) for upper midscale hotels to the above assumptions yields the outcome presented in Exhibit 13.
As seen in Exhibit 13, the 10% reduction in price yields a 4.5% increase in room night demand for the property. In actual performance metrics, that action reduced the price of the rooms from $100 to $90, resulting in selling 73 rooms instead of the 70 sold at the original room rate. (Note: the result of a 4.5% demand growth was 3.15 round-ed down to three additional rooms).
Exhibit 13 Net Effect of Rate Reduction Upper Midscale:
Effect of a 10% Rate Reduction
% Change in Net Rev. -6.1%
6%
4%
2%
0%
-2%
-4%
-6%
-8%
-10%
-12%
2011 Smith Travel Research, Inc.
ADR, -10.0%
Demand, 4.5%
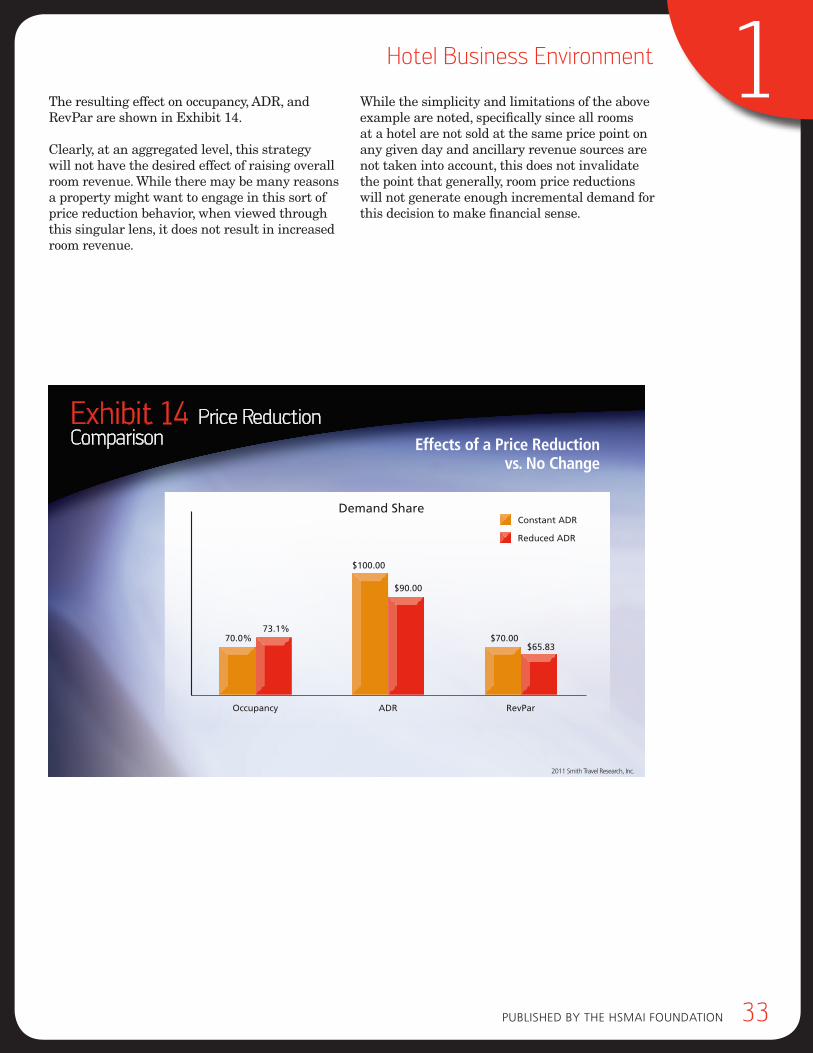
pubLiSHed by THe HSMAi FouNdATioN 33
1Hotel Business Environment
The resulting effect on occupancy, ADR, and RevPar are shown in Exhibit 14.
Clearly, at an aggregated level, this strategy will not have the desired effect of raising overall room revenue. While there may be many reasons a property might want to engage in this sort of price reduction behavior, when viewed through this singular lens, it does not result in increased room revenue.
While the simplicity and limitations of the above example are noted, specifically since all rooms at a hotel are not sold at the same price point on any given day and ancillary revenue sources are not taken into account, this does not invalidate the point that generally, room price reductions will not generate enough incremental demand for this decision to make financial sense.
Exhibit 14 Price Reduction Comparison Effects of a Price Reduction
vs. No Change
2011 Smith Travel Research, Inc.
Occupancy
70.0%73.1%
ADR
$100.00
$90.00
RevPar
$70.00$65.83
Constant ADR
Reduced ADR
Demand Share
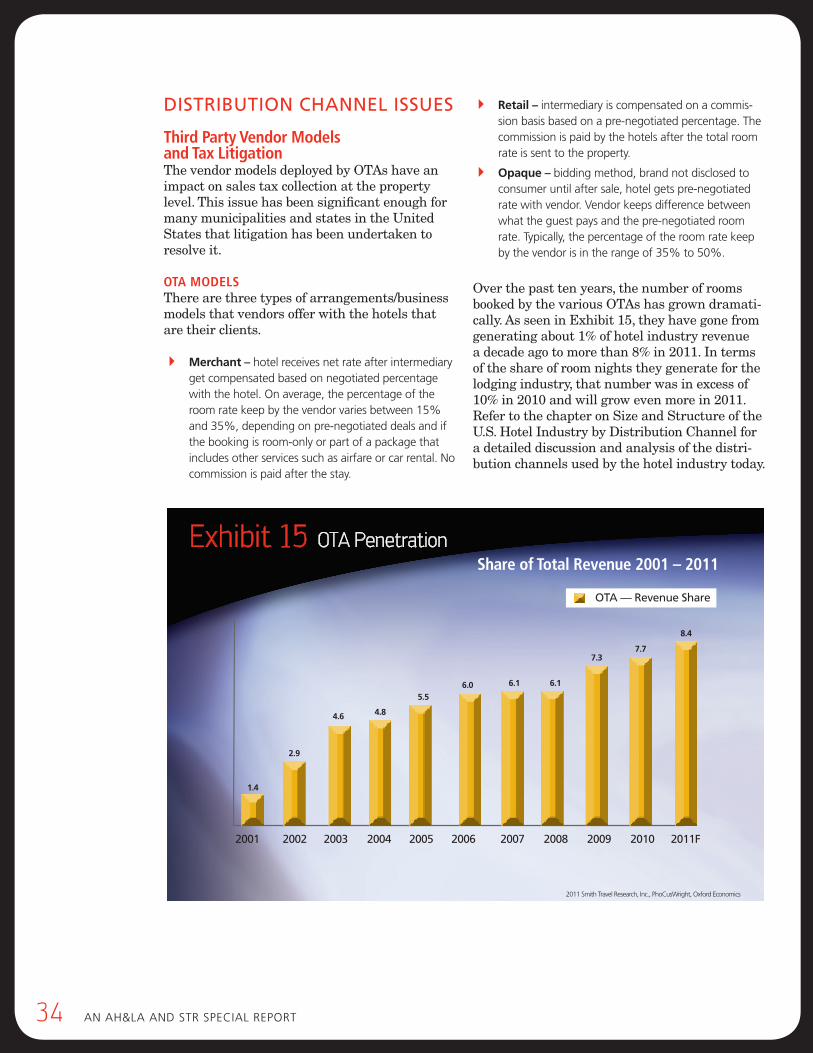
34 AN AH&LA ANd STR SpeciAL RepoRT
dISTrIbUTIon cHAnnel ISSUeS
third Party Vendor Models and tax litigationThe vendor models deployed by OTAs have an impact on sales tax collection at the property level. This issue has been significant enough for many municipalities and states in the United States that litigation has been undertaken to resolve it.
ota Models There are three types of arrangements/business models that vendors offer with the hotels that are their clients.
4 Merchant – hotel receives net rate after intermediary get compensated based on negotiated percentage with the hotel. on average, the percentage of the room rate keep by the vendor varies between 15% and 35%, depending on pre-negotiated deals and if the booking is room-only or part of a package that includes other services such as airfare or car rental. No commission is paid after the stay.
4 Retail – intermediary is compensated on a commis-sion basis based on a pre-negotiated percentage. The commission is paid by the hotels after the total room rate is sent to the property.
4 Opaque – bidding method, brand not disclosed to consumer until after sale, hotel gets pre-negotiated rate with vendor. Vendor keeps difference between what the guest pays and the pre-negotiated room rate. Typically, the percentage of the room rate keep by the vendor is in the range of 35% to 50%.
Over the past ten years, the number of rooms booked by the various OTAs has grown dramati-cally. As seen in Exhibit 15, they have gone from generating about 1% of hotel industry revenue a decade ago to more than 8% in 2011. In terms of the share of room nights they generate for the lodging industry, that number was in excess of 10% in 2010 and will grow even more in 2011. Refer to the chapter on Size and Structure of the U.S. Hotel Industry by Distribution Channel for a detailed discussion and analysis of the distri-bution channels used by the hotel industry today.
Exhibit 15 OTA Penetration
2001 2002 2003 2004 2005 2006 2007 2008 2009 2010 2011F
Share of Total Revenue 2001 – 2011
OTA — Revenue Share
2011 Smith Travel Research, Inc., PhoCusWright, Oxford Economics
1.4
2.9
4.6 4.8
5.56.0 6.1 6.1
7.37.7
8.4
pubLiSHed by THe HSMAi FouNdATioN 35
1Hotel Business Environment
Both the merchant and opaque models are sold as net rates, which means that the commission is removed from the rate prior to a guest stay and never incurred as a direct expense paid from the hotel to the vendor. Because of this rate structure, there is a portion of the guest payment that is not reflected anywhere on hotel financial statements. In 2010, the amount that guests paid for hotel rooms that the industry was not able to recognize was estimated by this study at approximately $2.7 billion, which is about 2.5% of total customer spend for hotel rooms.
sales tax collectIonAs state and local tax authorities collect their taxes directly from the hotel, there have been some municipalities that believe that they have not been able to collect the full amount of hotel taxes that they are due. As such many of those municipalities have taken legal action to try to collect the monies they believe they are due.
As of 2011, there are more than 50 states and/or municipalities that have turned to litigation, claim-ing that they are not receiving the full sales or occupancy tax they are due on rooms sold through the merchant model. Since hotels only receive 65% to 80% of the rate paid by the consumer and there-fore only receive and remit tax on this portion, the local governments are pursuing the balance. The litigation is with the OTAs that argue that they should not have to pay tax on the difference they receive from the consumer, which they consider to be a commission and/or service fee and, therefore, should not be subject to sales or occupancy tax. Some have compared this to the commission on an art sale. If you pay $1,000 for a piece of art and $200 of it in commission to the gallery, the sales tax still applies to the full $1,000 cost.
The outcome of cases is largely being determined on how individual ordinance or law is written.1 Like other taxes that are intended to tax the amount paid by the consumer of a good or service, occupancy and bed taxes were created to tax the amount a hotel guest pays for a hotel stay. Since most of the laws and ordinances establishing occupancy taxes were written decades before the Internet was created, when no online travel companies existed, their wording sometimes does not adequately reflect the nature of 21st century transactions.
1 based on a description provided by AH&LA, office of Government Affairs
In some jurisdictions, the statutes may state that the occupancy tax should be based on the amount a hotel receives for a room stay, which used to be synonymous to what the guest paid for the room when the statute was written. Unfortunately, that imprecise language has contributed to much of the litigation since the OTA claims it need not remit tax on what the guest pays for the room (the retail price) but rather on what the OTA pays for the room (its wholesale rate), since that is “what the hotel receives.”
In such cases, where the tax is based on what a hotel receives, courts have found that since the OTAs are not hotels, the jurisdictions can only base the tax on that amount and that jurisdictions must clarify the statute so that the retail price is properly identified. In other jurisdictions, courts have found that the existing statute clearly identi-fies the taxable amount as being what a guest pays for a stay and that OTAs must remit tax based on the retail price.
Some examples in favor of the municipality:
4 The Supreme court of South carolina found that the tax owed is on the total amount received from consumers in exchange for furnishing hotel accommodations.
4 The Georgia Supreme court has twice ruled that oTAs agreed to collect hotel taxes through their contracts with the hotels and by virtue of these agreements were duty bound to collect and remit hotel taxes on the retail price to the appropriate government entity.
4 A Washington State court issued a summary judgment in favor of the plaintiffs against an oTA, indicating that customer charges represented to be service fees intended to cover taxes and other costs were, in fact, part of the profit margin on the oTA transactions.
In favor of the OTAs:
4 The Kentucky State court of Appeals has found that the applicable statute in the state did not apply to what oTAs charge guests and that the Kentucky General Assembly would have to change the law for oTAs to be liable.
4 Ruling that oTAs are neither owners nor operators of hotels, the Los Angeles Superior court held that San diego’s occupancy tax ordinance did not apply to the booking services offered by the oTAs.2
2 interactive Travel Services Association, press release, September 8, 2011
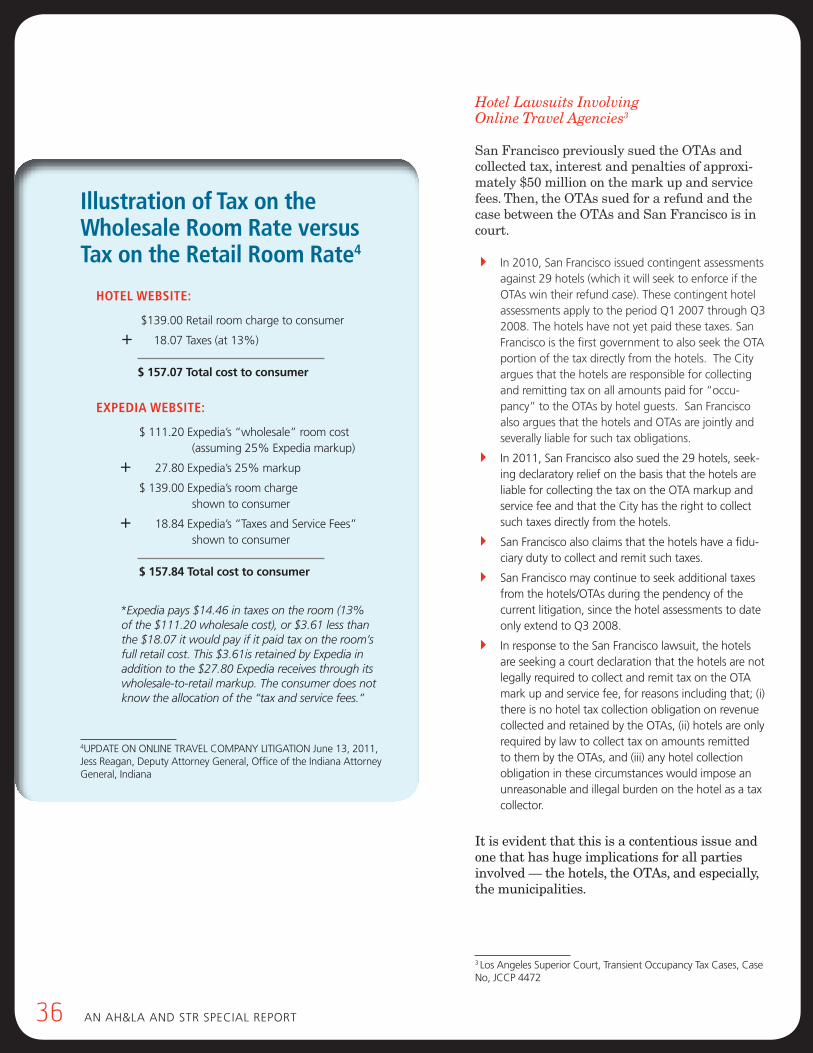
36 AN AH&LA ANd STR SpeciAL RepoRT
Hotel Lawsuits Involving Online Travel Agencies3
San Francisco previously sued the OTAs and collected tax, interest and penalties of approxi-mately $50 million on the mark up and service fees. Then, the OTAs sued for a refund and the case between the OTAs and San Francisco is in court. 4 in 2010, San Francisco issued contingent assessments
against 29 hotels (which it will seek to enforce if the oTAs win their refund case). These contingent hotel assessments apply to the period Q1 2007 through Q3 2008. The hotels have not yet paid these taxes. San Francisco is the first government to also seek the oTA portion of the tax directly from the hotels. The city argues that the hotels are responsible for collecting and remitting tax on all amounts paid for “occu-pancy” to the oTAs by hotel guests. San Francisco also argues that the hotels and oTAs are jointly and severally liable for such tax obligations.
4 in 2011, San Francisco also sued the 29 hotels, seek-ing declaratory relief on the basis that the hotels are liable for collecting the tax on the oTA markup and service fee and that the city has the right to collect such taxes directly from the hotels.
4 San Francisco also claims that the hotels have a fidu-ciary duty to collect and remit such taxes.
4 San Francisco may continue to seek additional taxes from the hotels/oTAs during the pendency of the current litigation, since the hotel assessments to date only extend to Q3 2008.
4 in response to the San Francisco lawsuit, the hotels are seeking a court declaration that the hotels are not legally required to collect and remit tax on the oTA mark up and service fee, for reasons including that; (i) there is no hotel tax collection obligation on revenue collected and retained by the oTAs, (ii) hotels are only required by law to collect tax on amounts remitted to them by the oTAs, and (iii) any hotel collection obligation in these circumstances would impose an unreasonable and illegal burden on the hotel as a tax collector.
It is evident that this is a contentious issue and one that has huge implications for all parties involved — the hotels, the OTAs, and especially, the municipalities.
3 Los Angeles Superior court, Transient occupancy Tax cases, case No, Jccp 4472
Illustration of tax on the Wholesale room rate versus tax on the retail room rate4
4updATe oN oNLiNe TRAVeL coMpANy LiTiGATioN June 13, 2011, Jess Reagan, deputy Attorney General, office of the indiana Attorney General, indiana
Hotel WebsIte:
$139.00 Retail room charge to consumer
+ 18.07 Taxes (at 13%)
$ 157.07 Total cost to consumer
exPedIa WebsIte:
$ 111.20 expedia’s “wholesale” room cost (assuming 25% expedia markup)
+ 27.80 expedia’s 25% markup
$ 139.00 expedia’s room charge shown to consumer
+ 18.84 expedia’s “Taxes and Service Fees” shown to consumer
$ 157.84 Total cost to consumer
*Expedia pays $14.46 in taxes on the room (13% of the $111.20 wholesale cost), or $3.61 less than the $18.07 it would pay if it paid tax on the room’s full retail cost. This $3.61is retained by Expedia in addition to the $27.80 Expedia receives through its wholesale-to-retail markup. The consumer does not know the allocation of the “tax and service fees.”
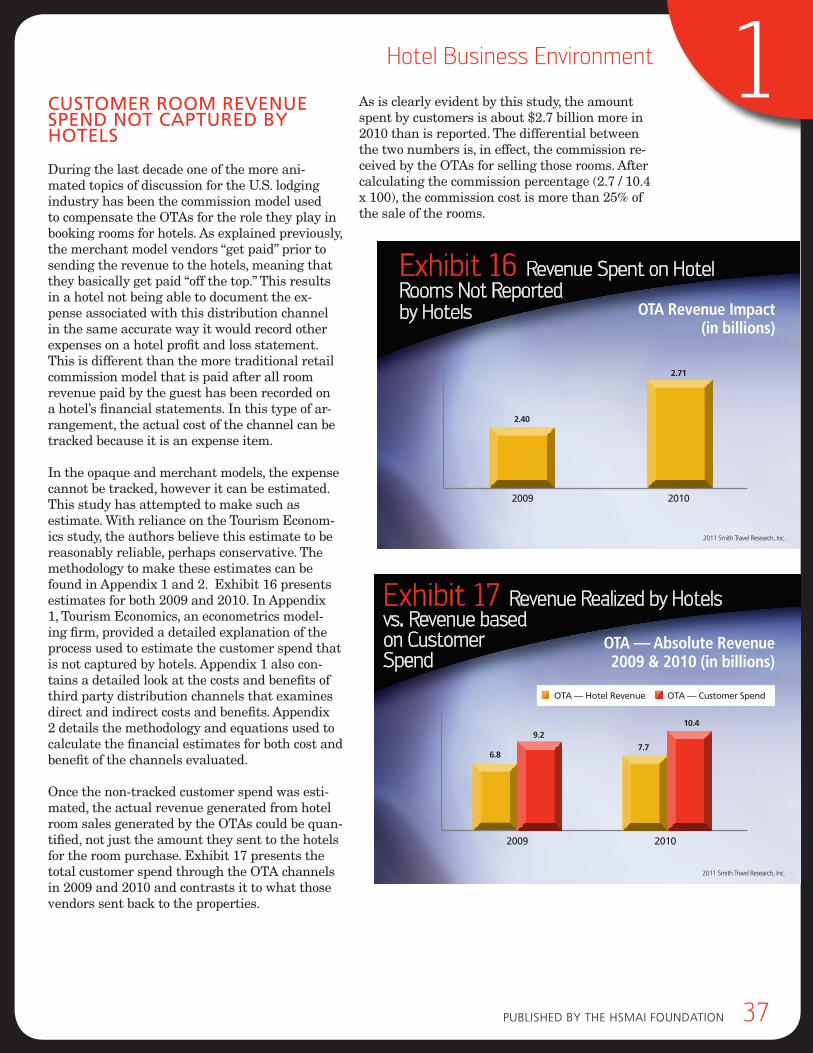
pubLiSHed by THe HSMAi FouNdATioN 37
1Hotel Business Environment
cUSTomer room revenUe Spend noT cApTUred by HoTelS
During the last decade one of the more ani-mated topics of discussion for the U.S. lodging industry has been the commission model used to compensate the OTAs for the role they play in booking rooms for hotels. As explained previously, the merchant model vendors “get paid” prior to sending the revenue to the hotels, meaning that they basically get paid “off the top.” This results in a hotel not being able to document the ex-pense associated with this distribution channel in the same accurate way it would record other expenses on a hotel profit and loss statement. This is different than the more traditional retail commission model that is paid after all room revenue paid by the guest has been recorded on a hotel’s financial statements. In this type of ar-rangement, the actual cost of the channel can be tracked because it is an expense item.
In the opaque and merchant models, the expense cannot be tracked, however it can be estimated. This study has attempted to make such as estimate. With reliance on the Tourism Econom-ics study, the authors believe this estimate to be reasonably reliable, perhaps conservative. The methodology to make these estimates can be found in Appendix 1 and 2. Exhibit 16 presents estimates for both 2009 and 2010. In Appendix 1, Tourism Economics, an econometrics model-ing firm, provided a detailed explanation of the process used to estimate the customer spend that is not captured by hotels. Appendix 1 also con-tains a detailed look at the costs and benefits of third party distribution channels that examines direct and indirect costs and benefits. Appendix 2 details the methodology and equations used to calculate the financial estimates for both cost and benefit of the channels evaluated.
Once the non-tracked customer spend was esti-mated, the actual revenue generated from hotel room sales generated by the OTAs could be quan-tified, not just the amount they sent to the hotels for the room purchase. Exhibit 17 presents the total customer spend through the OTA channels in 2009 and 2010 and contrasts it to what those vendors sent back to the properties.
As is clearly evident by this study, the amount spent by customers is about $2.7 billion more in 2010 than is reported. The differential between the two numbers is, in effect, the commission re-ceived by the OTAs for selling those rooms. After calculating the commission percentage (2.7 / 10.4 x 100), the commission cost is more than 25% of the sale of the rooms.
Exhibit 16 Revenue Spent on Hotel Rooms Not Reported by Hotels
2011 Smith Travel Research, Inc.
2.40
2.71
20102009
OTA Revenue Impact (in billions)
Exhibit 17 Revenue Realized by Hotels vs. Revenue based on Customer Spend
OTA — Hotel Revenue OTA — Customer Spend
2011 Smith Travel Research, Inc.
6.8
10.4
20102009
OTA — Absolute Revenue 2009 & 2010 (in billions)
7.7
9.2
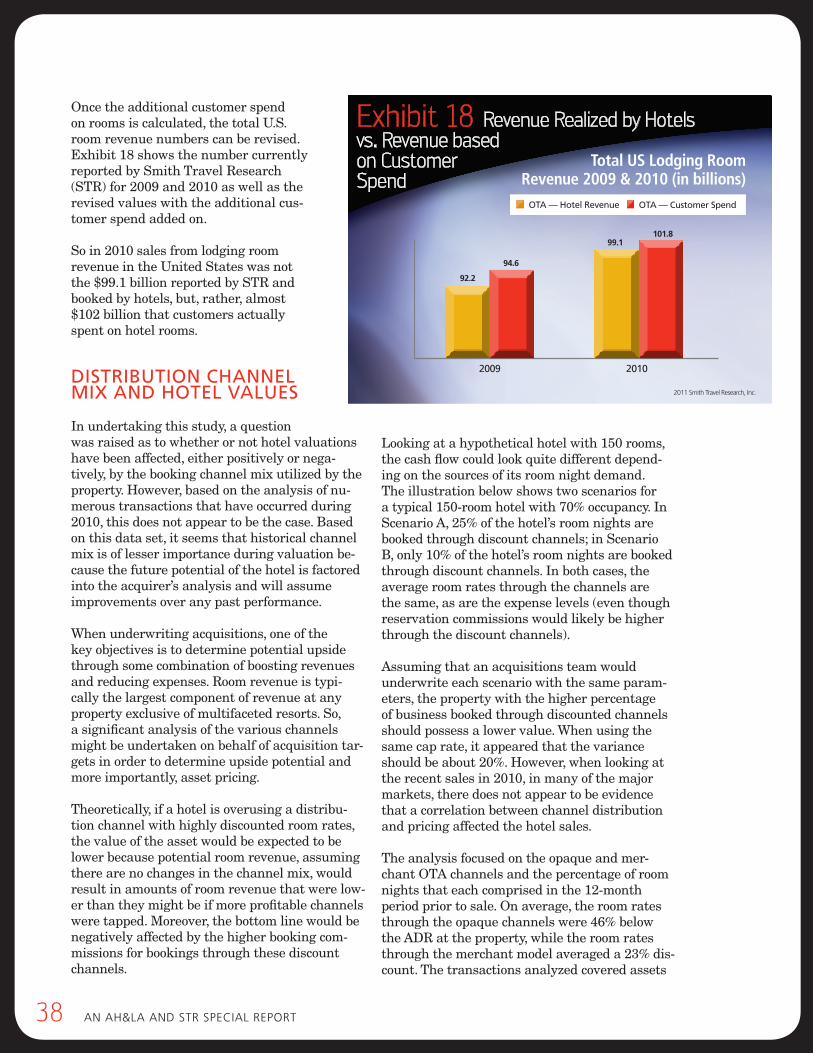
38 AN AH&LA ANd STR SpeciAL RepoRT
Once the additional customer spend on rooms is calculated, the total U.S. room revenue numbers can be revised. Exhibit 18 shows the number currently reported by Smith Travel Research (STR) for 2009 and 2010 as well as the revised values with the additional cus-tomer spend added on.
So in 2010 sales from lodging room revenue in the United States was not the $99.1 billion reported by STR and booked by hotels, but, rather, almost $102 billion that customers actually spent on hotel rooms.
dISTrIbUTIon cHAnnel mIx And HoTel vAlUeS
In undertaking this study, a question was raised as to whether or not hotel valuations have been affected, either positively or nega-tively, by the booking channel mix utilized by the property. However, based on the analysis of nu-merous transactions that have occurred during 2010, this does not appear to be the case. Based on this data set, it seems that historical channel mix is of lesser importance during valuation be-cause the future potential of the hotel is factored into the acquirer’s analysis and will assume improvements over any past performance.
When underwriting acquisitions, one of the key objectives is to determine potential upside through some combination of boosting revenues and reducing expenses. Room revenue is typi-cally the largest component of revenue at any property exclusive of multifaceted resorts. So, a significant analysis of the various channels might be undertaken on behalf of acquisition tar-gets in order to determine upside potential and more importantly, asset pricing.
Theoretically, if a hotel is overusing a distribu-tion channel with highly discounted room rates, the value of the asset would be expected to be lower because potential room revenue, assuming there are no changes in the channel mix, would result in amounts of room revenue that were low-er than they might be if more profitable channels were tapped. Moreover, the bottom line would be negatively affected by the higher booking com-missions for bookings through these discount channels.
Looking at a hypothetical hotel with 150 rooms, the cash flow could look quite different depend-ing on the sources of its room night demand. The illustration below shows two scenarios for a typical 150-room hotel with 70% occupancy. In Scenario A, 25% of the hotel’s room nights are booked through discount channels; in Scenario B, only 10% of the hotel’s room nights are booked through discount channels. In both cases, the average room rates through the channels are the same, as are the expense levels (even though reservation commissions would likely be higher through the discount channels).
Assuming that an acquisitions team would underwrite each scenario with the same param-eters, the property with the higher percentage of business booked through discounted channels should possess a lower value. When using the same cap rate, it appeared that the variance should be about 20%. However, when looking at the recent sales in 2010, in many of the major markets, there does not appear to be evidence that a correlation between channel distribution and pricing affected the hotel sales.
The analysis focused on the opaque and mer-chant OTA channels and the percentage of room nights that each comprised in the 12-month period prior to sale. On average, the room rates through the opaque channels were 46% below the ADR at the property, while the room rates through the merchant model averaged a 23% dis-count. The transactions analyzed covered assets
Exhibit 18 Revenue Realized by Hotels vs. Revenue based on Customer Spend
OTA — Customer Spend
2011 Smith Travel Research, Inc.
92.2
101.8
20102009
Total US Lodging Room Revenue 2009 & 2010 (in billions)
99.1
94.6
OTA — Hotel Revenue
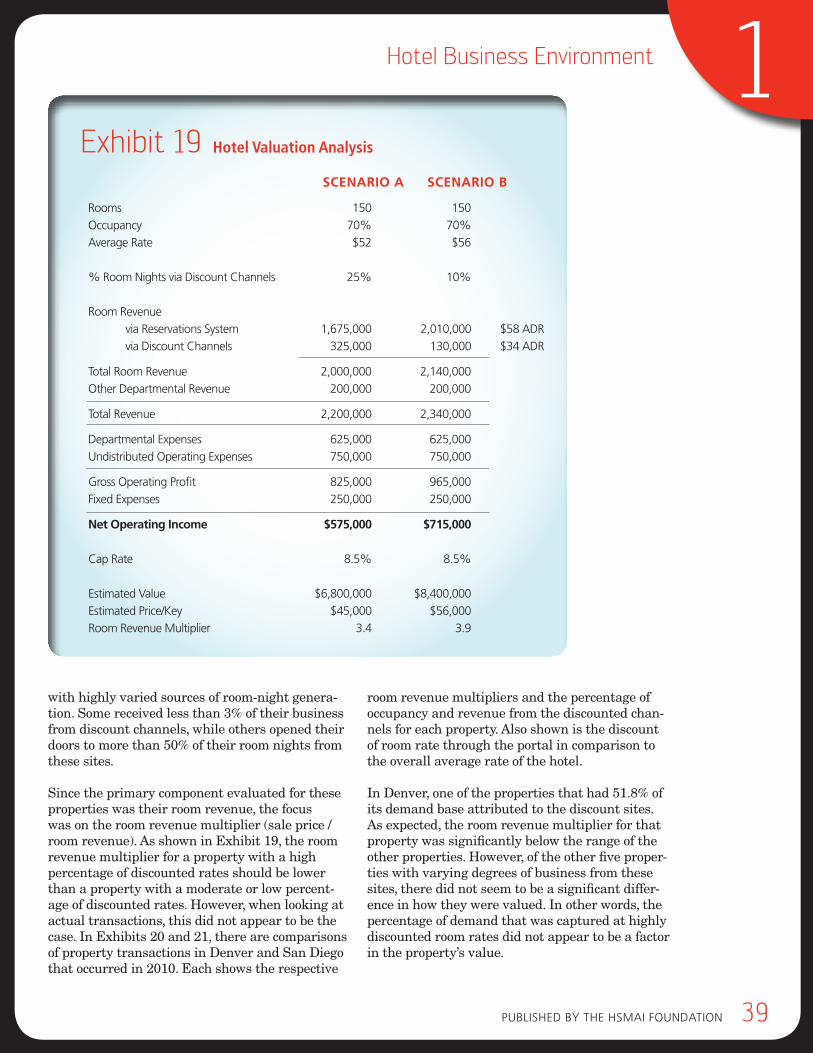
pubLiSHed by THe HSMAi FouNdATioN 39
1Hotel Business Environment
with highly varied sources of room-night genera-tion. Some received less than 3% of their business from discount channels, while others opened their doors to more than 50% of their room nights from these sites.
Since the primary component evaluated for these properties was their room revenue, the focus was on the room revenue multiplier (sale price / room revenue). As shown in Exhibit 19, the room revenue multiplier for a property with a high percentage of discounted rates should be lower than a property with a moderate or low percent-age of discounted rates. However, when looking at actual transactions, this did not appear to be the case. In Exhibits 20 and 21, there are comparisons of property transactions in Denver and San Diego that occurred in 2010. Each shows the respective
room revenue multipliers and the percentage of occupancy and revenue from the discounted chan-nels for each property. Also shown is the discount of room rate through the portal in comparison to the overall average rate of the hotel.
In Denver, one of the properties that had 51.8% of its demand base attributed to the discount sites. As expected, the room revenue multiplier for that property was significantly below the range of the other properties. However, of the other five proper-ties with varying degrees of business from these sites, there did not seem to be a significant differ-ence in how they were valued. In other words, the percentage of demand that was captured at highly discounted room rates did not appear to be a factor in the property’s value.
ScenaRiO a ScenaRiO B
Rooms 150 150
occupancy 70% 70%
Average Rate $52 $56
% Room Nights via discount channels 25% 10%
Room Revenue
via Reservations System 1,675,000 2,010,000 $58 AdR
via discount channels 325,000 130,000 $34 AdR
Total Room Revenue 2,000,000 2,140,000
other departmental Revenue 200,000 200,000
Total Revenue 2,200,000 2,340,000
departmental expenses 625,000 625,000
undistributed operating expenses 750,000 750,000
Gross operating profit 825,000 965,000
Fixed expenses 250,000 250,000
net Operating income $575,000 $715,000
cap Rate 8.5% 8.5%
estimated Value $6,800,000 $8,400,000
estimated price/Key $45,000 $56,000
Room Revenue Multiplier 3.4 3.9
Exhibit 19 Hotel Valuation analysis
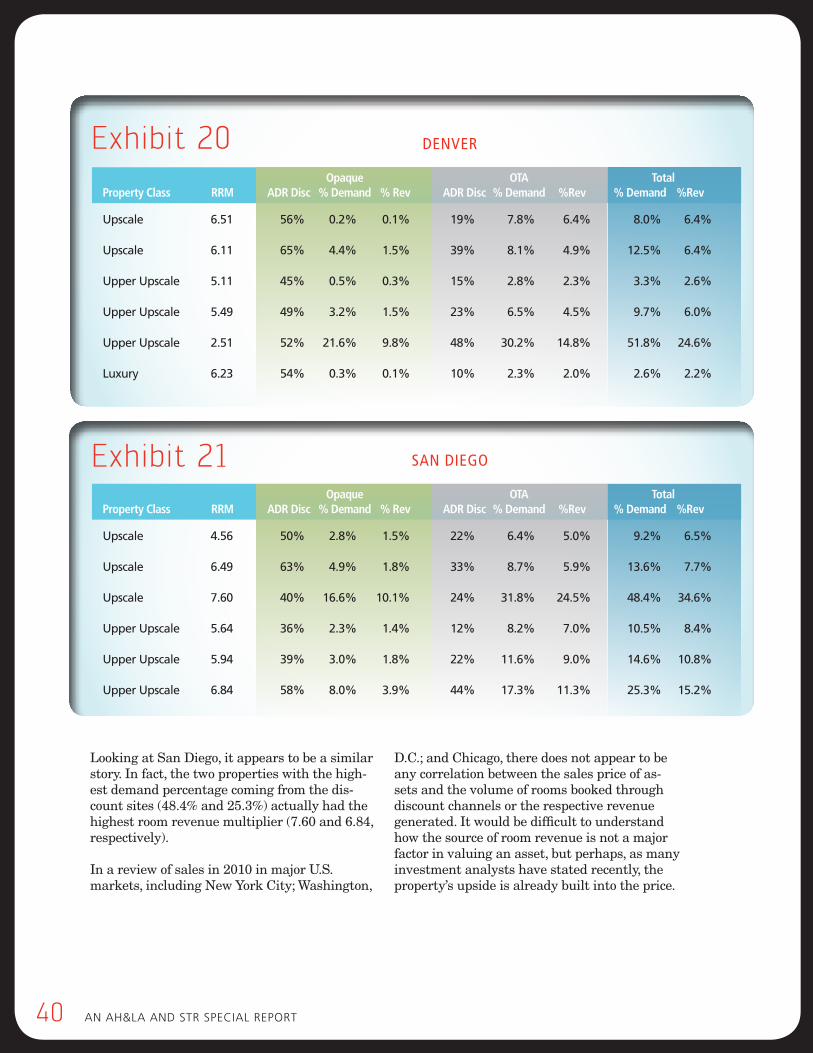
40 AN AH&LA ANd STR SpeciAL RepoRT
Looking at San Diego, it appears to be a similar story. In fact, the two properties with the high-est demand percentage coming from the dis-count sites (48.4% and 25.3%) actually had the highest room revenue multiplier (7.60 and 6.84, respectively).
In a review of sales in 2010 in major U.S. markets, including New York City; Washington,
D.C.; and Chicago, there does not appear to be any correlation between the sales price of as-sets and the volume of rooms booked through discount channels or the respective revenue generated. It would be difficult to understand how the source of room revenue is not a major factor in valuing an asset, but perhaps, as many investment analysts have stated recently, the property’s upside is already built into the price.
opaque ota totalProperty class rrM adr disc % demand % rev adr disc % demand %rev % demand %rev
Upscale 6.51 56% 0.2% 0.1% 19% 7.8% 6.4% 8.0% 6.4%
Upscale 6.11 65% 4.4% 1.5% 39% 8.1% 4.9% 12.5% 6.4%
Upper Upscale 5.11 45% 0.5% 0.3% 15% 2.8% 2.3% 3.3% 2.6%
Upper Upscale 5.49 49% 3.2% 1.5% 23% 6.5% 4.5% 9.7% 6.0%
Upper Upscale 2.51 52% 21.6% 9.8% 48% 30.2% 14.8% 51.8% 24.6%
luxury 6.23 54% 0.3% 0.1% 10% 2.3% 2.0% 2.6% 2.2%
Exhibit 20 Denver
opaque ota totalProperty class rrM adr disc % demand % rev adr disc % demand %rev % demand %rev
Upscale 4.56 50% 2.8% 1.5% 22% 6.4% 5.0% 9.2% 6.5%
Upscale 6.49 63% 4.9% 1.8% 33% 8.7% 5.9% 13.6% 7.7%
Upscale 7.60 40% 16.6% 10.1% 24% 31.8% 24.5% 48.4% 34.6%
Upper Upscale 5.64 36% 2.3% 1.4% 12% 8.2% 7.0% 10.5% 8.4%
Upper Upscale 5.94 39% 3.0% 1.8% 22% 11.6% 9.0% 14.6% 10.8%
Upper Upscale 6.84 58% 8.0% 3.9% 44% 17.3% 11.3% 25.3% 15.2%
Exhibit 21 San Diego

How long have you been in the hotel industry? How long have you been involved with distribution issues?
Larraine: i’ve been in the hotel industry for 29 years and have been involved in distribution issues my whole career, starting out with Marriott representing the travel agency and wholesaler segment and evolving into the online 3rd party distribution segment.
George: i have been in the hotel industry for 9 years, and in the internet space for 12. online distribution and product sales have been my focus for all 12 of those years.
In what way does your current role involve distribution?
Larraine: i’m currently responsible for strategy, sales, marketing, and operations through online 3rd parties, primarily comprising online Travel Agencies, Metase-arch, and Global distribution Systems (GdS).
George: i’m responsible for overall ecommerce strategy for Marriott, for which our overriding strategy is optimiz-ing the sales and distribution of our products through all online channels — whether our own direct channels (Marriott.com) or 3rd parties (oTAs, search engines, affili-ates, etc.). i am also directly accountable for all sales from online referral channels to M.com (e.g., search, affiliates).
Where would you say distribution fits into the overall hotel management landscape? Why does distribution matter?
At Marriott, we broadly define distribution as both direct and indirect channels. excluding Group business, Reser-vations and M.com are Mi’s largest direct-to-customer channels. From an indirect perspective (once again excluding Group), distribution is widely defined as our business through travel agencies, wholesalers and online 3rd parties such as oTAs.
our first priority is ensuring that our direct distribution channels are strong and competitive. However, the business we derive from 3rd party distribution channels are an integral part of Marriott’s overall revenue, and they provide us with important visibility to both business and leisure customers. Therefore, they continue to be a meaningful component of our overall business mix and profitability contributions.
What are the top 3 current issues that will have the greatest impact on hotel distribution in the next two to three years?
The pace of change in the distribution landscape has ac-celerated, primarily due to major new disruptive changes in the online space. The internet now accounts for a very significant share of total hotel bookings — and the big-gest future impacts will come from:
Search engines: Search now dominates the top-of-fun-nel consideration path for most leisure travel, and a large share of business travel. Search engines can be both a boon and a bane for hotels — managed well, they can drive revenue, but a simple change in a search engine’s algorithm, for example, can drop a hotel from page 1 to page 10 overnight — wiping out a material source of traffic and revenue. Google and bing have both clearly signaled their intent to be aggressive in the travel category. Google’s recent introductions of hotel rate ads, hotel finder, etc., show that regardless of whether any one of these products is successful, Google is going after this business. This will have serious implications on oTAs and meta-search — the “traditional search engines” for the travel category.
Mobile: it’s fast, it’s convenient, it’s location-aware, it’s untethered, and it’s always with you. This will change the travel experience — and become indispensable to the traveler… and not just for bookings. even Google states that 30% of hotel searches now come from a mobile device.
The proliferation and incursion of non-traditional online entrants into the travel category: Think Google. Think Apple. Think Facebook. Think Groupon. Non-trav-el players are leveraging their platforms to drive into the travel and hotel space online. They have huge “installed” customer bases, global brands, and dominant consumer technologies… and they have the ability to leverage those assets into travel, where a third of all online revenue occurs.
Larraine Voll MorrisVP eDistribution
George Corbin VP eCommerce Strategy & eMarketing
Marriott international
pubLiSHed by THe HSMAi FouNdATioN ANd iTS pubLiSHiNG pARTNeRS 41
Industry PersPectIVe
low res im-age, need
>>
>>
>>
>>
>>
>>
>>
continued >>
What is the smartest move you have seen in hotel distribution (by someone other than your own organization)?
in principle, the “smartest moves” are those that protect and reinforce your direct connection with your end-customer. if you give that up, you mortgage your future by surrendering your ability to manage your product, your brand, your profit margin, and your relationship with your customer.
What is the smartest move your organization has made related to hotel distribution?
Several years ago we committed to strengthen our lower-cost, direct-to-customer channels, and increase our direct relationship with the online customer. We also invested higher in the shopping funnel, where we can influence the consumer earlier in the booking process, before the actual booking takes place. We have also focused on how and by which channels customers come to us …and ways in which we can position Marriott more competitively within those feeder channels. This focus has not only helped over-all conversion on M.com, but has helped our voice channels as well, where we have an outstanding call conversion rate thanks to customers coming to us far more informed, “pre-qualified”, and ready to book thanks to the web.
What is the single biggest oversight or misstep you have witnessed (in your own organization or others in hospitality) in the last two years?
We would rather frame the answer in the form of “a key learning”, and that is: “Stay rational. Stay focused. Think long-term.” Hoteliers face a daily bar-rage of “new shiny things” in the market — social networks, deep discount flash sites, new niche oTAs, “cool” mobile apps, etc. All are aimed at grabbing your customer, and discounting / commoditizing your product. in the end, those that create a profitable proposition for the hotelier and the channel are the ones that will succeed; they must deliver incremental revenue that you could not otherwise get for your-self. The rest will ultimately fail, but only after having devalued your brand.
What three things can you tell a hotel general manager, owner or asset manager about distribution that would have the greatest impact on unit level profit?
What is the next thing that you predict will disappear or gradually fade away that is currently a part of the distribution scene?
We believe this is less about any one distribution channel or segment. Rather, we predict those entities that will disappear or fade away are those distribution channels that are under-capitalized, not scalable and/or represent a micro-niche or specialty market, or do not offer a sustainable value proposition to consum-ers or incremental revenue to suppliers.
If you had a crystal ball, what emerging technolo-gies do you anticipate could be game changers, or at least have the greatest affect on the distribution landscape in the next two to three years?
Mobile and location-based mobile services
personalization and “relevancy”: everyone’s getting pretty good at making a solid “booking” experience, but personalization can create stickiness for your channel over those of others.
Search engines will continue to fundamentally alter the online shopping landscape.
Industry PersPectIVe
our advice to our hotels has been consistent:
fully participate in the lowest-cost direct channels.
be smart about managing your direct-indirect channel mix and overall profitability.
honor your “best Rate Guarantee.”
>>
>>
>>
>>
>>
Larraine Voll Morris/George CorbinVP eDistribution/ VP eCommerce Strategy & eMarketing
Marriott international
123
42 AN AH&LA ANd STR SpeciAL RepoRT

How long have you been in the hotel industry? How long have you been involved with distribution issues?
Flo: i have been in the hotel/travel industry for 28 years, and have been involved with distribution for the majority of that time, with experience from the hotel, car rental, airline and GdS/technology supplier perspective.
Dan: i have been working in the industry for 20 years. i spent the majority of that time working in revenue man-agement and reservations for hotel, car rental, cruise, and gaming companies.
In what way does your current role involve distribution?
Flo: i am currently responsible for all distribution for WHG (ecommerce/online, third party, GdS, social, etc).
Dan: i am currently responsible for revenue management at WHG. i am also the business lead for our 5 year technol-ogy transformation program involving all aspects of rate management and revenue optimization.
Where would you say distribution fits into the overall hotel management landscape? Why does distribution matter?
Flo: distribution may be a limiting description for what is now a ubiquitous presence—as it now encompasses everything from content syndication, to connectivity, to online presence/marketing to social engagement. it is about how a hotel is shopped, perceived, assessed, rated, booked and shared across the ecosystem. it is complex, and if not understood and effectively managed, can have significant implications on a hotel’s profitability.
Dan: distribution is increasing becoming an integral part of revenue management. With the growth of online booking models and marketing a revenue manager must understand the impact these distribution and marketing partners will have on AdR while balancing the production they are get-ting from these sites because they reach customers that their hotel would otherwise not reach by themselves.
What are the top 3 current issues that will have the greatest impact on hotel distribution in the next two to three years?
Flo: Mobile, search, social and the transparency on pricing and product that results from all three.
Dan: My primary concerns are rate party and retaining the trust of the customer that the best rates available will be on our brand.com site. As online distribution increasingly moves into areas like mobile, social media, and deal sites, the lines will blur around rate parity and the best rate guarantee we promise our consumers on our websites. it will become harder and harder for a revenue manager to manage price across these many points of distribution and measure the true incremental business they are getting from these chan-nels. it will also become more confusing for the consumer to know where to go to get the best rates.
What is the smartest move you have seen in hotel distribution (by someone other than your own organization)?
Flo: it’s hard to identify a “smartest” move in this space, as one of the challenges is anticipating and preparing for the continued changes and developments in technology, consumer behavior, online marketing and advertising and other external forces. certainly continued development of the search/shopping experience will present continued challenges in understanding how to manage and measure the impact of our efforts. building the right foundation of expertise internally, identifying the right tools and assessing the required infrastructure and brand standards in order to effectively compete are all “smart” moves.
Dan: There is no one single “smartest” move. both WHG and its competitors are constantly taking small steps to bet-ter compete in the changing revenue management, market-ing, and distribution space.
What is the smartest move your organization has made related to hotel distribution?
Flo: bringing on additional expertise and investing in the right foundational elements to position us for success.
Dan: investment in people and technology.
Flo LuglieVP Marketing
Dan KowalewskiVP revenue Management
WynDhaM hotel GrouP
Industry PersPectIVe
>>
>>
>>>>
>>
>>
>>
>>
>>
>>
>>
>>
continued >>
pubLiSHed by THe HSMAi FouNdATioN 43
What is the single biggest oversight or misstep you have witnessed (in your own organization or others in hospitality) in the last two years?
Flo: organizations that have failed to play out current developments in the industry to a possible conclusion, and as such have impacted their ability to effectively compete, and not understanding the impact of a transparent, consumer driven market-place. At a hotel level, failure to engage with brand programs that are designed to drive direct or more profitable business compared to other third parties.
Dan: Today organizations have been quick to react to new marketing or distribution opportunities with-out understanding the full impact it will have on their business both short and long term.
What can you tell a hotel general manager, owner or asset manager about distribution that would have the greatest impact on unit level profit?
What is the next thing that you predict will disappear or gradually fade away that is currently a part of the distribution scene?
Flo: i’ve learned in my experience never to make pre-dictions, and that generally channels in distribution don’t disappear but evolve. i remember predictions in the mid 90’s that GdS were not long for this world, and yet they continue to play an important role in the distribution ecosystem. What i hope will fade away are the proliferation of deal sites, as i believe these only commoditize our products and add more complexity to an already overly complex model.
Dan: No one distribution or marketing model will completely disappear, they will morph. i see the emergence of new models like deal sites helping more tradition channels innovate and evolve in the distribution landscape.
If you had a crystal ball, what emerging technolo-gies do you anticipate could be game changers, or at least have the greatest affect on the distribution landscape in the next two to three years?
Flo: Again, mobile, tablets and social.
Dan: Mobile, social media and deal sites.
Industry PersPectIVe
Flo: Take full advantage of the brand programs that are developed to help you compete more effectively. Work with your brands to better un-derstand the trade offs between each channel, and how to better manage your participation in these channels.
Dan: Leverage the revenue management expertise in your brand to help you become more profitable. become engaged in programs and services offered and share your challenges regularly so your brand can continue to refine and improve them.
>>
>>
>>
>>>>
Flo Lugli/Dan KowalewskieVP Marketing/VP revenue Management
WynDhaM hotel GrouP
>>
1
2
44 AN AH&LA ANd STR SpeciAL RepoRT

pubLiSHed by THe HSMAi FouNdATioN 45
2The Distribution Landscape
pubLiSHed by THe HSMAi FouNdATioN 45
Hotel distribution channels are the conduits through which reservations pass to reach a hotel and to maintain availability, rates and informa-tion. Many reservations pass through a source as well as a channel. There may be costs associated with the source, most frequently a commission, as well as the channel that often carries techni-cal, marketing and commission costs. These costs are incurred before a guest steps into the lobby of a hotel, in the course of shopping for a hotel and making the booking. Historically, costs to utilize these channels were strictly viewed as operation-al and technical. Now, because so many of these channels are accessible to the public, distribution is as much about marketing communications as it is about technical reservation delivery and the costs of each reflect that component as well. There are five primary distribution channels, each of which may have multiple sub-channels:
1 call center or 800 number or “voice”
2 GdS (Global distribution System)
3 Hotel’s own website or brand.com
4 online travel agency (oTA)
5 property direct/other
When a hotel is trying to achieve its highest oc-cupancy at the highest rates, it has to tap a com-bination of many segments that come to the hotel through many channels. The complexity in the hotel distribution landscape is derived from the difficulty in maintaining its rates and availabil-ity in a timely manner in hundreds of channels,
and then understanding the route each customer takes to select a hotel and make a booking so a suitable communication plan can be executed.
In order to support the growing online volume, the underlying technology needed is extensive and the connectivity between the various pieces is just as important as each individual piece.
The primary job for a hotel marketer is to go where the travel shoppers go. When travelers are shopping for hotel information, whether it is for business or personal travel, they go through a process from the point that a trip is under consid-eration to the post-travel dialogue they may have with their family, friends or colleagues.
A hotel would ideally put forth content or offer assistance at each point a traveler passes through-out the process; serving up the needed informa-tion at the time and place a travel shopper needs it facilitates a better outcome. So much of this process is migrating online that it is now possible for a hotel to participate in many places along the shopping path as well as in the post-visit conversa-tions that fuel the traveler’s own next trip or one taken by friends or family. Being involved with travelers while they are researching, and facilitat-ing the process allows a hotel to put its offerings in the context of the travelers’ searches at the time they are making their decisions. The concept of a “conversation economy” arises because the dia-logue related to a travel purchase involves many interactions between consumers that are now visible online, particularly in the hugely popular social media sites such as consumer review, or sites like Facebook or YouTube. Following the traveler
the business in most hotels can be segmented into “market
segments” representing common customer types typically
defined by trip purpose such as individual business, individual
leisure, weekend getaway, company meeting, social group, or
convention. There are “sources of business” that represent the booker
such as a travel agent or company. And then there is the channel.
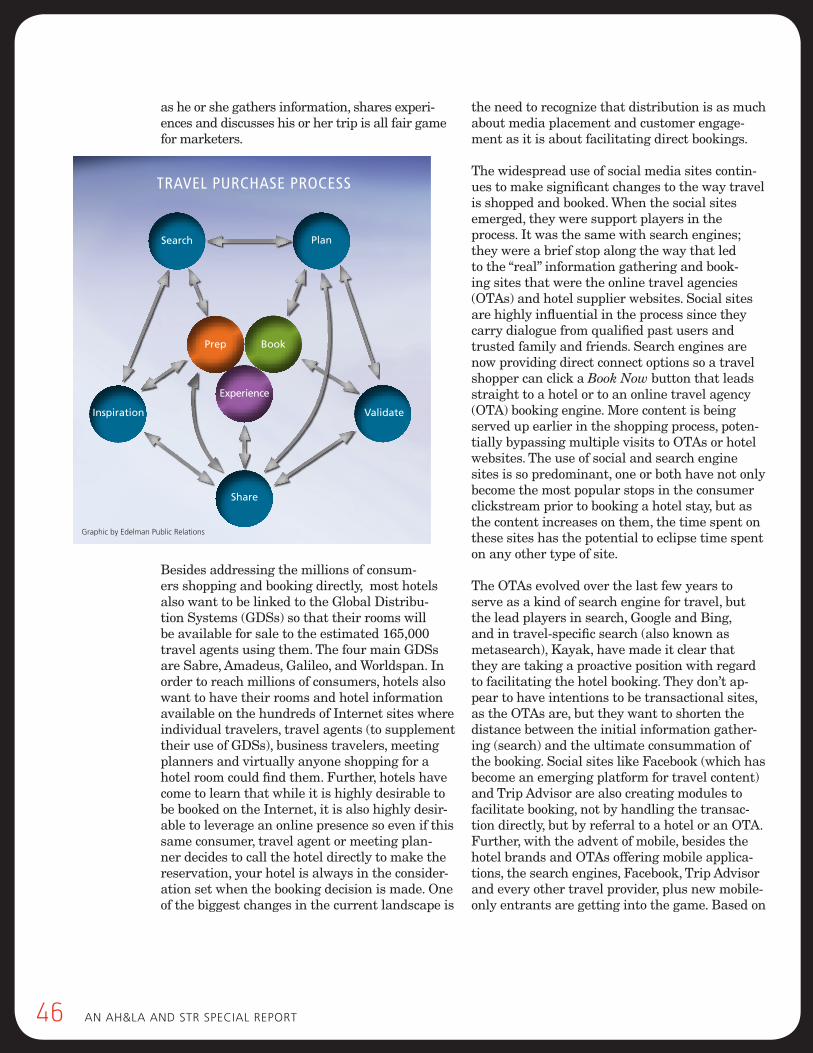
46 AN AH&LA ANd STR SpeciAL RepoRT
as he or she gathers information, shares experi-ences and discusses his or her trip is all fair game for marketers.
Besides addressing the millions of consum-ers shopping and booking directly, most hotels also want to be linked to the Global Distribu-tion Systems (GDSs) so that their rooms will be available for sale to the estimated 165,000 travel agents using them. The four main GDSs are Sabre, Amadeus, Galileo, and Worldspan. In order to reach millions of consumers, hotels also want to have their rooms and hotel information available on the hundreds of Internet sites where individual travelers, travel agents (to supplement their use of GDSs), business travelers, meeting planners and virtually anyone shopping for a hotel room could find them. Further, hotels have come to learn that while it is highly desirable to be booked on the Internet, it is also highly desir-able to leverage an online presence so even if this same consumer, travel agent or meeting plan-ner decides to call the hotel directly to make the reservation, your hotel is always in the consider-ation set when the booking decision is made. One of the biggest changes in the current landscape is
the need to recognize that distribution is as much about media placement and customer engage-ment as it is about facilitating direct bookings.
The widespread use of social media sites contin-ues to make significant changes to the way travel is shopped and booked. When the social sites emerged, they were support players in the process. It was the same with search engines; they were a brief stop along the way that led to the “real” information gathering and book-ing sites that were the online travel agencies (OTAs) and hotel supplier websites. Social sites are highly influential in the process since they carry dialogue from qualified past users and trusted family and friends. Search engines are now providing direct connect options so a travel shopper can click a Book Now button that leads straight to a hotel or to an online travel agency (OTA) booking engine. More content is being served up earlier in the shopping process, poten-tially bypassing multiple visits to OTAs or hotel websites. The use of social and search engine sites is so predominant, one or both have not only become the most popular stops in the consumer clickstream prior to booking a hotel stay, but as the content increases on them, the time spent on these sites has the potential to eclipse time spent on any other type of site.
The OTAs evolved over the last few years to serve as a kind of search engine for travel, but the lead players in search, Google and Bing, and in travel-specific search (also known as metasearch), Kayak, have made it clear that they are taking a proactive position with regard to facilitating the hotel booking. They don’t ap-pear to have intentions to be transactional sites, as the OTAs are, but they want to shorten the distance between the initial information gather-ing (search) and the ultimate consummation of the booking. Social sites like Facebook (which has become an emerging platform for travel content) and Trip Advisor are also creating modules to facilitate booking, not by handling the transac-tion directly, but by referral to a hotel or an OTA. Further, with the advent of mobile, besides the hotel brands and OTAs offering mobile applica-tions, the search engines, Facebook, Trip Advisor and every other travel provider, plus new mobile-only entrants are getting into the game. Based on
E
Search Plan
ValidateInspiration
Book
Experience
Prep
Share
Travel PurchaSe ProceSS
Graphic by edelman public Relations
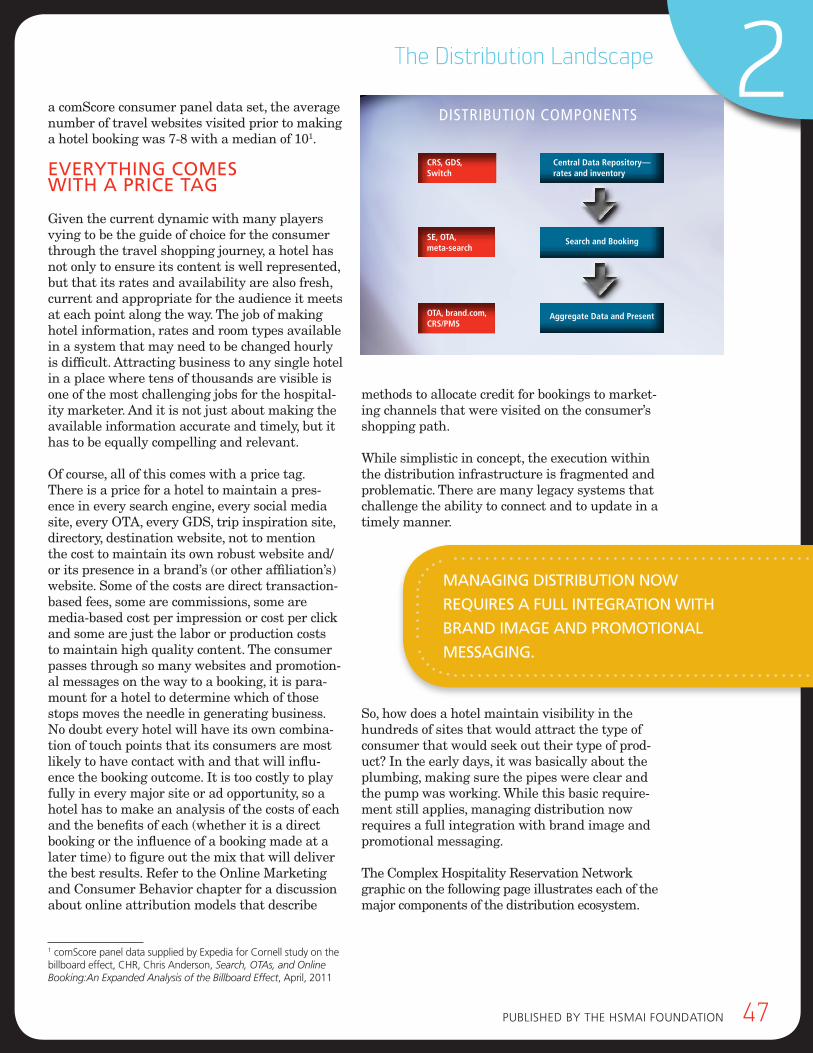
pubLiSHed by THe HSMAi FouNdATioN 47
2The Distribution Landscape
a comScore consumer panel data set, the average number of travel websites visited prior to making a hotel booking was 7-8 with a median of 101.
everyTHIng comeS wITH A prIce TAg
Given the current dynamic with many players vying to be the guide of choice for the consumer through the travel shopping journey, a hotel has not only to ensure its content is well represented, but that its rates and availability are also fresh, current and appropriate for the audience it meets at each point along the way. The job of making hotel information, rates and room types available in a system that may need to be changed hourly is difficult. Attracting business to any single hotel in a place where tens of thousands are visible is one of the most challenging jobs for the hospital-ity marketer. And it is not just about making the available information accurate and timely, but it has to be equally compelling and relevant.
Of course, all of this comes with a price tag. There is a price for a hotel to maintain a pres-ence in every search engine, every social media site, every OTA, every GDS, trip inspiration site, directory, destination website, not to mention the cost to maintain its own robust website and/or its presence in a brand’s (or other affiliation’s) website. Some of the costs are direct transaction-based fees, some are commissions, some are media-based cost per impression or cost per click and some are just the labor or production costs to maintain high quality content. The consumer passes through so many websites and promotion-al messages on the way to a booking, it is para-mount for a hotel to determine which of those stops moves the needle in generating business. No doubt every hotel will have its own combina-tion of touch points that its consumers are most likely to have contact with and that will influ-ence the booking outcome. It is too costly to play fully in every major site or ad opportunity, so a hotel has to make an analysis of the costs of each and the benefits of each (whether it is a direct booking or the influence of a booking made at a later time) to figure out the mix that will deliver the best results. Refer to the Online Marketing and Consumer Behavior chapter for a discussion about online attribution models that describe
1 comScore panel data supplied by expedia for cornell study on the billboard effect, cHR, chris Anderson, Search, OTAs, and Online Booking:An Expanded Analysis of the Billboard Effect, April, 2011
methods to allocate credit for bookings to market-ing channels that were visited on the consumer’s shopping path.
While simplistic in concept, the execution within the distribution infrastructure is fragmented and problematic. There are many legacy systems that challenge the ability to connect and to update in a timely manner.
So, how does a hotel maintain visibility in the hundreds of sites that would attract the type of consumer that would seek out their type of prod-uct? In the early days, it was basically about the plumbing, making sure the pipes were clear and the pump was working. While this basic require-ment still applies, managing distribution now requires a full integration with brand image and promotional messaging.
The Complex Hospitality Reservation Network graphic on the following page illustrates each of the major components of the distribution ecosystem.
DiSTribuTion comPonenTS
crs, Gds, switch
se, ota, meta-search
ota, brand.com, crs/PMs
central data repository— rates and inventory
search and booking
aggregate data and Present
mAnAgIng dISTrIbUTIon now
reqUIreS A fUll InTegrATIon wITH
brAnd ImAge And promoTIonAl
meSSAgIng.
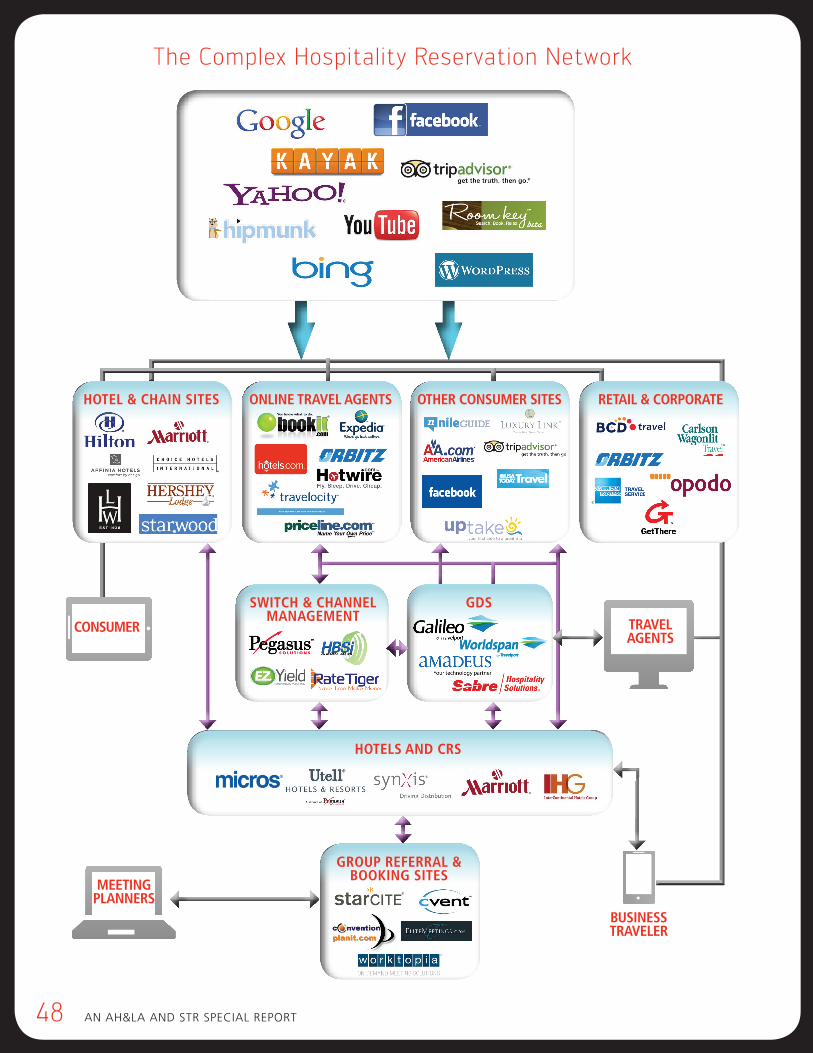
48 AN AH&LA ANd STR SpeciAL RepoRT
Hotels and CRs
GdsswitCH & CHannel ManaGeMent
Retail & CoRpoRateotHeR ConsuMeR sitesonline tRavel aGentsHotel & CHain sites
GRoup RefeRRal & BookinG sites
tRavel aGents
ConsuMeR
MeetinG planneRs
Business tRaveleR
The Complex Hospitality Reservation Network
pubLiSHed by THe HSMAi FouNdATioN 49
2The Distribution Landscape
The systems that need to be considered in the distribution platform for a hotel:
4 central reservation system (cRS)
4 property management system (pMS)
4 connectivity to GdS, oTA, search engine (via switch, extranet or direct)
4 channel management
4 branded website for hotel
4 Revenue management tools (RMS)
4 content management system (cMS)
The four main categories of information that need to be distributed are:
4 Hotel rates (frequently changing — dynamic)
4 Hotel availability (frequently changing — dynamic)
4 Hotel information such as room types, package types, amenities, location, contact information, meeting space (infrequently changing — static)
4 Rich content such as photos and video (some dynamic and some static), which is a category that is growing in importance
At one time, it was necessary to have a central reservation system in order to connect to one of the major connectivity hubs such as a GDS or a switch like Pegasus, HBSi or Derbysoft. Plat-forms have been developed that will allow an individual hotel to connect to one database with a front-end search engine that can be plugged into many different sites, a good example being hotelicopter or hotelscombined.com. The idea is that the search engine can function in Facebook, or on a destination site or anywhere a hotel would like to be visible and, while there is a fee for this direct connection, the cost is generally less than the cost of other third parties, since the transaction will occur on the hotel’s own website. Other models in development are a variation on the OTA in which hotels can choose to connect directly and receive the business as a referral so that the hotel website handles the transaction.
For those hotels not able to maintain a direct connection, they can allow this referral site to handle the transaction on their behalf and will pay a commission in the retail business model.
The two primary types of connections between distribution partners are from a hotel’s CRS to GDS and to OTA; while most use an industry switch/channel partner for this link (such as Peg-asus, HBSi or Derbysoft), some include a channel management tool to permit a hotel to update in one place for multiple connections to smaller third party vendors. The switches use their extensive databases to populate many websites, and they relay reservations and their related changes from GDS and Internet sites back to the hotel central reservation system (CRS) so that the hotels can service the business.
Most hotels and chains use the Pegasus switch at a minimum to connect to the GDSs but the largest international chains maintain direct au-tomated connections to a few of their larger GDS and OTA suppliers. Some individual hotels have direct relationships with OTAs by using con-nections with some manual intervention like an extranet, or surprisingly, there is still widespread use of email or fax. Some OTAs (Expedia as an example) also store rates and inventory then send a message to the hotel CRS for booking only. Many small hotel groups or independents use a third party reservation company like iHotelier, Synxis, or Micros-Fidelio to provide most connec-tions; they may still maintain a few extranets to OTAs for which the updating is often stream-lined by the use of a channel management tool, often incorporated into the reservation system.
The distribution landscape is complex with many players, many of whom are related. (Refer to the chart on the next page Major Travel Industry Distribution Companies).
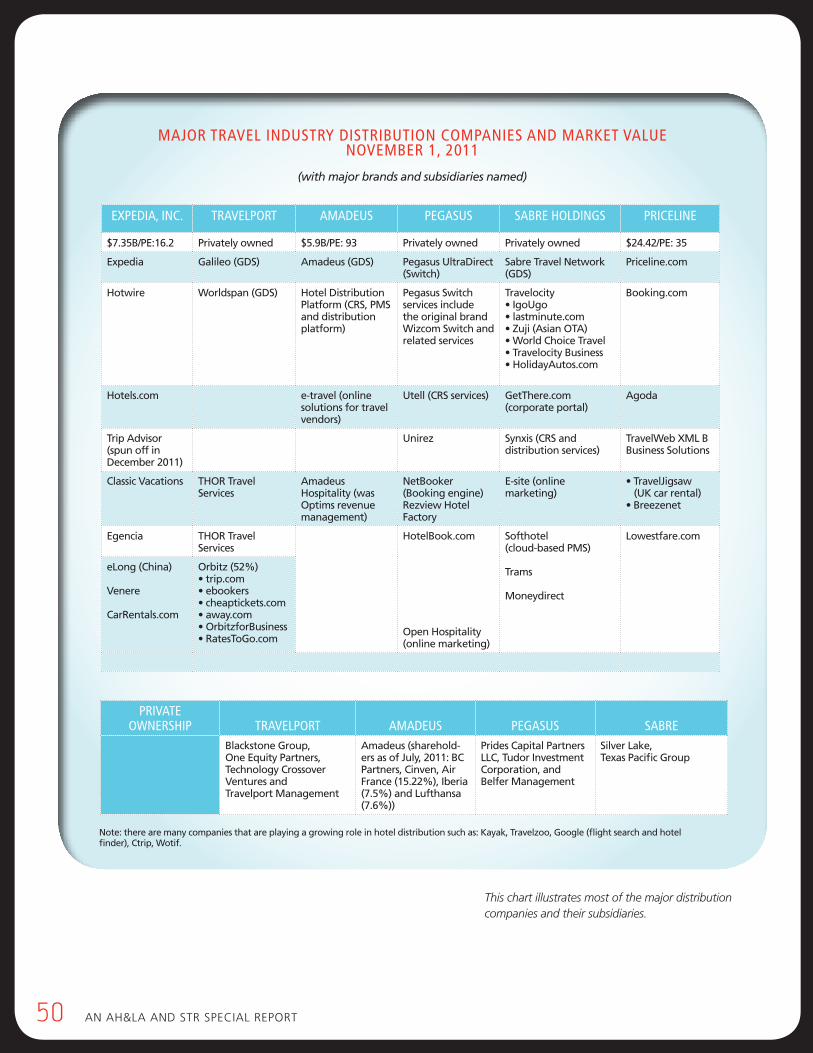
50 AN AH&LA ANd STR SpeciAL RepoRT
Note: there are many companies that are playing a growing role in hotel distribution such as: Kayak, Travelzoo, Homeaway, Google (flight search and hotel finder), ctrip, MakeMyTrip, Wotif.
exPeDia, inc. TravelPorT amaDeuS PegaSuS Sabre holDingS Priceline
$7.35b/pe:16.2 privately owned $5.9b/pe: 93 privately owned privately owned $24.42/pe: 35
expedia galileo (gdS) Amadeus (gdS) pegasus Ultradirect (Switch)
Sabre Travel network (gdS)
priceline.com
Hotwire worldspan (gdS) Hotel distribution platform (crS, pmS and distribution platform)
pegasus Switch services include the original brand wizcom Switch and related services
Travelocity • IgoUgo• lastminute.com• Zuji (Asian OTA)• World Choice Travel• Travelocity Business• HolidayAutos.com
booking.com
Hotels.com e-travel (online solutions for travel vendors)
Utell (crS services) getThere.com(corporate portal)
Agoda
Trip Advisor(spun off in december 2011)
Unirez Synxis (crS and distribution services)
Travelweb xml b business Solutions
classic vacations THor Travel Services
Amadeus Hospitality (was optims revenue management)
netbooker (booking engine)rezview Hotel factory
e-site (online marketing)
• TravelJigsaw (Uk car rental)• Breezenet
egencia THor Travel Services
Hotelbook.com
open Hospitality (online marketing)
Softhotel (cloud-based pmS)
Trams
moneydirect
lowestfare.com
elong (china)
venere
carrentals.com
orbitz (52%)• trip.com• ebookers• cheaptickets.com• away.com• OrbitzforBusiness• RatesToGo.com
PrivaTe ownerShiP
TravelPorT
amaDeuS
PegaSuS
Sabre
blackstone group, one equity partners, Technology crossover ventures and Travelport management
Amadeus (sharehold-ers as of July, 2011: BC partners, cinven, Air france (15.22%), Iberia (7.5%) and lufthansa (7.6%))
prides capital partners llc, Tudor Investment corporation, and belfer management
Silver lake,Texas pacific group
major Travel inDuSTry DiSTribuTion comPanieS anD markeT value november 1, 2011
(with major brands and subsidiaries named)
note: there are many companies that are playing a growing role in hotel distribution such as: kayak, Travelzoo, google (flight search and hotel finder), ctrip, wotif.
This chart illustrates most of the major distribution companies and their subsidiaries.
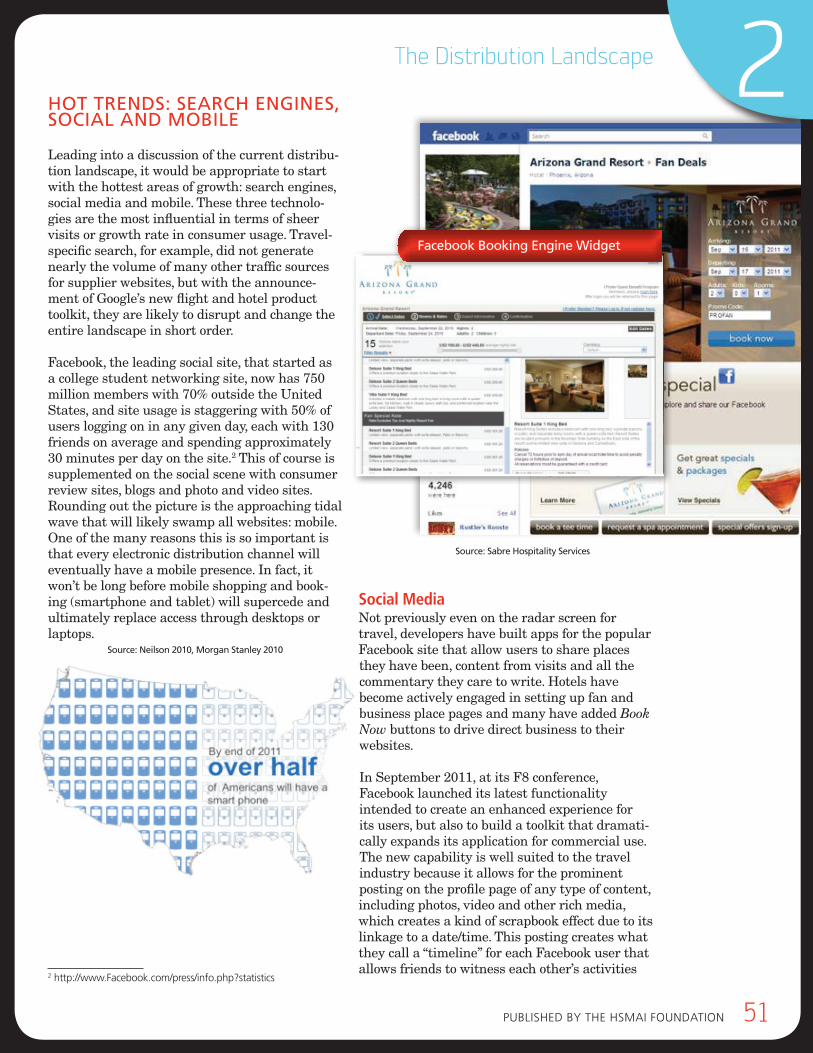
pubLiSHed by THe HSMAi FouNdATioN 51
2The Distribution Landscape
HoT TrendS: SeArcH engIneS, SocIAl And mobIle
Leading into a discussion of the current distribu-tion landscape, it would be appropriate to start with the hottest areas of growth: search engines, social media and mobile. These three technolo-gies are the most influential in terms of sheer visits or growth rate in consumer usage. Travel-specific search, for example, did not generate nearly the volume of many other traffic sources for supplier websites, but with the announce-ment of Google’s new flight and hotel product toolkit, they are likely to disrupt and change the entire landscape in short order.
Facebook, the leading social site, that started as a college student networking site, now has 750 million members with 70% outside the United States, and site usage is staggering with 50% of users logging on in any given day, each with 130 friends on average and spending approximately 30 minutes per day on the site.2 This of course is supplemented on the social scene with consumer review sites, blogs and photo and video sites. Rounding out the picture is the approaching tidal wave that will likely swamp all websites: mobile. One of the many reasons this is so important is that every electronic distribution channel will eventually have a mobile presence. In fact, it won’t be long before mobile shopping and book-ing (smartphone and tablet) will supercede and ultimately replace access through desktops or laptops.
Source: neilson 2010, morgan Stanley 2010
2 http://www.Facebook.com/press/info.php?statistics
social Media Not previously even on the radar screen for travel, developers have built apps for the popular Facebook site that allow users to share places they have been, content from visits and all the commentary they care to write. Hotels have become actively engaged in setting up fan and business place pages and many have added Book Now buttons to drive direct business to their websites.
In September 2011, at its F8 conference, Facebook launched its latest functionality intended to create an enhanced experience for its users, but also to build a toolkit that dramati-cally expands its application for commercial use. The new capability is well suited to the travel industry because it allows for the prominent posting on the profile page of any type of content, including photos, video and other rich media, which creates a kind of scrapbook effect due to its linkage to a date/time. This posting creates what they call a “timeline” for each Facebook user that allows friends to witness each other’s activities
facebook booking engine widget
Source: Sabre Hospitality Services
52 AN AH&LA ANd STR SpeciAL RepoRT
in real time sequence, such as listening to music, watching videos/movies and, of course, recording travel experiences. Content from external mobile apps such as a Nike user’s running times3 or commentary on hotels, can be directly posted to his or her Facebook page. The “like” function that was so popular is being expanded to what they call “gestures” that allows the creation of any verb (besides “like”) to be applied to customized buttons—now users can “watch,” “listen,” “enjoy”; these buttons are likely to be used by commercial entities to label with their brand and product names.4 The way this granular documentation can be applied by hotels to inspire travel, get brand advocates to help friends with planning and generally expand brand messaging seems to be both promising as well as overwhelming in terms of harnessing it for marketing communica-tions and customer engagement.
YouTube recently announced its “Merch Store” in which partners will be allowed to sell merchan-dise, concert tickets and other experience-based products that tie into the videos posted on the site. How long before Book Now buttons appear there?
The power of consumer review sites as a popu-lar form of social media is gaining influence in travel. From the December 2011 spinoff of Trip Advisor (previously an Expedia company), and the emergence of new consumer review-oriented travel sites, it seems that they may create a new type of distribution channel that may be one part each social, inspiration and booking referral site.
TrAvel-SpecIfIc SeArcH engIneS (also known as meta-search)
The world of travel-specific search has recently become a major battleground with Google’s ac-quisition of airfare engine ITA Software followed by the launch of Google’s Hotel Place Ads and Hotel Finder products in July 2011. In Septem-ber 2011, the long-awaited Flight Search tool was released and, even in its first iteration, it has
3 Ad Age digital, Retooled Facebook could give brands more ways to reach consumers, September 22, 20114 www.popsop.com, Facebook rolls out timeline, gestures, apps: new opportunities for brands advertising, September 23, 2011
quite a bit of functionality that is poised to give the existing meta-search engines a run for their money. Interestingly, the initial phase included only direct connections to airline sites, the OTAs and others were delayed in access to the site for advertising purposes. According to Experian Hitwise, in September 2010, almost one-third of traffic to travel-related websites started at Google. This fact alone could mean that some consumers never need to go beyond Google if it can satisfy their general search and their travel search objectives.
Source: Tnooz
The early form of meta-search initially looked like a rate comparison tool to help travelers find lower airfares and less costly hotels; Kayak was the leader in this niche market when it launched in 2004, and in late 2007 acquired its primary competitor Sidestep. In 2008, Microsoft acquired Farecast.com that was rebranded as Bing Travel and provides similar functionality as Kayak, along with the ability to predict when airfares will be lowest.
Kayak reported that 86% of the searches on its site for Q1’11 were for air travel and it depends heavily on ITA Software for this service raising a concern that, in spite of “consent decree” restric-tions placed on it with regard to the acquisition, Google may still limit access to Kayak since it is now a competitor.
Adding to this conflict are many others playing in the same space: the OTAs that have served as a type of search engine for travel; Vayama, with a more international focus; Skyscanner in Scotland and Dohop from Iceland focus on air; Fly.com was launched by Travelzoo in February 2009 in the United States and 2010 in Europe; Adioso is based in Australia; Trivago launched in Germany in 2007; and Hipmunk, launched in early 2011 in the United States. Hipmunk is a clever model, with a memorable chipmunk logo, that promises to take the “agony” out of travel by offering op-tions in terms of price and comfort, not just price and schedule; following its initial focus on air, it has since added hotel options.
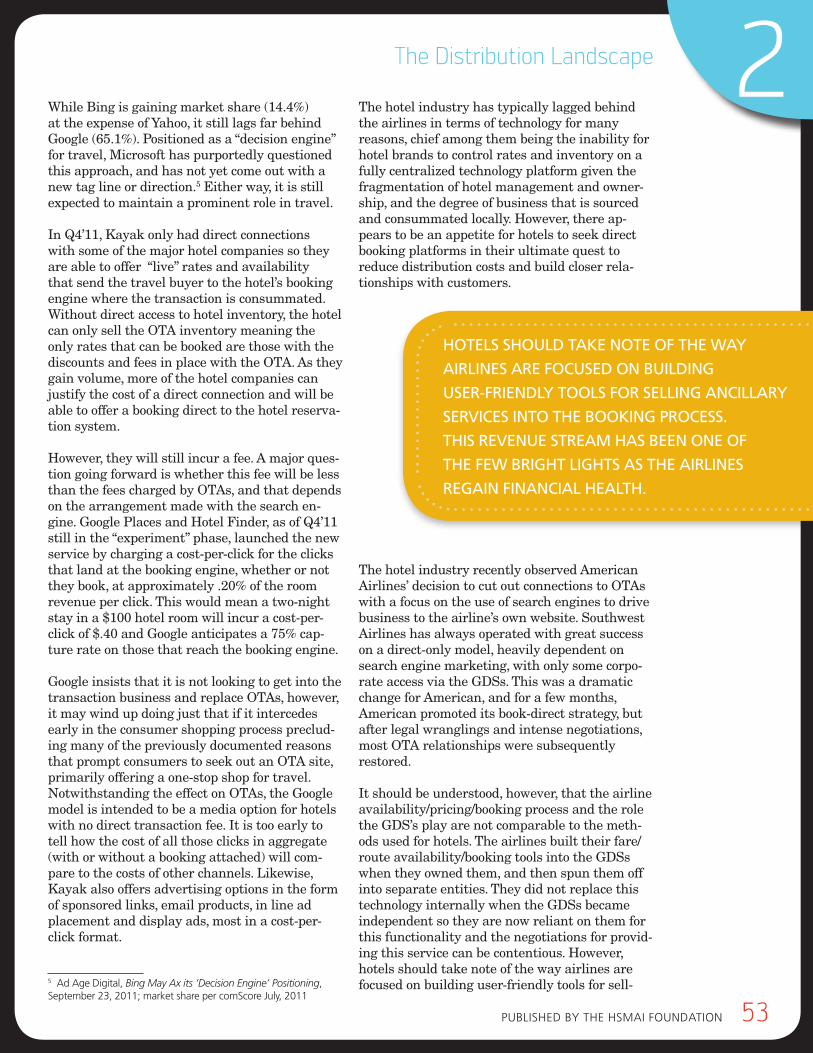
pubLiSHed by THe HSMAi FouNdATioN 53
2The Distribution Landscape
While Bing is gaining market share (14.4%) at the expense of Yahoo, it still lags far behind Google (65.1%). Positioned as a “decision engine” for travel, Microsoft has purportedly questioned this approach, and has not yet come out with a new tag line or direction.5 Either way, it is still expected to maintain a prominent role in travel.
In Q4’11, Kayak only had direct connections with some of the major hotel companies so they are able to offer “live” rates and availability that send the travel buyer to the hotel’s booking engine where the transaction is consummated. Without direct access to hotel inventory, the hotel can only sell the OTA inventory meaning the only rates that can be booked are those with the discounts and fees in place with the OTA. As they gain volume, more of the hotel companies can justify the cost of a direct connection and will be able to offer a booking direct to the hotel reserva-tion system.
However, they will still incur a fee. A major ques-tion going forward is whether this fee will be less than the fees charged by OTAs, and that depends on the arrangement made with the search en-gine. Google Places and Hotel Finder, as of Q4’11 still in the “experiment” phase, launched the new service by charging a cost-per-click for the clicks that land at the booking engine, whether or not they book, at approximately .20% of the room revenue per click. This would mean a two-night stay in a $100 hotel room will incur a cost-per-click of $.40 and Google anticipates a 75% cap-ture rate on those that reach the booking engine.
Google insists that it is not looking to get into the transaction business and replace OTAs, however, it may wind up doing just that if it intercedes early in the consumer shopping process preclud-ing many of the previously documented reasons that prompt consumers to seek out an OTA site, primarily offering a one-stop shop for travel. Notwithstanding the effect on OTAs, the Google model is intended to be a media option for hotels with no direct transaction fee. It is too early to tell how the cost of all those clicks in aggregate (with or without a booking attached) will com-pare to the costs of other channels. Likewise, Kayak also offers advertising options in the form of sponsored links, email products, in line ad placement and display ads, most in a cost-per-click format.
5 Ad Age digital, Bing May Ax its ‘Decision Engine’ Positioning, September 23, 2011; market share per comScore July, 2011
The hotel industry has typically lagged behind the airlines in terms of technology for many reasons, chief among them being the inability for hotel brands to control rates and inventory on a fully centralized technology platform given the fragmentation of hotel management and owner-ship, and the degree of business that is sourced and consummated locally. However, there ap-pears to be an appetite for hotels to seek direct booking platforms in their ultimate quest to reduce distribution costs and build closer rela-tionships with customers.
The hotel industry recently observed American Airlines’ decision to cut out connections to OTAs with a focus on the use of search engines to drive business to the airline’s own website. Southwest Airlines has always operated with great success on a direct-only model, heavily dependent on search engine marketing, with only some corpo-rate access via the GDSs. This was a dramatic change for American, and for a few months, American promoted its book-direct strategy, but after legal wranglings and intense negotiations, most OTA relationships were subsequently restored.
It should be understood, however, that the airline availability/pricing/booking process and the role the GDS’s play are not comparable to the meth-ods used for hotels. The airlines built their fare/route availability/booking tools into the GDSs when they owned them, and then spun them off into separate entities. They did not replace this technology internally when the GDSs became independent so they are now reliant on them for this functionality and the negotiations for provid-ing this service can be contentious. However, hotels should take note of the way airlines are focused on building user-friendly tools for sell-
HoTelS SHoUld TAke noTe of THe wAy
AIrlIneS Are focUSed on bUIldIng
USer-frIendly ToolS for SellIng AncIllAry
ServIceS InTo THe bookIng proceSS.
THIS revenUe STreAm HAS been one of
THe few brIgHT lIgHTS AS THe AIrlIneS
regAIn fInAncIAl HeAlTH.
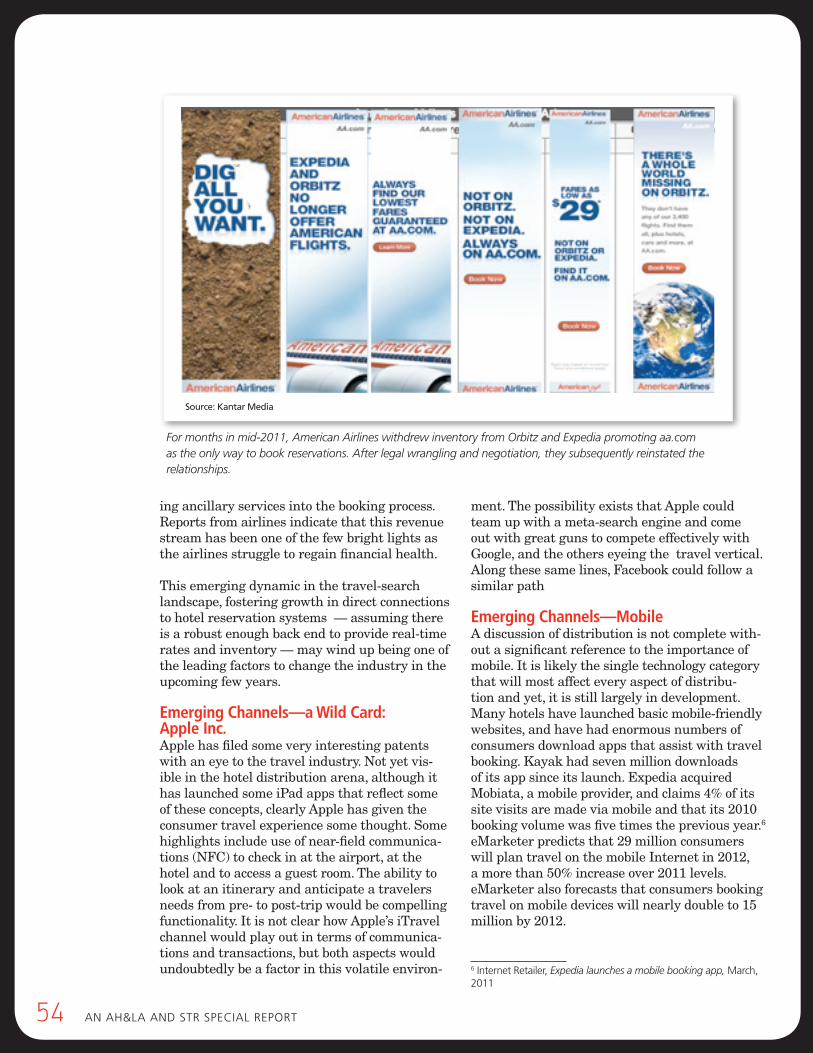
54 AN AH&LA ANd STR SpeciAL RepoRT
ing ancillary services into the booking process. Reports from airlines indicate that this revenue stream has been one of the few bright lights as the airlines struggle to regain financial health.
This emerging dynamic in the travel-search landscape, fostering growth in direct connections to hotel reservation systems — assuming there is a robust enough back end to provide real-time rates and inventory — may wind up being one of the leading factors to change the industry in the upcoming few years.
emerging channels—a Wild card: apple Inc.Apple has filed some very interesting patents with an eye to the travel industry. Not yet vis-ible in the hotel distribution arena, although it has launched some iPad apps that reflect some of these concepts, clearly Apple has given the consumer travel experience some thought. Some highlights include use of near-field communica-tions (NFC) to check in at the airport, at the hotel and to access a guest room. The ability to look at an itinerary and anticipate a travelers needs from pre- to post-trip would be compelling functionality. It is not clear how Apple’s iTravel channel would play out in terms of communica-tions and transactions, but both aspects would undoubtedly be a factor in this volatile environ-
ment. The possibility exists that Apple could team up with a meta-search engine and come out with great guns to compete effectively with Google, and the others eyeing the travel vertical. Along these same lines, Facebook could follow a similar path
emerging channels—MobileA discussion of distribution is not complete with-out a significant reference to the importance of mobile. It is likely the single technology category that will most affect every aspect of distribu-tion and yet, it is still largely in development. Many hotels have launched basic mobile-friendly websites, and have had enormous numbers of consumers download apps that assist with travel booking. Kayak had seven million downloads of its app since its launch. Expedia acquired Mobiata, a mobile provider, and claims 4% of its site visits are made via mobile and that its 2010 booking volume was five times the previous year.6 eMarketer predicts that 29 million consumers will plan travel on the mobile Internet in 2012, a more than 50% increase over 2011 levels. eMarketer also forecasts that consumers booking travel on mobile devices will nearly double to 15 million by 2012.
6 internet Retailer, Expedia launches a mobile booking app, March, 2011
For months in mid-2011, American Airlines withdrew inventory from Orbitz and Expedia promoting aa.com as the only way to book reservations. After legal wrangling and negotiation, they subsequently reinstated the relationships.
Source: kantar media
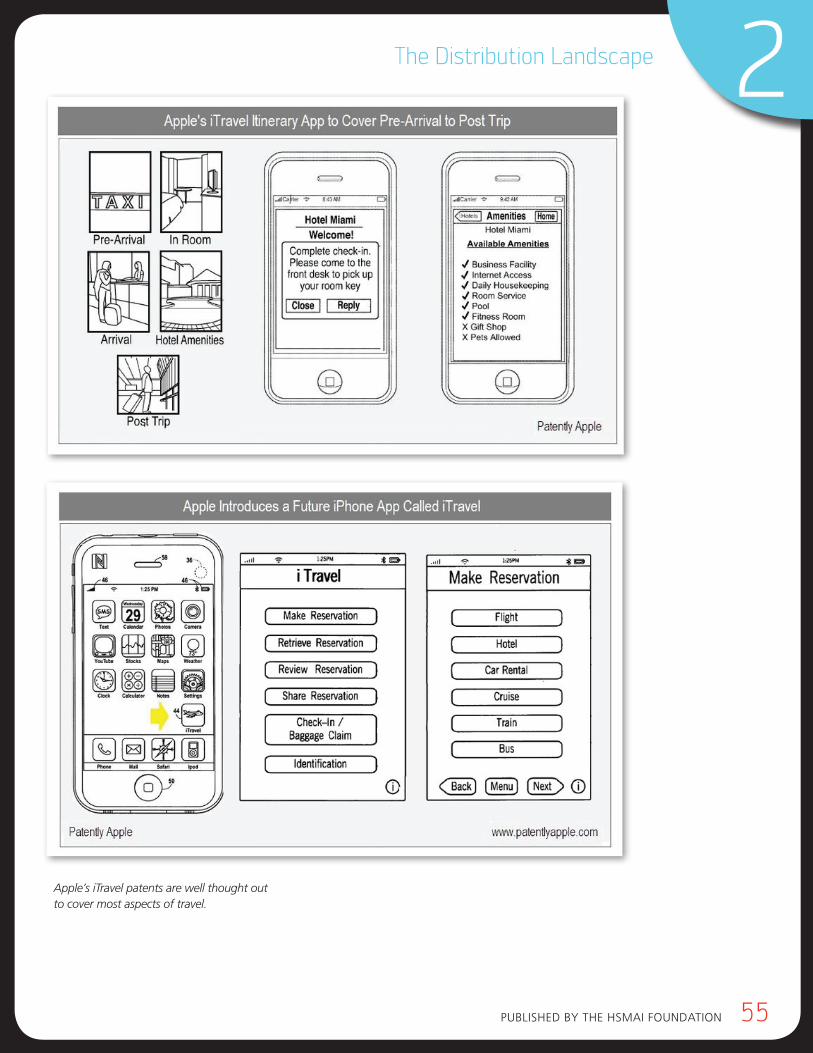
pubLiSHed by THe HSMAi FouNdATioN 55
2The Distribution Landscape
Apple’s iTravel patents are well thought out to cover most aspects of travel.
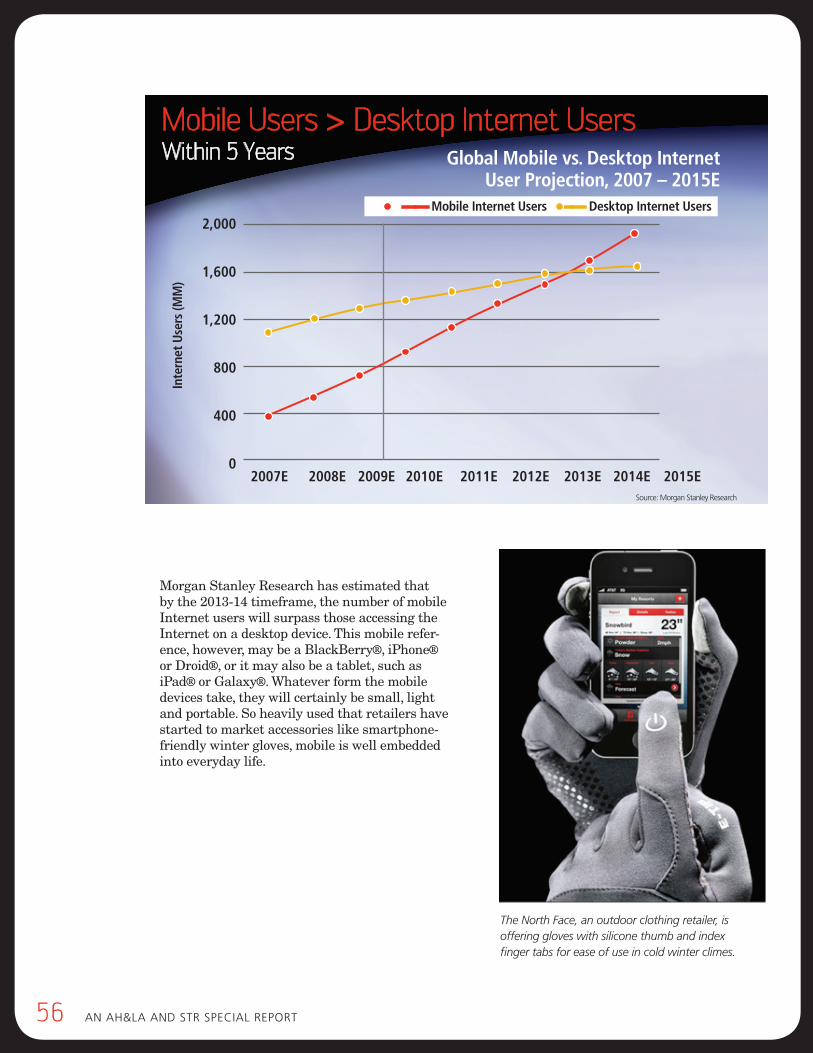
56 AN AH&LA ANd STR SpeciAL RepoRT
Morgan Stanley Research has estimated that by the 2013-14 timeframe, the number of mobile Internet users will surpass those accessing the Internet on a desktop device. This mobile refer-ence, however, may be a BlackBerry®, iPhone® or Droid®, or it may also be a tablet, such as iPad® or Galaxy®. Whatever form the mobile devices take, they will certainly be small, light and portable. So heavily used that retailers have started to market accessories like smartphone-friendly winter gloves, mobile is well embedded into everyday life.
Mobile Users > Desktop Internet Users
Within 5 Years
2,000
1,600
1,200
800
400
0 2007e 2008e 2009e 2010e 2011e 2012e 2013e 2014e 2015e
Global Mobile vs. desktop Internet user Projection, 2007 – 2015e
—— Mobile Internet users —— desktop Internet users
Source: Morgan Stanley Research
Inte
rnet
use
rs (M
M)
The North Face, an outdoor clothing retailer, is offering gloves with silicone thumb and index finger tabs for ease of use in cold winter climes.
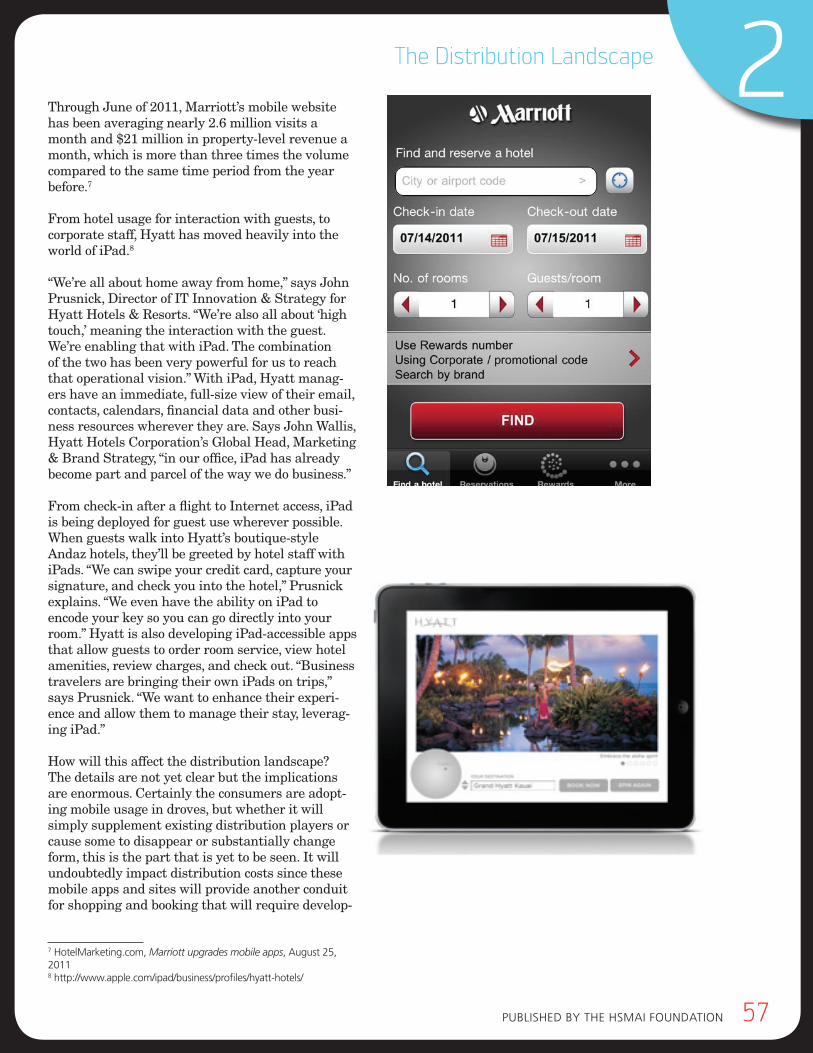
pubLiSHed by THe HSMAi FouNdATioN 57
2The Distribution Landscape
Through June of 2011, Marriott’s mobile website has been averaging nearly 2.6 million visits a month and $21 million in property-level revenue a month, which is more than three times the volume compared to the same time period from the year before.7
From hotel usage for interaction with guests, to corporate staff, Hyatt has moved heavily into the world of iPad.8
“We’re all about home away from home,” says John Prusnick, Director of IT Innovation & Strategy for Hyatt Hotels & Resorts. “We’re also all about ‘high touch,’ meaning the interaction with the guest. We’re enabling that with iPad. The combination of the two has been very powerful for us to reach that operational vision.” With iPad, Hyatt manag-ers have an immediate, full-size view of their email, contacts, calendars, financial data and other busi-ness resources wherever they are. Says John Wallis, Hyatt Hotels Corporation’s Global Head, Marketing & Brand Strategy, “in our office, iPad has already become part and parcel of the way we do business.”
From check-in after a flight to Internet access, iPad is being deployed for guest use wherever possible. When guests walk into Hyatt’s boutique-style Andaz hotels, they’ll be greeted by hotel staff with iPads. “We can swipe your credit card, capture your signature, and check you into the hotel,” Prusnick explains. “We even have the ability on iPad to encode your key so you can go directly into your room.” Hyatt is also developing iPad-accessible apps that allow guests to order room service, view hotel amenities, review charges, and check out. “Business travelers are bringing their own iPads on trips,” says Prusnick. “We want to enhance their experi-ence and allow them to manage their stay, leverag-ing iPad.”
How will this affect the distribution landscape? The details are not yet clear but the implications are enormous. Certainly the consumers are adopt-ing mobile usage in droves, but whether it will simply supplement existing distribution players or cause some to disappear or substantially change form, this is the part that is yet to be seen. It will undoubtedly impact distribution costs since these mobile apps and sites will provide another conduit for shopping and booking that will require develop-
7 HotelMarketing.com, Marriott upgrades mobile apps, August 25, 20118 http://www.apple.com/ipad/business/profiles/hyatt-hotels/
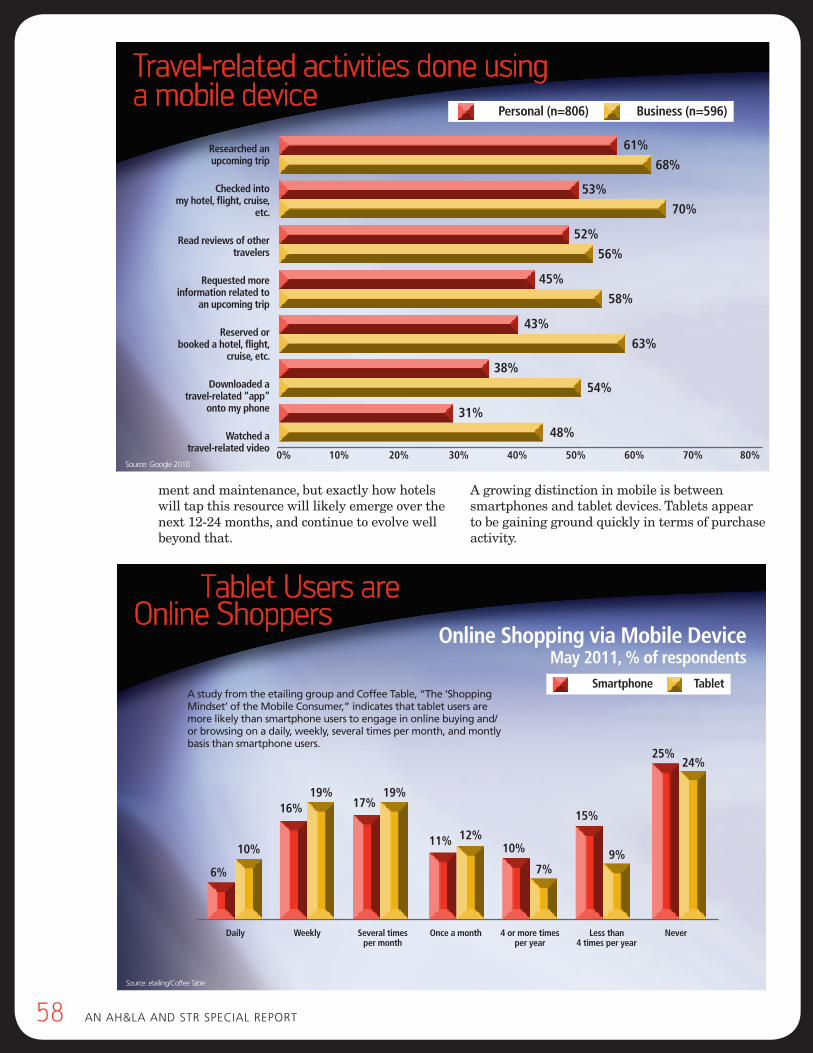
58 AN AH&LA ANd STR SpeciAL RepoRT
ment and maintenance, but exactly how hotels will tap this resource will likely emerge over the next 12-24 months, and continue to evolve well beyond that.
A growing distinction in mobile is between smartphones and tablet devices. Tablets appear to be gaining ground quickly in terms of purchase activity.
Travel-related activities done using a mobile device
researched an upcoming trip
checked into my hotel, flight, cruise,
etc.
read reviews of other travelers
requested more information related to
an upcoming trip
reserved or booked a hotel, flight,
cruise, etc.
downloaded a travel-related “app”
onto my phone
Watched a travel-related video
0% 10% 20% 30% 40% 50% 60% 70% 80%
Personal (n=806) business (n=596)
Source: Google 2010
61%
68%
53%
70%
52%
56%
45%
58%
43%
63%
38%
54%
31%
48%
Tablet Users are Online Shoppers
daily Weekly several times once a month 4 or more times less than never per month per year 4 times per year
smartphone tablet
Source: etailing/coffee Table
6%
10%
16%19%
17%19%
11% 12%10%
7%
15%
9%
25%24%
online shopping via Mobile deviceMay 2011, % of respondents
A study from the etailing group and coffee Table, “The ‘Shopping mindset’ of the mobile consumer,” indicates that tablet users are more likely than smartphone users to engage in online buying and/or browsing on a daily, weekly, several times per month, and montly basis than smartphone users.
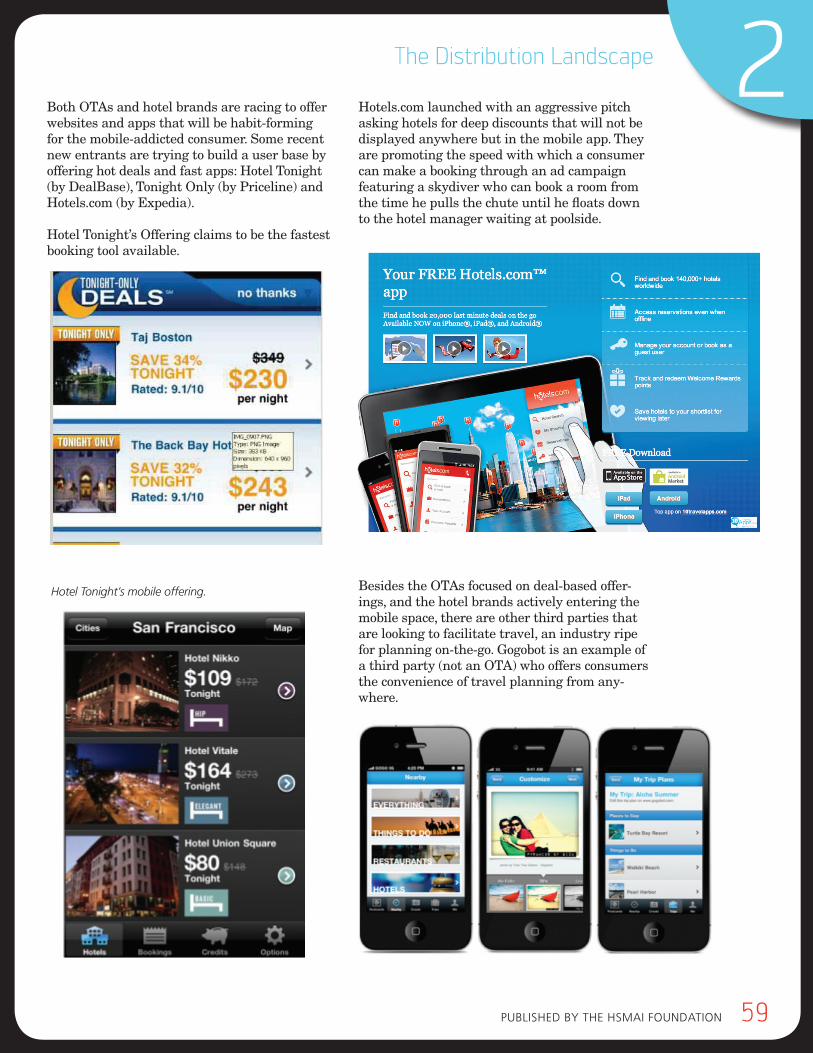
pubLiSHed by THe HSMAi FouNdATioN 59
2The Distribution Landscape
Both OTAs and hotel brands are racing to offer websites and apps that will be habit-forming for the mobile-addicted consumer. Some recent new entrants are trying to build a user base by offering hot deals and fast apps: Hotel Tonight (by DealBase), Tonight Only (by Priceline) and Hotels.com (by Expedia).
Hotel Tonight’s Offering claims to be the fastest booking tool available.
Hotels.com launched with an aggressive pitch asking hotels for deep discounts that will not be displayed anywhere but in the mobile app. They are promoting the speed with which a consumer can make a booking through an ad campaign featuring a skydiver who can book a room from the time he pulls the chute until he floats down to the hotel manager waiting at poolside.
Besides the OTAs focused on deal-based offer-ings, and the hotel brands actively entering the mobile space, there are other third parties that are looking to facilitate travel, an industry ripe for planning on-the-go. Gogobot is an example of a third party (not an OTA) who offers consumers the convenience of travel planning from any-where.
Hotel Tonight’s mobile offering.
60 AN AH&LA ANd STR SpeciAL RepoRT
A top priority for those responsible for hotel in-dustry distribution strategy at a corporate level, or at the hotel level in the independent hotel world, is to begin work on a mobile plan. Do as much research as possible and anticipate that mobile will be at the core of all consumer online activity in a very short time, and that travelers, often early adopters of technology, will expect ap-plications to be purpose built for mobile. It seems the approach has to address both the smartphone as well as the tablet as devices of choice for shop-ping and purchasing. Some new voice-enabled or map-based tools may further enhance the capa-bility of the mobile sites to the point where they become a more common point of entry on a travel search than the traditional web browser using search tools. Whatever form the mobile tools take, there is bound to be a shakeout in the mobile space and hotels will want to be sure that they make the cut or third parties will control a vital shopping portal.
onlIne TrAvel AgenTS (oTAs)
Merchant Model/WholesalerThese sites primarily employ net wholesale rates. They operate as a traditional wholesaler from a rate and markup perspective, but they are very different in that they communicate and relay reservations entirely online. The “merchant model” means that a hotel provides a third party vendor a net rate that is often 17% to 35% below retail levels. The merchant model website (it is an online wholesale travel agency) then decides what rate to post on its site to sell to the con-sumer. Some hotels have negotiated limits on markup for different rooms at different times. Others have not made any prior arrangement
with the website when they sell the website net rates. The consumer prepays for the room and the online vendor pays the hotel later for the agreed net rate.
While the merchant model is employed as a pri-mary business, these sites often offer retail sales also. Therefore, hotels that are not willing to offer net rates online can still take advantage of the distribution through these sites.
Typically, the hotels in the merchant program are likely to be more visible and more prominently featured than those in the retail programs. Originally, when hotels did not participate consis-tently (e.g., they withheld inventory during peak periods), the OTA did not support these hotels consistently or declined to feature the hotel when the hotel’s wanted to supplement their own direct channels. These agencies seek year-round part-nerships to ensure they have inventory “on their shelves” at all times and that the consumer views them as a reliable storefront to deliver fresh and desirable products. To this end, many of the more recent agreements include last room availability or base allocation requirements to protect the OTA from being cut out during times when the hotels can fill with direct channels. The merchant model, prepaid by the consumer at a 17% to 35% discount, is more lucrative to the OTA in terms of margin as well as “float” (due to the delay in the OTA transferring the funds to the hotel) than the retail model where the hotel rate is paid by the consumer upon check-out after which the hotel generates a commission check of only 10%. Of course, some OTAs now offer a single use credit card to the hotels in which the proceeds of room sales are paid more quickly, but the hotel has to pay the credit card transaction fee which can be 2% of the sale and can eat further into the mar-gins. Expedia, Travelocity and Orbitz are some of the most well-known sites that are dominantly selling through a merchant model.
Another important and little-known fact about these high volume sites is that a very large percentage of the business they book is handled off-line through 800 number customer service call centers. In past years, Expedia and Travelocity have reported informally at industry conferences that upwards of 30% to 40% of their volume com-monly passes through an 800 number call center for additional servicing or to finalize a booking.
Some new voIce-enAbled or mAp-bASed
ToolS mAy fUrTHer enHAnce THe
cApAbIlITy of THe mobIle SITeS To THe
poInT wHere THey become A more
common poInT of enTry on A TrAvel
SeArcH THAn THe TrAdITIonAl web
browSer USIng SeArcH ToolS.
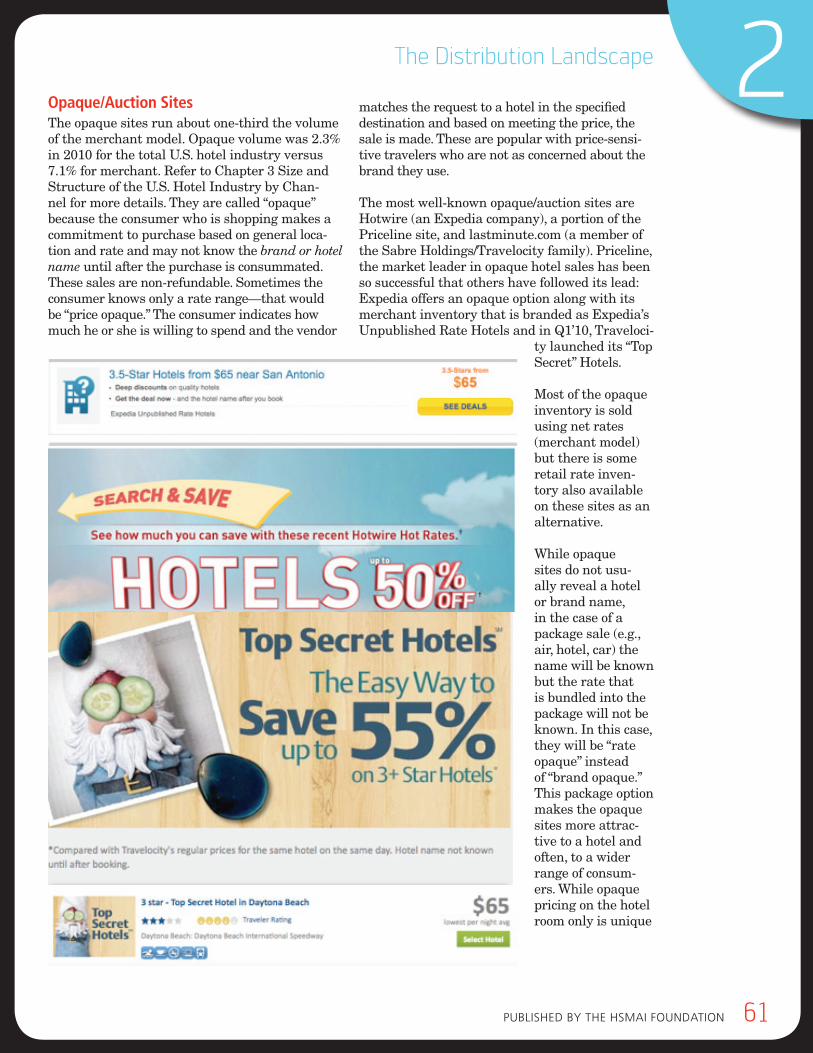
pubLiSHed by THe HSMAi FouNdATioN 61
2The Distribution Landscape
opaque/auction sitesThe opaque sites run about one-third the volume of the merchant model. Opaque volume was 2.3% in 2010 for the total U.S. hotel industry versus 7.1% for merchant. Refer to Chapter 3 Size and Structure of the U.S. Hotel Industry by Chan-nel for more details. They are called “opaque” because the consumer who is shopping makes a commitment to purchase based on general loca-tion and rate and may not know the brand or hotel name until after the purchase is consummated. These sales are non-refundable. Sometimes the consumer knows only a rate range—that would be “price opaque.” The consumer indicates how much he or she is willing to spend and the vendor
matches the request to a hotel in the specified destination and based on meeting the price, the sale is made. These are popular with price-sensi-tive travelers who are not as concerned about the brand they use.
The most well-known opaque/auction sites are Hotwire (an Expedia company), a portion of the Priceline site, and lastminute.com (a member of the Sabre Holdings/Travelocity family). Priceline, the market leader in opaque hotel sales has been so successful that others have followed its lead: Expedia offers an opaque option along with its merchant inventory that is branded as Expedia’s Unpublished Rate Hotels and in Q1’10, Traveloci-
ty launched its “Top Secret” Hotels.
Most of the opaque inventory is sold using net rates (merchant model) but there is some retail rate inven-tory also available on these sites as an alternative.
While opaque sites do not usu-ally reveal a hotel or brand name, in the case of a package sale (e.g., air, hotel, car) the name will be known but the rate that is bundled into the package will not be known. In this case, they will be “rate opaque” instead of “brand opaque.” This package option makes the opaque sites more attrac-tive to a hotel and often, to a wider range of consum-ers. While opaque pricing on the hotel room only is unique
62 AN AH&LA ANd STR SpeciAL RepoRT
to a few sites that use this model, this opaque ap-proach for package sales is commonly offered by most major merchant model sites.
A recent entry to the market in Q3’11, with another angle on the auction process is www.backbid.com, which allows consumers to tell any hotels in a destination how much they are willing to pay (even if they are already holding a reservation) and the site becomes a forum for ho-tels to bid against one another to pursue the same business and to encourage those travelers with reservations to cancel the existing booking in favor of the “better deal” they will get through this site. It is still too early to tell if this model will catch on with suppliers and consumers. A 2010 startup that announced it was closing down in December 2011, www.OffandAway.com, offered a bid-to-win auction model and allowed all bidders who didn’t win the auction to use the money they spent bid-ding up the auction price (at $1 per bid) toward a “private sale” purchase of a hotel room.
retail travel WebsitesThere are those sites that have been online-only and offer retail as an option to travelers, and those that started as bricks-and-mortar agen-cies that just moved their operation online and continued to service clients both ways. Hotels provide retail rates and inventory, bookings are made and the hotels pay the usual commissions in the 10% range after the guest has departed, based on the room revenue paid. Most of the OTAs favor the merchant model but allow retail sales for those customers who do not want to prepay for a room or to gain coverage in markets in which hotels do not want to enter into a mer-
chant agreement. Less densely populated areas and remote resorts are most often the destina-tions offered through a retail model. Booking.com, a Priceline company that dominates in Europe with a retail model, entered the United States market aggressively in 2010 and gained market share very quickly to become the domi-nant retail OTA.
flASH SAleS And HoT deAlSGrowing at a fast clip in response to the 2008-10 recession, deal-oriented offerings have become “all the rage”. In fact, it was so wildly successful in its early introduction in local markets with retailers like restaurants and hair salons that these startup companies quickly added hotels. Most of the OTAs have launched hot deals of their own in some form. One of the originals in travel is the TravelZoo model, which was built on an email list of consumers looking to be noti-fied about special deals, followed quickly with TravelTicker by Expedia, and Top Ten Deals of the Week by Orbitz. Now the retail-oriented GroupOn is selling online coupons for discounted hotel rooms, usually at 50% off retail. Expedia announced a partnership with GroupOn in 2011 to handle their travel offers. These models split the revenue with the supplier, which ends up providing the hotel with 25%-50% of its retail rate that is typically paid after the guest departs. Some coupon-based, and others with fairly loose membership requirements, sites such as Jetset-ter, LivingSocial, HomeRun, RueLaLa and others claim to offer a venue to reach new consumers who are not yet aware of a hotel.
It is not clear if this model is sustainable, if there is any potential repeat business and, for those ho-tels with ancillary services, if there is additional spending beyond the room rate from these new customers. This may be a case in whichthese consumers are so enamored of this newmodel that they are content to wait for the nextflash sale — sales that seem to be coming at them in a torrent — not bothering to go back to any they have visited in the past at a price more than the “half off” they are growing to expect.(Refer to the Costs and Benefits of Distribution chapter for some samples of ancillary spend and repeat usage by channel).
Claiming to inspire travel, those sites with higher quality content may begin to morph into travel inspiration or planning sites when the number of hotels willing to offer deep discounts
THIS mAy be A cASe In wHIcH THeSe con-
SUmerS Are So enAmored of THIS new
model THAT THey Are conTenT To wAIT
for THe nexT flASH SAle — SAleS THAT
Seem To be comIng AT THem In A Tor-
renT — noT boTHerIng To go bAck To
Any THey HAve vISITed In THe pAST AT A
prIce more THAn THe “HAlf off” THey Are
growIng To expecT.
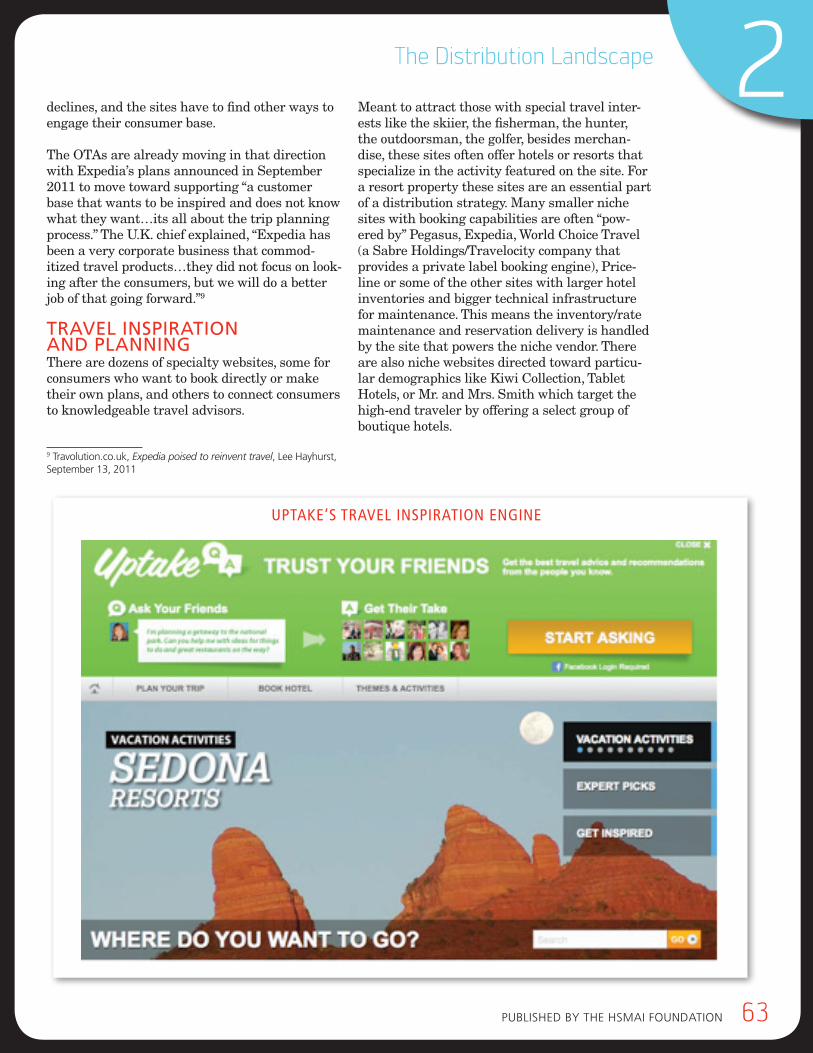
pubLiSHed by THe HSMAi FouNdATioN 63
2The Distribution Landscape
declines, and the sites have to find other ways to engage their consumer base.
The OTAs are already moving in that direction with Expedia’s plans announced in September 2011 to move toward supporting “a customer base that wants to be inspired and does not know what they want…its all about the trip planning process.” The U.K. chief explained, “Expedia has been a very corporate business that commod-itized travel products…they did not focus on look-ing after the consumers, but we will do a better job of that going forward.”9
TrAvel InSpIrATIon And plAnnIngThere are dozens of specialty websites, some for consumers who want to book directly or make their own plans, and others to connect consumers to knowledgeable travel advisors.
9 Travolution.co.uk, Expedia poised to reinvent travel, Lee Hayhurst, September 13, 2011
Meant to attract those with special travel inter-ests like the skiier, the fisherman, the hunter, the outdoorsman, the golfer, besides merchan-dise, these sites often offer hotels or resorts that specialize in the activity featured on the site. For a resort property these sites are an essential part of a distribution strategy. Many smaller niche sites with booking capabilities are often “pow-ered by” Pegasus, Expedia, World Choice Travel (a Sabre Holdings/Travelocity company that provides a private label booking engine), Price-line or some of the other sites with larger hotel inventories and bigger technical infrastructure for maintenance. This means the inventory/rate maintenance and reservation delivery is handled by the site that powers the niche vendor. There are also niche websites directed toward particu-lar demographics like Kiwi Collection, Tablet Hotels, or Mr. and Mrs. Smith which target the high-end traveler by offering a select group of boutique hotels.
uPTake’S Travel inSPiraTion engine
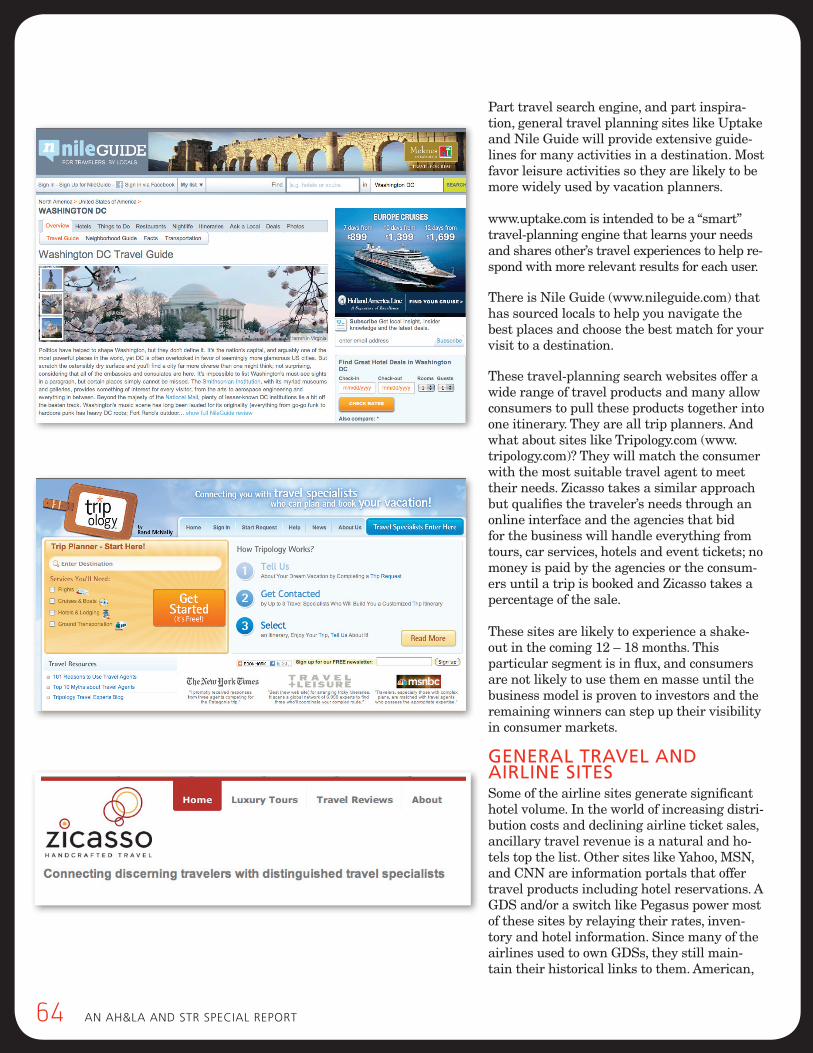
64 AN AH&LA ANd STR SpeciAL RepoRT
Part travel search engine, and part inspira-tion, general travel planning sites like Uptake and Nile Guide will provide extensive guide-lines for many activities in a destination. Most favor leisure activities so they are likely to be more widely used by vacation planners.
www.uptake.com is intended to be a “smart” travel-planning engine that learns your needs and shares other’s travel experiences to help re-spond with more relevant results for each user.
There is Nile Guide (www.nileguide.com) that has sourced locals to help you navigate the best places and choose the best match for your visit to a destination.
These travel-planning search websites offer a wide range of travel products and many allow consumers to pull these products together into one itinerary. They are all trip planners. And what about sites like Tripology.com (www.tripology.com)? They will match the consumer with the most suitable travel agent to meet their needs. Zicasso takes a similar approach but qualifies the traveler’s needs through an online interface and the agencies that bid for the business will handle everything from tours, car services, hotels and event tickets; no money is paid by the agencies or the consum-ers until a trip is booked and Zicasso takes a percentage of the sale.
These sites are likely to experience a shake-out in the coming 12 – 18 months. This particular segment is in flux, and consumers are not likely to use them en masse until the business model is proven to investors and the remaining winners can step up their visibility in consumer markets.
generAl TrAvel And AIrlIne SITeSSome of the airline sites generate significant hotel volume. In the world of increasing distri-bution costs and declining airline ticket sales, ancillary travel revenue is a natural and ho-tels top the list. Other sites like Yahoo, MSN, and CNN are information portals that offer travel products including hotel reservations. A GDS and/or a switch like Pegasus power most of these sites by relaying their rates, inven-tory and hotel information. Since many of the airlines used to own GDSs, they still main-tain their historical links to them. American,
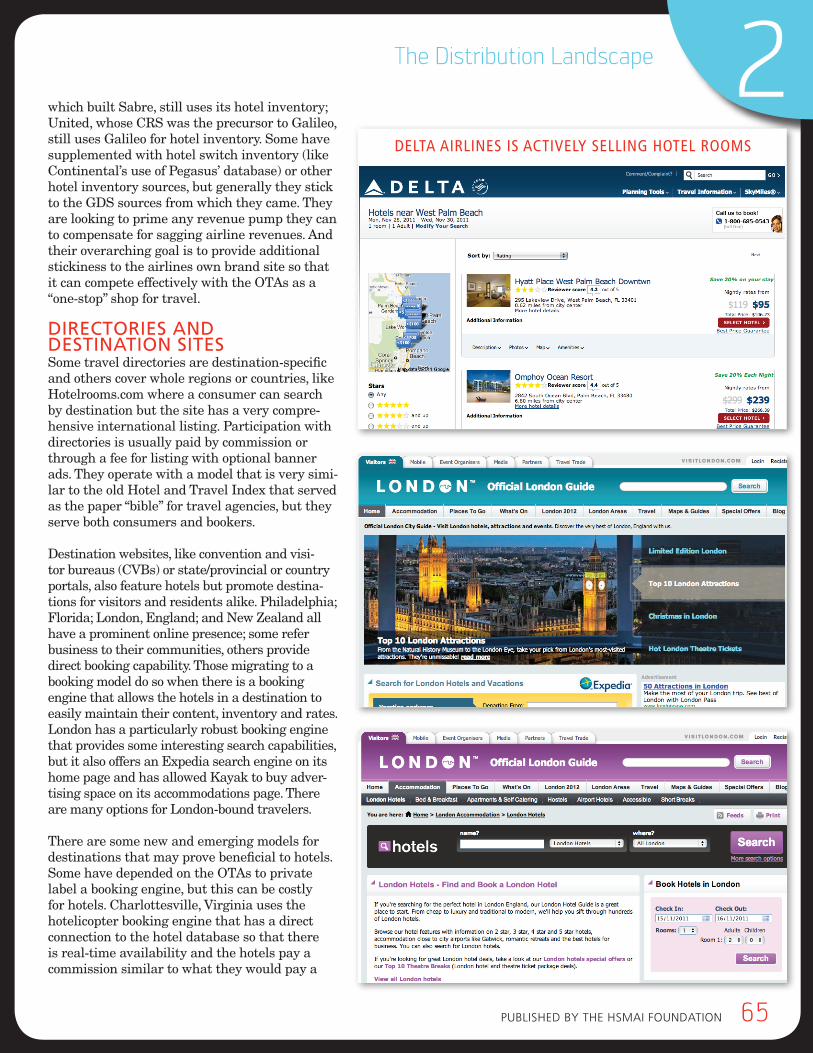
pubLiSHed by THe HSMAi FouNdATioN 65
2The Distribution Landscape
which built Sabre, still uses its hotel inventory; United, whose CRS was the precursor to Galileo, still uses Galileo for hotel inventory. Some have supplemented with hotel switch inventory (like Continental’s use of Pegasus’ database) or other hotel inventory sources, but generally they stick to the GDS sources from which they came. They are looking to prime any revenue pump they can to compensate for sagging airline revenues. And their overarching goal is to provide additional stickiness to the airlines own brand site so that it can compete effectively with the OTAs as a “one-stop” shop for travel.
dIrecTorIeS And deSTInATIon SITeSSome travel directories are destination-specific and others cover whole regions or countries, like Hotelrooms.com where a consumer can search by destination but the site has a very compre-hensive international listing. Participation with directories is usually paid by commission or through a fee for listing with optional banner ads. They operate with a model that is very simi-lar to the old Hotel and Travel Index that served as the paper “bible” for travel agencies, but they serve both consumers and bookers.
Destination websites, like convention and visi-tor bureaus (CVBs) or state/provincial or country portals, also feature hotels but promote destina-tions for visitors and residents alike. Philadelphia; Florida; London, England; and New Zealand all have a prominent online presence; some refer business to their communities, others provide direct booking capability. Those migrating to a booking model do so when there is a booking engine that allows the hotels in a destination to easily maintain their content, inventory and rates. London has a particularly robust booking engine that provides some interesting search capabilities, but it also offers an Expedia search engine on its home page and has allowed Kayak to buy adver-tising space on its accommodations page. There are many options for London-bound travelers.
There are some new and emerging models for destinations that may prove beneficial to hotels. Some have depended on the OTAs to private label a booking engine, but this can be costly for hotels. Charlottesville, Virginia uses the hotelicopter booking engine that has a direct connection to the hotel database so that there is real-time availability and the hotels pay a commission similar to what they would pay a
DelTa airlineS iS acTively Selling hoTel roomS
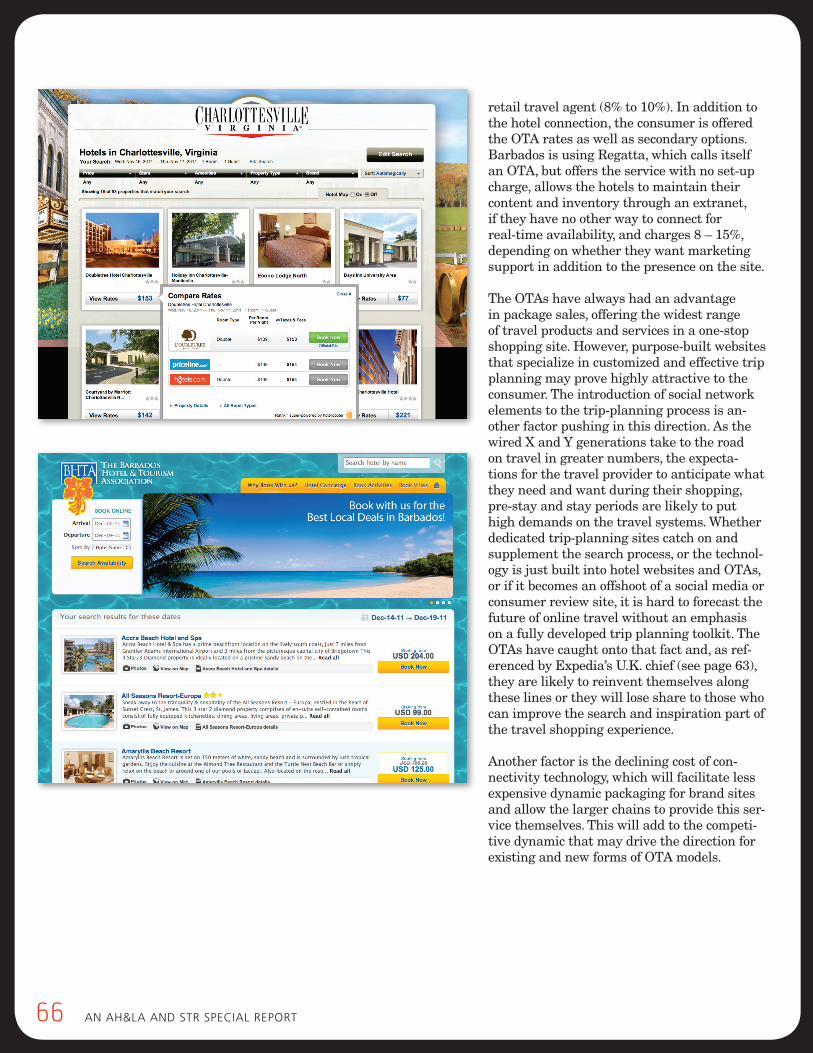
66 AN AH&LA ANd STR SpeciAL RepoRT
retail travel agent (8% to 10%). In addition to the hotel connection, the consumer is offered the OTA rates as well as secondary options. Barbados is using Regatta, which calls itself an OTA, but offers the service with no set-up charge, allows the hotels to maintain their content and inventory through an extranet, if they have no other way to connect for real-time availability, and charges 8 – 15%, depending on whether they want marketing support in addition to the presence on the site.
The OTAs have always had an advantage in package sales, offering the widest range of travel products and services in a one-stop shopping site. However, purpose-built websites that specialize in customized and effective trip planning may prove highly attractive to the consumer. The introduction of social network elements to the trip-planning process is an-other factor pushing in this direction. As the wired X and Y generations take to the road on travel in greater numbers, the expecta-tions for the travel provider to anticipate what they need and want during their shopping, pre-stay and stay periods are likely to put high demands on the travel systems. Whether dedicated trip-planning sites catch on and supplement the search process, or the technol-ogy is just built into hotel websites and OTAs, or if it becomes an offshoot of a social media or consumer review site, it is hard to forecast the future of online travel without an emphasis on a fully developed trip planning toolkit. The OTAs have caught onto that fact and, as ref-erenced by Expedia’s U.K. chief (see page 63), they are likely to reinvent themselves along these lines or they will lose share to those who can improve the search and inspiration part of the travel shopping experience.
Another factor is the declining cost of con-nectivity technology, which will facilitate less expensive dynamic packaging for brand sites and allow the larger chains to provide this ser-vice themselves. This will add to the competi-tive dynamic that may drive the direction for existing and new forms of OTA models.
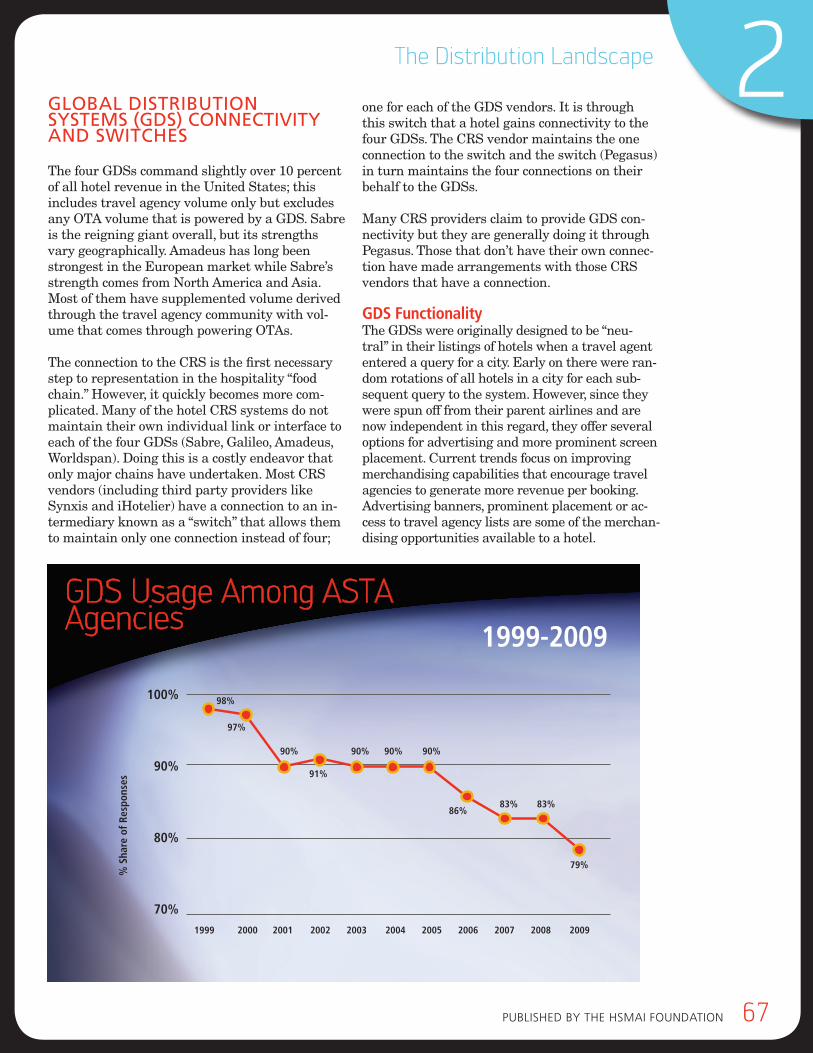
pubLiSHed by THe HSMAi FouNdATioN 67
2The Distribution Landscape
globAl dISTrIbUTIon SySTemS (gdS) connecTIvITy And SwITcHeS
The four GDSs command slightly over 10 percent of all hotel revenue in the United States; this includes travel agency volume only but excludes any OTA volume that is powered by a GDS. Sabre is the reigning giant overall, but its strengths vary geographically. Amadeus has long been strongest in the European market while Sabre’s strength comes from North America and Asia. Most of them have supplemented volume derived through the travel agency community with vol-ume that comes through powering OTAs.
The connection to the CRS is the first necessary step to representation in the hospitality “food chain.” However, it quickly becomes more com-plicated. Many of the hotel CRS systems do not maintain their own individual link or interface to each of the four GDSs (Sabre, Galileo, Amadeus, Worldspan). Doing this is a costly endeavor that only major chains have undertaken. Most CRS vendors (including third party providers like Synxis and iHotelier) have a connection to an in-termediary known as a “switch” that allows them to maintain only one connection instead of four;
one for each of the GDS vendors. It is through this switch that a hotel gains connectivity to the four GDSs. The CRS vendor maintains the one connection to the switch and the switch (Pegasus) in turn maintains the four connections on their behalf to the GDSs.
Many CRS providers claim to provide GDS con-nectivity but they are generally doing it through Pegasus. Those that don’t have their own connec-tion have made arrangements with those CRS vendors that have a connection.
Gds FunctionalityThe GDSs were originally designed to be “neu-tral” in their listings of hotels when a travel agent entered a query for a city. Early on there were ran-dom rotations of all hotels in a city for each sub-sequent query to the system. However, since they were spun off from their parent airlines and are now independent in this regard, they offer several options for advertising and more prominent screen placement. Current trends focus on improving merchandising capabilities that encourage travel agencies to generate more revenue per booking. Advertising banners, prominent placement or ac-cess to travel agency lists are some of the merchan-dising opportunities available to a hotel.
GDS Usage Among ASTA Agencies
1999-2009
100%
90%
80%
70%
1999 2000 2001 2002 2003 2004 2005 2006 2007 2008 2009
% s
hare
of r
espo
nses
98%
97%
90% 90% 90%90%
91%
86%83% 83%
79%
68 AN AH&LA ANd STR SpeciAL RepoRT
The GDS primary business was always to facili-tate travel agents selling airline tickets. Hotels were an add-on along with car rental and other services. When the airline industry went into a tailspin economically, the caps placed on airline commissions along with added service charges forced through airline negotiations with GDSs pushed travel agencies to look to hotels to make up for lost airline income. This could have been good for travel agents, but at the same time, consumer behavior moved online to a self-service model. The GDSs of the early 2000s survived a major upheaval as the OTAs and the plethora of web-sites populated the Internet. As the travel agency business started to narrow to specialized corpo-rate and complex leisure bookings (with more straightforward leisure bookings and smaller corporate accounts booking directly through brand websites or OTAs), the GDSs underwent self-examination. The growth of the travel agency market slowed when the many Internet sites grew, and it is not expanding like other con-sumer channels. In spite of the agreements with many large OTAs to “power” their sites, the OTA business has also taken a hit as it competes for market share with hotel brand websites. A study conducted by American Society of Travel Agents (ASTA) in 2009 shows that GDS usage by ASTA agencies declined from 98% in 1999 to the 2009 low of 79%. Refer to the chart GDS Usage Among ASTA Agencies on page 67.
The GDSs have had to find alternatives to com-pensate for the slowing markets. Besides “power-ing” online travel sites, they have all entered the corporate portal market so that either consumers can book corporate rates directly or large travel agencies that wanted to create their own corpo-rate portals can use the GDS as their “back end systems.” These legacy systems continue to strug-gle to find their way in the fast-moving online world in which consumers want the power to “do it themselves” and hotels want to be connected as directly as possible to their end user.
the switch Function and channel ManagementBeyond connectivity issues, Pegasus, with its long history as the go-between for hotels and GDSs, continues to build its database and connectiv-ity to a wide array of travel systems and serves as a repository and facilitator of travel sales.
Pegasus has long controlled the highest volume of transactions as a switch; however, there are other smaller players that have taken on some of the connections to websites that Pegasus did not service. Pegasus, which has the largest market share and the most robust functionality as it serves as a connectivity partner between the largest suppliers in the industry, is supplemented by smaller channel management partners who may serve in niche roles by connecting hotel inventory in specific global regions or for specific types of business.
A group of small channel management compa-nies, like EZYield and Rate Tiger emerged to make it easier for a hotel to update multiple connections to OTA extranets and smaller and/or local sites like destination (CVB) sites or local ground operators. Regional players like those in Asia (e.g. Ctrip, Agoda, Wotif) used switch connec-tivity provided by companies like DerbySoft and HBSi. At this point, it is likely that most chain-affiliated hotels may find they have an array of tools that serve to facilitate the rate and inven-tory updating function.
With a high demand to lower connectivity costs, each of the channel management and switch companies strive to bring the hotel inventory closer to the end user so that there are fewer “toll booths” along the way, each exacting a transac-tion fee for its role.
summary of Gds and switch technologyThe GDSs are not going away anytime soon but they will evolve into very different businesses as they move into the second decade of the 2000s. In the geographic markets that benefit from travel agency services, the GDS volume will grow, particularly in Asia. In terms of supporting the types of service needed for corporate expense tracking and planning, the GDS will continue to play a central role. The GDSs provide access to the lucrative travel agency market for hotels, and have historically produced higher average rates than most other channels. Travel management companies (TMCs), those that manage travel for large corporate accounts, and that historically are the primary users of GDS technology, have forged strong long-term partnerships with the GDSs. The GDSs will work hard to appeal to the small corporate accounts and the group/meetings market since they are the customer segments in growth mode and are not likely to use TMCs’
pubLiSHed by THe HSMAi FouNdATioN 69
2The Distribution Landscape
full range of travel management services. They will find stiff competition among suppliers, OTAs and some new Internet portals specializing in this business. Even as the GDS volume has been relatively flat or declining temporarily (a phe-nomenon magnified by the recession and there-fore will rebound somewhat with the economy), connections to the GDS are required by all hotel types that want to tap the travel agency market, and need to be handled by a reliable CRS vendor, whether they are direct or through a switch.
Any tools that streamline time and costs related to third party connections will be welcome, and each hotel organization has to choose between an investment in a direct connection and the best set of switch connection tools that can do this. Orga-nizations like OpenTravel Alliance, an industry non-profit, works with the distribution vendors and the hotel companies to standardize the mes-saging between systems, usually written in XML, so that the connection between a hotel and any new website can be more efficiently built.
No doubt, over the upcoming few years, the industry will continue to rely on a blend of direct XML messaging along with different forms of switch connectivity depending on development and maintenance costs for each channel involved.
offlIne And TrAdITIonAl wHoleSAlerS
For decades before the Internet emerged as a marketplace, the wholesalers and tour opera-tors have contributed by offering business that is largely package-based (hotel plus air and/or car and/or ground transportation or other activities/attractions) and are most dominant in fly-to des-tinations such as Mexico, Hawaii, the Caribbean in the Americas and in Europe as well as Asia-Pacific in most markets.
Wholesalers bring a combination of group-driven and individual business. The individual purchas-ers, long known as FIT travelers, come in through “receptive tour operators” who make local ar-rangements. This business is inbound to a country, often from other countries where the traveler is not familiar enough with the destination to make their own plans directly. Receptive operators provide unique services in providing packages and destination itineraries that are more personal and
include many elements that are currently not eas-ily served through other channels.
Wholesalers bring a great source of inbound opportunities for the North American market and, a large and vibrant business, it is mostly fly-drive and primarily destination-based but often includes primary markets and destination markets close to attractions and national parks.
On the international inbound business to North America, in response to the current distribution dynamic, receptive operators are reinventing themselves to protect their market niche. Their distinct offering is in service—a valued commod-ity today and likely well into the future.Historically, wholesalers on the group side were able to control most of the airline seats for limited airlift destinations, with a lock on the charter flights. Therefore, they controlled the matching of seats to beds. This market has long operated with deep discounts that are opaque to the consumer since they are bundled into the packages. They often commit to blocks of rooms and due to paper-based or manual operations, ho-tels have not always had the benefit of real-time updating of the room blocks, which can make forecasting difficult. However, increasingly, there are automated solutions that have improved this situation with B2B portals or channel manage-ment tools to control the room blocks.
The advent of the OTA caused a major disrup-tion to this market, but it still fills a unique niche that is not supported through other distribution partners. Much of the inbound international tour business comes through traditional wholesalers, as well as package business requiring payment handling, ground operations and other types of local coordination and support. The costs to hotels in terms of net rate discounts vary; the FIT tends to be a bit higher than the OTA rates, but on the group side, it is similar to that of the OTAs; the higher level of servicing is often the justification for a premium. It is unclear if more of this busi-ness will shift to the newer online-only rivals, particularly as they try to harness more of the international inbound demand from emerging markets from Brazil, Russia, India and China (BRIC countries), but after ten years of OTA penetration, the traditional players have managed to hang onto a portion of the business and, for the foreseeable future, are likely to retain their small but specialized slice of the hotel pie.
70 AN AH&LA ANd STR SpeciAL RepoRT
cAll cenTer, 800 nUmber, voIce reServATIonS And properTy dIrecT
This study has largely focused on electronic distribution and all the technology that drives it. However, the role of the voice or property direct channel is significant in hospitality. This Distribution Channel Analysis study defines the property direct channel as handling those res-ervations coming in either as walk-ins, groups/meetings, contract and any other type of busi-ness handled directly by the property. Nation-ally, in the United States, in 2010, this property direct component of the hotel business demand was over half (51.5%) and the demand coming through the voice channel (either to an offsite call center or to reservation agents in a hotel) was 13.2%. The revenue generated for the voice channel was disproportionately high providing over 17.2% of the revenue. While there are many options for handling these distribution chan-nels, they are often one of the most overlooked in terms of potential for revenue growth. Not all hotel types are as affected by the voice-based business as others. A recent HSMAI Resort Best Practices benchmarking study10 of independent resorts that are upscale or luxury, shows that almost two-thirds of all reservations are handled by the resort by phone or through property per-sonnel.
What are the implications for these statistics? If a hotel can convert at a higher rate or gain ancil-lary revenue sales (in those hotels with ancillary revenue offerings), higher profit margins will result. A call center conversion rate in the 30% range would be respectable, and the average room rates tend to be among the highest through the voice channel reflecting a premium of 31% at $127.78 over the 2010 national hotel average daily rate (ADR) of $98.05. At those rates, even if the room night demand is only 15%-20%, increas-ing one point of conversion can yield hundreds of thousands of dollars in revenue in a year. (Refer to the Distribution Costs and Benefits chapter for more detail on this topic.) Does the call routing system have technology to direct calls to the best salesperson for the type of call? Do inquiries about the property get followed up with a systematic sales technique so that qualified prospects can
10 HSMAi, Resort Best Practices Initiative Benchmarking Study, Au-gust 2011, cindy estis Green, www.hsmairesortbestpractices.com
be converted effectively? If not, then the property may have holes in its revenue net.
In terms of other property direct opportunities, well organized and systemically deployed sales activities conducted by front desk and other hotel personnel are tried-and-true because they work well. Hotel management would do well if it recognizes that the on-property staff controls al-most half of the property’s revenue. How well do these systems work? Some effective tools could be upsell mechanisms that are automated and embedded in a front office PMS system, along with manual processes that are utilized with ev-ery guest contact. Intelligence to inform the staff about who the guests are and predict what they may buy could yield considerable incremental revenue. How quickly the industry has forgotten the opportunity in the call center and property direct channels; it seems that if it is not online, few pay attention anymore.
These direct channels, even without the support of the latest technology, would be worth investing in some time and effort in terms of process im-provements and may prove to be the “low hang-ing fruit” that can yield great results quickly.
groUpS And meeTIngS
Some of the challenges posed by online distribu-tion include the growing use of electronic group and meetings lead sites.
Many websites have come and gone in an at-tempt to facilitate the group booking in an online environment. It seems that the complexity involved in dealing with meeting space, catering, group blocks, conditions such as cutoffs, negotia-tions for room upgrades, amenities, comps etc. has made it difficult for all but the simplest of meetings.
The dominant function that has remained in these attempts is the referral and RFP engine. Many sites serve as intermediaries for the ex-change of RFPs with hotel bids. Of late, a recur-ring issue in hotel sales departments includes the number of RFPs that a meeting planner may send out and the staffing and time commitment required to properly address these requests. If the referral sites allow too many hotels to be included in the bidding process, then the chances

pubLiSHed by THe HSMAi FouNdATioN 71
2The Distribution Landscape
for each to get the business are substantially lower; however, the time still has to be spent to respond. If the staffing does not adequately reply to the requests in a timely manner, then the hotel appears to be lacking in its sales responsiveness. This is a difficult situation that may require some refinement in the guidelines used by the lead referral sites that would benefit from col-laboration between the parties involved.
Another pattern that has become more promi-nent in the group and meetings market is the use of third party intermediaries. Conferon, Helms-Briscoe, among others, have taken a central role in the booking for many of the U.S. industry meetings. Some of the brands are exploring new approaches to take advantage of the online con-nectivity that is becoming part and parcel of the group/meetings business ecosystem. For instance, Marriott and Cvent have recently announced an ambitious connectivity implementation using the
Cvent RFP and sourcing tool. The industry will be watching closely to see if this initiative has a positive impact on Marriott’s share of group business.
When so much of the business is booked through these third parties, what is the role of the hotel or regional salesperson? Are they primarily re-sponding to third party inquiries, competing with their own third party vendors to find additional groups and meetings and/or just servicing busi-ness sourced through outside suppliers? If this is the case, does that change the staffing levels, skill sets, travel budgets or other expectations for a hotel sales team? This report has not quantified the full extent of third party bookings for groups and meetings, but it is a topic deserving further study since it has implications for the profit-ability of those hotels with a large percentage of property direct group and meetings business.
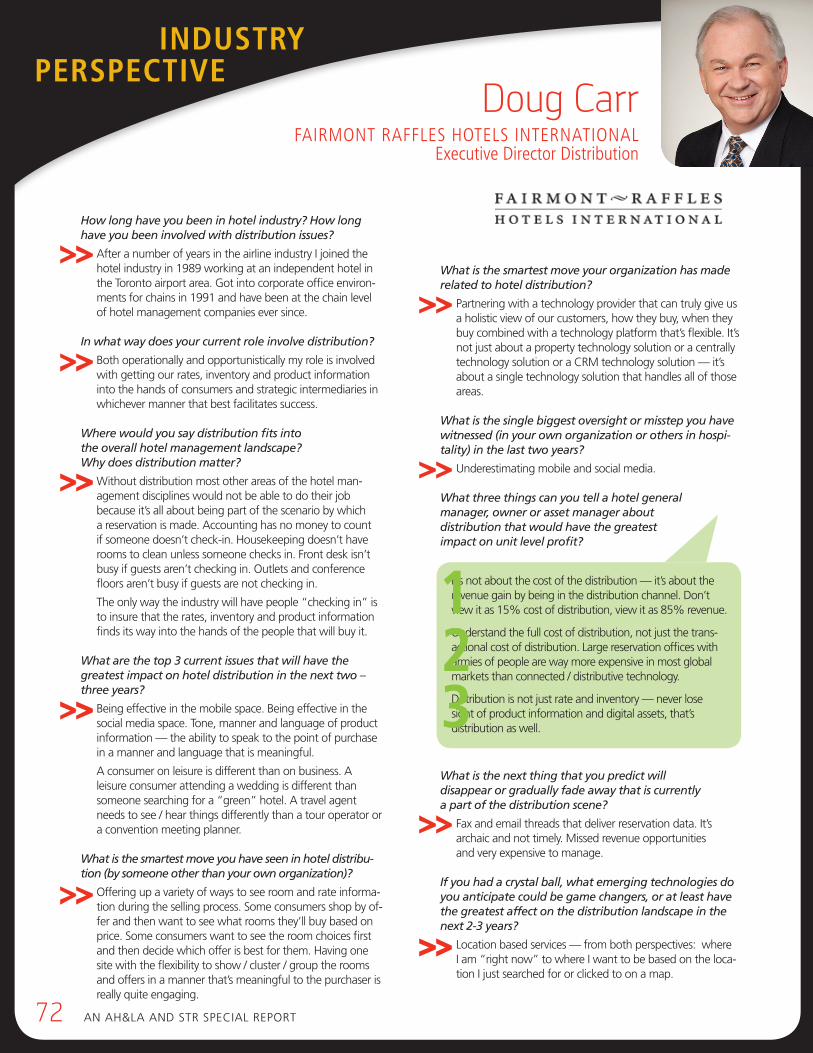
How long have you been in hotel industry? How long have you been involved with distribution issues?
After a number of years in the airline industry i joined the hotel industry in 1989 working at an independent hotel in the Toronto airport area. Got into corporate office environ-ments for chains in 1991 and have been at the chain level of hotel management companies ever since.
In what way does your current role involve distribution?
both operationally and opportunistically my role is involved with getting our rates, inventory and product information into the hands of consumers and strategic intermediaries in whichever manner that best facilitates success.
Where would you say distribution fits into the overall hotel management landscape? Why does distribution matter?
Without distribution most other areas of the hotel man-agement disciplines would not be able to do their job because it’s all about being part of the scenario by which a reservation is made. Accounting has no money to count if someone doesn’t check-in. Housekeeping doesn’t have rooms to clean unless someone checks in. Front desk isn’t busy if guests aren’t checking in. outlets and conference floors aren’t busy if guests are not checking in.
The only way the industry will have people “checking in” is to insure that the rates, inventory and product information finds its way into the hands of the people that will buy it.
What are the top 3 current issues that will have the greatest impact on hotel distribution in the next two – three years?
being effective in the mobile space. being effective in the social media space. Tone, manner and language of product information — the ability to speak to the point of purchase in a manner and language that is meaningful.
A consumer on leisure is different than on business. A leisure consumer attending a wedding is different than someone searching for a “green” hotel. A travel agent needs to see / hear things differently than a tour operator or a convention meeting planner.
What is the smartest move you have seen in hotel distribu-tion (by someone other than your own organization)?
offering up a variety of ways to see room and rate informa-tion during the selling process. Some consumers shop by of-fer and then want to see what rooms they’ll buy based on price. Some consumers want to see the room choices first and then decide which offer is best for them. Having one site with the flexibility to show / cluster / group the rooms and offers in a manner that’s meaningful to the purchaser is really quite engaging.
What is the smartest move your organization has made related to hotel distribution?
partnering with a technology provider that can truly give us a holistic view of our customers, how they buy, when they buy combined with a technology platform that’s flexible. it’s not just about a property technology solution or a centrally technology solution or a cRM technology solution — it’s about a single technology solution that handles all of those areas.
What is the single biggest oversight or misstep you have witnessed (in your own organization or others in hospi-tality) in the last two years?
underestimating mobile and social media.
What three things can you tell a hotel general manager, owner or asset manager about distribution that would have the greatest impact on unit level profit?
What is the next thing that you predict will disappear or gradually fade away that is currently a part of the distribution scene?
Fax and email threads that deliver reservation data. it’s archaic and not timely. Missed revenue opportunities and very expensive to manage.
If you had a crystal ball, what emerging technologies do you anticipate could be game changers, or at least have the greatest affect on the distribution landscape in the next 2-3 years?
Location based services — from both perspectives: where i am “right now” to where i want to be based on the loca-tion i just searched for or clicked to on a map.
it’s not about the cost of the distribution — it’s about the revenue gain by being in the distribution channel. don’t view it as 15% cost of distribution, view it as 85% revenue.
understand the full cost of distribution, not just the trans-actional cost of distribution. Large reservation offices with armies of people are way more expensive in most global markets than connected / distributive technology.
distribution is not just rate and inventory — never lose sight of product information and digital assets, that’s distribution as well.
>>
>>
>>
>>
>>
>>
>>
>>
>>
123
Doug CarrFairMont raFFleS hotelS international
executive Director Distribution
Industry PersPectIVe
72 AN AH&LA ANd STR SpeciAL RepoRT

How long have you been in the hotel industry? How long have you been involved with distribution issues?
i have been in the hotel industry about 15 years and involved in distribution issues just over 10 years.
In what way does your current role involve distribution?
expedia has a deep and comprehensive view into consumer behavior and market trends that we share daily with our hotel partners. our focus is to help our partners achieve their goals by working alongside revenue, distribution and ecommerce teams to identify ways in which to best utilize our diverse portfolio of channels and brands.
Where would you say distribution fits into the overall hotel management landscape? Why does distribution matter?
distribution is the key to getting guests into the hotel. More and more, it’s tied inextricably to marketing and exposure, brand building and global visibility for properties. done right, distribution can be a major driver of revenue growth and profitability.
Strategic distribution is about:
Attracting high-value guests.
channel diversification: Working with multiple distribution channels to generate demand and grow rate.
Maximizing occupancy at optimal rate.
Reaching demand that meets the needs of your property.
identifying distribution channels which will give your hotel global visibility and vast exposure.
What are the top 3 current issues that will have the greatest impact on hotel distribution in the next two to three years?
Significant shift (continued shift) of travel spend from offline to online worldwide.
Growth of middle class in emerging markets and prolifera-tion of international travel among these consumers.
emergence of mobile and tablets as leading platforms for accessing internet.
What is the smartest move you have seen in hotel distri-bution (by someone other than your own organization)?
creation of loyalty programs for independent hotels, such as Stash rewards.
unique distribution for independents through companies like Magnuson Hotels.
Vast improvement of brand.com ui’s. The focus that the brands have put into ease of booking and intelligent tech-nology has been an extremely smart move.
dedicated employees at chains and individual hotels to manage social media outlets, including integrating reviews (like Accor did with Trip Advisor on their own site) as well as a heightened focus on monitoring and responding to guest comments. As consumer generated content continues to grow in importance, ensuring that there is an ongoing touch point with the consumer is critical.
What is the smartest move your organization has made related to hotel distribution?
building a global team of market managers to work locally, in market with hotels at the property level and a world class strategy and analysis team to feed insights back to hotels about opportunities in their global distribution strategy.
Rapid development of mobile applications via the acquisition of Mobiata.
Asia focus. Joint venture with low cost carrier Air Asia, which makes it easier for consumers in Se Asia to purchase travel packages to international destinations. our invest-ment and commitment to growing elong in china.
What is the single biggest oversight or misstep you have witnessed (in your own organization or others in hospitality) in the last two years?
Hotels utilizing 3rd party distribution channels only during off-peak times. Minimizing/eliminating demand during peak times may result in lower AdR.
Too much focus on RevpAR and not enough focus on the total cost of distribution channels.
Heighted focus and discussion about oTA’s which generate less than 10% of overall hotel demand.
Melissa MaherexPeDia, inC
Global Vice President, Strategic accounts and industry relations
pubLiSHed by THe HSMAi FouNdATioN ANd iTS pubLiSHiNG pARTNeRS 73
Industry PersPectIVe
>>
>>
>>
>>
>>
>>
>>
continued >>
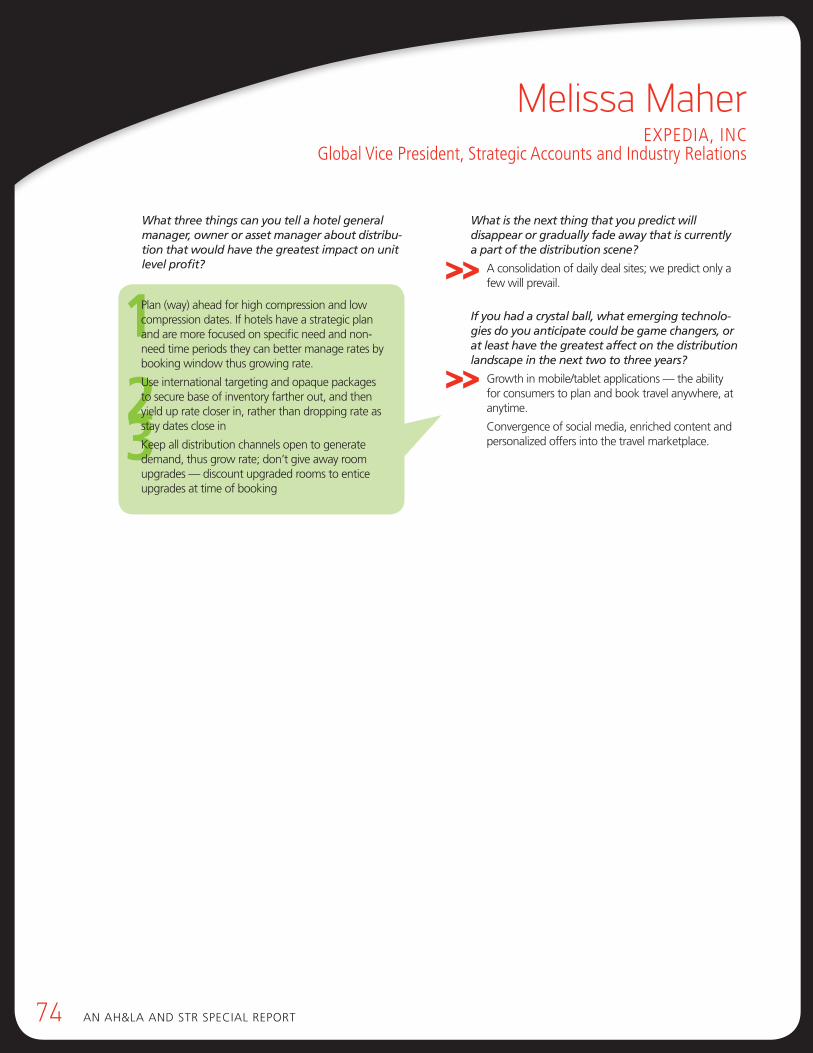
What three things can you tell a hotel general manager, owner or asset manager about distribu-tion that would have the greatest impact on unit level profit?
What is the next thing that you predict will disappear or gradually fade away that is currently a part of the distribution scene?
A consolidation of daily deal sites; we predict only a few will prevail.
If you had a crystal ball, what emerging technolo-gies do you anticipate could be game changers, or at least have the greatest affect on the distribution landscape in the next two to three years?
Growth in mobile/tablet applications — the ability for consumers to plan and book travel anywhere, at anytime.
convergence of social media, enriched content and personalized offers into the travel marketplace.
>>
Melissa MaherexPeDia, inC
Global Vice President, Strategic accounts and industry relations
>>
123
plan (way) ahead for high compression and low compression dates. if hotels have a strategic plan and are more focused on specific need and non-need time periods they can better manage rates by booking window thus growing rate.
use international targeting and opaque packages to secure base of inventory farther out, and then yield up rate closer in, rather than dropping rate as stay dates close in
Keep all distribution channels open to generate demand, thus grow rate; don’t give away room upgrades — discount upgraded rooms to entice upgrades at time of booking
74 AN AH&LA ANd STR SpeciAL RepoRT
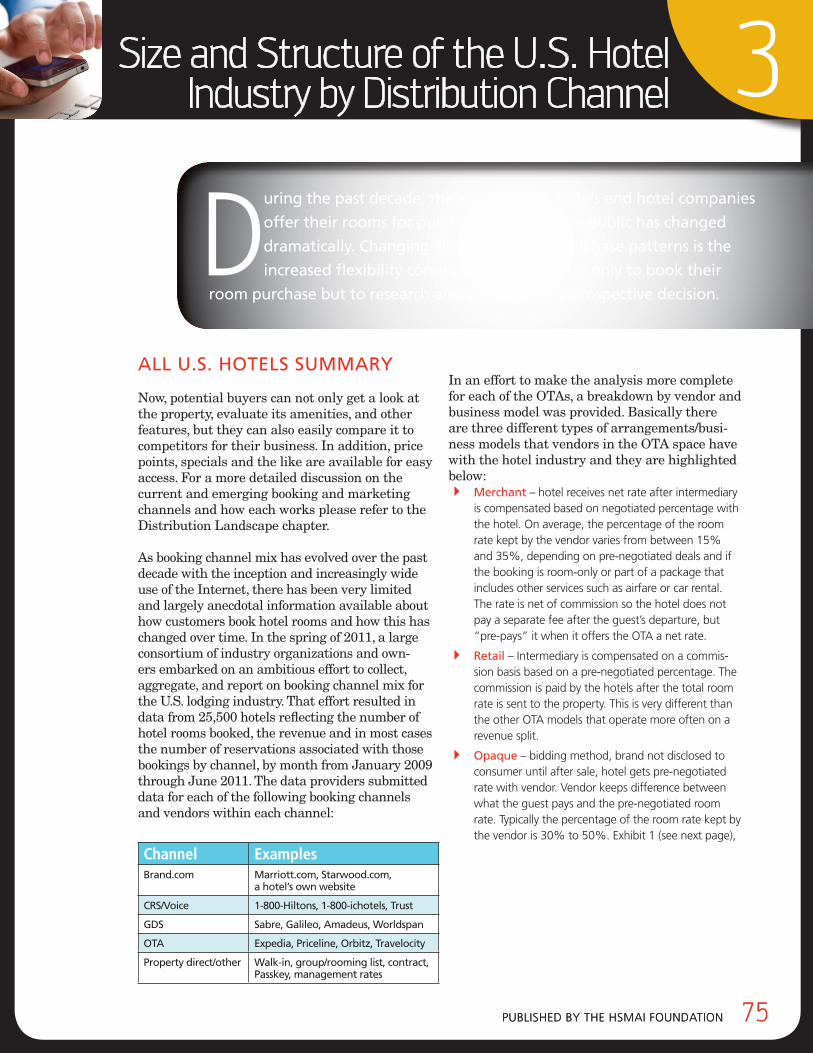
pubLiSHed by THe HSMAi FouNdATioN 75pubLiSHed by THe HSMAi FouNdATioN 75
3Size and Structure of the U.S. Hotel Industry by Distribution Channel
During the past decade, the way in which hotels and hotel companies
offer their rooms for purchase to the buying public has changed
dramatically. changing along with those purchase patterns is the
increased flexibility consumers now have not only to book their
room purchase but to research and evaluate their prospective decision.
All U.S. HoTelS SUmmAry
Now, potential buyers can not only get a look at the property, evaluate its amenities, and other features, but they can also easily compare it to competitors for their business. In addition, price points, specials and the like are available for easy access. For a more detailed discussion on the current and emerging booking and marketing channels and how each works please refer to the Distribution Landscape chapter.
As booking channel mix has evolved over the past decade with the inception and increasingly wide use of the Internet, there has been very limited and largely anecdotal information available about how customers book hotel rooms and how this has changed over time. In the spring of 2011, a large consortium of industry organizations and own-ers embarked on an ambitious effort to collect, aggregate, and report on booking channel mix for the U.S. lodging industry. That effort resulted in data from 25,500 hotels reflecting the number of hotel rooms booked, the revenue and in most cases the number of reservations associated with those bookings by channel, by month from January 2009 through June 2011. The data providers submitted data for each of the following booking channels and vendors within each channel:
channel examplesbrand.com marriott.com, Starwood.com,
a hotel’s own website
crS/voice 1-800-Hiltons, 1-800-ichotels, Trust
gdS Sabre, galileo, Amadeus, worldspan
oTA expedia, priceline, orbitz, Travelocity
property direct/other walk-in, group/rooming list, contract, passkey, management rates
In an effort to make the analysis more complete for each of the OTAs, a breakdown by vendor and business model was provided. Basically there are three different types of arrangements/busi-ness models that vendors in the OTA space have with the hotel industry and they are highlighted below:4 merchant – hotel receives net rate after intermediary
is compensated based on negotiated percentage with the hotel. on average, the percentage of the room rate kept by the vendor varies from between 15% and 35%, depending on pre-negotiated deals and if the booking is room-only or part of a package that includes other services such as airfare or car rental. The rate is net of commission so the hotel does not pay a separate fee after the guest’s departure, but “pre-pays” it when it offers the oTA a net rate.
4 retail – intermediary is compensated on a commis-sion basis based on a pre-negotiated percentage. The commission is paid by the hotels after the total room rate is sent to the property. This is very different than the other oTA models that operate more often on a revenue split.
4 opaque – bidding method, brand not disclosed to consumer until after sale, hotel gets pre-negotiated rate with vendor. Vendor keeps difference between what the guest pays and the pre-negotiated room rate. Typically the percentage of the room rate kept by the vendor is 30% to 50%. exhibit 1 (see next page),
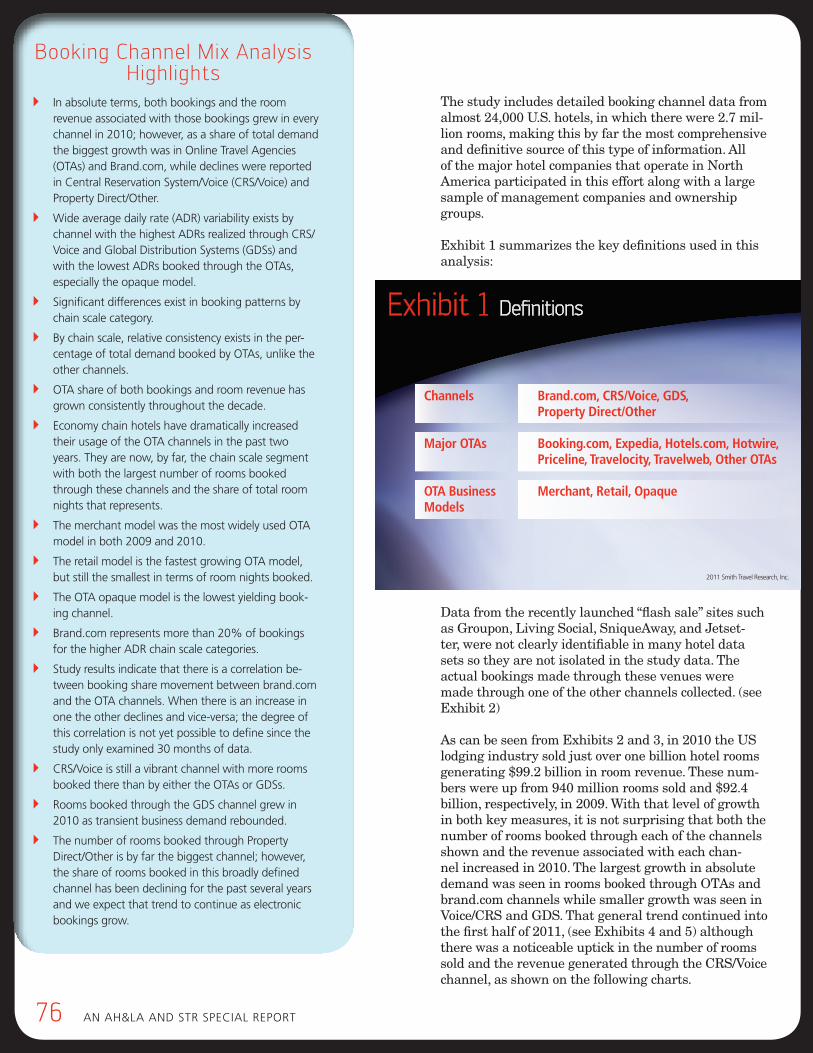
76 AN AH&LA ANd STR SpeciAL RepoRT
Booking Channel Mix Analysis Highlights
4 in absolute terms, both bookings and the room revenue associated with those bookings grew in every channel in 2010; however, as a share of total demand the biggest growth was in online Travel Agencies (oTAs) and brand.com, while declines were reported in central Reservation System/Voice (cRS/Voice) and property direct/other.
4 Wide average daily rate (AdR) variability exists by channel with the highest AdRs realized through cRS/Voice and Global distribution Systems (GdSs) and with the lowest AdRs booked through the oTAs, especially the opaque model.
4 Significant differences exist in booking patterns by chain scale category.
4 by chain scale, relative consistency exists in the per-centage of total demand booked by oTAs, unlike the other channels.
4 oTA share of both bookings and room revenue has grown consistently throughout the decade.
4 economy chain hotels have dramatically increased their usage of the oTA channels in the past two years. They are now, by far, the chain scale segment with both the largest number of rooms booked through these channels and the share of total room nights that represents.
4 The merchant model was the most widely used oTA model in both 2009 and 2010.
4 The retail model is the fastest growing oTA model, but still the smallest in terms of room nights booked.
4 The oTA opaque model is the lowest yielding book-ing channel.
4 brand.com represents more than 20% of bookings for the higher AdR chain scale categories.
4 Study results indicate that there is a correlation be-tween booking share movement between brand.com and the oTA channels. When there is an increase in one the other declines and vice-versa; the degree of this correlation is not yet possible to define since the study only examined 30 months of data.
4 cRS/Voice is still a vibrant channel with more rooms booked there than by either the oTAs or GdSs.
4 Rooms booked through the GdS channel grew in 2010 as transient business demand rebounded.
4 The number of rooms booked through property direct/other is by far the biggest channel; however, the share of rooms booked in this broadly defined channel has been declining for the past several years and we expect that trend to continue as electronic bookings grow.
The study includes detailed booking channel data from almost 24,000 U.S. hotels, in which there were 2.7 mil-lion rooms, making this by far the most comprehensive and definitive source of this type of information. All of the major hotel companies that operate in North America participated in this effort along with a large sample of management companies and ownership groups.
Exhibit 1 summarizes the key definitions used in this analysis:
Data from the recently launched “flash sale” sites such as Groupon, Living Social, SniqueAway, and Jetset-ter, were not clearly identifiable in many hotel data sets so they are not isolated in the study data. The actual bookings made through these venues were made through one of the other channels collected. (see Exhibit 2)
As can be seen from Exhibits 2 and 3, in 2010 the US lodging industry sold just over one billion hotel rooms generating $99.2 billion in room revenue. These num-bers were up from 940 million rooms sold and $92.4 billion, respectively, in 2009. With that level of growth in both key measures, it is not surprising that both the number of rooms booked through each of the channels shown and the revenue associated with each chan-nel increased in 2010. The largest growth in absolute demand was seen in rooms booked through OTAs and brand.com channels while smaller growth was seen in Voice/CRS and GDS. That general trend continued into the first half of 2011, (see Exhibits 4 and 5) although there was a noticeable uptick in the number of rooms sold and the revenue generated through the CRS/Voice channel, as shown on the following charts.
Exhibit 1 Definitions
2011 Smith Travel Research, Inc.
Channels Brand.com, CRS/Voice, GDS, Property Direct/Other
Major OTAs Booking.com, Expedia, Hotels.com, Hotwire, Priceline, Travelocity, Travelweb, Other OTAs
OTA Business Merchant, Retail, Opaque Models
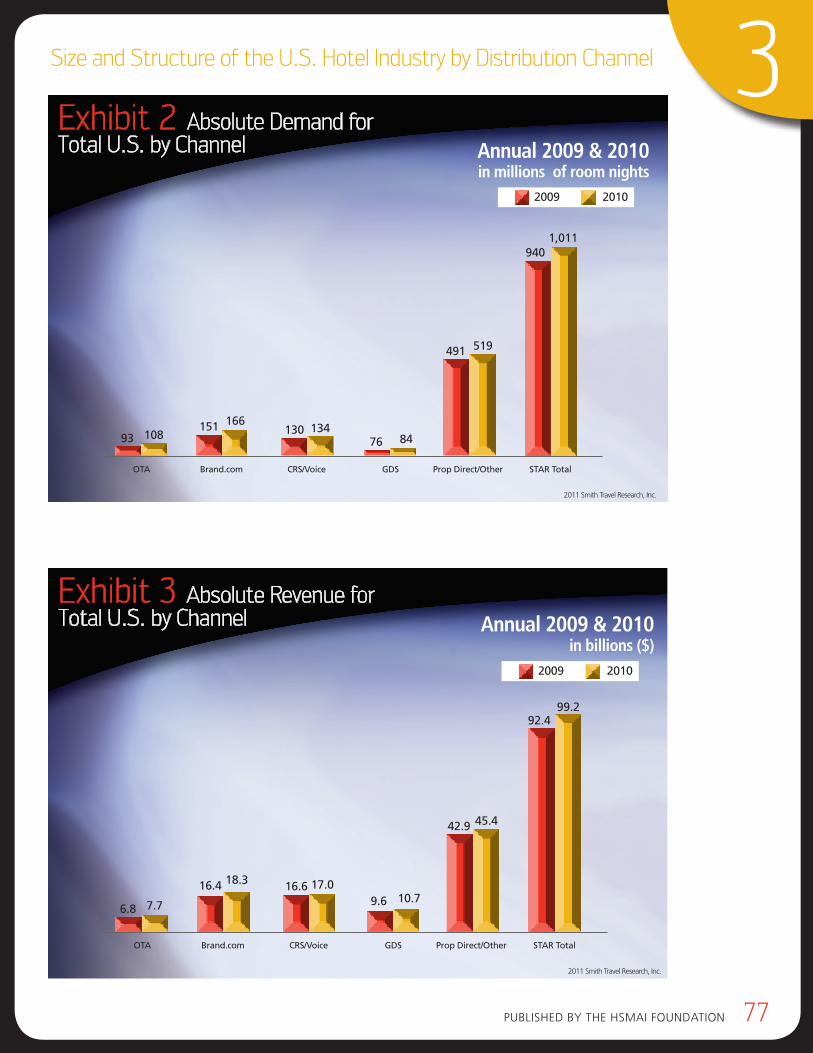
pubLiSHed by THe HSMAi FouNdATioN 77
3Size and Structure of the U.S. Hotel Industry by Distribution Channel
2011 Smith Travel Research, Inc.
OTA Brand.com CRS/Voice GDS Prop Direct/Other STAR Total
2009 2010
93 108151 166
130 13476 84
491 519
9401,011
Annual 2009 & 2010in millions of room nights
Exhibit 2 Absolute Demand for Total U.S. by Channel
2011 Smith Travel Research, Inc.
OTA Brand.com CRS/Voice GDS Prop Direct/Other STAR Total
2009 2010
6.8 7.7
16.4 18.3 16.6 17.09.6 10.7
42.9 45.4
92.499.2
Annual 2009 & 2010in billions ($)
Exhibit 3 Absolute Revenue for Total U.S. by Channel
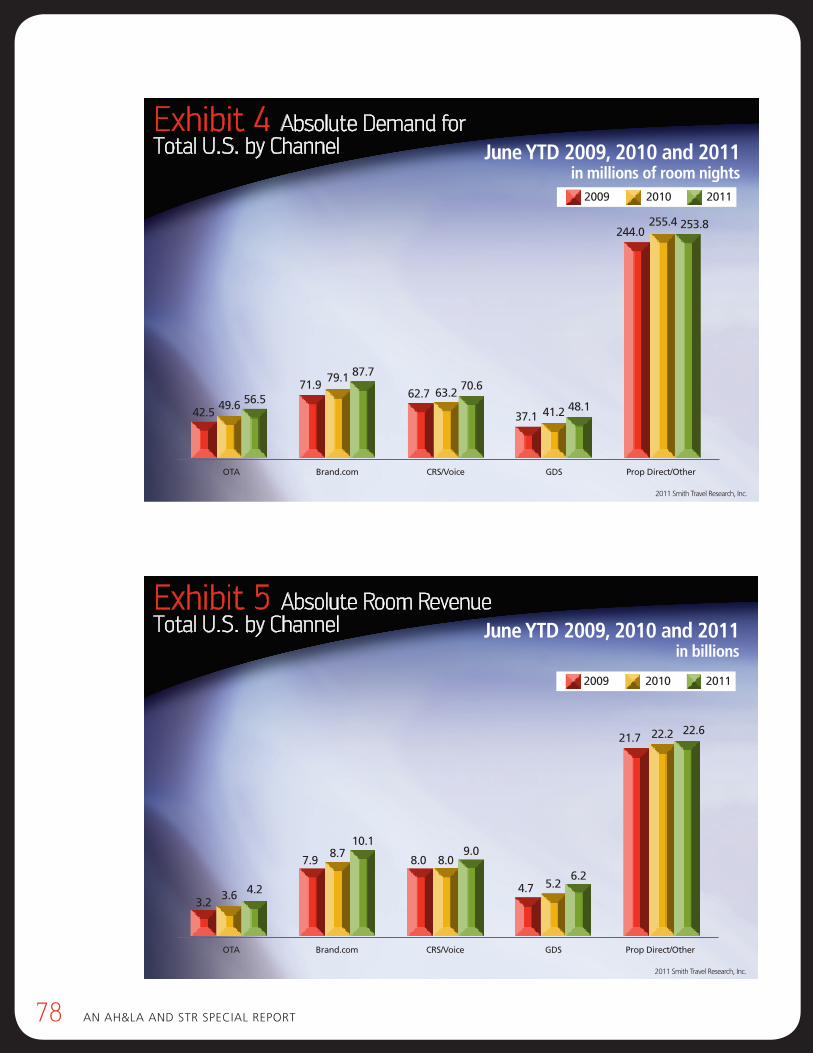
78 AN AH&LA ANd STR SpeciAL RepoRT
2011 Smith Travel Research, Inc.
OTA Brand.com CRS/Voice GDS Prop Direct/Other
42.5
June YTD 2009, 2010 and 2011 in millions of room nights
49.6 56.571.9
79.1 87.7
62.7 63.270.6
37.1 41.2 48.1
244.0253.8255.4
2009 2010 2011
Exhibit 4 Absolute Demand for Total U.S. by Channel
2011 Smith Travel Research, Inc.
OTA Brand.com CRS/Voice GDS Prop Direct/Other
3.2
June YTD 2009, 2010 and 2011 in billions
3.6 4.2
7.98.7
10.1
8.0 8.09.0
4.7 5.26.2
21.722.622.2
2009 2010 2011
Exhibit 5 Absolute Room Revenue Total U.S. by Channel
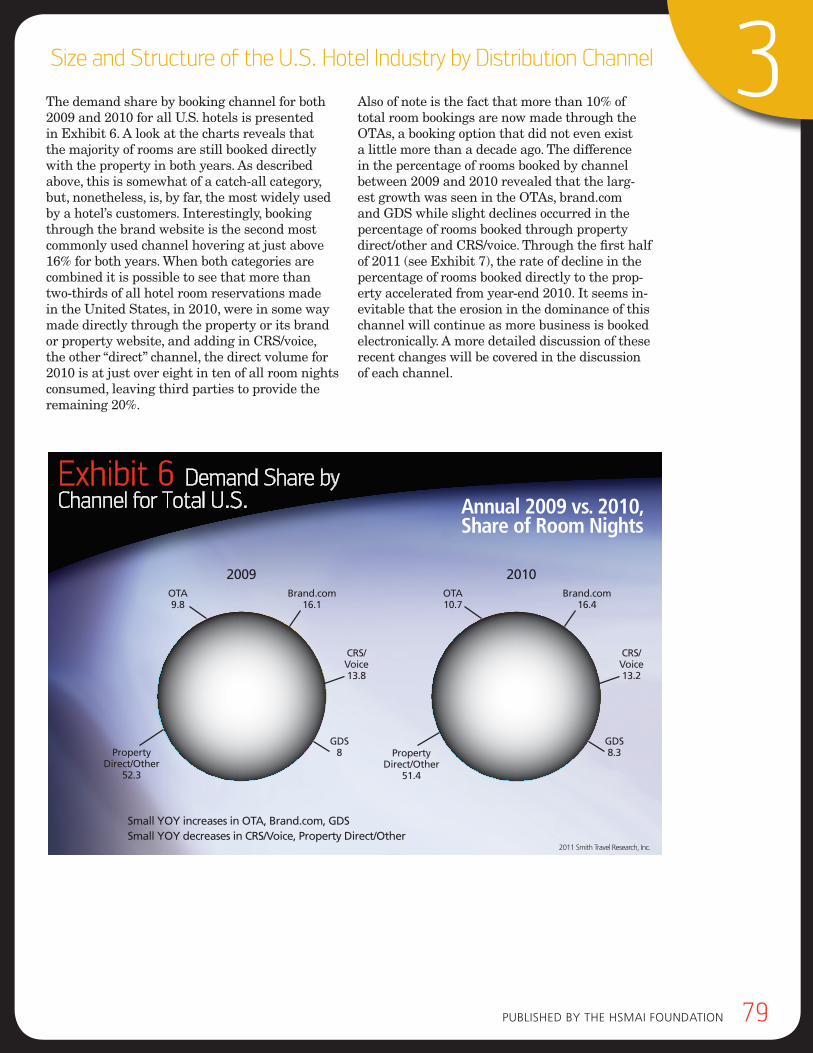
pubLiSHed by THe HSMAi FouNdATioN 79
3Size and Structure of the U.S. Hotel Industry by Distribution Channel
The demand share by booking channel for both 2009 and 2010 for all U.S. hotels is presented in Exhibit 6. A look at the charts reveals that the majority of rooms are still booked directly with the property in both years. As described above, this is somewhat of a catch-all category, but, nonetheless, is, by far, the most widely used by a hotel’s customers. Interestingly, booking through the brand website is the second most commonly used channel hovering at just above 16% for both years. When both categories are combined it is possible to see that more than two-thirds of all hotel room reservations made in the United States, in 2010, were in some way made directly through the property or its brand or property website, and adding in CRS/voice, the other “direct” channel, the direct volume for 2010 is at just over eight in ten of all room nights consumed, leaving third parties to provide the remaining 20%.
Also of note is the fact that more than 10% of total room bookings are now made through the OTAs, a booking option that did not even exist a little more than a decade ago. The difference in the percentage of rooms booked by channel between 2009 and 2010 revealed that the larg-est growth was seen in the OTAs, brand.com and GDS while slight declines occurred in the percentage of rooms booked through property direct/other and CRS/voice. Through the first half of 2011 (see Exhibit 7), the rate of decline in the percentage of rooms booked directly to the prop-erty accelerated from year-end 2010. It seems in-evitable that the erosion in the dominance of this channel will continue as more business is booked electronically. A more detailed discussion of these recent changes will be covered in the discussion of each channel.
2011 Smith Travel Research, Inc.
Annual 2009 vs. 2010, Share of Room Nights
2010
Exhibit 6 Demand Share by Channel for Total U.S.
2009Brand.com
16.4OTA10.7
Property Direct/Other
51.4
GDS8.3
CRS/Voice13.2
Brand.com16.1
OTA9.8
Property Direct/Other
52.3
GDS8
CRS/Voice13.8
Small YOY increases in OTA, Brand.com, GDSSmall YOY decreases in CRS/Voice, Property Direct/Other
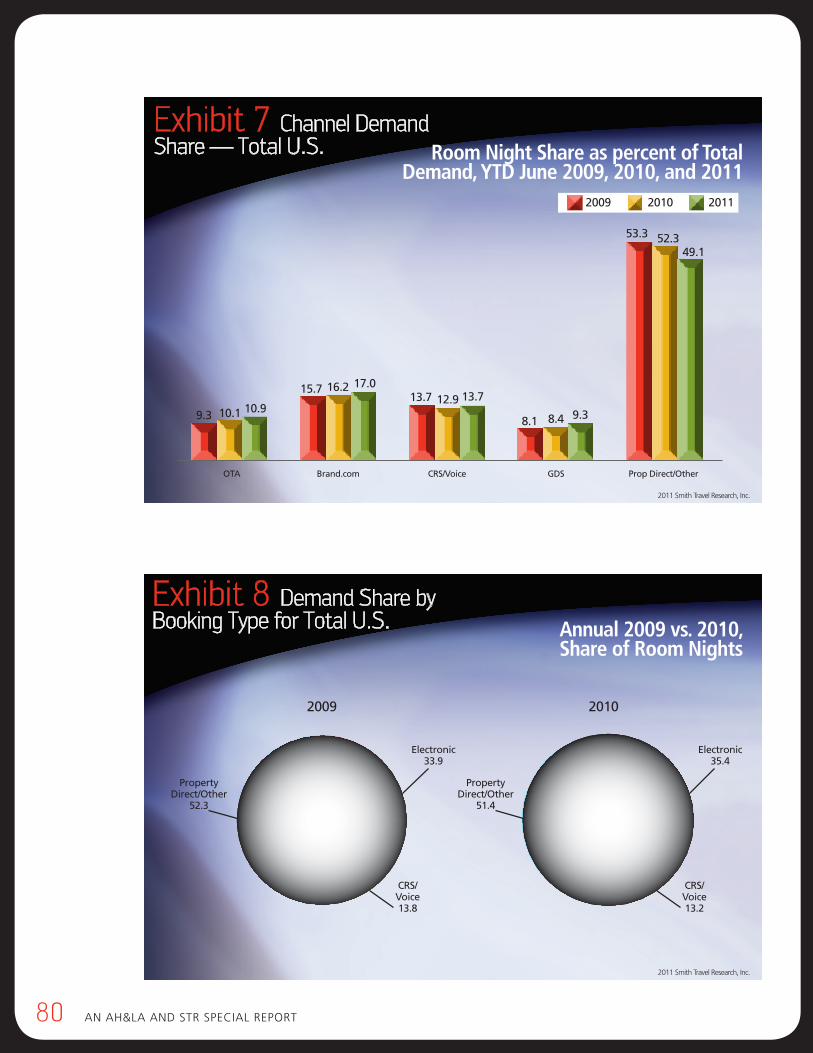
80 AN AH&LA ANd STR SpeciAL RepoRT
2011 Smith Travel Research, Inc.
OTA Brand.com CRS/Voice GDS Prop Direct/Other
9.3
Room Night Share as percent of Total Demand, YTD June 2009, 2010, and 2011
10.1 10.9
15.7 16.2 17.013.7 12.9 13.7
8.1 8.4 9.3
53.3
49.152.3
2009 2010 2011
Exhibit 7 Channel Demand Share — Total U.S.
2011 Smith Travel Research, Inc.
Annual 2009 vs. 2010, Share of Room Nights
2010
Exhibit 8 Demand Share by Booking Type for Total U.S.
2009
Electronic33.9
Property Direct/Other
52.3
CRS/Voice13.8
Electronic35.4
Property Direct/Other
51.4
CRS/Voice13.2
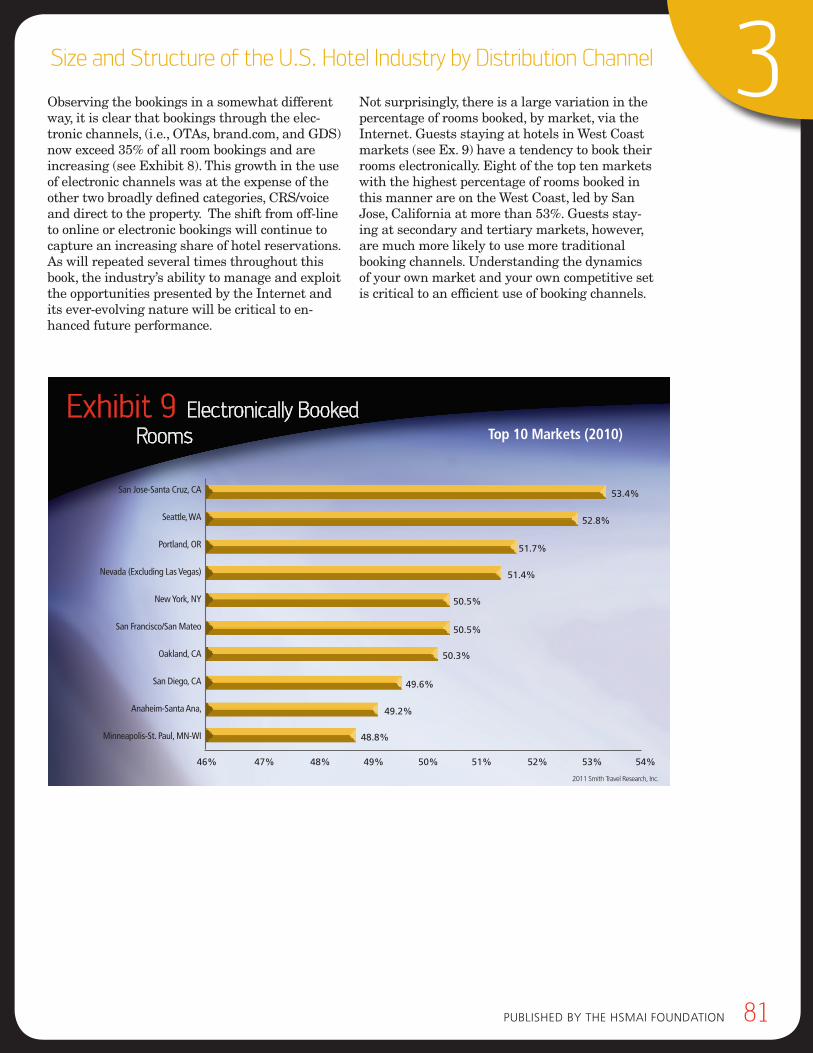
pubLiSHed by THe HSMAi FouNdATioN 81
3Size and Structure of the U.S. Hotel Industry by Distribution Channel
Exhibit 9 Electronically Booked
Rooms
San Jose-Santa Cruz, CA
Seattle, WA
Portland, OR
Nevada (Excluding Las Vegas)
New York, NY
San Francisco/San Mateo
Oakland, CA
San Diego, CA
Anaheim-Santa Ana,
Minneapolis-St. Paul, MN-WI
46% 47% 48% 49% 50% 51% 52% 53% 54%
Top 10 Markets (2010)
2011 Smith Travel Research, Inc.
48.8%
49.2%
49.6%
50.3%
50.5%
50.5%
51.4%
51.7%
52.8%
53.4%
Observing the bookings in a somewhat different way, it is clear that bookings through the elec-tronic channels, (i.e., OTAs, brand.com, and GDS) now exceed 35% of all room bookings and are increasing (see Exhibit 8). This growth in the use of electronic channels was at the expense of the other two broadly defined categories, CRS/voice and direct to the property. The shift from off-line to online or electronic bookings will continue to capture an increasing share of hotel reservations. As will repeated several times throughout this book, the industry’s ability to manage and exploit the opportunities presented by the Internet and its ever-evolving nature will be critical to en-hanced future performance.
Not surprisingly, there is a large variation in the percentage of rooms booked, by market, via the Internet. Guests staying at hotels in West Coast markets (see Ex. 9) have a tendency to book their rooms electronically. Eight of the top ten markets with the highest percentage of rooms booked in this manner are on the West Coast, led by San Jose, California at more than 53%. Guests stay-ing at secondary and tertiary markets, however, are much more likely to use more traditional booking channels. Understanding the dynamics of your own market and your own competitive set is critical to an efficient use of booking channels.
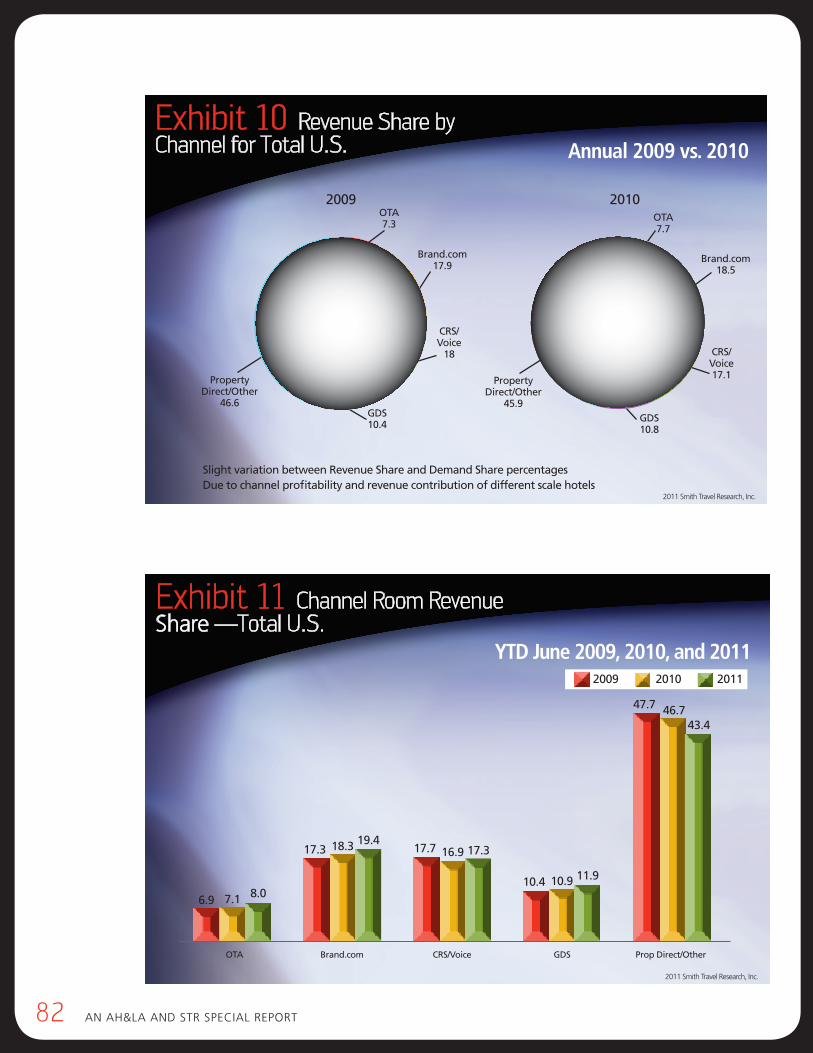
82 AN AH&LA ANd STR SpeciAL RepoRT
2011 Smith Travel Research, Inc.
Annual 2009 vs. 2010
2010
Exhibit 10 Revenue Share by Channel for Total U.S.
2009
Brand.com18.5
OTA7.7
Property Direct/Other
45.9GDS10.8
CRS/Voice17.1
Brand.com17.9
OTA7.3
Property Direct/Other
46.6GDS10.4
CRS/Voice
18
Slight variation between Revenue Share and Demand Share percentagesDue to channel profitability and revenue contribution of different scale hotels
2011 Smith Travel Research, Inc.
OTA Brand.com CRS/Voice GDS Prop Direct/Other
2009 2010 2011
6.9
YTD June 2009, 2010, and 2011
7.1 8.0
17.3 18.3 19.417.7 16.9 17.3
10.4 10.9 11.9
47.7
43.446.7
Exhibit 11 Channel Room Revenue Share —Total U.S.
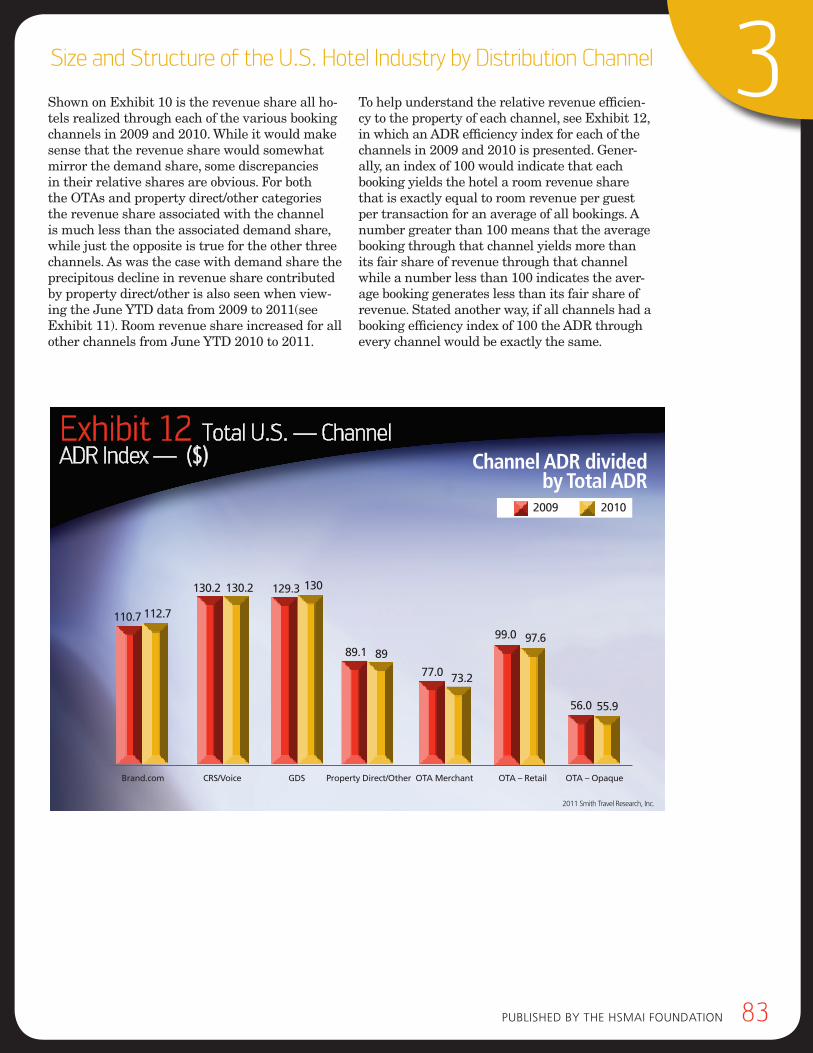
pubLiSHed by THe HSMAi FouNdATioN 83
3Size and Structure of the U.S. Hotel Industry by Distribution Channel
Shown on Exhibit 10 is the revenue share all ho-tels realized through each of the various booking channels in 2009 and 2010. While it would make sense that the revenue share would somewhat mirror the demand share, some discrepancies in their relative shares are obvious. For both the OTAs and property direct/other categories the revenue share associated with the channel is much less than the associated demand share, while just the opposite is true for the other three channels. As was the case with demand share the precipitous decline in revenue share contributed by property direct/other is also seen when view-ing the June YTD data from 2009 to 2011(see Exhibit 11). Room revenue share increased for all other channels from June YTD 2010 to 2011.
To help understand the relative revenue efficien-cy to the property of each channel, see Exhibit 12, in which an ADR efficiency index for each of the channels in 2009 and 2010 is presented. Gener-ally, an index of 100 would indicate that each booking yields the hotel a room revenue share that is exactly equal to room revenue per guest per transaction for an average of all bookings. A number greater than 100 means that the average booking through that channel yields more than its fair share of revenue through that channel while a number less than 100 indicates the aver-age booking generates less than its fair share of revenue. Stated another way, if all channels had a booking efficiency index of 100 the ADR through every channel would be exactly the same.
2011 Smith Travel Research, Inc.
Brand.com CRS/Voice GDS Property Direct/Other OTA Merchant OTA – Retail OTA – Opaque
2009 2010
110.7 112.7
77.0 73.2
99.0 97.6
Channel ADR divided by Total ADR
Exhibit 12 Total U.S. — Channel ADR Index — ($)
130.2 130.2 129.3 130
89.1 89
56.0 55.9
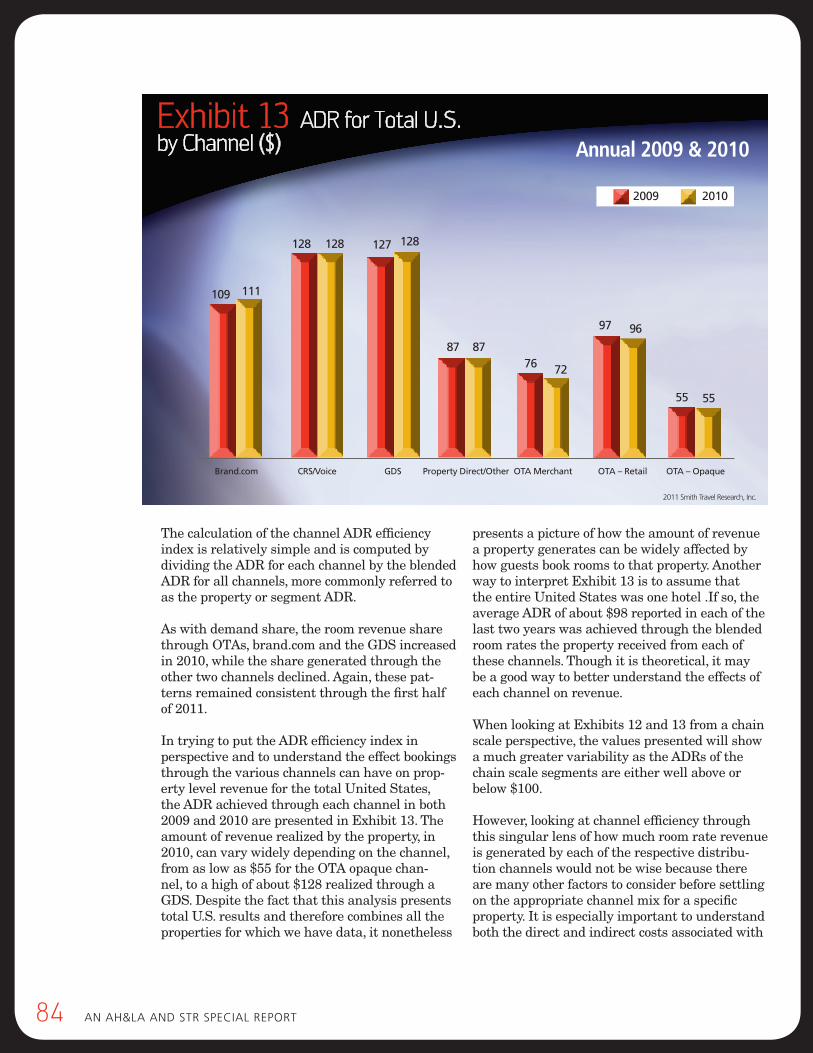
84 AN AH&LA ANd STR SpeciAL RepoRT
The calculation of the channel ADR efficiency index is relatively simple and is computed by dividing the ADR for each channel by the blended ADR for all channels, more commonly referred to as the property or segment ADR.
As with demand share, the room revenue share through OTAs, brand.com and the GDS increased in 2010, while the share generated through the other two channels declined. Again, these pat-terns remained consistent through the first half of 2011.
In trying to put the ADR efficiency index in perspective and to understand the effect bookings through the various channels can have on prop-erty level revenue for the total United States, the ADR achieved through each channel in both 2009 and 2010 are presented in Exhibit 13. The amount of revenue realized by the property, in 2010, can vary widely depending on the channel, from as low as $55 for the OTA opaque chan-nel, to a high of about $128 realized through a GDS. Despite the fact that this analysis presents total U.S. results and therefore combines all the properties for which we have data, it nonetheless
presents a picture of how the amount of revenue a property generates can be widely affected by how guests book rooms to that property. Another way to interpret Exhibit 13 is to assume that the entire United States was one hotel .If so, the average ADR of about $98 reported in each of the last two years was achieved through the blended room rates the property received from each of these channels. Though it is theoretical, it may be a good way to better understand the effects of each channel on revenue.
When looking at Exhibits 12 and 13 from a chain scale perspective, the values presented will show a much greater variability as the ADRs of the chain scale segments are either well above or below $100.
However, looking at channel efficiency through this singular lens of how much room rate revenue is generated by each of the respective distribu-tion channels would not be wise because there are many other factors to consider before settling on the appropriate channel mix for a specific property. It is especially important to understand both the direct and indirect costs associated with
2011 Smith Travel Research, Inc.
Brand.com CRS/Voice GDS Property Direct/Other OTA Merchant OTA – Retail OTA – Opaque
2009 2010
109 111
76 72
97 96
Annual 2009 & 2010Exhibit 13 ADR for Total U.S. by Channel ($)
128 128 127 128
87 87
55 55
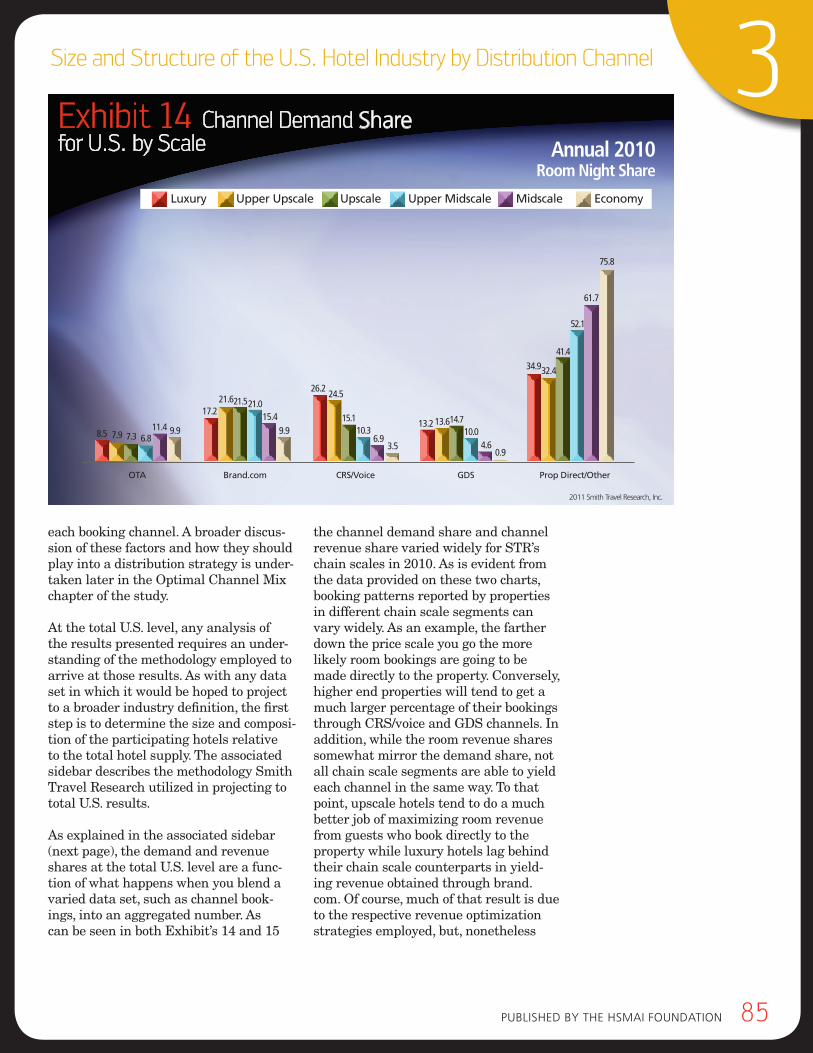
pubLiSHed by THe HSMAi FouNdATioN 85
3Size and Structure of the U.S. Hotel Industry by Distribution Channel
2011 Smith Travel Research, Inc.
OTA Brand.com CRS/Voice GDS Prop Direct/Other
Luxury Upper Upscale Upscale Upper Midscale Midscale Economy
8.5
Annual 2010Room Night Share
Exhibit 14 Channel Demand Share for U.S. by Scale
7.9 7.3 6.811.4 9.9
17.221.621.521.0
15.49.9
26.224.5
15.110.3
6.93.5
13.2 13.614.710.0
4.60.9
32.4
41.4
52.1
61.7
75.8
34.9
each booking channel. A broader discus-sion of these factors and how they should play into a distribution strategy is under-taken later in the Optimal Channel Mix chapter of the study.
At the total U.S. level, any analysis of the results presented requires an under-standing of the methodology employed to arrive at those results. As with any data set in which it would be hoped to project to a broader industry definition, the first step is to determine the size and composi-tion of the participating hotels relative to the total hotel supply. The associated sidebar describes the methodology Smith Travel Research utilized in projecting to total U.S. results.
As explained in the associated sidebar (next page), the demand and revenue shares at the total U.S. level are a func-tion of what happens when you blend a varied data set, such as channel book-ings, into an aggregated number. As can be seen in both Exhibit’s 14 and 15
the channel demand share and channel revenue share varied widely for STR’s chain scales in 2010. As is evident from the data provided on these two charts, booking patterns reported by properties in different chain scale segments can vary widely. As an example, the farther down the price scale you go the more likely room bookings are going to be made directly to the property. Conversely, higher end properties will tend to get a much larger percentage of their bookings through CRS/voice and GDS channels. In addition, while the room revenue shares somewhat mirror the demand share, not all chain scale segments are able to yield each channel in the same way. To that point, upscale hotels tend to do a much better job of maximizing room revenue from guests who book directly to the property while luxury hotels lag behind their chain scale counterparts in yield-ing revenue obtained through brand.com. Of course, much of that result is due to the respective revenue optimization strategies employed, but, nonetheless
86 AN AH&LA ANd STR SpeciAL RepoRT
the results analyzed in this manner do highlight the respective booking channel differences seen in each of the chain scale segments.
When also considering the different room rates achieved by the properties in the different chain scale segments (Exhibit 16), and the number of rooms in each of the segments (Exhibit 17), it is not surprising that the blended U.S. results would yield findings that may not be reflective of an individual property, brand, or segment. In effect, like any measure that aggregates diverse industry seg-ments, the blended results may differ greatly from those reported by the indi-vidual segments. The primary segments used for analysis are the STR chain scales. Please see the chain scale side bar for an explanation of this categorization.Another factor to consider, when examin-ing total U.S. demand and revenue share results is the wide variance in ADRs real-ized by hotels in the OTA merchant, retail and opaque models vs. the other booking channels. As described earlier in this report, it’s clear that the primary reason
for the discrepancy is that what the guest actually pays for the room and what the hotel receives in revenue for that room are different because of how the OTAs are compensated. The hotel receives the rate with the commission already removed, while the guest pays the full rate directly to the OTA who keeps the commission as a fee for its services. Most hotel rates that are commissionable are received and recorded in full by the hotel and then the commission is paid after the guest’s departure and booked as a hotel expense. Therefore, since the room rate realized by the hotel for OTA bookings is substan-tially less than room rates realized by the hotels through the other channels, it is not surprising that the revenue share of OTAs is well below the corresponding demand share. Exhibit 13, shown earlier, presents the average daily room rate achieved by booking channel for all U.S. hotels in 2010. The method-of-payment for the channel (either as net rate or a commission paid after departure) clearly affects the room rate attributable to the OTA channels.
in order to arrive at the total uS numbers presented in this study, STR took into consideration the following data sets:4 The sample of hotels contribut-
ing booking channel data
4 The sample of hotels that currently participate in STR’s monthly STAR program
4 The universe of hotels in each of the STR chain scale segments
initially, the data provided by each of the hotels for which booking chan-nel data were received were catego-rized into their respective chain scale segments. Then all the raw booking channel data were accumulated in order to arrive at total room demand and room revenue results, by channel, by chain scale segment.
once the totals were derived, the following measures were computed for each channel, by month for each respective chain scale segment:4 Average room rate
4Room demand share
4 Room revenue share
These results were compared to the aggregated computations from the corresponding chain scale results regularly calculated for the STAR pro-gram. Recognizing that the varied samples for the two data sets would result in slightly different scale-wide results two assumptions were made about the respective data sets. First, the aggregated demand and room revenue results generated through the STAR program were assumed to be more accurate and reliable than
the identical numbers arrived at by aggregating the booking channel demand and room revenue num-bers. Second, the demand and room revenue shares calculated, by chain scale, by channel, using the booking channel data, were assumed to be an accurate reflection of chain scale segment patterns. using those two assumptions drove the algorithms to adjust the raw demand and room revenue booking channel data so that they would match up exactly with the larger more established STAR results.
once the monthly booking channel data were recalculated, then the val-ues were accumulated to total u.S. and chain scale-specific results on a monthly and annual basis.
Methodology
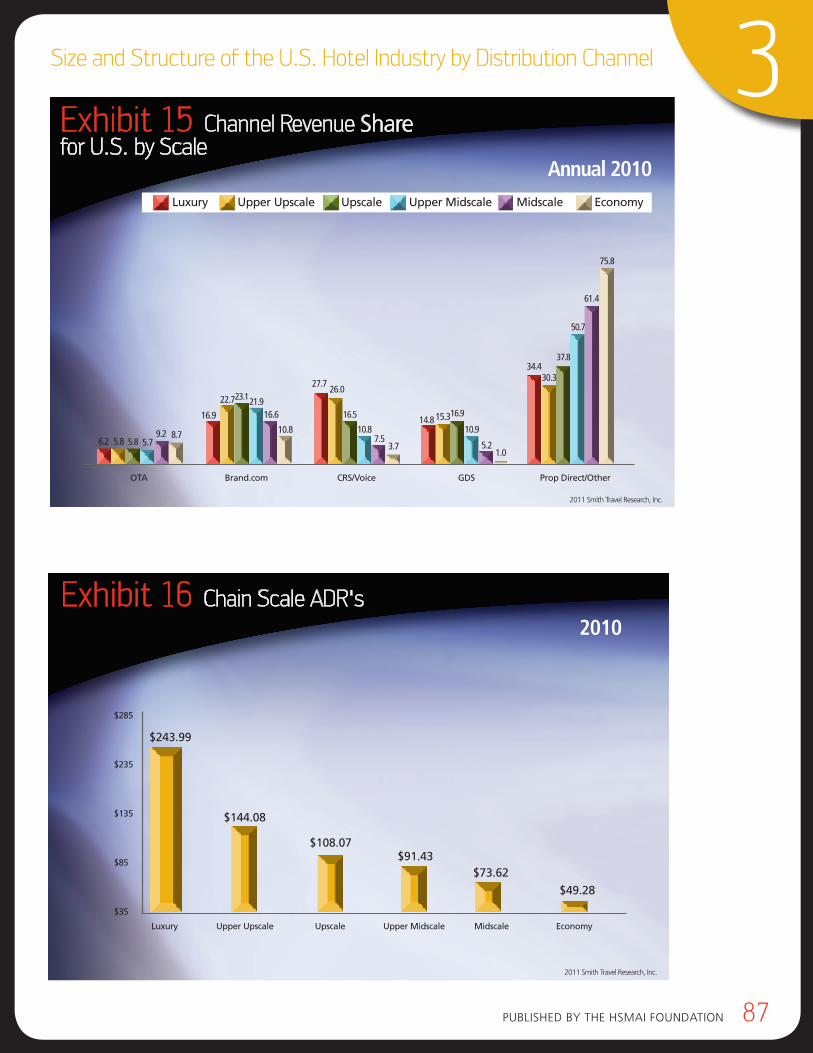
pubLiSHed by THe HSMAi FouNdATioN 87
3Size and Structure of the U.S. Hotel Industry by Distribution Channel
2011 Smith Travel Research, Inc.
OTA Brand.com CRS/Voice GDS Prop Direct/Other
Luxury Upper Upscale Upscale Upper Midscale Midscale Economy
6.2
Annual 2010
Exhibit 15 Channel Revenue Share for U.S. by Scale
5.8 5.8 5.79.2 8.7
16.9
22.723.121.916.6
10.8
27.726.0
16.5
10.87.5
3.7
14.8 15.316.9
10.9
5.21.0
30.3
37.8
50.7
61.4
75.8
34.4
2011 Smith Travel Research, Inc.
Luxury Upper Upscale Upscale Upper Midscale Midscale Economy
$243.99
$144.08
2010Exhibit 16 Chain Scale ADR's
$108.07$91.43
$73.62
$49.28
$285
$235
$135
$85
$35
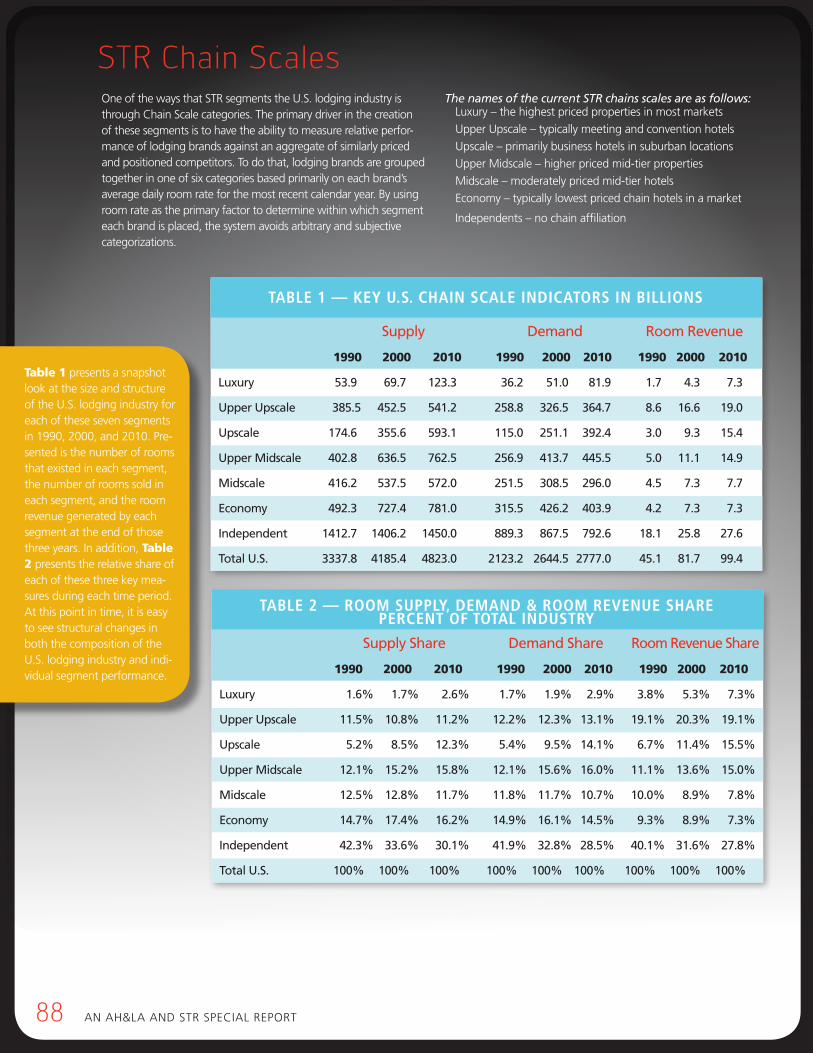
88 AN AH&LA ANd STR SpeciAL RepoRT
one of the ways that STR segments the u.S. lodging industry is through chain Scale categories. The primary driver in the creation of these segments is to have the ability to measure relative perfor-mance of lodging brands against an aggregate of similarly priced and positioned competitors. To do that, lodging brands are grouped together in one of six categories based primarily on each brand’s average daily room rate for the most recent calendar year. by using room rate as the primary factor to determine within which segment each brand is placed, the system avoids arbitrary and subjective categorizations.
The names of the current STR chains scales are as follows:Luxury – the highest priced properties in most markets
upper upscale – typically meeting and convention hotels
upscale – primarily business hotels in suburban locations
upper Midscale – higher priced mid-tier properties
Midscale – moderately priced mid-tier hotels
economy – typically lowest priced chain hotels in a market
independents – no chain affiliation
Supply demand room revenue
1990 2000 2010 1990 2000 2010 1990 2000 2010
luxury 53.9 69.7 123.3 36.2 51.0 81.9 1.7 4.3 7.3
Upper Upscale 385.5 452.5 541.2 258.8 326.5 364.7 8.6 16.6 19.0
Upscale 174.6 355.6 593.1 115.0 251.1 392.4 3.0 9.3 15.4
Upper midscale 402.8 636.5 762.5 256.9 413.7 445.5 5.0 11.1 14.9
midscale 416.2 537.5 572.0 251.5 308.5 296.0 4.5 7.3 7.7
economy 492.3 727.4 781.0 315.5 426.2 403.9 4.2 7.3 7.3
Independent 1412.7 1406.2 1450.0 889.3 867.5 792.6 18.1 25.8 27.6
Total U.S. 3337.8 4185.4 4823.0 2123.2 2644.5 2777.0 45.1 81.7 99.4
table 1 — Key u.s. cHaIn scale IndIcators In bIllIons
Supply Share demand Share room revenue Share
1990 2000 2010 1990 2000 2010 1990 2000 2010
luxury 1.6% 1.7% 2.6% 1.7% 1.9% 2.9% 3.8% 5.3% 7.3%
Upper Upscale 11.5% 10.8% 11.2% 12.2% 12.3% 13.1% 19.1% 20.3% 19.1%
Upscale 5.2% 8.5% 12.3% 5.4% 9.5% 14.1% 6.7% 11.4% 15.5%
Upper midscale 12.1% 15.2% 15.8% 12.1% 15.6% 16.0% 11.1% 13.6% 15.0%
midscale 12.5% 12.8% 11.7% 11.8% 11.7% 10.7% 10.0% 8.9% 7.8%
economy 14.7% 17.4% 16.2% 14.9% 16.1% 14.5% 9.3% 8.9% 7.3%
Independent 42.3% 33.6% 30.1% 41.9% 32.8% 28.5% 40.1% 31.6% 27.8%
Total U.S. 100% 100% 100% 100% 100% 100% 100% 100% 100%
table 2 — rooM suPPly, deMand & rooM reVenue sHare Percent oF total Industry
STR Chain Scales
Table 1 presents a snapshot look at the size and structure of the u.S. lodging industry for each of these seven segments in 1990, 2000, and 2010. pre-sented is the number of rooms that existed in each segment, the number of rooms sold in each segment, and the room revenue generated by each segment at the end of those three years. in addition, Table 2 presents the relative share of each of these three key mea-sures during each time period. At this point in time, it is easy to see structural changes in both the composition of the u.S. lodging industry and indi-vidual segment performance.
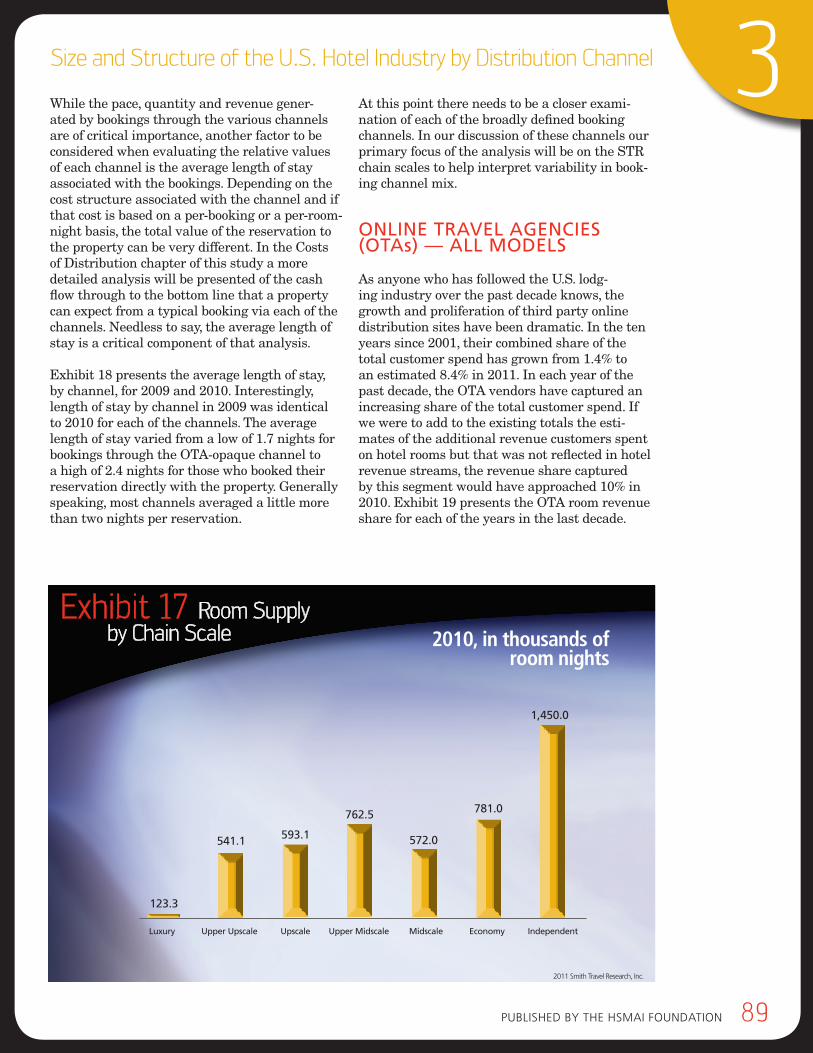
pubLiSHed by THe HSMAi FouNdATioN 89
3Size and Structure of the U.S. Hotel Industry by Distribution Channel
While the pace, quantity and revenue gener-ated by bookings through the various channels are of critical importance, another factor to be considered when evaluating the relative values of each channel is the average length of stay associated with the bookings. Depending on the cost structure associated with the channel and if that cost is based on a per-booking or a per-room-night basis, the total value of the reservation to the property can be very different. In the Costs of Distribution chapter of this study a more detailed analysis will be presented of the cash flow through to the bottom line that a property can expect from a typical booking via each of the channels. Needless to say, the average length of stay is a critical component of that analysis.
Exhibit 18 presents the average length of stay, by channel, for 2009 and 2010. Interestingly, length of stay by channel in 2009 was identical to 2010 for each of the channels. The average length of stay varied from a low of 1.7 nights for bookings through the OTA-opaque channel to a high of 2.4 nights for those who booked their reservation directly with the property. Generally speaking, most channels averaged a little more than two nights per reservation.
At this point there needs to be a closer exami-nation of each of the broadly defined booking channels. In our discussion of these channels our primary focus of the analysis will be on the STR chain scales to help interpret variability in book-ing channel mix.
onlIne TrAvel AgencIeS (oTAs) — All modelS
As anyone who has followed the U.S. lodg-ing industry over the past decade knows, the growth and proliferation of third party online distribution sites have been dramatic. In the ten years since 2001, their combined share of the total customer spend has grown from 1.4% to an estimated 8.4% in 2011. In each year of the past decade, the OTA vendors have captured an increasing share of the total customer spend. If we were to add to the existing totals the esti-mates of the additional revenue customers spent on hotel rooms but that was not reflected in hotel revenue streams, the revenue share captured by this segment would have approached 10% in 2010. Exhibit 19 presents the OTA room revenue share for each of the years in the last decade.
2011 Smith Travel Research, Inc.
Luxury Upper Upscale Upscale Upper Midscale Midscale Economy Independent
123.3
541.1
2010, in thousands of room nights
Exhibit 17 Room Supply by Chain Scale
593.1
762.5
572.0
1,450.0
781.0
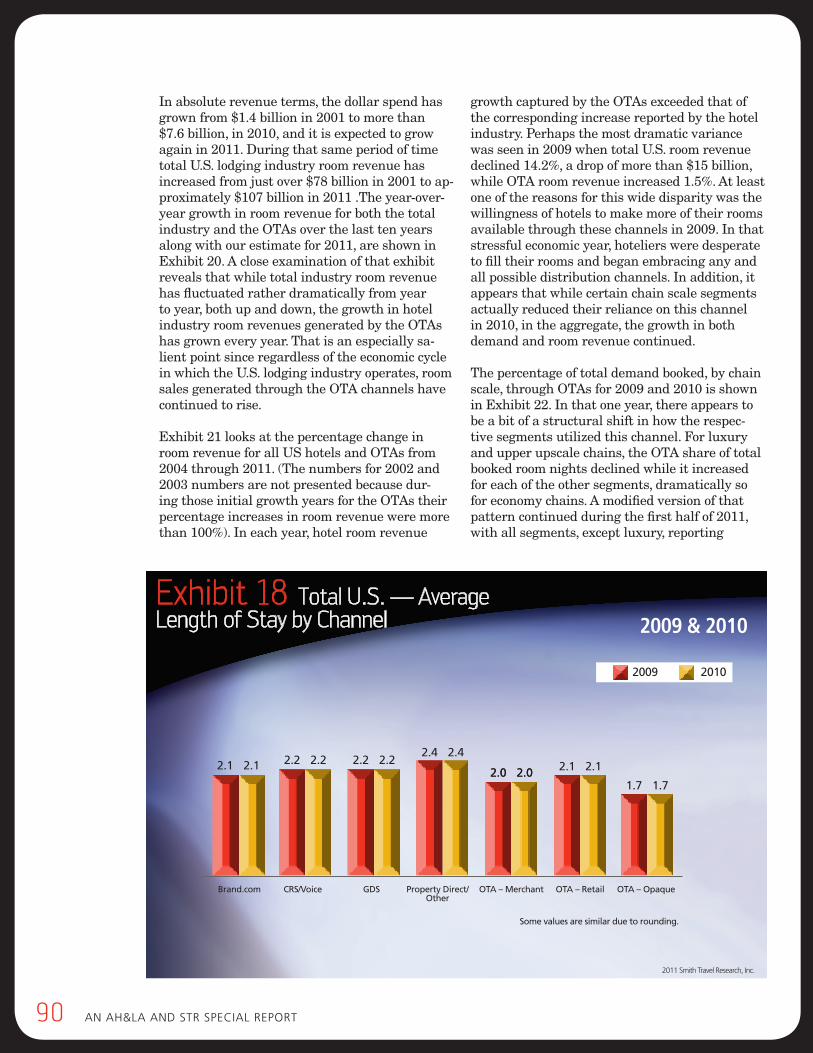
90 AN AH&LA ANd STR SpeciAL RepoRT
In absolute revenue terms, the dollar spend has grown from $1.4 billion in 2001 to more than $7.6 billion, in 2010, and it is expected to grow again in 2011. During that same period of time total U.S. lodging industry room revenue has increased from just over $78 billion in 2001 to ap-proximately $107 billion in 2011 .The year-over-year growth in room revenue for both the total industry and the OTAs over the last ten years along with our estimate for 2011, are shown in Exhibit 20. A close examination of that exhibit reveals that while total industry room revenue has fluctuated rather dramatically from year to year, both up and down, the growth in hotel industry room revenues generated by the OTAs has grown every year. That is an especially sa-lient point since regardless of the economic cycle in which the U.S. lodging industry operates, room sales generated through the OTA channels have continued to rise.
Exhibit 21 looks at the percentage change in room revenue for all US hotels and OTAs from 2004 through 2011. (The numbers for 2002 and 2003 numbers are not presented because dur-ing those initial growth years for the OTAs their percentage increases in room revenue were more than 100%). In each year, hotel room revenue
growth captured by the OTAs exceeded that of the corresponding increase reported by the hotel industry. Perhaps the most dramatic variance was seen in 2009 when total U.S. room revenue declined 14.2%, a drop of more than $15 billion, while OTA room revenue increased 1.5%. At least one of the reasons for this wide disparity was the willingness of hotels to make more of their rooms available through these channels in 2009. In that stressful economic year, hoteliers were desperate to fill their rooms and began embracing any and all possible distribution channels. In addition, it appears that while certain chain scale segments actually reduced their reliance on this channel in 2010, in the aggregate, the growth in both demand and room revenue continued.
The percentage of total demand booked, by chain scale, through OTAs for 2009 and 2010 is shown in Exhibit 22. In that one year, there appears to be a bit of a structural shift in how the respec-tive segments utilized this channel. For luxury and upper upscale chains, the OTA share of total booked room nights declined while it increased for each of the other segments, dramatically so for economy chains. A modified version of that pattern continued during the first half of 2011, with all segments, except luxury, reporting
2011 Smith Travel Research, Inc.
Brand.com CRS/Voice GDS Property Direct/ OTA – Merchant OTA – Retail OTA – Opaque Other
2009 2010
2.1 2.1 2.2 2.2
2009 & 2010Exhibit 18 Total U.S. — Average Length of Stay by Channel
2.2 2.22.4 2.4
2.0 2.02.0 2.0 2.1 2.1
1.7 1.7
Some values are similar due to rounding.
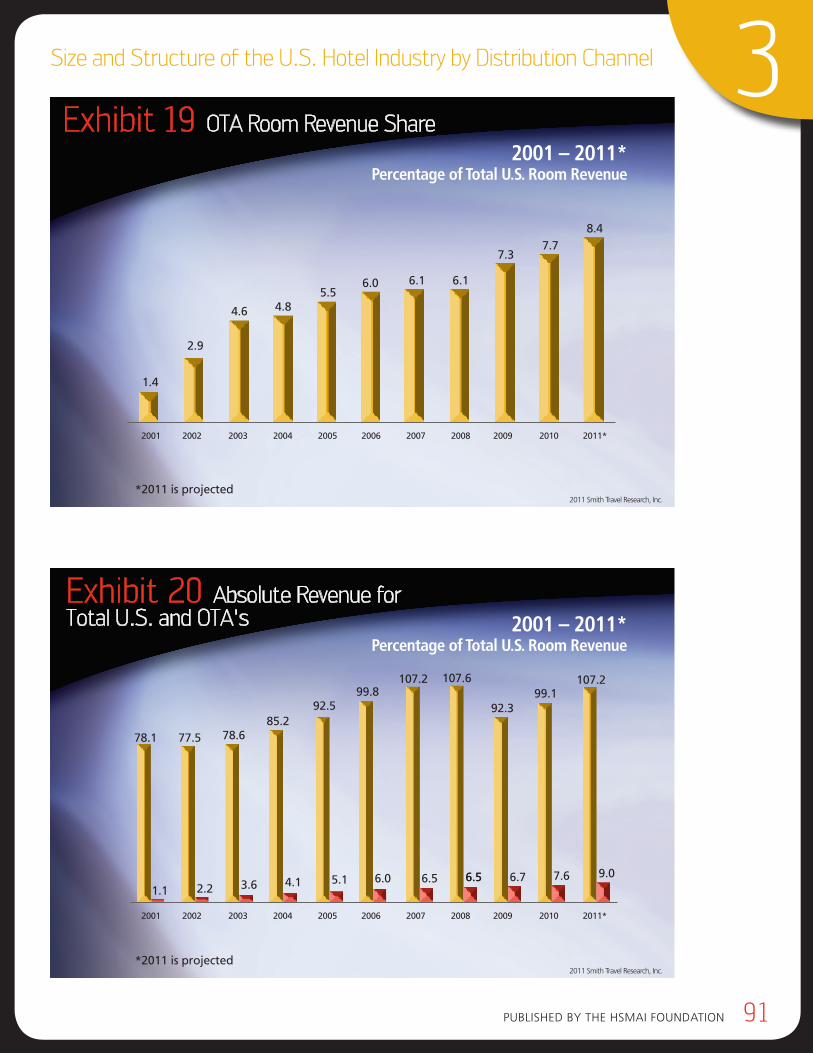
pubLiSHed by THe HSMAi FouNdATioN 91
3Size and Structure of the U.S. Hotel Industry by Distribution Channel
2011 Smith Travel Research, Inc.
2001 2002 2003 2004 2005 2006 2007 2008 2009 2010 2011*
*2011 is projected
78.1
2001 – 2011* Percentage of Total U.S. Room Revenue
Exhibit 20 Absolute Revenue for Total U.S. and OTA's
107.2
1.1
77.5
2.2
78.6
3.6
85.2
4.1
92.5
5.1
99.8
6.0
107.2
6.5
107.6
6.56.5 6.7
92.3
7.6
99.1
9.0
2011 Smith Travel Research, Inc.
2001 2002 2003 2004 2005 2006 2007 2008 2009 2010 2011*
*2011 is projected
1.4
2001 – 2011* Percentage of Total U.S. Room Revenue
Exhibit 19 OTA Room Revenue Share
2.9
4.6 4.85.5
6.0 6.1 6.1
7.37.7
8.4
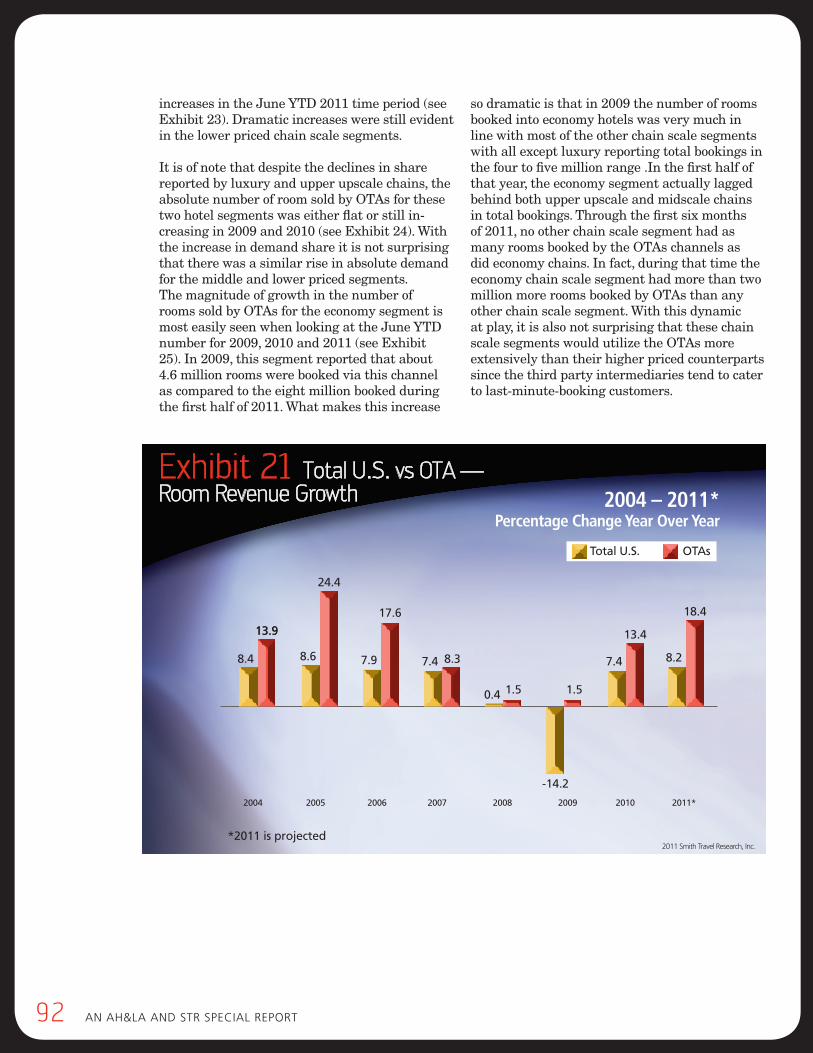
92 AN AH&LA ANd STR SpeciAL RepoRT
increases in the June YTD 2011 time period (see Exhibit 23). Dramatic increases were still evident in the lower priced chain scale segments.
It is of note that despite the declines in share reported by luxury and upper upscale chains, the absolute number of room sold by OTAs for these two hotel segments was either flat or still in-creasing in 2009 and 2010 (see Exhibit 24). With the increase in demand share it is not surprising that there was a similar rise in absolute demand for the middle and lower priced segments. The magnitude of growth in the number of rooms sold by OTAs for the economy segment is most easily seen when looking at the June YTD number for 2009, 2010 and 2011 (see Exhibit 25). In 2009, this segment reported that about 4.6 million rooms were booked via this channel as compared to the eight million booked during the first half of 2011. What makes this increase
so dramatic is that in 2009 the number of rooms booked into economy hotels was very much in line with most of the other chain scale segments with all except luxury reporting total bookings in the four to five million range .In the first half of that year, the economy segment actually lagged behind both upper upscale and midscale chains in total bookings. Through the first six months of 2011, no other chain scale segment had as many rooms booked by the OTAs channels as did economy chains. In fact, during that time the economy chain scale segment had more than two million more rooms booked by OTAs than any other chain scale segment. With this dynamic at play, it is also not surprising that these chain scale segments would utilize the OTAs more extensively than their higher priced counterparts since the third party intermediaries tend to cater to last-minute-booking customers.
2011 Smith Travel Research, Inc.
2004 2005 2006 2007 2008 2009 2010 2011*
*2011 is projected
8.4
2004 – 2011* Percentage Change Year Over Year
Exhibit 21 Total U.S. vs OTA — Room Revenue Growth
13.913.9
8.6
24.4
7.9
17.6
7.4 8.3
0.4 1.5
-14.2
1.5
7.4
13.4
8.2
18.4
Total U.S. OTAs
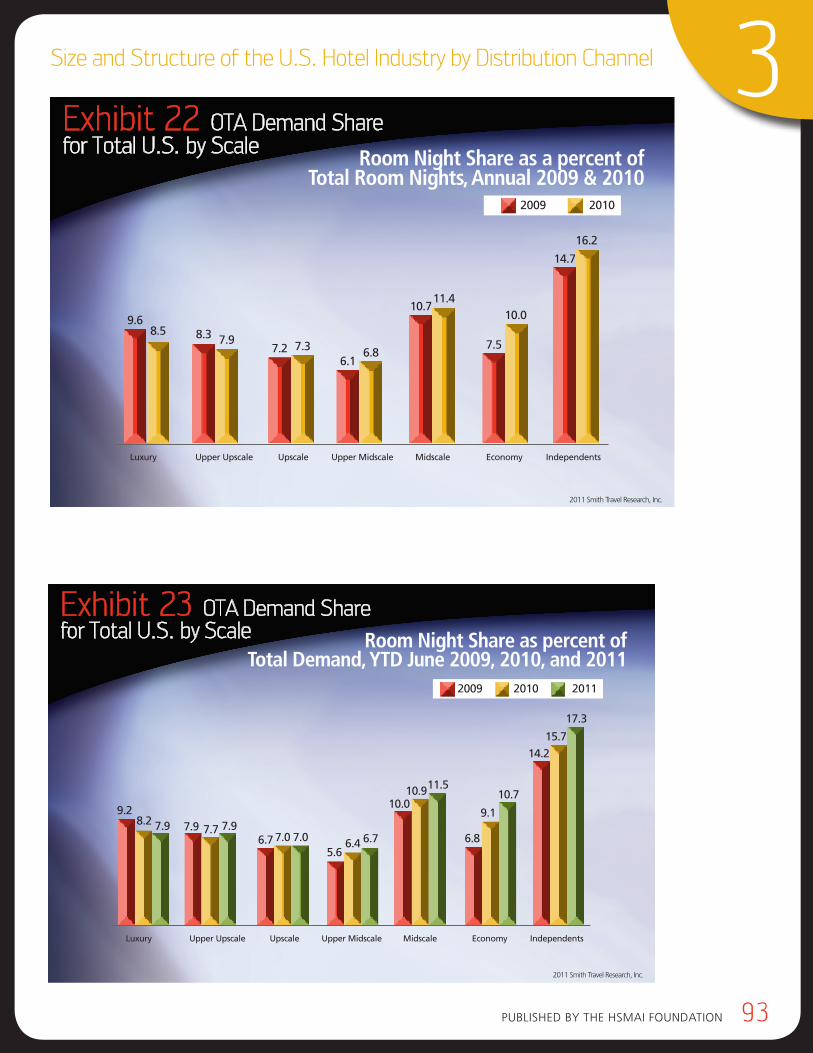
pubLiSHed by THe HSMAi FouNdATioN 93
3Size and Structure of the U.S. Hotel Industry by Distribution Channel
2011 Smith Travel Research, Inc.
Luxury Upper Upscale Upscale Upper Midscale Midscale Economy Independents
9.2
Room Night Share as percent of Total Demand, YTD June 2009, 2010, and 2011
Exhibit 23 OTA Demand Share for Total U.S. by Scale
8.2
2009 2010 2011
7.9 7.9 7.7 7.97.07.06.7 6.76.4
5.6
11.510.910.0
10.7
9.1
6.8
17.3
15.7
14.2
2011 Smith Travel Research, Inc.
Luxury Upper Upscale Upscale Upper Midscale Midscale Economy Independents
9.6
Room Night Share as a percent of Total Room Nights, Annual 2009 & 2010
Exhibit 22 OTA Demand Share for Total U.S. by Scale
8.5 8.3 7.97.2 7.3
6.16.8
10.711.4
7.5
10.0
14.7
16.2
2009 2010
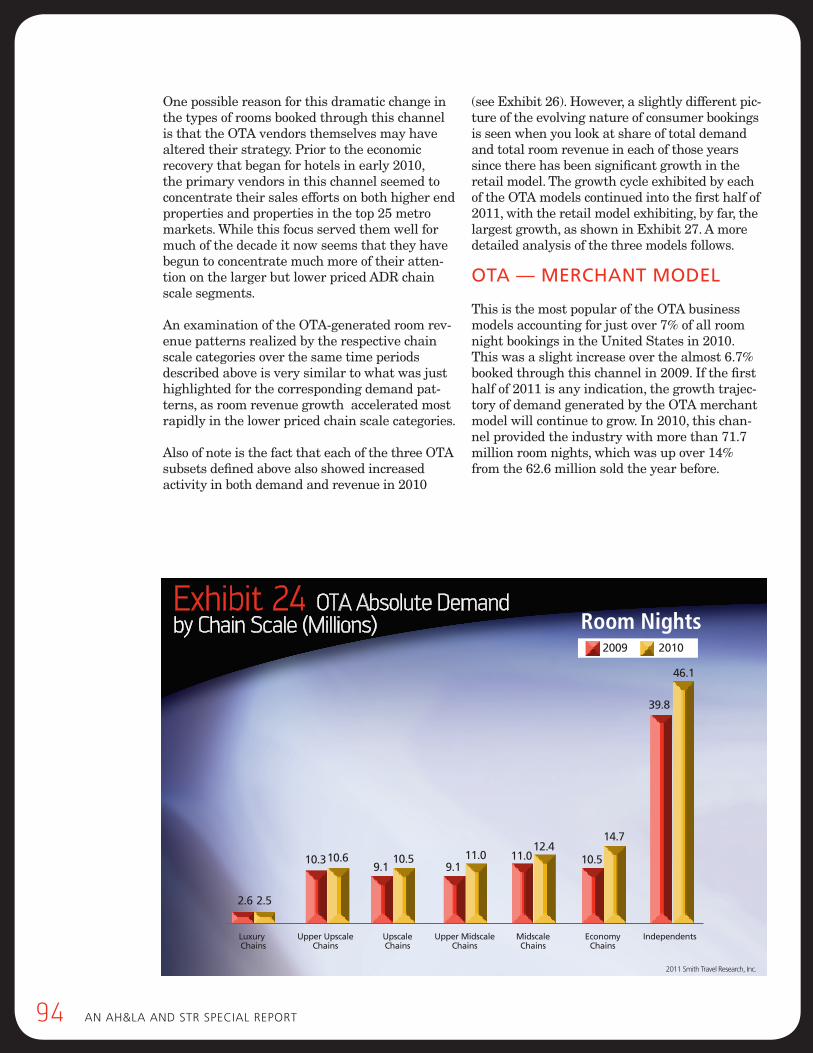
94 AN AH&LA ANd STR SpeciAL RepoRT
One possible reason for this dramatic change in the types of rooms booked through this channel is that the OTA vendors themselves may have altered their strategy. Prior to the economic recovery that began for hotels in early 2010, the primary vendors in this channel seemed to concentrate their sales efforts on both higher end properties and properties in the top 25 metro markets. While this focus served them well for much of the decade it now seems that they have begun to concentrate much more of their atten-tion on the larger but lower priced ADR chain scale segments.
An examination of the OTA-generated room rev-enue patterns realized by the respective chain scale categories over the same time periods described above is very similar to what was just highlighted for the corresponding demand pat-terns, as room revenue growth accelerated most rapidly in the lower priced chain scale categories.
Also of note is the fact that each of the three OTA subsets defined above also showed increased activity in both demand and revenue in 2010
(see Exhibit 26). However, a slightly different pic-ture of the evolving nature of consumer bookings is seen when you look at share of total demand and total room revenue in each of those years since there has been significant growth in the retail model. The growth cycle exhibited by each of the OTA models continued into the first half of 2011, with the retail model exhibiting, by far, the largest growth, as shown in Exhibit 27. A more detailed analysis of the three models follows.
oTA — mercHAnT model
This is the most popular of the OTA business models accounting for just over 7% of all room night bookings in the United States in 2010. This was a slight increase over the almost 6.7% booked through this channel in 2009. If the first half of 2011 is any indication, the growth trajec-tory of demand generated by the OTA merchant model will continue to grow. In 2010, this chan-nel provided the industry with more than 71.7 million room nights, which was up over 14% from the 62.6 million sold the year before.
Room Nights
2011 Smith Travel Research, Inc.
Luxury Upper Upscale Upscale Upper Midscale Midscale Economy Independents Chains Chains Chains Chains Chains Chains
Exhibit 24 OTA Absolute Demand by Chain Scale (Millions)
2009 2010
14.7
46.1
39.8
2.6
10.512.4
11.011.09.1
10.59.1
10.610.3
2.5
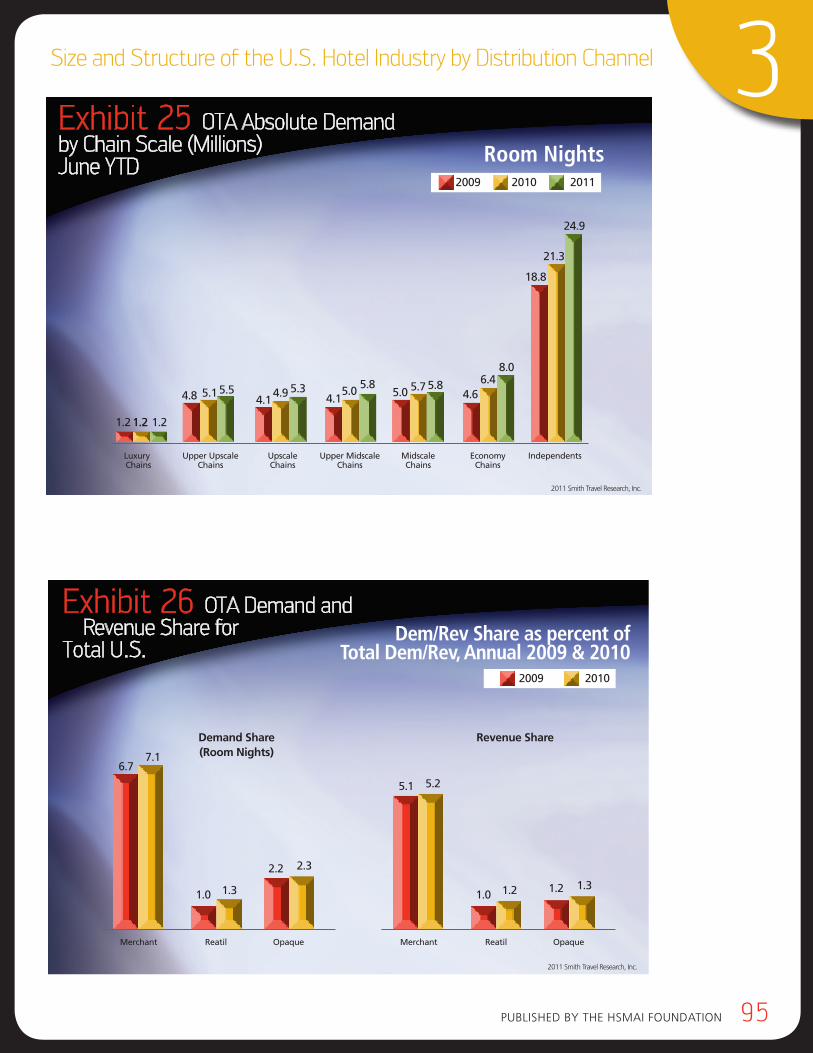
pubLiSHed by THe HSMAi FouNdATioN 95
3Size and Structure of the U.S. Hotel Industry by Distribution Channel
2011 Smith Travel Research, Inc.
Luxury Upper Upscale Upscale Upper Midscale Midscale Economy Independents Chains Chains Chains Chains Chains Chains
Exhibit 25 OTA Absolute Demand by Chain Scale (Millions) June YTD
1.2
2009 2010 2011
4.8 5.1 5.5 5.34.94.1
5.85.0
4.15.85.75.0
8.06.4
4.6
24.9
21.3
18.8
1.21.2 1.2
Room Nights
2011 Smith Travel Research, Inc.
Merchant Reatil Opaque
2009 2010
6.77.1
Dem/Rev Share as percent of Total Dem/Rev, Annual 2009 & 2010
Exhibit 26 OTA Demand and Revenue Share for Total U.S.
1.0 1.3
2.2 2.3
Demand Share(Room Nights)
Merchant Reatil Opaque
5.1 5.2
1.0 1.2 1.2 1.3
Revenue Share
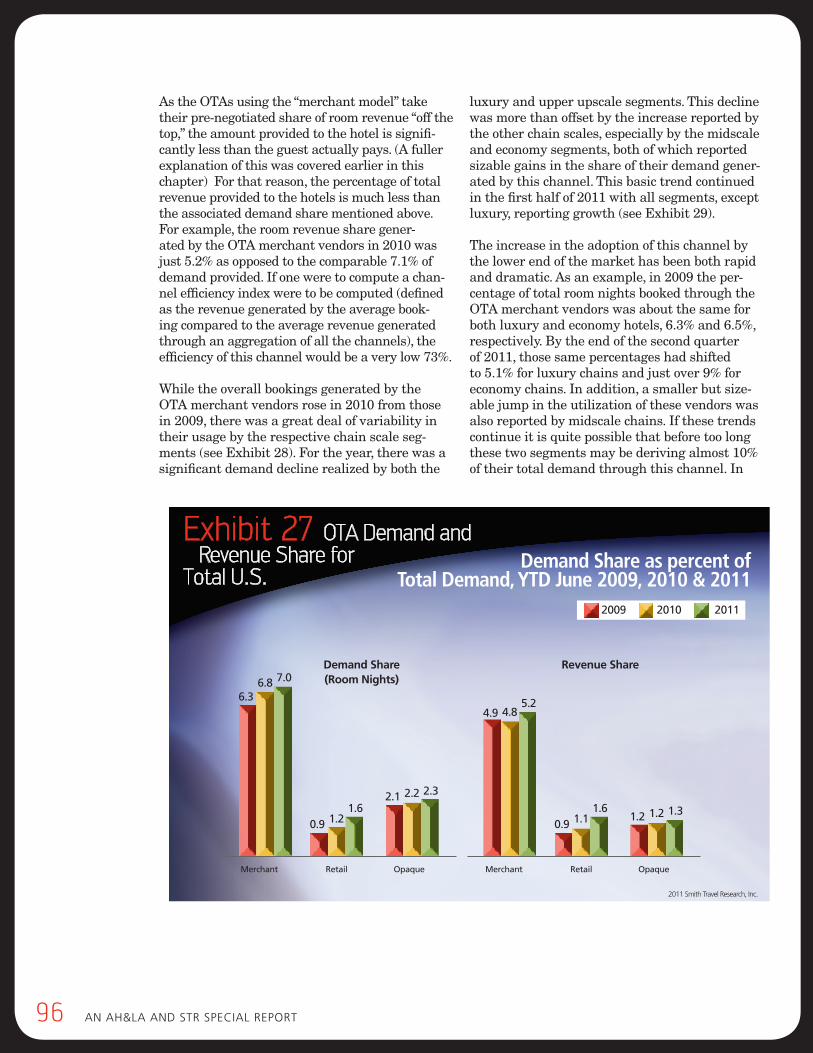
96 AN AH&LA ANd STR SpeciAL RepoRT
As the OTAs using the “merchant model” take their pre-negotiated share of room revenue “off the top,” the amount provided to the hotel is signifi-cantly less than the guest actually pays. (A fuller explanation of this was covered earlier in this chapter) For that reason, the percentage of total revenue provided to the hotels is much less than the associated demand share mentioned above. For example, the room revenue share gener-ated by the OTA merchant vendors in 2010 was just 5.2% as opposed to the comparable 7.1% of demand provided. If one were to compute a chan-nel efficiency index were to be computed (defined as the revenue generated by the average book-ing compared to the average revenue generated through an aggregation of all the channels), the efficiency of this channel would be a very low 73%.
While the overall bookings generated by the OTA merchant vendors rose in 2010 from those in 2009, there was a great deal of variability in their usage by the respective chain scale seg-ments (see Exhibit 28). For the year, there was a significant demand decline realized by both the
luxury and upper upscale segments. This decline was more than offset by the increase reported by the other chain scales, especially by the midscale and economy segments, both of which reported sizable gains in the share of their demand gener-ated by this channel. This basic trend continued in the first half of 2011 with all segments, except luxury, reporting growth (see Exhibit 29).
The increase in the adoption of this channel by the lower end of the market has been both rapid and dramatic. As an example, in 2009 the per-centage of total room nights booked through the OTA merchant vendors was about the same for both luxury and economy hotels, 6.3% and 6.5%, respectively. By the end of the second quarter of 2011, those same percentages had shifted to 5.1% for luxury chains and just over 9% for economy chains. In addition, a smaller but size-able jump in the utilization of these vendors was also reported by midscale chains. If these trends continue it is quite possible that before too long these two segments may be deriving almost 10% of their total demand through this channel. In
2011 Smith Travel Research, Inc.
Merchant Retail Opaque
Demand Share as percent of Total Demand, YTD June 2009, 2010 & 2011
Exhibit 27 OTA Demand and Revenue Share for Total U.S.
2.2 2.3
Demand Share(Room Nights)
2009 2010 2011
2.1
1.21.6
0.9
6.8 7.0
6.3
Merchant Retail Opaque
1.2 1.3
Revenue Share
1.21.11.6
0.9
4.85.2
4.9
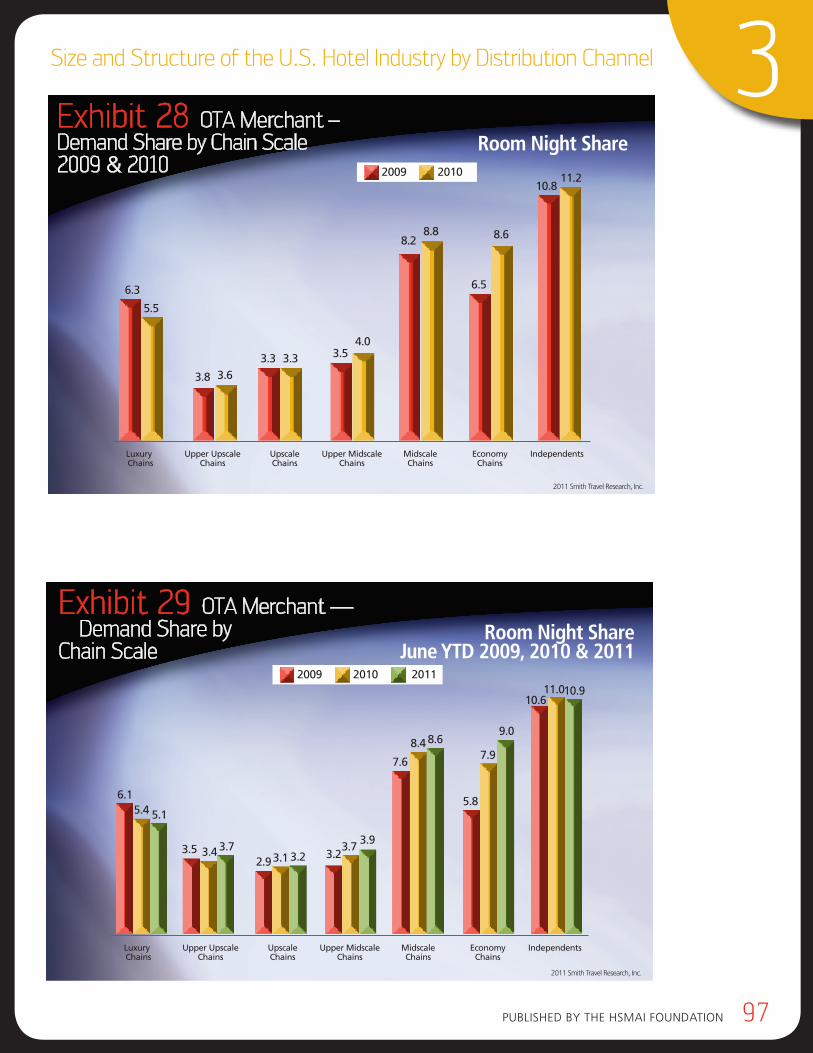
pubLiSHed by THe HSMAi FouNdATioN 97
3Size and Structure of the U.S. Hotel Industry by Distribution Channel
2011 Smith Travel Research, Inc.
Luxury Upper Upscale Upscale Upper Midscale Midscale Economy Independents Chains Chains Chains Chains Chains Chains
Exhibit 28 OTA Merchant – Demand Share by Chain Scale 2009 & 2010 2009 2010
8.6
11.210.8
6.3 6.5
8.88.2
4.03.53.33.3
3.63.8
5.5
Room Night Share
2011 Smith Travel Research, Inc.
Luxury Upper Upscale Upscale Upper Midscale Midscale Economy Independents Chains Chains Chains Chains Chains Chains
Exhibit 29 OTA Merchant — Demand Share by Chain Scale
6.1
3.5 3.4 3.73.23.12.9
3.93.7
3.2
8.68.4
7.6
9.0
7.9
5.8
10.911.010.6
2009 2010 2011
5.4 5.1
Room Night ShareJune YTD 2009, 2010 & 2011
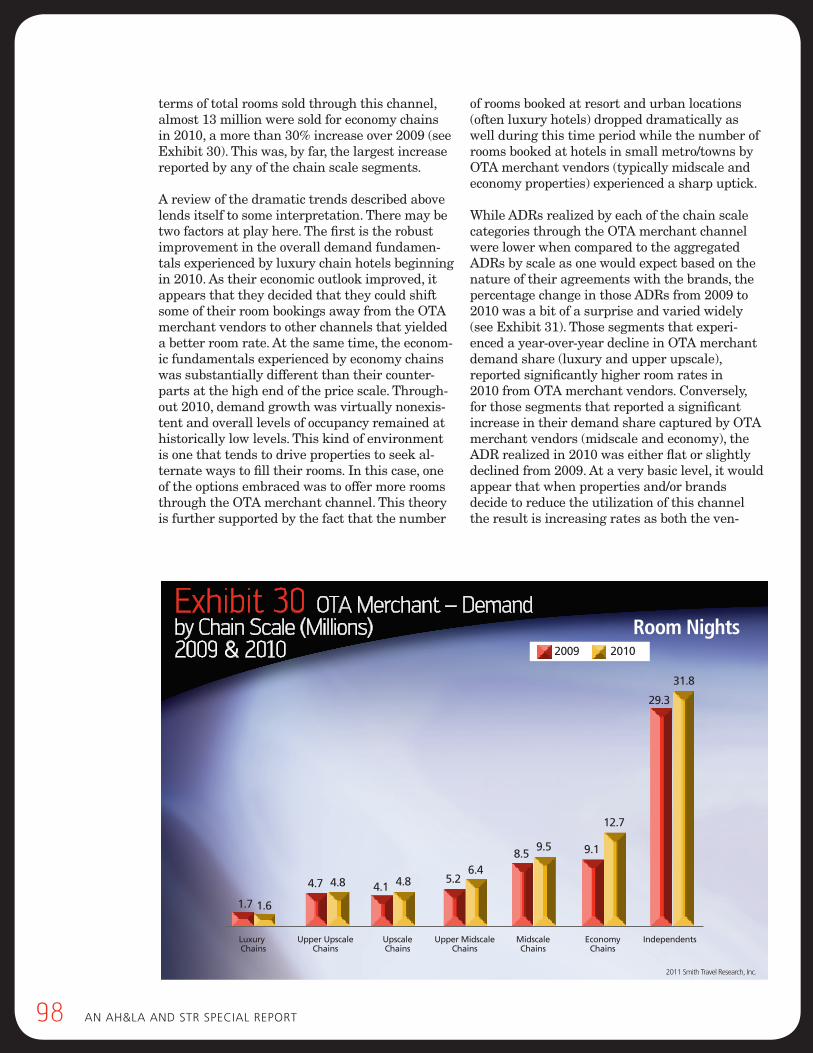
98 AN AH&LA ANd STR SpeciAL RepoRT
terms of total rooms sold through this channel, almost 13 million were sold for economy chains in 2010, a more than 30% increase over 2009 (see Exhibit 30). This was, by far, the largest increase reported by any of the chain scale segments.
A review of the dramatic trends described above lends itself to some interpretation. There may be two factors at play here. The first is the robust improvement in the overall demand fundamen-tals experienced by luxury chain hotels beginning in 2010. As their economic outlook improved, it appears that they decided that they could shift some of their room bookings away from the OTA merchant vendors to other channels that yielded a better room rate. At the same time, the econom-ic fundamentals experienced by economy chains was substantially different than their counter-parts at the high end of the price scale. Through-out 2010, demand growth was virtually nonexis-tent and overall levels of occupancy remained at historically low levels. This kind of environment is one that tends to drive properties to seek al-ternate ways to fill their rooms. In this case, one of the options embraced was to offer more rooms through the OTA merchant channel. This theory is further supported by the fact that the number
of rooms booked at resort and urban locations (often luxury hotels) dropped dramatically as well during this time period while the number of rooms booked at hotels in small metro/towns by OTA merchant vendors (typically midscale and economy properties) experienced a sharp uptick.
While ADRs realized by each of the chain scale categories through the OTA merchant channel were lower when compared to the aggregated ADRs by scale as one would expect based on the nature of their agreements with the brands, the percentage change in those ADRs from 2009 to 2010 was a bit of a surprise and varied widely (see Exhibit 31). Those segments that experi-enced a year-over-year decline in OTA merchant demand share (luxury and upper upscale), reported significantly higher room rates in 2010 from OTA merchant vendors. Conversely, for those segments that reported a significant increase in their demand share captured by OTA merchant vendors (midscale and economy), the ADR realized in 2010 was either flat or slightly declined from 2009. At a very basic level, it would appear that when properties and/or brands decide to reduce the utilization of this channel the result is increasing rates as both the ven-
Room Nights
2011 Smith Travel Research, Inc.
Luxury Upper Upscale Upscale Upper Midscale Midscale Economy Independents Chains Chains Chains Chains Chains Chains
Exhibit 30 OTA Merchant – Demand by Chain Scale (Millions) 2009 & 2010 2009 2010
12.7
31.8
29.3
1.7
9.19.58.5
6.45.24.84.14.84.7
1.6
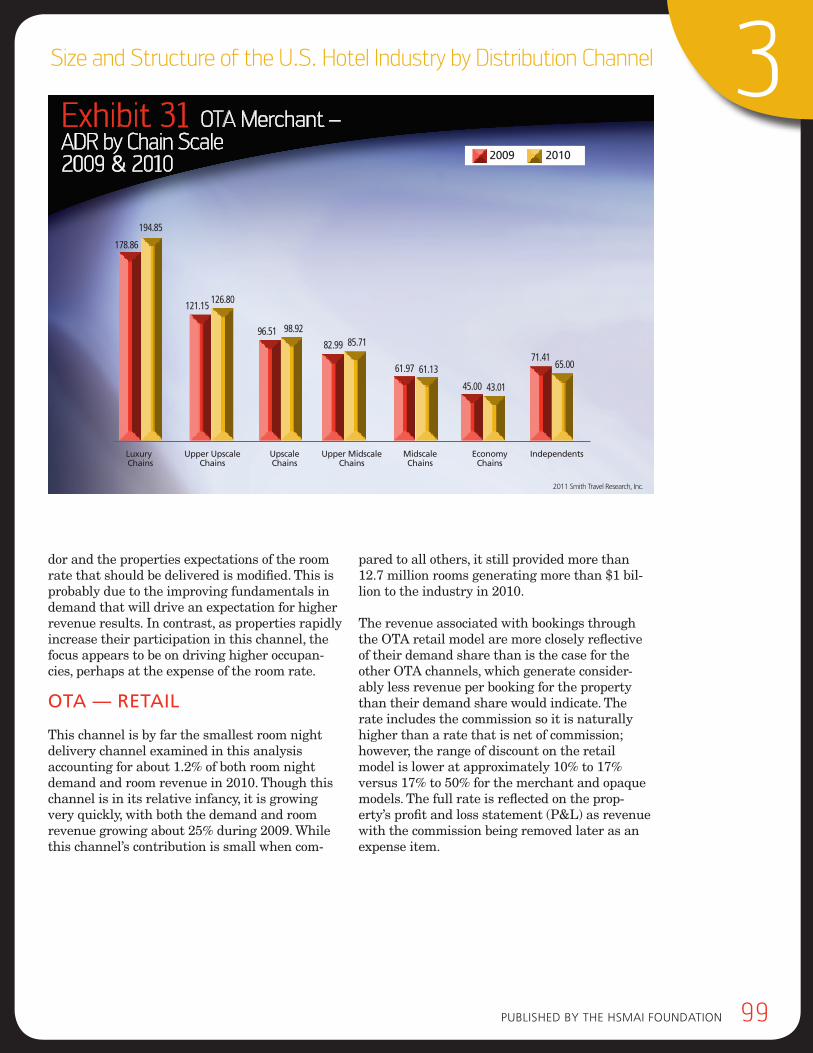
pubLiSHed by THe HSMAi FouNdATioN 99
3Size and Structure of the U.S. Hotel Industry by Distribution Channel
2011 Smith Travel Research, Inc.
Luxury Upper Upscale Upscale Upper Midscale Midscale Economy Independents Chains Chains Chains Chains Chains Chains
Exhibit 31 OTA Merchant – ADR by Chain Scale 2009 & 2010 2009 2010
178.86
194.85
121.15126.80
96.51 98.92
82.99 85.71
61.97 61.13
45.00 43.01
71.4165.00
dor and the properties expectations of the room rate that should be delivered is modified. This is probably due to the improving fundamentals in demand that will drive an expectation for higher revenue results. In contrast, as properties rapidly increase their participation in this channel, the focus appears to be on driving higher occupan-cies, perhaps at the expense of the room rate.
oTA — reTAIl
This channel is by far the smallest room night delivery channel examined in this analysis accounting for about 1.2% of both room night demand and room revenue in 2010. Though this channel is in its relative infancy, it is growing very quickly, with both the demand and room revenue growing about 25% during 2009. While this channel’s contribution is small when com-
pared to all others, it still provided more than 12.7 million rooms generating more than $1 bil-lion to the industry in 2010.
The revenue associated with bookings through the OTA retail model are more closely reflective of their demand share than is the case for the other OTA channels, which generate consider-ably less revenue per booking for the property than their demand share would indicate. The rate includes the commission so it is naturally higher than a rate that is net of commission; however, the range of discount on the retail model is lower at approximately 10% to 17% versus 17% to 50% for the merchant and opaque models. The full rate is reflected on the prop-erty’s profit and loss statement (P&L) as revenue with the commission being removed later as an expense item.
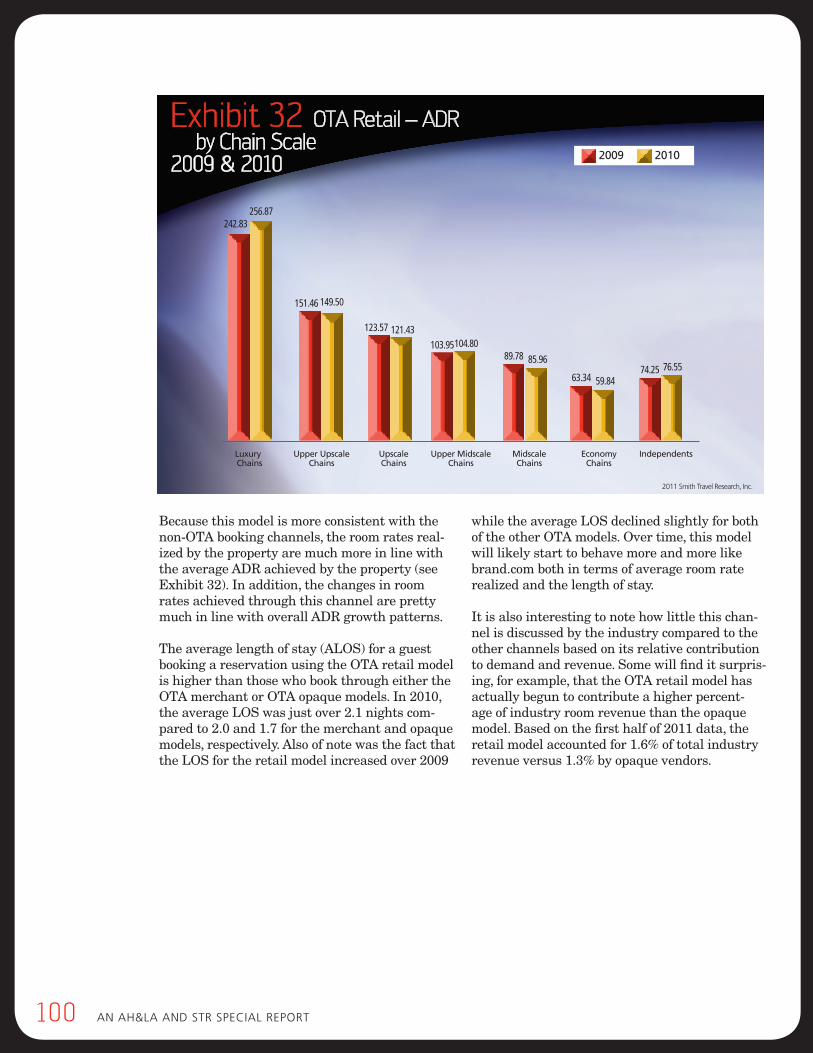
100 AN AH&LA ANd STR SpeciAL RepoRT
2011 Smith Travel Research, Inc.
Luxury Upper Upscale Upscale Upper Midscale Midscale Economy Independents Chains Chains Chains Chains Chains Chains
Exhibit 32 OTA Retail – ADR by Chain Scale 2009 & 2010 2009 2010
242.83256.87
151.46 149.50
123.57 121.43103.95104.80
89.78 85.96
63.34 59.8474.25 76.55
Because this model is more consistent with the non-OTA booking channels, the room rates real-ized by the property are much more in line with the average ADR achieved by the property (see Exhibit 32). In addition, the changes in room rates achieved through this channel are pretty much in line with overall ADR growth patterns.
The average length of stay (ALOS) for a guest booking a reservation using the OTA retail model is higher than those who book through either the OTA merchant or OTA opaque models. In 2010, the average LOS was just over 2.1 nights com-pared to 2.0 and 1.7 for the merchant and opaque models, respectively. Also of note was the fact that the LOS for the retail model increased over 2009
while the average LOS declined slightly for both of the other OTA models. Over time, this model will likely start to behave more and more like brand.com both in terms of average room rate realized and the length of stay.
It is also interesting to note how little this chan-nel is discussed by the industry compared to the other channels based on its relative contribution to demand and revenue. Some will find it surpris-ing, for example, that the OTA retail model has actually begun to contribute a higher percent-age of industry room revenue than the opaque model. Based on the first half of 2011 data, the retail model accounted for 1.6% of total industry revenue versus 1.3% by opaque vendors.
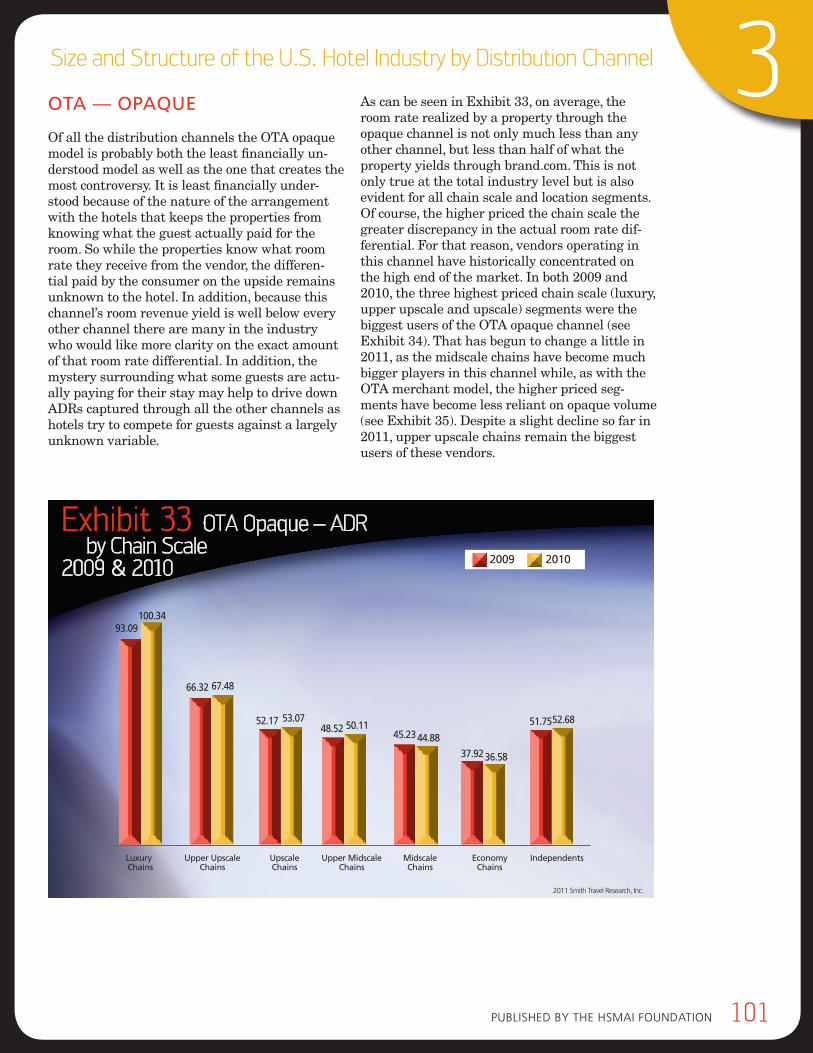
pubLiSHed by THe HSMAi FouNdATioN 101
3Size and Structure of the U.S. Hotel Industry by Distribution Channel
oTA — opAqUe
Of all the distribution channels the OTA opaque model is probably both the least financially un-derstood model as well as the one that creates the most controversy. It is least financially under-stood because of the nature of the arrangement with the hotels that keeps the properties from knowing what the guest actually paid for the room. So while the properties know what room rate they receive from the vendor, the differen-tial paid by the consumer on the upside remains unknown to the hotel. In addition, because this channel’s room revenue yield is well below every other channel there are many in the industry who would like more clarity on the exact amount of that room rate differential. In addition, the mystery surrounding what some guests are actu-ally paying for their stay may help to drive down ADRs captured through all the other channels as hotels try to compete for guests against a largely unknown variable.
As can be seen in Exhibit 33, on average, the room rate realized by a property through the opaque channel is not only much less than any other channel, but less than half of what the property yields through brand.com. This is not only true at the total industry level but is also evident for all chain scale and location segments. Of course, the higher priced the chain scale the greater discrepancy in the actual room rate dif-ferential. For that reason, vendors operating in this channel have historically concentrated on the high end of the market. In both 2009 and 2010, the three highest priced chain scale (luxury, upper upscale and upscale) segments were the biggest users of the OTA opaque channel (see Exhibit 34). That has begun to change a little in 2011, as the midscale chains have become much bigger players in this channel while, as with the OTA merchant model, the higher priced seg-ments have become less reliant on opaque volume (see Exhibit 35). Despite a slight decline so far in 2011, upper upscale chains remain the biggest users of these vendors.
2011 Smith Travel Research, Inc.
Luxury Upper Upscale Upscale Upper Midscale Midscale Economy Independents Chains Chains Chains Chains Chains Chains
Exhibit 33 OTA Opaque – ADR by Chain Scale 2009 & 2010 2009 2010
93.09100.34
66.32 67.48
52.17 53.0748.52 50.11
45.2344.88
37.9236.58
51.7552.68
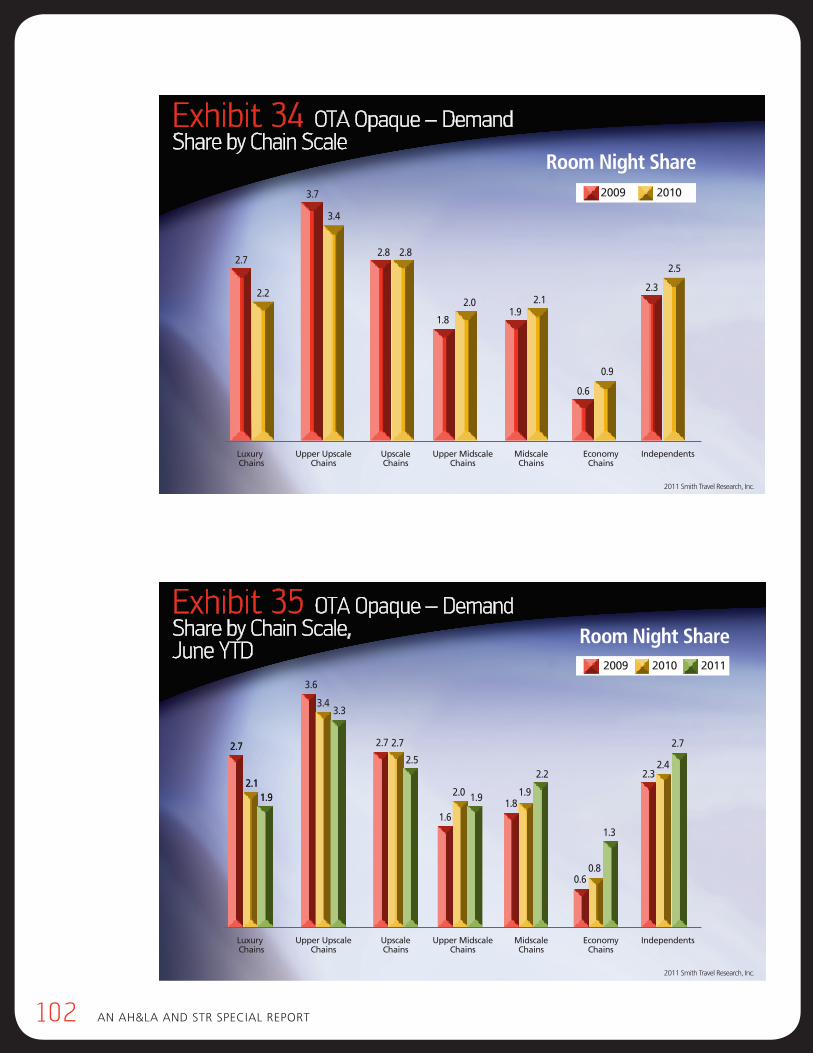
102 AN AH&LA ANd STR SpeciAL RepoRT
2011 Smith Travel Research, Inc.
Luxury Upper Upscale Upscale Upper Midscale Midscale Economy Independents Chains Chains Chains Chains Chains Chains
Exhibit 34 OTA Opaque – Demand Share by Chain Scale
2009 2010
2.7
2.2
3.7
3.4
2.8 2.8
1.8
2.01.9
2.1
0.6
0.9
2.3
2.5
Room Night Share
2011 Smith Travel Research, Inc.
Luxury Upper Upscale Upscale Upper Midscale Midscale Economy Independents Chains Chains Chains Chains Chains Chains
Exhibit 35 OTA Opaque – Demand Share by Chain Scale, June YTD
2009 2010 2011
2.7
2.11.9
3.6
3.43.3
2.7
2.11.9
2.7 2.7
2.5
1.6
1.92.01.8
2.2
1.9
0.6
1.3
0.8
2.3
2.7
2.4
Room Night Share
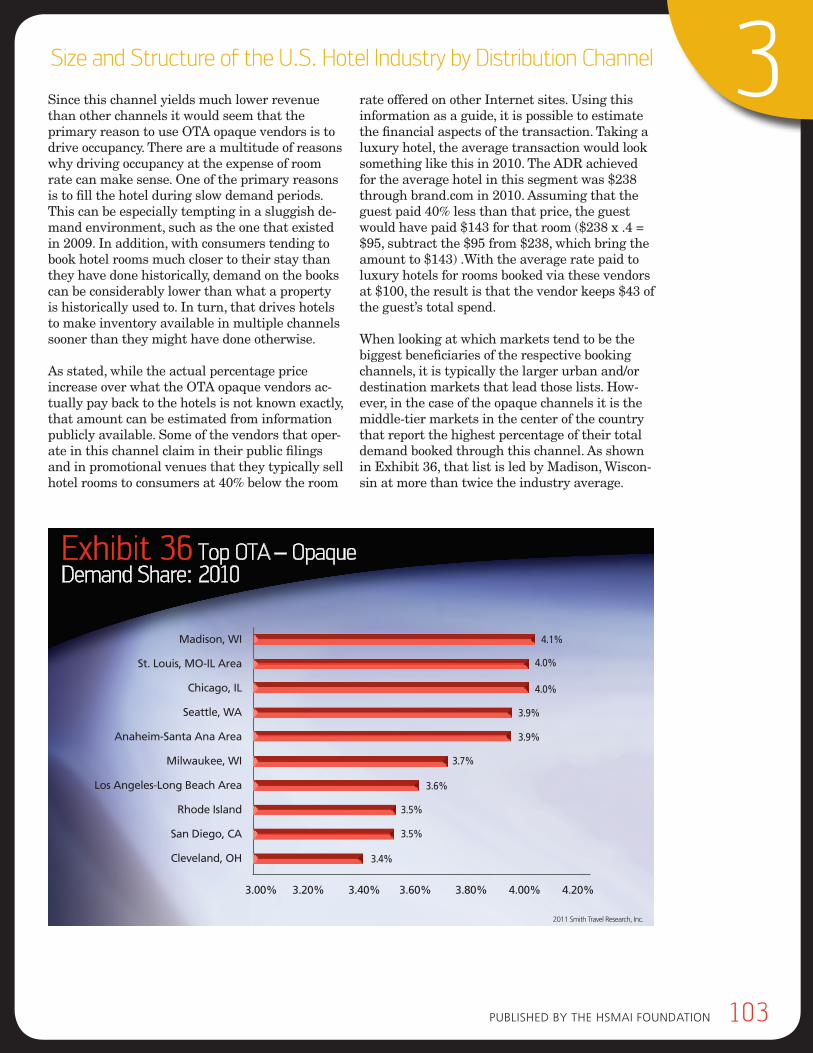
pubLiSHed by THe HSMAi FouNdATioN 103
3Size and Structure of the U.S. Hotel Industry by Distribution Channel
Since this channel yields much lower revenue than other channels it would seem that the primary reason to use OTA opaque vendors is to drive occupancy. There are a multitude of reasons why driving occupancy at the expense of room rate can make sense. One of the primary reasons is to fill the hotel during slow demand periods. This can be especially tempting in a sluggish de-mand environment, such as the one that existed in 2009. In addition, with consumers tending to book hotel rooms much closer to their stay than they have done historically, demand on the books can be considerably lower than what a property is historically used to. In turn, that drives hotels to make inventory available in multiple channels sooner than they might have done otherwise.
As stated, while the actual percentage price increase over what the OTA opaque vendors ac-tually pay back to the hotels is not known exactly, that amount can be estimated from information publicly available. Some of the vendors that oper-ate in this channel claim in their public filings and in promotional venues that they typically sell hotel rooms to consumers at 40% below the room
rate offered on other Internet sites. Using this information as a guide, it is possible to estimate the financial aspects of the transaction. Taking a luxury hotel, the average transaction would look something like this in 2010. The ADR achieved for the average hotel in this segment was $238 through brand.com in 2010. Assuming that the guest paid 40% less than that price, the guest would have paid $143 for that room ($238 x .4 = $95, subtract the $95 from $238, which bring the amount to $143) .With the average rate paid to luxury hotels for rooms booked via these vendors at $100, the result is that the vendor keeps $43 of the guest’s total spend.
When looking at which markets tend to be the biggest beneficiaries of the respective booking channels, it is typically the larger urban and/or destination markets that lead those lists. How-ever, in the case of the opaque channels it is the middle-tier markets in the center of the country that report the highest percentage of their total demand booked through this channel. As shown in Exhibit 36, that list is led by Madison, Wiscon-sin at more than twice the industry average.
2011 Smith Travel Research, Inc.
Exhibit 36 Top OTA – Opaque Demand Share: 2010
4.1%Madison, WI
St. Louis, MO-IL Area
Chicago, IL
Seattle, WA
Anaheim-Santa Ana Area
Milwaukee, WI
Los Angeles-Long Beach Area
Rhode Island
San Diego, CA
Cleveland, OH
3.00% 3.20% 3.40% 3.60% 3.80% 4.00% 4.20%
4.0%
4.0%
3.9%
3.9%
3.7%
3.6%
3.5%
3.5%
3.4%
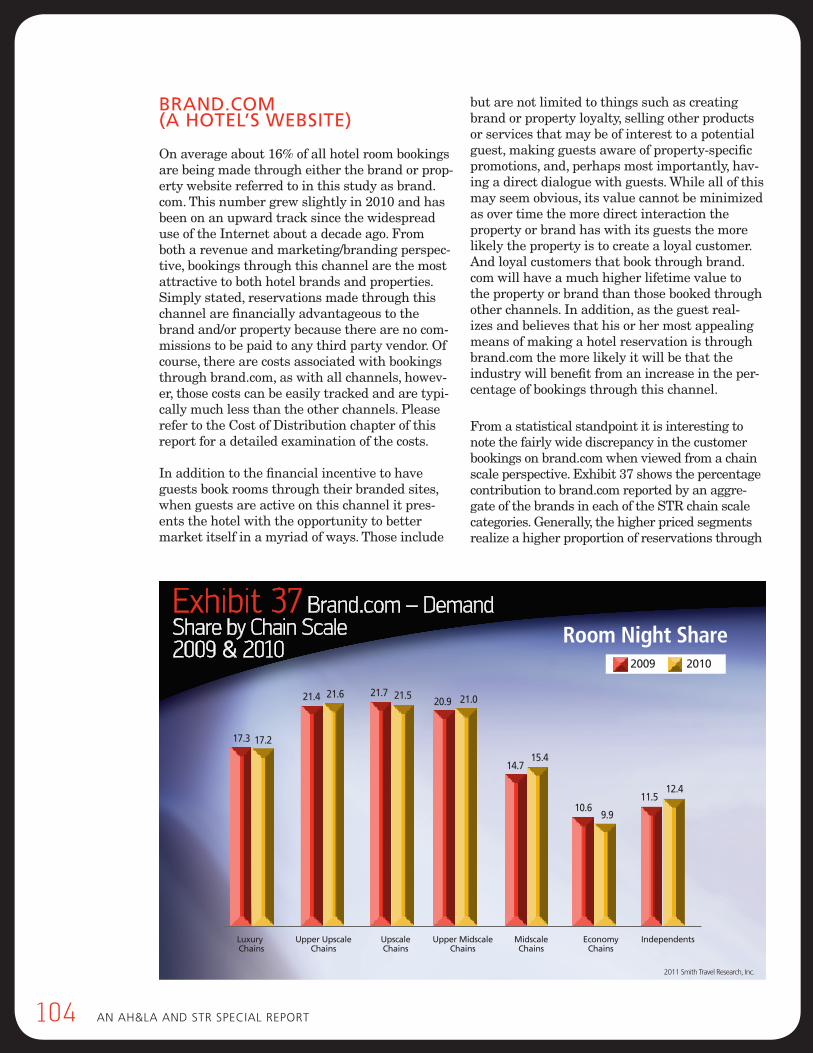
104 AN AH&LA ANd STR SpeciAL RepoRT
brAnd.com (A HoTel’S webSITe)
On average about 16% of all hotel room bookings are being made through either the brand or prop-erty website referred to in this study as brand.com. This number grew slightly in 2010 and has been on an upward track since the widespread use of the Internet about a decade ago. From both a revenue and marketing/branding perspec-tive, bookings through this channel are the most attractive to both hotel brands and properties. Simply stated, reservations made through this channel are financially advantageous to the brand and/or property because there are no com-missions to be paid to any third party vendor. Of course, there are costs associated with bookings through brand.com, as with all channels, howev-er, those costs can be easily tracked and are typi-cally much less than the other channels. Please refer to the Cost of Distribution chapter of this report for a detailed examination of the costs.
In addition to the financial incentive to have guests book rooms through their branded sites, when guests are active on this channel it pres-ents the hotel with the opportunity to better market itself in a myriad of ways. Those include
but are not limited to things such as creating brand or property loyalty, selling other products or services that may be of interest to a potential guest, making guests aware of property-specific promotions, and, perhaps most importantly, hav-ing a direct dialogue with guests. While all of this may seem obvious, its value cannot be minimized as over time the more direct interaction the property or brand has with its guests the more likely the property is to create a loyal customer. And loyal customers that book through brand.com will have a much higher lifetime value to the property or brand than those booked through other channels. In addition, as the guest real-izes and believes that his or her most appealing means of making a hotel reservation is through brand.com the more likely it will be that the industry will benefit from an increase in the per-centage of bookings through this channel.
From a statistical standpoint it is interesting to note the fairly wide discrepancy in the customer bookings on brand.com when viewed from a chain scale perspective. Exhibit 37 shows the percentage contribution to brand.com reported by an aggre-gate of the brands in each of the STR chain scale categories. Generally, the higher priced segments realize a higher proportion of reservations through
Room Night Share
2011 Smith Travel Research, Inc.
Luxury Upper Upscale Upscale Upper Midscale Midscale Economy Independents Chains Chains Chains Chains Chains Chains
Exhibit 37 Brand.com – Demand Share by Chain Scale 2009 & 2010
17.3 17.2
21.4 21.6 21.7 21.520.9 21.0
14.715.4
10.69.9
11.512.4
2009 2010
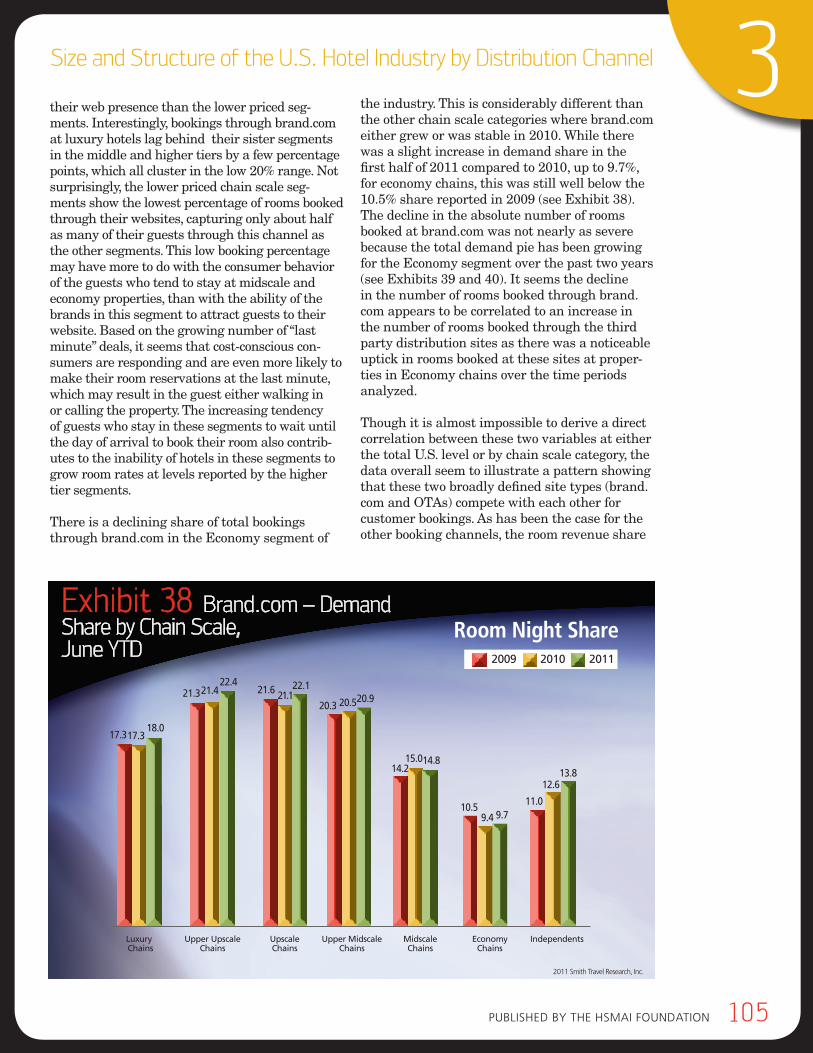
pubLiSHed by THe HSMAi FouNdATioN 105
3Size and Structure of the U.S. Hotel Industry by Distribution Channel
their web presence than the lower priced seg-ments. Interestingly, bookings through brand.com at luxury hotels lag behind their sister segments in the middle and higher tiers by a few percentage points, which all cluster in the low 20% range. Not surprisingly, the lower priced chain scale seg-ments show the lowest percentage of rooms booked through their websites, capturing only about half as many of their guests through this channel as the other segments. This low booking percentage may have more to do with the consumer behavior of the guests who tend to stay at midscale and economy properties, than with the ability of the brands in this segment to attract guests to their website. Based on the growing number of “last minute” deals, it seems that cost-conscious con-sumers are responding and are even more likely to make their room reservations at the last minute, which may result in the guest either walking in or calling the property. The increasing tendency of guests who stay in these segments to wait until the day of arrival to book their room also contrib-utes to the inability of hotels in these segments to grow room rates at levels reported by the higher tier segments.
There is a declining share of total bookings through brand.com in the Economy segment of
the industry. This is considerably different than the other chain scale categories where brand.com either grew or was stable in 2010. While there was a slight increase in demand share in the first half of 2011 compared to 2010, up to 9.7%, for economy chains, this was still well below the 10.5% share reported in 2009 (see Exhibit 38). The decline in the absolute number of rooms booked at brand.com was not nearly as severe because the total demand pie has been growing for the Economy segment over the past two years (see Exhibits 39 and 40). It seems the decline in the number of rooms booked through brand.com appears to be correlated to an increase in the number of rooms booked through the third party distribution sites as there was a noticeable uptick in rooms booked at these sites at proper-ties in Economy chains over the time periods analyzed.
Though it is almost impossible to derive a direct correlation between these two variables at either the total U.S. level or by chain scale category, the data overall seem to illustrate a pattern showing that these two broadly defined site types (brand.com and OTAs) compete with each other for customer bookings. As has been the case for the other booking channels, the room revenue share
Room Night Share
2011 Smith Travel Research, Inc.
Luxury Upper Upscale Upscale Upper Midscale Midscale Economy Independents Chains Chains Chains Chains Chains Chains
Exhibit 38 Brand.com – Demand Share by Chain Scale, June YTD
21.321.422.4
17.317.318.0
21.6 22.1
20.320.920.5
14.214.815.0
10.59.79.4
11.0
13.812.6
2009 2010 2011
21.1
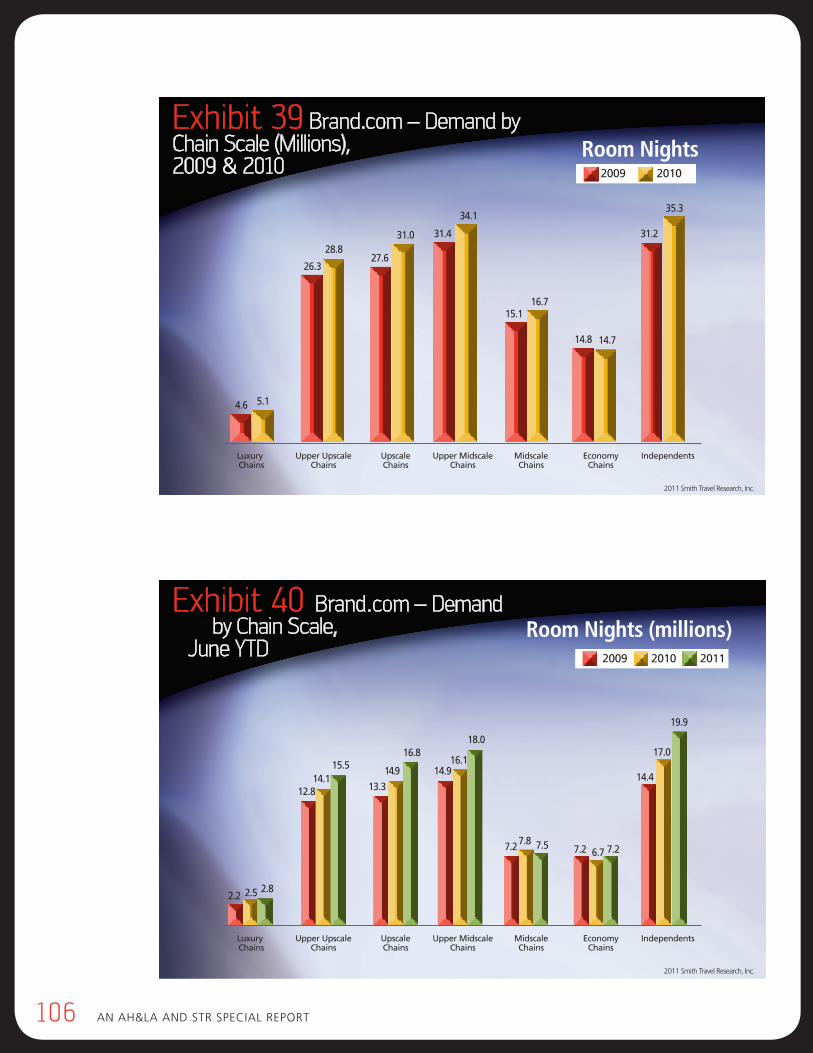
106 AN AH&LA ANd STR SpeciAL RepoRT
2011 Smith Travel Research, Inc.
Luxury Upper Upscale Upscale Upper Midscale Midscale Economy Independents Chains Chains Chains Chains Chains Chains
Exhibit 39 Brand.com – Demand by Chain Scale (Millions), 2009 & 2010 2009 2010
4.6 5.1
26.3
28.827.6
31.0 31.4
34.1
15.116.7
14.8 14.7
31.2
35.3
Room Nights
Room Nights (millions)
2011 Smith Travel Research, Inc.
Luxury Upper Upscale Upscale Upper Midscale Midscale Economy Independents Chains Chains Chains Chains Chains Chains
Exhibit 40 Brand.com – Demand by Chain Scale, June YTD
12.814.1
15.5
2.2 2.5 2.8
13.3
16.8
14.9
18.0
16.1
7.2 7.57.87.2 7.26.7
14.4
19.9
17.0
2009 2010 2011
14.9
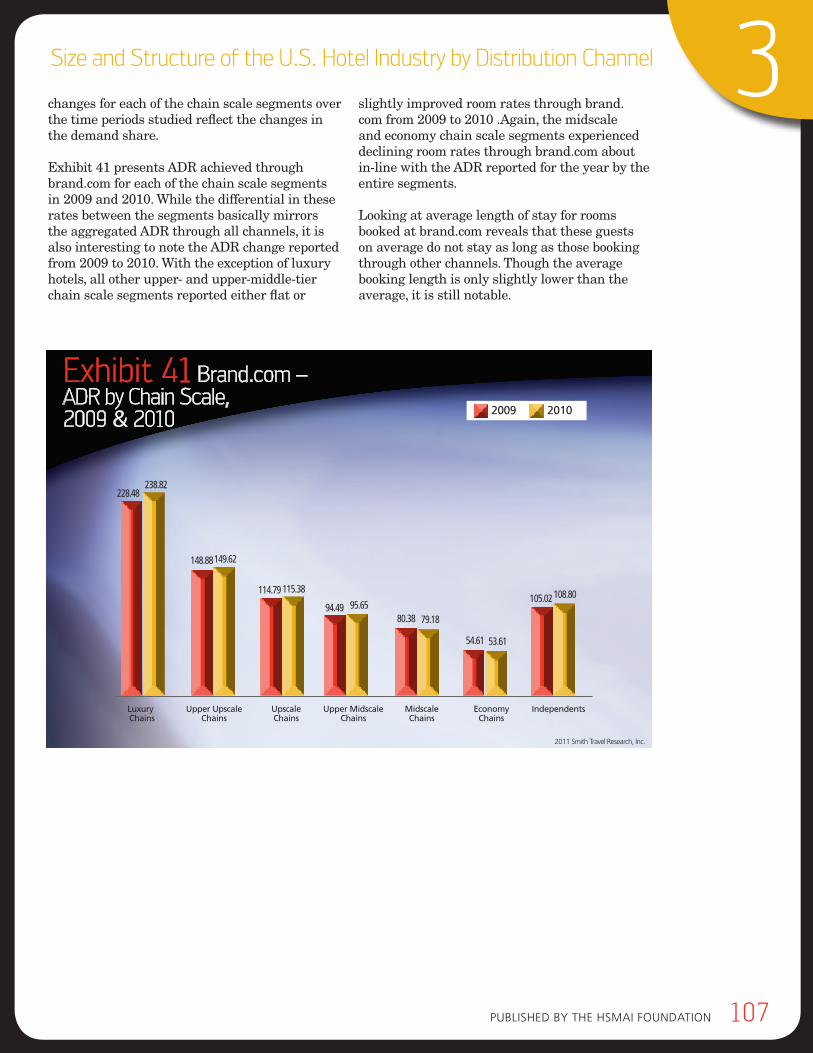
pubLiSHed by THe HSMAi FouNdATioN 107
3Size and Structure of the U.S. Hotel Industry by Distribution Channel
changes for each of the chain scale segments over the time periods studied reflect the changes in the demand share.
Exhibit 41 presents ADR achieved through brand.com for each of the chain scale segments in 2009 and 2010. While the differential in these rates between the segments basically mirrors the aggregated ADR through all channels, it is also interesting to note the ADR change reported from 2009 to 2010. With the exception of luxury hotels, all other upper- and upper-middle-tier chain scale segments reported either flat or
slightly improved room rates through brand.com from 2009 to 2010 .Again, the midscale and economy chain scale segments experienced declining room rates through brand.com about in-line with the ADR reported for the year by the entire segments.
Looking at average length of stay for rooms booked at brand.com reveals that these guests on average do not stay as long as those booking through other channels. Though the average booking length is only slightly lower than the average, it is still notable.
2011 Smith Travel Research, Inc.
Luxury Upper Upscale Upscale Upper Midscale Midscale Economy Independents Chains Chains Chains Chains Chains Chains
Exhibit 41 Brand.com – ADR by Chain Scale, 2009 & 2010 2009 2010
228.48238.82
148.88149.62
114.79 115.38
94.49 95.6580.38 79.18
54.61 53.61
105.02 108.80
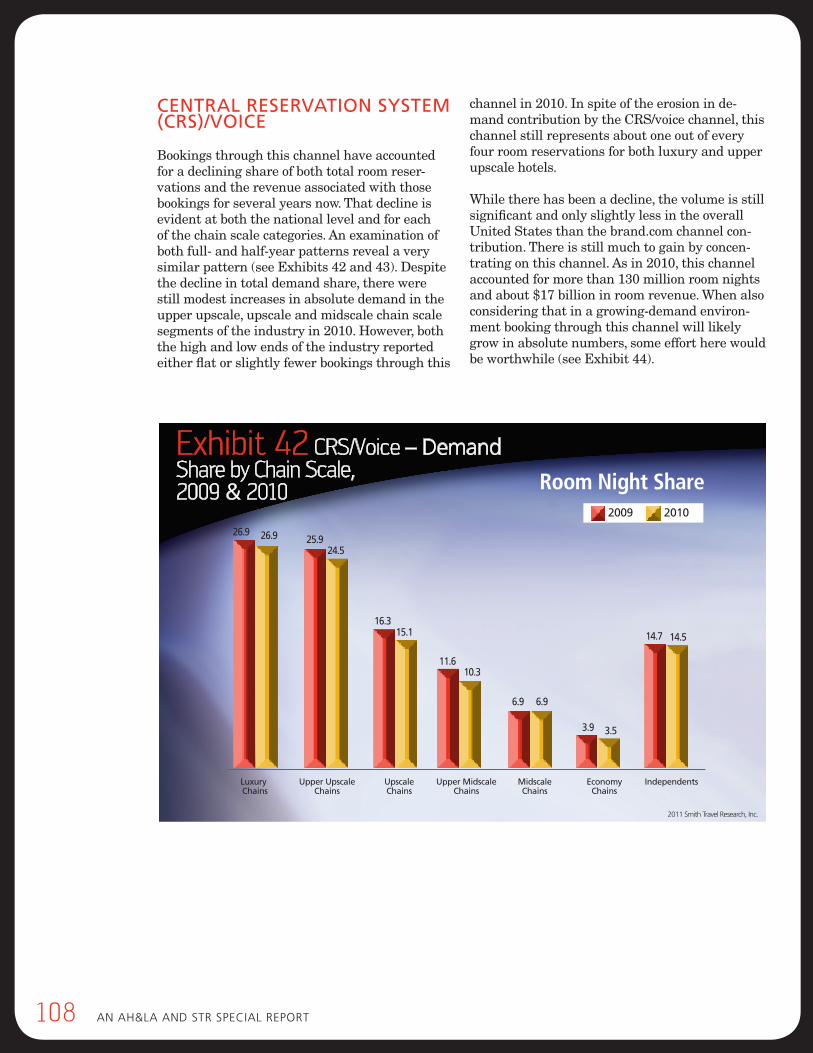
108 AN AH&LA ANd STR SpeciAL RepoRT
cenTrAl reServATIon SySTem (crS)/voIce
Bookings through this channel have accounted for a declining share of both total room reser-vations and the revenue associated with those bookings for several years now. That decline is evident at both the national level and for each of the chain scale categories. An examination of both full- and half-year patterns reveal a very similar pattern (see Exhibits 42 and 43). Despite the decline in total demand share, there were still modest increases in absolute demand in the upper upscale, upscale and midscale chain scale segments of the industry in 2010. However, both the high and low ends of the industry reported either flat or slightly fewer bookings through this
channel in 2010. In spite of the erosion in de-mand contribution by the CRS/voice channel, this channel still represents about one out of every four room reservations for both luxury and upper upscale hotels.
While there has been a decline, the volume is still significant and only slightly less in the overall United States than the brand.com channel con-tribution. There is still much to gain by concen-trating on this channel. As in 2010, this channel accounted for more than 130 million room nights and about $17 billion in room revenue. When also considering that in a growing-demand environ-ment booking through this channel will likely grow in absolute numbers, some effort here would be worthwhile (see Exhibit 44).
2011 Smith Travel Research, Inc.
Luxury Upper Upscale Upscale Upper Midscale Midscale Economy Independents Chains Chains Chains Chains Chains Chains
Exhibit 42 CRS/Voice – Demand Share by Chain Scale, 2009 & 2010
2009 2010
26.9 26.9 25.924.5
16.315.1
11.610.3
6.9 6.9
3.9 3.5
14.7 14.5
Room Night Share
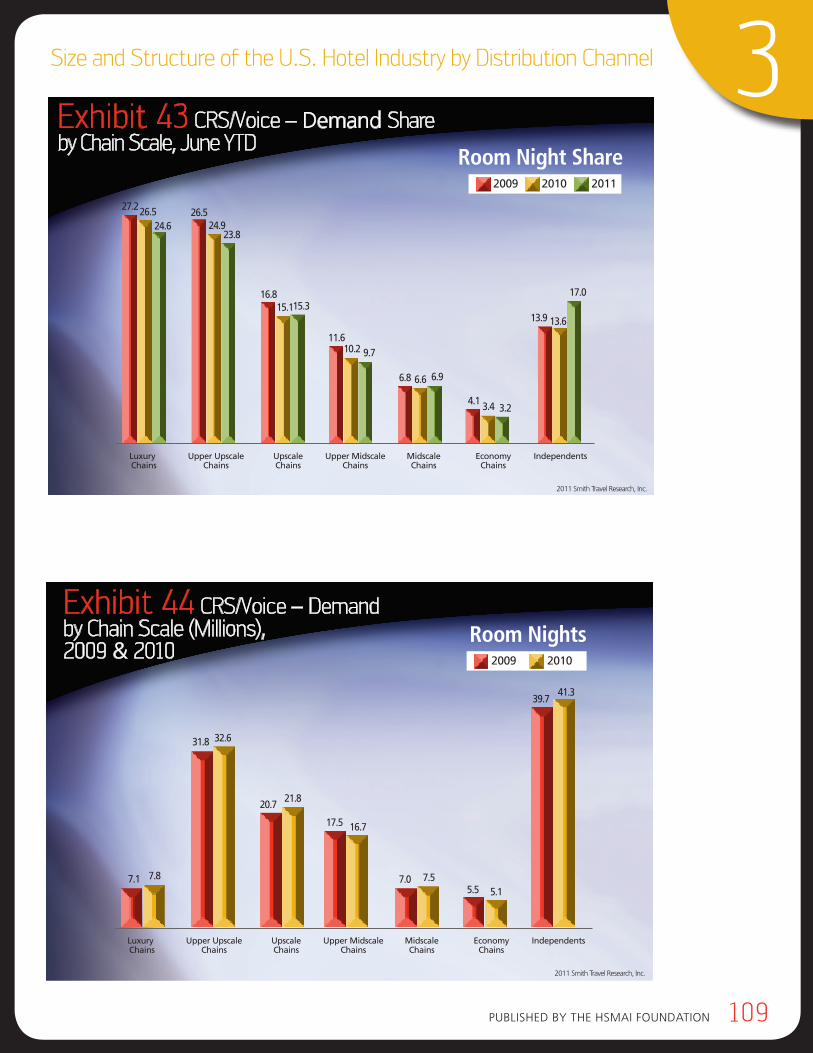
pubLiSHed by THe HSMAi FouNdATioN 109
3Size and Structure of the U.S. Hotel Industry by Distribution Channel
2011 Smith Travel Research, Inc.
Luxury Upper Upscale Upscale Upper Midscale Midscale Economy Independents Chains Chains Chains Chains Chains Chains
Exhibit 43 CRS/Voice – Demand Share by Chain Scale, June YTD
27.226.524.6
26.524.9
23.8
16.815.115.3
11.610.2 9.7
4.1
6.6 6.9
3.23.4
6.8
13.9 13.6
17.0
2009 2010 2011
Room Night Share
Room Nights
2011 Smith Travel Research, Inc.
Luxury Upper Upscale Upscale Upper Midscale Midscale Economy Independents Chains Chains Chains Chains Chains Chains
Exhibit 44 CRS/Voice – Demand by Chain Scale (Millions), 2009 & 2010 2009 2010
7.1 7.8
31.8 32.6
20.721.8
17.5 16.7
7.0 7.55.5 5.1
39.741.3
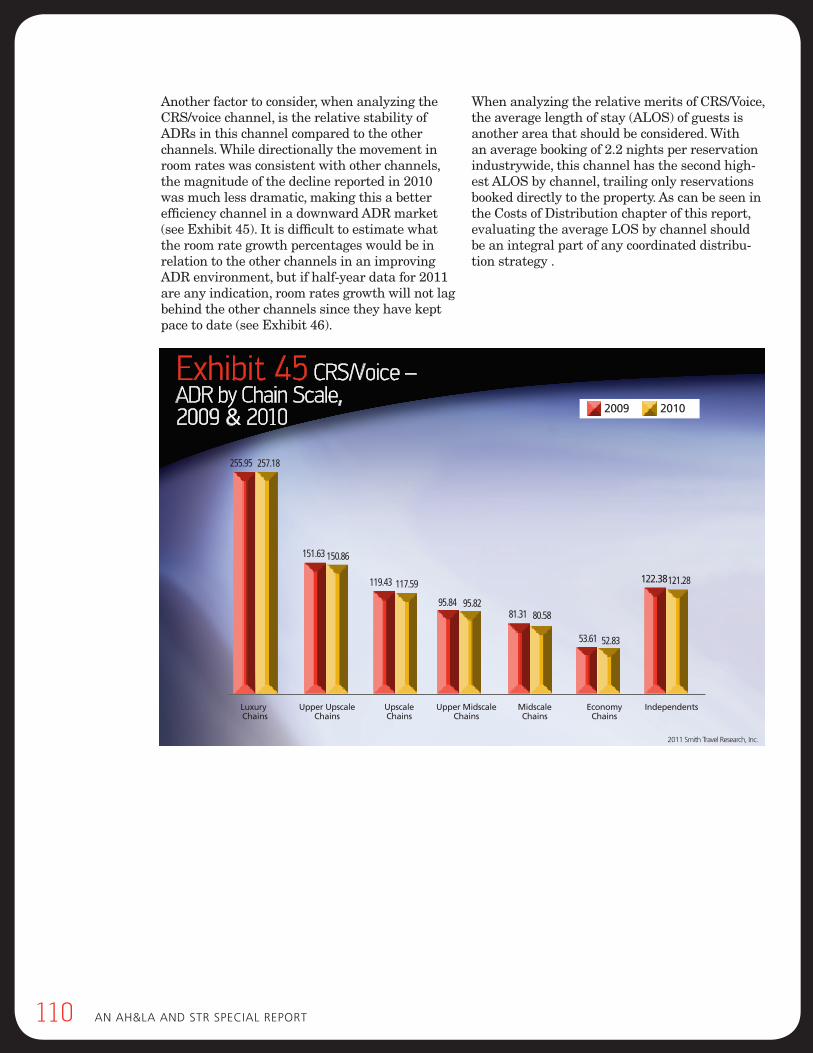
110 AN AH&LA ANd STR SpeciAL RepoRT
Another factor to consider, when analyzing the CRS/voice channel, is the relative stability of ADRs in this channel compared to the other channels. While directionally the movement in room rates was consistent with other channels, the magnitude of the decline reported in 2010 was much less dramatic, making this a better efficiency channel in a downward ADR market (see Exhibit 45). It is difficult to estimate what the room rate growth percentages would be in relation to the other channels in an improving ADR environment, but if half-year data for 2011 are any indication, room rates growth will not lag behind the other channels since they have kept pace to date (see Exhibit 46).
When analyzing the relative merits of CRS/Voice, the average length of stay (ALOS) of guests is another area that should be considered. With an average booking of 2.2 nights per reservation industrywide, this channel has the second high-est ALOS by channel, trailing only reservations booked directly to the property. As can be seen in the Costs of Distribution chapter of this report, evaluating the average LOS by channel should be an integral part of any coordinated distribu-tion strategy .
2011 Smith Travel Research, Inc.
Luxury Upper Upscale Upscale Upper Midscale Midscale Economy Independents Chains Chains Chains Chains Chains Chains
Exhibit 45 CRS/Voice – ADR by Chain Scale, 2009 & 2010 2009 2010
255.95 257.18
151.63 150.86
119.43 117.59
95.84 95.8281.31 80.58
53.61 52.83
122.38121.28
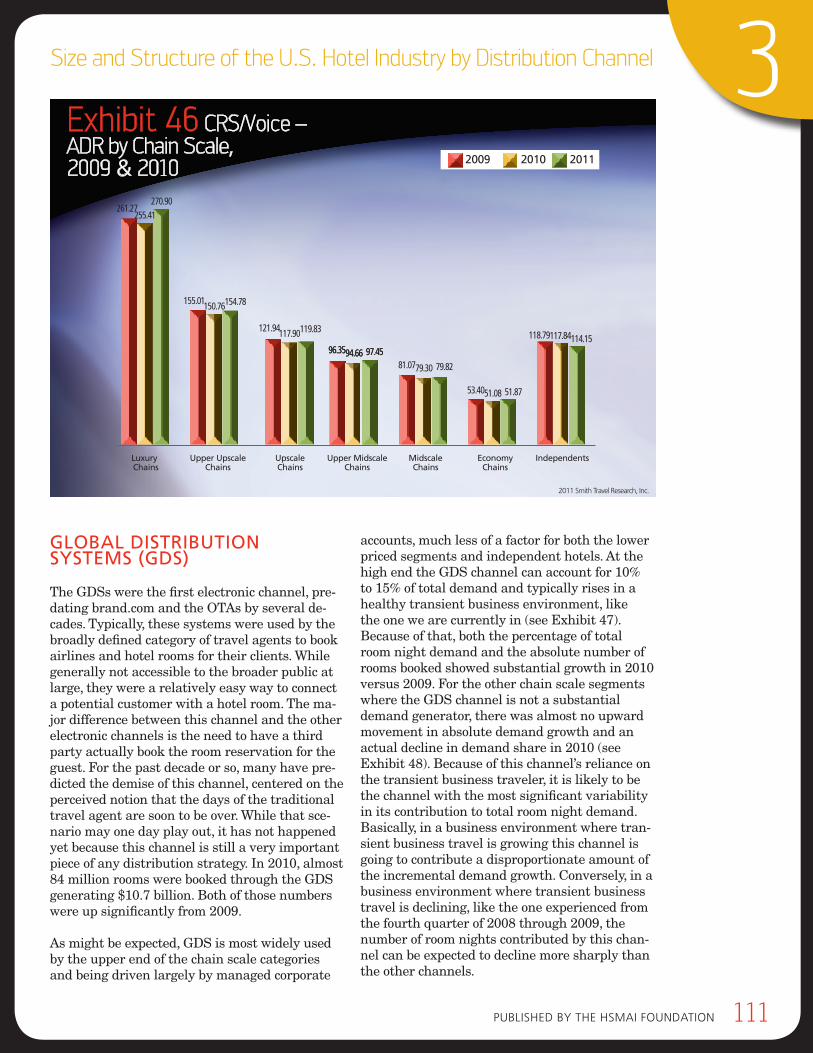
pubLiSHed by THe HSMAi FouNdATioN 111
3Size and Structure of the U.S. Hotel Industry by Distribution Channel
2011 Smith Travel Research, Inc.
Luxury Upper Upscale Upscale Upper Midscale Midscale Economy Independents Chains Chains Chains Chains Chains Chains
Exhibit 46 CRS/Voice – ADR by Chain Scale, 2009 & 2010
261.27270.90
255.41
155.01 154.78150.76
121.94 119.83117.90
96.35 97.4594.6696.35 97.4594.6681.07 79.8279.30
53.40 51.8751.08
118.79 114.15117.84
2009 2010 2011
globAl dISTrIbUTIon SySTemS (gdS)
The GDSs were the first electronic channel, pre-dating brand.com and the OTAs by several de-cades. Typically, these systems were used by the broadly defined category of travel agents to book airlines and hotel rooms for their clients. While generally not accessible to the broader public at large, they were a relatively easy way to connect a potential customer with a hotel room. The ma-jor difference between this channel and the other electronic channels is the need to have a third party actually book the room reservation for the guest. For the past decade or so, many have pre-dicted the demise of this channel, centered on the perceived notion that the days of the traditional travel agent are soon to be over. While that sce-nario may one day play out, it has not happened yet because this channel is still a very important piece of any distribution strategy. In 2010, almost 84 million rooms were booked through the GDS generating $10.7 billion. Both of those numbers were up significantly from 2009.
As might be expected, GDS is most widely used by the upper end of the chain scale categories and being driven largely by managed corporate
accounts, much less of a factor for both the lower priced segments and independent hotels. At the high end the GDS channel can account for 10% to 15% of total demand and typically rises in a healthy transient business environment, like the one we are currently in (see Exhibit 47). Because of that, both the percentage of total room night demand and the absolute number of rooms booked showed substantial growth in 2010 versus 2009. For the other chain scale segments where the GDS channel is not a substantial demand generator, there was almost no upward movement in absolute demand growth and an actual decline in demand share in 2010 (see Exhibit 48). Because of this channel’s reliance on the transient business traveler, it is likely to be the channel with the most significant variability in its contribution to total room night demand. Basically, in a business environment where tran-sient business travel is growing this channel is going to contribute a disproportionate amount of the incremental demand growth. Conversely, in a business environment where transient business travel is declining, like the one experienced from the fourth quarter of 2008 through 2009, the number of room nights contributed by this chan-nel can be expected to decline more sharply than the other channels.
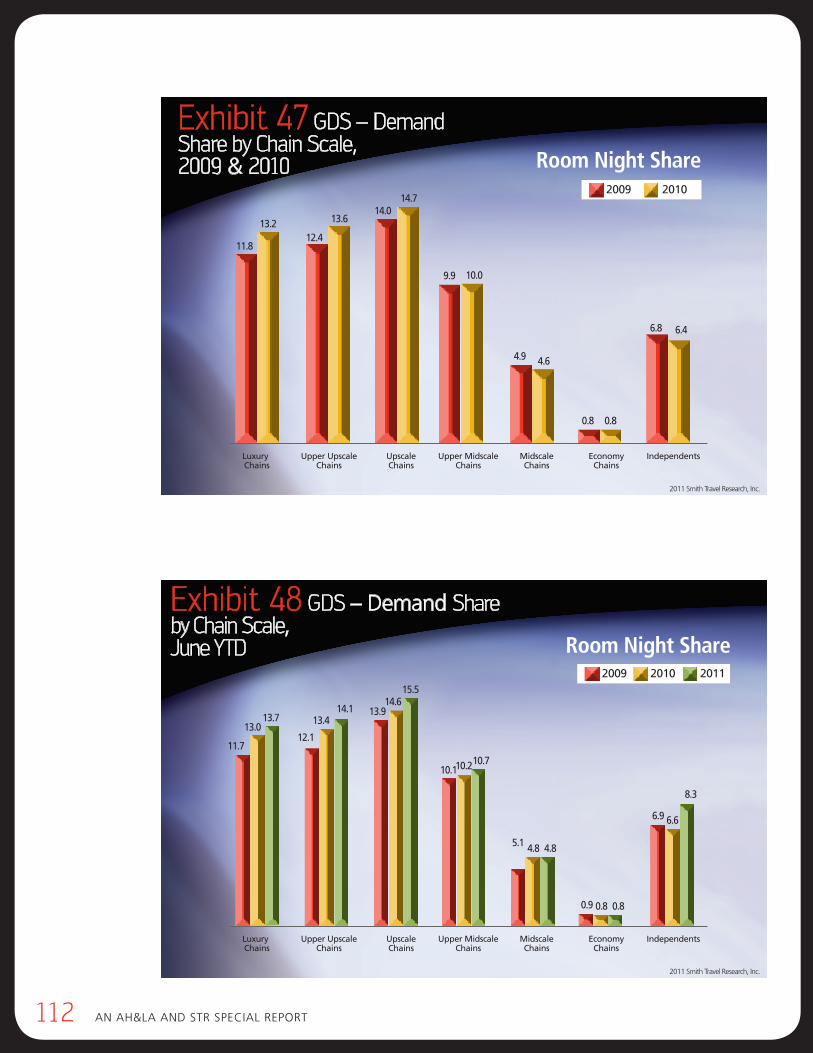
112 AN AH&LA ANd STR SpeciAL RepoRT
2011 Smith Travel Research, Inc.
Luxury Upper Upscale Upscale Upper Midscale Midscale Economy Independents Chains Chains Chains Chains Chains Chains
Exhibit 47 GDS – Demand Share by Chain Scale, 2009 & 2010
2009 2010
11.8
13.212.4
13.614.0
14.7
9.9 10.0
4.9 4.6
0.8 0.8
6.8 6.4
Room Night Share
2011 Smith Travel Research, Inc.
Luxury Upper Upscale Upscale Upper Midscale Midscale Economy Independents Chains Chains Chains Chains Chains Chains
Exhibit 48 GDS – Demand Share by Chain Scale, June YTD
2009 2010 2011
11.7
13.013.7
12.1
13.414.1 13.9
14.615.5
10.110.210.7
0.9
4.8 4.8
0.80.8
5.1
6.9 6.6
8.3
Room Night Share
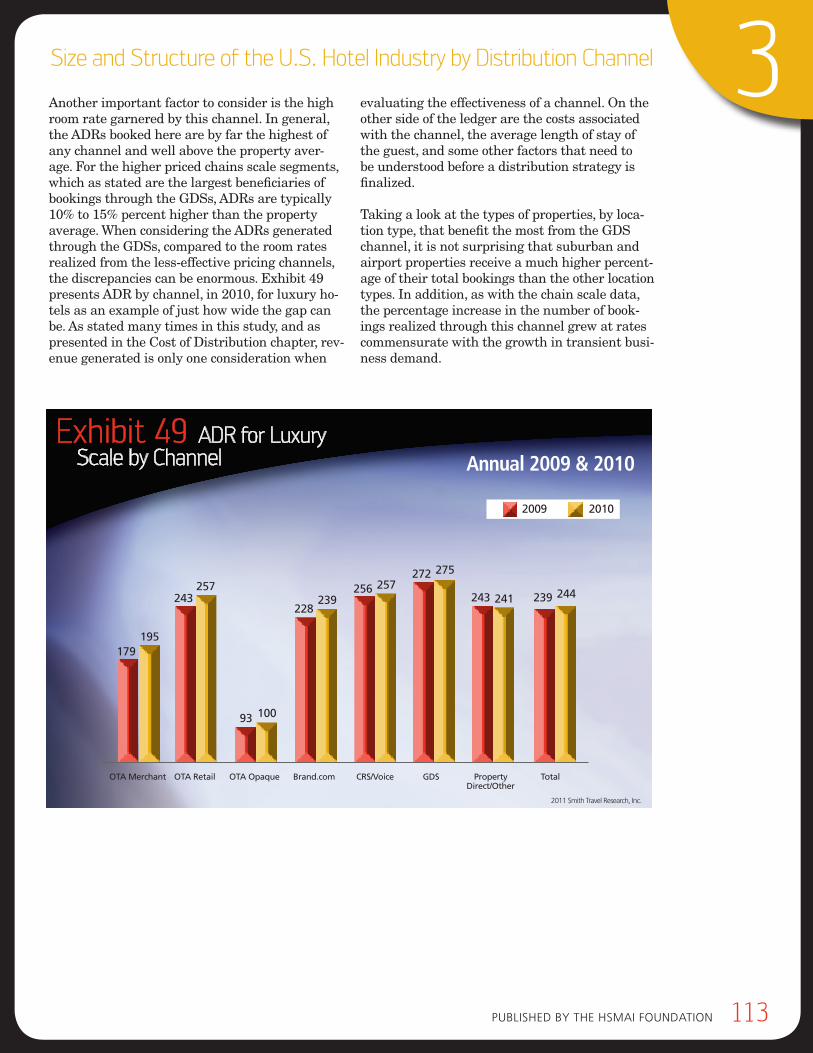
pubLiSHed by THe HSMAi FouNdATioN 113
3Size and Structure of the U.S. Hotel Industry by Distribution Channel
Another important factor to consider is the high room rate garnered by this channel. In general, the ADRs booked here are by far the highest of any channel and well above the property aver-age. For the higher priced chains scale segments, which as stated are the largest beneficiaries of bookings through the GDSs, ADRs are typically 10% to 15% percent higher than the property average. When considering the ADRs generated through the GDSs, compared to the room rates realized from the less-effective pricing channels, the discrepancies can be enormous. Exhibit 49 presents ADR by channel, in 2010, for luxury ho-tels as an example of just how wide the gap can be. As stated many times in this study, and as presented in the Cost of Distribution chapter, rev-enue generated is only one consideration when
evaluating the effectiveness of a channel. On the other side of the ledger are the costs associated with the channel, the average length of stay of the guest, and some other factors that need to be understood before a distribution strategy is finalized.
Taking a look at the types of properties, by loca-tion type, that benefit the most from the GDS channel, it is not surprising that suburban and airport properties receive a much higher percent-age of their total bookings than the other location types. In addition, as with the chain scale data, the percentage increase in the number of book-ings realized through this channel grew at rates commensurate with the growth in transient busi-ness demand.
2011 Smith Travel Research, Inc.
OTA Merchant OTA Retail OTA Opaque Brand.com CRS/Voice GDS Property Total Direct/Other
2009 2010
179195
Annual 2009 & 2010Exhibit 49 ADR for Luxury Scale by Channel
243257
93 100
228239
256 257272 275
243 241 239 244
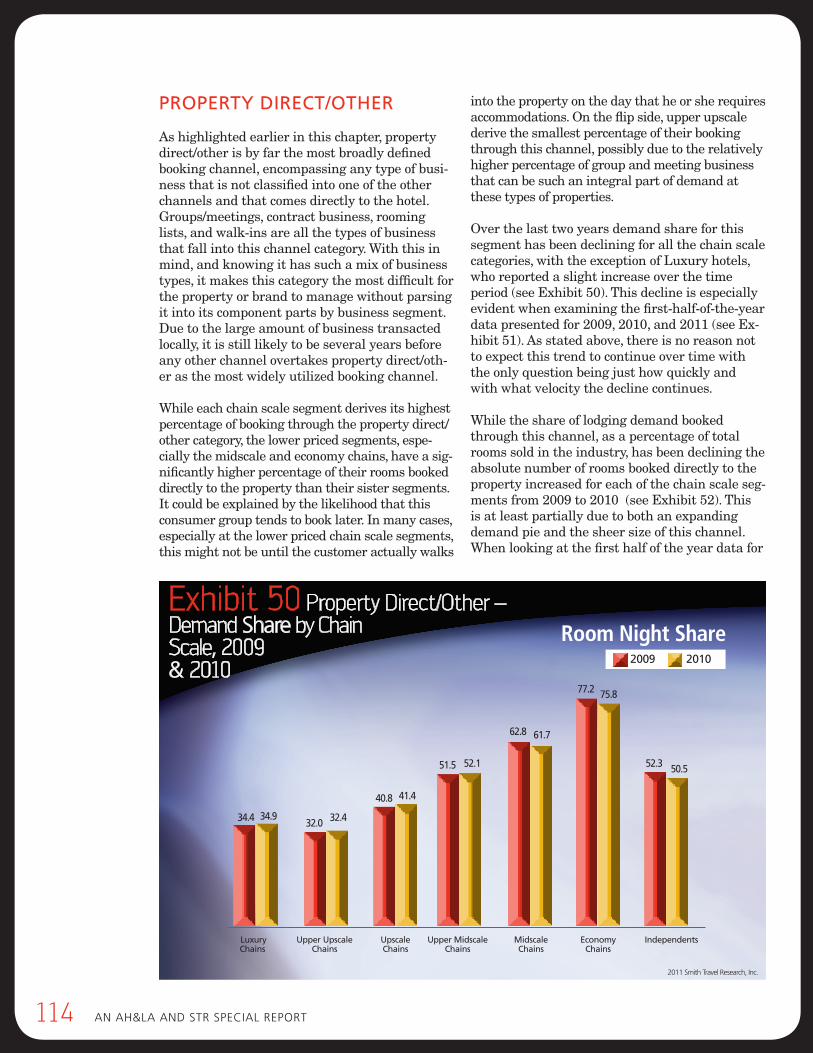
114 AN AH&LA ANd STR SpeciAL RepoRT
properTy dIrecT/oTHer
As highlighted earlier in this chapter, property direct/other is by far the most broadly defined booking channel, encompassing any type of busi-ness that is not classified into one of the other channels and that comes directly to the hotel. Groups/meetings, contract business, rooming lists, and walk-ins are all the types of business that fall into this channel category. With this in mind, and knowing it has such a mix of business types, it makes this category the most difficult for the property or brand to manage without parsing it into its component parts by business segment. Due to the large amount of business transacted locally, it is still likely to be several years before any other channel overtakes property direct/oth-er as the most widely utilized booking channel.
While each chain scale segment derives its highest percentage of booking through the property direct/other category, the lower priced segments, espe-cially the midscale and economy chains, have a sig-nificantly higher percentage of their rooms booked directly to the property than their sister segments. It could be explained by the likelihood that this consumer group tends to book later. In many cases, especially at the lower priced chain scale segments, this might not be until the customer actually walks
into the property on the day that he or she requires accommodations. On the flip side, upper upscale derive the smallest percentage of their booking through this channel, possibly due to the relatively higher percentage of group and meeting business that can be such an integral part of demand at these types of properties.
Over the last two years demand share for this segment has been declining for all the chain scale categories, with the exception of Luxury hotels, who reported a slight increase over the time period (see Exhibit 50). This decline is especially evident when examining the first-half-of-the-year data presented for 2009, 2010, and 2011 (see Ex-hibit 51). As stated above, there is no reason not to expect this trend to continue over time with the only question being just how quickly and with what velocity the decline continues.
While the share of lodging demand booked through this channel, as a percentage of total rooms sold in the industry, has been declining the absolute number of rooms booked directly to the property increased for each of the chain scale seg-ments from 2009 to 2010 (see Exhibit 52). This is at least partially due to both an expanding demand pie and the sheer size of this channel. When looking at the first half of the year data for
2011 Smith Travel Research, Inc.
Luxury Upper Upscale Upscale Upper Midscale Midscale Economy Independents Chains Chains Chains Chains Chains Chains
Exhibit 50 Property Direct/Other – Demand Share by Chain Scale, 2009 & 2010
2009 2010
34.4 34.932.0 32.4
40.8 41.4
51.5 52.1
62.8 61.7
77.2 75.8
52.3 50.5
Room Night Share
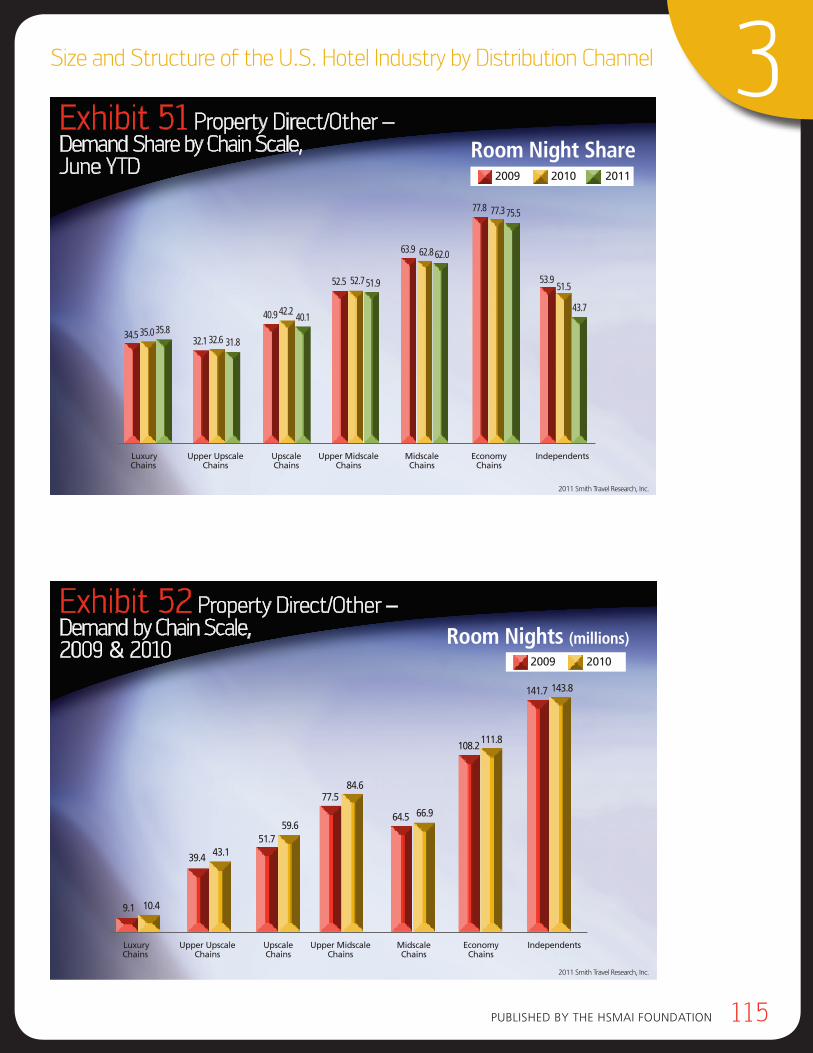
pubLiSHed by THe HSMAi FouNdATioN 115
3Size and Structure of the U.S. Hotel Industry by Distribution Channel
2011 Smith Travel Research, Inc.
Luxury Upper Upscale Upscale Upper Midscale Midscale Economy Independents Chains Chains Chains Chains Chains Chains
Exhibit 51 Property Direct/Other – Demand Share by Chain Scale, June YTD 2009 2010 2011
34.5 35.035.832.1 32.6 31.8
40.9 42.2 40.1
52.5 52.751.9
63.9 62.862.0
77.8 77.375.5
53.951.5
43.7
Room Night Share
2011 Smith Travel Research, Inc.
Luxury Upper Upscale Upscale Upper Midscale Midscale Economy Independents Chains Chains Chains Chains Chains Chains
Exhibit 52 Property Direct/Other – Demand by Chain Scale, 2009 & 2010
2009 2010
9.1 10.4
39.4 43.151.7
59.6
77.584.6
64.5 66.9
108.2111.8
141.7 143.8
Room Nights (millions)
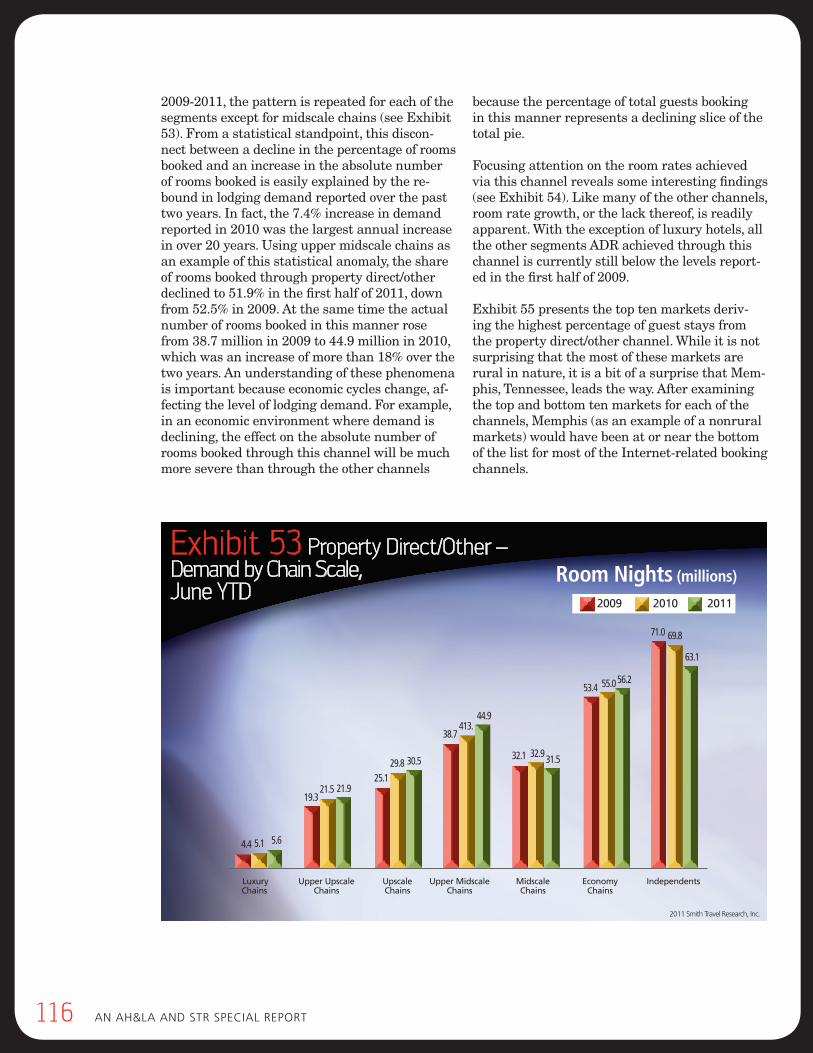
116 AN AH&LA ANd STR SpeciAL RepoRT
2009-2011, the pattern is repeated for each of the segments except for midscale chains (see Exhibit 53). From a statistical standpoint, this discon-nect between a decline in the percentage of rooms booked and an increase in the absolute number of rooms booked is easily explained by the re-bound in lodging demand reported over the past two years. In fact, the 7.4% increase in demand reported in 2010 was the largest annual increase in over 20 years. Using upper midscale chains as an example of this statistical anomaly, the share of rooms booked through property direct/other declined to 51.9% in the first half of 2011, down from 52.5% in 2009. At the same time the actual number of rooms booked in this manner rose from 38.7 million in 2009 to 44.9 million in 2010, which was an increase of more than 18% over the two years. An understanding of these phenomena is important because economic cycles change, af-fecting the level of lodging demand. For example, in an economic environment where demand is declining, the effect on the absolute number of rooms booked through this channel will be much more severe than through the other channels
because the percentage of total guests booking in this manner represents a declining slice of the total pie.
Focusing attention on the room rates achieved via this channel reveals some interesting findings (see Exhibit 54). Like many of the other channels, room rate growth, or the lack thereof, is readily apparent. With the exception of luxury hotels, all the other segments ADR achieved through this channel is currently still below the levels report-ed in the first half of 2009.
Exhibit 55 presents the top ten markets deriv-ing the highest percentage of guest stays from the property direct/other channel. While it is not surprising that the most of these markets are rural in nature, it is a bit of a surprise that Mem-phis, Tennessee, leads the way. After examining the top and bottom ten markets for each of the channels, Memphis (as an example of a nonrural markets) would have been at or near the bottom of the list for most of the Internet-related booking channels.
2011 Smith Travel Research, Inc.
Luxury Upper Upscale Upscale Upper Midscale Midscale Economy Independents Chains Chains Chains Chains Chains Chains
Exhibit 53 Property Direct/Other – Demand by Chain Scale, June YTD
4.4 5.1 5.6
19.321.5 21.9
25.129.8 30.5
38.7413.
44.9
32.1 32.931.5
53.4 55.056.2
71.0 69.8
63.1
2009 2010 2011
Room Nights (millions)
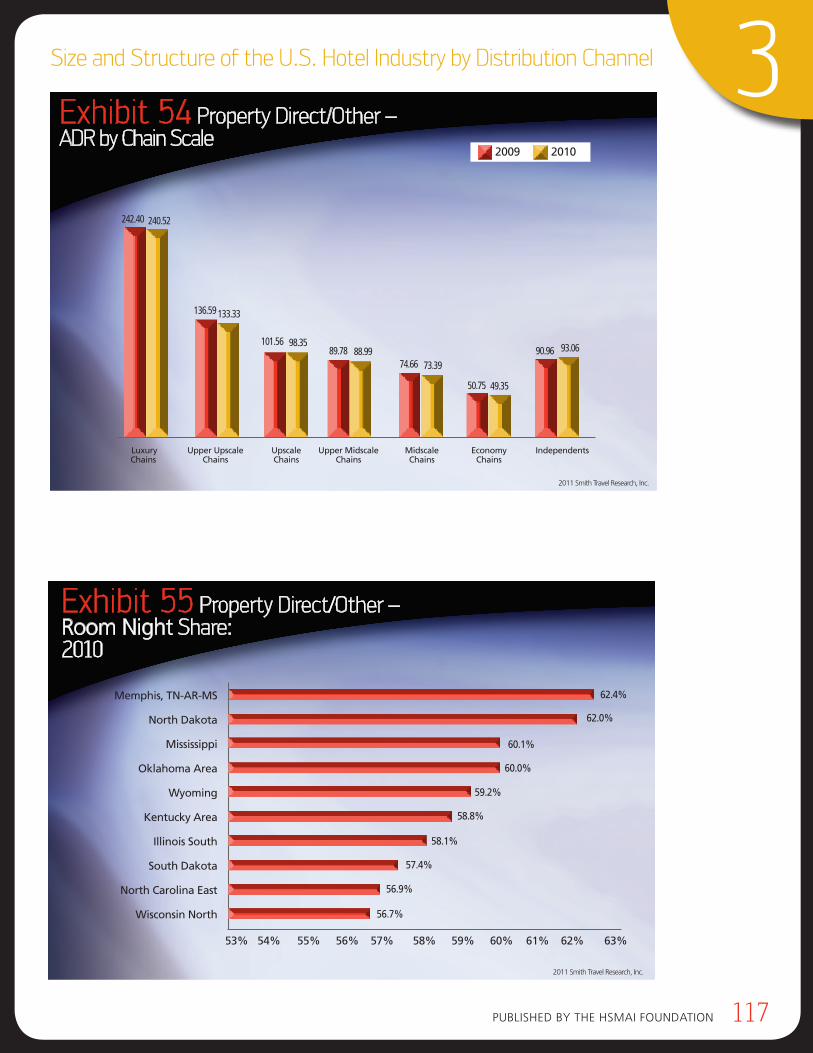
pubLiSHed by THe HSMAi FouNdATioN 117
3Size and Structure of the U.S. Hotel Industry by Distribution Channel
2011 Smith Travel Research, Inc.
Luxury Upper Upscale Upscale Upper Midscale Midscale Economy Independents Chains Chains Chains Chains Chains Chains
Exhibit 54 Property Direct/Other – ADR by Chain Scale
2009 2010
242.40 240.52
136.59 133.33
101.56 98.3589.78 88.99
74.66 73.39
50.75 49.35
90.96 93.06
2011 Smith Travel Research, Inc.
Exhibit 55 Property Direct/Other – Room Night Share: 2010
62.4%Memphis, TN-AR-MS
North Dakota
Mississippi
Oklahoma Area
Wyoming
Kentucky Area
Illinois South
South Dakota
North Carolina East
Wisconsin North
53% 54% 55% 56% 57% 58% 59% 60% 61% 62% 63%
62.0%
60.1%
60.0%
59.2%
58.8%
58.1%
57.4%
56.9%
56.7%
118 AN AH&LA ANd STR SpeciAL RepoRT
conclUSIon
In this chapter the results of the booking channel data were summarized for the purpose of this study. While much has been presented, there is still a wealth of ad-ditional information and analysis that can be exam-ined in the future. Some of those areas are:
4 Analysis by location type
4 detailed results by market and market tract
4 Monthly trending information and results
4 Results by oTA vendor
Examination of channel level data can provide tools to the lodging industry to help characterize trends as new channels emerge and mature ones plateau, and to indicate what different types of hotels are using to grow and manage their market share in an ever-changing and evolving distribution landscape.
pubLiSHed by THe HSMAi FouNdATioN 119
Industry PersPectIVe
How long have you been in the hotel industry? How long have you been involved with distribution issues?
20 years in hospitality.
In what way does your current role involve distribution?
Responsible for all sales, marketing and revenue management for our 337 hotels insuring implementation of iHR’s sales fundamentals and achievement of iHR’s revenue management metrics.
Where would you say distribution fits into the overall hotel management landscape? Why does distribution matter?
Today’s unlimited consumer access for comparative shopping, added value merchandising and customer reviews puts distribution first in the guest purchase decision process.
What are the top 3 current issues that will have the greatest impact on hotel distribution in the next two — three years?
Robust mobile applications.
customer data mining for personalized transactions and guest experience.
Lower distribution costs by increasing bookings through direct to guest channel.
What is the smartest move you have seen in hotel distribution (by someone other than your own organization)?
Third party internet retailers capturing the online retail channel while dictating their own wholesale mer-chant model compensation terms producing huge profits for them with minimal capital investment.
What is the smartest move your organization has made related to hotel distribution?
Recruiting the best talent in revenue management and structuring our hotel management teams to include dedicated regional revenue management directors.
What is the single biggest oversight or misstep you have witnessed (in your own organization or others in hospitality) in the last two years?
unlike the airlines, the hotel brands did not set the terms of the online retail distribution channel to the big merchant model Tpi’s.
What three things can you tell a hotel general manager, owner or asset manager about distribution that would have the greatest impact on unit level profit?
What is the next thing that you predict will disappear or gradually fade away that is currently a part of the distribution scene?
exclusivity of GdS channel for travel management companies.
If you had a crystal ball, what emerging technolo-gies do you anticipate could be game changers, or at least have the greatest affect on the distribution landscape in the next 2-3 years?
Mobile applications, cloud computing, alternative energy sources to lower travel costs and property operating expenses.
George BrennaninterState hotelS anD reSortS
executive Vice President, Sales and Marketing
Greatest incremental opportunity is leading rates higher in your set on potential sold out days when you do not have to create demand.
continuously invest in quality digital photos, update web presence and drive business direct to your site.
Hire the right sales leaders to insure prospecting for new business occurs constantly.
>>
>>
>>
>>
>>
>>
>>
>>
>>
123
120 AN AH&LA ANd STR SpeciAL RepoRT
How long have you been in hotel industry? How long have you been involved with distribution issues?
For the past 10 years i have been a faculty member teaching courses and writing about distribution, pric-ing, yield management and economics. Through my work experience at Hertz and consulting, i have been involved in distribution for over 30 years.
In what way does your current role involve distribution?
i teach; do research on; and consult on the topic daily.
Where would you say distribution fits into the overall hotel management landscape? Why does distribution matter?
distribution is a part of demand management. The latter involves distribution, marketing, sales, and pricing. At the property level this activity can be managed by an individual or a team. For chains it is parsed out to differ-ent staff elements at the regional, brand and chain levels. even ownership organizations are involved. distribution as part of demand management connects the customer directly and indirectly to the hotel and the chain for service value communication, delivery and appraisal.
What are the top 3 current issues that will have the greatest impact on hotel distribution in the next two — three years?
expanding influence of Google as a company in social search and mobile marketing.
Role of mobile as means to market and deliver service
complexity of managing distribution both cost effec-tively (optimum Roi) and in concert with other demand management activities.
What is the smartest move you have seen in hotel distribution?
…those moves being made by managers who are stay-ing informed about developments in distribution and not moving too quickly to chase a particular develop-ment until its value is better understood: dabble for understanding; commit for a measurable certainty of financial return!
What is the single biggest oversight or misstep you have witnessed in the last two years?
Hoteliers are taking a far too emotional approach to the evaluation of oTAs as a marketing and distribution tool. The thousands of hoteliers that used oTAs over the past 2 years as a means to shift or protect share likely did so for very sound reasons. The really smart ones will figure
out how to use them going forward in a long-term, high-risk, slow-growth world economy.
What three things can you tell a hotel general man-ager, owner or asset manager about distribution that would have the greatest impact on unit level profit?
What is the next thing that you predict will disappear or gradually fade away that is currently a part of the distribution scene?
criticism of the oTAs will give way to better marketing and better understanding by hoteliers. in part, oTAs made sizeable profits because they delivered what hoteliers could not. better marketing and demand management by hotels and better options than oTAs for hotels will produce sizeable profits for option pro-viders and more opportunities for hotels.
If you had a crystal ball, what emerging technologies do you anticipate could be game changers, or at least have the greatest affect on the distribution landscape in the next 2–3 years?
First, i do have a crystal ball. unfortunately, it’s formed from ithaca ice and melts each year.
There are two game changers: one the supplier and one for the customer. For suppliers the evolution of cloud computing that supports hotel systems and applications for service delivery and management will change the role of chains and raise the level property level competency. business intelligence dashboards will drive distribu-tion action through more and more hotel systems. For customers, devices connecting them to hotel services and selected groups of others will be more fully integrated with one another and the supplier for marketing and service delivery. displays on all screens — table-top, hand-held and dash board will be fully integrated and linked with those of the others to whom you want to link.
Bill Carroll, Ph DCornell SChool oF hotel aDMiniStration
Senior lecturer
Industry PersPectIVe
dabble; don’t commit too soon.
Measure, measure and measure again the effects of distribution actions for yourself and with respect to you position among your competitors.
evaluate and act on distribution within the context of demand management.
>>
>>
>>
>>
>>
>>
>>
>>
123
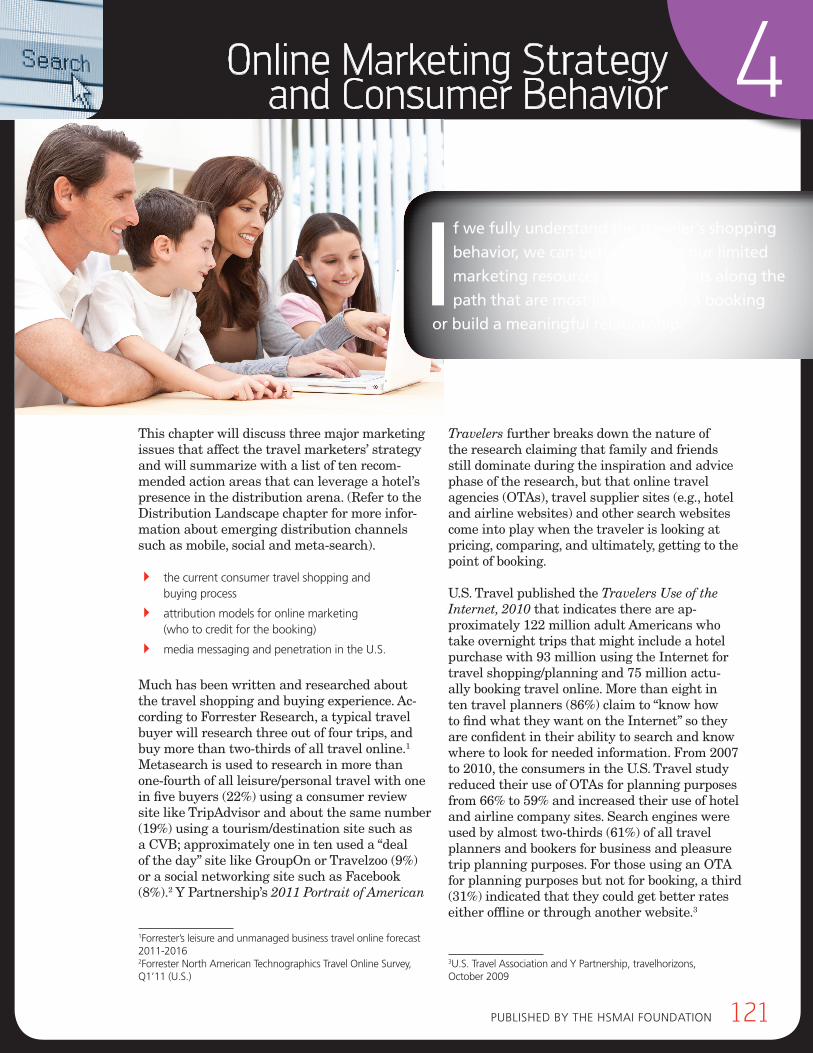
Published by the hsMAi FoundAtion 121
4Online Marketing Strategy and Consumer Behavior
This chapter will discuss three major marketing issues that affect the travel marketers’ strategy and will summarize with a list of ten recom-mended action areas that can leverage a hotel’s presence in the distribution arena. (Refer to the Distribution Landscape chapter for more infor-mation about emerging distribution channels such as mobile, social and meta-search).
4 the current consumer travel shopping and buying process
4 attribution models for online marketing (who to credit for the booking)
4 media messaging and penetration in the u.s.
Much has been written and researched about the travel shopping and buying experience. Ac-cording to Forrester Research, a typical travel buyer will research three out of four trips, and buy more than two-thirds of all travel online.1 Metasearch is used to research in more than one-fourth of all leisure/personal travel with one in five buyers (22%) using a consumer review site like TripAdvisor and about the same number (19%) using a tourism/destination site such as a CVB; approximately one in ten used a “deal of the day” site like GroupOn or Travelzoo (9%) or a social networking site such as Facebook (8%).2 Y Partnership’s 2011 Portrait of American
1Forrester’s leisure and unmanaged business travel online forecast 2011-20162Forrester north American technographics travel online survey, Q1’11 (u.s.)
Travelers further breaks down the nature of the research claiming that family and friends still dominate during the inspiration and advice phase of the research, but that online travel agencies (OTAs), travel supplier sites (e.g., hotel and airline websites) and other search websites come into play when the traveler is looking at pricing, comparing, and ultimately, getting to the point of booking.
U.S. Travel published the Travelers Use of the Internet, 2010 that indicates there are ap-proximately 122 million adult Americans who take overnight trips that might include a hotel purchase with 93 million using the Internet for travel shopping/planning and 75 million actu-ally booking travel online. More than eight in ten travel planners (86%) claim to “know how to find what they want on the Internet” so they are confident in their ability to search and know where to look for needed information. From 2007 to 2010, the consumers in the U.S. Travel study reduced their use of OTAs for planning purposes from 66% to 59% and increased their use of hotel and airline company sites. Search engines were used by almost two-thirds (61%) of all travel planners and bookers for business and pleasure trip planning purposes. For those using an OTA for planning purposes but not for booking, a third (31%) indicated that they could get better rates either offline or through another website.3
3u.s. travel Association and y Partnership, travelhorizons, october 2009
If we fully understand the traveler’s shopping
behavior, we can better allocate our limited
marketing resources to those points along the
path that are most likely to yield a booking
or build a meaningful relationship.
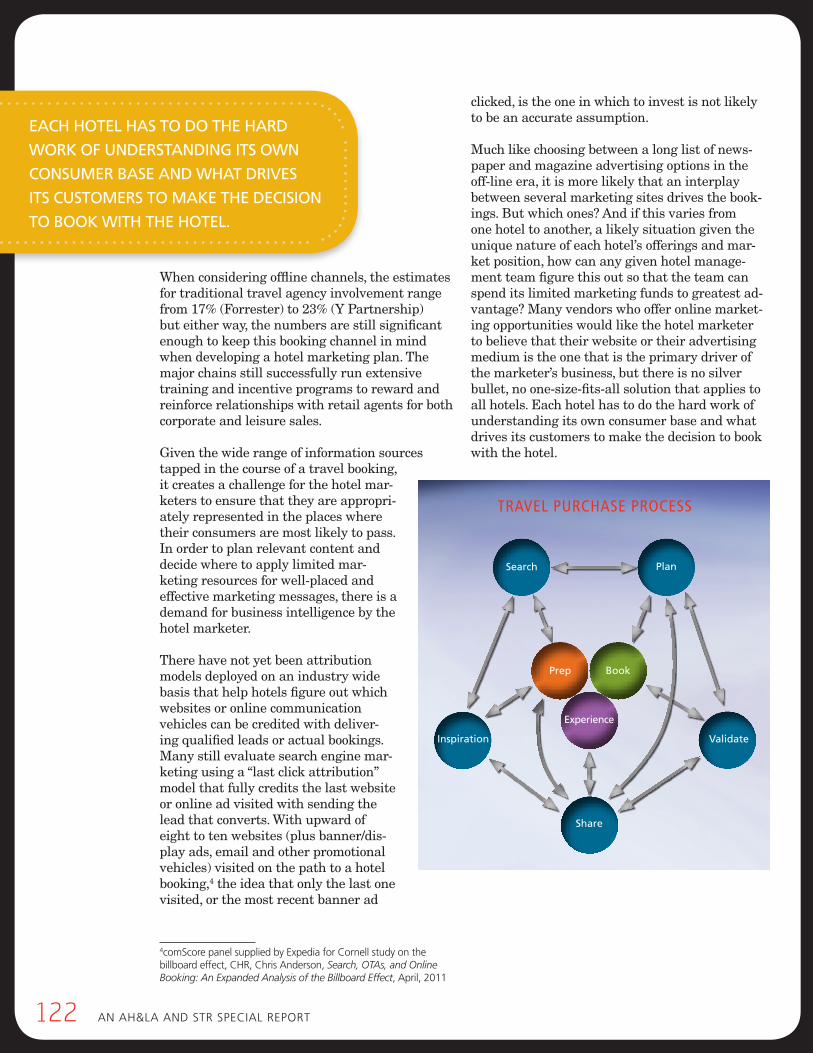
122 An Ah&lA And stR sPeciAl RePoRt
When considering offline channels, the estimates for traditional travel agency involvement range from 17% (Forrester) to 23% (Y Partnership) but either way, the numbers are still significant enough to keep this booking channel in mind when developing a hotel marketing plan. The major chains still successfully run extensive training and incentive programs to reward and reinforce relationships with retail agents for both corporate and leisure sales.
Given the wide range of information sources tapped in the course of a travel booking, it creates a challenge for the hotel mar-keters to ensure that they are appropri-ately represented in the places where their consumers are most likely to pass. In order to plan relevant content and decide where to apply limited mar-keting resources for well-placed and effective marketing messages, there is a demand for business intelligence by the hotel marketer.
There have not yet been attribution models deployed on an industry wide basis that help hotels figure out which websites or online communication vehicles can be credited with deliver-ing qualified leads or actual bookings. Many still evaluate search engine mar-keting using a “last click attribution” model that fully credits the last website or online ad visited with sending the lead that converts. With upward of eight to ten websites (plus banner/dis-play ads, email and other promotional vehicles) visited on the path to a hotel booking,4 the idea that only the last one visited, or the most recent banner ad
4comscore panel supplied by expedia for cornell study on the billboard effect, chR, chris Anderson, Search, OTAs, and Online Booking: An Expanded Analysis of the Billboard Effect, April, 2011
clicked, is the one in which to invest is not likely to be an accurate assumption.
Much like choosing between a long list of news-paper and magazine advertising options in the off-line era, it is more likely that an interplay between several marketing sites drives the book-ings. But which ones? And if this varies from one hotel to another, a likely situation given the unique nature of each hotel’s offerings and mar-ket position, how can any given hotel manage-ment team figure this out so that the team can spend its limited marketing funds to greatest ad-vantage? Many vendors who offer online market-ing opportunities would like the hotel marketer to believe that their website or their advertising medium is the one that is the primary driver of the marketer’s business, but there is no silver bullet, no one-size-fits-all solution that applies to all hotels. Each hotel has to do the hard work of understanding its own consumer base and what drives its customers to make the decision to book with the hotel.
Each hotEl has to do thE hard
work of undErstandIng Its own
consumEr basE and what drIvEs
Its customErs to makE thE dEcIsIon
to book wIth thE hotEl.
E
Search Plan
ValidateInspiration
Book
Experience
Prep
Share
Travel Purchase Process
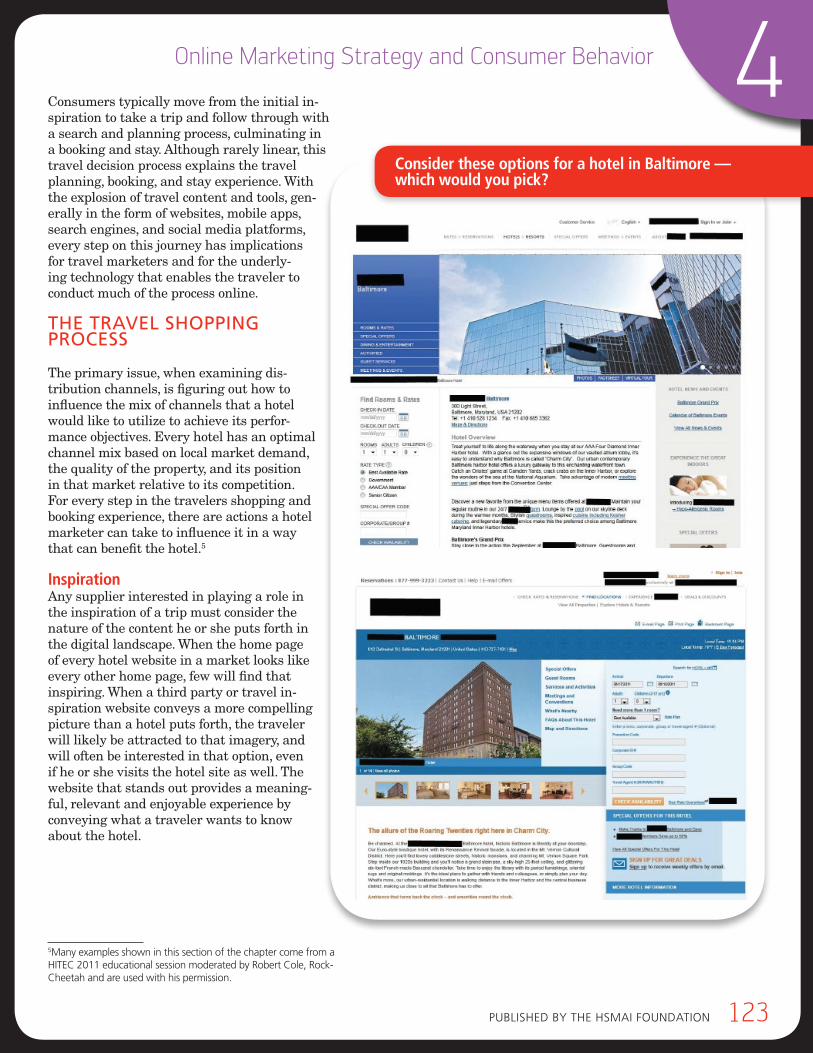
Published by the hsMAi FoundAtion 123
4Online Marketing Strategy and Consumer Behavior
Consumers typically move from the initial in-spiration to take a trip and follow through with a search and planning process, culminating in a booking and stay. Although rarely linear, this travel decision process explains the travel planning, booking, and stay experience. With the explosion of travel content and tools, gen-erally in the form of websites, mobile apps, search engines, and social media platforms, every step on this journey has implications for travel marketers and for the underly-ing technology that enables the traveler to conduct much of the process online.
thE travEl shoppIng procEss
The primary issue, when examining dis-tribution channels, is figuring out how to influence the mix of channels that a hotel would like to utilize to achieve its perfor-mance objectives. Every hotel has an optimal channel mix based on local market demand, the quality of the property, and its position in that market relative to its competition. For every step in the travelers shopping and booking experience, there are actions a hotel marketer can take to influence it in a way that can benefit the hotel.5
InspirationAny supplier interested in playing a role in the inspiration of a trip must consider the nature of the content he or she puts forth in the digital landscape. When the home page of every hotel website in a market looks like every other home page, few will find that inspiring. When a third party or travel in-spiration website conveys a more compelling picture than a hotel puts forth, the traveler will likely be attracted to that imagery, and will often be interested in that option, even if he or she visits the hotel site as well. The website that stands out provides a meaning-ful, relevant and enjoyable experience by conveying what a traveler wants to know about the hotel.
5Many examples shown in this section of the chapter come from a hitec 2011 educational session moderated by Robert cole, Rock-cheetah and are used with his permission.
Consider these options for a hotel in Baltimore —which would you pick?
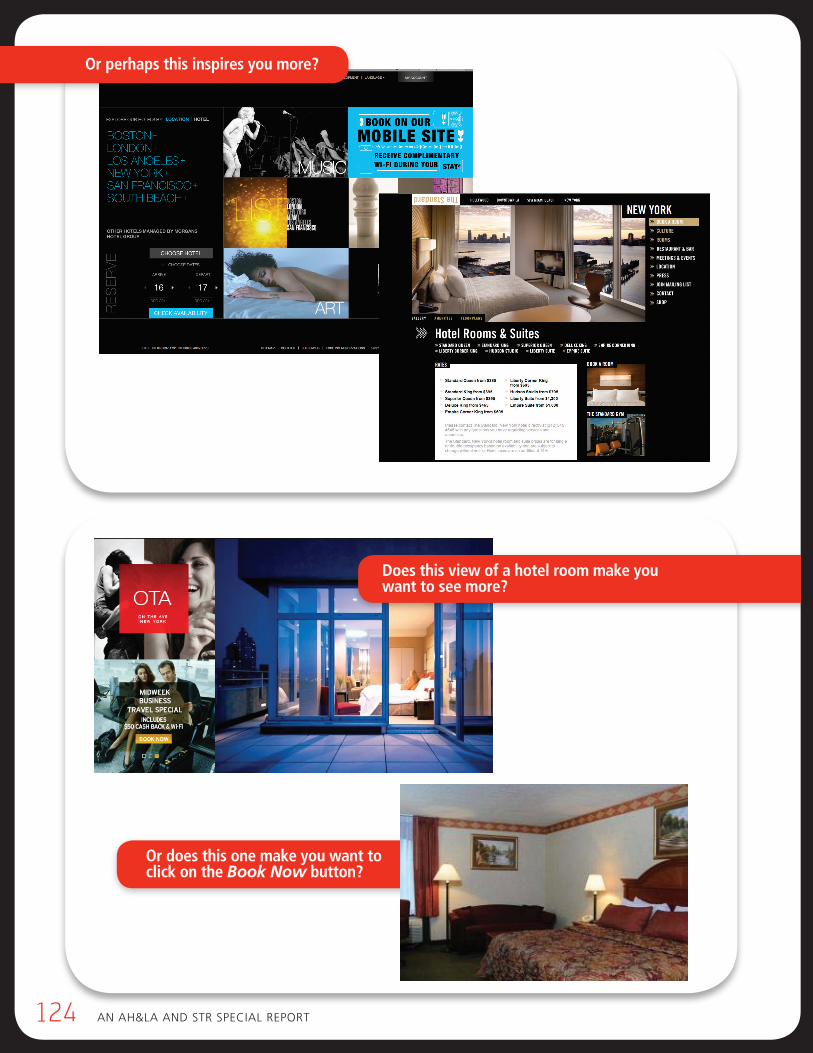
124 An Ah&lA And stR sPeciAl RePoRt
Or perhaps this inspires you more?
Does this view of a hotel room make you want to see more?
Or does this one make you want to click on the Book Now button?
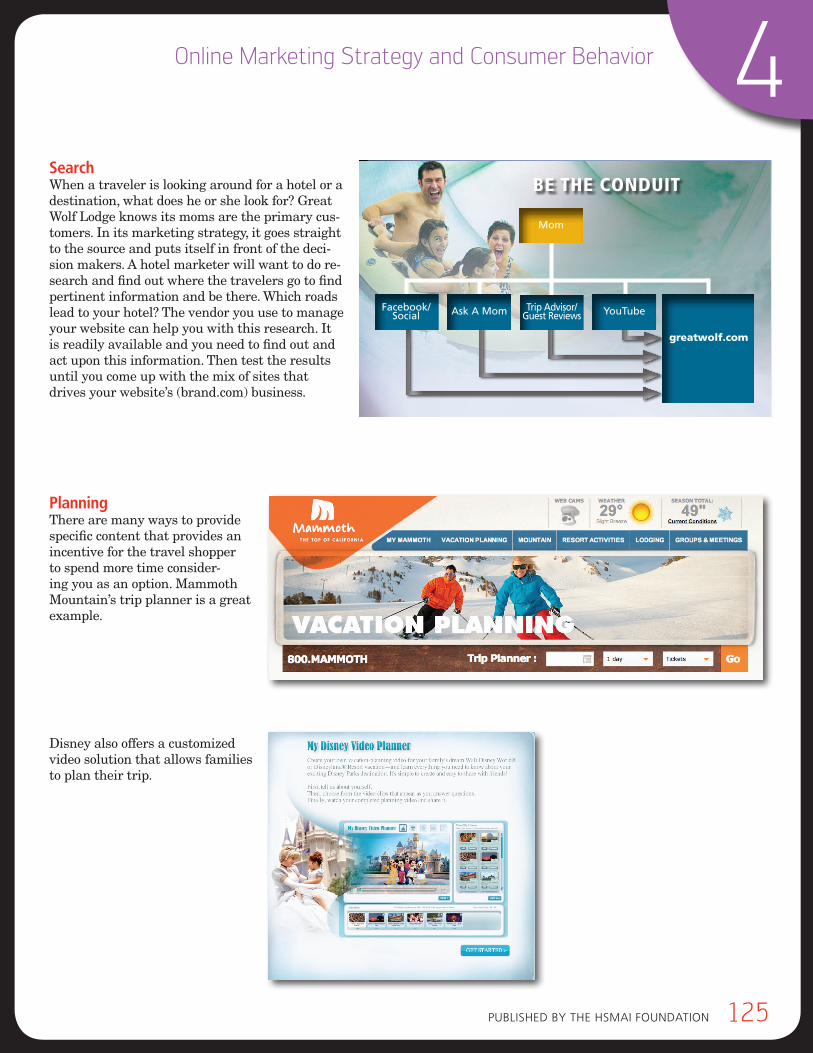
Published by the hsMAi FoundAtion 125
4Online Marketing Strategy and Consumer Behavior
SearchWhen a traveler is looking around for a hotel or a destination, what does he or she look for? Great Wolf Lodge knows its moms are the primary cus-tomers. In its marketing strategy, it goes straight to the source and puts itself in front of the deci-sion makers. A hotel marketer will want to do re-search and find out where the travelers go to find pertinent information and be there. Which roads lead to your hotel? The vendor you use to manage your website can help you with this research. It is readily available and you need to find out and act upon this information. Then test the results until you come up with the mix of sites that drives your website’s (brand.com) business.
PlanningThere are many ways to provide specific content that provides an incentive for the travel shopper to spend more time consider-ing you as an option. Mammoth Mountain’s trip planner is a great example.
Disney also offers a customized video solution that allows families to plan their trip.
Be the Conduit
Mom
Trip Advisor/ Guest Reviews
greatwolf.com
YouTubeAsk A MomFacebook/Social
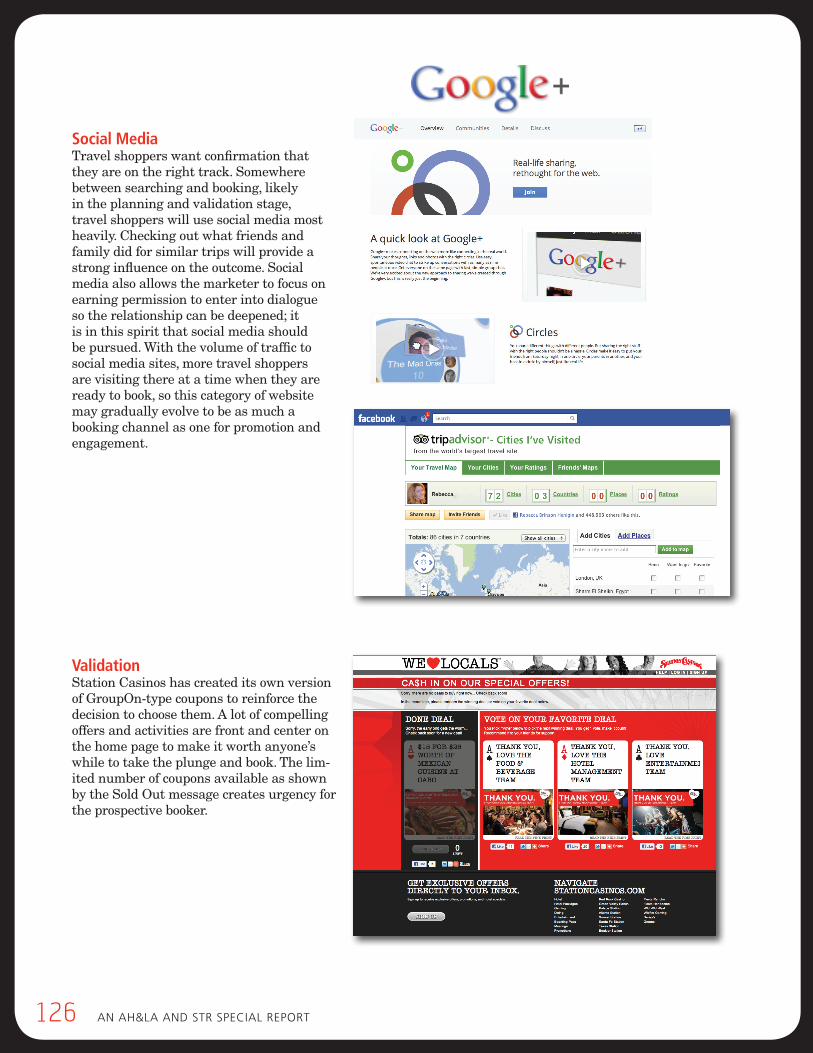
126 An Ah&lA And stR sPeciAl RePoRt
Social MediaTravel shoppers want confirmation that they are on the right track. Somewhere between searching and booking, likely in the planning and validation stage, travel shoppers will use social media most heavily. Checking out what friends and family did for similar trips will provide a strong influence on the outcome. Social media also allows the marketer to focus on earning permission to enter into dialogue so the relationship can be deepened; it is in this spirit that social media should be pursued. With the volume of traffic to social media sites, more travel shoppers are visiting there at a time when they are ready to book, so this category of website may gradually evolve to be as much a booking channel as one for promotion and engagement.
ValidationStation Casinos has created its own version of GroupOn-type coupons to reinforce the decision to choose them. A lot of compelling offers and activities are front and center on the home page to make it worth anyone’s while to take the plunge and book. The lim-ited number of coupons available as shown by the Sold Out message creates urgency for the prospective booker.
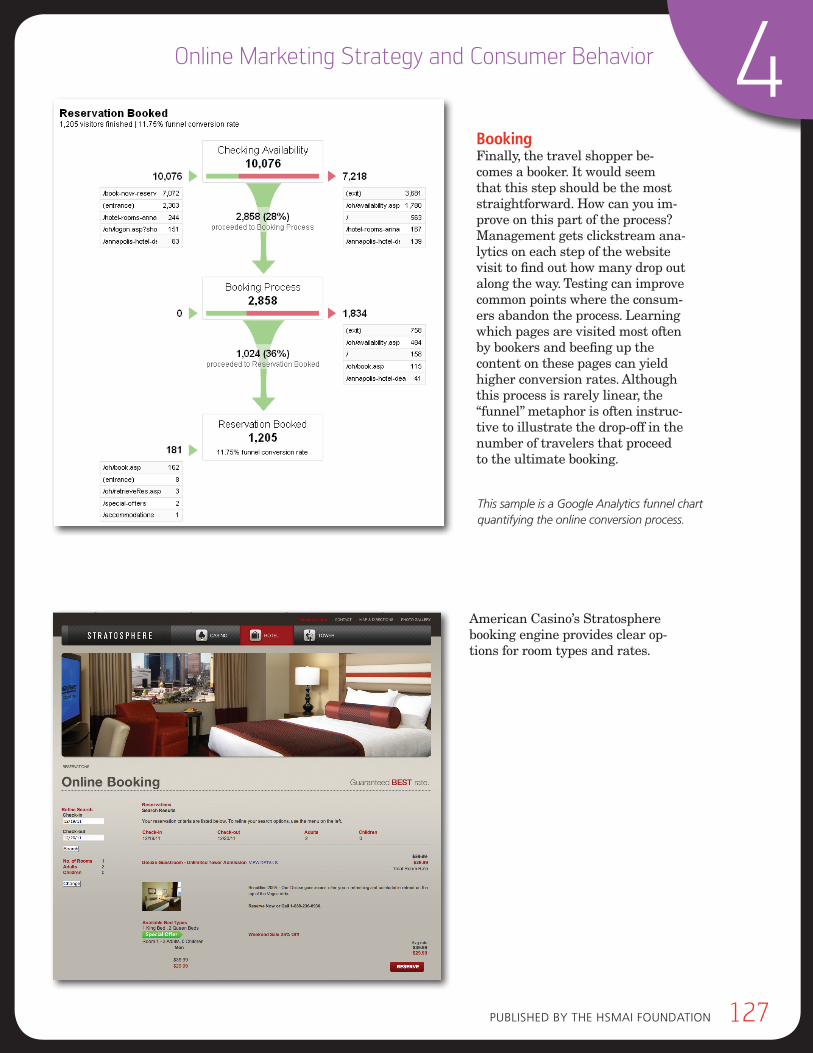
Published by the hsMAi FoundAtion 127
4Online Marketing Strategy and Consumer Behavior
BookingFinally, the travel shopper be-comes a booker. It would seem that this step should be the most straightforward. How can you im-prove on this part of the process? Management gets clickstream ana-lytics on each step of the website visit to find out how many drop out along the way. Testing can improve common points where the consum-ers abandon the process. Learning which pages are visited most often by bookers and beefing up the content on these pages can yield higher conversion rates. Although this process is rarely linear, the “funnel” metaphor is often instruc-tive to illustrate the drop-off in the number of travelers that proceed to the ultimate booking.
American Casino’s Stratosphere booking engine provides clear op-tions for room types and rates.
This sample is a Google Analytics funnel chart quantifying the online conversion process.
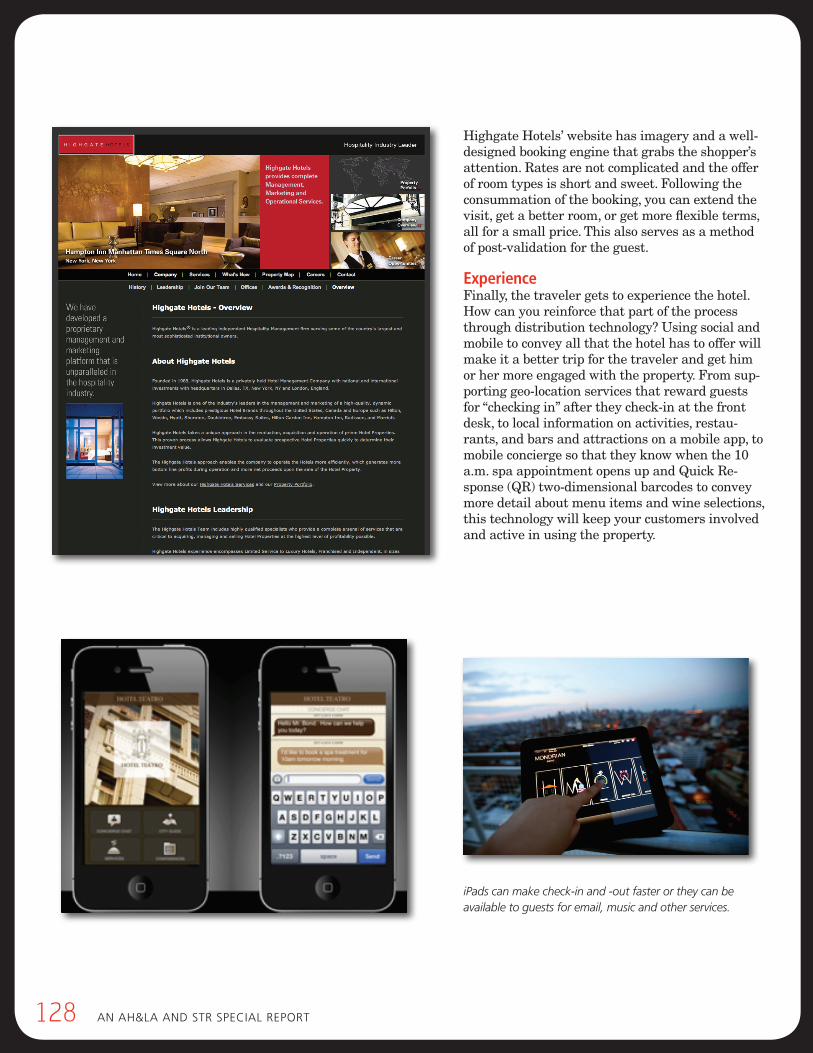
128 An Ah&lA And stR sPeciAl RePoRt
Highgate Hotels’ website has imagery and a well-designed booking engine that grabs the shopper’s attention. Rates are not complicated and the offer of room types is short and sweet. Following the consummation of the booking, you can extend the visit, get a better room, or get more flexible terms, all for a small price. This also serves as a method of post-validation for the guest.
ExperienceFinally, the traveler gets to experience the hotel. How can you reinforce that part of the process through distribution technology? Using social and mobile to convey all that the hotel has to offer will make it a better trip for the traveler and get him or her more engaged with the property. From sup-porting geo-location services that reward guests for “checking in” after they check-in at the front desk, to local information on activities, restau-rants, and bars and attractions on a mobile app, to mobile concierge so that they know when the 10 a.m. spa appointment opens up and Quick Re-sponse (QR) two-dimensional barcodes to convey more detail about menu items and wine selections, this technology will keep your customers involved and active in using the property.
iPads can make check-in and -out faster or they can be available to guests for email, music and other services.
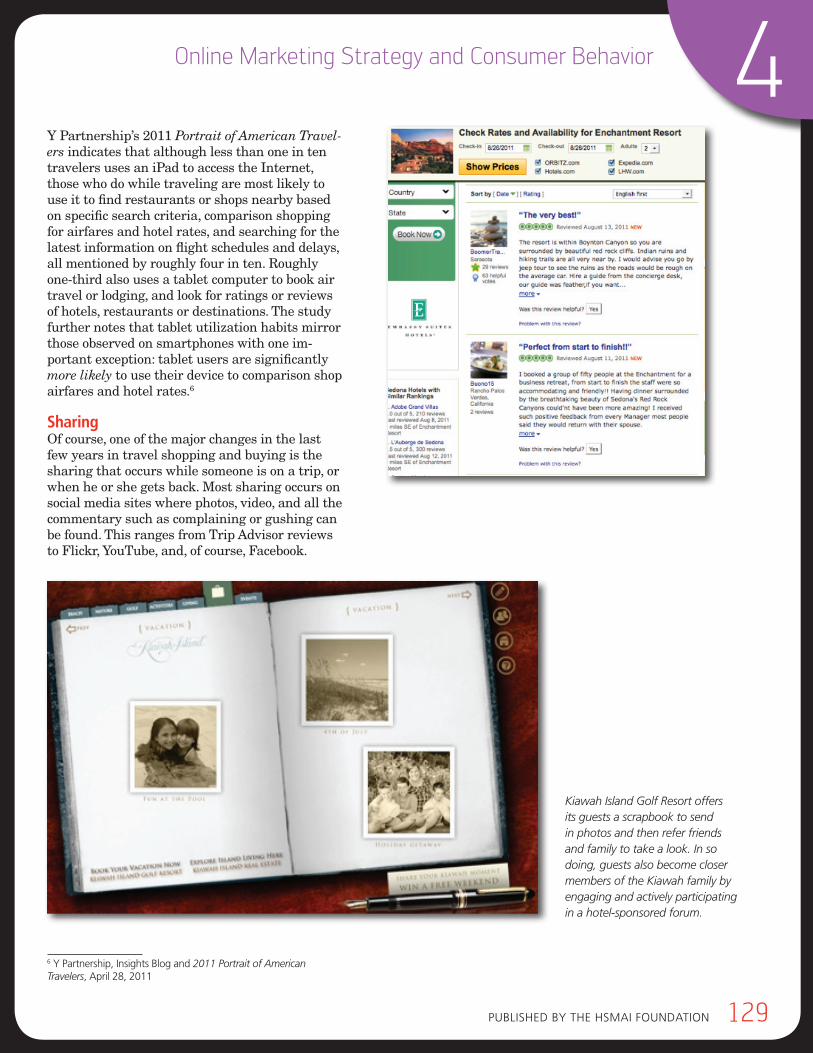
Published by the hsMAi FoundAtion 129
4Online Marketing Strategy and Consumer Behavior
Y Partnership’s 2011 Portrait of American Travel-ers indicates that although less than one in ten travelers uses an iPad to access the Internet, those who do while traveling are most likely to use it to find restaurants or shops nearby based on specific search criteria, comparison shopping for airfares and hotel rates, and searching for the latest information on flight schedules and delays, all mentioned by roughly four in ten. Roughly one-third also uses a tablet computer to book air travel or lodging, and look for ratings or reviews of hotels, restaurants or destinations. The study further notes that tablet utilization habits mirror those observed on smartphones with one im-portant exception: tablet users are significantly more likely to use their device to comparison shop airfares and hotel rates.6
SharingOf course, one of the major changes in the last few years in travel shopping and buying is the sharing that occurs while someone is on a trip, or when he or she gets back. Most sharing occurs on social media sites where photos, video, and all the commentary such as complaining or gushing can be found. This ranges from Trip Advisor reviews to Flickr, YouTube, and, of course, Facebook.
6 y Partnership, insights blog and 2011 Portrait of American Travelers, April 28, 2011
Kiawah Island Golf Resort offers its guests a scrapbook to send in photos and then refer friends and family to take a look. In so doing, guests also become closer members of the Kiawah family by engaging and actively participating in a hotel-sponsored forum.
130 An Ah&lA And stR sPeciAl RePoRt
Summary of the Travel Shopping and Buying ProcessConsumers respond favorably when they interact with relevant content and the user experience is positive; this may mean easy and efficient for some, it may mean fun and engaging for others, or it may mean all of the above, depending on the variety of customers for any hotel.
The channel of choice for a booking may be differ-ent than the channel of choice for search, plan-ning, or some other point along the online con-sumer journey, as illustrated by the examples in this chapter. Determining where to put resources along this path is a challenge to hotel marketers. Is one step more likely to influence the traveler than another? How can you tell which sites your hotel customers frequent and what actions they take at each? More important, how can you tell which of them contributes most to their deci-sion to choose you? This is the question many would like answered but it will undoubtedly take research on the part of the marketer along with testing and evaluation to figure out what moves the needle for each customer type.
One thing is for sure: if you create an awesome website with standout content and a great user interface that serves up relevant content that is appropriate for your visitors, you will improve conversion on that site. However, it is also a real-ity of the online consumer marketplace that you also have to manage your content on many other sites. It is not realistic to expect travelers to go to one site for all their online travel needs. Go where your shoppers go, see what they see; figure out how to be visible and compelling at each point on the travel-buying journey. Content and interaction are crucial, given the many choices a consumer has online for travel shopping and booking.
attrIbutIon modEls — how to crEdIt thE sourcE of onlInE bookIngsOne of the challenges of managing an online marketing strategy is the ability to determine what actually moves the travel shopper to click on the Book Now button. Every third party website that participates in the travel ecosystem would like the hotel marketer to believe that a visit to its website or the use of its advertis-ing medium is the trigger to get the traveler to choose your hotel.
However, it is not that simple. This topic is hotly debated by media experts where search market-ing is the theme, no matter what industry is the focus. A Google search turns up over four mil-lion entries for the topic of online attribution; there is a plethora of articles and white papers with academics and web providers alike wres-tling with the best way to answer this elusive question. Eric Peterson, author of Web Analytics Demystified and former Jupiter Research online analyst comments that “the relative nascence of digital marketing practices, combined with poorly understood interaction between online marketing channels likely means that hundreds of millions of dollars are wasted on efforts that don’t produce their intended result”. One online media expert, Josh Dreller, media director from Fuor Digital, describes it well: “you need to create a model that assigns a percentage of conversion to each interaction based on its value to that conversion.” He goes on to explain that you may need to credit every action from the first email to the interim banner ads and through to the last ad, website or consumer review clicked, and it is the combina-tion that drives the sale.
No one has yet found the answer, and services around “multi-click” attribution are emerging to address the reality that most online shoppers go to many sites before they ultimately buy, and it is most likely that visits to a combination of sites actually trip the decision. In the hotel arena, this could mean evaluating how much to credit email, the general search engine organic listing (e.g. Google, Yahoo), a pay-per-click (PPC) ad on the search engine; the travel search engine if one is used (e.g., Kayak, Bing), the OTA if one is used; an airline website if the consumer passes through; banner ads; social media sites, such as consumer review sites or the stop through
go whErE your shoppErs go,
sEE what thEy sEE; fIgurE out how
to bE vIsIblE and compEllIng at Each
poInt on thE travEl-buyIng journEy.
Published by the hsMAi FoundAtion 131
4Online Marketing Strategy and Consumer Behavior
the Facebook page for the hotel; and finally, any other listings or online ads in the interim. This doesn’t even factor in off-line marketing, such as television, magazine and newspaper ads, or radio into the equation, or the all-important feedback a consumer may get from family and friends through social media or off-line gatherings. It’s like the old story of retail tycoon John Wanamak-er who famously said well over 100 years before the Internet came along that he knew half of his advertising was wasted, if he could just figure out which half.
We know something trips the purchase, and we know travel shoppers visit many sites and in-teract with many media messages. We just don’t know which of those sites, and/or messages, or what combination of them triggers the booking. For convenience, many web marketers will sug-gest that the last website visited is the one to get the “credit” for the booking—that is the origin of the term “last click attribution.”
In the world of hotel distribution, there is a concept called the “billboard effect,” which is closely related to the concept of attribution mod-els. Two studies published in October 2009 and April 2011, by Cornell’s Center for Hospitality Research (CHR), and funded by Expedia, con-cluded that a visit to the Expedia website is the direct cause of a large number of hotel brand.com bookings. This study may be seen by some as a simple answer to characterize a complex on-line consumer behavior and any hotel marketer would be well served by examining the interplay between all communication vehicles (on- and off-line) and websites consumed by travel shoppers, and appropriately assigning credit to each touch point on the sales path. Attributing the majority of benefit to one provider where there are clearly many involved appears to be misleading and could result in a misappropriation of marketing resources.
The Billboard EffectThe data used to support the claim of the OTA Billboard Effect came from a combination of the two studies published in October 2009 and April 2011. The latter and more in-depth one is based on a sample of 1,720 reservations booked into InterContinental Hotel Group’s (IHG) hotels by members of comScore’s consumer panel in July-August of 2008, 2009, and 2010. IHG was chosen as a subject of study because it discontinued its agreement with Expedia from approximately November 2004 to November 2008 and the study was attempting to determine if there was a lift in brand.com bookings as a result of renewing the relationship. IHG had declined sharing its proprietary information so the study utilized publicly available data through comScore, which was acquired by Expedia.
The April 2011 CHR report was framed as a follow-on study to one published in October 2009, also by CHR, that examined four hotels; the earli-er study was referred to as a “pseudo-experiment” to cycle artificially on and off of Expedia and test the patterns of booking volume on brand.com in October, November, and December 2008. These studies were designed to examine the influence of Expedia on hotel website bookings but may have benefited from some other variables in the online booking equation. For example it would be helpful to consider the promotional activity in other channels as well as the impact of the rank positioning of the subject hotels on the site.
The first “pseudo-experiment” involved a case where three (of the four) hotels had sister brand-ed properties listed on Expedia even when the subject hotels were taken off so the brand was still being promoted. One hotel of the four was an independent. Listings appeared on the top of every page, the prime spot for bookings. Expedia reports 95% of bookings occur with first page placement and almost half (47%) of these book-ings are made with hotels in the top six positions.7 A top-of-page listing is the limited “real estate” reserved for only a few hotels, and, therefore, is not a realistic scenario that could represent a typical hotel’s benefit. If the hotel is on page three or four, would it get any play from the billboard effect? What does it “cost” a hotel to be on the top spot on page one? Does it usually take a deeply
7brian Ferguson, expedia, during presentation at the Cornell Hospitality Research Summit, october 2010
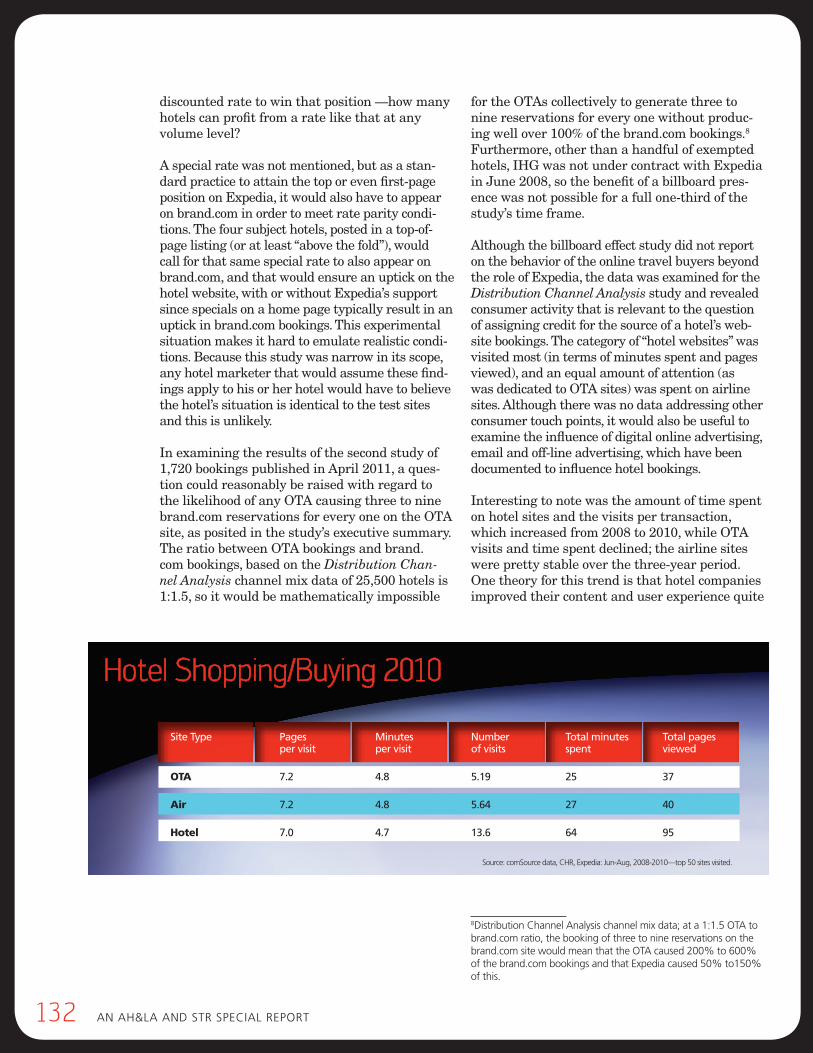
132 An Ah&lA And stR sPeciAl RePoRt
discounted rate to win that position —how many hotels can profit from a rate like that at any volume level?
A special rate was not mentioned, but as a stan-dard practice to attain the top or even first-page position on Expedia, it would also have to appear on brand.com in order to meet rate parity condi-tions. The four subject hotels, posted in a top-of-page listing (or at least “above the fold”), would call for that same special rate to also appear on brand.com, and that would ensure an uptick on the hotel website, with or without Expedia’s support since specials on a home page typically result in an uptick in brand.com bookings. This experimental situation makes it hard to emulate realistic condi-tions. Because this study was narrow in its scope, any hotel marketer that would assume these find-ings apply to his or her hotel would have to believe the hotel’s situation is identical to the test sites and this is unlikely.
In examining the results of the second study of 1,720 bookings published in April 2011, a ques-tion could reasonably be raised with regard to the likelihood of any OTA causing three to nine brand.com reservations for every one on the OTA site, as posited in the study’s executive summary. The ratio between OTA bookings and brand.com bookings, based on the Distribution Chan-nel Analysis channel mix data of 25,500 hotels is 1:1.5, so it would be mathematically impossible
for the OTAs collectively to generate three to nine reservations for every one without produc-ing well over 100% of the brand.com bookings.8 Furthermore, other than a handful of exempted hotels, IHG was not under contract with Expedia in June 2008, so the benefit of a billboard pres-ence was not possible for a full one-third of the study’s time frame.
Although the billboard effect study did not report on the behavior of the online travel buyers beyond the role of Expedia, the data was examined for the Distribution Channel Analysis study and revealed consumer activity that is relevant to the question of assigning credit for the source of a hotel’s web-site bookings. The category of “hotel websites” was visited most (in terms of minutes spent and pages viewed), and an equal amount of attention (as was dedicated to OTA sites) was spent on airline sites. Although there was no data addressing other consumer touch points, it would also be useful to examine the influence of digital online advertising, email and off-line advertising, which have been documented to influence hotel bookings.
Interesting to note was the amount of time spent on hotel sites and the visits per transaction, which increased from 2008 to 2010, while OTA visits and time spent declined; the airline sites were pretty stable over the three-year period. One theory for this trend is that hotel companies improved their content and user experience quite
8distribution channel Analysis channel mix data; at a 1:1.5 otA to brand.com ratio, the booking of three to nine reservations on the brand.com site would mean that the otA caused 200% to 600% of the brand.com bookings and that expedia caused 50% to150% of this.
Hotel Shopping/Buying 2010
Source: comSource data, CHR, Expedia: Jun-Aug, 2008-2010—top 50 sites visited.
Site Type Pages Minutes Number Total minutes Total pages per visit per visit of visits spent viewed
OTA 7.2 4.8 5.19 25 37
Air 7.2 4.8 5.64 27 40
Hotel 7.0 4.7 13.6 64 95
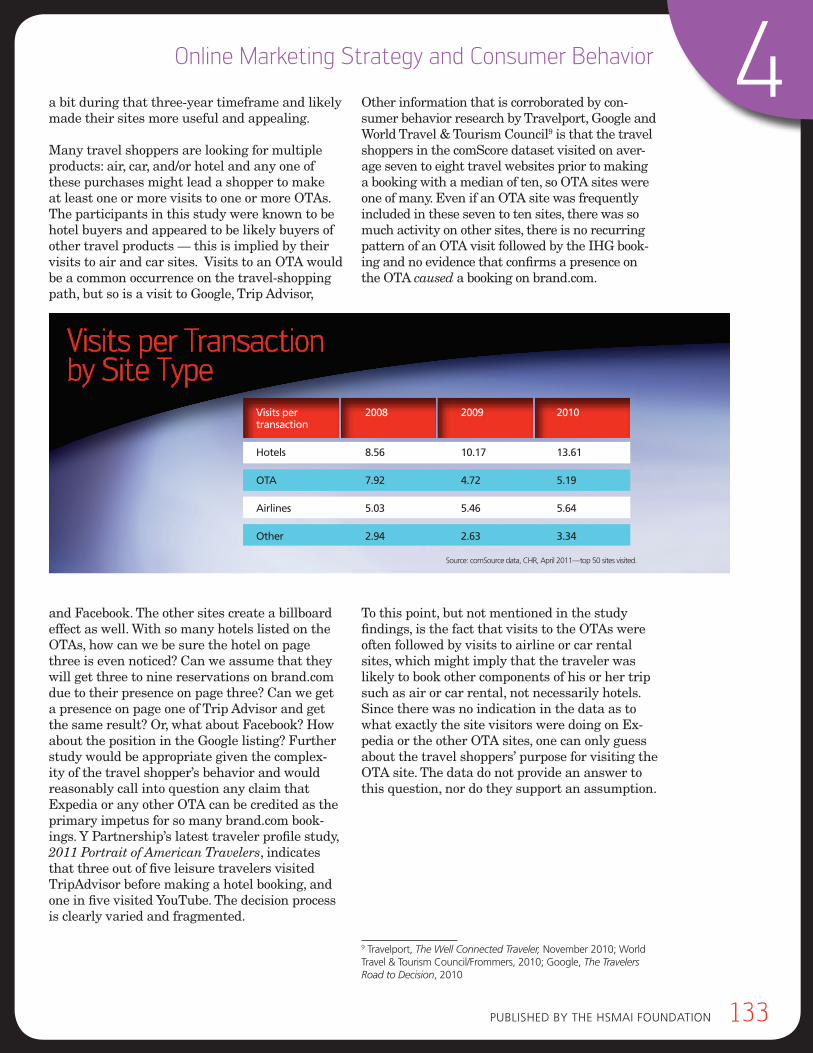
Published by the hsMAi FoundAtion 133
4Online Marketing Strategy and Consumer Behavior
a bit during that three-year timeframe and likely made their sites more useful and appealing.
Many travel shoppers are looking for multiple products: air, car, and/or hotel and any one of these purchases might lead a shopper to make at least one or more visits to one or more OTAs. The participants in this study were known to be hotel buyers and appeared to be likely buyers of other travel products — this is implied by their visits to air and car sites. Visits to an OTA would be a common occurrence on the travel-shopping path, but so is a visit to Google, Trip Advisor,
and Facebook. The other sites create a billboard effect as well. With so many hotels listed on the OTAs, how can we be sure the hotel on page three is even noticed? Can we assume that they will get three to nine reservations on brand.com due to their presence on page three? Can we get a presence on page one of Trip Advisor and get the same result? Or, what about Facebook? How about the position in the Google listing? Further study would be appropriate given the complex-ity of the travel shopper’s behavior and would reasonably call into question any claim that Expedia or any other OTA can be credited as the primary impetus for so many brand.com book-ings. Y Partnership’s latest traveler profile study, 2011 Portrait of American Travelers, indicates that three out of five leisure travelers visited TripAdvisor before making a hotel booking, and one in five visited YouTube. The decision process is clearly varied and fragmented.
Other information that is corroborated by con-sumer behavior research by Travelport, Google and World Travel & Tourism Council9 is that the travel shoppers in the comScore dataset visited on aver-age seven to eight travel websites prior to making a booking with a median of ten, so OTA sites were one of many. Even if an OTA site was frequently included in these seven to ten sites, there was so much activity on other sites, there is no recurring pattern of an OTA visit followed by the IHG book-ing and no evidence that confirms a presence on the OTA caused a booking on brand.com.
To this point, but not mentioned in the study findings, is the fact that visits to the OTAs were often followed by visits to airline or car rental sites, which might imply that the traveler was likely to book other components of his or her trip such as air or car rental, not necessarily hotels. Since there was no indication in the data as to what exactly the site visitors were doing on Ex-pedia or the other OTA sites, one can only guess about the travel shoppers’ purpose for visiting the OTA site. The data do not provide an answer to this question, nor do they support an assumption.
9 travelport, The Well Connected Traveler, november 2010; World travel & tourism council/Frommers, 2010; Google, The Travelers Road to Decision, 2010
Visits per Transaction by Site Type
Source: comSource data, CHR, April 2011—top 50 sites visited.
Visits per 2008 2009 2010 transaction
Hotels 8.56 10.17 13.61
OTA 7.92 4.72 5.19
Airlines 5.03 5.46 5.64
Other 2.94 2.63 3.34
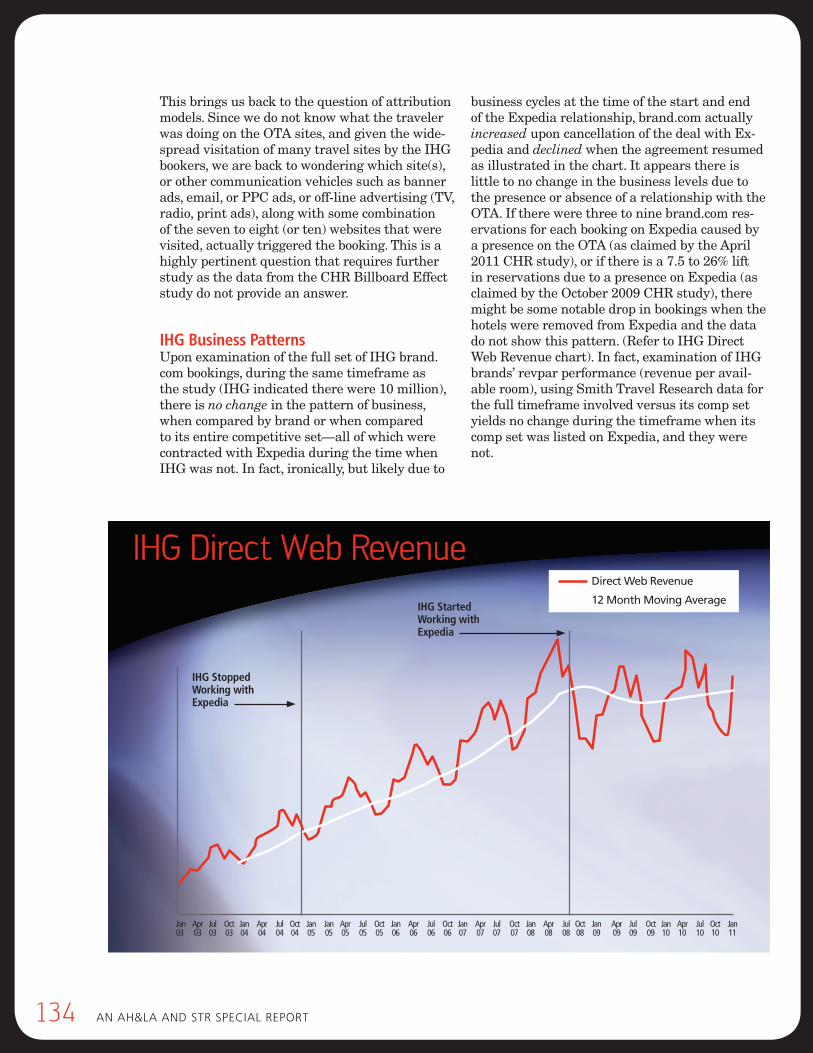
134 An Ah&lA And stR sPeciAl RePoRt
This brings us back to the question of attribution models. Since we do not know what the traveler was doing on the OTA sites, and given the wide-spread visitation of many travel sites by the IHG bookers, we are back to wondering which site(s), or other communication vehicles such as banner ads, email, or PPC ads, or off-line advertising (TV, radio, print ads), along with some combination of the seven to eight (or ten) websites that were visited, actually triggered the booking. This is a highly pertinent question that requires further study as the data from the CHR Billboard Effect study do not provide an answer.
IHG Business PatternsUpon examination of the full set of IHG brand.com bookings, during the same timeframe as the study (IHG indicated there were 10 million), there is no change in the pattern of business, when compared by brand or when compared to its entire competitive set—all of which were contracted with Expedia during the time when IHG was not. In fact, ironically, but likely due to
business cycles at the time of the start and end of the Expedia relationship, brand.com actually increased upon cancellation of the deal with Ex-pedia and declined when the agreement resumed as illustrated in the chart. It appears there is little to no change in the business levels due to the presence or absence of a relationship with the OTA. If there were three to nine brand.com res-ervations for each booking on Expedia caused by a presence on the OTA (as claimed by the April 2011 CHR study), or if there is a 7.5 to 26% lift in reservations due to a presence on Expedia (as claimed by the October 2009 CHR study), there might be some notable drop in bookings when the hotels were removed from Expedia and the data do not show this pattern. (Refer to IHG Direct Web Revenue chart). In fact, examination of IHG brands’ revpar performance (revenue per avail-able room), using Smith Travel Research data for the full timeframe involved versus its comp set yields no change during the timeframe when its comp set was listed on Expedia, and they were not.
IHG Direct Web Revenue
Jan Apr Jul Oct Jan Apr Jul Oct Jan Jan Apr Jul Oct Jan Apr Jul Oct Jan Apr Jul Oct Jan Apr Jul Oct Jan Apr Jul Oct Jan Apr Jul Oct Jan 03 03 03 03 04 04 04 04 05 05 05 05 05 06 06 06 06 07 07 07 07 08 08 08 08 09 09 09 09 10 10 10 10 11
IHG Stopped Working with Expedia
IHG Started Working with Expedia
Direct Web Revenue
12 Month Moving Average
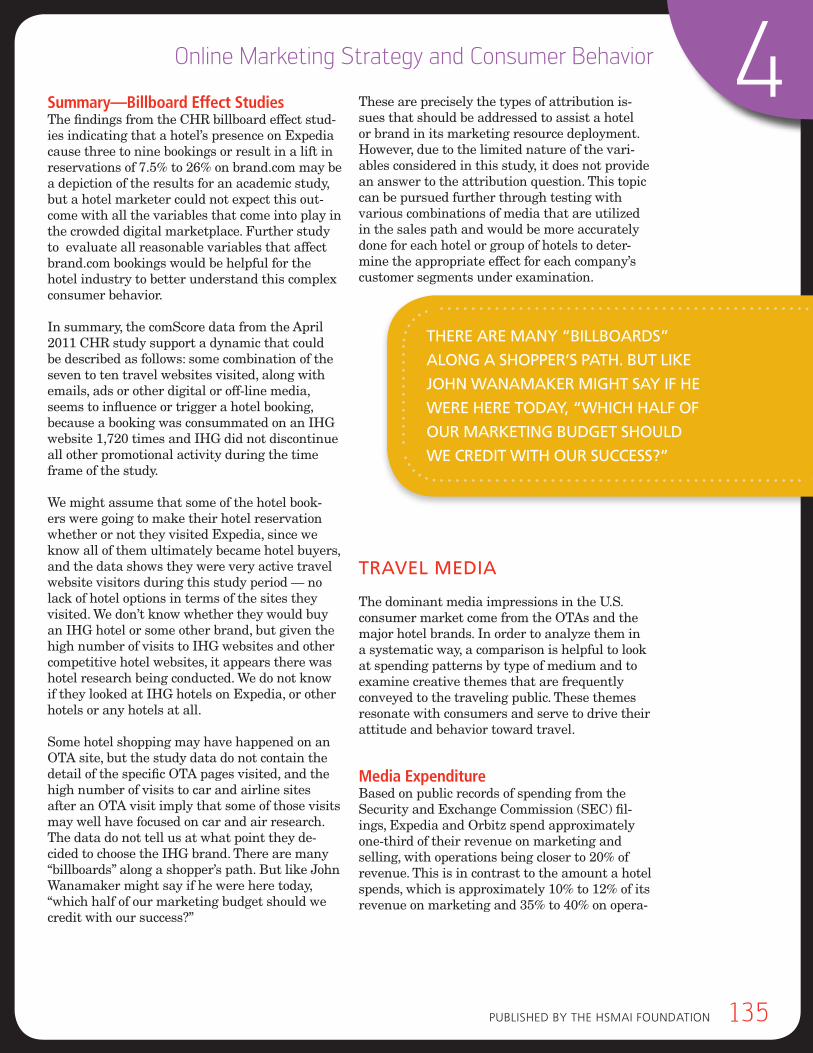
Published by the hsMAi FoundAtion 135
4Online Marketing Strategy and Consumer Behavior
Summary—Billboard Effect StudiesThe findings from the CHR billboard effect stud-ies indicating that a hotel’s presence on Expedia cause three to nine bookings or result in a lift in reservations of 7.5% to 26% on brand.com may be a depiction of the results for an academic study, but a hotel marketer could not expect this out-come with all the variables that come into play in the crowded digital marketplace. Further study to evaluate all reasonable variables that affect brand.com bookings would be helpful for the hotel industry to better understand this complex consumer behavior.
In summary, the comScore data from the April 2011 CHR study support a dynamic that could be described as follows: some combination of the seven to ten travel websites visited, along with emails, ads or other digital or off-line media, seems to influence or trigger a hotel booking, because a booking was consummated on an IHG website 1,720 times and IHG did not discontinue all other promotional activity during the time frame of the study.
We might assume that some of the hotel book-ers were going to make their hotel reservation whether or not they visited Expedia, since we know all of them ultimately became hotel buyers, and the data shows they were very active travel website visitors during this study period — no lack of hotel options in terms of the sites they visited. We don’t know whether they would buy an IHG hotel or some other brand, but given the high number of visits to IHG websites and other competitive hotel websites, it appears there was hotel research being conducted. We do not know if they looked at IHG hotels on Expedia, or other hotels or any hotels at all.
Some hotel shopping may have happened on an OTA site, but the study data do not contain the detail of the specific OTA pages visited, and the high number of visits to car and airline sites after an OTA visit imply that some of those visits may well have focused on car and air research. The data do not tell us at what point they de-cided to choose the IHG brand. There are many “billboards” along a shopper’s path. But like John Wanamaker might say if he were here today, “which half of our marketing budget should we credit with our success?”
These are precisely the types of attribution is-sues that should be addressed to assist a hotel or brand in its marketing resource deployment. However, due to the limited nature of the vari-ables considered in this study, it does not provide an answer to the attribution question. This topic can be pursued further through testing with various combinations of media that are utilized in the sales path and would be more accurately done for each hotel or group of hotels to deter-mine the appropriate effect for each company’s customer segments under examination.
travEl mEdIa
The dominant media impressions in the U.S. consumer market come from the OTAs and the major hotel brands. In order to analyze them in a systematic way, a comparison is helpful to look at spending patterns by type of medium and to examine creative themes that are frequently conveyed to the traveling public. These themes resonate with consumers and serve to drive their attitude and behavior toward travel.
Media ExpenditureBased on public records of spending from the Security and Exchange Commission (SEC) fil-ings, Expedia and Orbitz spend approximately one-third of their revenue on marketing and selling, with operations being closer to 20% of revenue. This is in contrast to the amount a hotel spends, which is approximately 10% to 12% of its revenue on marketing and 35% to 40% on opera-
thErE arE many “bIllboards”
along a shoppEr’s path. but lIkE
john wanamakEr mIght say If hE
wErE hErE today, “whIch half of
our markEtIng budgEt should
wE crEdIt wIth our succEss?”
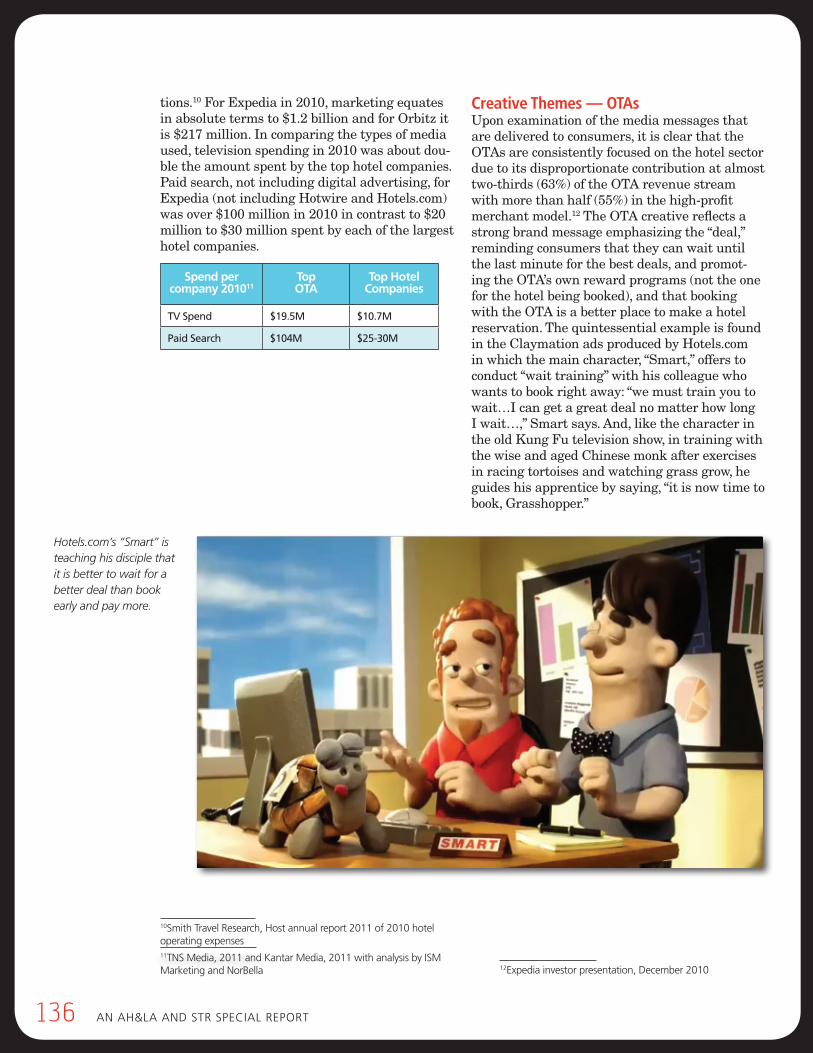
136 An Ah&lA And stR sPeciAl RePoRt
tions.10 For Expedia in 2010, marketing equates in absolute terms to $1.2 billion and for Orbitz it is $217 million. In comparing the types of media used, television spending in 2010 was about dou-ble the amount spent by the top hotel companies. Paid search, not including digital advertising, for Expedia (not including Hotwire and Hotels.com) was over $100 million in 2010 in contrast to $20 million to $30 million spent by each of the largest hotel companies.
10smith travel Research, host annual report 2011 of 2010 hotel operating expenses
Creative Themes — OTAsUpon examination of the media messages that are delivered to consumers, it is clear that the OTAs are consistently focused on the hotel sector due to its disproportionate contribution at almost two-thirds (63%) of the OTA revenue stream with more than half (55%) in the high-profit merchant model.12 The OTA creative reflects a strong brand message emphasizing the “deal,” reminding consumers that they can wait until the last minute for the best deals, and promot-ing the OTA’s own reward programs (not the one for the hotel being booked), and that booking with the OTA is a better place to make a hotel reservation. The quintessential example is found in the Claymation ads produced by Hotels.com in which the main character, “Smart,” offers to conduct “wait training” with his colleague who wants to book right away: “we must train you to wait…I can get a great deal no matter how long I wait…,” Smart says. And, like the character in the old Kung Fu television show, in training with the wise and aged Chinese monk after exercises in racing tortoises and watching grass grow, he guides his apprentice by saying, “it is now time to book, Grasshopper.”
Spend percompany 201011
Top OTA
Top Hotel Companies
tv spend $19.5m $10.7m
paid search $104m $25-30m
11tns Media, 2011 and Kantar Media, 2011 with analysis by isM Marketing and norbella 12expedia investor presentation, december 2010
Hotels.com’s “Smart” is teaching his disciple that it is better to wait for a better deal than book early and pay more.
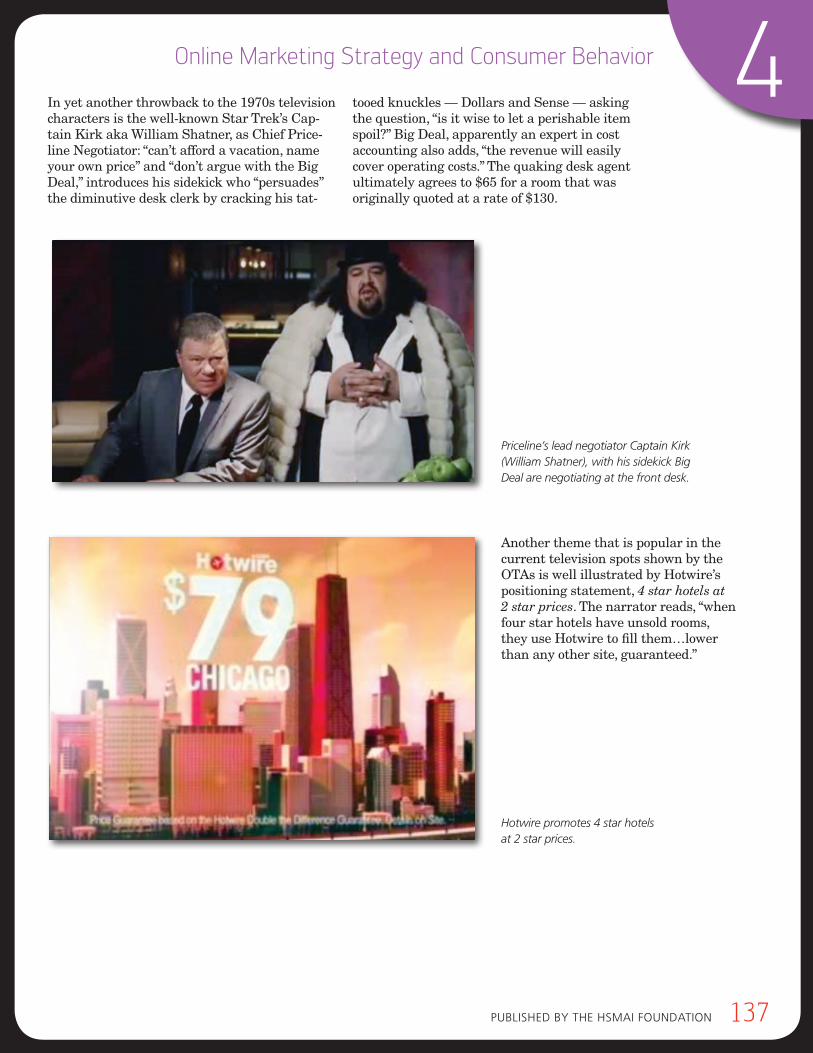
Published by the hsMAi FoundAtion 137
4Online Marketing Strategy and Consumer Behavior
In yet another throwback to the 1970s television characters is the well-known Star Trek’s Cap-tain Kirk aka William Shatner, as Chief Price-line Negotiator: “can’t afford a vacation, name your own price” and “don’t argue with the Big Deal,” introduces his sidekick who “persuades” the diminutive desk clerk by cracking his tat-
tooed knuckles — Dollars and Sense — asking the question, “is it wise to let a perishable item spoil?” Big Deal, apparently an expert in cost accounting also adds, “the revenue will easily cover operating costs.” The quaking desk agent ultimately agrees to $65 for a room that was originally quoted at a rate of $130.
Another theme that is popular in the current television spots shown by the OTAs is well illustrated by Hotwire’s positioning statement, 4 star hotels at 2 star prices. The narrator reads, “when four star hotels have unsold rooms, they use Hotwire to fill them…lower than any other site, guaranteed.”
Priceline’s lead negotiator Captain Kirk (William Shatner), with his sidekick Big Deal are negotiating at the front desk.
Hotwire promotes 4 star hotels at 2 star prices.
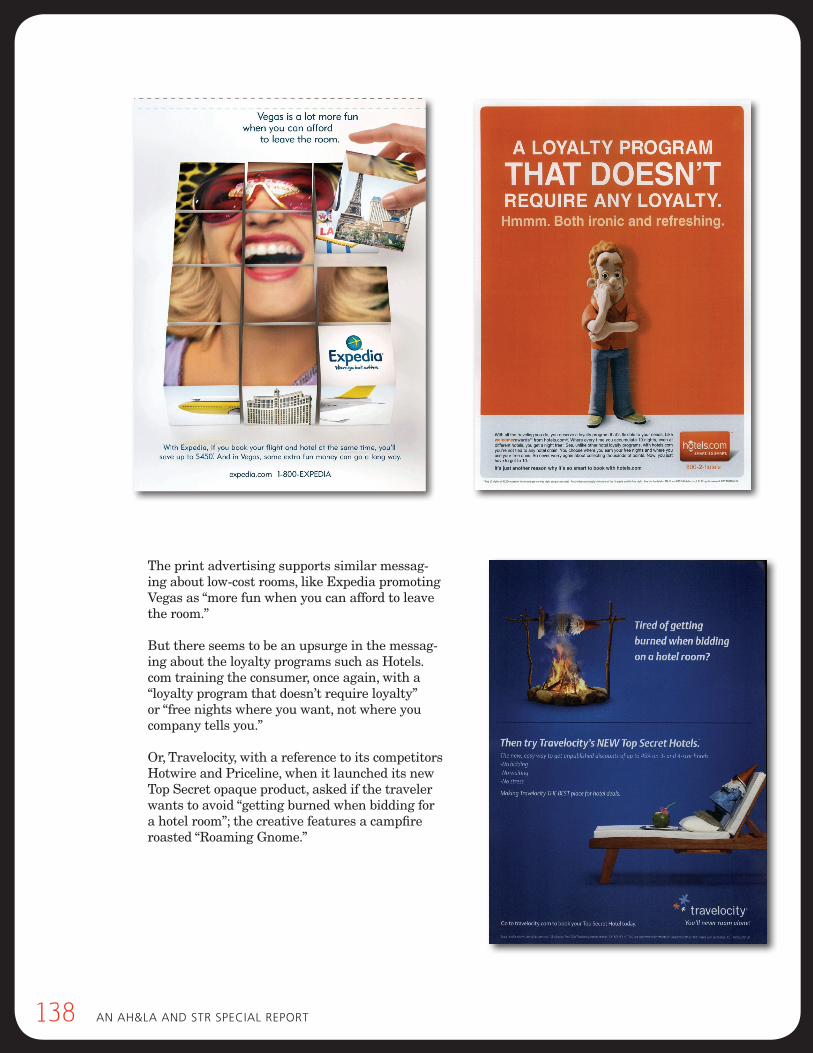
138 An Ah&lA And stR sPeciAl RePoRt
The print advertising supports similar messag-ing about low-cost rooms, like Expedia promoting Vegas as “more fun when you can afford to leave the room.”
But there seems to be an upsurge in the messag-ing about the loyalty programs such as Hotels.com training the consumer, once again, with a “loyalty program that doesn’t require loyalty” or “free nights where you want, not where you company tells you.”
Or, Travelocity, with a reference to its competitors Hotwire and Priceline, when it launched its new Top Secret opaque product, asked if the traveler wants to avoid “getting burned when bidding for a hotel room”; the creative features a campfire roasted “Roaming Gnome.”

Published by the hsMAi FoundAtion 139
4Online Marketing Strategy and Consumer Behavior
Creative Themes — HotelsIn sharp contrast, the hotel companies tend to deliver either a message that conveys the brand image and concept, and how it will make the traveler feel or one that is specific to a particu-lar seasonal promotion. In general, the OTAs are inclined to use more humor and irony which seems to address a hipper and edgier, possibly younger audience, while the hotel themes are more straightforward, perhaps more traditional and mainstream.
Best Western promotes the concept that its hotels are run by independent owners who care about their travelers by claiming the “world’s biggest hotel family” along with a value-add promotion offering a free night after three visits. With a similar formula, Days Inn offers the “best value under the sun” playing on its logo and makes a specific offer of 20% off with a three-night stay or longer.
Choice is the only ma-jor brand that (in the 2010-2011 timeframe) directly addresses the booking issue with its “take a stand” (on a suitcase) position, mak-ing a case for bookings on www.choicehotels.com for the best Inter-net rate possible and Choice also offers a specific seasonal offer for two stays to get a $50 gift card.
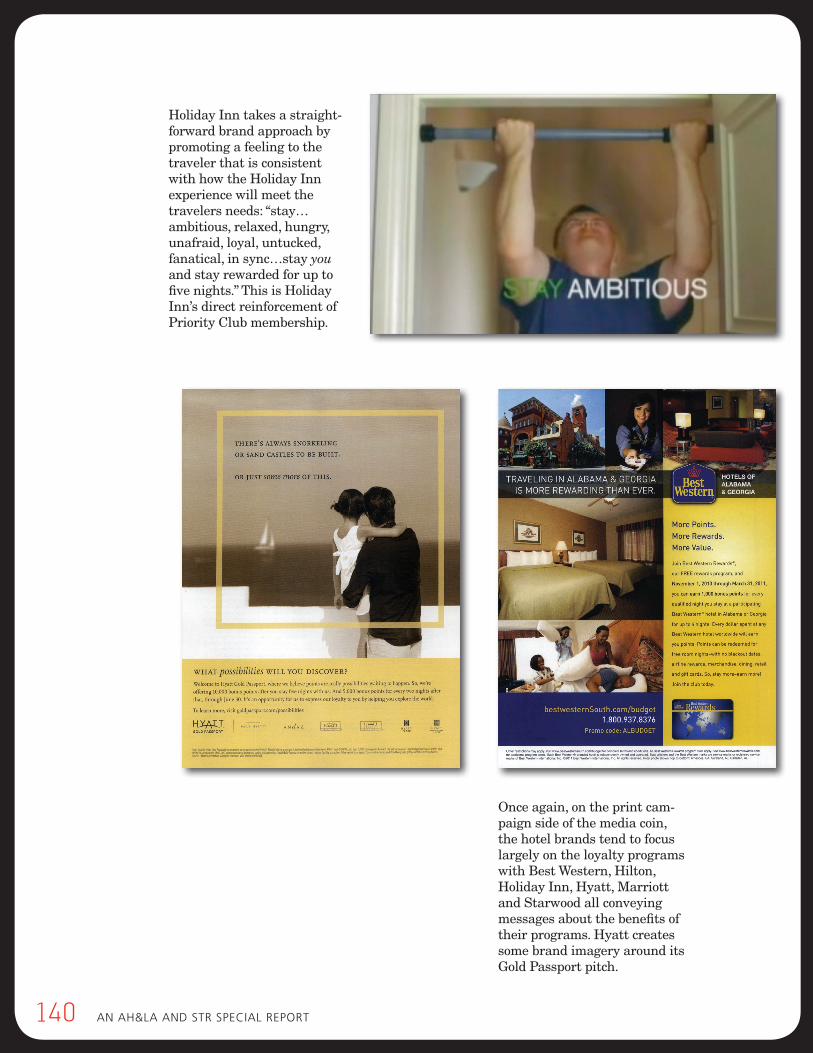
140 An Ah&lA And stR sPeciAl RePoRt
Holiday Inn takes a straight-forward brand approach by promoting a feeling to the traveler that is consistent with how the Holiday Inn experience will meet the travelers needs: “stay…ambitious, relaxed, hungry, unafraid, loyal, untucked, fanatical, in sync…stay you and stay rewarded for up to five nights.” This is Holiday Inn’s direct reinforcement of Priority Club membership.
Once again, on the print cam-paign side of the media coin, the hotel brands tend to focus largely on the loyalty programs with Best Western, Hilton, Holiday Inn, Hyatt, Marriott and Starwood all conveying messages about the benefits of their programs. Hyatt creates some brand imagery around its Gold Passport pitch.
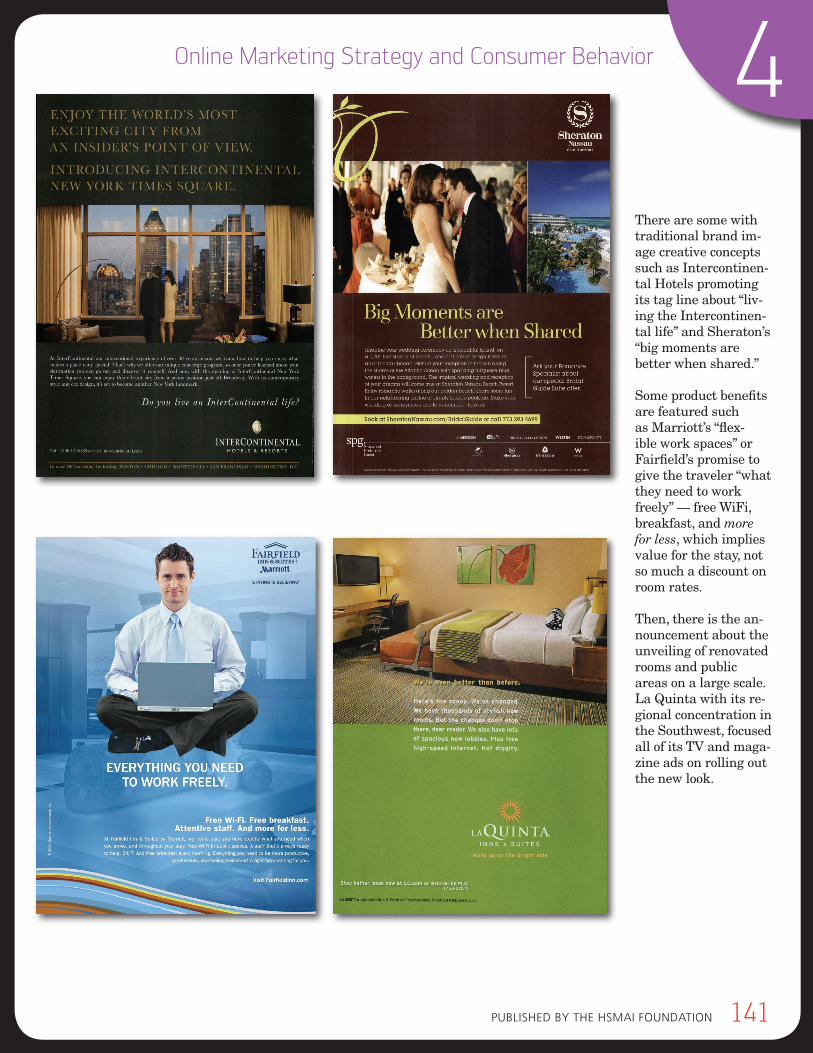
Published by the hsMAi FoundAtion 141
4Online Marketing Strategy and Consumer Behavior
There are some with traditional brand im-age creative concepts such as Intercontinen-tal Hotels promoting its tag line about “liv-ing the Intercontinen-tal life” and Sheraton’s “big moments are better when shared.”
Some product benefits are featured such as Marriott’s “flex-ible work spaces” or Fairfield’s promise to give the traveler “what they need to work freely” — free WiFi, breakfast, and more for less, which implies value for the stay, not so much a discount on room rates.
Then, there is the an-nouncement about the unveiling of renovated rooms and public areas on a large scale. La Quinta with its re-gional concentration in the Southwest, focused all of its TV and maga-zine ads on rolling out the new look.
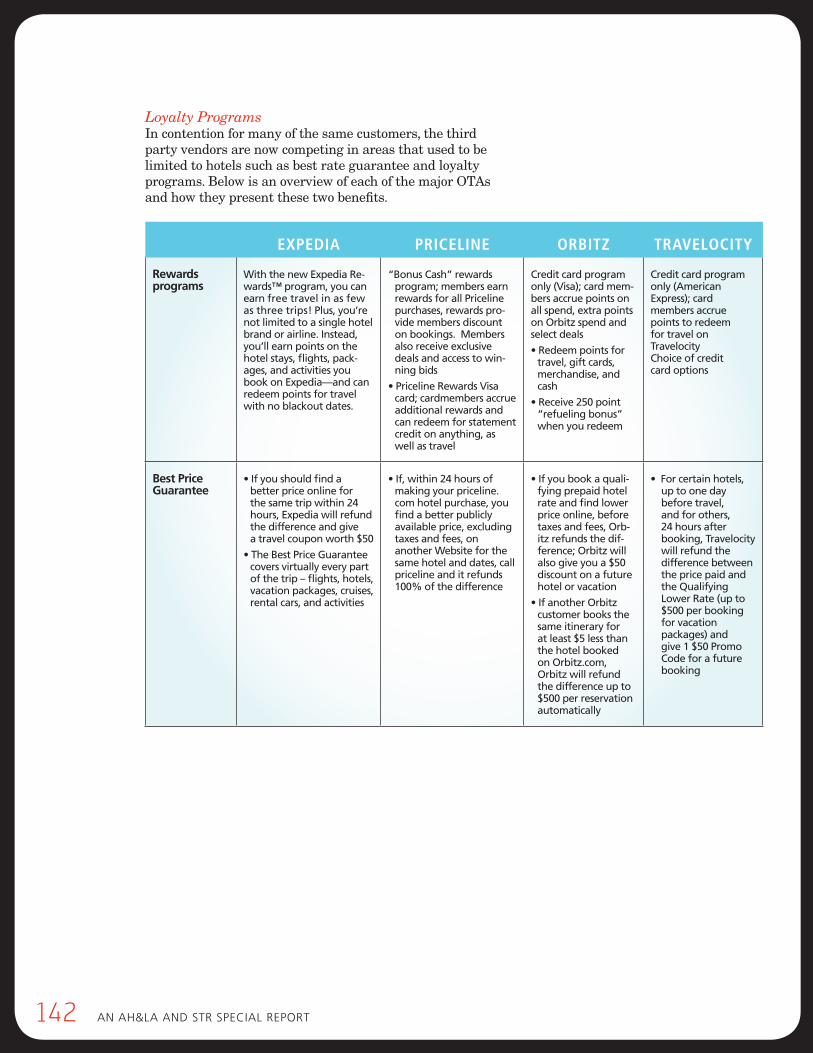
142 An Ah&lA And stR sPeciAl RePoRt
Loyalty ProgramsIn contention for many of the same customers, the third party vendors are now competing in areas that used to be limited to hotels such as best rate guarantee and loyalty programs. Below is an overview of each of the major OTAs and how they present these two benefits.
ExPEDIA PrICElInE OrBITz TrAVElOCITy
Rewards programs
with the new Expedia re-wards™ program, you can earn free travel in as few as three trips! plus, you’re not limited to a single hotel brand or airline. Instead, you’ll earn points on the hotel stays, flights, pack-ages, and activities you book on Expedia—and can redeem points for travel with no blackout dates.
“bonus cash” rewards program; members earn rewards for all priceline purchases, rewards pro-vide members discount on bookings. members also receive exclusive deals and access to win-ning bids
• Priceline Rewards Visa card; cardmembers accrue additional rewards and can redeem for statement credit on anything, as well as travel
credit card program only (visa); card mem-bers accrue points on all spend, extra points on orbitz spend and select deals
• Redeem points for travel, gift cards, merchandise, and cash
• Receive 250 point “refueling bonus” when you redeem
credit card program only (american Express); card members accrue points to redeem for travel on travelocitychoice of credit card options
Best Price Guarantee
• If you should find a better price online for the same trip within 24 hours, Expedia will refund the difference and give a travel coupon worth $50
• The Best Price Guarantee covers virtually every part of the trip – flights, hotels, vacation packages, cruises, rental cars, and activities
• If, within 24 hours of making your priceline.com hotel purchase, you find a better publicly available price, excluding taxes and fees, on another website for the same hotel and dates, call priceline and it refunds 100% of the difference
• If you book a quali-fying prepaid hotel rate and find lower price online, before taxes and fees, orb-itz refunds the dif-ference; orbitz will also give you a $50 discount on a future hotel or vacation
• If another Orbitz customer books the same itinerary for at least $5 less than the hotel booked on orbitz.com, orbitz will refund the difference up to $500 per reservation automatically
• For certain hotels, up to one day before travel, and for others, 24 hours after booking, travelocity will refund the difference between the price paid and the Qualifying lower rate (up to $500 per booking for vacation packages) and give 1 $50 promo code for a future booking
Published by the hsMAi FoundAtion 143
4Online Marketing Strategy and Consumer Behavior
Compelling ContentMake your content compelling and relevant, whether it is on your own website or syndicated to many other sites where you have a presence. Investing in great content is a highly effective differentiator given the number of hotel websites from which a traveler can choose. Content is a form of merchandising and should be developed with that in mind.
Great User ExperienceMake sure the user experience on your website and your booking engine is easy, fun and/or efficient. The most important rule — make sure your website and booking engine allow your site visitors to accomplish what they came to do and continually evaluate this to make sure you get it right all the time.
Know your CustomersResearch the path the different customer groups take on their way to a booking with you. Examine each step along that path for opportuni-ties to have a meaningful presence that engages and builds the rela-tionship, whether that is online or off-line.
Build an Online StrategyReview your online strategy against the travel process to ensure you have considered actions at each step to create a bias among your customers and prospects to consider you.
Create Bias for your Preferred Channels You can’t make travel shoppers choose one channel over another, but you can put out bread crumbs along their path that are so compelling that they will choose your route because it is appeal-ing and helps them accomplish their
goals better than the alternatives. This doesn’t mean only using your own website. By collaborating with others, you can get travelers to choose sites in which you can deepen your re-lationship with them as you lead them to your booking engine, whether that is on your own website or embedded in an external one.
Get SocialConsumers are all about social. Fig-ure out a way to be there in appro-priate ways. Master the social sites your consumers use. Think of social sites as places to build relationships and if you sell or incorporate your booking engine into a social site (e.g., Facebook), put it in a place that makes sense for the way the social site is naturally used.
Test and MonitorWhatever you do online, you should track results in all places possible. If you partner with a website (social, transactional, or informational) to promote your hotel, be sure you can track the results from it, whether it is a booking or other form of interaction. If you decide to test a new option, try to remove other factors that would muddy the results.
Attribution Models and “Billboard Effect”Be sure to calculate promotional lift from all your marketing channels, not just the ones that are vocal about claiming credit for it. Likely every one, including promotional messages like email, banner or display ads, and some off-line campaigns are con-tributing to making the cash register ring. Before assigning credit, look hard at the data to be sure you can quantify what that channel brings in terms of benefit from an added
presence and test various combina-tions until you figure out which ones get you the bookings at the lowest overall cost.
Distinguish yourselfIt is helpful to think about how your brand (independent or chain) differs from the others. Hotel brands have a tendency to look very similar in their content and messaging. It is hard to cut a unique swath from that cloth; this has been most successfully done in regional settings like boutique brands in major metro areas or in re-sorts. On a national or international basis, there is a tendency to dilute a brand’s uniqueness with messages that resonate with so many consum-er profiles that they fail to distin-guish the brand for any particular customer cohort. Ensure that your content and user experience set you apart with the audience that matters most to you.
Seek Sustainable Profit As much as every hotel would love the simplicity of one-step promotions that deliver immediate revenue, few consumers buy without having some kind of relationship first, an outcome that usually requires multiple in-teractions. Focus on engagement. A customer that does not refer others or return is worth far less than those who do. Spend your time and money on those who will refer or repeat. If you allocate resources in terms of acquisition, persuasion, and reten-tion, remind your team that if you are spending too much time on the first two steps, you may find yourself cycling through too many custom-ers and chasing your tail. Focus your resources on the channels that contribute the most profit and have long-term potential.
SummARy Of Online mARkeTinG STRATeGy And COnSumeR BeHAviORcontent and user experience are key variables that can drive online consumers to one site over another. however, it is important to keep in mind that because travel shoppers visit so many sites and are touched by so many promotional contacts in the run up to a booking, a presence on multiple sites and at multiple consumer touch points is likely to be appropriate. following are ten points to keep in mind:
How long have you been in hotel industry? How long have you been involved with distribution issues?
i have been involved with the industry for nearly 30 years. i have been extensively involved with the research, planning and analysis of hotel distribution for much of my career.
In what way does your current role involve distribution?
With responsibility for our company’s business intel-ligence services, my group works closely with our distribution organization to provide business insights regarding channel trends/dynamics, assess strategic options and measure performance.
Where would you say distribution fits into the overall hotel management landscape? Why does distribu-tion matter?
distribution plays a critical role in a hotel’s ability to achieve its revenue and profitability goals. A hotel needs to understand how to distribute its product to the right channels at the right time and at the right price for the right guest. distribution plays two critical roles. First, distribution channels drive demand and share to hotels that might otherwise go to competitors. second, disciplined management and optimization of distribution channels ensures that demand converts to bookings.
What are the top 3 current issues that will have the greatest impact on hotel distribution in the next two -– three years?
determining the true value of intermediaries in driving incremental traffic for hotels and compensating them accordingly.
Growth of bookings on mobile devices and tablets.
optimization of net revenue via each channel via an in-depth understanding of consumer dynamics and channel costs.
What is the smartest move your organization has made related to hotel distribution?
Aggressively communicating to consumers via national/local advertising that they should book direct through our proprietary web site to save time/money. this is a benefit for the consumer and for choice hotels.
What is the single biggest oversight or misstep you have witnessed (in your own organization or others in hospitality) in the last two years?
hotel companies in general have not done a good enough job in “owning” their customers, particularly infrequent guests, to prevent defection to third-party booking services that yield them lower rates/higher distribution costs.
What three things can you tell a hotel general manager, owner or asset manager about distribution that would have the greatest impact on unit level profit?
What is the next thing that you predict will disappear or gradually fade away that is currently a part of the distribution scene?
over time we can expect to see the central voice distribution systems continue to shrink (though not disappear) and with this volume shifting online.
If you had a crystal ball, what emerging technolo-gies do you anticipate could be game changers, or at least have the greatest affect on the distribution landscape in the next 2-3 years?
Mobile devices for shopping and booking.
Real-time customization of the shopping experience online.
Bill CarlsonChoiCe hotels international
senior Vice President, Performance analytics
InDUSTry PErSPECTIVE
evaluate the true cost of each distribution channel.
do not assume that all tracked business is “incremental business.”
understand which customers can be influenced to book via the hotel’s lower cost distribution channels.
®
>>
>>
>>
>>
>>
>>
>>
>>
123
144 An Ah&lA And stR sPeciAl RePoRt
How long have you been in the hotel industry? How long have you been involved with distribution issues?
My first hotel job was with the intercontinental Atlanta in 1989. i started working in distribution while at swissôtel hotels & Resorts in 1995. i’ve been involved in hotel distribution since then.
In what way does your current role involve distribution?
opentravel is a travel-distribution focused organiza-tion, which work with companies in all travel seg-ments to create standard communication messages to transmit traveler and travel information, and to execute transactions including reservations, modi-fications and cancellations. our goal is to create a common language to enable faster time to market for new travel products and new travel partners. As ceo of the opentravel Alliance, my job is to work with the board of directors on strategic direction of the organization, and oversee execution and day-to-day operations.
Where would you say distribution fits into the overall hotel management landscape? Why does distribution matter?
Without distribution, hotels would not have guests and we would all be out of a job. effective distribu-tion of hotel information and inventory is what gets guests in beds — it is the most important commercial function in a hotel.
What are the top 3 current issues that will have the greatest impact on hotel distribution in the next two to three years?
commissions and fees. the Gds’ and online travel agencies are under pressure from suppliers and regu-latory agencies regarding their pricing models and practices. this will create a lot of flux in the hotel industry in the next three years, and will definitely create some headaches for hoteliers until the dust settles.
understanding real costs of each channel. this can be a very murky area, especially for those proper-ties without a revenue management function. Fully analyzing all the cost components of a channel along with its return to the hotel requires some sophistica-tion and especially forbearance when working with multiple channels!
social media is here to stay, and will have a huge im-pact on distribution. hotels can no longer allow this function to be informal or unfocused — staff must be dedicated to this function.
What is the smartest move you have seen in hotel distribution (by someone other than your own organization)?
the smartest thing any hotel or hotel group can do is focus on their own hotel website and internet marketing. you are the best source of information on your property — why leave it to a third party to represent your property for you, especially when you have little control over presentation of information and images?
What is the smartest move your organization has made related to hotel distribution?
since our inception, opentravel has worked with all ‘links’ in the travel distribution supply chain — hotels, technology providers, and distributors. We believe this collaborative approach best serves the needs of all the players in the industry. Why? because guests have shown over the years they want to book where they want to book, and as an industry we have to work together to make our margins!
What is the single biggest oversight or misstep you have witnessed (in your own organization or others in hospitality) in the last two years?
hotels allowing third party access to lRA inventory. this cedes control to the third party and effectively strips the hotel of its ability to control inventory and pricing.
Valyn PerinioPentraVel allianCe
Ceo
InDUSTry PErSPECTIVE
>>
>>
>>
>>
>>
>>
>>
continued >>
Published by the hsMAi FoundAtion 145
What three things can you tell a hotel general manager, owner or asset manager about distribution that would have the greatest impact on unit level profit?
What is the next thing that you predict will disappear or gradually fade away that is currently a part of the distribution scene?
Allotments to wholesalers and tour operators. With more sophisticated technology in place on both sides, the burdens of annual allocations of inventory are unnecessary and hotels should push to get out of those contracts.
If you had a crystal ball, what emerging technolo-gies do you anticipate could be game changers, or at least have the greatest affect on the distribution landscape in the next two to three years?
Apple’s itravel platform, while still just a rumor, will probably become real and have a great impact on travel shopping and booking on hand-held devices.
social media remains a powerful inspiration and planning tool, but as players like Facebook figure out how to monetize inspiration and planning, look for them to go after more transaction-based functions, including booking.
More robust operational applications that are inter-net-native and cloud based. these have the potential to greatly reduce costs.
InDUSTry PErSPECTIVE
>>
>>
expend the effort to truly understand costs of each channel and return on investment per room of every distribution partner. in most cases today, hotels are losing money because they are allowing the distribution partner to dictate terms.
Focus on channel shift from third-party to brand.com to cut down on commissions and fees.
consider moving applications to the ‘cloud’ to cut down on software licensing and hardware costs.
Valyn PerinioPentraVel allianCe
Ceo
123
146 An Ah&lA And stR sPeciAl RePoRt
Published by the hsMAi FoundAtion 147
5Distribution Costs and Benefits
the cost to deliver a reservation to a hotel has grown dramati-
cally. besides reservation transaction costs, it is also necessary
to consider the cost to trigger the reservation. since many
hotels and hotel companies maintain a budget for operational
expenses (reservation delivery) separate from a budget for marketing
expenses (triggering the reservation), it can be problematic to deter-
mine actual distribution costs because these fees are often combined
when charged to a hotel.
Are search engine costs treated as a marketing fee or as one to facilitate the booking of direct reservations? Does the online travel agency (OTA) commission get charged as a reservation or a marketing expense (or is it even documented as a direct expense) on the P&L? How much should a hotel spend on each marketing channel and should it figure out a way to split out those operational costs from the marketing ones so that it can commit sufficient funding to accom-plish both? How can a hotel get the most “bang for the buck?”
There are many factors to consider when evalu-ating costs and benefits by channel such as direct and indirect reservation and marketing costs, as well as the potential value of each channel relative to marketing spend. There are also many ways to determine if costs incurred and invest-ments made are worthwhile. The case studies in this chapter are intended to provide an example of ways that business can be assessed using a composite of real data from various hotels. Each hotel would have to conduct these analyses using its own data to determine the best management action that applies to its own situation. Following are the types of analyses that are illustrated in this chapter:
4 commission costs for merchant and opaque business on the P&l statement.
4 Variable marketing and reservation fees by channel.
4 Analysis of conversion through direct channels (voice and the hotel’s website).
4 Revenue-to-cost ratios by marketing channel.
4 Ancillary spend analysis.
4 lifetime value analysis.
4 Flow-through analysis by channel.
ItEmIzIng commIssIon costs on thE p&l (mErchant and opaQuE modEl)
In order to conduct a cost comparison by channel, the reservation expense has to be clearly identi-fied. Connectivity fees from reservations vendors, switch fees, retail travel agency commissions and franchise or marketing fees that address distribution are all booked clearly as expenses to apply against the revenue they deliver. The cost of business delivered through the “merchant” model and the “opaque” model through the OTAs may prove difficult to track because it does not appear on a P&L statement. When a room is sold
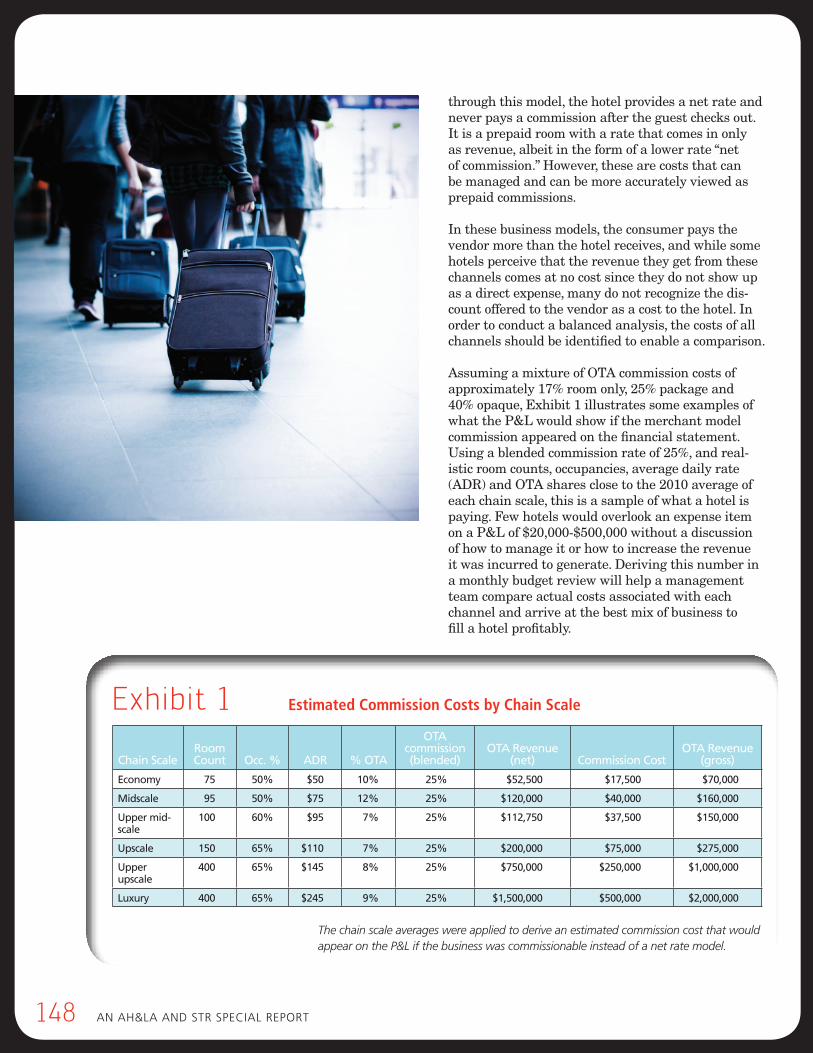
148 An Ah&lA And stR sPeciAl RePoRt
through this model, the hotel provides a net rate and never pays a commission after the guest checks out. It is a prepaid room with a rate that comes in only as revenue, albeit in the form of a lower rate “net of commission.” However, these are costs that can be managed and can be more accurately viewed as prepaid commissions.
In these business models, the consumer pays the vendor more than the hotel receives, and while some hotels perceive that the revenue they get from these channels comes at no cost since they do not show up as a direct expense, many do not recognize the dis-count offered to the vendor as a cost to the hotel. In order to conduct a balanced analysis, the costs of all channels should be identified to enable a comparison.
Assuming a mixture of OTA commission costs of approximately 17% room only, 25% package and 40% opaque, Exhibit 1 illustrates some examples of what the P&L would show if the merchant model commission appeared on the financial statement. Using a blended commission rate of 25%, and real-istic room counts, occupancies, average daily rate (ADR) and OTA shares close to the 2010 average of each chain scale, this is a sample of what a hotel is paying. Few hotels would overlook an expense item on a P&L of $20,000-$500,000 without a discussion of how to manage it or how to increase the revenue it was incurred to generate. Deriving this number in a monthly budget review will help a management team compare actual costs associated with each channel and arrive at the best mix of business to fill a hotel profitably.
note: these numbers are based on averages by chain scale for occupancy, adr and % ota business. the ota blended commission assumes a commission
of 17% room only, 25% package and 40% opaque.
Exhibit 1
chain scale
room count
occ. %
adr
% ota
ota commission (blended)
ota revenue
(net)
commission cost
ota revenue
(gross)
Economy 75 50% $50 10% 25% $52,500 $17,500 $70,000
midscale 95 50% $75 12% 25% $120,000 $40,000 $160,000
upper mid-scale
100 60% $95 7% 25% $112,750 $37,500 $150,000
upscale 150 65% $110 7% 25% $200,000 $75,000 $275,000
upper upscale
400 65% $145 8% 25% $750,000 $250,000 $1,000,000
luxury 400 65% $245 9% 25% $1,500,000 $500,000 $2,000,000
Estimated Commission Costs by Chain Scale
The chain scale averages were applied to derive an estimated commission cost that would appear on the P&L if the business was commissionable instead of a net rate model.
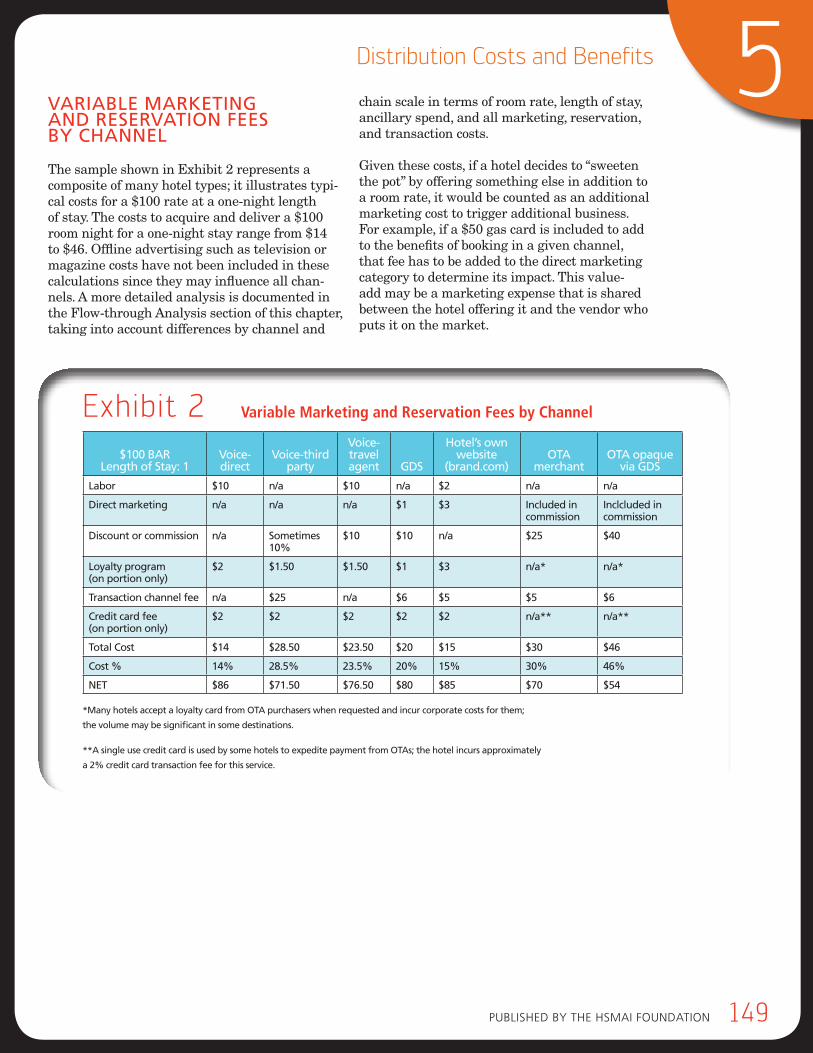
Published by the hsMAi FoundAtion 149
5Distribution Costs and Benefits
varIablE markEtIng and rEsErvatIon fEEs by channEl
The sample shown in Exhibit 2 represents a composite of many hotel types; it illustrates typi-cal costs for a $100 rate at a one-night length of stay. The costs to acquire and deliver a $100 room night for a one-night stay range from $14 to $46. Offline advertising such as television or magazine costs have not been included in these calculations since they may influence all chan-nels. A more detailed analysis is documented in the Flow-through Analysis section of this chapter, taking into account differences by channel and
chain scale in terms of room rate, length of stay, ancillary spend, and all marketing, reservation, and transaction costs.
Given these costs, if a hotel decides to “sweeten the pot” by offering something else in addition to a room rate, it would be counted as an additional marketing cost to trigger additional business. For example, if a $50 gas card is included to add to the benefits of booking in a given channel, that fee has to be added to the direct marketing category to determine its impact. This value-add may be a marketing expense that is shared between the hotel offering it and the vendor who puts it on the market.
Exhibit 2
*Many hotels accept a loyalty card from OTA purchasers when requested and incur corporate costs for them;
the volume may be significant in some destinations.
**a single use credit card is used by some hotels to expedite payment from otas; the hotel incurs approximately
a 2% credit card transaction fee for this service.
$100 bar
length of stay: 1
voice-direct
voice-third
party
voice- travel agent
gds
hotel’s own website
(brand.com)
ota
merchant
OTA opaque
via gds
labor $10 n/a $10 n/a $2 n/a n/a
direct marketing n/a n/a n/a $1 $3 Included in commission
Inclcluded in commission
discount or commission n/a sometimes 10%
$10 $10 n/a $25 $40
loyalty program (on portion only)
$2 $1.50 $1.50 $1 $3 n/a* n/a*
transaction channel fee n/a $25 n/a $6 $5 $5 $6
credit card fee (on portion only)
$2 $2 $2 $2 $2 n/a** n/a**
total cost $14 $28.50 $23.50 $20 $15 $30 $46
cost % 14% 28.5% 23.5% 20% 15% 30% 46%
nEt $86 $71.50 $76.50 $80 $85 $70 $54
Variable Marketing and reservation Fees by Channel
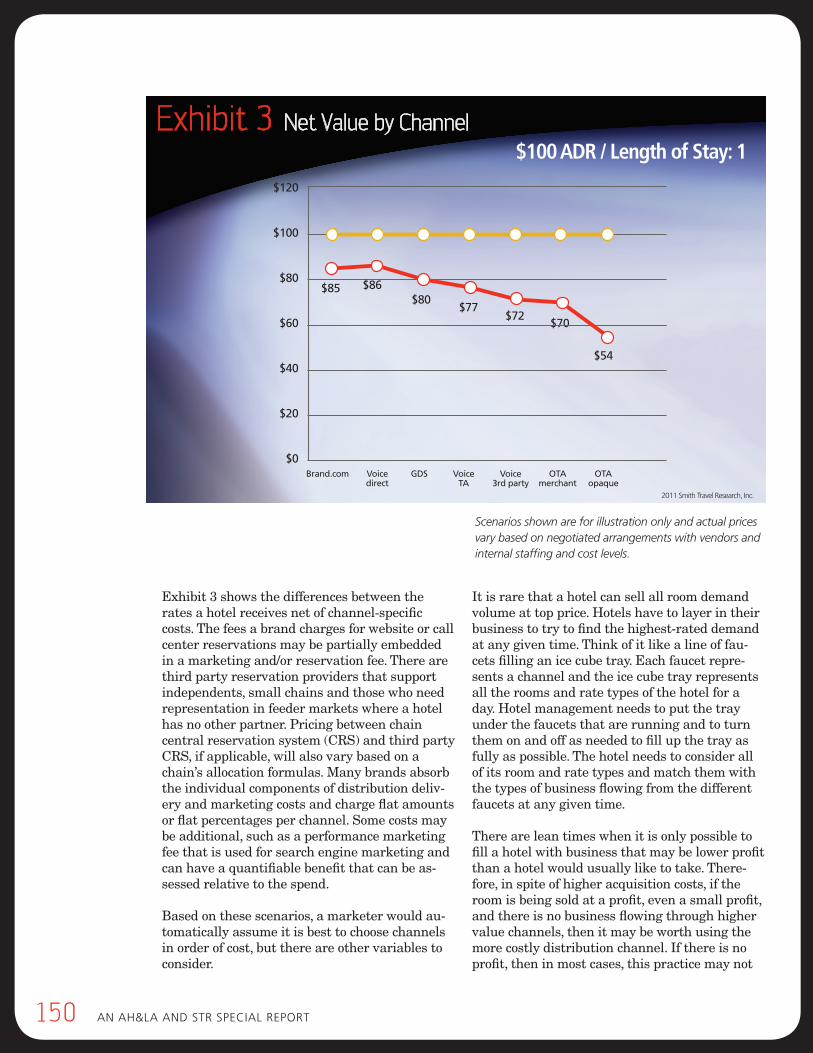
150 An Ah&lA And stR sPeciAl RePoRt
Exhibit 3 shows the differences between the rates a hotel receives net of channel-specific costs. The fees a brand charges for website or call center reservations may be partially embedded in a marketing and/or reservation fee. There are third party reservation providers that support independents, small chains and those who need representation in feeder markets where a hotel has no other partner. Pricing between chain central reservation system (CRS) and third party CRS, if applicable, will also vary based on a chain’s allocation formulas. Many brands absorb the individual components of distribution deliv-ery and marketing costs and charge flat amounts or flat percentages per channel. Some costs may be additional, such as a performance marketing fee that is used for search engine marketing and can have a quantifiable benefit that can be as-sessed relative to the spend.
Based on these scenarios, a marketer would au-tomatically assume it is best to choose channels in order of cost, but there are other variables to consider.
It is rare that a hotel can sell all room demand volume at top price. Hotels have to layer in their business to try to find the highest-rated demand at any given time. Think of it like a line of fau-cets filling an ice cube tray. Each faucet repre-sents a channel and the ice cube tray represents all the rooms and rate types of the hotel for a day. Hotel management needs to put the tray under the faucets that are running and to turn them on and off as needed to fill up the tray as fully as possible. The hotel needs to consider all of its room and rate types and match them with the types of business flowing from the different faucets at any given time.
There are lean times when it is only possible to fill a hotel with business that may be lower profit than a hotel would usually like to take. There-fore, in spite of higher acquisition costs, if the room is being sold at a profit, even a small profit, and there is no business flowing through higher value channels, then it may be worth using the more costly distribution channel. If there is no profit, then in most cases, this practice may not
2011 Smith Travel Research, Inc.
2009 2010 2011
$100 ADR / Length of Stay: 1Exhibit 3 Net Value by Channel
Brand.com Voice GDS Voice Voice OTA OTA direct TA 3rd party merchant opaque
$85 $86$80
$77$72
$70
$54
$120
$100
$80
$60
$40
$20
$0
Scenarios shown are for illustration only and actual prices vary based on negotiated arrangements with vendors and internal staffing and cost levels.
Published by the hsMAi FoundAtion 151
5Distribution Costs and Benefits
be worthwhile. It is management’s role to decide how many rooms should be available through each channel based on daily demand forecasting for each part of the week and each season of the year. If a hotel is obliged to sell through marginal channels during high demand times, in order to gain access to those channels during need periods, a cost/benefit analysis would be in order to assure management that there is a net benefit overall.
There are other times when a low-margin source of business can be worthwhile.
1. Create a base for compression if low margin room nights can be laid in early enough
to add to a base that creates a higher level of com-pression in the comp set of the hotel, then it can serve as a springboard to yield higher rates from other channels during the peak booking time. For example, if there is a way to stimulate low-rate paying custom-ers to book in the 21-40 day lead time window, then it can prove valuable to a hotel by pushing up rates for business booked within two weeks of the arrival date. Many hotels can make the mistake of using low-profit channels without regard for lead time and end up fill-ing in with low rates closer to arrival; this contributes to the impression by consumers in the marketplace that you can get a better rate if you wait until the last minute. this behavior has been reinforced by media messaging where waiting for a lower last minute rate is the explicit theme (see online Marketing and con-sumer behavior chapter for examples). traditionally, hotels would be best served by booking their lower rated business further out so they can push rates up closer to arrival when demand is likely to be highest. if a hotel takes lower rated business earlier for fear it won’t fill, and then offers last-minute low rates in the last week or two before arrival there can be two outcomes, both of which may contribute to slug-gish AdR growth: (1) the percentage of higher rated business will decline overall and (2) travelers learn that waiting can guarantee lower rates so the consumer is less inclined to book early even when lower rates are available.
2. Bring business you cannot bring yourself Assuming the rates yield a contribution to profit, low-
margin business is worthwhile if the hotel benefits from a valuable market it is not capable of tapping it-self, either due to technical issues or access. if it diverts business that would come otherwise through a hotel’s own website or call center, then it may not be worth
incurring a higher cost. however, as an example, for those hotels in a market that is attractive to interna-tional feeder markets, or to fly-in markets in which air/hotel packaging is a major source of demand, then those channels specializing in packaging, such as otAs, can be a valuable channels of choice, provided there is no feasible alternative to getting that business through a higher margin channel.
3. When ancillary spend is high For hotels with strong potential for ancillary spending
beyond the room rate, (i.e., revenue centers such as parking, premium internet services, golf), and that ancillary spend carries a high profit margin, the full benefit of that booking should be considered when evaluating the business. even if the contribution to profit from the room rate is small, if the ancillary spend yields a substantial profit contribution, then low margin business can be an attractive option for a hotel. however, it should be compared to alternatives to determine if it is still more beneficial than other demand streams available in the same time period.
4. Hit the threshold some hotel brands set threshold occupancy levels that
trip a premium in reimbursement to hotels for loyalty point redemption. When a hotel is near that threshold (e.g., 95% occupancy), it chooses to top off and hit that mark by taking the lower rated and marginally profitable business, often through the otA channel, in order to qualify for the much higher reimbursement from the brand loyalty program. Feeling like a game of “whack-a-mole,” where a wide range of demand may pop up in a few channels given a busy period in a particular market, this short-term quick fill may sometimes be a diversion of bookings that would have come through brand.com. but, being a quick fix and a reliable way to siphon off any last-minute demand coming into a market by the hotel that wants to hit the threshold, it works.
5. fill a hole When a large group cancels or a citywide event does
not fill a hotel as expected, the mass marketing benefit of the otA can be highly effective at plugging those holes for a given hotel, especially when they are unexpected and/or offer little lead time to launch other marketing initiatives to a large audience. the third party sites are adept at share shifting and one needy hotel may turn on the spigot that will direct much of the demand for a comp set to it during these need periods.
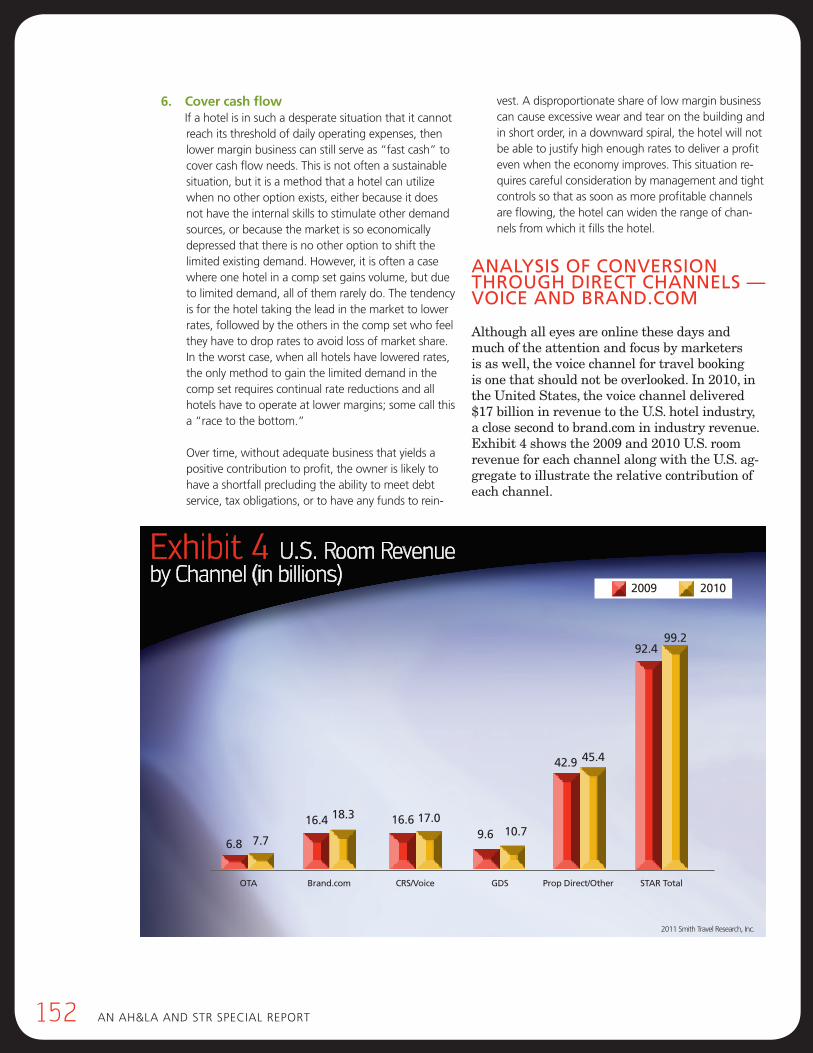
152 An Ah&lA And stR sPeciAl RePoRt
6. Cover cash flow if a hotel is in such a desperate situation that it cannot
reach its threshold of daily operating expenses, then lower margin business can still serve as “fast cash” to cover cash flow needs. this is not often a sustainable situation, but it is a method that a hotel can utilize when no other option exists, either because it does not have the internal skills to stimulate other demand sources, or because the market is so economically depressed that there is no other option to shift the limited existing demand. however, it is often a case where one hotel in a comp set gains volume, but due to limited demand, all of them rarely do. the tendency is for the hotel taking the lead in the market to lower rates, followed by the others in the comp set who feel they have to drop rates to avoid loss of market share. in the worst case, when all hotels have lowered rates, the only method to gain the limited demand in the comp set requires continual rate reductions and all hotels have to operate at lower margins; some call this a “race to the bottom.” over time, without adequate business that yields a positive contribution to profit, the owner is likely to have a shortfall precluding the ability to meet debt service, tax obligations, or to have any funds to rein-
vest. A disproportionate share of low margin business can cause excessive wear and tear on the building and in short order, in a downward spiral, the hotel will not be able to justify high enough rates to deliver a profit even when the economy improves. this situation re-quires careful consideration by management and tight controls so that as soon as more profitable channels are flowing, the hotel can widen the range of chan-nels from which it fills the hotel.
analysIs of convErsIon through dIrEct channEls —voIcE and brand.com
Although all eyes are online these days and much of the attention and focus by marketers is as well, the voice channel for travel booking is one that should not be overlooked. In 2010, in the United States, the voice channel delivered $17 billion in revenue to the U.S. hotel industry, a close second to brand.com in industry revenue. Exhibit 4 shows the 2009 and 2010 U.S. room revenue for each channel along with the U.S. ag-gregate to illustrate the relative contribution of each channel.
2011 Smith Travel Research, Inc.
2009 2010
OTA Brand.com CRS/Voice GDS Prop Direct/Other STAR Total
6.8 7.7
16.4 18.3 16.6 17.09.6 10.7
42.9 45.4
92.499.2
Exhibit 4 U.S. Room Revenue by Channel (in billions)
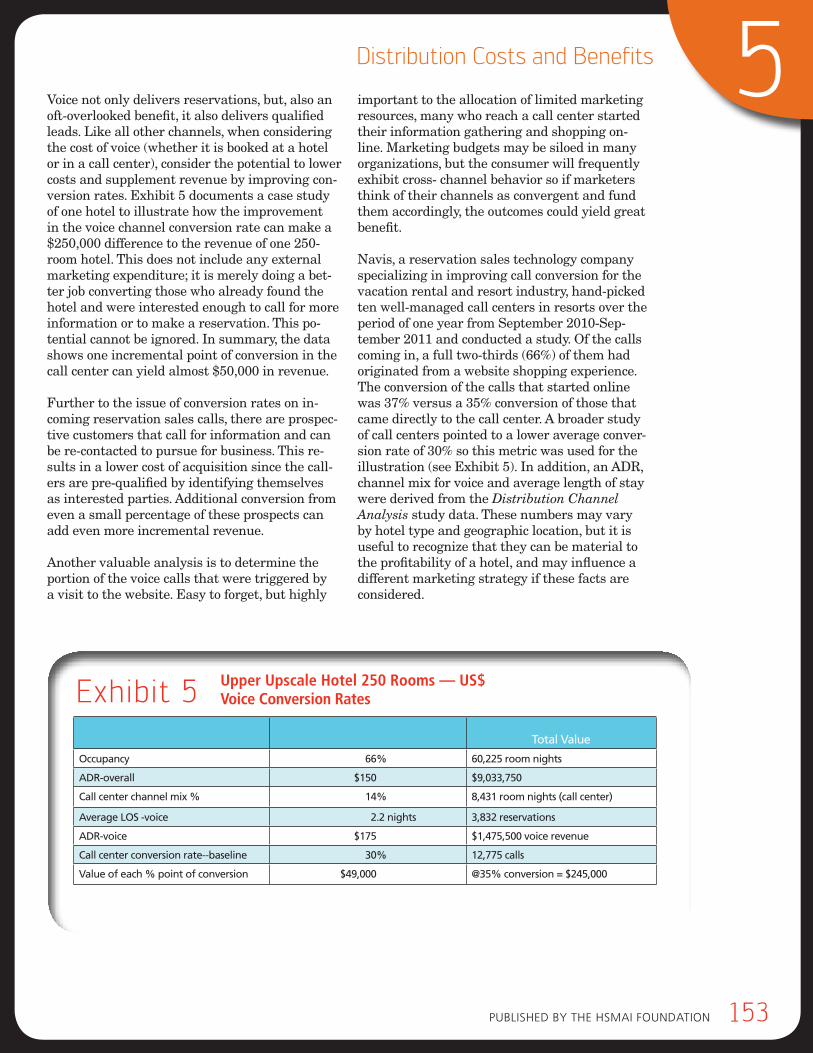
Published by the hsMAi FoundAtion 153
5Distribution Costs and Benefits
Voice not only delivers reservations, but, also an oft-overlooked benefit, it also delivers qualified leads. Like all other channels, when considering the cost of voice (whether it is booked at a hotel or in a call center), consider the potential to lower costs and supplement revenue by improving con-version rates. Exhibit 5 documents a case study of one hotel to illustrate how the improvement in the voice channel conversion rate can make a $250,000 difference to the revenue of one 250-room hotel. This does not include any external marketing expenditure; it is merely doing a bet-ter job converting those who already found the hotel and were interested enough to call for more information or to make a reservation. This po-tential cannot be ignored. In summary, the data shows one incremental point of conversion in the call center can yield almost $50,000 in revenue.
Further to the issue of conversion rates on in-coming reservation sales calls, there are prospec-tive customers that call for information and can be re-contacted to pursue for business. This re-sults in a lower cost of acquisition since the call-ers are pre-qualified by identifying themselves as interested parties. Additional conversion from even a small percentage of these prospects can add even more incremental revenue.
Another valuable analysis is to determine the portion of the voice calls that were triggered by a visit to the website. Easy to forget, but highly
important to the allocation of limited marketing resources, many who reach a call center started their information gathering and shopping on-line. Marketing budgets may be siloed in many organizations, but the consumer will frequently exhibit cross- channel behavior so if marketers think of their channels as convergent and fund them accordingly, the outcomes could yield great benefit.
Navis, a reservation sales technology company specializing in improving call conversion for the vacation rental and resort industry, hand-picked ten well-managed call centers in resorts over the period of one year from September 2010-Sep-tember 2011 and conducted a study. Of the calls coming in, a full two-thirds (66%) of them had originated from a website shopping experience. The conversion of the calls that started online was 37% versus a 35% conversion of those that came directly to the call center. A broader study of call centers pointed to a lower average conver-sion rate of 30% so this metric was used for the illustration (see Exhibit 5). In addition, an ADR, channel mix for voice and average length of stay were derived from the Distribution Channel Analysis study data. These numbers may vary by hotel type and geographic location, but it is useful to recognize that they can be material to the profitability of a hotel, and may influence a different marketing strategy if these facts are considered.
total value
occupancy 66% 60,225 room nights
adr-overall $150 $9,033,750
call center channel mix % 14% 8,431 room nights (call center)
average los -voice 2.2 nights 3,832 reservations
adr-voice $175 $1,475,500 voice revenue
call center conversion rate--baseline 30% 12,775 calls
value of each % point of conversion $49,000 @35% conversion = $245,000
Upper Upscale Hotel 250 rooms — US$Voice Conversion ratesExhibit 5
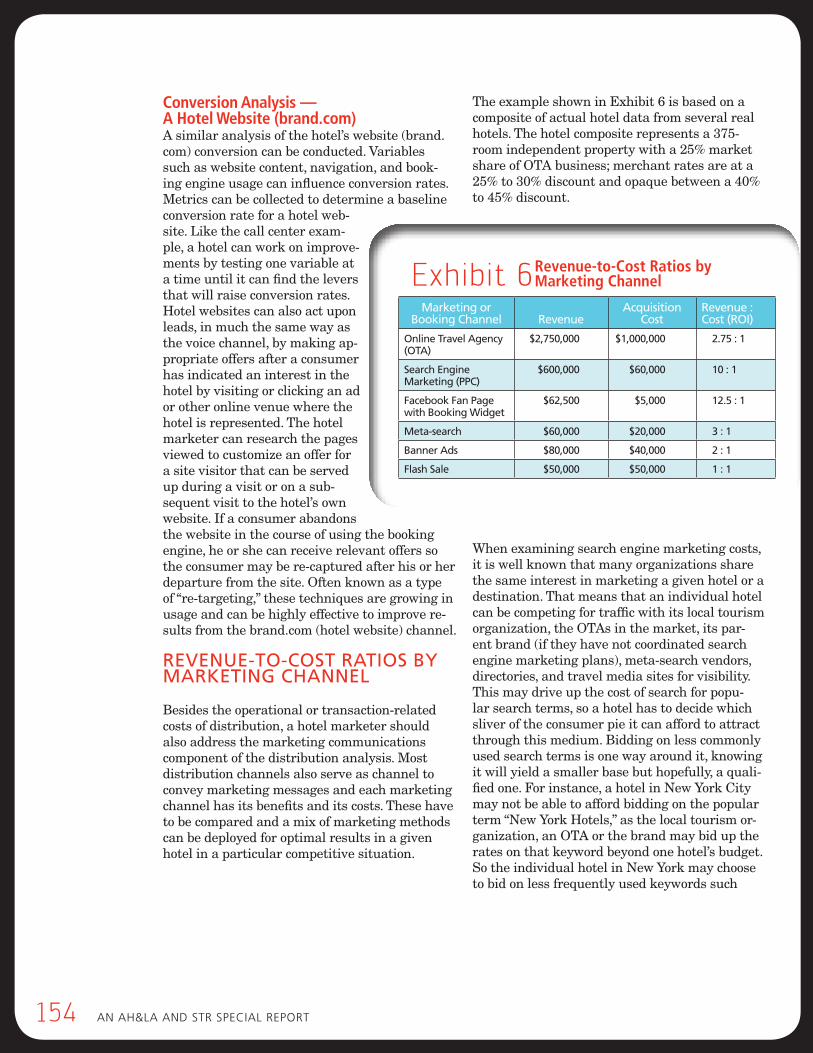
154 An Ah&lA And stR sPeciAl RePoRt
Conversion Analysis — A Hotel Website (brand.com)A similar analysis of the hotel’s website (brand.com) conversion can be conducted. Variables such as website content, navigation, and book-ing engine usage can influence conversion rates. Metrics can be collected to determine a baseline conversion rate for a hotel web-site. Like the call center exam-ple, a hotel can work on improve-ments by testing one variable at a time until it can find the levers that will raise conversion rates. Hotel websites can also act upon leads, in much the same way as the voice channel, by making ap-propriate offers after a consumer has indicated an interest in the hotel by visiting or clicking an ad or other online venue where the hotel is represented. The hotel marketer can research the pages viewed to customize an offer for a site visitor that can be served up during a visit or on a sub-sequent visit to the hotel’s own website. If a consumer abandons the website in the course of using the booking engine, he or she can receive relevant offers so the consumer may be re-captured after his or her departure from the site. Often known as a type of “re-targeting,” these techniques are growing in usage and can be highly effective to improve re-sults from the brand.com (hotel website) channel.
rEvEnuE-to-cost ratIos by markEtIng channEl
Besides the operational or transaction-related costs of distribution, a hotel marketer should also address the marketing communications component of the distribution analysis. Most distribution channels also serve as channel to convey marketing messages and each marketing channel has its benefits and its costs. These have to be compared and a mix of marketing methods can be deployed for optimal results in a given hotel in a particular competitive situation.
The example shown in Exhibit 6 is based on a composite of actual hotel data from several real hotels. The hotel composite represents a 375-room independent property with a 25% market share of OTA business; merchant rates are at a 25% to 30% discount and opaque between a 40% to 45% discount.
When examining search engine marketing costs, it is well known that many organizations share the same interest in marketing a given hotel or a destination. That means that an individual hotel can be competing for traffic with its local tourism organization, the OTAs in the market, its par-ent brand (if they have not coordinated search engine marketing plans), meta-search vendors, directories, and travel media sites for visibility. This may drive up the cost of search for popu-lar search terms, so a hotel has to decide which sliver of the consumer pie it can afford to attract through this medium. Bidding on less commonly used search terms is one way around it, knowing it will yield a smaller base but hopefully, a quali-fied one. For instance, a hotel in New York City may not be able to afford bidding on the popular term “New York Hotels,” as the local tourism or-ganization, an OTA or the brand may bid up the rates on that keyword beyond one hotel’s budget. So the individual hotel in New York may choose to bid on less frequently used keywords such
marketing or booking channel
revenue
Acquisition cost
revenue : cost (roI)
online travel agency (ota)
$2,750,000 $1,000,000 2.75 : 1
search Engine marketing (ppc)
$600,000 $60,000 10 : 1
facebook fan page with booking widget
$62,500 $5,000 12.5 : 1
meta-search $60,000 $20,000 3 : 1
banner ads $80,000 $40,000 2 : 1
flash sale $50,000 $50,000 1 : 1
Exhibit 6 revenue-to-Cost ratios by Marketing Channel
Published by the hsMAi FoundAtion 155
5Distribution Costs and Benefits
as its own hotel name, an event occurring in its neighborhood, or a nearby attraction.
Competing directly with national vendors is rarely a winnable strategy for an individual hotel so it has to accept that a portion of the demand coming into its market will be re-routed or diverted through a third party channel. Many hotels have agreements with third parties such as OTAs, tourism organizations, or directories prohibiting the third parties from bidding on the hotel name, or variations on it, which is consid-ered a “branded search term.” Hotels should be aware of who may be bidding on their branded terms and ensure that any infringement on this is discontinued immediately.
What is the right mix of marketing channels for each hotel? What is a reasonable blended reve-nue-to-cost ratio? Many would argue that search engine marketing using a pay-per-click (PPC) model should yield at least $8 or $10 for every $1 spent (although this benchmark varies widely between branded and unbranded terms). What can a hotel achieve in terms of its marketing ef-ficiency? Does every hotel calculate its marketing results in this way in order to set priorities and make decisions about future resource allocation? What options exist and what blend of market-ing channels will bring the right customer and achieve a hotel’s objectives?
There are many marketing channels, each of which has it’s own media opportunities, costs, and benefits. The hotel has to test those that trigger demand flow to the hotel and calculate the benefits by day of week and season so that it is building the best combination for its competi-tive situation. Some channels are new and may take time to start sending business. Some may be better during particular days of the week, or for specific seasons. All of the many combina-tions have to be analyzed so that the hotel can take advantage of its opportunities and spend its marketing resources most effectively.
Each hotel can undertake a similar analysis of all of its marketing channels to determine the mix that is most productive for its particular market situation and continue to monitor these costs on at least a monthly basis.
ancIllary spEnd analysIsAncillary revenue opportunities are well known in resorts such as spa, golf, food and beverage, retail, recreation, premium Internet, or other potentially profitable revenue centers, and can more than double revenue and profit. Of course, the gaming market and others with high profit-margin specialties such as golf or skiing have a similar focus on generating revenue from sources other than guest rooms.
While not all hotels have multiple revenue streams, those in the higher rated chain scales often have more options to supplement income in this way. The spending levels vary dramatically by channel and by segment. Many hotels do not track ancillary spend or retention by channel or segment, either due to technical limitations, system configuration or because they had not thought about it. If a marketer is to determine the full value of a channel and/or segment, especially if ancillary revenue has high profit margins, these revenue streams must be factored into the value equation when deciding priorities in allotting inventory and investing marketing resources. The implications for distribution chan-nels will include the assessment of each channel in terms of ancillary contribution and, also, the ability of each channel to support the sale of ancillary products and services.
For those who are in a limited service property with fewer revenue enhancements available, it is worth reviewing less traditional options. In a world where airlines are now successfully gen-erating ancillary revenue with seat placement, blanket/pillow sets, carry-on bags and snacks, it seems travelers will not be surprised to get offers
thE ImplIcatIons for dIstrIbutIon
channEls wIll IncludE thE assEssmEnt
of Each channEl In tErms of ancIllary
contrIbutIon and, also, thE abIlIty of
Each channEl to support thE salE of
ancIllary products and sErvIcEs.
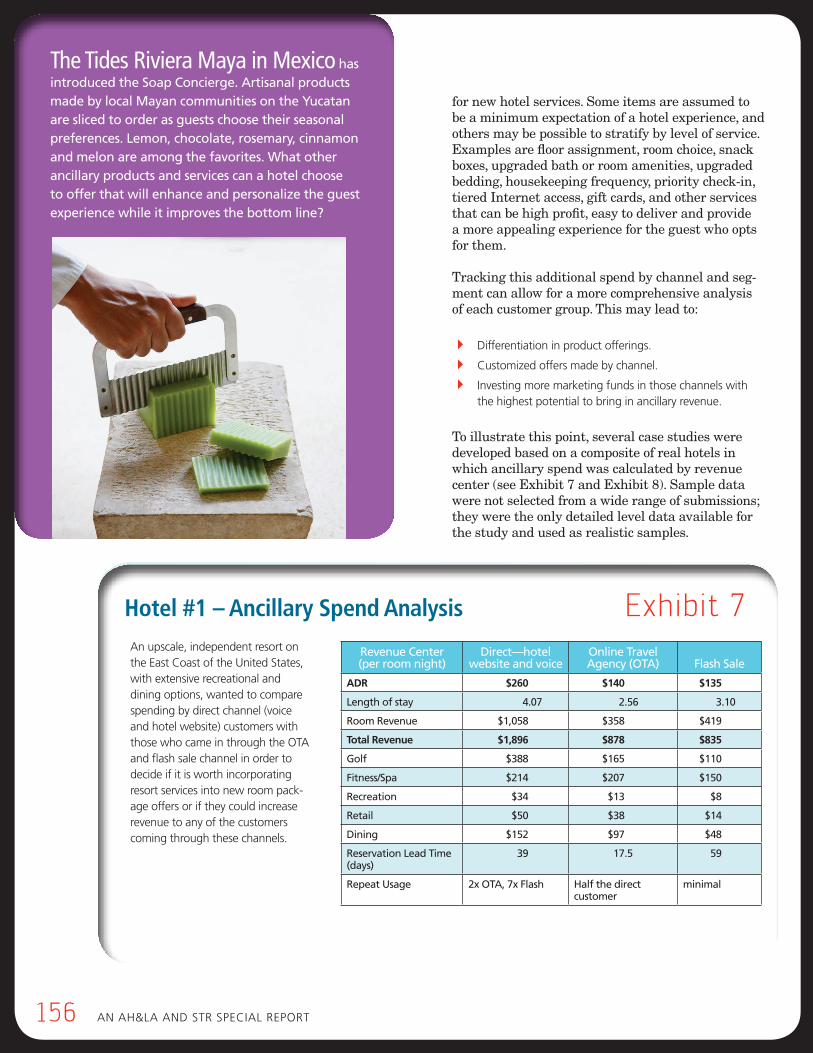
156 An Ah&lA And stR sPeciAl RePoRt
for new hotel services. Some items are assumed to be a minimum expectation of a hotel experience, and others may be possible to stratify by level of service. Examples are floor assignment, room choice, snack boxes, upgraded bath or room amenities, upgraded bedding, housekeeping frequency, priority check-in, tiered Internet access, gift cards, and other services that can be high profit, easy to deliver and provide a more appealing experience for the guest who opts for them. Tracking this additional spend by channel and seg-ment can allow for a more comprehensive analysis of each customer group. This may lead to:
4 differentiation in product offerings.
4 customized offers made by channel.
4 investing more marketing funds in those channels with the highest potential to bring in ancillary revenue.
To illustrate this point, several case studies were developed based on a composite of real hotels in which ancillary spend was calculated by revenue center (see Exhibit 7 and Exhibit 8). Sample data were not selected from a wide range of submissions; they were the only detailed level data available for the study and used as realistic samples.
The Tides riviera Maya in Mexico has introduced the soap concierge. artisanal products made by local mayan communities on the yucatan are sliced to order as guests choose their seasonal preferences. lemon, chocolate, rosemary, cinnamon and melon are among the favorites. what other ancillary products and services can a hotel choose to offer that will enhance and personalize the guest experience while it improves the bottom line?
An upscale, independent resort on the east coast of the united states, with extensive recreational and dining options, wanted to compare spending by direct channel (voice and hotel website) customers with those who came in through the otA and flash sale channel in order to decide if it is worth incorporating resort services into new room pack-age offers or if they could increase revenue to any of the customers coming through these channels.
revenue center(per room night)
direct—hotel website and voice
online travel agency (ota)
flash sale
AdR $260 $140 $135
length of stay 4.07 2.56 3.10
room revenue $1,058 $358 $419
Total Revenue $1,896 $878 $835
golf $388 $165 $110
fitness/spa $214 $207 $150
recreation $34 $13 $8
retail $50 $38 $14
dining $152 $97 $48
reservation lead time (days)
39 17.5 59
repeat usage 2x ota, 7x flash half the direct customer
minimal
Exhibit 7Hotel #1 – Ancillary Spend Analysis
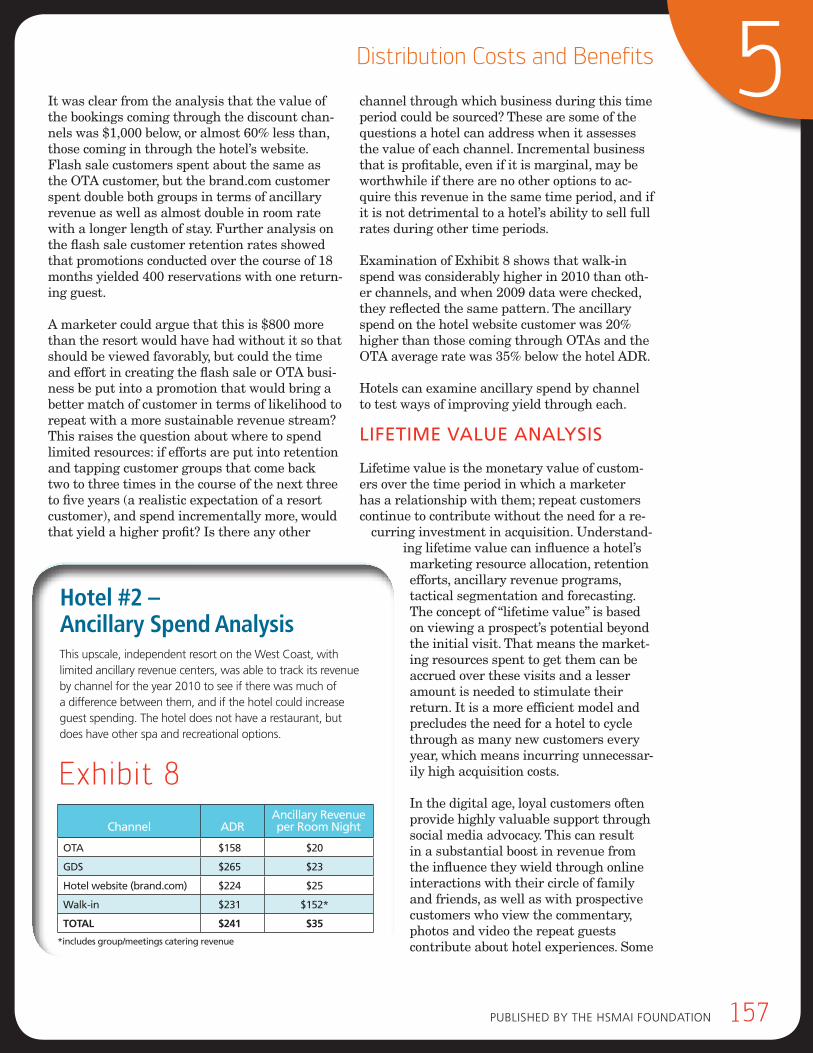
Published by the hsMAi FoundAtion 157
5Distribution Costs and Benefits
It was clear from the analysis that the value of the bookings coming through the discount chan-nels was $1,000 below, or almost 60% less than, those coming in through the hotel’s website. Flash sale customers spent about the same as the OTA customer, but the brand.com customer spent double both groups in terms of ancillary revenue as well as almost double in room rate with a longer length of stay. Further analysis on the flash sale customer retention rates showed that promotions conducted over the course of 18 months yielded 400 reservations with one return-ing guest.
A marketer could argue that this is $800 more than the resort would have had without it so that should be viewed favorably, but could the time and effort in creating the flash sale or OTA busi-ness be put into a promotion that would bring a better match of customer in terms of likelihood to repeat with a more sustainable revenue stream? This raises the question about where to spend limited resources: if efforts are put into retention and tapping customer groups that come back two to three times in the course of the next three to five years (a realistic expectation of a resort customer), and spend incrementally more, would that yield a higher profit? Is there any other
channel through which business during this time period could be sourced? These are some of the questions a hotel can address when it assesses the value of each channel. Incremental business that is profitable, even if it is marginal, may be worthwhile if there are no other options to ac-quire this revenue in the same time period, and if it is not detrimental to a hotel’s ability to sell full rates during other time periods.
Examination of Exhibit 8 shows that walk-in spend was considerably higher in 2010 than oth-er channels, and when 2009 data were checked, they reflected the same pattern. The ancillary spend on the hotel website customer was 20% higher than those coming through OTAs and the OTA average rate was 35% below the hotel ADR.
Hotels can examine ancillary spend by channel to test ways of improving yield through each.
lIfEtImE valuE analysIs
Lifetime value is the monetary value of custom-ers over the time period in which a marketer has a relationship with them; repeat customers continue to contribute without the need for a re-
curring investment in acquisition. Understand-ing lifetime value can influence a hotel’s marketing resource allocation, retention efforts, ancillary revenue programs, tactical segmentation and forecasting. The concept of “lifetime value” is based on viewing a prospect’s potential beyond the initial visit. That means the market-ing resources spent to get them can be accrued over these visits and a lesser amount is needed to stimulate their return. It is a more efficient model and precludes the need for a hotel to cycle through as many new customers every year, which means incurring unnecessar-ily high acquisition costs. In the digital age, loyal customers often provide highly valuable support through social media advocacy. This can result in a substantial boost in revenue from the influence they wield through online interactions with their circle of family and friends, as well as with prospective customers who view the commentary, photos and video the repeat guests contribute about hotel experiences. Some
Hotel #2 – Ancillary Spend Analysis
channel
adr
ancillary revenue per room night
ota $158 $20
gds $265 $23
hotel website (brand.com) $224 $25
walk-in $231 $152*
TOTAl $241 $35
*includes group/meetings catering revenue
Exhibit 8
this upscale, independent resort on the West coast, with limited ancillary revenue centers, was able to track its revenue by channel for the year 2010 to see if there was much of a difference between them, and if the hotel could increase guest spending. the hotel does not have a restaurant, but does have other spa and recreational options.
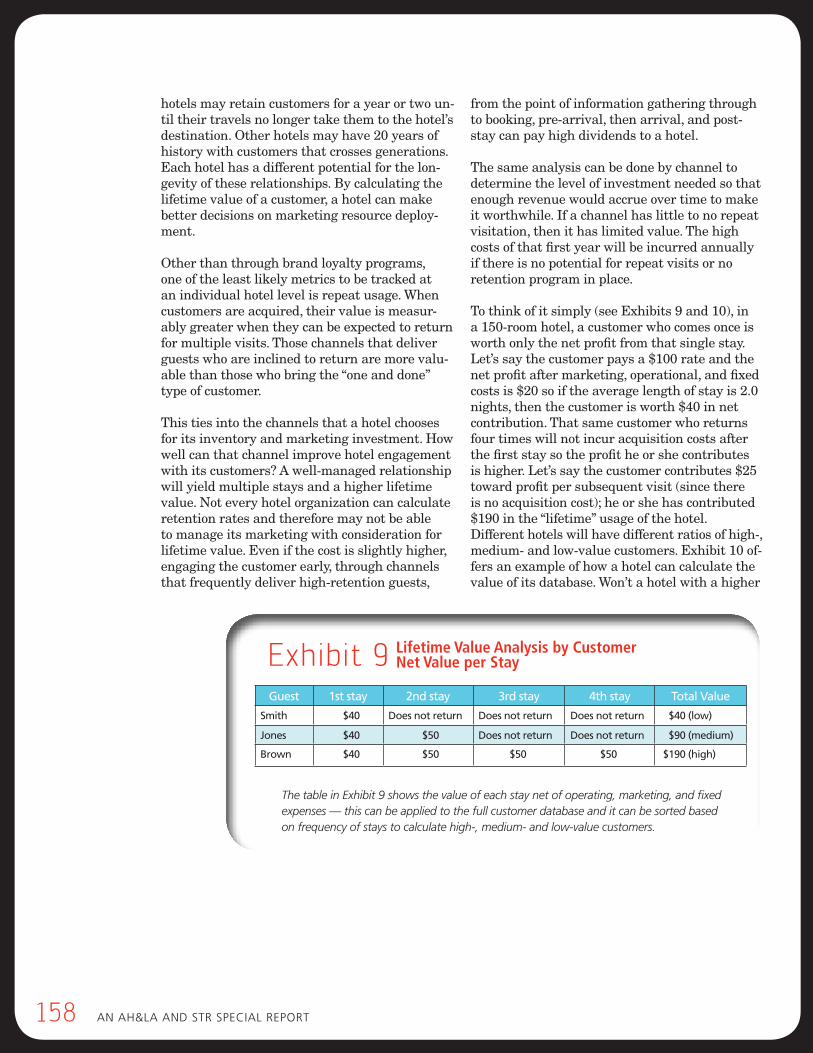
158 An Ah&lA And stR sPeciAl RePoRt
Exhibit 9
hotels may retain customers for a year or two un-til their travels no longer take them to the hotel’s destination. Other hotels may have 20 years of history with customers that crosses generations. Each hotel has a different potential for the lon-gevity of these relationships. By calculating the lifetime value of a customer, a hotel can make better decisions on marketing resource deploy-ment.
Other than through brand loyalty programs, one of the least likely metrics to be tracked at an individual hotel level is repeat usage. When customers are acquired, their value is measur-ably greater when they can be expected to return for multiple visits. Those channels that deliver guests who are inclined to return are more valu-able than those who bring the “one and done” type of customer.
This ties into the channels that a hotel chooses for its inventory and marketing investment. How well can that channel improve hotel engagement with its customers? A well-managed relationship will yield multiple stays and a higher lifetime value. Not every hotel organization can calculate retention rates and therefore may not be able to manage its marketing with consideration for lifetime value. Even if the cost is slightly higher, engaging the customer early, through channels that frequently deliver high-retention guests,
from the point of information gathering through to booking, pre-arrival, then arrival, and post-stay can pay high dividends to a hotel.
The same analysis can be done by channel to determine the level of investment needed so that enough revenue would accrue over time to make it worthwhile. If a channel has little to no repeat visitation, then it has limited value. The high costs of that first year will be incurred annually if there is no potential for repeat visits or no retention program in place.
To think of it simply (see Exhibits 9 and 10), in a 150-room hotel, a customer who comes once is worth only the net profit from that single stay. Let’s say the customer pays a $100 rate and the net profit after marketing, operational, and fixed costs is $20 so if the average length of stay is 2.0 nights, then the customer is worth $40 in net contribution. That same customer who returns four times will not incur acquisition costs after the first stay so the profit he or she contributes is higher. Let’s say the customer contributes $25 toward profit per subsequent visit (since there is no acquisition cost); he or she has contributed $190 in the “lifetime” usage of the hotel. Different hotels will have different ratios of high-, medium- and low-value customers. Exhibit 10 of-fers an example of how a hotel can calculate the value of its database. Won’t a hotel with a higher
guest 1st stay 2nd stay 3rd stay 4th stay total value
smith $40 does not return does not return does not return $40 (low)
jones $40 $50 does not return does not return $90 (medium)
brown $40 $50 $50 $50 $190 (high)
The table in Exhibit 9 shows the value of each stay net of operating, marketing, and fixed expenses — this can be applied to the full customer database and it can be sorted based on frequency of stays to calculate high-, medium- and low-value customers.
lifetime Value Analysis by Customer net Value per Stay
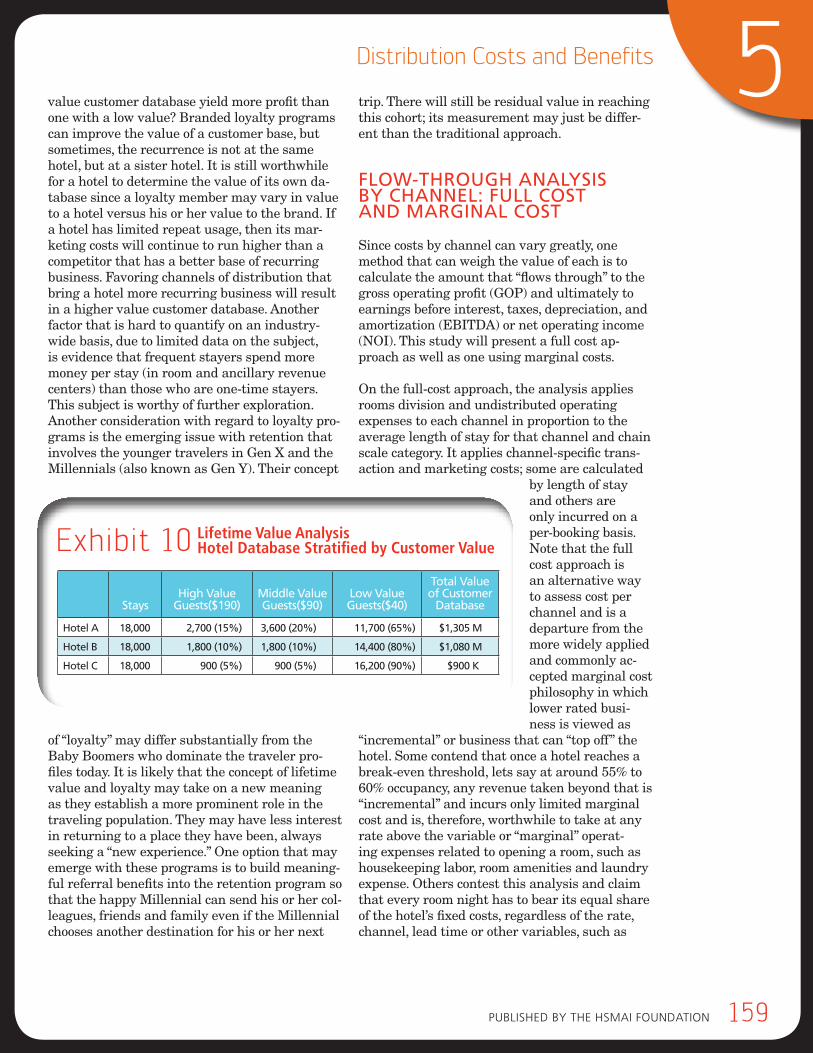
Published by the hsMAi FoundAtion 159
5Distribution Costs and Benefits
value customer database yield more profit than one with a low value? Branded loyalty programs can improve the value of a customer base, but sometimes, the recurrence is not at the same hotel, but at a sister hotel. It is still worthwhile for a hotel to determine the value of its own da-tabase since a loyalty member may vary in value to a hotel versus his or her value to the brand. If a hotel has limited repeat usage, then its mar-keting costs will continue to run higher than a competitor that has a better base of recurring business. Favoring channels of distribution that bring a hotel more recurring business will result in a higher value customer database. Another factor that is hard to quantify on an industry-wide basis, due to limited data on the subject, is evidence that frequent stayers spend more money per stay (in room and ancillary revenue centers) than those who are one-time stayers. This subject is worthy of further exploration.Another consideration with regard to loyalty pro-grams is the emerging issue with retention that involves the younger travelers in Gen X and the Millennials (also known as Gen Y). Their concept
of “loyalty” may differ substantially from the Baby Boomers who dominate the traveler pro-files today. It is likely that the concept of lifetime value and loyalty may take on a new meaning as they establish a more prominent role in the traveling population. They may have less interest in returning to a place they have been, always seeking a “new experience.” One option that may emerge with these programs is to build meaning-ful referral benefits into the retention program so that the happy Millennial can send his or her col-leagues, friends and family even if the Millennial chooses another destination for his or her next
trip. There will still be residual value in reaching this cohort; its measurement may just be differ-ent than the traditional approach.
flow-through analysIs by channEl: full cost and margInal cost
Since costs by channel can vary greatly, one method that can weigh the value of each is to calculate the amount that “flows through” to the gross operating profit (GOP) and ultimately to earnings before interest, taxes, depreciation, and amortization (EBITDA) or net operating income (NOI). This study will present a full cost ap-proach as well as one using marginal costs.
On the full-cost approach, the analysis applies rooms division and undistributed operating expenses to each channel in proportion to the average length of stay for that channel and chain scale category. It applies channel-specific trans-action and marketing costs; some are calculated
by length of stay and others are only incurred on a per-booking basis. Note that the full cost approach is an alternative way to assess cost per channel and is a departure from the more widely applied and commonly ac-cepted marginal cost philosophy in which lower rated busi-ness is viewed as
“incremental” or business that can “top off” the hotel. Some contend that once a hotel reaches a break-even threshold, lets say at around 55% to 60% occupancy, any revenue taken beyond that is “incremental” and incurs only limited marginal cost and is, therefore, worthwhile to take at any rate above the variable or “marginal” operat-ing expenses related to opening a room, such as housekeeping labor, room amenities and laundry expense. Others contest this analysis and claim that every room night has to bear its equal share of the hotel’s fixed costs, regardless of the rate, channel, lead time or other variables, such as
stayshigh value
guests($190)middle value guests($90)
low value guests($40)
total value of customer
database
hotel a 18,000 2,700 (15%) 3,600 (20%) 11,700 (65%) $1,305 m
hotel b 18,000 1,800 (10%) 1,800 (10%) 14,400 (80%) $1,080 m
hotel c 18,000 900 (5%) 900 (5%) 16,200 (90%) $900 k
Exhibit 10 lifetime Value Analysis Hotel Database Stratified by Customer Value
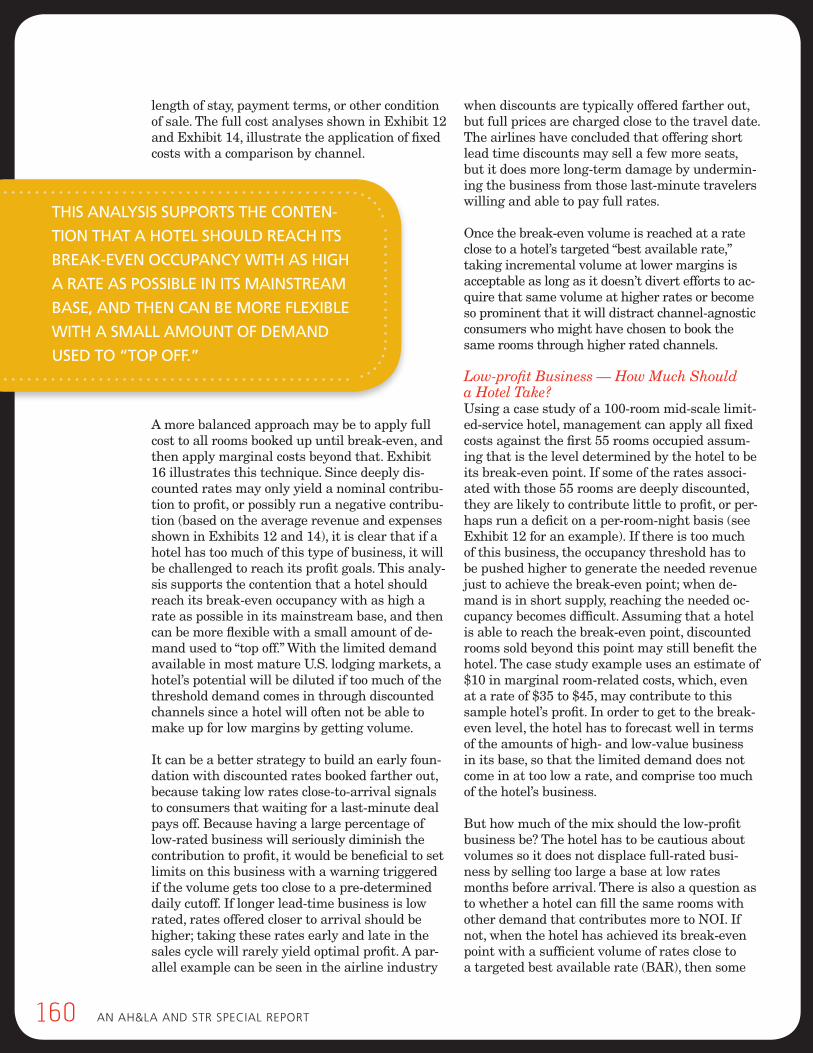
160 An Ah&lA And stR sPeciAl RePoRt
length of stay, payment terms, or other condition of sale. The full cost analyses shown in Exhibit 12 and Exhibit 14, illustrate the application of fixed costs with a comparison by channel.
A more balanced approach may be to apply full cost to all rooms booked up until break-even, and then apply marginal costs beyond that. Exhibit 16 illustrates this technique. Since deeply dis-counted rates may only yield a nominal contribu-tion to profit, or possibly run a negative contribu-tion (based on the average revenue and expenses shown in Exhibits 12 and 14), it is clear that if a hotel has too much of this type of business, it will be challenged to reach its profit goals. This analy-sis supports the contention that a hotel should reach its break-even occupancy with as high a rate as possible in its mainstream base, and then can be more flexible with a small amount of de-mand used to “top off.” With the limited demand available in most mature U.S. lodging markets, a hotel’s potential will be diluted if too much of the threshold demand comes in through discounted channels since a hotel will often not be able to make up for low margins by getting volume.
It can be a better strategy to build an early foun-dation with discounted rates booked farther out, because taking low rates close-to-arrival signals to consumers that waiting for a last-minute deal pays off. Because having a large percentage of low-rated business will seriously diminish the contribution to profit, it would be beneficial to set limits on this business with a warning triggered if the volume gets too close to a pre-determined daily cutoff. If longer lead-time business is low rated, rates offered closer to arrival should be higher; taking these rates early and late in the sales cycle will rarely yield optimal profit. A par-allel example can be seen in the airline industry
when discounts are typically offered farther out, but full prices are charged close to the travel date. The airlines have concluded that offering short lead time discounts may sell a few more seats, but it does more long-term damage by undermin-ing the business from those last-minute travelers willing and able to pay full rates.
Once the break-even volume is reached at a rate close to a hotel’s targeted “best available rate,” taking incremental volume at lower margins is acceptable as long as it doesn’t divert efforts to ac-quire that same volume at higher rates or become so prominent that it will distract channel-agnostic consumers who might have chosen to book the same rooms through higher rated channels.
Low-profit Business — How Much Should a Hotel Take?Using a case study of a 100-room mid-scale limit-ed-service hotel, management can apply all fixed costs against the first 55 rooms occupied assum-ing that is the level determined by the hotel to be its break-even point. If some of the rates associ-ated with those 55 rooms are deeply discounted, they are likely to contribute little to profit, or per-haps run a deficit on a per-room-night basis (see Exhibit 12 for an example). If there is too much of this business, the occupancy threshold has to be pushed higher to generate the needed revenue just to achieve the break-even point; when de-mand is in short supply, reaching the needed oc-cupancy becomes difficult. Assuming that a hotel is able to reach the break-even point, discounted rooms sold beyond this point may still benefit the hotel. The case study example uses an estimate of $10 in marginal room-related costs, which, even at a rate of $35 to $45, may contribute to this sample hotel’s profit. In order to get to the break-even level, the hotel has to forecast well in terms of the amounts of high- and low-value business in its base, so that the limited demand does not come in at too low a rate, and comprise too much of the hotel’s business.
But how much of the mix should the low-profit business be? The hotel has to be cautious about volumes so it does not displace full-rated busi-ness by selling too large a base at low rates months before arrival. There is also a question as to whether a hotel can fill the same rooms with other demand that contributes more to NOI. If not, when the hotel has achieved its break-even point with a sufficient volume of rates close to a targeted best available rate (BAR), then some
thIs analysIs supports thE contEn-
tIon that a hotEl should rEach Its
brEak-EvEn occupancy wIth as hIgh
a ratE as possIblE In Its maInstrEam
basE, and thEn can bE morE flExIblE
wIth a small amount of dEmand
usEd to “top off.”
Published by the hsMAi FoundAtion 161
5Distribution Costs and Benefits
contribution can be better than none. Low-value business may become a detriment to the hotel’s achievement of an optimal channel mix if it:
1. becomes too large a percentage of the hotel’s overall channel mix.
2. diverts financial or staff time and resources from seeking higher profit business.
3. erodes the overall rate strategy of the hotel.
4. Feeds a downward price spiral in the comp set that reduces rates for all and does not bring in enough incremental demand to compensate for the reductions in rate.
5. diverts customers who would otherwise book through higher value channels.
6. is promoted close to arrival and trains consumers to wait until the last minute for the best deal, undermin-ing the potential for high rates that may be booked at the same time.
A more granular way to conduct this analysis could be to examine a hotel’s revenue stream by day of week. A comparison of residual profit at different ratios of low- and high-value business could help determine the extent to which the hotel would benefit overall from some percentage of low-rated business used to “top off” during the high occupancy days. The danger is consistently taking too much low-profit business as part of the break-even base and undermining the hotel profit.
If a hotel has the autonomy to choose the volume it wants to take every day from each channel, and has no last room availability (LRA), base allocations, or conditions connected to low-value business that would be detrimental to revenue during peak times, accepting a wide range of rates to take advantage of the demand in the market may prove beneficial to optimize revenue. However, if there are restrictions on inventory or if a particular type of business is not contributing to profit at all, a cost/benefit analysis would be appropriate to factor in the rate erosion dur-ing peak times as a deduction from the benefit gained during periods of weak demand.
Distressed Inventory and ForecastingA frequent need to sell off “distressed inventory” (defined as rooms remaining in inventory very close to the day of arrival with limited options to sell them) could be a sign to examine a hotel’s forecasting methodology. While many hotels have days that do not sell out, if a hotel can forecast accurately enough to plan for these days, it may choose to sell more rooms farther out, even at lower rates, to minimize the inventory that ends up in “last minute” sales. If most of the inventory winds up sold in this way, and the other hotels in the competitive set don’t seem to be doing this to the same extent, the hotel may need to explore more fully the demand generators in its market to seek new opportunities. As mentioned previ-ously, offering last-minute “deals” can undermine the value of the brand (including the brand of an independent) by commoditizing the hotel room purchase with a focus on rate, and train the consumer to believe that last-minute deals are consistently offered and more attractive than rates offered farther out from arrival. This can also degrade the overall ADR since a hotel may take low-rated business early in the sales cycle as a foundation, and then proceed to take more low-rated business close-in to arrival, thereby raising the overall percentage of low-value busi-ness in total for a given day.
The flow-through analysis is conducted in two ways:
(1) the first is a full cost approach with comparisons of profit contribution by channel. the channel-specific expenses reflect a composite of data collected through interviews with brands and independent hotels while conducting research for this study. Refer to exhibit 12 for a midscale limited service hotel and exhibit 14 for an upscale full-service hotel.
(2) the second analysis is a marginal cost approach that illustrates several scenarios in which a sample 100-room hotel runs the 2010 u.s. average occupancy of 65% and, using a 55% breakeven occupancy, shows the effect of having low-rated business contributing 10, 20, and 30 rooms of the 65 rooms sold. then, as a contrast, it shows the effect of having 10, 20, and 30 rooms booked beyond the break-even occupancy level of 55% and the resulting profit from the “incre-mental” demand. Refer to exhibit 16 for the example of a mid-scale limited-service hotel.
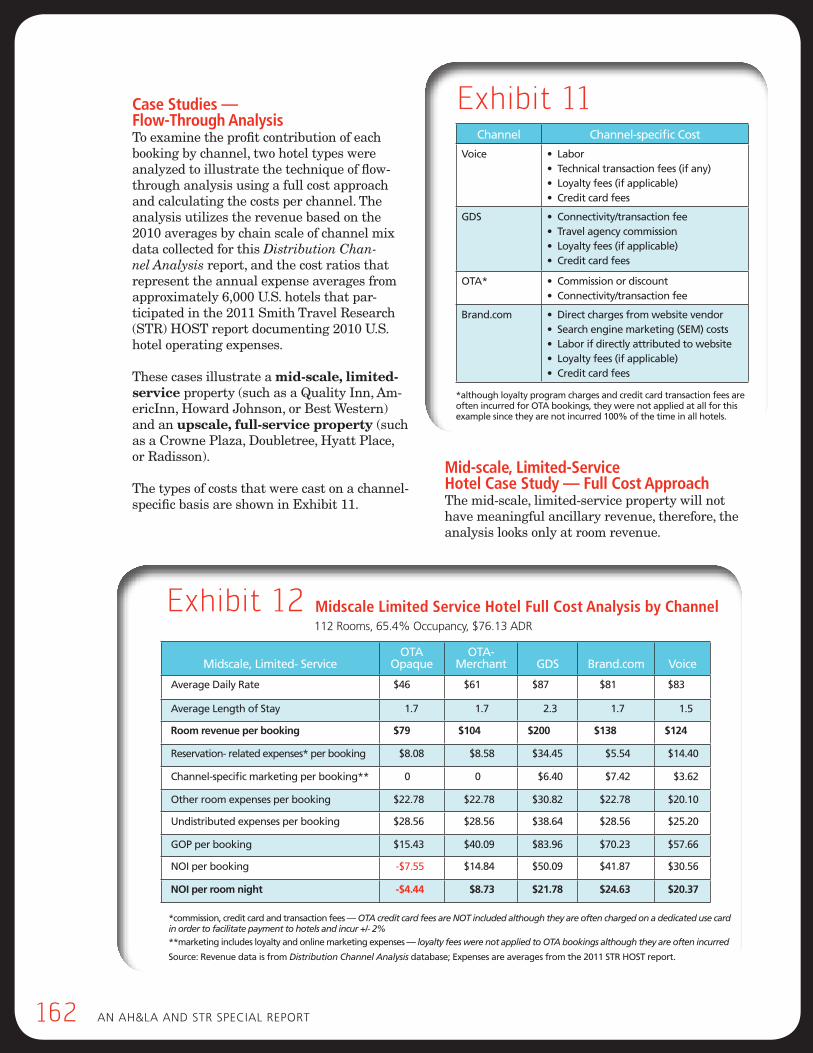
162 An Ah&lA And stR sPeciAl RePoRt
Case Studies — Flow-Through AnalysisTo examine the profit contribution of each booking by channel, two hotel types were analyzed to illustrate the technique of flow-through analysis using a full cost approach and calculating the costs per channel. The analysis utilizes the revenue based on the 2010 averages by chain scale of channel mix data collected for this Distribution Chan-nel Analysis report, and the cost ratios that represent the annual expense averages from approximately 6,000 U.S. hotels that par-ticipated in the 2011 Smith Travel Research (STR) HOST report documenting 2010 U.S. hotel operating expenses.
These cases illustrate a mid-scale, limited-service property (such as a Quality Inn, Am-ericInn, Howard Johnson, or Best Western) and an upscale, full-service property (such as a Crowne Plaza, Doubletree, Hyatt Place, or Radisson).
The types of costs that were cast on a channel-specific basis are shown in Exhibit 11.
Mid-scale, limited-Service Hotel Case Study — Full Cost ApproachThe mid-scale, limited-service property will not have meaningful ancillary revenue, therefore, the analysis looks only at room revenue.
channel Channel-specific Cost
voice • Labor• Technical transaction fees (if any)• Loyalty fees (if applicable)• Credit card fees
gds • Connectivity/transaction fee• Travel agency commission• Loyalty fees (if applicable)• Credit card fees
ota* • Commission or discount• Connectivity/transaction fee
brand.com • Direct charges from website vendor• Search engine marketing (SEM) costs• Labor if directly attributed to website• Loyalty fees (if applicable)• Credit card fees
Exhibit 11
*although loyalty program charges and credit card transaction fees are often incurred for ota bookings, they were not applied at all for this example since they are not incurred 100% of the time in all hotels.
Exhibit 12 Midscale limited Service Hotel Full Cost Analysis by Channel112 Rooms, 65.4% occupancy, $76.13 AdR
midscale, limited- service
ota Opaque
ota- merchant
gds
brand.com
voice
average daily rate $46 $61 $87 $81 $83
average length of stay 1.7 1.7 2.3 1.7 1.5
Room revenue per booking $79 $104 $200 $138 $124
reservation- related expenses* per booking $8.08 $8.58 $34.45 $5.54 $14.40
Channel-specific marketing per booking** 0 0 $6.40 $7.42 $3.62
other room expenses per booking $22.78 $22.78 $30.82 $22.78 $20.10
undistributed expenses per booking $28.56 $28.56 $38.64 $28.56 $25.20
gop per booking $15.43 $40.09 $83.96 $70.23 $57.66
noI per booking -$7.55 $14.84 $50.09 $41.87 $30.56
nOi per room night -$4.44 $8.73 $21.78 $24.63 $20.37
*commission, credit card and transaction fees — OTA credit card fees are NOT included although they are often charged on a dedicated use card in order to facilitate payment to hotels and incur +/- 2% **marketing includes loyalty and online marketing expenses — loyalty fees were not applied to OTA bookings although they are often incurred
source: revenue data is from Distribution Channel Analysis database; Expenses are averages from the 2011 str host report.
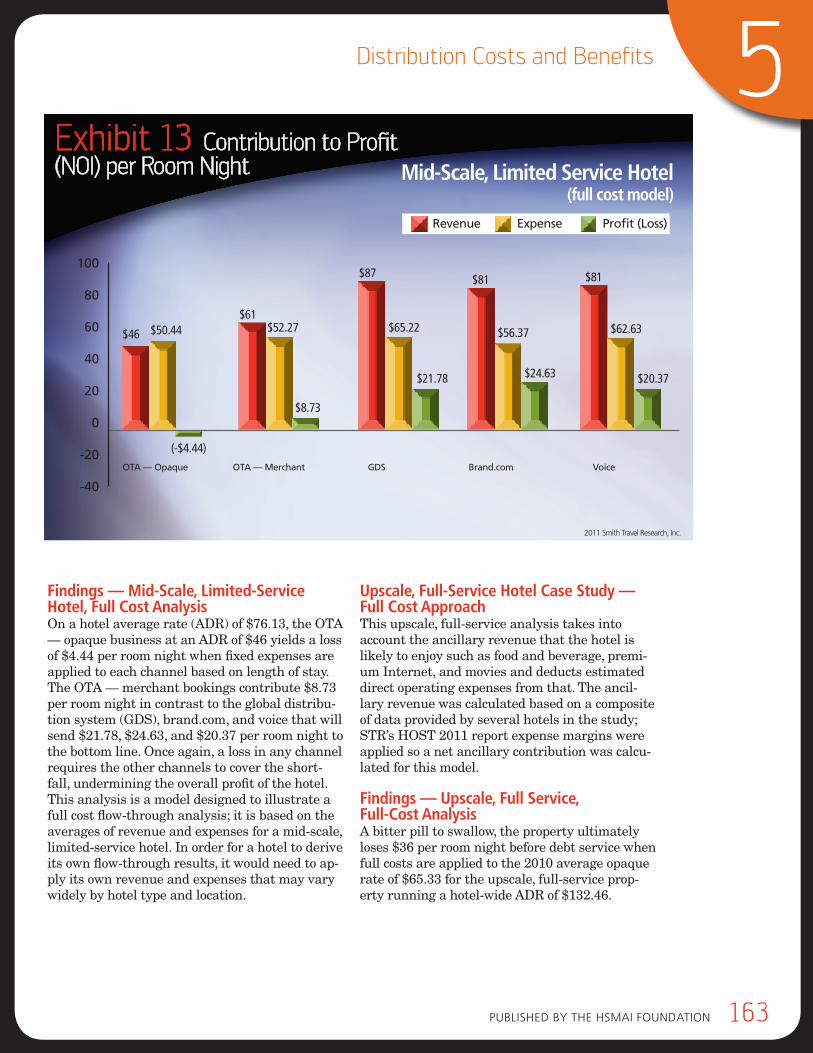
Published by the hsMAi FoundAtion 163
5Distribution Costs and Benefits
Findings — Mid-Scale, limited-Service Hotel, Full Cost AnalysisOn a hotel average rate (ADR) of $76.13, the OTA — opaque business at an ADR of $46 yields a loss of $4.44 per room night when fixed expenses are applied to each channel based on length of stay. The OTA — merchant bookings contribute $8.73 per room night in contrast to the global distribu-tion system (GDS), brand.com, and voice that will send $21.78, $24.63, and $20.37 per room night to the bottom line. Once again, a loss in any channel requires the other channels to cover the short-fall, undermining the overall profit of the hotel. This analysis is a model designed to illustrate a full cost flow-through analysis; it is based on the averages of revenue and expenses for a mid-scale, limited-service hotel. In order for a hotel to derive its own flow-through results, it would need to ap-ply its own revenue and expenses that may vary widely by hotel type and location.
Upscale, Full-Service Hotel Case Study — Full Cost ApproachThis upscale, full-service analysis takes into account the ancillary revenue that the hotel is likely to enjoy such as food and beverage, premi-um Internet, and movies and deducts estimated direct operating expenses from that. The ancil-lary revenue was calculated based on a composite of data provided by several hotels in the study; STR’s HOST 2011 report expense margins were applied so a net ancillary contribution was calcu-lated for this model.
Findings — Upscale, Full Service, Full-Cost Analysis A bitter pill to swallow, the property ultimately loses $36 per room night before debt service when full costs are applied to the 2010 average opaque rate of $65.33 for the upscale, full-service prop-erty running a hotel-wide ADR of $132.46.
2011 Smith Travel Research, Inc.
OTA — Opaque OTA — Merchant GDS Brand.com Voice
Revenue Expense Profit (Loss)
$46
Mid-Scale, Limited Service Hotel (full cost model)
$50.44
(-$4.44)
Exhibit 13 Contribution to Profit (NOI) per Room Night
100
80
60
40
20
0
-20
-40
$61$52.27
$8.73
$87
$65.22
$21.78
$81
$56.37
$24.63
$81
$62.63
$20.37
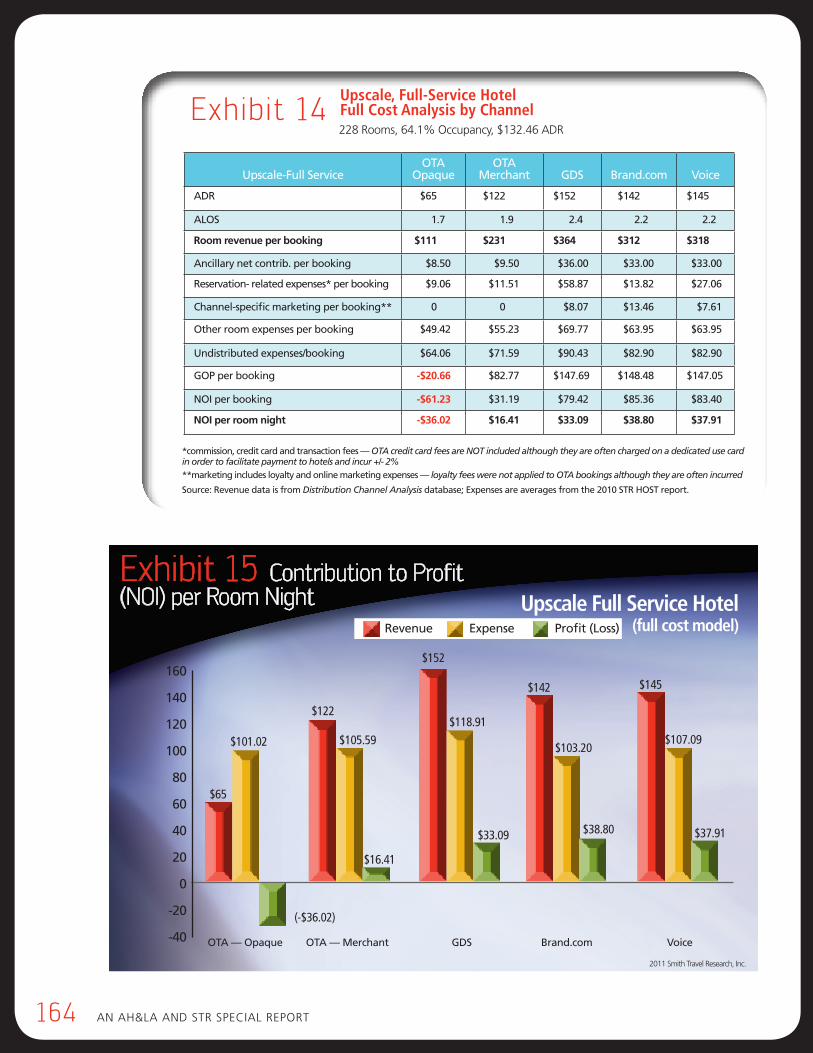
164 An Ah&lA And stR sPeciAl RePoRt
Exhibit 14Upscale, Full-Service Hotel Full Cost Analysis by Channel228 Rooms, 64.1% occupancy, $132.46 AdR
upscale-full service
otaOpaque
otamerchant
gds
brand.com
voice
adr $65 $122 $152 $142 $145
alos 1.7 1.9 2.4 2.2 2.2
Room revenue per booking $111 $231 $364 $312 $318
ancillary net contrib. per booking $8.50 $9.50 $36.00 $33.00 $33.00
reservation- related expenses* per booking $9.06 $11.51 $58.87 $13.82 $27.06
Channel-specific marketing per booking** 0 0 $8.07 $13.46 $7.61
other room expenses per booking $49.42 $55.23 $69.77 $63.95 $63.95
undistributed expenses/booking $64.06 $71.59 $90.43 $82.90 $82.90
gop per booking -$20.66 $82.77 $147.69 $148.48 $147.05
noI per booking -$61.23 $31.19 $79.42 $85.36 $83.40
nOi per room night -$36.02 $16.41 $33.09 $38.80 $37.91
*commission, credit card and transaction fees — OTA credit card fees are NOT included although they are often charged on a dedicated use card in order to facilitate payment to hotels and incur +/- 2% **marketing includes loyalty and online marketing expenses — loyalty fees were not applied to OTA bookings although they are often incurred
source: revenue data is from Distribution Channel Analysis database; Expenses are averages from the 2010 str host report.
2011 Smith Travel Research, Inc.
Upscale Full Service Hotel (full cost model) Revenue Expense Profit (Loss)
Exhibit 15 Contribution to Profit (NOI) per Room Night
OTA — Opaque OTA — Merchant GDS Brand.com Voice
(-$36.02)
$65
$101.02
160
140
120
100
80
60
40
20
0
-20
-40
$122
$105.59
$16.41
$152
$118.91
$33.09
$142
$103.20
$38.80
$145
$107.09
$37.91
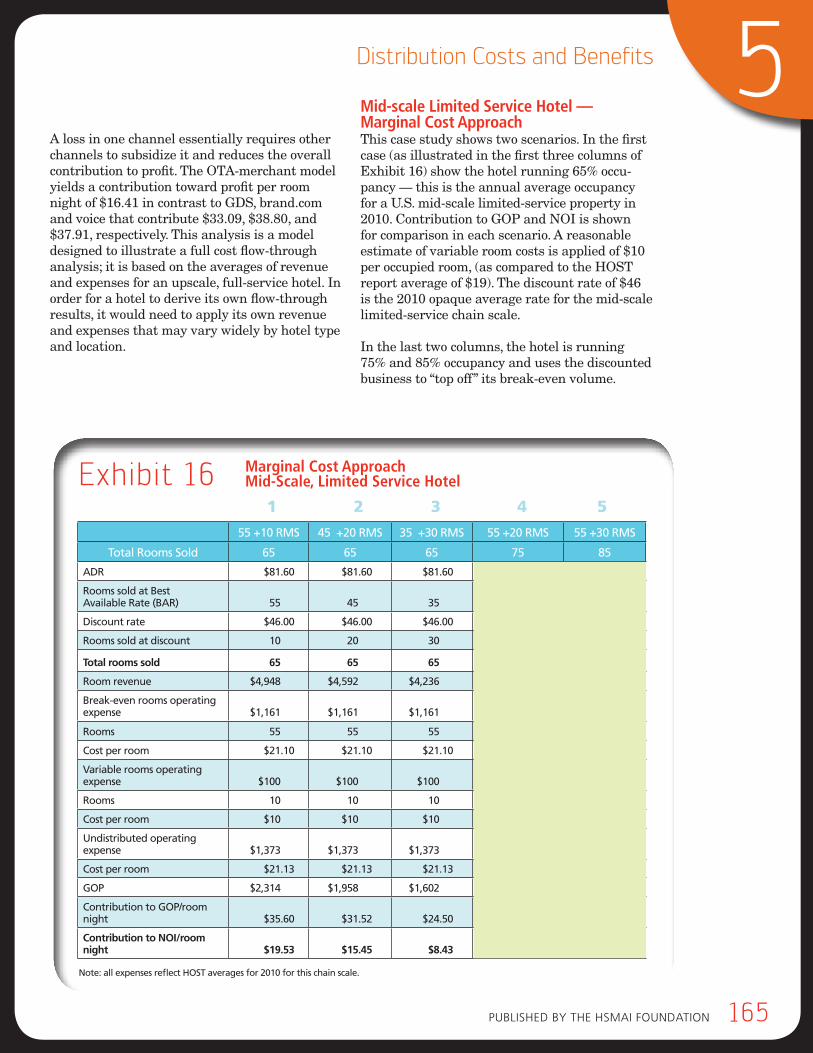
Published by the hsMAi FoundAtion 165
5Distribution Costs and Benefits
A loss in one channel essentially requires other channels to subsidize it and reduces the overall contribution to profit. The OTA-merchant model yields a contribution toward profit per room night of $16.41 in contrast to GDS, brand.com and voice that contribute $33.09, $38.80, and $37.91, respectively. This analysis is a model designed to illustrate a full cost flow-through analysis; it is based on the averages of revenue and expenses for an upscale, full-service hotel. In order for a hotel to derive its own flow-through results, it would need to apply its own revenue and expenses that may vary widely by hotel type and location.
Mid-scale limited Service Hotel — Marginal Cost ApproachThis case study shows two scenarios. In the first case (as illustrated in the first three columns of Exhibit 16) show the hotel running 65% occu-pancy — this is the annual average occupancy for a U.S. mid-scale limited-service property in 2010. Contribution to GOP and NOI is shown for comparison in each scenario. A reasonable estimate of variable room costs is applied of $10 per occupied room, (as compared to the HOST report average of $19). The discount rate of $46 is the 2010 opaque average rate for the mid-scale limited-service chain scale.
In the last two columns, the hotel is running 75% and 85% occupancy and uses the discounted business to “top off” its break-even volume.
55 +10 rms 45 +20 rms 35 +30 rms 55 +20 rms 55 +30 rms
total rooms sold 65 65 65 75 85
adr $81.60 $81.60 $81.60 $81.60 $81.60
rooms sold at best available rate (bar) 55 45 35 55 55
discount rate $46.00 $46.00 $46.00 $46.00 $46.00
rooms sold at discount 10 20 30 20 30
Total rooms sold 65 65 65 75 85
room revenue $4,948 $4,592 $4,236 $5,408 $5,868
break-even rooms operating expense $1,161 $1,161 $1,161 $1,161 $1,161
rooms 55 55 55 55 55
cost per room $21.10 $21.10 $21.10 $21.10 $21.10
variable rooms operating expense $100 $100 $100 $200 300
rooms 10 10 10 20 30
cost per room $10 $10 $10 $10 $10
undistributed operating expense $1,373 $1,373 $1,373 $1,585 $1,796
cost per room $21.13 $21.13 $21.13 $21.13 $21.13
gop $2,314 $1,958 $1,602 $2,462 $2,611
contribution to gop/room night $35.60 $31.52 $24.50 $32.83 $30.72
Contribution to nOi/room night $19.53 $15.45 $8.43 $16.76 $14.65
1 2 3 4 5
Exhibit 16
note: all expenses reflect host averages for 2010 for this chain scale.
Marginal Cost Approach Mid-Scale, limited Service Hotel
166 An Ah&lA And stR sPeciAl RePoRt
Column 1: the hotel sells 55 rooms at the best available rate (bAR), which is its estimated break-even point. they then sell 10 more rooms at a discount and the variable ex-pense is applied only to the 10 rooms; full costs are applied to the first 55 rooms sold.
Column 2: the hotel sells 65 rooms but only 45 at bAR and 20 at a discount. Marginal costs are associated with 10 rooms beyond the break-even point of 55 rooms; full costs are applied to the first 55 rooms.
Column 3: the hotel sells 65 rooms but only 35 at bAR and 30 at a discount. Marginal costs are associated with 10 rooms beyond the break-even point of 55 rooms; full costs are applied to the first 55 rooms.
the hotel exceeds the average annual occupancy rate for a midscale limited service hotel by selling 75 and 85 rooms.
Column 4: the hotel sells 75 rooms; 55 rooms at bAR to reach the break-even point and another 20 at a discount to “top off.”
Column 5: the hotel sells 85 rooms; 55 at bAR to reach the break-even point and 30 at a discount to “top off.”
Flow-Through Analysis — Wrap-UpTo summarize the various approaches to flow-through analysis, if the hotel’s normal break-even demand level is reached with too much discount-ed business, the hotel won’t hit a high enough revenue threshold and the market may not have enough excess demand to compensate, leaving the hotel with diminished profit. Accepting busi-ness that may not contribute at all — or may be net negative — to GOP or to NOI within the ho-
tel’s mainstream (or base) volume is not a tenable situation, however, a small ratio of the discounted business that contributes after a break-even vol-ume is reached may still be beneficial. Each hotel might decide to calculate the rate and volume threshold that will result in a profitable outcome, and manage to those objectives.
summary of dIstrIbutIon costs and bEnEfIts by channEl
There are many ways to analyze costs and ben-efits per channel. The most important point is that each hotel should drill down into its revenue and expenses to determine an accurate contribu-tion to profit by channel. Successful distribution is about sustainable profit streams rather than short-term revenue generation. Supplement-ing the overall assessment, it is helpful to look at (1) the techniques used to stimulate busi-ness through each channel, including call center operations, website design, marketing resource allocation; (2) the approach to retention and fostering referrals for brand loyalty program members as well as the rest of a hotel’s customer base, which may be as much as half or more of a hotel’s business (this applies to chain-affiliated or independent hotels); and (3) the ancillary revenue potential from each channel that may provide substantial revenue lift beyond the room night contribution. Recognizing the impact on the bottom line and on a brand’s position in the marketplace, the funds and staff time dedicated to distribution channel cost and benefit analysis are significant and worthy of closer examination.
How long have you been in the hotel industry? How long have you been involved with distribution issues?
i’ve been in the industry almost 30 years now and in that time i would have to say that i’ve alway been involved in distribution issues or adventures.
In what way does your current role involve distribution?
in my role as the ceo of Pegasus, i guess you could say i am immersed in distribution, as Pegasus processes the bulk of the world’s hospitality transactions, we live and breathe distribution.
Where would you say distribution fits into the overall hotel management landscape? Why does distribution matter?
distribution is a vitally important component of every hotel company’s strategy. As guests’ shopping patterns continue to evolve and fragment, hotel companies need to be able to reach guests, wherever and however they choose to shop for hotels …and do it in a cost effective and consistent manner. Without distribution, most hotels are out of business.
What are the top 3 current issues that will have the greatest impact on hotel distribution in the next two to three years?
continued growth of mobile computing: as consumers continue to change their use of technology to rely more heavily on mobile devices (smartphones, tablets, etc), hotels will need to invest in offering effective solutions to capture this business.
social networks: hotels will need to learn how to utilize these applications to leverage “word of mouth” marketing; these emerging networks will have a fundamental impact on all guest marketing activities (including guest loyalty).
Google’s increased focus on travel: they will continue to in-vest in travel products and services; since they still control the majority of consumer search activity, they will have an impact no matter what they choose to do.
What is the smartest move you have seen in hotel distribution (by someone other than your own organization)?
Google’s suite of hotel search products has the potential to be the most disruptive move. it is too early to tell if it is the smartest.
What is the smartest move your organization has made related to hotel distribution?
our shoppingnG initiative is reinventing the hotel shopping and booking process and was recognized as an information Week 500 winner.
What is the single biggest oversight or misstep you have witnessed (in your own organization or others in hospitality) in the last two years?
difficult to answer this question since virtually everyone is our customer, but if i had to pick one thing, it would be, all too often, we as an industry are slow to act, even when we know we must.
What three things can you tell a hotel general manager, owner or asset manager about distribution that would have the greatest impact on unit level profit?
What is the next thing that you predict will disappear or gradually fade away that is currently a part of the distribution scene?
the use of channel management applications to update cRs (to manage the Gds channel); these tools will increasingly be integrated into the cRs as hotels centralize and leverage more sophisticated rate management features to optimize revenue.
If you had a crystal ball, what emerging technologies do you anticipate could be game changers, or at least have the greatest affect on the distribution landscape in the next two to three years?
cloud based computing will change the way systems can be integrated, thus enabling more creative use of cRM, cRs, PMs, mobile and revenue management applications.
Mobile computing. in a few years we won’t make the distinc-tion between mobile and non-mobile. everything will be mobile.
Mike KistnerPegasus solutions
Chief executive officer
Published by the hsMAi FoundAtion And its PublishinG PARtneRs 167
InDUSTry PErSPECTIVE
Make sure you have a compelling website which offers an easy to use shopping experience on your booking engine. understand and engage in social media; join the conversation with your customers; welcome their input.
invest in revenue management. the value of your asset is highly dependent on this function, and you want the smartest, most experienced person you can afford running it.
building a loyal customer base starts in the trip planning process and doesn’t ever end. taking care of the customer in-house and after they leave is also part of distribution.
>>
>>
>>
>>
>>
>>
>>
>>
>>
123
How long have you been in the hotel industry? How long have you been involved with distribution issues?
More than 25 years.
In what way does your current role involve distribution?
i view distribution as the Place(P) in the marketing mix. today it involves all the virtual shelves where we want to have our hotel product displayed. distribu-tion touches all of our channel mix—consumer direct, business to business and our intermediary channels.
Where would you say distribution fits into the overall hotel management landscape? Why does distribution matter?
distribution is the combination of all the virtual shelves where our consumers and intermediary partners purchase our product.
What are the top 3 current issues that will have the greatest impact on hotel distribution in the next two to three years?
new distributors entering the sales mix—many more virtual shelves for hotel product to be sold through.
commission and wholesale discounts—will evolve and become more competitive.
new connectivity solutions allowing for more flexibility for brand.com to connect to partners and distributors.
Richer content—consumer reviews and visual assets to facilitate better conversion ratios.
What is the smartest move you have seen in hotel distribution (by someone other than your own organization)?
Google’s new products in the travel space and their focus on reducing the clicks to booking ratio.
What is the smartest move your organization has made related to hotel distribution?
being channel agnostic—want to secure space on as many shelves that make sense as well as holding partners to parity obligations. staying relevant in mobile and social channels and engaging with sMe to ensure we are evolving our marketing capabilities.
What three things can you tell a hotel general manager, owner or asset manager about distribution that would have the greatest impact on unit level profit?
What is the next thing that you predict will disappear or gradually fade away that is currently a part of the distribution scene?
i think most of the current intermediaries and distri-bution partners are here to stay and will respond to the changing environment to stay relevant.
If you had a crystal ball, what emerging technolo-gies do you anticipate could be game changers, or at least have the greatest affect on the distribution landscape in the next two to three years?
Google, Facebook and tripAdvisor have the greatest potential to keep influencing our business with their new consumer enhancements and focus on the end user to drive value and engagement.
Dorothy DowlingBest Western
senior Vice President, Marketing and sales
InDUSTry PErSPECTIVE
leverage brand channels and brand expertise — be engaged with your brand partner.
Focus on relationships — social and relationship currency is as important as ever in developing and nurturing business opportunities.
be open to new business opportunities — the world is changing faster than ever — and we need to adapt to be available for purchase where our consumer wants to be.
>>
>>
>>
>>
>>
>>
>>
>>
123
168 An Ah&lA And stR sPeciAl RePoRt
Published by the hsMAi FoundAtion 169
6Optimal Channel Mix
Published by the hsMAi FoundAtion 169
6Optimal Channel Mix
every hotel has an optimal channel mix. this is the ideal mix of
business from each channel that results in optimal profitabil-
ity for a hotel, given its position in the marketplace relative to
its competitors, taking into account its physical configuration,
amenities and condition, management quality, brand strength,
marketing prowess, and consumer perception. figuring it out can
be difficult and managing to achieve it is the ultimate challenge.
Realistically, a hotel with a brand flag (and this varies quite a bit by brand and location), will receive 30% to 70% of its business from the “mother ship” through group leads, central reservations, corporate promotions, national ac-count production, loyalty clubs and other brand-sponsored programs. Most hotels still have to fill the rest by closing on the leads in their local/regional markets or through local initiatives. Contribution by a loyalty club in a chain hotel may be as much as 50% of the transient base but that raises the question as to what the individual hotel can do for retention of the other 50% of its customers. For independent properties, they may get some lift from affiliation to reservation or sales consortiums, but most of the time, they source 50% or more locally.
dEmand gEnErators
Given that 30% to 70% percent of the business (let’s call it 50% for the purpose of discussion) is the local hotel’s responsibility, even with the help of a strong brand, getting half of the busi-ness requires some promotional and sales savvy. A hotel with diverse demand streams may have enough meeting space to fill a big share of the occupancy pie with local groups, meetings, and citywides, then it may only have another 25% to fill with the amorphous unmanaged corporate or transient segments. Sales calls to local cor-porate accounts can fill part of it, provided this type of business exists in a market, and that a hotel has suitable facilities for it. In an attempt to provide as much of a hotel’s business as pos-sible, brands and reservation representation
firms are building their infrastructure to step up qualified corporate traffic, especially since this segment is growing once again. Concurrently, Global Distribution Systems (GDSs) and online travel agencies (OTAs) are working hard to persuade small-to-mid-sized corporate accounts to use their inventory; for the GDSs this will supplement their primary business in powering travel management companies (TMCs). They argue that a corporate account can rely upon its negotiations with hotels for lower rates; they can be a volume producer to benefit any corporate account, so why not book through their system? The hotel has multiple conduits to bring in this business: direct from companies booking on the hotel website or calling the reservation depart-ment; through the GDSs; and through the OTAs, each with differing costs and benefits; however, it is the corporate accounts that may make the decision as to which channel they prefer.
What about hotels without meetings or corporate potential? Where do they turn for more high-value business?
There are dozens of local demand generators such as convention and visitors bureaus (CVBs), local attractions, parking facilities, universities, sports teams, local businesses (targeting em-ployees as opposed to corporate travel), travel industry employees coming to the hotel’s desti-nation, and entertainment venues. There may be needy hotels in popular nearby locations ripe for partnering on promotions; there are regional directories; booking referral sites; and a hotel can tap into social media about local activities

170 An Ah&lA And stR sPeciAl RePoRt
such as blogs about nearby sports, recreation, and consumer review sites that offer destination coverage and potential visibility to a local audi-ence. Brainstorming a list like this may reveal a few demand streams that are not as obvious and could fill some need periods at reasonable rates with minimal distribution and promotional costs. Some smaller niche or regional OTAs offering attractive terms to a hotel may also prove to be valuable sources of business. While the domi-nant channels in a market certainly provide the easiest levers to pull, seeking and testing all appropriate sources in a marketplace can yield a healthy mixture of channels. It is the responsibil-ity of the hotel team to find and test the options for quality and quantity, ensure that they yield profit and a sustainable revenue flow, and that they can handle the reservations operationally. This exercise may take more time and effort if executed systematically, but it will pay off on the bottom line.
Then there is the brainstorming over ways to increase ancillary revenue. Snack boxes during early morning or late-night timeframes, premi-um bath and bed amenities, gift cards, preferred rooms, flexible arrival and departure times, quicker check-in, convenient parking spaces, and stratified high-speed Internet access are all ex-amples of ways to improve margins on business through all channels.
compEtItIvE markEtIng bEhavIor
Is the hotel getting its fair share of the brand.com business coming into its marketplace? How does one hotel’s online content compare to its competitor’s? Is it more compelling? Do consum-ers find one hotel’s website meets their needs better than its competitor’s? Has the hotel opti-mized its search engine position? Does it know which digital venues or communication vehicles are triggering the bookings? How about its call center business — how is it performing relative to its comp set? What is the consumer perception of one hotel over another? There may be more to the channel choice decision than revenue and cost; what is the impact on the hotel’s brand (whether it’s a national brand or an independent) to be in a particular channel? This can cut both ways. Selling a line of clothes in Saks Fifth Av-enue gives it prestige and panache, while having that line in Walmart says it is acceptable for the “regular Joe.” Are the channels a hotel chooses to sell through ones that are frequented by guests that are a good fit for its product? These are among the questions that a hotel team can ad-dress to ensure they have overturned every stone in the quest for profitable bookings.
acQuIsItIon, pErsuasIon and rEtEntIon
Although most hotel marketing tends to focus on building traffic and acquiring new business, the companion disciplines of persuasion (which leads to conversion) and retention also play a role in a hotel’s results. Since there is limited incremen-tal demand in the U.S. lodging industry, a hotel performing optimally will recognize that any traffic that comes its way (through any channel) is limited and is a hot target for its competitors, and, therefore is highly valuable. Is the hotel doing the best job possible to convert the traf-fic that flows through existing channels? Are call center and website conversion rates being tracked? Are retention programs implemented effectively, whether it is a brand loyalty program or a local version used for non-loyalty members or in an independent setting? Are social media channels being tapped to heighten engagement? Are all marketing resources being used primarily toward acquisition without considering the need to commit funds and staff time to conversion and improving repeat business or referrals? A discus-sion on how marketing resources are deployed
Published by the hsMAi FoundAtion 171
6Optimal Channel Mix
would be useful in the context of setting goals for optimal channel mix. There are many channels and limited time and money to address them all. Priorities have to be set and a timeframe placed on each element of a distribution marketing plan. Each hotel’s decision about its allocation of local resources toward acquisition, persuasion and retention may depend on the support it gets for each of these from a brand for chain hotels and a marketing affiliation for independents. Determin-ing an optimal channel mix is about the relative benefit of each channel and the corresponding cost. Since most channels serve some combina-tion of booking, informational and promotional role, deciding which one(s) yield the best results may depend on the hotel’s need for it to support its goals for acquisition, persuasion/conversion or retention.
dEtErmInIng thE optImal mIx
Based purely on a cost-per-channel assessment, a hotelier might think that he or she should fill up on brand.com and central reservation business (CRS)/voice, or GDS, if available and appropri-ate for a hotel (GDS is largely the channel used by corporate accounts), but most hotels will fill up with a mixture of demand from all channels. A hotel can calculate the hotel’s net benefit from its existing business mix by examining costs and revenue from each channel, then make some decisions about an optimal channel mix. Most hotels have managed channel mix passively; the outcome is rarely targeted with defined objectives and management is not often evaluated based on this set of metrics. However, for a hotel to improve its profit levels, it has to establish clear goals by channel:
1. Forecast demand for each channel.
2. determine how to divide resources between acquisi-tion, conversion and retention and which channels support each.
3. build a distribution strategy around the desired mix to restrict some channels and stimulate flow into others and track conversion in all channels.
4. Monitor against competitors to see if it can achieve the channel mix that will deliver optimal results based on available demand in the market.
It will not help a hotel to wish for more higher value business if the demand for it in its location is not there. However, if demand exists in profitable
channels and the hotel is not poised to take ad-vantage of it, there could be a lot of money left “on the table.” This is not the desired scenario for any hotel owner or manager and it can be avoided with proactive distribution and revenue management.
However, if demand is meager from high-profit channels, and the lower rated business spigot is running, a hotel should tap into this stream as long as it can justify that it makes some profit on every booking. Taking it on the top line with lim-ited or no flow-through to the bottom line is not a sustainable method, even if it covers operating cash flow requirements in the short term.
It’s all about thE costs, or Is It rEally about thE profIt?
Determining an optimal channel mix is not about cutting out third party business and taking it all direct; it is about getting a mix of business that is profitable. Some third party volume may prove more attractive than direct depending on the costs of marketing to acquire it. Naturally, channels vary in profitability, but it is not advis-able to accept business through a channel that contributes no profit. Some consider flash sales a direct channel since the customer books direct with a hotel, but the costs can be quite a bit higher than other channels. If a channel brings consumers that may return or spend more money in high profit ancillary revenue centers, it may be worth paying more to bring them the first time. This concept is sound as long as a hotel can prove that customers come back and that they spend enough money beyond the room rate to make it worthwhile to incur the high acquisition costs. “Hoping it will work out” is not a viable strategy. (Refer to the Distribution Costs and Benefits chapter for examples of ancillary revenue by channel analysis and other techniques for calcu-lating costs per channel.)
If dEmand ExIsts In profItablE channEls
and thE hotEl Is not poIsEd to takE
advantagE of It, thErE could bE a lot
of monEy lEft “on thE tablE.”
172 An Ah&lA And stR sPeciAl RePoRt
prIcIng pattErns
Hotel rates should reflect the value of the hotel experience for the customer who is considering a purchase. Decision support technology does an effective job of allowing a hotel to manage its rates, but the assumption generally made is that the rate structure fed into the system is sound and appropriate for a hotel’s market. How does a hotel go about deciding what rate structure to deploy? How did so many hotels get into the habit of discounting for long lead-time business to build a base and then discount again for short lead-time business by offering last-minute spe-cials? Besides holding rates down in spite of ris-ing demand, the impact of this pattern is to train consumers to believe that they can wait to book and get a lower rate (Refer to Online Marketing and Consumer Behavior chapter for references to consumer media built on this theme). If a hotel is managing its rates well, the lower rates farther out from arrival will build an appropriate base that will be supplemented with higher rates closer in to arrival. Discounting at both ends of the arrival time line is generally a recipe for underachievement. The airlines, in contrast, have encouraged longer lead-time bookings by creating harsh disincentives to wait and holding firm to this structure. They follow a philosophy that the short lead-time discounts inflict damage on the revenue base by losing more full-paying custom-ers than they can gain through selling a few more seats at the last minute discounted fares.
It can be hard to have the confidence to raise rates after a recessionary economy has knocked the management team down and desperate measures have been taken to chase the limited demand with low rates. Pricing should reflect the quality of the product relative to the other options in the consumer’s consideration set for the same type of stay in the same market. It should not be driven by hotel management’s fear
that pushing a rate too high after a down period will repel customers. Of course, a hotel has to be mindful of the pricing behavior in its comp set as well. There is often a market leader, the one with a stronger brand or presence in the market who will be the dominant recipient of demand and forges ahead with the higher rates that often pave the way for the others. While some hotels do not have the product to take on this leader-ship role, waiting for a competitor to push rates up toward pre-recession levels is a follower’s strategy and may cost the hotel months of lost revenue potential. Pricing realistically, relative to product quality and consumer perception, is the best approach.
Hotels have a tradition of offering “special rates” which is code for “discounted” rooms. When Potbelly sandwich shop promotes its monthly “special,” it is 15% higher cost than the average sandwich and sells strongly. When a fine-dining restaurant prints its daily specials, it usually of-fers premium products that are really “special” in that they are not always available and, therefore, appear to be worth more. The hotel industry has conveyed a consistent message to consumers that makes “special” synonymous with “cheap” or “dis-count.” How sustainable is this technique going forward? Y Partnership’s Portrait of American Travelers 2011 indicates that almost two-thirds (64%) are willing to pay full price if they are guaranteed the quality and service they feel they deserve,1 however, there has been a difficult pat-tern to break in hotel pricing that drives prices downward with the hope that it will drive higher volume.
Further to the fundamentals of hotel rate setting, there are other pricing areas that can contribute to profit contribution including ancillary revenue development and yield management on meeting space, retail and other public areas. The pricing philosophies, as well as merchandising, in these disciplines are more of an art than a science at this time and would benefit from a higher level of analysis and a more sophisticated approach.
1 y Partnership/harrison Group, Portrait of American travelers 2011
dIscountIng at both Ends
of thE arrIval tImE lInE
Is gEnErally a rEcIpE for
undErachIEvEmEnt.
Published by the hsMAi FoundAtion 173
6Optimal Channel Mix
IncrEmEntal busInEss
On an industrywide basis, demand growth in the United States lodging market has only grown at a year-over-year rate of 1.6%2. The incremental portion of hotel demand through third party channels is a subset of this. Tourism Economics estimated approximately $400 million in incre-mental revenue for 2010 from OTAs on a total industry revenue volume of $100 billion. (Refer to Appendix 1 in the Hotel Business Environ-ment chapter for more details.) In 2010, with annual OTA revenue in the United States of $7 billion, this equates to a hefty percentage of room demand that pits hotels against third party channels in competition for the same consumer. Once the many new emerging channels are online, most likely dominated by mobile, social and meta-search, there is likely to be even more competition between hotels, brands, and third parties to direct the same pool of customers to their ultimate booking choice with fees charged at every step along the way.
The harsh reality of a mature lodging market makes it a daily challenge for most hotels to ac-quire demand and it is primarily done by shifting demand from a competitor. Assessing the costs of each channel becomes crucial to building a hotel’s channel mix so that the hotel is filled in, one day at a time, with the most profitable busi-ness available. The most common technique used to shift market share is dropping rates below those offered by competitors. As mentioned in the economic analysis put forth in the chapter on the Hotel Business Environment, due to the inelastic nature of lodging demand, lowering prices does not usually generate enough demand to compen-sate for the reduced rates unless a hotel can do this without having its comp set match the rates. There are other techniques that can be deployed to attract the limited demand in a market includ-ing improved sales techniques in the call center, re-targeting and smart marketing on the website, an easy-to-use and merchandising-oriented book-ing engine, and improved use of customer intel-ligence to enhance the guest experience at every touch point, through hotel-controlled channels and while the guest is on site. Learning which channels can be activated to acquire demand
2 smith travel Research, 2011, estimated average demand growth based on u.s. lodging 20 year trend of recorded room night demand.
from a competitor down the street at a reason-able direct cost and without undermining rates sold in other channels is a top priority.
It is difficult enough to reach targeted occupancy levels at reasonable rates but doing it with suf-ficient contribution to profit has to be top of mind. For all the effort expended bringing in the limited demand, it is not beneficial if there is little to show for the work in terms of contribution to gross oper-ating profit (GOP) or net operating income (NOI). Running promotions that deliver on the revenue, while it sounds encouraging on a top-line basis, can be a distraction to financial and staff resources if this revenue does not yield enough residual profit to be worthwhile. Or if it diverts staff time and funds from cultivating other channels that may yield higher profit, even if the revenue is less. Hotel marketers will also want to favor channels bringing higher value customers that add to ancil-lary spend and have the potential to repeat or refer additional business.
If hotels want to raise suppressed ADRs that have languished since the 2008 recession, rev-enue managers and general managers have to become profit managers.
optImal markEtIng spEnd
Because of the proliferation of websites visited by travel shoppers prior to a purchase, it is impor-tant to establish which of those sites influence the eventual outcome. The consumer path is complex. While driven to a brand site by search advertising, the consumer may pass through two or three consumer review sites, and one or two of them might also have a hotel’s message. Then, they may see the hotel featured on a destination site and check an OTA to get a broader view of their options in a neighborhood (there is that
If hotEls want to raIsE supprEssEd
adrs that havE languIshEd sIncE
thE 2008 rEcEssIon, rEvEnuE man-
agErs and gEnEral managErs
havE to bEcomE profIt managErs.
174 An Ah&lA And stR sPeciAl RePoRt
hotel again) before ultimately booking at the hotel site. What are the costs for this transac-tion? Distribution-only costs might be rather low since it is a brand.com booking. But there were some click-through charges on the ads used in the search engine and the consumer review or destination site in which a hotel is featured. Then, there might be an email campaign and some print advertising involved. How can you de-termine the optimal marketing spend? Of course, full-blown analysis of a marketing media mix or “attribution modeling” could yield a more ac-curate guide for the credit given to each of those touch points with the consumer, but that may re-quire complex statistical analysis and take time to get enough data to be conclusive.
In the meantime, review of each channel is es-sential. Brand.com bookings used to be tracked through a simpler path with search engines, link strategies, and other search engine optimiza-tion tactics being the primary drivers. Now, a marketer has to consider the role played by new emerging channels that influence the consumer booking decision and few hotels will find that one channel does it all for them. The sales path will start to deviate from the traditional web browser and search engine in the 2012 timeframe and into the future. Mobile is growing and may bring business through a hotel brand or OTA app or from one of the new mobile-only tools (yet anoth-er set of channels to manage), or possibly through the new voice-activated modules like Apple’s Siri or Google’s Majel. Trip inspiration sites which seem to be coming online by the dozen, social media like a hotel’s Facebook fan or business page, consumer review sites, and travel portals (e.g., Yahoo Travel, AOL Travel) may all be found to play a part in some bookings and may, in fact, provide new portals to start travel searches, not to mention tried-and-true email.
Improving the merchandising that occurs in each channel can go a long way to grow its revenue. Enhancing a booking engine to extend stays, provide incentives for bounceback bookings even before arrival, or to offer ancillary services can all substantially grow revenue. A hotel call center or reservation office may enjoy a 25% to 35% conver-sion rate. Who is calling back the seven out of ten callers who have inquired but did not consum-mate a booking? How well do the reservation agents sell a room, future stays, or other ancillary services? How systematic is the front desk sales operation? Do desk agents offer ancillary services or re-booking for future stays or sister properties? Assessing the opportunities to convert and retain customers, budgeting to allow for these actions, and tracking the results will provide insights that can improve profit outcomes for a hotel.
sEttIng and EvaluatIng thE markEtIng budgEt
How does a hospitality marketer arrive at an optimal media/promotional spending for online channels? Given the huge number of bookings that are influenced or made via online chan-nels, marketing budgets should reflect this new reality by allocating a proportion of spending relative to their targeted online shopping and buying volume. Most online media/promotional opportunities can be tracked with some consis-tent metric, for example, impressions, visits, time spent, relevant pages viewed, and feedback, such as commentary on social media.
Careful experimentation with new channels can allow a marketer to make assessments over time that will result in an optimal mix of media chan-nels with an investment that reflects business produced. If results cannot be effectively tracked, a hotel should engage professional help to assist. Some channels operate the same as traditional direct marketing in which one special offer is made and a set promotional time frame is given. These are the easiest to assess. The marketer can count the number of direct bookings for that spe-cial offer during the fixed time frame and come to a revenue-to-cost ratio that determines if the promotion is worth repeating.
although oftEn managEd by two dEpart-
mEnts and/or dIvIdEd Into two budgEts,
lookIng at mEdIa costs togEthEr wIth
dIstrIbutIon transactIon costs makEs
morE sEnsE whEn budgEtIng so Efforts
bEtwEEn bookIng and markEtIng
channEls arE IntEgratEd.
Published by the hsMAi FoundAtion 175
6Optimal Channel Mix
For general online marketing that is not product- or time frame-specific, a marketer will usually work concurrently in several channels. Partici-pation by a revenue management professional can assist in planning campaigns built around known lead-time factors for each segment and each feeder channel. The revenue manager can monitor when each channel will kick in with its most lucrative flow so that online market-ing efforts can align in terms of timing with this consumer demand. Tracking every point touched by a consumer is not an easy task and some touch points cannot be tracked at all. Without a fully developed attribution model in place, it may come down to evaluating simplistically to see if the presence or absence of a channel consis-tently yields a rise or fall in bookings when other promotional efforts are held constant. This, of course, may not be a scientific approach, and can prove difficult to turn channels completely on or off, but it could be better than randomly using a channel that may cost a lot with no way to judge its benefits.
A successful hotel marketer will do all that is possible to exhaust the demand available from the most profitable channels while also activat-ing desirable but lower value channels to supple-ment. For instance, some hotels can forecast accurately the corporate business they can get through GDSs on a weekday, so they can tap third party channels and plan ahead by using them to build a base of lower rate business in anticipation of the higher rates booked closer to arrival by the corporate accounts or last-minute transient travelers. Obviously, each hotel’s market conditions, channel lead times and profit margins can factor into this multichannel plan. Although often managed by two departments and/or divided into two budgets, looking at me-dia costs (typically a sales/marketing expense) together with distribution transaction costs (typically a rooms division expense) makes more sense when budgeting so efforts between book-ing and marketing channels are integrated. The methods and associated costs to stimulate busi-ness in each channel will vary, and this involves experimentation, particularly with the many new untested channels that are coming online in this dynamic period.
Coming up with internal revenue-to-cost for-mulas will help every hospitality organization properly apportion acquisition costs relative to benefits and more accurately assess each oppor-
tunity. And forecasting demand by channel be-comes even more crucial when the ideal channel mix is derived. (Refer to the Distribution Costs and Benefits chapter for more on this topic.)
An interdisciplinary team with skills in revenue management, online marketing, distribution, and operations needs to make these assess-ments and build the most effective distribution marketing strategy to control costs and optimize revenue.
sourcEs of data
There are many sources of data to support the distribution marketing strategy plan. Data are available about the GDS channel that produces corporate room nights for a market, as are a plethora of data to help hotels characterize the demand stream from the OTA channel. Although valuable, neither of these data sources will help evaluate a hotel’s business overall nor will it help figure out how to grow the website- or voice-direct business. Most brands and representation firms can provide intelligence about the sources of bookings into their call center and a hotel can tap into consumer perceptions of its hotel and its competitors through the many consumer review sites collecting hundreds of comments, all in the public domain. Knowing more about the profile and buying propensity of customers in each channel or by business segment can be helpful in developing merchandising and retention plans.With the growth in cross-channel shopping preceding a purchase, the need to access cross-channel intelligence is growing in tandem. Isolated data from one channel will not yield much insight into ways to improve the other channels and for the most part, each channel
to undErstand thIs volatIlE and
complEx dIstrIbutIon EnvIronmEnt
bEttEr, thE hotEl ownEr, brand
and managEmEnt has an ImpEra-
tIvE to gathEr, IntEgratE and
synthEsIzE thE full rangE of IntEl-
lIgEncE In an actIonablE form.
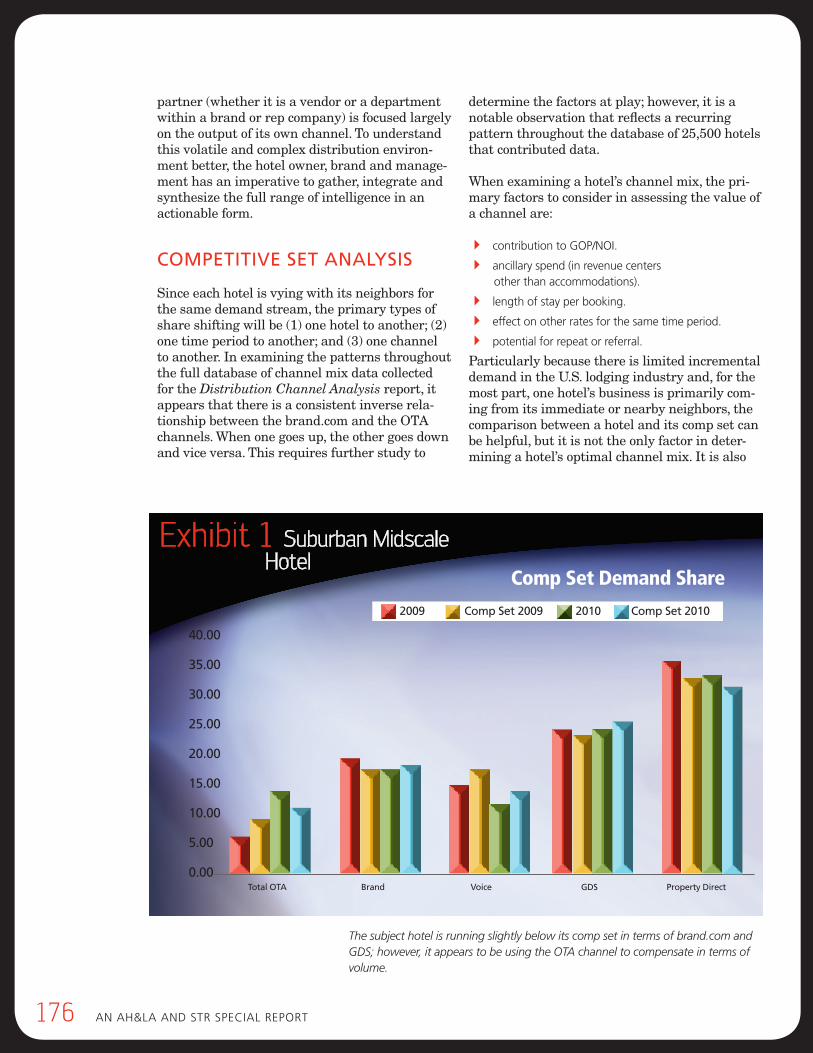
176 An Ah&lA And stR sPeciAl RePoRt
partner (whether it is a vendor or a department within a brand or rep company) is focused largely on the output of its own channel. To understand this volatile and complex distribution environ-ment better, the hotel owner, brand and manage-ment has an imperative to gather, integrate and synthesize the full range of intelligence in an actionable form.
compEtItIvE sEt analysIs
Since each hotel is vying with its neighbors for the same demand stream, the primary types of share shifting will be (1) one hotel to another; (2) one time period to another; and (3) one channel to another. In examining the patterns throughout the full database of channel mix data collected for the Distribution Channel Analysis report, it appears that there is a consistent inverse rela-tionship between the brand.com and the OTA channels. When one goes up, the other goes down and vice versa. This requires further study to
determine the factors at play; however, it is a notable observation that reflects a recurring pattern throughout the database of 25,500 hotels that contributed data.
When examining a hotel’s channel mix, the pri-mary factors to consider in assessing the value of a channel are:
4 contribution to GoP/noi.
4 ancillary spend (in revenue centers other than accommodations).
4 length of stay per booking.
4 effect on other rates for the same time period.
4 potential for repeat or referral.
Particularly because there is limited incremental demand in the U.S. lodging industry and, for the most part, one hotel’s business is primarily com-ing from its immediate or nearby neighbors, the comparison between a hotel and its comp set can be helpful, but it is not the only factor in deter-mining a hotel’s optimal channel mix. It is also
Total OTA Brand Voice GDS Property Direct
2009 Comp Set 2009 2010 Comp Set 2010
Exhibit 1 Suburban Midscale Hotel
40.00
35.00
30.00
25.00
20.00
15.00
10.00
5.00
0.00
Comp Set Demand Share
The subject hotel is running slightly below its comp set in terms of brand.com and GDS; however, it appears to be using the OTA channel to compensate in terms of volume.
Published by the hsMAi FoundAtion 177
6Optimal Channel Mix
essential to consider the perception of the hotel by the customers in the market, and the support the hotel gets from a brand (or other marketing affiliation) to facilitate bookings in each channel. Although the aggregate of production for any channel within the comp set is unlikely to be in-dicative of any of the hotel’s direct competitors, it can give a general perspective on how a hotel fits into its marketplace with respect to channel per-formance (refer to the Suburban Midscale Hotel example). A hotel’s optimal channel mix depends on its own potential relative to its competitors, not on attempting to match a neighbor’s mix.
In a random sample of competitive sets stud-ied from the Distribution Channel Analysis database, the differences in the magnitude of specific channel usage was striking within the same competitive set, therefore, it is important to understand the dynamic in each marketplace to supplement the insights learned from the channel metrics. Drilling down to production by week part can help narrow down a property’s strengths and weaknesses and tracking this data over time will allow a hotel to test results from a particular initiative to see if it affects the hotel’s position relative to its competitor’s. The comp set will be meaningful only if the hotels examined play in the same channels in a similar way as the
subject hotel; it is likely that one hotel can have different comp sets for each channel.
Comparisons between channels appear to hold more promise for driving and monitoring ac-tions, in contrast to the traditional benchmark-ing of average rate, occupancy and revenue per available room (revpar). It will provide more of a guideline to help a hotel judge if it is, in fact, moving the needle on performance in a channel it has targeted to increase or reduce.
summary — optImal channEl mIx
With all of the issues related to the distribution channel landscape, in terms of fragmentation, dy-namic growth in the number of emerging channel models and the potentially high costs of each, de-veloping an optimal channel mix for each property will provide a needed roadmap for management. Considering a hotel’s performance in its market, its relative physical and service advantages, its brand affiliation and its skills in managing de-mand compared to its competitors will all contrib-ute to deriving its optimal channel mix. Managing proactively to this objective will benefit a hotel in terms of its ability to achieve its optimal profit.
How long have you been in the hotel industry? How long have you been involved with distribution issues?
i have been in the hotel industry for 38 years. i have been involved in distribution for the last 25 years.
In what way does your current role involve distribution?
e-commerce and Revenue Management within our com-pany report directly to me. i also serve on ihG’s owners Association board of directors and Marriott’s e-commerce and sales & Marketing communications committee.
Where would you say distribution fits into the overall hotel management landscape? Why does distribution matter?
distribution is a major portion of the hotel landscape. the shift to online channels has caused the distribution land-scape to grow exponentially in both size and complexity. channel management has become a key factor in rate integrity, market share, and profitability.
What are the top 3 current that issues will have the greatest impact on hotel distribution in the next two – three years?
distribution costs are outpacing revenue gains by a wide margin.
new distribution channels are emerging faster than hoteliers can develop strategies to manage them.
hoteliers continue to allow online travel agencies (otAs) to control the dialogue with consumers. the major hotel brands must gain pricing and cost control of otAs on contract renewals.
What is the smartest move you have seen in hotel distribution (by someone other than your own organization)?
otAs have used their advertising to successfully convince the general public that the lowest rates are available through their on-line channels—at the expense of supplier sites. this distorts the concept of rate parity by misleading the consumer that the “best rates” are on the otA websites.
What is the smartest move your organization has made related to hotel distribution?
our organization completely ceased participation in opaque channels. it is our position these channels are no longer “opaque” and consequently devalue our retail prices. since implementing this strategy we have realized substantial gains in AdR, revenue, and profit.
What is the next thing that you predict will disappear or gradually fade away that is currently a part of the distribution scene?
it is clear that Google and bing are attempting to seize control of metasearch. this represents a direct threat to metasearch sites like Kayak.com. it is difficult to see a long-term future for metasearch sites unless they can create value for the consumer that cannot be matched by the search engines.
What three things can you tell a hotel general man-ager, owner or asset manager about distribution that would have the greatest impact on unit level profit?
If you had a crystal ball, what emerging technologies do you anticipate could be game changers, or at least have the greatest affect on the distribution landscape in the next 2-3 years?
channel management technology will continue to emerge and will become an important game-changer. Revenue management decisions will no longer be based simply on availability, price, length of stay, etc. these decisions will be based on complex algorithms which also factor in the customer acquisition costs and total profit associated with every booking. Major brands that develop and embrace these systems will have a clear edge in improving market share.
Mike ConwayWinegardner & haMMons, inC. hotels & resorts
senior Vice President — Marketing
InDUSTry PErSPECTIVE
it is essential to have a clear strategy in place to shift share away from expensive otA channels and to profitable direct channels.
opaque channels are no longer “opaque.” Participation in these channels simply devalues retail prices.
the cost of an otA transaction does not show up on the profit & loss statement, it is a reduction in revenue. consequently, many owners and asset managers are unaware of the significant cost of otA channels, thus the billion dollar leak in industry revenues!
>>
>>
>>
>>
>>
>>
>>
>>
123
178 An Ah&lA And stR sPeciAl RePoRt
How long have you been in the hotel industry? How long have you been involved with distribution issues?
i have worked in the hospitality industry since the early 90’s when i started out as a consultant for the hospitality consulting firm of laventhol & horwath. For the past 13 years, i have worked closely on solv-ing hotel distribution issues at expedia and now at Google.
In what way does your current role involve distribution?
At Google, one of my roles is to find efficient and cost-effective ways for hoteliers to put heads in beds. by driving demand directly to a hotel website, Google helps hotel suppliers leverage search and other adver-tising platforms as cost-efficient distribution channels.
Where would you say distribution fits into the overall hotel management landscape? Why does distribution matter?
too often, we view distribution as a revenue-man-agement problem rather than a marketing oppor-tunity. there are many viable channels for hoteliers today and companies that are able to effectively manage multiple channels will come out on top. having a comprehensive and measurable distribution strategy is the cornerstone of hotel profitability.
What are the top 3 current issues that will have the greatest impact on hotel distribution in the next two to three years?
smartphones, flash sale sites, and the evolution of online travel Agencies. consumer interaction and booking patterns continue to shift to new digital plat-forms including smartphones and tablets, while flash sales sites continue to gain momentum online. hote-liers need to make sure that they are well educated on the unique and powerful capabilities of these new media — so as to maximize Roi. the online travel agency model will continue to flourish during the next few years, especially as innovative players like booking.com ramp up in the us market. Rather than battle against them as competition, hoteliers should focus on cultivating mutually positive relation-ships with otA’s; hotel properties and brands reach millions of eyeballs via the otA channel, resulting in the opportunity to guide customers towards a direct booking channel (the so-called “billboard effect”).
What is the smartest move you have seen in hotel distribution (by someone other than your own organization)?
booking.com has done an incredible job of building a channel of distribution entirely through online mar-keting. their site is easy for the user to navigate and designed to do one thing very well: sell hotel rooms. by crafting a seamless online experience, booking.com is seeing dramatic share growth in various global markets, as the traveler turns increasingly online for travel.
What is the smartest move your organization has made related to hotel distribution?
early this year, Google launched an offering called hotel Price Ads that enables users to view actual price and availability information next to hotel listings in Google search results and on Google Maps & Place Pages. the pricing and availability data is surfaced via direct connections with otAs and suppliers. because hotel Price Ads provides pricing, availability, and map information simultaneously, users are equipped to make faster, more complete decisions and our partners report receiving increasingly qualified leads. Recently, we also launched a product called hotel Finder. hotel Finder is an experimental tool that makes it easier to find hotels, given certain param-eters. users can: shine a “tourist spotlight” on the most popular areas of a city; apply fine-grain location preferences; flip through a photo-rich summary of each result; keep track of ‘viewed’ hotels and ‘short-listed’ hotels; view how a given price compares to the hotel’s historical average (to see if it’s a cost-effective time to stay in that location). When the user is ready to book a room, hotel Finder connects the user to one of our partners (including both hotel suppliers and online travel Agencies) to fulfill the reservation.
Rob Torres google
Managing director, travel
InDUSTry PErSPECTIVE
>>
>>
>>
>>
>>
>>
continued >>
Published by the hsMAi FoundAtion 179
What is the single biggest oversight or misstep you have witnessed (in your own organization or others in hospitality) in the last two years?
lack of innovation in the travel space has been significant. not since the otA’s emerged in the late 90’s has there been any momentous change in our industry. hopefully, with the rapid rise of mobile technology and online video, we will begin to see some innovative business models emerge. sites like hipmunk and hotel tonight are examples of new entrants already creating buzz in the industry.
What three things can you tell a hotel general manager, owner or asset manager about distribution that would have the greatest impact on unit level profit?
What is the next thing that you predict will disappear or gradually fade away that is currently a part of the distribution scene?
i foresee that distribution will slowly become more accountable and measurable, as new and differ-ent channels are brought into the distribution mix. there will likely be less dependency on just one distribution channel. As hoteliers become savvier at multi-channel management, they will focus on maximizing return rather than on keeping com-plete control over inventory.
If you had a crystal ball, what emerging technolo-gies do you anticipate could be game changers, or at least have the greatest affect on the distribution landscape in the next two to three years?
Mobile is definitely going to be a game changer. consumer adoption of the mobile platform is grow-ing dramatically; mobile search already reflect that surge, with nearly one in five of all hotel-related search queries coming via mobile devices. by the end of 2011, more than half of all Americans will own a smartphone. consumers will not only research, but will feel very comfortable booking and checking into hotels on a mobile device within the next few years. hoteliers need to ensure that they are ready to cap-ture this technological revolution. Mobile optimized websites are a must and applications designed for smartphones and tablets are certainly another step in the right direction!
InDUSTry PErSPECTIVE
there are many channels of distribution avail-able to you, some of which have — in the past — been viewed as marketing channels. you must understand what all the costs and ben-efits of each channel are as you formulate the most profitable mix for your individual property. Additionally, having great content and an easy to use/navigable site is a must for increasing direct business.
>>
>>
>>
Rob Torres google
Managing director, travel
123
180 An Ah&lA And stR sPeciAl RePoRt
Published by the hsMAi FoundAtion 181
Acknowledgements
Published by the hsMAi FoundAtion 181
Many members of the hospitality community contributed to this study. Some contributed data, others participated in interviews to share alternative perspectives and some were readers to verify facts and ensure we covered relevant topics in each chapter. Although we cannot include every name, thank you to all who spoke to us for making this industry study as robust and useful as possible. While all efforts were made for the highest level of accuracy, some sources were contradictory or limited in detail. Apologies in advance for inadvertent oversights or errors but let us know if you see any so we can correct it for the updates. All attempts were made to produce a thorough and unbiased view of the state of distribution for the hotel industry. Thank you to all who took the time to contribute to this Special Report — it is far better for the valuable input we received.
Cindy Estis [email protected]
Mark [email protected]
January 2012
Thank You!
Special thanks to those closely involved with the book’s production:Steve Hood, STRMichael Mariano, Tourism EconomicsAdam Sacks, Tourism EconomicsAlex Smith, STRMichael Snyder, ScrivenerKathleen Tindell, HSMAI
Sponsor Advisory Group:Bob Alter, SunstoneMark Carrier, B.F. SaulTom Corcoran, FelCor
Rebecca Henigin, Henigin Design henigindesign.com
Graphic Design by:

182 An Ah&lA And stR sPeciAl RePoRt182 An Ah&lA And stR sPeciAl RePoRt
Chris Anderson, Cornell University
Scott Anderson, High Country Hospitality
Julie Atkinson, Starwood
David Becher, RRC/STR
Cody Bradshaw, Starwood Capital
Fran Brasseux, HSMAI Foundation
Chris Brosnahan, Carlson
Banks Brown, McDermott Will & Emery LLP
Paul Brown, Hilton
Bonnie Buckhiester, Buckhiester & Assoc.
Thomas Buoy, Extended Stay Hotels
John Burns, Burns Hospitality Technology Consulting
Denise Bynum, AnyRate
Elizabeth Cambra, Outrigger
Bill Carlson, Choice
Doug Carr, Fairmont
Mark Carrier, B.F. Saul
Bill Carroll, Cornell University
Andressa Chapman, Wild Dunes
Robert Cole, RockCheetah
David Colker, DLA Piper LLP
Isaac Collazo, IHG
Marlene Colucci, AH&LA
Keith Cotton, Derbysoft
Greg Cross, Hyatt
Bill Daddi, Daddi Brand Communications
Alise Deeb, La Quinta
Gigi DesLauriers, Carlson
Dorothy Dowling, Best Western
Mike Durazo, Best Western
Jimmy Egeland, Edelman PR
Gayle Ehrean, Sir Francis Drake
Riley Erin, Sabre
Oliver Fasching, Jumeirah
Brian Ferguson, Expedia
Leah Feygin, Kayak
Al French, Marriott
Rick Garlick, Maritz Research
Gareth Gaston, Wyndham
Rose Genovese, Denihan
Bob Gilbert, HSMAI
Wayne Goldberg, La Quinta
Nick Graham, Expedia
Nathaniel Green, Cornell University (Class of ’13)
Lew Harasymiw, Synxis
Sascha Hausmann, eRevMax
Adam Healey, Room Key
Susan Helstab, Four Seasons
Steve Hennis, STR Analytics
Lauren Hogan, USA Today
Karen Hughes, Starwood
Kurien Jacob, Highgate
Ashwin Kamlani, Regatta
PK Kannan, University of Maryland
Duncan Kennedy, Starwood
Linda Kent, Wyndham
Mike Kistner, Pegasus
Dan Kowalewski, Wyndham
Sandra Langley, IHG
Gary Leopold, ISM Marketing
Carol Levitt, Sabre
Theresa Lewis, Wyndham
Angelo Lombardi, La Quinta
Jon Londeen, Leading Hotels
Flo Lugli, Wyndham
Gautam Lulla, TravelTripper
Melissa Maher, Expedia
Michelle Marquis, Navis
Greg Martell, Marriott
Shawn McBurney, AH&LA
Joe McInerney, AH&LA
Lisa Muret, IHG
Tina Newman, Enchantment Group
Blair Nixon, Cornell University (Class of ’12)
Stephanie Noris, NorBella
Linda Palermo, Joie de Vivre
Valyn Perini, OpenTravel Alliance
Tammy Peter, Wyndham
Tim Peter, Tim Peter
Mark Phillips, Landry & Kling
Kathryn Potter, AH&LA
John Price, Thompson Hotels
Paul Reynolds, B.F. Saul
Connie Rheams, Pegasus
John Romeo, AnyRate
Andrew Rubinacci, IHG
Lori Satterfield, STR
Fred Schwartz, AAHOA
Charles Seilheimer, Room Key
Chinmai Sharma, Wyndham
Cara Shortsleeve, Google
Chris Silcock, Hilton
David Sjolander, Pegasus
Jason Smith, HSMAI
Randy Smith, STR
Michael Snyder, Scrivener
Robert Snyder, Tishman
Stephanie Sonnabend, Sonesta
Ed St. Onge, EZYield
Lindsay Stout, Edelman PR
Maxine Taylor, Chartres Lodging
Susan Thronson, Marriott
Kathleen Tindell, HSMAI
Rob Torres, Google
Menka Uttamchandani, Denihan
John Wallis, Hyatt
David Warman, Four Seasons
Kristi White, TravelClick
Tim Wiersma, Revenue Generation LLC
Mylene Young, Sonesta
Lucy Zheng, Cornell University (Class of ’13)
Cicily Zhou, Cornell University (Class of ’12)
Jim Zito, King and Grove Hotels
Rosanne Zusman, Wyndham
Acknowledgements
Published by the hsMAi FoundAtion 183
Glossary
Published by the hsMAi FoundAtion 183
A/B Testingtesting of ad campaigns or website design elements with two formats—an “A” and a “b” to compare results
Abandonmentthe point at which a website visitor discontinues an online process and moves on to another or leaves a website. Most often refers to dropping out of a booking process once it has been started.
ADRthe average daily rate is calculated by dividing total room revenue by the number of room nights sold in a period.
ADSAlternate distribution system. see also odd.
AcquisitionA marketing term to describe the process of getting or ac-quiring a customer.
Affiliate marketingthis online method is similar to a travel agency or referral service. there are networks of affiliate marketers (represent-ing participants in many industries) who find consumers with similar interests and provide referrals to any participat-ing website vendors who are an appropriate fit. the net-work handles the sale and the billing, tracks production, and collects a fee or commission on the sale.
AH&LAthe American hotel and lodging Association is based in Washington dc and represents the u.s. lodging industry for government legislative representation and for educational, informational and networking purposes. Visit their website at www.ahla.com.
Algorithmthe complex mathematical formula used by search engines and applied to determine the ranking for the listings that are returned in response to a keyword query. the search engine sends “bots” or “spiders” to collect information about each website in its database and codes it so when the algorithm searches the database. each website is assessed to deter-mine its relevance relative to the keyword being used in that instance.
Alt-tagsthese are the text tags that are attached to a graphic image on a website or in computer software to identify the graphic when you hold your mouse above the image. it could define the purpose of a graphic icon or be a word like “advertise-ment” to indicate that a graphic is an ad for a product. At one time this text was heavily used in search engine algo-rithms but its usage has declined.
ASPAn application service provider is one that offers technology through remote channels, usually through the internet. the user hotel only needs to install computers that are powerful enough to access the main system, usually through an inter-net connection, and a hotel usually pays for service by trans-action. there is no need for large capital investments at the hotel level. the AsP service upgrades and maintains its own system and the hotel just pays for usage. this is now often called “cloud” computing since the systems being used are remote from the actual user. (see also cloud computing).
Attitudinal data or metricsthe type of data that refers to what a website visitor is thinking about a website (website satisfaction) or about their online experience or about the reason or rationale for their website visit. Any type of data that describes the online visitor’s attitudes or perceptions would be part of attitudinal data. this data is almost always survey-based.
Behavioral data or metricsthe type of data that refers to what a website visitor is doing on a website or while they are online would be behavioral. this includes movement within a website or between web-sites. it could be survey-based but is usually system-generat-ed based on data files that track user movement.
Behavioral targetingthe process of directing promotional messages at a website visitor that is tailored to fit the user’s online behavior. be-havioral defines how someone acts not just once but over a series of time. so by definition, behavioral targeting re-quires a collection of data on a user (user profile). (see also contextual targeting.)
184 An Ah&lA And stR sPeciAl RePoRt
Booking engineA booking engine is the technology that allows reservations to be made on a website. this usually refers to the technol-ogy needed to power the booking function of a website so visitors can make a hotel reservation. it is comparable to a shopping cart on a retail website.
Blogs derived from the words “Web log,” blogs are personal or corporate online journals that offer reporting and/or opin-ions about people, things and events. they are designed to allow readers to post responses or comments. the most suc-cessful blogs generate a high degree of interactive dialogue. they are dated in reverse chronological order with the new-est material always at the top of the page and are often as-sociated with keyword tags for bookmarking and available as feeds for Rss readers.
Brand agnosticthis is a “nickname” for the group of online customers who are not inclined to go to an individual hotel or branded hotel site by name. A brand agnostic usually wants to cast a wider net based on type of hotel, destination/location, services of-fered or other variables in order to generate a short list of choices for hotel selection.
Brand flagthe brand name for a hotel affiliated with a chain.
Cachingthe technical methodology used on large websites to man-age high volume of inquiries or bookings on a site.
CAN-SPAM ACT of 2003the controlling the Assault of non-solicited Pornography and Marketing Act requires unsolicited commercial e-mail messages to be labeled (though not by a standard method) and to include opt-out instructions and the sender’s physical address. it prohibits the use of deceptive subject lines and false headers in such messages. the Ftc is authorized (but not required) to establish a “do-not-email” registry. state laws that require labels on unsolicited commercial e-mail or prohibit such messages entirely are pre-empted, although provisions merely addressing falsity and deception would remain in place. the cAn-sPAM Act takes effect on January 1, 2004.
the cAn-sPAM Act of 2003 was introduced by senators conrad R. burns (R-Mt) and Ron Wyden (d-oR) in April 2003, with minor changes from the previous year’s version, s. 630 (2002). two other bills (s. 1231 and s. 1293) were subsequently merged into it. the final version was approved by the senate in november 2003 and by the house of Rep-resentatives in december 2003, and was signed into law by President bush on december 16, 2003.
Channel managementthe techniques and tools used by hotels to update hotel in-formation, room inventory and rates in each of the distribu-tion channels in which they are represented.
Clickstream datathis data is generally the system-generated trail of files that capture the movements of users within a website. the clicks refer to every action taken by a website visitor and each of these clicks creates a file that is stored and analyzed to create a stream of activity.
Click paththe sequence followed by a website user that is generally a series of pages viewed or websites entered during the course of an online visit.
Click-through ratethe number of website visitors that click onto a promotional image (e.g. link, keyword, ad) as a percentage of total web-site visitors.
Cloud Computingthis is a type of technology that is operated and managed remotely and accessed through a network, usually through internet connections. it saves each individual location from having to install, train and invest in extensive onsite tech-nology and allows many users to tap into one centralized source that is always available and can be customized for each individual user. it is often charged on a “metered” type of fee structure so you pay for the space and transaction vol-ume you use from the central system that is “in the cloud.”
Content syndication the distribution of text, videos and photos to other websites to extend the reach of a brand by making its products more widespread, allowing others to subscribe to the content on a website to be used elsewhere. this may be done through the use of Rss enabling technology (see also Rss).
Contextual targetingthe process of showing a web visitor an ad that is relevant to what that person is doing at that point in time. it is usu-ally driven by the content on the page(s) the user has ac-cessed during this particular web visit and tries to give the user something relevant on the page they are on. (see also behavioral targeting.)
ConversionRefers to the transition by a customer from shopping or gathering information to taking an action such as purchas-ing or making an inquiry.
Published by the hsMAi FoundAtion 185
Glossary
Conversion funnelusing the metaphor of a funnel, a website visit is viewed as a series of steps and the number of website visitors that take each subsequent step is recorded. A graphic depiction is of-ten shown to indicate where the greatest number of visitors “drop out” of the conversion or booking process.
Cookiessmall text files created by a web server and sent back to a user’s web browser to store useful information that makes an existing or subsequent visits more efficient. there are “session” and “persistent” cookies that describe the time-frame for which they are stored. cookie files describe a user’s browser and visit, but do not contain any personal informa-tion about the person making the website visit.
CPAcost per action (also called cost per acquisition) in a mar-keting campaign is calculated by dividing the total cost of the campaign by the number of actions undertaken by the target audience, such as an inquiry, booking, email address submission, information request, or other desirable action.
CPCcost per click (same as pay-per-click) refers to the total cost of a marketing campaign divided by the number of clicks received through the site where the campaign was directed.
CPMcost per thousand refers to the total cost of a marketing campaign divided by the number of impressions made in the target audience (impressions counted in thousands). cPM is cost per thousand impressions.
CPOcost per order refers to the total cost of a marketing cam-paign divided by the number of orders received as a result of the campaign.
CRMcustomer relationship management is a marketing process supported by technology that allows hotels to improve the information about their customers and the communications they have with them in order to improve their relationships and gain more loyalty through higher levels of engagement.
CRS or CROcentral Reservation system or central Reservation office. this could be a system or an office that is used by hotels in one chain or organization or it could be one created by a third party vendor to support many unrelated independent hotels and small chains. these systems are used to maintain hotel information, inventories, and rates and to manage the reservation process for the chain or hotels in the system.
Dynamic cross sellingAllowing the consumer to purchase multiple products with-out bundling them into a package. the system facilitates the sale of ancillary products while the site visitor has a primary interest in one product. For example, an airline or hotel com-pany can offer car rental to its visitors without combining it with airfare or a hotel rate. some practitioners claim higher conversion rates if the ancillary products are offered in the course of the primary booking, rather than as an add-on suggestion.
Dynamic packaging (two definitions)this is the type of technology built into booking engines that allows a customer to choose and book multiple elements in their travel plan (in one website) such as air, hotel, car rental. this can also be applied to the functionality in a hotel’s web-site to allow booking of multiple elements of a hotel visit to include, for example, hotel room, theatre tickets, golf tee times, spa appointments and restaurant reservations.
EISexecutive information systems or business intelligence sys-tems designed to combine information from different sourc-es and facilitate management decisionmaking.
Extranetthe functionality used by some large online agencies that is accessible by a web browser to allow a hotel reservation department to update their hotel information, room inven-tory and/or rates. it looks like a website but it is password restricted to authorized hotel users and only allows informa-tion entry and updating.
GDSthe Global distribution systems including the big four: Ama-deus, Galileo, sabre, Worldspan. these are the large reserva-tion systems originally designed for airlines and now widely in use by travel agents only to book all forms of travel. these systems generally use older technology and are not connect-ed through the internet, however most of the Gds vendors also have related websites for various customer groups and they power portals for corporate accounts. travelport’s Gali-leo has acquired Worldspan and will be combining the best of both systems.
Hard hotel brand (see also Soft Brand)A hard brand is one in which a chain name is used to identify all hotels within the group (e.g. Marriott, Ramada, hilton, hyatt) and these hotels are all connected by ownership or management contract.
186 An Ah&lA And stR sPeciAl RePoRt
HITECAn annual industry conference run by hFtP (hospitality Fi-nancial and technology Professionals) that is the largest and most comprehensive worldwide showcasing hospitality technology. Refer to www.hitec.org or www.hftp.org/hitec.
Hitsthe number of times any element of a page is downloaded, including frames, images, text boxes. A hit is not the same as a page view. A “hit” is registered every time any part of a page is loaded, while a page view is the entire page. this is not a valuable marketing metric for this reason. (see also page views.)
HTNGhotel technology-next Generation is an initiative within the hospitality technology field in which companies (vendors and hotel brands) have joined together to establish common standards that will improve the integration and development between the many disparate and legacy systems used in hos-pitality. the purpose is to create more customer-friendly sys-tems and to help ensure that vendors and hotel companies are moving in concert toward the goal of technology that is more functional, more consistent with cutting edge develop-ments globally and more customer-centric in its application. note: htnG is using opentravel messages to facilitate inter-action between systems. Refer to www.htng.org.
ISP vendorAn internet service provider that provides internet connectiv-ity to an organization or to consumers. examples of large and popular isPs are comcast, cox, Adelphia, and Aol.
IP addressthis is the internet protocol address that is assigned to a computer once it is connected to a network. there are static and dynamic iP addresses that refer to whether a computer has a “permanent” address assigned or if it gets a new one every time it connects to the network.
JavascriptA registered trademark of sun Microsystems and licensed to netscape, this scripting language is a programming format most often used on websites and is only distantly related to Java programming language. it is most often used to write functions embedded in htMl web pages to perform func-tions that htMl cannot do alone. some common usages are to allow for window popups, web form validations and image changes triggered by mouse movements over them.
KeywordA word used in a search engine (such as Google, yahoo, Msn) in order to query the database and get a listing back (search engine Results Page or seRP) to answer a question, choose a hotel, or find information on a particular topic.
KPIs (key performance indicators)A KPi is a calculated ratio that measures some element of performance on a website.
Leading indicators (see also trailing indicators)the online metrics that are predictive of future behavior or performance. they are the metrics that help a web manager forecast some form of online activity.
Log files (for a web server)A text file that is written to document the activity of a web server. the most common information in log files include iP address, password and user id of user (if known), date and time of activity, the request of pages/information from the server, the size of the returned object.
Look-to-book ratioused in the travel industry to show the percentage of web-site visitors (lookers) relative to the number who book on the website (bookers).
LTV (lifetime value) analysisthe market analysis done on consumers to indicate the rev-enue each has generated over the time period for which an organization keeps records or designated timeframe used by the organization.
Mash-up is an application that pulls and displays information from different sources in response to user queries; they are a blending of different forms of online information such as maps with restaurant menus, or maps with hotel listings. An example would be plotting hotels, with their names, on a map along with local restaurants and/or attractions.
Merchant modelthe business model used by online travel agencies that so-licits net rates (non commissionable and discounted) from hotels that are then marked up and sold online. the affected hotel may or may not know the rate that is ultimately posted and/or sold even after the guest arrives at their hotel. the rate they sold to the online travel agency is not posted on the guest folio. this model was used historically in offline agencies and they were known as “wholesalers” who nor-mally marked it up and sold it through packaging to retailer agencies.
Meta-search this is a type of search engine that is used for travel-specific purposes. these search engines specialize in travel and offer criteria to users that are unique for travel searches such as location, dates, rates, quality ratings and other variables that are meaningful for travel planning. Kayak, sidestep, hip-munk, trivago and others offer meta-search tools.
Published by the hsMAi FoundAtion 187
Glossary
Meta-tagsdescriptive text within website code to describe what the website is offering. this text is indexed by search engine soft-ware (spiders) to factor into their ranking algorithms. copy-writing of meta-tags is an element of organic search engine optimization.
Monetary value (see also recency, frequency, LTV)A form of consumer evaluation based on how much money a consumer spends with an organization.
ODD (Onward distribution)onward distribution is the process of making hotel invento-ry, information and rates available throughout the internet’s travel websites. this may be done by providing it to a cRs or switch and/or passing it along manually. the wide range of travel websites throughout the internet is sometimes re-ferred to as Ads (alternative distribution system) or ids since it came about as an alternative to cRs and Gds systems.
Online Travel Agency (abbreviated OTA and also called OTC, online travel company)this refers to the large websites offering travel agency servic-es online and offering wide ranges of hotel offerings (usually thousands) using both wholesale and retail pricing models. Many were initiated as online only, however, some also of-fer traditional offline service. examples of popular otAs are expedia and travelocity.
Opaque brand, packaging, pricingthis type of business model is used by websites when the cus-tomer commits to a purchase without first knowing the brand, the prices of each element of a travel package or the price.
Open rateA common metric used to show the percentage of promo-tional email messages that have been opened by recipients relative to the number emailed out. the difference is gener-ally accounted for by “bouncebacks” or bad addresses that do not reach anyone and return to the sender and those that are deleted by the recipient.
OpenTravelthe opentravel Alliance is an organization made up of travel industry companies who are developing standard XMl mes-sages that can be used to exchange traveler information between travel trading partners, including hotels, car rental companies, airlines, railways, cruise lines, travel agencies and distributed. Functions include search, availability, pricing/rates, reservation/booking, modification, cancellation, itin-erary, content distribution, along with many others. these messages take the place of proprietary messages and can be used and re-used, speeding time to market for new distribu-tion partners and new distribution products.
Page tagsA type of tracking file that is comprised of javascript to cap-ture information about a website visitor’s browser and the pages the user requests all packaged into a small “gif” im-age. this is a tracking file used to replace or to complement system usage tracked with log files. (see also log files.)
Page viewsunlike “hits” which measure parts of a page, a page view is the metric that measures the full page seen by a website visitor. one page view means one person seeing one com-plete page of a website. if someone spends a long time on a website and looks at ten different pages, they would be measured as ten page views. (see also hits.)
PMSA Property Management system is used onsite in an indi-vidual hotel to allow for guest check-in and check-out. these systems vary but most have functionality for room inventory tracking, assignment of rooms, making internal reservations, generating guest billing, flagging rooms that are not avail-able, and guest messaging.
PPC (pay-per-click)this marketing technique is employed when a marketer es-tablishes links or advertising copy on a web page and agrees to pay a fee (usually from $.05-$5.00) for each time a web-site visitor clicks on a link or ad on a web page. the link or ad only appears on a page in response to a particular keyword entered into a search engine so different keywords result in different fees depending on their popularity. (see also seo.)
Price Elasticitythis is an economic measure that shows the responsive-ness or “elasticity” of the demand for a product based on a change in its price. in terms of hotel rooms, a high level of elasticity means that consumer demand changes a lot as prices change. A positive elasticity means that there is a lot of demand growth in response to lowered prices and the de-mand compensates for the lowered rates. A negative elastic-ity means that the demand growth prompted by lower rates is not adequate to compensate for the revenue lost due to lower prices.
Rate integritythis term refers to consistency of rates between systems so the same rate and availability options will be displayed in all systems connected to the cRs. this is a technical and management issue that ensures each system is working with the same formulas and following the same revenue man-agement guidelines to respond to user queries whether on a hotel/chain website, third party website, cRs call center, and/or individual hotel.
188 An Ah&lA And stR sPeciAl RePoRt
RMSRevenue Management systems.
Rate paritythis term refers to the strategy to maintain consistency of rates between sales channels. they are usually enforced through contractual agreements between hotel companies and the third party vendors who sell their inventory to ensure the rates available for any given time period will be consis-tent. this ensures that a supplier and a third party vendor will not compete with each other by offering “better deals” to customers for any given time period and all channels used will be rate consistent in the eyes of the consumer.
Recency (see also frequency, monetary value, LTV)A method used to determine the value of specific consumers or groups of consumers based on how recently they have used or purchased a product or service.
Retail modelthis is a pricing model used by online and offline travel agen-cies to sell a hotel rate as provided by a hotel for which the hotel pays a commission on the sale, usually 10%.
Retentionthis refers to any marketing methods used to keep existing customers.
Referral sourcethe last website that a user visited prior to visiting the current one is called the referral source. this might include a search engine, directory or other website in which there is a link or some other directive to send a user to another website.
Revpar/revpacRevenue per available room is a metric used to assess how well a hotel has managed their inventory and rates to op-timize revenue. it is calculated by multiplying occupancy x average rate (or by dividing room revenue by total number of rooms in a property) for a given period. some marketers would like to calculate Revpac or revenue per available cus-tomer to gauge how much revenue is generated from each customer in house at any given time. this is meant to assess how well a hotel sold room rate as well as ancillary revenue centers.
Response ratethis refers to the number of actions taken in response to a marketing campaign relative to the number who received the campaign message.
Revenue management this is the art and science of managing room inventory and rates in order to optimize hotel revenue given the constraints of competitive supply in the marketplace with the flow of demand at every rate level.
RSSReal simple syndication allows consumers to designate what news or information they want sent to them and that ap-pears on their browser rather than via email or by going to a specific news section of a website. A user signs up or “opts in” for specific categories of information and when that in-formation is updated or new information is available, it is au-tomatically delivered to those who had previously indicated an interest in receiving it. there are Rss feeders that a user has to load on their web browser and then the content ap-pears when they sign onto their browser. it is a technique of-ten used in place of email which is hampered by spam filters and wholesale deletions.
RFPthis is a request for proposal that is used in online channels to refer to the booking of group space or corporate rates. Group organizers/meeting planners put out their needs to a list of hotels with the expectation of receiving sales propos-als. Also, RFPs are used in the process hotels go through with corporate travel agencies to propose corporate rates and gain prominence in company’s travel listings for their city.
Search enginesthe websites like Google, yahoo and bing created to help users find information online by entering keywords (to form queries) and reviewing the summarized lists of information that are returned in response. usually the results from a search engine query refer to information sources, most often websites, a visitor can contact to get more information.
SEOsearch engine optimization (also called search engine mar-keting) is the process advertisers use to gain prominence in the listings from query returns (entered as keywords) so more visitors are referred to an advertiser. there is “organic” or “natural” seo that refers to a website’s efforts to be ranked high on a listing by virtue of appropriate copywriting and links from and to relevant and complementary sites. there is a form of seo marketing (PPc) in which a website pays for a prominent listing in response to a specific keyword. see also PPc.
SERPseRP is the abbreviation for “search engine Results Page,” which is what comes up in a search engine after a keyword is typed in.
Published by the hsMAi FoundAtion 189
Glossary
SegmentationA method used by marketers to stratify their prospective or existing customers into meaningful groupings for the pur-poses of targeted communications or product/service devel-opment.
SMAsMs is the abbreviation for “short Message service”, refer-ring to the system that text messaging uses. text messages are sometimes called “sMs.”
Social mediasocial media is the term used to describe the tools and plat-forms people employ to publish, converse and share content online. the tools include blogs, wikis and podcasts, as well as sites designed to stimulate user interaction among users with common interests through sharing of photos, videos and bookmarks. consumer review sites are a popular form of social media used in travel and the use of a site like Face-book (fan or business pages) is a common form of social networking used for business-to-consumer interaction.
Soft hotel brand (see also Hard hotel brand)these brands provide marketing, sales and reservations sup-port to independent hotels and small chains so they gain the sales and marketing capabilities of a larger chain and still re-tain their management independence. these soft brands do not have ownership or management agreements with their hotels and the hotels do not take on the name of the soft brand, except as a part of the reservation network. examples of soft hotel brands are utell, Preferred hotels, leading hotels of the World, historic hotels of America, and Golden tulip.
Switch servicesthe services in hospitality (Pegasus, hbsi, derbysoft) that create a connection between cRs and all outside systems including Gds, online travel agencies and other third party websites and services so individual hotels and hotel chains do not each have to create their own connection (or inter-face) to these other sites in order to maintain hotel informa-tion, inventory, rates and receive reservations.
TMCtravel Management company—these companies handle corporate accounts for booking, cost tracking and policy compliance.
Timeframe (unique visitors)A crucial component applied to specific online statistics to indicate the amount of time represented by the metric. For example, unique visitors can be counted for each 24-hour period, or they can be counted on a weekly basis. those con-sidered unique each day would be counted in the 24-hour metric; those who are unique over the period of seven days would be counted in the weekly one.
Top exit pagethe web page identified as the one most commonly visited last by the most users.
Trafficthe volume of visitors or visits on a web page.
Trailing indicators the online metrics that describe historical or past behavior or performance. (see also leading indicators.)
UGC the abbreviation for “user Generated content” and in-cludes all text, photos, videos and other materials that can be produced and displayed online by consumers. this term is often used interchangeably with social media but that is not an accurate characterization since some social media is produced commercially but shared socially and some user-generated content may not be social in nature at all.
Unique visitoreach person going to a website in a given timeframe. they are unique when there is a system to avoid counting the same person twice.
Unique user identificationA code or password associated with a person who visits a website to identify them distinctly and individually from any other person who visits.
URLthis is a website address and usually looks like this: www.somecompany.com.
Visitused interchangeably with session, a website visit is what gets counted when a user enters a website and views the first page. this usually times out at thirty minutes if there is no activity by the user and a new visit is counted.
Visitoreach person who enters to a website; they are counted when they open the first page of the site.
XMLthis is a type of language (eXtensible Markup language) that facilitates the sharing of data across different informa-tion systems, usually via the internet. the message library used by opentravel is written in XMl.
190 An Ah&lA And stR sPeciAl RePoRt
Web 2.0 or Web 3.0Web 2.0 or Web 3.0 is the term describing the use of the network as an online platform to allow interaction among all users. interaction is improved through an “architecture of participation” (as websites get used, they are improved by the users through added, enriched or modified content) going beyond the page metaphor (referring to web pages) of Web 1.0 to deliver richer user experiences.1
WidgetsWidgets, sometimes also called badges, gadgets, modules, flakes, capsules or snippets, are small utilities such as a “plug in” (often using Javascript or Flash) that can be in-stalled on any htMl web page without further compilation or processing. Widgets appear on a user’s desktop allow-ing performance of certain functions such as subscribing to a feed or making a donation. some anticipate widgets will become a new marketing vehicle due to their functionality, ease of use and popularity. they are a highly distributable web media that will lend themselves to the upcoming needs of web users to be transported between devices and used on smaller mobile devices.
1o’Reilly tim, ceo and Founder of o’Reilly Media coined the term for the first conference on the subject in 2004.
WikiWiki is a collaborative website that is open to anyone, with or without programming skills, for editing, additions or up-dating. Wiki is unusual in that it allows the organization of contributions (i.e., the categories and sections) to be edited in addition to the content itself. typically, changes are in small increments but there is a high volume of changes. the only quality control on wiki sites is through observation by the user community and there is no official screening for inaccuracies. Wiki is the hawaiian word for “quick” and the term was first used in 1995 by software engineers at the Portland Patterns Repository. the term later entered wide-spread use when Wikipedia began to create the first user-generated encyclopedia.
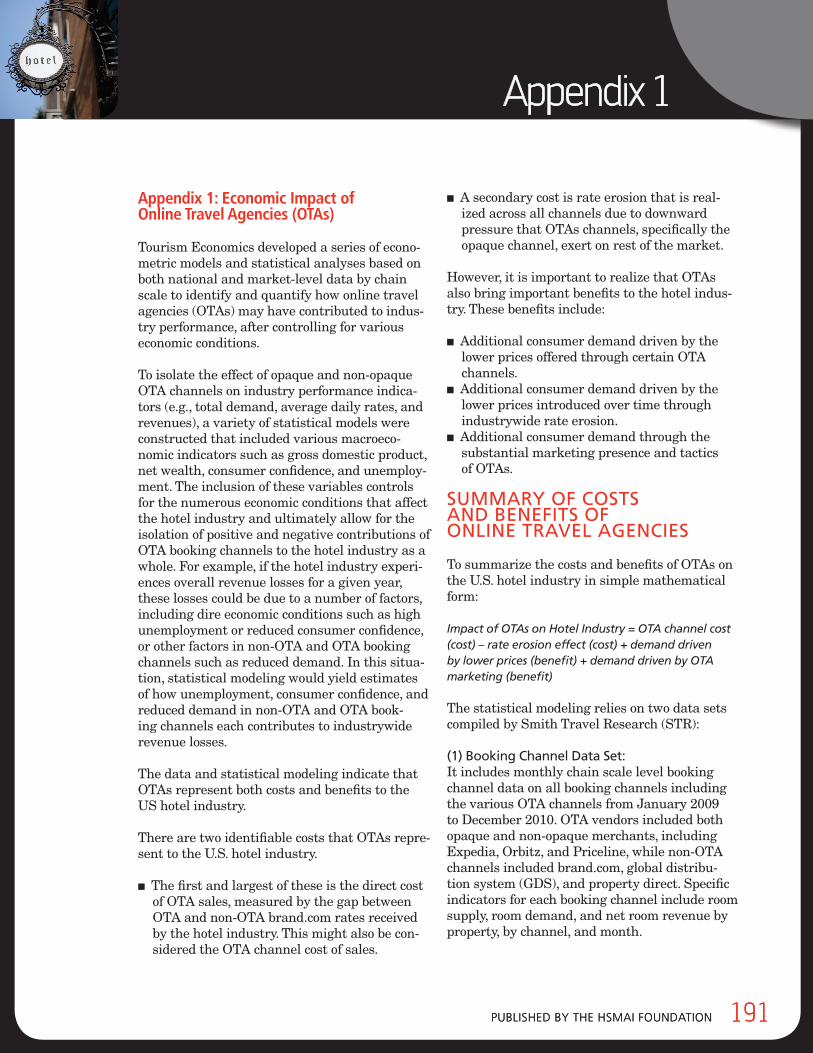
Published by the hsMAi FoundAtion 191
Appendix 1
Published by the hsMAi FoundAtion 191
Appendix 1: Economic Impact of Online Travel Agencies (OTAs)
Tourism Economics developed a series of econo-metric models and statistical analyses based on both national and market-level data by chain scale to identify and quantify how online travel agencies (OTAs) may have contributed to indus-try performance, after controlling for various economic conditions.
To isolate the effect of opaque and non-opaque OTA channels on industry performance indica-tors (e.g., total demand, average daily rates, and revenues), a variety of statistical models were constructed that included various macroeco-nomic indicators such as gross domestic product, net wealth, consumer confidence, and unemploy-ment. The inclusion of these variables controls for the numerous economic conditions that affect the hotel industry and ultimately allow for the isolation of positive and negative contributions of OTA booking channels to the hotel industry as a whole. For example, if the hotel industry experi-ences overall revenue losses for a given year, these losses could be due to a number of factors, including dire economic conditions such as high unemployment or reduced consumer confidence, or other factors in non-OTA and OTA booking channels such as reduced demand. In this situa-tion, statistical modeling would yield estimates of how unemployment, consumer confidence, and reduced demand in non-OTA and OTA book-ing channels each contributes to industrywide revenue losses.
The data and statistical modeling indicate that OTAs represent both costs and benefits to the US hotel industry.
There are two identifiable costs that OTAs repre-sent to the U.S. hotel industry.
n The first and largest of these is the direct cost of OTA sales, measured by the gap between OTA and non-OTA brand.com rates received by the hotel industry. This might also be con-sidered the OTA channel cost of sales.
n A secondary cost is rate erosion that is real-ized across all channels due to downward pressure that OTAs channels, specifically the opaque channel, exert on rest of the market.
However, it is important to realize that OTAs also bring important benefits to the hotel indus-try. These benefits include:
n Additional consumer demand driven by the lower prices offered through certain OTA channels.
n Additional consumer demand driven by the lower prices introduced over time through industrywide rate erosion.
n Additional consumer demand through the substantial marketing presence and tactics of OTAs.
SUMMARY OF COSTS AND BENEFITS OF ONLINE TRAVEL AGENCIES
To summarize the costs and benefits of OTAs on the U.S. hotel industry in simple mathematical form:
Impact of OTAs on Hotel Industry = OTA channel cost (cost) – rate erosion effect (cost) + demand driven by lower prices (benefit) + demand driven by OTA marketing (benefit)
The statistical modeling relies on two data sets compiled by Smith Travel Research (STR):
(1) Booking Channel Data Set:It includes monthly chain scale level booking channel data on all booking channels including the various OTA channels from January 2009 to December 2010. OTA vendors included both opaque and non-opaque merchants, including Expedia, Orbitz, and Priceline, while non-OTA channels included brand.com, global distribu-tion system (GDS), and property direct. Specific indicators for each booking channel include room supply, room demand, and net room revenue by property, by channel, and month.
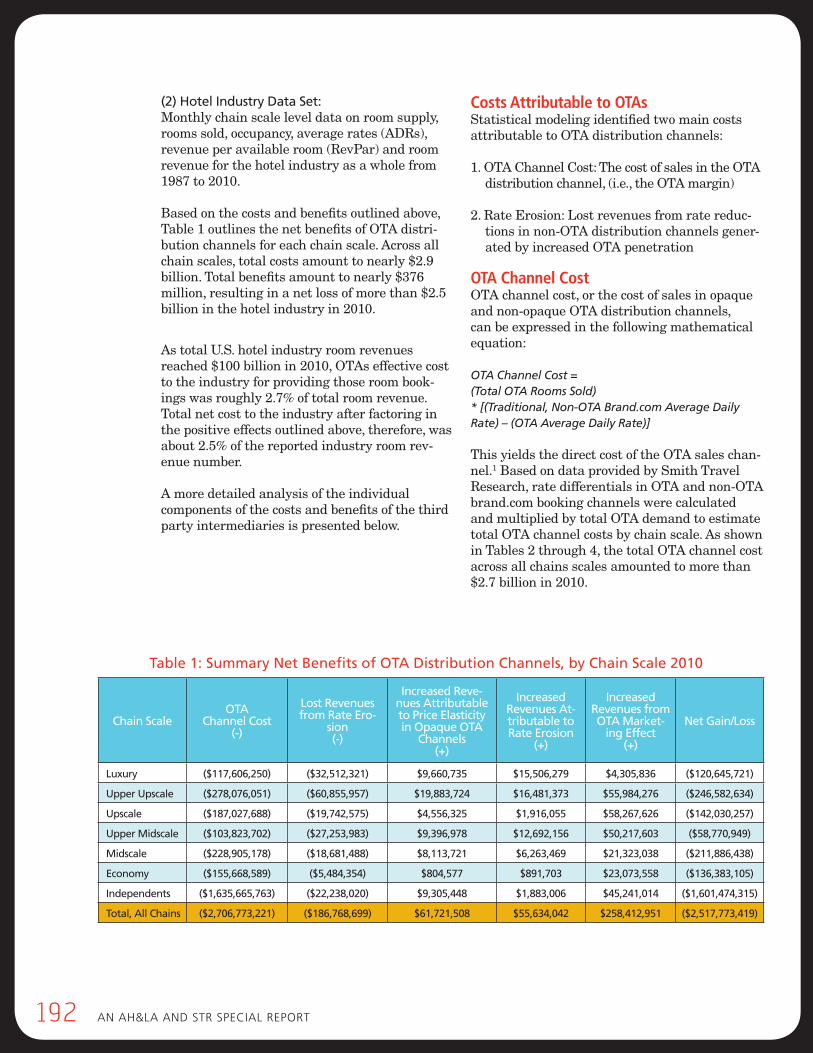
192 An Ah&lA And stR sPeciAl RePoRt
(2) Hotel Industry Data Set:Monthly chain scale level data on room supply, rooms sold, occupancy, average rates (ADRs), revenue per available room (RevPar) and room revenue for the hotel industry as a whole from 1987 to 2010.
Based on the costs and benefits outlined above, Table 1 outlines the net benefits of OTA distri-bution channels for each chain scale. Across all chain scales, total costs amount to nearly $2.9 billion. Total benefits amount to nearly $376 million, resulting in a net loss of more than $2.5 billion in the hotel industry in 2010.
As total U.S. hotel industry room revenues reached $100 billion in 2010, OTAs effective cost to the industry for providing those room book-ings was roughly 2.7% of total room revenue. Total net cost to the industry after factoring in the positive effects outlined above, therefore, was about 2.5% of the reported industry room rev-enue number.
A more detailed analysis of the individual components of the costs and benefits of the third party intermediaries is presented below.
Costs Attributable to OTAsStatistical modeling identified two main costs attributable to OTA distribution channels:
1. OTA Channel Cost: The cost of sales in the OTA distribution channel, (i.e., the OTA margin)
2. Rate Erosion: Lost revenues from rate reduc-tions in non-OTA distribution channels gener-ated by increased OTA penetration
OTA Channel CostOTA channel cost, or the cost of sales in opaque and non-opaque OTA distribution channels, can be expressed in the following mathematical equation:
OTA Channel Cost = (Total OTA Rooms Sold) * [(Traditional, Non-OTA Brand.com Average Daily Rate) – (OTA Average Daily Rate)]
This yields the direct cost of the OTA sales chan-nel.1 Based on data provided by Smith Travel Research, rate differentials in OTA and non-OTA brand.com booking channels were calculated and multiplied by total OTA demand to estimate total OTA channel costs by chain scale. As shown in Tables 2 through 4, the total OTA channel cost across all chains scales amounted to more than $2.7 billion in 2010. 1
Chain ScaleOTA
Channel Cost (-)
Lost Revenues from Rate Ero-
sion (-)
Increased Reve-nues Attributable to Price Elasticity in Opaque OTA
Channels (+)
Increased Revenues At-tributable to Rate Erosion
(+)
Increased Revenues from OTA Market-
ing Effect (+)
Net Gain/Loss
Luxury ($117,606,250) ($32,512,321) $9,660,735 $15,506,279 $4,305,836 ($120,645,721)
Upper Upscale ($278,076,051) ($60,855,957) $19,883,724 $16,481,373 $55,984,276 ($246,582,634)
Upscale ($187,027,688) ($19,742,575) $4,556,325 $1,916,055 $58,267,626 ($142,030,257)
Upper Midscale ($103,823,702) ($27,253,983) $9,396,978 $12,692,156 $50,217,603 ($58,770,949)
Midscale ($228,905,178) ($18,681,488) $8,113,721 $6,263,469 $21,323,038 ($211,886,438)
Economy ($155,668,589) ($5,484,354) $804,577 $891,703 $23,073,558 ($136,383,105)
Independents ($1,635,665,763) ($22,238,020) $9,305,448 $1,883,006 $45,241,014 ($1,601,474,315)
Total, All Chains ($2,706,773,221) ($186,768,699) $61,721,508 $55,634,042 $258,412,951 ($2,517,773,419)
Table 1: Summary Net Benefits of OTA Distribution Channels, by Chain Scale 2010
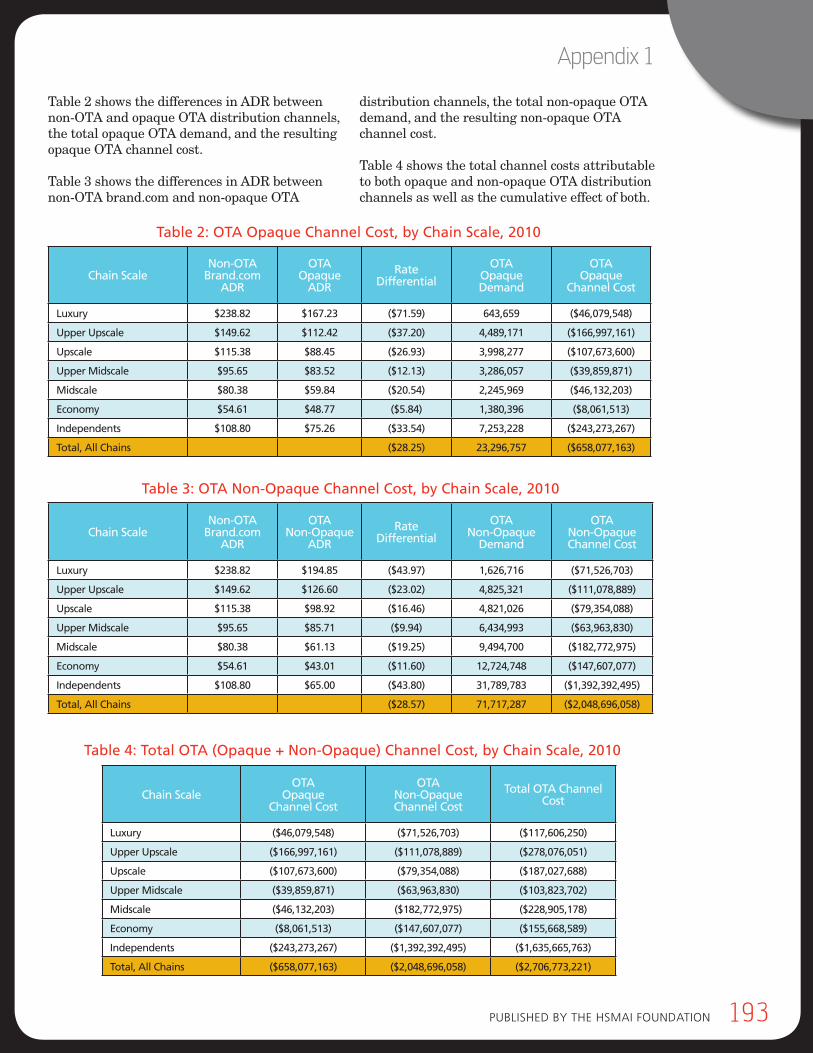
Published by the hsMAi FoundAtion 193
Appendix 1
Table 2 shows the differences in ADR between non-OTA and opaque OTA distribution channels, the total opaque OTA demand, and the resulting opaque OTA channel cost.
Table 3 shows the differences in ADR between non-OTA brand.com and non-opaque OTA
distribution channels, the total non-opaque OTA demand, and the resulting non-opaque OTA channel cost.
Table 4 shows the total channel costs attributable to both opaque and non-opaque OTA distribution channels as well as the cumulative effect of both.
Chain ScaleNon-OTA
Brand.comADR
OTAOpaque
ADR
RateDifferential
OTAOpaqueDemand
OTAOpaque
Channel Cost
Luxury $238.82 $167.23 ($71.59) 643,659 ($46,079,548)
Upper Upscale $149.62 $112.42 ($37.20) 4,489,171 ($166,997,161)
Upscale $115.38 $88.45 ($26.93) 3,998,277 ($107,673,600)
Upper Midscale $95.65 $83.52 ($12.13) 3,286,057 ($39,859,871)
Midscale $80.38 $59.84 ($20.54) 2,245,969 ($46,132,203)
Economy $54.61 $48.77 ($5.84) 1,380,396 ($8,061,513)
Independents $108.80 $75.26 ($33.54) 7,253,228 ($243,273,267)
Total, All Chains ($28.25) 23,296,757 ($658,077,163)
Chain ScaleNon-OTA
Brand.comADR
OTANon-Opaque
ADR
RateDifferential
OTANon-Opaque
Demand
OTANon-OpaqueChannel Cost
Luxury $238.82 $194.85 ($43.97) 1,626,716 ($71,526,703)
Upper Upscale $149.62 $126.60 ($23.02) 4,825,321 ($111,078,889)
Upscale $115.38 $98.92 ($16.46) 4,821,026 ($79,354,088)
Upper Midscale $95.65 $85.71 ($9.94) 6,434,993 ($63,963,830)
Midscale $80.38 $61.13 ($19.25) 9,494,700 ($182,772,975)
Economy $54.61 $43.01 ($11.60) 12,724,748 ($147,607,077)
Independents $108.80 $65.00 ($43.80) 31,789,783 ($1,392,392,495)
Total, All Chains ($28.57) 71,717,287 ($2,048,696,058)
Chain ScaleOTA
OpaqueChannel Cost
OTANon-OpaqueChannel Cost
Total OTA Channel Cost
Luxury ($46,079,548) ($71,526,703) ($117,606,250)
Upper Upscale ($166,997,161) ($111,078,889) ($278,076,051)
Upscale ($107,673,600) ($79,354,088) ($187,027,688)
Upper Midscale ($39,859,871) ($63,963,830) ($103,823,702)
Midscale ($46,132,203) ($182,772,975) ($228,905,178)
Economy ($8,061,513) ($147,607,077) ($155,668,589)
Independents ($243,273,267) ($1,392,392,495) ($1,635,665,763)
Total, All Chains ($658,077,163) ($2,048,696,058) ($2,706,773,221)
Table 2: OTA Opaque Channel Cost, by Chain Scale, 2010
Table 3: OTA Non-Opaque Channel Cost, by Chain Scale, 2010
Table 4: Total OTA (Opaque + Non-Opaque) Channel Cost, by Chain Scale, 2010
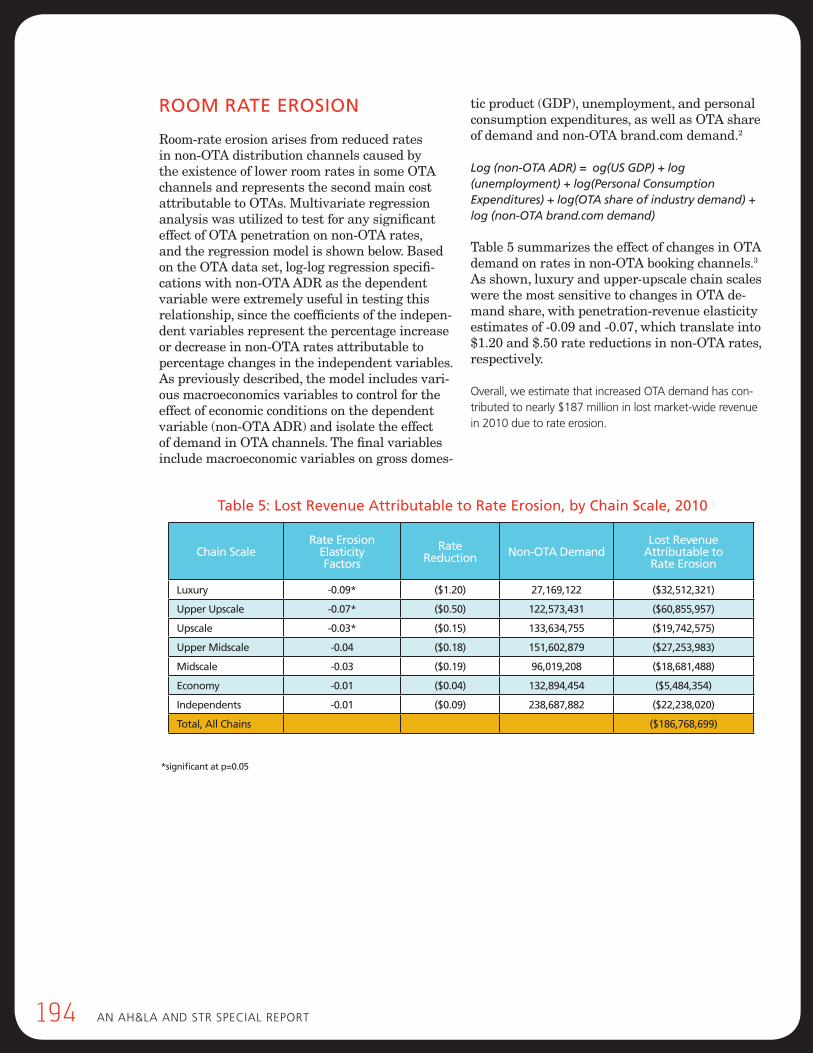
194 An Ah&lA And stR sPeciAl RePoRt
ROOM RATE EROSION
Room-rate erosion arises from reduced rates in non-OTA distribution channels caused by the existence of lower room rates in some OTA channels and represents the second main cost attributable to OTAs. Multivariate regression analysis was utilized to test for any significant effect of OTA penetration on non-OTA rates, and the regression model is shown below. Based on the OTA data set, log-log regression specifi-cations with non-OTA ADR as the dependent variable were extremely useful in testing this relationship, since the coefficients of the indepen-dent variables represent the percentage increase or decrease in non-OTA rates attributable to percentage changes in the independent variables. As previously described, the model includes vari-ous macroeconomics variables to control for the effect of economic conditions on the dependent variable (non-OTA ADR) and isolate the effect of demand in OTA channels. The final variables include macroeconomic variables on gross domes-
tic product (GDP), unemployment, and personal consumption expenditures, as well as OTA share of demand and non-OTA brand.com demand.2
Log (non-OTA ADR) = og(US GDP) + log (unemployment) + log(Personal Consumption Expenditures) + log(OTA share of industry demand) + log (non-OTA brand.com demand)
Table 5 summarizes the effect of changes in OTA demand on rates in non-OTA booking channels.3 As shown, luxury and upper-upscale chain scales were the most sensitive to changes in OTA de-mand share, with penetration-revenue elasticity estimates of -0.09 and -0.07, which translate into $1.20 and $.50 rate reductions in non-OTA rates, respectively.
overall, we estimate that increased otA demand has con-tributed to nearly $187 million in lost market-wide revenue in 2010 due to rate erosion.
Table 5: Lost Revenue Attributable to Rate Erosion, by Chain Scale, 2010
*significant at p=0.05
Chain ScaleRate Erosion
ElasticityFactors
RateReduction Non-OTA Demand
Lost Revenue Attributable to
Rate Erosion
Luxury -0.09* ($1.20) 27,169,122 ($32,512,321)
Upper Upscale -0.07* ($0.50) 122,573,431 ($60,855,957)
Upscale -0.03* ($0.15) 133,634,755 ($19,742,575)
Upper Midscale -0.04 ($0.18) 151,602,879 ($27,253,983)
Midscale -0.03 ($0.19) 96,019,208 ($18,681,488)
Economy -0.01 ($0.04) 132,894,454 ($5,484,354)
Independents -0.01 ($0.09) 238,687,882 ($22,238,020)
Total, All Chains ($186,768,699)
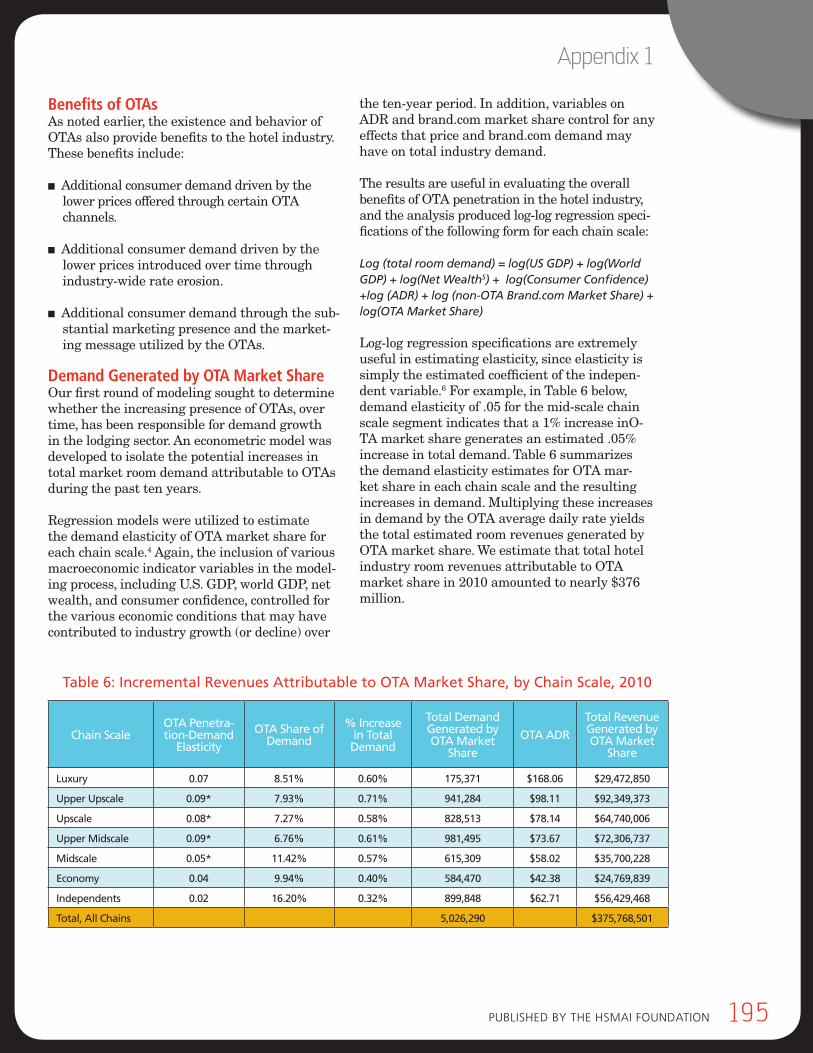
Published by the hsMAi FoundAtion 195
Appendix 1
Benefits of OTAs As noted earlier, the existence and behavior of OTAs also provide benefits to the hotel industry. These benefits include:
n Additional consumer demand driven by the lower prices offered through certain OTA channels.
n Additional consumer demand driven by the lower prices introduced over time through industry-wide rate erosion.
n Additional consumer demand through the sub-stantial marketing presence and the market-ing message utilized by the OTAs.
Demand Generated by OTA Market ShareOur first round of modeling sought to determine whether the increasing presence of OTAs, over time, has been responsible for demand growth in the lodging sector. An econometric model was developed to isolate the potential increases in total market room demand attributable to OTAs during the past ten years.
Regression models were utilized to estimate the demand elasticity of OTA market share for each chain scale.4 Again, the inclusion of various macroeconomic indicator variables in the model-ing process, including U.S. GDP, world GDP, net wealth, and consumer confidence, controlled for the various economic conditions that may have contributed to industry growth (or decline) over
the ten-year period. In addition, variables on ADR and brand.com market share control for any effects that price and brand.com demand may have on total industry demand.
The results are useful in evaluating the overall benefits of OTA penetration in the hotel industry, and the analysis produced log-log regression speci-fications of the following form for each chain scale:
Log (total room demand) = log(US GDP) + log(World GDP) + log(Net Wealth5) + log(Consumer Confidence) +log (ADR) + log (non-OTA Brand.com Market Share) + log(OTA Market Share)
Log-log regression specifications are extremely useful in estimating elasticity, since elasticity is simply the estimated coefficient of the indepen-dent variable.6 For example, in Table 6 below, demand elasticity of .05 for the mid-scale chain scale segment indicates that a 1% increase inO-TA market share generates an estimated .05% increase in total demand. Table 6 summarizes the demand elasticity estimates for OTA mar-ket share in each chain scale and the resulting increases in demand. Multiplying these increases in demand by the OTA average daily rate yields the total estimated room revenues generated by OTA market share. We estimate that total hotel industry room revenues attributable to OTA market share in 2010 amounted to nearly $376 million.
Chain ScaleOTA Penetra-tion-Demand
Elasticity
OTA Share of Demand
% Increase in Total Demand
Total Demand Generated by OTA Market
Share
OTA ADR
Total Revenue Generated by OTA Market
Share
Luxury 0.07 8.51% 0.60% 175,371 $168.06 $29,472,850
Upper Upscale 0.09* 7.93% 0.71% 941,284 $98.11 $92,349,373
Upscale 0.08* 7.27% 0.58% 828,513 $78.14 $64,740,006
Upper Midscale 0.09* 6.76% 0.61% 981,495 $73.67 $72,306,737
Midscale 0.05* 11.42% 0.57% 615,309 $58.02 $35,700,228
Economy 0.04 9.94% 0.40% 584,470 $42.38 $24,769,839
Independents 0.02 16.20% 0.32% 899,848 $62.71 $56,429,468
Total, All Chains 5,026,290 $375,768,501
Table 6: Incremental Revenues Attributable to OTA Market Share, by Chain Scale, 2010
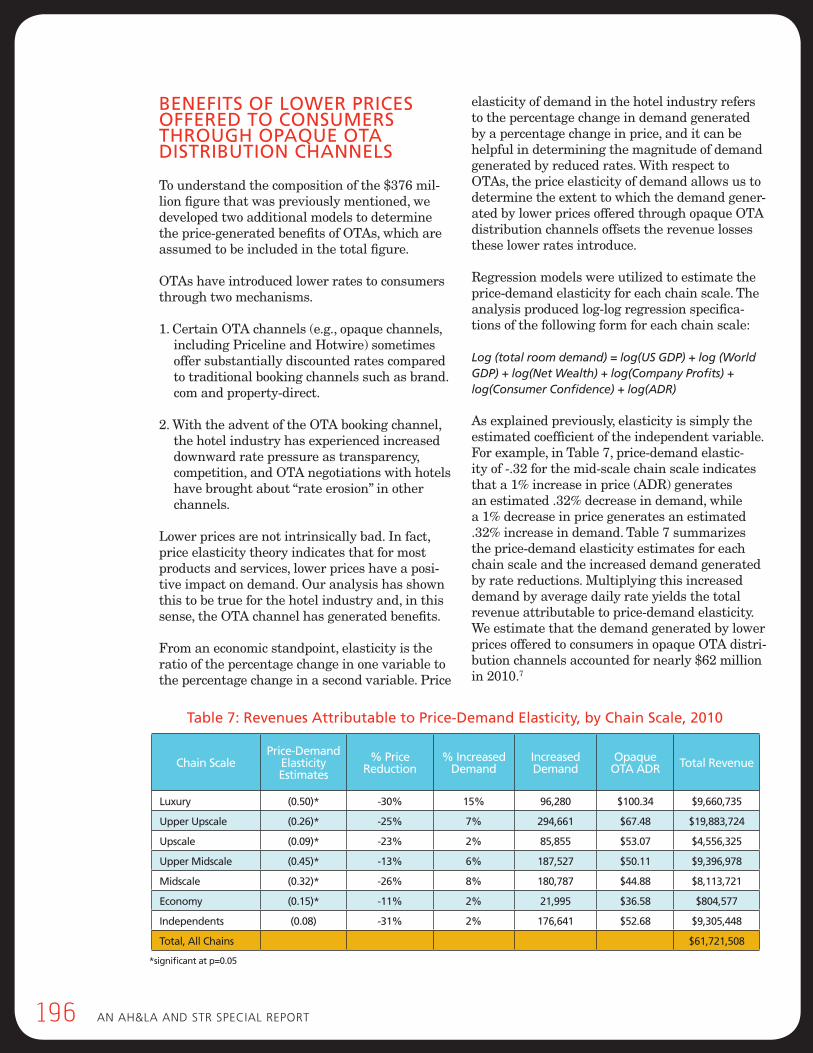
196 An Ah&lA And stR sPeciAl RePoRt
BENEFITS OF LOWER PRICES OFFERED TO CONSUMERS THROUGH OPAqUE OTA DISTRIBUTION CHANNELS
To understand the composition of the $376 mil-lion figure that was previously mentioned, we developed two additional models to determine the price-generated benefits of OTAs, which are assumed to be included in the total figure.
OTAs have introduced lower rates to consumers through two mechanisms.
1. Certain OTA channels (e.g., opaque channels, including Priceline and Hotwire) sometimes offer substantially discounted rates compared to traditional booking channels such as brand.com and property-direct.
2. With the advent of the OTA booking channel, the hotel industry has experienced increased downward rate pressure as transparency, competition, and OTA negotiations with hotels have brought about “rate erosion” in other channels.
Lower prices are not intrinsically bad. In fact, price elasticity theory indicates that for most products and services, lower prices have a posi-tive impact on demand. Our analysis has shown this to be true for the hotel industry and, in this sense, the OTA channel has generated benefits.
From an economic standpoint, elasticity is the ratio of the percentage change in one variable to the percentage change in a second variable. Price
elasticity of demand in the hotel industry refers to the percentage change in demand generated by a percentage change in price, and it can be helpful in determining the magnitude of demand generated by reduced rates. With respect to OTAs, the price elasticity of demand allows us to determine the extent to which the demand gener-ated by lower prices offered through opaque OTA distribution channels offsets the revenue losses these lower rates introduce.
Regression models were utilized to estimate the price-demand elasticity for each chain scale. The analysis produced log-log regression specifica-tions of the following form for each chain scale:
Log (total room demand) = log(US GDP) + log (World GDP) + log(Net Wealth) + log(Company Profits) + log(Consumer Confidence) + log(ADR)
As explained previously, elasticity is simply the estimated coefficient of the independent variable. For example, in Table 7, price-demand elastic-ity of -.32 for the mid-scale chain scale indicates that a 1% increase in price (ADR) generates an estimated .32% decrease in demand, while a 1% decrease in price generates an estimated .32% increase in demand. Table 7 summarizes the price-demand elasticity estimates for each chain scale and the increased demand generated by rate reductions. Multiplying this increased demand by average daily rate yields the total revenue attributable to price-demand elasticity. We estimate that the demand generated by lower prices offered to consumers in opaque OTA distri-bution channels accounted for nearly $62 million in 2010.7
Table 7: Revenues Attributable to Price-Demand Elasticity, by Chain Scale, 2010
*significant at p=0.05
Chain ScalePrice-Demand
Elasticity Estimates
% Price Reduction
% Increased Demand
Increased Demand
Opaque OTA ADR Total Revenue
Luxury (0.50)* -30% 15% 96,280 $100.34 $9,660,735
Upper Upscale (0.26)* -25% 7% 294,661 $67.48 $19,883,724
Upscale (0.09)* -23% 2% 85,855 $53.07 $4,556,325
Upper Midscale (0.45)* -13% 6% 187,527 $50.11 $9,396,978
Midscale (0.32)* -26% 8% 180,787 $44.88 $8,113,721
Economy (0.15)* -11% 2% 21,995 $36.58 $804,577
Independents (0.08) -31% 2% 176,641 $52.68 $9,305,448
Total, All Chains $61,721,508
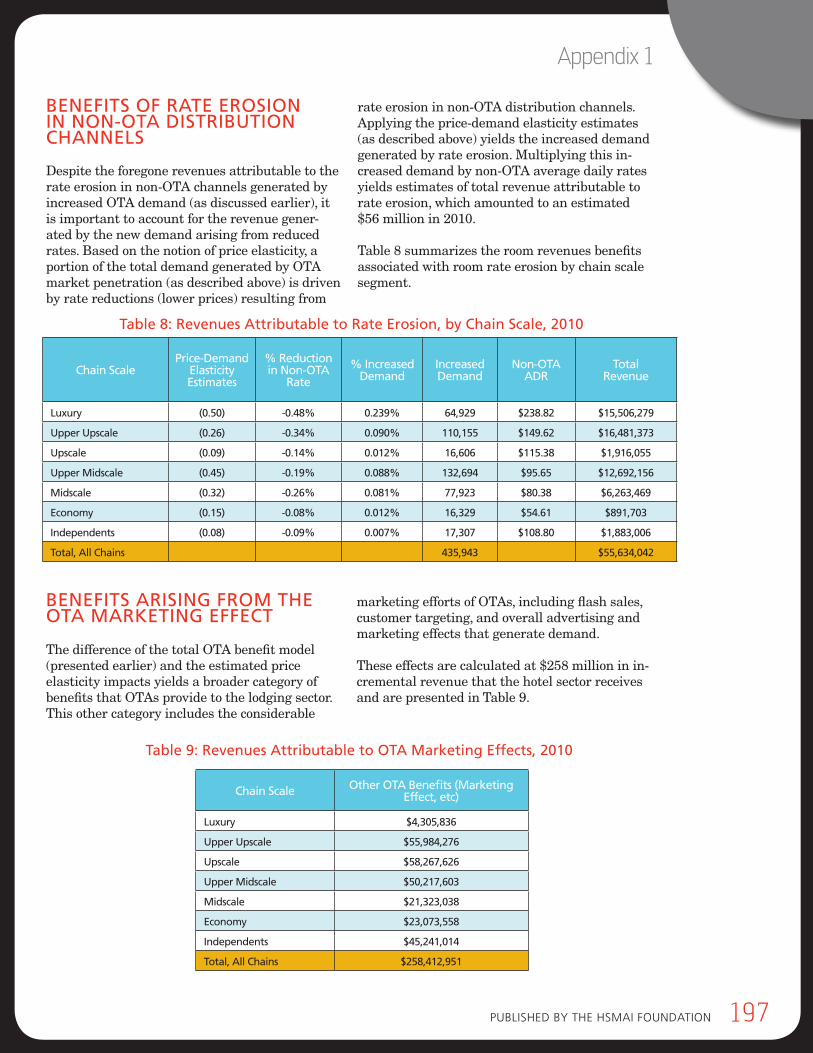
Published by the hsMAi FoundAtion 197
Appendix 1
BENEFITS OF RATE EROSION IN NON-OTA DISTRIBUTION CHANNELS
Despite the foregone revenues attributable to the rate erosion in non-OTA channels generated by increased OTA demand (as discussed earlier), it is important to account for the revenue gener-ated by the new demand arising from reduced rates. Based on the notion of price elasticity, a portion of the total demand generated by OTA market penetration (as described above) is driven by rate reductions (lower prices) resulting from
rate erosion in non-OTA distribution channels. Applying the price-demand elasticity estimates (as described above) yields the increased demand generated by rate erosion. Multiplying this in-creased demand by non-OTA average daily rates yields estimates of total revenue attributable to rate erosion, which amounted to an estimated $56 million in 2010.
Table 8 summarizes the room revenues benefits associated with room rate erosion by chain scale segment.
Chain ScalePrice-Demand
Elasticity Estimates
% Reduction in Non-OTA
Rate
% Increased Demand
Increased Demand
Non-OTA ADR
Total Revenue
Luxury (0.50) -0.48% 0.239% 64,929 $238.82 $15,506,279
Upper Upscale (0.26) -0.34% 0.090% 110,155 $149.62 $16,481,373
Upscale (0.09) -0.14% 0.012% 16,606 $115.38 $1,916,055
Upper Midscale (0.45) -0.19% 0.088% 132,694 $95.65 $12,692,156
Midscale (0.32) -0.26% 0.081% 77,923 $80.38 $6,263,469
Economy (0.15) -0.08% 0.012% 16,329 $54.61 $891,703
Independents (0.08) -0.09% 0.007% 17,307 $108.80 $1,883,006
Total, All Chains 435,943 $55,634,042
Chain Scale Other OTA Benefits (Marketing Effect, etc)
Luxury $4,305,836
Upper Upscale $55,984,276
Upscale $58,267,626
Upper Midscale $50,217,603
Midscale $21,323,038
Economy $23,073,558
Independents $45,241,014
Total, All Chains $258,412,951
Table 8: Revenues Attributable to Rate Erosion, by Chain Scale, 2010
BENEFITS ARISING FROM THE OTA MARKETING EFFECT
The difference of the total OTA benefit model (presented earlier) and the estimated price elasticity impacts yields a broader category of benefits that OTAs provide to the lodging sector. This other category includes the considerable
marketing efforts of OTAs, including flash sales, customer targeting, and overall advertising and marketing effects that generate demand.
These effects are calculated at $258 million in in-cremental revenue that the hotel sector receives and are presented in Table 9.
Table 9: Revenues Attributable to OTA Marketing Effects, 2010
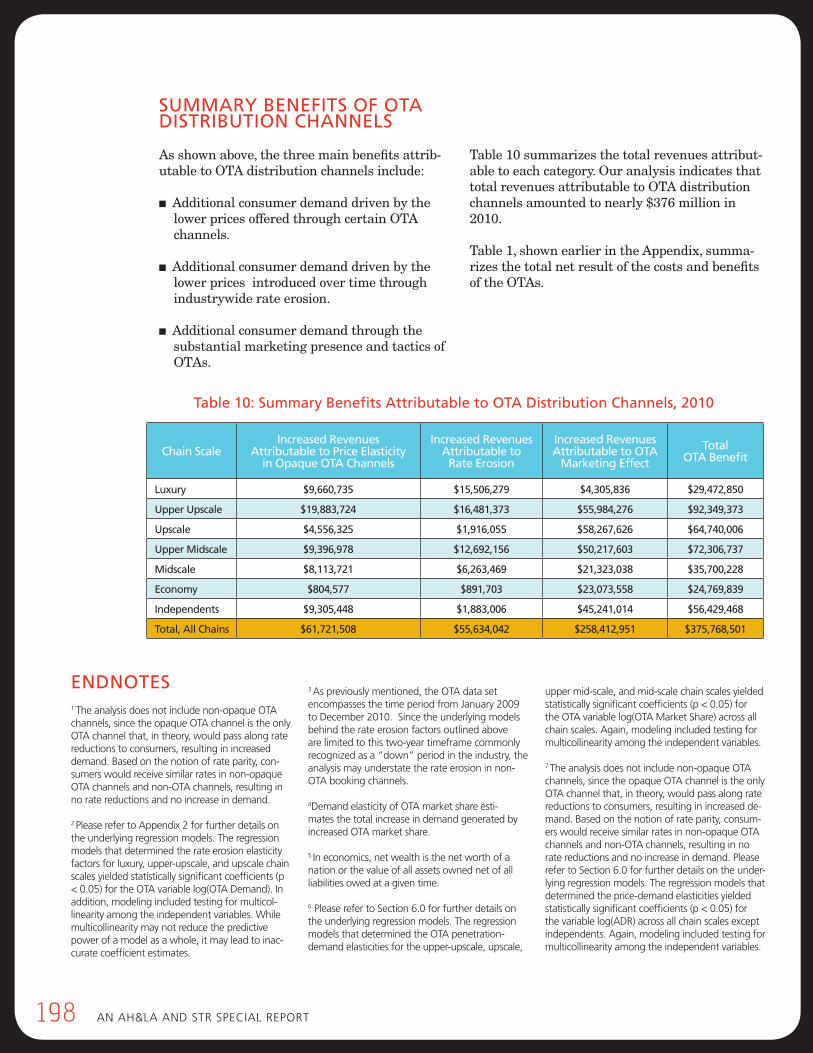
198 An Ah&lA And stR sPeciAl RePoRt198 An Ah&lA And stR sPeciAl RePoRt
SUMMARY BENEFITS OF OTA DISTRIBUTION CHANNELS
As shown above, the three main benefits attrib-utable to OTA distribution channels include:
n Additional consumer demand driven by the lower prices offered through certain OTA channels.
n Additional consumer demand driven by the lower prices introduced over time through industrywide rate erosion.
n Additional consumer demand through the substantial marketing presence and tactics of OTAs.
Table 10 summarizes the total revenues attribut-able to each category. Our analysis indicates that total revenues attributable to OTA distribution channels amounted to nearly $376 million in 2010.
Table 1, shown earlier in the Appendix, summa-rizes the total net result of the costs and benefits of the OTAs.
Chain ScaleIncreased Revenues
Attributable to Price Elasticity in Opaque OTA Channels
Increased Revenues Attributable to
Rate Erosion
Increased Revenues Attributable to OTA
Marketing Effect
Total OTA Benefit
Luxury $9,660,735 $15,506,279 $4,305,836 $29,472,850
Upper Upscale $19,883,724 $16,481,373 $55,984,276 $92,349,373
Upscale $4,556,325 $1,916,055 $58,267,626 $64,740,006
Upper Midscale $9,396,978 $12,692,156 $50,217,603 $72,306,737
Midscale $8,113,721 $6,263,469 $21,323,038 $35,700,228
Economy $804,577 $891,703 $23,073,558 $24,769,839
Independents $9,305,448 $1,883,006 $45,241,014 $56,429,468
Total, All Chains $61,721,508 $55,634,042 $258,412,951 $375,768,501
ENDNOTES1 the analysis does not include non-opaque otA channels, since the opaque otA channel is the only otA channel that, in theory, would pass along rate reductions to consumers, resulting in increased demand. based on the notion of rate parity, con-sumers would receive similar rates in non-opaque otA channels and non-otA channels, resulting in no rate reductions and no increase in demand. 2 Please refer to Appendix 2 for further details on the underlying regression models. the regression models that determined the rate erosion elasticity factors for luxury, upper-upscale, and upscale chain scales yielded statistically significant coefficients (p < 0.05) for the otA variable log(otA demand). in addition, modeling included testing for multicol-linearity among the independent variables. While multicollinearity may not reduce the predictive power of a model as a whole, it may lead to inac-curate coefficient estimates.
3 As previously mentioned, the otA data set encompasses the time period from January 2009 to december 2010. since the underlying models behind the rate erosion factors outlined above are limited to this two-year timeframe commonly recognized as a “down” period in the industry, the analysis may understate the rate erosion in non-otA booking channels.
4demand elasticity of otA market share esti-mates the total increase in demand generated by increased otA market share.
5 in economics, net wealth is the net worth of a nation or the value of all assets owned net of all liabilities owed at a given time. 6 Please refer to section 6.0 for further details on the underlying regression models. the regression models that determined the otA penetration-demand elasticities for the upper-upscale, upscale,
upper mid-scale, and mid-scale chain scales yielded statistically significant coefficients (p < 0.05) for the otA variable log(otA Market share) across all chain scales. Again, modeling included testing for multicollinearity among the independent variables.
7 the analysis does not include non-opaque otA channels, since the opaque otA channel is the only otA channel that, in theory, would pass along rate reductions to consumers, resulting in increased de-mand. based on the notion of rate parity, consum-ers would receive similar rates in non-opaque otA channels and non-otA channels, resulting in no rate reductions and no increase in demand. Please refer to section 6.0 for further details on the under-lying regression models. the regression models that determined the price-demand elasticities yielded statistically significant coefficients (p < 0.05) for the variable log(AdR) across all chain scales except independents. Again, modeling included testing for multicollinearity among the independent variables.
Table 10: Summary Benefits Attributable to OTA Distribution Channels, 2010
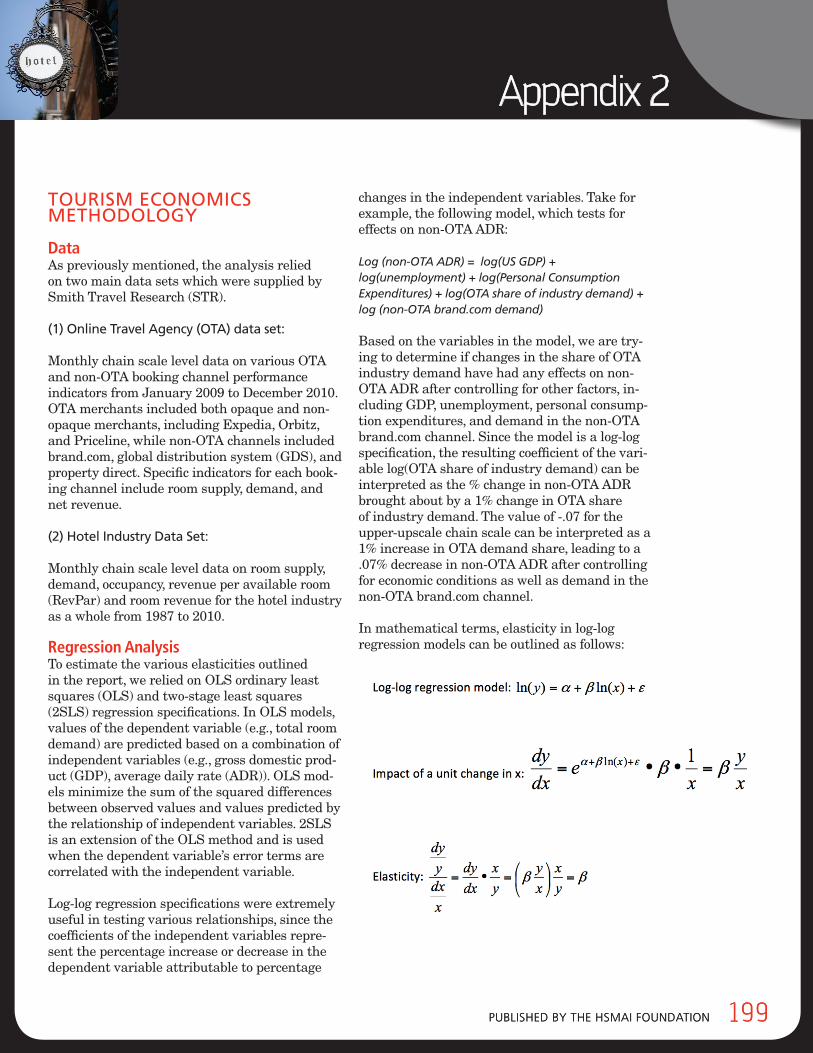
Published by the hsMAi FoundAtion 199
Appendix 2
Published by the hsMAi FoundAtion 199
TOURISM ECONOMICS METHODOLOGY
DataAs previously mentioned, the analysis relied on two main data sets which were supplied by Smith Travel Research (STR).
(1) Online Travel Agency (OTA) data set:
Monthly chain scale level data on various OTA and non-OTA booking channel performance indicators from January 2009 to December 2010. OTA merchants included both opaque and non-opaque merchants, including Expedia, Orbitz, and Priceline, while non-OTA channels included brand.com, global distribution system (GDS), and property direct. Specific indicators for each book-ing channel include room supply, demand, and net revenue.
(2) Hotel Industry Data Set:
Monthly chain scale level data on room supply, demand, occupancy, revenue per available room (RevPar) and room revenue for the hotel industry as a whole from 1987 to 2010.
Regression AnalysisTo estimate the various elasticities outlined in the report, we relied on OLS ordinary least squares (OLS) and two-stage least squares (2SLS) regression specifications. In OLS models, values of the dependent variable (e.g., total room demand) are predicted based on a combination of independent variables (e.g., gross domestic prod-uct (GDP), average daily rate (ADR)). OLS mod-els minimize the sum of the squared differences between observed values and values predicted by the relationship of independent variables. 2SLS is an extension of the OLS method and is used when the dependent variable’s error terms are correlated with the independent variable.
Log-log regression specifications were extremely useful in testing various relationships, since the coefficients of the independent variables repre-sent the percentage increase or decrease in the dependent variable attributable to percentage
changes in the independent variables. Take for example, the following model, which tests for effects on non-OTA ADR:
Log (non-OTA ADR) = log(US GDP) + log(unemployment) + log(Personal Consumption Expenditures) + log(OTA share of industry demand) + log (non-OTA brand.com demand)
Based on the variables in the model, we are try-ing to determine if changes in the share of OTA industry demand have had any effects on non-OTA ADR after controlling for other factors, in-cluding GDP, unemployment, personal consump-tion expenditures, and demand in the non-OTA brand.com channel. Since the model is a log-log specification, the resulting coefficient of the vari-able log(OTA share of industry demand) can be interpreted as the % change in non-OTA ADR brought about by a 1% change in OTA share of industry demand. The value of -.07 for the upper-upscale chain scale can be interpreted as a 1% increase in OTA demand share, leading to a .07% decrease in non-OTA ADR after controlling for economic conditions as well as demand in the non-OTA brand.com channel.
In mathematical terms, elasticity in log-log regression models can be outlined as follows:
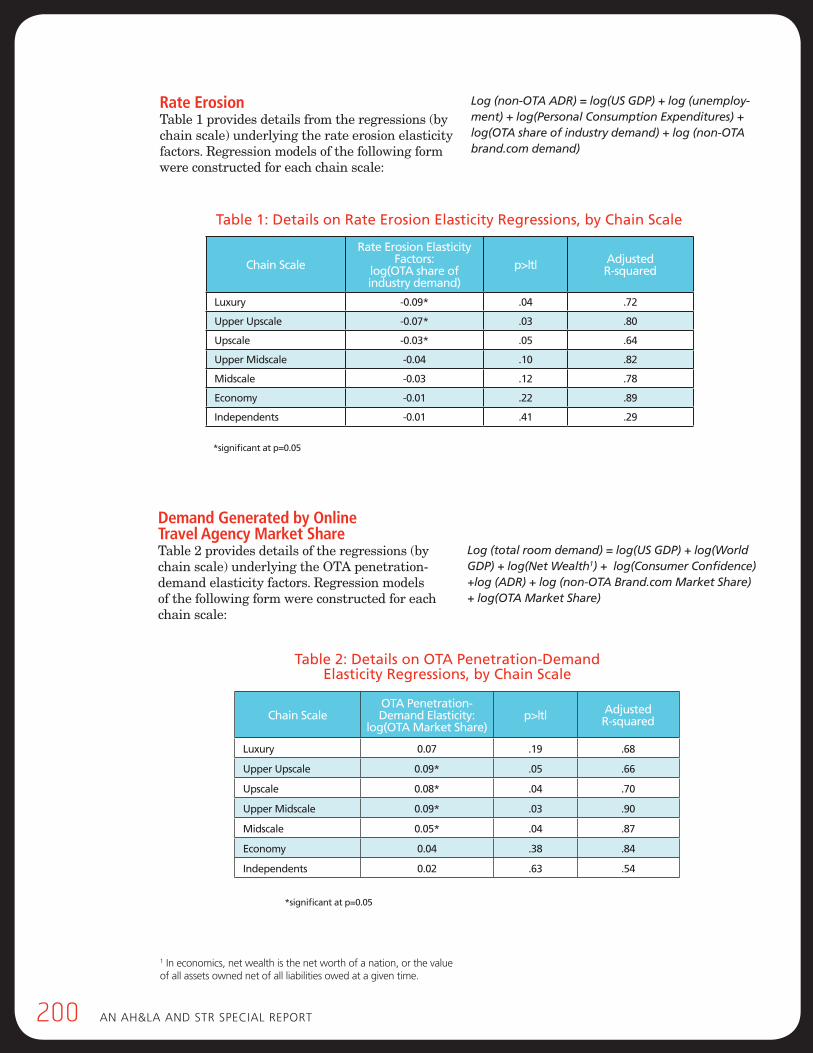
200 An Ah&lA And stR sPeciAl RePoRt200 An Ah&lA And stR sPeciAl RePoRt
Rate ErosionTable 1 provides details from the regressions (by chain scale) underlying the rate erosion elasticity factors. Regression models of the following form were constructed for each chain scale:
Log (non-OTA ADR) = log(US GDP) + log (unemploy-ment) + log(Personal Consumption Expenditures) + log(OTA share of industry demand) + log (non-OTA brand.com demand)
Chain Scale
Rate Erosion Elasticity Factors:
log(OTA share of industry demand)
p>|t| AdjustedR-squared
Luxury -0.09* .04 .72
Upper Upscale -0.07* .03 .80
Upscale -0.03* .05 .64
Upper Midscale -0.04 .10 .82
Midscale -0.03 .12 .78
Economy -0.01 .22 .89
Independents -0.01 .41 .29
1 in economics, net wealth is the net worth of a nation, or the value of all assets owned net of all liabilities owed at a given time.
Table 1: Details on Rate Erosion Elasticity Regressions, by Chain Scale
*significant at p=0.05
Table 2: Details on OTA Penetration-Demand Elasticity Regressions, by Chain Scale
*significant at p=0.05
Chain ScaleOTA Penetration- Demand Elasticity:
log(OTA Market Share)p>|t| Adjusted
R-squared
Luxury 0.07 .19 .68
Upper Upscale 0.09* .05 .66
Upscale 0.08* .04 .70
Upper Midscale 0.09* .03 .90
Midscale 0.05* .04 .87
Economy 0.04 .38 .84
Independents 0.02 .63 .54
Demand Generated by Online Travel Agency Market ShareTable 2 provides details of the regressions (by chain scale) underlying the OTA penetration-demand elasticity factors. Regression models of the following form were constructed for each chain scale:
Log (total room demand) = log(US GDP) + log(World GDP) + log(Net Wealth1) + log(Consumer Confidence) +log (ADR) + log (non-OTA Brand.com Market Share) + log(OTA Market Share)
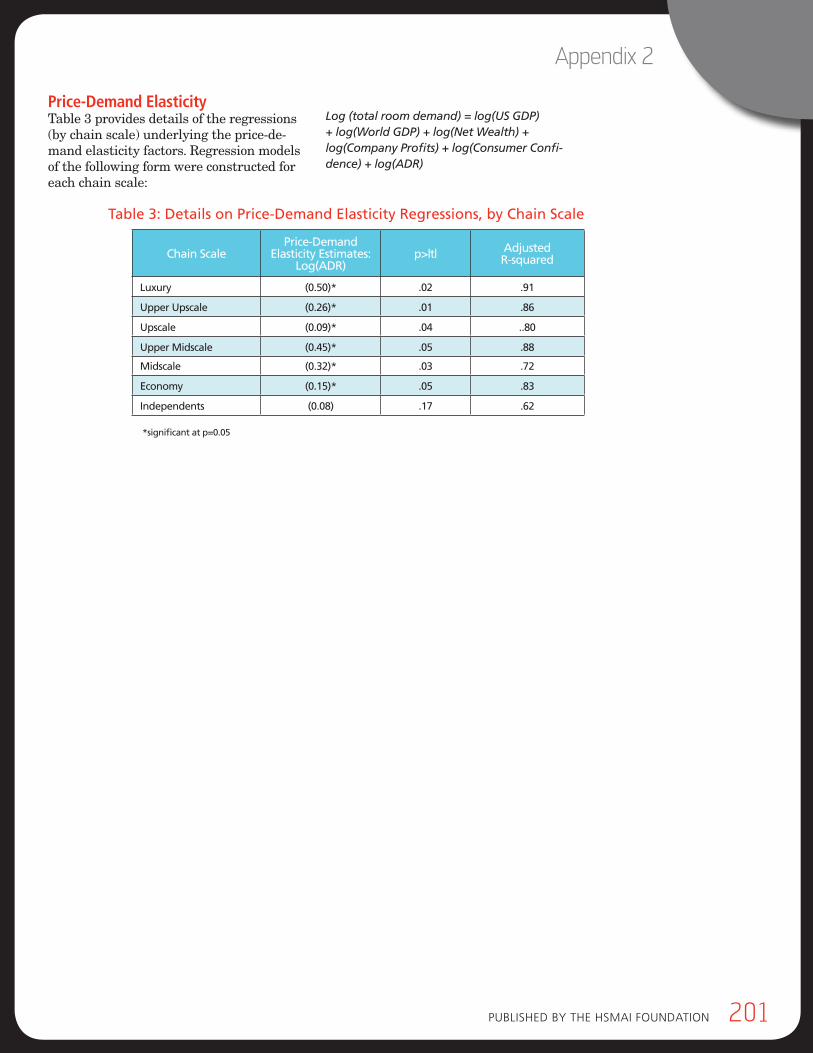
Published by the hsMAi FoundAtion 201
Acknowledgements
Published by the hsMAi FoundAtion 201
Appendix 2
Table 3: Details on Price-Demand Elasticity Regressions, by Chain Scale
*significant at p=0.05
Chain ScalePrice-Demand
Elasticity Estimates:Log(ADR)
p>|t| AdjustedR-squared
Luxury (0.50)* .02 .91
Upper Upscale (0.26)* .01 .86
Upscale (0.09)* .04 ..80
Upper Midscale (0.45)* .05 .88
Midscale (0.32)* .03 .72
Economy (0.15)* .05 .83
Independents (0.08) .17 .62
Price-Demand ElasticityTable 3 provides details of the regressions (by chain scale) underlying the price-de-mand elasticity factors. Regression models of the following form were constructed for each chain scale:
Log (total room demand) = log(US GDP) + log(World GDP) + log(Net Wealth) + log(Company Profits) + log(Consumer Confi-dence) + log(ADR)
202 An Ah&lA And stR sPeciAl RePoRt
Author‘s Biography
202 An Ah&lA And stR sPeciAl RePoRt202 An Ah&lA And stR sPeciAl RePoRt202 An Ah&lA And stR sPeciAl RePoRt
In her latest publication, Distribution Channel Analysis: A Guide for Hotels, the third in the Demystifying Distribution series, Cindy Estis Green shares her unique knowledge about distribution strategy and its implications for hotel profitabil-ity. Leveraging her expertise, she launched Kalibri Labs in 2012 offering data analytics, data modelling and intelligence services to hotels and technology companies in the hospitality industry. She is also the author of a blog, Demystifying Distri-bution, that is a forum for discussion on a hot industry topic. (www.demystifyingdistribution.com)
Cindy Estis Green’s career spans thirty-five years in hospital-ity. Following four years in a marketing role at the National Restaurant Association, Ms. Estis Green served seven years with Hilton International as head of corporate marketing in-formation systems and research and as a general manager for the Vista hotel brand.
After starting up the data mining and marketing analyt-ics consultancy, Driving Revenue, and selling it to Pegasus Solutions, Ms. Green spent ten years as managing partner of The Estis Group providing strategic marketing consulting to hospitality and travel organizations in the areas of distribu-tion, CRM, predictive modeling/data mining, social media and online marketing best practices.
A frequent speaker at national conferences and a guest lecturer at Cornell University’s School of Hotel Adminis-tration, Estis Green authored many well-respected publi-cations including Demystifying Distribution 2.0, and The Travel Marketers Guide to Social Media and Social Net-works. She was named one of the top 25 greatest minds by HSMAI, featured as Marketing Innovator of the Year and a Leader and Visionary by Lodging magazine. She was recently inducted into the Hospitality Technology Hall of Fame and the HSMAI DC Chapter Hall of Fame in recognition of her many contributions to sales and marketing technology. Ms. Estis Green is a past-Chair and board member on the HSMAI Foundation, and is a member of the HITEC Advisory Council and the HSMAI Resort Advisory Council.
Cindy Estis Green holds a BS from the School of Hotel Administration at Cornell University and an MBA in Marketing from The American University.
Cindy Estis Green Co-founder and CEO, Kalibri Labs
Published by the hsMAi FoundAtion 203
Acknowledgements
Published by the hsMAi FoundAtion 203
Author‘s Biography
Mark Lomanno is an Executive Board Member at newBrand-Analytics. In that role he not only serves on the company’s Board of Directors but also has taken an active role in the management of the company. In that capacity, Mr. Lomanno shapes the com-pany’s strategic direction, creating and enhancing new customer satisfaction research solutions and building relationships with hospitality brands, owners and operators.
Lomanno is the former President and CEO of Smith Travel Research (STR), the hotel industry’s global authority on current trends in supply, demand, occupancy and room rates. Under Mr. Lomanno’s 15 years of leadership, the company grew from a US firm to the most respected name in global hotel benchmarking. Prior to leaving STR, Lomanno co-authored Distribution Channel Analysis: A Guide for Hotels, the definitive study on the lodging industry’s on-line environment.
Mr. Lomanno serves on the advisory board of the Center for Hospitality Research at Cornell University and the University of Delaware’s school of Hotel, Restaurant and Institutional man-agement, is an active member in the Hotel Development Council of the Urban Land Institute and is a named Conti Professor at Pennsylvania State University. Because of his in-depth under-standing and knowledge of current industry issues Mr. Lomanno is asked to give numerous speeches at industry conferences, industry seminars and company meetings throughout the year. He is also a frequent lecturer at School of Hotel Administration at Cornell University.
Mr. Lomanno holds an MS degree in Marketing from LaSalle University and an MBA from Temple University. He lives in Cape May, NJ with his wife and is an avid runner and Philadel-phia Phillies baseball fan.
Mark Lomanno Executive Board Member, newBrandAnalytics

Related Documents