Distribution and turnover of recently fixed photosynthate in ryegrass rhizospheres Jessica L. Butler a,1 , Peter J. Bottomley a,b , Stephen M. Griffith c , David D. Myrold a, * a Department of Crop and Soil Science, Oregon State University, 3017 Agricultural and Life Science Building, Corvallis, OR 97331-7306, USA b Department of Microbiology, Oregon State University, 220 Nash Hall, Corvallis, OR 97331-3804, USA c National Forage Seed Production Research Center, USDA-ARS, 3450 SW Campus Way, Corvallis, OR 97331, USA Received 25 March 2003; received in revised form 28 August 2003; accepted 6 October 2003 Abstract The cycling of root-deposited photosynthate (rhizodeposition) through the soil microbial biomass can have profound influences on plant nutrient availability. Currently, our understanding of microbial dynamics associated with rhizosphere carbon (C) flow is limited. We used a 13 C pulse-chase labeling procedure to examine the flow of photosynthetically fixed 13 C into the microbial biomass of the bulk and rhizosphere soils of greenhouse-grown annual ryegrass (Lolium multiflorum Lam.). To assess the temporal dynamics of rhizosphere C flow through the microbial biomass, plants were labeled either during the transition between active root growth and rapid shoot growth (Labeling Period 1), or nine days later during the rapid shoot growth stage (Labeling Period 2). Although the distribution of 13 C in the plant/soil system was similar between the two labeling periods, microbial cycling of rhizodeposition differed between labeling periods. Within 24 h of labeling, more than 10% of the 13 C retained in the plant/soil system resided in the soil, most of which had already been incorporated into the microbial biomass. From day 1 to day 8, the proportion of 13 C in soil as microbial biomass declined from about 90 to 35% in rhizosphere soil and from about 80 to 30% in bulk soil. Turnover of 13 C through the microbial biomass was faster in rhizosphere soil than in bulk soil, and faster in Labeling Period 1 than Labeling Period 2. Our results demonstrate the effectiveness of using 13 C labeling to examine microbial dynamics and fate of C associated with cycling of rhizodeposition from plants at different phenological stages of growth. q 2003 Elsevier Ltd. All rights reserved. Keywords: Microbial biomass; Rhizodeposition; Root exudation; 13 C-labeling; Pulse-labeling 1. Introduction Because soil is the largest reservoir of organic carbon (C) in the terrestrial biosphere (Cardon et al., 2001), worldwide efforts have focused on trying to understand the dynamics of soil organic matter in hopes of gaining insight into global C cycling and ecosystem functioning. Although the microbial biomass represents a relatively small portion of soil organic C, generally 1–3% (Anderson and Domsch, 1989), it is essential that more knowledge be obtained about cycling of C and other nutrients through this pool because most primary productivity (plant material) passes through the soil microbial biomass at some point in time (Ryan and Aravena, 1994). Quantifying the flow of root-deposited photosynthate through the soil microbial biomass is of great importance because of its profound influence on the nutrient supply for plant growth; however, our current knowledge is limited. Thus, there is a fundamental need to gain more information on the microbial dynamics associated with C cycling in the rhizosphere. The rhizosphere, a zone of high microbial activity in the vicinity of growing plant roots, has received considerable attention since Hiltner first coined the term in 1904 (see Hale and Moore, 1979). Through the use of the C isotopes, 13 C and 14 C, the flow of C from the above- to below-ground plant parts, and the subsequent release of some of this photosynthate into the rhizosphere, have been widely investigated (e.g., Meharg, 1994; Swinnen et al., 1995). Collectively referred to as rhizodeposits, these C com- pounds, which reach the soil from living roots, consist of a number of organic compounds that differ in their mode of arrival and their degree of complexity/degradability (Lynch 0038-0717/$ - see front matter q 2003 Elsevier Ltd. All rights reserved. doi:10.1016/j.soilbio.2003.10.011 Soil Biology & Biochemistry 36 (2004) 371–382 www.elsevier.com/locate/soilbio 1 Current address: Harvard Forest, P.O. Box 68, Petersham, MA 01366, USA. * Corresponding author. Tel.: þ 1-541-737-5737; fax: þ1-541-737-5725. E-mail address: [email protected] (D.D. Myrold).

Welcome message from author
This document is posted to help you gain knowledge. Please leave a comment to let me know what you think about it! Share it to your friends and learn new things together.
Transcript
Distribution and turnover of recently fixed photosynthate
in ryegrass rhizospheres
Jessica L. Butlera,1, Peter J. Bottomleya,b, Stephen M. Griffithc, David D. Myrolda,*
aDepartment of Crop and Soil Science, Oregon State University, 3017 Agricultural and Life Science Building, Corvallis, OR 97331-7306, USAbDepartment of Microbiology, Oregon State University, 220 Nash Hall, Corvallis, OR 97331-3804, USA
cNational Forage Seed Production Research Center, USDA-ARS, 3450 SW Campus Way, Corvallis, OR 97331, USA
Received 25 March 2003; received in revised form 28 August 2003; accepted 6 October 2003
Abstract
The cycling of root-deposited photosynthate (rhizodeposition) through the soil microbial biomass can have profound influences on plant
nutrient availability. Currently, our understanding of microbial dynamics associated with rhizosphere carbon (C) flow is limited. We used a13C pulse-chase labeling procedure to examine the flow of photosynthetically fixed 13C into the microbial biomass of the bulk and
rhizosphere soils of greenhouse-grown annual ryegrass (Lolium multiflorum Lam.). To assess the temporal dynamics of rhizosphere C flow
through the microbial biomass, plants were labeled either during the transition between active root growth and rapid shoot growth (Labeling
Period 1), or nine days later during the rapid shoot growth stage (Labeling Period 2). Although the distribution of 13C in the plant/soil system
was similar between the two labeling periods, microbial cycling of rhizodeposition differed between labeling periods. Within 24 h of
labeling, more than 10% of the 13C retained in the plant/soil system resided in the soil, most of which had already been incorporated into the
microbial biomass. From day 1 to day 8, the proportion of 13C in soil as microbial biomass declined from about 90 to 35% in rhizosphere soil
and from about 80 to 30% in bulk soil. Turnover of 13C through the microbial biomass was faster in rhizosphere soil than in bulk soil, and
faster in Labeling Period 1 than Labeling Period 2. Our results demonstrate the effectiveness of using 13C labeling to examine microbial
dynamics and fate of C associated with cycling of rhizodeposition from plants at different phenological stages of growth.
q 2003 Elsevier Ltd. All rights reserved.
Keywords: Microbial biomass; Rhizodeposition; Root exudation; 13C-labeling; Pulse-labeling
1. Introduction
Because soil is the largest reservoir of organic carbon (C)
in the terrestrial biosphere (Cardon et al., 2001), worldwide
efforts have focused on trying to understand the dynamics of
soil organic matter in hopes of gaining insight into global C
cycling and ecosystem functioning. Although the microbial
biomass represents a relatively small portion of soil organic
C, generally 1–3% (Anderson and Domsch, 1989), it is
essential that more knowledge be obtained about cycling of
C and other nutrients through this pool because most
primary productivity (plant material) passes through the soil
microbial biomass at some point in time (Ryan and Aravena,
1994). Quantifying the flow of root-deposited photosynthate
through the soil microbial biomass is of great importance
because of its profound influence on the nutrient supply for
plant growth; however, our current knowledge is limited.
Thus, there is a fundamental need to gain more information
on the microbial dynamics associated with C cycling in the
rhizosphere.
The rhizosphere, a zone of high microbial activity in the
vicinity of growing plant roots, has received considerable
attention since Hiltner first coined the term in 1904 (see
Hale and Moore, 1979). Through the use of the C isotopes,13C and 14C, the flow of C from the above- to below-ground
plant parts, and the subsequent release of some of this
photosynthate into the rhizosphere, have been widely
investigated (e.g., Meharg, 1994; Swinnen et al., 1995).
Collectively referred to as rhizodeposits, these C com-
pounds, which reach the soil from living roots, consist of a
number of organic compounds that differ in their mode of
arrival and their degree of complexity/degradability (Lynch
0038-0717/$ - see front matter q 2003 Elsevier Ltd. All rights reserved.
doi:10.1016/j.soilbio.2003.10.011
Soil Biology & Biochemistry 36 (2004) 371–382
www.elsevier.com/locate/soilbio
1 Current address: Harvard Forest, P.O. Box 68, Petersham, MA
01366, USA.
* Corresponding author. Tel.: þ1-541-737-5737; fax: þ1-541-737-5725.
E-mail address: [email protected] (D.D. Myrold).

and Whipps, 1990). Rhizodeposits include any component
of the plant cell but are often conveniently classified into
soluble and insoluble compounds. It has been estimated that
as much as 40% of plant primary production may be lost
through rhizodeposition (Lynch and Whipps, 1990) and
several researchers have demonstrated that the flow of C
into the rhizosphere is influenced by a number of
physiological (e.g., plant growth stage, defoliation) and
environmental (e.g., temperature, CO2 concentration, soil
fertility, soil texture, and light intensity) factors (Martin and
Kemp, 1980; Merckx et al., 1985; Whipps, 1985; van
Ginkel et al., 1997, 2000; Hutsch et al., 2002). Studies
examining the influences of plant growth stage on C
allocation below-ground have found mixed results. For
example, in most plants the amount of C allocated below-
ground has been shown to generally decrease with plant
age; however, there have also been reports suggesting an
increase in C allocation below-ground in some perennials
with age (see review by Kuzyakov and Domanski, 2000).
Furthermore, researchers have also demonstrated that the
quality of rhizodeposits entering the rhizosphere changes
with age or developmental stage, plant species, and
environmental conditions (Martin, 1977; Kraffczyk et al.,
1984; Hutsch et al., 2002). For example, the amount of
proteins and carbohydrates in rhizodeposition decreases
with age (Brimecombe et al., 2001).
The flow of photosynthate into and through the soil
microbial biomass has not received nearly the attention that
the partitioning of photosynthate within plants and soil has
(Domanski et al., 2001; Hutsch et al., 2002; Kuzyakov et al.,
2002). Because microorganisms in the rhizosphere serve as
both a source and sink of nutrients (Kouno et al., 2002), they
directly influence plant growth and therefore play a critical
role in maintaining ecosystem productivity. Thus, it is the
interconnectedness of these two processes, the flow of C
into the soil and the subsequent cycling of this matter
through the microbial biomass that ultimately dictates
ecosystem functioning.
An approach that has provided a great deal of
information on soil C cycling through the microbial
biomass is the application of isotopically labeled substrates
to soil and subsequently monitoring their decomposition or
turnover (Saggar et al., 1996; Aoyama et al., 2000; Kouno
et al., 2002). The overall objective of this study was to trace
photosynthetically fixed C (13C) through annual ryegrass
(Lolium multiflorum Lam. var. Gulf) at two different stages
of plant growth. Our primary focus was on the flow of
photosynthate into the microbial biomass in rhizosphere and
bulk soil. We hypothesized that any changes in C allocation
that take place at the different growth stages will have an
influence on both the quality and quantity of rhizodeposi-
tion, which will therefore influence both the activity and the
turnover of the rhizosphere and bulk soil microbial biomass.
To test our hypotheses, we used a 13C pulse-chase labeling
procedure to examine the flow of photosynthetically fixed13C into the rhizosphere and bulk soil microbial biomass.
2. Materials and methods
2.1. Soil
Soil was collected in the summer of 2001 from the top
10 cm of four replicate conventionally tilled, high residue
incorporated, grass-seed research plots in Marion county
Oregon (part of the Sustainable Grass Seed Cropping System
Research Project established in 1992 by USDA-ARS
scientists; see Gohlke et al. (1999)) for a comprehensive
site summary. This soil is classified as a Nekia silty-clay loam
(clayey, mixed, mesic Xeric Haplohumult) with a pH of 5.1,
35% clay, and 3.7% organic C. Soil samples were air-dried,
passed through a 4.75 mm sieve, homogenized, and stored at
4 8C until the start of the experiment.
2.2. Growing conditions
Black plastic containers (600 cm3) were filled with
500 g of air-dried soil and wetted to 25% volumetric water
content (approximate bulk density of 1.1 g cm23). Duct
tape was placed over the holes in the bottoms of the
containers to keep the soil in and discourage roots from
growing out. Prior to planting, soil-filled containers were
kept in a greenhouse for 4 weeks in order to allow any
weed seeds to germinate. All germinated seeds were
removed from the soil.
Seeds of annual ryegrass were germinated in the
laboratory on moist filter paper in glass petri dishes. After
5 days, seedlings were transferred to the containers (two
seedlings per container) in the greenhouse. Soil water
content was adjusted every 2 days by weighing six randomly
selected containers and determining the average amount of
water necessary to maintain 25% volumetric water content.
Light intensity averaged 500 mmol m22 s21 with a 16 h
photoperiod. Plants were moved at every watering period to
reduce any potential bias in growing conditions. Maximum
and minimum temperatures were recorded daily and
converted into growing degree days (GDD) using the
following equation (Griffith, 2000):
GDD ¼ ðTmax þ TminÞ=2 ð1Þ
where Tmax is the daily maximum temperature and Tmin is
the daily minimum temperature measured in 8C and us 0 8C
as the base temperature. During the experiment, maximum
daily temperatures ranged from 21 to 35 8C; daily minimum
temperatures ranged from 8 to 18 8C.
2.3. Experimental design
Twenty plants were labeled with 13CO2 during each of
two growth stages, and four replicate containers were
sampled 1, 2, 3, 5, and 8 days after labeling. One unlabeled
container was harvested at each sample period to serve as a
control for background d 13C values. To account for any
autotrophic activity by soil microorganisms, four unplanted
J.L. Butler et al. / Soil Biology & Biochemistry 36 (2004) 371–382372
containers of soil were included in each labeling period: two
that served as unlabeled controls and two that underwent the
labeling process (one of each was harvested on days 1 and 8
after labeling). Four extra plants were grown, two of which
were used for plant biomass assessment prior to labeling and
two were used to determine if plants were mycorrhizal at the
time of each labeling period. No evidence of arbuscular
mycorrhizae was observcd (Butler et al., 2003). All plant
parts and soil were analyzed for total C and 13C abundance.
Microbial biomass C (MBC) and associated d 13C values
were determined on all soil samples.
2.4. 13C Labeling
A gas-tight labeling chamber (40.5 cm £ 40.5 cm £ 58.5
cm—length £ width £ height) was constructed out of plex-
iglass (6.4 mm thickness). The chamber was placed on a
piece of plexiglass that had the dimensions of the chamber
lined with weather stripping (1.9 cm wide) to create a gas-
tight seal. A hole was drilled in the top of the chamber and
fitted with a rubber septum for use in labeling. A shelf was
constructed inside the chamber to hold labeling supplies
along with two, 6 cm2 12 volt fans to promote air circulation.
Temperature and condensation were controlled by flowing
water through a copper coil that was attached to a water bath
maintained at 10 8C. The copper coil was wrapped around the
bottom perimeter of the chamber to avoid shading effects.
Two holes were drilled on opposite sides of the chamber with
ports to fit tubing for a LI-COR 6200 CO2 analyzer (LI-COR
Inc. Lincoln, NE). Supplemental lighting was placed
approximately 20 cm above the chamber to enhance
photosynthesis during labeling.
Prior to each labeling period, 20 plants were randomly
divided into two groups of 10, which allowed the plants to
be spaced out to reduce shading effects and optimize
photosynthetic 13CO2 assimilation. Eleven containers (10
planted and one unplanted) were placed in the chamber and
allowed to assimilate CO2 until the concentration fell to
200 ppm (v/v). During this time the overall photosynthetic
rate was determined and subsequently used to predict the
rate of 13CO2 assimilation. 13CO2 could not be directly
monitored with the LI-6200 because the infrared range was
set for 12CO2 and only slightly overlapped with the range for13CO2 (Svejcar et al., 1990).
To initiate 13CO2 labeling, 1 ml of 1.5 M lactic acid was
added to a beaker containing 22.4 mg 13C as NaHCO3 (99.9
atom% 13C; Cambridge Isotope Laboratories, Andover,
MA), which increased the CO2 concentration to about
600 ppm. Once the CO2 concentration fell below 200 ppm,
lactic acid was added to an adjacent beaker containing
22.4 mg C as unlabeled NaHCO3, which increased the CO2
concentration by about 400 ppm. When the CO2 concen-
tration fell below 200 ppm the 11 containers were removed
from the labeling chamber and placed in a similar Plexiglas
chamber to maximize the assimilation of any respired 13CO2
while the other set of containers was being labeled. Each set
of 11 containers underwent this labeling procedure three
times, however, the CO2 concentration was only increased
by about 200 ppm during the last labeling period (11.2 mg13C). The amount of 13CO2 added during the labeling
scenario was sufficient to label the plants at about 500‰
d 13C, assuming about 50% recovery of the label. Care was
taken to minimize any shading effects or labeling biases by
rotating the set of containers 1808 between the first and
second labeling and another 908 between the second and
third labeling period. Once each set of plants had undergone
all three labeling events, all 20 plants were placed back in
the chamber for an additional 1.5 h while sufficient 12CO2
was evolved to increase CO2 concentration by 400 ppm and
assimilated three times in an effort to minimize loss of13CO2. Two days prior to the second labeling period, seed
heads were removed from plants to enhance translocation of
the 13C label to the roots and associated soil. Once labeling
had occurred, however, any new seed heads were left on the
plants.
A preliminary plant growth study was conducted to
determine when the developmental stages for active root
growth and rapid shoot growth occur in annual ryegrass. At
weekly intervals throughout a 10-week period, three
replicate plants were harvested, dried and weighed to
determine root and shoot biomass. Based on the preliminary
experiment, we anticipated that active root growth would
peak at about 900 GDD to be followed by rapid shoot
growth about 100 GDD later. Prior to the first labeling
event, two plants were harvested, dried, and weighed (one at
574 GDD and one at 742 GDD) to assess whether the roots
were growing at a similar rate as observed in the preliminary
experiment. Based on these data, we moved up our labeling
schedule to 809 GDD (41 calendar days) for the active root
growth phase and to 1014 GDD (50 calendar days; the day
after the last set of plants labeled at active root growth had
been harvested) for the rapid shoot growth phase.
2.5. Harvesting procedure
On each sampling day (1, 2, 3, 5, and 8 days after labeling),
four replicate plants were selected randomly, removed from
their containers, and weighed The root/soil systems were
sliced down the middle and shaken in plastic bags until
approximately 80% of the initial mass was collected. This
portion was considered ‘bulk soil’. The soil remaining
attached to the root system was considered ‘rhizosphere
soil’. The rhizosphere soil was then carefully removed from
the roots with a probe and forceps. Root fragments remaining
in the bulk or rhizosphere soil were removed by passing
through a 1 mm sieve. Soil samples not used for immediate
analysis were stored in plastic bags at 220 8C.
Plant and soil samples were dried in an oven at 65 8C for
48 h. Dried plant material was weighed, transferred into
glass jars, and placed on a roller grinder with 8–10 stainless
steel rods until ground to a powder (2–4 days). Soil was
ground to a fine powder with a mortar and pestle.
J.L. Butler et al. / Soil Biology & Biochemistry 36 (2004) 371–382 373
2.6. Microbial biomass carbon
Soil was analyzed for MBC immediately following
harvest. The fumigation-extraction procedure of Vance et al.
(1987) was used, as modified by Bruulsema and Duxbury
(1996) for 13C analysis. Briefly, 15 g samples (wet weight) of
fumigated (24 h) and non-fumigated soils were placed on a
shaker for 1 h with 30 ml of 0.05 M K2SO4 and subsequently
filtered through Whatman #40 filter papers. Aliquots (0.5 ml)
of each K2SO4 extract were pipetted onto acetone-rinsed tin
squares (37 £ 37 mm2) (Environmental Microanalysis, Man-
chester, MA), dried at 60 8C for 1.5 h prior to adding a second
0.5 ml aliquot of K2SO4 extract, and dried overnight. The tin
squares containing the dried extracts were balled up with
gloved hands. Samples were analyzed for total C and d 13C
abundance. A KC of 0.45 was used to convert chloroform flush
C values into MBC (Vance et al., 1987). The following
equation was used to determine the d 13C value of MBC
d13CMBC ¼ ðd13Cfum £Cfum 2d13Ccon £CconÞ=ðCfum 2CconÞ
ð2Þ
where Cfum and Ccon refer to the mass of C extracted from the
fumigated and the non-fumigated, respectively, and d 13Cfum
and d 13Ccon refer to their corresponding d 13C values.
2.7. Isotopic analysis
Plant, soil, and K2SO4 extracts were analyzed for total C
and 13C abundance with a PDZ Europa 20/20 isotope ratio
mass spectrometer (Cheshire, England) interfaced with a
Europa Roboprep Dumas combustion/reduction apparatus
(Cheshire, England). By convention, 13C abundances were
expressed relative to Pee Dee Belemnite standard as either
d 13C or atom fraction 13C excess (Boutton, 1999).
2.8. Statistics
Analysis of variance (ANOVA) was used to evaluate all
time effects using the SAS statistical software package (SAS
Institute, 1996), with each labeling period analyzed separ-
ately. For all analyses, rhizosphere and bulk soils were
analyzed separately because they were not independent of
each other. Differences between rhizosphere and bulk soil
properties were evaluated using paired t-tests. Significant
differences are reported at the p , 0:05 level. Data are
reported as means of four replicates unless otherwise noted.
3. Results
3.1. Plant growth
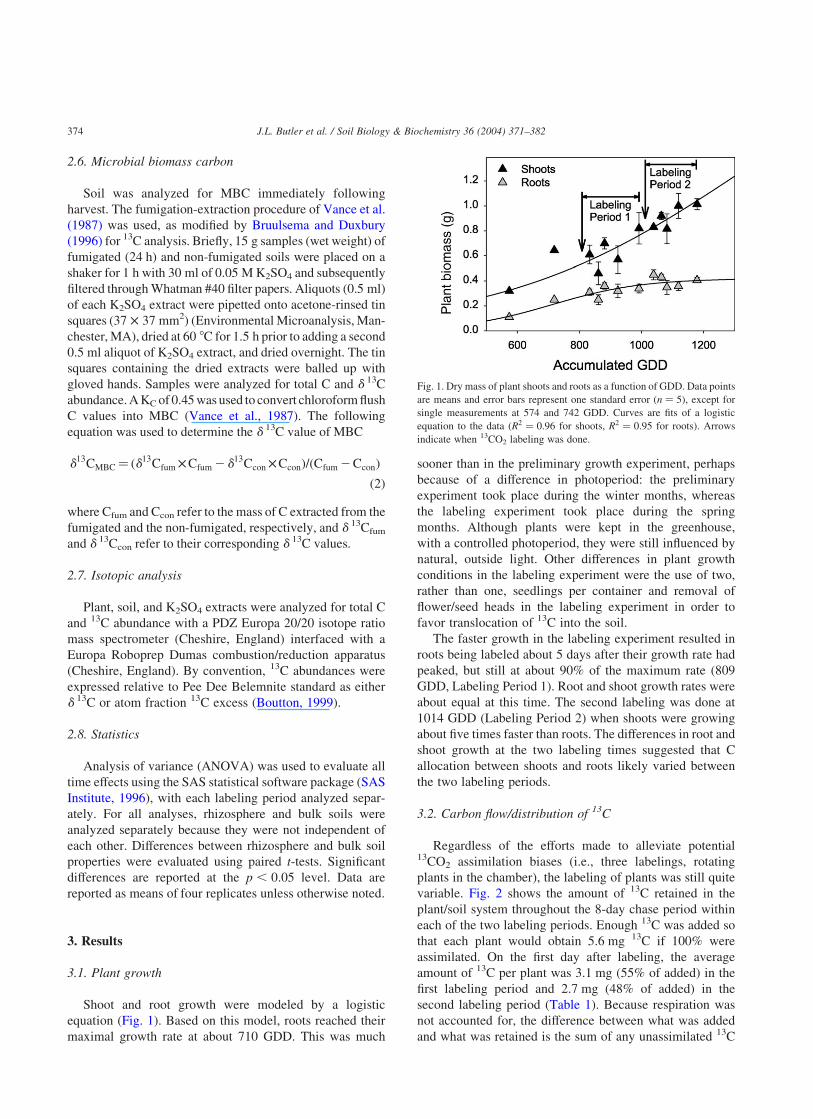
Shoot and root growth were modeled by a logistic
equation (Fig. 1). Based on this model, roots reached their
maximal growth rate at about 710 GDD. This was much
sooner than in the preliminary growth experiment, perhaps
because of a difference in photoperiod: the preliminary
experiment took place during the winter months, whereas
the labeling experiment took place during the spring
months. Although plants were kept in the greenhouse,
with a controlled photoperiod, they were still influenced by
natural, outside light. Other differences in plant growth
conditions in the labeling experiment were the use of two,
rather than one, seedlings per container and removal of
flower/seed heads in the labeling experiment in order to
favor translocation of 13C into the soil.
The faster growth in the labeling experiment resulted in
roots being labeled about 5 days after their growth rate had
peaked, but still at about 90% of the maximum rate (809
GDD, Labeling Period 1). Root and shoot growth rates were
about equal at this time. The second labeling was done at
1014 GDD (Labeling Period 2) when shoots were growing
about five times faster than roots. The differences in root and
shoot growth at the two labeling times suggested that C
allocation between shoots and roots likely varied between
the two labeling periods.
3.2. Carbon flow/distribution of 13C
Regardless of the efforts made to alleviate potential13CO2 assimilation biases (i.e., three labelings, rotating
plants in the chamber), the labeling of plants was still quite
variable. Fig. 2 shows the amount of 13C retained in the
plant/soil system throughout the 8-day chase period within
each of the two labeling periods. Enough 13C was added so
that each plant would obtain 5.6 mg 13C if 100% were
assimilated. On the first day after labeling, the average
amount of 13C per plant was 3.1 mg (55% of added) in the
first labeling period and 2.7 mg (48% of added) in the
second labeling period (Table 1). Because respiration was
not accounted for, the difference between what was added
and what was retained is the sum of any unassimilated 13C
Fig. 1. Dry mass of plant shoots and roots as a function of GDD. Data points
are means and error bars represent one standard error ðn ¼ 5Þ, except for
single measurements at 574 and 742 GDD. Curves are fits of a logistic
equation to the data (R2 ¼ 0:96 for shoots, R2 ¼ 0:95 for roots). Arrows
indicate when 13CO2 labeling was done.
J.L. Butler et al. / Soil Biology & Biochemistry 36 (2004) 371–382374

and that respired during the first day. There were no
statistically significant differences in the amount of 13C
retained at any of the days within or between labeling
periods (Fig. 1, Table 1). Although not statistically
significant, there was a large difference in the amount of13C retained on the second day of each labeling period,
much of which is likely due to the inherent plant-to-plant
variability. In the first labeling period, the plants that were
harvested on the second day were, on average, 25% smaller
than the plants harvested 1 day before them and 35%
smaller than those harvested 1 day after them (Fig. 1). These
plants probably did not have as much leaf area for
photosynthesis compared to the rest of the plants, and
therefore did not assimilate as much 13CO2. In comparison,
the plants that were harvested on the second day of the
second labeling period were, on average, 6% bigger than the
plants harvested the day before them and 13% bigger than
those plants harvested 1 day after them.
Throughout the two chase periods, the d 13C values in
shoots and roots were all significantly higher than the shoots
and roots of the unlabeled control plants (shoots:
228 ^ 0.4‰; roots: 227 ^ 0.3‰). In the first labeling
period, the average shoot d 13C value was 686‰ the day after
labeling and declined to 380‰ by the eighth day (Fig. 3).
Consistent with a lesser amount of total 13C in the plant/soil
system (Fig. 2), plants harvested on day 2 of the first labeling
period also had a lower average d 13C value compared to
plants harvested a day later. This provides further evidence
that the plants harvested on day 2, with lower total plant
biomass, were not as photosynthetically active relative to
plants harvested on day 3. If these plants had assimilated the
same amount as the others, then this would be reflected in
their d 13C values, which would be higher, not lower, than
those harvested on day 3. Overall, the dynamics of d 13C
values in the roots followed a similar trend to the shoots;
however, there were no significant differences between the
root d 13C values throughout the entire labeling period.
In the second labeling period, shoots had an average
d 13C value of 500‰ 1 day after labeling. By day 8, the
average shoot d 13C value had declined to 350‰; however,
there were no significant differences in shoot d 13C values
throughout the entire chase period (Fig. 3). There did appear
to be some shoot to root translocation between days 1 and 2.
Following day 2, root d 13C values generally declined,
although there was a subtle increase between days 5 and 8,
which was not significant and is likely the result of initial
labeling variability.
Throughout each chase period, the d 13C values of both
the rhizosphere and bulk soils were significantly higher than
the unlabeled, planted control soils (rhizosphere:
227.2 ^ 0.03‰; bulk: 227.2 ^ 0.04‰). Aside from the
variability associated with day 2 of the first labeling period,
the d 13C value in the rhizosphere soil declined steadily
during the 8 days, from an average of 221.6‰ on day 1 to
225.3‰ by day 8 (Fig. 3). Conversely, the d 13C value in
the bulk soil did not significantly change during the 8 days.
In the second labeling period, the d 13C values in the
rhizosphere soil also showed an overall decreasing trend
from an average of 223.8‰ on the first day to 225.1‰ on
day 8; however, there were no significant differences with
Fig. 2. Average 13C retained in the plant/soil system (shoots, roots, and soil)
throughout 8-day chase period of each labeling period (with SE, n ¼ 4).
Approximately 5.6 mg of 13C was added per plant.
Table 1
Distribution of the 13C retained on days 1 and 8 of each labeling period (mean ^ SE, n ¼ 4)
Component Labeling Period 1 Labeling Period 2
Day 1 Day 8 Day 1 Day 8
Percentage of 13CO2 added
Plants and soil system 55.5 ^ 7.4 39.6 ^ 8.6 49.5 ^ 5.4 43.7 ^ 4.1
Percentage of 13C in plant/soil system
Shoots 68.8 ^ 1.2 67.8 ^ 3.7 72.1 ^ 4.9 68.5 ^ 3.5
Roots 18.9 ^ 1.6 23.2 ^ 2.6 15.7 ^ 2.8 19.8 ^ 2.9
Rhizosphere soil 7.2 ^ 0.9a 3.7 ^ 0.6b 5.0 ^ 0.7 3.7 ^ 0.3
Bulk soil 5.2 ^ 0.8 5.3 ^ 1.0y 7.1 ^ 1.6 8.0 ^ 0.4x
Percentage of 13C in soil compartment
Rhizosphere microbial biomass C 97.1 ^ 3.4a 42.1 ^ 4.1bx 84.9 ^ 10.3a 27.4 ^ 2.2by
Bulk soil microbial biomass C 88.5 ^ 15.0a 36.4 ^ 6.0b 68.4 ^ 11.1a 23.3 ^ 1.8b
Within a Labeling Period and row, dissimilar letters ‘a and b’ indicate significant differences between day 1 and day 8. Within a row, significant differences
between Labeling Period 1 and 2 for that day are indicated by ‘x and y’.
J.L. Butler et al. / Soil Biology & Biochemistry 36 (2004) 371–382 375
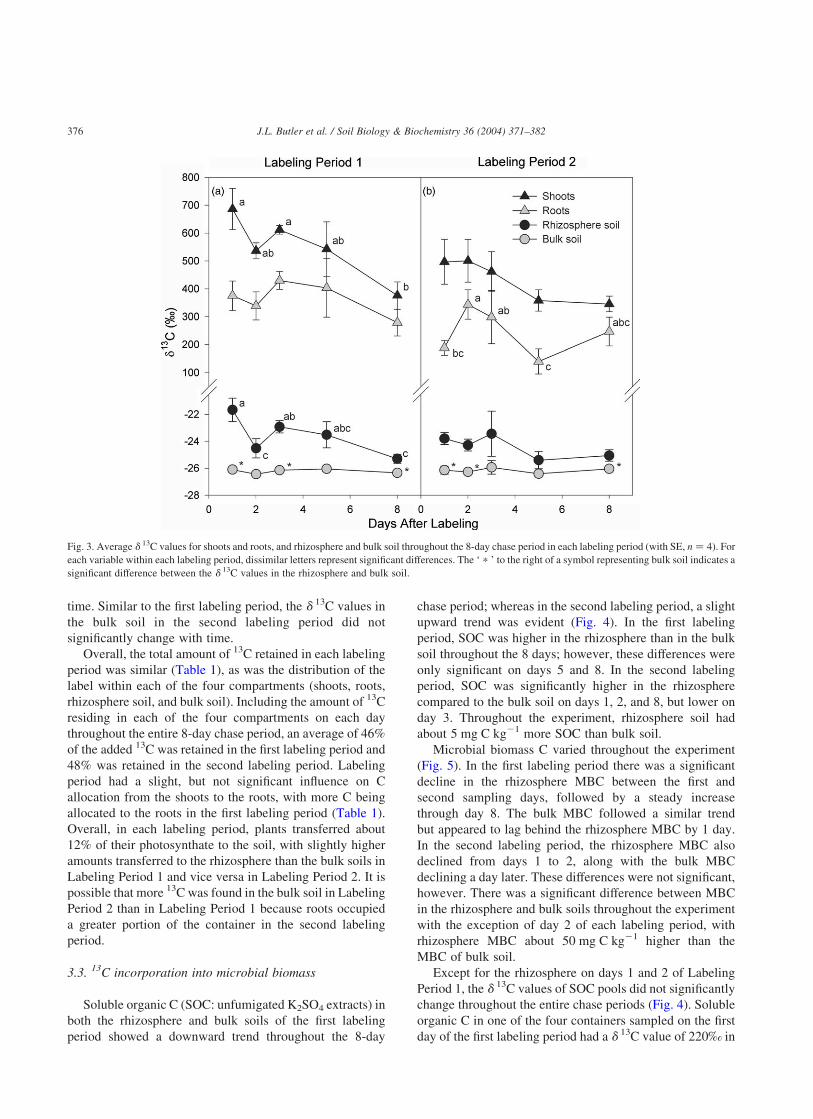
time. Similar to the first labeling period, the d 13C values in
the bulk soil in the second labeling period did not
significantly change with time.
Overall, the total amount of 13C retained in each labeling
period was similar (Table 1), as was the distribution of the
label within each of the four compartments (shoots, roots,
rhizosphere soil, and bulk soil). Including the amount of 13C
residing in each of the four compartments on each day
throughout the entire 8-day chase period, an average of 46%
of the added 13C was retained in the first labeling period and
48% was retained in the second labeling period. Labeling
period had a slight, but not significant influence on C
allocation from the shoots to the roots, with more C being
allocated to the roots in the first labeling period (Table 1).
Overall, in each labeling period, plants transferred about
12% of their photosynthate to the soil, with slightly higher
amounts transferred to the rhizosphere than the bulk soils in
Labeling Period 1 and vice versa in Labeling Period 2. It is
possible that more 13C was found in the bulk soil in Labeling
Period 2 than in Labeling Period 1 because roots occupied
a greater portion of the container in the second labeling
period.
3.3. 13C incorporation into microbial biomass
Soluble organic C (SOC: unfumigated K2SO4 extracts) in
both the rhizosphere and bulk soils of the first labeling
period showed a downward trend throughout the 8-day
chase period; whereas in the second labeling period, a slight
upward trend was evident (Fig. 4). In the first labeling
period, SOC was higher in the rhizosphere than in the bulk
soil throughout the 8 days; however, these differences were
only significant on days 5 and 8. In the second labeling
period, SOC was significantly higher in the rhizosphere
compared to the bulk soil on days 1, 2, and 8, but lower on
day 3. Throughout the experiment, rhizosphere soil had
about 5 mg C kg21 more SOC than bulk soil.
Microbial biomass C varied throughout the experiment
(Fig. 5). In the first labeling period there was a significant
decline in the rhizosphere MBC between the first and
second sampling days, followed by a steady increase
through day 8. The bulk MBC followed a similar trend
but appeared to lag behind the rhizosphere MBC by 1 day.
In the second labeling period, the rhizosphere MBC also
declined from days 1 to 2, along with the bulk MBC
declining a day later. These differences were not significant,
however. There was a significant difference between MBC
in the rhizosphere and bulk soils throughout the experiment
with the exception of day 2 of each labeling period, with
rhizosphere MBC about 50 mg C kg21 higher than the
MBC of bulk soil.
Except for the rhizosphere on days 1 and 2 of Labeling
Period 1, the d 13C values of SOC pools did not significantly
change throughout the entire chase periods (Fig. 4). Soluble
organic C in one of the four containers sampled on the first
day of the first labeling period had a d 13C value of 220‰ in
Fig. 3. Average d 13C values for shoots and roots, and rhizosphere and bulk soil throughout the 8-day chase period in each labeling period (with SE, n ¼ 4). For
each variable within each labeling period, dissimilar letters represent significant differences. The ‘ p ’ to the right of a symbol representing bulk soil indicates a
significant difference between the d 13C values in the rhizosphere and bulk soil.
J.L. Butler et al. / Soil Biology & Biochemistry 36 (2004) 371–382376

the rhizosphere compared to an average of 22‰ for the other
three plants sampled that day. This point was therefore
removed from the data set prior to data analysis. The
significance of this point is not known, but is likely the result
of plant-to-plant variability. In each labeling period SOC in
the rhizosphere had significantly higher d 13C values relative
to the unlabeled, planted and unplanted control soils
(226.5 ^ 0.1‰). In the first labeling period, the bulk soil
d 13C value of SOC was only significantly higher than the
control from days 3 through 8, whereas in the second labeling
period, the bulk d 13C value of SOC was significantly higher
throughout the entire chase period (Fig. 4). Soluble organic C
had higher d 13C in the rhizosphere soil relative to the bulk
soil throughout the entire chase periods; in the first labeling
period this difference was significant on every sampling day,
whereas it was only significant on days 2 and 8 of the second
labeling period.
Fig. 5 shows the 13C incorporation into the MBC pool.
Throughout each of the chase periods, the d 13C values of
the rhizosphere and bulk MBC were significantly higher
than the d 13C values of the unlabeled, planted control
MBC (224.7 ^ 0.04‰). Furthermore, there was no
evidence of autotrophic activity, as revealed by the d 13C
values of the microbial biomass in the unplanted control
soils that underwent the labeling treatment
(224.5 ^ 0.1‰). Initial incorporation of rhizodeposited13C into the MBC occurred within the first 24 h of labeling,
as is illustrated by the high d 13C values 1 day after
labeling of each labeling period (Fig. 5). In the first
labeling period, rhizosphere MBC d 13C values had a
downward trend throughout the 8-day chase period (from
455‰ on day 1 to 50‰ on day 8). The bulk soil MBC also
declined from 64‰ on day 1 to 1.0‰ on day 8. Similar
trends were evident in the second labeling period: the d 13C
values of the MBC declined in the rhizosphere soil from
220‰ on day 1 to 40‰ on day 8 and in the bulk soil from
60‰ on day 1 to 10‰ on day 8. Rhizosphere microbial
biomass was significantly more labeled than the bulk
Fig. 4. Soluble organic C in rhizosphere and bulk soil throughout the 8-day chase periods (means with SE, n ¼ 5; except n ¼ 4 for the bulk soil on day 8 of
Labeling Period 2). Within the rhizosphere or bulk samples, dissimilar letters indicate significant differences. The ‘ p ’ to the left of rhizosphere samples
indicate significant differences between the rhizosphere and bulk samples on that day. Mean d 13C values of soluble organic C in bulk and rhizosphere soils
throughout the 8-day chase periods (with SE, n ¼ 4). Within the rhizosphere or bulk samples, dissimilar letters indicate significant differences. The outlier in
the rhizosphere of Labeling Period 1 was removed prior to data analysis. The ‘ p ’ indicate significant differences between the rhizosphere and bulk samples
and the ‘^’ indicate significant differences between the bulk samples and the unlabeled control samples.
J.L. Butler et al. / Soil Biology & Biochemistry 36 (2004) 371–382 377

microbial biomass on days 1, 3, and 8 of the first labeling
period and days 1, 2, 5, and 8 of the second labeling period.
There was a strong correlation between the d 13C values
of the rhizosphere and bulk microbial biomass in each
labeling period (Labeling Period 1: R2 ¼ 0:77; Labeling
Period 2: R2 ¼ 0:82). The rhizosphere MBC was more than
six times as highly labeled as the bulk MBC in the first
labeling period, whereas in the second labeling period, the
rhizosphere MBC was only, on average, three times more
highly labeled than the bulk MBC.
The proportion of the 13C in the soil that resided in
the microbial biomass pool on days 1 and 8 is shown in
Table 1. On day 1, 97% of the 13C in the rhizosphere
soil resided in the microbial biomass pool in the first
labeling period, compared to 85% in Labeling Period 2.
In the bulk soil, 88% of the 13C label resided in the
MBC pool in Labeling Period 1, whereas 68% resided in
this pool in the second labeling period. By the end of
the 8-day chase period in Labeling Period 1, 42% of the
rhizosphere soil 13C resided in the rhizosphere MBC,
whereas 36% of the bulk soil 13C resided in the bulk
MBC pool. In contrast, in the second labeling period
only 27% of the rhizosphere soil 13C resided in the
rhizosphere MBC and 23% of the bulk soil 13C resided
in the bulk MBC pool. There were no significant
differences between the percentages of soil 13C in the
rhizosphere MBC compared to the bulk MBC in either
chase period.
4. Discussion
Results from this study add to previous studies
demonstrating that 13C pulse-chase labeling serves as a
useful tool for obtaining information on the cycling of
rhizodeposition (Kuzyakov and Domanski, 2000).
Fig. 5. Microbial biomass C in rhizosphere and bulk soil throughout the two 8-day chase periods (mean with SE, n ¼ 5). Within rhizosphere or bulk samples,
dissimilar letters indicate significant differences. The ‘ p ’ indicate significant differences between rhizosphere and bulk samples. Mean d 13C values of
rhizosphere and bulk microbial biomass throughout the 8-day chase periods (with SE, n ¼ 4). Dissimilar letters within the rhizosphere or bulk samples indicate
significant differences. The ‘ p ’ to the left of the rhizosphere samples indicate significant differences between the rhizosphere and bulk samples. The R2 for the
negative exponential line fit in Labeling Period 1 was 0.87 in the rhizosphere and 0.91 in the bulk. In Labeling Period 2 the R2 was 0.93 in the rhizosphere and
0.93 in the bulk soil.
J.L. Butler et al. / Soil Biology & Biochemistry 36 (2004) 371–382378
Although there was a slight, but not significant, shift from
more 13C allocated to the roots in Labeling Period 1 to
more 13C allocated to shoots in the second labeling
period, in general, the 13C distribution was similar
between the two labeling periods. This similarity is likely
because we labeled during a stage of transition into active
shoot growth and then 10 days later during a more active
shoot growth stage (Fig. 1) rather than during two distinct
growth stages (i.e., active root growth and rapid shoot
growth). Nevertheless, several fundamental differences
associated with the microbial cycling of 13C-labeled
rhizodeposition were apparent, which suggests that some
ecological/physiological changes had occurred within the
plant/soil soil system between the first and second
labeling periods.
4.1. Carbon flow
Several studies have documented that maximum shoot
and root respiration of labeled C occur within the first
24 h after pulse-labeling (Gregory and Atwell, 1991;
Swinnen et al., 1994; Domanski et al., 2001; Kuzyakov
et al., 2001; Hutsch et al., 2002; Ostle et al., 2003). For
example, in a 14CO2 pulse-chase labeling experiment with
50-day-old wheat and barley, Gregory and Atwell (1991)
observed that 15–25% of the assimilated 14CO2 was
respired within the first 24 h, the majority of which
occurred in the first 7.5 h. Others have reported shoot
respiration rates as high as 50% shortly after assimilation
(Warembourg and Morall, 1978). These findings, along
with the possibility that our plants did not assimilate all of
the 13CO2 on the day of labeling could explain why only
50% of the added 13C was retained in the plant/soil
system 1 day after labeling. This trend was consistent
between the two labeling periods, suggesting that they
responded similarly.
Kuzyakov and Domanski (2000) put together an
excellent review on above- and below-ground C
distribution in pulse-chase labeling experiments. From
this review, it appears that on average, 50% (and as high
as 80%) of plant-assimilated C is transferred below-
ground in pasture plants. Of this 50%, half remains in
roots (25% of total assimilated) and the other half is
incorporated into microbial biomass and soil organic
matter or respired by roots and microorganisms. It is
difficult to compare our C allocation results with other
studies given that we are not certain what percentage of
the 13CO2 was initially assimilated or how much was
respired. Nevertheless, we found an average of 20%
retained in roots and an average of 10% retained in soil
(Table 1), suggesting that the below-ground distribution
of 13C in our study was similar to previous reports.
The fact that in each of the two labeling periods there
were no significant changes in the total amount of 13C
retained in the plant/soil system with time (although
there was a decreasing trend; Fig. 2) and that the only
significant change in the distribution of 13C occurred
within the rhizosphere (Table 1) suggests that, for the
most part, the label had stabilized in the plant system
within the first 24 h. Although there might have been
some subtle shifts in C allocation within the plant, the
most dynamic flow of C throughout the rest of the chase
period was clearly evident within the microbial biomass
pool.
Through use of mathematical models, Kuzyakov et al.
(2001) demonstrated that maximum 14CO2 efflux from the
soil after pulse-labeling occurs in two main phases: the first
of which is root respiration, occurring during the first day
after labeling, followed by the second phase, occurring
between the second and fifth days, which is dominated by
microbial respiration of rhizodeposits. Although we can
only speculate about root respiration in our study, our
findings are consistent with a second phase of soil CO2
efflux as shown by the declining proportion of soil 13C in the
microbial biomass throughout the 8-day chase periods
(Table 1).
After pulse labeling 3-week-old wheat plants with14CO2, Cheng et al. (1993) found evidence of 14C in the
soil in less than 1 h, suggesting that recently assimilated
C moved through the system very rapidly. Additionally,
Rattray et al. (1995) found maximum incorporation of14C into the microbial biomass in the rhizosphere of
perennial ryegrass within 3 h of pulse labeling. By the
seventh day of the chase period, they could no longer
detect 14C in the microbial biomass. In a flooded rice
system, Lu et al. (2002) found 13C in SOC and MBC
immediately following a 6 h labeling period, with
maximum 13C incorporation into MBC 3 days later.
Although we did not sample until 24 h after labeling,
translocation of 13C into the soil and the subsequent
incorporation into the microbial biomass occurred rapidly
(within 24 h) in our system as well. This rapid flux is
also shown by the low d 13C values of the soluble C
pools the first day after labeling (Fig. 5), which is similar
to the data of Lu et al. (2002).
Although 13C-labeled rhizodeposition appeared in
similar proportions in each of the two labeling periods
(Table 1), differences in both the incorporation of 13C-
labeled rhizodeposits into the MBC pool and the
subsequent turnover of 13C-labeled microbial biomass
were evident. The fact that only 85% of the rhizosphere
soil and 68% of the bulk soil 13C were incorporated into
the MBC on day 1 of the second labeling period, whereas
97% of rhizosphere 13C and just under 88% of the bulk
soil 13C were incorporated into the MBC in the first
labeling period (Table 1), suggests that the substrate
quality of exudates might have been lower in Labeling
Period 2 than in Labeling Period 1. It has been
documented that the amounts of easily metabolized
proteins and carbohydrates in rhizodeposition generally
decrease with age (Brimecombe et al., 2001). Thus there
could have been more complex, less soluble forms of
J.L. Butler et al. / Soil Biology & Biochemistry 36 (2004) 371–382 379

rhizodeposition entering the soil, such as sloughed-off root
cap cells. Alternatively, it is possible that rhizodeposits
had lower C:N ratios in Labeling Period 1 and that
nitrogen (N) availability was influencing the amount of
rhizodeposition that got incorporated into the microbial
biomass, which has been documented in other studies
(Merckx et al., 1987; Liljeroth et al., 1990). We did not
measure soil N availability, however.
Bokhari et al. (1979) found 4.5 times more soluble sugar
in the rhizosphere of blue grama, whereas 1.3 times more
insoluble sugar was found in the non-rhizosphere soil.
Additionally, decreasing ratios of soluble-to-insoluble
rhizodeposits with increasing distance from the roots has
also been observed in wheat, barley, maize, tomato and pea
plants (Whipps, 1984, 1985, 1987). Thus, it is not
surprising that we observed slower incorporation of
rhizodeposition into the MBC in the bulk soils, relative
to the rhizosphere soils.
Five days after pulse-labeling perennial ryegrass with14CO2, Kuzyakov et al. (2001, 2002) found between 0.5
and 1.7% of the total 14C incorporated into the microbial
biomass pool, which corresponded to approximately one-
third of the total soil 14C (presumably the entire
container was considered rhizosphere soil with nine
plants and 2.2 or 3.5 kg soil). Similarly, in our study,
between 1 and 3% of the plant/soil system 13C on day 5
resided in each of the microbial biomass pools (data not
shown). Although there were slight variations between
the labeling periods, these values generally correspond to
approximately one-third of the 13C in the soil (Table 1);
the remaining two-thirds had therefore been incorporated
into soil organic matter.
During the 8-day chase periods, the decline of 13C in
the microbial biomass C pool followed an exponential
relationship with time (Fig. 5). Average turnover rates
and turnover times for the recently assimilated C in the
microbial biomass pools in each of the two labeling
periods were estimated by fitting the data to a negative
exponential model
Fp ¼ Fp0e2kt ð3Þ
where Fp0 is the atom fraction excess 13C at time t ¼ 0;
Fp is the atom fraction excess 13C at time t; and k is the
rate constant. Average atom fraction 13C of the soluble C
pool was used to determine the atom fraction excess 13C
of MBC because we assumed that the majority of
rhizodeposited 13C entering the MBC pool had originated
from readily available compounds in the soluble C pool
as suggested by de Neergaard and Magid (2001).
Furthermore, this calculation of average turnover time
is based on the assumption of steady-state conditions
(i.e., constant microbial biomass pool size). Although not
strictly true (MBC varied significantly at a few time
points; Fig. 5), given the high variability and random up/
down fluctuations, this would seem a reasonable
approximation.
Average rate constants ðkÞ and associated turnover
times (the inverse of the rate constant, k) for the
rhizosphere soils were, 0.32 ^ 0.07 day21, with a turn-
over of 3.2 days for Labeling Period 1, and 0.24 ^ 0.05
day21 for Labeling Period 2, with a turnover time of 4.2
days. Bulk values were: 0.18 ^ 0.02 day21 with a
turnover time of 5.5 days in Labeling Period 1, and
0.14 ^ 0.07 day21 and a turnover time of 7.1 days in
Labeling Period 2. Turnover times were nearly twice as
fast in the rhizosphere compared to the bulk soil in each
labeling period. This suggests that the microorganisms in
the rhizosphere were more active than in the bulk soil,
which would be expected.
Faster turnover rates are generally observed in the
rhizospheres of younger root systems (Kuzyakov et al.,
2001), thus it is likely that we would have seen turnover rates
faster than 3 days had we labeled in earlier stages of root
growth. Furthermore, the slower turnover times observed in
both the rhizosphere and bulk soils of Labeling Period 2
suggest that the microbial biomass was more stable at the
later stage of plant growth. Norton et al. (1990) estimated 9
days for the turnover of 14C labeled microbial biomass
utilizing rhizodeposition under ponderosa pine seedlings and
the data of Ostle et al. (2003) suggest a 7-day turnover for soil
RNA in a 13CO2 pulse-chase experiment with grass sod.
5. Conclusion
Our results confirm that recently assimilated C moves
through the plant/soil system at a very rapid pace. Within
24 h after labeling, approximately 12% of the total 13C
retained in the plant/soil system resided in the soil, much
of which had already been incorporated into the soil
microbial biomass. Although the overall C distribution
patterns were similar in the two labeling periods, our
results show fundamental differences in the way in which
rhizodeposition was cycled through the total microbial
biomass during a transition stage of plant development
and in a stage more dominated by shoot growth. The use
of 13C pulse-chase labeling was an effective approach for
examining the microbial dynamics associated with rhizo-
sphere C cycling. Application of this methodology to a
range of plant species, developmental growth stages, and
environmental conditions has the potential to greatly
enhance our knowledge of the dynamics of rhizosphere
processes.
Acknowledgements
We thank Richard Caskey for help with construction of
the labeling chamber and greenhouse operations. This work
was supported by a grant from the National Science
Foundation (DEB00-75777) to Peter Bottomley and David
Myrold.
J.L. Butler et al. / Soil Biology & Biochemistry 36 (2004) 371–382380
References
Anderson, T.H., Domsch, K.H., 1989. Ratios of microbial biomass carbon
to total organic carbon in arable soils. Soil Biology and Biochemistry
21, 471–479.
Aoyama, M., Angers, D.A., N’Dayegamiye, A., Bissonnette, N.,
2000. Metabolism of 13C-labeled glucose in aggregates from soils
with manure application. Soil Biology and Biochemistry 32,
295–300.
Bokhari, U.G., Coleman, D.C., Rubink, A., 1979. Chemistry of root
exudates and rhizosphere soils of prairie plants. Canadian Journal of
Botany 57, 1473–1477.
Boutton, T.W., 1999. Stable carbon isotope ratios of natural materials:
I. Sample preparation and mass spectrometric analysis. In: Coleman,
D.C., Fry, B. (Eds.), Carbon Isotope Techniques, Academic Press, San
Diego, pp. 155–171.
Brimecombe, M.J., De Leij, F.A., Lynch, J.M., 2001. The effect of root
exudates on rhizosphere microbial populations. In: Pinton, R., Uaranini,
Z., Nanniperi, P. (Eds.), The Rhizosphere: Biochemistry and Organic
Substances at the Soil–Plant Interface, Marcel-Dekker, New York, pp.
95–140.
Bruulsema, T.W., Duxbury, J.M., 1996. Simultaneous measurement of soil
microbial nitrogen, carbon, and carbon isotope ratio. Soil Science
Society of American Journal 60, 1787–1791.
Butler, J.L., Williams, M.A., Bottomley, P.J., Myrold, D.D.,
2003. Microbial community dynamics associated with
rhizosphere carbon flow. Applied and Environmental Microbiology
69, 6793–6800.
Cardon, Z.G., Hungate, B.A., Cambardella, C.A., Chapin, F.S. II, Field,
C.B., Holland, E.A., Mooney, H.A., 2001. Contrasting effects of
elevated CO2 on old and new carbon pools. Soil Biology and
Biochemistry 33, 365–373.
Cheng, W., Coleman, D.C., Carrol, C.R., Hoffman, C.A., 1993. In
situ measurement of root respiration and soluble C
concentrations in the rhizosphere. Soil Biology and Biochemistry
25, 1189–1196.
de Neergaard, A., Magid, J., 2001. Influence of the rhizosphere on
microbial biomass and recently formed organic matter. European
Journal of Soil Science 52, 377–384.
Domanski, G., Kuzyakov, Y., Siniakina, S.V., Stahr, K., 2001. Carbon
flows in the rhizosphere of ryegrass (Lolium perenne). Journal of Plant
Nutrition and Soil Science 164, 381–387.
Gohlke, T., Griffith, S.M., Steiner, J.J., 1999. Effects of crop rotation and
no-till crop establishment on grass seed production systems in the
Willamette Valley, Oregon, USDA, NRCS Technical Notes, Agronomy
Technical Note No. 30,.
Gregory, P.J., Atwell, B.J., 1991. The fate of carbon in pulse-labeled crops
of barley and wheat. Plant and Soil 136, 205–213.
Griffith, S.M., 2000. Relationship between accumulated growing degree
days and stages of ryegrass plant development. In: Young, W. III, (Ed.),
Seed Production Research, Oregon State University Extension and
USDA-ARS, Corvallis, Oregon, pp. 10–11.
Hale, M.G., Moore, L.D., 1979. Factors affecting root exudation II: 1970–
1978. Advances in Agronomy 31, 93–123.
Hutsch, B.W., Augustin, J., Merbach, W., 2002. Plant rhizodeposition—an
important source for carbon turnover in soils. Journal of Plant Nutrition
and Soil Science 165, 397–407.
Kouno, K., Wu, J., Brooks, P.C., 2002. Turnover of biomass C and P in soil
following incorporation of glucose and ryegrass. Soil Biology and
Biochemistry 34, 617–622.
Kraffczyk, I., Trolldenier, G., Beringer, H., 1984. Soluble root exudates of
maize: influence of potassium supply and rhizosphere microorganisms.
Soil Biology and Biochemistry 16, 315–322.
Kuzyakov, Y., Domanski, G., 2000. Carbon input by plants into
soil [Review]. Journal of Plant Nutrition and Soil Science 163,
421–431.
Kuzyakov, Y., Ehrensberger, H., Stahr, K., 2001. Carbon partitioning and
below-ground translocation by Lolium perenne. Soil Biology and
Biochemistry 33, 61–74.
Kuzyakov, Y., Biryukova, O.V., Kuznetzova, T.V., Molter, K., Kandeler,
E., Stahr, K., 2002. Carbon partitioning in plant and soil, carbon dioxide
fluxes and enzyme activities as affected by cutting ryegrass. Biology
and Fertility of Soils 35, 348–358.
Liljeroth, E., van Veen, J.A., Miller, H.J., 1990. Assimilate
translocation to the rhizosphere of two wheat lines and subsequent
utilization by rhizosphere microorganisms at two soil
nitrogen concentrations. Soil Biology and Biochemistry 22,
1015–1021.
Lu, Y., Watanabe, A., Kimura, M., 2002. Contributions of plant-derived
carbon to soil microbial biomass dynamics in a paddy rice microcosm.
Biology and Fertility of Soils 36, 136–142.
Lynch, J.M., Whipps, J.M., 1990. Substrate flow in the rhizosphere. Plant
and Soil 129, 1–10.
Martin, J.K., 1977. Factors influencing the loss of organic carbon from
wheat roots. Soil Biology and Biochemistry 9, 1–7.
Martin, J.K., Kemp, J.R., 1980. Carbon loss from roots of wheat cultivars.
Soil Biology and Biochemistry 12, 551–554.
Meharg, A.A., 1994. A critical review of labelling techniques used to
quantify rhizosphere carbon-flow. Plant and Soil 166, 55–62.
Merckx, R., den Hartog, A., van Veen, J.A., 1985. Turnover of root-derived
material and related microbial biomass formation in soils of different
texture. Soil Biology and Biochemistry 17, 565–569.
Merckx, R., Dijkstra, A., den Hartog, A., van Veen, J.A., 1987. Production of
root-derived material and associated microbial growth in soil at different
nutrient levels. Biology and Fertility of Soils 5, 126–132.
Norton, J.M., Smith, J.L., Firestone, M.K., 1990. Carbon flow in the
rhizosphere of ponderosa pine seedlings. Soil Biology and Biochem-
istry 22, 449–455.
Ostle, N., Whiteley, A.S., Bailey, M.J., Sleep, D., Ineson, P., Manefield,
M., 2003. Active microbial RNA turnover in a grassland soil
estimated using a 13CO2 spike. Soil Biology and Biochemistry 35,
877–885.
Rattray, E.A.S., Paterson, E., Killham, K., 1995. Characterization of the
dynamics of C-partitioning within Lolium perenne and to the
rhizosphere microbial biomass using 14C pulse chase. Biology and
Fertility of Soils 19, 280–286.
Ryan, M.C., Aravena, R., 1994. Combining 13C natural abundance and
fumigation-extraction methods to investigate soil microbial biomass
turnover. Soil Biology and Biochemistry 26, 1583–1585.
SAS Institute, 1996. SAS/STAT user’s guide. Version 6.12. SAS Institute,
Cary, NC.
Saggar, S., Parshotam, A., Sparling, G.P., Feltham, C.W., Hart, P.B.S.,
1996. 14C-labeled ryegrass turnover and residence times in soils varying
in clay content and mineralogy. Soil Biology and Biochemistry 28,
1677–1686.
Svejcar, T.J., Boutton, T.W., Trent, J.D., 1990. Assessment of carbon
allocation with stable carbon isotope labeling. Agronomy Journal 82,
18–21.
Swinnen, J., van Veen, J.A., Merckx, R., 1994. 14C pulse-labeling of
field-grown spring wheat: an evaluation of its use in rhizosphere
carbon budgets estimations. Soil Biology and Biochemistry 26,
161–170.
Swinnen, J., van Veen, J.A., Merckx, R., 1995. Root decay and turnover
of rhizodeposits in field-grown winter wheat and spring barley
estimated by 14C pulse-labelling. Soil Biology and Biochemistry 27,
211–217.
van Ginkel, J.H., Gorrisen, A., van Veen, J.A., 1997. Carbon and
nitrogen allocation in Lolium perenne in response to elevated
atmospheric CO2 with emphasis on soil carbon dynamics. Plant and
Soil 188, 299–308.
van Ginkel, J.H., Gorrisen, A., Polci, D., 2000. Elevated atmospheric
carbon dioxide concentration: effects of increased carbon input in
J.L. Butler et al. / Soil Biology & Biochemistry 36 (2004) 371–382 381

a Lolium perenne soil on microorganisms and decomposition. Soil
Biology and Biochemistry 32, 449–456.
Vance, E.D., Brookes, P.C., Jenkinson, D.S., 1987. An extraction method
for measuring soil microbial biomass C. Soil Biology and Biochemistry
19, 703–707.
Warembourg, F.R., Morall, R.A.A., 1978. Energy flow in the plant-
microorganism system. In: Dommergues, Y.R., Krupa, S.V. (Eds.),
Interactions between Non-Pathogenic Soil Microorganisms and Plants,
Elsevier, Amsterdam, pp. 205–242.
Whipps, J.M., 1984. Environmental factors affecting the loss of carbon
from the roots of wheat and barley seedlings. Journal of Experimental
Botany 35, 767–773.
Whipps, J.M., 1985. Effect of CO2 concentration on growth, carbon
distribution and loss of carbon from the roots of maize. Journal of
Experimental Botany 36, 644–651.
Whipps, J.M., 1987. Carbon loss form the roots of tomato and pea seedlings
grown in soil. Plant and Soil 103, 95–100.
J.L. Butler et al. / Soil Biology & Biochemistry 36 (2004) 371–382382
Related Documents