Distribution and chromatic adaptation of phytoplankton within a shelf sea thermocline Anna E. Hickman 1 Proudman Oceanographic Laboratory, 6 Brownlow St., Liverpool L3 5DA, United Kingdom Patrick M. Holligan and C. Mark Moore National Oceanography Centre, University of Southampton, European Way, Southampton SO14 3ZH, United Kingdom Jonathan Sharples Proudman Oceanographic Laboratory, 6 Brownlow St., Liverpool L3 5DA, United Kingdom Vladimir Krivtsov School of Ocean Sciences, University of Wales Bangor, Menai Bridge, Gwynedd LL59 5EY, United Kingdom Matthew R. Palmer Proudman Oceanographic Laboratory, 6 Brownlow St., Liverpool L3 5DA, United Kingdom Abstract Observations of vertical gradients in phytoplankton community structure were made through the water column of the seasonally stratified Celtic Sea, including within the thermocline. A deep chlorophyll maximum (DCM) was located within the thermocline at all stations, coupled to the nitracline. Vertical gradients in phytoplankton community composition were routinely observed within the thermocline. The cell abundance maxima for Synechococcus occurred in the upper part of the DCM coincident with a picoeukaryote abundance minima. Picoeukaryote abundance typically increased at or just above the peak of the DCM. Diatoms were observed occasionally at the DCM peak. Pigment compositions and phytoplankton absorption spectra indicated that the different phytoplankton communities were chromatically well adapted to the spectral composition of irradiance at the depths where they occurred in the water column. Profiles of vertical eddy diffusivity revealed that timescales for mixing between the phytoplankton layers within the thermocline were in excess of typical phytoplankton growth rates. The observed vertical gradients in community structure could therefore result from selection and niche partitioning of phytoplankton types on the light and nutrient gradient within the thermocline. The data further indicate that the pigments, light absorption characteristics, and cell size contribute to the phytoplankton selection process. The Celtic Sea, part of the temperate Northwest European shelf, is a tidally dynamic environment where water column structure is strongly influenced by the balance of solar heating and tidally generated mixing (Simpson and Hunter 1974). Much of the region becomes thermally stratified in April, initiating the spring phyto- plankton bloom (Pingree et al. 1976). The water column remains stratified throughout the summer, with the thermocline forming a boundary between nutrient-depleted surface mixed layer (SML) above and the nutrient-rich bottom mixed layer (BML) below (Pingree et al. 1977). During this seasonal stratification, a deep chlorophyll maximum (DCM) is present within the thermocline (Pingree et al. 1977). The DCM is typically located toward the base of the density gradient, lies within the euphotic zone, and is strongly coupled to the nitracline (Holligan et al. 1984a,b; Sharples et al. 2001). Energy from tidally induced turbulence is dissipated at the base of the thermocline, causing upward mixing of nitrate into the thermocline from the BML and downward mixing of phytoplankton from the base of the DCM (Sharples et al. 2001). Previous observations in the Celtic Sea have revealed a vertical flux of nitrate into the thermocline of around 2 mmol N m 22 d 21 with the DCM maintained at a depth corresponding to ,5% of surface irradiance (Sharples et al. 2001). The DCM is often observed to be a biomass and photosynthesis maximum as well as a pigment maximum (Holligan et al. 1984a,b; Pemberton et al. 2004; Moore et al. 2006). Monospecific blooms with chlorophyll a (Chl a) concentrations .10 mg Chl a m 23 have been reported (Holligan et al. 1984a; Sharples et al. 2001). In shelf seas, the relatively high light and nutrient availability at the DCM coupled with downward mixing of phytoplankton to the BML causes significant new produc- tion (sensu Dugdale and Georing 1967) and potentially 1 Present address: Department of Earth and Ocean Sciences, University of Liverpool, Liverpool, L69 3GP, United Kingdom Acknowledgments Thanks to Y. N. Kim, M. Qurban, M. Lucas, M. Green, J. Tweddle, T. Rippeth, and J. Simpson for data collection at sea, A. Poulton for phytoplankton cell counts, and R. Holland and M. Zubkov for assistance with flow cytometry. We also thank the officers and crew of the RRS Charles Darwin (CD173) and RV Prince Madog for their assistance at sea. We are grateful for the constructive comments from two anonymous reviewers. This work was supported by the UK Natural Environment Research Council grant NER/A/S/2001/00449 (University of Southampton), NER/A/S/2001/00961 (University of Wales, Ban- gor), and NERC core funding of the Proudman Oceanographic Laboratory. Limnol. Oceanogr., 54(2), 2009, 525–536 E 2009, by the American Society of Limnology and Oceanography, Inc. 525

Welcome message from author
This document is posted to help you gain knowledge. Please leave a comment to let me know what you think about it! Share it to your friends and learn new things together.
Transcript
Distribution and chromatic adaptation of phytoplankton within a shelf sea thermocline
Anna E. Hickman1
Proudman Oceanographic Laboratory, 6 Brownlow St., Liverpool L3 5DA, United Kingdom
Patrick M. Holligan and C. Mark MooreNational Oceanography Centre, University of Southampton, European Way, Southampton SO14 3ZH, United Kingdom
Jonathan SharplesProudman Oceanographic Laboratory, 6 Brownlow St., Liverpool L3 5DA, United Kingdom
Vladimir KrivtsovSchool of Ocean Sciences, University of Wales Bangor, Menai Bridge, Gwynedd LL59 5EY, United Kingdom
Matthew R. PalmerProudman Oceanographic Laboratory, 6 Brownlow St., Liverpool L3 5DA, United Kingdom
Abstract
Observations of vertical gradients in phytoplankton community structure were made through the water column ofthe seasonally stratified Celtic Sea, including within the thermocline. A deep chlorophyll maximum (DCM) waslocated within the thermocline at all stations, coupled to the nitracline. Vertical gradients in phytoplanktoncommunity composition were routinely observed within the thermocline. The cell abundance maxima forSynechococcus occurred in the upper part of the DCM coincident with a picoeukaryote abundance minima.Picoeukaryote abundance typically increased at or just above the peak of the DCM. Diatoms were observedoccasionally at the DCM peak. Pigment compositions and phytoplankton absorption spectra indicated that thedifferent phytoplankton communities were chromatically well adapted to the spectral composition of irradiance at thedepths where they occurred in the water column. Profiles of vertical eddy diffusivity revealed that timescales for mixingbetween the phytoplankton layers within the thermocline were in excess of typical phytoplankton growth rates. Theobserved vertical gradients in community structure could therefore result from selection and niche partitioning ofphytoplankton types on the light and nutrient gradient within the thermocline. The data further indicate that thepigments, light absorption characteristics, and cell size contribute to the phytoplankton selection process.
The Celtic Sea, part of the temperate NorthwestEuropean shelf, is a tidally dynamic environment wherewater column structure is strongly influenced by thebalance of solar heating and tidally generated mixing(Simpson and Hunter 1974). Much of the region becomesthermally stratified in April, initiating the spring phyto-plankton bloom (Pingree et al. 1976). The water columnremains stratified throughout the summer, with thethermocline forming a boundary between nutrient-depletedsurface mixed layer (SML) above and the nutrient-rich
bottom mixed layer (BML) below (Pingree et al. 1977).During this seasonal stratification, a deep chlorophyllmaximum (DCM) is present within the thermocline(Pingree et al. 1977). The DCM is typically located towardthe base of the density gradient, lies within the euphoticzone, and is strongly coupled to the nitracline (Holligan etal. 1984a,b; Sharples et al. 2001).
Energy from tidally induced turbulence is dissipated at thebase of the thermocline, causing upward mixing of nitrateinto the thermocline from the BML and downward mixingof phytoplankton from the base of the DCM (Sharples et al.2001). Previous observations in the Celtic Sea have revealeda vertical flux of nitrate into the thermocline of around 2mmol N m22 d21 with the DCM maintained at a depthcorresponding to ,5% of surface irradiance (Sharples et al.2001). The DCM is often observed to be a biomass andphotosynthesis maximum as well as a pigment maximum(Holligan et al. 1984a,b; Pemberton et al. 2004; Moore et al.2006). Monospecific blooms with chlorophyll a (Chl a)concentrations .10 mg Chl a m23 have been reported(Holligan et al. 1984a; Sharples et al. 2001).
In shelf seas, the relatively high light and nutrientavailability at the DCM coupled with downward mixing ofphytoplankton to the BML causes significant new produc-tion (sensu Dugdale and Georing 1967) and potentially
1 Present address: Department of Earth and Ocean Sciences,University of Liverpool, Liverpool, L69 3GP, United Kingdom
AcknowledgmentsThanks to Y. N. Kim, M. Qurban, M. Lucas, M. Green, J.
Tweddle, T. Rippeth, and J. Simpson for data collection at sea, A.Poulton for phytoplankton cell counts, and R. Holland and M.Zubkov for assistance with flow cytometry. We also thank theofficers and crew of the RRS Charles Darwin (CD173) and RVPrince Madog for their assistance at sea. We are grateful for theconstructive comments from two anonymous reviewers.
This work was supported by the UK Natural EnvironmentResearch Council grant NER/A/S/2001/00449 (University ofSouthampton), NER/A/S/2001/00961 (University of Wales, Ban-gor), and NERC core funding of the Proudman OceanographicLaboratory.
Limnol. Oceanogr., 54(2), 2009, 525–536
E 2009, by the American Society of Limnology and Oceanography, Inc.
525
carbon export (Sharples et al. 2001) during the summermonths. Indeed it has been shown using various methodsthat new production associated with the DCM in aseasonally stratified region of the North Sea is comparablein magnitude with that of the spring bloom (Richardson etal. 2000; Weston et al. 2005). Such estimates are consistentwith nitrate budgets for the Celtic Sea (Sharples et al.2001).
The DCM in shelf seas contrasts with, for example, theDCM in oligotrophic gyres where relatively weak verticalmixing results in upward nitrate fluxes more than one orderof magnitude lower than those measured in the Celtic Sea(Planas et al. 1999), an optically deep DCM, and lowcarbon export (Painter et al. 2007). Aside from thesedifferences however, the DCM in the seasonal thermoclineof shelf seas is located in a region of marked verticalgradients of light and nutrient availability (Holligan et al.1984a,b; Sharples et al. 2001), as is common for the DCMin other hydrographic systems (Cullen 1982).
In the Celtic Sea, although phytoplankton in the DCMhave been observed to differ physiologically and sometimestaxonomically from those in the SML (Holligan et al.1984a,b; Moore et al. 2006), the processes controllingphytoplankton community structure within the seasonalthermocline remain poorly understood. Such processes arecritical determinants of new and export production in shelfsea regions; and predicting biogeochemical responses to,for example, climatic and interannual variability in incidentsolar irradiance, stratification, or nitrate supply requires adetailed understanding of phytoplankton ecophysiology inthese environments.
In this paper we show that vertical taxonomic gradientsexist within the DCM located in the seasonal thermoclineof the Celtic Sea. We consider the hypothesis that bottom-up processes (nutrient and light availability) cause theseobserved gradients. We show that pigment concentrationsand phytoplankton light absorption characteristics con-form to vertical gradients in the spectral light field such thatthe phytoplankton were chromatically well adapted to thespectral quality of irradiance at their respective depths inthe water column (Takahashi et al. 1989; Bidigare et al.1990a; Lutz et al. 2003). Further, we illustrate thatphytoplankton cell sizes increased with depth on the nitrategradient. We relate our observations to recent modelingstudies (Fennel and Boss 2003) and studies in differenthydrographic regimes including oligotrophic gyres (Bidi-gare et al. 1990a; Lutz et al. 2003).
Methods
Water sampling—Data were collected at several loca-tions across the stratified region of the Celtic Sea shelfduring RRS Charles Darwin cruise CD173 (15 July–06August 2005, Fig. 1). A Seabird 911 conductivity, temper-ature, depth (CTD) probe fitted with a Chelsea InstrumentsAquatracka MKIII chlorophyll fluorometer providedprofiles of temperature, salinity, and fluorescence and therosette included 24- 3 20-liter Niskin bottles for watercollection. Samples were collected on the upcast of theCTD deployment with sample depths chosen on the basis
of the real-time fluorescence and temperature traces.Samples within the thermocline were typically around 5m apart, reducing to 2 m for some cases when thethermocline was narrow and when the sea state wasfavorable. This was a reasonable depth resolution givenour intention to sample across light and nutrient gradients,and given our sampling bottle length of 1 m. Nitratesamples were measured on board using standard colori-metric techniques (Grasshoff et al. 1983) on a scalar AAII-type autoanalyzer to a detection limit of ,0.1 mmol L21.
Estimates of vertical eddy diffusivity, Kz, (m2 s21), wereobtained from repeated profiles of shear microstructuremeasured by a free-falling turbulence profiler (FLY)following methods described by Rippeth et al. (2003).FLY profiles were carried out either from the same vesselor from a second ship (RV Prince Madog) no more than 2km away.
Phytoplankton characteristics—Biological measure-ments were obtained from at least one depth within theSML and at least two depths within the thermocline,corresponding to the peak of the DCM and to the upperslope of the DCM, as determined by the in situ fluorescenceprofile. Total and size-fractionated Chl a was measured onboard using a Turner A-10 fluorometer following themethod of Welschmeyer (1994). Samples for pigmentanalysis and particulate organic carbon (POC) analysiswere filtered through 25-mm Whatman GF/F filters andstored at 280uC for return to the laboratory. Pigmentsamples were analyzed using high-performance liquidchromatography (HPLC) on a Thermo Separation prod-ucts HPLC instrument following the method of Barlow et
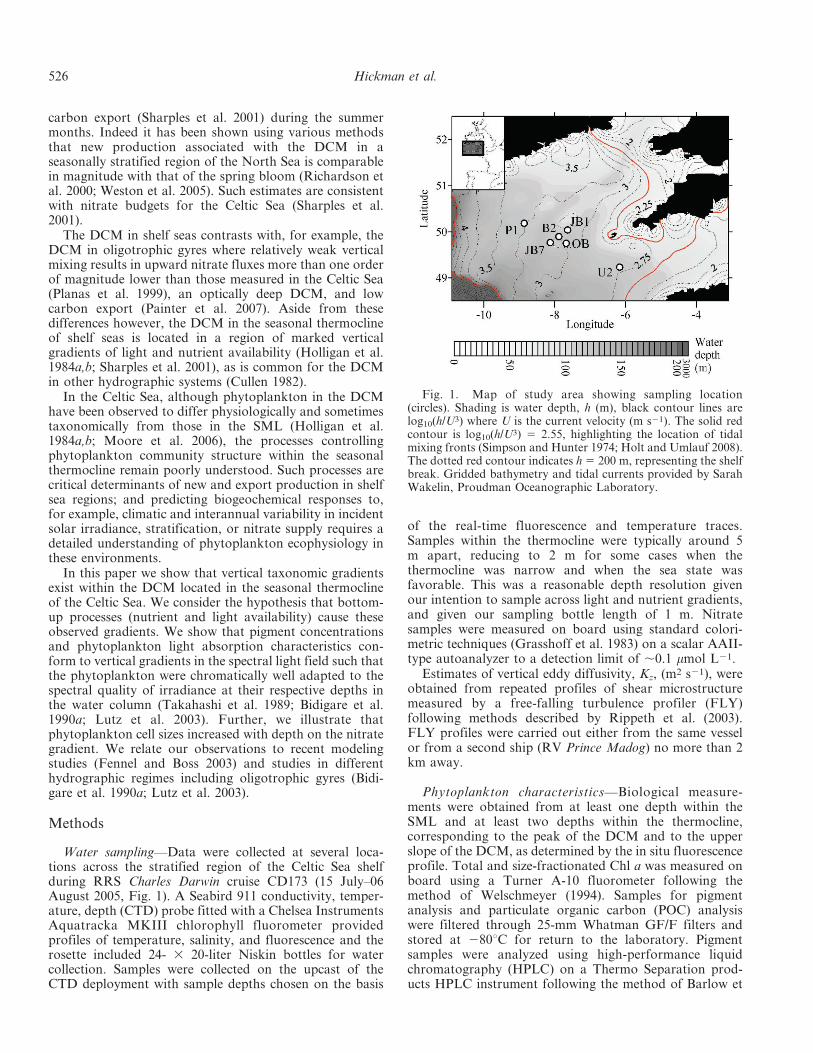
Fig. 1. Map of study area showing sampling location(circles). Shading is water depth, h (m), black contour lines arelog10(h/U3) where U is the current velocity (m s21). The solid redcontour is log10(h/U3) 5 2.55, highlighting the location of tidalmixing fronts (Simpson and Hunter 1974; Holt and Umlauf 2008).The dotted red contour indicates h 5 200 m, representing the shelfbreak. Gridded bathymetry and tidal currents provided by SarahWakelin, Proudman Oceanographic Laboratory.
526 Hickman et al.
al. (1993). Chl a values obtained by fluorometry on boardwere subsequently scaled to the HPLC Chl a concentra-tions. Analytical flow cytometry (AFC) samples werepreserved in paraformaldehyde to a final concentration of1% and frozen at 280uC before analysis in the laboratory.Analysis was carried out using a Beckson DickinsonFACSort flow cytometer. Microscope analyses of pre-served samples provided identification of larger phyto-plankton cells (typically .2 mm) and their carbon bio-mass following Poulton et al. (2007). POC samples wereanalyzed on a Thermo Finnegan Flash EA1112 elementalanalyzer.
Light absorption by phytoplankton—Phytoplankton lightabsorption was determined by the ‘‘pigment reconstruc-tion’’ method of Bidigare et al. (1990b) using pigmentconcentrations from HPLC combined with the weight-specific absorption coefficients for Chl a, Chl b, Chl c, thenonphotosynthetic carotenoids (NPC) (collectively zeaxan-thin [Zeax], prasinoxanthin, violaxanthin, alloxanthin, andb-carotene), and the photosynthetic carotenoids (PSC)(collectively peridinin, 199-hexanyloxyfucoxanthin [Hex],199-butanoyloxyfucoxanthin [But], and fucoxanthin [Fuc]).This method provided total absorption, a(l)PIG (m21), andabsorption by the chlorophylls and PSC only, a(l)PIG,PS
(m21). Phytoplankton absorption spectra were also ob-tained via the ‘‘filter pad technique’’ whereby watersamples were filtered through 25-mm Whatman GF/Ffilters and stored at 280uC and, on return to thelaboratory, filters were thawed and analyzed on a HitachiU-3000 spectrophotometer fitted with a w60 integratingsphere before and after depigmentation using 1–2% NaClO(following Tassan and Ferrari 1995). Total phytoplanktonabsorption, a(l)FILT (m21), was calculated followingBricaud and Stramski (1990):
a lð ÞFILT ~ 2:303 | D lð Þ| S½ �7 b lð Þ| V½ � ð1Þ
where S is the clearance area of the filter (m2), V is the volumeof filtered seawater (m3), D(l) is the optical density of allparticulate material retained on the filter normalized to that at750 nm, and b(l) is the path-length amplification factor:
b lð Þ~ 1:63 | D lð Þ{0:22: ð2Þ
a(l)FILT was then multiplied by the ratio of a(l)PIG,PS : a(l)PIG
to obtain the absorption by chlorophylls and photosyntheticcarotenoids only, a(l)FILT,PS (m21) (Moore et al. 2006).
In situ irradiance—A free-falling SATLANTIC irradi-ance sensor provided in situ downwelling irradiance, E(l)(mmol photons m22 s21), at six wavelengths. Profiles weremade to varying depths and 80% of casts penetrated belowthe thermocline. A simple linear interpolation betweenirradiance at the six wavelengths was used to give completespectra and photosynthetically available radiation (PAR)was obtained by the sum of irradiance at 400–700 nm. Thesurface intercepts of the linear relationships of log(E[l]) vs.depth within the SML for each of the six wavelengthsprovided the surface irradiance spectra. The measurementof irradiance at 705 nm was found to be variable so that a
cruise-mean value for E(705) : E(490) at the surface wasused to adjust the irradiance at 705 nm. At the surface, thecontributions of each of the six wavelengths to total PARvaried less than 8% between optics casts (n 5 43) such thatan average surface spectral ‘‘shape’’ was assumed through-out the cruise (Lorenzo et al. 2002; Tilstone et al. 2003).Light attenuation, Kd (l,z) (m21), was estimated over a 2-mdepth range (centred on depth z [m]) and compared withChl a from samples collected at depth z in the same locationand generally within ,2 h of the optics cast to provideKd (l) vs. Chl a relationships for each wavelength (Table 1).For 705 nm the correlation was not significant to 95%confidence so that the Kd (705 nm) vs. Chl a relationshipwas taken from Morel and Antoine (1994). Water columnlight fields were then constructed for each CTD cast byextrapolating the surface irradiance spectra through thewater column using the Kd (l) vs. Chl a relationshipscombined with Chl a values from (calibrated) CTD Chl afluorescence profiles.
Kd(l,z) values obtained from the Kd(l) vs. Chl arelationships shown in Table 1 were compared with thoseobtained from relationships with absorption by phyto-plankton, aPIG(l), at the six wavelengths. As expected,correlation at 705 nm was poor. However, for theremaining five wavelengths Kd(l,z) values obtained by thetwo methods compared well (r2 5 0.91, p , 0.001, n 5 230,correlation included all wavelengths). Estimates of Kd (l,z)obtained from comparison with a(l)PIG at the fivewavelengths were, on average, within 10% of thoseobtained from comparison with Chl a (three of the fivewavelengths were within 4%).
Results
Hydrographic environment—For each CTD profile theupper and lower boundaries of the pycnocline were definedrespectively as the shallowest depth at which the densitygradient (over a 3-m depth range) was .0.05 kg m23, andas the deepest depth where the density gradient was .0.02kg m23. Where the boundaries could not be identifiedunambiguously, particularly at the base of the SML whenwind mixing was weak, they were located by eye taking intoconsideration information from neighboring CTD casts.Density gradients were driven principally by temperaturerather than salinity. The term thermocline is subsequently
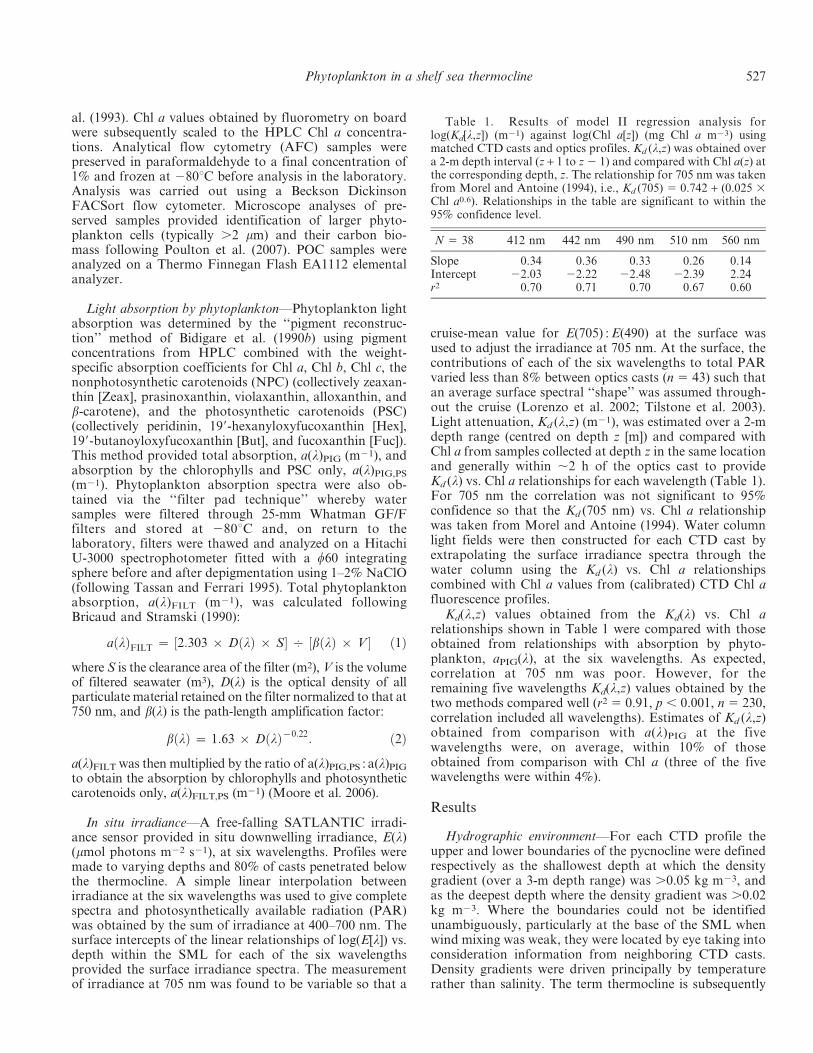
Table 1. Results of model II regression analysis forlog(Kd[l,z]) (m21) against log(Chl a[z]) (mg Chl a m23) usingmatched CTD casts and optics profiles. Kd (l,z) was obtained overa 2-m depth interval (z + 1 to z 2 1) and compared with Chl a(z) atthe corresponding depth, z. The relationship for 705 nm was takenfrom Morel and Antoine (1994), i.e., Kd (705) 5 0.742 + (0.025 3Chl a0.6). Relationships in the table are significant to within the95% confidence level.
N 5 38 412 nm 442 nm 490 nm 510 nm 560 nm
Slope 0.34 0.36 0.33 0.26 0.14Intercept 22.03 22.22 22.48 22.39 2.24r2 0.70 0.71 0.70 0.67 0.60
Phytoplankton in a shelf sea thermocline 527
used here to describe the intermediate layer between theSML and BML.
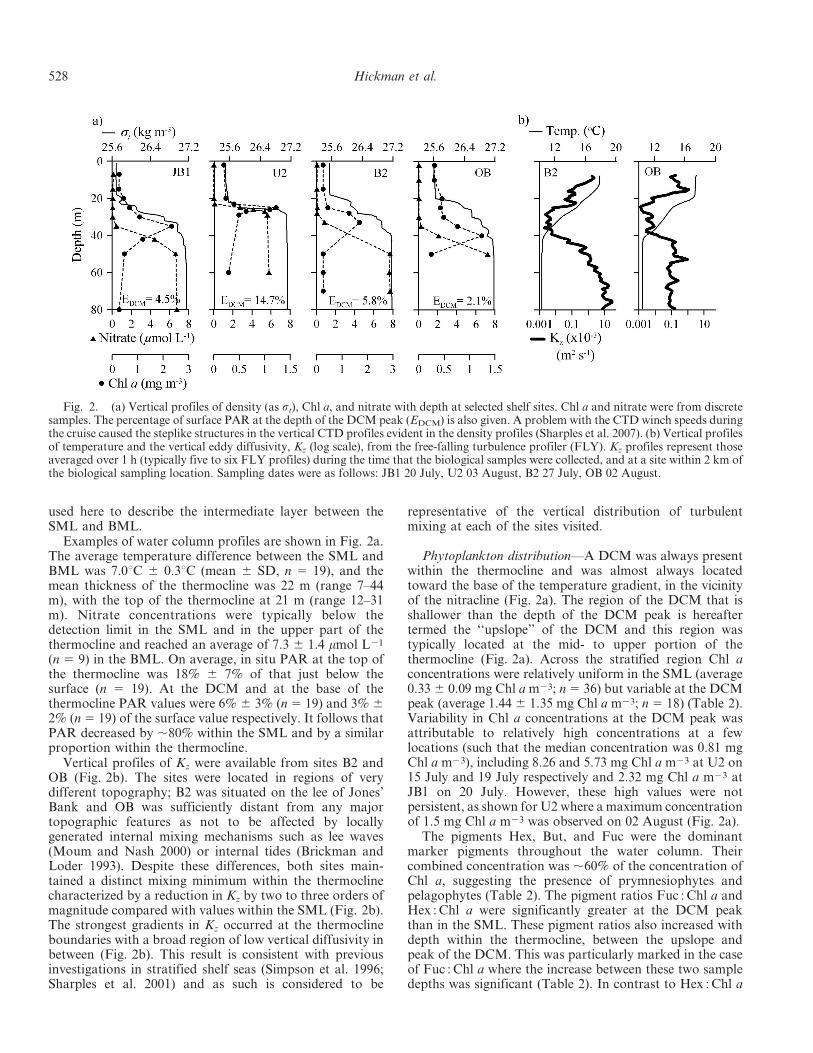
Examples of water column profiles are shown in Fig. 2a.The average temperature difference between the SML andBML was 7.0uC 6 0.3uC (mean 6 SD, n 5 19), and themean thickness of the thermocline was 22 m (range 7–44m), with the top of the thermocline at 21 m (range 12–31m). Nitrate concentrations were typically below thedetection limit in the SML and in the upper part of thethermocline and reached an average of 7.3 6 1.4 mmol L21
(n 5 9) in the BML. On average, in situ PAR at the top ofthe thermocline was 18% 6 7% of that just below thesurface (n 5 19). At the DCM and at the base of thethermocline PAR values were 6% 6 3% (n 5 19) and 3% 62% (n 5 19) of the surface value respectively. It follows thatPAR decreased by ,80% within the SML and by a similarproportion within the thermocline.
Vertical profiles of Kz were available from sites B2 andOB (Fig. 2b). The sites were located in regions of verydifferent topography; B2 was situated on the lee of Jones’Bank and OB was sufficiently distant from any majortopographic features as not to be affected by locallygenerated internal mixing mechanisms such as lee waves(Moum and Nash 2000) or internal tides (Brickman andLoder 1993). Despite these differences, both sites main-tained a distinct mixing minimum within the thermoclinecharacterized by a reduction in Kz by two to three orders ofmagnitude compared with values within the SML (Fig. 2b).The strongest gradients in Kz occurred at the thermoclineboundaries with a broad region of low vertical diffusivity inbetween (Fig. 2b). This result is consistent with previousinvestigations in stratified shelf seas (Simpson et al. 1996;Sharples et al. 2001) and as such is considered to be
representative of the vertical distribution of turbulentmixing at each of the sites visited.
Phytoplankton distribution—A DCM was always presentwithin the thermocline and was almost always locatedtoward the base of the temperature gradient, in the vicinityof the nitracline (Fig. 2a). The region of the DCM that isshallower than the depth of the DCM peak is hereaftertermed the ‘‘upslope’’ of the DCM and this region wastypically located at the mid- to upper portion of thethermocline (Fig. 2a). Across the stratified region Chl aconcentrations were relatively uniform in the SML (average0.33 6 0.09 mg Chl a m23; n 5 36) but variable at the DCMpeak (average 1.44 6 1.35 mg Chl a m23; n 5 18) (Table 2).Variability in Chl a concentrations at the DCM peak wasattributable to relatively high concentrations at a fewlocations (such that the median concentration was 0.81 mgChl a m23), including 8.26 and 5.73 mg Chl a m23 at U2 on15 July and 19 July respectively and 2.32 mg Chl a m23 atJB1 on 20 July. However, these high values were notpersistent, as shown for U2 where a maximum concentrationof 1.5 mg Chl a m23 was observed on 02 August (Fig. 2a).
The pigments Hex, But, and Fuc were the dominantmarker pigments throughout the water column. Theircombined concentration was ,60% of the concentration ofChl a, suggesting the presence of prymnesiophytes andpelagophytes (Table 2). The pigment ratios Fuc : Chl a andHex : Chl a were significantly greater at the DCM peakthan in the SML. These pigment ratios also increased withdepth within the thermocline, between the upslope andpeak of the DCM. This was particularly marked in the caseof Fuc : Chl a where the increase between these two sampledepths was significant (Table 2). In contrast to Hex : Chl a
Fig. 2. (a) Vertical profiles of density (as st), Chl a, and nitrate with depth at selected shelf sites. Chl a and nitrate were from discretesamples. The percentage of surface PAR at the depth of the DCM peak (EDCM) is also given. A problem with the CTD winch speeds duringthe cruise caused the steplike structures in the vertical CTD profiles evident in the density profiles (Sharples et al. 2007). (b) Vertical profilesof temperature and the vertical eddy diffusivity, Kz (log scale), from the free-falling turbulence profiler (FLY). Kz profiles represent thoseaveraged over 1 h (typically five to six FLY profiles) during the time that the biological samples were collected, and at a site within 2 km ofthe biological sampling location. Sampling dates were as follows: JB1 20 July, U2 03 August, B2 27 July, OB 02 August.
528 Hickman et al.
and Fuc : Chl a, the ratios of But : Chl a and Zeax : Chl awere minimal at the DCM peak. The ratio of Zeax : Chl awas maximal on the upslope of the DCM. The ratio ofNPC : PSC decreased with depth and was significantlylower at the DCM peak than on the upslope of the DCMand in the SML (Table 2).
The mean ,2-mm fraction of total Chl a in the regionranged from 51% in the SML to 44% at the DCM (Table 2).Flow cytometry data indicated that the main components ofthe picoplankton were the prokaryote Synechococcus and anassemblage of picoeukaryotes. The abundance of Synecho-coccus generally reached a maximum on the upslope of theDCM, whereas the picoeukaryotes were more evenlydistributed with depth (Table 2). Within the thermoclinethe picoeukaryote abundance was minimal on the upslope ofthe DCM and increased at the DCM peak (Table 2). Largercells identified by light microscopy were mainly unidentifiedflagellates ,10 mm in diameter (including cryptophytes andpelagophytes), with significant numbers of diatoms anddinoflagellates in only a few samples. Diatoms wereobserved at the DCM peak at all but one location butrarely accounted for more than ,10% of phytoplanktoncarbon biomass, as estimated by light microscopy.
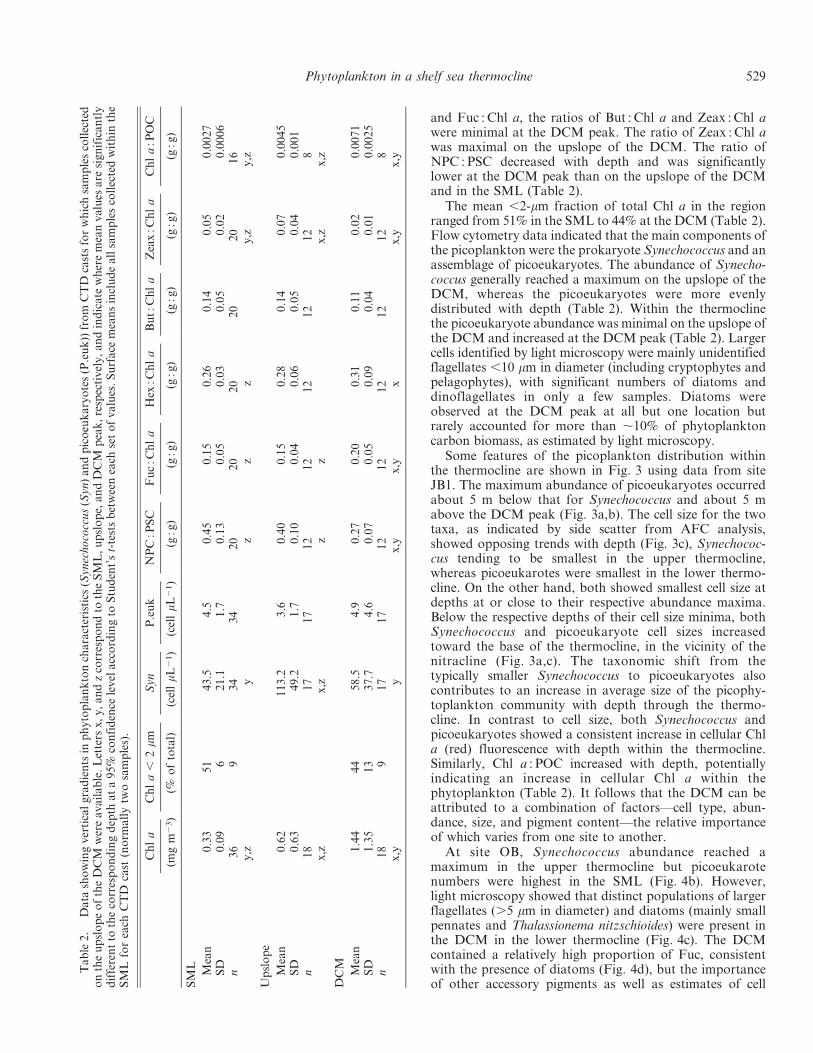
Some features of the picoplankton distribution withinthe thermocline are shown in Fig. 3 using data from siteJB1. The maximum abundance of picoeukaryotes occurredabout 5 m below that for Synechococcus and about 5 mabove the DCM peak (Fig. 3a,b). The cell size for the twotaxa, as indicated by side scatter from AFC analysis,showed opposing trends with depth (Fig. 3c), Synechococ-cus tending to be smallest in the upper thermocline,whereas picoeukarotes were smallest in the lower thermo-cline. On the other hand, both showed smallest cell size atdepths at or close to their respective abundance maxima.Below the respective depths of their cell size minima, bothSynechococcus and picoeukaryote cell sizes increasedtoward the base of the thermocline, in the vicinity of thenitracline (Fig. 3a,c). The taxonomic shift from thetypically smaller Synechococcus to picoeukaryotes alsocontributes to an increase in average size of the picophy-toplankton community with depth through the thermo-cline. In contrast to cell size, both Synechococcus andpicoeukaryotes showed a consistent increase in cellular Chla (red) fluorescence with depth within the thermocline.Similarly, Chl a : POC increased with depth, potentiallyindicating an increase in cellular Chl a within thephytoplankton (Table 2). It follows that the DCM can beattributed to a combination of factors—cell type, abun-dance, size, and pigment content—the relative importanceof which varies from one site to another.
At site OB, Synechococcus abundance reached amaximum in the upper thermocline but picoeukarotenumbers were highest in the SML (Fig. 4b). However,light microscopy showed that distinct populations of largerflagellates (.5 mm in diameter) and diatoms (mainly smallpennates and Thalassionema nitzschioides) were present inthe DCM in the lower thermocline (Fig. 4c). The DCMcontained a relatively high proportion of Fuc, consistentwith the presence of diatoms (Fig. 4d), but the importanceof other accessory pigments as well as estimates of cell
Table2.
Da
tash
ow
ing
ver
tica
lg
rad
ien
tsin
ph
yto
pla
nk
ton
cha
ract
eris
tics
(Sy
nec
ho
cocc
us
(Sy
n)
an
dp
ico
euk
ary
ote
s(P
.eu
k))
fro
mC
TD
cast
sfo
rw
hic
hsa
mp
les
coll
ecte
do
nth
eu
psl
op
eo
fth
eD
CM
wer
ea
va
ila
ble
.L
ette
rsx
,y
,a
nd
zco
rres
po
nd
toth
eS
ML
,u
psl
op
e,a
nd
DC
Mp
eak
,re
spec
tiv
ely
,a
nd
ind
ica
tew
her
em
ean
va
lues
are
sig
nif
ica
ntl
yd
iffe
ren
tto
the
corr
esp
on
din
gd
epth
at
a9
5%
con
fid
ence
lev
ela
cco
rdin
gto
Stu
den
t’s
t-te
sts
bet
wee
nea
chse
to
fv
alu
es.
Su
rfa
cem
ean
sin
clu
de
all
sam
ple
sco
llec
ted
wit
hin
the
SM
Lfo
rea
chC
TD
cast
(no
rma
lly
two
sam
ple
s).
Ch
la
Ch
la
,2
mm
Sy
nP
.eu
kN
PC
:PS
CF
uc
:Ch
la
Hex
:Ch
la
Bu
t:C
hl
aZ
eax
:Ch
la
Ch
la
:PO
C
(mg
m2
3)
(%o
fto
tal)
(cel
lm
L2
1)
(cel
lm
L2
1)
(g:g
)(g
:g)
(g:g
)(g
:g)
(g:g
)(g
:g)
SM
L
Mea
n0
.33
51
43
.54
.50
.45
0.1
50
.26
0.1
40
.05
0.0
02
7S
D0
.09
62
1.1
1.7
0.1
30
.05
0.0
30
.05
0.0
20
.00
06
n3
69
34
34
20
20
20
20
20
16
y,z
yz
zz
y,z
y,z
Up
slo
pe
Mea
n0
.62
11
3.2
3.6
0.4
00
.15
0.2
80
.14
0.0
70
.00
45
SD
0.6
34
9.2
1.7
0.1
00
.04
0.0
60
.05
0.0
40
.00
1n
18
17
17
12
12
12
12
12
8x
,zx
,zz
zx
,zx
,z
DC
M
Mea
n1
.44
44
58
.54
.90
.27
0.2
00
.31
0.1
10
.02
0.0
07
1S
D1
.35
13
37
.74
.60
.07
0.0
50
.09
0.0
40
.01
0.0
02
5n
18
91
71
71
21
21
21
21
28
x,y
yx
,yx
,yx
x,y
x,y
Phytoplankton in a shelf sea thermocline 529
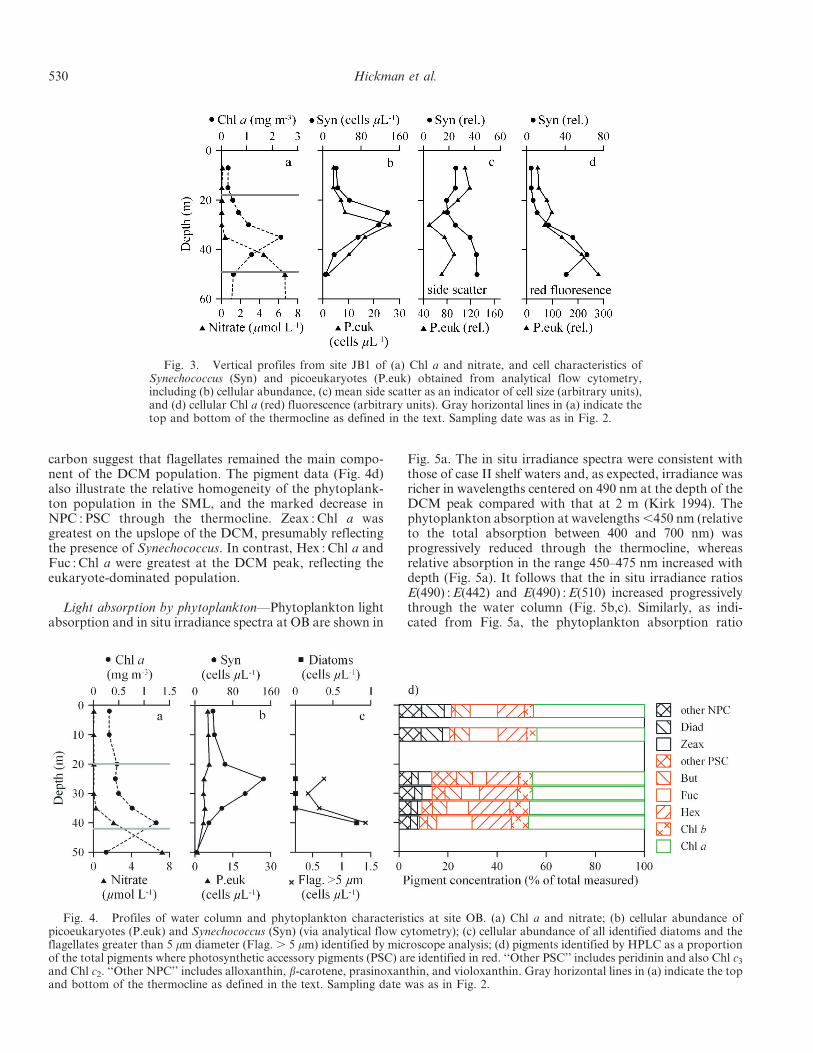
carbon suggest that flagellates remained the main compo-nent of the DCM population. The pigment data (Fig. 4d)also illustrate the relative homogeneity of the phytoplank-ton population in the SML, and the marked decrease inNPC : PSC through the thermocline. Zeax : Chl a wasgreatest on the upslope of the DCM, presumably reflectingthe presence of Synechococcus. In contrast, Hex : Chl a andFuc : Chl a were greatest at the DCM peak, reflecting theeukaryote-dominated population.
Light absorption by phytoplankton—Phytoplankton lightabsorption and in situ irradiance spectra at OB are shown in
Fig. 5a. The in situ irradiance spectra were consistent withthose of case II shelf waters and, as expected, irradiance wasricher in wavelengths centered on 490 nm at the depth of theDCM peak compared with that at 2 m (Kirk 1994). Thephytoplankton absorption at wavelengths ,450 nm (relativeto the total absorption between 400 and 700 nm) wasprogressively reduced through the thermocline, whereasrelative absorption in the range 450–475 nm increased withdepth (Fig. 5a). It follows that the in situ irradiance ratiosE(490) : E(442) and E(490) : E(510) increased progressivelythrough the water column (Fig. 5b,c). Similarly, as indi-cated from Fig. 5a, the phytoplankton absorption ratio
Fig. 3. Vertical profiles from site JB1 of (a) Chl a and nitrate, and cell characteristics ofSynechococcus (Syn) and picoeukaryotes (P.euk) obtained from analytical flow cytometry,including (b) cellular abundance, (c) mean side scatter as an indicator of cell size (arbitrary units),and (d) cellular Chl a (red) fluorescence (arbitrary units). Gray horizontal lines in (a) indicate thetop and bottom of the thermocline as defined in the text. Sampling date was as in Fig. 2.
Fig. 4. Profiles of water column and phytoplankton characteristics at site OB. (a) Chl a and nitrate; (b) cellular abundance ofpicoeukaryotes (P.euk) and Synechococcus (Syn) (via analytical flow cytometry); (c) cellular abundance of all identified diatoms and theflagellates greater than 5 mm diameter (Flag. . 5 mm) identified by microscope analysis; (d) pigments identified by HPLC as a proportionof the total pigments where photosynthetic accessory pigments (PSC) are identified in red. ‘‘Other PSC’’ includes peridinin and also Chl c3
and Chl c2. ‘‘Other NPC’’ includes alloxanthin, b-carotene, prasinoxanthin, and violoxanthin. Gray horizontal lines in (a) indicate the topand bottom of the thermocline as defined in the text. Sampling date was as in Fig. 2.
530 Hickman et al.
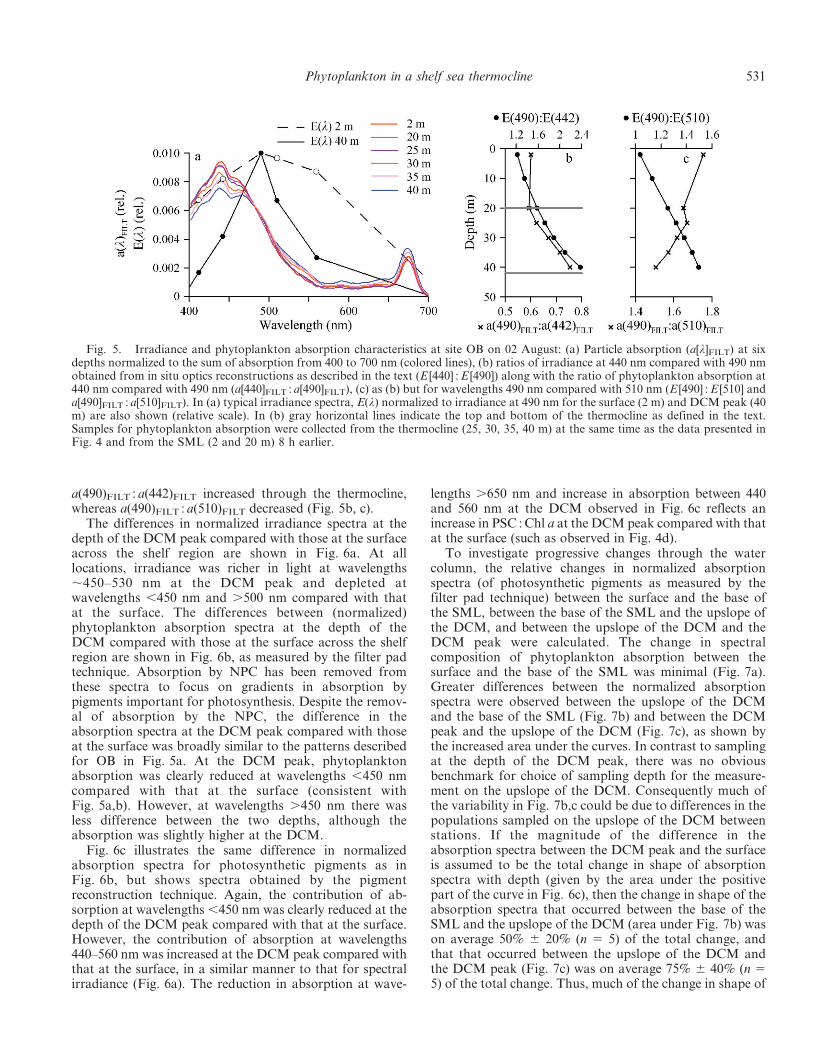
a(490)FILT : a(442)FILT increased through the thermocline,whereas a(490)FILT : a(510)FILT decreased (Fig. 5b, c).
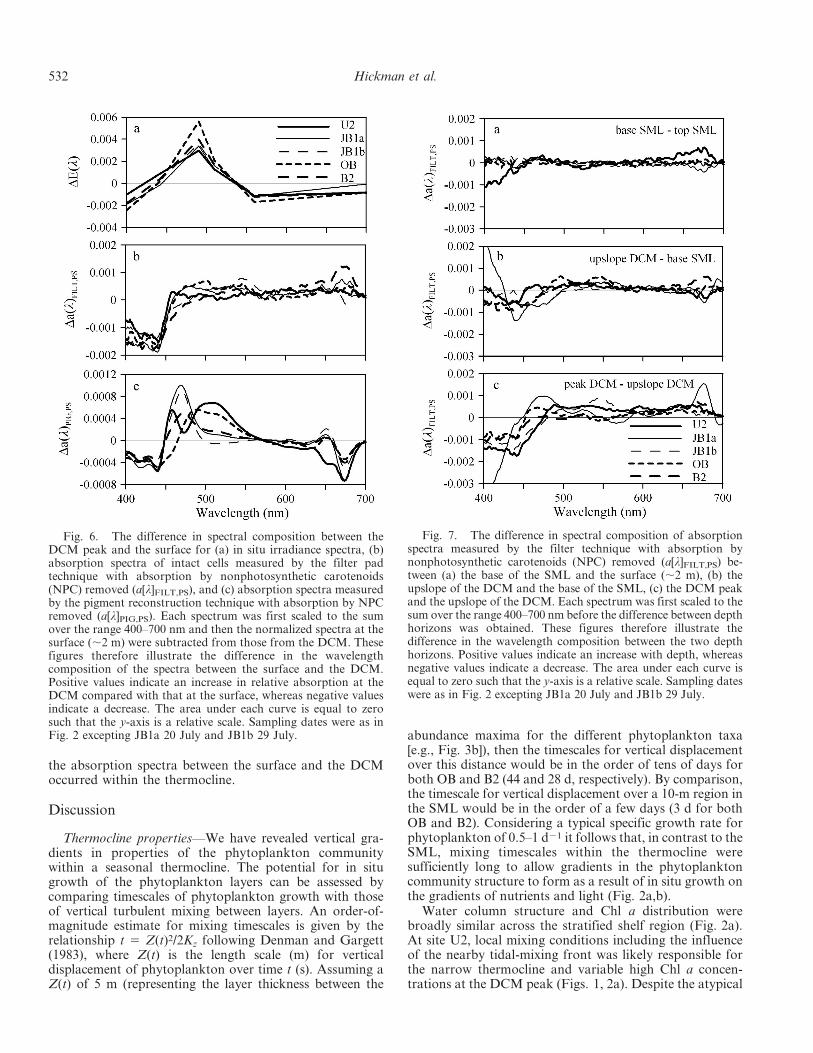
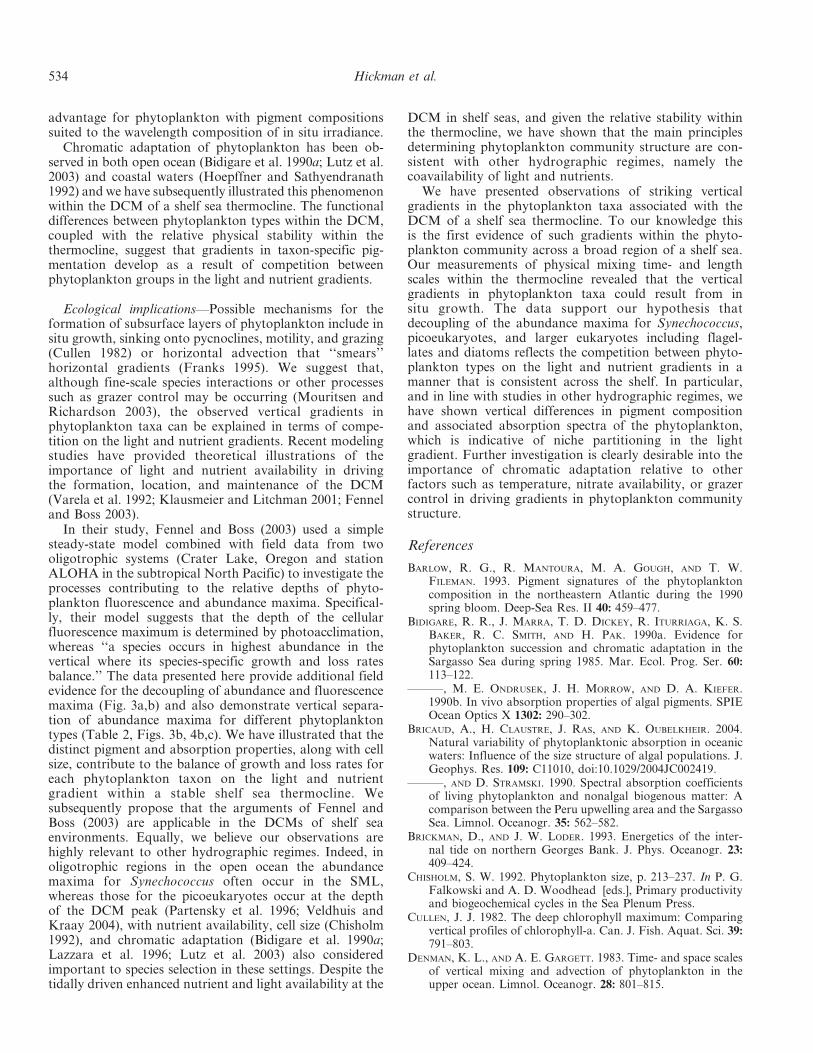
The differences in normalized irradiance spectra at thedepth of the DCM peak compared with those at the surfaceacross the shelf region are shown in Fig. 6a. At alllocations, irradiance was richer in light at wavelengths,450–530 nm at the DCM peak and depleted atwavelengths ,450 nm and .500 nm compared with thatat the surface. The differences between (normalized)phytoplankton absorption spectra at the depth of theDCM compared with those at the surface across the shelfregion are shown in Fig. 6b, as measured by the filter padtechnique. Absorption by NPC has been removed fromthese spectra to focus on gradients in absorption bypigments important for photosynthesis. Despite the remov-al of absorption by the NPC, the difference in theabsorption spectra at the DCM peak compared with thoseat the surface was broadly similar to the patterns describedfor OB in Fig. 5a. At the DCM peak, phytoplanktonabsorption was clearly reduced at wavelengths ,450 nmcompared with that at the surface (consistent withFig. 5a,b). However, at wavelengths .450 nm there wasless difference between the two depths, although theabsorption was slightly higher at the DCM.
Fig. 6c illustrates the same difference in normalizedabsorption spectra for photosynthetic pigments as inFig. 6b, but shows spectra obtained by the pigmentreconstruction technique. Again, the contribution of ab-sorption at wavelengths ,450 nm was clearly reduced at thedepth of the DCM peak compared with that at the surface.However, the contribution of absorption at wavelengths440–560 nm was increased at the DCM peak compared withthat at the surface, in a similar manner to that for spectralirradiance (Fig. 6a). The reduction in absorption at wave-
lengths .650 nm and increase in absorption between 440and 560 nm at the DCM observed in Fig. 6c reflects anincrease in PSC : Chl a at the DCM peak compared with thatat the surface (such as observed in Fig. 4d).
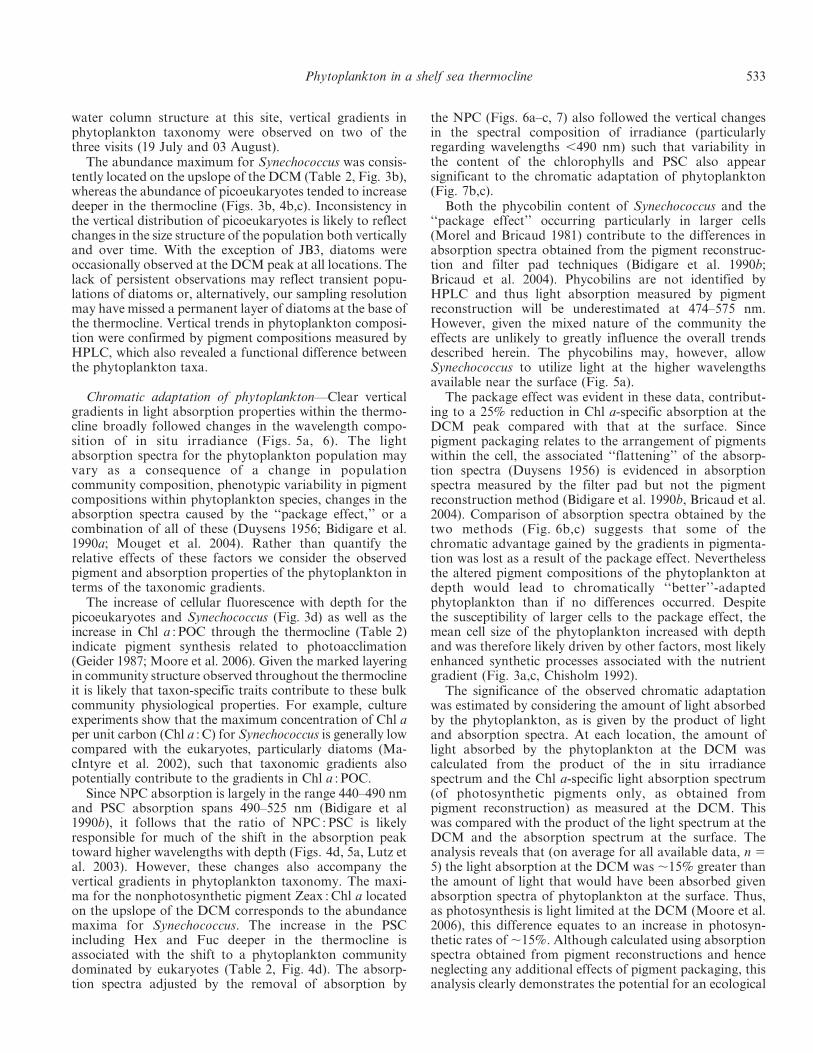
To investigate progressive changes through the watercolumn, the relative changes in normalized absorptionspectra (of photosynthetic pigments as measured by thefilter pad technique) between the surface and the base ofthe SML, between the base of the SML and the upslope ofthe DCM, and between the upslope of the DCM and theDCM peak were calculated. The change in spectralcomposition of phytoplankton absorption between thesurface and the base of the SML was minimal (Fig. 7a).Greater differences between the normalized absorptionspectra were observed between the upslope of the DCMand the base of the SML (Fig. 7b) and between the DCMpeak and the upslope of the DCM (Fig. 7c), as shown bythe increased area under the curves. In contrast to samplingat the depth of the DCM peak, there was no obviousbenchmark for choice of sampling depth for the measure-ment on the upslope of the DCM. Consequently much ofthe variability in Fig. 7b,c could be due to differences in thepopulations sampled on the upslope of the DCM betweenstations. If the magnitude of the difference in theabsorption spectra between the DCM peak and the surfaceis assumed to be the total change in shape of absorptionspectra with depth (given by the area under the positivepart of the curve in Fig. 6c), then the change in shape of theabsorption spectra that occurred between the base of theSML and the upslope of the DCM (area under Fig. 7b) wason average 50% 6 20% (n 5 5) of the total change, andthat that occurred between the upslope of the DCM andthe DCM peak (Fig. 7c) was on average 75% 6 40% (n 55) of the total change. Thus, much of the change in shape of
Fig. 5. Irradiance and phytoplankton absorption characteristics at site OB on 02 August: (a) Particle absorption (a[l]FILT) at sixdepths normalized to the sum of absorption from 400 to 700 nm (colored lines), (b) ratios of irradiance at 440 nm compared with 490 nmobtained from in situ optics reconstructions as described in the text (E [440] : E [490]) along with the ratio of phytoplankton absorption at440 nm compared with 490 nm (a[440]FILT : a[490]FILT), (c) as (b) but for wavelengths 490 nm compared with 510 nm (E [490] : E [510] anda[490]FILT : a[510]FILT). In (a) typical irradiance spectra, E(l) normalized to irradiance at 490 nm for the surface (2 m) and DCM peak (40m) are also shown (relative scale). In (b) gray horizontal lines indicate the top and bottom of the thermocline as defined in the text.Samples for phytoplankton absorption were collected from the thermocline (25, 30, 35, 40 m) at the same time as the data presented inFig. 4 and from the SML (2 and 20 m) 8 h earlier.
Phytoplankton in a shelf sea thermocline 531
the absorption spectra between the surface and the DCMoccurred within the thermocline.
Discussion
Thermocline properties—We have revealed vertical gra-dients in properties of the phytoplankton communitywithin a seasonal thermocline. The potential for in situgrowth of the phytoplankton layers can be assessed bycomparing timescales of phytoplankton growth with thoseof vertical turbulent mixing between layers. An order-of-magnitude estimate for mixing timescales is given by therelationship t 5 Z(t)2/2Kz following Denman and Gargett(1983), where Z(t) is the length scale (m) for verticaldisplacement of phytoplankton over time t (s). Assuming aZ(t) of 5 m (representing the layer thickness between the
abundance maxima for the different phytoplankton taxa[e.g., Fig. 3b]), then the timescales for vertical displacementover this distance would be in the order of tens of days forboth OB and B2 (44 and 28 d, respectively). By comparison,the timescale for vertical displacement over a 10-m region inthe SML would be in the order of a few days (3 d for bothOB and B2). Considering a typical specific growth rate forphytoplankton of 0.5–1 d21 it follows that, in contrast to theSML, mixing timescales within the thermocline weresufficiently long to allow gradients in the phytoplanktoncommunity structure to form as a result of in situ growth onthe gradients of nutrients and light (Fig. 2a,b).
Water column structure and Chl a distribution werebroadly similar across the stratified shelf region (Fig. 2a).At site U2, local mixing conditions including the influenceof the nearby tidal-mixing front was likely responsible forthe narrow thermocline and variable high Chl a concen-trations at the DCM peak (Figs. 1, 2a). Despite the atypical
Fig. 6. The difference in spectral composition between theDCM peak and the surface for (a) in situ irradiance spectra, (b)absorption spectra of intact cells measured by the filter padtechnique with absorption by nonphotosynthetic carotenoids(NPC) removed (a[l]FILT,PS), and (c) absorption spectra measuredby the pigment reconstruction technique with absorption by NPCremoved (a[l]PIG,PS). Each spectrum was first scaled to the sumover the range 400–700 nm and then the normalized spectra at thesurface (,2 m) were subtracted from those from the DCM. Thesefigures therefore illustrate the difference in the wavelengthcomposition of the spectra between the surface and the DCM.Positive values indicate an increase in relative absorption at theDCM compared with that at the surface, whereas negative valuesindicate a decrease. The area under each curve is equal to zerosuch that the y-axis is a relative scale. Sampling dates were as inFig. 2 excepting JB1a 20 July and JB1b 29 July.
Fig. 7. The difference in spectral composition of absorptionspectra measured by the filter technique with absorption bynonphotosynthetic carotenoids (NPC) removed (a[l]FILT,PS) be-tween (a) the base of the SML and the surface (,2 m), (b) theupslope of the DCM and the base of the SML, (c) the DCM peakand the upslope of the DCM. Each spectrum was first scaled to thesum over the range 400–700 nm before the difference between depthhorizons was obtained. These figures therefore illustrate thedifference in the wavelength composition between the two depthhorizons. Positive values indicate an increase with depth, whereasnegative values indicate a decrease. The area under each curve isequal to zero such that the y-axis is a relative scale. Sampling dateswere as in Fig. 2 excepting JB1a 20 July and JB1b 29 July.
532 Hickman et al.
water column structure at this site, vertical gradients inphytoplankton taxonomy were observed on two of thethree visits (19 July and 03 August).
The abundance maximum for Synechococcus was consis-tently located on the upslope of the DCM (Table 2, Fig. 3b),whereas the abundance of picoeukaryotes tended to increasedeeper in the thermocline (Figs. 3b, 4b,c). Inconsistency inthe vertical distribution of picoeukaryotes is likely to reflectchanges in the size structure of the population both verticallyand over time. With the exception of JB3, diatoms wereoccasionally observed at the DCM peak at all locations. Thelack of persistent observations may reflect transient popu-lations of diatoms or, alternatively, our sampling resolutionmay have missed a permanent layer of diatoms at the base ofthe thermocline. Vertical trends in phytoplankton composi-tion were confirmed by pigment compositions measured byHPLC, which also revealed a functional difference betweenthe phytoplankton taxa.
Chromatic adaptation of phytoplankton—Clear verticalgradients in light absorption properties within the thermo-cline broadly followed changes in the wavelength compo-sition of in situ irradiance (Figs. 5a, 6). The lightabsorption spectra for the phytoplankton population mayvary as a consequence of a change in populationcommunity composition, phenotypic variability in pigmentcompositions within phytoplankton species, changes in theabsorption spectra caused by the ‘‘package effect,’’ or acombination of all of these (Duysens 1956; Bidigare et al.1990a; Mouget et al. 2004). Rather than quantify therelative effects of these factors we consider the observedpigment and absorption properties of the phytoplankton interms of the taxonomic gradients.
The increase of cellular fluorescence with depth for thepicoeukaryotes and Synechococcus (Fig. 3d) as well as theincrease in Chl a : POC through the thermocline (Table 2)indicate pigment synthesis related to photoacclimation(Geider 1987; Moore et al. 2006). Given the marked layeringin community structure observed throughout the thermoclineit is likely that taxon-specific traits contribute to these bulkcommunity physiological properties. For example, cultureexperiments show that the maximum concentration of Chl aper unit carbon (Chl a : C) for Synechococcus is generally lowcompared with the eukaryotes, particularly diatoms (Ma-cIntyre et al. 2002), such that taxonomic gradients alsopotentially contribute to the gradients in Chl a : POC.
Since NPC absorption is largely in the range 440–490 nmand PSC absorption spans 490–525 nm (Bidigare et al1990b), it follows that the ratio of NPC : PSC is likelyresponsible for much of the shift in the absorption peaktoward higher wavelengths with depth (Figs. 4d, 5a, Lutz etal. 2003). However, these changes also accompany thevertical gradients in phytoplankton taxonomy. The maxi-ma for the nonphotosynthetic pigment Zeax : Chl a locatedon the upslope of the DCM corresponds to the abundancemaxima for Synechococcus. The increase in the PSCincluding Hex and Fuc deeper in the thermocline isassociated with the shift to a phytoplankton communitydominated by eukaryotes (Table 2, Fig. 4d). The absorp-tion spectra adjusted by the removal of absorption by
the NPC (Figs. 6a–c, 7) also followed the vertical changesin the spectral composition of irradiance (particularlyregarding wavelengths ,490 nm) such that variability inthe content of the chlorophylls and PSC also appearsignificant to the chromatic adaptation of phytoplankton(Fig. 7b,c).
Both the phycobilin content of Synechococcus and the‘‘package effect’’ occurring particularly in larger cells(Morel and Bricaud 1981) contribute to the differences inabsorption spectra obtained from the pigment reconstruc-tion and filter pad techniques (Bidigare et al. 1990b;Bricaud et al. 2004). Phycobilins are not identified byHPLC and thus light absorption measured by pigmentreconstruction will be underestimated at 474–575 nm.However, given the mixed nature of the community theeffects are unlikely to greatly influence the overall trendsdescribed herein. The phycobilins may, however, allowSynechococcus to utilize light at the higher wavelengthsavailable near the surface (Fig. 5a).
The package effect was evident in these data, contribut-ing to a 25% reduction in Chl a-specific absorption at theDCM peak compared with that at the surface. Sincepigment packaging relates to the arrangement of pigmentswithin the cell, the associated ‘‘flattening’’ of the absorp-tion spectra (Duysens 1956) is evidenced in absorptionspectra measured by the filter pad but not the pigmentreconstruction method (Bidigare et al. 1990b, Bricaud et al.2004). Comparison of absorption spectra obtained by thetwo methods (Fig. 6b,c) suggests that some of thechromatic advantage gained by the gradients in pigmenta-tion was lost as a result of the package effect. Neverthelessthe altered pigment compositions of the phytoplankton atdepth would lead to chromatically ‘‘better’’-adaptedphytoplankton than if no differences occurred. Despitethe susceptibility of larger cells to the package effect, themean cell size of the phytoplankton increased with depthand was therefore likely driven by other factors, most likelyenhanced synthetic processes associated with the nutrientgradient (Fig. 3a,c, Chisholm 1992).
The significance of the observed chromatic adaptationwas estimated by considering the amount of light absorbedby the phytoplankton, as is given by the product of lightand absorption spectra. At each location, the amount oflight absorbed by the phytoplankton at the DCM wascalculated from the product of the in situ irradiancespectrum and the Chl a-specific light absorption spectrum(of photosynthetic pigments only, as obtained frompigment reconstruction) as measured at the DCM. Thiswas compared with the product of the light spectrum at theDCM and the absorption spectrum at the surface. Theanalysis reveals that (on average for all available data, n 55) the light absorption at the DCM was ,15% greater thanthe amount of light that would have been absorbed givenabsorption spectra of phytoplankton at the surface. Thus,as photosynthesis is light limited at the DCM (Moore et al.2006), this difference equates to an increase in photosyn-thetic rates of ,15%. Although calculated using absorptionspectra obtained from pigment reconstructions and henceneglecting any additional effects of pigment packaging, thisanalysis clearly demonstrates the potential for an ecological
Phytoplankton in a shelf sea thermocline 533
advantage for phytoplankton with pigment compositionssuited to the wavelength composition of in situ irradiance.
Chromatic adaptation of phytoplankton has been ob-served in both open ocean (Bidigare et al. 1990a; Lutz et al.2003) and coastal waters (Hoepffner and Sathyendranath1992) and we have subsequently illustrated this phenomenonwithin the DCM of a shelf sea thermocline. The functionaldifferences between phytoplankton types within the DCM,coupled with the relative physical stability within thethermocline, suggest that gradients in taxon-specific pig-mentation develop as a result of competition betweenphytoplankton groups in the light and nutrient gradients.
Ecological implications—Possible mechanisms for theformation of subsurface layers of phytoplankton include insitu growth, sinking onto pycnoclines, motility, and grazing(Cullen 1982) or horizontal advection that ‘‘smears’’horizontal gradients (Franks 1995). We suggest that,although fine-scale species interactions or other processessuch as grazer control may be occurring (Mouritsen andRichardson 2003), the observed vertical gradients inphytoplankton taxa can be explained in terms of compe-tition on the light and nutrient gradients. Recent modelingstudies have provided theoretical illustrations of theimportance of light and nutrient availability in drivingthe formation, location, and maintenance of the DCM(Varela et al. 1992; Klausmeier and Litchman 2001; Fenneland Boss 2003).
In their study, Fennel and Boss (2003) used a simplesteady-state model combined with field data from twooligotrophic systems (Crater Lake, Oregon and stationALOHA in the subtropical North Pacific) to investigate theprocesses contributing to the relative depths of phyto-plankton fluorescence and abundance maxima. Specifical-ly, their model suggests that the depth of the cellularfluorescence maximum is determined by photoacclimation,whereas ‘‘a species occurs in highest abundance in thevertical where its species-specific growth and loss ratesbalance.’’ The data presented here provide additional fieldevidence for the decoupling of abundance and fluorescencemaxima (Fig. 3a,b) and also demonstrate vertical separa-tion of abundance maxima for different phytoplanktontypes (Table 2, Figs. 3b, 4b,c). We have illustrated that thedistinct pigment and absorption properties, along with cellsize, contribute to the balance of growth and loss rates foreach phytoplankton taxon on the light and nutrientgradient within a stable shelf sea thermocline. Wesubsequently propose that the arguments of Fennel andBoss (2003) are applicable in the DCMs of shelf seaenvironments. Equally, we believe our observations arehighly relevant to other hydrographic regimes. Indeed, inoligotrophic regions in the open ocean the abundancemaxima for Synechococcus often occur in the SML,whereas those for the picoeukaryotes occur at the depthof the DCM peak (Partensky et al. 1996; Veldhuis andKraay 2004), with nutrient availability, cell size (Chisholm1992), and chromatic adaptation (Bidigare et al. 1990a;Lazzara et al. 1996; Lutz et al. 2003) also consideredimportant to species selection in these settings. Despite thetidally driven enhanced nutrient and light availability at the
DCM in shelf seas, and given the relative stability withinthe thermocline, we have shown that the main principlesdetermining phytoplankton community structure are con-sistent with other hydrographic regimes, namely thecoavailability of light and nutrients.
We have presented observations of striking verticalgradients in the phytoplankton taxa associated with theDCM of a shelf sea thermocline. To our knowledge thisis the first evidence of such gradients within the phyto-plankton community across a broad region of a shelf sea.Our measurements of physical mixing time- and lengthscales within the thermocline revealed that the verticalgradients in phytoplankton taxa could result from insitu growth. The data support our hypothesis thatdecoupling of the abundance maxima for Synechococcus,picoeukaryotes, and larger eukaryotes including flagel-lates and diatoms reflects the competition between phyto-plankton types on the light and nutrient gradients in amanner that is consistent across the shelf. In particular,and in line with studies in other hydrographic regimes, wehave shown vertical differences in pigment compositionand associated absorption spectra of the phytoplankton,which is indicative of niche partitioning in the lightgradient. Further investigation is clearly desirable into theimportance of chromatic adaptation relative to otherfactors such as temperature, nitrate availability, or grazercontrol in driving gradients in phytoplankton communitystructure.
References
BARLOW, R. G., R. MANTOURA, M. A. GOUGH, AND T. W.FILEMAN. 1993. Pigment signatures of the phytoplanktoncomposition in the northeastern Atlantic during the 1990spring bloom. Deep-Sea Res. II 40: 459–477.
BIDIGARE, R. R., J. MARRA, T. D. DICKEY, R. ITURRIAGA, K. S.BAKER, R. C. SMITH, AND H. PAK. 1990a. Evidence forphytoplankton succession and chromatic adaptation in theSargasso Sea during spring 1985. Mar. Ecol. Prog. Ser. 60:113–122.
———, M. E. ONDRUSEK, J. H. MORROW, AND D. A. KIEFER.1990b. In vivo absorption properties of algal pigments. SPIEOcean Optics X 1302: 290–302.
BRICAUD, A., H. CLAUSTRE, J. RAS, AND K. OUBELKHEIR. 2004.Natural variability of phytoplanktonic absorption in oceanicwaters: Influence of the size structure of algal populations. J.Geophys. Res. 109: C11010, doi:10.1029/2004JC002419.
———, AND D. STRAMSKI. 1990. Spectral absorption coefficientsof living phytoplankton and nonalgal biogenous matter: Acomparison between the Peru upwelling area and the SargassoSea. Limnol. Oceanogr. 35: 562–582.
BRICKMAN, D., AND J. W. LODER. 1993. Energetics of the inter-nal tide on northern Georges Bank. J. Phys. Oceanogr. 23:409–424.
CHISHOLM, S. W. 1992. Phytoplankton size, p. 213–237. In P. G.Falkowski and A. D. Woodhead [eds.], Primary productivityand biogeochemical cycles in the Sea Plenum Press.
CULLEN, J. J. 1982. The deep chlorophyll maximum: Comparingvertical profiles of chlorophyll-a. Can. J. Fish. Aquat. Sci. 39:791–803.
DENMAN, K. L., AND A. E. GARGETT. 1983. Time- and space scalesof vertical mixing and advection of phytoplankton in theupper ocean. Limnol. Oceanogr. 28: 801–815.
534 Hickman et al.
DUGDALE, R. C., AND J. J. GEORING. 1967. Uptake of new andregenerated forms of nitrogen in primary productivity.Limnol. Oceanogr. 12: 196–206.
DUYSENS, L. M. N. 1956. The flattening effect of the absorptionspectra of suspensions as compared to that of solutions.Biochim. Biophys. Acta. 19: 1–12.
FENNEL, K., AND E. BOSS. 2003. Subsurface maxima of phyto-plankton and chlorophyll: Steady-state solutions from asimple model. Limnol. Oceanogr. 48: 1521–1534.
FRANKS, P. J. S. 1995. Thin layers of phytoplankton: A model offormation by near-internal wave shear. Deep-Sea Res. I 42:75–91.
GEIDER, R. J. 1987. Light and temperature dependence of thecarbon to chlorophyll-a ratio in microalgae and cyanobacte-ria: Implications for physiology and growth of phytoplank-ton. New Phytol. 106: 1–34.
GRASSHOFF, K. M., K. M. ERHARDT, AND K. KREMLING. 1983.Methods of seawater analysis. Verlag-Chemie.
HOEPFFNER, N., AND S. SATHYENDRANATH. 1992. Bio-opticalcharacteristics of coastal waters: Absorption spectra ofphytoplankton and pigment distribution in the western NorthAtlantic. Limnol. Oceanogr. 37: 1660–1679.
HOLLIGAN, P. M., P. J. L. WILLIAMS, D. PURDIE, AND R. P. HARRIS.1984b. Photosynthesis, respiration and nitrogen supply ofplankton populations in stratified, frontal and tidally mixedshelf waters. Mar. Ecol. Prog. Ser. 17: 201–213.
———, AND oTHERS. 1984a. Vertical distribution and partitioningof organic carbon in mixed, frontal and stratified waters ofthe English Channel. Mar. Ecol. Prog. Ser. 14: 111–127.
HOLT, J., AND L. UMLAUF. 2008. Modelling the tidal mixing frontsand seasonal stratification of the northwest Europeancontinental shelf. Cont. Shelf Res. 28: 887–903.
KIRK, J. T. O. 1994. Light and photosynthesis in aquaticecosystems. Cambridge Univ. Press.
KLAUSMEIER, C. A., AND E. LITCHMAN. 2001. Algal games: Thevertical distribution of phytoplankton in poorly mixed watercolumns. Limnol. Oceanogr. 46: 1998–2007.
LAZZARA, L., A. BRICAUD, AND H. CLAUSTRE. 1996. Spectralabsorption and fluorescence excitation properties of phyto-planktonic populations at a mesotrophic and an oligotrophicsite in the tropical North Atlantic (EUMELI program). Deep-Sea Res. I 43: 1215–1240.
LORENZO, L. M., B. ARBONES, F. G. FIGUEIRAS, G. H. TILSTONE,AND F. L. FIGUEROA. 2002. Photosynthesis, primary produc-tion and phytoplankton growth rates in Gerlache andBransfield Straits during Austral summer: Cruise FRUELA95. Deep-Sea Res. II 49: 707–721.
LUTZ, V. A., S. SATHYENDRANATH, E. J. H. HEAD, AND W. K. W.LI. 2003. Variability in pigment composition and opticalcharacteristics of phytoplankton in the Labrador Sea and thecentral North Atlantic. Mar. Ecol. Prog. Ser. 260: 1–18.
MACINTYRE, H. L., T. M. KANA, T. ANNING, AND R. J. GEIDER.2002. Photoacclimation of photosynthesis irradiance responsecurves and photosynthetic pigments in microalgae andcyanobacteria. J. Phycol. 38: 17–38.
MOORE, C. M., AND oTHERS. 2006. Phytoplankton photoacclima-tion and photoadaptation in response to environmentalgradients in a shelf sea. Limnol. Oceanogr. 51: 936–949.
MOREL, A., AND D. ANTOINE. 1994. Heating rate within the upperocean in relation to its bio-optical state. J. Phys. Oceanogr.24: 1652–1665.
———, AND A. BRICAUD. 1981. Theoretical results concerninglight absorption in a discrete medium, and application tospecific absorption of phytoplankton. Deep-Sea Res. I 28:1375–1393.
MOUGET, J. L., P. ROSA, AND G. TREMBLIN. 2004. Acclimation ofHaslea ostrearia to light of different spectral qualities—confirmation of ‘chromatic adaptation’ in diatoms. J. Photo-chem. Photobiol. B 75: 1–11.
MOUM, J. N., AND J. D. NASH. 2000. Topographically induceddrag and mixing at a small bank on the Continental shelf. J.Phys. Oceanogr. 30: 2049–2054.
MOURITSEN, L. T., AND K. RICHARDSON. 2003. Vertical microscalepatchiness in nano- and microplankton distributions in astratified estuary. J. Plankton Res. 25: 783–797.
PAINTER, S. C., R. SANDERS, A. J. POULTON, E. M. S. WOODWARD,M. LUCAS, AND K. CHAMBERLAIN. 2007. Nitrate uptake atphotic zone depths is not important for export in thesubtropical ocean. Global Biogeochem. Cy. 21: GB4005,doi:10.1029/2006GB002807.
PARTENSKY, F., J. BLANCHOT, F. LANTOINE, J. NEVEUX, AND D.MARIE. 1996. Vertical structure of picophytoplankton atdifferent trophic sites of the tropical northeastern AtlanticOcean. Deep-Sea Res. I 43: 1191–1213.
PEMBERTON, K., A. P. REES, P. I. MILLER, R. RAINE, AND I. JOINT.2004. The influence of water body characteristics onphytoplankton diversity and production in the Celtic Sea.Cont. Shelf Res. 24: 2011–2028.
PINGREE, R. D., P. M. HOLLIGAN, G. T. MARDELL, AND R. N.HEAD. 1976. Influence of physical stability on spring, summerand autumn phytoplankton blooms in the Celtic Sea. J. Mar.Biol. Assoc. UK 56: 845–873.
———, L. MADDOCK, AND E. I. BUTLER. 1977. The influence ofbiological activity and physical stability in determining thechemical distributions of inorganic phosphate, silicate andnitrate. J. Mar. Biol. Assoc. UK 57: 1065–1073.
PLANAS, D., S. AGUSTI, C. M. DUARTE, T. C. GRANATA, AND M.MERINO. 1999. Nitrate uptake and diffusive nitrate supply inthe Central Atlantic. Limnol. Oceanogr. 44: 116–126.
POULTON, A. J., C. M. MOORE, S. SEEYAVE, M. I. LUCAS, S.FIELDING, AND P. WARD. 2007. Phytoplankton communitycomposition around the Crozet Plateau, with emphasis ondiatoms and Phaeocystis. Deep-Sea Res. II 54: 2085–2105.
RICHARDSON, K., A. W. VISSER, AND F. B. PEDERSEN. 2000.Subsurface phytoplankton blooms fuel pelagic production inthe North Sea. J. Plankton Res. 22: 1663–1671.
RIPPETH, T. P., J. H. SIMPSON, E. WILLIAMS, AND M. E.INALL. 2003. Measurement of the rates of production anddissipation of turbulent kinetic energy in an energetic tidalflow: Red Wharf Bay revisited. J. Phys. Oceanogr. 33:1889–1901.
SHARPLES, J., C. M. MOORE, T. P. RIPPETH, P. M. HOLLIGAN, D. J.HYDES, N. R. FISHER, AND J. H. SIMPSON. 2001. Phytoplank-ton distribution and survival in the thermocline. Limnol.Oceanogr. 46: 486–496.
———, AND oTHERS. 2007. Spring-neap modulation of internaltide mixing and vertical nutrient fluxes at a shelf edge insummer. Limnol. Oceanogr. 52: 1735–1747.
SIMPSON, J. H., W. H. CRAWFORD, T. P. RIPPETH, A. R. CAMPBELL,AND J. V. S. CHOEK. 1996. The vertical structure of turbulentdissipation in shelf seas. J. Phys. Oceanogr. 26: 1579–1590.
———, AND J. R. HUNTER. 1974. Fronts in the Irish Sea. Nature250: 404–406.
TAKAHASHI, M., S. ICHIMURA, M. KISHINO, AND N. OKAMI. 1989.Shade and chromatic adaptation of phytoplankton photo-synthesis in a thermally stratified sea. Mar. Biol. 100:401–409.
TASSAN, S., AND G. M. FERRARI. 1995. An alternative approach toabsorption measurements of aquatic particles retained onfilters. Limnol. Oceanogr. 40: 1358–1368.
Phytoplankton in a shelf sea thermocline 535
TILSTONE, G. H., F. G. FIGUEIRAS, L. M. LORENZO, AND B.ARBONES. 2003. Phytoplankton composition, photosynthesisand primary production during different hydrographicconditions at the Northwest Iberian upwelling system. Mar.Ecol. Prog. Ser. 252: 89–104.
VARELA, R. A., A. CRUZADO, J. TINTORE, AND E. GARCIA-LADONA.1992. Modelling the deep-chlorophyll maximum: A coupledphysical–biological approach. J. Mar. Res. 50: 441–463.
VELDHUIS, M. J. W., AND G. W. KRAAY. 2004. Phytoplankton inthe subtropical Atlantic Ocean: Towards a better assessmentof biomass and composition. Deep-Sea Res. I 51: 507–530.
WELSCHMEYER, N. A. 1994. Fluorometric analysis of chlorophyll-ain the presence of chlorophyll-b and phaeopigments. Limnol.Oceanogr. 39: 1985–1992.
WESTON, K., L. FERNAND, D. K. MILLS, R. DELAHUNTY, AND J.BROWN. 2005. Primary production in the deep chlorophyllmaximum of the central North Sea. J. Plankton Res. 27:909–922.
Edited by: Robert R. Bidigare
Received: 24 March 2008Accepted: 12 September 2008
Amended: 17 October 2008
536 Hickman et al.
Related Documents