Distinguishing Regulators of Biomolecular Pathways Mentor: Dr. Xiwei Wu City of Hope Sean Caonguyen SoCalBSI 8/21/08

Distinguishing Regulators of Biomolecular Pathways Mentor: Dr. Xiwei Wu City of Hope Sean Caonguyen SoCalBSI 8/21/08.
Dec 18, 2015
Welcome message from author
This document is posted to help you gain knowledge. Please leave a comment to let me know what you think about it! Share it to your friends and learn new things together.
Transcript

Distinguishing Regulators of Biomolecular Pathways
Mentor:Dr. Xiwei WuCity of Hope
Sean CaonguyenSoCalBSI8/21/08

Expression Pattern Analysis
Microarray technology is a powerful tool for investigating cellular activity at different levels
DNA microarrays can be used to identify genetic ‘‘signatures’’ for disease
http://www.sciencedaily.com/images/2007/09/070912102212.jpg
Pan et al. (2005)
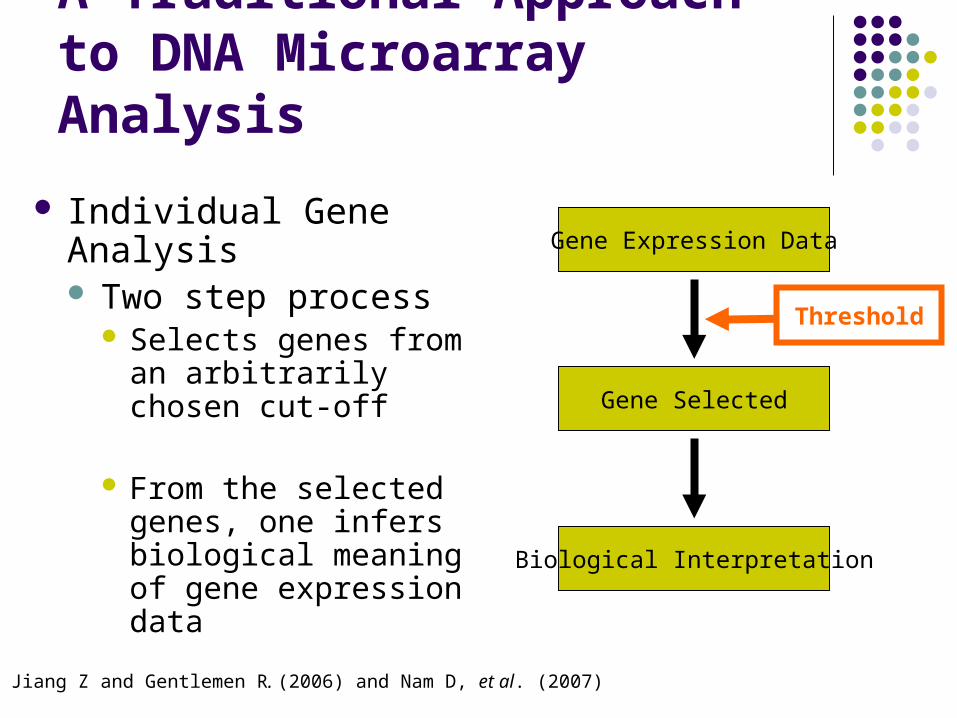
A Traditional Approach to DNA Microarray Analysis
Gene Expression Data
Gene Selected
Biological Interpretation
Threshold
Individual Gene Analysis Two step process
Selects genes from an arbitrarily chosen cut-off
From the selected genes, one infers biological meaning of gene expression data
Jiang Z and Gentlemen R. (2006) and Nam D, et al. (2007)
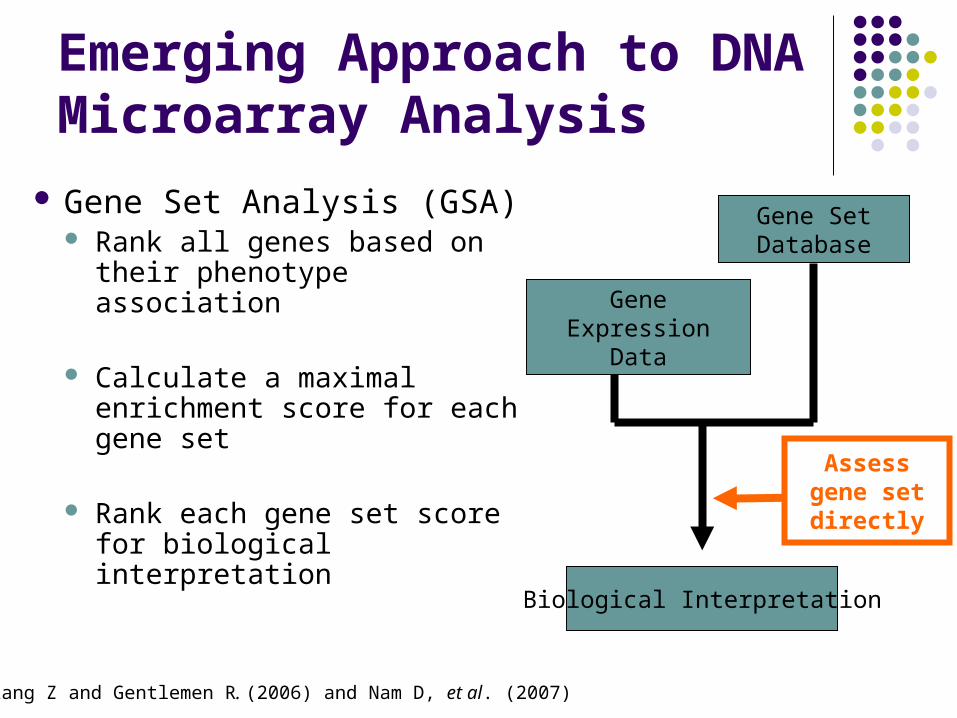
Emerging Approach to DNA Microarray Analysis
Gene Set Analysis (GSA) Rank all genes based on
their phenotype association
Calculate a maximal enrichment score for each gene set
Rank each gene set score for biological interpretation
Gene Expression Data
Gene Set Database
Biological Interpretation
Assess gene set directly
Jiang Z and Gentlemen R. (2006) and Nam D, et al. (2007)
Biological Significance of Gene Set Analyses
Ability to identify subtle changes in gene expression that are undetectable by traditional approaches
No arbitrary threshold
Generate results that are easier to interpret

Current Problem with GSA
Reduces gene set into a list of names
No difference in up-regulation and down-regulation Directionality is lost
A
B
D E
F
C
P
G
A
D
F
P
E
B
Suggests that the pathway is activatedSuggests a lower probability of pathway activation
HIGHER
up-regulation
down-regulation
up-regulation
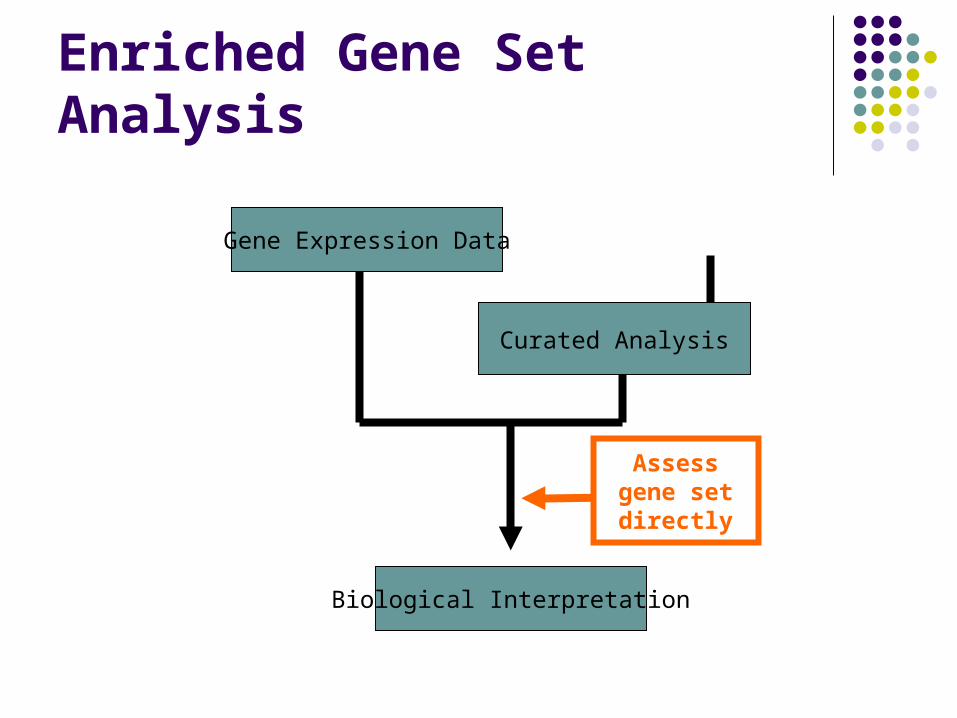
Enriched Gene Set Analysis
Gene Set Database
Biological Interpretation
Assess gene set directly
Curated Analysis
Gene Expression Data

Useful Tools for the Pathway Analysis Program
National Cancer Institutes (NCI) Pathway Interaction Database (http://pid.nci.nih.gov/PID/index.shtml)
contains information about molecular interactions and biological processes in signaling pathways
focuses on cancer research in human cells searches for biomolecules, processes, or by
viewing pathways Data format
Graphics: SVG or GIF Texts: XML or BioPax

Segment of the Phosphoinositide 3-Kinases (PI3K) Signaling Pathway
Key to Icons
non-lipid kinase pathway of Class IB PI3K
XML Script

Project Objective
Create a program to distinguish the activators and inhibitors in each signaling pathway Requires extensive use of XML Parser in Python

Approach to Project
1. Identify all the elements in the pathway
2. Record the pairwise interactions
Linking each interaction
3. Determine the role of each molecule
Finding each leaf node Using a traceback
method
A
B
D E
F
C
P
G
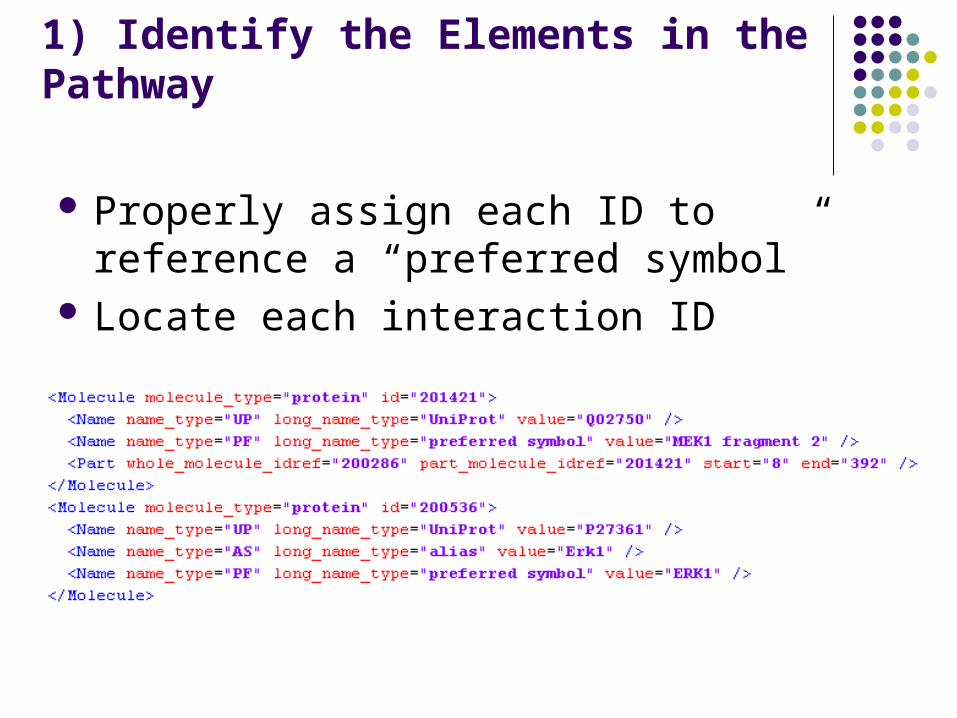
1) Identify the Elements in the Pathway
Properly assign each ID to reference a “preferred symbol”
Locate each interaction ID

2) Record the Pairwise Interactions
How to can we store each interaction? Memory efficient Easy extraction of
data
A
B
D E
F
C
P
GSparse Matrix!

Sparsing Matrix Initialization
A
B
D E
F
C
P
G
A B C D E F G P
A 0 0 0 0 0 0 0 0
B 1 0 0 0 0 0 0 0
C 0 0 0 0 0 0 0 0
D 0 1 1 0 0 0 0 0
E 0 -1 0 0 0 0 0 0
F 0 0 0 1 0 0 0 0
G 0 0 0 0 -1 0 0 0
P 0 0 0 0 0 1 0 0
Sparse Matrix
Regulators
Ou
tpu
t
1
1
11
1
-1
-1
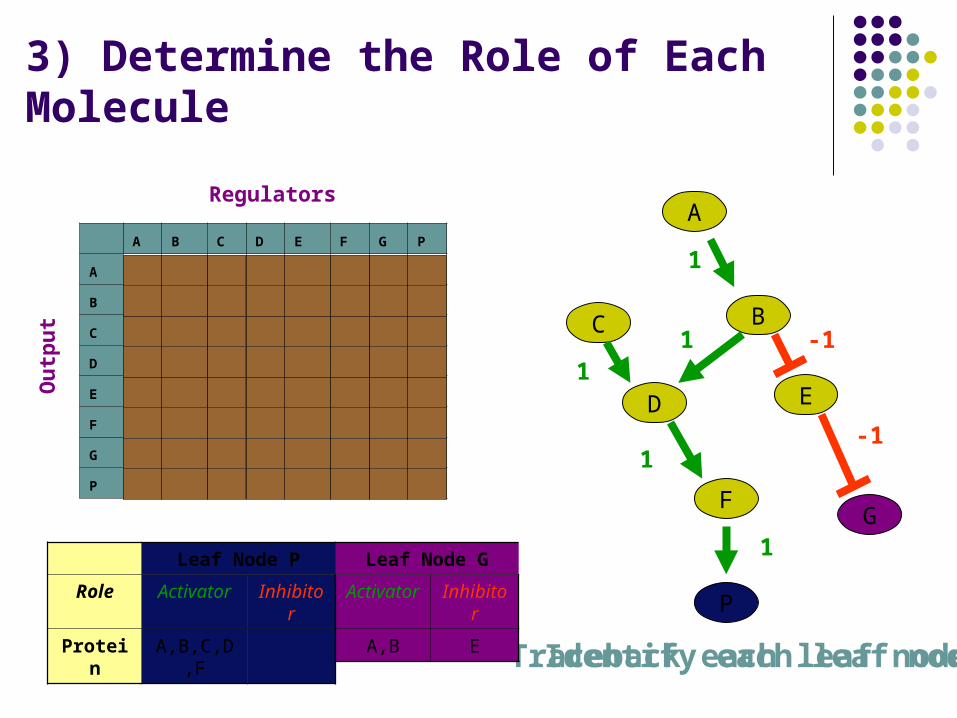
3) Determine the Role of Each Molecule
A
B
D E
F
C
P
G
A B C D E F G P
A 0 0 0 0 0 0 0 0
B 1 0 0 0 0 0 0 0
C 0 0 0 0 0 0 0 0
D 0 1 1 0 0 0 0 0
E 0 -1 0 0 0 0 0 0
F 0 0 0 1 0 0 0 0
G 0 0 0 0 -1 0 0 0
P 0 0 0 0 0 1 0 0
Regulators
Ou
tpu
t
Traceback each leaf node
1
1
11
1
-1
-1
Leaf Node P
Role Activator Inhibitor
Protein A,B,C,D,F
Identify each leaf node
Leaf Node G
Activator Inhibitor
A,B E

Locate Activated Pathways for Better Biological Interpretation
Gene Expression Data Up-regulation of B and D Down-regulation of E
Enriched Gene Set Analysis
Leaf Node P Leaf Node G
Role Activator Inhibitor Activator Inhibitor
Protein A,B,C,D,F A,B E
Possible activation of Pathway
A
B
D E
F
C
P
G
D E
B down-regulationup-regulation

Results
For each pathway menu, one can: find a list of proteins with associated roles for
each node look at each protein in an interaction find a list of all interactions in a pathway

Percentage of Inhibitors
Number of Pathwa
ys Percentage
0% 55 46.6%
0-5% 38 32.2%
>=5% 25 21.2%
>=10% 8 6.8%
>=20% 2 1.7%
Total 118 100%
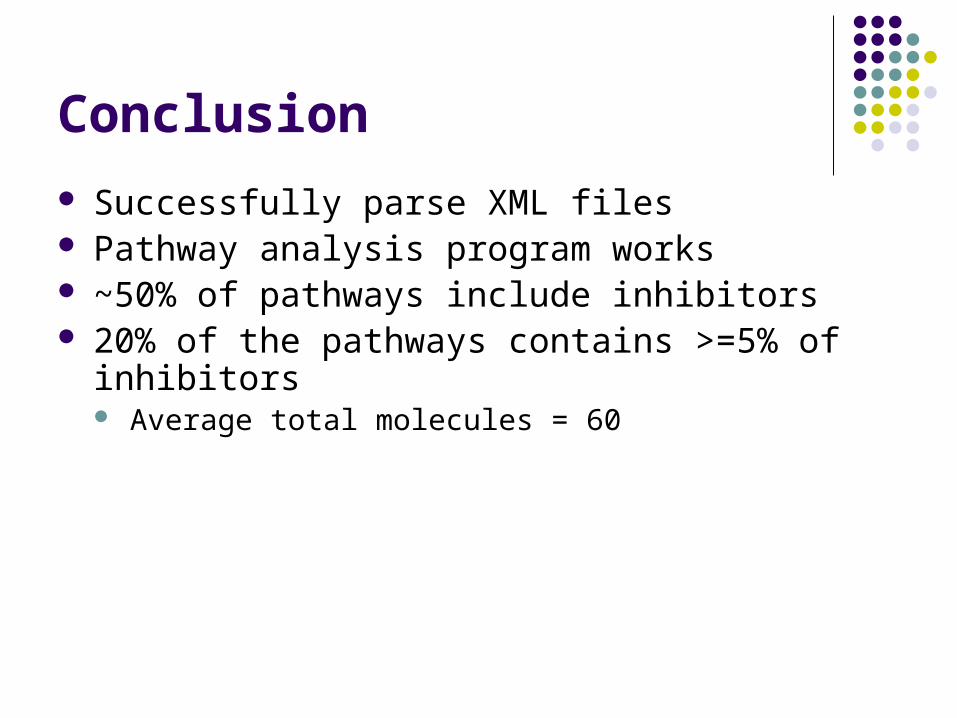
Conclusion
Successfully parse XML files Pathway analysis program works ~50% of pathways include inhibitors 20% of the pathways contains >=5% of inhibitors
Average total molecules = 60

Future Directions
Improvements to Software Ambiguous roles Proteins in different Complex
may have different roles Fine tune the overall role of
proteins in each pathway
Run program with real expression data set
Improve prognoses and drugs for diseases
A
B
D E
F
C
P
G

References Pan KH, Lih Cj, Cohen SN. Effects of threshold choice on biological conclusions
reached during analysis of gene expression by DNA microarrays. Proc Natl Acad Sci 2005, 102:8961-5.
Subramanian A, Tamayo P, et al. Gene set enrichment analysis: a knowledge-based approach for interpreting genome-wide expression profiles. Proc Natl Acad Sci 2005, 102:15545-50.
Nam D, Kim SY. Gene-set approach for expression pattern analysis. Brief Bioinform 2008, 9:189-97.
Dupuy A, Simon RM. Critical review of published microarray studies for cancer outcome and guidelines on statistical analysis and reporting. J Natl Cancer Inst 2007, 99:147-57.
Jiang Z, Gentleman R. Extensions to gene set enrichment. Bioinformatics 2007,23:306-13.
Dinu I, Potter JD, et al. Improving gene set analysis of microarray data by SAM-GS. BMC Bioinformatics 2007, 8:242.
Liu Q, Dinu I, et al. Comparative evaluation of gene-set analysis methods. BMC Bioinformatics 2007,8:431.

Acknowledgements Mentor
Xiwei Wu
SoCalBSI Faculty and Staff Jamil Momand Sandy Sharp Nancy Warter-Perez Wendie Johnston
Funding for SoCalBSI: DOE and NASA LA / Orange County
Biotechnology Center NSF, NIH, and Economic &
Workforce Development
Funding at City of Hope: National Cancer Institute National Institute of Health
Related Documents


