UNCORRECTED PROOF 1 Distinct MEG correlates of conscious experience, perceptual reversals and 2 stabilization during binocular rivalry Q1 Kristian Sandberg a,b,c, ⁎, Gareth Robert Barnes d , Bahador Bahrami c,e , Ryota Kanai c,f , 4 Morten Overgaard a , Geraint Rees c,d 5 a Cognitive Neuroscience Research Unit, Hammel Rehabilitation and Research Center, Voldbyvej 15, 8450 Hammel, Denmark 6 b Cognitive Neuroscience Research Unit, Aarhus University Hospital, Noerrebrogade 44, Building 10G, 8000 Aarhus C, Denmark 7 c Institute of Cognitive Neuroscience, University College London, 17 Queen Square, WC1N 3AR London, United Kingdom 8 d Wellcome Trust Centre for Neuroimaging, Institute of Neurology, 12 Queen Square, WC1N 3AR London, United Kingdom 9 e Interacting Minds Centre, Aarhus University, Jens Chr. Skous Vej 4, Building 1483, 3rd floor 8000 Aarhus C, Denmark 10 f Sackler Centre for Consciousness Science, School of Psychology, Pevensey 1, BN1 9QH Falmer, United Kingdom abstract 11 article info 12 Article history: 13 Accepted 8 June 2014 14 Available online xxxx 15 Keywords: 16 Consciousness 17 Binocular rivalry 18 Stabilization 19 Perceptual reversals 20 MEG 21 Magnetoencephalography 22 During binocular rivalry, visual perception alternates spontaneously between two different monocular images. 23 Such perceptual reversals are slowed or halted if stimuli are presented intermittently with inter-stimulus 24 intervals larger than ~400 ms — a phenomenon called stabilization. Often, the neural correlates of reversal and 25 stabilization are studied separately, and both phenomena in turn are studied separately from the neural 26 correlates of conscious perception. To distinguish the neural correlates of perceptual content, stabilization and 27 reversal, we recorded MEG signals associated with each in the same group of healthy humans observing repeated 28 trials of intermittent presentation of a dichoptic stimulus. Perceptual content correlated mainly with modulation 29 of stimulus-specific activity in occipital/temporal areas 150–270 ms after stimulus onset, possibly reflecting 30 inhibition of the neural populations representing the suppressed image. Stability of perception reflected a 31 gradual build-up of this modulation across at least 10 trials and was also, to some extent, associated with parietal 32 activity 40–90 ms and 220–270 ms after stimulus onset. Perceptual reversals, in contrast, were associated with 33 parietal (150–270 ms) and temporal (150–210 ms) activity on the trial before the reversal and a gradual 34 change in perception-specific activity in occipital (150–270 ms) and temporal (220–420 ms) areas across at 35 least 10 trials leading up to a reversal. Mechanistically, these findings suggest that stability of perception 36 during rivalry is maintained by modulation of activity related to the two monocular images, and gradual 37 adaptation of neuronal populations leads to instability that is eventually resolved by signals from parietal 38 and late sensory cortices. 39 © 2014 Published by Elsevier Inc. 40 41 42 43 44 Introduction 45 Perceptually ambiguous stimuli have long been used to study the 46 neural correlates of visual awareness as several different contents of 47 consciousness can be elicited by the same physical stimulus. Binocular 48 rivalry (BR; Blake and Logothetis, 2002; Blake and Wilson, 2011; 49 Breese, 1899; Tong et al., 2006) is a form of bistable perception that 50 occurs when an image is viewed monocularly while at the same time 51 another, incongruent, image is presented to the same retinal location 52 in the other eye. Perception alternates spontaneously between each 53 monocular view every few seconds; but if a blank interval longer 54 than ~400 ms is inserted between intermittent periods of binocular 55 presentations, the perceptual alternation rate drops dramatically as a 56 function of the duration of the blank interval (Leopold et al., 2002). 57 Perception during consecutive trials stabilizes to one of the two 58 monocular alternatives implying the existence of a perceptual memory 59 across subsequent trials, a phenomenon termed stabilization (Leopold 60 et al., 2002). 61 The intermittent presentation paradigm, where bistable stimuli are 62 presented for b 1 s separated by blank intervals of anywhere between 63 100 ms and 10 s, has been used to study the neural correlates of 64 conscious perception (Sandberg et al., 2013) as well as those of percep- 65 tual reversals (see Kornmeier and Bach (2012) for a review) and stabi- 66 lization (see Pearson and Brascamp (2008) for a review). Although 67 Leopold et al. (2002) recognized the importance of the paradigm for 68 studying changes in conscious perception in general, there is, neverthe- 69 less, very little comparison between studies of the neural correlates 70 of conscious perception and of the neural correlates of perceptual 71 reversals/stabilization. Even comparisons between studies of the 72 correlates of reversals and stabilization are infrequent. In one example NeuroImage xxx (2014) xxx–xxx ⁎ Corresponding author at: Cognitive Neuroscience Research Unit, Aarhus University Hospital, Noerrebrogade 44, Building 10G, 8000 Aarhus C, Denmark. E-mail address: [email protected] (K. Sandberg). YNIMG-11447; No. of pages: 15; 4C: 2, 4, 6, 7, 10, 11, 12 http://dx.doi.org/10.1016/j.neuroimage.2014.06.023 1053-8119/© 2014 Published by Elsevier Inc. Contents lists available at ScienceDirect NeuroImage journal homepage: www.elsevier.com/locate/ynimg Please cite this article as: Sandberg, K., et al., Distinct MEG correlates of conscious experience, perceptual reversals and stabilization during binocular rivalry, NeuroImage (2014), http://dx.doi.org/10.1016/j.neuroimage.2014.06.023

Welcome message from author
This document is posted to help you gain knowledge. Please leave a comment to let me know what you think about it! Share it to your friends and learn new things together.
Transcript

1
2
3Q1
4
5678910
1 1
121314
15161718192021
38
39
4041
42
43
44
45
46
47
48
49
50
51
52
53
54
55
NeuroImage xxx (2014) xxx–xxx
YNIMG-11447; No. of pages: 15; 4C: 2, 4, 6, 7, 10, 11, 12
Contents lists available at ScienceDirect
NeuroImage
j ourna l homepage: www.e lsev ie r .com/ locate /yn img
DistinctMEG correlates of conscious experience, perceptual reversals andstabilization during binocular rivalry
OO
FKristian Sandberg a,b,c,⁎, Gareth Robert Barnes d, Bahador Bahrami c,e, Ryota Kanai c,f,Morten Overgaard a, Geraint Rees c,d
a Cognitive Neuroscience Research Unit, Hammel Rehabilitation and Research Center, Voldbyvej 15, 8450 Hammel, Denmarkb Cognitive Neuroscience Research Unit, Aarhus University Hospital, Noerrebrogade 44, Building 10G, 8000 Aarhus C, Denmarkc Institute of Cognitive Neuroscience, University College London, 17 Queen Square, WC1N 3AR London, United Kingdomd Wellcome Trust Centre for Neuroimaging, Institute of Neurology, 12 Queen Square, WC1N 3AR London, United Kingdome Interacting Minds Centre, Aarhus University, Jens Chr. Skous Vej 4, Building 1483, 3rd floor 8000 Aarhus C, Denmarkf Sackler Centre for Consciousness Science, School of Psychology, Pevensey 1, BN1 9QH Falmer, United Kingdom
R⁎ Corresponding author at: Cognitive Neuroscience ReHospital, Noerrebrogade 44, Building 10G, 8000 Aarhus C
E-mail address: [email protected] (K. Sandberg).
http://dx.doi.org/10.1016/j.neuroimage.2014.06.0231053-8119/© 2014 Published by Elsevier Inc.
Please cite this article as: Sandberg, K., et abinocular rivalry, NeuroImage (2014), http:/
Pa b s t r a c t
a r t i c l e i n f o22
23
24
25
26
27
28
29
30
31
Article history:Accepted 8 June 2014Available online xxxx
Keywords:ConsciousnessBinocular rivalryStabilizationPerceptual reversalsMEGMagnetoencephalography
32
33
34
35
36
37
RECTED During binocular rivalry, visual perception alternates spontaneously between two different monocular images.Such perceptual reversals are slowed or halted if stimuli are presented intermittently with inter-stimulusintervals larger than ~400 ms — a phenomenon called stabilization. Often, the neural correlates of reversal andstabilization are studied separately, and both phenomena in turn are studied separately from the neuralcorrelates of conscious perception. To distinguish the neural correlates of perceptual content, stabilization andreversal, we recordedMEG signals associatedwith each in the same group of healthy humans observing repeatedtrials of intermittent presentation of a dichoptic stimulus. Perceptual content correlatedmainlywithmodulationof stimulus-specific activity in occipital/temporal areas 150–270 ms after stimulus onset, possibly reflectinginhibition of the neural populations representing the suppressed image. Stability of perception reflected agradual build-up of thismodulation across at least 10 trials andwas also, to some extent, associatedwith parietalactivity 40–90 ms and 220–270 ms after stimulus onset. Perceptual reversals, in contrast, were associated withparietal (150–270 ms) and temporal (150–210 ms) activity on the trial before the reversal and a gradualchange in perception-specific activity in occipital (150–270 ms) and temporal (220–420 ms) areas across atleast 10 trials leading up to a reversal. Mechanistically, these findings suggest that stability of perceptionduring rivalry is maintained by modulation of activity related to the two monocular images, and gradualadaptation of neuronal populations leads to instability that is eventually resolved by signals from parietaland late sensory cortices.
© 2014 Published by Elsevier Inc.
R56
57
58
59
60
61
62
63
64
65
66
67
68
UNCOIntroduction
Perceptually ambiguous stimuli have long been used to study theneural correlates of visual awareness as several different contents ofconsciousness can be elicited by the same physical stimulus. Binocularrivalry (BR; Blake and Logothetis, 2002; Blake and Wilson, 2011;Breese, 1899; Tong et al., 2006) is a form of bistable perception thatoccurs when an image is viewed monocularly while at the same timeanother, incongruent, image is presented to the same retinal locationin the other eye. Perception alternates spontaneously between eachmonocular view every few seconds; but if a blank interval longerthan ~400 ms is inserted between intermittent periods of binocularpresentations, the perceptual alternation rate drops dramatically as a
69
70
71
72
search Unit, Aarhus University, Denmark.
l., Distinct MEG correlates of/dx.doi.org/10.1016/j.neuroim
function of the duration of the blank interval (Leopold et al., 2002).Perception during consecutive trials stabilizes to one of the twomonocular alternatives implying the existence of a perceptual memoryacross subsequent trials, a phenomenon termed stabilization (Leopoldet al., 2002).
The intermittent presentation paradigm, where bistable stimuli arepresented for b1 s separated by blank intervals of anywhere between100 ms and 10 s, has been used to study the neural correlates ofconscious perception (Sandberg et al., 2013) as well as those of percep-tual reversals (see Kornmeier and Bach (2012) for a review) and stabi-lization (see Pearson and Brascamp (2008) for a review). AlthoughLeopold et al. (2002) recognized the importance of the paradigm forstudying changes in conscious perception in general, there is, neverthe-less, very little comparison between studies of the neural correlatesof conscious perception and of the neural correlates of perceptualreversals/stabilization. Even comparisons between studies of thecorrelates of reversals and stabilization are infrequent. In one example
conscious experience, perceptual reversals and stabilization duringage.2014.06.023
T
73
74
75
76
77
78
79
80
81
82
83
84
85
86
87
88
89
90
91
92
93
94
95
96
97
98
99
100
101
102
103
104
105
106
107
108
109
110
111
112
113
114
115
116
117
118
119
120
121
122
123
124
125
126
127
128
129
130
131
132
133
134
135
136
137
138
139
140
141
2 K. Sandberg et al. / NeuroImage xxx (2014) xxx–xxx
EC
of cross-referencing Koivisto andRevonsuo (2010) referred to Kornmeierand Bach’s (2004) Reversal Negativity as possible modulation ofconsciousness-specific activity, and in another example, Pearson andBrascamp (2008) referred to Reversal Positivity as potential evidencefor the involvement of early visual areas in stabilization. However, untilnow there has been no explicit comparison within the same participantsof these potentially different neural mechanisms.
In the present experiment, we intensively examined the neuralcorrelates of conscious perception, reversals, and stabilization in thesame participants using intermittent presentations of binocular rivalry.The first goal was to map the MEG correlates of perceptual contentduring binocular rivalry. We then mapped the MEG correlates ofstabilization/reversals and examinedwhich of these correlates reflectedmodulation of percept-specific activity. Finally, we examined thetemporal extent of these correlates (i.e. across how many trials be-fore/after a reversal each type of activity was observed). This allowedus to separate components associated with stabilization (which wereexpected to be found on many trials before/after a reversal) fromthosemore directly associatedwith the perceptual reversal (i.e. activityspecific to the trials immediately before and/or after the reversal).
Materials and methods
Data analyzed in the present article were previously reported inSandberg et al. (2013). This previous article was concerned only withthe correlates of conscious perception.
Participants
Eight healthy young adults (six females; 21–32 years mean 26.0 SD3.55)) with normal or corrected-to-normal vision gave informedconsent to participate in the experiment, which was approved by theUCL Research Ethics Committee.
Apparatus and MEG recording
Stimuli were generated using the MATLAB toolbox Cogent (http://www.vislab.ucl.ac.uk/Cogent/). They were projected onto a 19” screenat a resolution of 1024 × 768 pixels and at a refresh rate of 60 Hzusing a JVC D-ILA, DLA-SX21 projector. Participants viewed the stimuli
UNCO
RR
Fig. 1. Experimental setup. Top: Stimuli (a face and a grating)were presented dichoptically to thTrials were ~800 ms and the inter-trial interval was around ~900 ms. Bottom: Participants repsoon as they were able to meaningfully categorize the trial. Trials were labeled according to thseries of identical perceptual reports were assigned the label 10). For instance, the first of four sface after a series of gratings or mixed percepts) and “Face − 4” (as it was the fourth face percbelow and are referred to as stabilization weights and destabilization weights respectively.
Please cite this article as: Sandberg, K., et al., Distinct MEG correlates ofbinocular rivalry, NeuroImage (2014), http://dx.doi.org/10.1016/j.neuroim
ED P
RO
OF
through a mirror stereoscope positioned at approximately 50 cmfrom the screen. MEG data were recorded in a magnetically shieldedroom with a 275 channel CTF Omega whole-head gradiometer system(VSM MedTech, Coquitlam, BC, Canada) at a 600 Hz sampling rate.After participants were comfortably seated, head localizer coils wereattached to the nasion and 1 cm anterior of the left and right outercanthus to monitor head movement during the recording sessions.
Stimuli
A red Gabor patch (contrast = 100 %, spatial frequency = 3 cycles/degree, standard deviation of the Gaussian envelope = 10 pixels) waspresented to the right eye of the participants, and a green face waspresented to the left eye (Fig. 1). To avoid piecemeal rivalry, the stimulirotated at a rate of 0.7 cycles per second in opposite directions, and inorder to prevent the stimuli from being perceived in non-overlappingareas of the visual field, each stimulus was presented within an annulus(inner/outer r= 1.3/1.6 degrees of visual angle) consisting of randomlyoriented lines. In the center of the circlewas a small circularfixation dot.
Procedure
Participants looked into the mirror stereoscope while the fixationcircles around the stimuli were displayed, and the stereoscope wascalibrated by adjusting the mirrors until the circles fused. In order tominimize perceptual bias (Carter and Cavanagh, 2007), we increasedthe chances that participants would report each percept equally oftenduring the experiment by adjusting the relative luminance of theimages for each participant before the experiment. The startingluminance for each image was maximum screen value, and one valuewas decreased until the participant reported seeing both images equallyoften (+/−5%) during a one minute long continuous presentation. Forall participants, the luminance of the green face was decreased, and theend luminance (used in the experiment) was 58.0% (SD = 17.9%) ofmaximum screen value. Physical luminance was not measured. Whenstimuli were displayed during the calibration phase, participantsreported what they saw using one of three buttons, each corre-sponding to either face, grating, or mixed perception. During theexperiment, participants used the same three report options but swapped
e eyes of the participant. Stimuli were counter-rotating at a rate of 0.7 rotations per second.orted their perceptual experience (face/grating/mixed perception) with a button press aseir position in relation to a perceptual reversal (for simplicity, all trials after the 10th in auccessive trials of face perceptionwas labeled both “Face+ 1” (as it was the first perceivedeption trial before a perceptual reversal). These labels are used as weights in the analyses
conscious experience, perceptual reversals and stabilization duringage.2014.06.023
T
142
143
144
145
146
147
148
149
150
151
152
153
154
155
156
157
158
159
160
161
162
163
164
165
166
167
168
169
170
171
172
173
174
175
176
177
178
179
180
181
182
183
184
185
186
187
188
189
190
191
192
193
194
195
196
197
198
199
200
201
202
203
204
205
206
207
208
209
210
211
212
213
214
215
216
217
218
219
220
221
222
223
224
225
226
227
228
229
230
231
232
233
234
235
236
237
238
239
240
241
242
243
244
245
246
247
248
249
250
251
252
253
254
3K. Sandberg et al. / NeuroImage xxx (2014) xxx–xxx
UNCO
RREC
the hand used to report between blocks in order to minimize report-related confounds.
Each participant completed 6–9 runs consisting of 12 identicalblocks of 20 identical trials, i.e. a total of 1440–2160 trials were com-pleted per participant. Each trial consisted of presentation of therivalling images (face/grating), and trials were separated by a blank(grey) screen. The exact durations of stimulus and blank presentationwere calibrated for each participant for the reasons given in the follow-ing. Immediately after onset of binocular rivalry, participants mayperceive a mix of the two images for around 150 ms before one imageis perceived clearly (O’Shea and Crassini, 1984; Wolfe, 1983). As itwas of key importance that participants were able to distinguishmixed perception throughout a trial from any initial mixed perception(which theywere told to not report), stimulus duration had to be longerthan a few hundred milliseconds. However, for longer stimulus dura-tions, there is a risk that a reversal may occur during the presentation,and we wanted to avoid this as it would have an impact on the percep-tual decisions of the participants and the interpretation of the study.The exact stimulation period was thus calibrated individually foreach participant so that they experienced a stable perceptual state,i.e. perception had time to form and did not switch during the stim-ulation period. This resulted in stimulus durations of 750–900 ms(mean = 806, SD = 50.0) across participants. Furthermore, theduration of the blank periods has a large impact on the degree ofstabilization (Orbach et al., 1963). In order to ensure that partici-pants experienced a high degree of stabilization (but not 100%),each trial was separated by a blank (grey) screen appearing foraround 800–1000 ms (mean = 931, SD = 80.0) (Fig. 1). Betweeneach block participants were given a short break of 8 s. Betweenruns participants took a break and signaled when they were readyto start the next run. Participants were instructed not to blinkoutside of the breaks between blocks and were generally able tofollow these instructions. They were further instructed that ifthey needed to blink outside of the breaks, they should do it afterstimulus offset.
Preprocessing
SPM8 (http://www.fil.ion.ucl.ac.uk/spm/) was used for prepro-cessing the data. Before analysis, all datasets of the individual runsof each participant were high-pass filtered at 0.5 Hz and downsampledto 300Hz.1 Next, the data were epoched from −600 to 1400 msaround stimulus onset, and the reports of perception were used todivide stimulation intervals into face (44.1%, SD = 13.8), grating(38.6%, SD = 15.2) and mixed epochs (17.3%, SD = 13.0). Trialswith mixed perception were not analyzed and were thus only usedto establish when stabilization no longer occurred. Trials were thenrelabeled based on the behavioral responses: the first reportedface after a series of grating or mixed perception was thus labeled“Face + 1”, the second “Face + 2”, and so on up to a maximum of10 at which point perception was presumed to be fully stable. Thissubdivision allowed us to examine the modulations of the MEGsignal as a function face stabilization (using linear models based onFace 1–10 trials), grating stabilization (using linear models basedon Grating 1–10 trials), general stabilization (using linear modelsbased on Face 1–10 and Grating 1–10 trials) and perception(contrasting face and grating perception using all trials of each kind).When examining destabilization (i.e. signal changes prior to aperceptual switch), data were labeled so that “Face − 1” was the
255
256
257
258
259
260
261
1 The impact of high-pass filters of 0.1 Hz and 1 Hz on the data was also examined.Whereas the 1 Hz filter appeared to distort particularly some of the later componentsslightly, the 0.1 Hz filter led to low-frequency noise (Kappenman and Luck, 2010), whichin turn led to a poor source reconstruction. In order to ensure that the selected high-passfilter of 0.5 Hz did not lead to invalid results, subsequent CVA analyseswere performed onsensor space data at both 0.1 Hz and 0.5 Hz filtered data and very similar patternswere obtained.
Please cite this article as: Sandberg, K., et al., Distinct MEG correlates ofbinocular rivalry, NeuroImage (2014), http://dx.doi.org/10.1016/j.neuroim
ED P
RO
OF
last trial of reported face perception before a perceptual reversal,“Face − 2” the trial before that and so on. Finally, before sourcereconstruction, trials containing artifacts were removed at a thresholdof 3pT – on average 1.06% (SD = 1.46) – and the data were low-passfiltered at 30 Hz. Visual inspection of the data revealed that theinstructions on when to blink (see “Procedure”) were generallyfollowed and eye blinks were generally not observed in the ana-lyzed epochs. Furthermore, as all analyses were performed ondata reconstructed in source space (see below), activity related toeye blinks/movement is localized to the cortical surface aroundthe eyes, and activity at these sources within the analyzed epochwas insignificant and not included in the reconstructed dataset.
Data analysis
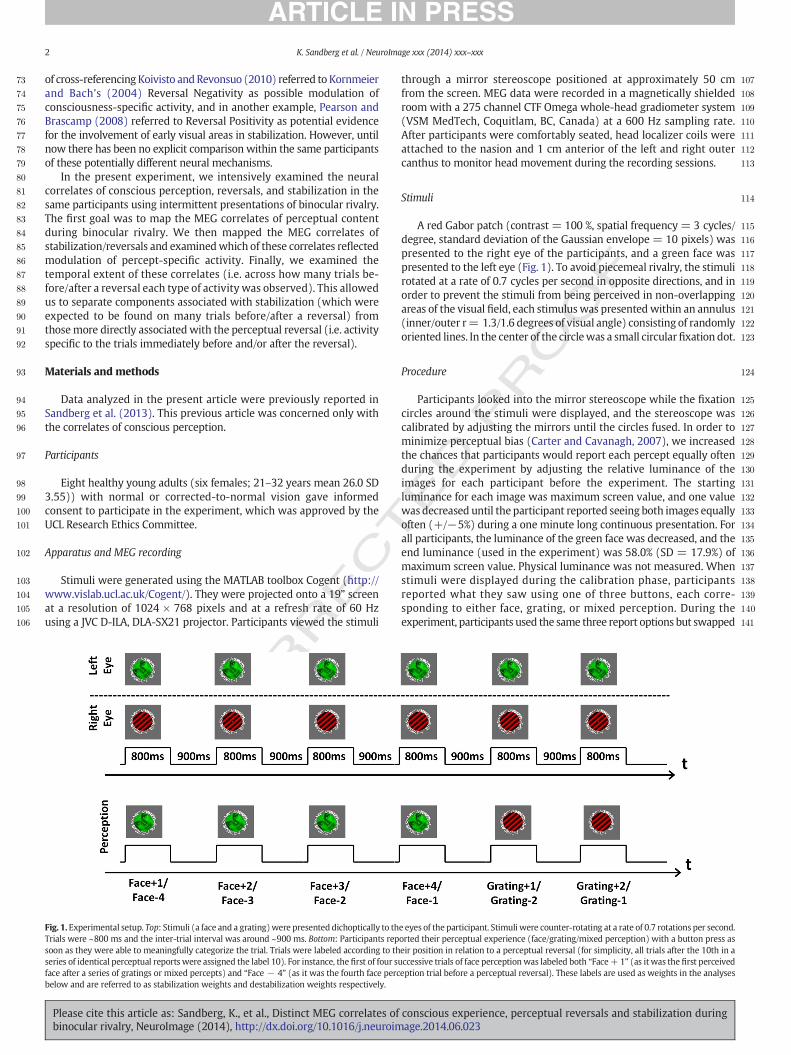
A schematic of the basic data analysis is shown in Fig. 2. In thesections below, each analysis step is explained in detail. In brief, firstthe data were projected into cortical space using the multiple sparsepriors algorithm (Friston et al., 2008b; Litvak and Friston, 2008). Thisgave us approximately 109 sources or regions of interest each withan individual time series. We then used canonical variates analysis(Chatfield and Collins, 1980), CVA, to determine the times at whichany linear mixture of sources (regardless of source location) couldexplain the behavioral response. In order to examine these time periodsin more detail we then used a multivariate Bayesian, MVB, scheme(Friston et al., 2008a) to test how well single anatomical regions(each consisting of a subset of the original sources) could explainthe behavioral responses.
To clarify our notation, in the following we use the terms “sources”,“features”, and “components”. We use the term ‘component’ to describetypical evoked response temporal peaks of interest (like the M170).A source, in this context, simply refers to a cortical location. A featureis a data reduction device and comprises a linear combination ofsources; importantly it is definedwithout reference to the experimentaldesign. This data reduction increases statistical power by reducingthe number of variables in the multivariate test. So for example, forthe canonical variates analysis in each trial at each time point, weconsider 120 sources that we reduce to 20 features, we then identi-fied linear combinations of these features (canonical vectors) thatexplained linear combinations (also canonical vectors) of the behav-ioral data. Classical CVA returns a statistic (in this case Chi squared)per pair of canonical vectors that can be tested against a well-definednull distribution (Chatfield and Collins, 1980). The first canonicalvector pair is the combination of features that predicts perception(or stabilization/destabilization) the best, and the second vectorpair (which has to be uncorrelated with the first) is the combinationof features that explains perception the second best, and so on. Ifthere is only a single behavioral regressor, there is effectively onlyone canonical vector pair. In this manuscript we only deal with thefirst canonical vector pair.
Source space activity reconstructionIn this section, we project the MEG sensor level data to the brain
space. This means that we gain some anatomical specificity and avoidproblemswith sensor level datawhichwill depend on the headpositionof an individual. Source analysis was performed within a window from−200 to 700ms around stimulus onset using themultiple sparse priors(MSP) algorithm (Friston et al., 2008b) based on all trials (over allconditions) from all eight participants (Litvak and Friston, 2008). Weused an inverse normalized canonical brain to provide the structuraland a single shell approximation to the inner skull boundary to givethe forward model (Nolte, 2003). The MSP algorithm operates byfinding the minimum number of patches (least complexity) on acanonical cortical mesh that explain the largest amount of variance(most accuracy) in the MEG data. This tradeoff between complexityand accuracy is optimized through maximization of model evidence
conscious experience, perceptual reversals and stabilization duringage.2014.06.023
UNCO
RRECT
OO
F
262
263
264
265
266
267
268
269
270
271
272
273
274
275
276
277
278
279
280
281
282
283
284
285
286
287
288
289
290
291
292
293
294
295
296
297
298
299
300
301
302
303
304
305
Q7 Fig. 2. Experimental analyses. Participants’ neural activity during performance of the taskwas measured with MEG. For analyses, the most active sources during the stimulationperiod were identified and activity was reconstructed at these sources. The figure showsthe most activated sources 0–700 ms after stimulus onset independently of trial typeacross all participants. All analyses were performed on source reconstructed datasets.Canonical variates analysis (CVA) was performed to identify the time points for whichthe MEG signal varied as a function of perception (face vs. grating) and as a function ofstabilization/destabilization (linear models based on the trial number relative to aperceptual reversal as explained in Fig. 1). Next, Multivariate Bayesian (MVB) modelswere constructed for each cortical area to compare the relative importance of the areasfor perception and stabilization/destabilization. Finally, different MVB models of thestabilization/destabilization memory trace were compared.
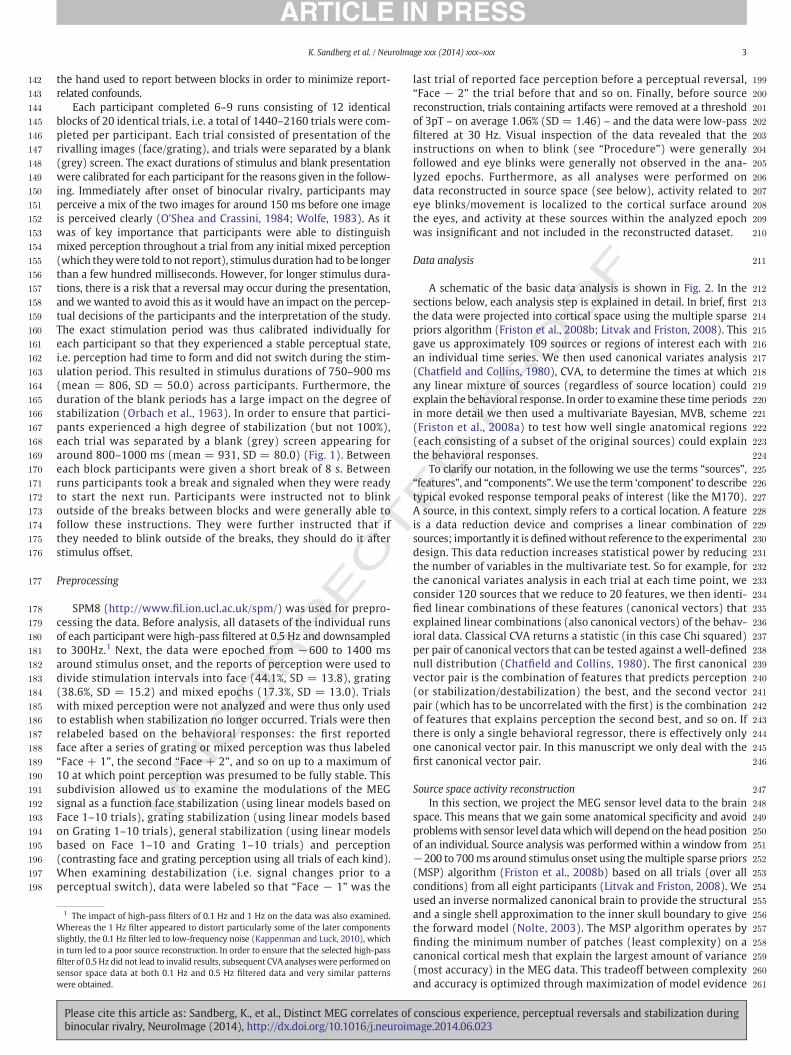
Fig. 3. Source peaks for activity reconstruction. Left: Sources for which MEG field strengthamplitude across all trialswas different from zero at an uncorrected significance thresholdof p b 0.05 (shown with infinite search depth). Right: Source peaks at which activity wasreconstructed and analyzed. Activity was reconstructed at a source peak if the fieldstrength amplitude across all trials was different from zero at a significance threshold pb 0.05 (uncorrected for multiple comparisons) with a minimum peak-to-peak distanceof 3 mm. This liberal criterion for source activation was selected to ensure a large numberof sources (109) for subsequent multivariate analyses on which conclusions are based.Sources were grouped according to overall cortical position: Green = occipital lobe,cyan = temporal lobe, hot red/yellow = parietal lobe, blue = precentral/postcentralgyri, red = prefrontal areas. Note that these color codes are unrelated to those used inFigs. 4, 5, 8, and 9.
4 K. Sandberg et al. / NeuroImage xxx (2014) xxx–xxx
in a variational Laplace scheme (Friston et al., 2007). The group levelinversion restricts the sources to be the same in all participants, butallows for different activation levels. The analysis identified 109
Please cite this article as: Sandberg, K., et al., Distinct MEG correlates ofbinocular rivalry, NeuroImage (2014), http://dx.doi.org/10.1016/j.neuroim
ED P
R
source peaks activated during stimulus presentation (0–700 ms) atan uncorrected threshold of p b 0.05. This liberal threshold wasselected in order to ensure that data from a wide distribution of cor-tical sources would be included in the analyses below. The activitymap and the map of selected source peaks can be seen in Fig. 3. Allsubsequent analyses were conducted on the (typically N1300) singletrial current density estimates across the 109 cortical sources foreach participant.
Canonical variates analysis (CVA)In this section, we want to establish how (if at all) the estimated
electrical activity across the cortical surfacemight predict the behavioraldata. CVA was used at a single-participant level to establish the timepoints for which activity differed significantly as a function of perceptu-al content, face stabilization, grating stabilization, and stabilization ingeneral. CVA is a generic multivariate framework which subsumes anumber of univariate and multivariate tests (like linear regression,ANCOVA, MANOVA etc.). It provides a single statistic (in this casechi square, an approximation to Wilk’s Lambda for reasonable (N30)degrees of freedom) which describes the ratio of explained tounexplained (co)variance (and therefore becomes equivalent to Ffor univariate tests). In this case, we wanted to examine if therewere any linear combinations of cortical sources that could explainthe behavioral data (over trials). For all models, this was performedby extracting 20 orthogonal features using principal componentsanalysis (PCA) and based on all conditions, at a single time pointfrom across the 109 source space estimates per trial (typicallyNt N 1300 trials). In principle, we could have used all 109 sourcesas input features, but as many of the source space estimates werehighly linearly correlated we chose to reduce this to 20 orthogonalfeatures for computational efficiency and because our region of in-terest (MVB) analysis below also used around 20 sources per area.We should note, however, that the number of components (in theinterval between 8 and 50) had little or no impact on the results asthe number of trials was so large in comparison. Canonical correlationwas calculated between the Nt behavioral measures (e.g. perceptionof face) and the Nt (rows) × 20 (columns) source level estimatesseparately for each time point (i.e. every 3.33 ms) across the −200 to700 ms time window (i.e. this is a multiple regression problem). ForBonferroni correction, we corrected for 21 comparisons reflecting theeffective 33 ms smoothness of the 30 Hz low-pass filtered data acrossthe 700 ms of the epoch for which the stimuli were presented. As at
conscious experience, perceptual reversals and stabilization duringage.2014.06.023
T
306
307
308
309
310
311
312
313
314
315
316
317
318
319
320
321
322
323
324
325
326
327
328
329
330
331
332
333
334
335
336
337
338
339
340
341
342
343
344
345
346
347
348
349
350
351
352
353
354
355
356
357
358
359
360
361
362
363
364
365
366
367
368
369
370
371
372
373
374
375
376
377
378
379
380
381
382
383
384
385
386
387
388
389
390
391
392
393
394
395
396
397
398
399
400
401
402
403
404
405
406
407
408
409
410
411
412
413
414
415
416
417
418
419
420
421
422
423
424
425
426
427
428
429
5K. Sandberg et al. / NeuroImage xxx (2014) xxx–xxx
UNCO
RREC
each time point we were conducting a single multivariate test (with ananalytically well described null distribution) rather than a series ofunivariate tests there was no need to correct for multiple comparisonsover space. These analyses are shown in Fig. 5.
Multivariate Bayesian (MVB) model testingFinally we wanted to look at how cortical activity within specific
anatomical regions over trials could be predicted by the perceptualstate on previous trials. In order to examine cortical sources whereactivity varied as a function of perceptual content and stabilization/reversals across participants, we constructed MVB models (Fristonet al., 2008a) consisting of subsets of five groups of sources corre-sponding to different cortical areas (see Fig. 3). The five sourcegroups were selected in order to reduce the total of 109 sources to ameaningful subset based on a division of the cortex into anatomicallydistinct areas. By restricting the sources used to a particular anatomicalarea (whilst attempting to explain the same behavioral data) we wereable to compute model evidence values showing the relative impor-tance of each anatomical region (in predicting behavior). This meantthat now rather than the features being orthogonal mixtures of sources,each source (within the anatomical area) became a feature. We thenused a random effects analysis to pool these individual model evidencevalues over the group (Stephan et al., 2009). This analysis was per-formed at the peaks in statistical significance identified by the CVA.The significant canonical vectors identified in the CVA typically had atemporal spread 50–80mswith the peaks of the individual participantsoccurring at slightly different time points. We therefore computedmodel evidence at 10 ms steps over each subject over this time rangeand the resulting model probabilities were averaged (over time) acrossthe entire peak timewindow. These peak timewindows are listedwhenresults are first presented (i.e. in Fig. 6). MVB was also used to examinethe stabilizationmemory trace.We did this by constructing a behavioralresponse vector in which each trial either contained a function of thenumber of stimulus presentations since the last perceptual reversal(in the stabilization analysis) or the number of presentations until thenext reversal (in the destabilization analysis). Each function was acount of the number of trials since (or until) the previous (next) percep-tual reversal with fixed ceiling (between 2 and 10 trials)(see Fig. 7A).Using the data from each region in turn, we then compared the modelevidence for each of these different functions (Figs. 8–9).
Results
As expected from previous studies (Leopold et al., 2002; Orbachet al., 1963), blank periods between stimulus presentations of around800 ms resulted in a high degree of stabilization while neverthelessexperiencing occasional perceptual reversals (average probability ofstabilization from trial to trial was 87% (SD = 8.8) for face perceptionand 86% (SD = 13.7) for grating perception). This setup thusallowed us to distinguish the gradual build-up of signals relatedto stabilization/destabilization from activity specific to the trialsassociated with a perceptual reversal.
We first examined the correlates of conscious perception duringintermittent presentation of binocular rivalry. This allowed us todistinguish stimulus-specific from non-stimulus-specific correlatesof stabilization/destabilization.
Percept-related activity
Based on more than 30 independent EEG studies employing differ-ent paradigms, Koivisto and Revonsuo (2010) conclude that visualawareness is correlated with activity often referred to as the VisualAwareness Negativity (VAN). At least 3MEGexperiments have reportedactivity corresponding to the VAN (Liu et al., 2012; Sandberg et al.,2013; Vanni et al., 1996). The exact time window of the VAN variesslightly between studies but is typically within the 130–320 ms time
Please cite this article as: Sandberg, K., et al., Distinct MEG correlates ofbinocular rivalry, NeuroImage (2014), http://dx.doi.org/10.1016/j.neuroim
ED P
RO
OF
window (see for instance Busch et al., 2010; Koivisto, 2005). The VANcan be divided temporally into an early and a late part (Koivisto andRevonsuo, 2010), and in some experiments, these two parts of theVAN are observed as separate ERP/ERF components (Fahrenfort et al.,2007; Sandberg et al., 2013). Although authors of various studies inter-pret their findings slightly differently, most emphasize the importanceof one or both of these ERP components in visual awareness. However,although Dehaene and others report that signals around the secondVAN component, peaking around 270 ms, correlate with subjective,graded ratings of visibility, they consider temporally later, bimodalresponses as the correlates of conscious report (Dehaene et al., 1998,2006; Sergent and Dehaene, 2004; Sergent et al., 2005). Based onthese previous findings, we hypothesized that reports of perceptualcontent during rivalry would correlate with MEG field strength mainlyaround latencies of the two face-specific peaks in the 130–320ms inter-val, theM170 and the P2m, but later components were also considered.
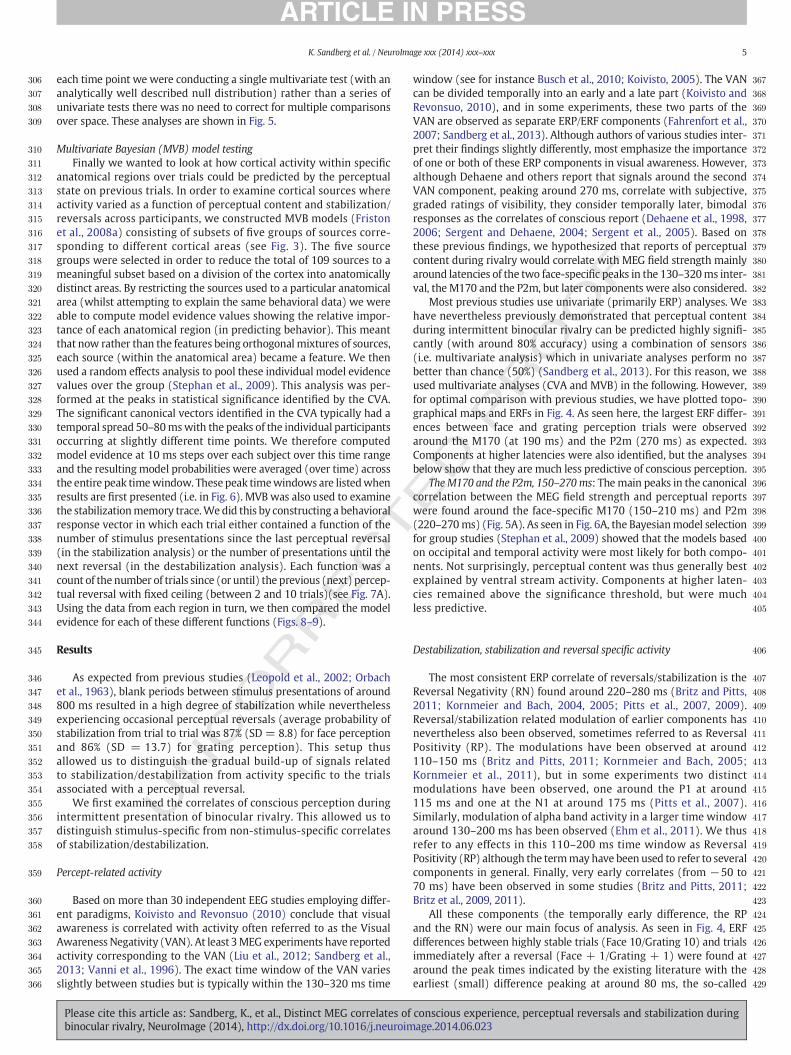
Most previous studies use univariate (primarily ERP) analyses. Wehave nevertheless previously demonstrated that perceptual contentduring intermittent binocular rivalry can be predicted highly signifi-cantly (with around 80% accuracy) using a combination of sensors(i.e. multivariate analysis) which in univariate analyses perform nobetter than chance (50%) (Sandberg et al., 2013). For this reason, weused multivariate analyses (CVA and MVB) in the following. However,for optimal comparison with previous studies, we have plotted topo-graphical maps and ERFs in Fig. 4. As seen here, the largest ERF differ-ences between face and grating perception trials were observedaround the M170 (at 190 ms) and the P2m (270 ms) as expected.Components at higher latencies were also identified, but the analysesbelow show that they are much less predictive of conscious perception.
TheM170 and the P2m, 150–270ms: Themain peaks in the canonicalcorrelation between the MEG field strength and perceptual reportswere found around the face-specific M170 (150–210 ms) and P2m(220–270ms) (Fig. 5A). As seen in Fig. 6A, the Bayesianmodel selectionfor group studies (Stephan et al., 2009) showed that the models basedon occipital and temporal activity were most likely for both compo-nents. Not surprisingly, perceptual content was thus generally bestexplained by ventral stream activity. Components at higher laten-cies remained above the significance threshold, but were muchless predictive.
Destabilization, stabilization and reversal specific activity
The most consistent ERP correlate of reversals/stabilization is theReversal Negativity (RN) found around 220–280 ms (Britz and Pitts,2011; Kornmeier and Bach, 2004, 2005; Pitts et al., 2007, 2009).Reversal/stabilization related modulation of earlier components hasnevertheless also been observed, sometimes referred to as ReversalPositivity (RP). The modulations have been observed at around110–150 ms (Britz and Pitts, 2011; Kornmeier and Bach, 2005;Kornmeier et al., 2011), but in some experiments two distinctmodulations have been observed, one around the P1 at around115 ms and one at the N1 at around 175 ms (Pitts et al., 2007).Similarly, modulation of alpha band activity in a larger time windowaround 130–200 ms has been observed (Ehm et al., 2011). We thusrefer to any effects in this 110–200 ms time window as ReversalPositivity (RP) although the termmay have been used to refer to severalcomponents in general. Finally, very early correlates (from −50 to70 ms) have been observed in some studies (Britz and Pitts, 2011;Britz et al., 2009, 2011).
All these components (the temporally early difference, the RPand the RN) were our main focus of analysis. As seen in Fig. 4, ERFdifferences between highly stable trials (Face 10/Grating 10) and trialsimmediately after a reversal (Face + 1/Grating + 1) were found ataround the peak times indicated by the existing literature with theearliest (small) difference peaking at around 80 ms, the so-called
conscious experience, perceptual reversals and stabilization duringage.2014.06.023
RRECTED P
RO
OF
430
431
432
433
434
435
436
437
438
439
440
441
442
443
444
445
446
447
448
449
450
451
452
453
454
455
456
457
458
459
460
461
462
463
464
465
466
467
Fig. 4. Event-related fields (ERFs) and topographies for illustrative purposes. RP: Reversal positivity. RN: Reversal negativity. FP: Frontopolar positivity. PP: Parietal positivity. A) Topography(bottom) and event-related activity (top) for the face-grating contrast (averages of all Grating 1–10 trials subtracted from averages of all Face 1–10 trials). Large differences in activity as afunction of reported perceptual content (face/grating)was found around theM170 (190ms after stimulus onset) and the P2m (260ms after stimulus onset). For each component, the ERFgraphwindowon the left plots the ERFs for trials immediately following a reversal (Face 1 andGrating 1) aswell as for trialswhen perceptionwas fully stable (Face 10 andGrating 10). TheERF graph window on the right plots the face-grating contrast using all trials. Note that the difference is present for both types of trials but also that it is larger for fully stable perception.B) Topography (top) and event-related activity (bottom) for the stabilization/reversal related activity. Large differences in activity between trials immediately after a reversal(Face 1/Grating 1) and trials with fully stable perception (Face 10/Grating 10) were found at 70, 190, 260, 310, 363, and 430ms after stimulus presentation. For each component, the ERFgraphwindow at the top plots the ERFs for all four above-mentioned trial types. The ERF graphwindow at the bottomplots the stabilization contrast for face (Face 1–Face 10) and grating(Grating 1–Grating 10) trials combined. Please note that these plots are for illustrative purposes only and do not take into account intermediate trials (Face 2–9/Grating 2–9), and neitheraremultivariate effects considered. Conclusions are based on analyses below. For improved readability, the color codes for the ERF plots are reused in Figs. 5, 8, and 9. Yellow, for instance,always marks the M170, and the degree of significance of the component is reported in Fig. 5 whereas stabilization vs. reversal model fit is reported in Figs. 8 and 9.
6 K. Sandberg et al. / NeuroImage xxx (2014) xxx–xxx
UNCO
reversal positivity peaking at 190 ms (the time of the m170), followedby the Reversal Negativity at around 270 ms.
Later correlates were also identified at around 340–420 ms and420–500 ms corresponding to what has been termed “Frontopolarpositivity” (FP) and “Parietal Positivity” (PP) respectively. However,these components have been interpreted as reflecting workingmemory processes, and recognition/appraisal of a reversal (Britzand Pitts, 2011; Kornmeier and Bach, 2006), or other cognitive pro-cesses during (O’Donnell et al., 1988) or following (Isoglu-Alkaçet al., 2000) a perceptual reversal. As they do not appear directlyrelated to the reversal, we report the analyses of these componentsbriefly, but do not provide further in-depth interpretations. We alsoobserved a small separate peak slightly later, at around 300 ms — whatwe refer to as a P3m. This peak shared sources and trace developmentwith the temporally late peaks and is discussed briefly with those.
Using a single linear model, it is difficult to distinguish activityrelated to destabilization/stabilization from activity related to rever-sals in general, as in both cases a difference in activity is observed fortrials immediately before/after a reversal compared to intervening
Please cite this article as: Sandberg, K., et al., Distinct MEG correlates ofbinocular rivalry, NeuroImage (2014), http://dx.doi.org/10.1016/j.neuroim
trials when perception is stable. The main difference is the temporalextent of the modulations. For reversal-related activity, the modulationis expected only around the reversal; for stabilization-related activity,the modulation is expected to continue across several trials after thereversal. In this section, we do not distinguish between the two.We do, however, distinguish between correlates of stabilization anddestabilization; i.e.we refer to the resultswhen using trials after a rever-sal as correlates of stabilization and we refer to the results when usingtrials before a reversal as correlates of destabilization. In the next sec-tion, we examine the temporal extent of each component in detailand distinguish between reversal and stabilization/destabilizationrelated activity.
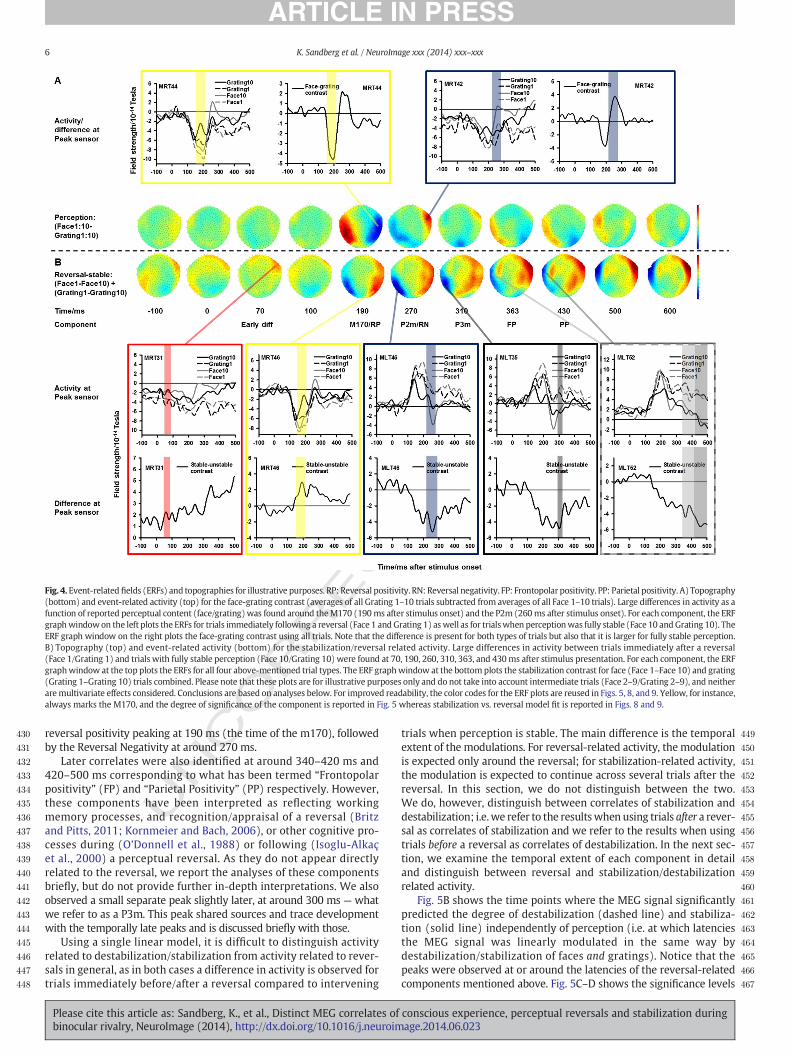
Fig. 5B shows the time points where the MEG signal significantlypredicted the degree of destabilization (dashed line) and stabiliza-tion (solid line) independently of perception (i.e. at which latenciesthe MEG signal was linearly modulated in the same way bydestabilization/stabilization of faces and gratings). Notice that thepeaks were observed at or around the latencies of the reversal-relatedcomponents mentioned above. Fig. 5C–D shows the significance levels
conscious experience, perceptual reversals and stabilization duringage.2014.06.023
UNCO
RRECTED P
RO
OF
468
469
470
471
472
473
474
475
476
477
478
479
480
481
482
483
484
485
486
487
488
Fig. 5. Canonical Variates Analysis (CVA). Average Chi2 across participants is plotted as a function of time. Chi2 values were obtained using both stabilization and destabilization weights(see Fig. 1 for a description) in separate design matrices. A) Chi2 for prediction of perception (Face-Grating contrast using all trials). The highest values were found for perception in thetime window of the two face-specific ERF components, theM170 and the P2m. B) Chi2 values for stabilization/destabilization in general (i.e. linear models inwhich both face and gratingtrials are included andweighted according to the degree of stabilization/destabilization). The dashed line plots CVA evidence based on trial number before a perceptual reversal (i.e. whatmay be called destabilization), and the solid line plots CVA based on trial number after a perceptual reversal (i.e. stabilization). Note the similar peak latencies for stabilization anddestabilization, and note how these differ from those for perception. C–D) Chi2 for grating and face perception individually. Note that face stabilization/destabilization values followthose of stabilization in general whereas grating stabilization/destabilization values follow the values of both perception and stabilization. This indicates that stabilization/destabilizationof grating perception correlates with modulation of the face-specific M170 and P2m, thus indicating that stabilization correlates with suppression of the non-perceived item. Horizontalmedium dashed line: p = 0.05 significance threshold. Horizontal long dashed line: p = 0.05 significance threshold after correcting for multiple comparisons.
7K. Sandberg et al. / NeuroImage xxx (2014) xxx–xxx
for grating and face destabilization/stabilization. Note the similarity ofthe stabilization and destabilization curves for all analyses. This showsthat the latencies for which activity changed across 10 trials before aperceptual reversal were almost identical to the latencies for whichactivity changed across 10 trials after a perceptual reversal. Below, wereport the CVA evidence and source composition of each componentindividually.
Earliest difference, 40–90 msWe observed a peak at 40–90 ms. Based on averaged chi2 values,
the peak was close to significant for grating and general stabilization
Please cite this article as: Sandberg, K., et al., Distinct MEG correlates ofbinocular rivalry, NeuroImage (2014), http://dx.doi.org/10.1016/j.neuroim
(p = 0.06, corrected for multiple comparisons). However, at thesingle subject level the peak was significant for 3 of 8 participants(after Bonferroni correction) (the cumulative probability of observing3 significant results (at the p = 0.05 level, after correction) out of 8possible is p= 0.006) (Fig. 5B–C). As shown in Fig. 5B–C, this temporal-ly early peak was mainly explained by precentral/postcentral and pari-etal sources. Most notable compared to perception-specific activity wasthe involvement of parietal sources. Interestingly, this peakwas presentonly on trials following a reversal, thus indicating a role in the build-upof stabilization. Given the uncertainty about whether this componentshould be considered significant, we suggest that it is studied separately
conscious experience, perceptual reversals and stabilization duringage.2014.06.023
ORRECTED P
RO
OF
489
490
491
492
493
494
495
496
497
498
499
500
501
502
503
504
505
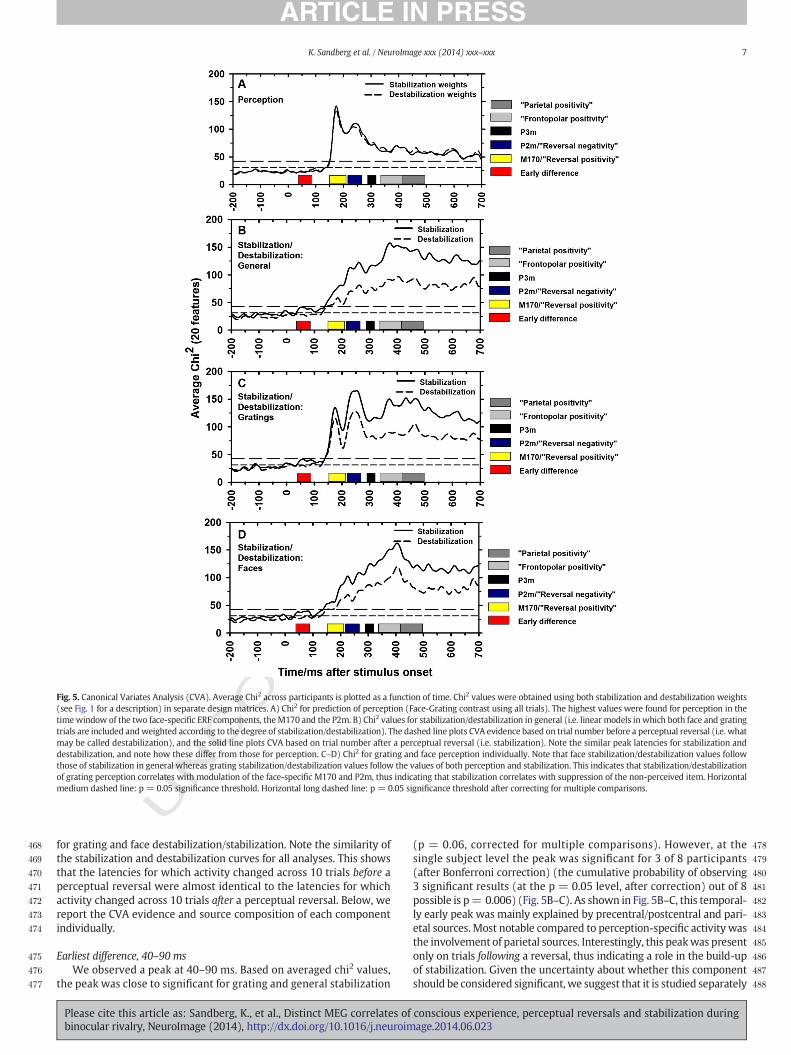
Fig. 6.Multivariate Bayesian (MVB) model probabilities. MVB model probabilities that a single cortical area explains the modulation of MEG activity as a function of perception (A) andstabilization (B–D) for all perception and stabilization-related components identified by CVA. Note that perception is primarily explained by extrastriate and to some extent temporalsources whereas parietal sources play a larger role in stabilization at the early components before 290 ms.
8 K. Sandberg et al. / NeuroImage xxx (2014) xxx–xxx
C
in experiments with more statistical power to ensure that it is not afalse positive.
N506
507
508
509
510
511
512
513
514
515
516
517
518
UM170/“reversal positivity” (RP), 150–210 msThis peak was significant for all stabilization and destabilization
conditions and peaked at the individual participant level at around170 ms (Fig. 5B–D). Note that a larger peak was observed for gratingstabilization/destabilization than for face stabilization and that thispeak followed the pattern of perception evidence. This could indicatethat the best correlate of stabilization at this latency was increasedsuppression of the non-perceived image (that is, stabilized grating per-ception correlated with suppression of the face-specific M170). As seenin Fig. 6, especially activity in occipital, temporal and parietal regionsexplained stabilization well at this component. Unlike at most othercomponents, the distribution of source probabilities at the M170/RPwas different for face and grating stabilization,with grating stabilization
Please cite this article as: Sandberg, K., et al., Distinct MEG correlates ofbinocular rivalry, NeuroImage (2014), http://dx.doi.org/10.1016/j.neuroim
primarily correlating with changes in occipital activity and face stabili-zation mainly correlating with changes in temporal lobe activity.
P2m/“reversal negativity” (RN), 220–270 msThis peak was observed for general/grating/face stabilization/
destabilization (Fig. 5B–D) and again the peak was larger for gratingthan face stabilization, possibly indicating increased suppression ofthe non-perceived image as a function of stabilization. As shown inFig. 6B–D, the main predictor of stabilization/destabilization aroundthis time was activity in occipital, temporal, and parietal areas. As forthe M170/RP, the distribution of source probabilities at the P2m/RNwas different for face and grating stabilization, with grating stabili-zation primarily correlating with changes in temporal and parietalactivity and face stabilization mainly correlating with changes in oc-cipital and temporal activity. These slightly different profiles for faceand grating stabilization, along with the timing of the components,
conscious experience, perceptual reversals and stabilization duringage.2014.06.023

T
519
520
521
522
523
524
525
526
527
528
529
530
531
532
533
534
535
536
537
538
539
540
541
542
543
544
545
546
547
548
549
550
551
552
553
554
555
556
557
558
559
560
561
562
563
564
565
566
567
568
569
570
571
572
573
574
575
576
577
578
579
580
581
582
583
584
9K. Sandberg et al. / NeuroImage xxx (2014) xxx–xxx
indicate that stabilization at the M170/RP and P2m/RN mainlycorrelates with modulation of perception-specific activity.
P3m and “frontopolar/parietal positivity” (FP/PP), 290–500 msThese three high latency components were significant for general/
grating/face stabilization/destabilization (Fig. 5B–D). Mainly temporaland precentral/postcentral sources were predictive (Fig. 6B–D). Theinvolvement of sensory/motor sources lends support to the earlier claimsthat these components are not directly related to the stabilization/reversal process.
SummaryWe found that the amplitude of the MEG signal across several
sources predicted the degree of stabilization (ranging from immediatelyafter a reversal to 10 trials after a reversal) and destabilization (rangingfrom immediately before a reversal to 10 trials before a reversal).Although a very early peak (40–90 ms) was observed for stabilization,the first highly significant peaks were observed around the time rangeof ERP components in previous studies contrasting reversal and stabilitytrials (the RP and the RN). These two peaks (M170/RP and P2m/RN)were observed at the timepointswhen activity predicted theperceptualcontent the best, thus indicating that some components related toreversals/stabilization are in factmodulation of percept-specific activity.However, we also identified involvement of parietal sources whichwere not observed when predicting perceptual content, and thesesources thus appeared primarily related to reversals/stabilization. Inthe section below, we analyze the temporal extent of each component(i.e. across how many trials before/after a reversal it is observed) inorder to separate the correlates of destabilization/stabilization fromthose of perceptual reversals.
Distinguishing reversal and stabilization related activity
In order to distinguish the correlates of stabilization/destabilizationfrom those of perceptual reversals, we examined the temporal extent
UNCO
RREC
Fig. 7. Examples of reversal and stabilization specific MVBmodel evidence distributions. Nine dare plotted in (A). The models differ in howmany trials before/after a perceptual reversal theyreversal and theweight 10 to any other trial. This model is thus expected to give high evidencetrial. The model 10+, in contrast, assigns different (increasing) weights to 10 trials followinggradually evolving stabilization trace is found. (B) Example of model probability when a comafter a reversal to all other trials, and model probability drops when more distinctions are increlated. Model probability is highest when a long stabilization trace of 10 trials is considered in
Please cite this article as: Sandberg, K., et al., Distinct MEG correlates ofbinocular rivalry, NeuroImage (2014), http://dx.doi.org/10.1016/j.neuroim
ED P
RO
OF
of the memory trace in the cortical areas primarily responsible for theeffects. If a component changes gradually across, for instance, 10 trialsleading up to a perceptual reversal, the best model would thus be onethat assigned monotonically increasing weights to each of the 10 trialsleading up to the reversal. The weights for one such possible modelcan be seen in Fig. 7A, labeled 10+/−, and the model probability forsuch amodel should thus be higher than for models taking into accountfewer trials when slowly developing stabilization trace is present(Fig. 7C). In contrast, if a component is involved primarily in the processof perceptual reversal (i.e. on the trial immediately before or afterthe reversal) the best model should simply assign a large weight(here 10) to trial 1 after (or before) a reversal and a much smaller(here 1) weight to all other trials. The weights for such a model can beseen in Fig. 7A, labeled 2+/−. If such a model were correct, includingmore trials would not improve the model and would result in aworse fit, thus leading to lower model probabilities for such models.An example of this is shown in Fig. 7B.
Stabilization/destabilization tracemodel evidencewas calculated forall models assigned probabilities of greater than 20% in the previousanalyses of general stabilizationmodels. The estimatedmodel probabil-ities of the stabilization/destabilization traces are reported in Fig. 8 bycomponent and source for general stabilization. However, as sourceprobabilities were different between face, grating, and generalstabilization for the M170/RP and the P2m/RN, additional tracemodel probabilities were calculated separately for face and gratingstabilization/destabilization for these components at the relevantsources. These results are presented in Fig. 9.
As seen in Figs. 8 and 9, the best model for trials following a reversalwas the 10+ model for most components/sources, corresponding to along, robust stabilization trace. Specifically, activity at occipital, temporaland parietal sources around the M170/RP (150–210 ms) and theP2m/RN (220–270ms) was stabilization related, but also parietal activ-ity at the early difference (40–90 ms) and late temporal (290–500 ms)and precentral/postcentral (290–320 ms) activity was stabilizationrelated. On trials following a reversal, there was no clear evidence for
ifferent linear models were tested for stabilization and destabilization. The model weightsconsider. The model 2+, for instance, assigns the weight 1 to the trial immediately after alevels for components where activity differs mainly between a reversal trial and any othera reversal and is thus expected to give high evidence levels at components for which aponent is reversal related. High model probability is obtained when comparing trial 1
luded in the model. (C) Example of model probability when a component is stabilizationthe model.
conscious experience, perceptual reversals and stabilization duringage.2014.06.023

UNCO
RRECTED P
RO
OF
585
586
587
588
589
590
591
592
593
594
595
596
597
598
599
600
Fig. 8.General reversal/(de)stabilizationmemory traceMVBmodel probabilities. For all components, stabilization/reversal tracemodel probabilities were estimated for sources obtaininghigher than 20%probability in the analysis reported in Fig. 6B.Note thatmodels taking into account a long stabilization trace (10 trials) typically had highprobabilities inoccipital/temporalareas whereas reversal related components were localized to activity in parietal sources immediately prior to a reversal (i.e. the 2− models were most probable).
10 K. Sandberg et al. / NeuroImage xxx (2014) xxx–xxx
reversal-related activity — only the 3+ model at parietal sites wasassigned a high probability, but this was not as high as the probabilityof the 10+model. On the trials leading up to a reversal, the 2− reversalmodel received the highest probability at parietal sites for theM170/RPand the P2m/RN and at temporal sites for the M170/RP. In contrast,activity at occipital sites around the M170/RP and the P2m/RN wasdestabilization-related, as was activity at temporal sites for theP2m/RN, the P3 and the FP.
Please cite this article as: Sandberg, K., et al., Distinct MEG correlates ofbinocular rivalry, NeuroImage (2014), http://dx.doi.org/10.1016/j.neuroim
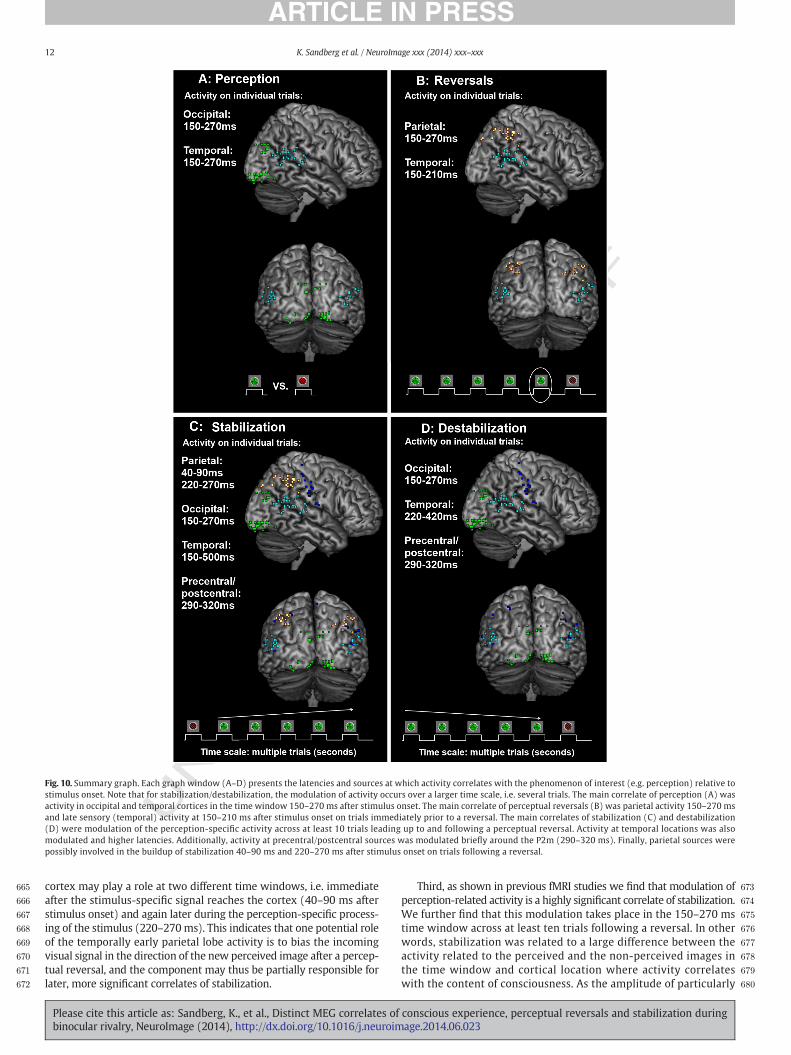
The results are summarized in Fig. 10. Taken together, the resultsshow that there is great overlap in the components and sourcesinvolved in conscious perception and destabilization, both involvingsensory sources early as well as late in the visual hierarchy. In contrast,only activity at parietal and late sensory (temporal) sources predictedthe occurrence of perceptual reversals. The temporally very earlypredictor of perceptual reversals (i.e. destabilization, observed severaltrials before a reversal) is thus changes in the activity related to
conscious experience, perceptual reversals and stabilization duringage.2014.06.023
TD P
RO
OF
601
602
603
604
605
606
607
608
609
610
611
612
613
614
615
616
617
618
619
620
621
622
623
624
625
626
627
628
629
630
631
632
633
634
635
636
637
638
639
640
641
642
643
644
645
646
647
648
649
650
651
652
653
654
655
656
657
658
659
660
661
662
663
664
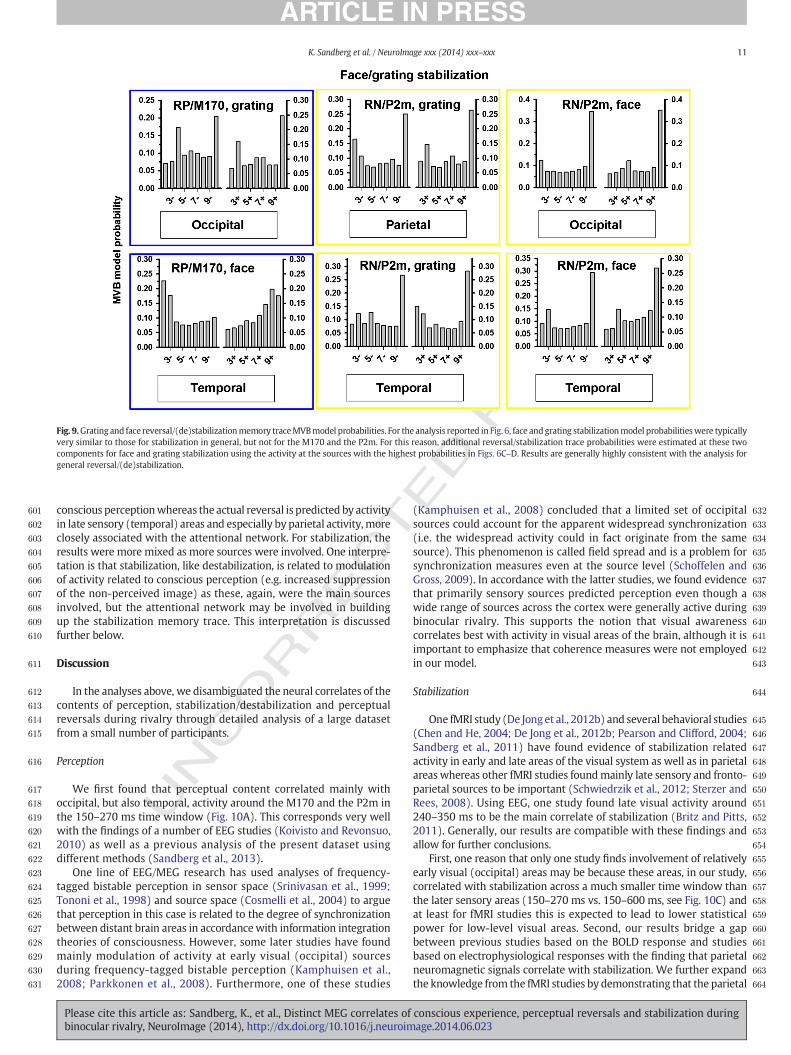
Fig. 9.Grating and face reversal/(de)stabilizationmemory traceMVBmodel probabilities. For the analysis reported in Fig. 6, face andgrating stabilizationmodel probabilitieswere typicallyvery similar to those for stabilization in general, but not for the M170 and the P2m. For this reason, additional reversal/stabilization trace probabilities were estimated at these twocomponents for face and grating stabilization using the activity at the sources with the highest probabilities in Figs. 6C–D. Results are generally highly consistent with the analysis forgeneral reversal/(de)stabilization.
11K. Sandberg et al. / NeuroImage xxx (2014) xxx–xxx
UNCO
RREC
conscious perceptionwhereas the actual reversal is predicted by activityin late sensory (temporal) areas and especially by parietal activity, moreclosely associated with the attentional network. For stabilization, theresults were more mixed as more sources were involved. One interpre-tation is that stabilization, like destabilization, is related to modulationof activity related to conscious perception (e.g. increased suppressionof the non-perceived image) as these, again, were the main sourcesinvolved, but the attentional network may be involved in buildingup the stabilization memory trace. This interpretation is discussedfurther below.
Discussion
In the analyses above, we disambiguated the neural correlates of thecontents of perception, stabilization/destabilization and perceptualreversals during rivalry through detailed analysis of a large datasetfrom a small number of participants.
Perception
We first found that perceptual content correlated mainly withoccipital, but also temporal, activity around the M170 and the P2m inthe 150–270 ms time window (Fig. 10A). This corresponds very wellwith the findings of a number of EEG studies (Koivisto and Revonsuo,2010) as well as a previous analysis of the present dataset usingdifferent methods (Sandberg et al., 2013).
One line of EEG/MEG research has used analyses of frequency-tagged bistable perception in sensor space (Srinivasan et al., 1999;Tononi et al., 1998) and source space (Cosmelli et al., 2004) to arguethat perception in this case is related to the degree of synchronizationbetween distant brain areas in accordance with information integrationtheories of consciousness. However, some later studies have foundmainly modulation of activity at early visual (occipital) sourcesduring frequency-tagged bistable perception (Kamphuisen et al.,2008; Parkkonen et al., 2008). Furthermore, one of these studies
Please cite this article as: Sandberg, K., et al., Distinct MEG correlates ofbinocular rivalry, NeuroImage (2014), http://dx.doi.org/10.1016/j.neuroim
E(Kamphuisen et al., 2008) concluded that a limited set of occipitalsources could account for the apparent widespread synchronization(i.e. the widespread activity could in fact originate from the samesource). This phenomenon is called field spread and is a problem forsynchronization measures even at the source level (Schoffelen andGross, 2009). In accordance with the latter studies, we found evidencethat primarily sensory sources predicted perception even though awide range of sources across the cortex were generally active duringbinocular rivalry. This supports the notion that visual awarenesscorrelates best with activity in visual areas of the brain, although it isimportant to emphasize that coherence measures were not employedin our model.
Stabilization
One fMRI study (De Jong et al., 2012b) and several behavioral studies(Chen and He, 2004; De Jong et al., 2012b; Pearson and Clifford, 2004;Sandberg et al., 2011) have found evidence of stabilization relatedactivity in early and late areas of the visual system as well as in parietalareas whereas other fMRI studies foundmainly late sensory and fronto-parietal sources to be important (Schwiedrzik et al., 2012; Sterzer andRees, 2008). Using EEG, one study found late visual activity around240–350 ms to be the main correlate of stabilization (Britz and Pitts,2011). Generally, our results are compatible with these findings andallow for further conclusions.
First, one reason that only one study finds involvement of relativelyearly visual (occipital) areas may be because these areas, in our study,correlated with stabilization across a much smaller time window thanthe later sensory areas (150–270 ms vs. 150–600 ms, see Fig. 10C) andat least for fMRI studies this is expected to lead to lower statisticalpower for low-level visual areas. Second, our results bridge a gapbetween previous studies based on the BOLD response and studiesbased on electrophysiological responses with the finding that parietalneuromagnetic signals correlate with stabilization. We further expandthe knowledge from the fMRI studies by demonstrating that the parietal
conscious experience, perceptual reversals and stabilization duringage.2014.06.023
UNCO
RRECTED P
RO
OF
665
666
667
668
669
670
671
672
673
674
675
676
677
678
679
680
Fig. 10. Summary graph. Each graph window (A–D) presents the latencies and sources at which activity correlates with the phenomenon of interest (e.g. perception) relative tostimulus onset. Note that for stabilization/destabilization, the modulation of activity occurs over a larger time scale, i.e. several trials. The main correlate of perception (A) wasactivity in occipital and temporal cortices in the time window 150–270 ms after stimulus onset. The main correlate of perceptual reversals (B) was parietal activity 150–270 msand late sensory (temporal) activity at 150–210 ms after stimulus onset on trials immediately prior to a reversal. The main correlates of stabilization (C) and destabilization(D) were modulation of the perception-specific activity across at least 10 trials leading up to and following a perceptual reversal. Activity at temporal locations was alsomodulated and higher latencies. Additionally, activity at precentral/postcentral sources was modulated briefly around the P2m (290–320 ms). Finally, parietal sources werepossibly involved in the buildup of stabilization 40–90 ms and 220–270 ms after stimulus onset on trials following a reversal.
12 K. Sandberg et al. / NeuroImage xxx (2014) xxx–xxx
cortex may play a role at two different time windows, i.e. immediateafter the stimulus-specific signal reaches the cortex (40–90 ms afterstimulus onset) and again later during the perception-specific process-ing of the stimulus (220–270ms). This indicates that one potential roleof the temporally early parietal lobe activity is to bias the incomingvisual signal in the direction of the new perceived image after a percep-tual reversal, and the component may thus be partially responsible forlater, more significant correlates of stabilization.
Please cite this article as: Sandberg, K., et al., Distinct MEG correlates ofbinocular rivalry, NeuroImage (2014), http://dx.doi.org/10.1016/j.neuroim
Third, as shown in previous fMRI studies we find that modulation ofperception-related activity is a highly significant correlate of stabilization.We further find that this modulation takes place in the 150–270 mstime window across at least ten trials following a reversal. In otherwords, stabilization was related to a large difference between theactivity related to the perceived and the non-perceived images inthe time window and cortical location where activity correlateswith the content of consciousness. As the amplitude of particularly
conscious experience, perceptual reversals and stabilization duringage.2014.06.023
T
F
681
682
683
684
685
686
687
688
689
690
691
692
693
694
695
696
697
698
699
700
701
702
703
704
705
706
707
708
709
710
711
712
713
714
715
716
717
718
719
720
721
722
723
724
725
726
727
728
729
730
731
732
733
734
735
736
737
738
739
740
741
742
743
744
745
746
747
748
749
750
751
752
753
754
755
756
757
758
759
760
761
762
763
764
765
766
767
768
769
770
771
772
773
774
775
776
777
778
779
780
781
782
783
784
785
786
787
788
789
790
791
792
793
794
795
796
797
798
799
800
801
802
803
804
805
806
807
13K. Sandberg et al. / NeuroImage xxx (2014) xxx–xxx
UNCO
RREC
the face-specific M170 was much lower for stable than unstablegratings (Grating 1 vs. Grating 10, see Fig. 4B) and as evidence for grat-ing stabilization was higher than for face stabilization at this compo-nent, a main correlate of stabilization could be increased suppressionof activity related to the non-perceived image. In other words, an in-crease in stabilization of grating perception led to a reduction of theamplitude of a component typically found to be related to the non-perceived image category. However, not only suppression of thenon-perceived image but also increased activity related to the per-ceived image appeared to be related to stabilization. Both these find-ings are consistent with a recent behavioural study (De Jong et al.,2012a) demonstrating that exposure to one of two rivalling stimuliprior to rivalry leads to an immediate positive bias towards the pre-viously perceived stimulus at the onset of rivalry (thus indicating afacilitating effect), but also to a subsequent, longer-lasting increasein duration of perception of the alternative stimulus. Changes inthe inhibitory capacity of the previously presented stimulus seemthe most straightforward explanation for this change in dominanceduration of the alternative stimulus as this was modulated withoutthe stimulus having been shown previously although it should benoted that this is an interpretation as MEG does not provide a directmeasure of inhibition. In our experiment, we thus interpret thebuild-up of stabilization to be related to a build-up of modulationof consciousness-specific activity (inhibition and/or facilitation)that was “remembered” and increased from trial to trial in visualareas, possibly assisted by parietal activity.
The interpretation of stabilization as related to gradually increasinginhibition of activity related to the non-perceived image fits well withthe recent proposal by Klink et al. (2010) of the involvement of ananti-Hebbian learning mechanism for inhibitory synapses in binocularvision. In this framework, the interocular inhibition during binocularrivalry is remembered across a period of stimulus removal (even whendifferent stimuli are displayed if these do not activate the same cells).In the intermittent presentation paradigm, the blank intervals wouldthus not interfere with the strength and direction of the inhibition, butwould nevertheless decrease adaptation, thus reducing the probabilityof perceptual instability and allowing for further build-up of theinhibitory connection strength on the following trial.
Finally, we found that the sources we labelled as precentral/postcentral correlated with stabilization 290–320 ms after stimulusonset, and possibly also already 40–90 ms after stimulus onset. Thiscould be taken as evidence of a correlation between stabilizationand sensory/motor activity, however other interpretations are alsopossible. One alternative explanation could be that we are in factmeasuring an insula response as this area was included in themodel, and at least one fMRI study has found the insula to beinvolved in stabilization (Schwiedrzik et al., 2012). We suggest thatparticularly the temporally early component is studied separatelyin experiments with more statistical power.
Destabilization
Interestingly, the main correlate of destabilization was changes inperception-specific activity at occipital sources around 150–270 ms aswell as at 220–270 ms and slightly higher latencies at temporal sources(Fig. 10D). This finding is consistent with the claim that adaptation ofthe neurons responsible for inhibiting the suppressed image culminatesin perceptual reversals as explained above (Noest et al., 2007; Wilson,2007). In otherwords,we interpret thefindings of a long destabilizationtrace as an indication of a slow build-up of adaptation of the neuronsresponsible for suppressing the activity related to the non-perceivedimage. As temporal sources were involved during a shorter timewindow for destabilization than for stabilization, the data are alsolargely consistent with one fMRI experiment finding that adaptationleads to reversals and that the adaptation process primarily occurs inareas of the occipital lobe, i.e. in the early parts of the cortical visual
Please cite this article as: Sandberg, K., et al., Distinct MEG correlates ofbinocular rivalry, NeuroImage (2014), http://dx.doi.org/10.1016/j.neuroim
system (Schwiedrzik et al., 2012). In further agreement with thatfMRI study, we found no involvement of parietal sources.
Generally, our data are thus consistent with the notion that whileadaptation is slowed by the blank interval, it is nevertheless notprevented entirely, and a gradual build-up of adaptation will lead to agradual removal of inhibition of the suppressed image. Changes in thestimulus-specific activity in the 150–270 time window across manytrials was thus in principle a much earlier predictor of perceptualreversals compared to the parietal activity observed only on trialsimmediately prior to a reversal (see below). We expand upon theprevious fMRI experiment by providing the temporal details of thecorrelates of stabilization/destabilization, both in terms of the latency(relative to stimulus onset) of components related to stabilization, butalso the general extent of the destabilization trace across trials, whichhas not been examined previously.
ED P
RO
OReversals
In apparent contrast to the models predicting destabilizationare findings of fronto-parietal activity during perceptual reversals(Lumer et al., 1998; Sterzer and Kleinschmidt, 2007). Such activitymay, however, be more closely related to our findings of activitychanges on trials immediately before a reversal.
We identified parietal lobe activity at around 150–270 ms afterstimulus onset and temporal lobe activity 150–210 ms after stimulusonset on trials immediately prior to a perceptual reversal (Fig. 10B).This activity corresponded well with the so-called Reversal Positivity(Kornmeier and Bach, 2005, 2012) although the latency was slightlydelayed compared to some studies, but seemed to fit with a responsereported by Pitts et al. (2007) for reversals for Rubin’s vase andSchröder’s staircase as well as with a temporal lobe response alsofound to be predictive at 180 ms on the trial prior to a reversal(O’Shea et al., 2013). In order to resolve the apparent conflict betweentheories emphasizing a role of visual areas and theories emphasizing arole of fronto-parietal areas, one fMRI study (Knapen et al., 2011) hasclaimed that parietal/prefrontal activity around reversals of perceptionduring continuous rivalry is a consequence of an ongoing reversal andnot a cause of it as it is present during exposure to monocular displaysof mixed perception and appears during transitions of continuousbinocular rivalry. Nevertheless, some experimental findings argueagainst this interpretation and suggest a causal role for frontal andparietal activity. For example, De Graaf et al. (2011) used TMS todemonstrate a causal role of the frontal cortex specifically for voluntaryreversals whereas Carmel et al. (2010) and Kanai et al. (2010, 2011)demonstrate that at least two parietal sites play a causal role inreversals of ambiguous perception. Our parietal model included areasvery close to the peak coordinates reported by these previous studies.Additionally, we have previously shown (Sandberg et al., 2013) thatreaction times when reporting conscious experience during inter-mittent BR decrease as a function of stabilization across at least 10trials before and after a reversal whereas this is not the case whenthe participant experiences a series of mixed perception. This indi-cates that perceptual clarity increases across at least 10 trials aftera reversal, but parietal activity is only present immediately beforeand after a reversal. Based on our findings, parietal activity thusappears more closely tied to reversals of perception than to unclearor mixed perception in general.
Overall, our findings may thus be interpreted as support for causalroles for both visual and parietal areas, and in fact, there seems to belittle reason that these two explanations should be mutually exclusive.By plotting the long-term development of the destabilization trace,it seems clear that changes in extrastriate visual cortex activity is theearliest predictor of a perceptual reversal, yet the reversal occurs onlyon the trial at which parietal and late visual (i.e. temporal lobe) sourcesbecome active.
conscious experience, perceptual reversals and stabilization duringage.2014.06.023
T
808
809
810
811Q2
812
813
814
815
816
817
818
819
820
821
822
823
824
825
826
827
828
829
830
831
832
833
834
835
836
837
838
839
840
841
842
843
844
845
846
847
848
849
850
851
852
853
854
855
856
857
858
859
860
861
862
863
864
865
866
867
868
869
870
871
872
873
874
875
876
877
878
879
880
881
882
883
884
885
886
887
888
889
890
891
892
893
894
895
896
897
898
899
900
901
902
903
904
905
906
907
908
909
910
911
912
913
914
915
916
917
918
919
920
921
922
923
924
925
926
927
928
929
930
931
932
933
934
935
936
937
938
14 K. Sandberg et al. / NeuroImage xxx (2014) xxx–xxx
UNCO
RREC
General considerations
One approach that seems able to accommodate our findings isthe predictive coding framework. In one predictive coding model ofbinocular rivalry (Hohwy, 2008) late sensory areas predict the activ-ity of lower areas based on a hypothesis of what is being perceived.On the trials leading up to a reversal, destabilization leads to a weak-er suppression of the activity related to the non-perceived image,which in turns leads to a larger prediction error. The prediction,for instance, that a grating is present in the stimulated area of thevisual field fails to account for an increasing amount of face-specific activity, and eventually the hypothesis must be updatedand a reversal initiated.
It should be noted that the present study focused only on activitybelow 30 Hz. This cutoff was chosen because a previous analysis of thedata revealed that gamma band activity (above 30 Hz) did not predictconscious contentmuch above chance (Sandberg et al., 2013). However,more detailed analyses of high frequency activity is still needed todetermine the exact role of this activity for conscious perception,stabilization, and reversals.
A long destabilization process as separate from restabilization/disambiguation has been suggested previously by Kornmeier and Bach(2012), who argue that it may start as early as immediately followinga reversal. Although they predict that this destabilization process shoulddevelop across seconds or even minutes, previous evidence have foundmainly parietal activity as a predictor of reversals up to around 1 s priorto report (in the continuous case) or 1 s prior to the onset of the trial onwhich a new percept is reported (in the intermittent case). This issomewhat surprising as it would be expected that destabilization islinked to, for instance, adaptation, would be detectable mainly inperceptual areas of the occipital/temporal lobes. Our study providesthe first clear neuroscientific evidence of a long-term destabilizationtrace, and this trace is indeed linked to activity changes in occipital/temporal areas. Parietal activity, such as that found prior to reversalsin other studies, appears exclusively on the trial immediately to a rever-sal in our study, and we thus link it more closely to the disambiguation/reversal process than to the long-term destabilization. It could eitherreflect reversal-related processes directly or simply be a marker ofmaximal instability as suggested by Kornmeier and Bach (2012).
It should further be noted that we have compared our findings toother studies of bistable perception, but as noted, not all of these haveused binocular rivalry — some have used ambiguous figures. These dif-ferent cases of bistable (or multistable) perception have many aspectsin common, but there are also some differences. For instance, the sup-pression during intermittent binocular rivalry is mainly eye specific(Chen and He, 2004; Pearson and Clifford, 2004; Sandberg et al., 2011)whereas this cannot be the case for ambiguous figures. We thereforeemphasize that some of the observed differences between studiescould also be attributed to slightly different mechanisms involved.
In the discussion of our findings, we have compared the results tothose of studies of continuous presentations of ambiguous stimuli, andalthough there appears to be great overlap in the areas involved, itmay reasonably be questioned whether the mechanisms are the same.Indeed, different mechanisms have been proposed to account for thetwo phenomena (Noest et al., 2007). Nevertheless, it is important toremember that reversal rates are modulated non-monotonically as afunction of inter-stimulus interval (ISI) and that so-called continuouspresentation is in fact typically a case of intermittent presentationwith a very short ISI (dependent on the frequency of the display cycleand luminance changes across the cycle). For these reasons, it may beentirely possible that the behavioral changes caused by gradual increasein ISI may be accounted for not by the appearance of the “extramechanism” needed to account for the intermittent case (whether itbe increased excitability of the dominant neurons (Wilson, 2007),increased subthreshold elevation of baseline activity for the dominantneurons (Noest et al., 2007), or anti-Hebbian learning), but by a
Please cite this article as: Sandberg, K., et al., Distinct MEG correlates ofbinocular rivalry, NeuroImage (2014), http://dx.doi.org/10.1016/j.neuroim
ED P
RO
OF
relatively larger impact of this mechanism due to the slower increaseof adaptation. If this is true, the intermittent paradigm allows for thestudy of both mechanisms whereas the non-adaptation mechanism isdifficult to study in the continuous case.
Our results may also be compared to those using a slightly differentparadigm, first used by Kaernbach and colleagues (Kaernbach et al.,1999). Here, one of the rivalling stimuli is replaced by a stimulusidentical to the other stimulus (thus abolishing rivalry and insteadresulting in fused perception). When the suppressed image isreplaced, no change in awareness is expected (as the participant isalready perceiving the image now presented to both eyes), butwhen the dominant image is replaced, awareness changes to thenew fused percept. This allows for study of exogenous changes ofawareness during continuous viewing, but time-locked to an event,thus allowing for analyses of event-related responses. Since the per-ceptual reversal is exogenous, larger similarity to percept specific(rather than reversal specific activity) is to be expected. The activitydifferences obtained using this paradigm (Roeber et al., 2008, 2011)are somewhat similar to those observed for intermittent rivalry withevidence of an occipital difference around the P1 found in somerivalry studies (e.g. Pitts et al., 2007) as well as differences around180 ms and from 250 ms and onwards. The main difference appearsto be consistent modulation of the P1 component, which is typicallynot found to be a consistent predictor of awareness (Sandberg et al.,2013). One explanation for this difference could be that changes inperception are linked to a new stimulus being presented to thedominant eye whereas no change is linked to presentation of a stim-ulus to the suppressed eye. Presentation to the suppressed eye maycause a slight suppression of all stimulus processing, even temporal-ly very early components that could be precursors for awarenesswithout being directly linked.
Some studies have indicated a larger role of the right hemisphere inperceptual reversals (Britz et al., 2009; Ehm et al., 2011) whereas otherstudies have found evidence for the involvement of both left and righthemispheres (Britz and Pitts, 2011; Kanai et al., 2010), and one studyprimarily found evidence for left hemisphere activity being predictive(O’Shea et al., 2013). In our study, therewas a tendency for hemisphericlateralization towards the right in the raw data, and indeed a previousanalysis of the data showed that right hemisphere sensors were gener-ally slightly more predictive of perceptual content (Sandberg et al.,2013). However, the strength of our current multivariate approachis that it combines information from many features (sources in ourcase), and reducing the number of features to one half would causethe individual models to be composed of a critically low number ofsources (below 15, see for instance Sandberg et al. (2013) and Haynesand Rees (2005)).We propose that the question of hemispheric lateral-ization as well as inter-hemispheric communication is addressed infuture studies, possibly using dynamic causal modelling (DCM) as theanalysis paradigm. Such a paradigm could also be used to examine therole of different areas within one of our general areas. For instance,it would be interesting to examine if the proposed different functionsof the posterior and anterior parts of the superior parietal lobule(Kanai et al., 2011) could be related to the involvement in bothstabilization and perceptual reversals.
In summary, we studied the neural correlates of perceptual content,stability of perception and reversals of perception for the first timein a single experiment. We also examined, for the first time, thechanges in neural activity across around 15 s during the build-up ofstabilization of binocular rivalry as well as the gradual decay of stabi-lization (i.e. destabilization) and discovered that the temporal devel-opment of these two processes was almost identical. We interpretthe findings mechanistically as indicating that the human brainmaintains stability of perception by suppressing competing interpre-tations and that gradual adaptation of the inhibiting cells leads toa state of instability that is eventually resolved by parietal andlate-stage visual (temporal) sources.
conscious experience, perceptual reversals and stabilization duringage.2014.06.023

T
939
940
941
942
943
944
94594694794894995095195295395495595695795895996096196296396496596696796896997097197297397497597697797897998098198298398498598698798898999099199299399499599699799899910001001100210031004Q31005100610071008100910101011101210131014
101510161017101810191020102110221023102410251026102710281029103010311032Q4103310341035103610371038103910401041104210431044104510461047104810491050105110521053105410551056105710581059106010611062106310641065Q510661067106810691070Q610711072107310741075107610771078107910801081108210831084108510861087108810891090109110921093109410951096
15K. Sandberg et al. / NeuroImage xxx (2014) xxx–xxx
UNCO
RREC
Acknowledgements
This work was supported by theWellcome Trust (GR and GRB), theJapan Society for the Promotion of Science (RK), the European ResearchCouncil (BB, KS and MO) and the MRC UK MEG Partnership Grant,MR/K005464/1.
References
Blake, R., Logothetis, N.K., 2002. Visual competition. Nat. Rev. Neurosci. 3, 13–21.Blake, R., Wilson, H., 2011. Binocular vision. Vis. Res. 51, 754–770.Breese, B.B., 1899. On inhibition. Psychol. Monogr. 3, 1–65.Britz, J., Pitts, M.A., 2011. Perceptual reversals during binocular rivalry: ERP components
and their concomitant source differences. Psychophysiology 48, 1490–1499.Britz, J., Landis, T., Michel, C.M., 2009. Right parietal brain activity precedes perceptual
alternation of bistable stimuli. Cereb. Cortex 19, 55–65.Britz, J., Pitts, M.A., Michel, C.M., 2011. Right parietal brain activity precedes perceptual
alternation during binocular rivalry. Hum. Brain Mapp. 32, 1432–1442.Busch, N.A., Fründ, I., Herrmann, C.S., 2010. Electrophysiological evidence for different
types of change detection and change blindness. J. Cogn. Neurosci. 22, 1852–1869.Carmel, D., Walsh, V., Lavie, N., Rees, G., 2010. Right parietal TMS shortens dominance
durations in binocular rivalry. Curr. Biol. 20, R799–R800.Carter, O., Cavanagh, P., 2007. Onset rivalry: Brief presentation isolates an early
independent phase of perceptual competition. PLoS ONE 2, e343.Chatfield, C., Collins, A.J., 1980. Introduction to multivariate analysis. Chapman and Hall.Chen, X., He, S., 2004. Local factors determine the stabilization of monocular ambiguous
and binocular rivalry stimuli. Curr. Biol. 14, 1013–1017.Cosmelli, D., David, O., Lachaux, J.-P., Martinerie, J., Garnero, L., Renault, B., Varela, F., 2004.
Waves of consciousness: Ongoing cortical patterns during binocular rivalry.NeuroImage 23, 128–140.
De Graaf, T.A., de Jong, M.C., Goebel, R., van Ee, R., Sack, A.T., 2011. On the functionalrelevance of frontal cortex for passive and voluntarily controlled bistable vision.Cereb. Cortex 21, 2322–2331.
De Jong, M.C., Knapen, T., van Ee, R., 2012a. Opposite influence of perceptual memory oninitial and prolonged perception of sensory ambiguity. PLoS ONE 7, e30595.
De Jong, M.C., Kourtzi, Z., van Ee, R., 2012b. Perceptual experience modulates corticalcircuits involved in visual awareness. Eur. J. Neurosci. 36, 3718–3731.
Dehaene, S., Kerszberg, M., Changeux, J.P., 1998. A neuronal model of a global workspacein effortful cognitive tasks. Proc. Natl. Acad. Sci. U. S. A. 95, 14529–14534.
Dehaene, S., Changeux, J.-P., Naccache, L., Sackur, J., Sergent, C., 2006. Conscious,preconscious, and subliminal processing: A testable taxonomy. Trends Cogn.Sci. 10, 204–211.
Ehm, W., Bach, M., Kornmeier, J., 2011. Ambiguous figures and binding: EEG frequencymodulations during multistable perception. Psychophysiology 48, 547–558.
Fahrenfort, J.J., Scholte, H.S., Lamme, V.A.F., 2007. Masking disrupts reentrant processingin human visual cortex. J. Cogn. Neurosci. 19, 1488–1497.
Friston, K., Mattout, J., Trujillo-Barreto, N., Ashburner, J., Penny, W., 2007. Variational freeenergy and the Laplace approximation. NeuroImage 34, 220–234.
Friston, K.J., Chu, C., Mourão-Miranda, J., Hulme, O., Rees, G., Penny, W., Ashburner, J.,2008a. Bayesian decoding of brain images. NeuroImage 39, 181–205.
Friston, K.J., Harrison, L., Daunizeau, J., Kiebel, S., Phillips, C., Trujillo-Barreto, N., Henson, R., Flandin, G., Mattout, J., 2008b. Multiple sparse priors for theM/EEG inverse problem.NeuroImage 39, 1104–1120.
Haynes, J.-D., Rees, G., 2005. Predicting the stream of consciousness from activity inhuman visual cortex. Curr. Biol. 15, 1301–1307.
Isoglu-Alkaç, U., Basar-Eroglu, C., Ademoglu, A., Demiralp, T., Miener, M., Stadler, M.,2000. Alpha activity decreases during the perception of Necker cube reversals: Anapplication of wavelet transform. Biol. Cybern. 82, 313–320.
Kaernbach, C., Schröger, E., Jacobsen, T., Roeber, U., 1999. Effects of consciousness onhuman brain waves following binocular rivalry. Neuroreport 10, 713–716.
Kamphuisen, A., Bauer, M., van Ee, R., 2008. No evidence for widespread synchronizednetworks in binocular rivalry: MEG frequency tagging entrains primarily early visualcortex. J. Vis. 8, 4.1–4.8.
Kanai, R., Bahrami, B., Rees, G., 2010. Human parietal cortex structure predicts individualdifferences in perceptual rivalry. Curr. Biol. 20, 1626–1630.
Kanai, R., Carmel, D., Bahrami, B., Rees, G., 2011. Structural and functional fractionation ofright superior parietal cortex in bistable perception. Curr. Biol. 21, R106–R107.
Kappenman, E.S., Luck, S.J., 2010. The effects of electrode impedance on data quality andstatistical significance in ERP recordings. Psychophysiology.
Klink, P.C., Brascamp, J.W., Blake, R., van Wezel, R.J.A., 2010. Experience-driven plasticityin binocular vision. Curr. Biol. 20, 1464–1469.
Knapen, T., Brascamp, J., Pearson, J., van Ee, R., Blake, R., 2011. The role of frontal andparietal brain areas in bistable perception. J. Neurosci. 31, 10293–10301.
Koivisto, M., 2005. Independence of visual awareness from the scope of attention:An electrophysiological study. Cereb. Cortex 16, 415–424.
Koivisto, M., Revonsuo, A., 2010. Event-related brain potential correlates of visualawareness. Neurosci. Biobehav. Rev. 34, 922–934.
Kornmeier, J., Bach, M., 2004. Early neural activity in Necker-cube reversal: Evidence forlow-level processing of a gestalt phenomenon. Psychophysiology 41, 1–8.
Please cite this article as: Sandberg, K., et al., Distinct MEG correlates ofbinocular rivalry, NeuroImage (2014), http://dx.doi.org/10.1016/j.neuroim
ED P
RO
OF
Kornmeier, J., Bach, M., 2005. The Necker cube—An ambiguous figure disambiguated inearly visual processing. Vis. Res. 45, 955–960.
Kornmeier, J., Bach, M., 2006. Bistable perception — Along the processing chain fromambiguous visual input to a stable percept. Int. J. Psychophysiol. 62, 345–349.
Kornmeier, J., Bach, M., 2012. Ambiguous figures — What happens in the brain whenperception changes but not the stimulus. Front. Hum. Neurosci. 6, 51.
Kornmeier, J., Pfäffle, M., Bach, M., 2011. Necker cube: Stimulus-related (low-level) andpercept-related (high-level) EEG signatures early in occipital cortex. J. Vis. 11, 12.
Leopold, D.A., Wilke, M., Maier, A., Logothetis, N.K., 2002. Stable perception of visuallyambiguous patterns. Nat. Neurosci. 5, 605–609.
Litvak, V., Friston, K., 2008. Electromagnetic source reconstruction for group studies.NeuroImage 42, 1490–1498.
Liu, Y., Paradis, A.-L., Yahia-Cherif, L., Tallon-Baudry, C., 2012. Activity in the lateraloccipital cortex between 200 and 300 ms distinguishes between physically identicalseen and unseen stimuli. Front. Hum. Neurosci. 6, 211.
Lumer, E.D., Friston, K.J., Rees, G., 1998. Neural correlates of perceptual rivalry in thehuman brain. Science 280, 1930–1934.
Noest, van Ee, R., Nijs, M.M., van Wezel, R.J., 2007. Percept-choice sequences driven byinterrupted ambiguous stimuli: A low-level neural model. JOV 7, 1–14.
Nolte, G., 2003. The magnetic lead field theorem in the quasi-static approximation and itsuse for magnetoencephalography forward calculation in realistic volume conductors.Phys. Med. Biol. 48, 3637–3652.
O’Donnell, B.F., Hendler, T., Squires, N.K., 1988. Visual evoked potentials to illusoryreversals of the Necker cube. Psychophysiology 25, 137–143.
O’Shea, R.P., Crassini, B., 1984. Binocular rivalry occurs without simultaneous presentationof rival stimuli. Percept. Psychophys. 36, 266–276.
O’Shea, R.P., Kornmeier, J., Roeber, U., 2013. Predicting visual consciousness electrophys-iologically from intermittent binocular rivalry. PLoS ONE 8, e76134.
Orbach, J., Ehrlich, D., Heath, H., 1963. Reversibility of the Necker cube: I. An examinationof the concept of “satiation of orientation”. Percept. Mot. Skills 17, 439–458.
Parkkonen, L., Andersson, J., Hämäläinen, M., Hari, R., 2008. Early visual brain areas reflectthe percept of an ambiguous scene. Proc. Natl. Acad. Sci. U. S. A. 105, 20500–20504.
Pearson, J., Brascamp, J.W., 2008. Sensorymemory for ambiguous vision. Trends Cogn. Sci.12, 334–341.
Pearson, J., Clifford, C., 2004. Determinants of visual awareness following interruptionsduring rivalry. J. Vis. 4, 196–202.
Pitts, M.A., Nerger, J.L., Davis, T.J.R., 2007. Electrophysiological correlates of perceptualreversals for three different types of multistable images. J. Vis. 7, 6.
Pitts, M.A., Martínez, A., Stalmaster, C., Nerger, J.L., Hillyard, S.A., 2009. Neural generatorsof ERPs linked with Necker cube reversals. Psychophysiology 46, 694–702.
Roeber, U., Widmann, A., Trujillo-Barreto, N.J., Herrmann, C.S., O’Shea, R.P., Schröger, E.,2008. Early correlates of visual awareness in the human brain: Time and place fromevent-related brain potentials. J. Vis. 8, 21.1–21.12.
Roeber, U., Veser, S., Schröger, E., O’Shea, R.P., 2011. On the role of attention in binocularrivalry: Electrophysiological evidence. PLoS ONE 6, e22612.
Sandberg, K., Bahrami, B., Lindelov, J.K., Overgaard, M., Rees, G., 2011. The impact ofstimulus complexity and frequency swapping on stabilization of binocular rivalry.J. Vis. 11, 1–10.
Sandberg, K., Bahrami, B., Kanai, R., Barnes, G.R., Overgaard, M., Rees, G., 2013. Early visualresponses predict conscious face perception within and between subjects duringbinocular rivalry. J. Cogn. Neurosci.
Schoffelen, J.-M., Gross, J., 2009. Source connectivity analysis with MEG and EEG. Hum.Brain Mapp. 30, 1857–1865.
Schwiedrzik, C.M., Ruff, C.C., Lazar, A., Leitner, F.C., Singer,W., Melloni, L., 2012. Untanglingperceptual memory: Hysteresis and adaptation map into separate cortical networks.Cereb. Cortex.
Sergent, C., Dehaene, S., 2004. Neural processes underlying conscious perception:Experimental findings and a global neuronal workspace framework. J. Physiol. Paris98, 374–384.
Sergent, C., Baillet, S., Dehaene, S., 2005. Timing of the brain events underlying access toconsciousness during the attentional blink. Nat. Neurosci. 8, 1391–1400.
Srinivasan, R., Russell, D.P., Edelman, G.M., Tononi, G., 1999. Increased synchronizationof neuromagnetic responses during conscious perception. J. Neurosci. Off. J. Soc.Neurosci. 19, 5435–5448.
Stephan, K.E., Penny, W.D., Daunizeau, J., Moran, R.J., Friston, K.J., 2009. Bayesian modelselection for group studies. NeuroImage 46, 1004–1017.
Sterzer, P., Kleinschmidt, A., 2007. A neural basis for inference in perceptual ambiguity.Proc. Natl. Acad. Sci. U. S. A. 104, 323–328.
Sterzer, P., Rees, G., 2008. A neural basis for percept stabilization in binocular rivalry. J.Cogn. Neurosci. 20, 389–399.
Tong, F., Meng, M., Blake, R., 2006. Neural bases of binocular rivalry. Trends Cogn. Sci.(Regul. Ed.) 10, 502–511.
Tononi, G., Srinivasan, R., Russell, D.P., Edelman, G.M., 1998. Investigating neuralcorrelates of conscious perception by frequency-tagged neuromagnetic responses.Proc. Natl. Acad. Sci. U. S. A. 95, 3198–3203.
Vanni, S., Revonsuo, A., Saarinen, J., Hari, R., 1996. Visual awareness of objects correlateswith activity of right occipital cortex. Neuroreport 8, 183–186.
Wilson, H.R., 2007. Minimal physiological conditions for binocular rivalry and rivalrymemory. Vis. Res. 47, 2741–2750.
Wolfe, J.M., 1983. Influence of spatial frequency, luminance, and duration on binocularrivalry and abnormal fusion of briefly presented dichoptic stimuli. Perception 12,447–456.
conscious experience, perceptual reversals and stabilization duringage.2014.06.023
Related Documents


![Binocular Rivalry Oriented Predictive Auto-Encoding Network ...network design with the binocular rivalry mechanism based on predictive coding theory [42] which helps to explain the](https://static.cupdf.com/doc/110x72/60abff4be3ea4b6f6c7e3793/binocular-rivalry-oriented-predictive-auto-encoding-network-network-design-with.jpg)