RESEARCH Distinct Brain Volume Changes Correlating with Clinical Stage, Disease Progression Rate, Mutation Size, and Age at Onset Prediction as Early Biomarkers of Brain Atrophy in Huntington’s Disease Ferdinando Squitieri 1, ∗ , Milena Cannella 1 , Maria Simonelli 1 , Jenny Sassone 2 , Tiziana Martino 1 , Eugenio Venditti 3 , Andrea Ciammola 2 , Claudio Colonnese 3 , Luigi Frati 4 & Andrea Ciarmiello 5, ∗ 1 Neurogenetics Unit, IRCCS Neuromed & Centre for Rare Diseases, Pozzilli (IS), Italy 2 Department of Neurology and Laboratory of Neuroscience, “Dino Ferrari” Center, IRCCS Istituto Auxologico Italiano, Milan, Italy 3 Department of Neuroimaging, IRCCS Neuromed, Pozzilli (IS), Italy 4 Department of Experimental Medicine, University “Sapienza,” Rome, Italy 5 Unit of Nuclear Medicine, S. Andrea Hospital, La Spezia, Italy Keywords Brain biomarkers; Magnetic resonance imaging; Peripheral markers; Progression rate and severity; Volumetric brain atrophy. Correspondence Ferdinando Squitieri, M.D., Ph.D., Neurogenetics Unit, IRCCS Neuromed & Centre for Rare Diseases, Localit ` a Camerelle, 86077–Pozzilli (IS), Italy. Tel.: +39 0865-915238; Fax: +39 0865-927575; E-mail: [email protected] ∗ These authors contributed equally to this work. doi: 10.1111/j.1755-5949.2008.00068.x Searching brain and peripheral biomarkers is a requisite to cure Huntington’s disease (HD). To search for markers indicating the rate of brain neurodegen- erative changes in the various disease stages, we quantified changes in brain atrophy in subjects with HD. We analyzed the cross-sectional and longitudinal rate of brain atrophy, quantitatively measured by fully-automated multipara- metric magnetic resonance imaging, as fractional gray matter (GM, determin- ing brain cortex volume), white matter (WM, measuring the volume of axonal fibers), and corresponding cerebral spinal fluid (CSF, a measure of global brain atrophy), in 94 gene-positive subjects with presymptomatic to advanced HD, and age-matched healthy controls. Each of the three brain compartments we studied (WM, GM, and CSF) had a diverse role and their time courses differed in the development of HD. GM volume decreased early in life. Its decrease was associated with decreased serum brain-derived-neurotrophic-factor and started even many years before onset symptoms, then decreased slowly in a nonlinear manner during the various symptomatic HD stages. WM volume loss also began in the presymptomatic stage of HD a few years before man- ifest symptoms appear, rapidly decreasing near to the zone-of-onset. Finally, the CSF volume increase began many years before age at onset. Its volume measured in presymptomatic subjects contributed to improve the CAG-based model of age at onset prediction. The progressive CSF increase depended on CAG mutation size and continued linearly until the last stages of HD, perhaps representing the best marker of progression rate and severity in HD (R 2 = 0.25, P < 0.0001). Introduction Huntington’s disease (HD) is caused by an expanded CAG mutation generating a toxic protein named huntingtin that affects cells at several levels within and outside the central nervous system. Mutated huntingtin exerts its main pathological effect on brain neurons. Neu- ronal dysfunction and degeneration cause progressively invalidating extrapyramidal symptoms, cognitive decline and behavioral changes. Historically, studies on HD neu- ropathology highlighted as the predominantly affected brain structure the striatum [1], showing progressive stri- atal dysfunction and degeneration since the beginning of the disease and even before the first symptoms ap- pear [2–4]. Recent reports have nevertheless highlighted widespread cortical and subcortical brain atrophy early in the disease course [4–10]. Precisely, how the mutation influences the rate of brain structure atrophy remains unclear, although pro- gressive neuronal degeneration probably depends on CNS Neuroscience & Therapeutics 15 (2009) 1–11 c 2009 The Authors. Journal Compilation c 2009 Blackwell Publishing Ltd 1

Welcome message from author
This document is posted to help you gain knowledge. Please leave a comment to let me know what you think about it! Share it to your friends and learn new things together.
Transcript

RESEARCH
Distinct Brain Volume Changes Correlating with Clinical Stage,Disease Progression Rate, Mutation Size, and Age at OnsetPrediction as Early Biomarkers of Brain Atrophy in Huntington’sDiseaseFerdinando Squitieri 1,∗, Milena Cannella1, Maria Simonelli1, Jenny Sassone2, Tiziana Martino1,Eugenio Venditti3, Andrea Ciammola2, Claudio Colonnese3, Luigi Frati4 & Andrea Ciarmiello5,∗
1 Neurogenetics Unit, IRCCS Neuromed & Centre for Rare Diseases, Pozzilli (IS), Italy2 Department of Neurology and Laboratory of Neuroscience, “Dino Ferrari” Center, IRCCS Istituto Auxologico Italiano, Milan, Italy3 Department of Neuroimaging, IRCCS Neuromed, Pozzilli (IS), Italy4 Department of Experimental Medicine, University “Sapienza,” Rome, Italy5 Unit of Nuclear Medicine, S. Andrea Hospital, La Spezia, Italy
KeywordsBrain biomarkers; Magnetic resonance imaging;
Peripheral markers; Progression rate and
severity; Volumetric brain atrophy.
CorrespondenceFerdinando Squitieri, M.D., Ph.D.,
Neurogenetics Unit, IRCCS Neuromed & Centre
for Rare Diseases, Localita Camerelle,
86077–Pozzilli (IS), Italy.
Tel.: +39 0865-915238;
Fax: +39 0865-927575;
E-mail: [email protected]
∗ These authors contributed equally to this work.
doi: 10.1111/j.1755-5949.2008.00068.x
Searching brain and peripheral biomarkers is a requisite to cure Huntington’sdisease (HD). To search for markers indicating the rate of brain neurodegen-erative changes in the various disease stages, we quantified changes in brainatrophy in subjects with HD. We analyzed the cross-sectional and longitudinalrate of brain atrophy, quantitatively measured by fully-automated multipara-metric magnetic resonance imaging, as fractional gray matter (GM, determin-ing brain cortex volume), white matter (WM, measuring the volume of axonalfibers), and corresponding cerebral spinal fluid (CSF, a measure of global brainatrophy), in 94 gene-positive subjects with presymptomatic to advanced HD,and age-matched healthy controls. Each of the three brain compartments westudied (WM, GM, and CSF) had a diverse role and their time courses differedin the development of HD. GM volume decreased early in life. Its decreasewas associated with decreased serum brain-derived-neurotrophic-factor andstarted even many years before onset symptoms, then decreased slowly in anonlinear manner during the various symptomatic HD stages. WM volumeloss also began in the presymptomatic stage of HD a few years before man-ifest symptoms appear, rapidly decreasing near to the zone-of-onset. Finally,the CSF volume increase began many years before age at onset. Its volumemeasured in presymptomatic subjects contributed to improve the CAG-basedmodel of age at onset prediction. The progressive CSF increase depended onCAG mutation size and continued linearly until the last stages of HD, perhapsrepresenting the best marker of progression rate and severity in HD (R2 = 0.25,P < 0.0001).
Introduction
Huntington’s disease (HD) is caused by an expandedCAG mutation generating a toxic protein namedhuntingtin that affects cells at several levels within andoutside the central nervous system. Mutated huntingtinexerts its main pathological effect on brain neurons. Neu-ronal dysfunction and degeneration cause progressivelyinvalidating extrapyramidal symptoms, cognitive declineand behavioral changes. Historically, studies on HD neu-
ropathology highlighted as the predominantly affectedbrain structure the striatum [1], showing progressive stri-atal dysfunction and degeneration since the beginningof the disease and even before the first symptoms ap-pear [2–4]. Recent reports have nevertheless highlightedwidespread cortical and subcortical brain atrophy early inthe disease course [4–10].
Precisely, how the mutation influences the rate ofbrain structure atrophy remains unclear, although pro-gressive neuronal degeneration probably depends on
CNS Neuroscience & Therapeutics 15 (2009) 1–11 c© 2009 The Authors. Journal Compilation c© 2009 Blackwell Publishing Ltd 1
Brain Changes in Huntington’s Disease F. Squitieri et al.
genetic load [6,9,11]. Additional assumptions on thepathogenesis of HD emphasized the role of glial cells inHD mouse models, cell cultures and patients’ brain [12],ascertaining white matter abnormalities and microglialactivation since the presymptomatic life stage [4,13–17].Collectively, the large set of data so far reported on struc-tural changes and neuropathology in HD reflect the het-erogeneous clinical features of the illness characterized bythe wide variety of symptoms and by the several mech-anisms that in concert contribute to the development ofdisease.
In such a complex scenario, further complicated by theneuropathological and subtle clinical events arising be-fore the first symptoms appear, a crucial need is to iden-tify in vivo brain markers (so-called dry biomarkers) of HDstaging. The main limitation in searching for brain struc-tural markers was that brain structures had to be tracedmanually. This technical drawback made it difficult to ex-tend the results worldwide to other centers without in-curring errors in reliability. Equally important, automaticor semiautomatic methods for tracing small brain struc-tures such as caudate volumes still need to be validated[18].
Some of these technical problems can be overcome byusing a fully automated method for magnetic resonanceimaging (MRI) volumetric assessment. Quantitative vol-umetric measures such as fractional gray matter (fGM,determining brain cortex volume), fractional white mat-ter (fWM, measuring the volume of axonal fibers), andthe corresponding fractional cerebral spinal fluid (fCSF, ameasure of global brain atrophy), together provide sensi-tive information about volumes in the various brain com-partments calculated by an unsupervised procedure formultiparametric segmentation [19]. Volume loss in thediverse brain tissues as measured by a quantitative MRIprocedure therefore provides a sensitive and objectivemarker of disease progression in various disorders includ-ing multiple sclerosis (MS) [20,21] and Alzheimer’s dis-ease (AD) [21,22]. This automated procedure also helpedto identify and measure the volume of abnormal whitematter (aWM) [23,24], due to reactive inflammatory pro-cesses, in MS, a neurological disorder mainly involvingWM. More research is needed, possibly using an age atonset prediction model [25,26] to characterize better thevolumetric changes in brain since the presymptomatic HDstage, so that MRI centers could easily measure them. Infuture these changes might also prove useful as biomark-ers to judge the effectiveness of proposed neuroprotectivetherapeutic interventions in HD.
In this study, using an unsupervised multiparamet-ric brain segmentation procedure based on an MRI re-laxometric approach, we aimed to define the cross-sectional and longitudinal rate of brain atrophy, quan-
titatively measured as fGM and fWM volume loss andrelative fCSF volume increase, in a large group of indi-viduals including presymptomatic gene-carriers, patientswith advanced HD, and age-matched healthy controls.We also assessed whether the brain atrophy detected onquantitative MRI correlates with the genetic load or theclinical stages of the disease. We then investigated anexperimental model to predict age at onset in presymp-tomatic subjects. To find out whether early degenerativechanges are associated with peripheral biological changeswe measured brain-derived neurotrophic factor (BDNF)in patients’ serum.
Materials and Methods
Subjects
Demographic, clinical and genetic characteristics of sub-ject groups are reported in Table S1. A group of 94 HDmutation carriers (mean age of 41.9 ± 9.8 years, range14–70; 45 males and 49 females), 35 in the presymp-tomatic and 59 in the advanced stage of disease, wereenrolled in the study and underwent a baseline MRI scan(Table S1). Of these 94 gene carriers, 11 asymptomaticmutation carriers and 21 patients also underwent a de-layed MRI examination at least 18 months after the firstMRI assessment (mean follow-up interval = 21.32 ± 8.47months). For control purposes, we used data stored in ourdata bank from 48 healthy volunteers [4]. All participantsunderwent genetic testing after informed consent andneurological examination, including motor, psychiatric,cognitive, and functional assessments, by physicians withexpertise in HD [6]. Age at onset of symptoms was cal-culated according to the initial neurological manifesta-tions [6]. Motor symptoms and behavioral and cognitivechanges were assessed clinically with the unified Hunt-ington’s disease rating scale (UHDRS) [27] and mini-mental state examination (MMSE). Subjects’ consent wasobtained according to the Declaration of Helsinki (BrMed J 1991; 302; 1194). They were assigned to one ofseven diagnostic categories to stratify our cohort clini-cally into subgroups thus distinguishing subjects in a pre-clinical stage of HD from those showing even minimalsigns or symptoms of HD: (1) true preclinical HD, no ab-normalities, and MMSE above 25; (2) soft signs, abnor-mal neurological signs despite being specific, insufficientalone to allow a definitive clinical diagnosis of HD, andMMSE above 25; (3) soft signs and symptoms, abnor-mal neurological signs and symptoms that despite beingspecific were insufficient alone to allow a definitive clini-cal diagnosis of HD without the support of molecular ge-netic testing [27,28] and left the subject’s independenceand functional capacity unaffected, and MMSE above 25;
2 CNS Neuroscience & Therapeutics 15 (2009) 1–11 c© 2009 The Authors. Journal Compilation c© 2009 Blackwell Publishing Ltd
F. Squitieri et al. Brain Changes in Huntington’s Disease
(4) manifested HD (stage 1); (5) HD stage 2; (6) HD stage3; and (7) advanced HD stage 4 or 5. The disease stagewas calculated according to the total functional capacity(TFC) score [29]. We considered the subjects with softclinical manifestations (points 2 and 3) in the so-calledzone-of-onset [30]. In subjects with a disease history ofat least 5 years, the rate of functional decline and symp-tom progression was measured in loss of units per yearusing the TFC and the disability scales (DS) [4,6,29,31].The DS rating scale combines patients’ independenceand motor performance, thus taking into account therelationship between independence and neurologicalmotor impairment [31]. Most patients were taking ben-zodiazepines; some with advanced disease were re-ceiving low doses of atypical neuroleptics (olanzapine,2.5–10 mg, or risperidone, 1–3 mg), sometimes associatedwith benzodiazepines, lithium carbonate, or valproate. Tohighlight decreased biological changes in subjects at thetrue presymptomatic stage of life and healthy controls,we tested the serum concentrations of BDNF, a growthfactor produced by cortical neurons that crosses the brainbarrier and that we have already described as lower in theserum of symptomatic HD patients than in controls [32].Serum BDNF levels were measured using an enzyme-linked immunosorbent assay (ELISA) kit (BDNF EmaxImmunoassay System kit Promega, Madison, WI, USA),according to the manufacturer’s instructions. BDNF con-centrations in the serum samples were assayed in fourindependent experiments. Data are presented as means± SD.
MRI Acquisition
MRI scans were obtained at a field strength of 1.5 T(GE Signa 1.5 T), sampling the whole brain at 34 lev-els. The acquisition protocol included 2 interleaved setsof 17 slices covering the entire brain. Each of the 2sets consisted of 2 conventional spin-echo sequences,generating 15 T1-weighted (TR/TE, 600/15) and protondensity/T2-weighted (TR/TE1–TE2, 2,200/15–90) images(25-cm field of view, 256 × 256 acquisition matrix, 4-mm-thick axial slices). For comparison, we used a neu-roimaging archive containing MRI data obtained fromhealthy controls (Table S1). The MRI control databasecontained 48 baseline and 15 delayed MRI scans (meanfollow-up interval = 15.80 ± 7.12 months).
MRI Segmentation Procedure and StatisticalAnalysis
Brain compartments were segmented with a fully au-tomated postprocessing procedure as described else-
where [19]. For each MRI study, total intracranial vol-ume and absolute volumes (in milliliters) of GM, WM,aWM, CSF, the intracerebroventricular volume (ICV),and corresponding fractional volumes (fGM = GM/ICV,fWM = WM/ICV, faWM = aWM/ICV, and fCSF =CSF/ICV), were calculated to allow comparison of datafrom subjects with different head sizes. For comparisonbetween groups of gene carriers, fGM, fWM, and fCSFwere then corrected for age-related changes by adjust-ing both variables to the mean age of the subjects stud-ied (43.54 years), according to the corresponding rates ofyearly decline (0.013%/year for fGM and 0.015%/yearfor fWM) or of yearly increase (0.15%/year for fCSF), asmeasured in the MRI database of healthy controls [19].Two-way analysis of variance (ANOVA) was used to com-pare groups. Tukey’s Kramer multiple comparison testwas used to compare differences between each pairs ofmeans with appropriate adjustment for multiple testing.Linear regression was used to assess the relationship be-tween CAG repeat expansion and the rate of whole brainatrophy. Matched-pairs test was used with diagnostic cat-egories with more than one repeated MRI scan, to as-sess differences in longitudinal measures of brain volume.The over time rate of volume change was calculated forGM, WM, and CSF according to the following formula:Rate of change = ((delayed scan – baseline scan)/baselinescan)) × 100)/time between scans. ANOVA with Tukeytest was used to compare the mean BDNF values in thegroups. P-values equal to or less than 0.05 were consid-ered to indicate statistical significance. Statistical analysiswas done with JMP version 6 software (SAS Institute Inc.,2005, Cary, NC, USA).
Experimental Model to Predict Age at Onset inPresymptomatic Subjects
To test whether CAG-based prediction of HD age at on-set could be improved by assessing fCSF brain volume inpresymptomatic subjects, at the time when they under-went MRI, we used a multiple regression approach bytaking in account both the expanded CAG repeat numberand the fCSF brain compartment volume. From the 35presymptomatic subjects (Table S1) currently undergoingfollow-up, we selected a subset of 23 individuals who,during the longitudinal follow-up, have manifested signsand symptoms of HD. We used the unpaired Student’st-test to compare two statistical approaches to calculatethe age at onset prediction (taking in account the real ageat which the subjects manifested motor symptoms): thesimple CAG-based regression model versus the multipleregression model taking in account as variables the CAGrepeat number + fCSF volume.
CNS Neuroscience & Therapeutics 15 (2009) 1–11 c© 2009 The Authors. Journal Compilation c© 2009 Blackwell Publishing Ltd 3
Brain Changes in Huntington’s Disease F. Squitieri et al.
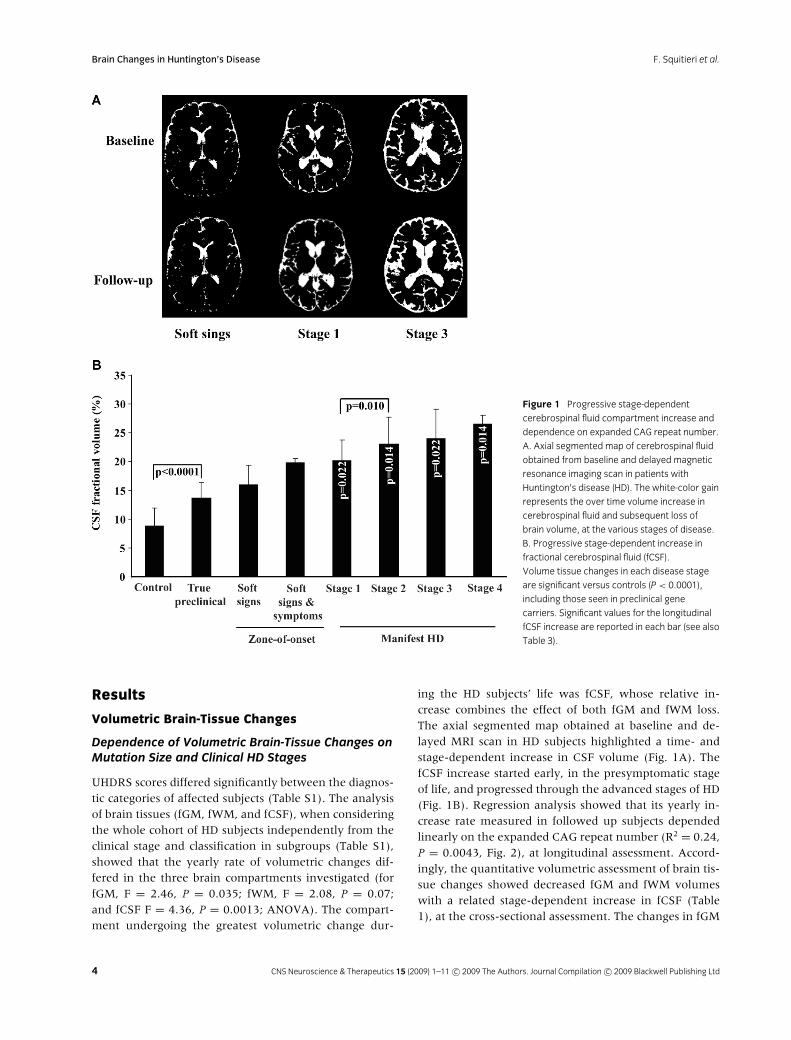
Figure 1 Progressive stage-dependent
cerebrospinal fluid compartment increase and
dependence on expanded CAG repeat number.
A. Axial segmented map of cerebrospinal fluid
obtained from baseline and delayed magnetic
resonance imaging scan in patients with
Huntington’s disease (HD). The white-color gain
represents the over time volume increase in
cerebrospinal fluid and subsequent loss of
brain volume, at the various stages of disease.
B. Progressive stage-dependent increase in
fractional cerebrospinal fluid (fCSF).
Volume tissue changes in each disease stage
are significant versus controls (P < 0.0001),
including those seen in preclinical gene
carriers. Significant values for the longitudinal
fCSF increase are reported in each bar (see also
Table 3).
Results
Volumetric Brain-Tissue Changes
Dependence of Volumetric Brain-Tissue Changes onMutation Size and Clinical HD Stages
UHDRS scores differed significantly between the diagnos-tic categories of affected subjects (Table S1). The analysisof brain tissues (fGM, fWM, and fCSF), when consideringthe whole cohort of HD subjects independently from theclinical stage and classification in subgroups (Table S1),showed that the yearly rate of volumetric changes dif-fered in the three brain compartments investigated (forfGM, F = 2.46, P = 0.035; fWM, F = 2.08, P = 0.07;and fCSF F = 4.36, P = 0.0013; ANOVA). The compart-ment undergoing the greatest volumetric change dur-
ing the HD subjects’ life was fCSF, whose relative in-crease combines the effect of both fGM and fWM loss.The axial segmented map obtained at baseline and de-layed MRI scan in HD subjects highlighted a time- andstage-dependent increase in CSF volume (Fig. 1A). ThefCSF increase started early, in the presymptomatic stageof life, and progressed through the advanced stages of HD(Fig. 1B). Regression analysis showed that its yearly in-crease rate measured in followed up subjects dependedlinearly on the expanded CAG repeat number (R2 = 0.24,P = 0.0043, Fig. 2), at longitudinal assessment. Accord-ingly, the quantitative volumetric assessment of brain tis-sue changes showed decreased fGM and fWM volumeswith a related stage-dependent increase in fCSF (Table1), at the cross-sectional assessment. The changes in fGM
4 CNS Neuroscience & Therapeutics 15 (2009) 1–11 c© 2009 The Authors. Journal Compilation c© 2009 Blackwell Publishing Ltd

F. Squitieri et al. Brain Changes in Huntington’s Disease
Figure 2 Linear correlation between yearly increase in fCSF and
CAG repeat number in gene-positive preclinical and affected subjects.
A positive linear correlation was found between the yearly increase in
fCSF and CAG repeat expansion (R2 = 0.24, P = 0.0043).
Table 1 Cross-sectional analysis of fractional GM, WM, and CSF volume in healthy control, preclinical, and affected gene-positive subjects, grouped
according to their disease stage
Group n GM WM CSF
Mean ± SD F P Mean ± SD F P Mean ± SD F P
41.12 < 0.0001 15.75 < 0.0001 58.92 < 0.0001
Control 48 52.74 ± 2.9 38.39 ± 2.20 8.85 ± 3.13
True preclinical 22 48.17 ± 2.31 38.26 ± 1.99 13.65 ± 2.71
Soft signs 10 45.78 ± 2.39 38.18 ± 1.87 16.01 ± 3.29
Soft signs and symptoms 3 45.67 ± 0.56 34.48 ± 1.19 19.79 ± 0.71
Stage 1 18 44.46 ± 3.22 35.28 ± 2.51 20.13 ± 3.59
Stage 2 23 42.13 ± 3.30 34.62 ± 2.67 23.11 ± 4.63
Stage 3 14 42.44 ± 3.94 33.39 ± 3.37 23.96 ± 5.14
Stage 4/5 4 42.28 ± 3.07 31.14 ± 2.33 26.52 ± 1.50
F, ratio of variances for F-test between populations.
Table 2 Analysis of differences between groups. The table shows significant differences (P) among diagnostic categories on GM, WM, and CSF fractional
volumes
Groups fGM fWM fCSF
mL P mL P mL P
Control vs. true preclinical 4.58 < 0.0001 0.13 ns 4.80 < 0.0001True preclinical vs. soft signs 2.39 < 0.0001 0.08 ns 2.36 0.0903
Soft signs vs. soft signs and symptoms 0.11 ns 3.71 0.0209 3.78 ns
Soft signs and symptoms vs. stage 1 1.21 ns 0.80 ns 0.34 ns
Stage 1 vs. stage 2 2.33 < 0.0001 0.66 0.0023 2.98 0.0100Stage 2 vs. stage 3 0.31 ns 1.23 ns 0.85 ns
Stage 3 vs. stage 4 0.16 ns 2.25 ns 2.57 ns
mL, volume difference between groups. All classes show significant differences versus controls.
(P < 0.0001).
and fWM volumes differed in time course; whereas fGMvolume began to diminish already in the “true” preclin-ical stage of life, well before the first signs and symp-toms appeared (Table 1), fWM volume decreased in the“zone-of-onset,” showing progressive volume loss un-til HD manifested (Table 1). The different time courseswere confirmed by both cross-sectional (Tables 1 and 2)and longitudinal (Table 3) analyses. The greatest changesbegan during the early HD stages: the most prominentchange involved the milliliter percentages for fGM lossand the related fCSF increase (Table 2). In agreementwith the early decreased fGM volume, serum BDNF meanconcentration was already lower in the “true” presymp-tomatic subjects than in healthy age-matched controls(17019 ± 6977 pg/mL from 22 presymptomatic subjectsversus 25318 ± 7019 from 24 control subjects; P < 0.001,unpaired t-test).
CNS Neuroscience & Therapeutics 15 (2009) 1–11 c© 2009 The Authors. Journal Compilation c© 2009 Blackwell Publishing Ltd 5

Brain Changes in Huntington’s Disease F. Squitieri et al.
Tab
le3
Rat
ean
dvo
lum
ech
ange
infG
M,a
ndfW
Mlo
ssan
dfC
SFin
crea
se,i
nhe
alth
yco
ntro
ls,a
ndd
iagn
ostic
cate
gori
esof
gene
-pos
itive
sub
ject
sin
the
long
itud
inal
stud
y
GM
WM
CSF
Dia
gnos
ticca
tego
ries
nA
vera
gefo
llow
-up
mon
ths
Rat
eof
chan
ge(m
L)/y
ear
loss
PR
ate
ofch
ange
(mL)
/yea
rlo
ssP
Rat
eof
chan
ge(m
L)/y
ear
incr
ease
P
Con
trol
1513
–0.0
01–0
.01
ns–0
.001
–0.0
2ns
0.00
30.
05ns
True
pre
clin
ical
818
–0.0
01–0
.03
ns–0
.048
–0.8
70.
0158
0.01
40.
25ns
Soft
sign
s3
18–0
.130
–2.3
40.
0793
0.00
10.
02ns
0.08
71.
560.
0891
Stag
e1
519
–0.0
39–0
.75
0.04
37–0
.018
–0.3
5ns
0.05
81.
110.
0223
Stag
e2
820
–0.0
64–1
.24
0.04
650.
011
0.22
ns0.
051
1.01
0.01
41
Stag
e3
823
–0.0
50–1
.15
ns–0
.045
–1.0
4ns
0.09
42.
170.
0139
The
long
itud
inal
anal
ysis
ofH
Dsu
bje
cts
and
cont
rols
show
eda
vari
able
time-
and
stag
e-d
epen
den
tbra
in-t
issu
evo
lum
ech
ange
inH
D.
Last
stag
efo
llow
-up
sar
em
issi
ngd
ueto
the
smal
lsiz
eof
the
coho
rt.
Figure 3. Cerebrospinal fluid (fCSF) increase in dependence on
disability scale (DS) score per Huntington’s disease subjects’ stage.
A different color marks each stage of the subjects’ life including the preclin-
ical stage. Higher fCSF volumes correspond to more severe DS scores and
more advanced disease stages according to the total functional capacity
scale (regression analysis, R2 = 0.25, P < 0.0001).
Correlation of Volumetric Brain-Tissue Changeswith Clinical Markers
In the affected subjects (n = 59), the single changes infractional volumes of all the brain compartments ana-lyzed correlated linearly with the decreasing TFC scalescore, an index of functional capacity and HD staging(fGM: R2 = 0.20, P < 0.0001; fWM: R2 = 0.37, P <
0.0001; fCSF: R2 = 0.40, P < 0.0001). Similarly, fGMand fCSF correlated linearly with the decreasing DS score,an index including both independence and motor im-pairment, calculated in subjects subgrouped according totheir HD stage (fGM: R2 = 0.30, P < 0.0001; fCSF: R2 =0.28, P < 0.0001, Fig. 3). The only MRI variable that cor-related linearly with the progressively increasing clinicalseverity of HD, calculated as a loss of TFC scale score unitsper year, was the increasing fCSF volume (R2 = 0.14, P =0.02) in patients who had HD for at least 5 years.
Study of Abnormal White Matter
Structural analysis of WM to detect volumes of fractionaldemyelinated WM due to an inflammatory process [23]highlighted the presence of higher faWM volume in HDsubjects with soft signs than in healthy controls (0.081± 0.051 vs. 0.017 ± 0.02, P < 0.0001 by ANOVA) andin subjects with true preclinical disease (0.081 ± 0.051vs. 0.032 ± 0.02, P = 0.0003) (Fig. S1). Increased faWMvolumes were higher in subjects with advanced HD thanin presymptomatic subjects (0.21 ± 0.20 vs. 0.05 ± 0.04,P < 0.0001) (Fig. S1). Furthermore, faWM volumes werehigher in clinical stage 3 than in stage 1 (0.35 ± 0.29 vs.
6 CNS Neuroscience & Therapeutics 15 (2009) 1–11 c© 2009 The Authors. Journal Compilation c© 2009 Blackwell Publishing Ltd
F. Squitieri et al. Brain Changes in Huntington’s Disease
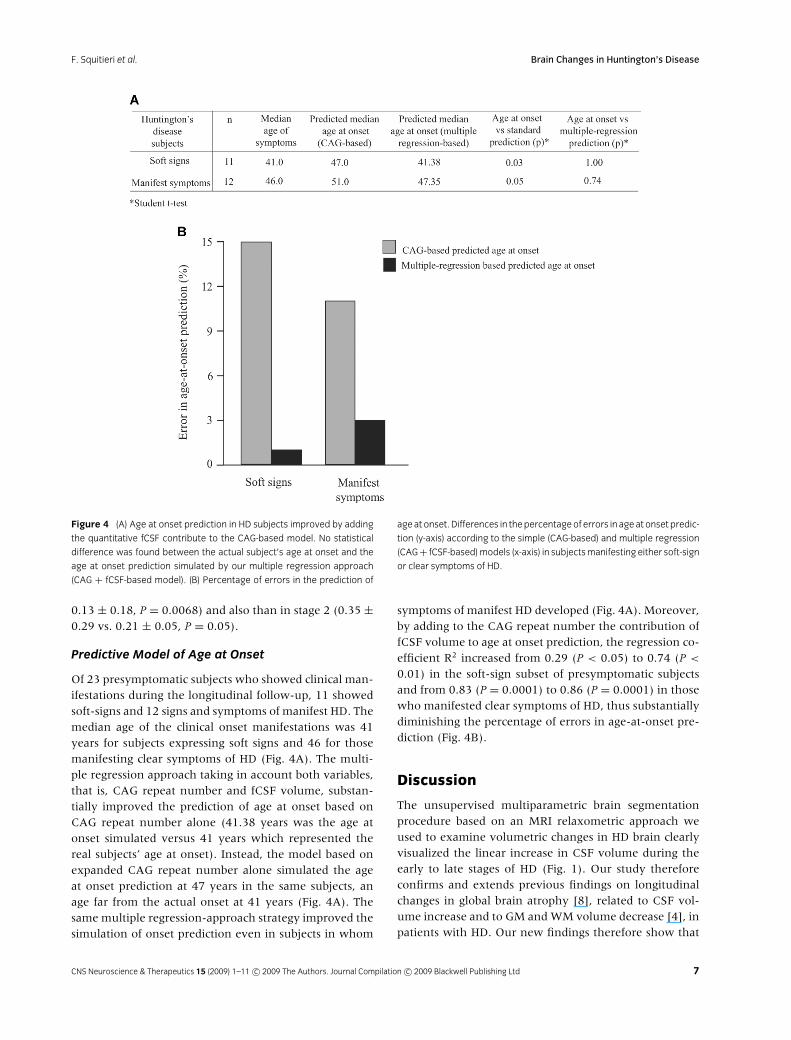
Figure 4 (A) Age at onset prediction in HD subjects improved by adding
the quantitative fCSF contribute to the CAG-based model. No statistical
difference was found between the actual subject’s age at onset and the
age at onset prediction simulated by our multiple regression approach
(CAG + fCSF-based model). (B) Percentage of errors in the prediction of
age at onset. Differences in the percentage of errors in age at onset predic-
tion (y-axis) according to the simple (CAG-based) and multiple regression
(CAG + fCSF-based) models (x-axis) in subjects manifesting either soft-sign
or clear symptoms of HD.
0.13 ± 0.18, P = 0.0068) and also than in stage 2 (0.35 ±0.29 vs. 0.21 ± 0.05, P = 0.05).
Predictive Model of Age at Onset
Of 23 presymptomatic subjects who showed clinical man-ifestations during the longitudinal follow-up, 11 showedsoft-signs and 12 signs and symptoms of manifest HD. Themedian age of the clinical onset manifestations was 41years for subjects expressing soft signs and 46 for thosemanifesting clear symptoms of HD (Fig. 4A). The multi-ple regression approach taking in account both variables,that is, CAG repeat number and fCSF volume, substan-tially improved the prediction of age at onset based onCAG repeat number alone (41.38 years was the age atonset simulated versus 41 years which represented thereal subjects’ age at onset). Instead, the model based onexpanded CAG repeat number alone simulated the ageat onset prediction at 47 years in the same subjects, anage far from the actual onset at 41 years (Fig. 4A). Thesame multiple regression-approach strategy improved thesimulation of onset prediction even in subjects in whom
symptoms of manifest HD developed (Fig. 4A). Moreover,by adding to the CAG repeat number the contribution offCSF volume to age at onset prediction, the regression co-efficient R2 increased from 0.29 (P < 0.05) to 0.74 (P <
0.01) in the soft-sign subset of presymptomatic subjectsand from 0.83 (P = 0.0001) to 0.86 (P = 0.0001) in thosewho manifested clear symptoms of HD, thus substantiallydiminishing the percentage of errors in age-at-onset pre-diction (Fig. 4B).
Discussion
The unsupervised multiparametric brain segmentationprocedure based on an MRI relaxometric approach weused to examine volumetric changes in HD brain clearlyvisualized the linear increase in CSF volume during theearly to late stages of HD (Fig. 1). Our study thereforeconfirms and extends previous findings on longitudinalchanges in global brain atrophy [8], related to CSF vol-ume increase and to GM and WM volume decrease [4], inpatients with HD. Our new findings therefore show that
CNS Neuroscience & Therapeutics 15 (2009) 1–11 c© 2009 The Authors. Journal Compilation c© 2009 Blackwell Publishing Ltd 7

Brain Changes in Huntington’s Disease F. Squitieri et al.
brain atrophy, as detected by measuring volume changesin fGM, fWM, and fCSF, begins early in the life of genecarriers. Hence, our findings showing that brain WM vol-ume loss, reflecting the altered size and number of den-dritic spines [13,33], starts at the presymptomatic stageof life [4,17] (Table 3) and progresses rapidly through thezone-of-onset (Table 2) up to manifest HD suggest thatthis measure of brain atrophy needs further investigationas a potentially reliable predictor of HD in people who aregene carriers approaching the zone-of-onset, yet near tothe probable age at onset of symptoms.
Although the second quantitative measure of brain at-rophy we studied, GM volume loss, also starts early inlife, before WM volume loss (Table 2), its loss of vol-ume diminishes slowly throughout the disease courseand progresses nonlinearly over time towards advancedHD stages (Table 3). Evidence of such early GM volumeloss, reflecting the early brain cortex atrophy [4,10], isa novel finding further corroborated by in vivo biologicalchanges in the periphery. Indeed, BDNF, a neurotrophicfactor produced by cortical neurons [34] implicated in thepathogenic mechanisms of HD [35] and whose levels inserum reflect those in the brain [32,35], already starts todecrease in the presymptomatic stages of HD.
A distinctive, previously unreported finding in ourstudy is that the longitudinal fCSF increase detected infollowed-up HD subjects depends strictly on the size ofexpanded CAG repeat mutation (Fig. 5). This observationis also in line with the large mutation size reported in pa-tients with HD showing particularly severe clinical pro-gression of the disease, probably associated with a fasterrate of global brain atrophy than the adult forms carryingmoderate mutation sizes [11]. Collectively, our quantita-tive findings indicate that each of the three brain com-partments we studied (WM, GM, and CSF) has a diverserole and their time courses differing in the developmentof HD (Fig. 4). The GM compartment shows the earliestvolume decrease in life, far from manifest HD, thereafterits volume decreases slowly in a nonlinear manner dur-ing the various HD stages; WM volume loss begins in thepresymptomatic stage of HD, its rapid decrease markingthe zone-of-onset. Finally, CSF volume increases manyyears before age at onset, then continues linearly untilthe last stages of HD. Measuring its progressive increasecould help to improve CAG-based age at onset predictionin unaffected mutation carriers even far from probablemanifest HD (Table S1 and Fig. 4). Of these three braincompartments, CSF volume seems also the best predictorof disease progression rate and severity in HD (Figs. 3 and4), thus confirming that progressive global brain atrophycould be a potential biomarker [8].
Our study has limitations. First, although our large co-hort gave us the opportunity to do cross-sectional and
Figure 5 Brain tissue changes in Huntington’s disease (HD)
subjects throughout life compared with healthy controls.
Analysis of 48 healthy control subjects, 35 presymptomatic HD
subjects (including “true” presymptomatic, soft sign, and soft sign
and symptom subjects) and 59 affected subjects. The cross-sectional
volumetric analysis shows an early decrease in fGM volume, a fast fWM
loss in the zone-of-onset phase, and a progressive linear increase in the
fCSF volume beginning many years before age at onset and continuing
until the advanced stages of the disease (fGM: 52.7 ± 2.9 mL in healthy
control versus 47.3 ± 2.5 mL in presymptomatic HD versus 42.3 ± 3.5
mL in affected subjects, F = 134.5, P < 0.0001; fWM: 38.4 ± 2.2 mL in
healthy control versus 37.9 ± 2.1 mL in presymptomatic HD versus 34.3
± 2.9 mL in affected subjects, F = 41.5, P < 0.0001; fCSF: 8.8 ± 3.1 mL in
healthy controls versus 14.8 ± 3.3 mL in presymptomatic HD versus 22.6
± 4.6 mL in affected subjects, F = 170.1, P < 0.0001. F, ratio of variances
for F-test between populations).
longitudinal analyses, definitive conclusions would needfollow-ups of years (in our analysis the longest was 3years) on a larger sample size, especially the size of thecohort within the zone-of-onset and those at the final HDstages. Enrolling these elderly extremely disabled personsobviously raises practical difficulties. Second, our aim wasto search for cerebral markers of HD stages and HD courseseverity from one stage to another, without taking intoaccount fine regional brain variations. We sought pre-liminary information on gross brain volume variabilityin as many HD stages as possible, and used a fully au-tomated procedure that would allow the research to beextended worldwide. Further studies designed to relatefine regional brain changes to the clinical stages and vari-ants of the disease will be a crucial step in disclosing otherfeatures in the natural history of HD.
Notwithstanding these limitations, we found thatchanges in brain volumes differed at the various stagesof life. The only marker associated with complete linear
8 CNS Neuroscience & Therapeutics 15 (2009) 1–11 c© 2009 The Authors. Journal Compilation c© 2009 Blackwell Publishing Ltd

F. Squitieri et al. Brain Changes in Huntington’s Disease
progressive HD brain damage (Fig. 1) and disease pro-gression (Fig. 3) was CSF, whose volumetric increase isa marker of global brain atrophy, as demonstrated inother neurodegenerative diseases [22]. Interestingly, inthis study, both WM and GM decreased in a segmen-tal nonlinear manner reflecting the segmental nonlineartrend in the HD progression rate previously described instudies using a clinical approach (Fig. 4) [4,6].
Our observations reflect the major currently acceptedpathogenic mechanisms in HD. For example, they sup-port the role of glia and axonal dysfunction and degen-eration leading to WM volume loss early in life [4,33].This early WM volumetric change would substantiallycontribute to the HD excitotoxic process leaving neuronsunprotected against mutant huntingtin, as demonstratedin vitro [12]. Again, our findings inferring the occurrenceof increasing inflammatory WM tissue in symptomaticpeople (i.e., demyelinated WM, Fig. S1), reflect the re-cently published observations on the role of microglial ac-tivation correlating with HD severity [15] and beginningearly in the life of HD subjects [16]. In their study, theauthors performed positron emission tomography pro-cedure [16], by using a tracer specifically detecting ac-tivated microglia. Coherently to findings from Tai et al.[16], our data show increased faWM volume beginningsince presymptomatic life stage (Fig. S1). Our data alsofit in with the evidence that the progression rate in HDdepends on the genetic load of the mutation [4,9,11].Finally, our findings, corroborated by our age at onsetprediction model, underline that brain atrophy involv-ing cortical structures begins early, during the presymp-tomatic stages of HD [4,6], and that early brain degen-erative changes are associated with peripheral biologicalchanges (i.e., BDNF in serum), possibly revealing newpotential biomarkers in HD. The improved age-at-onsetprediction might also help in assessing the benefits of po-tential neuroprotective therapies, thus favoring novel ap-proaches to be transferred from animal models to humans[36].
Acknowledgments
We thank Professor Jean Paul Vonsattel, Columbia Uni-versity, NY, USA, for his thoughtful comments onthe manuscript, Dr. Bruno Alfano, Italian National Re-search Council, Naples, Italy, for kindly providing afully automated postprocessing procedure to segment thebrain compartments, the European Huntington’s Disease(EURO-HD) Network, all patients and their families (As-sociazione Italiana Corea di Huntington-Neuromed), theItalian Society of Hospital Neurologists (SNO, “lascitoGobessi”), the Italian Health Ministry (FS, COFIN 2006;finalizzato ex art.56 2007), for their kind support. The
financial support of Telethon, Italy, to FS (Grant no.GGP06181) is gratefully acknowledged.
Conflict of Interest
The authors report no conflicts of interest.
References
1. Hersh S, Rosas HD, Ferrante RJ. Neuropathology and
pathophysiology of Huntington’s disease. New York;
McGraw-Hill; 2004.
2. Harris GJ, Codori AM, Lewis RF, Schmidt E, Bedi A,
Brandt J. Reduced basal ganglia blood flow and volume
in pre-symptomatic, gene-tested persons at-risk for
Huntington’s disease. Brain 1999;122:1667–1678.
3. Aylward EH, Sparks BF, Field KM, Yallapragada V,
Shpritz BD, Rosenblatt A, Brandt J, Gourley LM, Liang
K, Zhou H, Margolis RL, Ross CA. Onset and rate of
striatal atrophy in preclinical Huntington disease.
Neurology 2004;63:66–72.
4. Ciarmiello A, Cannella M, Lastoria S, Simonelli M, Frati
L, Rubinsztein DC, Squitieri F. Brain white-matter
volume loss and glucose hypometabolism precede the
clinical symptoms of Huntington’s disease. J Nucl Med
2006;47:215–222.
5. Thieben MJ, Duggins AJ, Good CD, Gomes L, Mahant N,
Richards F, McCusker E, Frackowiak RS. The distribution
of structural neuropathology in pre-clinical Huntington’s
disease. Brain 2002;125:1815–1828.
6. Squitieri F, Gellera C, Cannella M, Mariotti C, Cislaghi G,
Rubinsztein DC, Almqvist EW, Turner D, Bachoud-Levi
AC, Simpson SA, et al. Homozygosity for CAG mutation
in Huntington disease is associated with a more severe
clinical course. Brain 2003;126:946–955.
7. Kassubek J, Juengling FD, Kioschies T, Henkel K,
Karitzky J, Kramer B, Ecker D, Andrich J, Saft C, Kraus
P, et al. Topography of cerebral atrophy in early
Huntington’s disease: A voxel-based morphometric MRI
study. J Neurol Neurosurg Psychiatry 2004;75:213–220.
8. Henley SM, Frost C, MacManus DG, Warner TT, Fox NC,
Tabrizi SJ. Increased rate of whole-brain atrophy over 6
months in early Huntington disease. Neurology
2006;67:694–696.
9. Ruocco HH, Bonilha L, Li LM, Lopes-Cendes I, Cendes F.
Longitudinal analysis of regional gray matter loss in
Huntington disease: Effects of the length of the CAG
repeat. J Neurol Neurosurg Psychiatry 2008;79:130–135.
10. Rosas HD, Salat DH, Lee SY, Zaleta AK, Pappu V, Fischl
B, Greve D, Hevelone N, Hersch SM. Cerebral cortex
and the clinical expression of Huntington’s disease:
Complexity and heterogeneity. Brain 2008;131:
1057–1068.
11. Rosenblatt A, Liang KY, Zhou H, Abbott MH, Gourley
LM, Margolis RL, Brandt J, Ross CA. The association of
CNS Neuroscience & Therapeutics 15 (2009) 1–11 c© 2009 The Authors. Journal Compilation c© 2009 Blackwell Publishing Ltd 9
Brain Changes in Huntington’s Disease F. Squitieri et al.
CAG repeat length with clinical progression in
Huntington disease. Neurology 2006;66:1016–1020.
12. Shin JY, Fang ZH, Yu ZX, Wang CE, Li SH, Li XJ. Exp-
ression of mutant huntingtin in glial cells contributes to
neuronal excitotoxicity. J Cell Biol 2005;171:1001–1012.
13. Sapp E, Kegel KB, Aronin N, Hashikawa T, Uchiyama Y,
Tohyama K, Bhide PG, Vonsattel JP, DiFiglia M. Early
and progressive accumulation of reactive microglia in
the Huntington disease brain. J Neuropathol Exp Neurol
2001;60:161–172.
14. Rosas HD, Tuch DS, Hevelone ND, Zaleta AK, Vangel M,
Hersch SM, Salat DH. Diffusion tensor imaging in
presymptomatic and early Huntington’s disease:
Selective white matter pathology and its relationship to
clinical measures. Mov Disord 2006;21:1317–1325.
15. Pavese N, Gerhard A, Tai YF, Ho AK, Turkheimer F,
Barker RA, et al. Microglial activation correlates with
severity in Huntington disease: A clinical and PET study.
Neurology 2006;66:1638–1643.
16. Tai YF, Pavese N, Gerhard A, Tabrizi SJ, Barker RA,
Brooks DJ, Piccini P. Microglial activation in
presymptomatic Huntington’s disease gene carriers. Brain
2007;130:1759–1766.
17. Kloppel S, Draganski B, Golding CV, Chu C, Nagy Z,
Cook PA, Hicks SL, Kennard C, Alexander DC, Parker
GJ, et al. White matter connections reflect changes in
voluntary-guided saccades in pre-symptomatic
Huntington’s disease. Brain 2008;131:196–204.
18. Douaud G, Gaura V, Ribeiro MJ, Lethimonnier F, Maroy
R, Verny C, Krystkowiak P, Damier P, Bachoud-Levi AC,
Hantraye P, Remy P. Distribution of grey matter atrophy
in Huntington’s disease patients: A combined ROI-based
and voxel-based morphometric study. Neuroimage
2006;32:1562–1575.
19. Alfano B, Brunetti A, Covelli EM, Quarantelli M, Panico
MR, Ciarmiello A, Salvatore M. Unsupervised,
automated segmentation of the normal brain using a
multispectral relaxometric magnetic resonance approach.
Magn Reson Med 1997;37:84–93.
20. Quarantelli M, Ciarmiello A, Morra VB, Orefice G,
Larobina M, Lanzillo R, Schiavone V, Salvatore E, Alfano
B, Brunetti A. Brain tissue volume changes in relapsing-
remitting multiple sclerosis: Correlation with lesion load.
Neuroimage 2003;18:360–366.
21. Filippi M, Rovaris M, Inglese M, Barkhof F, De Stefano N,
Smith S, Comi G. Interferon beta-1a for brain tissue loss
in patients at presentation with syndromes suggestive of
multiple sclerosis: A randomised, double-blind,
placebo-controlled trial. Lancet 2004;364:1489–1496.
22. Fox NC, Freeborough PA, Rossor MN. Visualisation and
quantification of rates of atrophy in Alzheimer’s disease.
Lancet 1996;348:94–97.
23. Alfano B, Brunetti A, Larobina M, Quarantelli M,
Tedeschi E, Ciarmiello A, Covelli EM, Salvatore M.
Automated segmentation and measurement of global
white matter lesion volume in patients with multiple
sclerosis. J Magn Reson Imaging 2000;12:799–807.
24. Tedeschi G, Lavorgna L, Russo P, Prinster A, Dinacci D,
Savettieri G, Quattrone A, Livrea P, Messina C, Reggio A,
et al. Brain atrophy and lesion load in a large population
of patients with multiple sclerosis. Neurology
2005;65:280–285.
25. Brinkman RR, Mezei MM, Theilmann J, Almqvist E,
Hayden MR. The likelihood of being affected with
Huntington disease by a particular age, for a specific CAG
size. Am J Hum Genet 1997;60:1202–1210.
26. Squitieri F, Sabbadini G, Mandich P, Gellera C, Di Maria
E, Bellone E, Castellotti B, Nargi E, de Grazia U, Frontali
M, Novelletto A. Family and molecular data for a fine
analysis of age at onset in Huntington disease. Am J Med
Genet 2000;95:366–373.
27. Huntington Study Group. The unified Huntington’s
disease rating scale: Reliability and consistency.
Huntington Study Group. Mov Disord 1996;11:136–142.
28. Paulsen JS, Zhao H, Stout JC, Brinkman RR, Guttman M,
Ross CA, Como P, Manning C, Hayden MR, Shoulson I,
Huntingdon Study Group. Clinical markers of early
disease in persons near onset of Huntington’s disease.
Neurology 2001;57:658–662.
29. Marder K, Zhao H, Myers RH, Cudkowicz M, Kayson E,
Kieburtz K, Orme C, Paulsen J, Penney JB Jr, Siemers E,
Shoulson I. Rate of functional decline in Huntington’s
disease. Huntington Study Group. Neurology
2000;54:452–458.
30. Penney JB Jr., Young AB, Shoulson I,
Starosta-Rubenstein S, Snodgrass SR, Sanchez-Ramos J,
Ramos-Arroyo M, Gomez F, Penchaszadeh G, Alvir J,
et al. Huntington’s disease in Venezuela: 7 years of
follow-up on symptomatic and asymptomatic
individuals. Mov Disord 1990;5:93–99.
31. Myers RH, Sax DS, Koroshetz WJ, Mastromauro C,
Cupples LA, Kiely DK, Pettengill FK, Bird ED. Factors
associated with slow progression in Huntington’s disease.
Arch Neurol 1991;48:800–804.
32. Ciammola A, Sassone J, Cannella M, Calza S, Poletti B,
Frati L, Squitieri F, Silani V. Low brain-derived
neurotrophic factor (BDNF) levels in serum of
Huntington’s disease patients. Am J Med Genet B
Neuropsychiatr Genet 2007;144:574–577.
33. Gutekunst CA, Li SH, Yi H, Mulroy JS, Kuemmerle S,
Jones R, Rye D, Ferrante RJ, Hersch SM, Li XJ. Nuclear
and neuropil aggregates in Huntington’s disease:
Relationship to neuropathology. J Neurosci 1999;19:
2522–2534.
34. Saudou F, Finkbeiner S, Devys D, Greenberg ME.
Huntingtin acts in the nucleus to induce apoptosis but
death does not correlate with the formation of
intranuclear inclusions. Cell 1998;95:55–66.
35. Gauthier LR, Charrin BC, Borrell-Pages M, Dompierre
JP, Rangone H, Cordelieres FP, De Mey J, MacDonald
10 CNS Neuroscience & Therapeutics 15 (2009) 1–11 c© 2009 The Authors. Journal Compilation c© 2009 Blackwell Publishing Ltd
F. Squitieri et al. Brain Changes in Huntington’s Disease
ME, Lessmann V, Humbert S, Saudou F. Huntingtin
controls neurotrophic support and survival of neurons by
enhancing BDNF vesicular transport along microtubules.
Cell 2004;118:127–138.
36. Kaplitt MG, Feigin A, Tang C, Fitzsimons HL, Mattis P,
Lawlor PA, Bland RJ, Young D, Strybing K, Eidelberg D,
During MJ. Safety and tolerability of gene therapy with
an adeno-associated virus (AAV) borne GAD gene for
Parkinson’s disease: An open label, phase I trial. Lancet
2007;369:2097–2105.
Supporting Information
Additional Supporting Information may be found in theonline version of this article:
Table S1. Demographic, clinical and genetic characteris-tics of subject groups.Figure S1. Analysis of fractional abnormal white mat-ter (faWM). Scatter plot of fractional demyelinated WM(faWM in milliliters, x-axis) measured in 48 controls andin 35 asymptomatic subjects and in 59 patients using theunsupervised technique (y-axis), showed a greater faWMvolume in patients than in asymptomatic and controlsubjects (P < 0.0001 by unpaired t).
Please note: Wiley-Blackwell are not responsible for thecontent or functionality of any supporting materials sup-plied by the authors. Any queries (other than missing ma-terial) should be directed to the corresponding author forthe article.
CNS Neuroscience & Therapeutics 15 (2009) 1–11 c© 2009 The Authors. Journal Compilation c© 2009 Blackwell Publishing Ltd 11
Related Documents


