DISSRETATION APPICATIONS OF SUPERATOM THEORY IN METAL CLUSTER CHEMISTRY Submitted by Marcus A Tofanelli Department of Chemistry In partial fulfillment of the requirements For the Degree of Doctor of Philosophy Colorado State University Fort Collins, Colorado Fall 2016 Doctoral committee: Advisor: Christopher J. Ackerson Amy L. Prieto Mathew Shores Delphine Farmer Jacob Roberts

Welcome message from author
This document is posted to help you gain knowledge. Please leave a comment to let me know what you think about it! Share it to your friends and learn new things together.
Transcript
DISSRETATION
APPICATIONS OF SUPERATOM THEORY IN METAL CLUSTER CHEMISTRY
Submitted by
Marcus A Tofanelli
Department of Chemistry
In partial fulfillment of the requirements
For the Degree of Doctor of Philosophy
Colorado State University
Fort Collins, Colorado
Fall 2016
Doctoral committee:
Advisor: Christopher J. Ackerson
Amy L. Prieto Mathew Shores Delphine Farmer Jacob Roberts

Copyright by Marcus A. Tofanelli 2016
All Rights Reserved
ii
ABSTRACT
APPICATIONS OF SUPERATOM THEORY IN METAL CLUSTER CHEMISTRY
One of the largest modern scientific debates is understanding the size dependent
properties of a metal. While much effort has been performed on understanding metal particles
from the top down to much less work has been accomplished from the bottom up. This has lead
to a great deal of interest in metal clusters. Metal clusters containing 20 to 200 metal atoms are
similar yet strikingly different to both to normal coordination chemistry and continuous bulk
systems, therefore neither a classical understanding for bulk or molecular systems appears to be
appropriate.
Superatom theory has emerged as a useful concept for describing the properties of a
metal cluster in this size range. In this model a new set of ‘superatomic’ orbitals arises from the
valence electrons of all the metals in a cluster. From superatom theory the properties of a metal
cluster, such as stability, ionization energy, reactivity, and magnetism, should depend on valence
of the superatomic orbitals, similar to a normal atom. However superatom theory has largely
been used to describe the high stabilities of metal clusters with completed electronic
configurations. Thus many features of superatom theory have remained largely untested and the
extent that the superatom model truly applies has remained in question for many years.
Over the past decade increases in synthetic and analytical techniques have allowed for the
isolation of a series of stable monodisperse gold thiolate monolayer protected clusters (MPCs)
containing from 10 to 500 gold atoms. The wide range in sizes and high stability of gold thiolate
iii
clusters provides an instrumental system for understanding superatom theory and the transition
from molecular-like cluster to bulk-like system.
In the first part of this thesis the effects of the superatomic valence is investigated under
superatomic assumptions. Au25(SR)18 (where SR= any thiolate) can be synthesized in 3 different
oxidation states without any major distortions to the geometry of the cluster, thus it is possible to
test 3 different superatomic configurations for a single cluster. These studies show that the
superatom model correctly predicts changes observed in the stability, absorption spectrum,
crystal structures, and magnetic susceptibility for each charge state of Au25(SR)18. In addition,
the superatom model is shown to also apply to the isoelectronic PdAu24(SR)18 superatomic
cluster. This work is discussed in Chapters 2, 3, and 4.
The second part of this thesis focuses on the transition from superatomic metal clusters to
metal nanoparticles. Au144(SR)60 is studied in order to understand this transition. Although the
plasmon is not immediately apparent through linear absorption spectroscopy, a plasmonic feature
is observed in transient absorption spectroscopy. This observation in combination with the
absence of a HOMO-LUMO gap suggests that Au144(SR)60 can be treated with bulk assumptions.
However Au144(SR)60 shows quantized behavior and powder x-ray diffraction reveals that
symmetry of the metal core does not represent what is observed in the bulk. Au144(SR)60 appears
to show both superatomic and bulk behavior making it an instrumental tool for understanding the
transition from superatomic to bulk behavior. This work is discussed in Chapters 2, 5, and 6.
iv
TABLE OF CONTENTS
Abstract……………………………………………………………………………………………ii
Chapter 1. An Introduction To Metal Cluster Chemistry...……………………………………….1
References…………………………………………………………………………………………7
Chapter 2. Superatom Electron Configuration Predicts Thermal Stability of Au25(SR)18
Nanoclusters ……………………………………………………………………………………..10
2.1 Synopsis ……………………………………………………………………………..10
2.2 Introduction…………………………………………………………………………..10
2.3 Methods………………………………………………………………………………13
2.4 Results and discussion……………………………………………………………….13
References………………………………………………………………………………………..19
Chapter 3. Jahn–Teller effects in Au25(SR)18 …………………………………………………...22
3.1 Synopsis……………………………………………………………………………...22
3.2 Introduction…………………………………………………………………………..23
3.3 Methods………………………………………………………………………………25
3.4 Symmetry analysis…………………………………………………………………...27
3.5 Optical/Electronic Properties of Au25(PET)18–1/0/+1 ………………………………….33
3.6 Magnetic Properties of Au25(SR)18–1/0/+1……………………………………………..35
3.7 Long range order and packing of Au25(PET)18PF6…………………………………..37
3.8 Conclusions…………………………………………………………………...42
References………………………………………………………………………………………..43
Chapter 4. Crystal Structure of the PdAu24(SR)180 Superatom…………………………………..47
v
4.1 Synopsis...……………………………………………………………………………47
4.2 Introduction…………………………………………………………………………..47
4.3 Results and discussion……………………………………………………………….49
References………………………………………………………………………………………..54
Chapter 5. Relaxation of Metallic Au144(SR)60 Nanoclusters……………………………………57
5.1 Synopsis ……………………………………………………………………………..57
5.2 Introduction…………………………………………………………………………..58
5.3 Results and discussion……………………………………………………………….60
5.4 Conclusion…………………………………………………………………………...75
References………………………………………………………………………………………..77
Chapter 6. Polymorphism in magic-sized Au144(SR)60 clusters………………………………….80
6.1 Synopsis ……………………………………………………………………………..80
6.2 Introduction…………………………………………………………………………..80
6.3 Results and discussion……………………………………………………………….83
6.4 Conclusion…………………………………………………………………………...95
6.5 Methods………………………………………………………………………………98
References……………………………………………………………………………………….99
Chapter 7. Summary……………………………………………………………………………104
Supporting information…………………………………………………………………………106
1
Chapter 1
An Introduction to Metal Cluster Chemistry
During the past 50 years a new major area of chemistry has developed focused on metal
clusters containing from several to several hundred metal atoms. In this size range the
physiochemical properties are highly dependent on the symmetry and exact atomic count of
cluster. This has allowed for an incredibly diverse set of applications to be envisioned for metal
clusters such as high temperature superconducting, multi-dimensional theranostics, and
catalysis.1-4 However before the full potential of metal cluster chemistry can be realized a better
understanding of these systems is required.
Interest in metal cluster expands over a diverse set of fields as they have been observed in
solids, solutions, and gases. Initially it was believed that each cluster was a unique molecule
because the properties varied so much from cluster to cluster. Nevertheless in the mid 1980’s it
was found that the behavior of ligated inorganic clusters followed rules developed by Wade and
Mingos, and that these could even be extended to metal clusters in the solid state.1,5,6 Thus it is
possible to relate clusters containing different metals and in different phases. Early in the studies
preformed on metal MPC crude characterization techniques made it difficult to study clusters
containing much more than 12 metal atoms. As advancements in characterization techniques
progressed it was possible to study monodisperse clusters up to several hundred atoms. However
once a metal cluster becomes much larger than about 12 atoms the Wade-Mingos rules no longer
appear to hold valid. A new model is required in order to understand metal clusters larger than 12
metal atoms but still significantly smaller than bulk material.
2
During the 1960’s new methods were developed to produce gas phase metal clusters in
order to elucidate the properties isolated metal clusters. Results from these studies revealed that
metal clusters with specific atomic counts were much more abundant than others and this was
attributed to a high stability of these clusters. Initially it was not well understood what gave rise
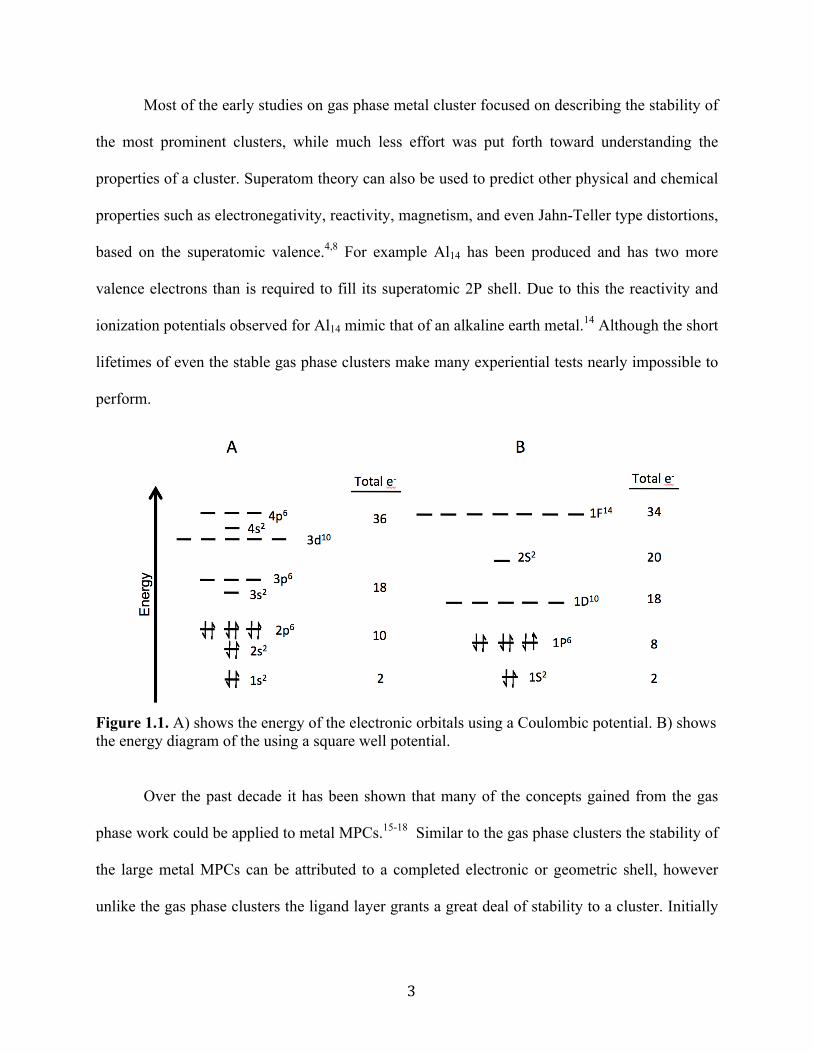
to the enhanced stability of these metal clusters. In 1984 Knight and coworkers realized that the
nuclear shell model correctly predicted the stability of gas phase sodium metal clusters.7 This
lead theoreticians to apply a similar model developed by Nilsson. In the model developed for
metal clusters the s and p valence electrons are considered to be delocalized over the entire
cluster and experience a spherically symmetric square well potential. Solving the Schrödinger
equation with these approximations gives rise to a new set of molecular orbitals that have the
same symmetry as normal atomic orbitals, thus this model has coined the name
superatom’theory.8 The new ‘superatomic’ orbitals derived from this mode appear as |1S2|,
|1S21P6|, |1S21P61D102S2|, |1S21P61D102S21F142P6 |. . . corresponding to electron counts of 2, 8,
20, 40 . . . , respectively, as shown in Figure 1.1.7 When the number of valence electrons in a
metal cluster fills a ‘superatomic’ orbital stability is gained, similar to a normal atom, Superatom
theory has since been successfully applied to many other gas phase clusters. 9-11 However
superatom theory could not be used to rationalize the stability of all metal clusters observed. It
was soon discovered that in many cases these numbers corresponded to a completed geometric
shell.12,13 By completing a geometric shell it is possible to obtain the minimum surface energy
and the maximum coordination for each atom in the system. Thus the stability of gas phase metal
clusters can be understood to be as a competition between electronic and geometric shell
closures.
3
Most of the early studies on gas phase metal cluster focused on describing the stability of
the most prominent clusters, while much less effort was put forth toward understanding the
properties of a cluster. Superatom theory can also be used to predict other physical and chemical
properties such as electronegativity, reactivity, magnetism, and even Jahn-Teller type distortions,
based on the superatomic valence.4,8 For example Al14 has been produced and has two more
valence electrons than is required to fill its superatomic 2P shell. Due to this the reactivity and
ionization potentials observed for Al14 mimic that of an alkaline earth metal.14 Although the short
lifetimes of even the stable gas phase clusters make many experiential tests nearly impossible to
perform.
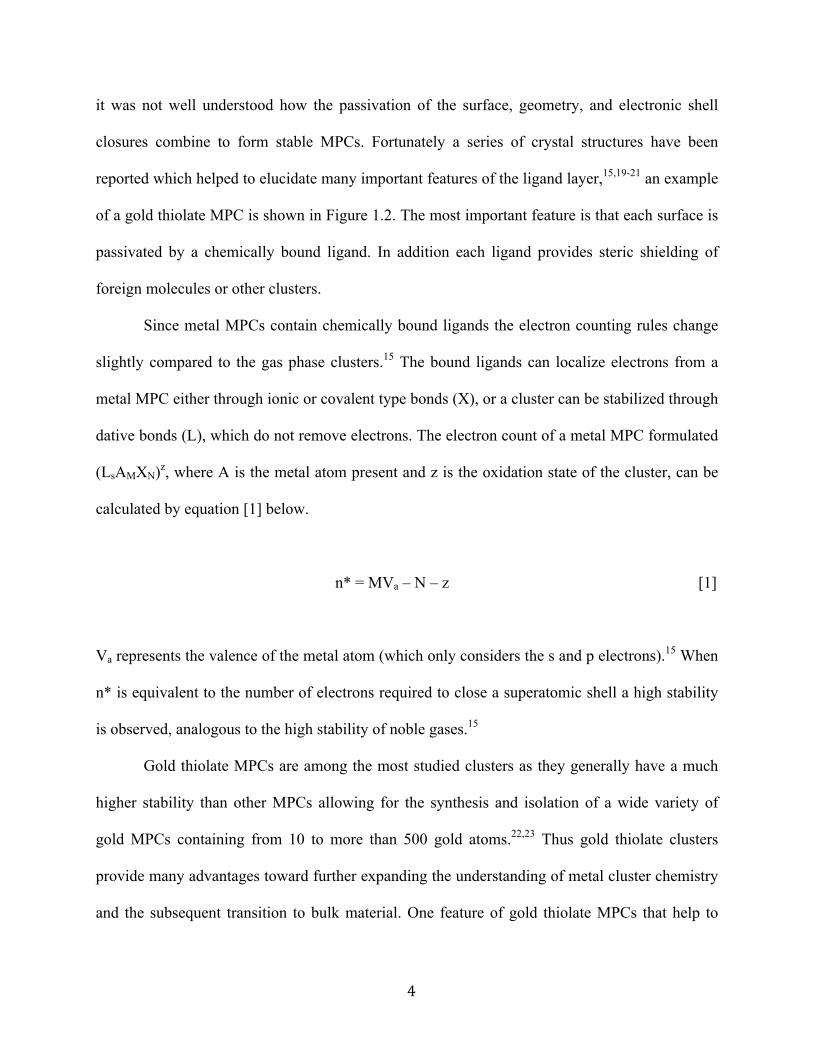
Figure 1.1. A) shows the energy of the electronic orbitals using a Coulombic potential. B) shows the energy diagram of the using a square well potential.
Over the past decade it has been shown that many of the concepts gained from the gas
phase work could be applied to metal MPCs.15-18 Similar to the gas phase clusters the stability of
the large metal MPCs can be attributed to a completed electronic or geometric shell, however
unlike the gas phase clusters the ligand layer grants a great deal of stability to a cluster. Initially
4
it was not well understood how the passivation of the surface, geometry, and electronic shell
closures combine to form stable MPCs. Fortunately a series of crystal structures have been
reported which helped to elucidate many important features of the ligand layer,15,19-21 an example
of a gold thiolate MPC is shown in Figure 1.2. The most important feature is that each surface is
passivated by a chemically bound ligand. In addition each ligand provides steric shielding of
foreign molecules or other clusters.
Since metal MPCs contain chemically bound ligands the electron counting rules change
slightly compared to the gas phase clusters.15 The bound ligands can localize electrons from a
metal MPC either through ionic or covalent type bonds (X), or a cluster can be stabilized through
dative bonds (L), which do not remove electrons. The electron count of a metal MPC formulated
(LsAMXN)z, where A is the metal atom present and z is the oxidation state of the cluster, can be
calculated by equation [1] below.
n* = MVa – N – z [1]
Va represents the valence of the metal atom (which only considers the s and p electrons).15 When
n* is equivalent to the number of electrons required to close a superatomic shell a high stability
is observed, analogous to the high stability of noble gases.15
Gold thiolate MPCs are among the most studied clusters as they generally have a much
higher stability than other MPCs allowing for the synthesis and isolation of a wide variety of
gold MPCs containing from 10 to more than 500 gold atoms.22,23 Thus gold thiolate clusters
provide many advantages toward further expanding the understanding of metal cluster chemistry
and the subsequent transition to bulk material. One feature of gold thiolate MPCs that help to
5
elucidate the nature of metal clusters is that in many cases undergo reversible charging events in
electrochemistry, making it possible to compare the effects of the superatomic valence for a
single cluster. Most notably superatom theory has been able to correctly predict the magnetic
properties of Au25(SR)18 in the –1 and 0 charge states. Electron paramagnetic resonance
spectroscopy (EPR) has revealed that Au25(SR)18-1 is diamagnetic due to a completed
superatomic orbital (1S21P6), while Au25(SR)180 (1S21P5) is paramagnetic resulting from one
unpaired.24,25 Unfortunately the effects of the superatomic valence have remained largely
untested for gold thiolate MPCs.
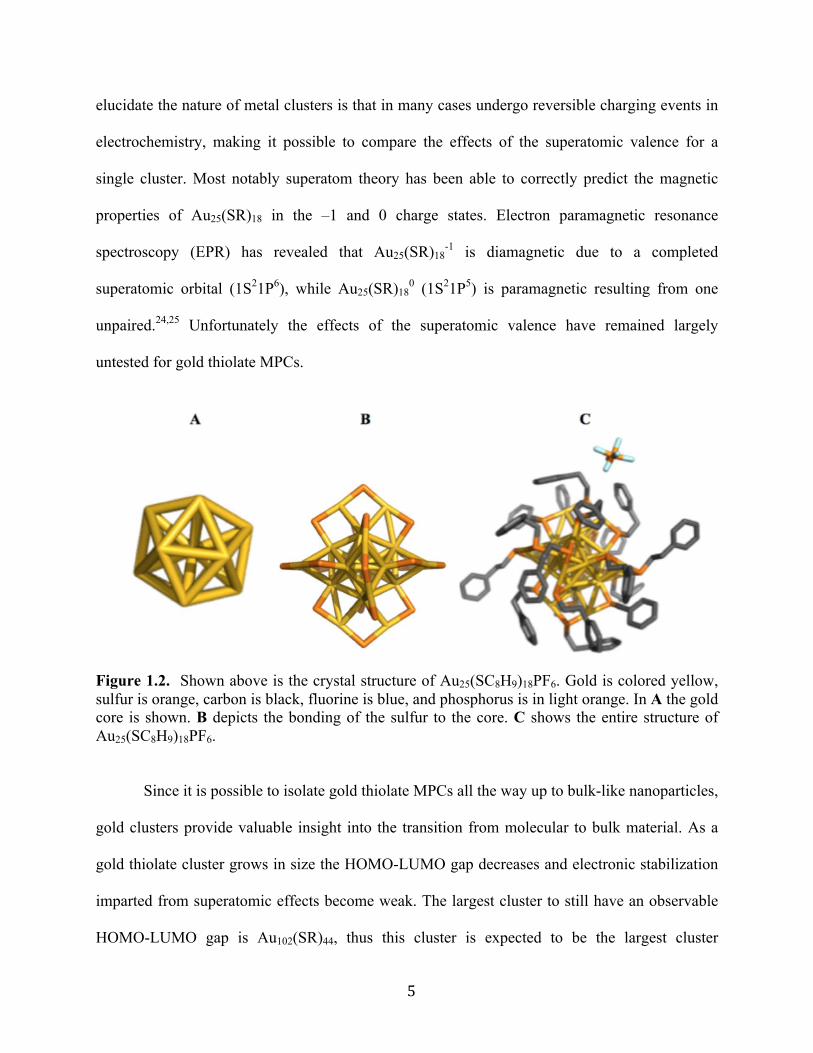
Figure 1.2. Shown above is the crystal structure of Au25(SC8H9)18PF6. Gold is colored yellow, sulfur is orange, carbon is black, fluorine is blue, and phosphorus is in light orange. In A the gold core is shown. B depicts the bonding of the sulfur to the core. C shows the entire structure of Au25(SC8H9)18PF6.
Since it is possible to isolate gold thiolate MPCs all the way up to bulk-like nanoparticles,
gold clusters provide valuable insight into the transition from molecular to bulk material. As a
gold thiolate cluster grows in size the HOMO-LUMO gap decreases and electronic stabilization
imparted from superatomic effects become weak. The largest cluster to still have an observable
HOMO-LUMO gap is Au102(SR)44, thus this cluster is expected to be the largest cluster
6
stabilized through superatomic effects, while larger clusters are stabilized through geometric
effects.15 However it is not readily apparent at what point superatomic effects give way to bulk
material. The largest cluster to still have an observable HOMO-LUMO gap is Au102(SR)44, thus
this cluster is expected to be the largest cluster stabilized through superatomic effects, while
larger clusters are stabilized through geometric effects. Another question that remains for
clusters on the verge of bulk material is the symmetry that the metal cluster adopts. Bulk gold
adopts a face center cubic lattice, which has an octahedral symmetry, however the observed
symmetry for many metal clusters is near icosahedral. Therefore at some size a metal cluster will
adopt the geometry observed in the bulk. Although it is not clear for what sizes this occurs and
how the geometry affects the properties of a metal cluster. It has proven difficult to determine
crystal structures for clusters larger than Au102(SR)44, however it is expected that clusters in this
size range can adopt both octahedral and icosahedral symmetries.22,27 Gold thiolate clusters in
this size range mark the transition from superatomic to bulk system making it possible to study
the evolution of a metal particle from molecular to bulk material one step at a time.
Early studies on gas phase metal clusters revealed many valuable insights into metal
bonding. Unfortunately, the “stable” gas phase clusters often exist for seconds or less, making
many empirical tests impossible. Recently, it has been shown that many of the concepts that have
been developed for gas phase clusters can be extended to solution-stable MPCs. The most
notable are gold thiolate MPCs, due to the high stability and wide range in sizes that can be
produced. In combination with the advancements made in characterization techniques research
into gold thiolate MPCs provide valuable insights into the fundamental nature of metallic
bonding between the bulk and molecular systems.
7
References
(1) Mingos, M.; Wales, D. Introduction to Cluster Chemistry; Prentice-Hall, 1990.
(2) Hagel, J.; Kelemen, M. T.; Fischer, G.; Pilawa, B.; Wosnitza, J.; Dormann, E.; Löhneysen,
H. v; Schnepf, A.; Schnöckel, H.; Neisel, U.; Beck, J. J. Low Temp. Phys. 2002, 129 (3–
4), 133–142.
(3) Castleman, A. W.; Khanna, S. N. J. Phys. Chem. C 2009, 113 (7), 2664–2675.
(4) Jena, P. J. Phys. Chem. Lett. 2013, 4 (9), 1432–1442.
(5) Mingos, D. M. P. Acc. Chem. Res. 1984, 17 (9), 311–319.
(6) Corbett, J. D. Inorg. Chem. 2000, 39 (23), 5178–5191.
(7) Knight, W. D.; Clemenger, K.; de Heer, W. A.; Saunders, W. A.; Chou, M. Y.; Cohen, M.
L. Phys. Rev. Lett. 1984, 52 (24), 2141–2143.
(8) de Heer, W. A. Rev. Mod. Phys. 1993, 65 (3), 611–676.
(9) Schriver, null; Persson, null; Honea, null; Whetten, null. Phys. Rev. Lett. 1990, 64 (21),
2539–2542.
(10) Brack, M.; Genzken, O.; Hansen, K. Z. Für Phys. At. Mol. Clust. 19 (4), 51–53.
(11) Katakuse, I.; Ichihara, T.; Fujita, Y.; Matsuo, T.; Sakurai, T.; Matsuda, H. Int. J. Mass
Spectrom. Ion Process. 1986, 69 (1), 109–114.
(12) Rayane, D.; Benamar, A.; Melinon, P.; Tribollet, B.; Broyer, M. Z. Für Phys. At. Mol.
Clust. 19 (4), 191–193.
(13) Rayane, D.; Melinon, P.; Cabaud, B.; Hoareau, A.; Tribollet, B.; Broyer, M. Phys. Rev. A
1989, 39 (11), 6056–6059.
(14) Bergeron, D. E.; Roach, P. J.; Castleman, A. W.; Jones, N. O.; Khanna, S. N. Science
2005, 307 (5707), 231–235.
8
(15) Walter, M.; Akola, J.; Lopez-Acevedo, O.; Jadzinsky, P. D.; Calero, G.; Ackerson, C. J.;
Whetten, R. L.; Grönbeck, H.; Häkkinen, H. Proc. Natl. Acad. Sci. 2008, 105 (27), 9157–
9162.
(16) Lopez-Acevedo, O.; Clayborne, P. A.; Häkkinen, H. Phys. Rev. B 2011, 84 (3), 35434.
(17) Joshi, C. P.; Bootharaju, M. S.; Alhilaly, M. J.; Bakr, O. M. J. Am. Chem. Soc. 2015, 137
(36), 11578–11581.
(18) Aluminum(I) and Gallium(I) Compounds: Syntheses, Structures, and Reactions -
Dohmeier - 2003 - Angewandte Chemie International Edition in English - Wiley Online
Library
http://onlinelibrary.wiley.com/doi/10.1002/anie.199601291/abstract?systemMessage=Wile
y+Online+Library+will+be+disrupted+on+21st+March+from+10%3A30+GMT+%2806%
3A30+EDT%29+for+up+to+six+hours+for+essential+maintenance.++Apologies+for+the
+inconvenience. (accessed Mar 20, 2015).
(19) Dainese, T.; Antonello, S.; Gascón, J. A.; Pan, F.; Perera, N. V.; Ruzzi, M.; Venzo, A.;
Zoleo, A.; Rissanen, K.; Maran, F. ACS Nano 2014, 8 (4), 3904–3912.
(20) Heaven, M. W.; Dass, A.; White, P. S.; Holt, K. M.; Murray, R. W. J. Am. Chem. Soc.
2008, 130 (12), 3754–3755.
(21) Zeng, C.; Chen, Y.; Kirschbaum, K.; Appavoo, K.; Sfeir, M. Y.; Jin, R. Sci. Adv. 2015, 1
(2), e1500045.
(22) Negishi, Y.; Nakazaki, T.; Malola, S.; Takano, S.; Niihori, Y.; Kurashige, W.; Yamazoe,
S.; Tsukuda, T.; Häkkinen, H. J. Am. Chem. Soc. 2015, 137 (3), 1206–1212.
(23) Dass, A. J. Am. Chem. Soc. 2011, 133 (48), 19259–19261.
9
(24) Venzo, A.; Antonello, S.; Gascón, J. A.; Guryanov, I.; Leapman, R. D.; Perera, N. V.;
Sousa, A.; Zamuner, M.; Zanella, A.; Maran, F. Anal. Chem. 2011, 83 (16), 6355–6362.
(25) Akbari-Sharbaf, A.; Hesari, M.; Workentin, M. S.; Fanchini, G. J. Chem. Phys. 2013, 138
(2), 24305-024305–5.
(26) Lopez-Acevedo, O.; Akola, J.; Whetten, R. L.; Grönbeck, H.; Häkkinen, H. J. Phys.
Chem. C 2009, 113 (13), 5035–5038.
(27) Dass, A.; Theivendran, S.; Nimmala, P. R.; Kumara, C.; Jupally, V. R.; Fortunelli, A.;
Sementa, L.; Barcaro, G.; Zuo, X.; Noll, B. C. J. Am. Chem. Soc. 2015, 137 (14), 4610–
4613.
10
Chapter 2
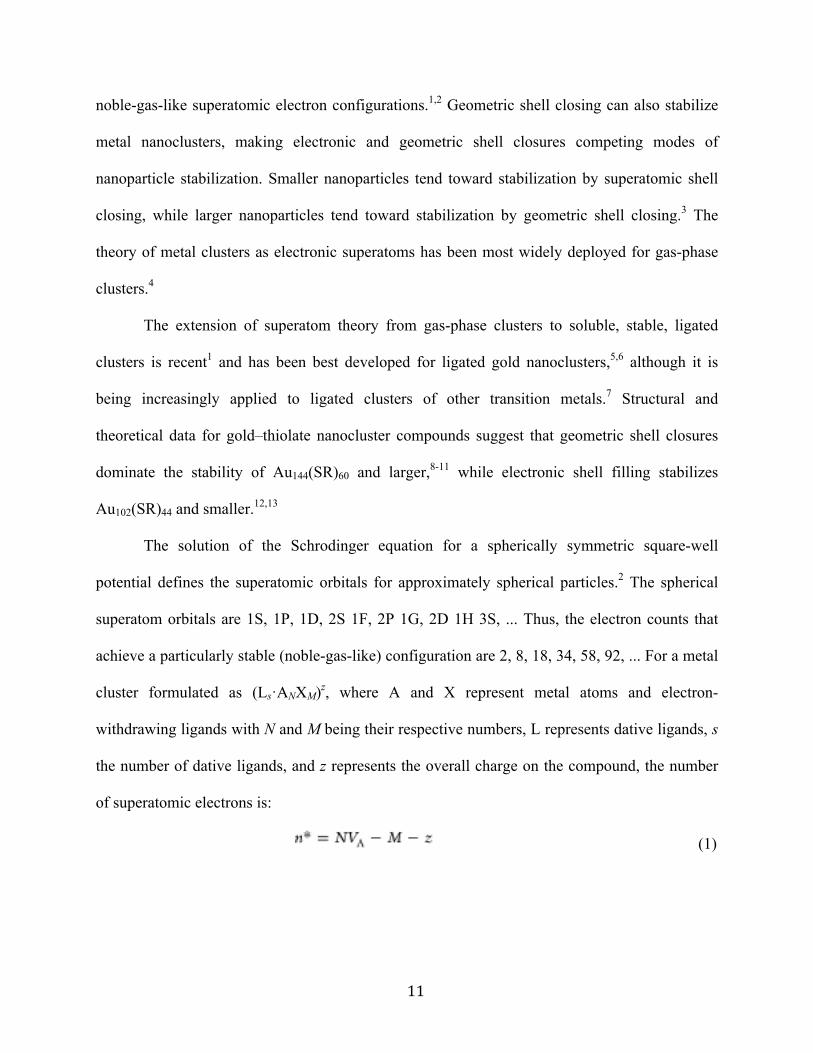
Superatom Electron Configuration Predicts Thermal Stability of Au25(SR)18 Nanoclusters*
2.1 Synopsis
The exceptional stability of ligand-stabilized gold nanoclusters such as Au25(SC6H13)18–1,
Au39(PR3)14X6–1, and Au102(SR)44 arises from the total filling of superatomic electron shells
resulting in a “noble-gas superatom” electron configuration. Electrochemical manipulation of
oxidation state can add or remove electrons from superatom orbitals creating species
electronically analogous to atomic radicals. Herein we show that oxidizing the Au25(SR)18–1
superatom from the noble gas like 1S2 1P6 to the open shell radical 1S2 1P5 and diradical 1S2 1P4
electron configurations results in decreased thermal stability of the compound, as measured by
differential scanning calorimetry. Similar experiments probing 5 oxidation states of the
putatively geometrically stabilized Au144(SR)60 cluster suggest a more complex relationship
between oxidation state and thermal stability for this compound.
2.2 Introduction
The electron configurations of elements predict a remarkable set of properties, including
ionization energy, electronegativity, and bonding valency. The superatomic electron
configurations of metal clusters predict stable molecular formulas, which are associated with
* The work presented herein is published in the Journal of the American Chemical Society with
Marcus A. Tofanelli and Christopher J. Ackerson as coauthors. Marcus Tofanelli’s include
experimental design, data analysis, and synthetic development and characterization of gold
nanoclusters and assemblies. Permission to reprint this material was granted by the American
Chemical Society. © 2012 American Chemical Society. J. Am. Chem. Soc., 2012, 134 (41),
16937–16940.
11
noble-gas-like superatomic electron configurations.1,2 Geometric shell closing can also stabilize
metal nanoclusters, making electronic and geometric shell closures competing modes of
nanoparticle stabilization. Smaller nanoparticles tend toward stabilization by superatomic shell
closing, while larger nanoparticles tend toward stabilization by geometric shell closing.3 The
theory of metal clusters as electronic superatoms has been most widely deployed for gas-phase
clusters.4
The extension of superatom theory from gas-phase clusters to soluble, stable, ligated
clusters is recent1 and has been best developed for ligated gold nanoclusters,5,6 although it is
being increasingly applied to ligated clusters of other transition metals.7 Structural and
theoretical data for gold–thiolate nanocluster compounds suggest that geometric shell closures
dominate the stability of Au144(SR)60 and larger,8-11 while electronic shell filling stabilizes
Au102(SR)44 and smaller.12,13
The solution of the Schrodinger equation for a spherically symmetric square-well
potential defines the superatomic orbitals for approximately spherical particles.2 The spherical
superatom orbitals are 1S, 1P, 1D, 2S 1F, 2P 1G, 2D 1H 3S, ... Thus, the electron counts that
achieve a particularly stable (noble-gas-like) configuration are 2, 8, 18, 34, 58, 92, ... For a metal
cluster formulated as (Ls·ANXM)z, where A and X represent metal atoms and electron-
withdrawing ligands with N and M being their respective numbers, L represents dative ligands, s
the number of dative ligands, and z represents the overall charge on the compound, the number
of superatomic electrons is:
(1)
12
where V is the valence of the metal atom (V = 1 for Au, which donates its 6s electron). When n*
is equivalent to the number of electrons required to close a superatomic shell (i.e., a magic
number), special stability is observed, analogous to the special stability of noble gases.
Implicit in the superatom description of nanoclusters is that filled electronic shells produce
highly inert, noble-gas-like compounds, while open-shell compounds may be more reactive.
Castleman and Khanna extended the superatom theory to show that ion pairs14 and extended
solid-state networks15,16 can be formed from open-shell Al and As clusters that are soft-landed
from the gas phase.
Compared with the work on soft-landed gas-phase clusters, the application of superatom
theory to ligated clusters is more limited and to date has been used in two notable ways. First,
superatom theory has been used to explain the special stability of compounds such as
Au25(SR)18–1, Au39(PPh3)14Cl6
–1, Au68(SR)34, and Au102(SR)44 as resulting from total fillings of
the 2P, 1F, 1F, and 1G shells (i.e., n = 8, 34, 34, and 58), respectively. 1,13,17-21. Second, the
observed paramagnetism of the Au25(SR)180 species has been explained in terms of an unpaired
superatomic electron arising in a 1S2 1P5 superatomic electron configuration. 6,17
Here we performed a direct experimental test of the superatom theory as applied to
ligated metal clusters and established that superatomic electron configurations of Au25(SC6H13)18
are predictive of the thermal decomposition temperature of this compound. For comparison, we
also established the thermal stability of charge states of the putatively geometrically stabilized8,22
compound Au144(SC6H13)60.
13
2.3 Methods
Au25(SC6H13)18 and Au144(SC6H13)60 were prepared by the methods of Murray23 and
Jin24 respectively with minor modifications detailed in the supporting information. Differential
pulse voltammetry was done on a Bioanalytical Systems BAS 100B potentionstat using
100mmol TBAPF6, or about 50 mmol TEABF4 in dichloromethane as electrolyte and solvent,
similar to the previous work of Murray25-29.
Bulk electrolysis was performed under air in a two frit, three chamber electrochemical
cell, controlled by the same potentiostat used for the DPV experiments.
Differential Scanning Calorimetry (DSC) was accomplished with TA Intruments 2920
modulated DSC. All products were redissolved in a minimal amount of DCM and then
deposited into an aluminum hermetic DSC pan and allowed to air dry in order to achieve uniform
coverage of the pan. Vacuum was applied for 10 min to ensure complete removal of DCM.
Greater experimental detail may be found in the supporting information.
2.4 Results and Discussion
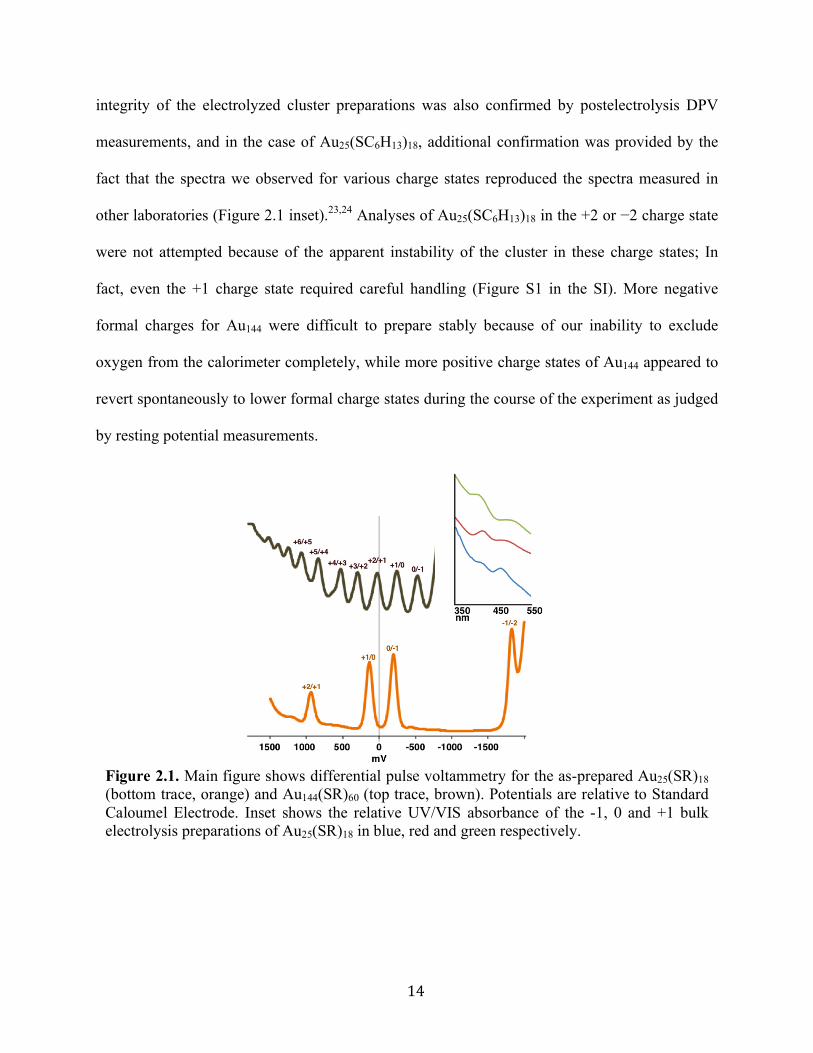
We prepared Au25(SC6H13)18 in the −1, 0, and 1 charge states and Au144(SC6H13)60 in the
−1, 0, 1, 2, and 3 charge states. The preparation of each formal charge state proceeded by initial
collection of a differential pulse voltammogram and verification that the as-prepared clusters
showed the expected electrochemical response (Figure 2.1). Following the DPV measurement,
analytical amounts (1–3 mg) of each cluster in each targeted formal charge state were prepared
by bulk electrolysis. To isolate the stability effect of the cluster core charge from the effect of
counterions, we executed bulk electrolysis with two different electrolytes, TBAPF6 and TEABF4.
Success of the bulk electrolysis preparation was verified by resting potential measurements. The
14
integrity of the electrolyzed cluster preparations was also confirmed by postelectrolysis DPV
measurements, and in the case of Au25(SC6H13)18, additional confirmation was provided by the
fact that the spectra we observed for various charge states reproduced the spectra measured in
other laboratories (Figure 2.1 inset).23,24 Analyses of Au25(SC6H13)18 in the +2 or −2 charge state
were not attempted because of the apparent instability of the cluster in these charge states; In
fact, even the +1 charge state required careful handling (Figure S1 in the SI). More negative
formal charges for Au144 were difficult to prepare stably because of our inability to exclude
oxygen from the calorimeter completely, while more positive charge states of Au144 appeared to
revert spontaneously to lower formal charge states during the course of the experiment as judged
by resting potential measurements.
Figure 2.1. Main figure shows differential pulse voltammetry for the as-prepared Au25(SR)18 (bottom trace, orange) and Au144(SR)60 (top trace, brown). Potentials are relative to Standard Caloumel Electrode. Inset shows the relative UV/VIS absorbance of the -1, 0 and +1 bulk electrolysis preparations of Au25(SR)18 in blue, red and green respectively.
15
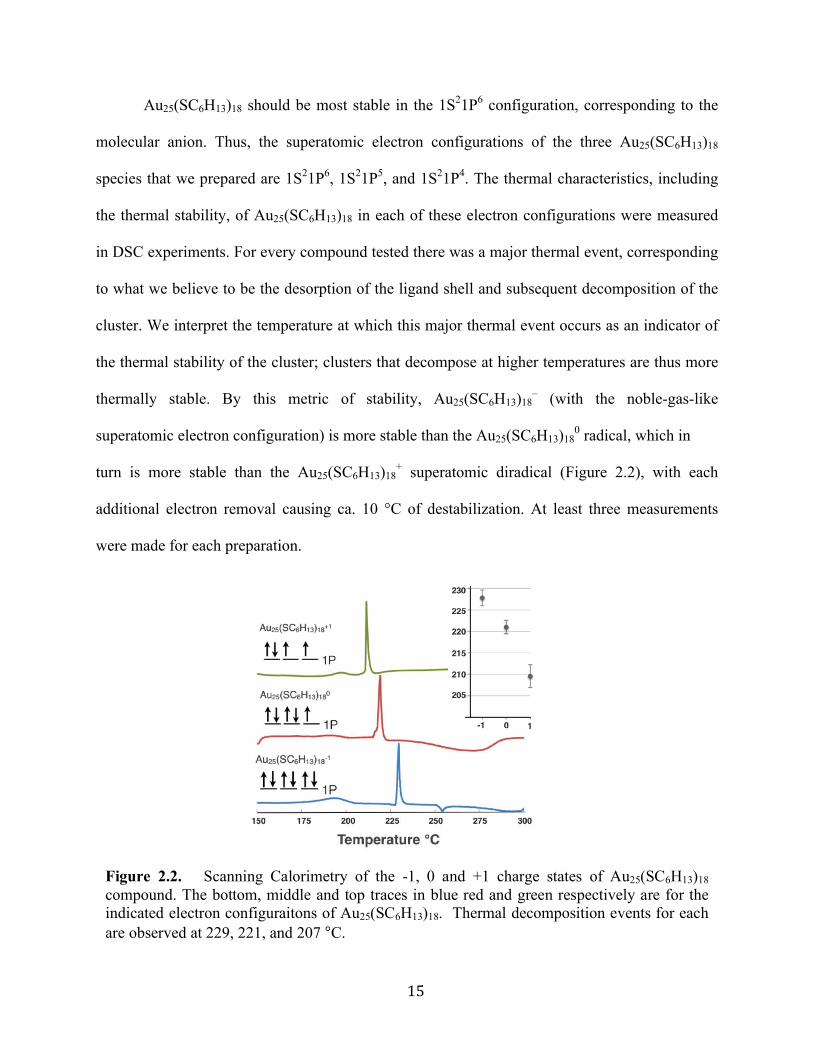
Au25(SC6H13)18 should be most stable in the 1S21P6 configuration, corresponding to the
molecular anion. Thus, the superatomic electron configurations of the three Au25(SC6H13)18
species that we prepared are 1S21P6, 1S21P5, and 1S21P4. The thermal characteristics, including
the thermal stability, of Au25(SC6H13)18 in each of these electron configurations were measured
in DSC experiments. For every compound tested there was a major thermal event, corresponding
to what we believe to be the desorption of the ligand shell and subsequent decomposition of the
cluster. We interpret the temperature at which this major thermal event occurs as an indicator of
the thermal stability of the cluster; clusters that decompose at higher temperatures are thus more
thermally stable. By this metric of stability, Au25(SC6H13)18– (with the noble-gas-like
superatomic electron configuration) is more stable than the Au25(SC6H13)180 radical, which in
turn is more stable than the Au25(SC6H13)18+ superatomic diradical (Figure 2.2), with each
additional electron removal causing ca. 10 °C of destabilization. At least three measurements
were made for each preparation.
Figure 2.2. Scanning Calorimetry of the -1, 0 and +1 charge states of Au25(SC6H13)18
compound. The bottom, middle and top traces in blue red and green respectively are for the indicated electron configuraitons of Au25(SC6H13)18. Thermal decomposition events for each are observed at 229, 221, and 207 °C.
16
For the Au25(SC6H13)180 and Au25(SC6H13)18
+ charge states, different electrolytes gave
indistinguishable stability measurements when the standard error was taken into account. The
Au25(SC6H13)18– charge state appeared to be slightly stabilized by the tetrabutylammonium
counterion relative to the tetramethylammonium or tetraethylammonium counterion, although
the effect of the electrolyte was small in comparison with the effect of the charge state. The
Figure 2.2 inset reports the results of the DSC runs for all of the electrolytes with standard error.
Figure S2 shows the separate effects of the electrolyte and charge on the thermal stability.
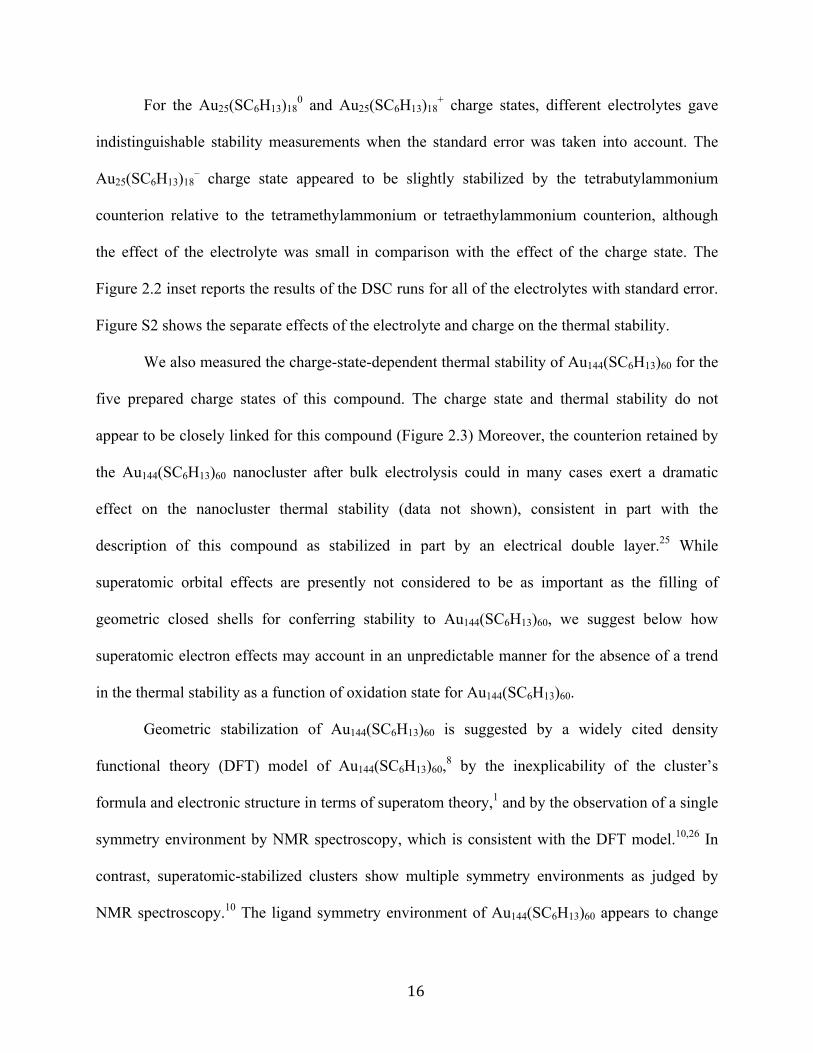
We also measured the charge-state-dependent thermal stability of Au144(SC6H13)60 for the
five prepared charge states of this compound. The charge state and thermal stability do not
appear to be closely linked for this compound (Figure 2.3) Moreover, the counterion retained by
the Au144(SC6H13)60 nanocluster after bulk electrolysis could in many cases exert a dramatic
effect on the nanocluster thermal stability (data not shown), consistent in part with the
description of this compound as stabilized in part by an electrical double layer.25 While
superatomic orbital effects are presently not considered to be as important as the filling of
geometric closed shells for conferring stability to Au144(SC6H13)60, we suggest below how
superatomic electron effects may account in an unpredictable manner for the absence of a trend
in the thermal stability as a function of oxidation state for Au144(SC6H13)60.
Geometric stabilization of Au144(SC6H13)60 is suggested by a widely cited density
functional theory (DFT) model of Au144(SC6H13)60,8 by the inexplicability of the cluster’s
formula and electronic structure in terms of superatom theory,1 and by the observation of a single
symmetry environment by NMR spectroscopy, which is consistent with the DFT model.10,26 In
contrast, superatomic-stabilized clusters show multiple symmetry environments as judged by
NMR spectroscopy.10 The ligand symmetry environment of Au144(SC6H13)60 appears to change
17
reversibly upon oxidation and reduction of the Au144(SC6H13)60 cluster.26 Taken together, the
unpredictable counterion- and charge-dependent thermal stability and the apparent breakdown of
symmetry in some oxidation states leads us to speculate that residual superatom electronic
effects may provoke Jahn–Teller-type distortion of these structurally obscure clusters. This
means that competing superatomic effects may alter the structure and electronic and thermal
stability of these clusters in unpredictable ways that depend on the interplay of geometric,
ligand-steric, and electronic effects.
In contrast to Au144(SC6H13)60, the outer coordination shell [SR–Au(I)–SR–Au(I)–SR
units] of Au25(SC6H13)18 may act in concert with the organic ligands of this cluster to constrain
the geometry even when the superatomic electron configuration favors Jahn–Teller-type
distortion. Thus, there are no significant distortions between Au25(SC6H13)18– and
Figure 2.3. Differential Scanning Calorimetry of representative samples of Au144(SC6H13)60 in +3, +2, +1, 0, and -1 oxidation states. Inset shows the decomposition temperature for multiple masurements at each oxidation state, with error bars representing the standard deviation for the set of measurements. Only one measurement was made for the +3 oxidation state.
18
Au25(SC6H13)180 in single-crystal X-ray structures,13,18,27 while we observe stability trends
predicted by the superatomic electron configuration. While the low rates of electron transfer for
Au25(SR)180/–1 noted by Murray and Maran23 suggest a charge-state-dependent distortion, the
totality of current evidence suggests that this distortion is small.
In conclusion, we have shown that the superatom electron configuration predicts a
thermal stability trend for noble-gas, radical, and diradical superatom electron configurations of
Au25(SR)18. Clear trends were not observed for Au144(SR)60, leading us to speculate that a
complex interplay of electronic and geometric effects may be of importance. The extension of
superatom theory to predict other properties of ligated clusters, such as superatomic valency and
catalytic reactivity, remain largely open questions.
19
References
(1) Walter, M.; Akola, J.; Lopez-Acevedo, O.; Jadzinsky, P. D.; Calero, G.; Ackerson, C. J.;
Whetten, R. L.; Grönbeck, H.; Häkkinen, H. Proc. Natl. Acad. Sci. 2008, 105 (27), 9157–9162.
(2) de Heer, W. A. Rev. Mod. Phys. 1993, 65 (3), 611–676.
(3) Martin, T. P.; Bergmann, T.; Goehlich, H.; Lange, T. J. Phys. Chem. 1991, 95 (17),
6421–6429.
(4) Castleman, A. W. J. Phys. Chem. Lett. 2011, 2 (9), 1062–1069.
(5) Häkkinen, H. Chem. Soc. Rev. 2008, 37 (9), 1847–1859.
(6) Zhu, M.; Aikens, C. M.; Hendrich, M. P.; Gupta, R.; Qian, H.; Schatz, G. C.; Jin, R. J.
Am. Chem. Soc. 2009, 131 (7), 2490–2492.
(7) Clayborne, P. A.; Lopez-Acevedo, O.; Whetten, R. L.; Grönbeck, H.; Häkkinen, H. Eur.
J. Inorg. Chem. 2011, 2011 (17), 2649–2652.
(8) Lopez-Acevedo, O.; Akola, J.; Whetten, R. L.; Grönbeck, H.; Häkkinen, H. J. Phys.
Chem. C 2009, 113 (13), 5035–5038.
(9) Dass, A. J. Am. Chem. Soc. 2011, 133 (48), 19259–19261.
(10) Wong, O. A.; Heinecke, C. L.; Simone, A. R.; Whetten, R. L.; Ackerson, C. J. Nanoscale
2012, 4 (14), 4099.
(11) Qian, H.; Zhu, Y.; Jin, R. Proc. Natl. Acad. Sci. 2012, 109 (3), 696–700.
(12) Lopez-Acevedo, O.; Tsunoyama, H.; Tsukuda, T.; Hannu Häkkinen; Aikens, C. M. J.
Am. Chem. Soc. 2010, 132 (23), 8210–8218.
(13) Zhu, M.; Aikens, C. M.; Hollander, F. J.; Schatz, G. C.; Jin, R. J. Am. Chem. Soc. 2008,
130 (18), 5883–5885.
20
(14) Bergeron, D. E.; Castleman, A. W.; Morisato, T.; Khanna, S. N. Science 2004, 304
(5667), 84–87.
(15) Castleman, A. W.; Khanna, S. N. J. Phys. Chem. C 2009, 113 (7), 2664–2675.
(16) Claridge, S. A.; Castleman, A. W.; Khanna, S. N.; Murray, C. B.; Sen, A.; Weiss, P. S.
ACS Nano 2009, 3 (2), 244–255.
(17) Nealon, G. L.; Donnio, B.; Greget, R.; Kappler, J.-P.; Terazzi, E.; Gallani, J.-L.
Nanoscale 2012, 4 (17), 5244–5258.
(18) Heaven, M. W.; Dass, A.; White, P. S.; Holt, K. M.; Murray, R. W. J. Am. Chem. Soc.
2008, 130 (12), 3754–3755.
(19) Teo, B. K.; Shi, X.; Zhang, H. J. Am. Chem. Soc. 1992, 114 (7), 2743–2745.
(20) Dass, A. J. Am. Chem. Soc. 2009, 131 (33), 11666–11667.
(21) Jadzinsky, P. D.; Calero, G.; Ackerson, C. J.; Bushnell, D. A.; Kornberg, R. D. Science
2007, 318 (5849), 430–433.
(22) Kumara, C.; Dass, A. Nanoscale 2011, 3 (8), 3064–3067.
(23) Parker, J. F.; Fields-Zinna, C. A.; Murray, R. W. Acc. Chem. Res. 2010, 43 (9), 1289–
1296.
(24) Venzo, A.; Antonello, S.; Gascón, J. A.; Guryanov, I.; Leapman, R. D.; Perera, N. V.;
Sousa, A.; Zamuner, M.; Zanella, A.; Maran, F. Anal. Chem. 2011, 83 (16), 6355–6362.
(25) Murray, R. W. Chem. Rev. 2008, 108 (7), 2688–2720.
(26) Song, Y.; Harper, A. S.; Murray, R. W. Langmuir 2005, 21 (12), 5492–5500.
(27) Zhu, M.; Eckenhoff, W. T.; Pintauer, T.; Jin, R. J. Phys. Chem. C 2008, 112 (37), 14221–
14224.
21
(28) Parker, J. F.; Weaver, J. E. F.; McCallum, F.; Fields-Zinna, C. A.; Murray, R. W.
Langmuir 2010, 26 (16), 13650–13654.
(29) Qian, H.; Jin, R. Chem. Mater. 2011, 23 (8), 2209–2217.
(30) Gold Nanoelectrodes of Varied Size: Transition to Molecule-Like Charging | Science
https://secure.colostate.edu/content/280/5372/,DanaInfo=science.sciencemag.org+2098
(accessed May 24, 2016).
(31) Ingram, R. S.; Hostetler, M. J.; Murray, R. W.; Schaaff, T. G.; Khoury, J. T.; Whetten, R.
L.; Bigioni, T. P.; Guthrie, D. K.; First, P. N. J. Am. Chem. Soc. 1997, 119 (39), 9279–9280.
(32) García-Raya, D.; Madueño, R.; Blázquez, M.; Pineda, T. J. Phys. Chem. C 2009, 113
(20), 8756–8761.
(33) Quinn, B. M.; Liljeroth, P.; Ruiz, V.; Laaksonen, T.; Kontturi, K. J. Am. Chem. Soc.
2003, 125 (22), 6644–6645.
22
Chapter 3
Jahn–Teller effects in Au25(SR)18*
3.1 Synopsis
The relationship between oxidation state, structure, and magnetism in many molecules is
well described by first-order Jahn–Teller distortions. This relationship is not yet well defined for
ligated nanoclusters and nanoparticles, especially the nano-technologically relevant gold-thiolate
protected metal clusters. Here we interrogate the relationships between structure, magnetism, and
oxidation state for the three stable oxidation states, −1, 0 and +1 of the thiolate protected
nanocluster Au25(SR)18. We present the single crystal X-ray structures of the previously
undetermined charge state Au25(SR)18+1, as well as a higher quality single crystal structure of the
neutral compound Au25(SR)180. Structural data combined with SQUID magnetometry and DFT
theory enable a complete description of the optical and magnetic properties of Au25(SR)18 in the
three oxidation states. In aggregate the data suggests a first-order Jahn–Teller distortion in this
compound. The high quality single crystal X-ray structure enables an analysis of the ligand–
ligand and ligand–cluster packing interactions that underlie single-crystal formation in thiolate
protected metal clusters.
* The work presented herein is published in Chemical Science with Marcus A. Tofanelli, Kirsi
Salorinne, Thomas W. Ni, Sami Malola, Brian Newell, Billy Phillips, Hannu Häkkinen,
Christopher J. Ackerson as joint authors. Marcus Tofanelli’s contributions include experimental
design, data analysis, and synthetic development and characterization of gold nanoclusters and
assemblies. © 2015 Royal Society of Chemistry American Chemical Society. Chem. Sci. , 2016,
7, 1882-1890.
23
3.2 Intro
The Jahn–Teller theorem establishes that molecular orbitals must be symmetrically
occupied by electrons in order for them to be energetically degenerate.1 Unequal occupation of
orbitals leads to breaking of the energetic degeneracy of the orbitals, with concomitant
distortions to the symmetry of the molecule, coupled to simultaneous changes in optical and
magnetic properties. Jahn–Teller effects are described experimentally for low-nuclearity metal
clusters,2 carbon clusters such as fullerenes,3 clusters in extended solids,4 Zintl phases,5 and
theoretically for larger nanoclusters.6-8
For nanocluster compounds (here we define a nanocluster as a metal cluster with one or
more metal atoms that is neighbored only by other metal atoms) the role of the Jahn–Teller effect
is unclear. In this work, we investigate the structural and magnetic properties of Au25(SR)18 in 3
charge states. Of the compounds comprising the Aux(SR)y monolayer protected cluster magic
number series,9 the Au25(SR)18 nanocluster10,11 is the best understood, both experimentally and
theoretically. The compound was initially isolated by Whetten,10 with the Au25(SR)18
formulation made subsequently by Tsukuda.12 The single-crystal X-ray structure13,14 combined
with reliable syntheses15,16 preceded the emergence of this compound as a singular subject for
understanding the physical and inorganic chemistry of broadly studied and applied17,18 thiolate
protected gold nanoclusters. Theoretical studies conclude that the frontier orbitals of Au25(SR)18
and many other Aux(SR)y compounds as large as Au102(SR)44 are well predicted by a spherical
superatom model.9,19 In this model, Au25(SR)18−1 is an 8e− system, corresponding to a noble gas-
like 1S21P6 superatom electron configuration. The superatom electron configuration of
Au25(SR)18 can be modified through now well established electrochemical methods which allows
for stable preparations of Au25(SR)18 in −1, 0 and +1 oxidation states, corresponding to 1S21P6,
24
1S21P5, and 1S21P4 superatom electron configurations, respectively. Several properties including
magnetism, optical absorption, catalytic reactivity and stability can be rationalized in terms of
superatom electron configuration.14,20,21 Of these reports, magnetic studies may give insight into
whether Au25(SR)18 is subject to Jahn–Teller effects.
If Jahn–Teller effects do not apply to Au25(SR)18, then Hund's rule predicts that the −1, 0,
and +1 charge states should be diamagnetic, S = 1/2 paramagnetic and S = 1 paramagnetic,
respectively. However, if the cluster has morphological flexibility and can change shape with
changing charge, then the superatomic orbitals may lose their degeneracy with changing charge
states and the −1, 0 and +1 charge states would become diamagnetic, S = 1/2 paramagnetic, and
diamagnetic, respectively. The magnetic properties of thiolate protected gold nanoparticles,
however, are controversial, with inconsistent reports of magnetic properties made for apparently
similar preparations.22 Indeed, even for the remarkably well defined cluster Au25(SR)18 there are
conflicting reports of magnetism. Of three prior reports interrogating Au25(SR)18 magnetism by
EPR or NMR spectroscopy, all reports found that the −1 and 0 oxidation states are diamagnetic
and S = 1/2 paramagnetic, consistent with superatom theory for the cluster. There are conflicting
reports, however, regarding the nature of the +1 cluster, with two studies concluding
diamagnetism and one study concluding paramagnetism.21-25
Here we present a comprehensive study on the structures, magnetic properties, and
optical properties of Au25(PET)18 in its three stable charge states. Notably we present the first
crystal structure of {[Au25(PET)18+1][PF6
−1]}, as well as a notably higher resolution crystal
structure of Au25(PET)180 relative to a previous report.26 These structures show the same general
atomic connectivity as observed in previous structures, with a 13 atom icosahedral core protected
by 6 SR–Au–SR–Au–SR “semiring” units. The formal symmetry of the entire molecule,
25
including the approximately icosahedral core, is Th.27 In addition, we make the first SQUID
magnetometry study of all three charge states, and also present linear absorption spectra from
redissolved crystals of each charge state, notably improving upon the previous
spectroelectrochemistry of this compound. We observe geometric distortions away from
idealized symmetry in the inorganic core, and these distortions increased with decreasing
superatomic valence from 1S21P6 to 1S21P4. The evolution of structure, magnetism and optical
properties with oxidation state can be understood in terms of Jahn–Teller effects.
3.3 Methods
Au25(PET)18- was synthesized using widely adopted methods.
13 [Au25(PET)18]
- [TOA]
+:
Au25(PET)18- was synthesized by co-dissolving 1 g of HAuCl4 and 1.560 g of
tetraoctylammonium bromide (TOAB) in 70 ml of THF. This solution was allowed to stir for 15
min over which time the solution turns from yellow to orange. Next 1.8 ml of phenylethanethiol
(PET) is added to the solution. The reaction mixture was stirred until it turned clear, which takes
about 3 hours. Once the solution turned clear a freshly prepared aqueous solution containing 965
mg of NaBH4 and 24 ml of water at 0 C ° was prepared. This aqueous solution is than rapidly
added to the THF solution under vigorous stirring and was allowed to stir for 2 days. The
reaction mixture was loosely covered to prevent the loss of THF over this course of time.
Au25(PET)18-1
can than be oxidized to the Au25(SR)180 by shaking in the presence of silica gel.
Au25(PET)18+ was synthesized through bulk electrolysis from crystallized Au25(PET)18
- or
Au25(PET)180. Au25(PET)18
- was dissolved in a solution of containing 0.1M TBAPF6 in DCM.
Bulk electrolysis was preformed at a constant potential in a three-compartment cell at 300 mV vs
SCE. Immediately after the bulk electrolysis was complete, the solution was prepared for
26
crystallization, as this compound appears to be unstable in solution for short periods of time.
Ethanol was added to the DCM solution used in bulk electrolysis until a precipitate formed. This
was than centrifuged and the solution was decanted. This was repeated until the precipitated
appears to contain Au25(PET)18+, as judged by UV/Vis. Once this Au25(PET)18
+ is sufficiently
pure the solution will appear green instead of yellow or orange. At this point the Au25(PET)18+
was put into a at -20 °C freezer with no insulation.
Au25(PET)18- was synthesized using previously reported methods.
13 The as-synthesized
product was than oxidized to the Au25(SR)180 by shaking in the presence of silica gel. The
cationic form was produced by bulk electrolysis of crystal pure Au25(SR)180. Single crystals of all
three charge states formed after slow cooling in a solvent anti-solvent mixture. A more detailed
procedure is presented in the SI. Crystals of each form were amenable to total structure
determination by single crystal X-ray methods. This resulted in the first crystal structure of
Au25(SR)18+1
as well as a notably higher quality single crystal x-ray structure of Au25(SR)180
compared to the previously reported structure.
We performed density functional theory (DFT) calculations using the GPAW package that
implements projector augmented-wave (PAW) method in a real-space grid.25
Electronic structure,
charge distribution, magnetic states and optical absorption of the clusters in all charge states were
analyzed. Crystal structure coordinates including the full ligand layer were used as such without
optimization to the theoretical minimum. The atomic charges were analyzed using the Bader
decomposition method26
and the optical absorption spectra were calculated from the linear
response time dependent DFT as implemented in GPAW.27
The PBE exchange-correlation
functional was used both for the ground-state and optical absorption calculation. The PAW setups
for gold include scalar-relativistic corrections.
27
3.4 Symmetry analysis
We report crystal structure of Au25(PET)18+1
and an improved Au25(PET)180 crystal
structure.26 Each structure shows the same general atomic connectivity as the observed
previously13,14,26,28, with each cluster structure containing a 13 atom filled icosahedral core
surrounded by 6 SR-Au-SR-Au-SR semi-rings. A comparison of the structures of the
crystallographically resolved charge states of Au25(PET)18–1/0/+1 (Figure 3.1) shows that the
symmetry of the structure evolves from more ideal to less ideal as charge state increases.
We quantified the distortions from ideal symmetry in two ways: First, by analysis of
bond lengths, angles, and dihedral angles; Second, by continuous symmetry measure (CSM)29,30
as implemented in SHAPE v2.1. CSM is a method for quantifying the deviation from idealized
symmetry. Briefly, the method quantifies the deviation of a shape from its ideal counterpart by
calculating the sum of squares of displacement from the ideal geometry. To quantify distortion
from ideal geometry through CSM, we developed a ‘shell-by-shell’ description of the geometric
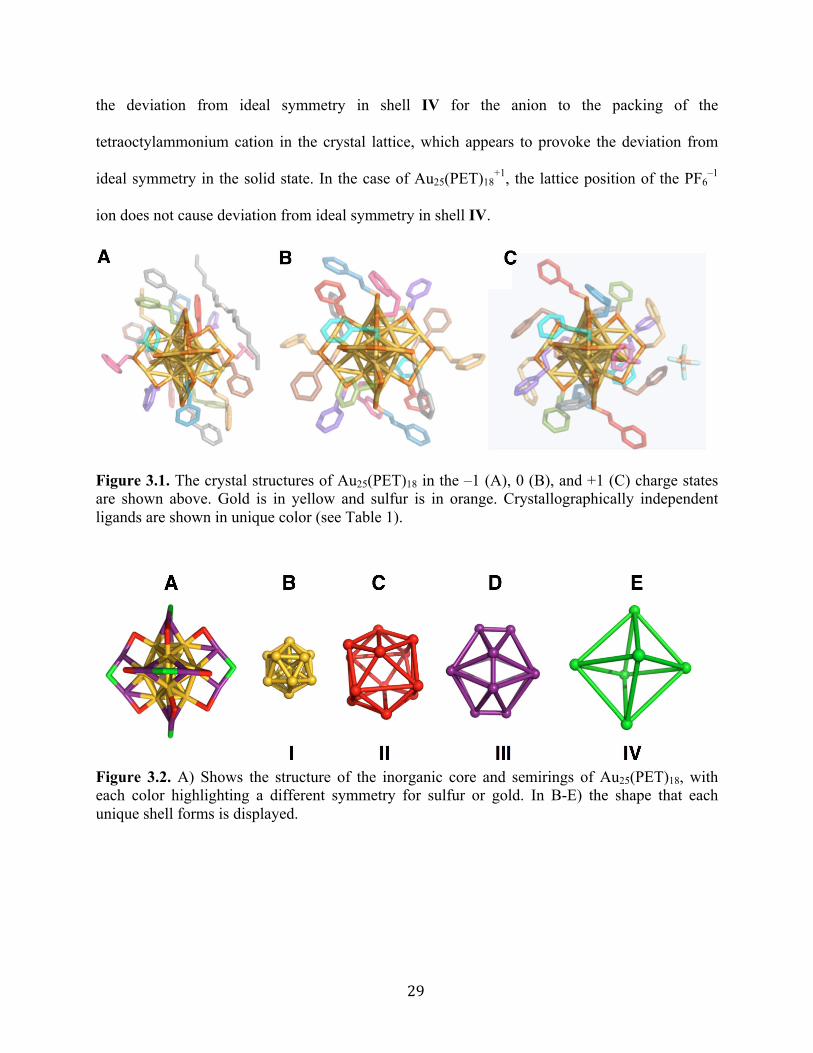
relationships of the atoms in Au25(SR)18 as shown in Figure 3.2.
In the shell-by-shell description, Au25(PET)18 is composed of 4 shells of symmetrically
related atoms (Figure 3.2). The innermost shell (I, Figure 3.2B) is a filled Au13 icosahedron. The
next most outer shell (II, Figure 3.2C) is comprised of 12 sulfur atoms that form the vertices of
an icosahedron. The next most outer shell (III, Figure 3.2D) is comprised of the 12 Au(I) atoms
of Au25(SR)18 forming the vertices of a truncated dodecahedron. The outermost shell (IV, figure
3.2E) is comprised of 6 sulfur atoms that form the vertices of an octahedron. The atoms in shell I
are both chemically and geometrically related. In shells II-IV the atoms within each shells are
related only by geometry. Figure 3.2A shows how these geometric shells are related in the
context of chemical bonding in the structure.
28
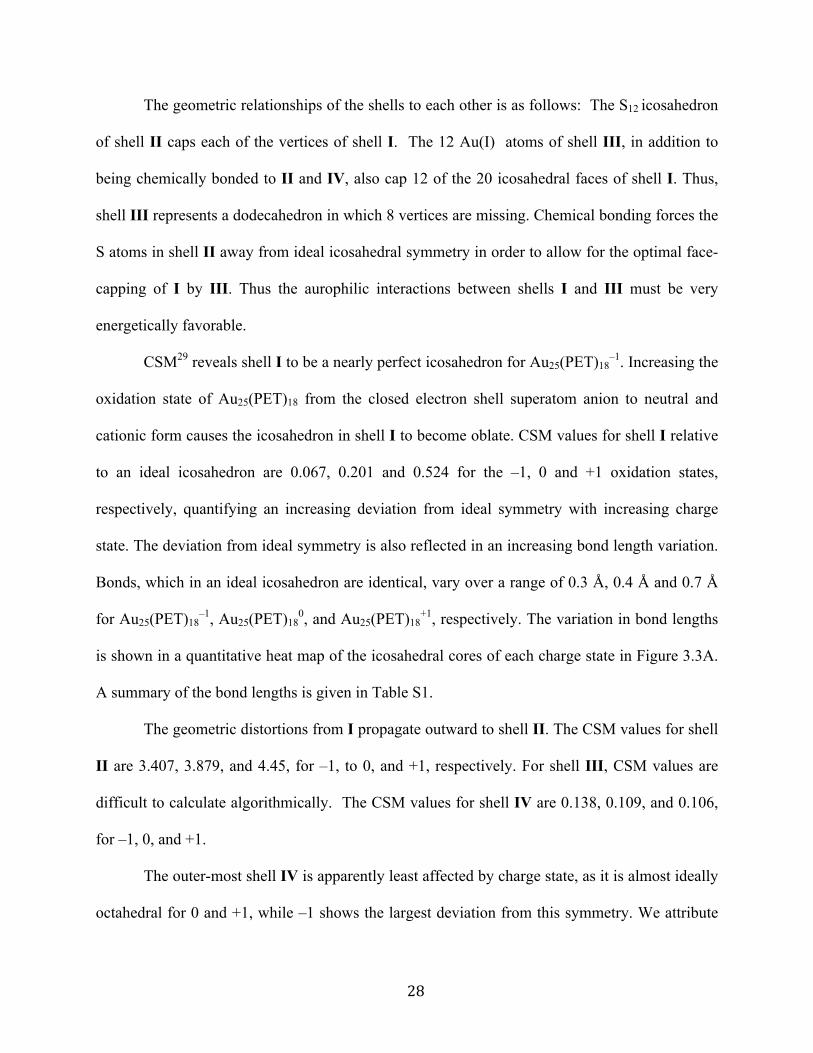
The geometric relationships of the shells to each other is as follows: The S12 icosahedron
of shell II caps each of the vertices of shell I. The 12 Au(I) atoms of shell III, in addition to
being chemically bonded to II and IV, also cap 12 of the 20 icosahedral faces of shell I. Thus,
shell III represents a dodecahedron in which 8 vertices are missing. Chemical bonding forces the
S atoms in shell II away from ideal icosahedral symmetry in order to allow for the optimal face-
capping of I by III. Thus the aurophilic interactions between shells I and III must be very
energetically favorable.
CSM29 reveals shell I to be a nearly perfect icosahedron for Au25(PET)18–1. Increasing the
oxidation state of Au25(PET)18 from the closed electron shell superatom anion to neutral and
cationic form causes the icosahedron in shell I to become oblate. CSM values for shell I relative
to an ideal icosahedron are 0.067, 0.201 and 0.524 for the –1, 0 and +1 oxidation states,
respectively, quantifying an increasing deviation from ideal symmetry with increasing charge
state. The deviation from ideal symmetry is also reflected in an increasing bond length variation.
Bonds, which in an ideal icosahedron are identical, vary over a range of 0.3 Å, 0.4 Å and 0.7 Å
for Au25(PET)18–1, Au25(PET)18
0, and Au25(PET)18+1, respectively. The variation in bond lengths
is shown in a quantitative heat map of the icosahedral cores of each charge state in Figure 3.3A.
A summary of the bond lengths is given in Table S1.
The geometric distortions from I propagate outward to shell II. The CSM values for shell
II are 3.407, 3.879, and 4.45, for –1, to 0, and +1, respectively. For shell III, CSM values are
difficult to calculate algorithmically. The CSM values for shell IV are 0.138, 0.109, and 0.106,
for –1, 0, and +1.
The outer-most shell IV is apparently least affected by charge state, as it is almost ideally
octahedral for 0 and +1, while –1 shows the largest deviation from this symmetry. We attribute
29
the deviation from ideal symmetry in shell IV for the anion to the packing of the
tetraoctylammonium cation in the crystal lattice, which appears to provoke the deviation from
ideal symmetry in the solid state. In the case of Au25(PET)18+1, the lattice position of the PF6
–1
ion does not cause deviation from ideal symmetry in shell IV.
Figure 3.1. The crystal structures of Au25(PET)18 in the –1 (A), 0 (B), and +1 (C) charge states are shown above. Gold is in yellow and sulfur is in orange. Crystallographically independent ligands are shown in unique color (see Table 1).
Figure 3.2. A) Shows the structure of the inorganic core and semirings of Au25(PET)18, with each color highlighting a different symmetry for sulfur or gold. In B-E) the shape that each unique shell forms is displayed.
30
To fully describe the changes that occur to the semi-rings (II-IV), we examine how each
shell distorts with respect to shell I. The symmetry of the inorganic core (shells I-IV) is
approximately of the point group D2h.19 This approximation assumes the semirings on opposite
sides of the cluster are coplanar, with the other four semirings lying orthogonal to the plane
defined by coplanar semirings. In all structures of Au25(SR)18, there is some deviation from this
idealized description. The amount of in which the symmetry is lowered, on average, increases
with increasing oxidation state. As Au25(PET)18 becomes more oxidized the gold atoms in shell
Figure 3.3. A) Heat map of Au25(PET)18
–1,0,+1. B) An energy level diagram. C) A heat map of distortion away from the face.
31
III shift toward the edges of shell I in order to stabilize the weaker bonds that arise from an
oblate core. As shown in Table S1 the average degree that the atoms in shell III deviate away
from the face are 1.91°, 2.06°, and 2.63° for –1, 0, and +1 charge states, respectively. This in
turn causes shell II and IV to bend out of the plane. By measuring the dihedral angle the amount
that the semirings bend out of the plane can be quantified. The plane of shell I is defined as the
very central atom of the icosahedral and the two gold atoms which are bound to the semirings.
For the semirings the plane is defined as the atom of interest in the semi-ring, the gold atom in
shell I which is bound the semi-ring, and the central atom of shell I. The planes defined for the
measurement of the dihedral angle between shells I and II is shown in Figure 3.4. This
measurement was performed for each atom in the semi-ring. On average the dihedral angle of the
semirings are 7.3°, 8.6°, and 12.8°, for –1, 0, and +1, respectively. The average dihedral angle
for each shell is given in Table S2.
Measurement of the dihedral angles shown in Figure 3.4 allows quantification of
deviation from the ideal point group. One plane is contained within shell I and is defined as the
central atom of the icosahedron and the two vertex gold atoms anchoring each side of a semiring
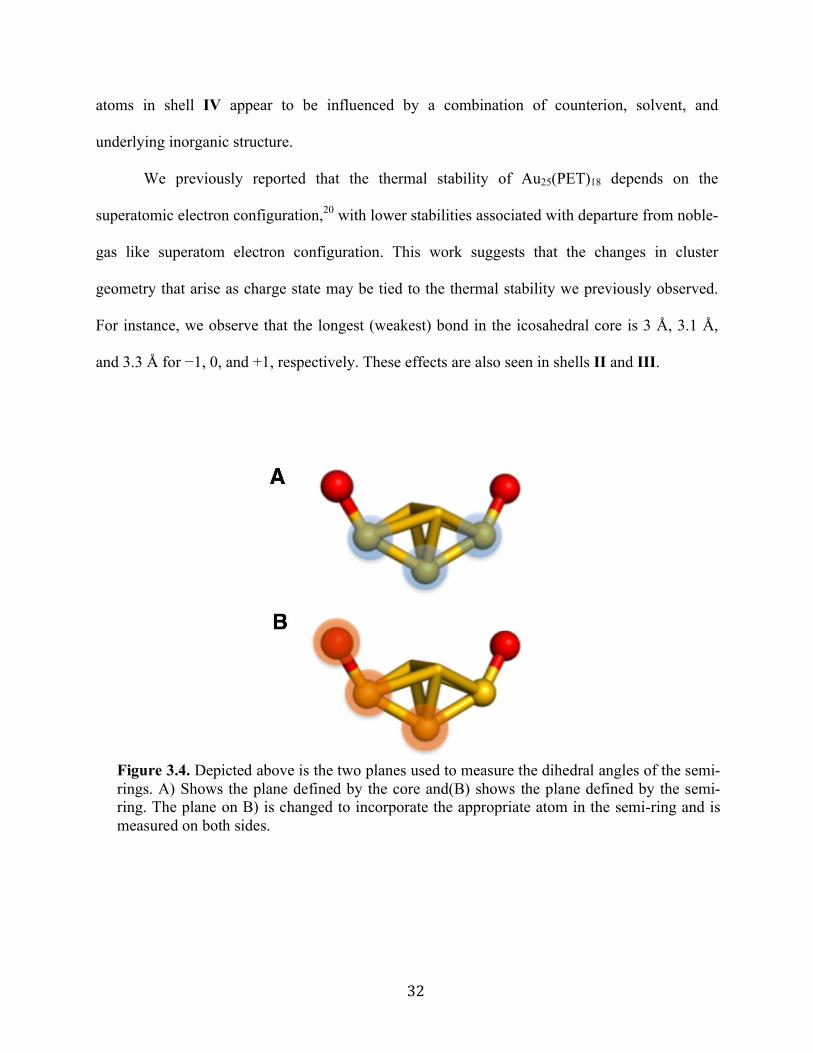
(Figure 3.4A). The second plane is defined by the atom of the semi-ring, the gold atom of shell I
to which the semi-ring is anchored, and the central atom of the cluster (Figure 3.4B).
The deviations from ideal symmetry of IV identified by CSM are presently described
independently of chemical bonding to other shells. Chemical bonding requirements in the cluster
clearly influence the sulfur atoms of shell IV. This is most obvious in the dihedral angles of the
atoms in the semi-rings. The sulfur atoms in IV have the largest average dihedral angle for the
+1 (5.1°), followed by −1 (3.9°), and finally 0 (0.8°) oxidation states. Thus, the coordinates of
32
atoms in shell IV appear to be influenced by a combination of counterion, solvent, and
underlying inorganic structure.
We previously reported that the thermal stability of Au25(PET)18 depends on the
superatomic electron configuration,20 with lower stabilities associated with departure from noble-
gas like superatom electron configuration. This work suggests that the changes in cluster
geometry that arise as charge state may be tied to the thermal stability we previously observed.
For instance, we observe that the longest (weakest) bond in the icosahedral core is 3 Å, 3.1 Å,
and 3.3 Å for −1, 0, and +1, respectively. These effects are also seen in shells II and III.
Figure 3.4. Depicted above is the two planes used to measure the dihedral angles of the semi-rings. A) Shows the plane defined by the core and(B) shows the plane defined by the semi-ring. The plane on B) is changed to incorporate the appropriate atom in the semi-ring and is measured on both sides.
33
3.5 Optical/Electronic Properties of Au25(PET)18–1/0/+1
The absorption spectra of Au25(PET)18 evolves notably across each charge state,
suggesting changes in the underlying electronic structure after oxidation or reduction of
Au25(SR)18. The absorption peak around 680 nm (1.81 eV) is attributed to the transition from the
1P to 1De and the peak between 450-470 nm (2.76-2.58 eV) has been attributed to the transition
of the 1P to 1Dt.19 The transition at 380-400 nm (3.15-3.08 eV) is attributed to excitation of the
semirings to 1De orbital. The energy transition from the 1P to 1De for the –1, 0, and +1 are 1.78
eV, 1.81 eV, and 1.88 eV, respectively. For the 1P to 1Dt energy gaps of 2.76 eV, 2.68 eV, and
2.58 eV are observed for the –1, 0 and +1, respectively. Finally the energy gap for ligand band to
superatomic D orbital transition is 3.08 eV for –1 and 0, and 3.15 eV for +1. These values are
summarized in Table S3.
The experimental and theoretical spectra of Au25(PET)18 are previously reported.14,21,24,26
We improved the experimental spectra for each charge state by forming, isolating and
redissolving x-ray quality single crystals of each charge state. We replot our data with previously
reported spectroelectrochemical data in Figure 3.5 as previously noted, the linear absorption
spectrum changes substantially for each oxidation state. We correlate these changes here to
changes in the structure of each oxidation state. Relative to Au25(PET)18− the 1P to 1De transition
shows a slightly decreased energy gap of about 0.03 eV for Au25(PET)180, while the energy of
this transition increases for Au25(PET)18+1 by about 0.1 eV. The decrease in the HOMO-LUMO
energy gap from Au25(PET)18–1 to Au25(PET)18
0 is due to one of the 1P orbitals increasing in
energy, but still being occupied by one electron, depicted in a qualitative energy level diagram in
Figure 3.3. With the removal of a second electron the splitting of the 1P orbitals becomes much
greater than thermal energy, and the highest energy 1P orbital becomes unoccupied. The
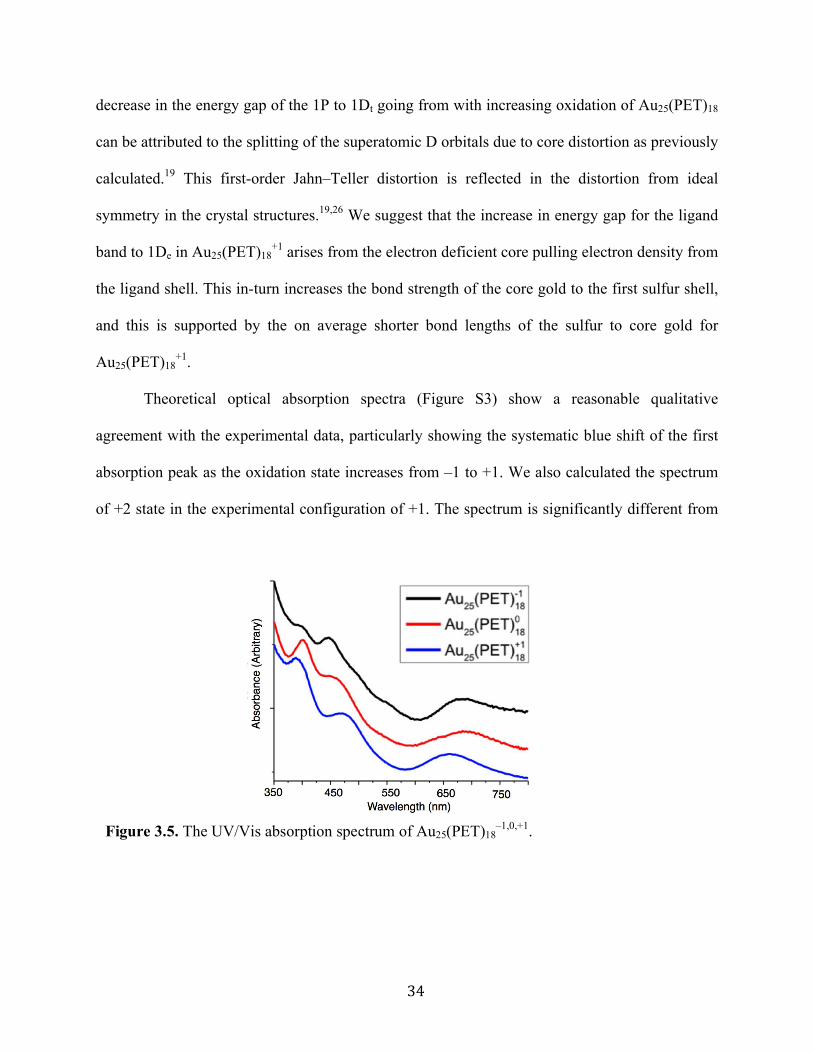
34
decrease in the energy gap of the 1P to 1Dt going from with increasing oxidation of Au25(PET)18
can be attributed to the splitting of the superatomic D orbitals due to core distortion as previously
calculated.19 This first-order Jahn–Teller distortion is reflected in the distortion from ideal
symmetry in the crystal structures.19,26 We suggest that the increase in energy gap for the ligand
band to 1De in Au25(PET)18+1 arises from the electron deficient core pulling electron density from
the ligand shell. This in-turn increases the bond strength of the core gold to the first sulfur shell,
and this is supported by the on average shorter bond lengths of the sulfur to core gold for
Au25(PET)18+1.
Theoretical optical absorption spectra (Figure S3) show a reasonable qualitative
agreement with the experimental data, particularly showing the systematic blue shift of the first
absorption peak as the oxidation state increases from –1 to +1. We also calculated the spectrum
of +2 state in the experimental configuration of +1. The spectrum is significantly different from
Figure 3.5. The UV/Vis absorption spectrum of Au25(PET)18
–1,0,+1.
35
+1 spectrum at low excitation energies and confirm that +2 clusters are not as impurities in the
solution of +1.
3.6 Magnetic Properties of Au25(SR)18–1/0/+1
We report the first investigation of magnetism in the Au25(SR)18−1/0/+1 cluster by
Superconducting Quantum Interference Device (SQUID). Relative to NMR and EPR approaches
SQUID incorporates greater sensitivity, allowing observation of smaller molar magnetic
susceptibilities (χm). SQUID measures the total susceptibility of a sample whereas previous
studies were limited to paramagnetic susceptibility. Subtraction of the diamagnetic contribution
from χm allows determination of the paramagnetic susceptibility (χp). χp can be used for the
comparison of a magnetic moment to that of a free electron. The diamagnetic susceptibilities
were approximated from Pascal's diamagnetic corrections.
To determine the charge dependent magnetic behavior of Au25(SR)18, temperature was
ramped from 4 K to 300 K under a magnetic field of 0.1 Tesla. In this regime, paramagnetic
substances show a response that is inversely proportional to the temperature, and diamagnetic
substances show a temperature-independent response. Figure 3.6 shows the χp vs. temperature.
We conclude that Au25(PET)18 in −1 and +1 oxidation states is almost ideally diamagnetic. This
observation agrees with the computational prediction for the spin-singlet ground state of
Au25(PET)18+ (the spin-triplet state is predicted to be +0.39 eV higher in energy). Deviations
from ideal behavior are reflected in a very small paramagnetic-type response, observable only at
very low temperatures for −1 and +1. Conversely, Au25(PET)18 as a neutral compound produces
a nearly ideal paramagnetic response that could be observed up to 300 K. The paramagnetic
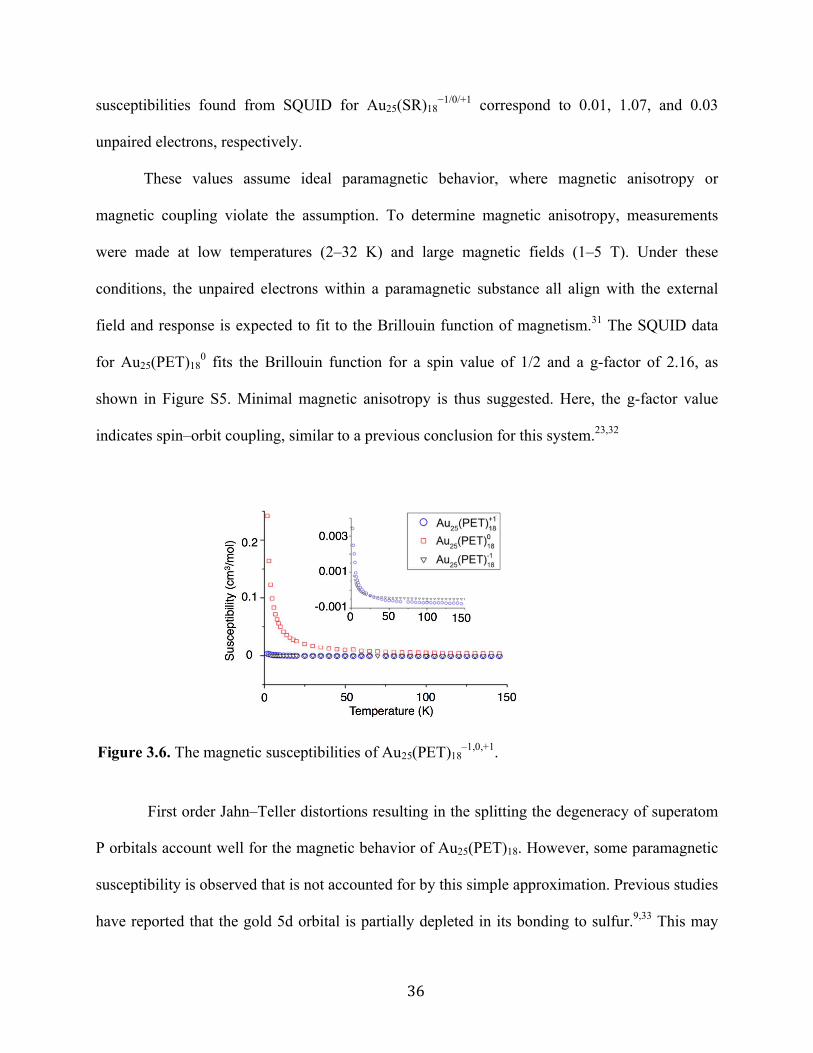
36
susceptibilities found from SQUID for Au25(SR)18−1/0/+1 correspond to 0.01, 1.07, and 0.03
unpaired electrons, respectively.
These values assume ideal paramagnetic behavior, where magnetic anisotropy or
magnetic coupling violate the assumption. To determine magnetic anisotropy, measurements
were made at low temperatures (2–32 K) and large magnetic fields (1–5 T). Under these
conditions, the unpaired electrons within a paramagnetic substance all align with the external
field and response is expected to fit to the Brillouin function of magnetism.31 The SQUID data
for Au25(PET)180 fits the Brillouin function for a spin value of 1/2 and a g-factor of 2.16, as
shown in Figure S5. Minimal magnetic anisotropy is thus suggested. Here, the g-factor value
indicates spin–orbit coupling, similar to a previous conclusion for this system.23,32
First order Jahn–Teller distortions resulting in the splitting the degeneracy of superatom
P orbitals account well for the magnetic behavior of Au25(PET)18. However, some paramagnetic
susceptibility is observed that is not accounted for by this simple approximation. Previous studies
have reported that the gold 5d orbital is partially depleted in its bonding to sulfur.9,33 This may
Figure 3.6. The magnetic susceptibilities of Au25(PET)18–1,0,+1.
37
result in a magnetic moment that would correspond to a fraction of an unpaired electron on gold
bonded to sulfur, which in the ensemble of an Au25(SR)18 molecule is observed as a small
magnetic moment for the −1 and +1 oxidation states.
Compared to Au25(PET)18−1, Au25(PET)18
+1 has a slightly larger magnetic susceptibility.
We propose that this arises from greater electron deficiency in Au25(PET)18+1, which pulls
electron density inward, creating larger d holes in the semiring Au(I) atoms compared to
Au25(PET)18−1. According to the Bader charge analysis, 0.34e and 0.28 are depleted from the
core and semiring Au atoms, respectively, when comparing Au25(PET)18+1 to Au25(PET)18
−1 (
Table S4). The magnetic behavior of Au25(PET)180 is more complicated. Here we propose that
due to the almost degenerate P orbitals, the paramagnetic susceptibility in excess of 1.0 unpaired
electrons arises from spin–orbit coupling.23,32 We estimate that 1–3% of an unpaired electron
arises from the Au–S interaction (d-holes), with the remaining (4–6%) arising from superatomic
spin–orbit coupling for Au25(PET)180. Our values for magnetism in the anionic compound are
consistent with previously reported results.33
3.7 Long range order and packing of Au25(PET)18PF6
The high-quality of the two reported crystal structures prompts the first complete analysis
of molecular packing interactions in single-crystals of thiolate protected gold. Indeed, clusters
with ligand shells comprised of aromatic ligands such as PET and pMBA account for most
crystal structures of ligated gold nanoparticles. In the case of Au25(SR)18−1/0/+1, there are
substantial differences in the ligand shell structure in the solid state for each charge state. These
differences in the ligand layer do not appear to be propagations of the changes in the inorganic
core due to charge state; rather, the differences in the ligand layer of Au25(SR)18−1/0/+1 arise from
38
different inter- and intra-molecular ligand–ligand interactions, ligand–counterion interactions,
and ligand–solvent interactions (Figure 3.7).
The high quality of the Au25(SR)18+1 structure reported here allows a careful analysis of
the role of phenylethane thiolate ligands in the packing of Au25(PET)18+1 into single crystals. To
our knowledge, no similar analysis has been previously reported; the interactions described here,
however, appear to be ubiquitous among PET protected AuNC structures.13,14,26,34,35,36 . The
importance of this analysis is due to the ligand shell of thiolate protected gold nanoparticles
largely determining the interaction of the cluster with its external environment, for instance, in
biological contexts.37,38
Due to the imposed inversion symmetry of the P (bar) space group, there are nine
crystallographically independent PET ligands found on the cluster surface (Figure 3.1) located in
three crystallographically independent semirings (S–Au–S–Au–S units) shown in Figure S4 and
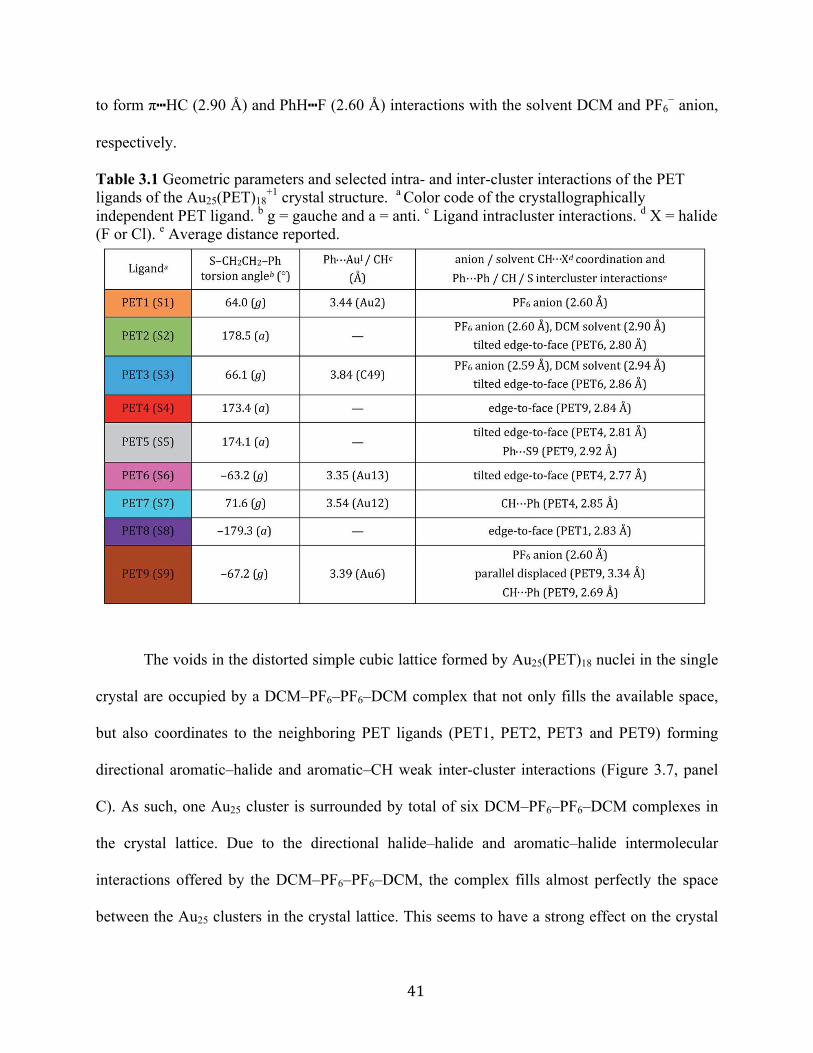
S5. Table 3.1 summarizes the dominant intra- and inter-molecular interactions of each of the nine
symmetry-unique ligands in the Au25(SR)18+1 crystal structure.
Each ligand adopts either anti or gauche conformation on the cluster surface,
corresponding to an S–CH2–CH2–Ph torsion angle of ∼180° or ∼60°, respectively (Table 1,
Scheme S1, Figure S4). Four of the five gauche ligands (PET1, PET6, PET7 and PET9) fold
over the semiring to which they are bonded and form cation–aromatic interactions with the AuI
atom in the semiring. Specifically, AuI⋯π interactions are observed, with average distance of
3.43 Å (Figure S6). A fifth gauche ligand (PET3) does not form cation–phenyl interaction with
the AuI atom in the unit. Instead it coordinates to the PF6− counter anion and DCM solvent
molecule that sit above the corresponding AuI atom (Au3), preventing the AuI⋯π interactions
observed for other gauche ligands.
39
The remaining four crystallographically independent ligands (PET2, PET4, PET5 and
PET8) form inter-cluster CH⋯S, CH⋯Ph and Ph⋯Ph interactions with the ligands of adjacent
Au25 clusters. In addition, these ligands form intermolecular Ph⋯F, Ph⋯Cl and CH⋯F interactions
with the PF6− anions or DCM solvent molecules within the crystal lattice.
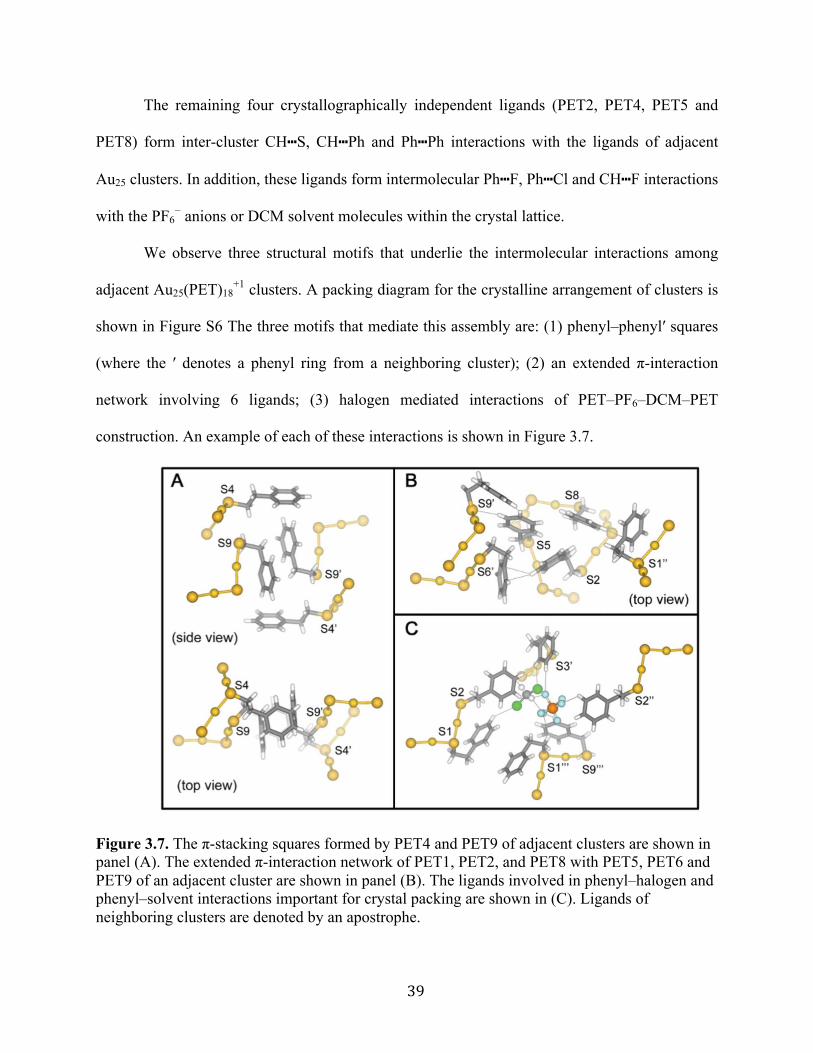
We observe three structural motifs that underlie the intermolecular interactions among
adjacent Au25(PET)18+1 clusters. A packing diagram for the crystalline arrangement of clusters is
shown in Figure S6 The three motifs that mediate this assembly are: (1) phenyl–phenyl′ squares
(where the ′ denotes a phenyl ring from a neighboring cluster); (2) an extended π-interaction
network involving 6 ligands; (3) halogen mediated interactions of PET–PF6–DCM–PET
construction. An example of each of these interactions is shown in Figure 3.7.
Figure 3.7. The π-stacking squares formed by PET4 and PET9 of adjacent clusters are shown in panel (A). The extended π-interaction network of PET1, PET2, and PET8 with PET5, PET6 and PET9 of an adjacent cluster are shown in panel (B). The ligands involved in phenyl–halogen and phenyl–solvent interactions important for crystal packing are shown in (C). Ligands of neighboring clusters are denoted by an apostrophe.
40
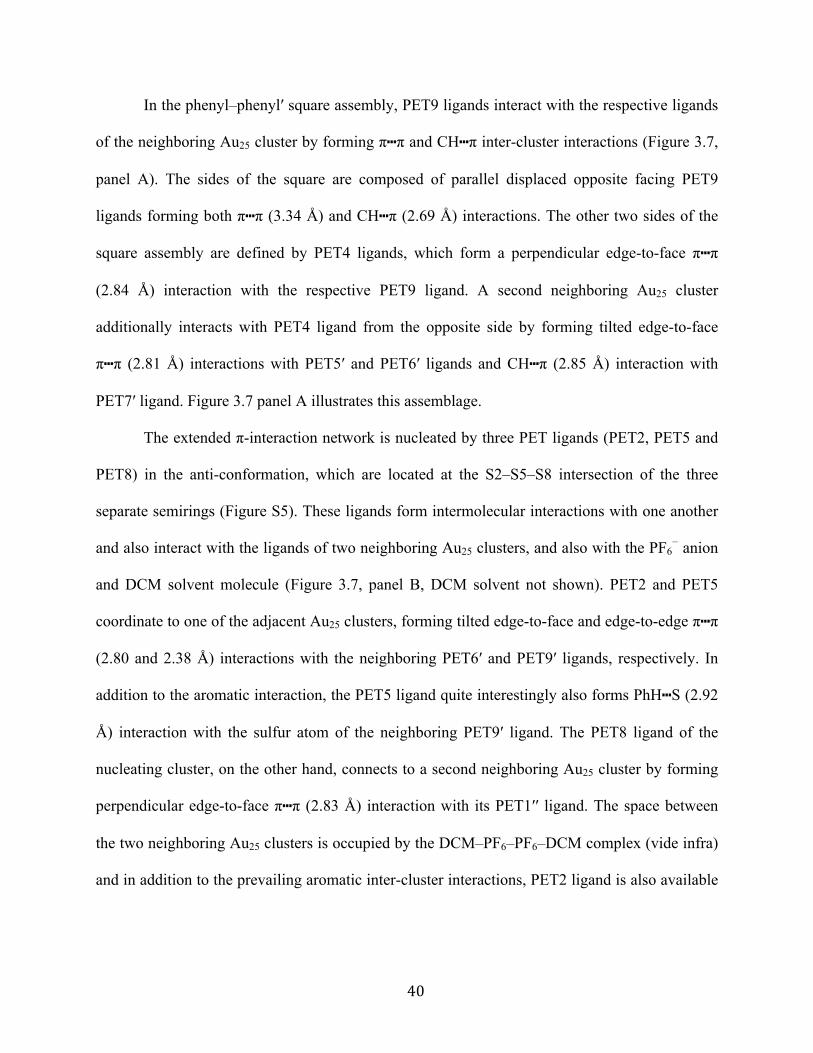
In the phenyl–phenyl′ square assembly, PET9 ligands interact with the respective ligands
of the neighboring Au25 cluster by forming π⋯π and CH⋯π inter-cluster interactions (Figure 3.7,
panel A). The sides of the square are composed of parallel displaced opposite facing PET9
ligands forming both π⋯π (3.34 Å) and CH⋯π (2.69 Å) interactions. The other two sides of the
square assembly are defined by PET4 ligands, which form a perpendicular edge-to-face π⋯π
(2.84 Å) interaction with the respective PET9 ligand. A second neighboring Au25 cluster
additionally interacts with PET4 ligand from the opposite side by forming tilted edge-to-face
π⋯π (2.81 Å) interactions with PET5′ and PET6′ ligands and CH⋯π (2.85 Å) interaction with
PET7′ ligand. Figure 3.7 panel A illustrates this assemblage.
The extended π-interaction network is nucleated by three PET ligands (PET2, PET5 and
PET8) in the anti-conformation, which are located at the S2–S5–S8 intersection of the three
separate semirings (Figure S5). These ligands form intermolecular interactions with one another
and also interact with the ligands of two neighboring Au25 clusters, and also with the PF6− anion
and DCM solvent molecule (Figure 3.7, panel B, DCM solvent not shown). PET2 and PET5
coordinate to one of the adjacent Au25 clusters, forming tilted edge-to-face and edge-to-edge π⋯π
(2.80 and 2.38 Å) interactions with the neighboring PET6′ and PET9′ ligands, respectively. In
addition to the aromatic interaction, the PET5 ligand quite interestingly also forms PhH⋯S (2.92
Å) interaction with the sulfur atom of the neighboring PET9′ ligand. The PET8 ligand of the
nucleating cluster, on the other hand, connects to a second neighboring Au25 cluster by forming
perpendicular edge-to-face π⋯π (2.83 Å) interaction with its PET1′′ ligand. The space between
the two neighboring Au25 clusters is occupied by the DCM–PF6–PF6–DCM complex (vide infra)
and in addition to the prevailing aromatic inter-cluster interactions, PET2 ligand is also available
41
to form π⋯HC (2.90 Å) and PhH⋯F (2.60 Å) interactions with the solvent DCM and PF6− anion,
respectively.
Table 3.1 Geometric parameters and selected intra- and inter-cluster interactions of the PET ligands of the Au25(PET)18
+1 crystal structure. a Color code of the crystallographically independent PET ligand. b g = gauche and a = anti. c Ligand intracluster interactions. d X = halide (F or Cl). e Average distance reported.
The voids in the distorted simple cubic lattice formed by Au25(PET)18 nuclei in the single
crystal are occupied by a DCM–PF6–PF6–DCM complex that not only fills the available space,
but also coordinates to the neighboring PET ligands (PET1, PET2, PET3 and PET9) forming
directional aromatic–halide and aromatic–CH weak inter-cluster interactions (Figure 3.7, panel
C). As such, one Au25 cluster is surrounded by total of six DCM–PF6–PF6–DCM complexes in
the crystal lattice. Due to the directional halide–halide and aromatic–halide intermolecular
interactions offered by the DCM–PF6–PF6–DCM, the complex fills almost perfectly the space
between the Au25 clusters in the crystal lattice. This seems to have a strong effect on the crystal
42
packing arrangement and gives an extremely good quality crystal structure which is also seen as
the lack of disorder in the ligand layer.
3.8 Conclusions
The determination of the crystal structures of Au25(PET)18 in three discrete charge states
allows for the first time a comparison of electronic and magnetic differences of all three stable
charge states of Au25(SR)18 in the context of their structure. The Jahn–Teller effect is a
convenient structural framework to describe the evolution of structure as oxidation state changes.
Au25(PET)18−1 has a noble gas-like configuration (1S21P6) underlying its diamagnetism and
comparatively high thermal stability. Comparatively, Au25(PET)180 with 1S21P5 superatom
electron configuration is paramagnetic arising from an unpaired 1P electron. When incomplete,
the superatomic 1P become non-degenerate, which is reflected in the structure of the cluster
becoming oblate relative to the anion. Oxidation to Au25(PET)18+1 (1S21P4) results in larger
distortions to the cluster than are observed in either of the other charge states. The electronic
distortion results in an unoccupied P orbital in Au25(PET)18+1, rendering it diamagnetic. Here we
show for the first time that Jahn–Teller effects apply to thiolate protected gold clusters. The
superatom driven distortions are primarily observed in the 13 gold atoms of shell I, with
subsequent shells reflecting smaller distortions. A Jahn–Teller effect for Au24X(SR)18 where X =
Pd or Pt was recently reported by another group, based on spectroscopic evidence, while this
paper was under revision.39
43
References
(1) Jahn, H. A.; Teller, E. Proc. R. Soc. Lond. Math. Phys. Eng. Sci. 1937, 161 (905), 220–
235.
(2) Cotton, F. A.; Fang, A. J. Am. Chem. Soc. 1982, 104 (1), 113–119.
(3) Chancey, C.C. and O’Brien, M.C.M.: The Jahn-Teller Effect in C60 and Other
Icosahedral Complexes (Hardcover). http://press.princeton.edu/titles/6243.html (accessed May
19, 2016).
(4) Hughbanks, T.; Corbett, J. D. Inorg. Chem. 1988, 27 (12), 2022–2026.
(5) Campbell, J.; Dixon, D. A.; Mercier, H. P. A.; Schrobilgen, G. J. Inorg. Chem. 1995, 34
(23), 5798–5809.
(6) Häkkinen, H. Chem. Soc. Rev. 2008, 37 (9), 1847–1859.
(7) de Heer, W. A. Rev. Mod. Phys. 1993, 65 (3), 611–676.
(8) Schooss, D.; Weis, P.; Hampe, O.; Kappes, M. M. Philos. Trans. R. Soc. Lond. Math.
Phys. Eng. Sci. 2010, 368 (1915), 1211–1243.
(9) Walter, M.; Akola, J.; Lopez-Acevedo, O.; Jadzinsky, P. D.; Calero, G.; Ackerson, C. J.;
Whetten, R. L.; Grönbeck, H.; Häkkinen, H. Proc. Natl. Acad. Sci. 2008, 105 (27), 9157–9162.
(10) Schaaff, T. G.; Knight, G.; Shafigullin, M. N.; Borkman, R. F.; Whetten, R. L. J. Phys.
Chem. B 1998, 102 (52), 10643–10646.
(11) Parker, J. F.; Fields-Zinna, C. A.; Murray, R. W. Acc. Chem. Res. 2010, 43 (9), 1289–
1296.
(12) Negishi, Y.; Nobusada, K.; Tsukuda, T. J. Am. Chem. Soc. 2005, 127 (14), 5261–5270.
44
(13) Heaven, M. W.; Dass, A.; White, P. S.; Holt, K. M.; Murray, R. W. J. Am. Chem. Soc.
2008, 130 (12), 3754–3755.
(14) Zhu, M.; Aikens, C. M.; Hollander, F. J.; Schatz, G. C.; Jin, R. J. Am. Chem. Soc. 2008,
130 (18), 5883–5885.
(15) Parker, J. F.; Weaver, J. E. F.; McCallum, F.; Fields-Zinna, C. A.; Murray, R. W.
Langmuir 2010, 26 (16), 13650–13654.
(16) Zhu, M.; Lanni, E.; Garg, N.; Bier, M. E.; Jin, R. J. Am. Chem. Soc. 2008, 130 (4), 1138–
1139.
(17) Love, J. C.; Estroff, L. A.; Kriebel, J. K.; Nuzzo, R. G.; Whitesides, G. M. Chem. Rev.
2005, 105 (4), 1103–1170.
(18) Daniel, M.-C.; Astruc, D. Chem. Rev. 2004, 104 (1), 293–346.
(19) Aikens, C. M. J. Phys. Chem. Lett. 2011, 2 (2), 99–104.
(20) Tofanelli, M. A.; Ackerson, C. J. J. Am. Chem. Soc. 2012, 134 (41), 16937–16940.
(21) Antonello, S.; Perera, N. V.; Ruzzi, M.; Gascón, J. A.; Maran, F. J. Am. Chem. Soc. 2013,
135 (41), 15585–15594.
(22) Nealon, G. L.; Donnio, B.; Greget, R.; Kappler, J.-P.; Terazzi, E.; Gallani, J.-L.
Nanoscale 2012, 4 (17), 5244–5258.
(23) Zhu, M.; Aikens, C. M.; Hendrich, M. P.; Gupta, R.; Qian, H.; Schatz, G. C.; Jin, R. J.
Am. Chem. Soc. 2009, 131 (7), 2490–2492.
(24) Venzo, A.; Antonello, S.; Gascón, J. A.; Guryanov, I.; Leapman, R. D.; Perera, N. V.;
Sousa, A.; Zamuner, M.; Zanella, A.; Maran, F. Anal. Chem. 2011, 83 (16), 6355–6362.
(25) Akbari-Sharbaf, A.; Hesari, M.; Workentin, M. S.; Fanchini, G. J. Chem. Phys. 2013, 138
(2), 24305.
45
(26) Zhu, M.; Eckenhoff, W. T.; Pintauer, T.; Jin, R. J. Phys. Chem. C 2008, 112 (37), 14221–
14224.
(27) Aikens, C. M. In Frontiers of Nanoscience; Häkkinen, T. T. and H., Ed.; Protected Metal
ClustersFrom Fundamentals to Applications; Elsevier, 2015; Vol. 9, pp 223–261.
(28) Dainese, T.; Antonello, S.; Gascón, J. A.; Pan, F.; Perera, N. V.; Ruzzi, M.; Venzo, A.;
Zoleo, A.; Rissanen, K.; Maran, F. ACS Nano 2014, 8 (4), 3904–3912.
(29) Zabrodsky, H.; Peleg, S.; Avnir, D. J. Am. Chem. Soc. 1992, 114 (20), 7843–7851.
(30) Pinsky, M.; Avnir, D. Inorg. Chem. 1998, 37 (21), 5575–5582.
(31) Kahn, O. 1942-. Molecular magnetism; VCH, 1993.
(32) Jiang, D.; Kühn, M.; Tang, Q.; Weigend, F. J. Phys. Chem. Lett. 2014, 5 (19), 3286–
3289.
(33) Negishi, Y.; Tsunoyama, H.; Suzuki, M.; Kawamura, N.; Matsushita, M. M.; Maruyama,
K.; Sugawara, T.; Yokoyama, T.; Tsukuda, T. J. Am. Chem. Soc. 2006, 128 (37), 12034–12035.
(34) Qian, H.; Eckenhoff, W. T.; Zhu, Y.; Pintauer, T.; Jin, R. J. Am. Chem. Soc. 2010, 132
(24), 8280–8281.
(35) Das, A.; Li, T.; Li, G.; Nobusada, K.; Zeng, C.; Rosi, N. L.; Jin, R. Nanoscale 2014, 6
(12), 6458–6462.
(36) Zeng, C.; Liu, C.; Chen, Y.; Rosi, N. L.; Jin, R. J. Am. Chem. Soc. 2014, 136 (34),
11922–11925.
(37) Sexton, J. Z.; Ackerson, C. J. J. Phys. Chem. C 2010, 114 (38), 16037–16042.
(38) Wong, O. A.; Hansen, R. J.; Ni, T. W.; Heinecke, C. L.; Compel, W. S.; Gustafson, D.
L.; Ackerson, C. J. Nanoscale 2013, 5 (21), 10525–10533.

46
(39) Kwak, K.; Tang, Q.; Kim, M.; Jiang, D.; Lee, D. J. Am. Chem. Soc. 2015, 137 (33),
10833–10840.
47
Chapter 4
Crystal Structure of the PdAu24(SR)180 Superatom
*
4.1 Synopsis
The single-crystal X-ray structure of Pd-doped Au25(SR)18 was solved. The crystal
structure reveals that in PdAu24(SR)18, the Pd atom is localized only to the centroid of the
Au25(SR)18 cluster. This single-crystal X-ray structure shows that PdAu24(SR)180 is well
conceptualized with the superatom theory. The PdAu24(SR)180 charge state is isoelectronic with
Au25(SR)18+1 as determined by a first order Jahn–Teller effect of similar magnitude and by
electrochemical comparison. The previously reported increased stability of PdAu24(SR)18 can be
rationalized in terms of Pd–Au bonds that are shorter than the Au–Au bonds in Au25(SR)18.
4.2 Introduction
Many ligand-protected gold clusters, including Au11(PPh3)7Cl3, Au25(SR)18,
Au39(PPh3)14Cl6, and Au102(SR)44, can be described electronically as superatoms.1 Superatom
theory can be extended to describe properties such as stability,2 magnetism,3 and certain optical
properties.4 Superatom theory approximates metal clusters as spheres containing the free or
valence electrons of the metal atoms comprising the cluster. A valence electron count of 2, 8, 18,
20, 34, 40, 58... corresponds to total filling of superatom orbitals, resulting in noble gas-like
electron configurations associated with high stability.5 Ligands can either withdraw one electron
* The work presented herein is published in the Journal of the American Chemical Society with Marcus A. Tofanelli, Thomas W. Ni, Billy D. Phillips, and Christopher J. Ackerson as joint authors. Marcus Tofanelli’s contributions include experimental design, data analysis, and synthetic development and characterization of gold nanoclusters and assemblies. © 2016 American Chemical Society. J. Am. Chem. Soc., 2016, 55 (3), 999–1001.
48
each from the superatom or serve as dative ligands that neither add to nor subtract from the
superatom electron count.1 Overall, this simple approximation remarkably predicts the symmetry
and degeneracy of the frontier orbitals of many ligated metal clusters.6 Au25(SR)18 and
isostructural compounds are intensively studied currently, with detailed understanding of
electronic properties available.7
An emergent question in the experimental literature is how dopant atoms such as Pt or Pd
impact the superatom electron count in ligated bimetallic clusters, such as in the recently
reported PdAu24(SR)18, PtAu24(SR)18, Pd2Au36(SR)24, AgxAu25-x(SR)18, and PdxAu144–x(SR)60
clusters.8,9,10 All of the single-crystal X-ray determined doped or alloy clusters of thiolate-
protected metal replace Au with Ag or vice versa, resulting in clusters such as Ag32Au12(SR)24
and AgxAu144–x(SR)60.11,12,13,14,15 In the case of coinage metals (Cu, Ag, Au), each metal is now
understood to donate one electron (i.e., 6s1 electron of Au). The electron donation behavior of
other metals to the superatom is a matter of conjecture. In the case of Pd, for instance, it is
expected that the d10 metal atom will neither add to nor subtract from the superatom electron
count.16 There is no empirical structural evidence so far to support this conjecture.
Another open question in the recent literature concerns the position of dopant or alloy
atoms in the cluster. In Au25(SR)18 based clusters, there are three possible positions for these
dopants: (1) in the centroid of the 13 atom icosahedron that forms the core of the cluster, (2) as
one of the vertices of the central icosahedron, or (3) in the semi-ring (i.e., replacing a Au atom in
the SR-Au(I)-SR-Au(I)-SR structure. In the case of PdAu24(SR)18, DFT and EXAFS studies
place the dopant atom at the centroid position for Au24X(SR)18 clusters where X is Pt or Pd.14,16
However, the position of Pd in the Pd2Au36(SR)24 structure is not speculated as found at the
centroid positions of each fused bi-icosihedra.17 In each case, the positions of heteroatoms are
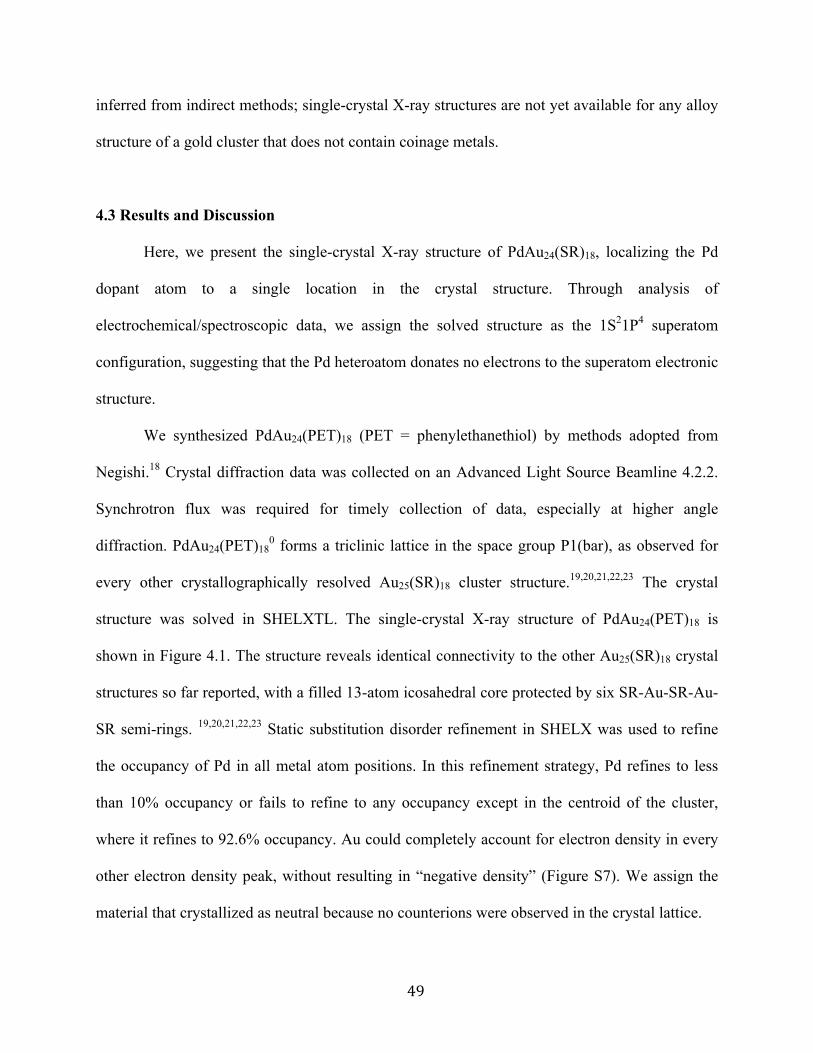
49
inferred from indirect methods; single-crystal X-ray structures are not yet available for any alloy
structure of a gold cluster that does not contain coinage metals.
4.3 Results and Discussion
Here, we present the single-crystal X-ray structure of PdAu24(SR)18, localizing the Pd
dopant atom to a single location in the crystal structure. Through analysis of
electrochemical/spectroscopic data, we assign the solved structure as the 1S21P4 superatom
configuration, suggesting that the Pd heteroatom donates no electrons to the superatom electronic
structure.
We synthesized PdAu24(PET)18 (PET = phenylethanethiol) by methods adopted from
Negishi.18 Crystal diffraction data was collected on an Advanced Light Source Beamline 4.2.2.
Synchrotron flux was required for timely collection of data, especially at higher angle
diffraction. PdAu24(PET)180 forms a triclinic lattice in the space group P1(bar), as observed for
every other crystallographically resolved Au25(SR)18 cluster structure.19,20,21,22,23 The crystal
structure was solved in SHELXTL. The single-crystal X-ray structure of PdAu24(PET)18 is
shown in Figure 4.1. The structure reveals identical connectivity to the other Au25(SR)18 crystal
structures so far reported, with a filled 13-atom icosahedral core protected by six SR-Au-SR-Au-
SR semi-rings. 19,20,21,22,23 Static substitution disorder refinement in SHELX was used to refine
the occupancy of Pd in all metal atom positions. In this refinement strategy, Pd refines to less
than 10% occupancy or fails to refine to any occupancy except in the centroid of the cluster,
where it refines to 92.6% occupancy. Au could completely account for electron density in every
other electron density peak, without resulting in “negative density” (Figure S7). We assign the
material that crystallized as neutral because no counterions were observed in the crystal lattice.
50
Linear absorption spectroscopy and electrochemical measurements suggest that the
PdAu24(PET)18 cluster is isoelectronic with the Au25(SR)18 cluster. Electrochemically,
PdAu24(PET)18 and Au25(PET)18 show the same multiplicity of charging events with almost
identical spacing between each reduction/oxidation wave. The difference in the voltammograms
is a shift of −534 mV for the potentials of PdAu24(PET)18 compared to Au25(PET)18 (Figure
4.2).24 Likewise, the linear absorption spectra of PdAu24(PET)180 are similar to Au25(PET)18
0;
each compound has a broad band peak centered at 650 and 688 nm with a sharp feature at 380
and 400 nm for PdAu24(PET)180 and Au25(PET)18
0, respectively. The voltammograms are similar
to those previously reported by Murray for the same compound.24 Previous theoretical reports
describe modification of the electronic spectra of Au25(SR)18 upon doping with Pd. DFT
description of the electronic structure suggests that removal of electrons is “softer” for
PdAu24(SR)18 as a result of the electronic structure modification upon doping, resulting in a
substantially shifted electrochemical response.25
Figure 4.1. Shown in A is the crystal structure of PdAu24(PET)18 with gold in yellow, thiol in red and palladium in blue. The carbon chains have been removed for clarity. B is a heat map of the bond lengths of the gold icosahedron.
51
Despite the similarities, it is obscure which oxidation state of Au25(PET)18 is formally
isoelectronic with PdAu24(PET)180. In general, only the s and p electrons of a metal are donated
to the superatom. With an electron configuration of 5s04d10, it is expected that Pd makes no
contribution to the superatom electron count. Thus, PdAu24(PET)180 is expected to be
“superatom-isoelectronic” with Au25(PET)18+.
Assuming this, each event in the square wave voltammogram of PdAu24(SR)18 is
assigned with the superatomic configuration (Figure 4.2). The resting potential of the
PdAu24(PET)180 used in formation of single crystals is at 50 mV vs SCE, suggesting a 1S21P4
superatomic configuration for the single-crystal structure. This “open-shell” superatom electron
configuration is one in which a Jahn–Teller effect should be observable, analogous to our recent
observations of a Jahn–Teller effect that increases with increasing oxidation state for Au25(SR)18–
1/0/+1.26
Indeed, analysis of the central icosahedron of PdAu24(SR)18 reveals that the structure is
distorted away from idealized icosahedral symmetry with remarkable similarity to the distortion
observed previously in the Au25(SR)181+ (1S21P4) superatom. In the 1S2 1P4 superatom structure
of Au25(SR)181+, bond lengths in the icosahedral core varied from 2.7 to 3.3 Å, whereas for the
1S21P6 configuration, bond lengths vary only from 2.8 to 3.0 Å. The variability in bond lengths
observed in PdAu24(SR)180 span an identical range to those of Au25(SR)18
+1. Continuous
symmetry measurement (CSM) can be used to quantify distortion from idealized geometry in
terms of root mean squares.27 The CSM values for the central icosahedron of Au25(SR)18–1/0/+1 are
0.67, 0.201, and 0.524. The CSM value for the corresponding structure in PdAu24(SR)180 is
0.350, falling between the values previously observed for the neutral and cationic Au25(SR)18
species.
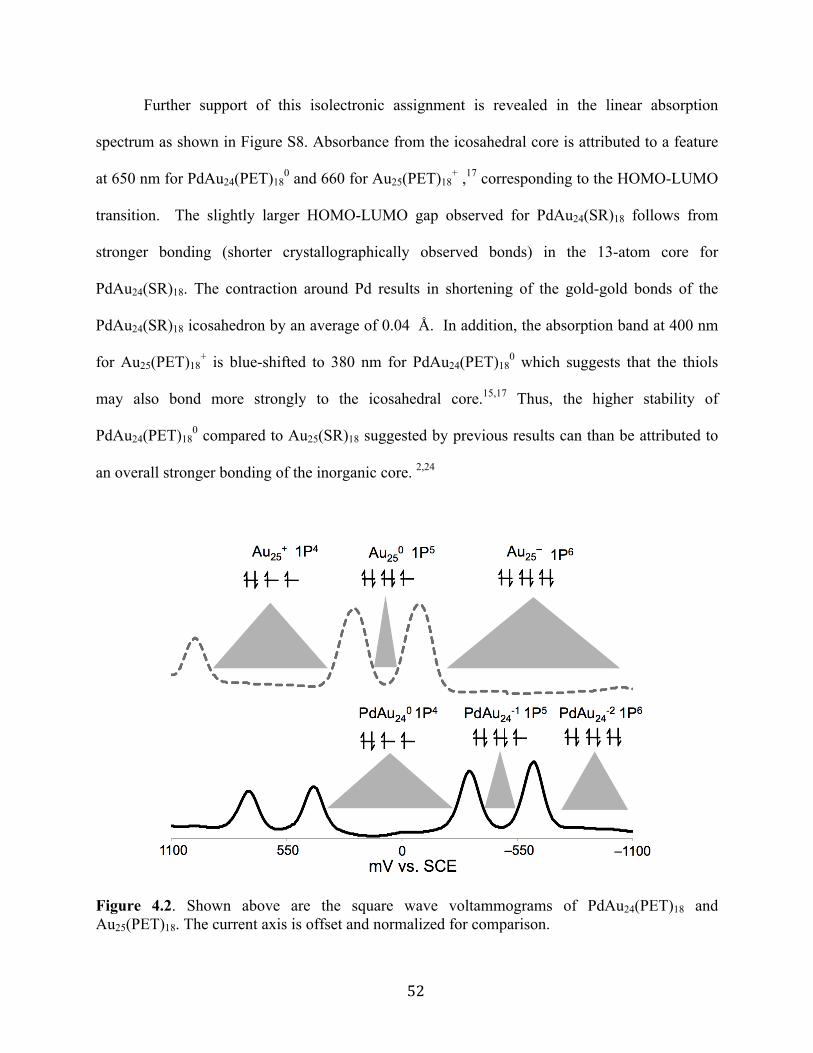
52
Further support of this isolectronic assignment is revealed in the linear absorption
spectrum as shown in Figure S8. Absorbance from the icosahedral core is attributed to a feature
at 650 nm for PdAu24(PET)180 and 660 for Au25(PET)18
+ ,17 corresponding to the HOMO-LUMO
transition. The slightly larger HOMO-LUMO gap observed for PdAu24(SR)18 follows from
stronger bonding (shorter crystallographically observed bonds) in the 13-atom core for
PdAu24(SR)18. The contraction around Pd results in shortening of the gold-gold bonds of the
PdAu24(SR)18 icosahedron by an average of 0.04 Å. In addition, the absorption band at 400 nm
for Au25(PET)18+ is blue-shifted to 380 nm for PdAu24(PET)18
0 which suggests that the thiols
may also bond more strongly to the icosahedral core.15,17 Thus, the higher stability of
PdAu24(PET)180 compared to Au25(SR)18 suggested by previous results can than be attributed to
an overall stronger bonding of the inorganic core. 2,24
Figure 4.2. Shown above are the square wave voltammograms of PdAu24(PET)18 and Au25(PET)18. The current axis is offset and normalized for comparison.
53
We isolated the PdAu24(PET)18 as the neutral (1S21P4) compound without taking any
measures to preserve the oxidation state of the cluster. We suggest that the as-synthesized
PdAu24(PET)18 is in the –2 charge state (1S21P6, presumably more stable). We suggest that,
similar to Au25(SR)18, the compound we studied may be oxidized by ambient atmosphere into the
crystallized oxidation state. Because the reduction potentials are shifted to more negative values
for PdAu24(PET)18 compared to Au25(PET)18, oxidaiton in the presenece of atmospheric oxygen
is expected to be more facile.
Herein we report the crystal structure of PdAu24(PET)180 revealing that Pd is localized to
the cluster core, which retains the same atomic connectivity and nearly identical geometry to
Au25(PET)18–,0,+ clusters. The presence of Pd results in shorter bonds in the 13-atom core and a
blue-shift in the UV/Vis spectrum. Furthermore isoelectronic features between Au25(SR)18 and
PdAu24(SR)18 are clear in their structures, electrochemistry, and linear absorption spectra.
Overall we suggest that PdAu24(PET)18, like Au25(SR)18 is well predicted by a spherical
superatom model.
54
References
(1) Walter, M.; Akola, J.; Lopez-Acevedo, O.; Jadzinsky, P. D.; Calero, G.; Ackerson, C. J.;
Whetten, R. L.; Grönbeck, H.; Häkkinen, H. Proc. Natl. Acad. Sci. U.S.A. 2008, 105,
9157−9162.
(2) Tofanelli, M. A.; Ackerson, C. J. J. Am. Chem. Soc. 2012, 134, 16937−16940.
(3) Zhu, M.; Aikens, C. M.; Hendrich, M. P.; Gupta, R.; Qian, H.; Schatz, G. C.; Jin, R. J.
Am. Chem. Soc. 2009, 131, 2490−2492.
(4) Yi, C.; Tofanelli, M. A.; Ackerson, C. J.; Knappenberger, K. L. J. Am. Chem. Soc. 2013,
135, 18222−18228.
(5) Deheer, W. A. Rev. Mod. Phys. 1993, 65, 611−676.
(6) Lopez-Acevedo, O.; Clayborne, P. A.; Hakkinen, H. Phys. Rev. B: Condens. Matter
Mater. Phys. 2011, 84, 035434.
(7) Aikens, C. M. In Protected Metal Clusters -- From Fundamentals to Applications;
Tsukuda, T., Häkkinen, H., Eds.; Elsevier, 2015; Vol. 9, pp 223−261.
(8) Kothalawala, N.; Kumara, C.; Ferrando, R.; Dass, A. Chem. Commun. 2013, 49,
10850−10852.
(9) Qian, H.; Barry, E.; Zhu, Y.; Jin, R. Acta Phys.-Chim. Sin. 2011, 27, 513−519.
(10) Kwak, K.; Tang, Q.; Kim, M.; Jiang, D.-E.; Lee, D. J. Am. Chem. Soc. 2015, 137, 10833.
(11) Kumara, C.; Dass, A. Nanoscale 2011, 3, 3064−3067.
(12) Kumara, C.; Aikens, C. M.; Dass, A. J. Phys. Chem. Lett. 2014, 5, 461−466.
(13) Parker, J. F.; Fields-Zinna, C. A.; Murray, R. W. Acc. Chem. Res. 2010, 43, 1289−1296.
(14) Christensen, S. L.; MacDonald, M. A.; Chatt, A.; et al. J. Phys.
55
Chem. C 2012, 116, 26932−26937.
(15) Yang, H.; Wang, Y.; Huang, H.; Gell, L.; Lehtovaara, L.; Malola, S.; Häkkinen, H.;
Zheng, N. Nat. Commun. 2013, 4, 2422.
(16) Kacprzak, K. A.; Lehtovaara, L.; Akola, J.; Lopez-Acevedo, O.; Häkkinen, H. Phys. Chem.
Chem. Phys. 2009, 11, 7123−7129.
(17) Zhang, B.; Kaziz, S.; Li, H.; Wodka, D.; Malola, S.; Safonova, O.; Nachtegaal, M.;
Mazet, C.; Dolamic, I.; Llorca, J.; Kalenius, E.; Lawson Daku, L. M.; Häkkinen, H.; Bürgi, T.;
Barrabés, N. Nanoscale 2015, 7, 17012−17019.
(18) Negishi, Y.; Kurashige, W.; Niihori, Y.; Iwasa, T.; Nobusada, K. Phys. Chem. Chem.
Phys. 2010, 12, 6219−6225.
(19) Zhu, M.; Aikens, C. M.; Hollander, F. J.; Schatz, G. C.; Jin, R. J. Am. Chem. Soc. 2008,
130, 5883−5885.
(20) Dainese, T.; Antonello, S.; Gascón, J. A.; Pan, F.; Perera, N. V.; Ruzzi, M.; Venzo, A.;
Zoleo, A.; Rissanen, K.; Maran, F. ACS Nano 2014, 8, 3904−3912.
(21) Zhu, M.; Eckenhoff, W. T.; Pintauer, T.; Jin, R. J. Phys. Chem. C 2008, 112,
14221−14224.
(22) Heaven, M. W.; Dass, A.; White, P. S.; Holt, K. M.; Murray, R. W. J. Am. Chem. Soc.
2008, 130, 3754−3755.
(23) Ni, T. W.; Tofanelli, M. A.; Phillips, B. D.; Ackerson, C. J. Inorg. Chem. 2014, 53,
6500−6502.
(24) Fields-Zinna, C. A.; Crowe, M. C.; Dass, A.; Weaver, J. E. F.; Murray, R. W. Langmuir
2009, 25, 7704−7710.
56
(25) Lopez-Acevedo, O.; Akola, J.; Whetten, R. L.; Gronbeck, H.; Hakkinen, H. J. Phys.
Chem. C 2009, 113, 5035−5038.
(26) Tofanelli, M. A.; Salorinne, K.; Ni, T. W.; Malola, S.; Newell, B. S.; Phillips, B.;
Häkkinen, H.; Ackerson, C. J. Chem. Sci. 2015, 7, 1882-1890.
(27) Zabrodsky, H.; Peleg, S.; Avnir, D. J. Am. Chem. Soc. 1992, 114, 7843−7851.
(28) Negishi, Y.; Kurashige, W.; Niihori, Y.; Iwasa, T.; Nobusada, K. Phys. Chem. Chem.
Phys. 2010, 12, 6219−6225.
(29) Yan, J.; Su, H.; Yang, H.; Malola, S.; Lin, S.; Häkkinen, H.; Zheng, N. J. Am. Chem. Soc.
2015, 137, 11880−11883.
57
Chapter 5
Relaxation of Metallic Au144(SR)60 Nanoclusters*
5.1 Synopsis
Electronic energy relaxation of Au144(SR)60q ligand-protected nanoclusters, where SR =
SC6H13 and q = −1, 0, +1, and +2, was examined using femtosecond time-resolved transient
absorption spectroscopy. The observed differential transient spectra contained three distinct
components: (1) transient bleaches at 525 and 600 nm, (2) broad visible excited-state absorption
(ESA), and (3) stimulated emission (SE) at 670 nm. The bleach recovery kinetics depended upon
the excitation pulse energy and were thus attributed to electron–phonon coupling typical of
metallic nanostructures. The prominent bleach at 525 nm was assigned to a core-localized
plasmon resonance (CLPR). ESA decay kinetics were oxidation-state dependent and could be
described using a metal-sphere charging model. The dynamics, emission energy, and intensity of
the SE peak exhibited dielectric-dependent responses indicative of Superatom charge transfer
states. On the basis of these data, the Au144(SR)60 system is the smallest-known nanocluster to
exhibit quantifiable electron dynamics and optical properties characteristic of metals.
* The work presented herein is published in the Journal of the American Chemical Society with
Chongyue Yi, Marcus A. Tofanelli, Christopher J. Ackerson, and Kenneth L. Knappenberger Jr.
as joint authors. The contributions made by Marcus Tofanelli in this chapter include the
synthesis of Au144(SR)60 as well as the electrochemical methods employed. Permission to reprint
granted by © 2013 American Chemical Society. J. Am. Chem. Soc., 2013, 135 (48), 18222–
18228.
58
5.2 Introduction
Metallic nanostructures represent a promising class of nanomaterials for catalysis,
medical diagnostics, therapeutics, and the utilization of electromagnetic energy.1,-6 Many of these
opportunities depend on the unique optical and electronic properties exhibited by metals
confined to nanoscale dimensions. For colloidal nanoparticles, these properties change
dramatically over the nanometer length scale, evolving from subnanometer, quantum-confined
nanoclusters with discrete electronic orbitals and HOMO–LUMO energy gaps to the collective
properties of plasmon-supporting nanoparticles (>2 nm). Although significant progress has been
made using Superatom models to describe the electronic structure of smaller nanoclusters,7-15 ,
and classical approaches accurately account for the optical and electronic characteristics of larger
nanoparticles,16,17 the properties—including the onset of metallic behavior—of intermediate
(∼1.5 nm) nanometals are poorly understood. Monolayer-protected gold nanoclusters (MPCs) are
an emerging class of nanomaterials, which can be examined in an attempt to bridge the gap in
understanding the evolution from molecular to bulk metal behavior. Much like gas-phase
clusters, specific “magic” sizes of MPCs can be isolated based on a combination of electronic
and geometric shell closings.7-15, 18-20 Moreover, synthetic and electrochemical methods exist for
tailoring the optical, electronic, and capacitive properties of these materials.3, 18, 21-25
The Au144(SR)60 MPC, where SR is SC6H13, nanocluster is especially well-suited for
studying the properties of 1–2 nm nanometals. Widely accepted DFT models that are consistent
with structural data posit a core–shell structure that contains a polyhedral 114-atom gold core,
which is protected by 30 RS-Au-RS “staple” moieties in the outer shell.18, 26 The core has three
concentric shells of 12, (42), and 60 symmetrically equivalent atoms, yielding a total core
diameter of 1.5 nm, with a total inorganic diameter of 1.8 nm including the RS-Au-RS units.18, 27
59
The first evidence of the metal-like behavior for Au144 was obtained from electrochemical and
tunneling microscopy measurements that indicated that these nanoclusters could accommodate
classical double-layer charging,21 with up to 15 discrete charge states resolvable for this MPC.28
These results are supported by recent infrared absorption measurements and electronic-structure
calculations that suggest Au144 nanoclusters are gapless.25 A 20-meV energy gap was detected in
the HOMO–LUMO energy region, but this effect arose from spectroscopic selection rules.25
Simulated optical spectra for Au144(SH)60 included two peaks at 540 and 600 nm, for which the
electron densities are localized to the 114-atom core.18, 19 Taken together, these results suggest
Au144(SR)60 is an ideal prototype for studying the onset of metallic electronic relaxation and
optical properties, including emergent plasmon phenomena.
Femtosecond time-resolved differential extinction spectroscopy is a reliable experimental
diagnostic for quantifying the optical and electronic properties of metal nanostructures.30-41
Excitation of metals by short-pulse lasers generates a nonequilibrium electron gas, which
subsequently cools through coupling with the phonon bath of the metal lattice over a picosecond
time scale.29 Formation of the hot electron gas results in a transient bleach in the differential
extinction spectra at the plasmon resonance wavelength of the nanoparticle. The dynamics of the
approximately picosecond electron–phonon equilibration can be recorded by monitoring the
time-dependent recovery of the plasmon bleach. For metals, these electron cooling rates depend
directly on the excitation pulse energy.30
Here, we present the results of a study of femtosecond time-resolved transient extinction
measurements of Au144(SC6H13)60 manipulated by bulk electrolysis into 4 different oxidation
states, q (q = −1, 0, +1, +2). We provide the first direct experimental evidence of MPCs
displaying electronic energy relaxation characteristic of metallic nanostructures, with a
60
quantifiable electron–phonon coupling constant. Also, transient difference spectra included
discrete peaks at visible wavelengths, consistent with a collective resonance of the free electrons,
which we described as a core-localized plasmon resonance (CLPR). Although significant
contributions from Superatom orbitals were required to account fully for the observed relaxation
dynamics, the 144-gold-atom nanocluster is, to date, the smallest cluster known to exhibit
metallic electronic-energy relaxation dynamics and optical properties.
5.3 Results and Discussion
For all time- and wavelength-resolved transient extinction measurements, Au144(SR)60
nanoclusters were excited using the 400-nm second harmonic of an amplified Ti:sapphire laser,
and the time domain relaxation dynamics were recorded using a temporally delayed broad-
bandwidth visible continuum pulse. The experimental setup has been described previoulsy;42
pertinent details are provided as Supporting Information. The 400-nm excitation was resonant
with multiple nanocluster states that included contributions from the ligand shell and the gold
interband transition.18 Figure 5.1 portrays typical transient differential extinction spectra for
nanoclusters in the q = −1 (a), 0 (b), +1 (c), and +2 (d) oxidation states recorded at a pump–probe
time delay of 0.8 ps. For all oxidation states, the transient spectra included three distinct
components: (i) ground-state bleach at short wavelengths, (ii) broad excited-state absorption
(ESA) that spanned most of the visible spectrum, and (iii) transient induced transparency at 670
nm, which we attributed to stimulated emission. Analysis of the time-domain response was
complicated by the spectral overlap of the three components described above, which resulted
primarily from the broad ESA peak. Although the general features of the transient spectra were
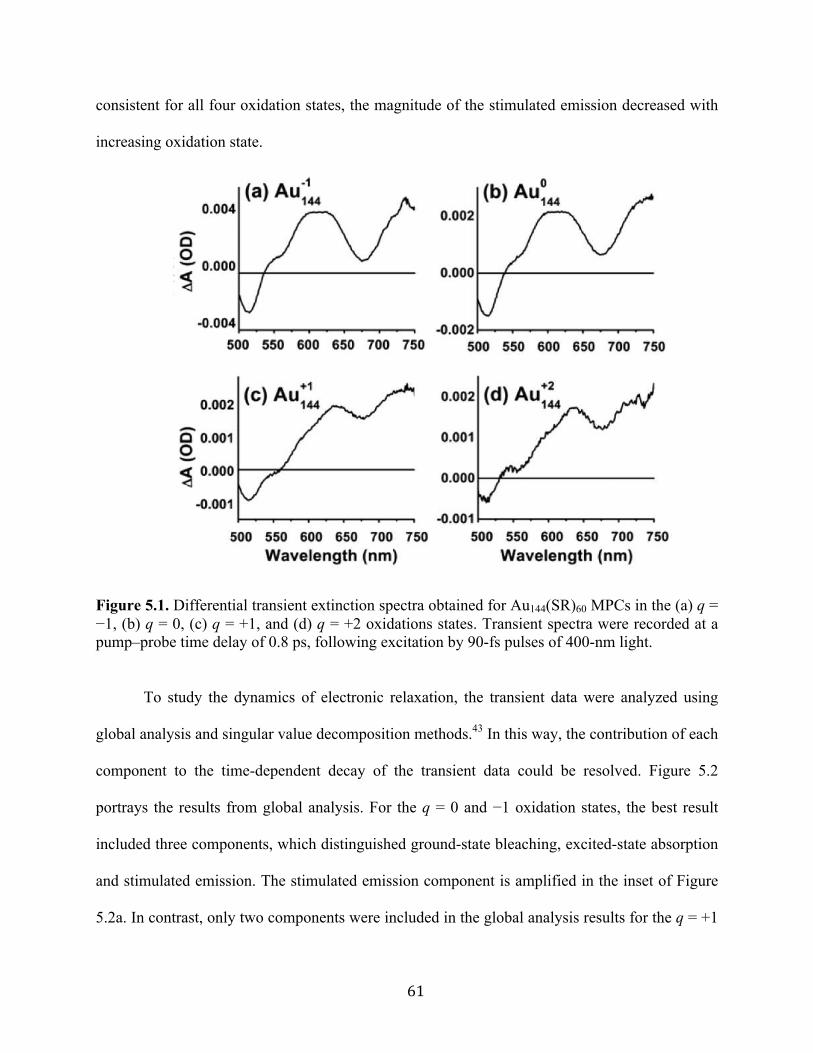
61
consistent for all four oxidation states, the magnitude of the stimulated emission decreased with
increasing oxidation state.
Figure 5.1. Differential transient extinction spectra obtained for Au144(SR)60 MPCs in the (a) q = −1, (b) q = 0, (c) q = +1, and (d) q = +2 oxidations states. Transient spectra were recorded at a pump–probe time delay of 0.8 ps, following excitation by 90-fs pulses of 400-nm light.
To study the dynamics of electronic relaxation, the transient data were analyzed using
global analysis and singular value decomposition methods.43 In this way, the contribution of each
component to the time-dependent decay of the transient data could be resolved. Figure 5.2
portrays the results from global analysis. For the q = 0 and −1 oxidation states, the best result
included three components, which distinguished ground-state bleaching, excited-state absorption
and stimulated emission. The stimulated emission component is amplified in the inset of Figure
5.2a. In contrast, only two components were included in the global analysis results for the q = +1
62
and +2 oxidation states (Figure 5.2b), which corresponded to ground-state bleaching and excited-
state absorption. This result was not surprising based on the relatively weak stimulated emission
observed for nanoclusters in positive oxidation states. Temporal analysis of the three components
yielded characteristic time constants of (i) ∼1 ps, (ii) ∼3 ps, and (iii) ∼20 ps. These three
components, which provided direct experimental evidence for metallic electron energy
relaxation, as well as relaxation via Superatom states, will be discussed separately.
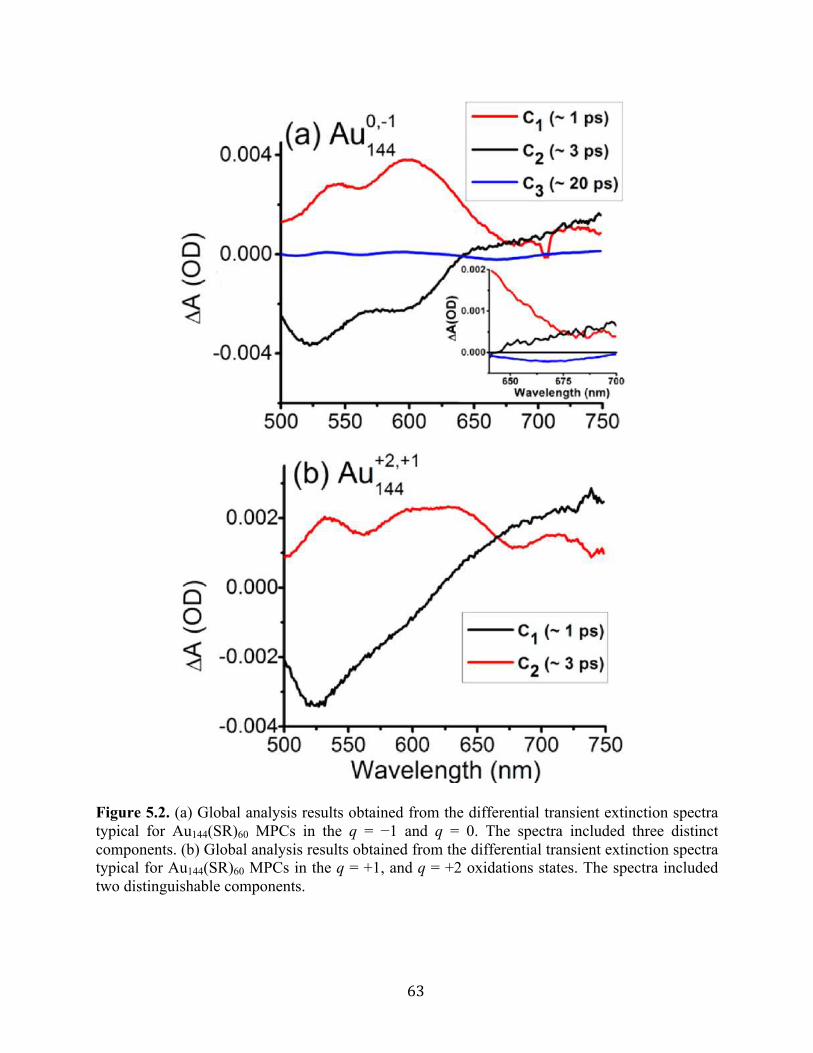
63
Figure 5.2. (a) Global analysis results obtained from the differential transient extinction spectra typical for Au144(SR)60 MPCs in the q = −1 and q = 0. The spectra included three distinct components. (b) Global analysis results obtained from the differential transient extinction spectra typical for Au144(SR)60 MPCs in the q = +1, and q = +2 oxidations states. The spectra included two distinguishable components.
64
Component 1: Ground-State Bleaching
Component one contributes negative amplitude to the transient difference spectra with an
onset of approximately 630 nm, reminiscent of the well-known LSPR bleach exhibited by larger
colloidal gold nanoparticles. This bleach component contributed two peaks with maxima at 525
and 600 nm, consistent with electronic structure calculations.18 The intensity of the 600-nm
component was most significant for nanoclusters with q = 0, −1. To determine the nature of
electronic energy relaxation in the Au144 nanoclusters, the time dependence of the component-1
bleach recovery was monitored. Time-domain data obtained after electronic excitation of the
Au144(0) nanocluster using a range of excitation pulse energies are shown in Figure 5.3a. These
time-dependent traces were generated using the magnitude of the 525-nm transient bleach signal
as a function of time after nanocluster excitation. For this sample, the pump laser power was
varied from 300 to 800 nJ per pulse, with larger pulse energies resulting in longer relaxation
times. The experimental time-domain data were fit using an exponential decay function. The
instrument response function was deconvoluted to the Gaussian pump and probe laser pulses
using a program written in house that relies on an iterative least-squares approach.42
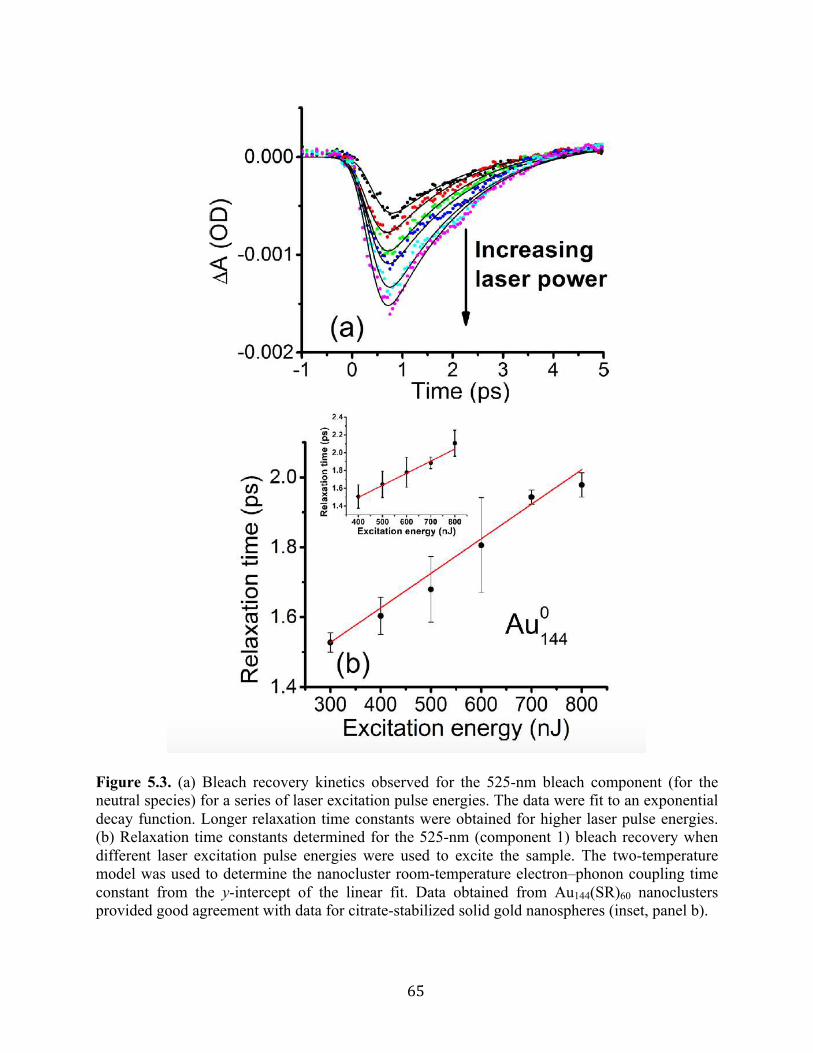
65
Figure 5.3. (a) Bleach recovery kinetics observed for the 525-nm bleach component (for the neutral species) for a series of laser excitation pulse energies. The data were fit to an exponential decay function. Longer relaxation time constants were obtained for higher laser pulse energies. (b) Relaxation time constants determined for the 525-nm (component 1) bleach recovery when different laser excitation pulse energies were used to excite the sample. The two-temperature model was used to determine the nanocluster room-temperature electron–phonon coupling time constant from the y-intercept of the linear fit. Data obtained from Au144(SR)60 nanoclusters provided good agreement with data for citrate-stabilized solid gold nanospheres (inset, panel b).
66
To examine more carefully the excitation pulse energy dependence of the data in Figure
5.3a, the resulting time constants were plotted as a function of laser pulse energy in Figure 5.3b.
Although Figure 5.3b portrays only the data obtained for the neutral Au144(SR)60 system, the
relaxation time constants for all four nanocluster oxidation states were linearly dependent on
excitation pulse energy; the complete data set is provided as Supporting Information. Linear
power-dependent data are a characteristic feature of electron cooling in metallic nanostructures
and are accurately described using the two-temperature model.44, 45 The use of pulsed lasers to
excite metals results in the formation of a nonequilibrium electron gas. In the two-temperature
model, the electron gas and the metal lattice are treated as two coupled subsystems at different
temperatures; upon impulsive excitation, the temperature of the electron gas is determined by the
laser pulse energy, whereas the lattice remains at room temperature. The extent of electron–
phonon coupling determines the rate of energy flow from the electron gas to the lattice. The two
temperature model can be described using eqs 1 and 2:44, 45
eq 1
eq 2
where Te and Tl are the respective temperatures of the electron gas and the lattice, and Ce and Cl
are the electron and lattice heat capacities. The coupling of Te and Tl is quantified by the
electron–phonon coupling constant, G. The linear dependence of the relaxation time constant on
the excitation pulse energy results from the direct dependence of Ce on Te, as shown in eq 2
where γ = 66 J m–3 K–2 for gold.30
Hence, the pulse-energy dependence of the relaxation time constants could be used to
quantify the electron–phonon coupling constants observed for the Au144 nanoclusters. First, the
67
room-temperature electron–phonon coupling time constant was determined for the Au144
nanoclusters by applying a linear fit to the data in Figure 5.3b and extrapolating to zero laser
pulse energy. The room-temperature time constant obtained in this manner was then converted to
the nanocluster electron–phonon coupling constant using eq 3:30
eq. 3
Analysis of all four nanoclusters yielded an average electron–phonon coupling constant
of G = (1.68 ± 0.15) × 1016 W m3– K–1. This value agreed well with the reported value of ∼2 ×
1016 W m3– K–1 for larger citrate-stabilized gold nanoparticles;30 using the same laser system as
in the current study, we recently obtained G = 1.85 × 10¹⁶ W m3– K–1 for solid gold nanospheres
ranging from 20 to 83 nm in diameter.42 Therefore, the bleach-recovery results for Au144(SR)60
nanoclusters agreed well with electron–lattice equilibration, which we attribute to interband
excitation of the 114-atom gold core of the nanocluster. The small differences in the G values of
the nanoclusters and nanoparticles could arise from the dispersing medium and capping ligands;
the nanoclusters are stabilized by thiols whereas the large nanoparticles are capped using citrate.
Taken together, the transient bleach at 525 nm and the electron cooling dynamics suggested that
the Au144 nanoclusters exhibited properties characteristic of larger plasmonic noble metal
nanoparticles. Although transient extinction measurements have been performed on other ligand-
protected gold nanoclusters,46-50 these data provide the first experimental evidence of
quantifiable electron–phonon coupling that is characteristic of a metal nanostructure. Previous
experiments carried out on Au55 revealed a rapid energy relaxation process occurring on a
68
picosecond time scale, but an electron–phonon coupling constant could not be determined for
those clusters.34
The electronic relaxation dynamics of the Au144 nanoclusters were consistent with
electronic structure calculations25 as well as electrochemical measurements21 that predict a
vanishing energy gap separating the HOMO and LUMO levels and the onset of metallic
behavior. The gap closing also results in a high density of states in the HOMO–LUMO region,
leading to efficient electrical charging.21 The capacitive properties of Au144(SR)60 nanoclusters
can be described using a metallic-sphere model. Nonlinear absorption measurements provide
further evidence of metallic behavior for Au144(SR)60 nanoclusters.51 Recent electronic structure
calculations indicate that optical excitation of Au144(SR)60 nanoclusters results in a collective
resonance that is localized to the nanocluster core.29 This collective resonance likely gives rise to
the transient bleach observed at 525 nm in the differential extinction spectra following 400-nm
excitation of the Au144(SR)60 interband transition. Because this resonance is confined to the
interior core of the core–shell nanoparticle, we distinguish it from the localized surface plasmon
resonances (LSPR) of colloidal nanoparticles by calling it a core-localized plasmon resonance
(CLPR). To our knowledge, these transient data provide the first experimental observation of a
prominent CLPR transition. Moreover, the 144-atom nanocluster is the smallest gold system for
which a plasmon resonance has been verified and characteristic metallic electron cooling has
been quantified.
Component 2: Excited-State Absorption
Further direct evidence of the metallic behavior of Au144 nanoclusters was obtained from
the oxidation state-dependent kinetics of component two (excited state absorption). In addition to
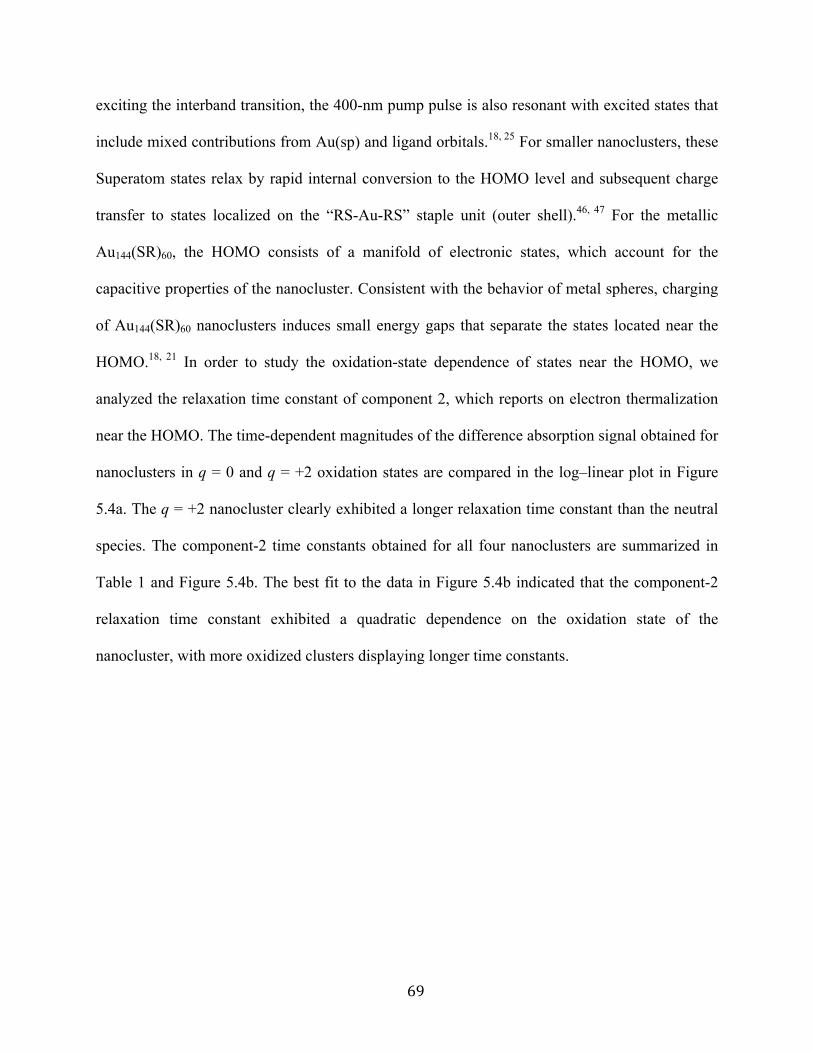
69
exciting the interband transition, the 400-nm pump pulse is also resonant with excited states that
include mixed contributions from Au(sp) and ligand orbitals.18, 25 For smaller nanoclusters, these
Superatom states relax by rapid internal conversion to the HOMO level and subsequent charge
transfer to states localized on the “RS-Au-RS” staple unit (outer shell).46, 47 For the metallic
Au144(SR)60, the HOMO consists of a manifold of electronic states, which account for the
capacitive properties of the nanocluster. Consistent with the behavior of metal spheres, charging
of Au144(SR)60 nanoclusters induces small energy gaps that separate the states located near the
HOMO.18, 21 In order to study the oxidation-state dependence of states near the HOMO, we
analyzed the relaxation time constant of component 2, which reports on electron thermalization
near the HOMO. The time-dependent magnitudes of the difference absorption signal obtained for
nanoclusters in q = 0 and q = +2 oxidation states are compared in the log–linear plot in Figure
5.4a. The q = +2 nanocluster clearly exhibited a longer relaxation time constant than the neutral
species. The component-2 time constants obtained for all four nanoclusters are summarized in
Table 1 and Figure 5.4b. The best fit to the data in Figure 5.4b indicated that the component-2
relaxation time constant exhibited a quadratic dependence on the oxidation state of the
nanocluster, with more oxidized clusters displaying longer time constants.
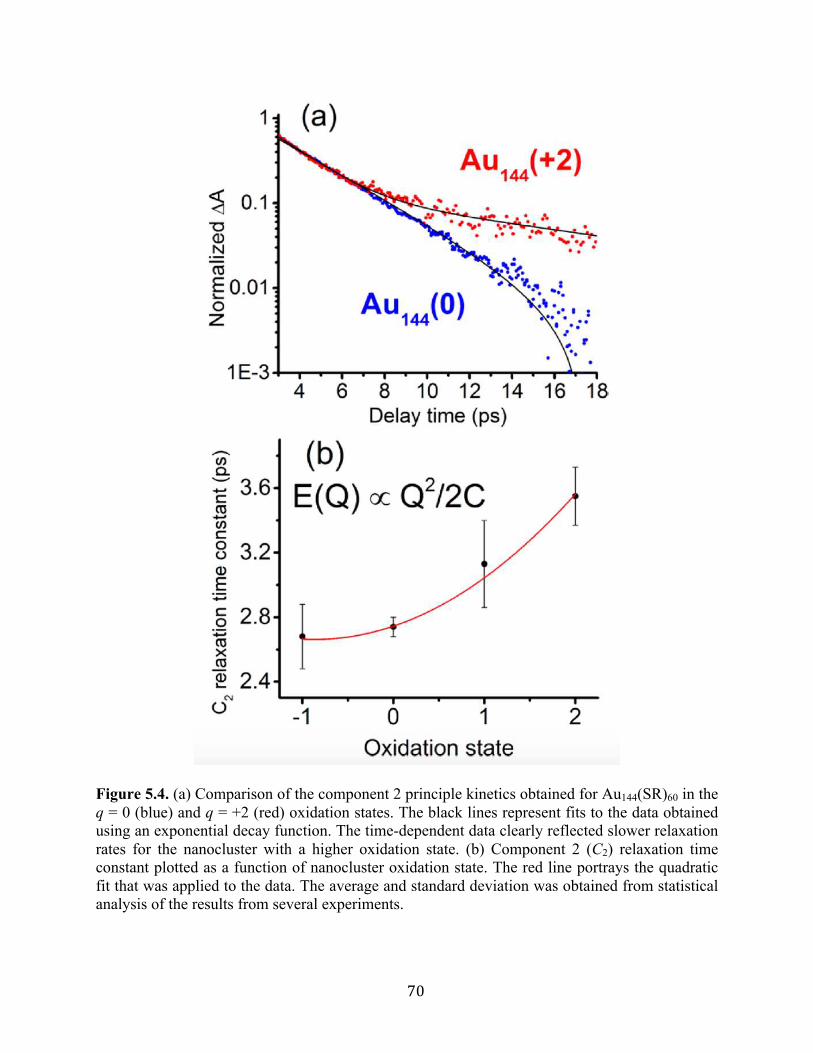
70
Figure 5.4. (a) Comparison of the component 2 principle kinetics obtained for Au144(SR)60 in the q = 0 (blue) and q = +2 (red) oxidation states. The black lines represent fits to the data obtained using an exponential decay function. The time-dependent data clearly reflected slower relaxation rates for the nanocluster with a higher oxidation state. (b) Component 2 (C2) relaxation time constant plotted as a function of nanocluster oxidation state. The red line portrays the quadratic fit that was applied to the data. The average and standard deviation was obtained from statistical analysis of the results from several experiments.
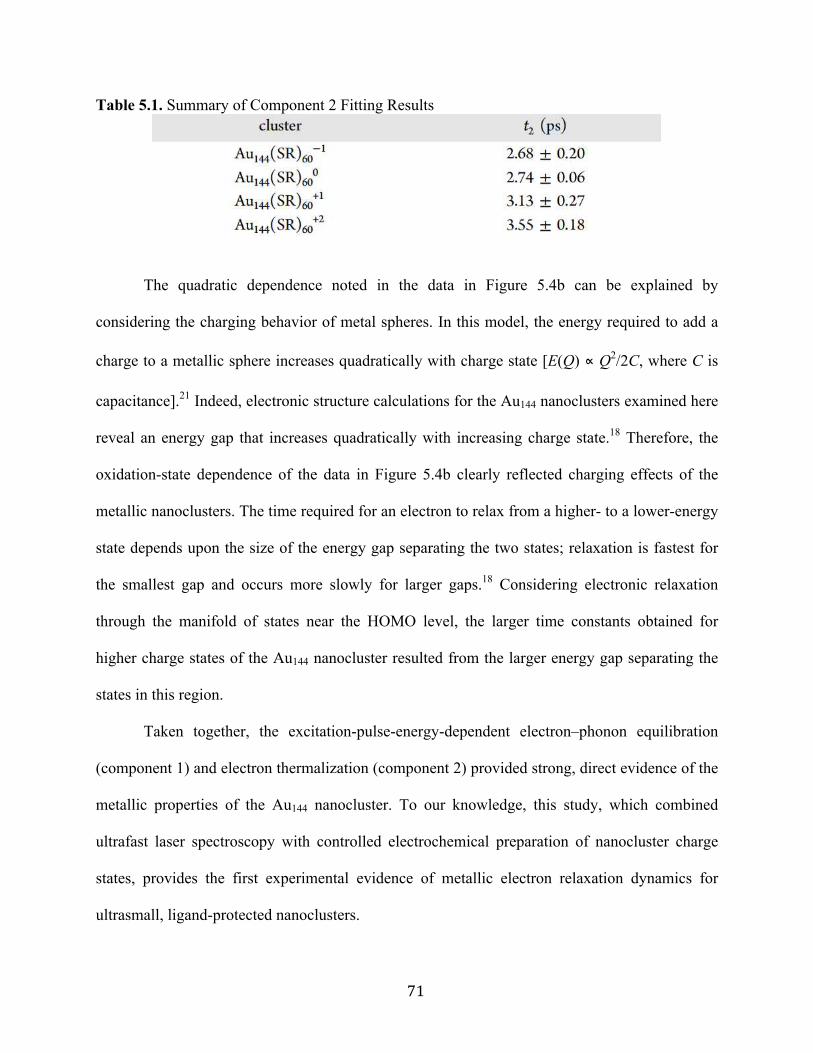
71
Table 5.1. Summary of Component 2 Fitting Results
The quadratic dependence noted in the data in Figure 5.4b can be explained by
considering the charging behavior of metal spheres. In this model, the energy required to add a
charge to a metallic sphere increases quadratically with charge state [E(Q) ∝ Q2/2C, where C is
capacitance].21 Indeed, electronic structure calculations for the Au144 nanoclusters examined here
reveal an energy gap that increases quadratically with increasing charge state.18 Therefore, the
oxidation-state dependence of the data in Figure 5.4b clearly reflected charging effects of the
metallic nanoclusters. The time required for an electron to relax from a higher- to a lower-energy
state depends upon the size of the energy gap separating the two states; relaxation is fastest for
the smallest gap and occurs more slowly for larger gaps.18 Considering electronic relaxation
through the manifold of states near the HOMO level, the larger time constants obtained for
higher charge states of the Au144 nanocluster resulted from the larger energy gap separating the
states in this region.
Taken together, the excitation-pulse-energy-dependent electron–phonon equilibration
(component 1) and electron thermalization (component 2) provided strong, direct evidence of the
metallic properties of the Au144 nanocluster. To our knowledge, this study, which combined
ultrafast laser spectroscopy with controlled electrochemical preparation of nanocluster charge
states, provides the first experimental evidence of metallic electron relaxation dynamics for
ultrasmall, ligand-protected nanoclusters.
72
Component 3: Stimulated Emission
The third component of the transient spectra resulted from transient induced transparency
at 670 nm, which we attributed to stimulated emission. The magnitude of the component 3 signal
increased concomitantly with the probe energy, and the peak energy, amplitude, and width all
exhibited time-dependent behaviors. These factors implied that the spectral feature at 670 nm
resulted from stimulated emission rather than saturated ground-state absorption.53 As portrayed
by the transient spectra in Figure 5.1, the relative contribution from stimulated emission was
largest for the q = 0, −1 nanoclusters, whereas only small contributions were observed for the
cationic species. Stimulated emission is often observed in transient extinction spectra of
organometallic compounds, and it originates from charge-transfer states.54 Ligand-to-metal
charge transfer processes have been invoked to account for NIR photoluminescence of smaller
(Au25) nanoclusters.55 Nanocluster-to-ligand-shell charge transfer has also been used to reconcile
picosecond relaxation dynamics of Au25.46 However, for Au144, electronic energy relaxation
proceeds by rapid thermalization of a manifold of states with an electron gap of approximately
20 meV. On the basis of energy conserving arguments, this relaxation process should preclude
electron transfer from the nanocluster to the ligand shell. One possible explanation to account for
component three dynamics is that the time-dependent stimulated emission signal tracks
electronic energy relaxation of charge-transfer Superatomic orbitals with significant ligand
character that are excited independently of the nanocluster core. On the basis of electronic
structure calculations, 400-nm pumping of Au144(SR)60 excites both the interband transition and
ligand states.25
To examine whether component three resulted from stimulated emission mediated by
charge-transfer Superatom states, we analyzed the integrated intensities (Figure 5.5a; blue) and
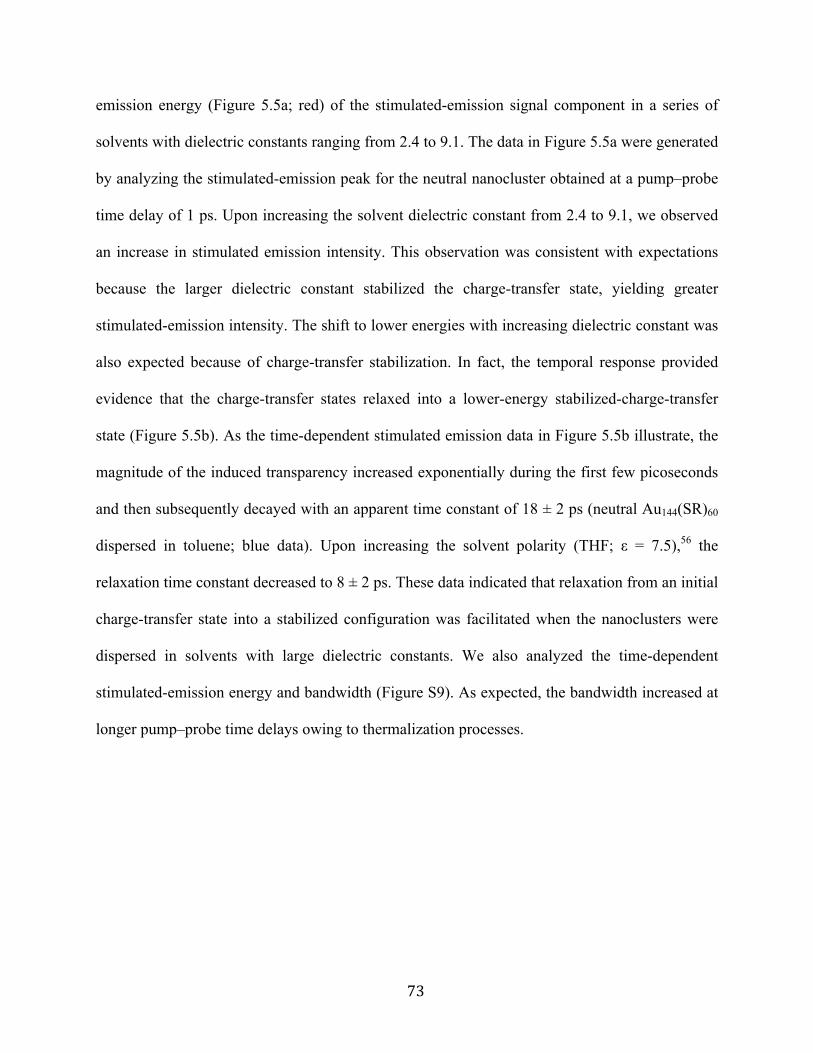
73
emission energy (Figure 5.5a; red) of the stimulated-emission signal component in a series of
solvents with dielectric constants ranging from 2.4 to 9.1. The data in Figure 5.5a were generated
by analyzing the stimulated-emission peak for the neutral nanocluster obtained at a pump–probe
time delay of 1 ps. Upon increasing the solvent dielectric constant from 2.4 to 9.1, we observed
an increase in stimulated emission intensity. This observation was consistent with expectations
because the larger dielectric constant stabilized the charge-transfer state, yielding greater
stimulated-emission intensity. The shift to lower energies with increasing dielectric constant was
also expected because of charge-transfer stabilization. In fact, the temporal response provided
evidence that the charge-transfer states relaxed into a lower-energy stabilized-charge-transfer
state (Figure 5.5b). As the time-dependent stimulated emission data in Figure 5.5b illustrate, the
magnitude of the induced transparency increased exponentially during the first few picoseconds
and then subsequently decayed with an apparent time constant of 18 ± 2 ps (neutral Au144(SR)60
dispersed in toluene; blue data). Upon increasing the solvent polarity (THF; ε = 7.5),56 the
relaxation time constant decreased to 8 ± 2 ps. These data indicated that relaxation from an initial
charge-transfer state into a stabilized configuration was facilitated when the nanoclusters were
dispersed in solvents with large dielectric constants. We also analyzed the time-dependent
stimulated-emission energy and bandwidth (Figure S9). As expected, the bandwidth increased at
longer pump–probe time delays owing to thermalization processes.
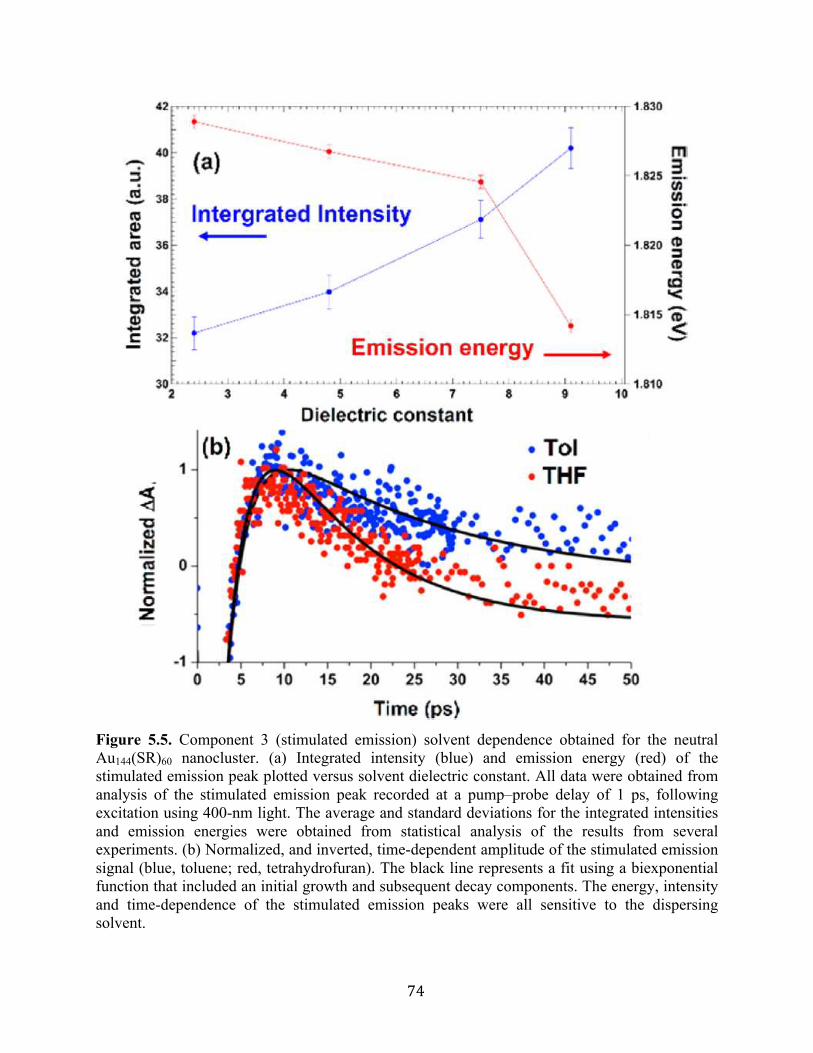
74
Figure 5.5. Component 3 (stimulated emission) solvent dependence obtained for the neutral Au144(SR)60 nanocluster. (a) Integrated intensity (blue) and emission energy (red) of the stimulated emission peak plotted versus solvent dielectric constant. All data were obtained from analysis of the stimulated emission peak recorded at a pump–probe delay of 1 ps, following excitation using 400-nm light. The average and standard deviations for the integrated intensities and emission energies were obtained from statistical analysis of the results from several experiments. (b) Normalized, and inverted, time-dependent amplitude of the stimulated emission signal (blue, toluene; red, tetrahydrofuran). The black line represents a fit using a biexponential function that included an initial growth and subsequent decay components. The energy, intensity and time-dependence of the stimulated emission peaks were all sensitive to the dispersing solvent.
75
Electronic energy relaxation of Au144(SR)60 nanoclusters proceeds via several
mechanisms. Systematic analysis of the multicomponent transient extinction spectra allowed for
elucidation of these processes. Two of these components (C1 and C2) exhibited the characteristic
features of electronic energy relaxation for metal nanostructures, thereby providing direct
evidence of the metallic behavior of the ligand-protected Au144 system. However, analysis of
component 3, which showed signatures of charge-transfer states, suggested that Superatom
concepts are still needed for providing a complete description of the electron dynamics of
monolayer-protected nanoclusters with diameters of approximately 1.8 nm.
5.4 Conclusion
We have presented the first systematic study of electronic energy relaxation of
Au144(SR)60 nanoclusters using a comprehensive range of oxidation states. Our ultrafast transient
extinction data showed direct evidence of the metallic properties of this nanocluster. To our
knowledge, the Au144(SR)60 species is the smallest gold nanoparticle to exhibit quantifiable
metallic behavior. The transient-difference spectra obtained for Au144(SR)60 also provided
compelling experimental evidence for collective optical excitations that localize electron density
to the interior core of the nanocluster. We designate these optical transitions as core-localized
plasmon resonances. The potential impacts of metal nanostructure optical, thermal, and electrical
properties are far reaching, with applications including applied spectroscopy, solar-to-electric
energy conversion, medical imaging and therapeutics, and nonlinear optical technologies based
on negative index metamaterials. Clearly, gold nanoparticles with diameters of approximately
1.8 nm are important nanomaterials for developing a predictive understanding of the transition
from molecular to bulk-like properties.
76
References
(1) Valden, M.; Lai, X.; Goodman, D. W. Science 1998, 281, 1647– 1650
(2) Hirsch, L. R.; Stafford, R. J.; Bankson, J. A.; Sershen, S. R.; Rivera, B.; Price, R. E.;
Hazle, J. D.; Halas, N. J.; West, J. L. Proc. Natl. Acad. Sci. U.S.A. 2003, 100, 13540– 13554
(3) McCoy, R. S.; Choi, S.; Collins, G.; Ackerson, B. J.; Ackerson, C. J. ACS Nano 2013, 7,
2610– 2616
(4) Knappenberger, K. L., Jr.; Dowgiallo, A. M.; Chandra, M.; Jarrett, J. W. J. Phys. Chem.
Lett. 2013, 4, 1109– 1119
(5) Daniel, M.-C.; Astruc, D. Chem. Rev. 2004, 104, 293– 346
(6) Sardar, R.; Funston, A.; Mulvaney, P.; Murray, R. Langmuir 2009, 24, 13840– 13851
(7) Aikens, C. M. J. Phys. Chem. Lett. 2010, 1, 2594– 2599
(8) Jin, R. Nanoscale 2010, 2, 343– 362
(9) Price, R. C.; Whetten, R. L. J. Am. Chem. Soc. 2005, 127, 13750– 13751
(10) Aikens, C. M. J. Phys. Chem. Lett. 2011, 2, 99– 104
(11) Wyrwas, R. B.; Alvarez, M. M.; Khoury, J. T.; Price, R. C.; Schaaff, T. G.; Whetten, R.
L. Eur. Phys. J. D 2007, 43, 91– 95
(12) Walter, M.; Akola, J.; Lopez-Acevedo, O.; Jadzinsky, P. D.; Calero, G.; Ackerson, C. J.;
Whetten, R. L.; Gronbeck, H.; Hakkinen, H. Proc. Natl. Acad. Sci. U.S.A. 2008, 105, 9157–
9162
(13) Heaven, M. W.; Dass, A.; White, P. S.; Holt, K. M.; Murray, R. W. J. Am. Chem. Soc.
2008, 130, 3754– 3755
77
(14) Zhu, M.; Aikens, C. M.; Hollander, F.; Schatz, G.; Jin, R. J. Am. Chem. Soc. 2008, 130,
5883– 5885
(15) Tofanelli, M. A.; Ackerson, C. J. Am. Chem. Soc. 2012, 134, 16937– 16940
(16) Mie, G. Ann. Phys. 1908, 330, 377– 445
(17) Kreibig, U.; Vollmer, M. Optical Properties of Metal Clusters; Springer: Berlin-
Heidelberg, 1995.
(18) Lopez-Acevedo, O.; Akola, J.; Whetten, R. L.; Grönbeck, H.; Häkkinen, H. J. Phys.
Chem. C 2009, 113, 5035– 5038
(19) Dass, A. J. Am. Chem. Soc. 2011, 133, 19259– 19261
(20) Knoppe, S.; Boudon, J.; Dolamic, I.; Dass, A.; Burgi, T. Anal. Chem. 2011, 83, 5056–
5061
(21) Ingram, R. S.; Hostetler, M. J.; Murray, R. W.; Schaaff, T. G.; Khoury, J. T.; Whetten, R.
L.; Bigioni, T. P.; Guthrie, D. K.; First, P. N. J. Am. Chem. Soc. 1997, 119, 9279– 9280
(22) Chaki, N. K.; Negishi, Y.; Tsunoyama, H.; Shichibu, Y.; Tsukuda, T. J. Am. Chem. Soc.
2008, 130, 8608– 8610
(23) Jadzinsky, P. D.; Calero, G.; Ackerson, C. J.; Bushnell, D. A.; Kornberg, R. D. Science
2007, 318, 430– 433
(24) Parker, J. F.; Fields-Zinna, C. A.; Murray, R. W. Acc. Chem. Res. 2010, 43, 1289– 1296
(25) Koivisto, J.; Malola, S.; Kumara, C.; Dass, A.; Hakkinan, H.; Pettersson, M. J. Phys.
Chem. Lett. 2012, 3, 3076– 3080
(26) Wong, O. A.; Heinecke, C. L.; Simone, A. R.; Whetten, R. L.; Ackerson, C. J. Nanoscale
2012, 4, 4099– 4102
78
(27) Bahena, D.; Bhattarai, N.; Santiago, U.; Tlahuice, A.; Ponce, A.; Bach, S. B.; Yoon, B.;
Whetten, R. L.; Landman, U.; Jose-Yacaman, M. J. Phys. Chem. Lett. 2013, 4, 975– 981
(28) (a) Hicks, J. F.; Miles, D. T.; Murray, R. W. J. Am. Chem. Soc. 2002, 124, 13322– 13328
(b) Quinn, B. M.; Liljeroth, P.; Ruiz, V.; Laaksonen, T.; Kontturi, K. J. Am. Chem. Soc. 2003,
125, 6644– 6645
(28) Malola, S.; Lehtovara, L.; Enkovaara, J.; Hakkinan, H. ACS Nano 2013, 125, 6644– 6645
(30) Hartland, G. V. Phys. Chem. Chem. Phys. 2004, 6, 5263– 5274
(31) Voisin, C.; Del Fatti, N.; Christofilos, D.; Vallee, F. J. Phys. Chem. B 2001, 105, 2264–
2280
(32) Pelton, M.; Sader, J. E.; Burgin, J.; Liu, M. Z.; Guyot-Sionnest, P.; Gosztola, D. Nat.
Nanotechnol. 2009, 4, 492– 495
(33) Voisin, C.; Del Fatti, N.; Christofilos, D.; Vallee, F. Appl. Surf. Sci. 2000, 164, 131– 139
(34) Smith, B. A.; Zhang, J. Z.; Giebel, U.; Schmid, G. Chem. Phys. Lett. 1997, 270, 139– 144
(35) Link, S.; El-Sayed, M. A. J. Phys. Chem. B 1999, 103, 8410– 8426
(36) Hartland, G. V. J. Chem. Phys. 2002, 116, 8048– 8055
(37) Averitt, R. D.; Westcott, S. L.; Halas, N. J. Phys. Rev. B 1998, 58, R10203– 10206
(38) Dowgiallo, A. M.; Knappenberger, K. L., Jr. J. Am. Chem. Soc. 2012, 134, 19393– 19400
(39) Grant, C. D.; Schwartzberg, A. M.; Yang, Y.; Chen, S.; Zhang, J. Z. Chem. Phys. Lett.
2004, 383, 31– 34
(40) Guillon, C.; Langot, P.; Del Fatti, N.; Vallee, F.; Kirakosyan, A. S.; Shahbazyan, T. V.;
Cardinal, T.; Treguer, M. Nano Lett. 2007, 7, 138– 142
(41) Dowgiallo, A. M.; Schwartzberg, A. M.; Knappenberger, K. L., Jr. Nano Lett. 2011, 11,
3258– 3262
79
(42) Dowgiallo, A. M.; Knappenberger, K. L., Jr. Phys. Chem. Chem. Phys. 2011, 13, 21585–
21592
(43) Van Stokkum, I. H. M.; Larsen, D. S.; Van Grondelle, R. Biochim. Biophys. Acta,
Bioenerg. 2004, 87, 1858– 1872
(44) Kaganov, M. I.; Lifshitz, I. M.; Tanatarov, L. V. Sov. Phys.—JETP 1957, 4, 173
(45) Fujimoto, J. G.; Ippen, E. P.; Bloemberger, N. Phys. Rev. Lett. 1984, 53, 1837– 1840
(46) Miller, S. A.; Fields-Zinna, C. A.; Murray, R. W.; Moran, A. M. J. Phys. Chem. Lett.
2010, 1, 1383– 1387
(47) Devadas, M. S.; Kim, J.; Sinn, E.; Lee, D.; Goodson, T. G.; Ramakrishna, G. J. Phys.
Chem. C 2010, 114, 22417– 22423
(48) Qian, H.; Sfeir, M. Y.; Jin, R. J. Phys. Chem. C 2010, 114, 19935– 19940
(49) Green, T. G.; Knappenberger, K. L., Jr. Nanoscale 2012, 4, 4111– 4118
(50) Yau, S. H.; Varnavski, O.; Goodson, T. Acc. Chem. Res. 2013, 46, 1506– 1516
(51) Philip, R.; Chantharasupawong, P.; Qian, H.; Jin, R.; Thomas, J. Nano Lett. 2012, 12,
4661– 4667
(52) Englman, R.; Jortner, J. Mol. Phys. 1970, 18, 145– 164
(53) Bingemann, D.; Ernsting, N. P. J. Chem. Phys. 1995, 102, 2691– 2700
(54) Leung, M. H. M.; Pham, D. T.; Lincoln, S. F.; Kee, T. W. Phys. Chem. Chem. Phys.
2012, 14, 13580– 13587
(55) Wu, Z.; Jin, R. Nano Lett. 2010, 10, 2568– 2573
(56) CRC Handbook of Chemistry and Physics, 92nd ed.; CRC Press: Boca Raton, FL, 2011–
2012; pp 6– 242.
80
Chapter 6
Polymorphism in magic-sized Au144(SR)60 clusters*
6.1 Synopsis
Ultra-small, magic-sized metal nanoclusters represent an important new class of materials
with properties between molecules and particles. However, their small size challenges the
conventional methods for structure characterization. Here we present the structure of ultra-stable
Au144(SR)60 magic-sized nanoclusters obtained from atomic pair distribution function analysis of
X-ray powder diffraction data. The study reveals structural polymorphism in these archetypal
nanoclusters. In addition to confirming the theoretically predicted icosahedral-cored cluster, we
also find samples with a truncated decahedral core structure, with some samples exhibiting a
coexistence of both cluster structures. Although the clusters are monodisperse in size, structural
diversity is apparent. The discovery of polymorphism may open up a new dimension in
nanoscale engineering.
6.2 Introduction
The promise of nanotechnology, to engineer materials at the nanoscale with improved
properties, is predicated on the idea that material structure and properties are fundamentally
modified on this scale. Gold clusters are prototypical inorganic materials that exemplify this1-8.
*The work presented herein is published in the Nature Communications with Kirsten M.Ø.
Jensen, Pavol Juhas, Marcus A. Tofanelli, Christine L. Heinecke, Gavin Vaughan, Christopher J.
Ackerson, and Simon J. L. Billinge as joint authors. The contributions made by Marcus Tofanelli
in this chapter include the synthesis of Au144(SR)60 , the electrochemical methods employed as
well as characterization by mass spectrometry. © 2016 Macmillan Publishers Limited. Nature comm., 2016, 7, 11859.
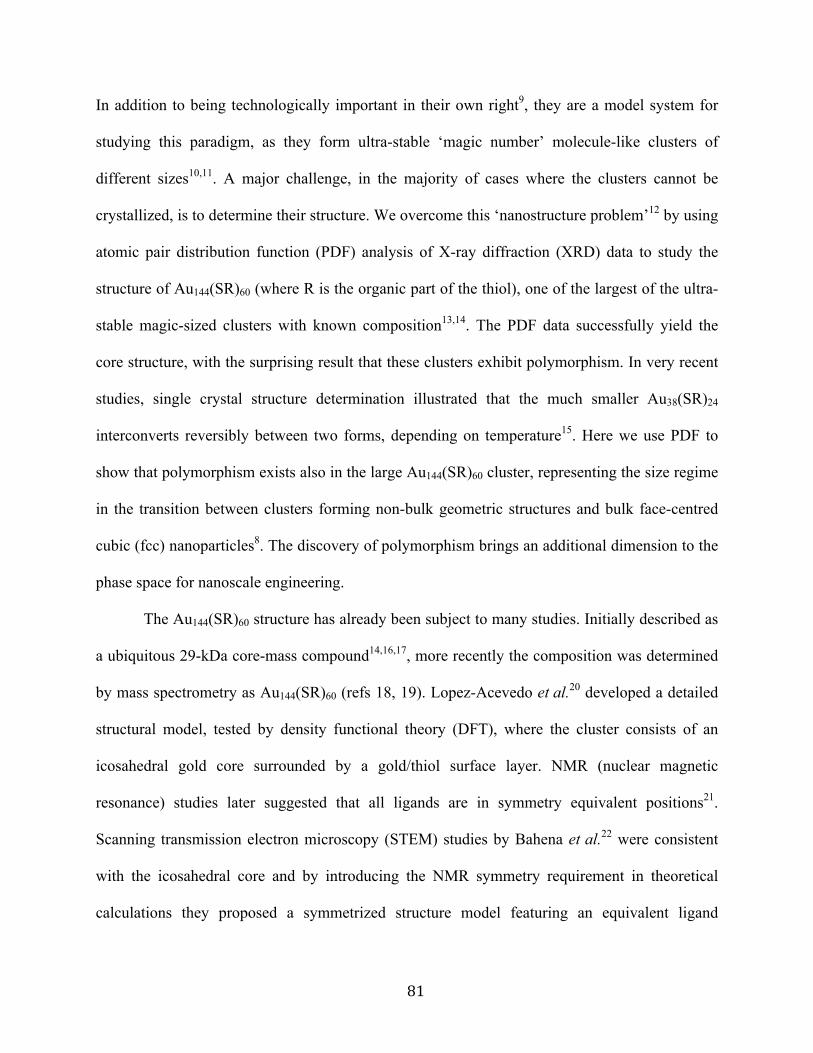
81
In addition to being technologically important in their own right9, they are a model system for
studying this paradigm, as they form ultra-stable ‘magic number’ molecule-like clusters of
different sizes10,11. A major challenge, in the majority of cases where the clusters cannot be
crystallized, is to determine their structure. We overcome this ‘nanostructure problem’12 by using
atomic pair distribution function (PDF) analysis of X-ray diffraction (XRD) data to study the
structure of Au144(SR)60 (where R is the organic part of the thiol), one of the largest of the ultra-
stable magic-sized clusters with known composition13,14. The PDF data successfully yield the
core structure, with the surprising result that these clusters exhibit polymorphism. In very recent
studies, single crystal structure determination illustrated that the much smaller Au38(SR)24
interconverts reversibly between two forms, depending on temperature15. Here we use PDF to
show that polymorphism exists also in the large Au144(SR)60 cluster, representing the size regime
in the transition between clusters forming non-bulk geometric structures and bulk face-centred
cubic (fcc) nanoparticles8. The discovery of polymorphism brings an additional dimension to the
phase space for nanoscale engineering.
The Au144(SR)60 structure has already been subject to many studies. Initially described as
a ubiquitous 29-kDa core-mass compound14,16,17, more recently the composition was determined
by mass spectrometry as Au144(SR)60 (refs 18, 19). Lopez-Acevedo et al.20 developed a detailed
structural model, tested by density functional theory (DFT), where the cluster consists of an
icosahedral gold core surrounded by a gold/thiol surface layer. NMR (nuclear magnetic
resonance) studies later suggested that all ligands are in symmetry equivalent positions21.
Scanning transmission electron microscopy (STEM) studies by Bahena et al.22 were consistent
with the icosahedral core and by introducing the NMR symmetry requirement in theoretical
calculations they proposed a symmetrized structure model featuring an equivalent ligand
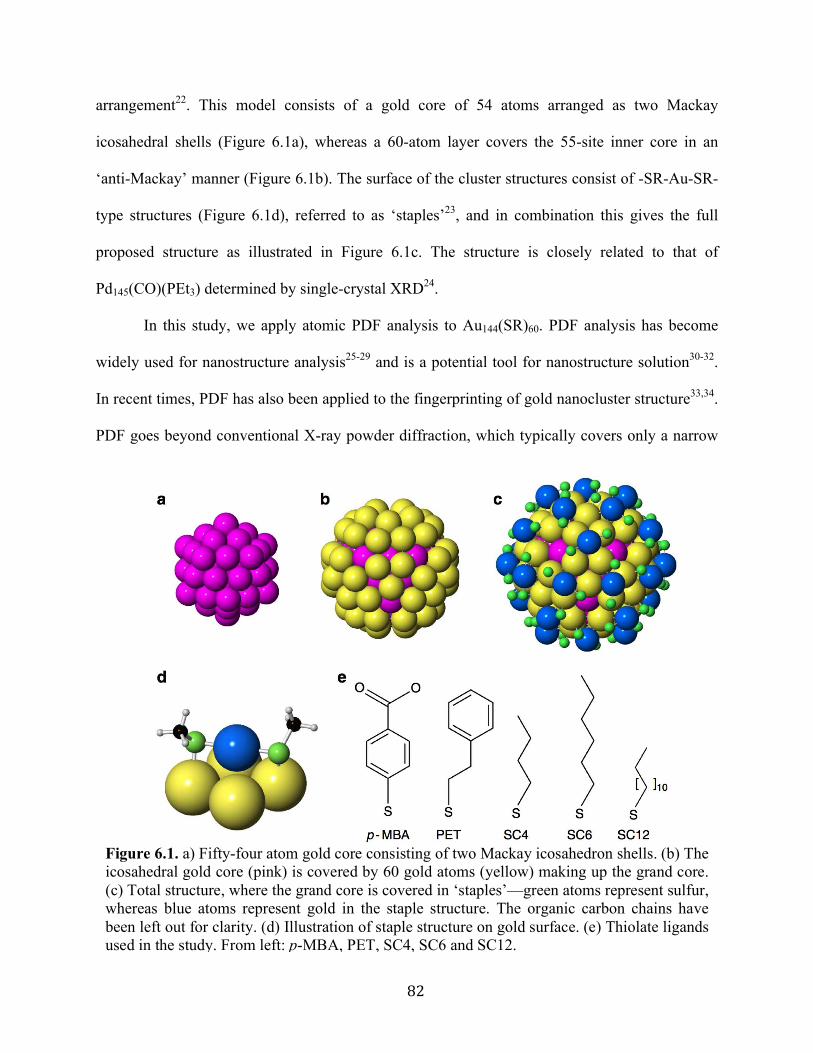
82
arrangement22. This model consists of a gold core of 54 atoms arranged as two Mackay
icosahedral shells (Figure 6.1a), whereas a 60-atom layer covers the 55-site inner core in an
‘anti-Mackay’ manner (Figure 6.1b). The surface of the cluster structures consist of -SR-Au-SR-
type structures (Figure 6.1d), referred to as ‘staples’23, and in combination this gives the full
proposed structure as illustrated in Figure 6.1c. The structure is closely related to that of
Pd145(CO)(PEt3) determined by single-crystal XRD24.
In this study, we apply atomic PDF analysis to Au144(SR)60. PDF analysis has become
widely used for nanostructure analysis25-29 and is a potential tool for nanostructure solution30-32.
In recent times, PDF has also been applied to the fingerprinting of gold nanocluster structure33,34.
PDF goes beyond conventional X-ray powder diffraction, which typically covers only a narrow
Figure 6.1. a) Fifty-four atom gold core consisting of two Mackay icosahedron shells. (b) The icosahedral gold core (pink) is covered by 60 gold atoms (yellow) making up the grand core. (c) Total structure, where the grand core is covered in ‘staples’—green atoms represent sulfur, whereas blue atoms represent gold in the staple structure. The organic carbon chains have been left out for clarity. (d) Illustration of staple structure on gold surface. (e) Thiolate ligands used in the study. From left: p-MBA, PET, SC4, SC6 and SC12.
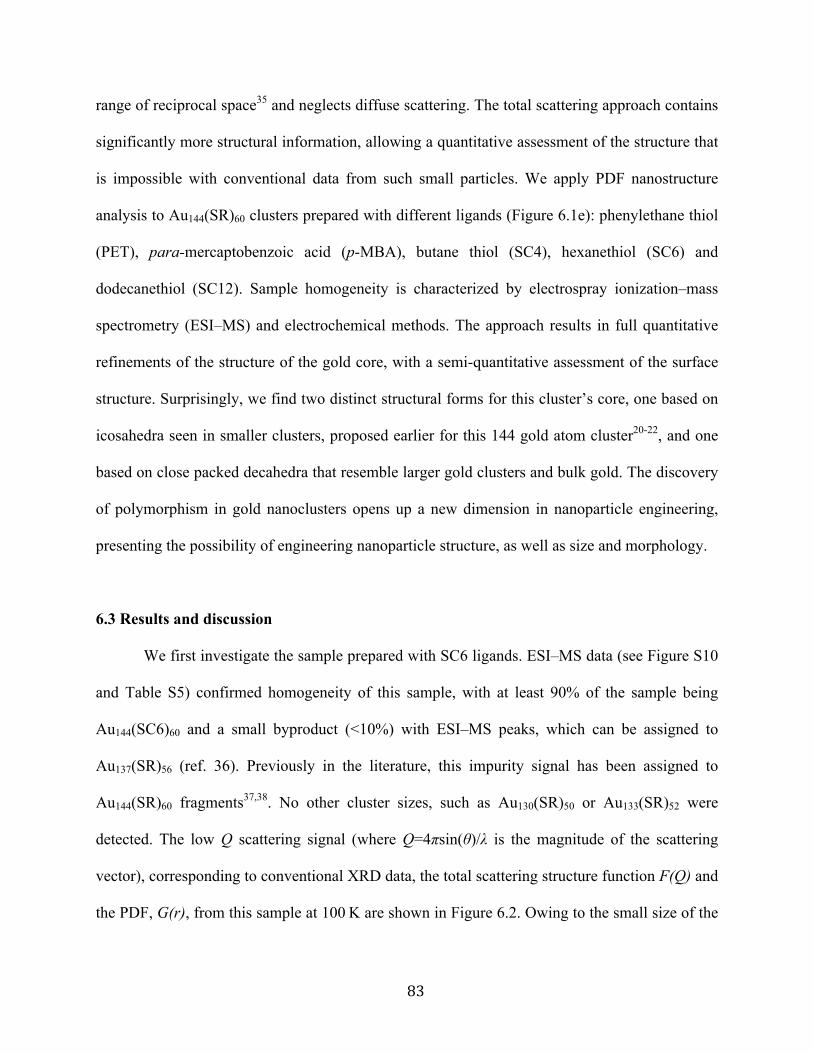
83
range of reciprocal space35 and neglects diffuse scattering. The total scattering approach contains
significantly more structural information, allowing a quantitative assessment of the structure that
is impossible with conventional data from such small particles. We apply PDF nanostructure
analysis to Au144(SR)60 clusters prepared with different ligands (Figure 6.1e): phenylethane thiol
(PET), para-mercaptobenzoic acid (p-MBA), butane thiol (SC4), hexanethiol (SC6) and
dodecanethiol (SC12). Sample homogeneity is characterized by electrospray ionization–mass
spectrometry (ESI–MS) and electrochemical methods. The approach results in full quantitative
refinements of the structure of the gold core, with a semi-quantitative assessment of the surface
structure. Surprisingly, we find two distinct structural forms for this cluster’s core, one based on
icosahedra seen in smaller clusters, proposed earlier for this 144 gold atom cluster20-22, and one
based on close packed decahedra that resemble larger gold clusters and bulk gold. The discovery
of polymorphism in gold nanoclusters opens up a new dimension in nanoparticle engineering,
presenting the possibility of engineering nanoparticle structure, as well as size and morphology.
6.3 Results and discussion
We first investigate the sample prepared with SC6 ligands. ESI–MS data (see Figure S10
and Table S5) confirmed homogeneity of this sample, with at least 90% of the sample being
Au144(SC6)60 and a small byproduct (<10%) with ESI–MS peaks, which can be assigned to
Au137(SR)56 (ref. 36). Previously in the literature, this impurity signal has been assigned to
Au144(SR)60 fragments37,38. No other cluster sizes, such as Au130(SR)50 or Au133(SR)52 were
detected. The low Q scattering signal (where Q=4πsin(θ)/λ is the magnitude of the scattering
vector), corresponding to conventional XRD data, the total scattering structure function F(Q) and
the PDF, G(r), from this sample at 100 K are shown in Figure 6.2. Owing to the small size of the
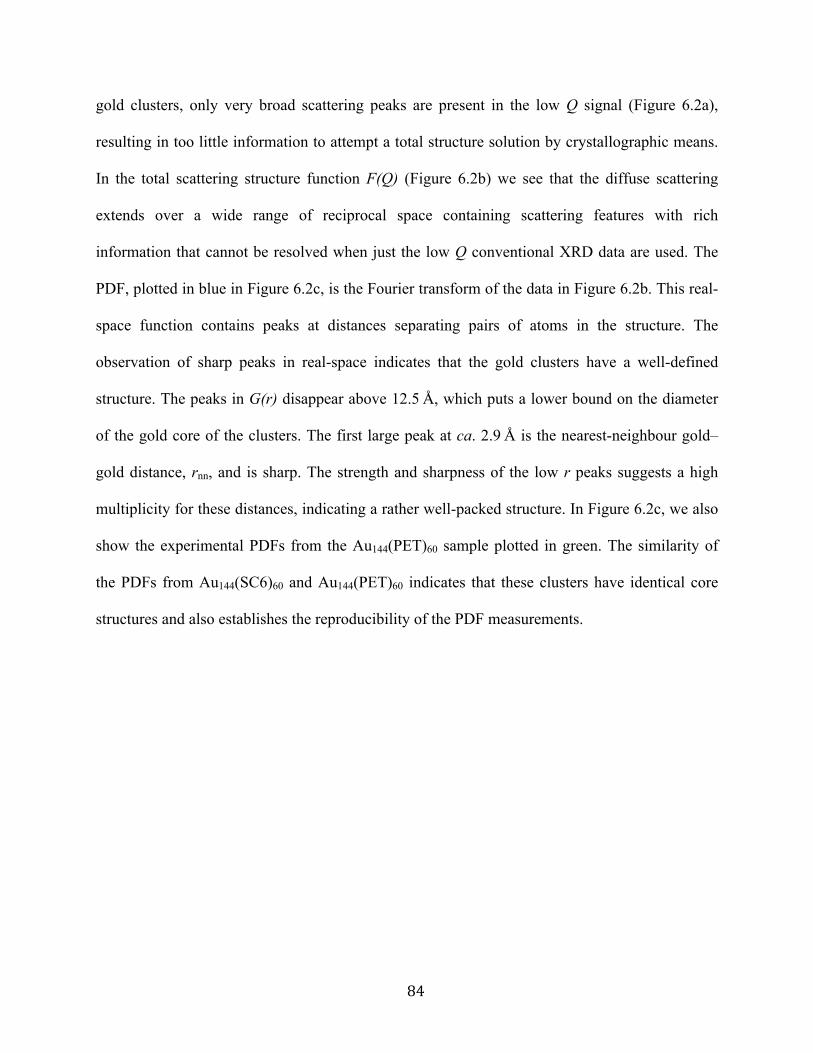
84
gold clusters, only very broad scattering peaks are present in the low Q signal (Figure 6.2a),
resulting in too little information to attempt a total structure solution by crystallographic means.
In the total scattering structure function F(Q) (Figure 6.2b) we see that the diffuse scattering
extends over a wide range of reciprocal space containing scattering features with rich
information that cannot be resolved when just the low Q conventional XRD data are used. The
PDF, plotted in blue in Figure 6.2c, is the Fourier transform of the data in Figure 6.2b. This real-
space function contains peaks at distances separating pairs of atoms in the structure. The
observation of sharp peaks in real-space indicates that the gold clusters have a well-defined
structure. The peaks in G(r) disappear above 12.5 Å, which puts a lower bound on the diameter
of the gold core of the clusters. The first large peak at ca. 2.9 Å is the nearest-neighbour gold–
gold distance, rnn, and is sharp. The strength and sharpness of the low r peaks suggests a high
multiplicity for these distances, indicating a rather well-packed structure. In Figure 6.2c, we also
show the experimental PDFs from the Au144(PET)60 sample plotted in green. The similarity of
the PDFs from Au144(SC6)60 and Au144(PET)60 indicates that these clusters have identical core
structures and also establishes the reproducibility of the PDF measurements.
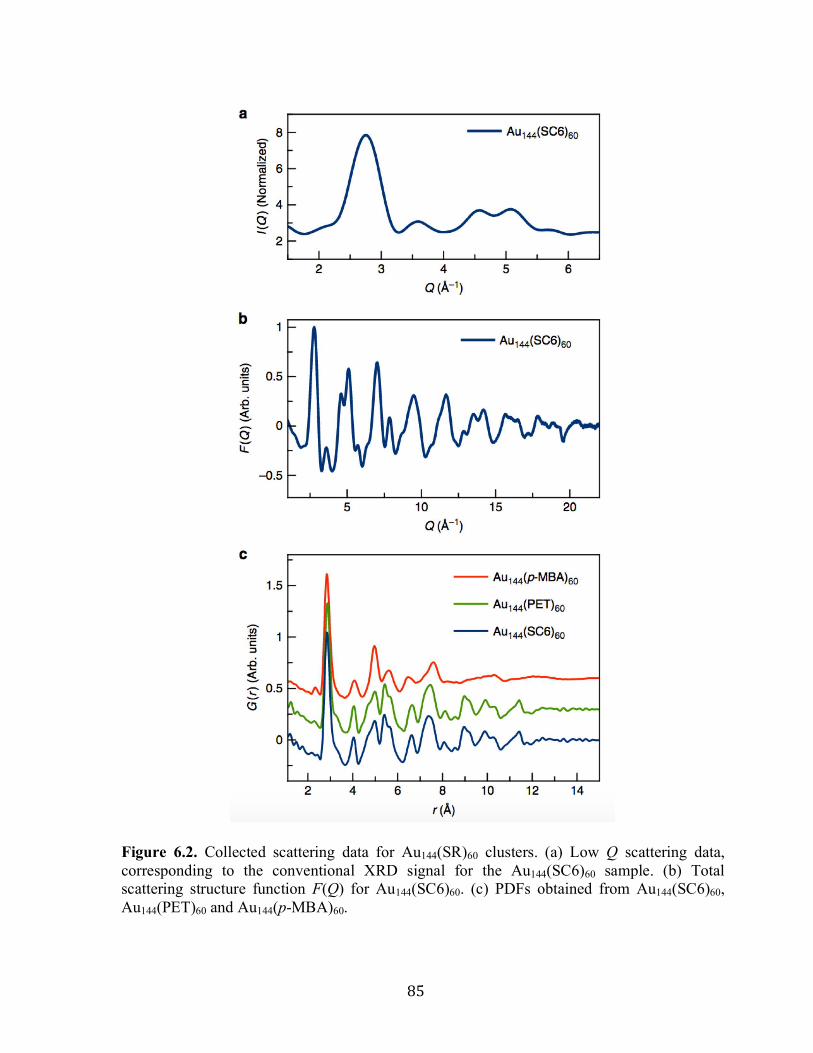
85
Figure 6.2. Collected scattering data for Au144(SR)60 clusters. (a) Low Q scattering data, corresponding to the conventional XRD signal for the Au144(SC6)60 sample. (b) Total scattering structure function F(Q) for Au144(SC6)60. (c) PDFs obtained from Au144(SC6)60, Au144(PET)60 and Au144(p-MBA)60.
86
The red line in Figure 6.2c shows the PDF from Au144(p-MBA)60. There is a remarkable
difference between this PDF and those of Au144(SC6)60 and Au144(PET). These clusters have the
same size, as evident from the disappearance of sharp features in the PDF, by the characteristic,
well-defined differential pulse voltammetry and from mobility in polyacrylamide gel
electrophoresis consistent with Au144(SR)60. Both the SC6, PET- and p-MBA-protected
preparations, formed the poorly diffracting hexagonal plate crystals previously observed for
these compounds39,40. The sharp PDF peaks indicate that the Au144(p-MBA)60 clusters also have
a well-defined ordered structure. However, their structure is remarkably different from that of the
SC6- and PET-terminated clusters: the Au144(SR)60 clusters are exhibiting polymorphism. We
now explore quantitatively the two structural polymorphs, Form I and Form II, of these clusters.
Form I
We begin by calculating PDFs from candidate structures suggested in the literature to
compare with the data. The relative atomic positions are highly constrained in the modeling with
only five parameters allowed to vary: a scale factor accounting for the overall PDF intensity, a
uniform cluster expansion factor that allows the cluster structure to contract or expand, two
isotropic atomic displacement parameter applied separately to the core and surface atoms, as well
as a parameter accounting for correlated atomic motion41. Therefore, good fits to the data are a
strong indicator that the model has captured the correct geometry of the core. To simplify the
models, only the Au and S atoms were included in the refinements, as the scattering signal from
the organic ligands is negligible (see Supplementary note 3) . Figure 6.3a shows the calculated
PDF from the model suggested by Bahena et al.22, fitted to the SC6 data20. The result of a
refinement to the same data, but using the structure reported by Lopez-Acevedo et al.20 is shown
87
in Figure S11. Both models describe the main features of the PDF of the Au144(SC6)60
nanoclusters very well, with the Bahena structure giving a slightly better fit to the PDF with
agreement factor RW=16.3%. This confirms the proposed structures of previous theoretical and
STEM studies21,22.
Similar fits to the Au144(PET)60 sample are given in Figure S12 and Table S6, also
showing good agreement with the icosahedral model (RW=15.8%). Furthermore, a direct
comparison of the experimental data from the PET and SC6 data show that the two samples give
rise to practically identical PDFs as illustrated in Figure S13, where the difference curve between
the two PDFs is essentially a flat line. Interestingly, the ESI–MS data indicated ~16%
Au137(SR)56 in the PET sample, that is, a higher fraction than seen in the SC6 sample. The flat
difference curve between the two PDFs would not be expected if the byproduct signal in ESI–
MS is coming from a different cluster, that is, Au137(SR)56. Thus, the PDFs either indicate that
the byproduct signal is coming from fragments of Au144(SR)60 created during the ESI–MS
measurement, or that the core structure of Au137(SR)56 is indistinguishable to that of Au144(SR)60
Form I. As we see later, the PDF is quite sensitive to small changes in core structure and,
although the latter scenario cannot be ruled out, the former is more probable, indicating that our
samples are pure Au144(SR)60. If the latter scenario is correct, it establishes that the core of
Au137(SR)56 is highly similar to that of Au144(SR)60.
The data shown in Figure 6.2 are obtained at 100 K. Scattering data from Au144(PET)60
were also taken at 300 K, showing no structural changes between the two temperatures (Figure
S14). Furthermore, we measured data using three different X-ray energies, ranging from 39 to
87 keV, and all PDFs ( Figure S14) showed the same structure.
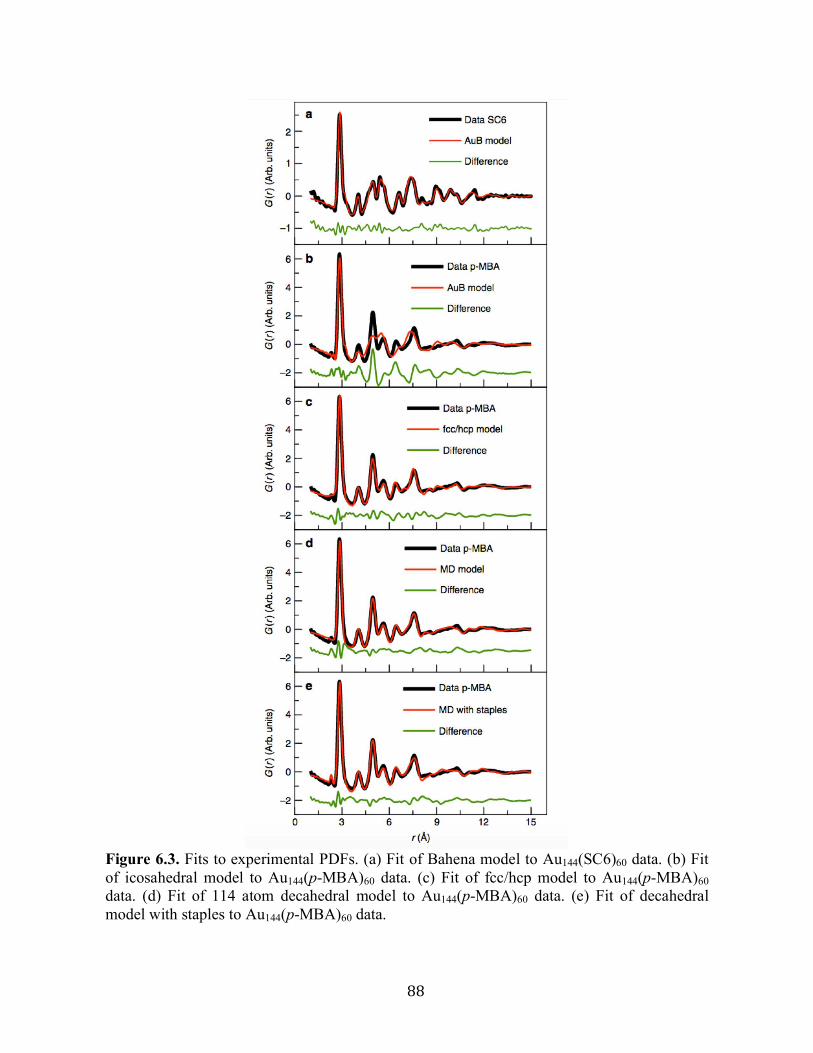
88
Figure 6.3. Fits to experimental PDFs. (a) Fit of Bahena model to Au144(SC6)60 data. (b) Fit of icosahedral model to Au144(p-MBA)60 data. (c) Fit of fcc/hcp model to Au144(p-MBA)60 data. (d) Fit of 114 atom decahedral model to Au144(p-MBA)60 data. (e) Fit of decahedral model with staples to Au144(p-MBA)60 data.
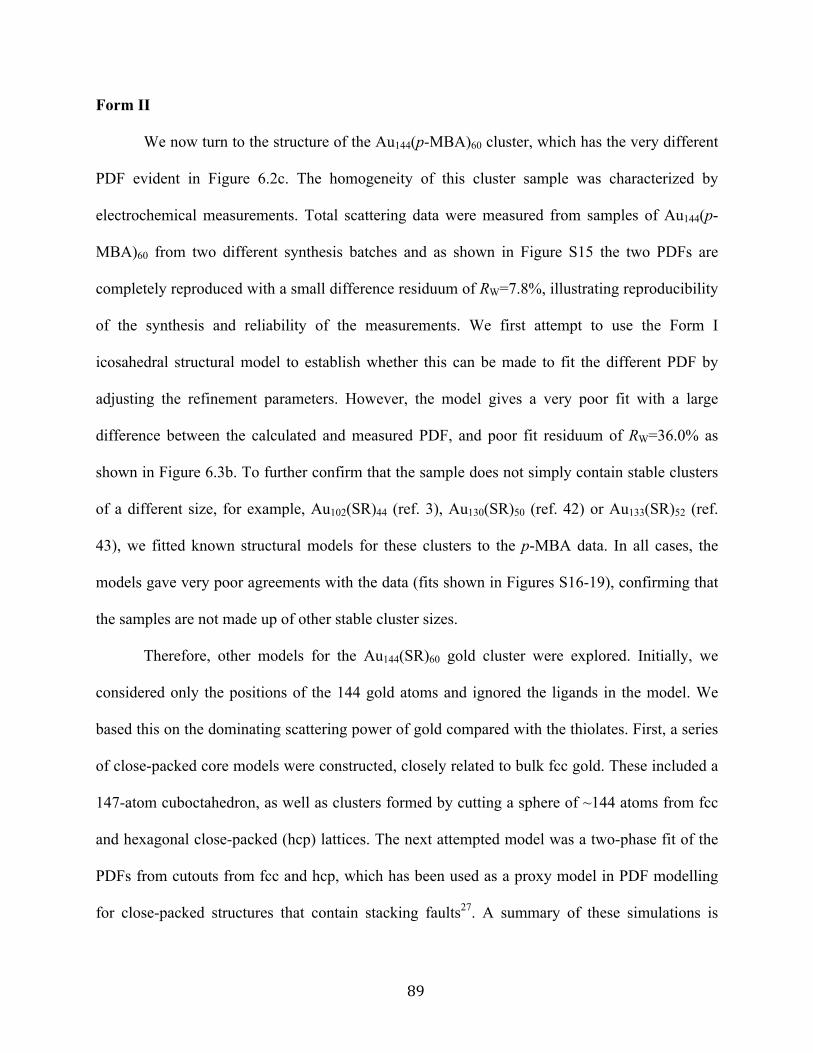
89
Form II
We now turn to the structure of the Au144(p-MBA)60 cluster, which has the very different
PDF evident in Figure 6.2c. The homogeneity of this cluster sample was characterized by
electrochemical measurements. Total scattering data were measured from samples of Au144(p-
MBA)60 from two different synthesis batches and as shown in Figure S15 the two PDFs are
completely reproduced with a small difference residuum of RW=7.8%, illustrating reproducibility
of the synthesis and reliability of the measurements. We first attempt to use the Form I
icosahedral structural model to establish whether this can be made to fit the different PDF by
adjusting the refinement parameters. However, the model gives a very poor fit with a large
difference between the calculated and measured PDF, and poor fit residuum of RW=36.0% as
shown in Figure 6.3b. To further confirm that the sample does not simply contain stable clusters
of a different size, for example, Au102(SR)44 (ref. 3), Au130(SR)50 (ref. 42) or Au133(SR)52 (ref.
43), we fitted known structural models for these clusters to the p-MBA data. In all cases, the
models gave very poor agreements with the data (fits shown in Figures S16-19), confirming that
the samples are not made up of other stable cluster sizes.
Therefore, other models for the Au144(SR)60 gold cluster were explored. Initially, we
considered only the positions of the 144 gold atoms and ignored the ligands in the model. We
based this on the dominating scattering power of gold compared with the thiolates. First, a series
of close-packed core models were constructed, closely related to bulk fcc gold. These included a
147-atom cuboctahedron, as well as clusters formed by cutting a sphere of ~144 atoms from fcc
and hexagonal close-packed (hcp) lattices. The next attempted model was a two-phase fit of the
PDFs from cutouts from fcc and hcp, which has been used as a proxy model in PDF modelling
for close-packed structures that contain stacking faults27. A summary of these simulations is
90
given in Table S7. None of the fcc- or hcp-based clusters produced completely convincing fits to
the observed PDF. However, the fits were significantly better than for the Bahena model,
especially for the fcc/hcp mixture as shown in Figure 6.3c. The PDF agreement of the fcc/hcp
model was remarkably improved after allowing for a separate expansion ratio for the atoms in
the outermost shell, giving RW=16.3%, a step which was motivated by allowing for a possible
surface relaxation. This improved the refinement by fitting the asymmetry in the first Au–Au
peak. However, the results indicated that the bond lengths between the atoms in the surface were
contracted compared with the bonds in the core and the atomic displacement parameters were
excessively large over 0.03 Å2 for the core atoms, suggesting the existence of some atomic
relaxations that are not part of these simple models. Furthermore, this model contains 141 atoms
in the fcc phase and 147 atoms in the hcp phase. We seek a model that can also explain the high
stability of the Au core with 144 atoms, whereas spherical chunks of close-packed bulk material
would not have special stability. Nonetheless, the fitting results establish that the structure of
Au144(SR)60 is much closer to a three-dimensional close-packed structure than the icosahedral,
DFT-derived models.
Our search for close-packed structures that have special atom counts led us to explore a
series of Marks decahedral structures that are constructed by introducing twin boundaries along
the (110) planes of the fcc lattice44,45. Closed shell, truncated decahedra can be constructed with
a large range of discrete number of atoms, including 144, that is, the exact number of gold atoms
in the cluster. This structure and the fit to the experimental PDF are shown in Figure S19, where
excellent fits are seen. However, as described above, thiolate ligands are known to create –SR-
Au-SR– or –SR-Au-SR-Au-SR– ‘staples’ on gold surfaces23,46. The short staple, that is, –SR-Au-
SR– is mainly seen on larger clusters, where the curvature is small, as would be the case in the
91
~2 nm Au144(SR)60 structure, and Au144(SR)60 may thus better be represented as Au114[(SR)-Au-
(SR)]30. This pointed us towards a smaller ino decahedral structure as the core of the cluster, as
illustrated in Figure 6.4a,b. The cluster shown has exactly 114 gold atoms, leaving 30 gold atoms
for the staples as required by the putative stoichiometry. The fit of this cluster to the data is
shown in Figure 6.3d and, as illustrated, the model very well describes the experimental PDF.
All distinct sharp peaks up to 8 Å are reproduced and the fit remains very close even at higher r-
values where the features are broader and less resolved. In studies of smaller clusters, it has been
shown that although the core of the cluster is decahedral, a shell of gold atoms may be seen
between the core structure and the staple layer3. Therefore, we tried stripping down the
decahedral structure to a yet smaller core and reattaching the atoms as ‘caps’ on the remaining
structure3. However, interestingly, any modification to the 114 atom decahedral core highly
deteriorated the PDF fit, making lower symmetry structures unlikely. This makes us confident in
a core structure based on the 114 atom decahedron, closely related to the ino decahedron
described by Cleveland et al.17
Various configurations of the staples on the 114-atom decahedral structure cluster were
then considered, where one example is presented in Figure 6.4c and other selected models are
shown in Figure S19. Staples were placed on the (111) surfaces as previously seen23; however, to
accommodate all ligands to the structure in a physically sensible manner, staples were also
attached to the (100) surfaces, although this motif has not yet been reported. Several different
models were constructed, which all give comparably good fits to the data with RW values of ca.
15–18%, with one example shown in Figure 6.3e, where the presence of staples fit to the
shoulder of the nearest neighbor Au–Au peak. The PDF refinements were somewhat sensitive to
the staple attachment, as subtle differences between the features in the fitted PDF can be
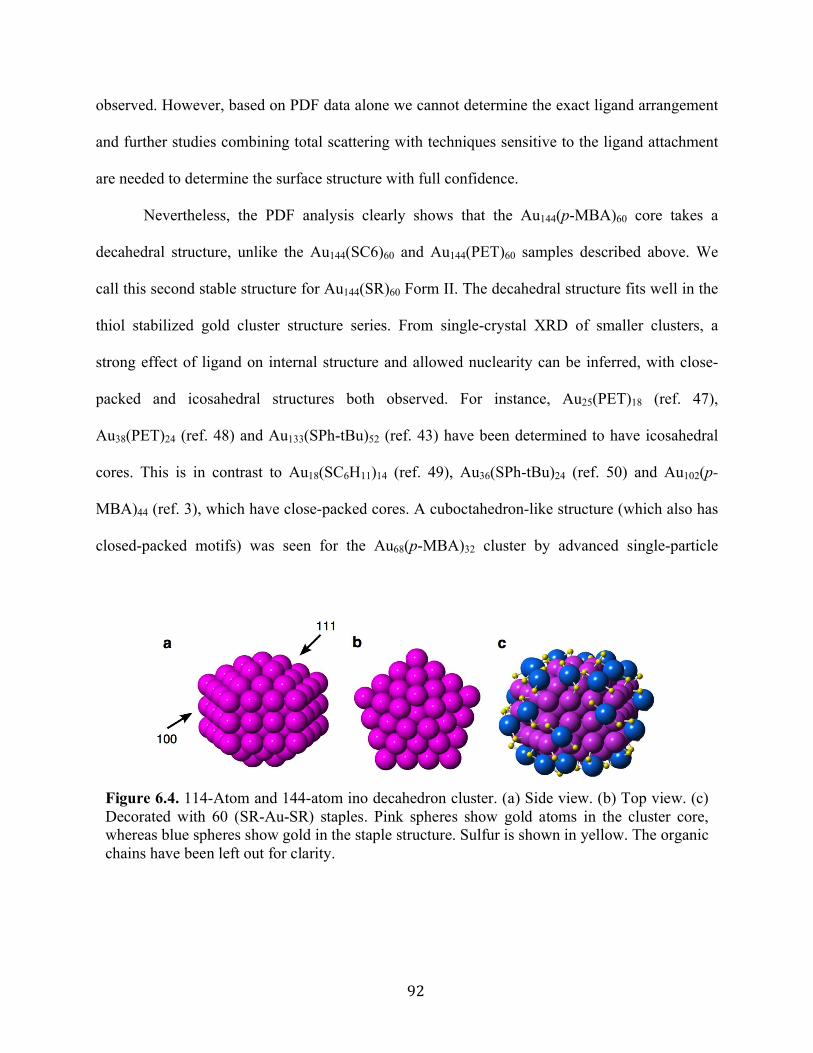
92
observed. However, based on PDF data alone we cannot determine the exact ligand arrangement
and further studies combining total scattering with techniques sensitive to the ligand attachment
are needed to determine the surface structure with full confidence.
Nevertheless, the PDF analysis clearly shows that the Au144(p-MBA)60 core takes a
decahedral structure, unlike the Au144(SC6)60 and Au144(PET)60 samples described above. We
call this second stable structure for Au144(SR)60 Form II. The decahedral structure fits well in the
thiol stabilized gold cluster structure series. From single-crystal XRD of smaller clusters, a
strong effect of ligand on internal structure and allowed nuclearity can be inferred, with close-
packed and icosahedral structures both observed. For instance, Au25(PET)18 (ref. 47),
Au38(PET)24 (ref. 48) and Au133(SPh-tBu)52 (ref. 43) have been determined to have icosahedral
cores. This is in contrast to Au18(SC6H11)14 (ref. 49), Au36(SPh-tBu)24 (ref. 50) and Au102(p-
MBA)44 (ref. 3), which have close-packed cores. A cuboctahedron-like structure (which also has
closed-packed motifs) was seen for the Au68(p-MBA)32 cluster by advanced single-particle
Figure 6.4. 114-Atom and 144-atom ino decahedron cluster. (a) Side view. (b) Top view. (c) Decorated with 60 (SR-Au-SR) staples. Pink spheres show gold atoms in the cluster core, whereas blue spheres show gold in the staple structure. Sulfur is shown in yellow. The organic chains have been left out for clarity.
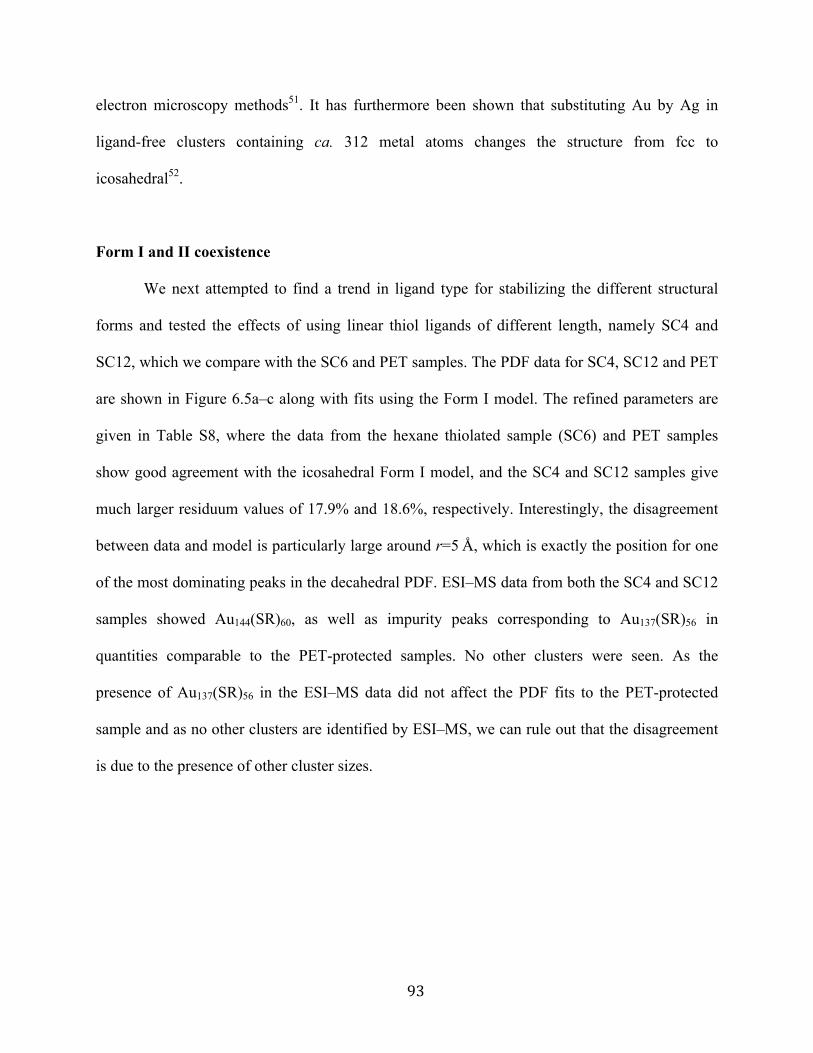
93
electron microscopy methods51. It has furthermore been shown that substituting Au by Ag in
ligand-free clusters containing ca. 312 metal atoms changes the structure from fcc to
icosahedral52.
Form I and II coexistence
We next attempted to find a trend in ligand type for stabilizing the different structural
forms and tested the effects of using linear thiol ligands of different length, namely SC4 and
SC12, which we compare with the SC6 and PET samples. The PDF data for SC4, SC12 and PET
are shown in Figure 6.5a–c along with fits using the Form I model. The refined parameters are
given in Table S8, where the data from the hexane thiolated sample (SC6) and PET samples
show good agreement with the icosahedral Form I model, and the SC4 and SC12 samples give
much larger residuum values of 17.9% and 18.6%, respectively. Interestingly, the disagreement
between data and model is particularly large around r=5 Å, which is exactly the position for one
of the most dominating peaks in the decahedral PDF. ESI–MS data from both the SC4 and SC12
samples showed Au144(SR)60, as well as impurity peaks corresponding to Au137(SR)56 in
quantities comparable to the PET-protected samples. No other clusters were seen. As the
presence of Au137(SR)56 in the ESI–MS data did not affect the PDF fits to the PET-protected
sample and as no other clusters are identified by ESI–MS, we can rule out that the disagreement
is due to the presence of other cluster sizes.
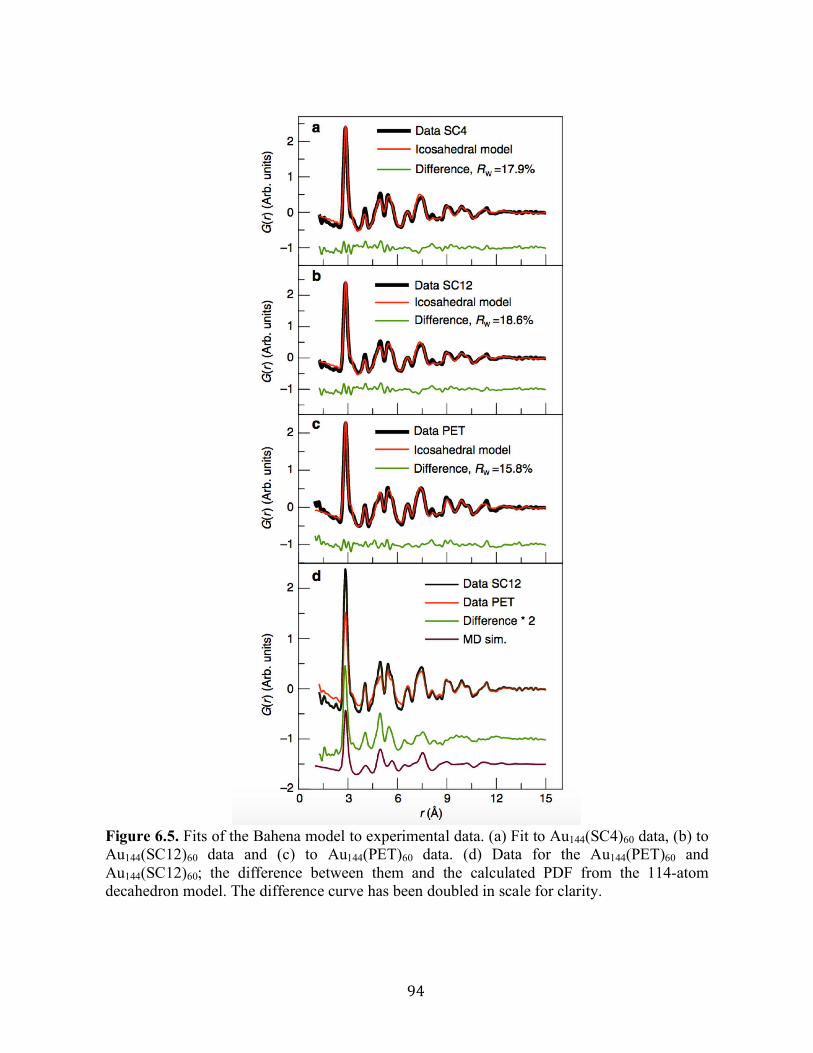
94
Figure 6.5. Fits of the Bahena model to experimental data. (a) Fit to Au144(SC4)60 data, (b) to Au144(SC12)60 data and (c) to Au144(PET)60 data. (d) Data for the Au144(PET)60 and Au144(SC12)60; the difference between them and the calculated PDF from the 114-atom decahedron model. The difference curve has been doubled in scale for clarity.
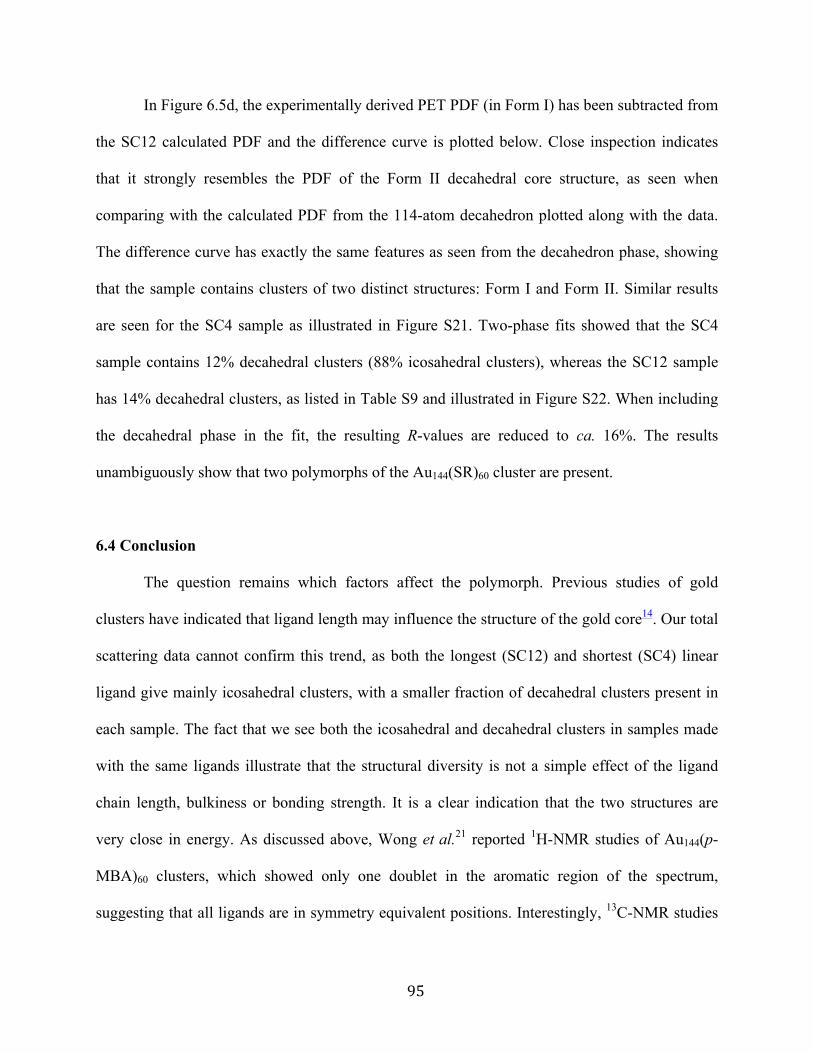
95
In Figure 6.5d, the experimentally derived PET PDF (in Form I) has been subtracted from
the SC12 calculated PDF and the difference curve is plotted below. Close inspection indicates
that it strongly resembles the PDF of the Form II decahedral core structure, as seen when
comparing with the calculated PDF from the 114-atom decahedron plotted along with the data.
The difference curve has exactly the same features as seen from the decahedron phase, showing
that the sample contains clusters of two distinct structures: Form I and Form II. Similar results
are seen for the SC4 sample as illustrated in Figure S21. Two-phase fits showed that the SC4
sample contains 12% decahedral clusters (88% icosahedral clusters), whereas the SC12 sample
has 14% decahedral clusters, as listed in Table S9 and illustrated in Figure S22. When including
the decahedral phase in the fit, the resulting R-values are reduced to ca. 16%. The results
unambiguously show that two polymorphs of the Au144(SR)60 cluster are present.
6.4 Conclusion
The question remains which factors affect the polymorph. Previous studies of gold
clusters have indicated that ligand length may influence the structure of the gold core14. Our total
scattering data cannot confirm this trend, as both the longest (SC12) and shortest (SC4) linear
ligand give mainly icosahedral clusters, with a smaller fraction of decahedral clusters present in
each sample. The fact that we see both the icosahedral and decahedral clusters in samples made
with the same ligands illustrate that the structural diversity is not a simple effect of the ligand
chain length, bulkiness or bonding strength. It is a clear indication that the two structures are
very close in energy. As discussed above, Wong et al.21 reported 1H-NMR studies of Au144(p-
MBA)60 clusters, which showed only one doublet in the aromatic region of the spectrum,
suggesting that all ligands are in symmetry equivalent positions. Interestingly, 13C-NMR studies
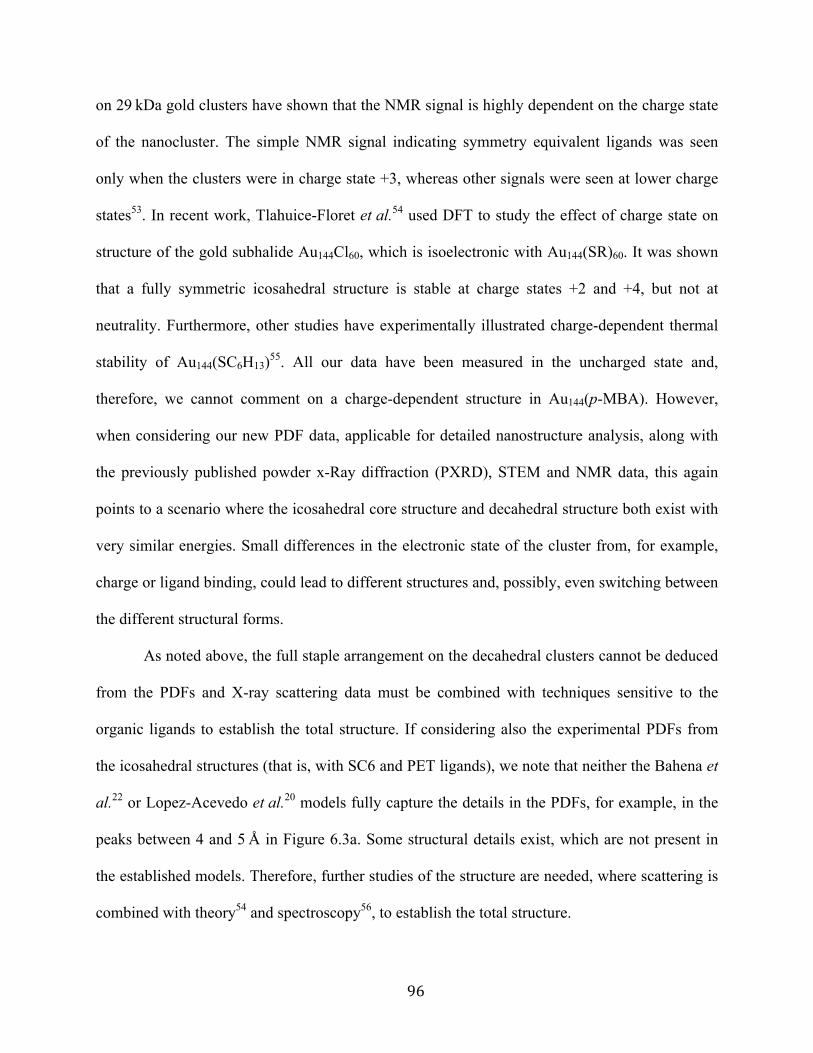
96
on 29 kDa gold clusters have shown that the NMR signal is highly dependent on the charge state
of the nanocluster. The simple NMR signal indicating symmetry equivalent ligands was seen
only when the clusters were in charge state +3, whereas other signals were seen at lower charge
states53. In recent work, Tlahuice-Floret et al.54 used DFT to study the effect of charge state on
structure of the gold subhalide Au144Cl60, which is isoelectronic with Au144(SR)60. It was shown
that a fully symmetric icosahedral structure is stable at charge states +2 and +4, but not at
neutrality. Furthermore, other studies have experimentally illustrated charge-dependent thermal
stability of Au144(SC6H13)55. All our data have been measured in the uncharged state and,
therefore, we cannot comment on a charge-dependent structure in Au144(p-MBA). However,
when considering our new PDF data, applicable for detailed nanostructure analysis, along with
the previously published powder x-Ray diffraction (PXRD), STEM and NMR data, this again
points to a scenario where the icosahedral core structure and decahedral structure both exist with
very similar energies. Small differences in the electronic state of the cluster from, for example,
charge or ligand binding, could lead to different structures and, possibly, even switching between
the different structural forms.
As noted above, the full staple arrangement on the decahedral clusters cannot be deduced
from the PDFs and X-ray scattering data must be combined with techniques sensitive to the
organic ligands to establish the total structure. If considering also the experimental PDFs from
the icosahedral structures (that is, with SC6 and PET ligands), we note that neither the Bahena et
al.22 or Lopez-Acevedo et al.
20 models fully capture the details in the PDFs, for example, in the
peaks between 4 and 5 Å in Figure 6.3a. Some structural details exist, which are not present in
the established models. Therefore, further studies of the structure are needed, where scattering is
combined with theory54 and spectroscopy56, to establish the total structure.
97
The polymorphism seen in our data suggests many new studies of gold nanoclusters. The
close energies between different cluster structures may not be limited to the Au144(SR)60 cluster
family, but exist in a larger size range and in different materials systems. The presence of
polymorphism challenges some of the characterization methods that are used for structure
solution. For example, when applying single-crystal XRD, the crystallization process works as a
structural sieve that will favour only one cluster polymorph over others that may be present in
suspension, resulting in an incomplete picture. As we show, PDF will see the average sample and
any structural heterogeneity will be observed in the data. Compared with electron beams used for
STEM studies, X-rays are much less perturbing of the system and any structural changes due to
beam irradiation are therefore less probable. Furthermore, PDF allows to distinguish between
seemingly similar clusters, that is, Au130(SR)50, Au133(SR)52 and the two forms of Au144(SR)60.
In summary, we have shown by means of total scattering PDF analysis on well-
characterized samples of Au144(SR)60 that the clusters can take two distinct structures: a
truncated decahedron structure (Form II) and the previously proposed icosahedral structure
(Form I). The two structures have been isolated in samples with p-MBA and SC6 ligands,
respectively, but in samples with SC4 and SC12, the two structures are seen to coexist, indicating
that the energy of the two structures are very close to each other. In recent times, several new
metal clusters have been isolated in the size range from 50 to 300 atoms57,58. The structures of
many of these clusters remain undetermined, owing to difficulties in crystallizing the clusters
into a large, single crystal suitable for structure determination. We believe that PDF will be an
excellent tool for these studies and, when combined with spectroscopic methods, will be able to
provide full structure solutions to many new nanomaterials.
98
6.5 Methods
Total scattering data were acquired during three different beamtimes at three different
facilities. For all samples, the cluster powders were loaded in Kapton tubes with inner diameter
of 1 mm. Data for both samples of the Au144(p-MBA)60 cluster was obtained at ID11 at the
European Synchrotron Radiation Facility with an X-ray wavelength of 0.1774 Å at 100 K. For
the Au144(PET)60, Au144(SC6)60, Au144(SC4)60 and Au144(SC12)60 clusters, data were measured at
beamline 11-ID-B at the Advanced Photon Source, at Argonne National Laboratory. Here, data
were measured at 100 and 300 K with X-ray wavelength 0.143 Å. Additional data sets for the
Au144(PET)60 were furthermore measured at the X7B beamline at room temperature with X-ray
wavelength of 0.319 Å, as well as at the X17A beamline, X-ray wavelength 0.186 Å at 100 and
300 K, both at the National synchrotron light source facility at Brookhaven National Laboratory.
The experimental powder diffraction patterns were integrated using the programme
Fit2D60 and Fourier transformed to obtain the PDF using the programme PDFgetX3
61. Modeling
was done using DiffPy-CMI.
99
References
(1) Brust, M.; Fink, J.; Bethell, D.; Schiffrin, D. J.; Kiely, C. J. Chem. Soc., Chem. Commun.
1995, 1655-1656.
(2) Brust, M.; Walker, M.; Bethell, D.; Schiffrin, D. J.; Whyman, R. J. Chem. Soc., Chem.
Commun. 1994, 801-802.
(3) Maier, S. A.; Brongersma, M. L.; Kik, P. G.; Meltzer, S.; Requicha, A. A. G.; Atwater,
H. A. Adv. Mater. 2001, 13, 1501-1505.
(4) Jadzinsky, P. D.; Calero, G.; Ackerson, C. J.; Bushnell, D. A.; Kornberg, R. D. Science
2007, 318, 430-433.
(5) Walter, M.; Akola, J.; Lopez-Acevedo, O.; Jadzinsky, P. D.; Calero, G.; Ackerson, C. J.;
Whetten, R. L.; Gronbeck, H.; Hakkinen, H. Proc. Natl. Acad. Sci. U.S.A. 2008, 105, 9157-9162.
(6) Zhu, M.; Aikens, C. M.; Hollander, F. J.; Schatz, G. C.; Jin, R. J. Am. Chem. Soc. 2008,
130, 5883-5889.
(7) Weissker, H. C.; Escobar, H. B.; Thanthirige, V. D.; Kwak, K.; Lee, D.; Ramakrishna,
G.; Whetten, R. L.; Lopez-Lozano, X. Nat. Commun. 2014, 5, 3785.
(8) Philip, R.; Chantharasupawong, P.; Qian, H. F.; Jin, R. C.; Thomas, J. Nano Lett. 2012,
12, 4661-4667.
(9) Negishi, Y.; Nakazaki, T.; Malola, S.; Takano, S.; Niihori, Y.; Kurashige, W.; Yamazoe,
S.; Tsukuda, T.; Häkkinen, H. J. Am. Chem. Soc. 2014, 137, 1206–1212
(10) Mandal, S.; Bakeine, G. J.; Krol, S.; Ferrari, C.; Clerici, A. M.; Zonta, C.; Cansolino, L.;
Ballarini, F.; Bortolussi, S.; Stella, S.; Protti, N.; Bruschi, P.; Altieri, S. Appl. Radiat. Isot. 2011,
69, 1692-1697.
100
(11) Daniel, M. C.; Astruc, D. Chem. Rev. 2004, 104, 293-346.
(12) Pasquato, L.; Pengo, P.; Scrimin, P. J. Mater. Chem. 2004, 14, 3481-3487.
(13) Jin, R. C. Nanoscale 2010, 2, 343-362.
(14) Qian, H. F.; Zhu, M. Z.; Wu, Z. K.; Jin, R. C. Acc. Chem. Res. 2012, 45, 1470-1479.
(15) Billinge, S. J. L.; Levin, I. Science 2007, 316, 1698-1698.
(16) Whetten, R. L.; Khoury, J. T.; Alvarez, M. M.; Murthy, S.; Vezmar, I.; Wang, Z. L.;
Stephens, P. W.; Cleveland, C. L.; Luedtke, W. D.; Landman, U. Adv. Mater. 1996, 8, 428-433.
(17) Schaaff, T. G.; Shafigullin, M. N.; Khoury, J. T.; Vezmar, I.; Whetten, R. L. J. Phys.
Chem. B 2001, 105, 8785-8796.
(18) Alvarez, M. M.; Khoury, J. T.; Schaaff, T. G.; Shafigullin, M.; Vezmar, I.; Whetten, R.
L. Chem. Phys. Lett. 1997, 266, 91-98.
(19) Chaki, N. K.; Negishi, Y.; Tsunoyama, H.; Shichibu, Y.; Tsukuda, T. J. Am. Chem. Soc.
2008, 130, 8608-8612.
(20) Qian, H. F.; Jin, R. C. Nano Lett. 2009, 9, 4083-4087.
(21) Lopez-Acevedo, O.; Akola, J.; Whetten, R. L.; Gronbeck, H.; Hakkinen, H. J. Phys.
Chem. C 2009, 113, 5035-5038.
(22) Wong, O. A.; Heinecke, C. L.; Simone, A. R.; Whetten, R. L.; Ackerson, C. J. Nanoscale
2012, 4, 4099-4102.
(23) Bahena, D.; Bhattarai, N.; Santiago, U.; Tlahuice, A.; Ponce, A.; Bach, S. B. H.; Yoon,
B.; Whetten, R. L.; Landman, U.; Jose-Yacaman, M. J. Phys. Chem. Lett. 2013, 4, 975-981.
(24) Hakkinen, H. Nat. Chem. 2012, 4, 443-455.
(25) Billinge, S. J. L.; Kanatzidis, M. G. Chem. Commun. 2004, 7, 749-760.
(26) Billinge, S. J. L. J. Solid State Chem. 2008, 181, 1695-1700.
101
(27) Young, C. A.; Goodwin, A. L. J. Mater. Chem. 2011, 21, 6464-6476.
(28) Yang, X. H.; Masadeh, A. S.; McBride, J. R.; Bozin, E. S.; Rosenthal, S. J.; Billinge, S. J.
L. Phys. Chem. Chem. Phys. 2013, 15, 8480-8486.
(29) Neder, R. B.; Korsunskiy, V. I. J. Phys.: Condens. Matter 2005, 17, S125-S134.
(30) Newton, M. A.; Chapman, K. W.; Thompsett, D.; Chupas, P. J. J. Am. Chem. Soc. 2012,
134, 5036-5039.
(31) Page, K.; Hood, T. C.; Proffen, T.; Neder, R. B. J. Appl. Crystallogr. 2011, 44, 327-336.
(32) Juhas, P.; Cherba, D. M.; Duxbury, P. M.; Punch, W. F.; Billinge, S. J. L. Nature 2006,
440, 655-658.
(33) Cliffe, M. J.; Dove, M. T.; Drabold, D. A.; Goodwin, A. L. Phys. Rev. Lett. 2010, 104.
(34) Billinge, S. J. L.; Dykhne, T.; Juhas, P.; Bozin, E.; Taylor, R.; Florence, A. J.; Shankland,
K. Crystengcomm 2010, 12, 1366-1368.
(35) Ackerson, C. J.; Jadzinsky, P. D.; Sexton, J. Z.; Bushnell, D. A.; Kornberg, R. D.
Bioconjugate Chem. 2010, 21, 214-218.
(36) Koivisto, J.; Salorinne, K.; Mustalahti, S.; Lahtinen, T.; Malola, S.; Hakkinen, H.;
Pettersson, M. J. Phys. Chem. Lett. 2014, 5, 387-392.
(37) Jeong, I. K.; Proffen, T.; Mohiuddin-Jacobs, F.; Billinge, S. J. L. J. Phys. Chem. A 1999,
103, 921-924.
(38) Marks, L. D. Philosophical Magazine a-Physics of Condensed Matter Structure Defects
and Mechanical Properties 1984, 49, 81-93.
(39) Marks, L. D. Rep. Prog. Phys. 1994, 57, 603-649.
(40) Jiang, D. E.; Tiago, M. L.; Luo, W. D.; Dai, S. J. Am. Chem. Soc. 2008, 130, 2777-2784.
102
(41) Heaven, M. W.; Dass, A.; White, P. S.; Holt, K. M.; Murray, R. W. J. Am. Chem. Soc.
2008, 130, 3754-3762.
(42) Qian, H. F.; Eckenhoff, W. T.; Zhu, Y.; Pintauer, T.; Jin, R. C. J. Am. Chem. Soc. 2010,
132, 8280-8284.
(43) Dass, A.; Theivendran, S.; Nimmala, P. R.; Kumara, C.; Jupally, V. R.; Fortunelli, A.;
Sementa, L.; Barcaro, G.; Zuo, X. B.; Noll, B. C. J. Am. Chem. Soc. 2015, 137, 4610-4613.
(44) Das, A.; Liu, C.; Byun, H. Y.; Nobusada, K.; Zhao, S.; Rosi, N.; Jin, R. C. Angew. Chem.
Int. Ed. 2015, 54, 3140-3144.
(45) Das, A.; Liu, C.; Zeng, C. J.; Li, G.; Li, T.; Rosi, N. L.; Jin, R. C. J. Phys. Chem. A 2014,
118, 8264-8269.
(46) Azubel, M.; Koivisto, J.; Malola, S.; Bushnell, D.; Hura, G. L.; Koh, A. L.; Tsunoyama,
H.; Tsukuda, T.; Pettersson, M.; Hakkinen, H.; Kornberg, R. D. Science 2014, 345, 909-912.
(47) Cleveland, C. L.; Landman, U.; Schaaff, T. G.; Shafigullin, M. N.; Stephens, P. W.;
Whetten, R. L. Phys. Rev. Lett. 1997, 79, 1873-1876.
(48) Song, Y.; Harper, A. S.; Murray, R. W. Langmuir 2005, 21, 5492-5500.
(49) Wang, Z. W.; Palmer, R. E. Phys. Rev. Lett. 2012, 108, 245502.
(50) Wells, D. M.; Rossi, G.; Ferrando, R.; Palmer, R. E. Nanoscale 2015, 7, 6498-6503.
(51) Li, G.; Zeng, C. J.; Jin, R. C. J. Am. Chem. Soc. 2014, 136, 3673-3679.
(52) Nimmala, P. R.; Yoon, B.; Whetten, R. L.; Landman, U.; Dass, A. J. Phys. Chem. A
2013, 117, 504-517.
(53) Qian, H. F.; Jin, R. C. Chem. Mater. 2011, 23, 2209-2217.
(54) Hammersley, A. P.; Svensson, S. O.; Hanfland, M.; Fitch, A. N.; Hausermann, D. High
Pressure Res. 1996, 14, 235-248.

103
(55) Juhas, P.; Davis, T.; Farrow, C. L.; Billinge, S. J. L. J. Appl. Crystallogr. 2013, 46, 560-
566.
104
Chapter 7
Summary
Gold thiolate MPCs are very stable and can be isolated in a wide range of sizes making
them an instrumental tool for studying metal clusters from molecular to bulk material. For very
small gold MPCs the properties can be well described through molecular orbital theory, while for
much larger clusters can be understood by band theory. However medium sized gold clusters
(13< x<144) cannot be easily explained through either molecular or bulk models.
In order to understand the properties of medium sized gold MPCs superatom theory has
been applied. For a gold cluster in this size range the valence electrons of each metal atom are
donated to the superatomic orbitals, and this gives rise to the properties of the cluster. Oxidation
or reduction of a metal cluster will cause large shifts in the physiochemical properties that can be
understood through changes to the superatomic valence. In addition it is shown that gold thiolate
clusters can by produced with single metal atom substitution. It is shown that the properties of
the bi-metallic clusters mimic the properties of monometallic clusters when identical
superatomic valences are achieved. This indicates that the properties described by the superatom
model are largely dependent on the superatomic orbitals, with smaller variations arising due to
the nature of the metal or the protecting ligand shell.
Furthermore superatom theory works well to understand the transition from molecular to
bulk metal clusters. For small metal clusters the properties are heavily dependent on the
superatomic valence, thus removal or addition of an electron has a large effect on the
physiochemical properties. This is due to the large energy spacing between superatomic orbitals,
which gives rise to more molecular-like behavior. For larger metal clusters the effects of the
105
superatomic valence are less apparent, because there exist much smaller spacing between energy
levels of the superatomic orbitals. The closely spaced energy levels allow for the emergence of
bulk behaviors, such as a plasmon resonance. However since these clusters are quantized and the
properties significantly deviate away from typical bulk behavior and in order to rationalize all of
the observed properties superatom theory must be applied.
The research performed herein shows that superatom theory can be used to describe the
properties of gold thiolate MPCs and that the superatom model likely could be applied to other
ligated metal clusters that lie between molecular and bulk material.
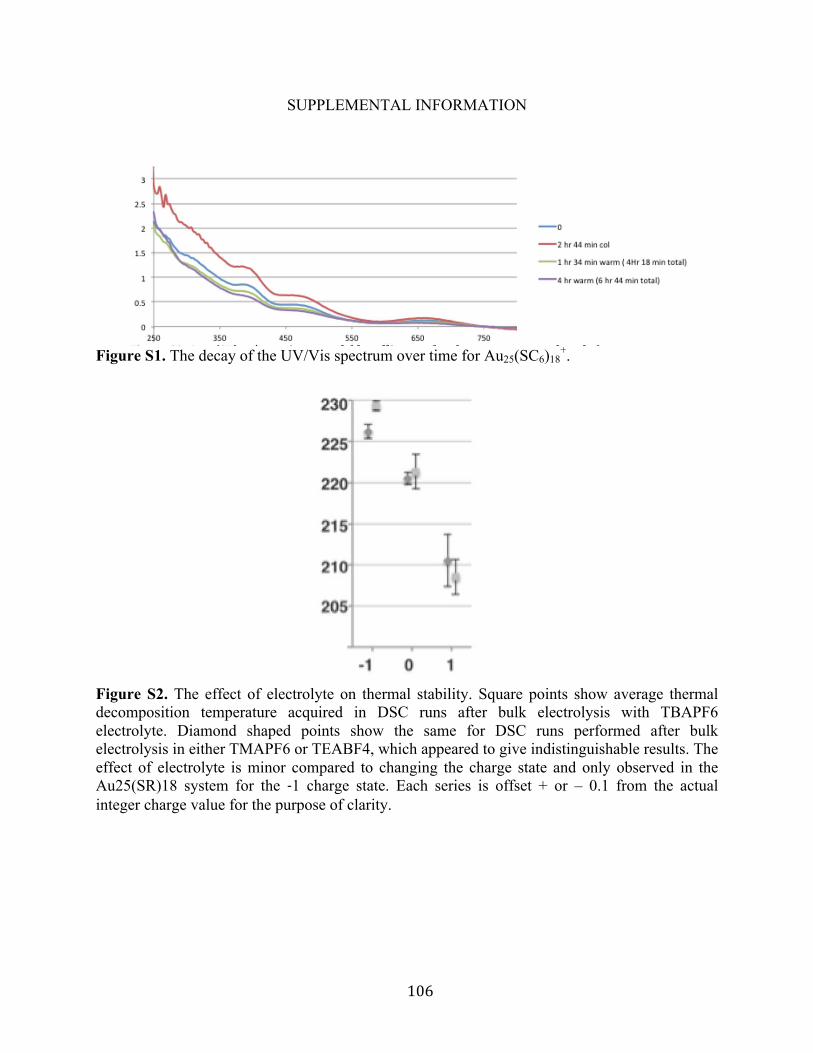
106
SUPPLEMENTAL INFORMATION
Figure S1. The decay of the UV/Vis spectrum over time for Au25(SC6)18
+.
Figure S2. The effect of electrolyte on thermal stability. Square points show average thermal decomposition temperature acquired in DSC runs after bulk electrolysis with TBAPF6 electrolyte. Diamond shaped points show the same for DSC runs performed after bulk electrolysis in either TMAPF6 or TEABF4, which appeared to give indistinguishable results. The effect of electrolyte is minor compared to changing the charge state and only observed in the Au25(SR)18 system for the ‐1 charge state. Each series is offset + or – 0.1 from the actual integer charge value for the purpose of clarity.
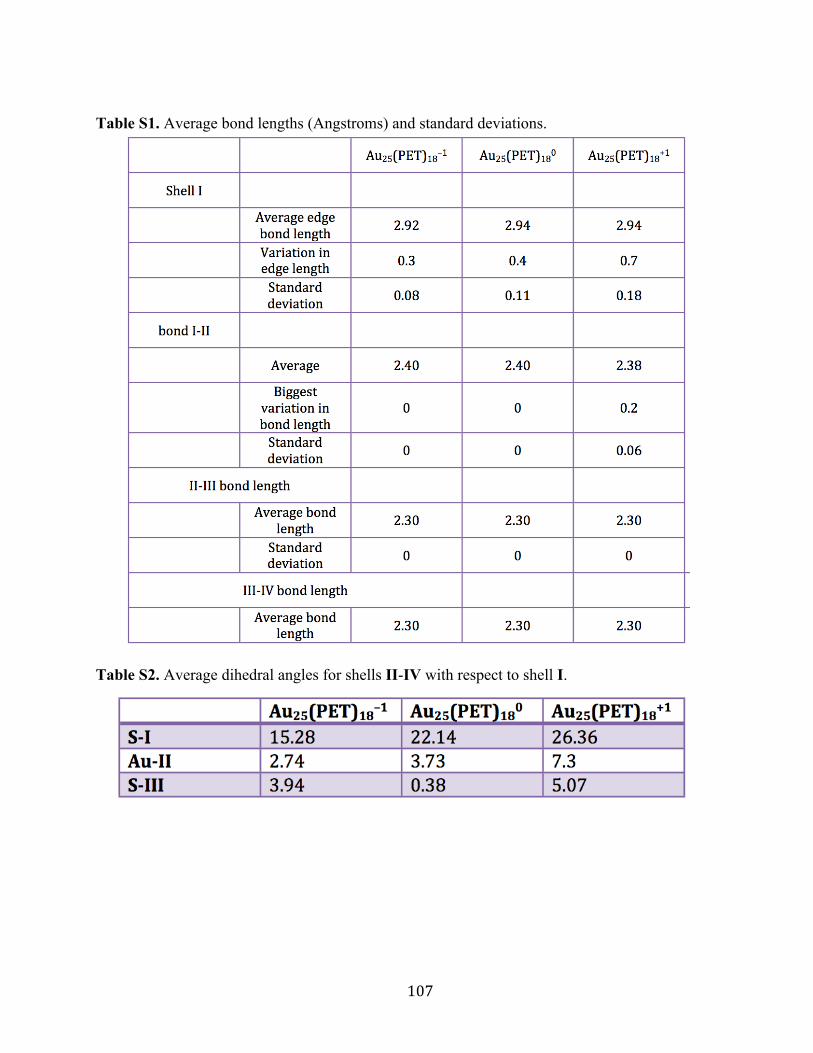
107
Table S1. Average bond lengths (Angstroms) and standard deviations.
Table S2. Average dihedral angles for shells II-IV with respect to shell I.
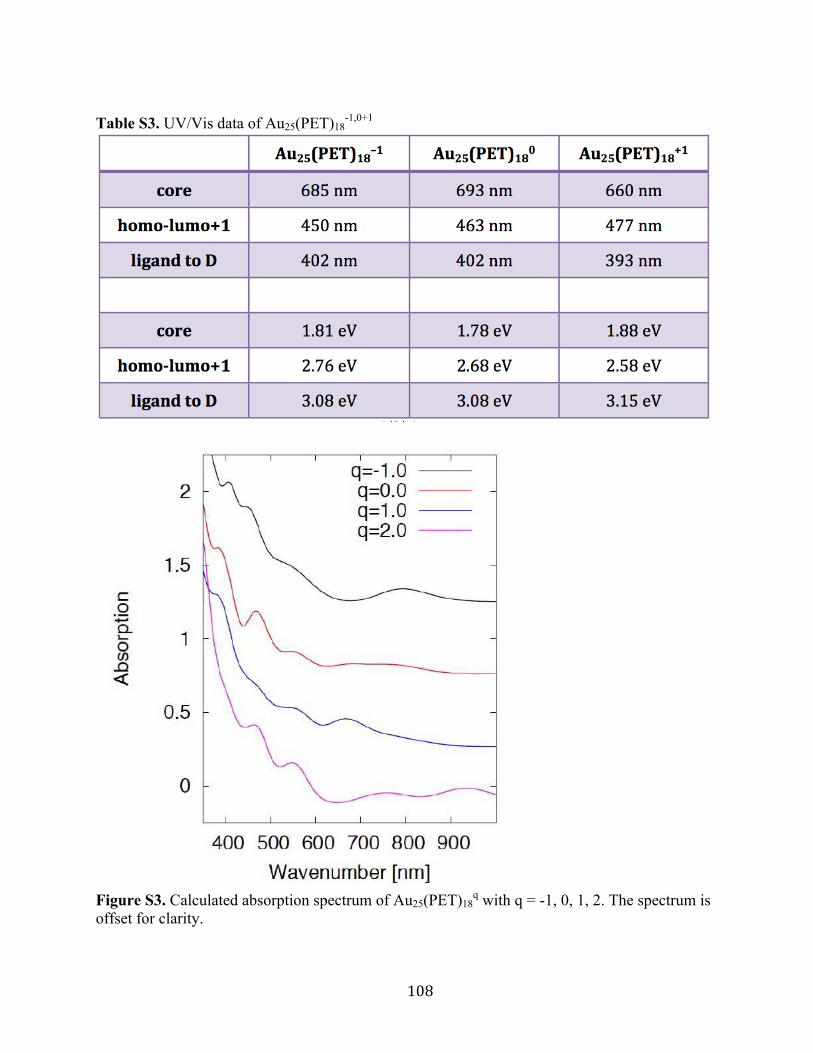
108
Table S3. UV/Vis data of Au25(PET)18-1,0+1
Figure S3. Calculated absorption spectrum of Au25(PET)18
q with q = -1, 0, 1, 2. The spectrum is offset for clarity.
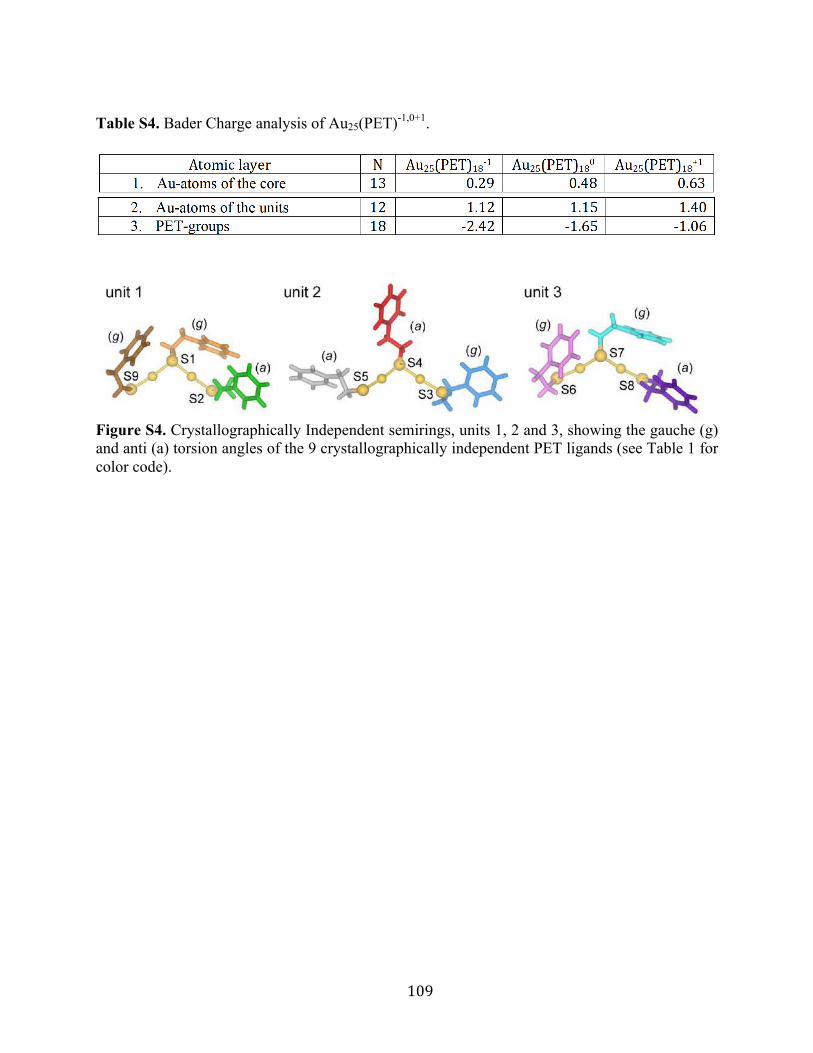
109
Table S4. Bader Charge analysis of Au25(PET)-1,0+1.
Figure S4. Crystallographically Independent semirings, units 1, 2 and 3, showing the gauche (g) and anti (a) torsion angles of the 9 crystallographically independent PET ligands (see Table 1 for color code).
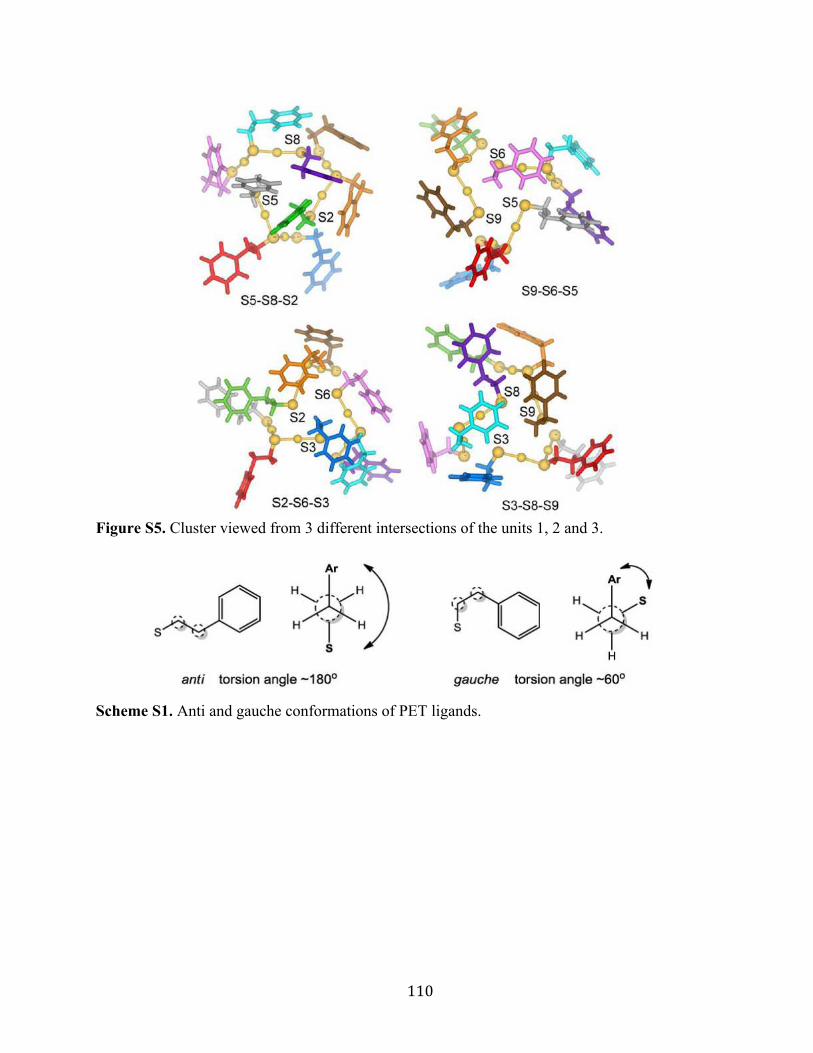
110
Figure S5. Cluster viewed from 3 different intersections of the units 1, 2 and 3.
Scheme S1. Anti and gauche conformations of PET ligands.
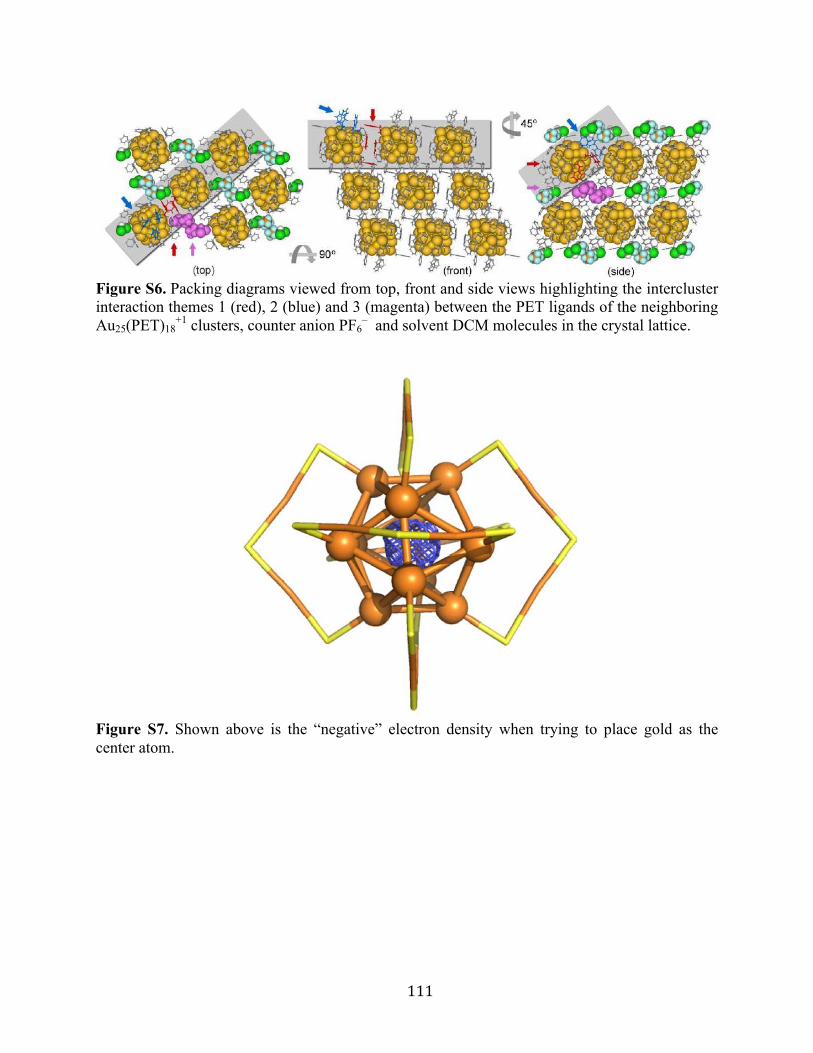
111
Figure S6. Packing diagrams viewed from top, front and side views highlighting the intercluster interaction themes 1 (red), 2 (blue) and 3 (magenta) between the PET ligands of the neighboring Au25(PET)18
+1 clusters, counter anion PF6– and solvent DCM molecules in the crystal lattice.
Figure S7. Shown above is the “negative” electron density when trying to place gold as the center atom.
112
Figure S8. The UV/Vis absorption spectrum of PdAu24.
Figure S9. (a)Time-dependent stimulated emission energy obtained using three different laser pulse energies, black: 800 nJ, red: 600nJ, blue: 400nJ. (b) Time-dependent stimulated emission bandwidth under 400 nJ excitation laser pulse.
113
Figure S10. ESI-MS Spectra for Au144 products. Peak assignments are given in Supplementary Table 5.
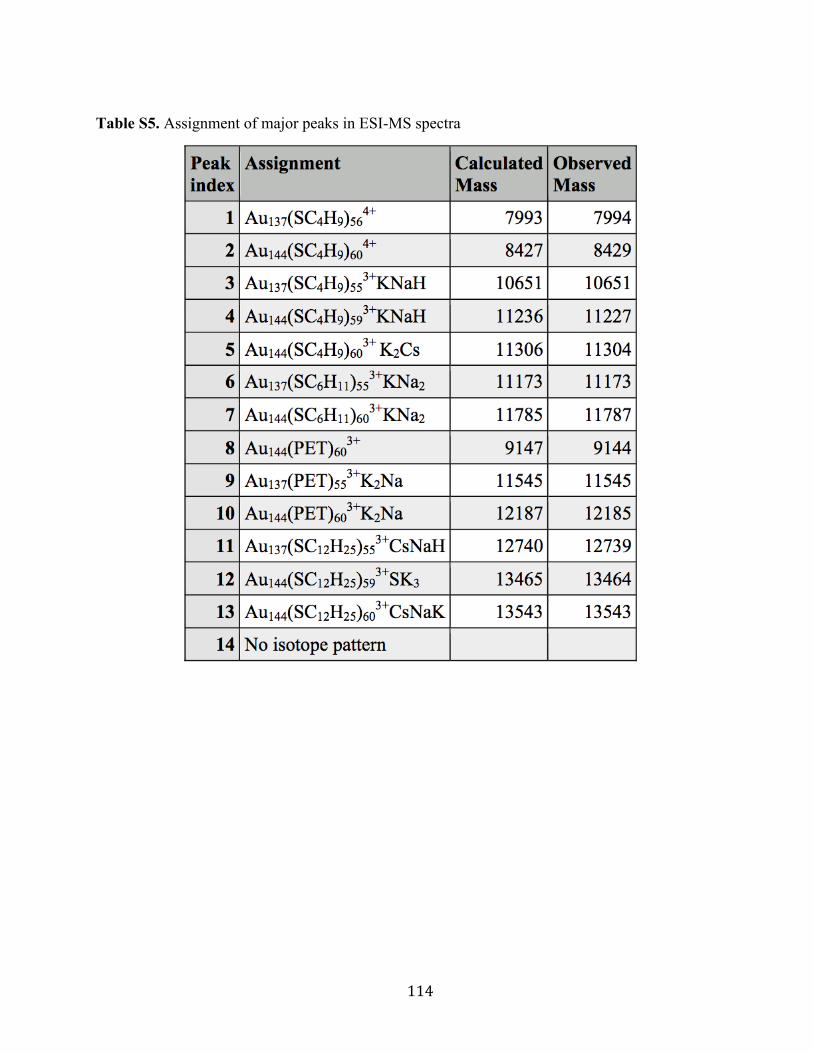
114
Table S5. Assignment of major peaks in ESI-MS spectra
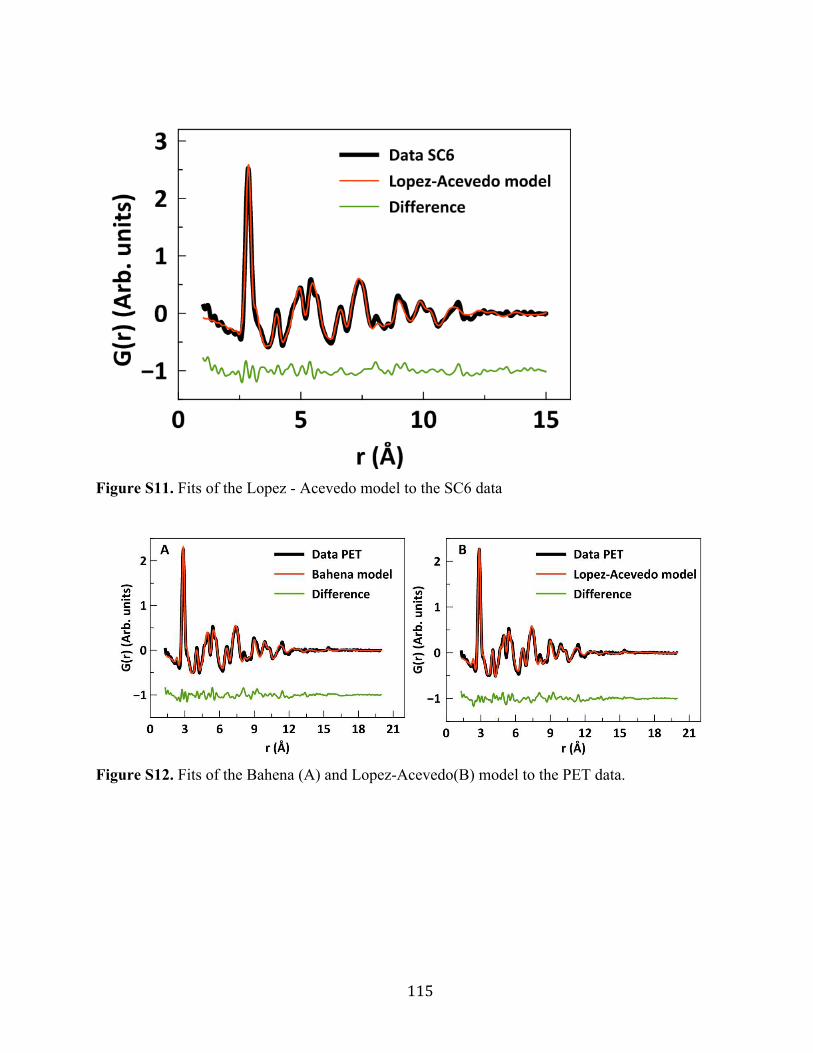
115
Figure S11. Fits of the Lopez - Acevedo model to the SC6 data
Figure S12. Fits of the Bahena (A) and Lopez-Acevedo(B) model to the PET data.
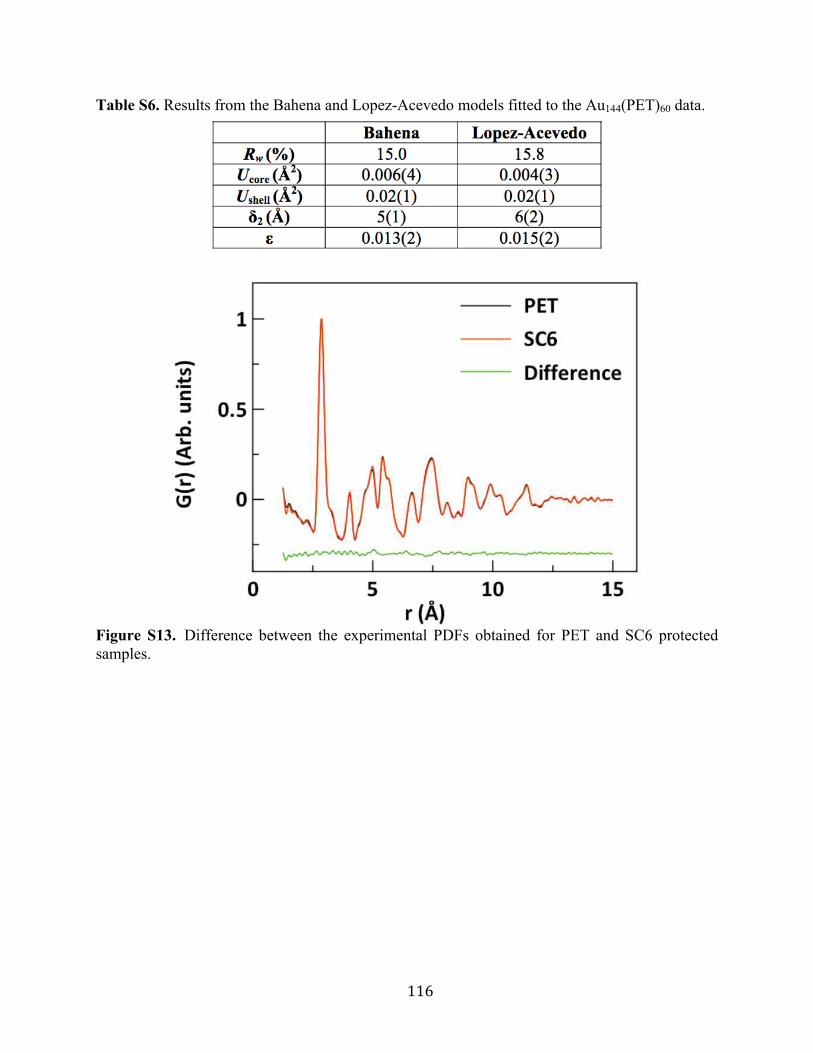
116
Table S6. Results from the Bahena and Lopez-Acevedo models fitted to the Au144(PET)60 data.
Figure S13. Difference between the experimental PDFs obtained for PET and SC6 protected samples.
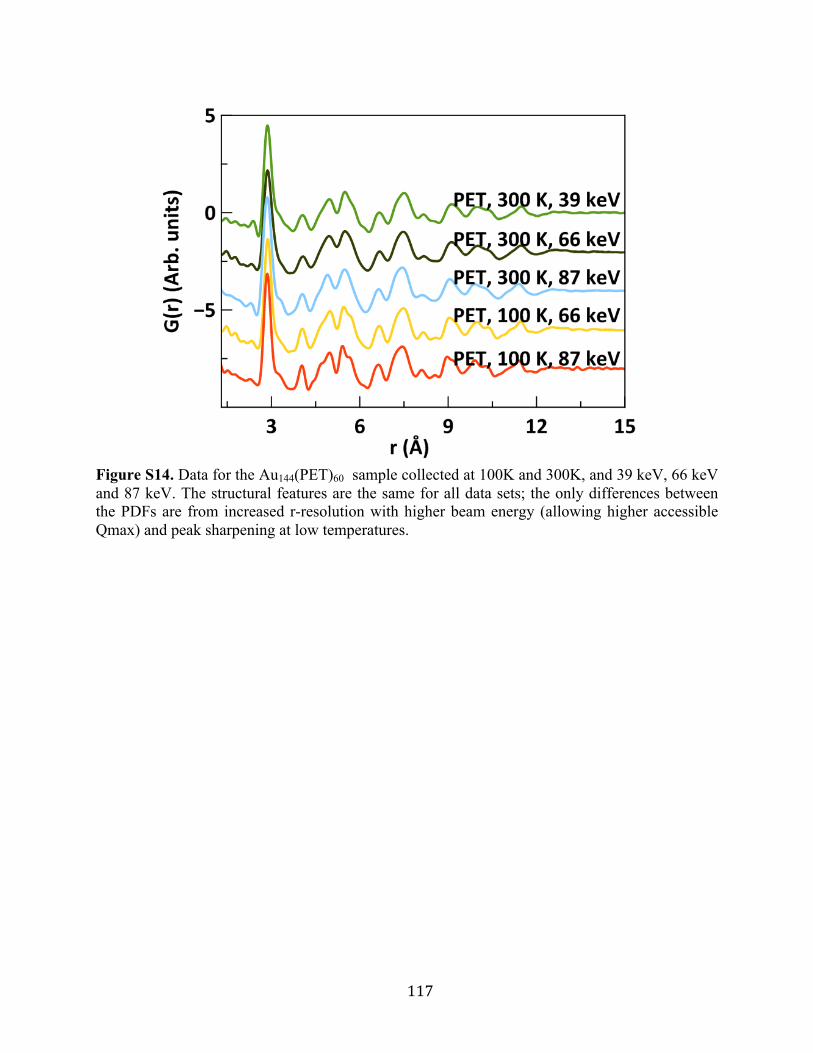
117
Figure S14. Data for the Au144(PET)60 sample collected at 100K and 300K, and 39 keV, 66 keV and 87 keV. The structural features are the same for all data sets; the only differences between the PDFs are from increased r-resolution with higher beam energy (allowing higher accessible Qmax) and peak sharpening at low temperatures.
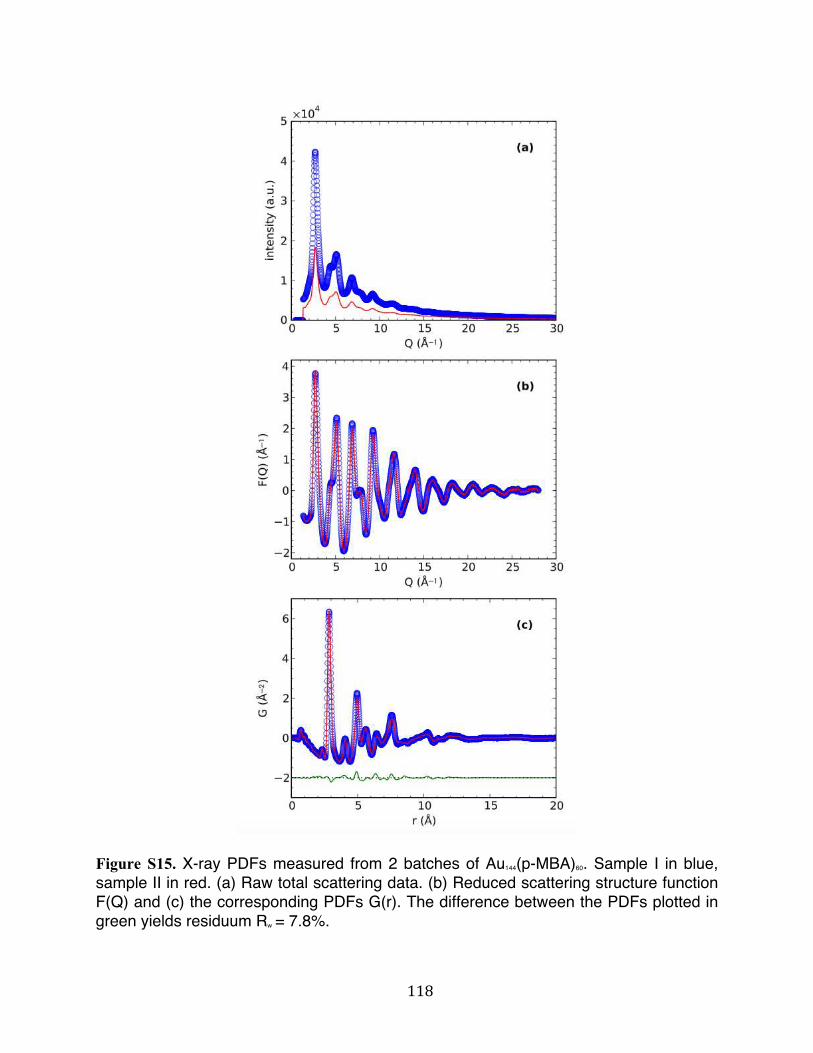
118
Figure S15. X-ray PDFs measured from 2 batches of Au144(p-MBA)60. Sample I in blue,
sample II in red. (a) Raw total scattering data. (b) Reduced scattering structure function
F(Q) and (c) the corresponding PDFs G(r). The difference between the PDFs plotted in
green yields residuum Rw = 7.8%.
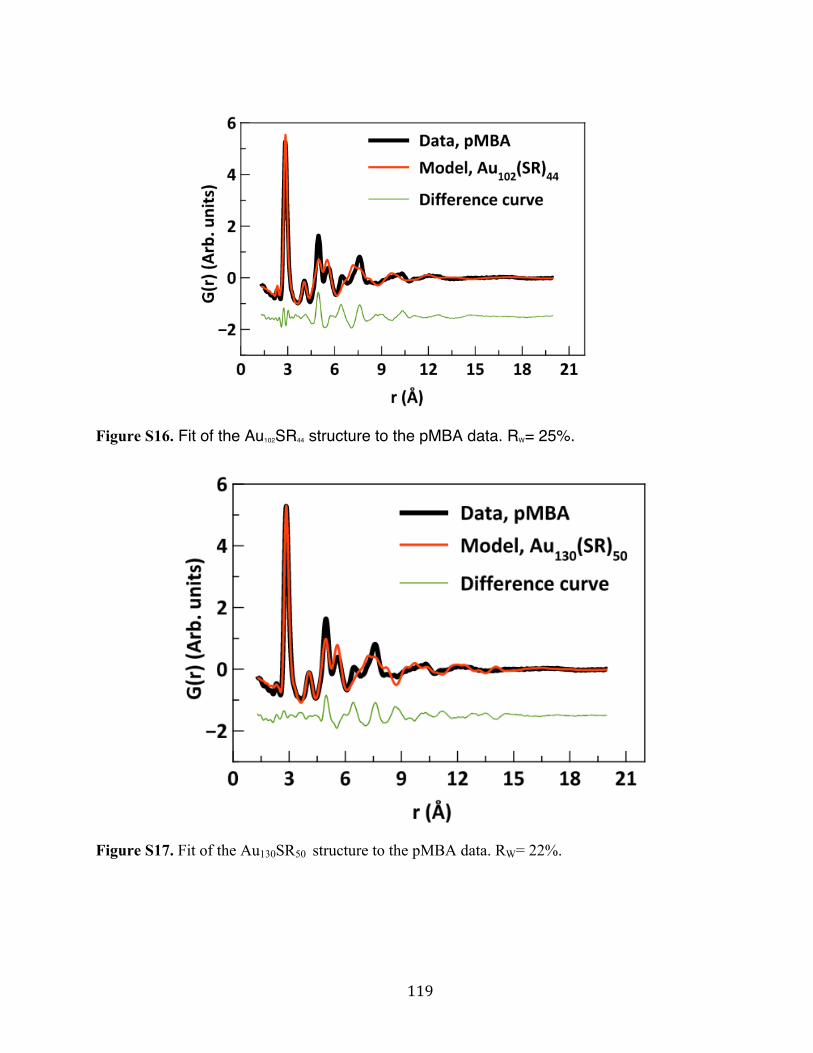
119
Figure S16. Fit of the Au102SR44 structure to the pMBA data. RW= 25%.
Figure S17. Fit of the Au130SR50 structure to the pMBA data. RW= 22%.
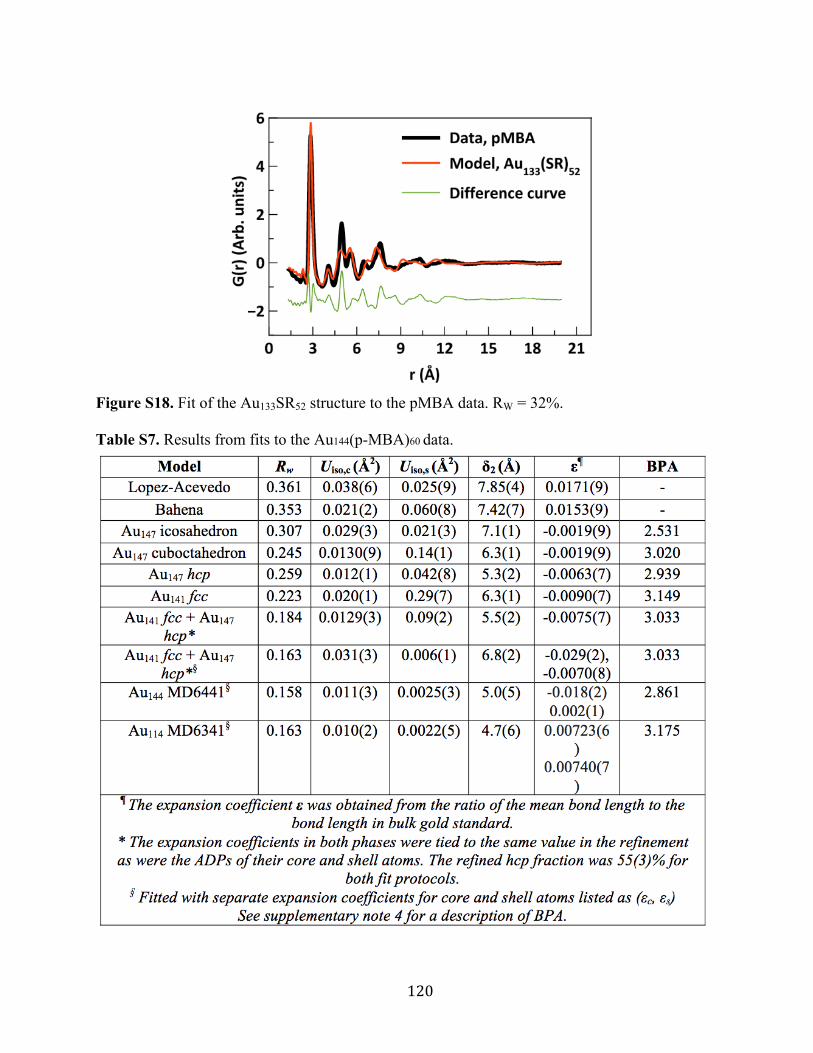
120
Figure S18. Fit of the Au133SR52 structure to the pMBA data. RW = 32%.
Table S7. Results from fits to the Au144(p-MBA)60 data.
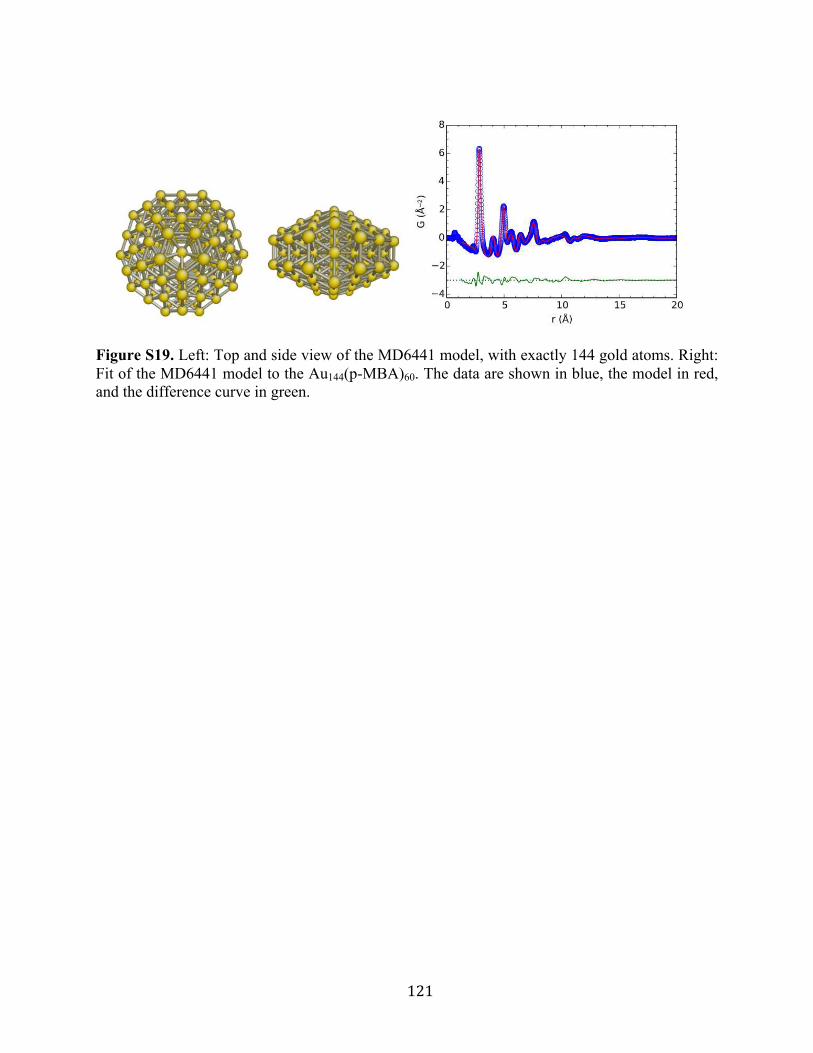
121
Figure S19. Left: Top and side view of the MD6441 model, with exactly 144 gold atoms. Right: Fit of the MD6441 model to the Au144(p-MBA)60. The data are shown in blue, the model in red, and the difference curve in green.
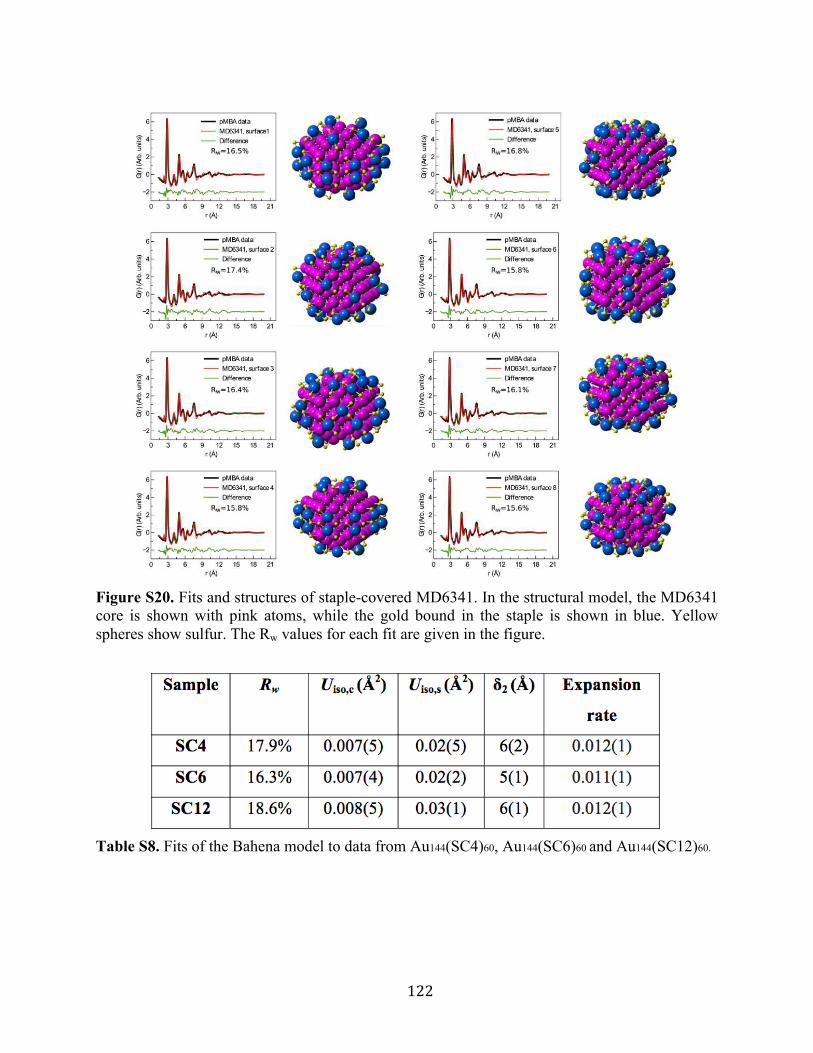
122
Figure S20. Fits and structures of staple-covered MD6341. In the structural model, the MD6341 core is shown with pink atoms, while the gold bound in the staple is shown in blue. Yellow spheres show sulfur. The Rw values for each fit are given in the figure.
Table S8. Fits of the Bahena model to data from Au144(SC4)60, Au144(SC6)60 and Au144(SC12)60.
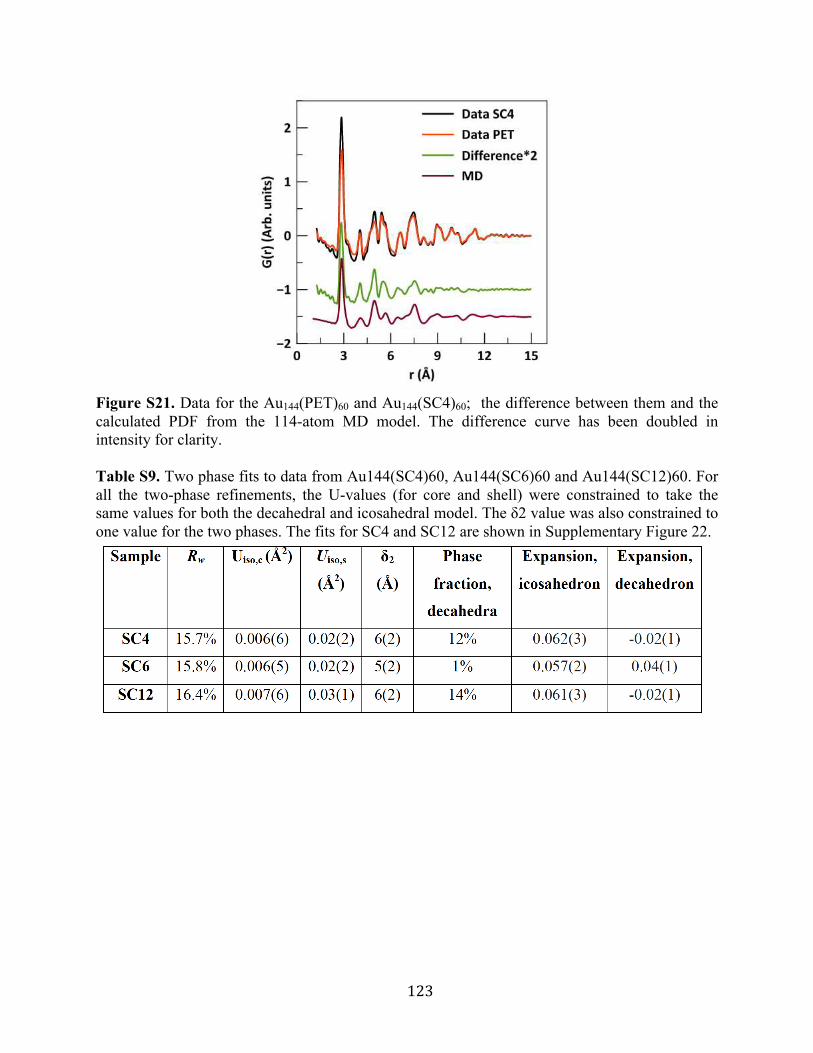
123
Figure S21. Data for the Au144(PET)60 and Au144(SC4)60; the difference between them and the calculated PDF from the 114-atom MD model. The difference curve has been doubled in intensity for clarity. Table S9. Two phase fits to data from Au144(SC4)60, Au144(SC6)60 and Au144(SC12)60. For all the two-phase refinements, the U-values (for core and shell) were constrained to take the same values for both the decahedral and icosahedral model. The δ2 value was also constrained to one value for the two phases. The fits for SC4 and SC12 are shown in Supplementary Figure 22.
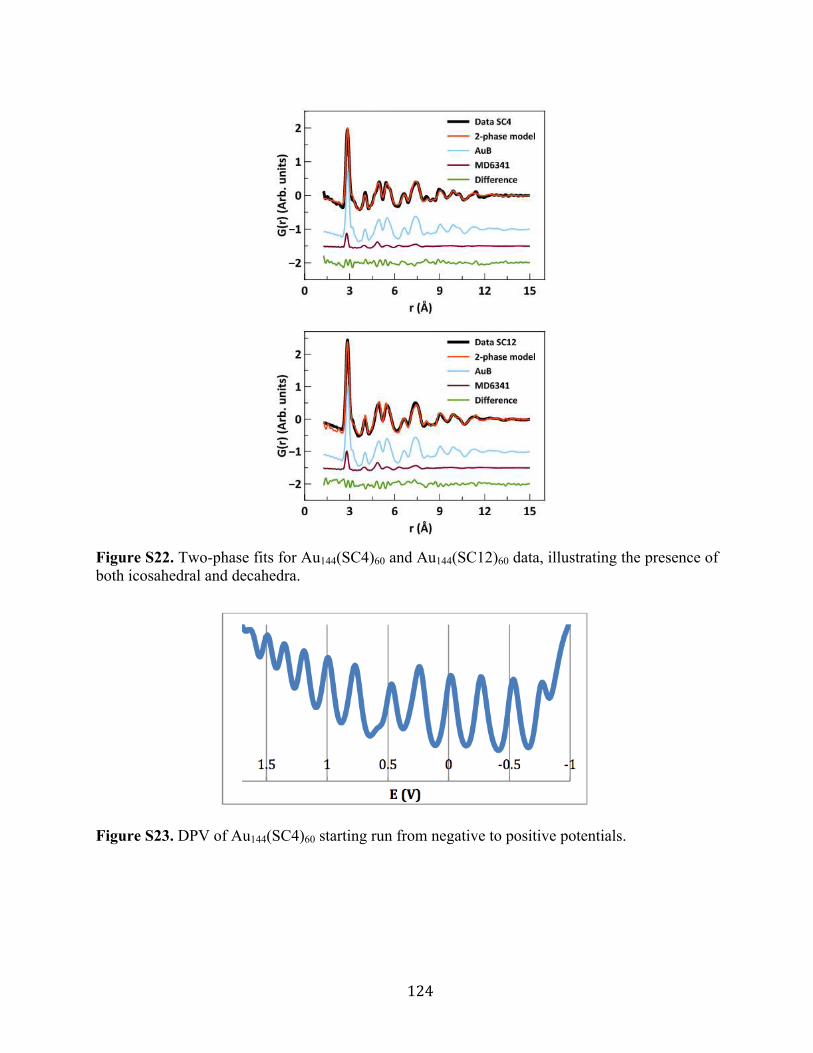
124
Figure S22. Two-phase fits for Au144(SC4)60 and Au144(SC12)60 data, illustrating the presence of both icosahedral and decahedra.
Figure S23. DPV of Au144(SC4)60 starting run from negative to positive potentials.
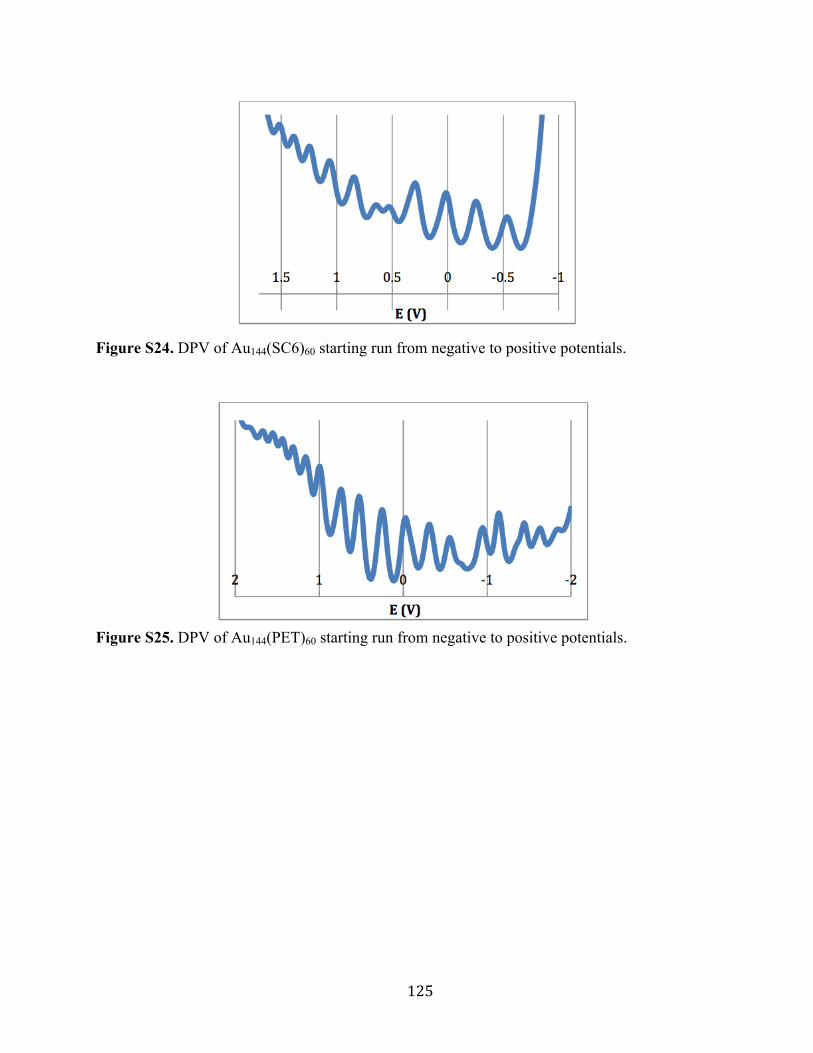
125
Figure S24. DPV of Au144(SC6)60 starting run from negative to positive potentials.
Figure S25. DPV of Au144(PET)60 starting run from negative to positive potentials.
Related Documents

![Free Space QED with a Single Rydberg Superatom [1]...Free Space QED and Emergent Universal Dynamics with a Single Rydberg Superatom Jan Kumlin1, Sebastian Ho˜erberth2, and Hans Peter](https://static.cupdf.com/doc/110x72/609276a4cc59352aa21a55be/free-space-qed-with-a-single-rydberg-superatom-1-free-space-qed-and-emergent.jpg)