United States Department of Agriculture Forest Service Forest Products Laboratory General Technical Report FPL-GTR-77 Dissolving Pulp Industry Market Trends Irene Durbak

Welcome message from author
This document is posted to help you gain knowledge. Please leave a comment to let me know what you think about it! Share it to your friends and learn new things together.
Transcript
United StatesDepartment ofAgriculture
ForestService
ForestProductsLaboratory
GeneralTechnicalReportFPL-GTR-77
Dissolving PulpIndustryMarket Trends
Irene Durbak

Abstract Acknowledgments
This report presents a worldwide overview of the dissolv-ing pulp industry and highlights of this industry in Alaska.It describes trends in world markets and major end-usemarkets, with special emphasis on the manufacture and useof textile fibers in the United States. Figures and tablespresent data on production, consumption, and trade ofdissolving pulp and the cellulosic fibers-rayon andacetate-produced from it. Data are also given on theproduction and use of competing natural and syntheticfibers, such as cotton, silk, nylon, and polyester.
Keywords: Dissolving pulp, market trends, Alaskan woodpulp, pulp exports, rayon, acetate, textile fibers
Durbak, Irene, 1993. Dissolving pulp industry: Market trends. Gen. Tech.Rep. FPL-GTR-77. Madison, WI: U.S. Department of Agriculture,Forest Service, Forest Products Laboratory. 20 p.
A limited number of free copies of this publication are available to thepublic from the Forest Products Laboratory, One Gifford Pinchot Drive,Madison, WI 53705-2398. Laboratory publications are sent to more than1,000 libraries in the United States and elsewhere.
The Forest Products Laboratory is maintained in cooperation with theUniversity of Wisconsin.
The policy of the United States Department of Agriculture Forest Serviceprohibits discrimination on the basis of race, color, national origin, age,religion, sex, or disability, familial status, or political affiliation. Personsbelieving they have been discriminated against in any Forest Servicerelated activity should write to Chief, Forest Service, USDA, P.O. Box96090, Washington, DC 20090-6090.
This report was prepared with assistance from the follow-ing Forest Service personnel: Research ForesterDavid Brooks, Corvallis, Oregon; Regional EconomistMichael Martin, Juneau, Alaska; and Computer AssistantLloyd Davidson, Madison, Wisconsin. Editorial assistancewas provided by Forest Service editors Karen Esterholdt,Portland, Oregon, and Jim Anderson and Jean Livingston,Madison, Wisconsin. Special thanks are extended to millrepresentatives at the Alaska Pulp Corporation in Sitka,Alaska, and the Ketchikan Pulp Company in Ketchikan,Alaska, for their assistance and information providedduring a visit of the mills in 1989.
This report is based on a study conducted by the author in1989. The study was supported by the USDA ForestService, Alaska Region 10, as part of the Alaska TimberMarket Studies. In preparation for publication of thisreport, efforts were made to update information in thetables and figures collected in the original study withavailable data to 1990.
September 1993
Dissolving Pulp IndustryMarket Trends
Irene Durbak, Research ForesterForest Products Laboratory, Madison, Wisconsin
Introduction
This report discusses worldwide trends in capacity,production, consumption, trade, and end uses for thedissolving pulp industry. Trends and operating activity inthe late 1980s at two Alaskan pulp mills are also given.Much of the information on the Alaskan mills wasobtained through personal communication with millrepresentatives in 1989. The report begins with a briefdescription of dissolving pulp, including its processes anduses. This is followed by a discussion of the industry andtrends for dissolving pulp in Alaska and worldwide. End-use markets of dissolving pulp are also discussed, withemphasis on the manufacture and use of textile fibers inthe United States.
Processes and Uses
Dissolving wood pulp is a chemically refined bleached In 1988, two Alaskan pulp mills produced close to
pulp composed of more than 90 percent pure cellulose 355 x 103 t of wood pulp, consumed about 2 x 10⁶m3
fiber. This pulp has special properties, such as a high level (solid volume) of pulpwood logs and chips, and employed
of brightness and uniform molecular-weight distribution. It about 880 people (Forest Service 1989). (In this report,
is used to make products that include rayon and acetate 1 t =1 metric ton = 1.10 short tons.) These mills are the
textile fibers, cellophane, photographic film, and various Alaska Pulp Corporation in Sitka and the Ketchikan Pulp
chemical additives (Hinck and others 1985) (Table 1). To Company in Ketchikan. In 1988, Alaska’s dissolving pulp
a large extent, use of dissolving wood pulp depends on its capacity was about 28 percent of the total U.S. capacity
purity (cellulose content), which depends mainly on the and 7 percent of the total world capacity. Alaska’s capa-
production process. city was greater than that of Canada by almost 30 percent.
Two basic processes are used to produce dissolving pulp(Hiett 1985). The sulfite process produces (sulfite) pulpwith a cellulose content up to 92 percent. It can useammonium, calcium, magnesium or sodium as a base.The prehydrolysis sulfate process produces (sulfate) pulpwith a cellulose content up to 96 Special alkalinepurification treatments can yield even higher celluloselevels-up to 96 percent for the sulfite process and up to98 percent for the sulfate process (Hiett 1985). The 90- to92-percent cellulose-content sulfite pulps are used mostlyto make viscose rayon for textiles and cellophane. The 96-to 98-percent cellulose-content sulfate pulps are used tomake rayon yarn for industrial products such as tire cord,rayon staple for high-quality fabrics, and various acetateand other specialty products (Hiett 1985; Miller FreemanPublications, Inc. 1989b).
In Alaska, dissolving wood pulp is made from softwoodfiber using a sulfite process with a magnesium base. This yields a pulp with a cellulose content of about 91 percent,and most of the pulp produced is of this grade.1
Most producers worldwide make dissolving pulp usingsoftwood fiber and the acid-sulfite and sulfate process(Tables 2 and 3). They tend to target similar end-usemarkets as do Alaskan producers. In the United States,almost half the production capacity in 1989 was insoftwood sulfite pulp; in Canada, all the productioncapacity was in softwood sulfite pulp. Sulfite pulpproduced in Japan, South Africa, and Spain is made fromeucalyptus and other hardwood fiber.
Industry and TrendsAlaska
Alaska produces dissolving wood pulp mostly for therayon staple industry and small amounts of sulfite pulp forthe paper industry. A large portion of this dissolving pulpis exported to the Pacific Rim, Europe, and Latin America;a small portion (10 to 20 percent) is shipped to U.S.domestic markets.
Since 1984, dissolving pulp exports from Alaska haveincreased, leveling off after 1988 (Fig. 1). In 1989,Alaskan pulp exports totaled 254.6 x 10³ t, valued atUS$205.2 x 10⁶ 4). This was Alaska’s highestexport level in more than 10 years and was more than athird of the total U.S. dissolving pulp exports. In 1990,export volume and value decreased (Table 4).
1Information obtained by the author during mill visit, Mayto June 1989.

In 1989, 40 percent of Alaska’s dissolving pulp exportswent to Japan, the main market for Alaskan pulp. Othermajor markets included Taiwan, China, and India (Fig. 2).
Trends during the late 1980s indicated a strong marketposition for Alaskan dissolving pulp. As the volume andvalue of Alaskan dissolving pulp exports increaseddramatically, production was pushed to near capacitylevels. Helped by demand for paper-grade pulps and theirincreasing prices, market prices for dissolving pulp indomestic and foreign markets increased as well (Table 5).Production incentives at the Sitka and Ketchikan millswere targeted at increasing production levels to meet thestrong demand.1 In 1990, prices started decreasing,however.
Trends in Alaskan dissolving pulp exports to individualmarkets reflected worldwide trends in dissolving pulpproduction, consumption, and trade. After 1985, exports toJapan increased for a few years after decreasing in theearly 1980s (Table 6). Alaska’s share of Japanese importsincreased also, but not to the levels of previous years,reflecting increased Japanese imports from other sources(Fig. 3). Exports to other markets, like Western Europe,Eastern Europe, and Taiwan, gained in relative importance(Table 7). Increasing exports to Western Europe andJapan reflect, in part, decreasing production capacity inthese markets. Increasing exports to other markets reflecta growing trend in consumption.
During the late 1980s, the Alaska Pulp Corporation andthe Ketchikan Pulp Company improved the efficiency oftheir dissolving pulp operations.1 Labor costs decreasedand productivity increased. Using magnesium as a base fortheir sulfite process enabled them to achieve high levels ofchemical recovery. Their use of purchased fuel oil alsodecreased. At the Alaska Pulp Corporation, recoveredmethane substituted for some of their fuel oil needs. At theKetchikan Pulp Company, most of the needed energycame from recovered red liquor and hogged fuel. Thelatter mill was building a strong market base with a widerange of customers. Both mills were striving to maximizereturns on their wood raw material by increasing millproduction and by using sawmill residues in pulp produc-tion. In addition, both mills were taking advantage ofincreased profitability to invest in treatment facilities tomeet enviromnental standards.2
Worldwide
In 1988, total world capacity for dissolving pulp produc-tion was 5.1 x 10⁶ t (Table 8). This was a sharp decreasefrom previous years, when total capacity was about6 x 10 t. The decrease was due mainly to a large decrease6 in capacity in the former U.S.S.R. where some mills closed
2It has been announced that one dissolving pulp mill inAlaska will be suspending pulping operations permanentlyas of September 30, 1993.
for environmental reasons (Miller Freeman Publications,Inc. 1989b). In 1990, world capacity dropped further to 4.9
x 10 t, mainly because of a decrease in Eastern Europe 6 (Table 8).
In 1987, the former U.S.S.R. had the highest reporteddissolving pulp capacity at 1.7 x 10⁶ t or 29 percent of theworld total (Table 8). In 1988, reported capacity in theformer U.S.S.R decreased sharply to 760 x 10 t or3 15 percent of the world total. In 1990, however, capacitystarted to recover. In 1990, United United States capacity was1.4 x 106 t or 28 percent of the total world dissolving pulpcapacity (Fig. 4).
In general, total world capacity for dissolving pulpproduction has been decreasing, especially since 1985(Fig. 5, Table 8). This reflects lower profitability fordissolving pulp producers as a result of increasing costs,decreasing prices, and competition from synthetic fibers(Miller Freeman Publications, Inc., 1988e).
During the early 1980s, eight mills in Western Europeeither closed or converted to paper pulp production. As aresult, dissolving pulp capacity in Western Europedecreased. It then rebounded somewhat in 1990 (Table 8).Two Canadian mills and one Japanese mill closed, andcapacity in the United States, Canada, and Japan alsodecreased. Capacity also decreased in Eastern Europe,especially in 1990. In contrast, capacity increased in India,South Africa, and Latin America.
The trend in world production of dissolving pulp hasgradually decreased since 1970. This trend parallels ageneral decrease in total world consumption (Fig 5). Bothproduction and consumption decreased in the UnitedStates, Japan, and Western Europe (Tables 9 and 10).However, production increased in the former U.S.S.R.(until 1987), South Africa, and India.
Between 1982 and 1987, total world production ofdissolving pulp increased somewhat (Fig. 5). This mirrorsthe production trend in the United States since 1982(Fig. 6). With domestic consumption at a relativelyconstant level since 1982, U.S. exports increased (Fig. 7,Table 11).
From 1970 to 1986, Japanese production and consumptionof dissolving pulp decreased, with production decreasingmom than consumption. This gap increased imports(Fig. 8). Since 1986, imports have been decreasing.
A similar gap existed in Western Europe, especially duringthe early 1980s when dissolving pulp production decreasedsharply. This may partly account for Western Europe’sincreased imports from Alaska and other sources duringthat time (Table 6 and 12).
During the 1970s, consumption of dissolving pulp inEastem Europe (including the former U.S.S.R.) increased
2

sharply (Fig. 7). Since 1975, Eastern Europe has been thelargest consumer of dissolving pulp. Consumption, likeproduction, increased more slowly during the 1980s. In1988, production decreased sharply as a result of plantclosings (Fig. 6).
During the 1970s and 1980s, dissolving pulp production,consumption, and capacity in India increased steadily andthe gap between production and apparent consumptionnarrowed (Figs. 6 and 7; Tables 8-10).
Of particular relevance to dissolving pulp producers in thePacific Northwest is the production increase in SouthAfrica since 1970. One South African mill produceshardwood sulfite pulp mainly for viscose rayon stapleproduction. With low production costs, the mill has been astrong market competitor in southeast Asia, helping pricesdecrease in the early 1980s (Miller Freeman Publications,Inc. 1988a). In addition, foreign currency exchange ratesduring the 1980s were favorable for South Africanexporters to Japan; the rand depreciated much moreagainst the Japanese yen than did U.S. and Canadiancurrencies (Stevens and Adams 1991). In 1987, SouthAfrica supplied an estimated 14 percent of total worlddissolving pulp exports; in 1990, South Africa supplied22 percent of total world exports (Table 11).
End-Use
About 77 percent of all dissolving pulp is used in themanufacture of cellulosic fibers (rayon and acetate)(Table 1). These include (a) viscose rayon staple andfilament yarn used mainly for textiles, tire cords, andvarious industrial products and (b) acetate staple andfilament yarn used for textiles and acetate fiber (tow) forcigarette filters.
Since the 1960s, world fiber competition has increased asa result of various synthetic (noncellulosic, manufactured)fibers including nylon, polyester, acrylic, olefin, and glassfiber (Fig. 9). These fibers have been gaining a sharplyincreasing share of the total market for manufacturedfibers. As a result, production and consumption of cellulo-sic (manufactured rayon and acetate) fibers made fromdissolving pulp gradually decreased.
Natural (nonmanufactured) fibers, especially cotton, haveconsistently dominated the textile fiber market worldwide.Production and consumption increased steadily, especiallysince the mid-1970s (Fig. 9).
In 1988, total world production of textile fibers was37.2 x 106 t (Fig. 10). More than half the total productionconsisted of natural fibers: cotton (49 percent), wool(15 percent), and silk 1 percent). Synthetic fibers were38 percent of the total, and cellulosic fibers (rayon andacetate) were less than 8 percent. During the 1980s, theproportion of synthetic fibers increased, and the proportionof wool and cellulosic fibers decreased.
The increase in synthetic fibers relative to cellulosic fibersis also evident when considering the change in the numberof fiber-producing facilities worldwide. Although the totalnumber of fiber-producing facilities increased only 3 per-cent between 1972 and 1988, the number of polyester-producing facilities increased 50 percent (Fig. 11). Thenumber of rayon-producing facilities decreased 67 percent;acetate-producing facilities decreased 57 percent.
The largest decrease in fiber-producing facilities occurredin Western Europe. In 1988, Western Europe had 27 rayonand acetate plants compared to 72 in 1972 (Fig. 12).Moreover, production of rayon and acetate in WesternEurope decreased sharply during the 1970s and early1980s (Fig. 13a). This parallels the decrease in dissolvingpulp production and consumption discussed previously. In1988, Western Europe produced 18 percent of the world’srayon and acetate fiber (Fig. 14).
The former U.S.S.R has been the largest producer ofrayon and acetate (Fig. 14). In 1988, the former U.S.S.R.produced 21 percent of the world total. In 1990, however,production dropped to 0.84 x 10⁶ t; this was 20 percent ofthe world total (Fiber Organon 1992a-c). In EasternEurope, including the former U.S.S.R., the trend in rayonand acetate production remained relatively constantthroughout most of the 1970s and 1980s at 1.0 to1.5 x 106 t (Fig. 13a).
Japan is a net exporter of rayon and acetate fiber. In 1988and 1990, Japan produced 10 percent of the world totaland consumed only 6 percent of the world total (Fig. 14)(Fiber Organon 1992c). The trend in production of rayonand acetate was somewhat level during the early 1980s,then decreased gradually after 1985 (Fig. 13a). Thisparalleled the trend in consumption of dissolving pulp inJapan.
Production of rayon and acetate in the People’s Republicof China and Taiwan increased steadily throughout the1970s and 1980s (Fig. 13b). Production in India decreasedin 1982 but then recovered and continued its steadyincrease during the rest of the 1980s. As previouslymentioned, consumption of dissolving pulp in Indiaincreased steadily throughout the 1970s and 1980s.
United States production of cellulosic textile fiber (exclud-ing acetate fiber for cigarette filters) has gradually de-creased, similar to the trend in Western Europe. Produc-tion decreased sharply during the major recession years,then maintained the new lower levels in the followingyears (Fig. 15). Since 1982, rayon and acetate productionhas remained at about 0.3 x 10⁶ t, decreasing to 0.2 x 10⁶ tin 1990 (Fiber Organon 1993). In contrast, U.S. productionand consumption of synthetic fibers have increasedsharply, especially during the early 1970s (Fig. 15).
Most fiber used in the United States is synthetic (polyester,nylon, acrylic, glass); this is followed by cotton. In 1990,synthetic fibers were 61 percent of total U.S. fiber
3
consumption; cotton and wool were 35 percent; rayon andacetate fibers were only 4 percent of total fiber consump-tion (Fig. 16). Compared to 1990, market share forcotton increased, while that for synthetic and cellulosicfibers decreased.
In 1990, total U.S. consumption of rayon and acetatetextile fiber was 0.27 x 10⁶ t (excludes acetate fiber usedfor cigarette filter). In 1980, total U.S. consumption was0.34 x 106 The hugest use (49 percent) was in textiles,for apparel production (Fig. 17). Other major uses oftextile fiber included fabric for drapery and upholstery(15 percent), filament yarn for various industrial productsincluding tire cords (21 percent), medical and sanitaryproducts (13 percent), and other home textiles (2 percent)(Fiber Organon 1992a-c).
Use of synthetic fibers, mainly polyester, nylon, andacrylic predominated in the U.S. apparel industry duringthe 1970s and early 1980s (Fig. 18). Use of cotton, whichwas second in importance in the apparel industry, hasincreased dramatically since 1982, surpassing syntheticfibers in the late 1980s. In 1990, use of cotton dominated.
Use of cellulosic fiber, mainly rayon, slowly decreasedduring the 1970s. Since 1985, however, use of rayon hasexperienced a gradual increase. The increase reflects, inpart, the popularity of high-quality rayon fabric developedin the late 1980s.
Use of synthetic fiber predominates in the drapery andupholstery industry. Use of synthetic fiber and cottonincreased sharply since 1982 (Fig. 19). Use of rayon,which was as important as cotton in the late 1970s,decreased sharply during the late 1970s as did use ofcotton. Unlike cotton, use of rayon did not recover muchafter 1982.
The high absorbency of rayon makes it a valuable fiber forvarious medical and sanitary products, such as gauzes,cotton balls, tampons, and diapers (Randel How-ever, use of rayon decreased and use of synthetic fibersincreased (Fig. 20).
Rayon and acetate fibers are also used in a wide range ofindustrial and miscellaneous consumer products, such ashoses, belting, felts, fiberfill, cordage, paper and tapereinforcing, and tires (Textile Economics Bureau 1989f).Although low in comparison to cotton and synthetic fibers,
use of rayon and acetate fiber remained relatively constantduring the 1980s (Fig. 21).
Use of high-tenacity rayon yarn for tire cord and cordfabric decreased sharply in the United States during theearly 1970s, and use of polyester fiber predominated(Fig. 22). Since 1975, use of rayon decreased moregradually, use of polyester and nylon decreased sharply,and use of steel increased sharply. In 1990, use of rayonfor tires and tire cord was only 3 percent of total U.S.consumption of rayon and acetate fiber. In 1990, that usedropped to less than 1 percent (Fig. 17).
Conclusions
Long-term trends in production and consumption ofdissolving pulp have been slowly decreasing as competingnatural and synthetic fibers have been increasing theirshare of end-use markets. During the late 1980s, a levelingoccurred in the long-term trends for dissolving pulp, withoverall stable levels of production and consumption. Insome world markets and end-use products, consumption ofdissolving pulp increased. Some producers making sulfitepulp from inexpensive hardwood fiber may be better ableto compete with Alaskan producers in certain markets.
For several years during the late 1980s, with worldwidedecreases in production capacity and favorable currencyexchange rates for U.S. exporters, Alaskan producersexperienced increasing export volumes and increasingprices. The decrease of the U.S. dollar relative to theJapanese yen and other major currencies was an importantfactor favoring U.S. exports. A stable weak-dollar positioncould help support the cost-competitiveness of U.S. woodpulp in foreign markets having stronger currencies. AsStevens and Adams (1991) point out, some currencieshave depreciated greatly against the Japanese yen, forexample, the South African rand. This could have affectedthe quantity of Japanese dissolving pulp imports fromSouth Africa.
In 1989, internal investments and efforts aimed at decreas-ing costs and improving operating efficiency and market-ing effectiveness were seen as helping to place dissolvingpulp producers in Alaska in a better position to competewhen market trends became less favorable. It appeared thatif producers could continue to supply a high-qualityproduct at a low cost relative to competing supplies, thenthese producers would be able to compete effectively andmaintain a strong niche in a shrinking world market.
4
5

6

Table 1—Derivatives and end-use products from dissolving pulpa
DerivativeTotal pulp use
End-use product (percent)
Cellulosic fibersViscose rayon staple
Regular Apparel fabric 42High-wet modulus Special fabric for 3
Viscose rayon filament yamapparel, furnishings
Regular tenacity Apparel 10High tenacity Tire cord and belting, 7
industrial usesAcetate staple and tow Cigarette filters 8Acetate filament yam Apparel, furnishings 7
OthersFrom viscose rayon
Cellophane Packaging 7Sponges, sausage casings 1
Acetate plastics Photographic films, 1sheets, moldings
Cellulose nitrates Lacquers, film, 8explosives
Other cellulosic organic Additives in food, 8compounds cosmetics
Special paper pulps Filter, photographic 2papers
aSource: Hiett 1985; Hinck and others 1985.
7
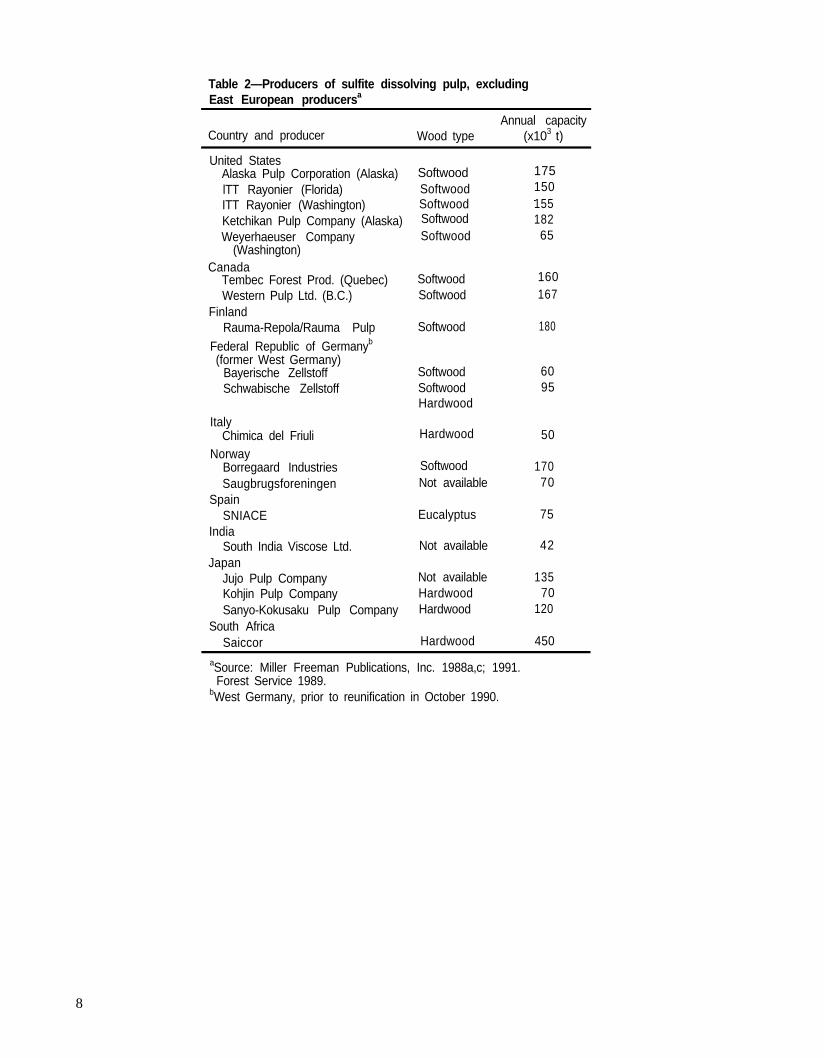
Table 2—Producers of sulfite dissolving pulp, excludingEast European producersa
Country and producerAnnual capacity
Wood type (x103 t)
United StatesAlaska Pulp Corporation (Alaska)lTT Rayonier (Florida)ITT Rayonier (Washington)Ketchikan Pulp Company (Alaska)Weyerhaeuser Company
(Washington)Canada
Tembec Forest Prod. (Quebec)Western Pulp Ltd. (B.C.)
FinlandRauma-Repola/Rauma Pulp
Federal Republic of Germanyb
(former West Germany)Bayerische ZellstoffSchwabische Zellstoff
ItalyChimica del Friuli
NorwayBorregaard IndustriesSaugbrugsforeningen
SpainSNIACE
IndiaSouth India Viscose Ltd.
JapanJujo Pulp CompanyKohjin Pulp CompanySanyo-Kokusaku Pulp Company
South AfricaSaiccor
Hardwood
SoftwoodNot available
Eucalyptus
Not available
Not availableHardwoodHardwood
Hardwood
Softwood
SoftwoodSoftwoodSoftwoodSoftwood
SoftwoodSoftwood
Softwood
SoftwoodSoftwoodHardwood
17515015518265
160167
180
6095
50
17070
75
42
13570
120
450
aSource: Miller Freeman Publications, Inc. 1988a,c; 1991.Forest Service 1989.
bWest Germany, prior to reunification in October 1990.
8
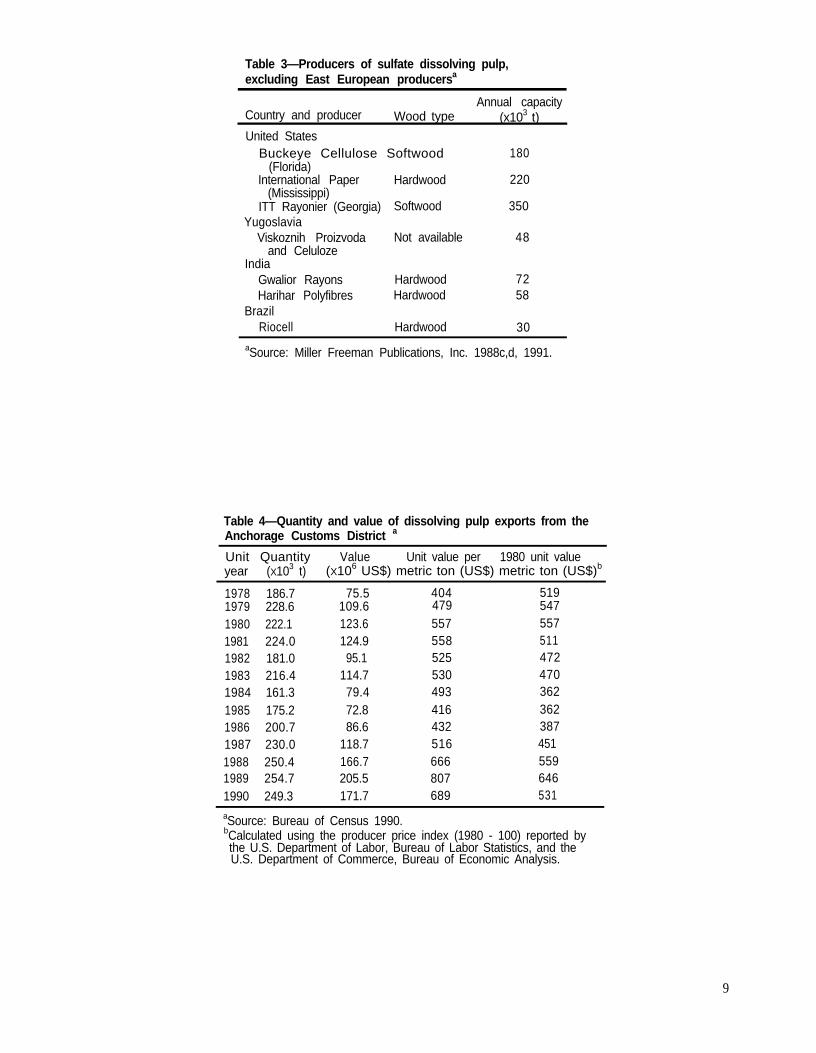
Table 3—Producers of sulfate dissolving pulp,excluding East European producersa
Country and producerAnnual capacity
Wood type (x103 t)United States
Buckeye Cellulose Softwood 180(Florida)
International Paper Hardwood 220(Mississippi)
ITT Rayonier (Georgia) Softwood 350Yugoslavia
Viskoznih Proizvoda Not available 48and Celuloze
IndiaGwalior Rayons Hardwood 72Harihar Polyfibres Hardwood 58
BrazilRiocell Hardwood 30
aSource: Miller Freeman Publications, Inc. 1988c,d, 1991.
Table 4—Quantity and value of dissolving pulp exports from theAnchorage Customs District a
Unit Quantity Valueyear (X103 t)
Unit value per 1980 unit value(X106 US$) metric ton (US$) metric ton (US$)b
1978 186.7 75.5 404 5191979 228.6 109.6 479 5471980 222.1 123.6 557 5571981 224.0 124.9 558 5111982 181.0 95.1 525 4721983 216.4 114.7 530 4701984 161.3 79.4 493 3621985 175.2 72.8 416 3621986 200.7 86.6 432 3871987 230.0 118.7 516 4511988 250.4 166.7 666 5591989 254.7 205.5 807 6461990 249.3 171.7 689 531
aSource: Bureau of Census 1990.bCalculated using the producer price index (1980 - 100) reported bythe U.S. Department of Labor, Bureau of Labor Statistics, and theU.S. Department of Commerce, Bureau of Economic Analysis.
9
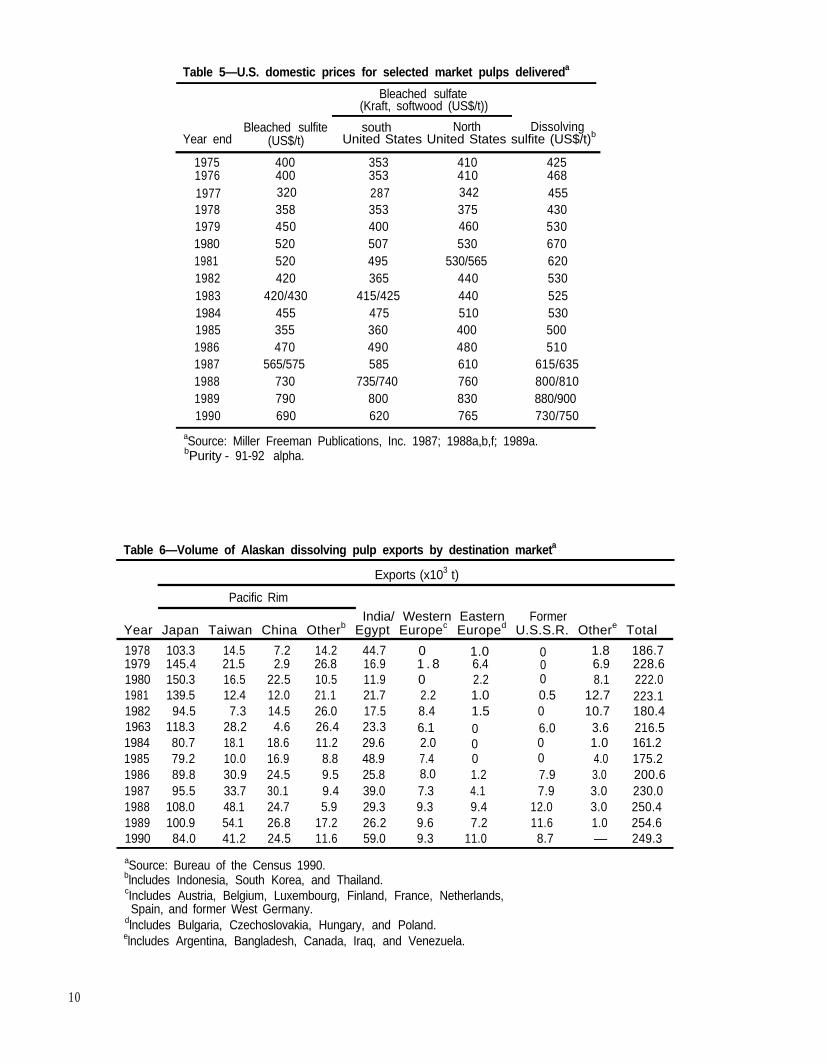
Table 5—U.S. domestic prices for selected market pulps delivereda
Bleached sulfate(Kraft, softwood (US$/t))
Bleached sulfite south North DissolvingYear end (US$/t) United States United States sulfite (US$/t)b
1982 420 365 440 5301983 420/430 415/425 440 5251984 455 475 510 5301985 355 360 400 5001986 470 490 480 5101987 565/575 585 610 615/6351988 730 735/740 760 800/8101989 790 800 830 880/9001990 690 620 765 730/750
aSource: Miller Freeman Publications, Inc. 1987; 1988a,b,f; 1989a.bPurity - 91-92 alpha.
Table 6—Volume of Alaskan dissolving pulp exports by destination marketa
1975 400 353 410 4251976 400 353 410 4681977 320 287 342 4551978 358 353 375 4301979 450 400 460 5301980 520 507 530 6701981 520 495 530/565 620
Exports (x103 t)
Pacific RimIndia/ Western Eastern Former
Year Japan Taiwan China Otherb Egypt Europec Europed U.S.S.R. Othere Total
1978 103.3 14.5 7.2 14.2 44.7 0 1.0 0 1.8 186.71979 145.4 21.5 2.9 26.8 16.9 1 . 8 6.4 0 6.9 228.61980 150.3 16.5 22.5 10.5 11.9 0 2.2 0 8.1 222.01981 139.5 12.4 12.0 21.1 21.7 2.2 1.0 0.5 12.7 223.11982 94.5 7.3 14.5 26.0 17.5 8.4 1.5 0 10.7 180.4
1963 118.3 28.2 4.6 26.4 23.3 6.1 0 6.0 3.6 216.51984 80.7 18.1 18.6 11.2 29.6 2.0 0 0 1.0 161.21985 79.2 10.0 16.9 8.8 48.9 7.4 0 0 4.0 175.21986 89.8 30.9 24.5 9.5 25.8 8.0 1.2 7.9 3.0 200.61987 95.5 33.7 30.1 9.4 39.0 7.3 4.1 7.9 3.0 230.01988 108.0 48.1 24.7 5.9 29.3 9.3 9.4 12.0 3.0 250.41989 100.9 54.1 26.8 17.2 26.2 9.6 7.2 11.6 1.0 254.61990 84.0 41.2 24.5 11.6 59.0 9.3 11.0 8.7 — 249.3
aSource: Bureau of the Census 1990.blncludes Indonesia, South Korea, and Thailand.cIncludes Austria, Belgium, Luxembourg, Finland, France, Netherlands,Spain, and former West Germany.
dlncludes Bulgaria, Czechoslovakia, Hungary, and Poland.elncludes Argentina, Bangladesh, Canada, Iraq, and Venezuela.
10

Table 7—Alaskan dissolving pulp exports by destination marketa
Total exports (%)
Pacific RimIndia/ Western Eastern Former
Year Japan Taiwan China Otherb Egypt Europec Europed U.S.S.R. Othere Total
1978 55.3 7.8 3.9 7.6 23.9 0.5 0.0 1001979 63.6 9.4 1.3 11.7 7.4
0.00.8 2.8 9.9
1.03.0 100
1980 67.7 7.4 10.1 4.7 5.4 0.0 1.0 0.0 3.6 1001981 62.5 5.6 5.4 9.5 9.7 1.0 0.4 0.2 5.7 1001982 52.4 4.0 8.0 14.4 9.7 4.6 0.8 0.0 5.9 100
1983 54.6 13.0 2.1 12.2 10.8 2.8 0.0 2.6 1.7 1001984 50.1 11.2 11.5 6.9 18.4 1.2 0.0 0.0 0.6 1001985 45.2 5.7 9.6 5.0 27.9 4.2 0.0 0.0 2.3 1001986 44.8 15.4 12.2 4.7 12.9 4.0 0.6 3.9 1.5 1001987 41.5 14.7 13.1 4.1 17.0 3.2 1.8 3.4 1.3 1001988 43.5 19.2 9.9 2.4 11.7 3.7 3.8 4.8 1.2 1001989 39.6 21.2 10.5 6.8 10.3 3.8 2.8 4.6 0.4 100
aSource: Bureau of the Census 1991.blncludes Indonesia, South Korea, and Thailand.clncludes Austria, Belgium, Luxembourg, Finland, France, Netherlands,
Spain, and former West Germany.dlncludes Bulgaria, Czechoslovakia, Hungary, and Poland.elncludes Argentina, Bangladesh, Canada, Iraq, and Venezuela.
11

Table 8—World capacity for dissolving pulp productiona
Capacity (x103 t)
OtherUnited Western Nordic Former Eastern South
Year States Canada Europeb countriesc U.S.S.R. Europed Japan Africa lndia Othere Total
1970 15751971 16081972 16091973 16441974 16501975 16181976 14811977 14251978 14871979 13931980 14321981 14421982 14031983 14551984 13641985 13091986 12731987 12541988 12711989 13571990 1383
490500428390404397393343424395340303305201221266245245277281247
728742659681715727673675688698687578562538499480415453465458518
755 600650 700670 850730 925710 1000685 1025665 1100660 1175690 1250655 1325600 1400555 1475560 1550580 1625555 1700750 1700640 1700565 1700675 760720 760475 780
379390390375415419411402472496542535530532519519519519519522277
596593598582521479479479479479479449449449449449345325325325325
220 60 88250 80 114250 80 217270 90 225280 120 229280 120 214310 120 114310 120313 130317 150325 176363 135
114116104
99116
400 135 117440 175 108485 175 127412 200 146415 220 156415 250 189420 250 183420 250 183420 250 183
549156275751591260445964574657036049601260805951601161036094623159285915514552754858
aSource: United Nations, FAO; 1984,1985,1988,1988,1989,1990,1991,1992b.bOther Westem Europe include Austria, France, Spain, West Germany, and Yugoslavia.cNordic countries include Finland, Norway, and Sweden.dEastern Europa includes Bulgaria, Czechoslovakia, East Germany, Poland, and Romania.eOther includes Algeria, Argentina, Bangladesh, Brazil, China, and Turkey, Pakistan (in 1970-1971), Mexico, andCuba (1,000 t in 1970).
12

Table 9—World production of dissolving pulpa
Production (x103 t)
United Nordic Western Former Eastern South India/Year States Canada countriesb Europec U.S.S.R. Europed Japan Africa Turkey Othere Total
1970 1547 4141971 1518 3911972 1503 3701973 1485 2931974 1583 3331975 1436 2261976 1309 2221977 1271 2681978 1284 3511979 1360 3681980 1368 3131981 1239 2741982 991 2201983 1144 2171984 1094 2211985 1068 2221986 1141 2221987 1190 2421988 1240 2661989 1293 2731990 1173 221
695 603627 535686 582671 602717 639606 503549 551504 592529 589513 576452 507433 561401 459419 454430 463311 444247 440282 429
454 307472 348444 294
542 354639 354716 336739 36740 389800 372794 382800 399810 388753 345828 327782 345796 348846 331872 316895 321895 325895 319692 321668 339668 332
554 217 f545 239 49514 245 86489 258 96444 360 125280 419 121324 328 136330 348 139321 405 142316 420 152300 420 153256 420 154266 386 152260 369 184252 406 184249 581 209172 581 209175 581 259177 581 259189 390 259187 400 259
4511
107657352
51478977704767646679878293
493049025018500154174828466847034870485047574541408942714305436442984451438443134071
aSource: United Nations, FAO; 1983,1988,1989,1992a.blncludes Finland, Norway, and Sweden.cAustria, France, Spain, former West Germany, Italy, and Yugoslavia.dlncludes Bulgaria, Czechoslovakia, former East Germany, Poland, and Roman&.elncludes Argentina, Mexico, and Brazil (mostly Brazil).f , negligible.
13

Table 10—World consumption of dissolving pulpa
Consumption (x103 t)
SouthOther Africa/
United Nordic Western Former Eastern Latin Turkey/ WorldYear States Canada Japan countriesb Europec U.S.S.R. Europed India America othere total
1970 1009 119 740 103 1392 542 413 23 44941971 1087 90 726 107 1230 640 416 63
96 5785 75 4519
1972 988 98 734 173 1247 716 399 99 72 95 46221973 979 101 682 84 1332 739 451 104 65 86 46241974 1053 99 707 190 1267 740 505 124 184 88 49581975 935 135 456 263 1058 760 553 129 127 58 4453
692
1990 665 — 409
1976 819
142
103
672 668
519 145 10761977 713 174 534 76 11581978 768 228 532 109 10101979 841 182 569 72 10541980 908 132 580 97 10281981 754 113 464 82 10091982 587 98 435 136 9501983 732 94 506 118 9121984 700 95 513 163 8671985 655 96 506 54 9251986 727 54 453 44 9161987 688 67 430 68 10381988 680 60 436 72 6921989 792 72 430 47 739
794800810753761782796846872895895895
668
524 134 126
341
130
271
4371523
115
158
344
91
3627
110 4337428 170 88 178 4390382 216 75 333 4556442 216 116 326 4604361 156 93 306 4115357 164 89 274 3869342 196 71 235 4053330 196 91 362 4189334 221 83 529 4291338 221 89 420 4254335 271 99 494 4385336 271 110 564 3913354 271 104 382 3858
aSource: United Nations, FAO; 1983,1988,1989,1992a.bIncludes Finland, Norway, and Sweden.cIncludes Austria, Belgium, Luxembourg, France, Greece, Ireland, Italy, Netherlands, Portugal, Spain, Switzerland,
United Kingdom, former West Germany, and Yugoslavia (93,000 metric tons in 1989 and 1990, estimate).dIncludes Czechoslovakia, former East Germany (170,000 metric tons, estimate, 1989–1990), Hungary, Poland,
and Romania.eIncludes Australia, China, Indonesia, New Zealand, Pakistan, Philippines, South Korea, Turkey, Greece, and Thailand.
14

Table 11—World export volume of dissolving pulpa
Exports (x103 t)
United South Nordic Former West Other WesternYear States Canada Africa countriesb Germany Europec Otherd Total
1970 789 3021971 717 3111972 720 2831973 668 2081974 715 2431975 631 1261976 663 1471977 722 1301978 687 2101979 694 2481980 698 2351981 711 2211982 573 1741983 587 1771984 540 1821985 572 1741986 645 216
204 594227 524241 517251 596360 531419 350328 412348 429338 430214 450237 388236 387233 325252 341205 313205 318205 262
1722263127113529273233373128543343
34 1241 2275 1467 779 1837 1451 438 850 470 455 131 229 832 534 1124 3824 7
1987 681e 213 205 274 80 31 24 14621988 785e 219 205 295 57 36 5 16011989 759e 224 350 287 57 34 3 17161990 709e 242 350 207 53 35 4 1599
19521864187618281973158816401704174617121647162513731422133913341401
aSource: Bureau of the Census 1991. United Nations, FAO: 1983, 1988, 1989, 1992.bincludes Finland, Norway, and Sweden.cIncludes Belgium, Luxembourg, France, Italy, Netherlands, Portugal, Spain, United
Kingdom, and Yugoslavia.dIncludes Hungary and Japan.eOf total U.S. exports, Alaska comprised 33.8 percent in 1987, 31.9 percent in 1988,
33.6 percent in 1989, and 35.2 percent in 1990.
15
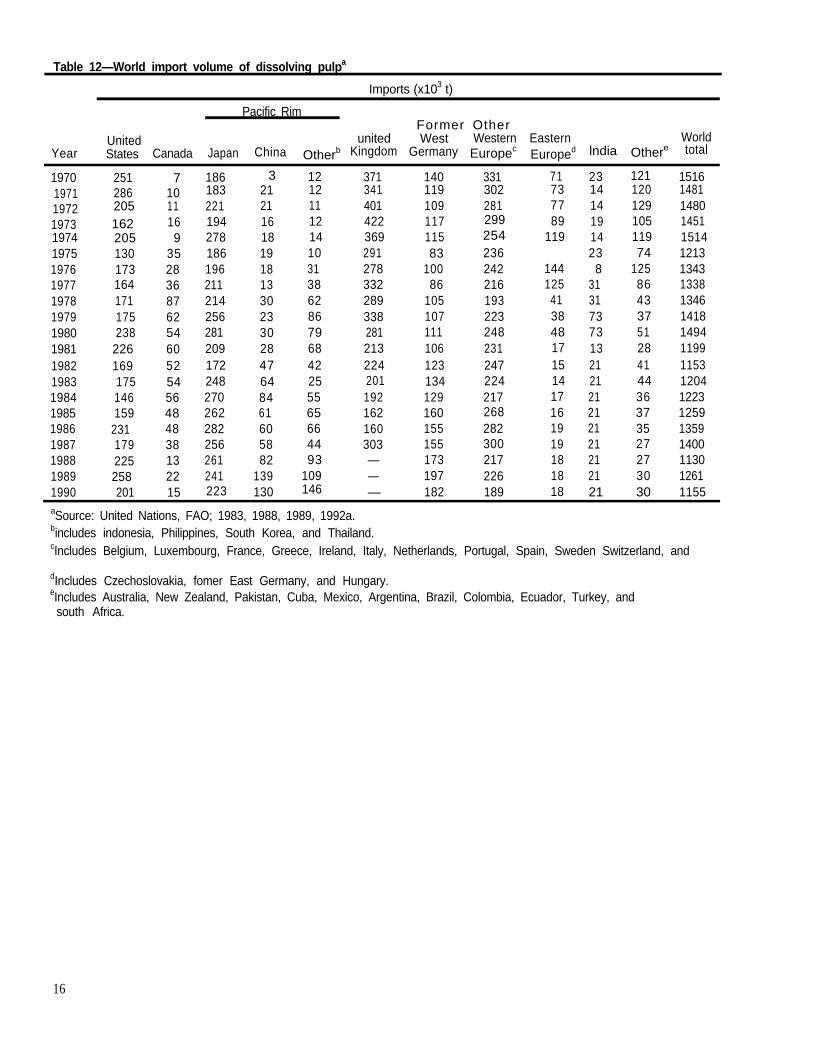
Table 12—World import volume of dissolving pulpa
Imports (x103 t)
Pacific RimFormer Other
United united West Western Eastern WorldYear States Canada Japan China Otherb Kingdom Germany Europec Europed lndia Othere total
7 3 121197019711972197319741975197619771978197919801981198219831984198519861987198819891990
251286205
1011169
352836876254605254564848381322
186183221194278186196211214256281209172248270262282256261241
212116181918133023302847648461605882
139130
12 37112 34111 40112 42214 36910 29131 27838 33262 28986 33879 28168 21342 22425 20155 19265 16266 16044 30393 —
109 —146 —
140119
331302
10911711583
10086
281
71737789
119162 299 1451205 254 1514130 236 1213173 242 144 1343164 216 125 1338171 105 193 41 1346175 107 223 38 1418238 111 248 48 1494
226 106 231 17 1199169 123 247 15 1153175 134 224 14 1204146 129 217 17 1223159 160 268 16 1259
231 155 282 19 1359179 155 300 19 1400225 173 217 18 1130258 197 226 18 1261201 15 223 182 189 18 21 30 1155
aSource: United Nations, FAO; 1983, 1988, 1989, 1992a.bincludes indonesia, Philippines, South Korea, and Thailand.cIncludes Belgium, Luxembourg, France, Greece, Ireland, Italy, Netherlands, Portugal, Spain, Sweden Switzerland, and
dIncludes Czechoslovakia, fomer East Germany, and Hungary.eIncludes Australia, New Zealand, Pakistan, Cuba, Mexico, Argentina, Brazil, Colombia, Ecuador, Turkey, andsouth Africa.
231414191423
831317373132121212121212121
12012910511974
12586433751284144363735272730
151614811480
16

Figure 1–U.S. exports of dissolving pulp (Bureauof the census 1990).
Figure 2–Distribution of 1989 Alaskan dissolvingpulp exports. Total 1989 exports: 254.6 x 10³ t(Bureau of the Census 1990).
Figure 3–Japanese imports of dissolving pulp(Bureau of the Census 1990; United Nations,FAO 1983, 1992a).
Figure 4–World distribution of dissolving pulp.Total 1980 capacity: 6.1 x 10⁶ t. Total 1990 capacity:4.9 x 10⁶ t (United Nations, FAO 1984–1991).
Figure 5–World trends in production, consumption,and capacity of dissolving pulp (United Nations,FAO 1983, 1984–1991, 1992a).
Figure 6–World trends in production of dissolvingpulp. Eastern Europe includes former U.S.S.R.;Western Europe includes Norway, Sweden,Finland (United Nations, FAO 1983, 1992a).
17

Figure 7–World trends in consumption of dissolvingpulp (United Nations, FAO 1983, 1992a).
Figure 8–Japanese consumption, production, and importsof dissolving wood pulp (United Nations, FAO 1983,1992a).
Figure 9–World trends in fiber production by typeof fiber. Cellulosic fibers include textile rayon andacetate; synthetic fibers include nylon, polyester,acrylic, and other synthetic fibers; natural fibersinclude cotton, wool, and silk (Fiber Organon 1992b;Textile Economics Bureau 1973c, 1979b, 1984, 1989d).
Figure 10–World production of textile fibers by typeof fiber. Total 1983 production: 30.8 x 10⁶ t. Total 1988production: 37.2 x 10³ t (Textile Economics Bureau 1984,1989d).
Figure 11–Number of world fiber-producing plantsby type of fiber. 1972 total plants: 859; 1988 totalplants: 886 (Textile Economics Bureau 1973b, 1989c).
Figure 12–World distribution of rayon and acetate fiber.1972 total rayon and acetate plants: 223; 1988total rayon and acetate plants: 144 (TextileEconomics Bureau 1973b, 1989c).
18

Figure 13a–World production of rayon and acetatefiber. Eastern Europe includes former U.S.S.R.;Western Europe includes Norway, Sweden, Finland(Fiber Organon 1992b; Textile Economics Bureau1980a, 1986a, 1989e).
Figure 13b–World production of rayon and acetate.Other includes Latin America and Canada (Textile Eco-nomics Bureau 1980a, 1986a, 1989e).
Figure 15–U.S. production and mill consumptionof synthetic and celluolosic fiber. Cellulosic fibers (CF)include textile rayon and acetate; synthetic fibers (SF)include nylon, polyester, acrylic, and other syntheticfibers (Fiber Organon 1992b, 1993; TextileEconomics Bureau 1989b,g).
Figure 16–U.S. mill consumption of textile fibers.Total 1980 consumption: 5.1 x 10⁶ t; total 1990 con-sumption: 6.4 x 10⁶ t. Cellulosic fibers include textilerayon and acetate; synthetic fibers include nylon,polyester, acrylic, and other synthetic fibers.(Consumption equals production plus importsless exports.) (Fiber Organon 1992a; TextileEconomics Bureau 1989b).
Figure 14–World production of rayon and acetate fiberTotal 1990 production: 2.8 x 10⁶t (Fiber Organon 1992c;Textile Economics Bureau 1990).
19
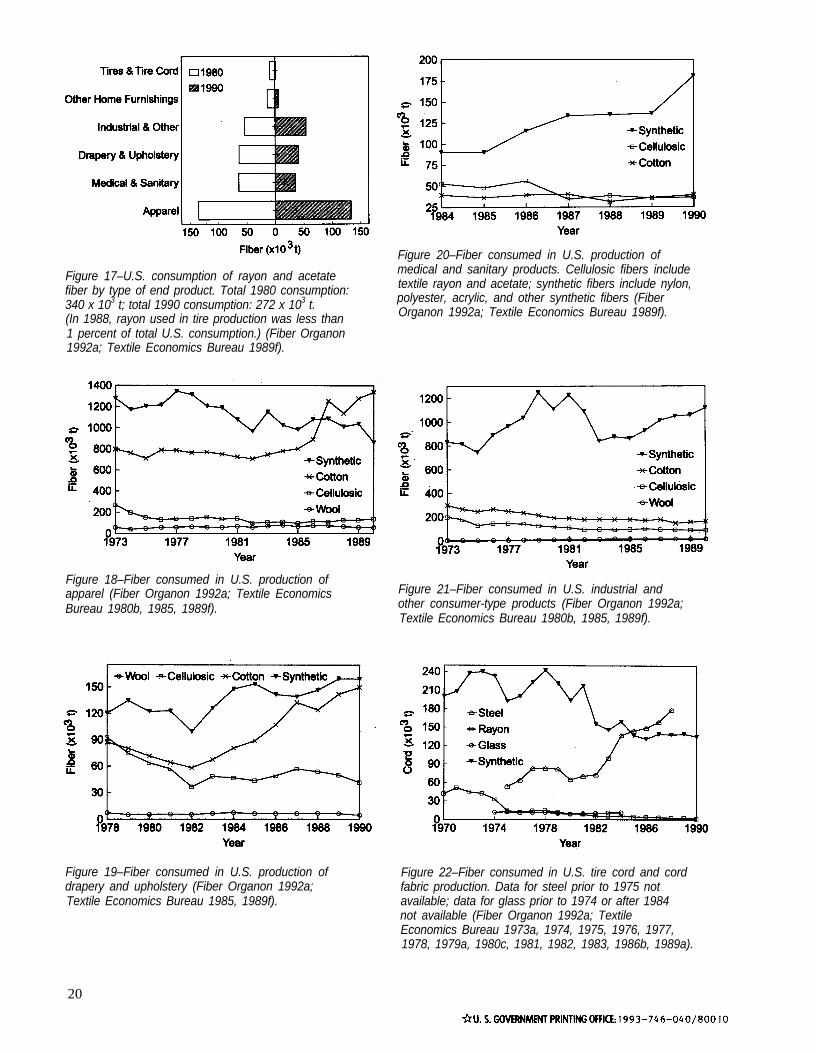
Figure 17–U.S. consumption of rayon and acetatefiber by type of end product. Total 1980 consumption:340 x 103 t; total 1990 consumption: 272 x 103 t.(In 1988, rayon used in tire production was less than1 percent of total U.S. consumption.) (Fiber Organon1992a; Textile Economics Bureau 1989f).
Figure 18–Fiber consumed in U.S. production ofapparel (Fiber Organon 1992a; Textile EconomicsBureau 1980b, 1985, 1989f).
Figure 19–Fiber consumed in U.S. production ofdrapery and upholstery (Fiber Organon 1992a;Textile Economics Bureau 1985, 1989f).
Figure 20–Fiber consumed in U.S. production ofmedical and sanitary products. Cellulosic fibers includetextile rayon and acetate; synthetic fibers include nylon,polyester, acrylic, and other synthetic fibers (FiberOrganon 1992a; Textile Economics Bureau 1989f).
Figure 21–Fiber consumed in U.S. industrial andother consumer-type products (Fiber Organon 1992a;Textile Economics Bureau 1980b, 1985, 1989f).
Figure 22–Fiber consumed in U.S. tire cord and cordfabric production. Data for steel prior to 1975 notavailable; data for glass prior to 1974 or after 1984not available (Fiber Organon 1992a; TextileEconomics Bureau 1973a, 1974, 1975, 1976, 1977,1978, 1979a, 1980c, 1981, 1982, 1983, 1986b, 1989a).
20
Related Documents