Meeting housing demand: Exploring the sustainability of the RDP housing in Knysna, South Africa. by Antonio Baleiza

Welcome message from author
This document is posted to help you gain knowledge. Please leave a comment to let me know what you think about it! Share it to your friends and learn new things together.
Transcript
Meeting housing demand: Exploring the sustainability of the RDP
housing in Knysna, South Africa. by Antonio Baleiza
1
Abstract Large proportions of the population in South Africa live in informal
settlements. These settlements are highly populated and lack basic services
such as water and sanitation. To deal with these issues, South Africa has
embarked on a program to house a nation by committing to provide adequate
housing to all. Set in Knysna, a small coastal town with limited resources and
job opportunities, this dissertation looks at the sustainability of the current
housing development and its processes. Observational impact assessments
were carried out and interviews with various stakeholders within the housing
process were held. Through a thematic analysis, this dissertation will
highlight key issues in the housing process and conclude on the sustainability
of this particular development.
2
Acknowledgements
I would like to thank my wife Sarah for her ongoing support. I would also like
to thank the Knysna municipality for its openness and enthusiasm and finally
I would like to thank Frances Harris for her advice during this process.
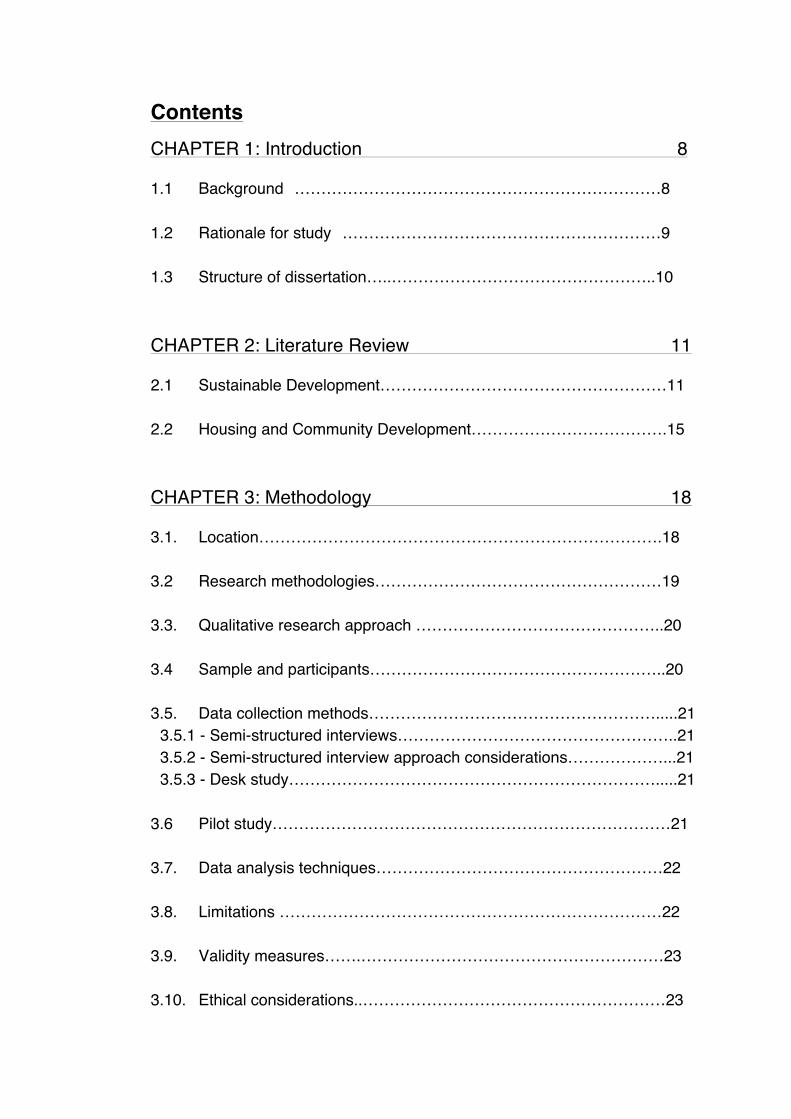
Contents CHAPTER 1: Introduction 8 1.1 Background ……………………………………………………………8 1.2 Rationale for study ……………………………………………………9 1.3 Structure of dissertation…..…………………………………………..10 CHAPTER 2: Literature Review 11 2.1 Sustainable Development………………………………………………11 2.2 Housing and Community Development……………………………….15 CHAPTER 3: Methodology 18 3.1. Location………………………………………………………………….18 3.2 Research methodologies………………………………………………19 3.3. Qualitative research approach ………………………………………..20 3.4 Sample and participants………………………………………………..20 3.5. Data collection methods……………………………………………….....21
3.5.1 - Semi-structured interviews……………………………………………..21 3.5.2 - Semi-structured interview approach considerations………………...21 3.5.3 - Desk study…………………………………………………………….....21
3.6 Pilot study…………………………………………………………………21 3.7. Data analysis techniques………………………………………………22 3.8. Limitations ………………………………………………………………22 3.9. Validity measures…….…………………………………………………23 3.10. Ethical considerations..…………………………………………………23
4
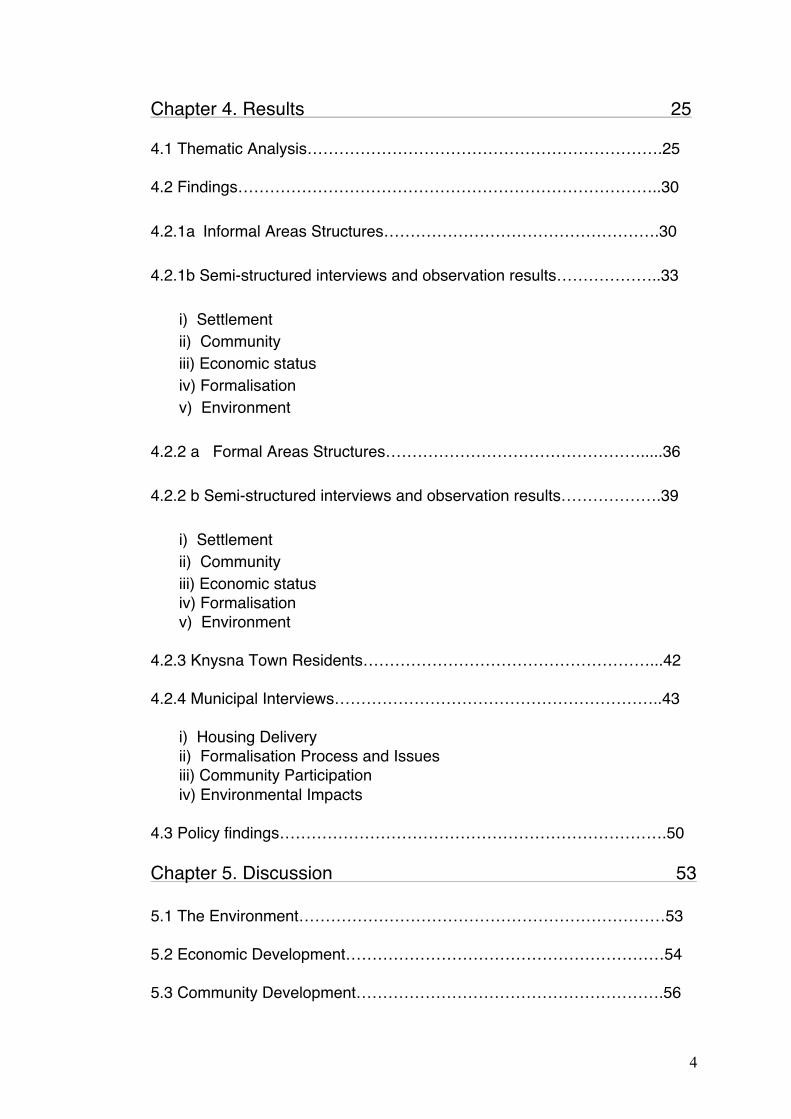
Chapter 4. Results 25 4.1 Thematic Analysis………………………………………………………….25 4.2 Findings……………………………………………………………………..30 4.2.1a Informal Areas Structures…………………………………………….30 4.2.1b Semi-structured interviews and observation results………………..33
i) Settlement ii) Community iii) Economic status iv) Formalisation v) Environment
4.2.2 a Formal Areas Structures………………………………………….....36 4.2.2 b Semi-structured interviews and observation results……………….39
i) Settlement ii) Community iii) Economic status iv) Formalisation v) Environment
4.2.3 Knysna Town Residents………………………………………………...42 4.2.4 Municipal Interviews……………………………………………………..43
i) Housing Delivery ii) Formalisation Process and Issues iii) Community Participation iv) Environmental Impacts
4.3 Policy findings……………………………………………………………….50 Chapter 5. Discussion 53 5.1 The Environment……………………………………………………………53 5.2 Economic Development……………………………………………………54 5.3 Community Development………………………………………………….56
5
Chapter 6. Conclusions and Recommendations 58 6.1 Conclusions………………………………………………………………..57 6.2 Recommendations………………………………………………………..58 References 60
6
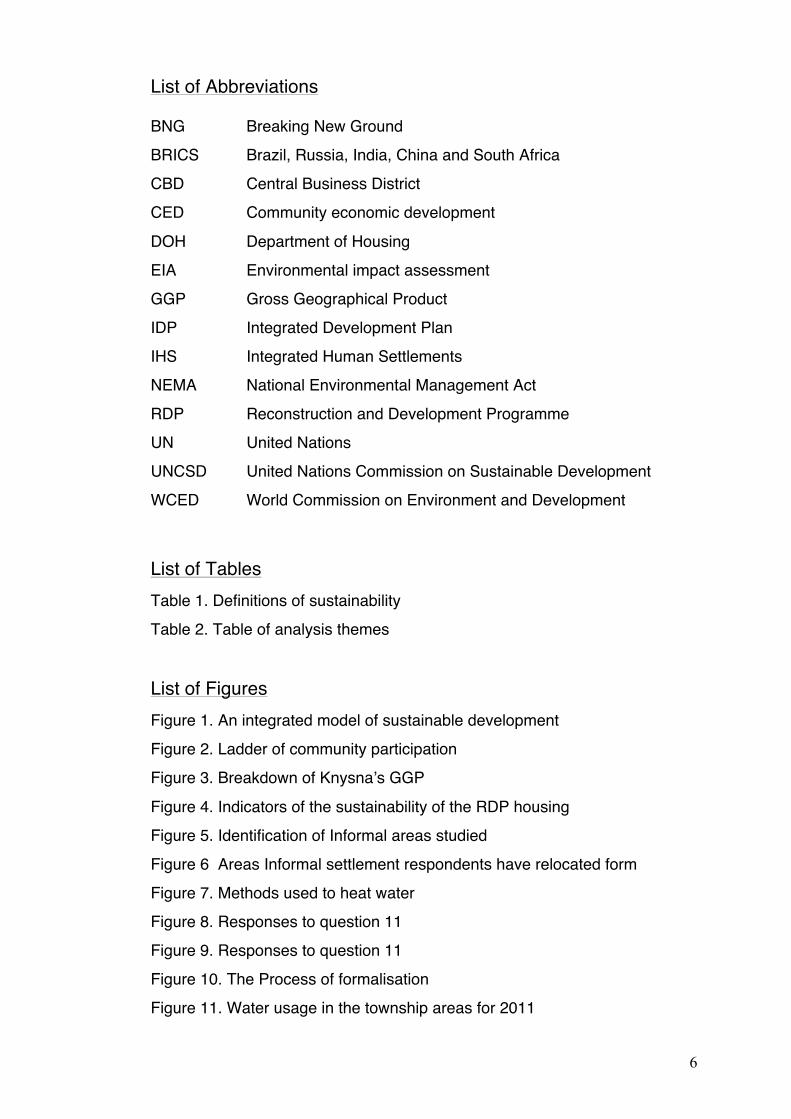
List of Abbreviations BNG Breaking New Ground
BRICS Brazil, Russia, India, China and South Africa
CBD Central Business District
CED Community economic development DOH Department of Housing
EIA Environmental impact assessment
GGP Gross Geographical Product
IDP Integrated Development Plan
IHS Integrated Human Settlements
NEMA National Environmental Management Act
RDP Reconstruction and Development Programme
UN United Nations
UNCSD United Nations Commission on Sustainable Development
WCED World Commission on Environment and Development
List of Tables Table 1. Definitions of sustainability
Table 2. Table of analysis themes
List of Figures Figure 1. An integrated model of sustainable development
Figure 2. Ladder of community participation
Figure 3. Breakdown of Knysna’s GGP
Figure 4. Indicators of the sustainability of the RDP housing
Figure 5. Identification of Informal areas studied
Figure 6 Areas Informal settlement respondents have relocated form
Figure 7. Methods used to heat water
Figure 8. Responses to question 11
Figure 9. Responses to question 11
Figure 10. The Process of formalisation
Figure 11. Water usage in the township areas for 2011
7
Figure 12. Change in Transport costs
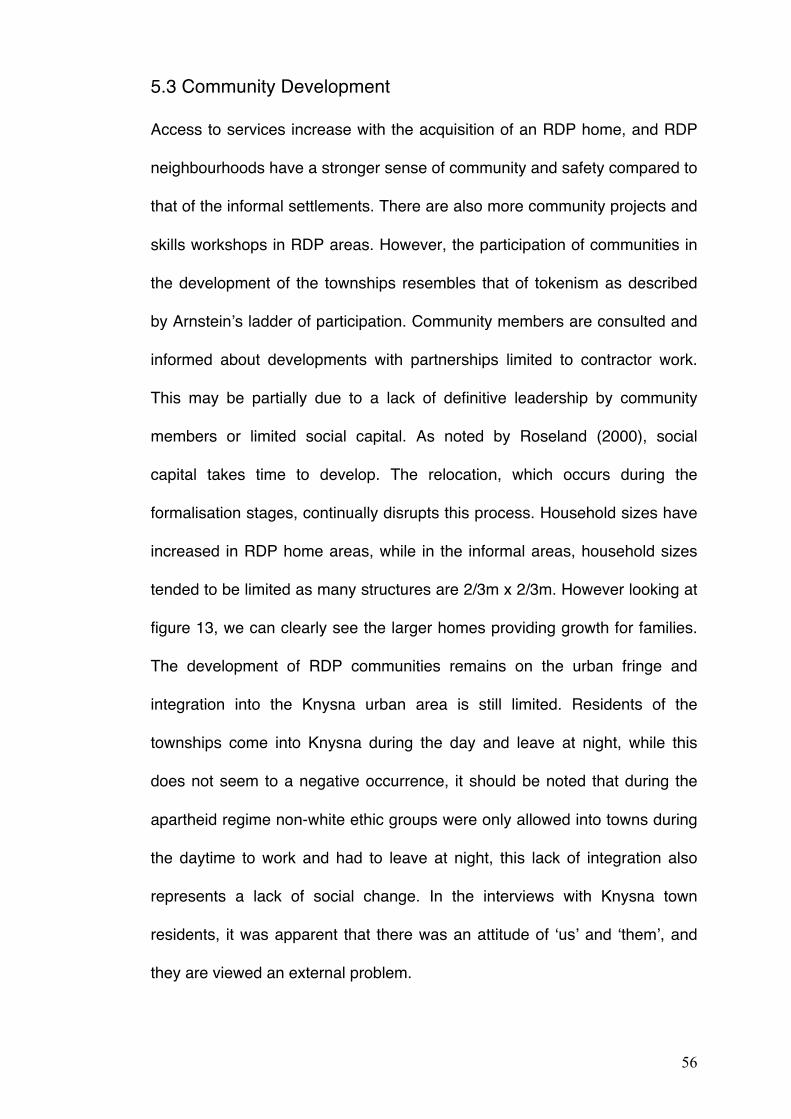
Figure 13. RDP Occupancy size
List of Images Plate 1. Types of Informal settlements
Plate 2. Example of risks due to illegal-wiring practices
Plate 3. Informal area along the N2
Plate 4. Wooden RDP design
Plate 5. First Concrete RDP Design
Plate 6. Second Concrete RDP Design
Plate 7. Third Concrete RDP Design
Plate 8. Latest Concrete RDP Design
Plate 9. Environment around the RDP homes
List of Appendices
Appendix 1 Radial designs of Settlements
Appendix 2 Provinces of South Africa and the Eden district
Appendix 3 Arial Cross-section of Knysna
Appendix 4 Comparison of Apartheid city design and Knysna
Appendix 5 A sustainable development-planning model of Bangladesh
Appendix 6 Questions for semi-structured interviews
Appendix 7 Question and Objective crosschecking guide
Appendix 8 Results of pilot questions in informal areas
Appendix 9 Results of pilot questions in formal (RDP home) areas
Appendix 10 Amended questionnaire for formal (RDP home) areas
Appendix 11 UNCSD Theme indicator framework
Appendix 12 Thematic Coding
8
CHAPTER 1: Introduction 1. Background Although South Africa has been included into the BRICS group (Brazil,
Russia, India, China and South Africa) as a rapidly growing economy, it
remains ranked as having one of the highest disparities in the world,
(Bassuk, 2013). This is largely due to the structural legacy of apartheid and
its policy of racial segregation in the country. This segregation limited
freedom and access to wealth and education to the white minority. This
socially destructive policy came to an end with the democratic election of a
new government in 1994. However, the economic, social and spatial impacts
of the apartheid regime remain. During apartheid, The Group Area’s Act,
No.41 of 1950, stipulated that there be a segregation of residential areas by
ethnic group. Urban areas were therefore planned in accordance with this
policy. Generally, the white affluent areas were situated close to the urban
center while the labour force was placed in radial concentrations on the urban
fringe and were labeled as townships, (Appendix 1). The movement from
these areas was strongly regulated and therefore any migration for non-
whites was limited.
The newly elected ANC government has being seeking to achieve equality,
democracy and access to basic needs through the Reconstruction and
Development Programme (RDP), (Cameron 1996). This policy states that
“one of the RDP’s first priorities, is to provide for the homeless”, (SAGI,
1994). This is further reiterated in the South African constitution, stating,
“Everyone has the right to have access to adequate housing”, (HRC, 1996
p.28). These mandates have led to the RDP housing project, a project with
9
large social and economic goals. These RDP homes are not only to be a
means of providing adequate housing, but also a mechanism to alleviate
poverty. In 1994 a backlog of 3 million homes were recorded, (O’Malley,
2011) and in 2011, a housing backlog around 2 million was estimated,
(Sowetan, 2011), despite 2,5 million homes being built since 1994,
(Parliament, 2010). An increasing amount of pressure is on government to
provide more homes and services and over the past few years the amount of
violent protests has increased as a result of the perceived slowness of
delivery, (Alexander, 2010). This has fuelled a hastened implementation of
housing provision with large developments appearing on the urban fringe.
1.2 Rationale for study Now that there is freedom of movement in the post-apartheid South Africa,
migration has increased, with people relocating to areas where job
opportunities exist. The main pulling provinces are that of the Western Cape
and Gauteng (Appendix 2), which have large central business districts
(CBD). The townships on the urban periphery become the first destinations to
migrants, who usually build informal structures. This in-migration and
settlements on the urban fringe has resulted in the increase of township size
and density. As resources and space are becoming limiting factors, we must
begin to consider the sustainability of these rapid developments. How will
these increases in density and demand be met? What are the social
conditions and the environmental impacts of these urban fringe spaces?
Bearing in mind that the homes also delivered as mechanisms for poverty
alleviation, how do they affect poverty?
10
The aims and objectives of this project are thus;
Aim:
The aim of this dissertation is to investigate whether the current model of
RDP housing as a means to alleviate poverty is sustainable.
Objectives:
1. To Investigate the Social Sustainability of the RDP housing Policy
2. To Investigate the Economic Sustainability of the RDP housing Policy
3. To Investigate the Environmental Sustainability of the RDP housing Policy
1.3 Structure of dissertation
This dissertation consists of six chapters. In the first chapter we will explore
the setting of the study and highlight reasons for carrying out this study. The
second chapter will review the literature around townships and RDP
housing’s function in economic development. We will then discuss
sustainable development and sustainable infrastructure. The third chapter will
examine the methodology used in the study, while the fourth chapter will
present the results, followed by a discussion in the fifth. The closing
conclusions and recommendations will then be presented in the sixth and
final chapter.
11
CHAPTER 2 Literature Review
2.1 Sustainable Development
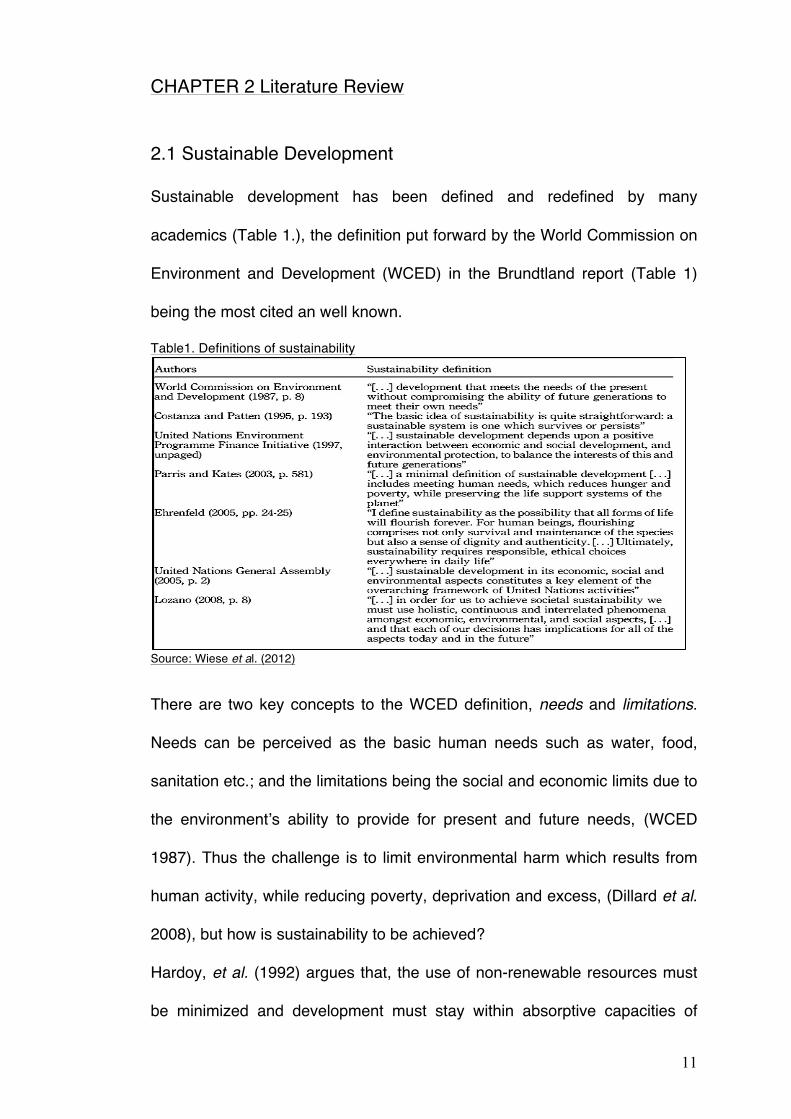
Sustainable development has been defined and redefined by many
academics (Table 1.), the definition put forward by the World Commission on
Environment and Development (WCED) in the Brundtland report (Table 1)
being the most cited an well known.
Table1. Definitions of sustainability
Source: Wiese et al. (2012)
There are two key concepts to the WCED definition, needs and limitations.
Needs can be perceived as the basic human needs such as water, food,
sanitation etc.; and the limitations being the social and economic limits due to
the environment’s ability to provide for present and future needs, (WCED
1987). Thus the challenge is to limit environmental harm which results from
human activity, while reducing poverty, deprivation and excess, (Dillard et al.
2008), but how is sustainability to be achieved?
Hardoy, et al. (1992) argues that, the use of non-renewable resources must
be minimized and development must stay within absorptive capacities of
12
local and global waste-absorption limits while meeting basic human needs.
Similarly, (C. L. Choguill 1996) notes that by dealing with environmental,
social, economic criteria in unison is key to achieving sustainability.
Elkington’s (1997) ‘triple bottom line’ of sustainability, is a term commonly
used, this requires the ‘balancing’ of social, environmental and economic
factors to ensure the sustainability of developments, keeping in mind that
these three ‘spheres’ of sustainability are dynamic and interdependent, and
should be considered inseparably. The 1992 Rio Declaration also highlights
these three spheres and suggests that in order to achieve sustainability there
will need to be trade-offs in the prioritisation process. Furthermore,
sustainability is about the integration of social, economic and ecological
values, thus considerations about social preferences and diversities must
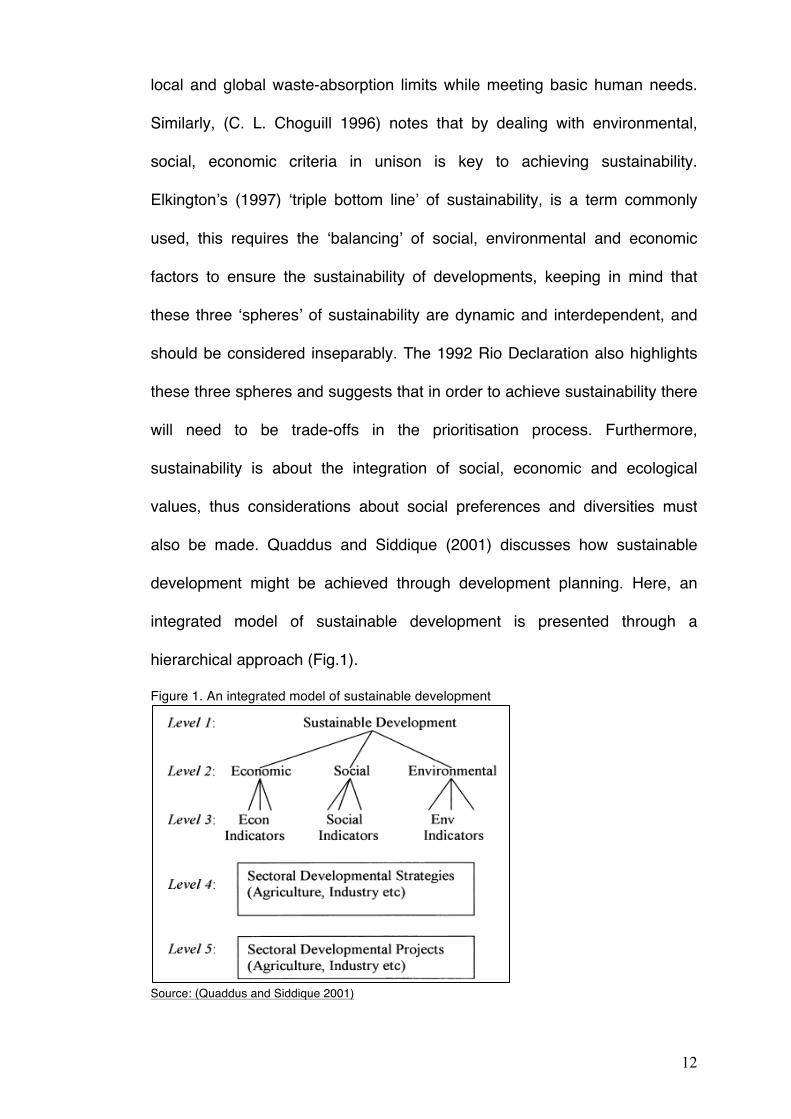
also be made. Quaddus and Siddique (2001) discusses how sustainable
development might be achieved through development planning. Here, an
integrated model of sustainable development is presented through a
hierarchical approach (Fig.1).
Figure 1. An integrated model of sustainable development
Source: (Quaddus and Siddique 2001)
13
In this approach, level 1 is the final objective of sustainable development and
level 2 represents the dimensions (or pillars) of sustainable development.
Level 3 defines level 2’s objectives in more operational terms through
indicators determined by research and consultation with stakeholders,
(Quaddus and Siddique 2001). Level 4 are the strategies, which will help
meet the goals of level 3, and finally level 5 consists of the projects that will
carry out the strategies (See appendix 5 for an example of this). However,
Quaddus and Siddique point out that, indicators differ from locality to locality
and thus planners must sensitively adjust indicators to represent the locality.
This is due to the difference of needs, for example; the needs of people in the
‘first world’ differ substantially form the needs of the people in the ‘third
world’. Vallance et al. (2011), point out that the notion of sustaining the
current societal arrangements in developing nations is unsustainable and that
meeting the basic needs everywhere is a crucial part of achieving
development goals. Destatte (2010), notes that sustainable development is
essentially viewing development in the long term. He presents the ‘ Foresight
Process’, in which stakeholder analysis plays a central role. Here the
interactions of economic, social and environmental variables are assessed
through stakeholder dialogues, thereby enabling development as a holistic
process with the needs of stakeholders as the central axis. However, Manzi
(2010) notes that when different policies are implemented in the pursuit of
protecting the environment, securing social and economic advancement,
there can be tensions brought about between stakeholders, he suggests that
redressing these is the biggest challenge to sustainable development.
14
Dillard et al. (2008), state that environmental sustainability can only be
grounded in social sustainability. Vallance et al. (2011), identified social
homogeneity, equitable incomes, employment and access to goods and
services as constituent elements of social sustainability, while Polèse and
Stren (2000), refer to social sustainability as the ‘policies and institutions that
have the overall effect of integrating diverse groups and cultural practices in a
just and equitable fashion’. Manzi (2010), further states that social
sustainability should acknowledge the political dimension, questioning how
power and control are exercised within the urban policy context.
In the South African context, Polèse and Stren (2000) highlight four main
themes, which need to be addressed to achieve sustainability in the urban
environment. Firstly, planning and physical intervention; this relates to the
breaking down of the artificial spatial barriers left by apartheid. This is
important not only for social inclusion but also to allow access to economic
activities. Secondly, Polèse and Stren (2000), note that increasing social
capital through basic education and developing skills, will enhance capacity
and thus further develop employment opportunity. Thirdly is the issue of
transport, Polèse and Stren (2000), see public transport as a key component
to influence structural change, and the lack of this in South Africa as a failure
to achieve social sustainability. The fourth theme is the housing process
which, Polèse and Stren conclude, have not taken into account the
importance of social capital and networks. Social Capital is made up of social
organisations, which increase a society’s productive potential; these include
features such as networks, norms and trust, (Roseland, 2000). Roseland
(2000) also notes that social capital cannot be created nor can it be coerced
15
but rather develops over time in the correct environment. Quigley (1996),
argues that by focusing on community development we can create the space
for social organisation to develop.
2.2 Housing and Community Development
The Reconstruction and Development Program in South Africa has
emphasised the use of housing as a community development and anti-
poverty mechanism, (Cross, 2008). Rogerson (1999), states that as part of
the survival strategy of the poor, housing plays a critical role as it secures a
level of socio-economic stability and serves as a source of asset creation and
saving.
Pugh (2000), notes that, as household incomes increase self-builds are
upgraded through ‘’progressive’’ improvements (i.e. replacing inferior
materials with superior materials) and thus made more homely and
increasing in value. This process is further enhanced when services and
infrastructure are improved within the settlements’ environment. However as
Rogerson (1999) points out, within developing nations, regulatory frameworks
prescribe high standards of social and physical infrastructure, which may
stifle development due to the constraint of financial resources. However, if
policies fail to achieve a stable growth of income, secure tenure and
development social capital, these improvements to housing will be less
probable, (Pugh, 2000). Securing tenure can be a vital starting point to
poverty alleviation, as it promotes investment into livelihoods and can
encourage environmental stewardship, (Nyametso, 2012). A stable growth of
income is needed to facilitate this investment and fund the development of a
16
community. Community Economic Development (CED) is often seen as a
way of addressing development at the community level, whereby some
control over the local economy is taken away from the market or the state
and transferred to local community members, (Roseland, 2000). CED
projects can either be used to directly improve infrastructure or to facilitate
small business markets, (Rogerson, 1999). For instance, tourism has been
regarded as a 'passport to development' as it creates a local market, (Binns
and Nel, 2002). Case studies in South Africa led Binns and Nel to conclude
that tourism-based local economic development is serving as a catalyst for
social and economic development, through which the apartheid-based
injustices can be partly addressed. However, the poorer communities can be
marginalised as they may not have control over the development process,
and therefore the participation of poor communities needs to be supported,
(Binns and Nel, 2002). Choguill (1996), suggests that community
development should not just focus on improvements that lead to healthier
and productive lives, but also mobilize communities to claim their rights in the
political arena, thus fostering better community involvement or participation.
Arnstein (1969) defined citizen participation as, “the redistribution of power,
which enables the ‘have-not’ citizens…to be included in the future, whereby
they can induce social reform that enables them to share in the benefits of
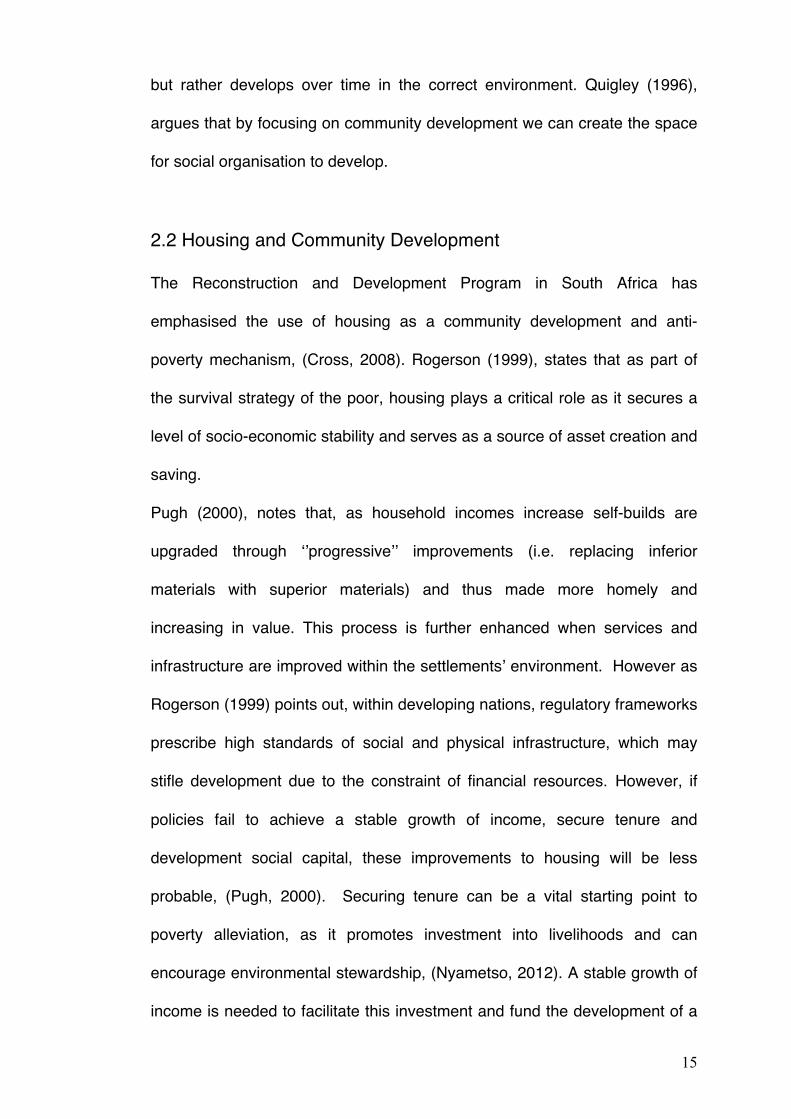
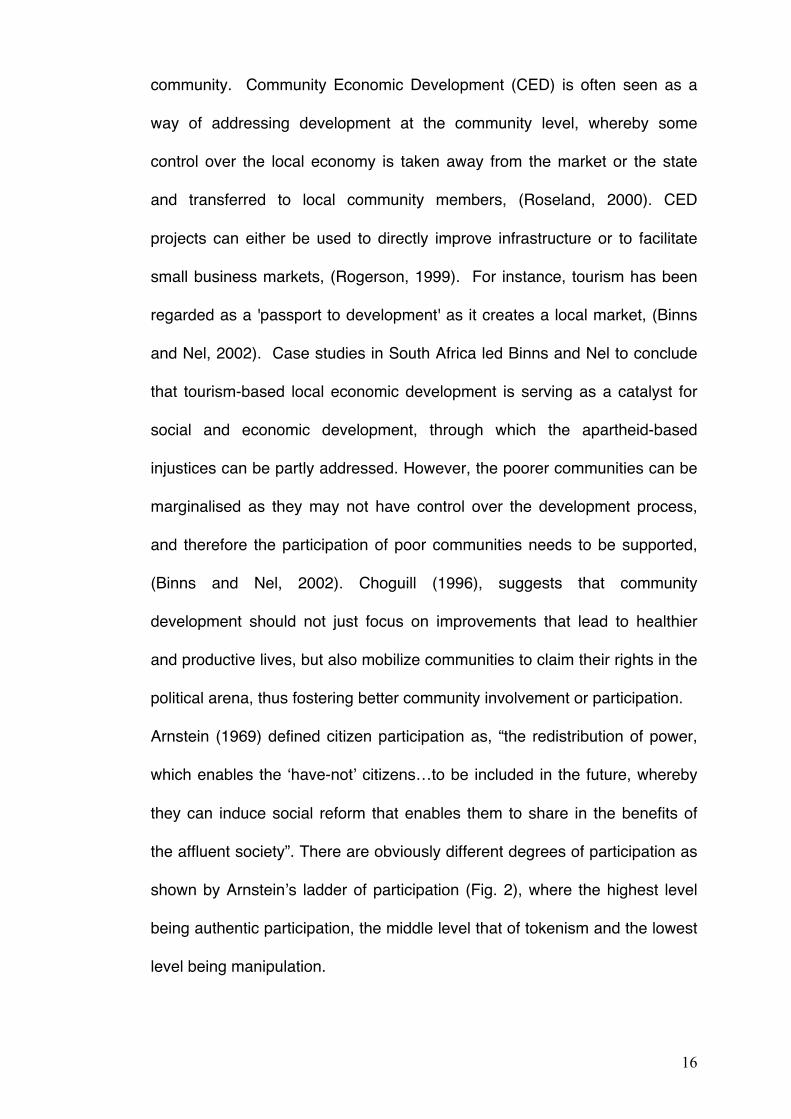
the affluent society”. There are obviously different degrees of participation as
shown by Arnstein’s ladder of participation (Fig. 2), where the highest level
being authentic participation, the middle level that of tokenism and the lowest
level being manipulation.
17
Figure 2. A Ladder of community participation
Source: (Choguill,1996)
The lower rungs of non-participation refer to the practices or ‘rubber
stamping’, where support for projects are engineered and thus participation
by communities is a public relations tool for developers, (Arnstein, 1969).
Similarly the seventh rung ‘therapy’, is another form of tokenism, whereby the
‘tenants are bought together to help them adjust their values and attitudes to
that of the larger society’, thus engineering participation. Tokenism, Arnstein
identifies as a one-way flow of information, for example developments might
‘engage’ with communities about proposed developments but no channels of
feedback are provided. Arnstein regards the first step towards authentic
participation as the redistributions of power and responsibilities. At this level,
community members are included into planning boards and decision-making
processes.
Therefore if housing provision is to be sustainable, social, economic and
environmental factors must be balanced. To maintain environmental
sustainability, development must remain within regeneration limits of the
environment and social sustainability must be secured to limit impacts upon
the environment. Social sustainability requires improved equity and improved
social capacity, which requires the investment into social capital through
community participation and development.
18
CHAPTER 3 Methodologies 3.1. Location The site chosen for the research is Knysna, South Africa (Appendix 2,3,4), on
the border of the Western Cape and Eastern Cape. It is a famous tourist
destination with seasonal peaks in the summertime and festivals throughout
the year. It is situated in an estuarine bay surrounded by steep hills with the
N2 highway running through the town center. Knysna has a population of
68 659, which has increased by 20 000 people since 2001, (StatsSA, 2013).
Within the resident population, 49.5% of people are dependants (below 15
and above 64 years old) and 50% of the population have no schooling, while
25% of the population is unemployed, (StatsSA, 2013). Within the municipal
area of Knysna, 18 120 households are in formal housing while 4 303
households are in informal housing, (Knysna Municipality 2013). The 2010
and 2011 census has shown an increase in migration form the Eastern Cape
to the Western Cape, (StatsSA, 2013). It has been suggested (Kok, 2006),
that this migration trend is primarily due to the search for employment, the
major destination being the City of Cape Town further south. According to the
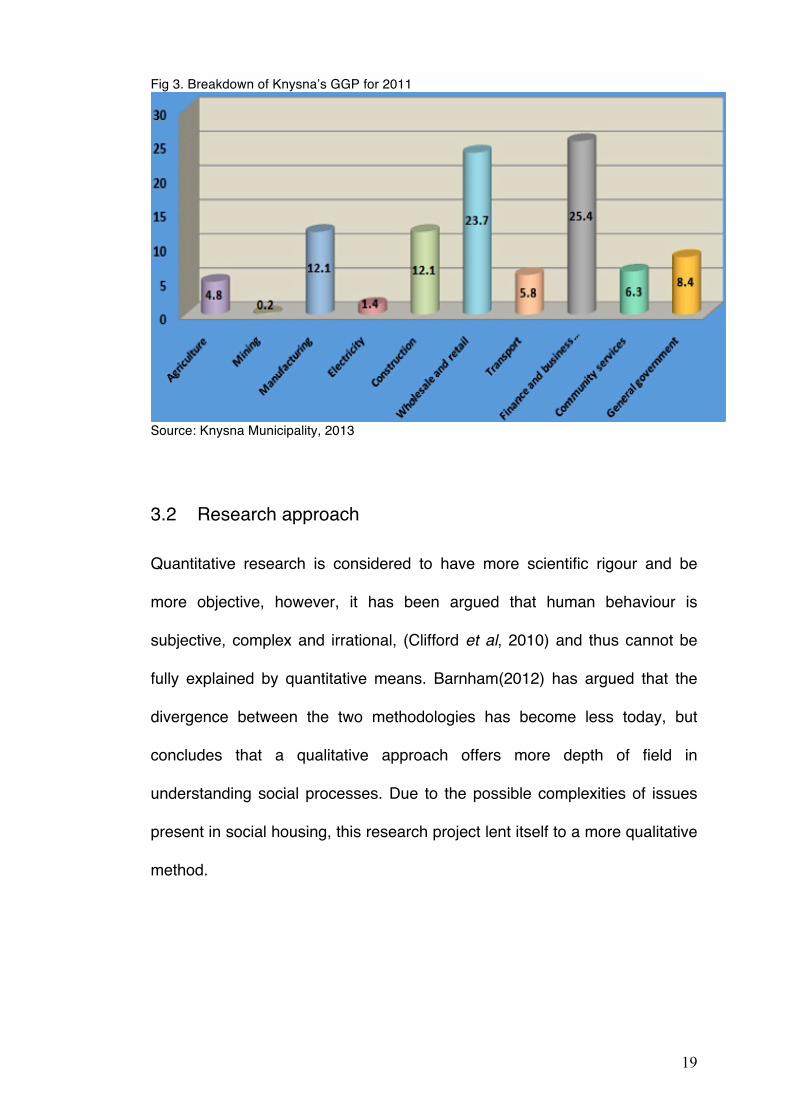
Knysna annual Report, Knysna’s Gross Geographical Product (GGP) of R2.3
billion made up 13% of the Eden districts annual GGP, the third largest
contributor. Figure 3 represents the breakdown of the economic sectors
within Knysna, finance and business is the largest source of revenue for
Knysna with the second largest being that of wholesale and retail at 23%, of
which 24% is related to tourism accommodation.
19
Fig 3. Breakdown of Knysna’s GGP for 2011
Source: Knysna Municipality, 2013 3.2 Research approach
Quantitative research is considered to have more scientific rigour and be
more objective, however, it has been argued that human behaviour is
subjective, complex and irrational, (Clifford et al, 2010) and thus cannot be
fully explained by quantitative means. Barnham(2012) has argued that the
divergence between the two methodologies has become less today, but
concludes that a qualitative approach offers more depth of field in
understanding social processes. Due to the possible complexities of issues
present in social housing, this research project lent itself to a more qualitative
method.
20
3.3 Research method
A variety of approaches and methods of data collection have been employed
for this research. This included semi-structured interviews, participant
observation and a desk study. Four areas of study were identified and
explored. The first area was the informal settlements; these areas are made
up of individuals who live in temporary self-built structures and were identified
as the first point of entry into the housing process. The second area was the
RDP homeowners and the third area being institutional structures, which
managed the process. The fourth area investigated was that of residents who
did not live in these areas but rather in Knysna centre. This structure is
designed to capture information about the RDP homes and processes as
represented by each level from entry into the process, to being an external
viewer of the process. This served as a means to cross-reference each level
and compare ‘real world realities’ with current policy and perceptions.
3.4 Sample and participants Interviewee’s were picked at random throughout the study area. Interviews
were informal and one on one. Initially 30 interviews were planned in the
informal areas, 30 in the RDP areas and 30 in the town centre. However, it
has been argued, (Glaser and Strauss 2009), that random sampling could
possibly miss the actual targeted groups. Thus theoretical sampling was
used for the semi-structured interviews and interviews were concluded when
no further additional findings were being captured.
21
3.5. Data collection methods
3.5.1 - Semi-structured interviews
Interviews were carried out during working hours and weekends. The
questions (Appendix 6) within the interview were designed to meet all the
primary and secondary objectives; an objective table was used to ensure this
(Appendix 7). Additional questions and observations about the localities of
participants were also noted. Notes were only taken after interviews to
ensure informality of conversations.
3.5.2 - Semi-structured interview approach considerations
Interviews were conducted during working hours, as the areas where
interviews took place are considered unsafe at night. A possible problem with
this approach was the potential of only interviewing unemployed individuals.
3.5.3 Desk study
Policy documents of national and local government were collected and
reviewed. News articles as well as historic data, census data and case
studies were also reviewed.
3.6. Pilot studies 3.6.1 Informal settlements The pilot questionnaires were carried out over two days and were conducted
in the informal areas of Nekkies and Dam se Bos. Some results of the
questionnaire were homogeneous and it became apparent that some
questions were self-evident, either by observation or as a result of a policy
22
put in place by the local municipality. Appendix 8 is a summary table of the
questions and the justifications for their omission from the Questionnaire
used for the study.
3.6.2 Formal settlements (RDP home owners) The pilot questionnaires were carried out over two days, in the informal areas
at Hornlee and Khayaletu. Once again it became apparent that some
questions were self evident, either by observation or a policy put in place by
the municipality. Appendix 9 is a summary table of the questions and the
justifications for further omissions. The RDP homes also seemed to house
more people than they were intended for, thus a question of family size was
also added. Appendix 10 shows the questionnaire used for the rest of the
primary data capture and the linkages to objectives.
3.7. Data analysis techniques In grounded theory, theories regarding social phenomena are derived from
the data gathered, (Glaser and Strauss 2009). Theories are further grounded
in a systematic analysis of data, comparing gathered data and derived
theories to existing theories, (Lingard et al, 2008). This will be done by
means of thematic analysis. Thematic analysis goes beyond counting words
and phrases, but rather focuses on highlighting themes within the gathered
data, (Guest et al, 2012).
3.8. Limitations and problems encountered and methods to improve the study Limitations encountered during the research include trust issues, as service
delivery is highly politicised in the country, one is met with scepticism and
23
mistrust and thus answers to questions may lack depth. This could be
improved by using local teams to carry out interviews. Another limiting factor
was the times of interviews; those who were employed might not be
represented in the interviews. An interview on the weekend was a mitigation
strategy to counter this, however, the presence of alcoholism and intimidation
made interviews on the weekend difficult and dangerous.
Further methods to improve the study would be the use of focus groups and
thematic mapping techniques within these meetings.
3.9. Validity measures Within different areas 3 interviews were carried out, this was to ensure
triangulation of information in each locality. Pictures and observations were
also recorded to counter/support comments made by participants. News
articles were also researched as a background check to thematic comments
made by participants.
3.10. Ethical considerations
Residents within the townships have a culture and lifestyles different from
people who live in Knysna town. Due consideration has been taken to ensure
that all questions have been dealt with in a sensitive manner. Since service
delivery is a sensitive issue in South Africa, care was taken to ensure that
respondents were aware that questions were for research only and that the
respondents should hold no expectation on answers given. Video and voice
recording media was not used. It was also important to ensure that
participants understood the questions and thus colloquial language was
used, the interviews were also conducted in Afrikaans, as many people in the
24
townships did not want to speak English. Respondents would also remain
anonymous, therefore no names or addresses where gathered. No names
are used only titles or respondent reference numbers.
25
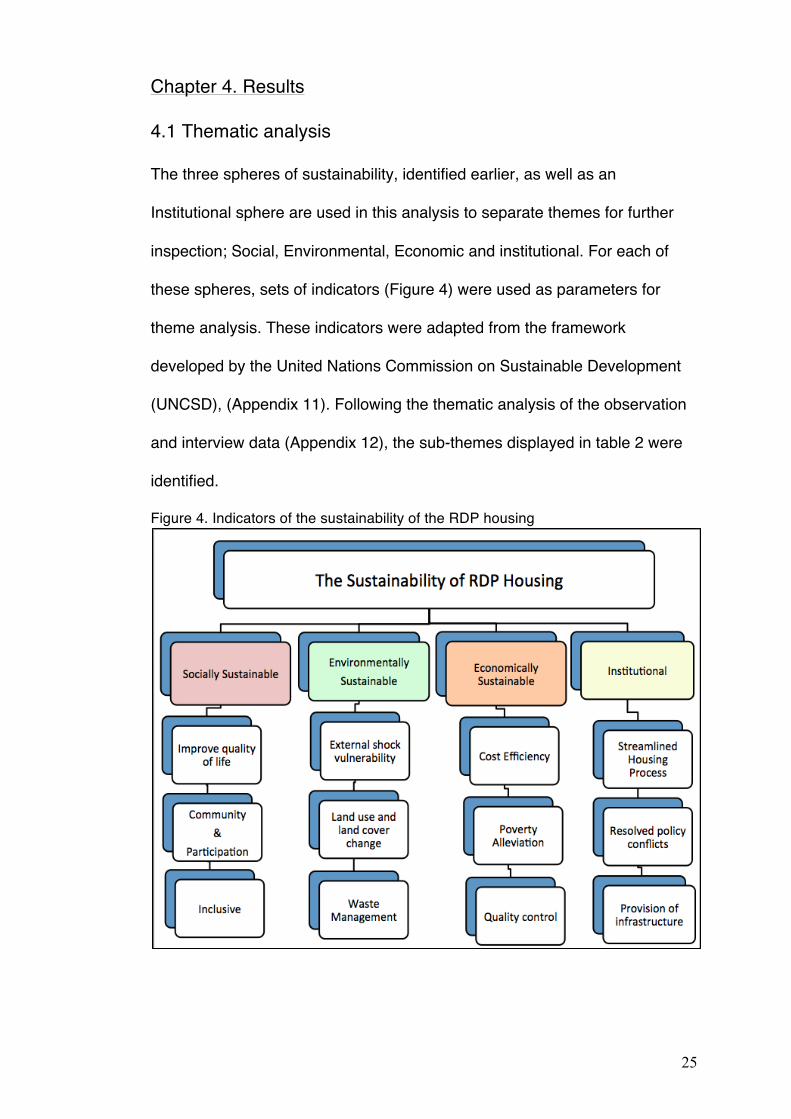
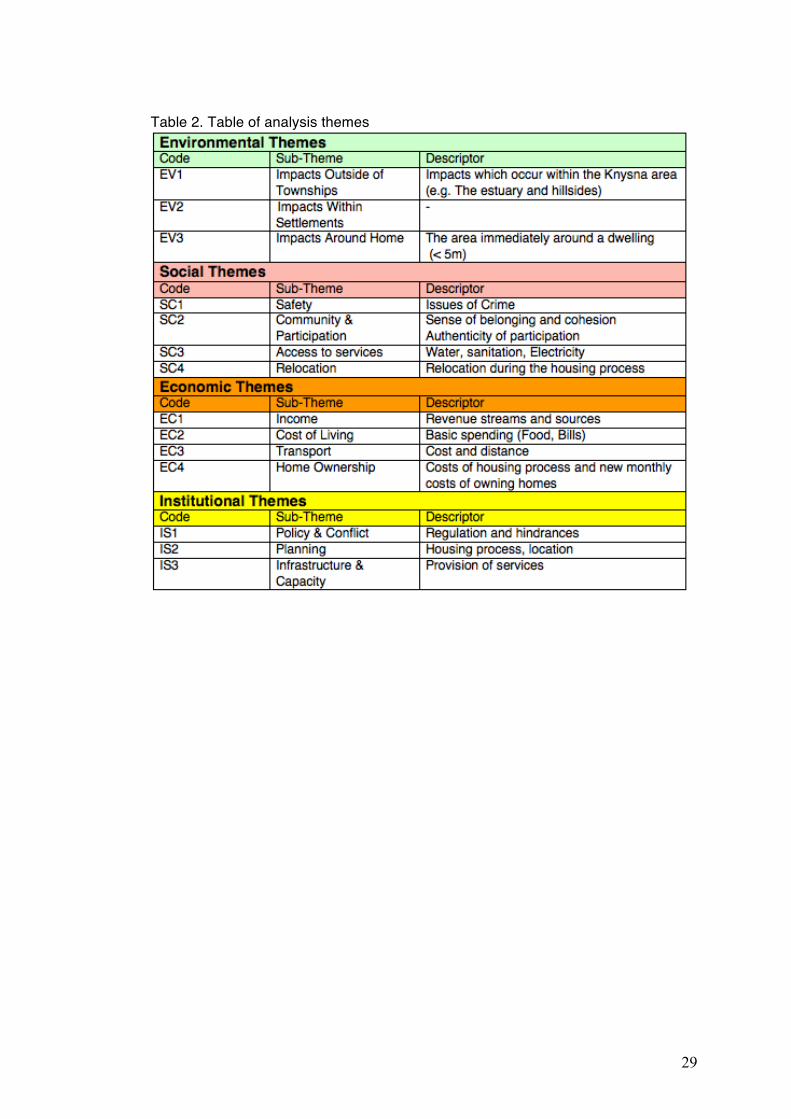
Chapter 4. Results 4.1 Thematic analysis The three spheres of sustainability, identified earlier, as well as an
Institutional sphere are used in this analysis to separate themes for further
inspection; Social, Environmental, Economic and institutional. For each of
these spheres, sets of indicators (Figure 4) were used as parameters for
theme analysis. These indicators were adapted from the framework
developed by the United Nations Commission on Sustainable Development
(UNCSD), (Appendix 11). Following the thematic analysis of the observation
and interview data (Appendix 12), the sub-themes displayed in table 2 were
identified.
Figure 4. Indicators of the sustainability of the RDP housing
26
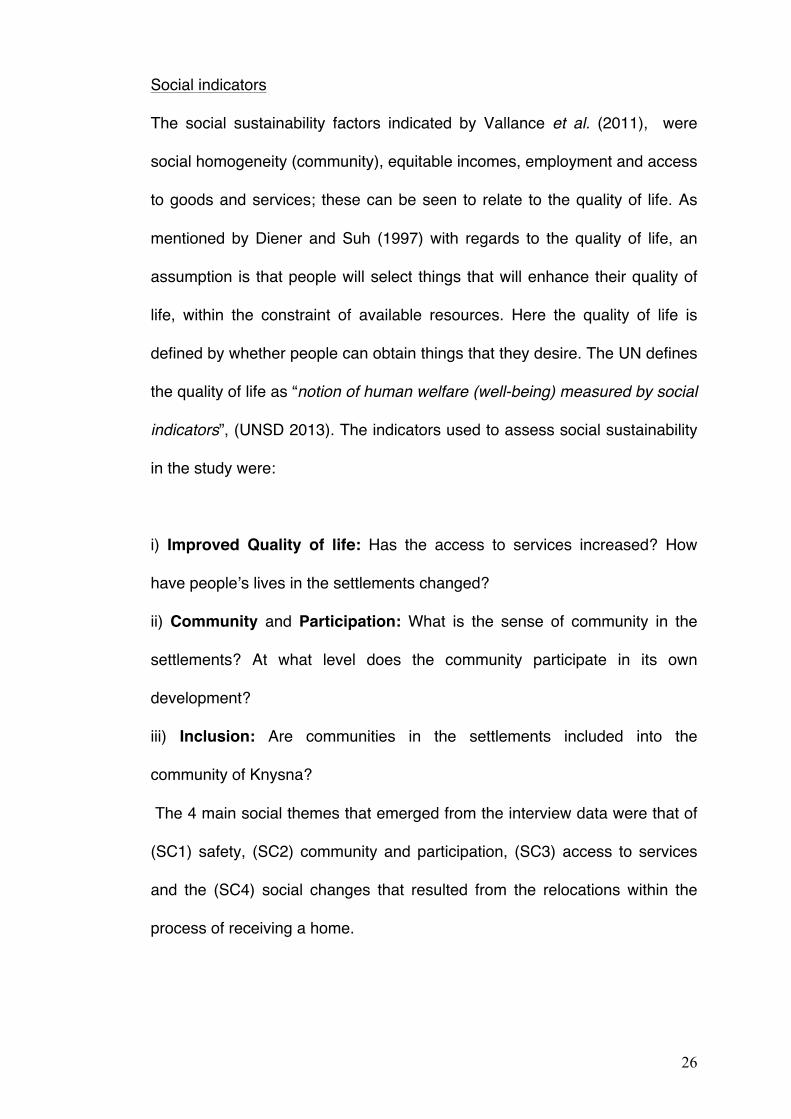
Social indicators
The social sustainability factors indicated by Vallance et al. (2011), were
social homogeneity (community), equitable incomes, employment and access
to goods and services; these can be seen to relate to the quality of life. As
mentioned by Diener and Suh (1997) with regards to the quality of life, an
assumption is that people will select things that will enhance their quality of
life, within the constraint of available resources. Here the quality of life is
defined by whether people can obtain things that they desire. The UN defines
the quality of life as “notion of human welfare (well-being) measured by social
indicators”, (UNSD 2013). The indicators used to assess social sustainability
in the study were:
i) Improved Quality of life: Has the access to services increased? How
have people’s lives in the settlements changed?
ii) Community and Participation: What is the sense of community in the
settlements? At what level does the community participate in its own
development?
iii) Inclusion: Are communities in the settlements included into the
community of Knysna?
The 4 main social themes that emerged from the interview data were that of
(SC1) safety, (SC2) community and participation, (SC3) access to services
and the (SC4) social changes that resulted from the relocations within the
process of receiving a home.
27
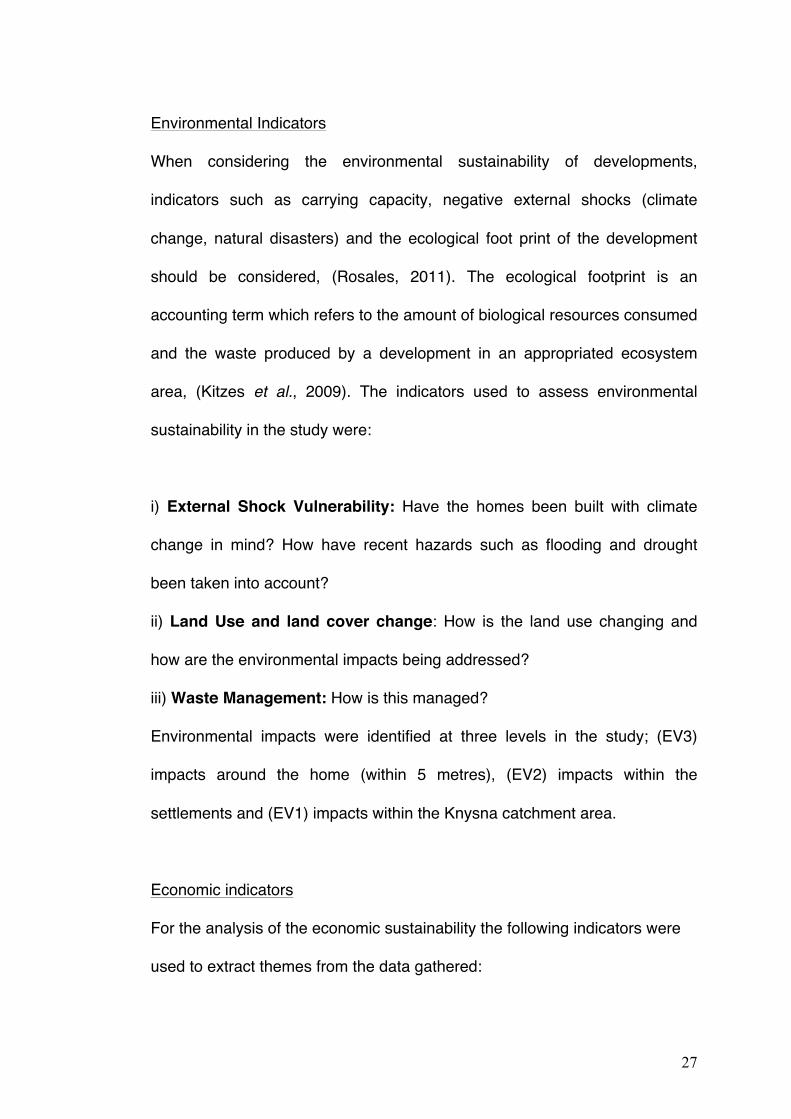
Environmental Indicators
When considering the environmental sustainability of developments,
indicators such as carrying capacity, negative external shocks (climate
change, natural disasters) and the ecological foot print of the development
should be considered, (Rosales, 2011). The ecological footprint is an
accounting term which refers to the amount of biological resources consumed
and the waste produced by a development in an appropriated ecosystem
area, (Kitzes et al., 2009). The indicators used to assess environmental
sustainability in the study were:
i) External Shock Vulnerability: Have the homes been built with climate
change in mind? How have recent hazards such as flooding and drought
been taken into account?
ii) Land Use and land cover change: How is the land use changing and
how are the environmental impacts being addressed?
iii) Waste Management: How is this managed?
Environmental impacts were identified at three levels in the study; (EV3)
impacts around the home (within 5 metres), (EV2) impacts within the
settlements and (EV1) impacts within the Knysna catchment area.
Economic indicators
For the analysis of the economic sustainability the following indicators were
used to extract themes from the data gathered:
28
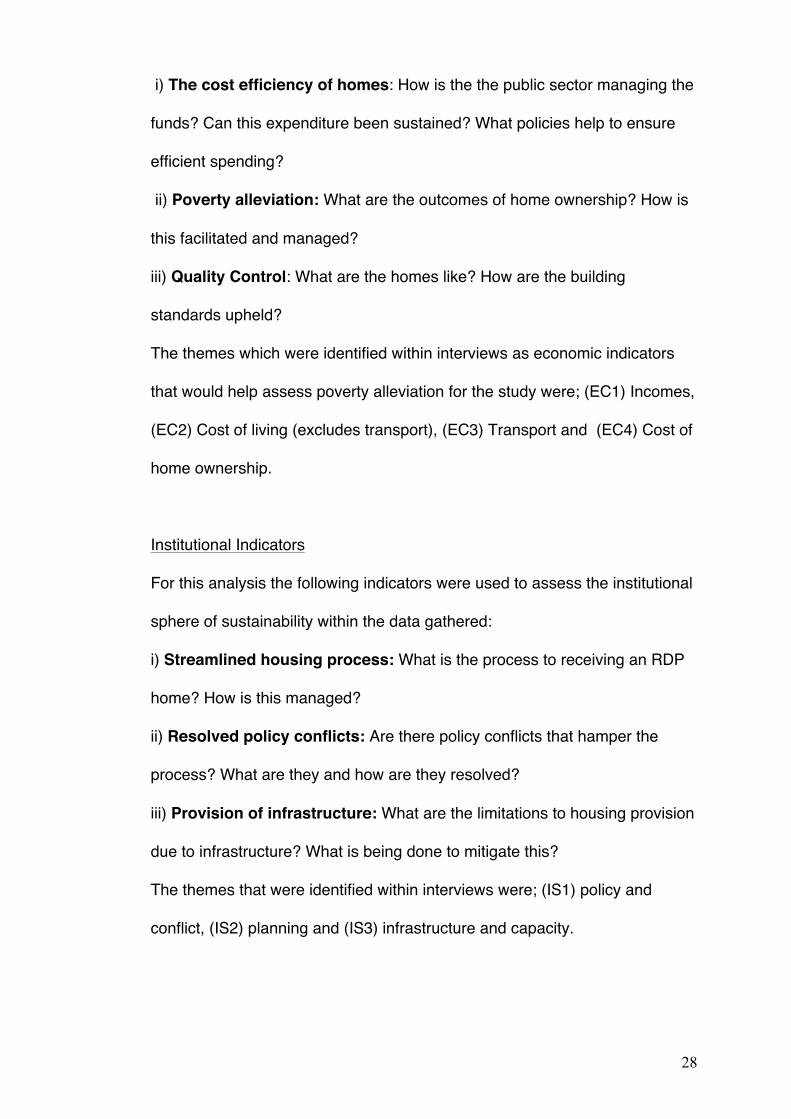
i) The cost efficiency of homes: How is the the public sector managing the
funds? Can this expenditure been sustained? What policies help to ensure
efficient spending?
ii) Poverty alleviation: What are the outcomes of home ownership? How is
this facilitated and managed?
iii) Quality Control: What are the homes like? How are the building
standards upheld?
The themes which were identified within interviews as economic indicators
that would help assess poverty alleviation for the study were; (EC1) Incomes,
(EC2) Cost of living (excludes transport), (EC3) Transport and (EC4) Cost of
home ownership.
Institutional Indicators
For this analysis the following indicators were used to assess the institutional
sphere of sustainability within the data gathered:
i) Streamlined housing process: What is the process to receiving an RDP
home? How is this managed?
ii) Resolved policy conflicts: Are there policy conflicts that hamper the
process? What are they and how are they resolved?
iii) Provision of infrastructure: What are the limitations to housing provision
due to infrastructure? What is being done to mitigate this?
The themes that were identified within interviews were; (IS1) policy and
conflict, (IS2) planning and (IS3) infrastructure and capacity.
29
Table 2. Table of analysis themes
30
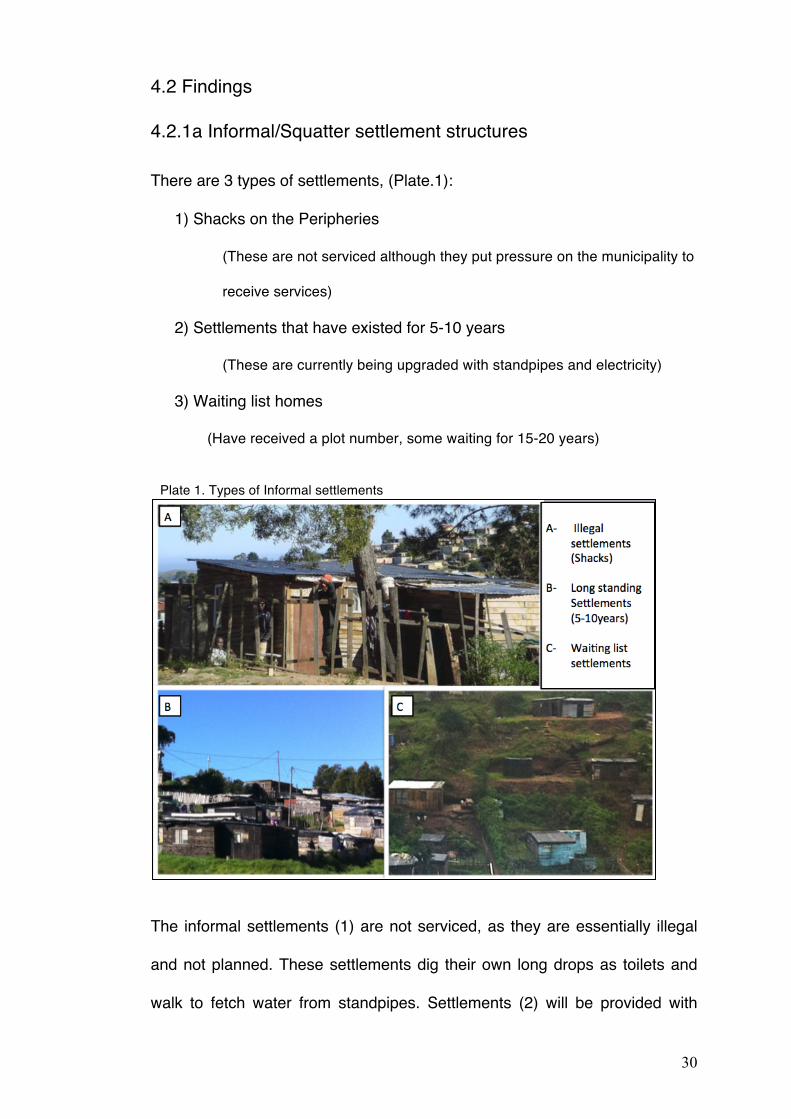
4.2 Findings 4.2.1a Informal/Squatter settlement structures
There are 3 types of settlements, (Plate.1):
1) Shacks on the Peripheries
(These are not serviced although they put pressure on the municipality to
receive services)
2) Settlements that have existed for 5-10 years
(These are currently being upgraded with standpipes and electricity)
3) Waiting list homes
(Have received a plot number, some waiting for 15-20 years)
Plate 1. Types of Informal settlements
The informal settlements (1) are not serviced, as they are essentially illegal
and not planned. These settlements dig their own long drops as toilets and
walk to fetch water from standpipes. Settlements (2) will be provided with
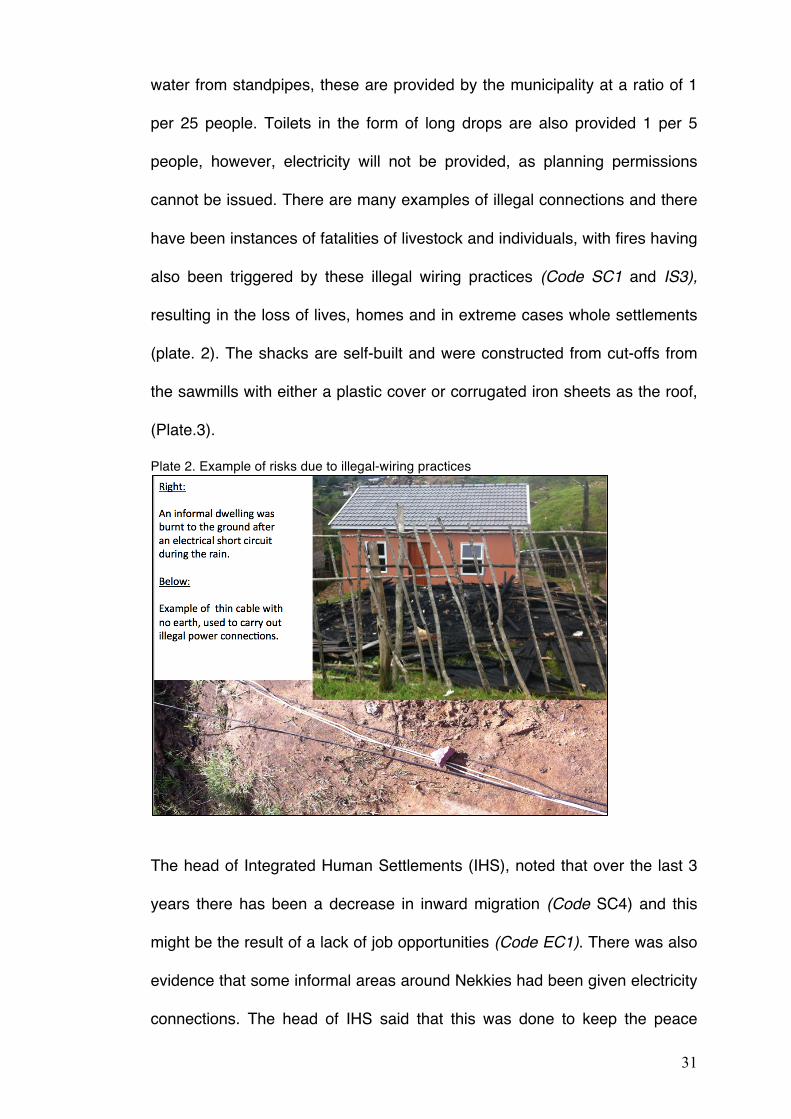
31
water from standpipes, these are provided by the municipality at a ratio of 1
per 25 people. Toilets in the form of long drops are also provided 1 per 5
people, however, electricity will not be provided, as planning permissions
cannot be issued. There are many examples of illegal connections and there
have been instances of fatalities of livestock and individuals, with fires having
also been triggered by these illegal wiring practices (Code SC1 and IS3),
resulting in the loss of lives, homes and in extreme cases whole settlements
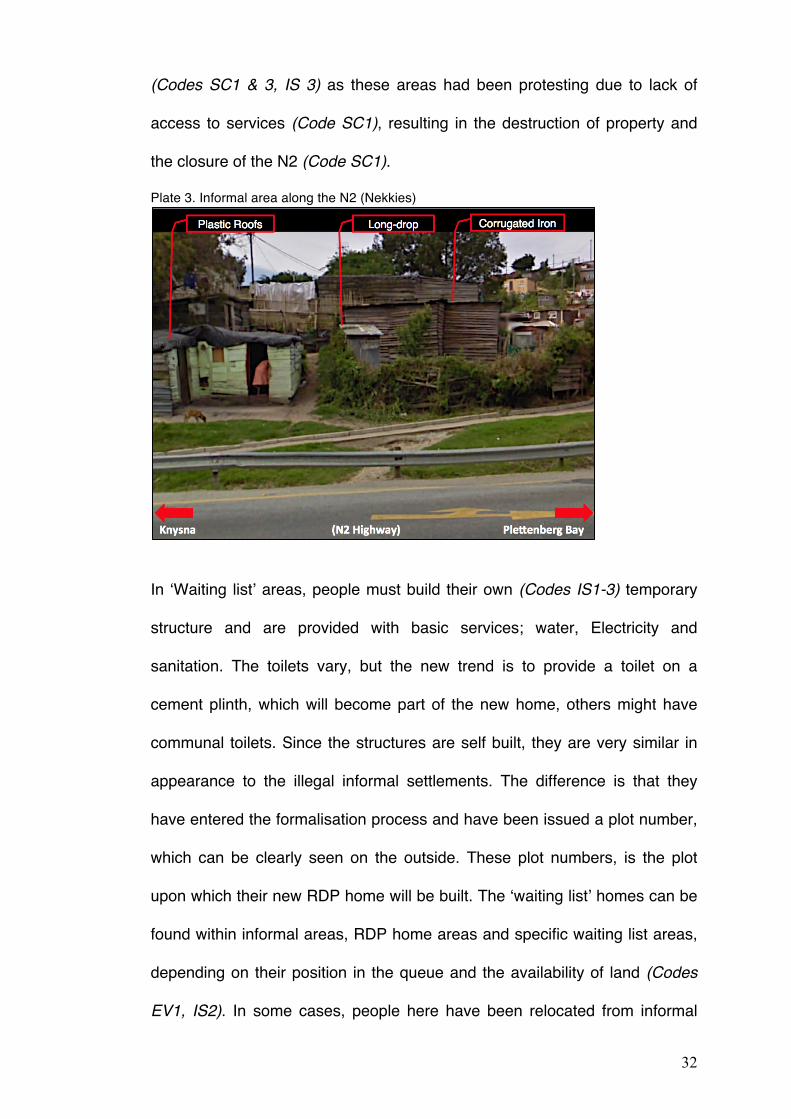
(plate. 2). The shacks are self-built and were constructed from cut-offs from
the sawmills with either a plastic cover or corrugated iron sheets as the roof,
(Plate.3).
Plate 2. Example of risks due to illegal-wiring practices
The head of Integrated Human Settlements (IHS), noted that over the last 3
years there has been a decrease in inward migration (Code SC4) and this
might be the result of a lack of job opportunities (Code EC1). There was also
evidence that some informal areas around Nekkies had been given electricity
connections. The head of IHS said that this was done to keep the peace
32
(Codes SC1 & 3, IS 3) as these areas had been protesting due to lack of
access to services (Code SC1), resulting in the destruction of property and
the closure of the N2 (Code SC1).
Plate 3. Informal area along the N2 (Nekkies)
In ‘Waiting list’ areas, people must build their own (Codes IS1-3) temporary
structure and are provided with basic services; water, Electricity and
sanitation. The toilets vary, but the new trend is to provide a toilet on a
cement plinth, which will become part of the new home, others might have
communal toilets. Since the structures are self built, they are very similar in
appearance to the illegal informal settlements. The difference is that they
have entered the formalisation process and have been issued a plot number,
which can be clearly seen on the outside. These plot numbers, is the plot
upon which their new RDP home will be built. The ‘waiting list’ homes can be
found within informal areas, RDP home areas and specific waiting list areas,
depending on their position in the queue and the availability of land (Codes
EV1, IS2). In some cases, people here have been relocated from informal
33
areas and will again be relocated to the plot where the RDP home will be
built. This relocation process is due to the limited space and the difficulties of
laying infrastructure (Codes S2, EV3) between settlements in fragmented
informal settlements. Once people have received a RDP home, the
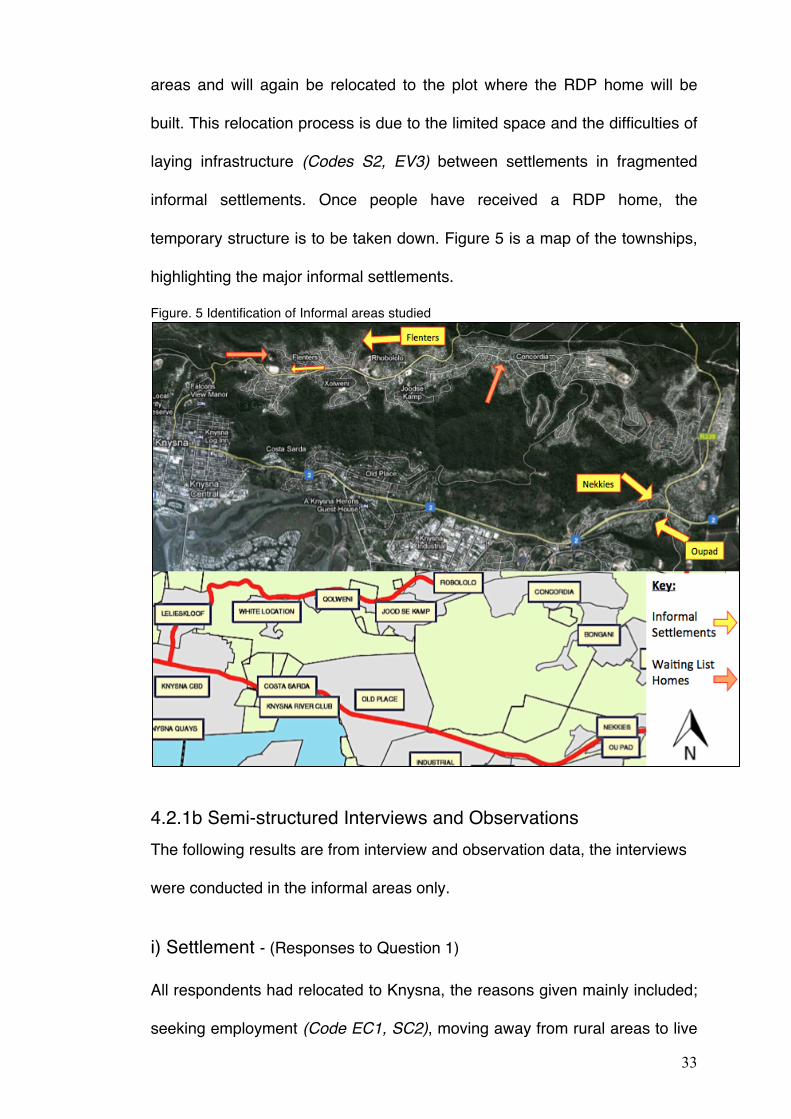
temporary structure is to be taken down. Figure 5 is a map of the townships,
highlighting the major informal settlements.
Figure. 5 Identification of Informal areas studied
4.2.1b Semi-structured Interviews and Observations The following results are from interview and observation data, the interviews
were conducted in the informal areas only.
i) Settlement - (Responses to Question 1)
All respondents had relocated to Knysna, the reasons given mainly included;
seeking employment (Code EC1, SC2), moving away from rural areas to live
34
in the cities, taken over informal dwelling (Code SC2) as their family or
friends have received RDP homes, while others simply moved to Knysna to
get away from larger cities such as Cape Town, as they felt it was too
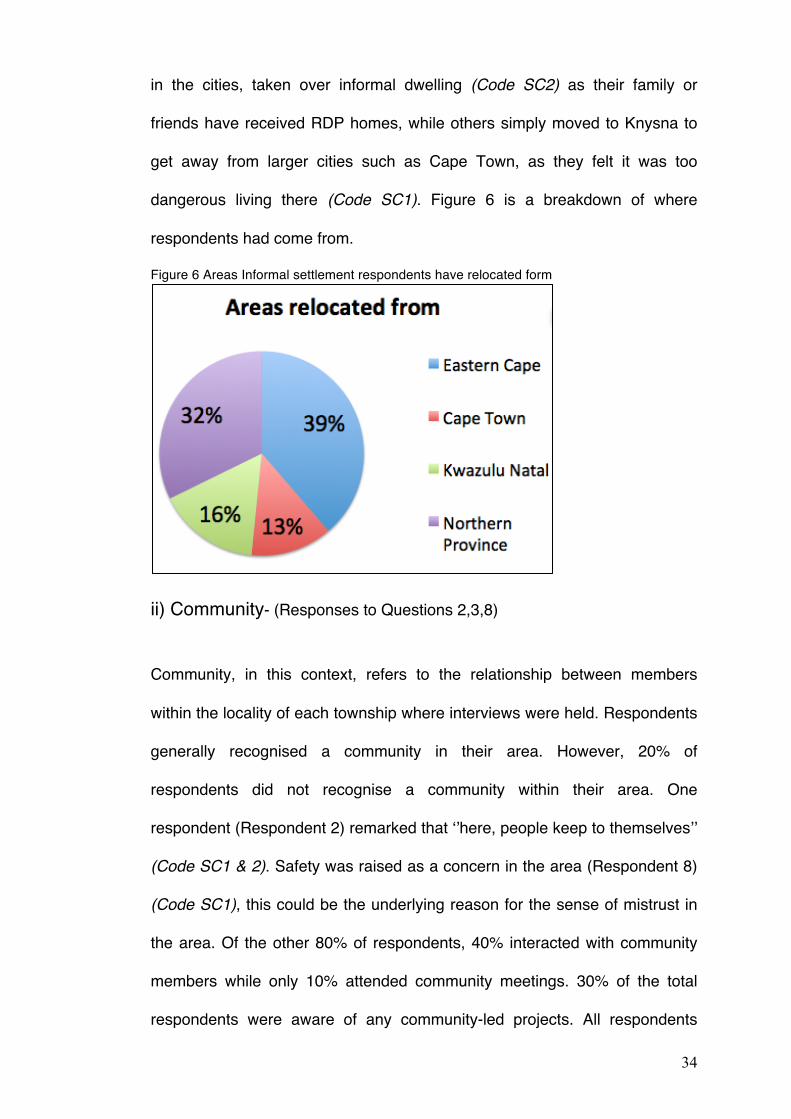
dangerous living there (Code SC1). Figure 6 is a breakdown of where
respondents had come from.
Figure 6 Areas Informal settlement respondents have relocated form
ii) Community- (Responses to Questions 2,3,8)
Community, in this context, refers to the relationship between members
within the locality of each township where interviews were held. Respondents
generally recognised a community in their area. However, 20% of
respondents did not recognise a community within their area. One
respondent (Respondent 2) remarked that ‘’here, people keep to themselves’’
(Code SC1 & 2). Safety was raised as a concern in the area (Respondent 8)
(Code SC1), this could be the underlying reason for the sense of mistrust in
the area. Of the other 80% of respondents, 40% interacted with community
members while only 10% attended community meetings. 30% of the total
respondents were aware of any community-led projects. All respondents
35
were aware of meetings held by the municipality, however there were marked
tensions by respondents:
Respondent 1, “They don't listen to us they, come and tell us what they are doing''
Respondent 4, “They just talk''
Respondent 10, ”People argue about service delivery”
Respondent 15, ”They don’t listen”
iii) Economic status- (Responses to Questions 9-14)
As 50% of all respondents were unemployed, as discussed, this might not be
a true representation of employment statistics due to the times of interviews.
However, employed respondents had jobs which were shift based and they
either had a day off or were working on the weekend. The main sources of
commuting transport used were identified as taxis (46.7%), lift shares
(26.7%) or by foot (26.7 %). Buses were present, however, these were for
school pupils only. 80% Journey times were over 10mins and 60% of
respondents who commuted spent between R20 and R30 a day. 16,7% of
respondents had family members who were away from home, of which
27,8% received remittances.
iv) Formalisation - (Responses to Questions 15-18) Only 63% of respondents had spoken to the municipality about receiving an
RDP home. Respondents would not discuss why they had not sought out
advise on obtaining a RDP home. All participants knew people who had
received RDP homes, however, 66% of respondents did not socialise with
them anymore (Code SC2). The cost of transport is the main reason for this
as remarked by Respondent 6, ‘’travel is too expensive, she lives far away
36
now’’ (Code EC3) and Respondent 2, ‘’we only see each other at work’’(Code
SC2).
v) Environment - (Responses to Questions 20 & 21)
Access to green space in the questionnaire was referred to as parkland or
‘natural’ areas. 80% of respondents had no access to (Code EV2) such
areas. Furthermore, they felt that the environment where they were living was
unsanitary and one respondent (Respondent 10) commented that “it’s not
healthy to live like this’’ (Code EV3, SC1).
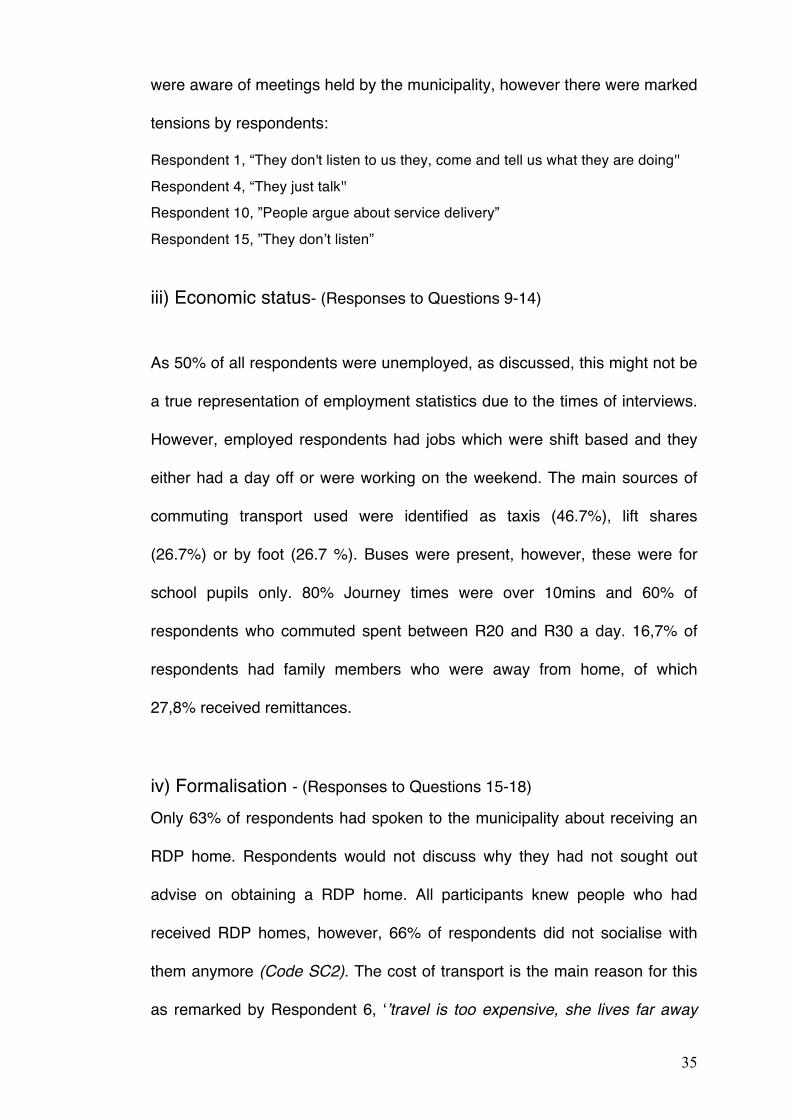
4.2.2 Formal Areas 4.2.2a Evolution of design The earlier designs were wooden (Plate 3); they had a garden and included a
water and electricity meter. Many tenants bypassed these meters creating a
shift to a prepaid electricity meter. Water is not generally metered or charged
and each household is given a 6Kl/ per month subsidy.
Plate 4. Wooden RDP homes
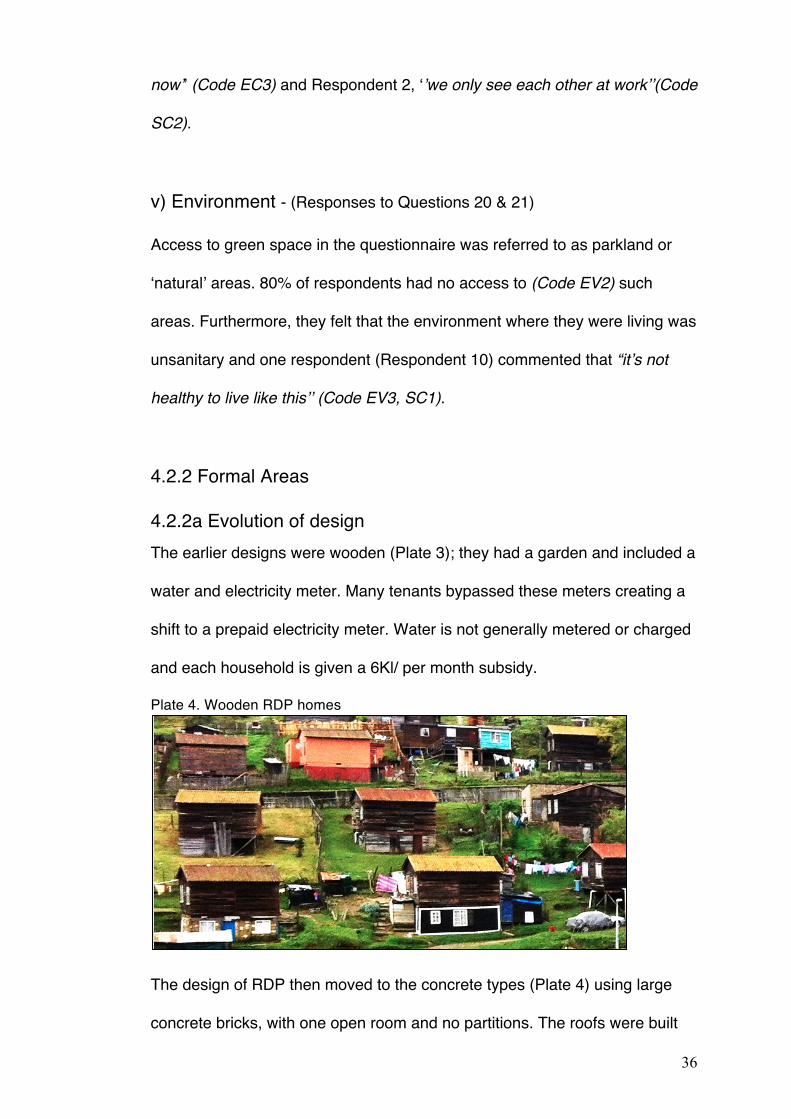
The design of RDP then moved to the concrete types (Plate 4) using large
concrete bricks, with one open room and no partitions. The roofs were built
37
from asbestos and without gutters (Code SC1) and “gutters must be installed
by the tenants”, (Head of IHS) (Code EC4). In most cases access (steps or
walkway) to the property is not provided, nor is any storm drainage from the
site (Code EV3); the tenant must also install these (Code EC4). The
construction of these structures was tendered out to the lowest bidder, as the
focus of policy was to deliver quantity. Subsequently, as a result of the use of
cheap materials, many of these types of RDP homes are in disrepair, the
cost of which falls to the tenant. Respondents pointed out structural damage
due to vibration from construction vehicles.
Plate 5. First Concrete RDP Design
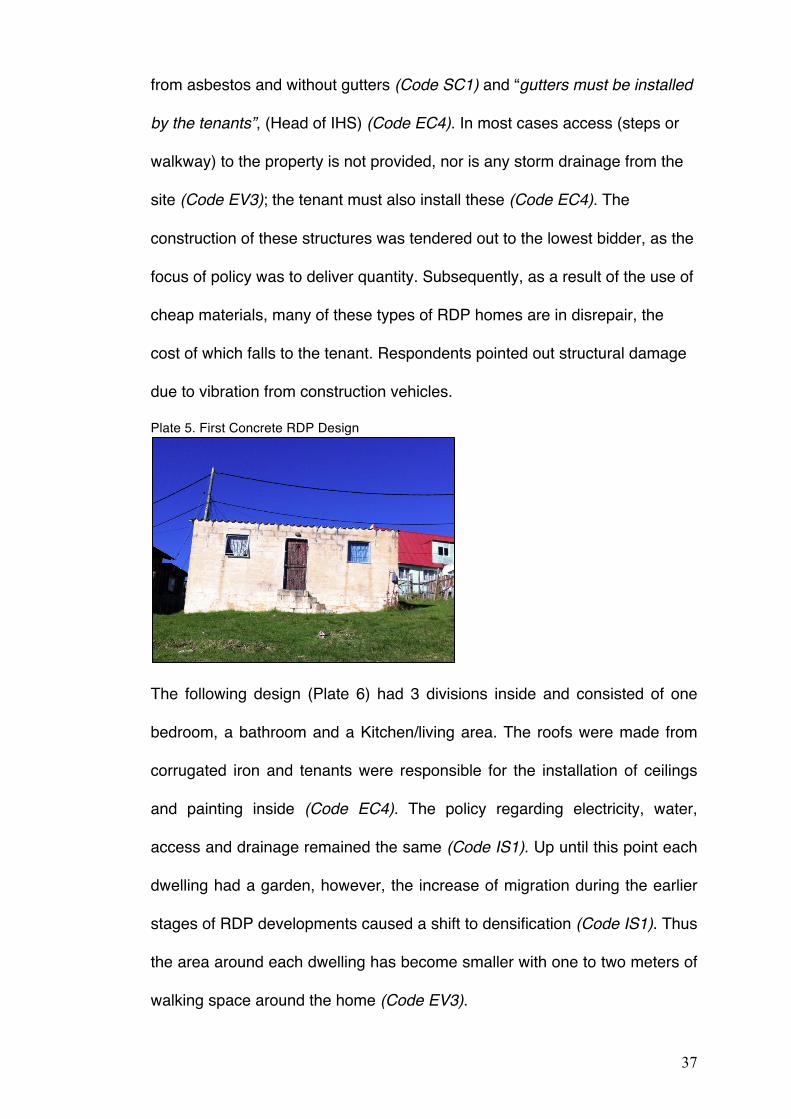
The following design (Plate 6) had 3 divisions inside and consisted of one
bedroom, a bathroom and a Kitchen/living area. The roofs were made from
corrugated iron and tenants were responsible for the installation of ceilings
and painting inside (Code EC4). The policy regarding electricity, water,
access and drainage remained the same (Code IS1). Up until this point each
dwelling had a garden, however, the increase of migration during the earlier
stages of RDP developments caused a shift to densification (Code IS1). Thus
the area around each dwelling has become smaller with one to two meters of
walking space around the home (Code EV3).
38
Plate 6. Second Concrete RDP Design
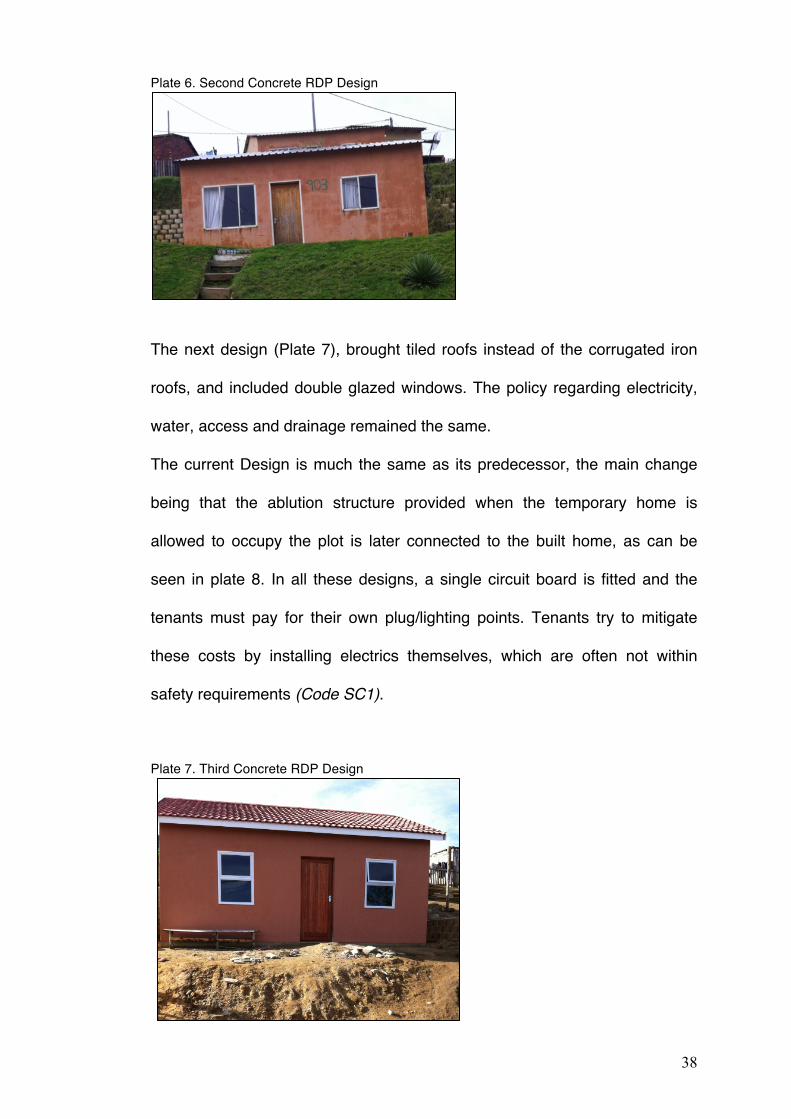
The next design (Plate 7), brought tiled roofs instead of the corrugated iron
roofs, and included double glazed windows. The policy regarding electricity,
water, access and drainage remained the same.
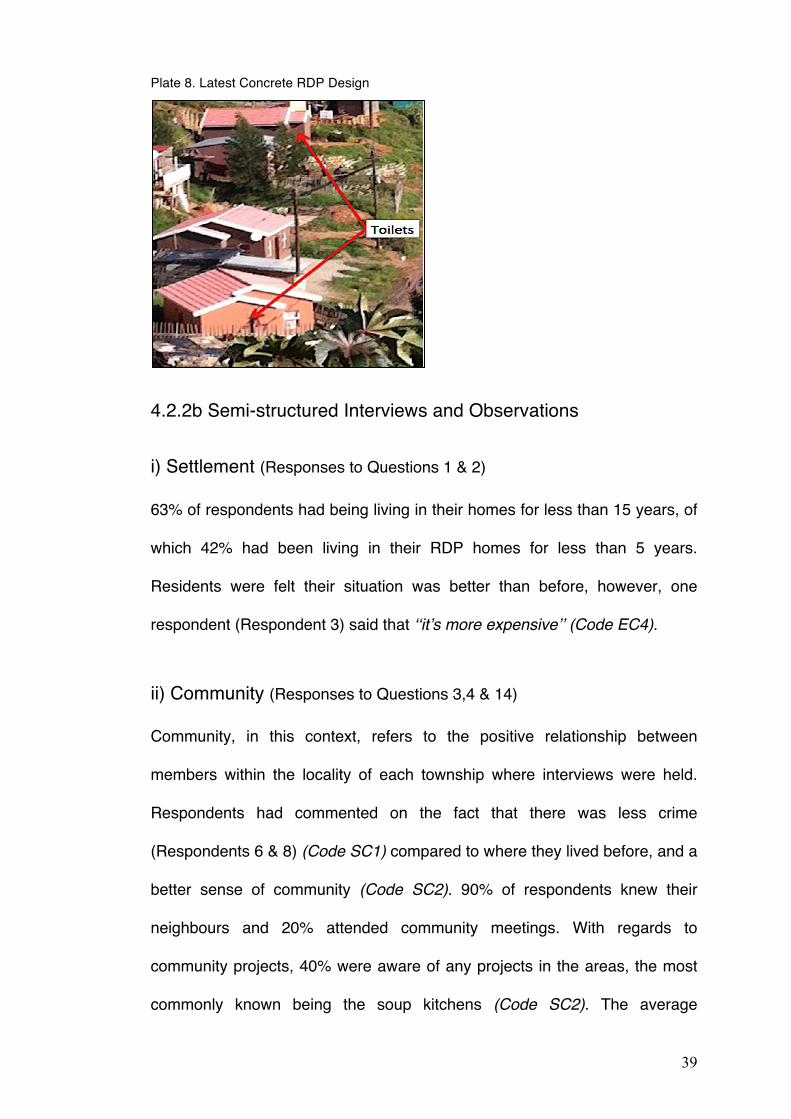
The current Design is much the same as its predecessor, the main change
being that the ablution structure provided when the temporary home is
allowed to occupy the plot is later connected to the built home, as can be
seen in plate 8. In all these designs, a single circuit board is fitted and the
tenants must pay for their own plug/lighting points. Tenants try to mitigate
these costs by installing electrics themselves, which are often not within
safety requirements (Code SC1).
Plate 7. Third Concrete RDP Design
39
Plate 8. Latest Concrete RDP Design
4.2.2b Semi-structured Interviews and Observations
i) Settlement (Responses to Questions 1 & 2)
63% of respondents had being living in their homes for less than 15 years, of
which 42% had been living in their RDP homes for less than 5 years.
Residents were felt their situation was better than before, however, one
respondent (Respondent 3) said that ‘‘it’s more expensive’’ (Code EC4).
ii) Community (Responses to Questions 3,4 & 14)
Community, in this context, refers to the positive relationship between
members within the locality of each township where interviews were held.
Respondents had commented on the fact that there was less crime
(Respondents 6 & 8) (Code SC1) compared to where they lived before, and a
better sense of community (Code SC2). 90% of respondents knew their
neighbours and 20% attended community meetings. With regards to
community projects, 40% were aware of any projects in the areas, the most
commonly known being the soup kitchens (Code SC2). The average
40
household size in the RDP homes was 5 people, with largest being 8
persons.
iii) Economic status (Responses to Questions 5-8)
46,6% of the people interviewed were employed, and 16,6% were retired.
The transportation costs were between R15 - R18 a day for 50% of
respondents. Residents of homes had pre-paid electricity metres which they
needed to top up, 56% of residents paid over R20 per week for electricity.
The majority, 86.6%, of respondents had family away from home, of which
32% were receiving remittances.
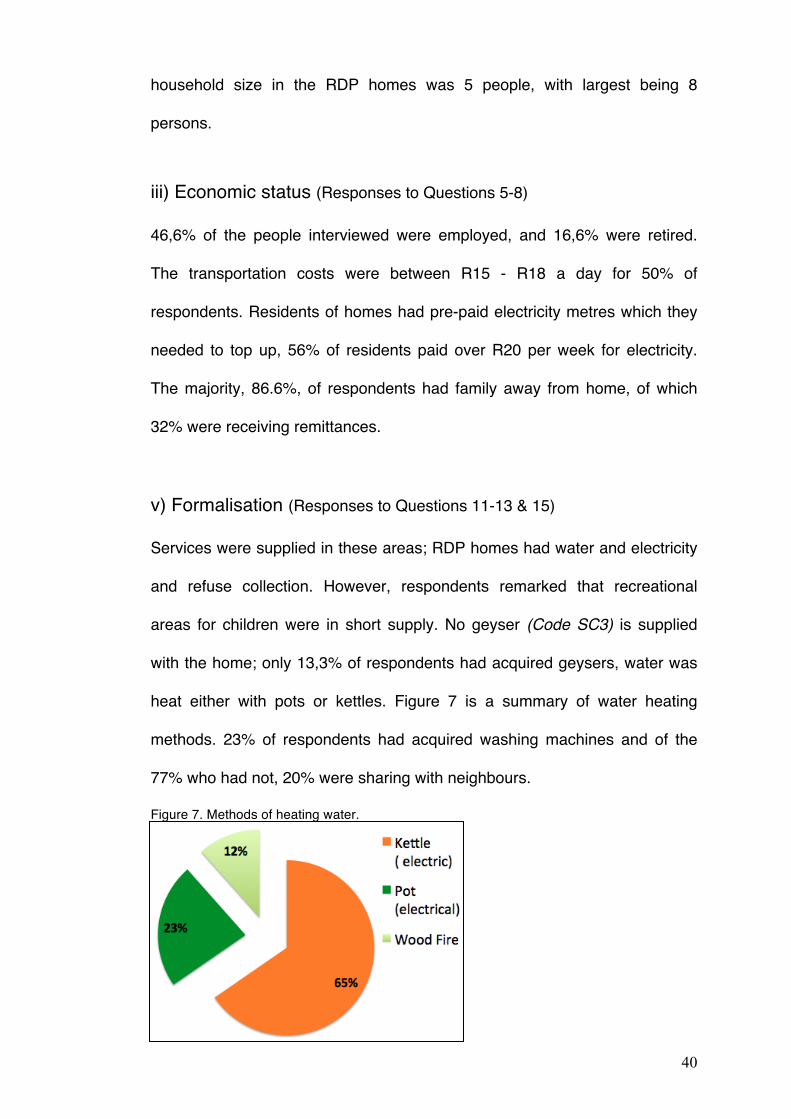
v) Formalisation (Responses to Questions 11-13 & 15)
Services were supplied in these areas; RDP homes had water and electricity
and refuse collection. However, respondents remarked that recreational
areas for children were in short supply. No geyser (Code SC3) is supplied
with the home; only 13,3% of respondents had acquired geysers, water was
heat either with pots or kettles. Figure 7 is a summary of water heating
methods. 23% of respondents had acquired washing machines and of the
77% who had not, 20% were sharing with neighbours.
Figure 7. Methods of heating water.
41
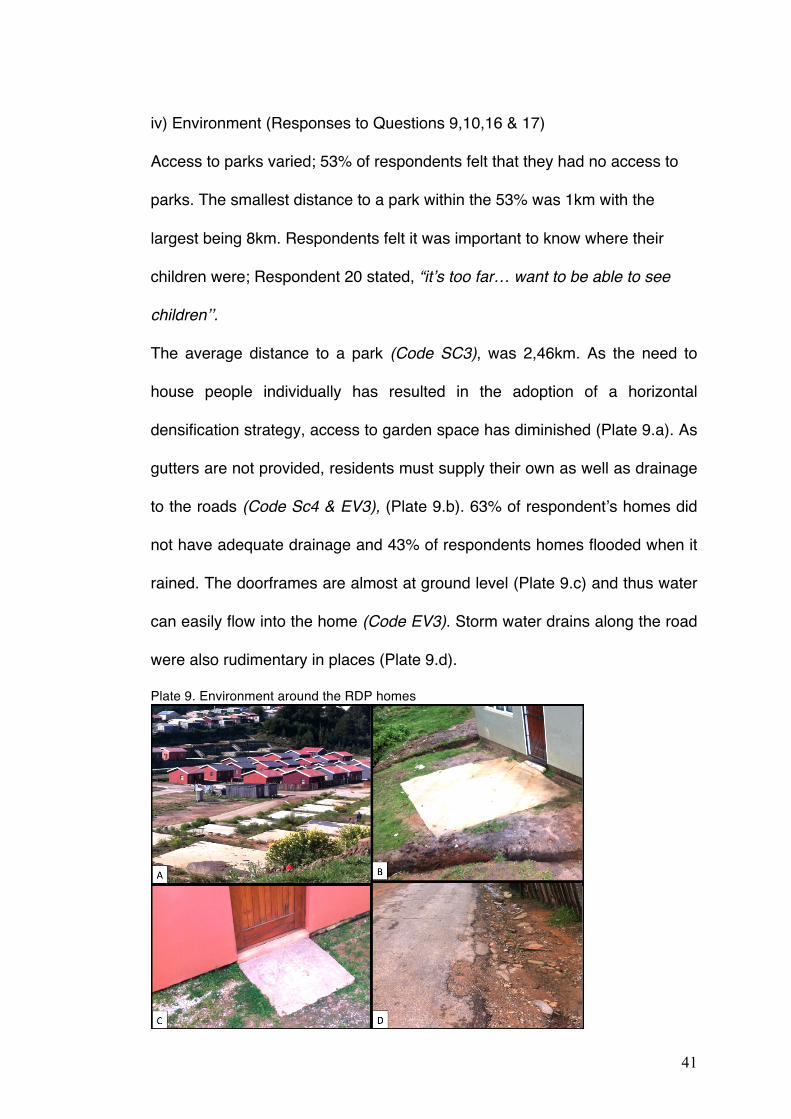
iv) Environment (Responses to Questions 9,10,16 & 17)
Access to parks varied; 53% of respondents felt that they had no access to
parks. The smallest distance to a park within the 53% was 1km with the
largest being 8km. Respondents felt it was important to know where their
children were; Respondent 20 stated, “it’s too far… want to be able to see
children’’.
The average distance to a park (Code SC3), was 2,46km. As the need to
house people individually has resulted in the adoption of a horizontal
densification strategy, access to garden space has diminished (Plate 9.a). As
gutters are not provided, residents must supply their own as well as drainage
to the roads (Code Sc4 & EV3), (Plate 9.b). 63% of respondent’s homes did
not have adequate drainage and 43% of respondents homes flooded when it
rained. The doorframes are almost at ground level (Plate 9.c) and thus water
can easily flow into the home (Code EV3). Storm water drains along the road
were also rudimentary in places (Plate 9.d).
Plate 9. Environment around the RDP homes
42
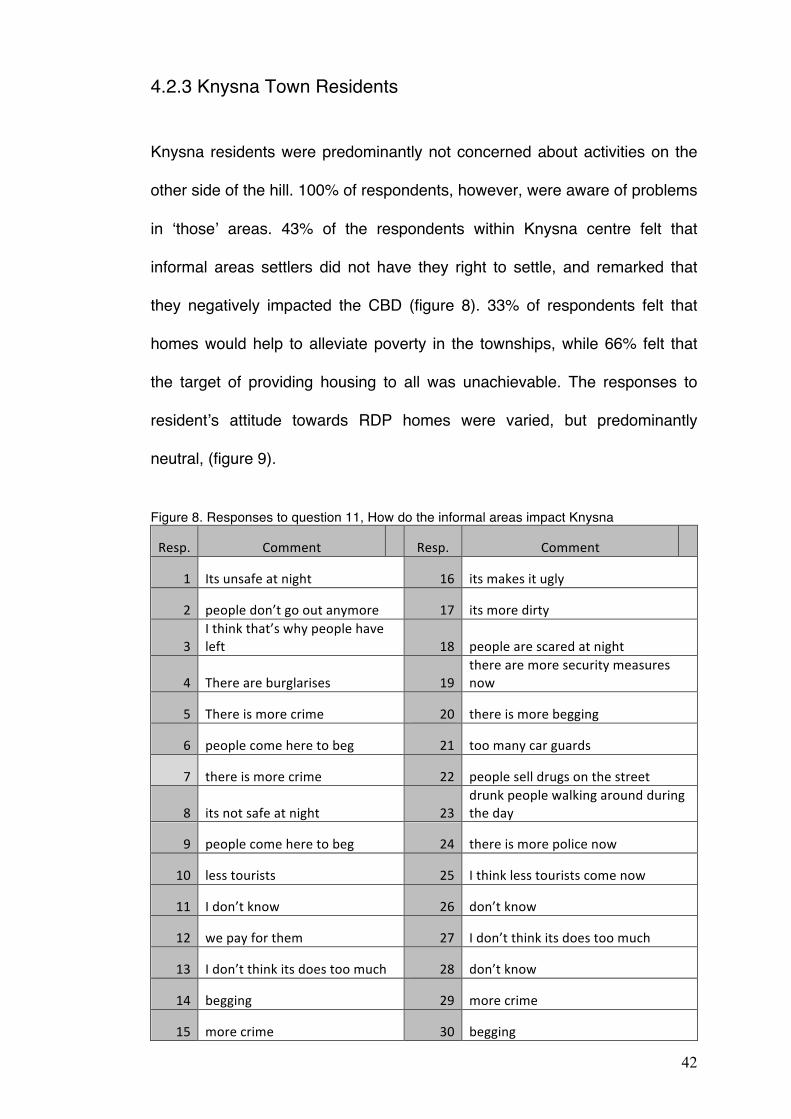
4.2.3 Knysna Town Residents
Knysna residents were predominantly not concerned about activities on the
other side of the hill. 100% of respondents, however, were aware of problems
in ‘those’ areas. 43% of the respondents within Knysna centre felt that
informal areas settlers did not have they right to settle, and remarked that
they negatively impacted the CBD (figure 8). 33% of respondents felt that
homes would help to alleviate poverty in the townships, while 66% felt that
the target of providing housing to all was unachievable. The responses to
resident’s attitude towards RDP homes were varied, but predominantly
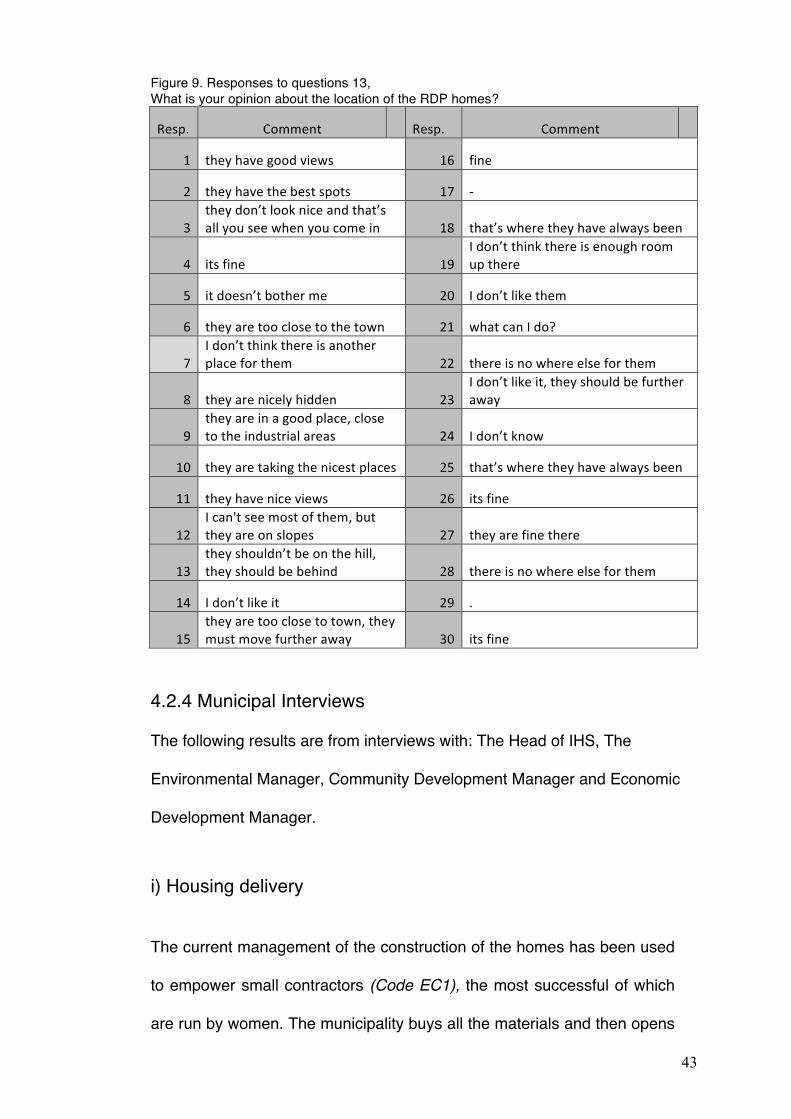
neutral, (figure 9).
Figure 8. Responses to question 11, How do the informal areas impact Knysna
Resp. Comment Resp. Comment
1 Its unsafe at night 16 its makes it ugly
2 people don’t go out anymore 17 its more dirty
3 I think that’s why people have left 18 people are scared at night
4 There are burglarises 19 there are more security measures now
5 There is more crime 20 there is more begging
6 people come here to beg 21 too many car guards
7 there is more crime 22 people sell drugs on the street
8 its not safe at night 23 drunk people walking around during the day
9 people come here to beg 24 there is more police now
10 less tourists 25 I think less tourists come now
11 I don’t know 26 don’t know
12 we pay for them 27 I don’t think its does too much
13 I don’t think its does too much 28 don’t know
14 begging 29 more crime
15 more crime 30 begging
43
Figure 9. Responses to questions 13, What is your opinion about the location of the RDP homes?
Resp. Comment Resp. Comment
1 they have good views 16 fine
2 they have the best spots 17 -‐
3 they don’t look nice and that’s all you see when you come in 18 that’s where they have always been
4 its fine 19 I don’t think there is enough room up there
5 it doesn’t bother me 20 I don’t like them
6 they are too close to the town 21 what can I do?
7 I don’t think there is another place for them 22 there is no where else for them
8 they are nicely hidden 23 I don’t like it, they should be further away
9 they are in a good place, close to the industrial areas 24 I don’t know
10 they are taking the nicest places 25 that’s where they have always been
11 they have nice views 26 its fine
12 I can't see most of them, but they are on slopes 27 they are fine there
13 they shouldn’t be on the hill, they should be behind 28 there is no where else for them
14 I don’t like it 29 .
15 they are too close to town, they must move further away 30 its fine
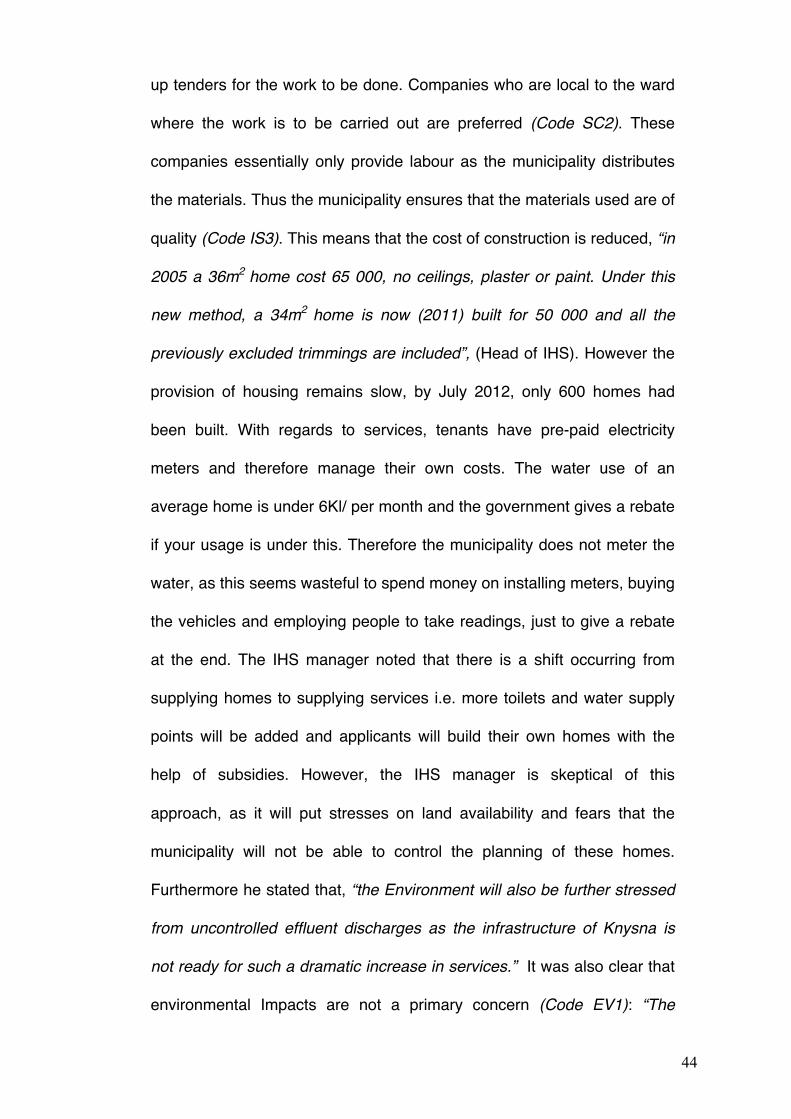
4.2.4 Municipal Interviews The following results are from interviews with: The Head of IHS, The
Environmental Manager, Community Development Manager and Economic
Development Manager.
i) Housing delivery
The current management of the construction of the homes has been used
to empower small contractors (Code EC1), the most successful of which
are run by women. The municipality buys all the materials and then opens
44
up tenders for the work to be done. Companies who are local to the ward
where the work is to be carried out are preferred (Code SC2). These
companies essentially only provide labour as the municipality distributes
the materials. Thus the municipality ensures that the materials used are of
quality (Code IS3). This means that the cost of construction is reduced, “in
2005 a 36m2 home cost 65 000, no ceilings, plaster or paint. Under this
new method, a 34m2 home is now (2011) built for 50 000 and all the
previously excluded trimmings are included”, (Head of IHS). However the
provision of housing remains slow, by July 2012, only 600 homes had
been built. With regards to services, tenants have pre-paid electricity
meters and therefore manage their own costs. The water use of an
average home is under 6Kl/ per month and the government gives a rebate
if your usage is under this. Therefore the municipality does not meter the
water, as this seems wasteful to spend money on installing meters, buying
the vehicles and employing people to take readings, just to give a rebate
at the end. The IHS manager noted that there is a shift occurring from
supplying homes to supplying services i.e. more toilets and water supply
points will be added and applicants will build their own homes with the
help of subsidies. However, the IHS manager is skeptical of this
approach, as it will put stresses on land availability and fears that the
municipality will not be able to control the planning of these homes.
Furthermore he stated that, “the Environment will also be further stressed
from uncontrolled effluent discharges as the infrastructure of Knysna is
not ready for such a dramatic increase in services.” It was also clear that
environmental Impacts are not a primary concern (Code EV1): “The
45
Priority for the municipality is building homes, not environmental impacts.’’
Environmental impact assessments (EIA) prolong the building process
and are therefore not conducted prior to the construction phase, but rather
after. EIA’s are also costly and must be paid for from the housing budget.
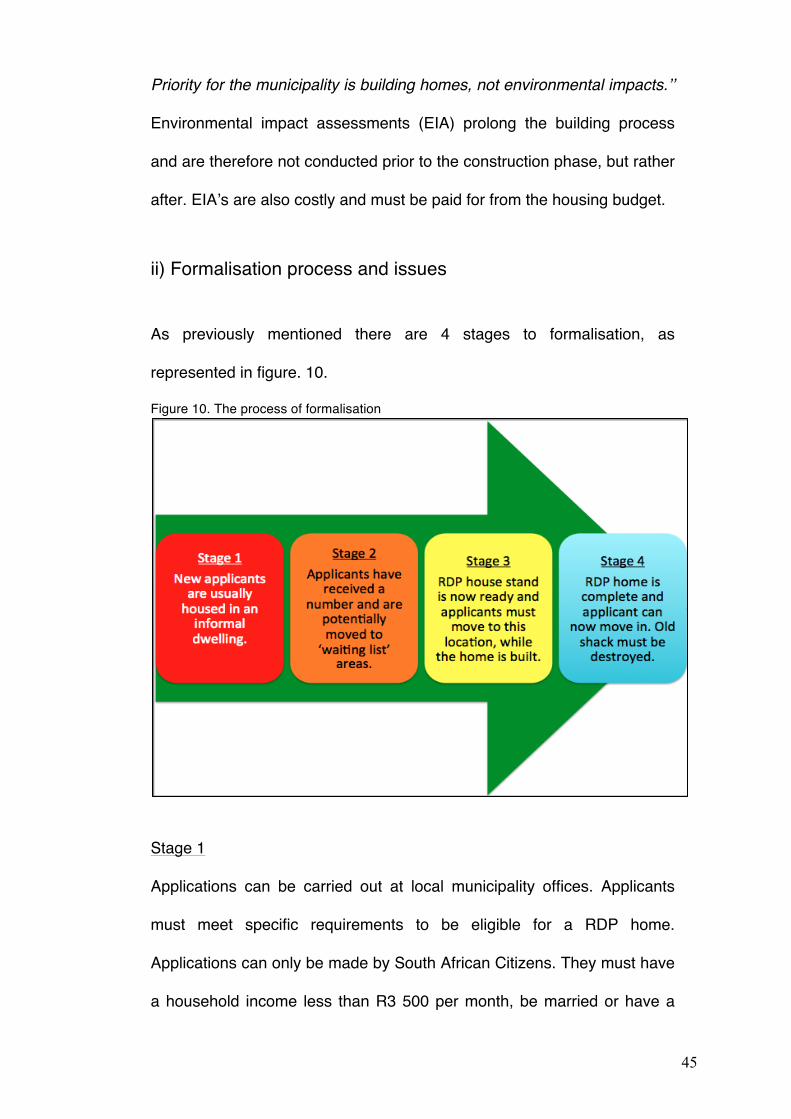
ii) Formalisation process and issues
As previously mentioned there are 4 stages to formalisation, as
represented in figure. 10.
Figure 10. The process of formalisation
Stage 1
Applications can be carried out at local municipality offices. Applicants
must meet specific requirements to be eligible for a RDP home.
Applications can only be made by South African Citizens. They must have
a household income less than R3 500 per month, be married or have a
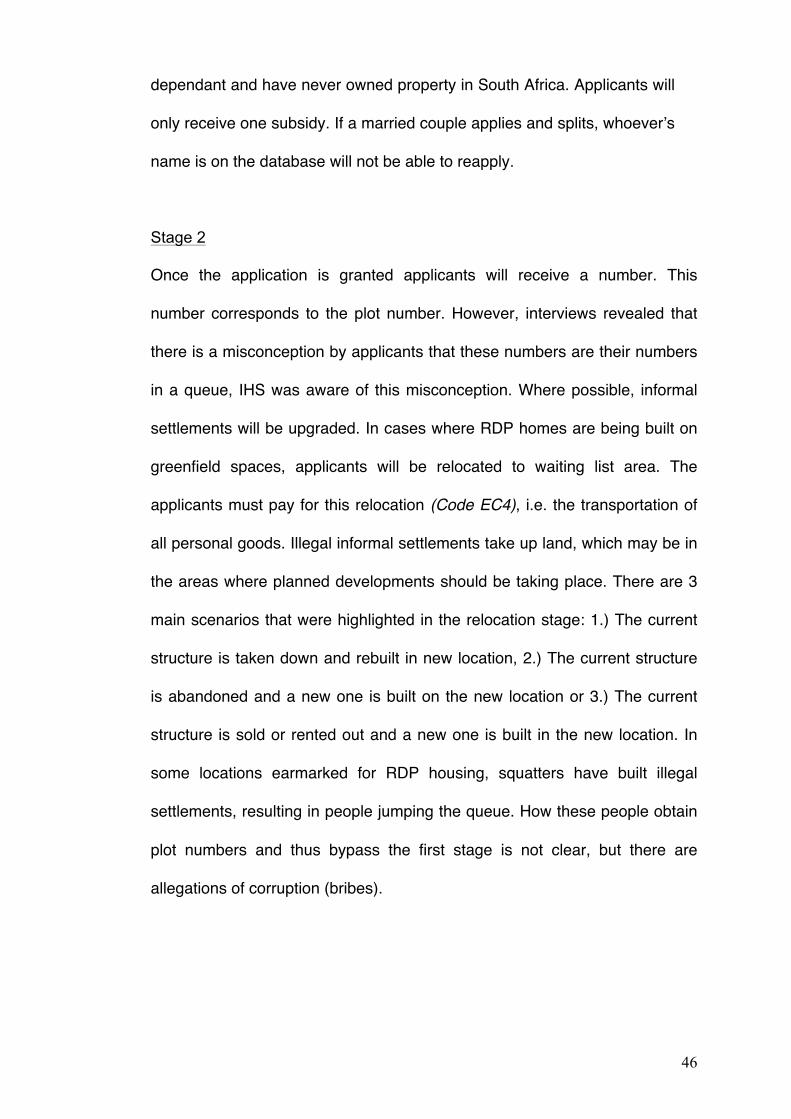
46
dependant and have never owned property in South Africa. Applicants will
only receive one subsidy. If a married couple applies and splits, whoever’s
name is on the database will not be able to reapply.
Stage 2
Once the application is granted applicants will receive a number. This
number corresponds to the plot number. However, interviews revealed that
there is a misconception by applicants that these numbers are their numbers
in a queue, IHS was aware of this misconception. Where possible, informal
settlements will be upgraded. In cases where RDP homes are being built on
greenfield spaces, applicants will be relocated to waiting list area. The
applicants must pay for this relocation (Code EC4), i.e. the transportation of
all personal goods. Illegal informal settlements take up land, which may be in
the areas where planned developments should be taking place. There are 3
main scenarios that were highlighted in the relocation stage: 1.) The current
structure is taken down and rebuilt in new location, 2.) The current structure
is abandoned and a new one is built on the new location or 3.) The current
structure is sold or rented out and a new one is built in the new location. In
some locations earmarked for RDP housing, squatters have built illegal
settlements, resulting in people jumping the queue. How these people obtain
plot numbers and thus bypass the first stage is not clear, but there are
allegations of corruption (bribes).
47
Stage 3
The RDP home foundation and infrastructure has been laid and is now ready
for building of the new RDP home to commence. Applicants must move to
this location, build another temporary structure to live in on-site, while the
permanent structure is built.
The settlement of squatters in these areas does happen but applicants chase
them out; IHS noted that it is up to the community to stop this from
happening.
Stage 4
The RDP home is complete and after an inspection, the keys are handed to
the applicant who can now move in. Their old shack must be destroyed,
however, this is not done by the municipality. The informal dwelling in some
cases is rented out or used as and extension to the RDP home. Permits are
required to carry out extensions but there seems to be little enforcement of
this.
Besides the formalisation process, there are external factors which effect
housing delivery. IHS highlighted the main 4 factors:
• 1) Topography; available land is steep and needs to be reinforced in
order to be useable.
• 2) Land availability; the informal homes are very tightly bunched and
there is very little free land, available space is also claimed by
squatters. When developing proper homes, roads and infrastructure,
48
the land becomes even scarcer. IHS is looking at increasing density
by building flats and duplex’s.
• 3) Acceptance of density; culturally, inhabitants want to be close to the
earth (linkages to ancestors) thus, living in apartments is not accepted
yet. The settlement of Oupad will be the first trial of the density
approach, however, it has required numerous meetings with the
community to get them to agree to this type of development.
• 4) Delivery of infrastructure; the provision of infrastructure such as
water, drainage and waste is outsourced to a local firm. They
commented that one major difficulty of providing infrastructure was the
availability of solid ground. In some cases, workers trying to install
pipes would dig into many long drops before finding suitable ground to
lay services.
iii) Community participation IHS has its own department that deals with community participation. There
are 3 levels of community involvement; at the first level, communities elect
representatives to lobby for certain issues (safety, sanitation, transport etc.).
At the second level, these representatives meet with Ward leaders. The ward
leaders are employed by the municipality but are voted in by the
communities. All communication between the community and the municipality
must go through the ward representative. At the third level, the municipality
49
holds meetings with the community at the community hall. Each ward has a
community hall and these meetings are held once or twice a month.
iv) Environmental impacts EIAs are rarely carried out, and the head of environmental management
commented on the fact that social concerns are given preference. It was also
noted that the run-off from the township areas was having serious effects on
the estuary (Code EV1); the main pollutants recorded were phosphates,
nitrates and heavy metals. It was also highlighted that E-coli counts in the
estuary were increasing due to the run-off from long-drop toilets.
Storm water is said to be kept separate from the sewage and is not treated,
with the storm water run-off being directed directly into the estuary, thus
being the entry path of surface pollutants (Code EV1). However, water from
Knysna home gutters are directed to the sewage plant. Sewage works
operatives explained how the sewage plant was currently being upgraded as
the increase of homes has caused overflow problems in the past. The
sewage plant is less than 100m from the estuary, and during one flooding
event, the sewage works was overloaded and there was a large effluent
discharge into the estuary.
There has also been an increase in silt deposition in the estuary (Code EV1).
Many roads in the townships are gravel roads, and thus soil is easily
transported. In the past years, the intensity of precipitation has been
increasing, resulting in major flooding in Knysna (Code EV1).
Droughts in Knysna have also been recorded over the past few years. Since
the increased development in the area, the water storage had not been
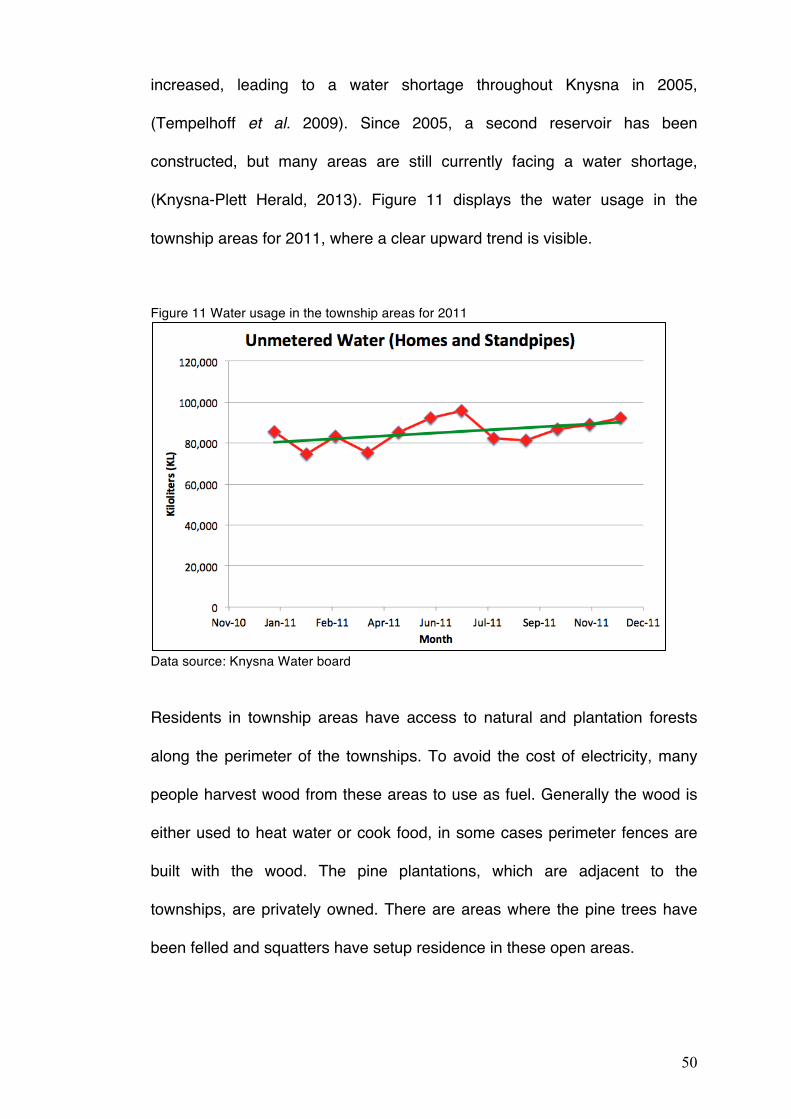
50
increased, leading to a water shortage throughout Knysna in 2005,
(Tempelhoff et al. 2009). Since 2005, a second reservoir has been
constructed, but many areas are still currently facing a water shortage,
(Knysna-Plett Herald, 2013). Figure 11 displays the water usage in the
township areas for 2011, where a clear upward trend is visible.
Figure 11 Water usage in the township areas for 2011
Data source: Knysna Water board
Residents in township areas have access to natural and plantation forests
along the perimeter of the townships. To avoid the cost of electricity, many
people harvest wood from these areas to use as fuel. Generally the wood is
either used to heat water or cook food, in some cases perimeter fences are
built with the wood. The pine plantations, which are adjacent to the
townships, are privately owned. There are areas where the pine trees have
been felled and squatters have setup residence in these open areas.
51
4.3 Policy findings
i.) Prevention of Illegal Eviction from and Unlawful Occupation of Land Act 1998 This document outlines the rights of those unlawfully occupying land and the
procedures that need to be followed to evict them. The premise being that
one may not be evicted without a court order. The head of IHS noted that this
policy works against the housing development as squatters arrive in groups
and build homes within 24hrs. To remove the settlers, a charge of illegal
settlement must be brought against them and only when/if the court order is
issued, may they be forced to vacate. This results in land being occupied and
development being retarded. Furthermore, in the interim these settlers can
apply for housing.
ii) National Environmental Management Act (107 of 1998) (NEMA) This documents outlines principles, which provide guidance for environmental
decision-making. It legislates procedures, administration and enforcement of
environmental management laws. However, section 24 in this document
allows for EIAs to be carried out after development. The EIA may either be
approved or the applicant will be liable to pay for the rehabilitation. It is
argued that this opens the doors for exploitation, (Environmental Manager,
2012: September, 2012).
iii) Breaking New Ground 2004 (BNG)
This document emphasises the building of more sustainable homes and
offers different housing/subsidy configurations to address delivery problems.
52
iv) Municipal Systems Act (No. 32 of 2000) This Act requires all local municipalities to develop their own Integrated
Development Plan (IDP), covering the short, medium and long term action
plan.
v) Sustainable Human Settlement Strategy (2008-2013) This document is part of Knysna’s IDP, highlighting the current housing
delivery challenges and the need for upgrading infrastructure. It also
proposes acquiring new land parcels to develop new housing areas. It further
highlights a ‘Gap’ Market − this demographic consists of individuals who have
a household income above R3500 but less than R10 000, and therefore
cannot receive a RDP home or subsidy. Thus ‘starter’ homes will also be
developed.
53
Chapter 5. Discussion
The RDP housing project in its current form is delivering homes as quickly as
possible, however there are definite development issues, which we will
explore in this discussion.
5.1 The Environment
The environment has taken a back seat in this process and the impacts,
which seem localised and contained within the township communities, may
have detrimental future ramifications for Knysna as a whole. It emerged in
the study, that no EIA’s are carried out before development takes place and
that the environmental impacts are not a concern of the municipality.
However, Knysna relies on its environment for the income from tourism,
visitors either come for the scenic beauty, the water sports or outdoors
activities. The Knysna estuary is the largest on the south coast of South
Africa and in terms of bio-diversity, it has the highest plant and animal
diversity out of all the estuaries in South Africa, (Allanson, 1995). It is also
home to the endangered Knysna seahorse (Hippocampus capensis), (IUCN,
2012). The region experiences rainfall with an average of 715-1400 mm per
year, (Knysna.org, 2013), with a trend of increasing intensity of rainfall and
flooding, (Sen Roy and Rouault, 2013). As township residents clear areas of
forest, either for fuel or to accommodate a dwelling, the run-off rate is being
further increased, further increasing pollutant counts and sedimentation in the
estuary, as confirmed by the head of environmental management. Failure to
address these issues could result in the damage or loss of the estuarine
environment, which in turn may result in the loss of tourist arrivals and thus
54
negatively impact the local income streams. The increased run-off also poses
a threat to the communities within the townships, they are not provided with
adequate storm water drainage around homes, which results in their homes
and assets being damaged. Not only does this burden residents with the cost
of repairs, but also voids any investment they have made. Thus the provision
of infrastructure in terms of storm water drainage and sanitation should be
the highest of priorities.
5.2 Economic Development
The municipality has creatively approached the quality management of the
RDP homes. By assuming the role of supplying the materials for the home,
they have managed to secure low costs as materials are bought in bulk from
a single supplier. This also ensures that all homes built are to the same
standard. This has not been the case in other municipalities and has resulted
in inferior building materials and thus unstable homes, which has resulted in
R400 million being spent on repairs, (Sowetan, 2012). This also helps to
eliminate fraudulent activities which have plagued the RDP programme in the
past, (Mackay, 1996). There is some evidence to suggest that income
streams are being developed; township tourism is widely promoted by the
Knysna tourism department and skilled entrepreneurs can tender for
construction contracts in the townships. In some cases the old informal
structure, which tenants occupied before moving into their RDP home, has
now been rented out, thus generating another income stream.
While we can see from the interview data that the cost of travel has
decreased for those in RDP homes (Figure 12), the use of RDP homes as a
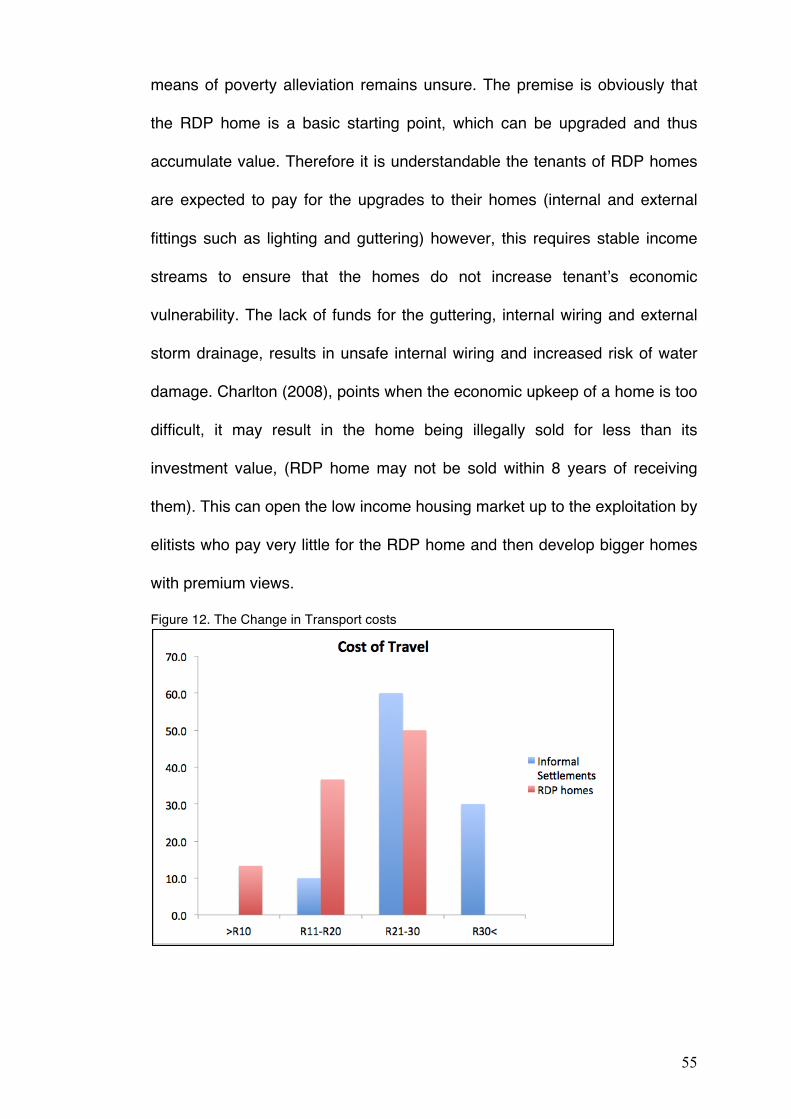
55
means of poverty alleviation remains unsure. The premise is obviously that
the RDP home is a basic starting point, which can be upgraded and thus
accumulate value. Therefore it is understandable the tenants of RDP homes
are expected to pay for the upgrades to their homes (internal and external
fittings such as lighting and guttering) however, this requires stable income
streams to ensure that the homes do not increase tenant’s economic
vulnerability. The lack of funds for the guttering, internal wiring and external
storm drainage, results in unsafe internal wiring and increased risk of water
damage. Charlton (2008), points when the economic upkeep of a home is too
difficult, it may result in the home being illegally sold for less than its
investment value, (RDP home may not be sold within 8 years of receiving
them). This can open the low income housing market up to the exploitation by
elitists who pay very little for the RDP home and then develop bigger homes
with premium views.
Figure 12. The Change in Transport costs
56
5.3 Community Development
Access to services increase with the acquisition of an RDP home, and RDP
neighbourhoods have a stronger sense of community and safety compared to
that of the informal settlements. There are also more community projects and
skills workshops in RDP areas. However, the participation of communities in
the development of the townships resembles that of tokenism as described
by Arnstein’s ladder of participation. Community members are consulted and
informed about developments with partnerships limited to contractor work.
This may be partially due to a lack of definitive leadership by community
members or limited social capital. As noted by Roseland (2000), social
capital takes time to develop. The relocation, which occurs during the
formalisation stages, continually disrupts this process. Household sizes have
increased in RDP home areas, while in the informal areas, household sizes
tended to be limited as many structures are 2/3m x 2/3m. However looking at
figure 13, we can clearly see the larger homes providing growth for families.
The development of RDP communities remains on the urban fringe and
integration into the Knysna urban area is still limited. Residents of the
townships come into Knysna during the day and leave at night, while this
does not seem to a negative occurrence, it should be noted that during the
apartheid regime non-white ethic groups were only allowed into towns during
the daytime to work and had to leave at night, this lack of integration also
represents a lack of social change. In the interviews with Knysna town
residents, it was apparent that there was an attitude of ‘us’ and ‘them’, and
they are viewed an external problem.
57
Figure 13. RDP Occupancy size
Chapter 6. Conclusions and Recommendations 6.1 Conclusions
The task of housing provision entrusted to the local municipality is not easy to
execute and the progress thus far is commendable, and as evidenced by the
evolution of the designs of RDP homes, there are frameworks in place which
monitor and evaluate the process continually. The municipality has also
adapted strategies to ensure quality, cost efficiency and standardisation of
homes. However, current eviction polices and the resulting changes in land
availability remain a barrier to securing efficient planning and control of these
developments. The rapid expansion of these developments has also strained
resources; waste management systems capacities are not upgraded in
tandem with the developments resulting in the developments being outside of
the absorptive capacity of the current system, water and electricity demands
outstrip the supply and deforestation is not managed.
58
By definition, sustainable development is about planning for the long-term.
However, in the development of RDP housing, the focus has been on rapid
provision of housing in the shortest time frame without sufficient
consideration or planning for the long-term environmental impacts. The land
cover change in the upper hillsides have not taken into account the increased
storm water run-off and has thus potentially increased Knysna’s vulnerability
to extreme events, both in the townships and lower down in the town centre.
Furthermore, the continued impacts on the estuary would not only be
detrimental to the biodiversity of the area, but could result in negative
economic repercussions of the decrease in tourism and real estate
investment.
While increased numbers of homes are being provided and thus giving
people access to a better quality of life, sustainable income streams for
people living in the townships are not evidently developed. Township tourism
has been widely promoted in the townships, but only a small proportion of
people benefit from this. With the current population exceeding the amount of
available jobs, the maintenance of homes and livelihoods will not be
sustainable, thus the goal of alleviating poverty is not likely to be achieved.
Where RDP homes have existed for a longer period, there are more cohesive
communities, as evidenced by the presence of community projects and
residential interaction. Homes are looked after, gardens maintained and
schools are being built. However, there is a general desire for community
parks and accessible placements of green spaces.
59
6.2 Recommendations
If the high demand of service is to be met, a more sustainable approach to
infrastructure will need to be adopted. Providing RDP homes with solar power
would lessen the load on current electric infrastructure, if this was to be
coupled with a feed-in tariff it could further help develop income streams for
home owners.
The development of a town centre within the townships could help further
develop community and self-governance through active participation.
Through further authentic community participation, residents could be
empowered to shape their own neighborhoods and increase a sense of place
and ownership. Furthermore, retail space in the townships could minimise the
travelling cost for many people as well as provide employment.
The requirements for EIAs before any development is to take place should
be reviewed, specifically, the NEMA policy Section 24, would increase
environmental impact management plans. As sustainable development
requires a balance of the economic, environmental and social factors, a more
integral approach needs to be developed and adopted, where the
development of one factor in done in unison with the other two.
60
References:
Alexander, P., 2010. Rebellion of the poor: South Africa’s service delivery protests – a preliminary analysis. Review of African Political Economy, 37(123), pp.25–40.
Allanson, B., 1995. Knysna Basin Project South Africa - Knysna Lagoon Estuary, Garden Route, Western Cape, South Africa. Available at: http://www.knysnabasinproject.co.za/ (Accessed April 22, 2013).
Arnstein, S.R., 1969. A Ladder Of Citizen Participation. Journal of the American Institute of Planners, 35(4), pp.216–224.
Barnham, C., 2012. Separating methodologies? International Journal of Market Research, 54(6), pp.736–738.
Bassuk, J., 2013. Cost of Inequality, Oxfam. Available at: http://pdf-book-free-download.com/OXFAM-MEDIA-BRIEFING-18-January-2013, (Accessed: 28 January 2013)
Binns, T. and Nel, E., 2002. Tourism as a local development strategy in South Africa. Geographical Journal, 168(3), pp.235–247.
Cameron, R., 1996. The Reconstruction and Development Programme. Journal of Theoretical Politics, 8(2), pp.283–294.
Choguill, C.L., 1996. Ten steps to sustainable infrastructure. Habitat International, 20(3), pp.389–404.
Choguill, M.B.G., 1996. A ladder of community participation for underdeveloped countries. Habitat International, 20(3), pp.431–444.
Clifford, N., French, S. and Valentine, G., 2010. Key Methods in Geography, SAGE.
Destatte, P., 2010. Foresight: A major tool in tackling sustainable development. Technological Forecasting and Social Change, 77(9), pp.1575–1587.
Diener, E. and Suh, E., 1997. Measuring Quality Of Life: Economic, Social, And Subjective Indicators. Social Indicators Research, 40(1-2), pp.189–216.
Dillard, J., Dujon, V. and King, M.C., 2008. Understanding the Social Dimension of Sustainability, Routledge.
Glaser, B.G. and Strauss, A.L., 2009. The Discovery of Grounded Theory: Strategies for Qualitative Research, Transaction Publishers.
Guest, G.S. , MacQueen, K.M. and Namey, E.E., 2012. Applied Thematic Analysis, Sage Publications, Inc.
61
HRC, 1996. Constitution Of The Republic Of South Africa No. 108 of 1996, Available at: http://www.info.gov.za/documents/constitution/1996/a108-96.pdf [Accessed July 23, 2011].
IUCN, 2012. Hippocampus capensis (Cape Seahorse, Knysna Seahorse). Available at: http://www.iucnredlist.org/details/10056/0 [Accessed April 22, 2013].
Kitzes, J. et al., 2009. A research agenda for improving national Ecological Footprint accounts. Ecological Economics, 68(7), pp.1991–2007.
Knysna Municipality, 2013. Knysna Annual Report 2011/12. Available at: http://www.knysna.gov.za/wp-content/uploads/2013/02/Final-for-council-Knysna_AR_11_12-230112-lw.pdf [Accessed April 23, 2013].
Knysna-Plett Herald, 2013. Knysna-Plett Herald | No water in some areas. Available at: http://www.knysnaplettherald.com/news.aspx?id=44973&h=No-water-in-some-areas [Accessed April 23, 2013].
Knysna.org, 2013. Garden Route Knysna Western Cape South Africa. Available at: http://www.knysna.org/climate/ [Accessed March 30, 2013].
Kok, P.C., 2006. Migration in South And Southern Africa: Dynamics And Determinants, HSRC Press.
Lingard, L., Albert, M. and Levinson, W., 2008. Grounded theory, mixed methods, and action research. BMJ, 337(aug07 3), pp.a567–a567.
Mackay, C. j., 1996. The development of housing policy in South Africa in the post apartheid period. Housing Studies, 11(1), p.133.
Nyametso, J.K., 2012. Resettlement of Slum Dwellers, Land Tenure Security and Improved Housing, Living and Environmental Conditions at Madina Estate, Accra, Ghana. Urban Forum, 23(3), pp.343–365.
O’Malley, P., 2011. The Reconstruction and Development Programme (RDP) - The O’Malley Archives. Available at: http://www.nelsonmandela.org/omalley/index.php/site/q/03lv02039/04lv02103/05lv02120/06lv02126.htm [Accessed March 21, 2013].
Parliament, 2010. Politicsweb - 2,4m RDP houses built since 1994 - Minister - PARTY. Politics Web. Available at: http://www.politicsweb.co.za/politicsweb/view/politicsweb/en/page71654?oid=204713&sn=Detail&pid=71654 [Accessed March 21, 2013].
Polèse, M. and Stren, R.E., 2000. The Social Sustainability of Cities: Diversity and the Management of Change, University of Toronto Press.
62
Pugh, C., 2000. Squatter settlements: Their sustainability, architectural contributions, and socio-economic roles. Cities, 17(5), pp.325–337.
Quaddus, M.A. and Siddique, M.A.B., 2001. Modelling sustainable development planning: A multicriteria decision conferencing approach. Environment International, 27(2–3), pp.89–95.
Quigley, K.F.F., 1996. Making democracy work: Civic traditions in modern Italy: By Robert D. Putnam. Princeton, N.J.: Princeton University Press,). Orbis, 40(2), pp.333–341.
Rogerson, C.., 1999. Local economic development and urban poverty alleviation: the experience of post-apartheid South Africa. Habitat International, 23(4), pp.511–534.
Rosales, N., 2011. Towards the Modeling of Sustainability into Urban Planning: Using Indicators to Build Sustainable Cities. Procedia Engineering, 21, pp.641–647.
Roseland, M., 2000. Sustainable community development: integrating environmental, economic, and social objectives. Progress in Planning, 54(2), pp.73–132.
SAGI, 1994. White papers. South African Government information online. Available at: http://www.info.gov.za/view/DynamicAction?pageid=549&tabfield=kcYYYY&tabval=1994&sdate=&orderby=document_date_orig%20desc [Accessed March 21, 2013].
Sen Roy, S. and Rouault, M., 2013. Spatial patterns of seasonal scale trends in extreme hourly precipitation in South Africa. Applied Geography, 39, pp.151–157.
Singh, R.K. et al., 2012. An overview of sustainability assessment methodologies. Ecological Indicators, 15(1), pp.281–299.
Sowetan, 2012. More than R400m spent fixing shoddy RDP houses - Sexwale - Sowetan LIVE. Available at: http://www.sowetanlive.co.za/news/2012/05/11/more-than-r400m-spent-fixing-shoddy-rdp-houses---sexwale [Accessed April 22, 2013].
Sowetan, 2011. Sexwale outlines housing backlog challenge - Sowetan LIVE. Available at: http://www.sowetanlive.co.za/news/2011/07/21/sexwale-outlines-housing-backlog-challenge [Accessed March 21, 2013].
Tempelhoff, J. et al., 2009. The December 2004-January 2005 floods in the Garden Route region of the Southern Cape, South Africa. Jàmbá: Journal of Disaster Risk Studies, 2(2). Available at: http://www.jamba.org.za/index.php/jamba/article/view/18 [Accessed April 23, 2013].
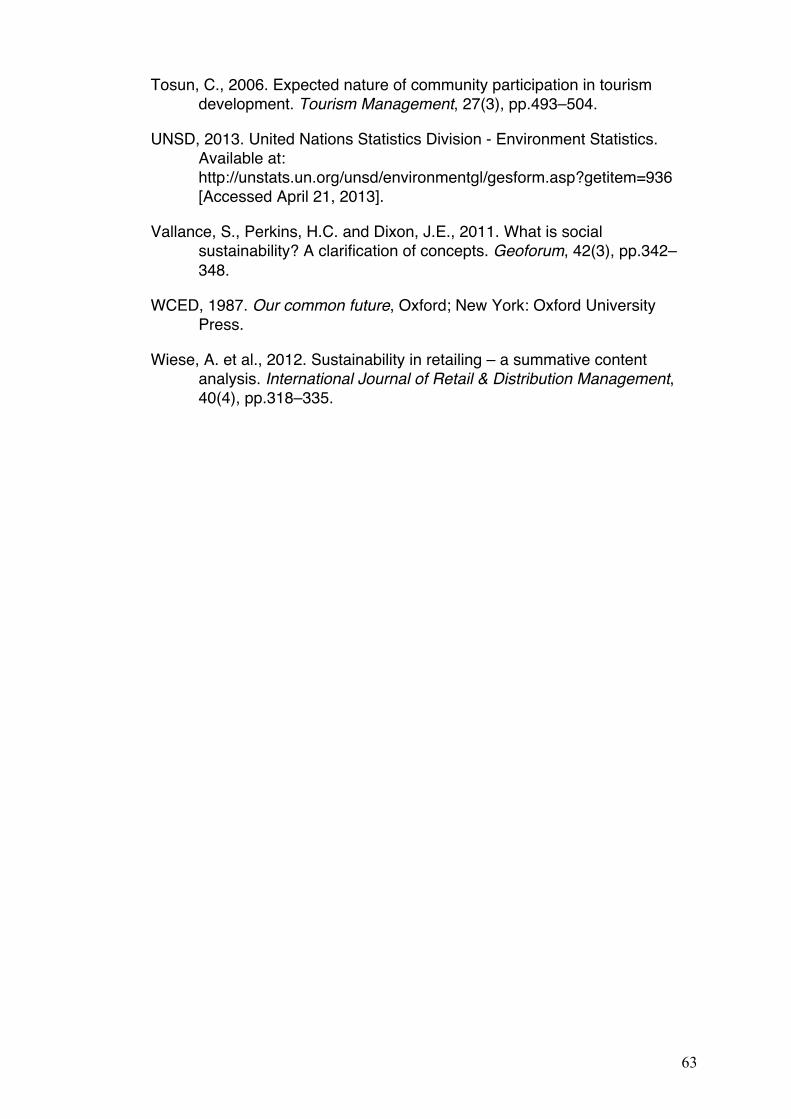
63
Tosun, C., 2006. Expected nature of community participation in tourism development. Tourism Management, 27(3), pp.493–504.
UNSD, 2013. United Nations Statistics Division - Environment Statistics. Available at: http://unstats.un.org/unsd/environmentgl/gesform.asp?getitem=936 [Accessed April 21, 2013].
Vallance, S., Perkins, H.C. and Dixon, J.E., 2011. What is social sustainability? A clarification of concepts. Geoforum, 42(3), pp.342–348.
WCED, 1987. Our common future, Oxford; New York: Oxford University Press.
Wiese, A. et al., 2012. Sustainability in retailing – a summative content analysis. International Journal of Retail & Distribution Management, 40(4), pp.318–335.
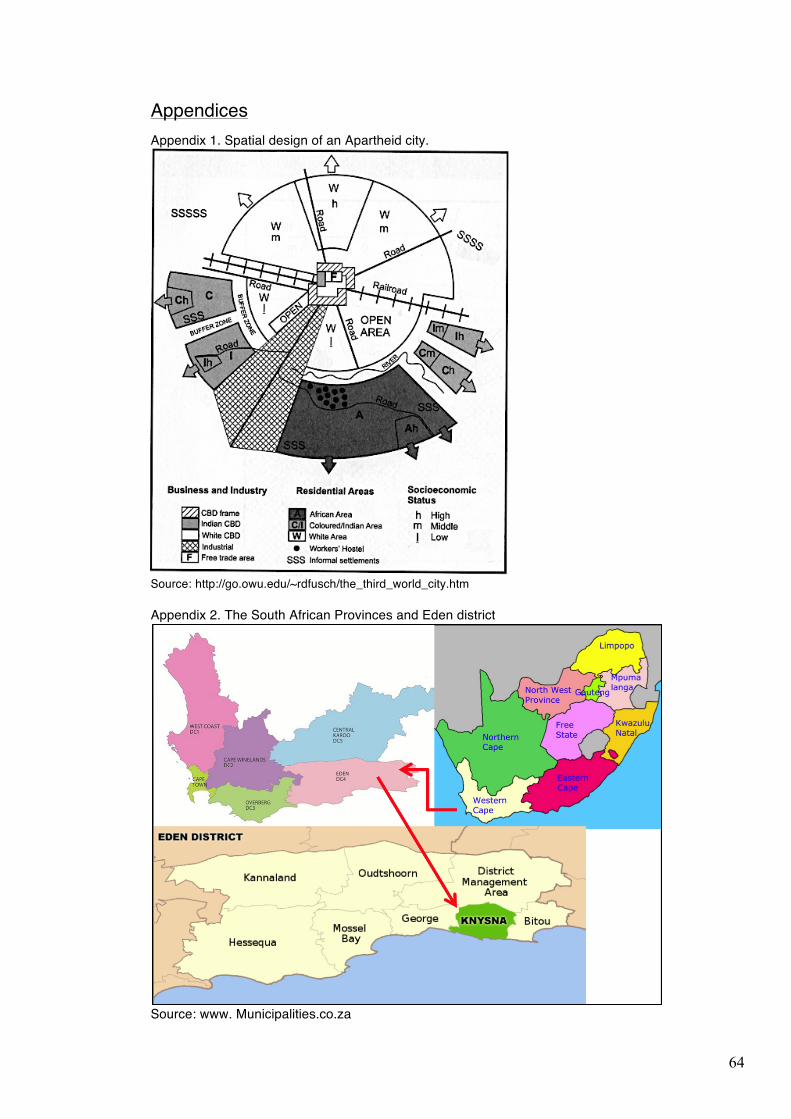
64
Appendices Appendix 1. Spatial design of an Apartheid city.
Source: http://go.owu.edu/~rdfusch/the_third_world_city.htm Appendix 2. The South African Provinces and Eden district
Source: www. Municipalities.co.za
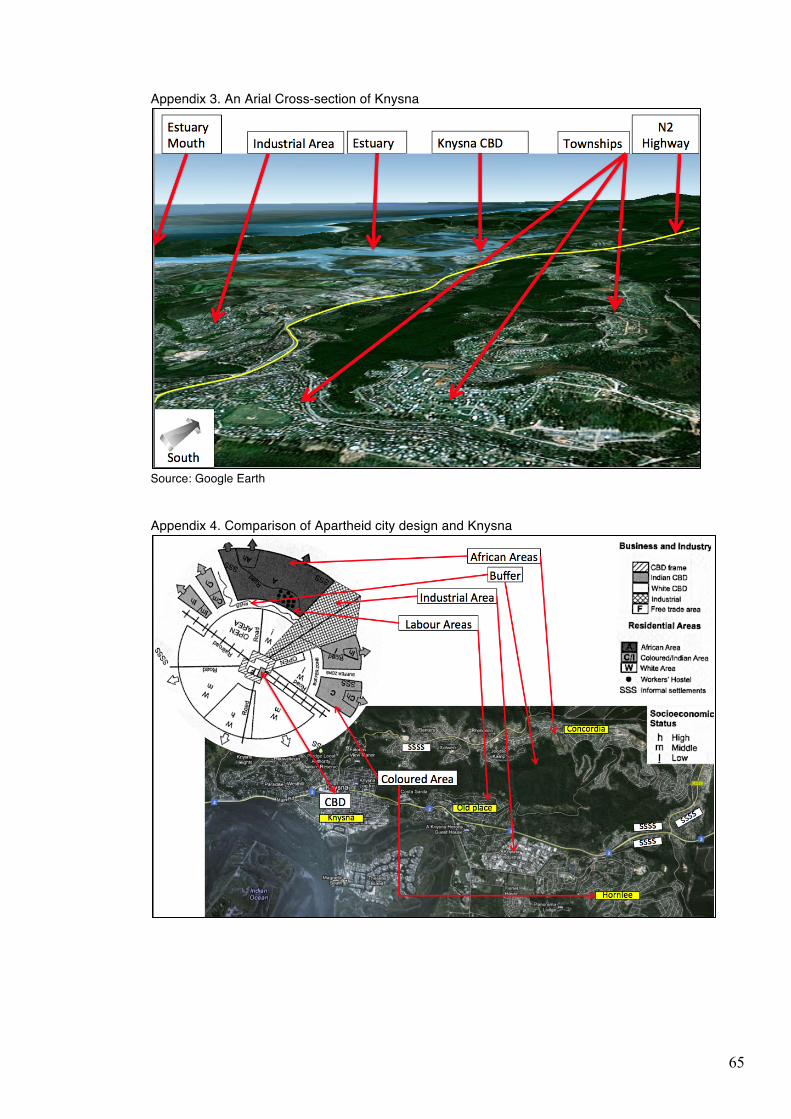
65
Appendix 3. An Arial Cross-section of Knysna
Source: Google Earth Appendix 4. Comparison of Apartheid city design and Knysna
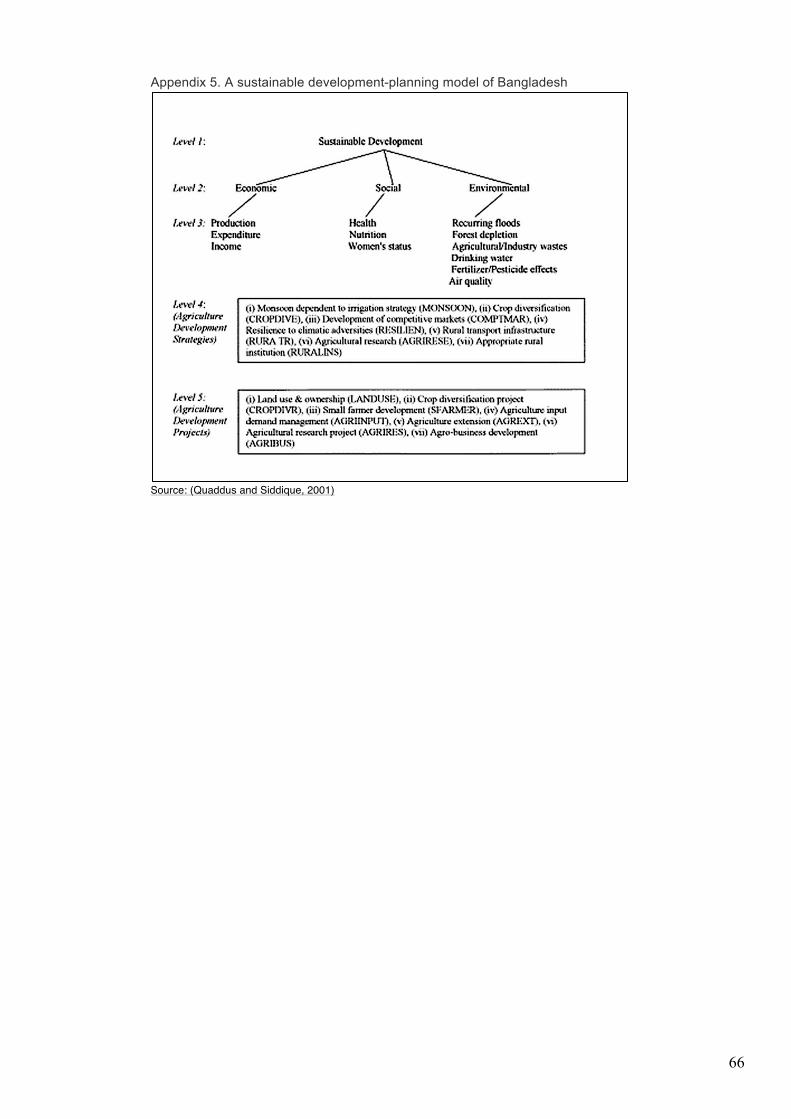
66
Appendix 5. A sustainable development-planning model of Bangladesh
Source: (Quaddus and Siddique, 2001)
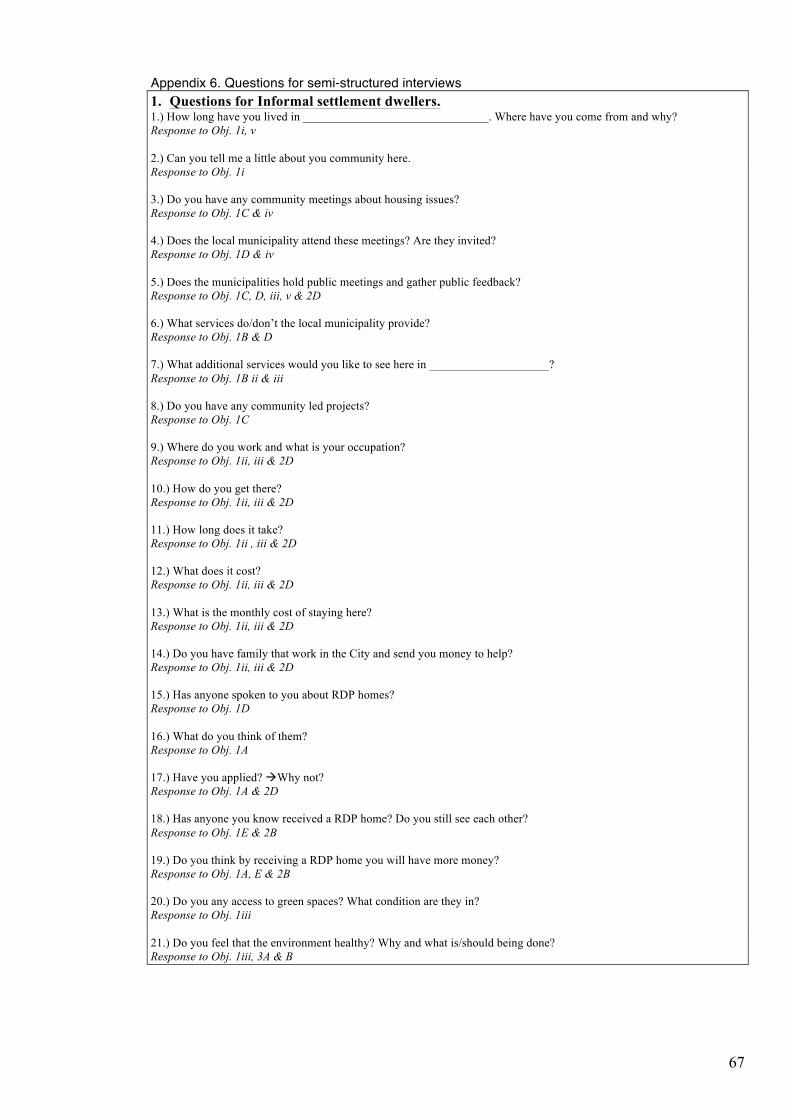
67
Appendix 6. Questions for semi-structured interviews 1. Questions for Informal settlement dwellers. 1.) How long have you lived in _______________________________. Where have you come from and why? Response to Obj. 1i, v 2.) Can you tell me a little about you community here. Response to Obj. 1i 3.) Do you have any community meetings about housing issues? Response to Obj. 1C & iv 4.) Does the local municipality attend these meetings? Are they invited? Response to Obj. 1D & iv 5.) Does the municipalities hold public meetings and gather public feedback? Response to Obj. 1C, D, iii, v & 2D 6.) What services do/don’t the local municipality provide? Response to Obj. 1B & D 7.) What additional services would you like to see here in ____________________? Response to Obj. 1B ii & iii 8.) Do you have any community led projects? Response to Obj. 1C 9.) Where do you work and what is your occupation? Response to Obj. 1ii, iii & 2D 10.) How do you get there? Response to Obj. 1ii, iii & 2D 11.) How long does it take? Response to Obj. 1ii , iii & 2D 12.) What does it cost? Response to Obj. 1ii, iii & 2D 13.) What is the monthly cost of staying here? Response to Obj. 1ii, iii & 2D 14.) Do you have family that work in the City and send you money to help? Response to Obj. 1ii, iii & 2D 15.) Has anyone spoken to you about RDP homes? Response to Obj. 1D 16.) What do you think of them? Response to Obj. 1A 17.) Have you applied? àWhy not? Response to Obj. 1A & 2D 18.) Has anyone you know received a RDP home? Do you still see each other? Response to Obj. 1E & 2B 19.) Do you think by receiving a RDP home you will have more money? Response to Obj. 1A, E & 2B 20.) Do you any access to green spaces? What condition are they in? Response to Obj. 1iii 21.) Do you feel that the environment healthy? Why and what is/should being done? Response to Obj. 1iii, 3A & B
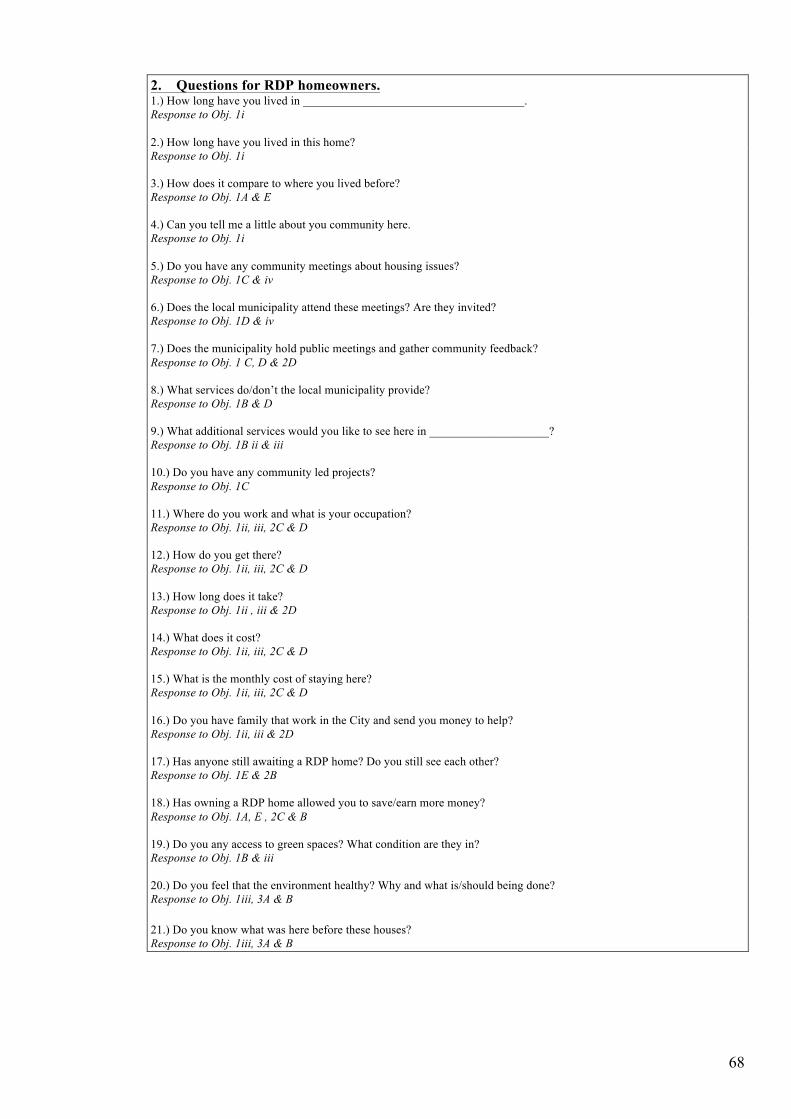
68
2. Questions for RDP homeowners. 1.) How long have you lived in _____________________________________. Response to Obj. 1i 2.) How long have you lived in this home? Response to Obj. 1i 3.) How does it compare to where you lived before? Response to Obj. 1A & E 4.) Can you tell me a little about you community here. Response to Obj. 1i 5.) Do you have any community meetings about housing issues? Response to Obj. 1C & iv 6.) Does the local municipality attend these meetings? Are they invited? Response to Obj. 1D & iv 7.) Does the municipality hold public meetings and gather community feedback? Response to Obj. 1 C, D & 2D 8.) What services do/don’t the local municipality provide? Response to Obj. 1B & D 9.) What additional services would you like to see here in ____________________? Response to Obj. 1B ii & iii 10.) Do you have any community led projects? Response to Obj. 1C 11.) Where do you work and what is your occupation? Response to Obj. 1ii, iii, 2C & D 12.) How do you get there? Response to Obj. 1ii, iii, 2C & D 13.) How long does it take? Response to Obj. 1ii , iii & 2D 14.) What does it cost? Response to Obj. 1ii, iii, 2C & D 15.) What is the monthly cost of staying here? Response to Obj. 1ii, iii, 2C & D 16.) Do you have family that work in the City and send you money to help? Response to Obj. 1ii, iii & 2D 17.) Has anyone still awaiting a RDP home? Do you still see each other? Response to Obj. 1E & 2B 18.) Has owning a RDP home allowed you to save/earn more money? Response to Obj. 1A, E , 2C & B 19.) Do you any access to green spaces? What condition are they in? Response to Obj. 1B & iii 20.) Do you feel that the environment healthy? Why and what is/should being done? Response to Obj. 1iii, 3A & B 21.) Do you know what was here before these houses? Response to Obj. 1iii, 3A & B
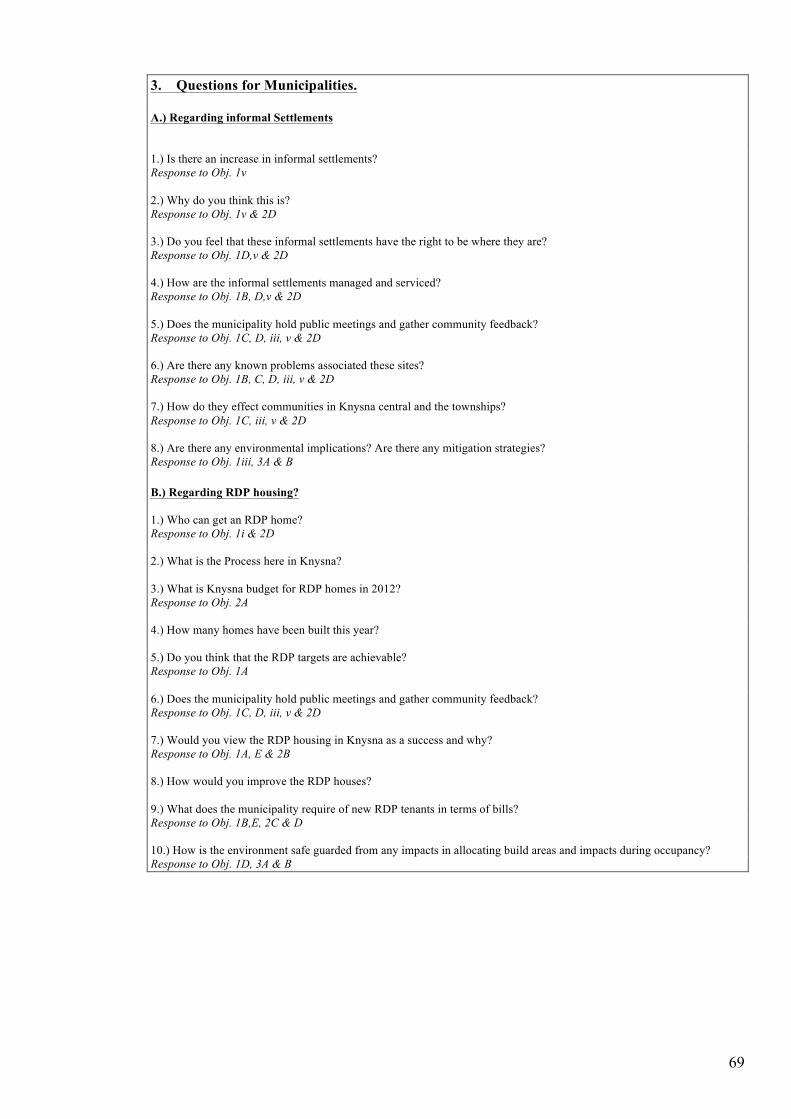
69
3. Questions for Municipalities. A.) Regarding informal Settlements 1.) Is there an increase in informal settlements? Response to Obj. 1v 2.) Why do you think this is? Response to Obj. 1v & 2D 3.) Do you feel that these informal settlements have the right to be where they are? Response to Obj. 1D,v & 2D 4.) How are the informal settlements managed and serviced? Response to Obj. 1B, D,v & 2D 5.) Does the municipality hold public meetings and gather community feedback? Response to Obj. 1C, D, iii, v & 2D 6.) Are there any known problems associated these sites? Response to Obj. 1B, C, D, iii, v & 2D 7.) How do they effect communities in Knysna central and the townships? Response to Obj. 1C, iii, v & 2D 8.) Are there any environmental implications? Are there any mitigation strategies? Response to Obj. 1iii, 3A & B B.) Regarding RDP housing? 1.) Who can get an RDP home? Response to Obj. 1i & 2D 2.) What is the Process here in Knysna? 3.) What is Knysna budget for RDP homes in 2012? Response to Obj. 2A 4.) How many homes have been built this year? 5.) Do you think that the RDP targets are achievable? Response to Obj. 1A 6.) Does the municipality hold public meetings and gather community feedback? Response to Obj. 1C, D, iii, v & 2D 7.) Would you view the RDP housing in Knysna as a success and why? Response to Obj. 1A, E & 2B 8.) How would you improve the RDP houses? 9.) What does the municipality require of new RDP tenants in terms of bills? Response to Obj. 1B,E, 2C & D 10.) How is the environment safe guarded from any impacts in allocating build areas and impacts during occupancy? Response to Obj. 1D, 3A & B
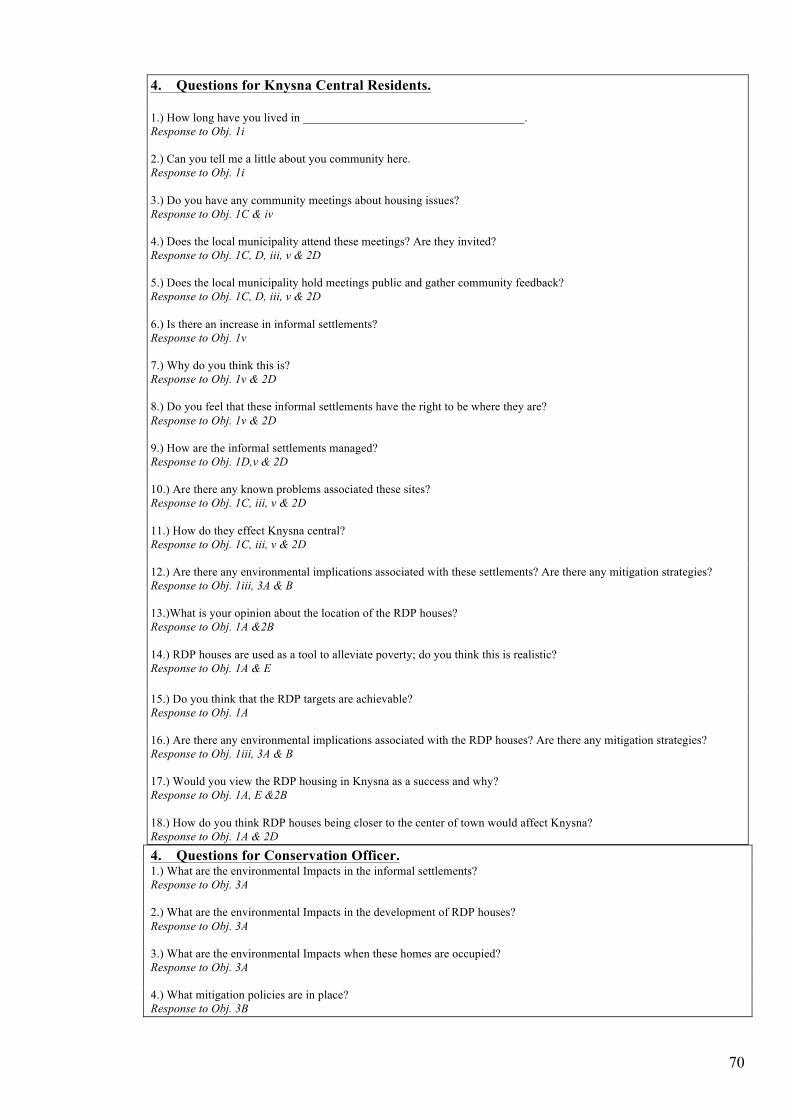
70
4. Questions for Knysna Central Residents. 1.) How long have you lived in _____________________________________. Response to Obj. 1i 2.) Can you tell me a little about you community here. Response to Obj. 1i 3.) Do you have any community meetings about housing issues? Response to Obj. 1C & iv 4.) Does the local municipality attend these meetings? Are they invited? Response to Obj. 1C, D, iii, v & 2D 5.) Does the local municipality hold meetings public and gather community feedback? Response to Obj. 1C, D, iii, v & 2D 6.) Is there an increase in informal settlements? Response to Obj. 1v 7.) Why do you think this is? Response to Obj. 1v & 2D 8.) Do you feel that these informal settlements have the right to be where they are? Response to Obj. 1v & 2D 9.) How are the informal settlements managed? Response to Obj. 1D,v & 2D 10.) Are there any known problems associated these sites? Response to Obj. 1C, iii, v & 2D 11.) How do they effect Knysna central? Response to Obj. 1C, iii, v & 2D 12.) Are there any environmental implications associated with these settlements? Are there any mitigation strategies? Response to Obj. 1iii, 3A & B 13.)What is your opinion about the location of the RDP houses? Response to Obj. 1A &2B 14.) RDP houses are used as a tool to alleviate poverty; do you think this is realistic? Response to Obj. 1A & E 15.) Do you think that the RDP targets are achievable? Response to Obj. 1A 16.) Are there any environmental implications associated with the RDP houses? Are there any mitigation strategies? Response to Obj. 1iii, 3A & B 17.) Would you view the RDP housing in Knysna as a success and why? Response to Obj. 1A, E &2B 18.) How do you think RDP houses being closer to the center of town would affect Knysna? Response to Obj. 1A & 2D
4. Questions for Conservation Officer. 1.) What are the environmental Impacts in the informal settlements? Response to Obj. 3A 2.) What are the environmental Impacts in the development of RDP houses? Response to Obj. 3A 3.) What are the environmental Impacts when these homes are occupied? Response to Obj. 3A 4.) What mitigation policies are in place? Response to Obj. 3B
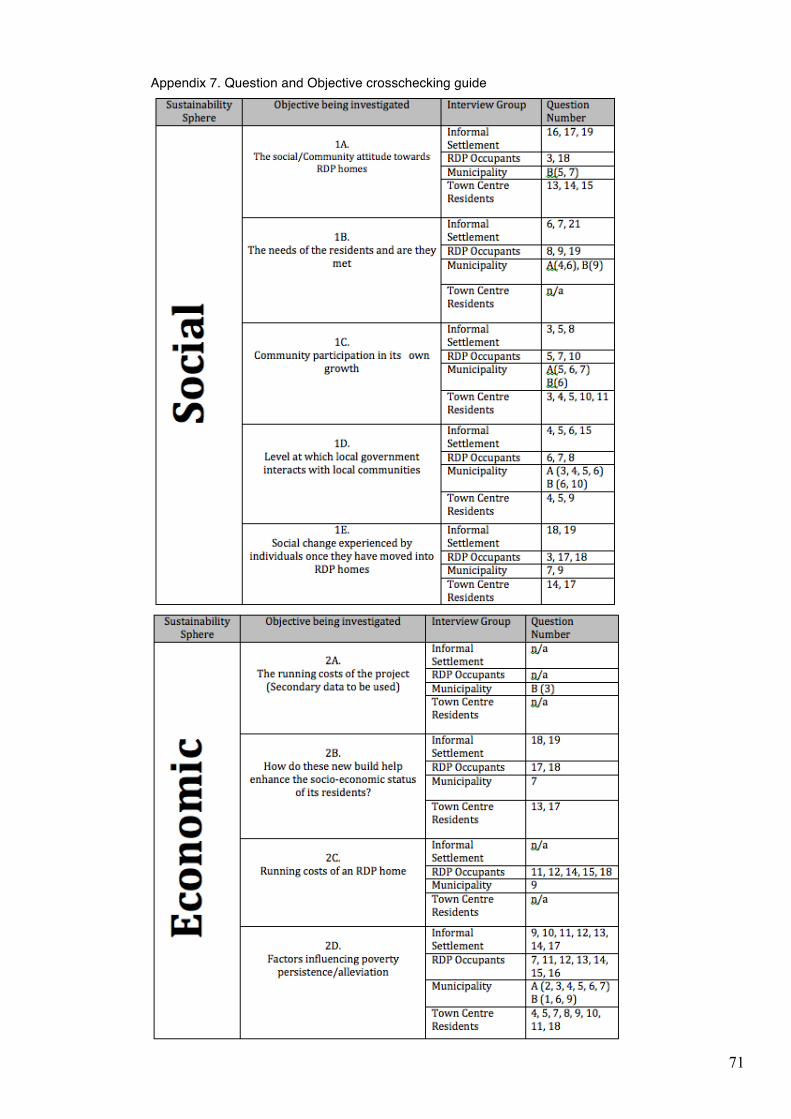
71
Appendix 7. Question and Objective crosschecking guide
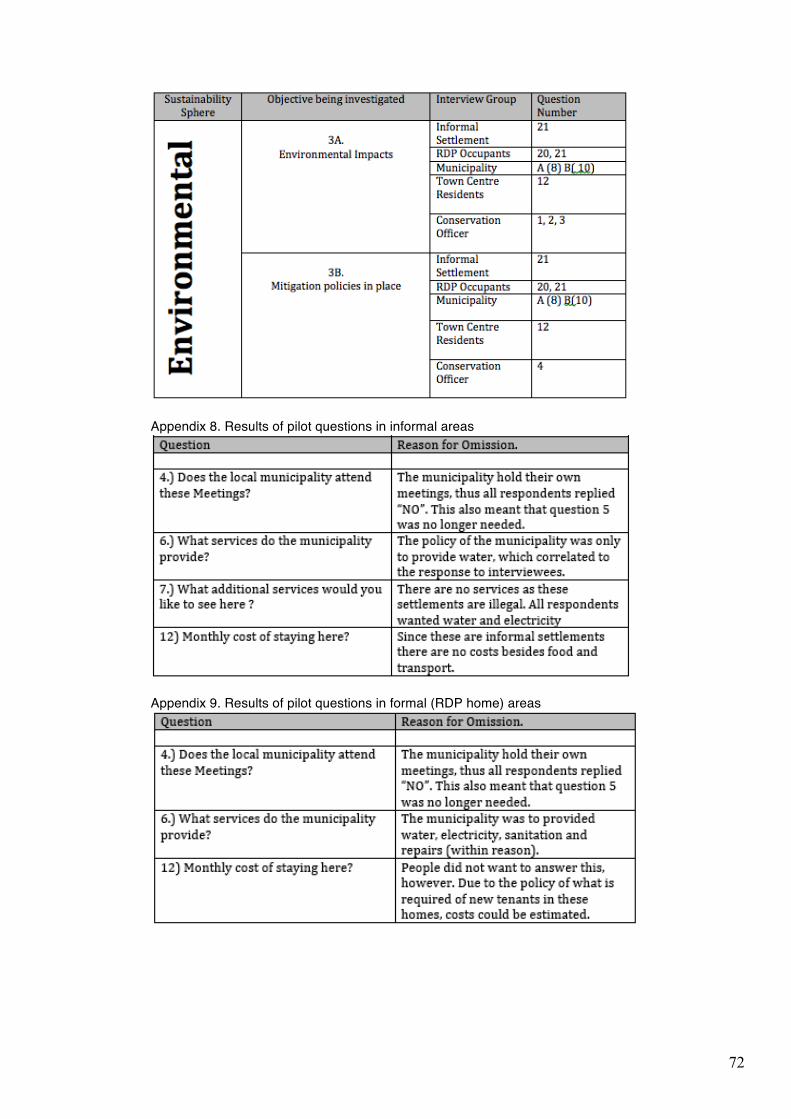
72
Appendix 8. Results of pilot questions in informal areas
Appendix 9. Results of pilot questions in formal (RDP home) areas
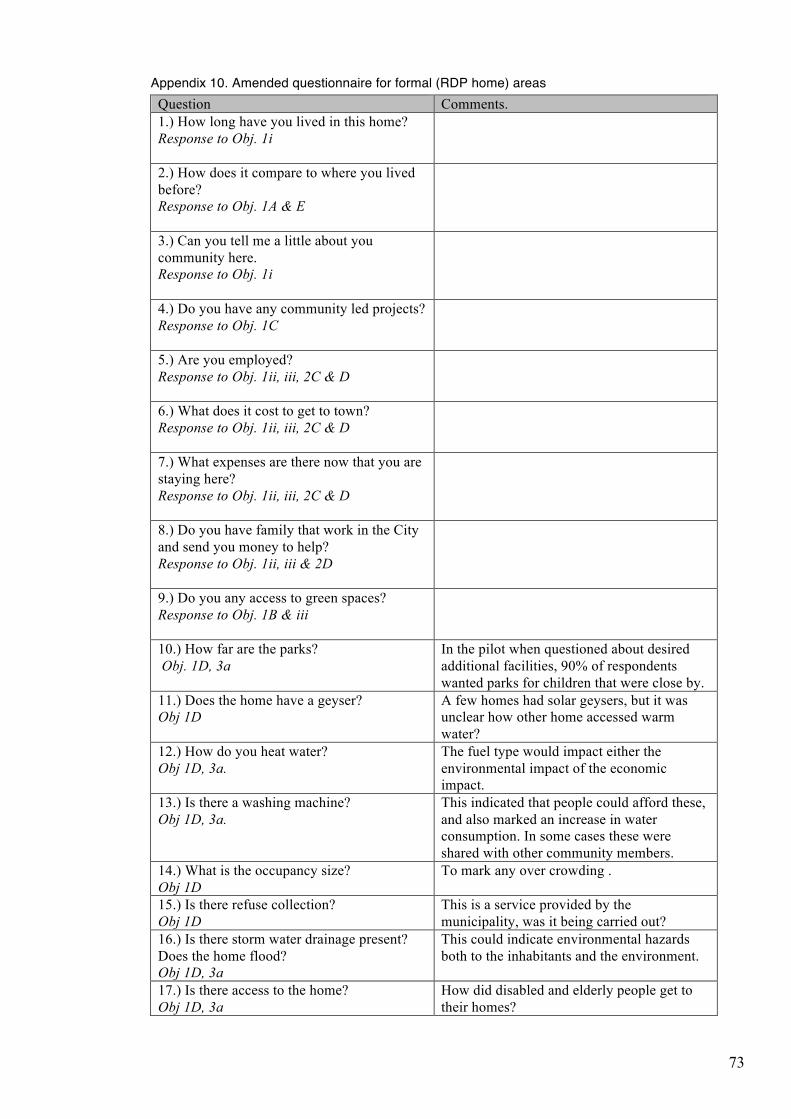
73
Appendix 10. Amended questionnaire for formal (RDP home) areas
Question Comments. 1.) How long have you lived in this home? Response to Obj. 1i
2.) How does it compare to where you lived before? Response to Obj. 1A & E
3.) Can you tell me a little about you community here. Response to Obj. 1i
4.) Do you have any community led projects? Response to Obj. 1C
5.) Are you employed? Response to Obj. 1ii, iii, 2C & D
6.) What does it cost to get to town? Response to Obj. 1ii, iii, 2C & D
7.) What expenses are there now that you are staying here? Response to Obj. 1ii, iii, 2C & D
8.) Do you have family that work in the City and send you money to help? Response to Obj. 1ii, iii & 2D
9.) Do you any access to green spaces? Response to Obj. 1B & iii
10.) How far are the parks? Obj. 1D, 3a
In the pilot when questioned about desired additional facilities, 90% of respondents wanted parks for children that were close by.
11.) Does the home have a geyser? Obj 1D
A few homes had solar geysers, but it was unclear how other home accessed warm water?
12.) How do you heat water? Obj 1D, 3a.
The fuel type would impact either the environmental impact of the economic impact.
13.) Is there a washing machine? Obj 1D, 3a.
This indicated that people could afford these, and also marked an increase in water consumption. In some cases these were shared with other community members.
14.) What is the occupancy size? Obj 1D
To mark any over crowding .
15.) Is there refuse collection? Obj 1D
This is a service provided by the municipality, was it being carried out?
16.) Is there storm water drainage present? Does the home flood? Obj 1D, 3a
This could indicate environmental hazards both to the inhabitants and the environment.
17.) Is there access to the home? Obj 1D, 3a
How did disabled and elderly people get to their homes?
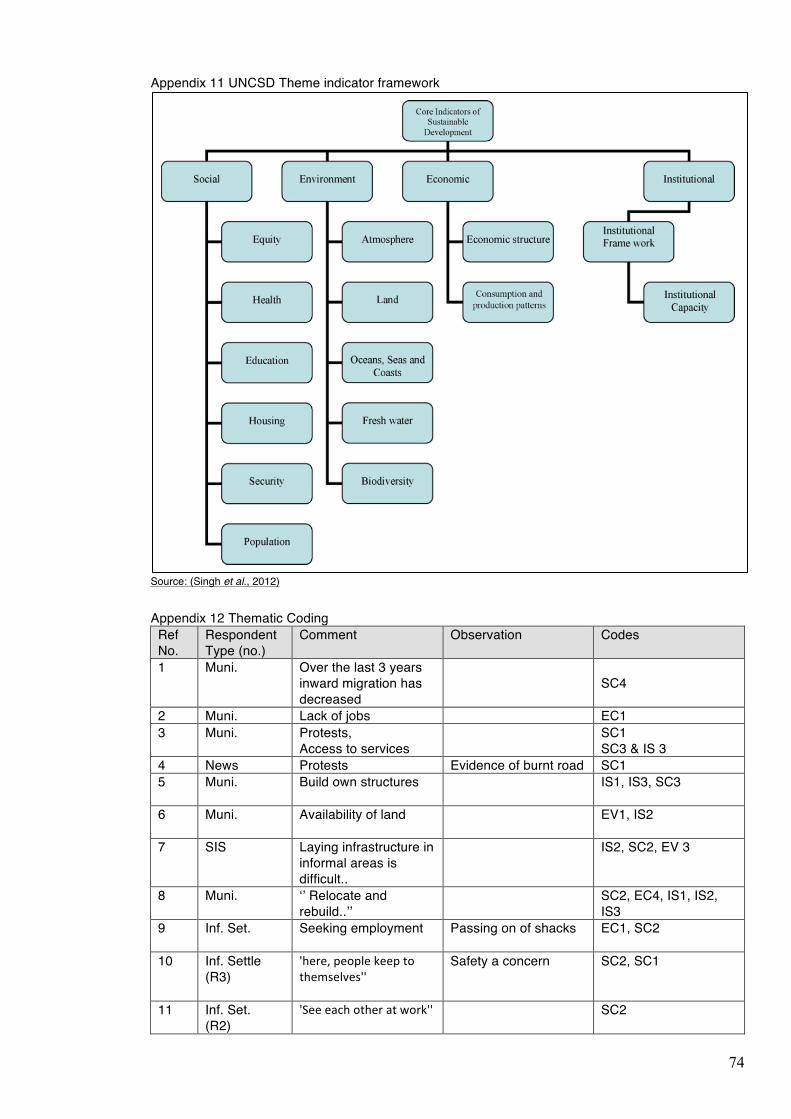
74
Appendix 11 UNCSD Theme indicator framework
Source: (Singh et al., 2012)
Appendix 12 Thematic Coding
Ref No.
Respondent Type (no.)
Comment Observation Codes
1 Muni. Over the last 3 years inward migration has decreased
SC4
2 Muni. Lack of jobs EC1 3 Muni. Protests,
Access to services SC1
SC3 & IS 3 4 News Protests Evidence of burnt road SC1 5 Muni. Build own structures IS1, IS3, SC3
6 Muni. Availability of land EV1, IS2
7 SIS Laying infrastructure in
informal areas is difficult..
IS2, SC2, EV 3
8 Muni. ‘’ Relocate and rebuild..’’
SC2, EC4, IS1, IS2, IS3
9 Inf. Set. Seeking employment Passing on of shacks
EC1, SC2
10 Inf. Settle (R3)
'here, people keep to themselves''
Safety a concern SC2, SC1
11 Inf. Set. (R2)
'See each other at work''
SC2
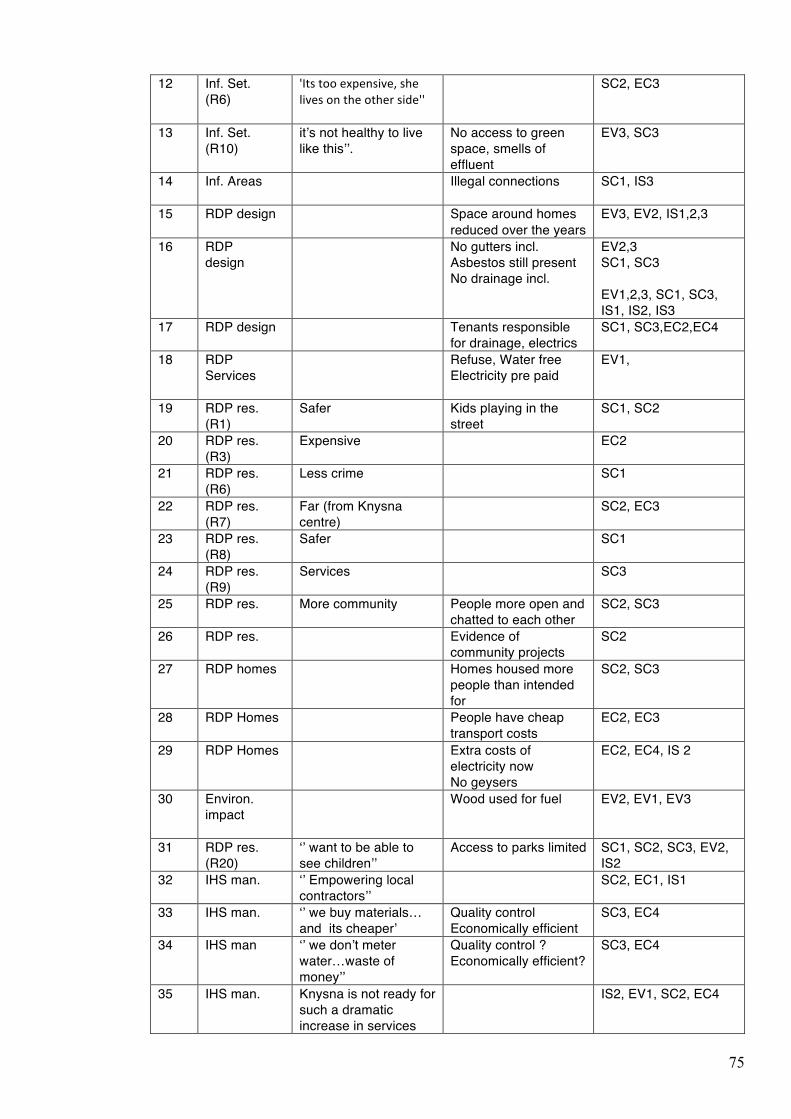
75
12 Inf. Set. (R6)
'Its too expensive, she lives on the other side''
SC2, EC3
13 Inf. Set. (R10)
it’s not healthy to live like this’’.
No access to green space, smells of effluent
EV3, SC3
14 Inf. Areas Illegal connections SC1, IS3
15 RDP design Space around homes reduced over the years
EV3, EV2, IS1,2,3
16 RDP design
No gutters incl. Asbestos still present No drainage incl.
EV2,3 SC1, SC3 EV1,2,3, SC1, SC3, IS1, IS2, IS3
17 RDP design Tenants responsible for drainage, electrics
SC1, SC3,EC2,EC4
18 RDP Services
Refuse, Water free Electricity pre paid
EV1,
19 RDP res. (R1)
Safer Kids playing in the street
SC1, SC2
20 RDP res. (R3)
Expensive EC2
21 RDP res. (R6)
Less crime SC1
22 RDP res. (R7)
Far (from Knysna centre)
SC2, EC3
23 RDP res. (R8)
Safer SC1
24 RDP res. (R9)
Services SC3
25 RDP res. More community People more open and chatted to each other
SC2, SC3
26 RDP res. Evidence of community projects
SC2
27 RDP homes Homes housed more people than intended for
SC2, SC3
28 RDP Homes
People have cheap transport costs
EC2, EC3
29 RDP Homes
Extra costs of electricity now No geysers
EC2, EC4, IS 2
30 Environ. impact
Wood used for fuel EV2, EV1, EV3
31 RDP res. (R20)
‘’ want to be able to see children’’
Access to parks limited
SC1, SC2, SC3, EV2, IS2
32 IHS man. ‘’ Empowering local contractors’’
SC2, EC1, IS1
33 IHS man. ‘’ we buy materials… and its cheaper’
Quality control Economically efficient
SC3, EC4
34 IHS man ‘’ we don’t meter water…waste of money’’
Quality control ? Economically efficient?
SC3, EC4
35 IHS man. Knysna is not ready for such a dramatic increase in services
IS2, EV1, SC2, EC4
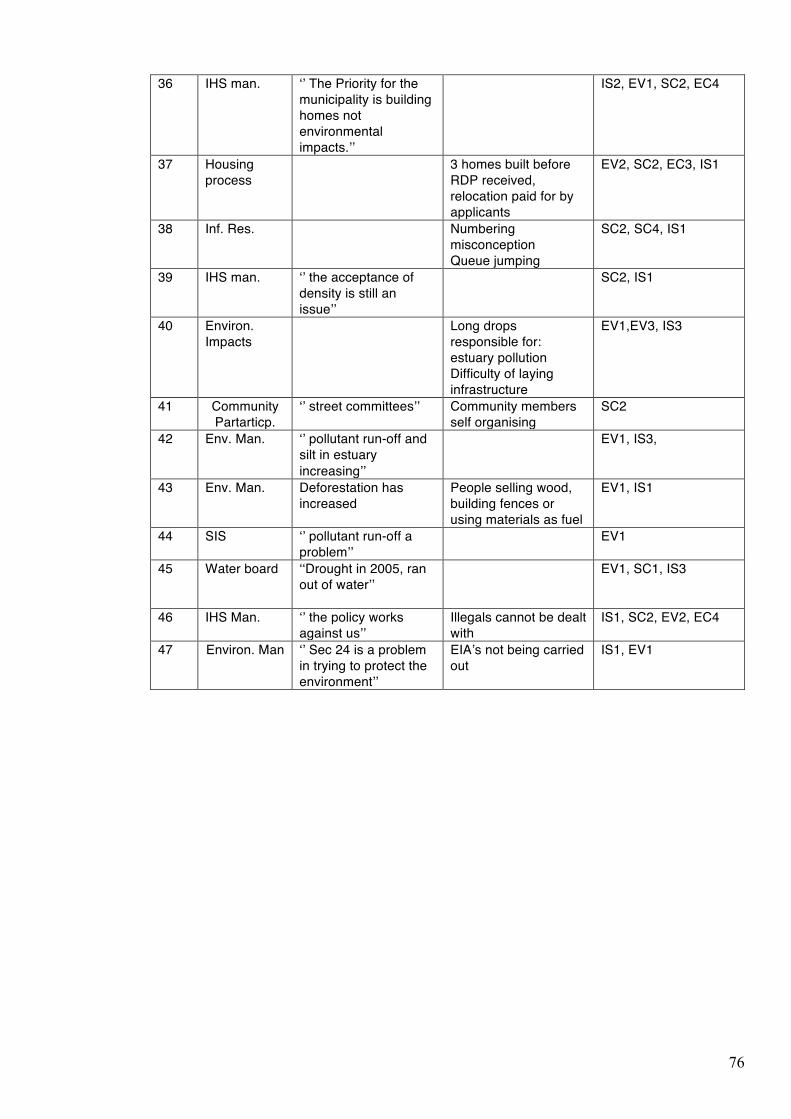
76
36 IHS man. ‘’ The Priority for the municipality is building homes not environmental impacts.’’
IS2, EV1, SC2, EC4
37 Housing process
3 homes built before RDP received, relocation paid for by applicants
EV2, SC2, EC3, IS1
38 Inf. Res. Numbering misconception Queue jumping
SC2, SC4, IS1
39 IHS man. ‘’ the acceptance of density is still an issue’’
SC2, IS1
40 Environ. Impacts
Long drops responsible for: estuary pollution Difficulty of laying infrastructure
EV1,EV3, IS3
41 Community Partarticp.
‘’ street committees’’ Community members self organising
SC2
42 Env. Man. ‘’ pollutant run-off and silt in estuary increasing’’
EV1, IS3,
43 Env. Man. Deforestation has increased
People selling wood, building fences or using materials as fuel
EV1, IS1
44 SIS ‘’ pollutant run-off a problem’’
EV1
45 Water board ‘‘Drought in 2005, ran out of water’’
EV1, SC1, IS3
46 IHS Man. ‘’ the policy works against us’’
Illegals cannot be dealt with
IS1, SC2, EV2, EC4
47 Environ. Man ‘’ Sec 24 is a problem in trying to protect the environment’’
EIA’s not being carried out
IS1, EV1
Related Documents