i DURABILITY OF REINFORCED CONCRETE STRUCTURES IN A SALINE ENVIRONMENT By Lakshmeesha Kodla B.E.(Civil Engineering) School of Computing, Science And Engineering University of Salford This dissertation is submitted in part fulfilment of the requirements for the MSc degree in Structural Engineering 2015

Dissertation Report submission copy for CD
Aug 09, 2015
Welcome message from author
This document is posted to help you gain knowledge. Please leave a comment to let me know what you think about it! Share it to your friends and learn new things together.
Transcript

i
DURABILITY OF
REINFORCED CONCRETE STRUCTURES IN A SALINE ENVIRONMENT
By
Lakshmeesha Kodla
B.E.(Civil Engineering)
School of Computing, Science And Engineering
University of Salford
This dissertation is submitted in part fulfilment of the
requirements for the MSc degree in Structural Engineering
2015

ii
DECLARATION
‘’I, Lakshmeesha Kodla, declare that this dissertation is my own work. Any section, part
or phrasing of more than 20 consecutive words that is copied from any other work or
publication has been clearly referenced at the point of use and also fully described in the
reference section of this dissertation.’’
‘’Signed …….…………………............................................................‘’

iii
ACKNOWLEDGEMENT
I would like to take this opportunity to express my heartiest gratitude to my dissertation
supervisor Dr. Wayne. Y. Wang without whose excellent guidance, understanding, expertise
patience, inspiration and priceless advice it would have not been possible to materialise this
thesis. He supported me with a creative environment through continuous discussion and
arguments and helped me in every step to enrich my knowledge on the subject to conduct my
research work.
I would also like the express my sincere thanks to all the staff members in the Clifford
Whitworth Library at the University of Salford, whose timely provision of resources helped
me to gather all the necessary information and look into various issues associated with this
study.
I would like to extend my thanks to my friend who has accompanied me throughout and
supported me mentally and morally in further work.
Finally, I would like to extend my gratitude to my beloved parents and siblings who has
encouraged me to acquire knowledge and for their unconditional love and support helped me
to complete this research work.

iv
ABSTRACT
Numerous studies have been conducted in order to bring out best possible outcomes in
minimizing the deterioration of concrete embedded with steel reinforcement and removal of
chloride-ion concentration. Likewise, observations are made to predict two different schemes
for complete removal of chloride from the concrete. To achieve this, concrete specimen is
applied with two different current densities. Besides, the technique involves applying a high
(DC) current density through the concrete cover region between the cathodically polarised
steel reinforcement and an anode placed in the external region in a suitable electrolyte on the
surface of the structure. The medium is of pore solution. The paper is also focused on the
study and investigation of efficiency of chloride removal with steel bars of different
configurations acting as the cathodes. The paper is also discussed with close observation an
ionic concentration distribution profiles and effects of externally applied current density.
The behaviour of the concrete specimen under two different current density is examined by
changing the number of parameters in the partial differential equation (PDE) tool. Finally, by
using COMSOL Multiphysics software, analysis is conducted which is validated by using
these pre-determined extracted experimental data in order to compute and study the final
outputs. Simultaneously, a cut line 2D graph is also plotted for the two simulations with two
different current density of 5 A/m2 and 3 A/m2 respectively. The prime importance of this
COMSOL Multiphysics is to create a model that, it can render accurate design and forecast
the removal of maximum percentage of chlorides deposited within the concrete member,
which in return allows the marine concrete structures by giving excellent service life and
extend the durability of the concrete structure even further. Thereby process of maintenance
and repairs become easy by the provision of temporary supports for the extensive treatment,
which require safety measures will be taken before the structure reaches the practically
impossible state.
Overall, the outcome of this study would be useful for academics and professionals in design
implementations, to improve durability of RC-structures under saline environment, to update
and assess if there is any need for implementation of these techniques in nuclear power plant
and petrochemical refining plant projects.
v
Table of Contents Page No.
TITLE PAGE………………………………………............................................................... i
DECLARATION…………………………………………………………………………..... ii
ACKNOWLEDGEMENT…………………………………………………………………... iii
ABSTRACT…………………………………………………………………………………. iv
1 INTRODUCTION .......................................................................................................... 10 BACKGROUND INFORMATION ................................................................. 10 1.1 SCOPE AND OBJECTIVES ........................................................................... 12 1.2 ORGANISATION OF THE THESIS .............................................................. 13 1.3
2 LITERATURE REVIEW .............................................................................................. 142.1 INTRODUCTION ................................................................................................ 14
2.1.1 Brief history of durability of structures ................................................................................ 15 BACKGROUND OF THE PROJECT............................................................. 16 2.2
Concrete as an environment .......................................................................................... 16 2.2.1 Corrosion and passivation of steel reinforcement ......................................................... 17 2.2.2 Factors adversely affecting corrosion rates of steel in concrete .................................... 17 2.2.3 Ideal condition............................................................................................................... 18 2.2.4 Practical condition......................................................................................................... 18 2.2.5 Deterioration mechanism .............................................................................................. 19 2.2.6 Stages in deterioration ................................................................................................... 19 2.2.7 Modes of Deterioration ................................................................................................. 20 2.2.8
The constituent of cement paste ................................................................................ 21 2.2.8.1 Deterioration by hydrolysis of cement paste constituents ......................................... 24 2.2.8.2 Contribution of Ettringite (𝑪 − 𝑨 − 𝑺 −𝑯) ............................................................. 24 2.2.8.3 Deterioration by acid attack ...................................................................................... 25 2.2.8.4 Deterioration by salts ................................................................................................ 26 2.2.8.5 Deterioration by Alkali- silica reaction (ASR) ......................................................... 28 2.2.8.6 Deterioration by Freeze/Thaw Damage .................................................................... 30 2.2.8.7 Deterioration by Alkali Aggregate Reaction (AAR)................................................. 31 2.2.8.8 Reactive Aggregate ................................................................................................... 32 2.2.8.9
General types of AAR (Mingshu 1992) and (Dr. M Nagesh, 2012) ......................... 32 2.2.8.10 Thermal Incompatibility of concrete components (TICC) ........................................ 33 2.2.8.11
2.3. Shrinkage ............................................................................................................ 34 2.4. Frost Damage ...................................................................................................... 36
CORROSION RATE MEASUREMENTS IN STEEL SHEET PILE WALLS 2.5IN A MARINE ENVIRONMENT ............................................................................. 40
2.5.1 BACKGROUND INFORMATION (H. Wall, L. Wadso/Marine Structures 33(2013)21-32)) ............................................................................................................................ 40
INTRODUCTION (H. Wall, L. Wadso/Marine Structures 33(2013)21-32)) ............... 41 2.5.2

6
Principles of design of a sheet pile quay (H. Wall, L. Wadso/Marine Structures 2.5.333(2013)21-32)) ............................................................................................................................ 43
Current design values on corrosion rates (H. Wall, L. Wadso/Marine Structures 2.5.433(2013)21-32)) ............................................................................................................................ 44
North America (H. Wall, L. Wadso/Marine Structures 33(2013)21-32)) ................. 45 2.5.4.1 Australia (H. Wall, L. Wadso/Marine Structures 33(2013)21-32)) .......................... 46 2.5.4.2 Europe (H. Wall, L. Wadso/Marine Structures 33(2013)21-32)) ............................. 46 2.5.4.3 Sweden (H. Wall, L. Wadso/Marine Structures 33(2013)21-32)) ............................ 47 2.5.4.4
3 METHODOLOGY ......................................................................................................... 48Multi-phase modelling of ionic transport in concrete under externally applied current density ..................................................................................................................................... 48
ABSTRACT..................................................................................................... 48 3.1 INTRODUCTION ........................................................................................... 48 3.2 THEORETICAL BACKGROUND ................................................................. 49 3.3 NUMERICAL BACKGROUND ..................................................................... 52 3.4
Simulated migration test ............................................................................................... 52 3.4.1 Geometry ....................................................................................................................... 53 3.4.2 Modelling of ECR ......................................................................................................... 54 3.4.3 Simulation results and discussions ................................................................................ 57 3.4.4 Conclusions ................................................................................................................... 62 3.4.5
4 RESULTS AND DISCUSSIONS ................................................................................... 63 Summary of modelling .................................................................................... 63 4.1 Role of multi-ionic movement of Na+ and Cl- and K + in Concrete during and 4.2
after applied current density...................................................................................... 64 4.3 Simulation results and discussions ................................................................... 65 4.4 Comparison of 2D Line graph ......................................................................... 70
5 CONCCLUSION AND FURTHER WORK ................................................................ 74 Conclusion ....................................................................................................... 74 5.1 Recommendation for further work .................................................................. 75 5.2
REFERENCES ....................................................................................................................... 76REFERENCES FOR LIST OF FIGURES AND TABLES ............................................... 79

7
List of Figures Figure 2–1 A control volume of concrete (Dr. Wayne Y. Wang, 2001) ................................. 15 Figure 2–2 Schematic representation of Anhydrous Portland Cement and Hydrated Portland cement Paste............................................................................................................................. 21 Figure 2–3 Constitution of Anhydrous and hydrated Portland cement paste (Dr. Wayne. Y. Wang, 2001) ............................................................................................................................. 22 Figure 2–4 Composition of anhydrous Portland cement (Dr. Wayne Y. Wang, 2001) ........... 22 Figure 2–5 Calcium Silicate Hydrate & CH crystal ................................................................ 23 Figure 2–6 Calcium hydrate composition ................................................................................ 23 Figure 2–7 Prismatic and trigonal shaped Ettringite ................................................................ 24 Figure 2–8 Process of deterioration of steel by carbonic acid attack ...................................... 25 Figure 2–9 Carbonation of concrete process and PH value range ........................................... 26 Figure 2–10 Alkali-Silica Reaction Sequence (Thomas, M.D.A., Fournier, B., Folliard, K.J., 2013)/ ....................................................................................................................................... 29 Figure 2–11 (a) Shows the ASR process and (b) shows the adverse ASR damage on Retaining wall .......................................................................................................................... 30 Figure 2–12 Freeze-thaw Resistance/Deck scaling ................................................................ 30 Figure 2–13 Freeze-thaw cycles/D-Cracking .......................................................................... 31 Figure 2–14 Alkali-carbonate reaction process ....................................................................... 33 Figure 2–15 (a) Shrinkage causing crack and (curling in later stage) on beam bottom (Tension zone) and (b) shrinkage crack appeared on floor slab (compression zone leading to curling of floor slab/concrete) .................................................................................................................. 34 Figure 2–16 (a) Schematic representation of corrosion of reinforcement and its reaction process (b) Progression of corrosion of reinforced concrete ................................................... 37 Figure 2–17 Pitting corrosion and corrosion effect on reinforcement Source: (Wikipedia/Pit Corrosion) ................................................................................................................................ 38 Figure 2–18 Carbonation and corrosion effect on reinforcement ............................................ 39 Figure 2–19 Examples of vertical loads on quay decks ........................................................... 42 Figure 2–20 Cross section of a standard back-anchored steel sheet pile wall ......................... 43 Figure 2–21 Examples of sections of sheet piles: Z-profile (type BZ and AZ) on the left and U-profile (type Larssen) on the right ....................................................................................... 44 Figure 2–22 Bending moment (M) and shear force (V) diagrams for a standard back-anchored sheet pile wall ........................................................................................................... 45 Figure 2–23 Recommended design corrosion rates for steel in marine environments in different parts of the world ...................................................................................................... 46 Figure 3–1 Schematic representation of ECR .......................................................................... 52 Figure 3–2 2D two-phase model: section of concrete ............................................................. 53 Figure 3–3 Current flow pattern, anytime, Ij = 5 A/m2 ........................................................... 57 Figure 3–4 Distribution profiles of ionic concentration for current density of 1 A/m2 (at cathode) .................................................................................................................................... 58
8
Figure 3–5 Distribution profile of ionic concentration for the current density of 8 A/m2 (at cathode) .................................................................................................................................... 59 Figure 3–6 Influence of aggregate volume fraction on the transport of chloride and hydroxide ions at lower boundary (section of y=0) .................................................................................. 61 Figure 4–1 Bar chart showing total amount of free chlorides remaining in the specimen ...... 64 Figure 4–2 Distribution of current density at 5 A/m2 .............................................................. 66 Figure 4–3 Ionic concentration distribution profiles for case one with current density of 5 A/m2 at cathode ....................................................................................................................... 67 Figure 4–4 Movement of ions in X-axis and Y-axis................................................................ 68 Figure 4–5 Ionic concentration profile for current density 3 A/m2 (at cathode) ..................... 69 Figure 4–6 Ionic concentration curve of single (centre) reinforced concrete specimen of current density I1 = 5 A/m2 ...................................................................................................... 70 Figure 4–7 Influence of aggregate volume fraction on transport of chloride ions at lower boundary (y=0) ........................................................................................................................ 70 Figure 4–8 Influence of tortuosity caused by aggregate on transport of potassium ions at lower boundary (y=0) .............................................................................................................. 71 Figure 4–9 Ionic concentration curve of 3 reinforced concrete specimen of applied current density I2 = 3 A/m2 ................................................................................................................... 71 Figure 4–10 Influence of aggregate volume fraction of chloride, potassium and sodium ions at lower boundary (y=0) .......................................................................................................... 72 Figure 4–11 Concentration curve showing influence of aggregate tortuosity by chloride, potassium and sodium ions at lower boundary (y=0) .............................................................. 72

9
List of Tables
Table 2-1 Concentration of Major Ions in Some of the World Seas ....................................... 18 Table 3-1 Charge number, diffusion coefficients, and initial and boundary concentrations Source: (Qing-Feng-Liu et al. 2012) ........................................................................................ 55 Table 3-2 Total amount of free Chlorides remaining in the specimen (unit thickness) Source: (Qing-Feng Liu, et al. paper number SLM14/7. (2012) .......................................................... 60 Table 4-1 Total amount of free chlorides remaining in the specimen (unit thickness) ........... 64
10
INTRODUCTION 1
BACKGROUND INFORMATION 1.1
Reinforced concrete structure is a wide spread material and a concept used these days for any
kind of building structure due to its rich in durability character and also due to strength over
the structure. But, due to unscheduled and improper maintenance problems, impose the
reinforced concrete structure to undergo corrosive environment in addition to chloride
infusion. The main objective should always be, to investigate and evaluate the main reason
for the chloride induced corrosion of steel element mainly in the saline environment. The
probability may firstly and fore mostly be neither due to provision of cover less than the
minimum requirement, nor due to improper or over vibration procedure followed during the
time of execution.
Simultaneously, this would lead to a reduction in water-cement (w/c) content of the concrete
mix, thus resulting in honeycomb formation. This formation of honeycomb over the texture
of concrete, which is exposed to weather entrap with air and contribute to severe corrosion of
steel. In total, corrosion of reinforcement takes place within the concrete. Of all this exposure
condition, i.e. Temperature changes like (summer and winter) also referred to as seasonal
effects; tend the RC structure to undergo several environmental variations and plays vital role
in the durability of reinforced concrete structure especially over the saline environment.
However, the high degree of variability that exists in the model parameters makes it difficult
to predict the degree of deterioration of RC structures with certainty. This essentially calls for
a probabilistic tool account for uncertainties and variability in the physical and material
parameters in the model. The study presented by (R.Muigai 2012) proposed that, the
development of probabilistic Service life prediction (SLP) model to take account of the range
of possible values for each input parameter at the initial limit state (ILS) of a RC structure.
The probabilistic SLP model would be able to predict the range of expected times to
corrosion initiation rather than a single value, so as to allow owners to make a more rational
and accurate selection of durability parameters and economical decisions for a RC structure.
It would thus assist in obtaining a balance of economy as well as safety of the concrete
structure.
Over the years, the engineers had been developed numerous design techniques and strategies
as such, service life prediction model conducted by (Mohamad Nagi and Robert Kilgour) on
durability of concrete structures in 1970 Arabian Peninsula and Gulf region, electrochemical

11
method is used to investigate the chloride removal from concrete. Even at present, every
design is under close observation and also a concerned matter everywhere.
‘’ (Prof. Dr. Ing, Michael Raupach) reported that, in the 1960s, first major damages on
concrete buildings induced by reinforcement corrosion problems have been documented.
Since 1975, the amount of corrosion problem increasing considerably leading to various
forms in maintaining the maintenance of infrastructure’’. As survey conducted by (Thomson
N.G et al. 2007), ‘’It is estimated that corrosion related maintenance and repairs for concrete
structures cost around equal to or over $1 trillion per annum across the US and according to
the analysis of (Dr. Jackson, G2MT Labs, 2013 survey) in the U.S it was $276B in 1998.
However, over the past decades at the global level, undoubtedly, the current new designs
technique has reached the peak level by demanding creative implementation method to
surpass the durability problems.
It had been proved in the past and also in the recent years that the reinforced concrete gives
the best performance output in durability. But when exposed to environment, it undergoes
drastic changes and only in certain cases, when certain part of its surface is exposed to
weather. For example, if we consider in the UK, the repair, encasement and refurbishment
work leads to extra resources. Possibly the worst scenario is the untimely weather
interruption and damage to the existing structure during repair stage. This may put loads of
man power, equipment and also importantly time. So, from practical point of view the best
way is to take the initiative step by facilitating the structure with excellent maintenance work
to overcome these problems.
Therefore, durability of reinforced concrete structure has widened up with the timely
implementation of new techniques. To cope up with the corrosion of reinforcement over
marine condition new techniques, viz., ECR or ECE, SLP model methods etc., where Fick’s
second law would be the best choice for certain techniques in practical conditions and also
more preferable one till date.

12
SCOPE AND OBJECTIVES 1.2
The main scope of this thesis is to investigate the removal of chloride contents and extract the
corrosion compounds from the concrete specimen. In order to achieve best results, following
objectives of this study are specified as follows:
• Apply two different current densities of I1 = 5 A/m2 and I2 = 3 A/m2. This will give
the individual result on amount of chloride removal in percentage and also the
diffusion coefficient. In order to study the chloride concentration of all the ions, the
anode boundary phase is left transparent to withdraw chloride ions. The behaviour of
the individual ions and chloride induced into the concrete specimen, diffusion
coefficient is examined by changing the parameters. • Apply direct current (DC) from the external cathode region, in order to extract and
removal of maximum chloride content speedily from the concrete region. To bring
out the two conceptual ideas, case 1, is modelled with single (#1) reinforcement
placed centrally having 12mm diameter bars with current density of 5 A/m2 and case
2, deals with three reinforcements (#3) at the top equally spaced between each bar
with constant current density of 3 A/m2, which is equal to (1.884 mA/m2) at the
anode. The diameter of the bar remains unchanged with 12mm (Radius = 0.006m). • The model created using the COMSOL Multiphysics package, a commercial software
program designed to simulate any physical process which can be described in the
form of a partial differential equations. Further this will be used to determine the
chloride removal and diffusion coefficient process and transport of ionic species,
followed by extraction of chloride content from the specimen.

13
ORGANISATION OF THE THESIS 1.3
The work is structured through five chapters. The contents of the each chapter are as under:
Chapter 2: Literature Review
It discusses the findings of other researches on durability of reinforced concrete structures in
a saline environment, various rates and forms of corrosion on steel, modes of deterioration,
deterioration mechanism, and their relevance to this work.
Chapter 3: Methodology
This chapter presents the approach of the thesis with the purpose to establish the basis of the
parameters as explained in the Literature review. It includes the descriptions of the steps
involved in investigating the study and identifies the elements required for chlorides removal
from the entire marine structures. It also involves some relevant examples on corrosion rates,
structures affected through free chloride contents depositing on the steel reinforcement and to
meet other goals aforementioned in Section - 1.2.
Chapter 4: Results and Discussions
This chapter discusses on the simulations conducted using pre-determined migration test
experimental data and its collection to execute the model analysis and findings. It also
provides two set of model analysis and comparisons to predict the amount of free chlorides
remaining in the specimen based on the original model created in Chapter 3. Finally, the
results obtained are compared with the simulated COMSOL Multiphysics model in
accordance to the aims and objectives of the study.
Chapter 5: Conclusion and Recommendation of the work
This chapter deals with the summary of the results, conclusion of the research work and
suggests the topics for further studies.

14
LITERATURE REVIEW 2
2.1 INTRODUCTION
Durability design of reinforced concrete (RC) structure in adverse environment is also most
commonly concerned with ensuring the ability of the concrete to resist the penetration of
aggressive agents and particles during its intended life time. As mentioned above, this largely
involves quality control measures. It may be during the mixing, execution and finishing
stages. The thickness of the cover layer protecting the reinforcement is also important during
these stages, because these cover layers are more susceptible to poor construction practices.
(Such as curing and inadequate compaction) in turn increases the penetration of aggressive
agents from the environment.
Therefore, durability Indexes (DIs) has been adopted as an engineering measures of the
potential resistance of the concrete cover to the transport of fluids and ions through concrete
as a medium. These transport mechanisms considered are gas permeability, water sorptivity
and chloride ion conductivity. Here we are going to fix the solution for durability problem
over the saline environment. For example, consider the chloride ingress into a fresh concrete
from saline environment. The chloride concentration graph within the concrete constantly
changes with respect to time. The chloride transportation in concrete is conventionally
described using Fick’s first law (Dr. Wayne Y. Wang, 2001):
𝑱𝒙 = −𝑫 𝒅𝑪𝒅𝒙
(1.0)
Where Jx (mole/m2.s) is the flux of the chloride through a cross section perpendicular to the
flow direction x (m). D (m2/s) is called the diffusion coefficient, and C (mole/m3) is the
concentration of chloride at a specific position along X.
The above equation defines that the flux (amount of chloride per unit area per unit time)
depends on the gradient (the grade of change) chloride concentration in x direction. The
negative sign indicates that the moving direction of chloride is from the point of high
concentration to that of lower concentration.

15
JIN JOUT
∆X
2.1.1 Brief history of durability of structures
When we go back to the history of civil engineering in the early days of 1970, the biggest
problems of the durability of the concrete structure concern head up in many countries.
United Kingdom was also not exempted from that severity of durability problem. Since then,
it has contributed in a complete change over in attitude to the design concept and construction
of many concrete structures as stated by (Dr. Wayne Y. Wang, 2001).
In practice there are two main basic concerns in building structural design:
1. The mechanical safety of the structure.
2. Strength of the materials.
For example, while we take durability concern for concrete structures over country wise. We
have major countries like USA, UK, New Zealand and the Middle East.
According to the study report given by (Dr. Wayne. Y. Wang, 2001) ‘’ In USA, de- icing of
salts lead to serious deterioration of the bridge decks due to corrosion of reinforcement. In the
UK, the strength of high alumina cement (which is having advantage of setting time of
concrete in early stage) was detected to be brought down with time due to the unstable of the
primary hydrated product (CAH10), which will convert to (C3AH6) ’’. These bring extreme
changes in the bonding and strength volume as time lapse. In the Middle East Chloride
induced concentration became a major problem of deterioration of concrete. If we consider as
a worldwide problem majority part of the problem is from Alkali-silica reaction causing
severe cracking in structures.
A A
Figure 2–1 A control volume of concrete (Dr. Wayne Y. Wang, 2001)
16
The basic idea to come out from this severe durability problem, one has to designing the
concrete structure according to the durability pattern.
Two simple steps in designing the durability pattern specified in (Dr. Wayne. Y. Wang,
Structural Design for Durability, tutorial notes, 2013, p. 2) are as follows:
Rectifying the aggressive nature of the condition to which the structure is exposed and
will be suitable to work in.
Select the material and design the structures accordingly, would be able to comply
with the environment within the service life of the structure.
BACKGROUND OF THE PROJECT 2.2
Concrete as an environment 2.2.1
The environment is gifted by good quality of concrete over the steel reinforcement is one of
the high and rich alkalinity due to the presence of combination of hydroxides of sodium,
potassium and calcium taken place during the hydration reactions. The enormous surrounding
concrete acts as a physical barrier to many of the steel’s aggressors. In such condition steel is
passive and any small break in its protective oxide film problems can immediately be fixed
and are soon repaired. If, however, the amount of alkalinity of its surroundings are depleted,
neither by naturalization with atmospheric carbon dioxide, nor due to depassivating anions
such as chloride are capable of reaching the steel medium; severe corrosion of steel
reinforcement can occur (Dr. Wayne. Y. Wang, 2001). As a result, in the latter stage create
problem of staining of the concrete by rust and spalling of the cover due to increase in
volume. This leads to conversion of iron into iron oxide which is termed as ‘Corrosion’ or
simply ‘Rusting’.
(Professor. Sudhir Mishra, IIT Kanpur, Concrete Engineering and Technology, online tutorial
lecture-26 on ‘’Reinforcement corrosion in concrete’’) suggested that ‘’ the actual
composition of pore solution mainly depends upon the constitution of the cement used, but in
principle our environment has very high amount of pH, the hydroxyl ions coming from the Ca
(OH) 2 formed during the cement hydration. This pH in concrete is reported to be in excess of
12-13. It also has pores of different sizes that allow material transport. Regardless of the
assumption made for the homogeneity, there are concentration gradients, presence of
aggregates (of different sizes), etc. It is thus homogeneous only macroscopically ’’.
17
Corrosion and passivation of steel reinforcement 2.2.2
Corrosion in steel is due to the exposed steel over the moist atmospheres (i.e. in presence of
air) surrounded by variations in the electrical potential on the steel texture forming combined
reaction of anodic and cathodic sites. The metal oxides at the anode where corrosion
formations according to (Lund, Maj. Technical reports, 1996) and (Broomfield, J. P, 2002)
are due to:
𝐹𝑒 (𝑚𝑒𝑡𝑎𝑙) → 𝐹𝑒2+(𝑎𝑞. ) + 2𝑒 − (1.1)
Simultaneously, reduction occurs at cathode sites. Where process of corrosion formations are
due to:
12 𝑂2 + 𝐻2𝑂 + 2𝑒−(𝑚𝑒𝑡𝑎𝑙) → 2𝑂𝐻. (𝑎𝑞. ) (1.2)
2𝐻+(𝑎𝑞. ) + 2𝑒 − (𝑚𝑒𝑡𝑎𝑙) → 𝐻2(𝑔𝑎𝑠) (1.3)
The electrons produced during the process are conducted through the metal while the rest of
the ions formed are carried via the pore water which acts as the electrolyte.
Factors adversely affecting corrosion rates of steel in concrete 2.2.3
The factors which determines the corrosion rates of steel in concrete as pointed out by
(Broomfield, J. P, 2002) are; the presence of an ionically conducting aqueous phase (aq.) (i.e.
pore water) in contact with the steel surface, and also the existence of anodic and cathodic
sites on metal bounded with this electrolyte and availability of oxygen to react which enables
to proceed the corrosion. Table 2-1 shows the major contribution of individual ions from sea
water across the world leading to corrosion rate of steel.

18
Table 2-1 Concentration of Major Ions in Some of the World Seas
Moreover, permeability of concrete is very important to determine the extent to which the
aggressive external sources can attack the steel medium. In order to ward off ‘depassivation’,
a thick cover with low permeability is more likely important, which avert the access of
chloride ions from an external source reaching the steel medium (Broomfield, J. P, 2002).
Ideal condition 2.2.4
There can still be little more doubt about more effective and constructive way of protecting
the steel, which is embedded in concrete, is to provide it with an adequate depth of cover by
high strength, low permeability concrete free from depassivating ions such as chlorides.
However, in real world, concrete is laid by the tonne in all extreme weathers and
environments, exposed to industrial atmospheres, de-icing salts and seawater.
Practical condition 2.2.5
The reinforced concrete structure for the chosen project is, to construct over the marine
environment, which always have threat from corrosive agents, viz., chloride attack and
carbonation as demonstrated in the reports of (Broomfield, J. P, 2002) and (Tuutti. K, 1982).
Therefore, the structure is more likely and undoubtedly to get affected by contamination,
namely; neither through industrial waste nor through transport of electrochemical conditions,
sea water containing chemicals, reactions taking place between the mix proportions resulting
in breakdown of workability and change over in the nature of concrete mix design and ionic
charges between reinforcement members. Consequently, contaminated materials and poor
workmanship are hard to take out completely by our understanding, the often complex forms
of chemical and electrochemical conditions that can exist. It should be possible to take the
19
structures which will last long into the next century by possible ways of developing structures
accordingly. So it is easy to preclude poll of cost in extra workmanship and material
processing.
Deterioration mechanism 2.2.6
Deterioration mechanism mainly takes place in two different ways. The first form; according
to (Dr. Wayne. Y. Wang, tutorial notes, 2013) is associated with chemical process (i.e.
chemical deterioration of cement paste) and secondly by corrosion of reinforcement. Majority
of reinforced concrete around the globe performs efficiently, adequately and may arise only
few problems. Rest, the minority of structures deteriorate, neither by the action of aggressive
components from the external source like environment nor due to incompatibility of the mix
design constituents. Possible problems have been raised as a result of incomplete or
inaccurate site investigation, due to poor workmanship, poor design procedures, badly
specified concrete and a range of various other factors.
Stages in deterioration 2.2.7
There are various stages involved in deterioration of reinforced concrete. (Lund, Maj 1996)
discuss the idea that, the mechanism of deterioration are primarily due to chemico- physical
in nature (i.e. a chemical reactions as a formation of products which is greater in volume than
the reactants leading only the physical effects such as cracking and spalling) and occurs in
three different discrete stages:
Stage 1: Initiation phase (t0)
Stage 2: Propagation phase (t1) &
Stage 3: Deterioration phase (t2)
Stage 1: Initiation phase (to) – Concentration of aggressive constituent is insufficient to
initiate any chemical reaction or the chemical reaction is occurring in a very slow rate
process. Initiation is achieved completely either by neutralisation of the concrete around the
reinforcement, so-called carbonation, or by an excessive chloride concentration around the
reinforcement. The rate of corrosion after initiation is determined by the electrochemical
conditions in and around the corrosion area as illustrated by (Lund, Maj technical reports,

20
1996). Therefore, no physical damage has occurred. The duration of to may vary from few
minutes to the design life of the structure.
Stage 2: Propagation phase (t1) – Chemical reactions may begin or are continuing process,
some physical damage may occur, but it is insufficient to cause distress. The amount of
acceleration of deterioration process usually occurs during this propagation stage is due to the
increased accessibility of aggressive ions or due to modification of the concrete nature.
Stage 3: Deterioration phase (t2) – Deterioration occurs due to rapid breakdown of the fabric
structure. Here combined effect of both physical and chemical processes are of sufficient
severity that the structure becomes no longer provides good serviceable (failure occurs) and
major remedial work or in extreme cases, demolition is required.
Modes of Deterioration 2.2.8
Deterioration of concrete as illustrated by (Paul Lambert, 2002 (updated report published on
2013)) and (Wayne. Y. Wang, 2001) may occur due to a number of chemical bodies, physical
bodies and of various mechanisms. These may include:
I. Chemical deterioration of cement paste and
II. Corrosion of reinforcement, mainly due to;
Chloride ion concentration
Carbonation process or Neutralization
Change in rebar environment leading to (impinging cracks)
Sulphate attack of concrete
Salt recrystallization (exfoliation)
Soft water/acid attack of concrete
Alkali Aggregate reaction (AAR)
Thermal incompatibility of concrete components (TICC)
Shrinkage
Frost Damage
Deterioration by hydrolysis of cement paste constituents
Deterioration by salts
Deterioration by acids
Deterioration by Alkali-silica reaction (ASR)
21
Leaching by soft water (Hydrolysis)
Freeze and thaw attack
Meanwhile, if we consider as a two different sectors from the above list,
(I). Chemical deterioration of cement paste constitutes the following process;
The constitution of cement paste.
Deterioration by hydrolysis of cement paste constituents.
Deterioration by acids.
Deterioration by salts.
Deterioration by combination of alkali-silica reaction.
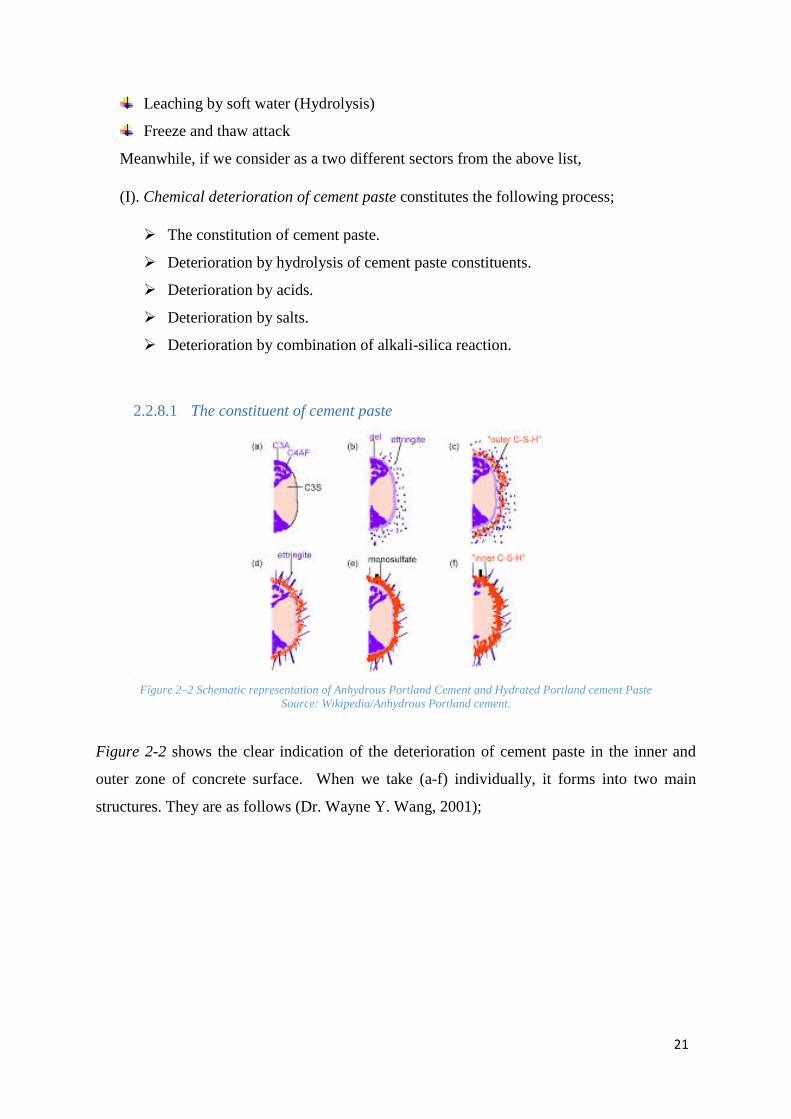
The constituent of cement paste 2.2.8.1
Figure 2–2 Schematic representation of Anhydrous Portland Cement and Hydrated Portland cement Paste
Source: Wikipedia/Anhydrous Portland cement.
Figure 2-2 shows the clear indication of the deterioration of cement paste in the inner and
outer zone of concrete surface. When we take (a-f) individually, it forms into two main
structures. They are as follows (Dr. Wayne Y. Wang, 2001);

22
Anhydrous Portland cement Hydrated Portland Cement Paste
Fast
Slow
Fast
CaSO4·2H2O 3CaO·Al2O3·3CaSO4·32H2O
Figure 2–3 Constitution of Anhydrous and hydrated Portland cement paste (Dr. Wayne. Y. Wang, 2001)
The composition of anhydrous Portland cement
Tri-calcium silicate (3CaO·SiO2)
*C: CaO (Lime); S: SiO2 55-60%
Di-Calcium silicate (2CaO·SiO2) 10-25%
Tri-calcium aluminate (3CaO.Al2O3) 10%
Tetra-calcium aluminoferrite (4CaO·Al2O3·Fe2O3) 10%
Gypsum (CaSO4·2H2O & alkalis (Na2O/K2O) 5-10%
**A: Al2O3; F: Fe2O3 (Ferric oxide); S: SO4(Sulphate); H= H2O Figure 2–4 Composition of anhydrous Portland cement (Dr. Wayne Y. Wang, 2001)
C3S
C4AF
GYPSUM
C-S-H
Gel
80%
C-A-Ṡ-H
20%
Ettringite, a crystal of calcium
sulpho-ferri-alluminate hydrate
Calcium Silicate Hydrate
C3S
C2S
C3A
C3AF
Gypsum
C2S
C3A
CH
20% Portlandite, a crystal of Ca (OH) 2

23
Figure 2–5 Calcium Silicate Hydrate & CH crystal
Source: Wikipedia/ CH crystal and CSH
As mentioned above in the Figure 2-5, Calcium Silicate Hydrate (C-S-H) constitutes up to
50-60% of hydrated Portland cement paste. It also includes a fibrous layer like structure with
a very surface area and high density (Dr. Wayne Y. Wang, tutorial notes, 2013, p. 6). These
two play a vital role in determining the properties of the paste. It has a significant
contribution towards strength of the material due to its compact structure.
Figure 2–6 Calcium hydrate composition
Source: (www.cementlab.com/ Calcium hydrate composition)
When it comes to calcium hydrate (CH) as shown above in Figure 2-6, ‘’20-25% of its
volume is occupied by hydrated Portland cement paste. One of its peculiar forms is that, large
crystals with distinctive hexagonal-prismatic plates with low surface area. Thus, its
contribution towards the strength of the material is also limited due to its considerable lower
surface area when compared with C-S-H. It has a high solubility, less chemical durability
under acid attack (Dr. Wayne Y. Wang, tutorial notes, 2013, p. 7).’’
Crystal flower
composition
constitutes C-S-H
CH crystal
Hexagonal–prismatic
plate shaped CH

24
Deterioration by hydrolysis of cement paste constituents 2.2.8.2
Soft waters, resulting from melting of snow, ice or rain coming in contact with concrete, tend
to hydrolyse or dissolve the calcium containing products; for e.g., (Ca (OH)2. However,
generally hard waters, [ground water, lake water, and river water] do not participate in this
reaction. Ca (OH) 2 is more susceptible to hydrolysis due to its higher solubility compared to
other components of the cement paste (C-S-H). When water comes in contact with Portland
cement paste, the dissolved content of the CH will be washed away. Thus deterioration
decreases strength of concrete, increase in porosity and reduction in durability there by
causing aesthetic damage. The leachate can also react with CO2 in presence of air, leading to
precipitation of calcium carbonate on the surface. This phenomenon is termed as
efflorescence (Dr. Wayne Y. Wang, tutorial notes, 2013, p. 7).
Contribution of Ettringite (𝑪 − 𝑨 − 𝑺 −𝑯) 2.2.8.3
Ettringite is a hydrous calcium aluminium sulphate material having chemical formula Ca6 ·
Al2 · (SO4) · 3(OH) 12 · 26H2O. It is usually colourless in nature to yellow crystallizing in the
trigonal shape. The needle-shaped prismatic crystals are always colourless but turns white on
partial dehydration process (Dr. Wayne Y. Wang, tutorial notes 2013).
Figure 2–7 Prismatic and trigonal shaped Ettringite
Source: (Wikipedia/Ettringite)
When it comes to its properties, Ettringite contribution is limited in amount and it is having
minor amount of effect on the material properties of the concrete. It is having only 15-20% of
the volume of hydrated Portland cement paste and its structural stability lies in between C-S-
H and CH.
Colourless to yellow
mineral, trigonal
shaped crystals of
Ettringite (C-A-Ṡ-H)

25
Deterioration by acid attack 2.2.8.4
Acid attack is also known as the Cation-exchange between acid solutions to the constituents
of Portland cement paste. But, deterioration of concrete by acids is primarily the result of
compounds of chemicals and calcium hydroxide of the hydrated Portland cement. In most
cases, the chemical reaction results in the form of water soluble calcium compounds which
are then leached away by aqueous solutions Swamy (2002). One of the major cause is by
carbonic acid attack also termed as ‘’carbonation’’.
Carbonation is when reaction takes place between presence of lime in concrete and CO2 from
air, yielding calcium carbonate. When CO2 dissolved into water, forming a weak carbonic
acid (Dr. Wayne Y. Wang, tutorial notes 2013). The reaction by acid attack compound is as
follows:
𝐻2𝑂 + 𝐶𝑂2 = 𝐻2𝐶𝑂3 (1.4)
Figure 2–8 Process of deterioration of steel by carbonic acid attack Courtesy: (e-Learning VTU E-notes, Unit7, Concrete Technology)

26
Figure 2–9 Carbonation of concrete process and PH value range
Source: (e-learning.vtu.ac.in/E-Notes by Dr. M. Nagesh, 2012/Concrete Technology)
Deterioration by salts 2.2.8.5
Many salts when they dissolved in presence of water are bound to take reactions with the
Portland cement components. These reactions when combined with cement paste or its
components leading to attack by ammonium and magnesium salts causing erosion attack,
sulphate attack leading to expansive attack. Thus making the material mix weaker and results
in corrosion of steel. The relation of the sea-salt particles and the penetration of chloride into
concrete is when: the sea-salt particles volume is greater than 0.12mg/dm2/day, the
penetration of chloride particles tends to increase suddenly [Sakugawa, Sakuta et al. (1985)].
For example, 1: Attack of ammonium salts: ‘’Ammonium salts are widely and commonly
found in agriculture and fertilizer nature. These salts are capable of transforming cement
paste of Portland cement into highly soluble salts’’ (Dr. Wayne Y. Wang, tutorial notes 2013,
p. 8). The reaction process retrieved from (Dr. Wayne Y. Wang, tutorial notes 2013, p. 8) can
be formed as:

27
Cation exchange
2𝑁𝐻4𝐶𝑙(𝑎𝑚𝑚𝑜𝑛𝑖𝑢𝑚 𝑐ℎ𝑙𝑜𝑟𝑖𝑑𝑒) + 𝐶𝑎(𝑂𝐻)2 → 𝐶𝑎𝐶𝑙2 + 2𝑁𝐻4𝑂𝐻 (1.5)
(𝑁𝐻4)2𝑆𝑂4(𝑎𝑚𝑚𝑜𝑛𝑖𝑢𝑚 𝑠𝑢𝑙𝑓𝑎𝑡𝑒) + 𝐶𝑎(𝑂𝐻)2 → 𝐶𝑎𝑆𝑂4 + 2𝑁𝐻4𝑂𝐻
Equation (1.5) is extracted from (Dr. Wayne. Y Wang/Structural Design for Durability,
(2013), p.8)
From the above case, we can observe that all the four products are soluble. The results of
these soluble natures cause the erosion by increasing both permeability and porosity.
Example 2: Attack by magnesium salts: ‘’Bicarbonates of magnesium (𝑀𝑔(𝐻𝐶𝑂3)2) are
abundantly found in ground water, sea water and some industrial effluents’’. The reaction
process proposed below given by (Dr. Wayne Y. Wang, tutorial notes 2013, p. 9) can be
written as:
𝐶𝑎(𝑂𝐻)2 + 𝑀𝑔2+ → 𝑀𝑔(𝑂𝐻)2 + 𝐶𝑎2+ + 2𝐻2𝑂 (1.6)
𝐶𝑆𝐻−𝑔𝑒𝑙 + 𝑀𝑔2+ → 𝑀𝑔(𝑂𝐻)2+𝐶𝑎2+ + 𝑆𝑖𝑂2 + 𝐻2
Here magnesium salts reacts first with calcium hydrate (CH), forming soluble magnesium
hydroxide (𝑀𝑔(𝐻𝐶𝑂3)2), at the same time, magnesium has a tendency to react with CSH gel
as well.
Example 3: Sulphate attack: Sulphate attack takes two forms: (Dr. Wayne. Y
Wang/Structural Design for Durability, (2013), p.10)
(i) Internal attack and
(ii) External attack.
External attack: External sources of sulphate are more common in ground water, magnesium
sulphate (𝑀𝑔𝑆𝑂4) and alkali sulphate (𝑁𝑎2𝑆𝑂4) are generally present. All these can be the

28
result of high-sulfate soils and ground water, or can be the result of atmospheric change and
also from industrial waste pollution. In agriculture soil and water, ammonium sulphates
((𝑁𝐻4)2𝑆𝑂4) are present in abundance. The effluent from industry furnaces which contain
high amount of sulphur (S) fuels may contain sulphuric acid ((𝐻2𝑆𝑂4).
Subsequently, when sulphate ions penetrate into the concrete region in addition to
contaminated water, they may react with the free lime components (CaO) and CH ((OH) 2) in
pore water to form gypsum. The reaction equation (1.7) below extracted from (Dr. Wayne Y.
Wang/Structural Design for Durability, (2013), p. 9) as follows:
𝐶𝑎2+ + 𝑆𝑂4 2− + 2𝐻2𝑂 → 𝐶𝑎𝑆𝑂4 · 2𝐻2𝑂 (1.7)
Meanwhile, this end product of gypsum continues to react with calcium aluminate hydrates in
concrete to form Ettringite.
Internal attack: DEF sometimes referred to as internal attack of sulphate may also be
combined into the concrete during the mixing process. An external source of sulphur is not
necessarily needed for this type of deterioration to occur.
Sulphate attack also involves Ettringite formation, but it occurs because of a different
process. Albeit, the formation of reactions is different, the effect is similar. Thus resulting in
crystalline or gel- like substance formation within the hardened concrete, causing it to expand
or crack. This Delayed Ettringite Formation (DEF) which expands in its volume and
formation of crack causes gap at the interface between aggregates and cement paste. All these
reactions are catalysed by moisture content, and steadily and gradually progress into the
surface of the concrete as cracking allows deeper water penetration.
Deterioration by Alkali- silica reaction (ASR) 2.2.8.6
Alkali-silica reaction is also referred in terms of ASR, alkali- silica reaction formation is a
chemical reaction caused by combined properties of the aggregates and cement respectively
[Swamy (2002),(D. Matthew Stuart, PDH online course S155 (1 PDH), 2013, p. 7)].
Cracking in alkali silica reaction (ASR) takes various patterns. In plain concrete and in parts
of reinforced concrete structures, where there is little or no surface reinforcement. Cracking
tends to be irregular and map-like. In reinforced and prestressed concrete elements, cracking
Gypsum

29
tends to occur in the direction of the reinforcing bar (Ono 1988). According to (Dr. Wayne
Y. Wang, 2001), alkali-silica reaction is a reaction between the hydroxyl ions (OH-) in the
pore solution of concrete and the reactive forms of silica contents in the aggregate, such as.,
Chert, quartzite, opal, strained quartz crystals. For example,
𝑆𝑖𝑂2 + 2𝑁𝑎𝑂𝐻 → 𝑁𝑎2𝑆𝑖4𝑂9(𝑠𝑜𝑑𝑖𝑢𝑚 𝑡𝑒𝑡𝑟𝑎𝑠𝑖𝑙𝑙𝑖𝑐𝑎𝑡𝑒) + 𝐻2𝑂 (1.8)
Figure 2–10 Alkali-Silica Reaction Sequence (Thomas, M.D.A., Fournier, B., Folliard, K.J., 2013)/ Alkali Aggregate Reactivity (AAR) Facts Book. Retrieved from
(http://www.fhwa.dot.gov/pavement/concrete/asr/pubs/hif13019.pdf )
As explained above in the DEF process, the reaction result will be the same by means of its
increase in volume. Overall, the products of alkali-silica gel taking up more water and
exerting and expansive pressure on the surface causing serious expansion and cracking
process in the concrete. The reaction formula (1.9) followed by diagrammatic representation
of ASR, shown in (Figure 2-11 a & b), are as follows,
𝑆𝑖𝑂2 + 2𝑁𝑎𝑂𝐻 → [𝑁𝑎2𝑆𝑖4𝑂9(𝑠𝑜𝑑𝑖𝑢𝑚 𝑡𝑒𝑡𝑟𝑎𝑠𝑖𝑙𝑙𝑖𝑐𝑎𝑡𝑒)] + 𝐻2𝑂 (1.9)
Alkali-silica gel

30
Figure 2–11 (a) Shows the ASR process and (b) shows the adverse ASR damage on Retaining wall
Courtesy: (ASR damage/ http://en.wikipedia.org/wiki/Alkali%E2%80%93silica_reaction )
Deterioration by Freeze/Thaw Damage 2.2.8.7
(D. Matthew Stuart, 2013, p. 6) described that, ‘’wet concrete and freezing conditions are a
bad combination. Water expands when it freezes. If trapped in concrete, it creates outward
pressure on the surrounding material. Concrete subjected to freeze/thaw cycles is typically
air-entrained by adding a chemical admixture to the concrete. The resulting air bubbles
provide space to accommodate the expansion of the freezing water.’’
(D. Matthew Stuart, 2013, p. 6) also noticed that, Freeze/thaw damage generally occurs in
two forms. ‘’The first is common to open parking decks and other horizontal surface that
collect standing water. We can observe from (Figure 2-12 and 2-13) that, ‘Freeze/thaw
cycles’ gradually deteriorates the concrete surface, revealing aggregate and leaving the
concrete with an eroded impression. As the surface ‘breaks down’, it becomes more porous,
which in turn lead to severe deterioration problems.’’
Deck scaling and cracking
Figure 2–12 Freeze-thaw Resistance/Deck scaling
Source: (Portland cement Association) (http://www.cement.org/for-concrete-books-learning/concrete-technology/durability/freeze-thaw-resistance)

31
As illustrated by (D. Matthew Stuart, 2013, p. 6), the second form of freeze/thaw damage is
associated with water freezing in cracks. As shown in (Figure 2-13), one important
mechanism appears to be surface densification. Meanwhile, a larger concentration of water
can collect in a crack than in a naturally occurring surface pores. Consequently, the resulting
destruction will be more rapid and dreadful. Cracks also enable water to penetrate directly to
the reinforcing steel member. This may initiate or accelerate corrosion and other moisture-
related forms of deterioration.
Figure 2–13 Freeze-thaw cycles/D-Cracking Source: (Portland cement Association)
Deterioration by Alkali Aggregate Reaction (AAR) 2.2.8.8
Alkali-aggregate reaction (AAR), a harmful chemical reaction between certain mineral
phases of the aggregates and the alkali hydroxides of the concrete pore solution, is one of the
main deleterious process affecting the durability of concrete infrastructure globally (Sanchez,
Fournier et al. 2015). The number of structures affected by AAR is relatively small compared
to that of those concrete structures built, but the resulting affect has been found in many
countries around the world.
According to (Dr. M. Nagesh, ‘’Concrete Durability’’/ VTU EDUSAT SERIES 16th
PROGRAM, 2012) & (Ichikawa 2009) most of the structures which are severely affected and
cracked by AAR, are commonly exposed to the weather or laid underground in contact with
the damp or moisture soil. This is because presence of moisture is more essential to form
significant amount of expansion over the concrete. Consequently, presence of alkali content
is also more important apart from moisture. It is also found that, when there is sufficient
amount of moisture and alkali, maximum expansion of concrete due to AAR reduces with
32
respect to the constituents of reactive minerals in aggregates is within the sensitive region.
This is sometime referred as ‘pessimum’ content. Contents of these reactive minerals below
or greater than the pessimum value, reduction in the AAR expansion can be observed.
Reactive Aggregate 2.2.8.9
Reactive aggregates are the aggregates either in the form of coarse or fine aggregate, in order
to reduce the ASR expansion compared to that of control mortars used instead or to increase
its efficiency and performance over the mechanisms responsible for ASR reduction.
General types of AAR (Mingshu 1992) and (Dr. M Nagesh, 2012) 2.2.8.10
Alkali-silica reaction
Alkali-silicate reaction and
Alkali carbonate reaction
As explained before in the section (2.2.8.6), Alkali-silica reaction is a reaction when the
reactive silica phase in an aggregate particle is attacked and dissolved by the alkali
hydroxides in the presence of concrete pore solution. A reactive product and free silica gel
contents in the aggregate rise to form and swells in the presence of water.
𝑆𝑖𝑂2 + 2𝑁𝑎𝑂𝐻 + 𝐻2𝑂 → 𝑁𝑎2𝑆𝑖𝑂3 · 2𝐻2𝑂 (2.0)
Silica Alkali Water Alkali-silica gel (Dr. M Nagesh, 2012)
Subsequently, (Dr. M Nagesh/Concrete Durability, (2012)/ VTU EDUSAT SERIES 16th
PROGRAM, p.24) stated that, ‘’alkali-silicate reaction is the same as alkali-silica reaction
except that in this case reactive constituents is not the free silica, but present in the combined
form of phyllosilicates.’’
Alkali-carbonate reaction referred to as ACR occurs in concrete when an alkali reacts with
certain dolomitic lime stones containing clay. As illustrated in Portland Cement Association
(PCA) publication, 2002, p. 9), ‘’Dedolomitization, the breakdown of dolomite, is normally
associated with expansion. This reaction and subsequent crystallization of brucite may tend to
cause allowable expansion.’’

33
The deterioration precipitated by alkali-carbonate reaction is similar to that caused by ASR;
however, ACR is relatively infrequent because aggregates vulnerable to this phenomenon are
less common and are usually inappropriate for use in concrete for other reasons. Aggregate
susceptible to ACR tend to have a characteristic texture that can be indicated by
petrographers’’. Unlike carbonate reaction, the use of additional cementing materials owing
to ACR does not prevent deleterious expansion (Portland Cement Association, 2002, p. 9).
According to (Dr. Mor & Associates, Inc., 1997-2008), the best way to overcome and surpass
ACR damage, viz., by using non-reactive aggregates, reducing available hydroxides, taking
control on moisture and temperature and also by minimizing porosity. It is recommended that
ACR susceptible aggregates not be used in concrete (Farny, Kosmatka et al. 1997).
The actual reaction formation process of ACR over the concrete structure is shown in
(Figure. 2-14).
Figure 2–14 Alkali-carbonate reaction process
Courtesy: (Wikipedia/Alkali-carbonate reaction)
Thermal Incompatibility of concrete components (TICC) 2.2.8.11
According to (Fu, Wong et al. 2004), when a cement- based concrete material is subjected to
elevated temperatures, the difference in thermal properties of the cementitious matrix and the
aggregate inclusions induces thermal stresses and possibly cracking in the concrete. The
author also mentioned in his research report, which he extracted from ‘Venecanin
investigations’ stating - ‘’greater the mismatch in the mechanical and thermal properties
between the matrix and the inclusion, the more significant would be the reduction of strength,
elasticity modulus, and durability of concrete’’. But remarkable definition for ‘TICC’ given
by (Venecanin (1990)) states that, ‘’unequal change in volume of concrete components, when
concrete is exposed to certain temperature changes, cause crack in concrete and drastically

34
reduces its durability’’. This phenomenon is often called thermal incompatibility of concrete
components ‘(TICC)’. This occurs when aggregate of low coefficient of thermal expansion
(CTE) is used and carbonate rocks often have low ‘CTE’.
2.3. Shrinkage
Concrete specimens slowly deforms with respect to time even in absence of applied loads.
These deformations are called shrinkage when temperature is constant (Bazant and Wittmann
1982). It is more important to find out the strain induced on concrete which we call it as
shrinkage strain. Therefore, (Bazant, PANULA et al. 1992) used his own method called ‘BP-
KX model’ to predict the shrinkage effect over the concrete surface. Accordingly, it is
complex in nature to figure out both creep and shrinkage prediction. This is not due to
inherent theoretical complexity but to the fact that there are many factors that influence creep
and shrinkage and most of them are taken into consideration, with a broad range of variation.
The shrinkage formations are shown below in (Figure 2-15a) and (b) respectively.
(a) (b)
Figure 2–15 (a) Shrinkage causing crack and (curling in later stage) on beam bottom (Tension zone) and (b) shrinkage
crack appeared on floor slab (compression zone leading to curling of floor slab/concrete)
Courtesy: (Wikipedia/ Shrinkage of concrete)
In most practical circumstances, however, many of these factors have similar values and can
be taken into consideration to vary only over a certain limited range. To overcome the
shrinkage effect and to fix the shrinkage prediction, simplified formula [2.1 - 2.3] can be used
according to (Bazant, PANULA et al. 1992):

35
Simplified Formula for Shrinkage
𝜀𝑠ℎ(𝑡, 𝑡𝑜) = 𝜀𝑠ℎ∞𝐾𝑠ℎ(𝑡) 𝑤ℎ𝑒𝑟𝑒, = 𝑡 − 𝑡𝑜 (2.1)
For time curve
𝑆() = tanh 𝜏𝑠ℎ (2.2)
Where,
𝑡 = 𝑡𝑖𝑚𝑒, 𝑟𝑒𝑝𝑟𝑒𝑠𝑒𝑛𝑡𝑖𝑛𝑔 𝑡ℎ𝑒 𝑎𝑔𝑒 𝑜𝑓 𝑐𝑜𝑛𝑐𝑟𝑒𝑡𝑒
𝑡𝑜 = 𝑎𝑔𝑒 𝑤ℎ𝑒𝑛 𝑑𝑟𝑦𝑖𝑛𝑔 𝑏𝑒𝑔𝑖𝑛
= 𝑑𝑢𝑟𝑎𝑡𝑖𝑜𝑛 𝑜𝑓 𝑑𝑟𝑦𝑖𝑛𝑔 (𝑎𝑙𝑙 𝑡ℎ𝑒 𝑡𝑖𝑚𝑒 𝑚𝑢𝑠𝑡 𝑏𝑒 𝑔𝑖𝑣𝑒𝑛 𝑖𝑛 𝑑𝑎𝑦𝑠)
𝜀𝑠ℎ∞ = 𝑢𝑙𝑡𝑖𝑚𝑎𝑡𝑒 𝑠ℎ𝑟𝑖𝑛𝑘𝑎𝑔𝑒 𝑠𝑡𝑎𝑖𝑛
𝜏𝑠ℎ = 𝑠ℎ𝑟𝑖𝑛𝑘𝑎𝑔𝑒 ℎ𝑎𝑙𝑓 − 𝑡𝑖𝑚𝑒
ℎ = 𝑟𝑒𝑙𝑎𝑡𝑖𝑣𝑒 ℎ𝑢𝑚𝑑𝑖𝑡𝑦 𝑜𝑓 𝑒𝑛𝑣𝑖𝑟𝑜𝑛𝑚𝑒𝑛𝑡 (0 ≤ ℎ ≤ 1)
For humidity dependence,
𝑘ℎ 1 − ℎ3 𝑓𝑜𝑟 ℎ ≤ 0.98−0.2 𝑓𝑜𝑟 ℎ = 1
𝑙𝑖𝑛𝑒𝑎𝑟 𝑖𝑛𝑡𝑒𝑟𝑝𝑜𝑙𝑎𝑡𝑖𝑜𝑛 𝑓𝑜𝑟 0.98 ≤ ℎ ≤ 1 (2.3)
Admissible Parameter Range for Shrinkage (Bazant, PANULA et al. 1992)
The simplifications of the formula from the above equation steps 2.1 to 2.3 were attained by
restricting the ranges of certain parameters. For the following parameters the present
formulas usually give very good results, their deviations from the formulas in equation steps
2.1 to 2.3 being relatively small.
For shrinkage,
1.0 ≤ 𝑘𝑠 ≤ 1.3 𝑡𝑜 ≤ 7 𝑑𝑎𝑦𝑠
13 ≤ 𝑇 ≤ 37 1 ≤ 𝑎 𝑠 ≤⁄ 2.6
36
For the above mentioned parameter values the shrinkage predictions can be predicted based
on the equations [2.1 & 2.2]; i.e.
𝑘𝑠 = 1.5 (𝑠ℎ𝑎𝑝𝑒 𝑓𝑎𝑐𝑡𝑜𝑟 𝑓𝑜𝑟 𝑎 𝑐𝑦𝑙𝑖𝑛𝑑𝑒𝑟)
𝑡𝑜 = 10 𝑑𝑎𝑦𝑠 ; 𝑇 = 23 ; 𝑎 𝑠 ≤ 2.6⁄ ; 𝑡′ = 𝑡𝑜
2.4. Frost Damage
Frost damage, according to (Lund, Maj 1996) & (Everett 1961) is nothing but the concrete
exposed to the moisture environment in the presence of oxygen. The concrete associate with
the temperature change, i.e. seasonal changes (Heating and Cooling effect), thus the top layer
is prone to have cracked effect during summer heat and moisture to penetrate into the deeper
section causing frost damage during winter cooling effect respectively. There are two main
frost damage to cope with; (i) internal damage causing loss of cohesion of the concrete and
loss of bond to the reinforcement. (ii) Surface scaling, gradually reducing the concrete cover
protecting the reinforcement and causing aesthetic damage.
As stated in (Section 2.4), internal frost damage is mainly due to concrete surpassing the
critical level of saturation process. To overcome this type of situation is only possible by
introducing an entrained air-pore system of sufficiently high quality. Then only the cement
material or cement paste will be protected. If the concrete is provided with non- porous
aggregate (moisture free) and provided there are no defects in the concrete structure, concrete
will be of frost resistant.
Surface scaling of the concrete surface occurs when concrete surface is in constant
connection with the freeze/thaw. The mechanism behind surface scaling is still a questionable
and unclear problem. Each new freezing gives rise to additional scaling formation. This is
mainly due to the functionality of the minimum freezing temperature. The amount of surface
scaling is taking place over the past decade, and at present condition, leading the researchers
to trace out the future effect and come up with a new solution for it.

37
(II). Corrosion of reinforcement
The corrosion of reinforcement is a serious problem due to reduction of reinforcement, since
the volume of the rust product is higher than the volume of the corroded steel. The porous
zone, which is located around either steel or concrete surface, can to some extent absorb the
higher volume of the rust products. However, at certain times, the total amount of corrosion
products exceeds the required amount of corrosion products to fill the porous zone around the
reinforcement.
Subsequently, the rust product will then exert expansive pressure on the surrounding
concrete. Due to these expansive pressures exerted on the concrete medium will initiate
tensile stresses near the reinforcement. After some time tensile stresses go further with
increasing corrosion rate and reach the critical value developing corrosion cracks. With
further production of rust, the crack opening will increase and eventually result in spalling.
More research work is needed to understand the final stage of corrosion processes, and to
overcome and clarify these important problems for a corroded reinforced concrete structure.
Corrosion of reinforcement takes place in two ways: (Dr. Wayne Y. Wang, 2001)
1. Pit corrosion due to chloride presence
2. Carbonation and Corrosion.
By looking at Figure 2-16 (a), we can observe that, reaction process takes place in
various forms and the extracted three reaction equations from (Dr. Wayne Y. Wang,
2001) are as follows:
Figure 2–16 (a) Schematic representation of corrosion of reinforcement and its reaction process (b) Progression of
corrosion of reinforced concrete Courtesy: Wikipedia/ corrosion of reinforcement

38
𝐹𝑒2+ + 2𝑂𝐻− → 𝐹𝑒(𝑂𝐻)2 (𝐹𝑒𝑟𝑟𝑜𝑢𝑠 ℎ𝑦𝑑𝑟𝑜𝑥𝑖𝑑𝑒) (2.4)
4𝐹𝑒(𝑂𝐻)2 + 𝑂2 + 2𝐻2𝑂 → 4𝐹𝑒(𝑂𝐻)3 (𝐹𝑒𝑟𝑟𝑖𝑐 ℎ𝑦𝑑𝑟𝑜𝑥𝑖𝑑𝑒)𝑖𝑛𝑠𝑜𝑙𝑢𝑏𝑙𝑒 (2.5)
2𝐹𝑒(𝑂𝐻)3 → 𝐹𝑒2𝑂3 · 2𝐻2𝑂 + 𝐻2𝑂 ( 𝐻𝑦𝑑𝑟𝑎𝑡𝑒𝑑 𝑓𝑒𝑟𝑟𝑖𝑐 𝑜𝑥𝑖𝑑𝑒(𝑅𝑢𝑠𝑡)) (2.6)
It is observed from the above equation [2.6] that, the volume increase of the rust is 2-10
times, which could lead the concrete to crack and spalling in the later stage.
1. Pit corrosion
In this process the chloride, which is an anion of a strong acid and many metal substances
having cations displays a certain amount of considerable solubility in chloride reactions.
Later on this will perform as a catalyst for oxidation (Air) of the iron by taking a major role
during the reaction stage. Thus an insoluble porous cap of ferric hydroxide 𝐹𝑒(𝑂𝐻)3 as
shown in [Equation 2.5] starts developing at the pit mouth. Figure 2-17 (a) on the left and
Figure 2-17(b) on the right shows the pitting corrosion with the reaction cycle and its
corrosion effect on reinforcement respectively.
(a) (b)
Figure 2–17 Pitting corrosion and corrosion effect on reinforcement Source: (Wikipedia/Pit Corrosion)

39
2. Carbonation and corrosion
Carbonation is the term used to indicate the effect of carbon dioxide (CO2) on concrete.
According to Bouquet, G.C (2002), influence of carbonation on concrete is of paramount
importance as it affects the life span of the concrete structure when corrosion of
reinforcement takes place. This is because the diffusion of CO2 into the surface of concrete
due to the concentration difference between the atmosphere and the concrete pore structure.
Thus resulting in depletion of alkalinity level and promotes the reinforcement member to be
exposed to the danger of corrosion. Subsequently, corrosion causes the concrete to deteriorate
and disintegrate. Figure 2-18, shows the carbonation and its corrosion effect on
reinforcement in hippodrome Wellington, Belgium.
Figure 2–18 Carbonation and corrosion effect on reinforcement
Source: (Wikipedia/ carbonation and corrosion effect on reinforcement)
The dissolution of Ca (OH) 2 takes place due to dissolved CO2 in pore water condition. The
reaction formula demonstrated according to (Dr. Wayne Y. Wang, 2001) will be,
𝐶𝑎(𝑂𝐻)2 + 𝐶𝑂2 + 𝐻2𝑂 → 𝐶𝑎𝐶𝑂3 + 2𝐻2𝑂 (2.7)
Carbonation also results in major breakdown by lowering the pH value of the pore solution in
concrete(𝑝𝐻 ≈ 6~8). The pH of the pore solution in fresh concrete is approximately figuring
12.6. When, pH value falls below 9, the FeO passive film on the surface of re-bar breaks
down.
40
• Detailed study of corrosion rate measurements in a marine environment.
This documented case study in the following sections below brings out the practical issues
with the corrosion process and rate of corrosion in accordance with the service life of steel
sheet piles in the marine environment. This case study also includes, pre-conducted survey
and study of an ongoing Swedish research project as on 2013 paper presented by (H. Wall, L.
Wadso/Marine Structures 33 (2013) 21-32) on different overseas conditions, viz., North
America, Australia, Europe, and Swedish harbour were also discussed below. Besides, the
study report also revolves around the design of a sheet pile quay on particular saline nature.
CORROSION RATE MEASUREMENTS IN STEEL SHEET PILE WALLS IN 2.5
A MARINE ENVIRONMENT
2.5.1 BACKGROUND INFORMATION (H. Wall, L. Wadso/Marine Structures
33(2013)21-32))
Corrosion of steel structures in a saline region is a great drawback to the whole construction
industry and creates the majority of problems with the life of the structure. Over the years, the
deterioration of this kind of structures is costly and difficult to predict both designing new
structures and estimation of the remaining service lifetime for the existing structures. Here in
this case study report, which I am going to discuss is a previous investigation conducted on
the rate of corrosion in the steel sheet piles on the Swedish west coast. Here corrosion rates
are measured in terms of (mm/year). These measuring procedure can be used both while
designing new structures, mainly by oversizing, i.e. oversizing the steel thickness for existing
and new sheet pile structures while estimating its bearing capacity.
According to the previous investigations conducted over the east coast of Sweden, corrosion
rates on sheet piles has resulted in salinity ranging from 0.2% to 0.8%. These results are still
used as a measuring tool for the corrosion rate of all the steel structures over the Swedish
west coast maritime exposure conditions, even if, salinity percentage reaches as high as 3.0%.
The ultrasonic measurement tests were conducted based on three wharf structures spanning a
length of huge 700 meters inspected over the Halmstad on the west coast. The age of these
three sheets pile structures which are inspected ranged from 36 – 51 years. The original sheet
pile sections are known even with its dimensions. One of the quay structures is situated along
the river line. Over the time, salinity at all wharfs recording low values at the top surface and
carrying on to approximately 2% at the bottom.

41
However, the results show the peak graph of corrosion rates by 1 m beneath the mean water
surface and 3 – 6 m below the water surface at the level of the propellers from the ships
berthing area and it is from the most frequented of the inspected flat structure over the shore
called wharfs. The capacity to endure something of steel sheet thicknesses falling in the range
of ±6 % are usually disregarded when investigating, the remaining thickness of the steel sheet
piles. Thus a simple calculation based model shows that, the sheet piles must be in the range
of 50 years of age before the corrosion rate estimation process can be carried out, considering
the fact of the tolerances, and even with the unknown true sheet pile thickness.
INTRODUCTION (H. Wall, L. Wadso/Marine Structures 33(2013)21-32)) 2.5.2
As we all know a large portion of the international trade market across the globe today is
relying on the sea as a carrier for transportation of goods. In recent decades, the demand has
increased on the quays and ferry berths in our harbours due to the higher percentage of
transportation of goods like heavy machine transportation, along with larger commercial
freight vessels are some of the live examples.
According to the source, many quays located in Swedish harbours have touched down to an
age limit of 60-70 years and have - reached their design lifetime, according to the original
design limitations based on assumptions carried out on corrosion rates. However, all these
quays and wharfs are actually working well and still in good condition, but there is a need for
maintenance work by inspections on a timely basis and predictions for the remaining lifetime
of these remaining structures. Albeit, there is a need, in order to plan for renovations and
design of new quays and its approach plans for service lifetime predictions.
The service lifetime of the new sheet pile structure is usually achieved by oversizing the
thickness of the steel in its profile of the sheet. Here one thing is very important to be
considered in order to achieve better service life, and while verifying the bearing capacity
(BC) of the existing structures by having thorough knowledge about the rate of corrosion.
Simultaneously, to estimate its remaining service lifetime, according to bearing capacity
considerations, when structure is allowed with oversizing, a certain percentage of corrosion
rates (mm/years) are assumed. However, in this case corrosion is considered to be even
throughout the surface and corrosion like pit corrosion and other types of uneven corrosions
are not taken into account.

42
In practical considerations, the rate of corrosion is assumed to be a linear function of time by
most engineers. According to the sources and report from a European research project
collected by the author on this research project concludes that the rate of corrosion decreases
with respect to time. According to his collected reports, the rate of corrosion needs to be
treated statistically. It is most likely that plummeting corrosion rate will be found if the
protective covering or layers of corrosion products which are formed are not impaired or
deteriorated.
Figure 2–19 Examples of vertical loads on quay decks
Source: (Henrik Wall, Lars Wadso/Marine Structures 33 (2013) 21-32 /Science Direct)
One of the best ways for attaining the estimation of the rate of corrosion at a certain site is to
perform measurements on remaining good available thickness on an existing structure.
Having mentioned earlier that, the thorough knowledge over the original sheet pile
dimensions and its installation year, it is easier to predict and estimate the average corrosion
rate. Therefore, having complete knowledge about these average corrosion rate in individual
harbours will make the work more efficient, less use of economy and environmental gains as
this type of structures in the future can then take full advantage to plan out depending upon
the actual rate of material loss.
When examining existing steel sheet structures, one frequently assesses the uniform corrosion
rate over a certain area of the structure. This is, however, indicates a clearer picture of how
exactly the corrosion process takes place. Since, there is also repeatedly possibility of pit
corrosion, which is accumulated to small extents. These pit corrosion can give rise to very
misleading results with the most commonly used ultrasonic gauges for assessing the steel
thickness. It is also frequently observed that the most rigorous corrosion in sheet pile
structures appears in the splash zone, while much lower percentage of corrosion rates are
observed in several meters below the mean water level (MSL). This could give a symptom of
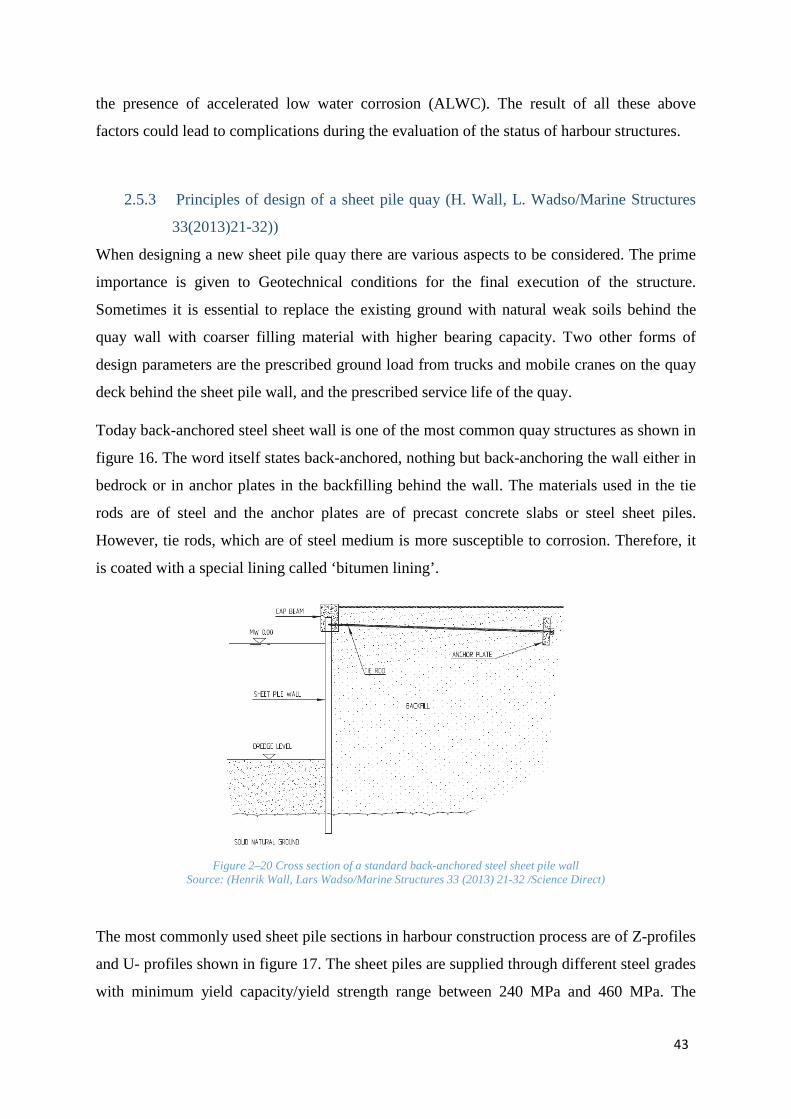
43
the presence of accelerated low water corrosion (ALWC). The result of all these above
factors could lead to complications during the evaluation of the status of harbour structures.
Principles of design of a sheet pile quay (H. Wall, L. Wadso/Marine Structures 2.5.3
33(2013)21-32))
When designing a new sheet pile quay there are various aspects to be considered. The prime
importance is given to Geotechnical conditions for the final execution of the structure.
Sometimes it is essential to replace the existing ground with natural weak soils behind the
quay wall with coarser filling material with higher bearing capacity. Two other forms of
design parameters are the prescribed ground load from trucks and mobile cranes on the quay
deck behind the sheet pile wall, and the prescribed service life of the quay.
Today back-anchored steel sheet wall is one of the most common quay structures as shown in
figure 16. The word itself states back-anchored, nothing but back-anchoring the wall either in
bedrock or in anchor plates in the backfilling behind the wall. The materials used in the tie
rods are of steel and the anchor plates are of precast concrete slabs or steel sheet piles.
However, tie rods, which are of steel medium is more susceptible to corrosion. Therefore, it
is coated with a special lining called ‘bitumen lining’.
Figure 2–20 Cross section of a standard back-anchored steel sheet pile wall
Source: (Henrik Wall, Lars Wadso/Marine Structures 33 (2013) 21-32 /Science Direct)
The most commonly used sheet pile sections in harbour construction process are of Z-profiles
and U- profiles shown in figure 17. The sheet piles are supplied through different steel grades
with minimum yield capacity/yield strength range between 240 MPa and 460 MPa. The

44
thickness of the standard sheet pile profile fall in the range between 6mm and 20 mm in the
flange section and about 8 mm and 16 mm in the web section respectively. Maximum rolling
lengths practically depends according to the type of profile chosen and come in between 16 m
and 33 m.
In most of the section cases, which are considered as sensitive sections (with respect to the
bending moment capacity) in a back- anchored sheet pile wall appears to be at about one third
portion of the depth of excavation from the bottom of the sea level, as this is where exactly
bending moment normally rises with the highest. However, in exceptional cases, the largest
shear force is exactly concentrated at the attachment level of the tie rods. Due to this, as
mentioned earlier, it is necessary to detect the potential weaknesses in the flanges, which is
beneath the water surface area and in the web section located over the attachment level of the
tie roads. The corrosion of the whole sheet pile section is to be taken into account, with
additional compression stresses over the whole section coming into the picture only when
these sheet pile walls supporting the direct vertical loads from a crane support.
However, when we take design as a main criteria for sheet pile wall design for certain
locality, greater interest would be more helpful in considering the factors that influencing the
rate of corrosion: namely, salinity, biological growth, which allows the process of
carbonation by a reduction in surface alkalinity and the effect of rainfall, change in
temperature, oxygen concentration, erosion etc.
Figure 2–21 Examples of sections of sheet piles: Z-profile (type BZ and AZ) on the left and U-profile (type Larssen) on the right
Source: (Henrik Wall, Lars Wadso/Marine Structures 33 (2013) 21-32 /Science Direct)
Current design values on corrosion rates (H. Wall, L. Wadso/Marine Structures 2.5.4
33(2013)21-32))
Different parts of the globe use different values on corrosion rates on steel in marine
structures. This information is available in national or international building code standards in
some cases of recommended corrosion rates. These recommended corrosion rates over here

45
for steel in marine environments are expressed concisely for USA, Australia, Europe and
Sweden. As discussed earlier, it is a well-known phenomenon that rate of corrosion on steel
under marine region is not linear, for instance, the parameters presented in the report on
which Euro code is laid on.
Over the years, many models have been raised for describing the non-linearity; according to
the data collected so far and produced by the author, it is clear that the non-linear behaviour
pattern is however most common during the first three years of exposure, at least in the
Nordic colder climates and 0.13 mm/year will be the ultimate corrosion rate recorded during
the period with 10 of mean water temperature over the year. However the new harbour
structures are designed for 50 years of service life, but still considered for 100 years, because
of the reason that the corrosion rate over these periods are assumed to be linear.
North America (H. Wall, L. Wadso/Marine Structures 33(2013)21-32)) 2.5.4.1
According to the U.S Army Corps of Engineers in the United States proposes that, the rate of
corrosion in marine environment on steel sheet piles lies between 2 and 10 mile/year, which
is approximately equals 0.05-0.25 mm/year. The notable point is that, the existing U.S. data
on rate of corrosion are bit old and are not compatible and indicates remarkable point that the
Euro code 3 gives a better guidance.
Figure 2–22 Bending moment (M) and shear force (V) diagrams for a standard back-anchored sheet pile wall Source: (Henrik wall, L. Wadso/Marine structures 33 (2013) 21-32 /Science direct)
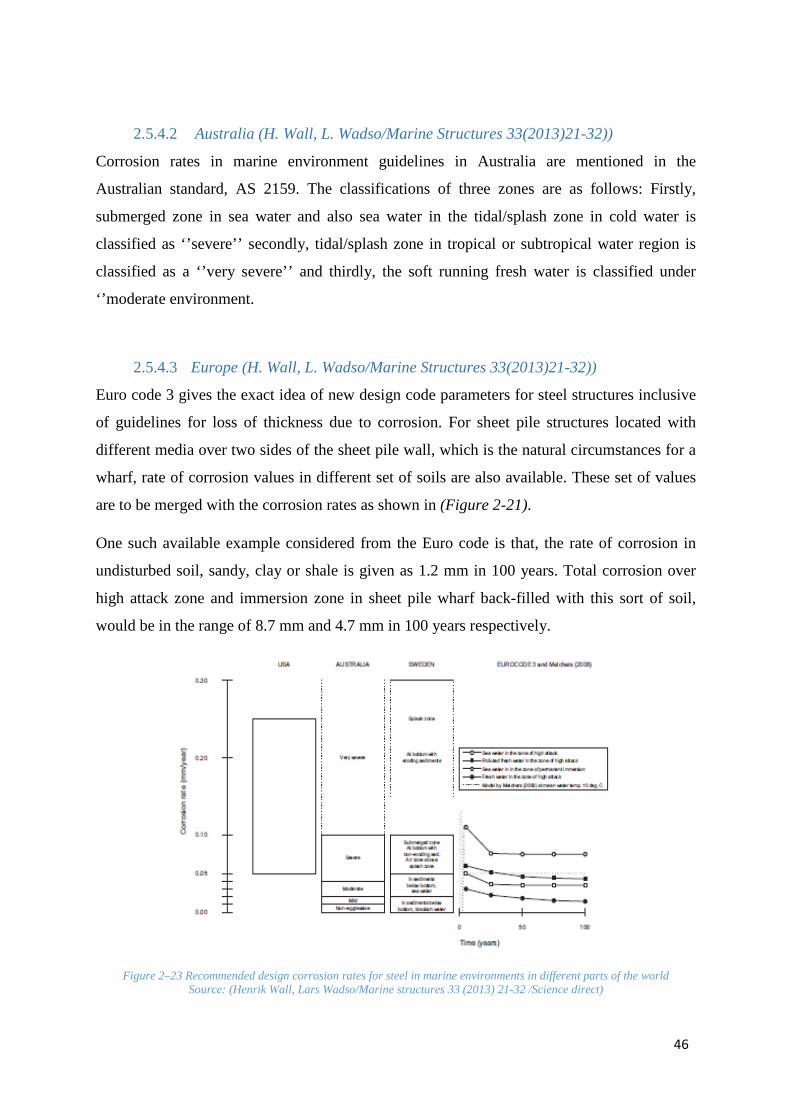
46
Australia (H. Wall, L. Wadso/Marine Structures 33(2013)21-32)) 2.5.4.2
Corrosion rates in marine environment guidelines in Australia are mentioned in the
Australian standard, AS 2159. The classifications of three zones are as follows: Firstly,
submerged zone in sea water and also sea water in the tidal/splash zone in cold water is
classified as ‘’severe’’ secondly, tidal/splash zone in tropical or subtropical water region is
classified as a ‘’very severe’’ and thirdly, the soft running fresh water is classified under
‘’moderate environment.
Europe (H. Wall, L. Wadso/Marine Structures 33(2013)21-32)) 2.5.4.3
Euro code 3 gives the exact idea of new design code parameters for steel structures inclusive
of guidelines for loss of thickness due to corrosion. For sheet pile structures located with
different media over two sides of the sheet pile wall, which is the natural circumstances for a
wharf, rate of corrosion values in different set of soils are also available. These set of values
are to be merged with the corrosion rates as shown in (Figure 2-21).
One such available example considered from the Euro code is that, the rate of corrosion in
undisturbed soil, sandy, clay or shale is given as 1.2 mm in 100 years. Total corrosion over
high attack zone and immersion zone in sheet pile wharf back-filled with this sort of soil,
would be in the range of 8.7 mm and 4.7 mm in 100 years respectively.
Figure 2–23 Recommended design corrosion rates for steel in marine environments in different parts of the world Source: (Henrik Wall, Lars Wadso/Marine structures 33 (2013) 21-32 /Science direct)

47
Sweden (H. Wall, L. Wadso/Marine Structures 33(2013)21-32)) 2.5.4.4
The earlier investigation over the Swedish east coast for corrosion of steel sheet piles, which
is setup on an extensive survey conducted for corrosion data on steel piles and sheet piles in
soil and water, guidelines are given for rate of corrosion under fresh water condition, blackish
water and in sea water. There is no collection of data for corrosion rate along the west coast.
Due to fluctuations in environmental loads in the marine environment along the Swedish west
coast, these guidelines are certainly too rough for application.
As pointed out earlier the salinity is remarkably lower at the east coast compared to the west
coast. Yet same guidelines are used when designing new structures on both sides of the
country coast. Certain things are recommended for corrosion rate of the steel pointing
towards the back-filling in a wharf with natural soils lying behind it, can be still set to 10% of
the corrosion than on the side facing the water.

48
METHODOLOGY 3
Multi-phase modelling of ionic transport in concrete under externally
applied current density
ABSTRACT 3.1
The model presented in this methodology report is of dimensional (2D) model to forecast the
electrochemical chloride removal also sometime referred as Desalination or Electrochemical
chloride Extraction (ECE) or simply (ECR) within the concrete surface. ‘’ Unlike the most of
the existing models which only treat the concrete as a single-phase pore solution, here, the
concrete is taken as a heterogeneous composite structure with two phases, including
aggregates and mortar ’’(Qing-Feng Liu, Long-Yuan Li and Dave Easterbrook, paper number
SLM14/1. (2012).
The simulation conducted over here is not only accounted by the ionic interactions between
multi-species during the deporting process of these ions, but also various other influential
factors, i.e., electrochemical reactions, adsorption and/or desorption process of ions subjected
to the boundary between two phases of electrolyte liquid and aggregate solid due to the
formation of ionic binding by the application of treatment time and current density.
Therefore, by computing a nonlinear system of mass conservation and current conservation
equations, the ionic species distribution profiles under different current density over the
complete time span of 12 weeks were successfully extracted as it is. Similarly, comparison
over the two set of results were also discussed here by taking and without taking
considerations of ionic bonding effects.
INTRODUCTION 3.2
It is a well-known fact that - ‘’The penetration of ions, mainly the chloride ions, when
subjected through the mortar-based materials are one of the key threatening agents leading to
the corrosion of steel reinforcement within the members of the concrete structures. However,
considerations from the rehabilitation methods of both economy and efficiency,
electrochemical chloride removal (ECR) or electrochemical chloride extraction (ECE) is a
conventional or salutary way for treating the reinforcement concrete, which is about to or

49
already experiencing from chloride-induced environment (Qing-Feng Liu et al. paper number
SLM14/1, 2012).’’
The conceptual idea of ECR according to Qing-Feng Liu, Long-Yuan Li and Dave
Easterbrook, paper number SLM14/1. (2012) involves ‘’ placing an external anode
surrounded by a suitable liquid electrolyte on the concrete surface and passing the high direct
current density into the embedded reinforced bar, which acts as a cathode.’’ During, certain
period of time (usually after some weeks) a large amount of negatively charged chlorides are
operating away from the reinforced cathode to the externally connected anode by the DC
current. These ions/ionic transportation processes eventually move into an external liquid
electrolyte phase are thereby pulled out from the concrete. This is done once it has reached
the members of the concrete.
However, Qing-Feng Liu, et al. paper number SLM14/1, (2012) and their research work
describes that, the technique was coined in the year 1970, greatest interest and efforts were
involved in assessing the distribution profiles of chlorides versus time or space with various
other factors, (i.e., treatment time, temperature effect, additives, binding effect etc.) during
the ECR process. The 2D model here covers both methodology concept extracted from the
experimental studies for the true model and the numerical simulations respectively.
THEORETICAL BACKGROUND 3.3
By assuming mortar is a saturated pore medium and there are no chemical reactions between
ionic species going to take place in both the phases of liquid and solid medium. But, while
the original modelling of this concept in (MATLAB) changed to COMSOL Multiphysics
software to interpret the originality in the application of knowledge and the whole concept.
Therefore, in COMSOL it is difficult to achieve the model as a two different material and
separations cannot be made, but can only be achieved as a single concrete material i.e.,
(combination of Fine aggregate + Coarse aggregate + Cement + Water). Thus the transport
of ionic components, which involved in the mortar, can be written in the equation form for
both mass and current conservation respectively. The equations demonstrated by (Qing-Feng
Liu, et al. paper number SLM14/2. (2012) are as follows,
𝜕𝐶𝑘𝜕𝑡
= −𝛻𝐽𝑘 Where, 𝑘 = 1, … … … ,𝑁 (2.8)
𝐼 = 𝐹 ∑ 𝑧𝑘𝐽𝑘𝑛𝑘=1 Where, 𝑘 = 1, … … … ,𝑁 (2.9)

50
Where terms,
Ck denotes the concentration of k-th ionic species in the mortar phase,
t = time.
Jk = Flux of the k-th ionic species.
I = Current density.
F= 9.648x10⁻⁴ C·mol-1 of the Faraday constant.
zk = Charge number of the k-th ionic species.
N= Total number of ionic species contained in the mortar.
As described by Qing-Feng Liu, et al. paper number SLM14/2. (2012); to make it
convenience and also because of the tendency of the ionic species travelling in the liquid
medium of the mortar only, the values of solid/liquid ratio of the mortar content is hidden. By
doing this, it can be cancelled out during the process of calculation part.
Moreover, in this study of ionic transport, Diffusion and migration are the two dominating
medium; therefore, the ionic flux equation can be written as follows,
𝐽𝑘 = −𝐷𝑘∇𝐶𝑘 − 𝐷𝑘𝐶𝑘𝑧𝑘𝐹𝑅𝑇
∇Φ (3.0)
Where,
Dk = Diffusion coefficient of k-th ionic species
R = 8.314 J·mol-1·K-1 is the ideal gas constant
T =298 K is the absolute temperature and
Φ = Electrostatic potential
Substituting the equation [3.0] into (2.8) and (2.9) gives,
𝜕𝐶𝑘𝜕𝑡
= 𝐷𝑘∇2𝐶𝑘 + ∇ 𝑧𝑘𝐷𝑘𝐶𝑘 𝐹𝑅𝑇∇Φ (3.1)
𝐹𝑅𝑇∇Φ = − (𝐼 𝐹)⁄ +∑ 𝑧𝑘𝐷𝐾∇𝐶𝑘𝑛
𝐾=1∑ 𝑧2𝑘𝐷𝑖𝐶𝑖𝑛𝑘=1
(3.2)
However, equation (3.1) is only applicable and valid for the ionic species which do not
experience ionic bonding. While taking into consideration of the adsorption and/or desorption

51
of ions within the concrete, the concern is only on mortar phase as the model features around
adsorption and/or desorption process. Therefore, the equation (2.8) and (3.1) need to some
modification and as follows,
𝜕𝐶𝑘𝜕𝑡
+ 𝜕𝑆𝑘𝜕𝑡
= −∇𝐽𝑘 (3.3)
𝜕𝐶𝑘𝜕𝑡
+ 𝜕𝑆𝑘𝜕𝑡− 𝐷𝑘∇2𝐶𝑘 + ∇ 𝑧𝑘𝐷𝑘𝐶𝑘
𝐹𝑅𝑇∇Φ (3.4)
Where,
Sk is the concentration of bound ions of species k.
Since the current simulation work enlist on a two-phase 2D numerical concrete model, the
current density pattern in equation (3.2) when solving for an electrostatic potential can be
represented in terms of its two components in a square coordinate system:
𝐹𝑅𝑇
∂Φ𝜕𝑥
= −(𝐼𝑥 𝐹)⁄ +∑ 𝑧𝑘𝐷𝐾
𝜕𝐶𝑘𝜕𝑥
𝑛𝐾=1
∑ 𝑧2𝑘𝐷𝑖𝐶𝑖𝑛𝑘=1
(3.5)
𝐹𝑅𝑇
∂Φ𝜕𝑦
= −(𝐼𝑦 𝐹)⁄ +∑ 𝑧𝑘𝐷𝐾
𝜕𝐶𝑘𝜕𝑦
𝑛𝐾=1
∑ 𝑧2𝑘𝐷𝑖𝐶𝑖𝑛𝑘=1
(3.6)
Here Ix and Iy are the two components of current density in x and y direction respectively.
Since the current density proves ∇𝐼 = 0, Ix and Iy can be computed by adopting the Laplace
equation,
∇2Ψ = ∂2Ψ𝜕𝑥2
+ 𝜕2Ψ𝜕𝑦2
= 0 (3.7)
Where,
Ix = 𝜕Ψ𝜕𝑥
and Iy = 𝜕Ψ𝜕𝑦
According to Qing-Feng Liu, et al. paper number SLM14/3. (2012) in short, Equation (3.1) –
(3.7) can describes the transport behaviour of ions in a saturated pore medium unless the term
of Sk in Equation (3.3) is defined. Concentration graph of individual ionic species and

52
electrostatic potential gradient can be achieved, if provided with current density distribution,
and also, if initial and boundary conditions of each of them are properly assigned.
NUMERICAL BACKGROUND 3.4
Simulated migration test 3.4.1
Taking into consideration from the pre-determined simulated migration test conducted over
the period of 12-week test basis, In order to predict the electrochemical chloride removal
(ECR) within a piece of concrete specimen. For the particular test a steel bar of 5mm radius is
located at centre. The test at the initial time, the concrete medium is saturated with a solution
of five ionic species such as, potassium (K+), sodium (Na+), chloride (Cl-), hydroxide (OH-)
and calcium (Ca2+) respectively. A direct current (DC) is applied externally between the
single anode placed on the left corner of the concrete specimen as shown in the figure.16 and
the reinforcing steel bar. The anode is dipped into a suitable chamber of electrolyte, which
has a greater volumetric weight than the concrete medium.
Practically, the anode inside the electrolyte chamber having the nature of a reservoir-like
compartment, it is reasonable to make an assumption that, the concentration of individual
ionic species in the external solution region will remain undisturbed and constant throughout
the process of treatment.
Figure 3–1 Schematic representation of ECR
Source extracted from [Qing-Feng Liu, et al. paper number SLM14/3. (2012)]

53
Geometry 3.4.2
The model is a set of two-dimensional (2D) concrete numerical models are prepared to
simulate the ECR in concrete specimen. From the thorough study of the report, it is difficult
to model and to split up the materials into individual species during the modelling process in
MATLAB program, but the model adopted for analysis from the case study models are
simulated using COMSOL Multiphysics, the combination of these materials as explained
before in the theoretical background is taken as a concrete specimen.
Figure 3-2 shows one of the schematic sectional diagram of the model of concrete specimen
adopted in this simulation (to make the model more precise and accurate, and to pull out the
symmetry problems, only half of the geometry, 50 x 25 mm is taken into account and
proposed here), which is for the fractional volume of the aggregate being (1-φ) = 0.5 (where
(1-φ) is the porosity of the geometrical model). In the present simulation, according to the
authors Qing-Feng Liu, et al. paper number SLM14/3. (2012), ‘’the concrete specimen is
treated as the heterogeneous composite structure with two phases, in which all circular areas
indicates the coarse aggregates or central steel cathode and the remaining region is for the
mortar (composited by both solid and liquid phases)’’. The location of the aggregate is
anonymously picked up by the COMSOL Multiphysics program. According to author,
particle shape only makes a modest influence on the transport properties of concrete.
Figure 3–2 2D two-phase model: section of concrete
Source: (Qing-Feng Liu, et al paper number SLM14/4. (2012)

54
Moreover, in the present model, it is assumed that, mortar phase is the region where ionic
transport would takes place due to its much larger diffusivity than that of aggregates.
Arguably, the Equations (2.8)-(3.1) presented in Section 3.3 are applied to the areas except
aggregates, which contains not only mortar but also the interface transition zone (ITZ). Thus,
all the parameters extracted in the equations are referred as the composite of mortar and ITZ.
Taking consideration of ionic concentration and diffusion coefficient, according to the
authors Qing-Feng Liu, et al. paper number SLM14/3. (2012) discuss the idea that, ionic
concentration is defined as ‘’the concentration of ions per unit volume of the composite
(mortar and ITZ)’’ and ‘’diffusion coefficient is the apparent diffusion coefficient of ions
defined in the composite rather than in the pore solution’’. In addition to these, with respect
to the phase of the interface transition zone, more accuracy can be achieved, if ITZ was taken
into account separately. However, due to the limitation of computation and in excessive of its
minute scale, the ITZ phase is not considered in this model and also with its dominant effect
is reflected by the chosen diffusion coefficient of ions.
Modelling of ECR 3.4.3
Before heading up with the modelling firstly Equation (3.4) can be solved, it is very
important to know the definition of the term bound ions concentration, Sk. According to the
concept developed by (Y Wang, L Y Li and C L Page, 2001), Chloride ions are believed to
bind both in terms of physically and chemically on to the pore surfaces within the mortar
matrix. Having said that, these chloride ions chemically react with aluminate phases to
produce chloroaluminates. However, this binding effect is temporary and not permanent; if
the concentration of free ions dropping occurs, there is a balance between free and bound
ions, chloride ions will be released again. Having the evidence from the experimental data
produced and approximated by Langmuir isotherm satisfies for the relationship between
bound ions and free chloride ions are of independent of removal rates and can be written as:
𝑆𝐶𝑙 = 𝛼𝐶𝐶𝑙(1+𝛽𝐶𝐶𝑙)
(3.8)
Where SCl and CCl are the concentration of bound and free chloride ions, w is the water
content in which diffusion occurs, expressed in terms of per unit weight of cement, α = 0.42
and β = 0.8 mol-1 𝑙 are the constants, determined based on the experimental data for the
mortar of w = 0.3. While comparing the binding of potassium and sodium with respect to

55
chloride ions, is very limited and thus can be ignored. Therefore it is very important to
balance the chloride ions release process by the adsorption of hydroxyl ions, in order to
preserve the charge balance and vice versa.
Admittedly, the process suggests that the adsorbed hydroxyl ions into the mortar matrix
might be computed based on the chloride released, but the preceding was not taken into
feasible consideration because of its lack of experimental evidence in quantifying the
desorption of hydroxyl ions. Thus the adsorption of the chlorides is assumed to be
equilibrated by the adsorption/desorption of Na, K, and OH in concrete mixture. That is,
1 + 𝜆3 𝜕𝐶𝑁𝑎
𝜕𝑡= −∇𝐽𝑁𝑎 (3.9)
1 + 𝜆3 𝜕𝐶𝐾
𝜕𝑡= −∇𝐽𝐾 (4.0)
1 − 𝜆3 𝜕𝐶𝑂𝐻
𝜕𝑡= −∇𝐽𝑂𝐻 (4.1)
Accordingly, the Equation (3.4) need necessary modifications, which is straightforward and
thus not further discussions made in the report here.
According to the discussion presented by the authors Qing-Feng Liu, et al. paper number
SLM14/4. (2012) for setting up boundary conditions, charge number, initial concentration,
diffusion coefficients, and the boundary concentration of individual ionic species which is
adopted in the current model are as follows in Table 2 respectively.
Table 3-1 Charge number, diffusion coefficients, and initial and boundary concentrations Source: (Qing-Feng-Liu et al.
2012)
Field variables K Na Cl OH Ca Boundary
concentration, mole/m3 (at anode,
x=0)
5 5 10 25.2 12.6
Initial Concentration,
mole/m3 100 900 380 620 0
Charge number 1 1 -1 -1
2
Apparent diffusion coefficient, x 10-10
m2/s 0.39 0.27 1.02 5.28 0.16

56
While considering the external electric field during the simulation process, three cases of
constant and steady current density boundaries of ( 𝛪1 = 1 A/m2, 𝛪2 = 5 mA/m2, and 𝛪3 = 8
mA/m2) are applied at the steel cathode. Their directions are both pretty much normal to the
boundary. For modelling purpose according to Equation (3.7), the current density I, as
illustrated by the potential function 𝛹 with the relationship of 𝛪 = 𝜕𝛹𝜕𝑛
(where n stands for the
normal vector). Therefore, at the cathode end where current density cases are placed, 𝛹 is
taken as one boundary condition and written in the derivative form ( 𝜕Ψ𝜕𝑛
= Ι𝑗 , 𝑗 = 1,2,3). At
the anode end boundary conditions are set to (x = 0), because of the features of Laplace
equation, it is quite reasonable and the best way to set 𝜓 = 0 as the other boundary
condition for the purpose of convenience.
During the process of current application at two electrodes, undergoes electrochemical
reactions, which has also been taken into consideration for the current presentation of
modelling work. More importantly, following electrochemical reactions taking place at the
cathodes are noted below,
2𝐻2𝑂 + 2𝑒− − −(𝑒𝑙𝑒𝑐𝑡𝑟𝑜𝑙𝑦𝑠𝑖𝑠) ⟶ 2𝑂𝐻− + 𝐻2 (4.2)
At anode,
4𝑂𝐻− − 4𝑒− − −(𝑒𝑙𝑒𝑐𝑡𝑟𝑜𝑙𝑦𝑠𝑖𝑠) ⟶ 2𝐻2𝑂 + 𝑂2 (4.3)
From the above two Equations (4.2) - (4.3) it is clear that, the flux of the hydroxyl ions
reactant/product on polar boundaries, Ω, at the cathode is assumed to be equivalent to the
current density, whereas fluxes of all other ions, are assumed to be zero.
𝐽𝑂𝐻𝛺 = 𝛪𝛺𝐹
(Ω, polar boundaries) (4.4)
Meanwhile, the fluxes of other four ionic species (K+, Na+, Cl-, OH-) are assumed to be zero,
i.e. , 𝐽𝑂𝐻𝛺 = 0,𝑤ℎ𝑒𝑟𝑒 (𝑘 ≠ 𝑂𝐻).
Other than the fact beside that, with the exception of anode and cathode on the boundaries,
there is no flow for the current density and no fluxes for the ionic movement.

57
Simulation results and discussions 3.4.4
Figure 3-3 shows the magnitude and direction of the current density. It is clear that the
currents orientate at the excursion point to the aggregates and drive-off from the anode to
cathode. It is also noticeable from the colour legend and the span of the arrow that, the region
between anode and central cathode where current density lies, is found to be much bigger
than that in the rear side of the steel region and far away from the anode.
Figure 3–3 Current flow pattern, anytime, Ij = 5 A/m2
Source: (Qing-Feng Liu, et al. paper number SLM14/5. (2012)
According to the conducted model and adopted concept for the model, authors (Qing-Feng
Liu, et al. paper number SLM14/5. (2012) suggested that, the three-dimensional plotted
model in Figures (3-4)-(3-5), offer enough information on the concentration deployment of
ionic species, viz., potassium, sodium, chloride and hydroxide ions in the mortar matrix when
tended to a small and large currents respectively, where the two plane coordinates indicates
the variable position of the two-dimensional concrete model whereas, the vertical coordinate
represent the concentration value. Moreover, each frame of independent variable depicts
instantaneous moment commencing from 4th week to the 12th week. Having said that, to make
the calculation easier from charge balance and also because of much lower concentration, the
calcium profiles are not shown here.

58
Figure 3-4 (a) and (b) present the concentration deployment graph compatible to a supplied
current density of 1 mA/m2 on steel cathode, (which is identical to 0.628 mA/m2 on anode).
The profile also disclosed the fact that, under low current density, the migration of four ionic
species is highly influenced by the behaviour of diffusion agents in which all ions tend to
drift towards the anode ending up in the zone of relatively lower concentration flow.
(a) (b)
Figure 3–4 Distribution profiles of ionic concentration for current density of 1 A/m2 (at cathode) Source: (Qing-Feng Liu, et al. paper number SLM14/5. (2012)
Whereas, on the other hand the steel cathode does not experience much influence on the
carrier process since the ions movements almost occur over x-axis, but infrequently along y-
axis region ( In exceptional cases it happens along the y-coordinate are just because of the
fact that, the effect of tortuosity resulted by the phase of aggregates). Therefore, it is easy to
predict that, the ionic species having the higher diffusion coefficient, moves faster than that
of lower diffusion coefficients.

59
In the meantime with the increased current density, the migration plays an increasingly vital
role in the transport process. It has been clearly depicted in Figure 3-5(a) and (b) suggested
by (Qing-Feng Liu, et al. paper number SLM14/6. (2012) that, ‘’When the constant current
density applied on the steel cathode reaches to 8 A/m2 (equivalent to 5.03 mA/m2 on
anode)’’, the transport behaviour will vary accordingly from the one that shown in (Figure 3-
4). The highest value of concentration of individual ionic species with respect to time depicts
that the contents of chlorides are steadily removed from the zone close to the steel, whereas
in return potassium and sodium ions are transported to this zone. Due to negative charge of
the hydroxides, they also tend to migrate from cathode to anode like the chlorides. Large
numbers of hydroxyl ions are generated at the steel cathode, because of the electrochemical
reactions taking place at the steel cathode (Equations. (4.2) - (4.3)), the resulting quantity of
which is higher than that migrated off from the cathode.
(a) (b)
Figure 3–5 Distribution profile of ionic concentration for the current density of 8 A/m2 (at cathode) Source: (Qing-Feng Liu, et al. paper number SLM14/6. (2012)
Therefore the view is clear that, movement of hydroxyl also take place from anode to cathode
at the same time its concentration increases at the cathode end during the ECR. Though the
performances between hydroxyl ions and the two positive ions are similar, but the core
natures of the both are completely different. From the aforementioned (Figure. 3-3) holds the
fact that, the current flow located mainly between the two electrodes, diffusion controls the

60
transport of ionic particles in the rear side of the central steel, which in return makes it even
more difficult to remove the ions in that region.
Meanwhile, to thoroughly understand the effect of electrochemical reactions (ECR) on the
maintenance of reinforcing steel members below in Table 3-2 gives the clear picture on total
mole numbers of chlorides remaining at different times in the specimen. It is easily perceived
from the table values that, when subjected to an electric field the amount of chloride ions in
the specimen remarkably decreases with respect to time. Moreover, (Qing-Feng Liu, et al.
paper number SLM14/7. (2012) predicted only 30% free chlorides retain under the influence
of current density of I3 = 8 A/m2 after 12 week treatment time. If, there is no external electric
field, whereas this figure becomes 80%.
To investigate the effects given by the aggregate phase, Figure 3-6 bring out the fact, how
the distribution process of chloride concentrations and hydroxyl ions take place along with
the lower boundary (section y = 0) at three different time periods for three different
volumetric fractions of aggregates packed ((1-φ) = 0.1, (1-φ) = 0.3 and (1-φ) = 0.5)
respectively. The disruptions of the curves indicate the location where the aggregates or steel
cathode are established. According to two of those values and the rate of upward and
downward inclinations as exemplified by the distribution of concentration curves, the
observation clearly indicates that, in general terms the more and faster ions can transport with
the larger volume fraction of aggregates.
Table 3-2 Total amount of free Chlorides remaining in the specimen (unit thickness) Source: (Qing-Feng Liu, et al. paper
number SLM14/7. (2012)
Time
Initial (mole/m)
4 weeks (mole/m)
8 weeks (mole/m)
12 weeks (mole/m)
I1 = 1 mA/m2
0.475
0.420
0.397
0.380
I2 = 5 mA/m2
0.475
0.291
0.224
0.183
I3 = 8 mA/m2
0.475
0.257
0.189
0.150

61
The practical reason is that, the compact particle tends to larger current density within the
electrolyte, which makes the scenario and as seen from (Figure 3-4 and Figure 3-5) identical
to that of increasing the current density directly. In spite of that, where the diffusion process
is prevailing there is still much smaller degree of changes in the zone on the rear side of the
central steel. This gives the clear vision again that, no significant effect, but only little impact
on ECR is noticed with change in current density at regions where there is no electrodes
clamping.
Figure 3–6 Influence of aggregate volume fraction on the transport of chloride and hydroxide ions at lower boundary (section of y=0)
Apart from that, the case of 0.1 volumetric fraction of aggregates owns the curves with most
smooth concentration whereas in the case of 0.5 volumetric fraction of aggregates owns the
most variant concentration curves, overall these two cases depicts the efficacy of tortuosity
resulted by the aggregate.
62
Conclusions 3.4.5
According to Qing-Feng Liu, et al. paper number SLM14/8. (2012), the proposed numerical
investigation revolves on the ionic transport in a plane concrete specimen with the supply of
external current. To predict a 12-week ionic migration test numerical models has been
conducted. Aforementioned, efficacy of externally applied current density, electrochemical
reactions, binding effect, treatment time and the volume fraction of the phase of aggregate
has been taken into account and discussed accordingly. To summarize, the conclusions drawn
from the present investigation report presented by the authors Qing-Feng Liu, et al. paper
number SLM14/8. (2012) are as follows.
1) Migration process increasingly becomes very vital with the rise of the externally
applied current density between the two electrodes. Besides, for the rest of the
portions, with the changes in the current have no significant impact on diffusion
process is being dominant throughout. Irrespective of their charges, diffusion
coefficients, different ionic species, its act of transport behaviour will also be different
and electrochemical reactions suffered as well the initial and boundary conditions.
2) Larger the applied current density, more will be the amounts of ions been removed. In
other terms of the effectiveness of ECR, numerically, after 12-week treatment only
about 30% of free chlorides retain under the efficacy of I3 = 8A/m2. Therefore
statistical figure becomes 80% if there is almost zero or no external field.
3) Larger volumetric fraction of hidden aggregate fetch not only the larger tortuosity but
also the current density in the mortar matrix phase, which upfront leads to that, the
heavier particles enclosed within the concrete, the ions can transport more and faster
between the two electrodes.
63
RESULTS AND DISCUSSIONS 4
Summary of modelling 4.1Case: 1
The concrete specimen is of simple 2D and two-phase structure. The square domain
measuring 0.22 x 0.22m2 is constructed of hydrated cement paste with its left surface is
exposed to a chloride-containing medium. The specimen is embedded with single steel bar of
(12 mm diameter) placed exactly at the centre (i.e. zero position) for the model (the distances
from their central lines to the external anode is 0.11m, and it is schematically represented in
Figure 3-1). The entire model polarization is done galvanostatically by a controlled current
density of 3 A/m2. Simultaneously, potential is measured. The initial concentrations of ionic
species are assumed to be uniform, the values of which used in the numerical study with
other parameters used are tabulated and can be seen in Table 3-2. The model test involves
application of only two different current density range with case (1) 5 A/m2 and case (2) 3
A/m2 respectively. These two different treatments are investigated for accurate values, and
also to clearly differentiate the amount of chlorides removed from the concrete specimen. In
the first case current is applied through the anode to the reinforcing bar acting as the cathode.
The geometry of the specimen is different than that of the geometry explained in Section
3.4.2. This is because of the reason owing to the symmetry and to come out with the new
conceptual application to the model for future work.
Case: 2
In the second model case, the concrete specimen is simulated with the same hydrated cement
paste having external pore solution embedded with assumed three reinforcement bar with
constant current density of 3 A/m2. The increase in the current charge results in early removal
of chlorides (few weeks) from the concrete specimen. To investigate the chloride removal
process constant current is taken for consideration and presented here. The actual amount of
free chlorides remaining in the specimen are taken from the pre-determined experimental data
from (Table 3-2) is shown again for the graph purpose. A line graph is plotted for the
simulation considering the fact from the analysis that, highest concentration of chloride
content takes place in the x-coordinate. These amounts of chloride removal are then
compared with both the cases from the simulation results and are discussed here. The

64
porosity and tortuosity are assumed as, ε = 0.129 and τ = 2. The parameters used in the
chloride binding model are α= 0.42, β= 0.8 and w = 0.3.
Table 4-1 Total amount of free chlorides remaining in the specimen (unit thickness)
Figure 4–1 Bar chart showing total amount of free chlorides remaining in the specimen
Role of multi-ionic movement of Na+ and Cl- and K + in Concrete during and 4.2
after applied current density
It is chemically proven fact from the experimental tests that, chloride ions are free bound
electrons which can move freely in and around the pore solution. When the current is applied
(DC), the negative electrons bound to lose its electrons and goes into the steel cathode. These
negatively charged electrons at the steel cathode become positive (because of two negatively
charged electron attraction) charged electrons. Thus strong concentration of all Na+ at the
steel surface is enhanced by a strong initial chloride concentration in the specimen. These
Time Initial (mole/m) 4 weeks mole/m 8 weeks mole/m 12 weeks mole/m
0.475 0.42 0.397 0.38
0.475 0.291 0.224 0.183
0.475 0.257 0.189 0.15
I1 = 1 A/m2
I1 = 5 A/m2
I1 = 8 A/m2
0
0.1
0.2
0.3
0.4
0.5
1 5 8
Free
Chl
orid
e Co
ncen
trat
ion
(mol
e/m
)
Currrent Density (A/m2)
AMOUNT OF FREE CHLORIDES REMAINING IN THE SPECIMEN
Initial (mole/m)
4 weeks (mole/m)
8 weeks (mole/m)
12 weeks (mole/m)

65
electrons attracted towards the anode region and fore spread the electrons to the Na+ and
becomes bunch of solid sodium ions. Agreeing to the pore solution condition there may be
more amount of Na+ readily available.
While, at the cathode end negative electrons from the Cl- contents within the specimen which
investigate to bind will strip off and goes back into the battery. All the chlorine compositions
near the cathode tend to bind together and again get back into the battery. So, when two
negative chlorine electrons are combined lose their balance electrons. Thus the reaction
process forming chlorine gas and can be extracted. Therefore in practical terms, these
chemical reactions at the battery end will be in the form of negative electrons (e-) receiver
and loser. Where, the cathode end gain electrons and anode end loses its electrons during the
electrolysis process.
It is chemically found that, potassium in nature occurs only in ionic salts. Due to marine
environment, it is found dissolved in seawater. Potassium by weight is found to be very
minute in nature and its quantity in the concrete is not high compared to that of Na+ ions.
Therefore, it is highly soluble in water of potassium compounds. But, the real threat is when
the reaction of (K+) potassium in contact with water forms potassium hydroxide (KOH).
Because of its violent exothermic character give rise to hydrogen gas (H2). In this case the
structure is exposed to marine atmosphere. Thus, hydrogen again reacts with the atmospheric
oxygen (air) leading to severe damage. In contrast, potassium ions are much more likely to
lose extra electrons, acquiring a positive charge, than to gain one and to acquire a negative
charge. The result is because of its low ionization tendency.
4.3 Simulation results and discussions
Figure 4-2 shows the distribution of current densities for the first case. It depicts the
magnitude and flow of current density. In this case, the flow of current (shown in arrow
mark) is perpendicular to the anode and the steel cathode. The flow of current is found to be
slightly lower and slower at the far end of the anode. So, the chloride ions deposited at the far
end thus practically become slower to reach out the anode end on the left side of the concrete
specimen. The colour legend and the length of the arrow shows that, the current density in the
region between anode and steel cathode at the centre is found to be much larger than that in
the rear region of the steel cathode and far away from the anode.

66
Figure 4–2 Distribution of current density at 5 A/m2
Figure 4-3 depicts the ionic concentration distribution profiles of potassium (K+), sodium
(Na+), chloride (Cl-) and hydroxyl ions (OH-) during applied current density of 5 A/m2 for
case one at any time are shown in (Figure 4-3a), (Figure 4-3b), (Figure 4-3c), and for
(Figure 4-3d) respectively. Similarly, results from the simulations for case two are shown in
(Figure 4-5) respectively.
The concentration of calcium ions are left intentionally and it is not presented here. This is
due to the fact that, the concentration is low in nature compared to those of other ions and can
be calculated directly from the solubility equilibrium.
(a) (b)

67
(c) (d)
Figure 4–3 Ionic concentration distribution profiles for case one with current density of 5 A/m2 at cathode
As it can be seen from (Figure 4-3b) and (Figure 4-3d), which predicts only slight change in
the concentration level of sodium and hydroxyl ions vary from (2.2512 x10⁴ mole/m3 to
2.9972 x10⁴ mole/m3). While looking at the colour legend and from (Figure 4-3b), the ionic
concentration distribution of sodium (Na+) and potassium (K+) ions are found depositing all
around the steel reinforcement phase, having maximum concentration of (2.2512 x10⁴
mole/m3). Whereas during the process (Figure 4-3a), it can be seen that, both potassium and
sodium ions are moving from anode towards the inside of the concrete. The chloride ions in
(Figure 4-3c), move exactly in the opposite direction. The highest concentration of potassium
and sodium ions are found parallel to the anode phase and the concentration of chloride is
found be the lowest of all with (0.0161 mole/m3).
The concentrations of hydroxyl ions are found adjacent to the anode phase, which is far from
the central reinforcement. Due to electrochemical reactions taking place at the steel cathode,
the concentration of these hydroxyl ions can be predicted to increase with time and might
come closer to the steel bar to get deposited. The generation rate of hydroxyl ions might get
faster owing to the fact that, the distance between the reinforcement and anode being very
closer to each other. Since most of the current is acquired by the steel cathode
(reinforcement), the amount of chloride ions will be in the steel cathode region and removal
of chloride will also be in the same region. Therefore, the treatment has very little impact on
the reinforcement far from the surface, since the movement of ions almost entirely take place
along x-axis, but rarely found to take place along y-axis and can be seen in (Figure 4-4).

68
Figure 4–4 Movement of ions in X-axis and Y-axis
In one particular concentration region i.e., behind the reinforcement, due to little flow of
current the transport behaviour of ions will be much slower to reach the steel region in
removal process of chloride particles, and it is because of lower diffusion coefficient. It can
experience more rapid movement of ionic species with higher diffusion coefficient.
Whereas in case two, three reinforcement bars are placed at equidistant from each other.
Constant current density of 3 A/m2 for all three reinforcement distributed equally throughout
the electrolysis process and observations made from the simulations results are presented here
and shown in Figure 4-5.
Figure 4-5, shows the concentration distribution profile of each ionic species. It can be seen
from the colour legend that, the highest percentage of concentration of potassium and sodium
ions are deposited at all three edges of the bar, which is far away from the anode region.
When ECR technique is applied, the cations migrate towards the surface of the steel bar.
Particularly by analysing the process, potassium ions move towards the steel bar more
quickly than that of cations.

69
(a) (b)
(c) (d)
Figure 4–5 Ionic concentration profile for current density 3 A/m2 (at cathode)
Though the performances between concentrations of hydroxyl ions and the two positive ions
are identical, but their behaviour patterns are completely different. The simulated results and
colour legends of both the cases show that, the concentration of Na+ ions at the steel surface
undergoes a slight increase in case two. Because of the strong initial concentration inside the
specimen and ionic movement mechanism, the positive charge of the Na+ ions deposit closer
to the negative charge of the steel cathode, which later responsible for the transfer of current
from anode towards the cathode.
Meanwhile, it can be seen in Figure 4-5 (c) that, the concentration ratio of chloride in the
entire steel reinforcement bar is not evenly deposited and only a slight accumulation is found.

70
Overall, concentration level near the anode region is lower than that accumulated on the
lower region, which is far from the anode. Chloride removal is enhanced in case one with
5A/m2 for early removal of chlorides in comparison to that of second case. Thus from the
results of the evolution of the removal of Cl- contents, which can be achieved by increasing
the current density. However for the region behind the bars, the ionic transport mechanism is
controlled by the electric field is slower.
4.4 Comparison of 2D Line graph
Case 1:
Figure 4–6 Ionic concentration curve of single (centre) reinforced concrete specimen of current density I1 = 5 A/m2
Figure 4–7 Influence of aggregate volume fraction on transport of chloride ions at lower boundary (y=0)

71
Figure 4–8 Influence of tortuosity caused by aggregate on transport of potassium ions at lower boundary (y=0)
Case 2:
Figure 4–9 Ionic concentration curve of 3 reinforced concrete specimen of applied current density I2 = 3 A/m2
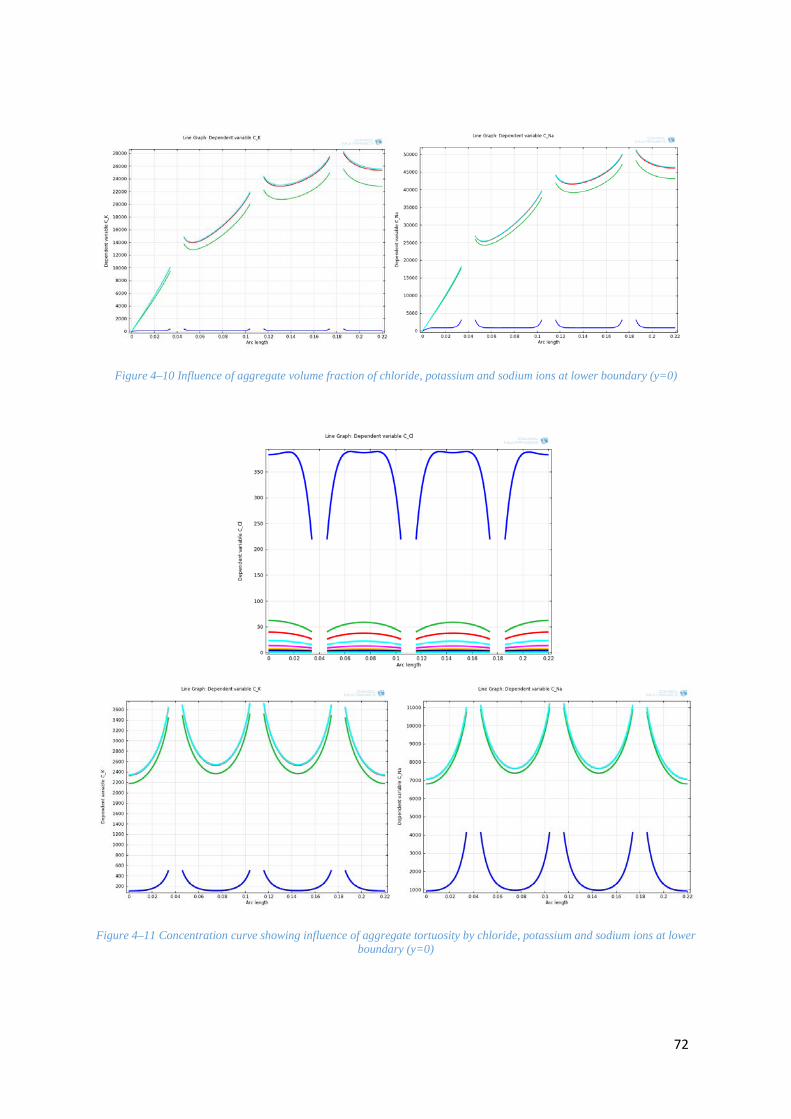
72
Figure 4–10 Influence of aggregate volume fraction of chloride, potassium and sodium ions at lower boundary (y=0)
Figure 4–11 Concentration curve showing influence of aggregate tortuosity by chloride, potassium and sodium ions at lower boundary (y=0)

73
It can be seen from case one of constant current density (Figure 4-6) that, the interruption
between the line graph profile is the aggregate or steel reinforcement/ (steel cathode) region,
and the concentration curve is smooth due to ionic concentrations orient towards steel
cathode during the ECR treatment. The distribution profile of the curves (Figure 4-7 and 4-8)
having upward and downward trend represents the significant effect of aggregate volume
fraction during the transport of chloride, potassium and sodium ions respectively. The
chloride ions concentration is at the far end of the anode due to low current flow, whereas
potassium ions having least concentration generation rate drifting towards the circumference
of the steel cathode.
Similarly, for case two, it can be seen from (Figure 4-9) that, the concentration curve is
smooth and symmetrical at each reinforcement region. The smooth curve trend is due to
constant current density of 3 A/m2 applied throughout on transport of ions during the
treatment process. Consequently, when the influence of tortuosity caused by the aggregate
(Figure 4-10) during electrochemical treatment, one can observe that, fluctuant behaviour
upon volume fraction of aggregate on transport mechanism. The two curve cases also show
that, there is no much impact nature of neither increased nor constant current density during
ECR treatment. However, the heavy volumetric fraction of aggregates grabs larger currents at
central steel cathode region, where diffusion process is dominant. Thus, in case two (Figure
4-11) only a little difference of concentration of each ions compared to case one can be seen.
74
CONCCLUSION AND FURTHER WORK 5
Conclusion 5.1
The study conducted in this thesis deals with the 2D-two phase computer model for
simulation in order to extract the chloride from reinforced concrete (RC) structures. To do
this an electrochemical process is adopted and has been presented here. The keen intension is
to improve the durability pattern of the concrete and modification to the design principles
over the coastal conditions are conducted using COMSOL Multiphysics software.
The simulation and analysis with proper attention to the design principles concentrated
mainly over concrete cover, type of reinforcement used and concentration of chloride
removal from the reinforcing bar with the time are taken into consideration. A number of
parameters were used to assess the effects of concentration of each ion over the steel
reinforcement. This is achieved by varying current density. Keeping these things in mind, the
behaviour of chloride ions during, and after the applied current densities is observed.
Proper comparisons with the previous conducted results factors are used with modification
during the simulation process. It is found from the graph and colour legends that, highest
concentration of potassium and sodium ions takes place (about 80%) at the circumference of
the bar. This is because of steel cathode acting as a dominant during flow of current. Chloride
concentration at front phase of (about 16%) and at rear phase is found to be (70%) due to low
flow of current and flux at that particular phase. This indicates the enhancement and dramatic
increase in chloride reduction through ECR treatment. Hydroxyl ions averaging throughout
and even at increased current density, without being affected by the transport behaviour.
Thus, hydroxyl ions enhancement has been achieved by applied 3 A/m2 of current density at
the steel cathode in case 2.
Overall, as reviewed from the simulation results and discussions, the study is concluded in
such a way that, the rate of increase in current density will remove the chloride concentration
accumulated inside the specimen at the earliest (few weeks) than that of the least current
density. There is serious threat to the concrete resistance with the application of increased
current density for speedy removal of chloride ions. In practical condition, due to increase in
concrete resistance with the treatment time, it is difficult to maintain the current density.
Therefore, use of ECR treatment process lasts for only 8 weeks. Owing to the fact, one of the
best ways to achieve the chloride removal and to ward off high corrosion rates of steel in
marine exposure condition is; by concerned application of combined ECR technique and

75
corrosion inhibitors shall be given the first preference. It is not recommended to adopt
electrochemical reaction (ECR) treatment process applied to structures having strong chloride
contents and rich corrosion rates, which is difficult to exclude and not sufficient to guarantee
in predicting the prolongation of the service life of the structures.
Recommendation for further work 5.2
As reviewed from the above results and discussions, Design principles were the best part to
make an accurate observation before, during, and after the construction of any marine
structures. It is also important to use the known effective methods and parametric
applications to increase the durability and reduce the permeability of concrete in the marine
environment. There are strong possibilities of serious threat and cause to the structures, when
there is poor quality of workmanship and maintenance and more importantly, failure to
handle and close observation of operational standards in such specific marine condition.
Therefore, proper study and analysis of certain concrete structure over the marine
environment may improve the durability of structure as below:
1) Application of design principles and safety standards during the structure is being
under installation process can prevent serious threat to the structure and also
irreparable structural damage.
2) In order to increase the durability of the structure and compressive strength of the
concrete can be achieved by making good use of admixtures during the mix design,
viz., Micro silica gel, Polypropylene fibres, Super Plasticizer, saw dust, etc. These
sound admixtures have a dramatic impact on increasing the compressive strength of
concrete.
3) It is advisable not to use ECR technique on large scale project works, unless the
electrochemical assessments are made of the marine structures concerned.
4) Proper assessments should be conducted on chloride ions concentration neither before
nor after the electrochemical reaction with the application of the technique, which
later wards shall be made provision for the full scale projects.
5) Finally, provision of concrete cover, reinforcement spacing are the two main
important factor in all concrete corrosion results of the world offshore structures.
Therefore, providing cover depth up to 40 mm (which is more than the nominal cover
depth) at the compression member and reinforcing bar shall be used by adopting
‘sandwich reinforcement technique’ for sea or ocean structures.

76
REFERENCES
Alkali Carbonate Reaction/Portland Cement Association. http://www.cement.org/for-concrete-books-learning/concrete-technology/durability/alkali-aggregate-reaction
Bazant, Z. P., et al. (1992). "Improved Prediction Model for Time-Dependent Deformations of Concrete: Part 6–Simplified Code-Type Formulation". Materials and structures 25(148): (219-223).
Bazant, Z. P. and F. H. Wittmann (1982). ''Creep and shrinkage in concrete structures''. Wiley New York.
Broomfield, J. P. (2002). Corrosion of steel in concrete: understanding, investigation and repair. CRC Press.
COMSOL Multiphysics User’s Guide. (1998-2012), Version 4.3. Retrieved 16 January, 2015 http://nf.nci.org.au/facilities/software/COMSOL/4.3/doc/pdf/mph/COMSOLMultiphysicsUsersGuide.pdf
Dr. Jackson. (June 2013). G2MT Laboratories. Retrieved 12 April, 2015, from http://www.g2mtlabs.com/corrosion/cost-of-corrosion/
De Rincon, O. T., Sanchez, M., Millano, V., Fernandez, R., de Partidas, E. A., Andrade, C., & Derregibus, M. (2007). Effect of the marine environment on reinforced concrete durability in Iberoamerican countries: DURACON project/CYTED. Corrosion Science, 49(7), 2832-2843. Retrieved from http://www.sciencedirect.com/science/article/pii/S0010938X07000327 Dr. M. Nagesh. (2012). ''Notes on concrete durability chapter''. VTU EDUSAT SERIES 16th PROGRAM, VTU e-Learning. Concrete Technology. Available on http://elearning.vtu.ac.in/12/enotes/Adv_Conc_Stru/Unit4-MN.pdf
Dr. Mor & Associates, Inc. (1997-2009), ‘’Concrete Forensics and Litigation Support’’. Retrieved from http://www.drmor.com/learn/ASR.html
Everett, D. (1961). "The thermodynamics of frost damage to porous solids". Trans. Faraday Soc. 57: 1541-1551.
Farny, J. A., et al. (1997). ''Diagnosis and control of alkali-aggregate reactions in concrete, Portland Cement Association''.
Fu, Y. F., et al. (2004). "Thermal induced stress and associated cracking in cement-based composite at elevated temperatures––Part II: thermal cracking around multiple inclusions". Cement and Concrete Composites 26(2): 113-126.

77
Fu, C., Jin, X., and Jin, N. (2010) ''Modelling of Chloride Ions Diffusion in Cracked Concrete''. Earth and Space 2010: pp. 3579-3589. doi: 10.1061/41096(366)343
Henrik Wall, Lars Wadso / Marine Structures 33 (2013) 21-32. doi:10.1016/j.marstruc.2013.04.006 / Entire case study report on 'Marine Structures'. Available at http://www.sciencedirect.com/science/article/pii/S0951833913000336
Ichikawa, T. (2009). "Alkali–silica reaction, pessimum effects and pozzolanic effect". Cement and Concrete Research 39(8): 716-726.
Lund,Mejlbro. (1996). ''Durability of Concrete in Saline Environment''. The Complete Solution of fick's Second Law of Diffusion with time dependent, Diffusion Coefficient and Surface Concentration. CEMENTA, Danderyd, Sweden.
L Schueremans, D Van Gemert, S Giessler. (2007), Construction and Building Materials. Chloride penetration in RC-structures in marine environment- Long term assessment to preventive hydrophobic treatment, 21(6), 1238-1249. Retrieved from http://www.sciencedirect.com/science/article/pii/S0950061806001309#
Mingshu, T. (1992). "Classification of alkali-aggregate reaction". Bulletin of National Natural Science Foundation of China 3: 007.
Martin Cyr, Patrice Rivard, Francis Labrecque. (2009). Cement and Concrete Composites. ''Reduction of ASR-expansion using powders ground from various sources of reactive aggregates'', 31 (7), pp.438-446. Retrieved 16 November 2014, from http://www.sciencedirect.com/science/article/pii/S095894650900078X?np=y
Nagi, M., & Kilgour, R. ‘Service Life Prediction of Concrete Structures’. Retrieved from http://www.t.watancon.com/documentation/technical/Nagi%20-%20Service%20Life%20Prediction.pdf
Ono, K. (1988). "Damaged concrete structures in Japan due to alkali silica reaction". International Journal of Cement Composites and Lightweight Concrete 10(4): 247-257.
Paul Lambert, (March 13 2002). Abstracted from Corrosion Protection Association monograph 1. ‘’ Steel Reinforced Concrete - Corrosion of the Reinforcing Steel ‘’ Retrieved from http://www.azom.com/article.aspx?ArticleID=1318
Portland Cement Association. (2002). Types and Causes of Concrete Deterioration. Retrieved 1 November, 2015, from http://www.cement.org/docs/default-source/th-paving-pdfs/concrete/types-and-causes-of-concrete-deterioration-is536.pdf?sfvrsn=4

78
Professor. Sudhir Mishra, Indian Institute of Technology, Kanpur, Concrete Engineering and Technology, Lecture-26 on ''Reinforcement corrosion in concrete''. Published on 13 February 2014. Available at https://www.youtube.com/watch?v=0XIGC5WwW-4
Prof. Dr.-Ing. Michael Raupach. History of EFC-WP 11 “Corrosion in Concrete“. Retrieved 10 October, 2014, fromhttp://www.efcweb.org/efcweb_media/-p-1205.pdf?rewrite_engine=id
R.Muigai, P. M., M. Alexander (2012). "Durability of reinforced concrete structures: A comparision of the use of durability indexes in the deemed-to-satisfy approach and full-probabilistic approach". Matrials and Structures 45(8), 1233-1244.
Sakugawa, T., et al. (1985). ''Durability of Reinforced Concrete Structures in Marine Environment''. Ocean Space Utilization’85, Springer, 455-461.
Sanchez, L. F. M., et al. (2015). "Reliable quantification of AAR damage through assessment of the Damage Rating Index (DRI)". Cement and Concrete Research 67(0), 74-92.
Swamy, R. N. (2002). ''The alkali-silica reaction in concrete''. CRC Press.
Tuutti, K. (1982). Corrosion of steel in concrete (No. Monograph).
Thompson, N. G., Yunovich, M., & Dunmire, D. (2007). Cost of corrosion and corrosion maintenance strategies. Corrosion Reviews, 25(3-4), 247-262. Retrieved 12 April, 2015, from http://www.degruyter.com/view/j/corrrev.2007.25.3-4/corrrev.2007.25.3-4.247/corrrev.2007.25.3-4.247.xml
Venecanin, S. D. (1990). "Thermal incompatibility of concrete components and thermal properties of carbonate rocks". ACI materials journal 87(6), p. 602-607.

79
REFERENCES FOR LIST OF FIGURES AND TABLES
Figure 2-2 Anhydrous Portland cement. Retrieved 26 September, 2014 from https://www.google.co.uk/search?q=anhydrous+portland+cement&espv=2&biw=1366&bih=643&source=lnms&tbm=isch&sa=X&ei=ERI4VeS_F8G1acz-gWA&ved=0CAcQ_AUoAg#imgrc=iv0pHs6xbY0B3M%253A%3BiMzU0NggiB4NIM%3Bhttp%253A%252F%252Fcnx.org%252Fresources%252Ff908f051664ee12d0ec6d18b890f018f%252FFig19.jpg%3Bhttp%253A%252F%252Fcnx.org%252Fcontents%252Ff46e8679-ee00-4073-9f5e-a87ca9955a9e%254025.5%253A31%252FChemistry_of_the_Main_Group_El%3B3151%3B2629
Figure 2-5 Calcium Silicate Hydrate and CH crystal. Retrieved 01 October, 2014, from https://www.google.co.uk/search?q=CH+crystal+and+CSH&espv=2&biw=1366&bih=643&tbm=isch&imgil=1KlObKoyRLV1QM%253A%253BrKBbhWRLAiGQTM%253Bhttp%25253A%25252F%25252Fwww.fhwa.dot.gov%25252Fpublications%25252Fresearch%25252Finfrastructure%25252Fpavements%25252Fpccp%25252F04150%25252Fchapt14.cfm&source=iu&pf=m&fir=1KlObKoyRLV1QM%253A%252CrKBbhWRLAiGQTM%252C_&usg=__G6qUSMrx-89Ezw0J3N9iXAnGNAE%3D&ved=0CCwQyjc&ei=ywc8VbyrFIHbauOLgbgN#imgdii=zj3sUfXTcY6nMM%3A%3Bzj3sUfXTcY6nMM%3A%3BbmUdvinEF4xMkM%3A&imgrc=zj3sUfXTcY6nMM%253A%3Bw5N9AZ3o44jB8M%3Bhttp%253A%252F%252Fwww.scielo.br%252Fimg%252Frevistas%252Fmr%252F2013nahead%252Faop_matres147212fig9.jpg%3Bhttp%253A%252F%252Fwww.scielo.br%252Fscielo.php%253Fscript%253Dsci_arttext%2526pid%253DS1516-14392014000100003%3B331%3B258
Figure 2-6 Calcium hydrate composition. Cement lab. Retrieved 01 October, 2014, from http://www.cementlab.com/cement-art.htm
Figure 2-7 Prismatic and trigonal shaped Ettringite. Retrieved 01 October, 2014, from http://en.wikipedia.org/wiki/Ettringite
Figure 2-8 Process of deterioration of steel by carbonic acid attack and Figure 2-9 Carbonation of concrete process and PH value range. Retrieved 1 November, 2014, from http://elearning.vtu.ac.in/16/ENotes/ConcreteTechnology/Unit7-MN.pdf
Figure 2-10 Alkali Silica reaction Sequence. Alkali-Aggregate Reactivity (AAR) Facts Book. Retrieved from http://www.fhwa.dot.gov/pavement/concrete/asr/pubs/hif13019.pdf
Figure 2-12 Freeze-thaw Resistance/Deck Scaling and Figure 2-13 Freeze-thaw cycles/D-Cracking). Retrieved 15 November, 2014, from http://www.cement.org/for-concrete-books-learning/concrete-technology/durability/freeze-thaw-resistance

80
Figure 2-14 Alkali-carbonate reaction process and definition. Retrieved 16 November, 2014, from http://www.cement.org/for-concrete-books-learning/concrete-technology/durability/alkali-aggregate-reaction
Figure 2-15 Shrinkage of concrete. Retrieved 17 November 2014, from https://www.google.co.uk/search?q=wikipedia/shrinkage+of+concrete&espv=2&biw=1366&bih=643&source=lnms&tbm=isch&sa=X&ei=ihE8VfmSOdXear-sgOgE&ved=0CAYQ_AUoAQ#tbm=isch&q=shrinkage+of+concrete&imgrc=ULXbQFmD--YokM%253A%3BpJSbRblkJP2jSM%3Bhttps%253A%252F%252Fcbiconsultinginc.files.wordpress.com%252F2012%252F04%252Fphoto.jpg%3Bhttps%253A%252F%252Fcbiconsultinginc.wordpress.com%252F2012%252F04%252F02%252Fconcrete-shrinkage-issues%252F%3B3264%3B2448
Figure 2-16 Corrosion of Reinforcement. Retrieved 18 November 2014, from https://www.google.co.uk/search?q=wikipedia/shrinkage+of+concrete&espv=2&biw=1366&bih=643&source=lnms&tbm=isch&sa=X&ei=ihE8VfmSOdXear-sgOgE&ved=0CAYQ_AUoAQ#tbm=isch&q=corrosion+of+reinforcement&imgrc=nHm30bCOp7c9kM%253A%3BnMbvx2VUnSuKfM%3Bhttp%253A%252F%252Fwww.cement.org%252Fimages%252Fdefault-source%252Fcontech%252Fcorrosion_water_graphic.jpg%253Fsfvrsn%253D2%3Bhttp%253A%252F%252Fwww.cement.org%252Ffor-concrete-books-learning%252Fconcrete-technology%252Fdurability%252Fcorrosion-of-embedded-materials%3B490%3B214
Figure 2-17 Pitting of corrosion and corrosion effect on reinforcement. Retrieved 18 November, 2014, from https://www.google.co.uk/search?q=pitting+of+corrosion&espv=2&biw=1366&bih=643&source=lnms&tbm=isch&sa=X&ei=lj4tVe3ZB4P2av-ogJAN&ved=0CAYQ_AUoAQ&dpr=1
Figure 2-18 Carbonation and corrosion effect on reinforcement. Retrieved 18 November, 2014, from http://en.wikipedia.org/wiki/Concrete_degradation
Table 2-1 Olutoge, F. A., & Amusan, G. M. The Effect of Sea Water on Compressive Strength of Concrete. Concentration of major Ions in some of the world seas. Retrieved 22, September 2014, from http://www.ijesi.org/papers/Vol%283%297/Version-2/E0372023031.pdf
Related Documents