Welcome message from author
This document is posted to help you gain knowledge. Please leave a comment to let me know what you think about it! Share it to your friends and learn new things together.
Transcript
DISSERTATION
Do good and talk about it: Corporate SocialPerformance and Corporate Social Reporting
Dipl.-Kfm., Dipl.-Vw. Carsten Albers
angestrebter akademischer Grad
Dr. rer. pol.
Dresden, im März 2012
Betreuer: Univ.-Prof. Dr. Thomas W. Günther
Contents
1 Cover Paper 1
1.1 Introduction . . . . . . . . . . . . . . . . . . . . . . . . . . . . . . . . 1
1.2 Corporate social performance . . . . . . . . . . . . . . . . . . . . . . 3
1.3 Stakeholder centred theories . . . . . . . . . . . . . . . . . . . . . . . 4
1.3.1 Legitimacy theory . . . . . . . . . . . . . . . . . . . . . . . . . 5
1.3.2 Institutional theory . . . . . . . . . . . . . . . . . . . . . . . . 6
1.3.3 Resource dependence theory . . . . . . . . . . . . . . . . . . . 7
1.3.4 Stakeholder theory . . . . . . . . . . . . . . . . . . . . . . . . 7
1.3.5 Application of theories . . . . . . . . . . . . . . . . . . . . . . 8
1.4 Information sources . . . . . . . . . . . . . . . . . . . . . . . . . . . . 9
1.4.1 Information problem . . . . . . . . . . . . . . . . . . . . . . . 9
1.4.2 Agency problem . . . . . . . . . . . . . . . . . . . . . . . . . . 10
1.4.3 Types of information sources . . . . . . . . . . . . . . . . . . . 10
1.4.4 Credibility of disclosed information . . . . . . . . . . . . . . . 12
1.5 Causes for social reporting . . . . . . . . . . . . . . . . . . . . . . . . 13
1.6 Standards and guidelines for social reporting . . . . . . . . . . . . . . 16
1.6.1 Reporting standards . . . . . . . . . . . . . . . . . . . . . . . 16
1.6.2 Assurance standards . . . . . . . . . . . . . . . . . . . . . . . 17
1.7 Overview of corporate social performance research . . . . . . . . . . . 17
1.8 Included papers . . . . . . . . . . . . . . . . . . . . . . . . . . . . . . 21
1.8.1 Paper 1: Escaping the fog: How to de�ne Corporate Social
Performance . . . . . . . . . . . . . . . . . . . . . . . . . . . . 22
1.8.2 Paper 2: Disclose or not disclose: Determinants of social re-
porting . . . . . . . . . . . . . . . . . . . . . . . . . . . . . . . 23
1.8.3 Paper 3: Sunny with cloudy intervals: The in�uence of social
reporting on �rm value . . . . . . . . . . . . . . . . . . . . . . 24
1.9 Conclusion and further research . . . . . . . . . . . . . . . . . . . . . 25
2 Escaping the fog: How to de�ne Corporate Social Performance 27
2.1 Introduction . . . . . . . . . . . . . . . . . . . . . . . . . . . . . . . . 27
2.2 Background . . . . . . . . . . . . . . . . . . . . . . . . . . . . . . . . 30
2.2.1 Reasons for ambiguous study results . . . . . . . . . . . . . . 30
i
Contents
2.2.2 Validity . . . . . . . . . . . . . . . . . . . . . . . . . . . . . . 32
2.3 Literature search . . . . . . . . . . . . . . . . . . . . . . . . . . . . . 35
2.4 De�nitions . . . . . . . . . . . . . . . . . . . . . . . . . . . . . . . . . 36
2.5 Face validity . . . . . . . . . . . . . . . . . . . . . . . . . . . . . . . . 43
2.5.1 Measures of CSP . . . . . . . . . . . . . . . . . . . . . . . . . 43
2.5.2 Face validity of CSP measures . . . . . . . . . . . . . . . . . . 45
2.6 Proposal for assessing CSP in future research . . . . . . . . . . . . . . 49
2.7 Summary . . . . . . . . . . . . . . . . . . . . . . . . . . . . . . . . . 54
3 Disclose or not disclose: Determinants of social reporting 57
3.1 Introduction . . . . . . . . . . . . . . . . . . . . . . . . . . . . . . . . 57
3.2 Literature Review . . . . . . . . . . . . . . . . . . . . . . . . . . . . . 60
3.3 Theoretical Framework . . . . . . . . . . . . . . . . . . . . . . . . . . 65
3.4 Research Design . . . . . . . . . . . . . . . . . . . . . . . . . . . . . . 69
3.4.1 Dependent Variable . . . . . . . . . . . . . . . . . . . . . . . . 70
3.4.2 Independent Variables . . . . . . . . . . . . . . . . . . . . . . 71
3.4.3 Empirical Model . . . . . . . . . . . . . . . . . . . . . . . . . 74
3.4.4 Data Sources and Sample . . . . . . . . . . . . . . . . . . . . 75
3.5 Results . . . . . . . . . . . . . . . . . . . . . . . . . . . . . . . . . . . 76
3.5.1 Descriptive Statistics . . . . . . . . . . . . . . . . . . . . . . . 76
3.5.2 Regression results . . . . . . . . . . . . . . . . . . . . . . . . . 77
3.5.3 Robustness checks . . . . . . . . . . . . . . . . . . . . . . . . 80
3.6 Conclusion . . . . . . . . . . . . . . . . . . . . . . . . . . . . . . . . . 81
4 Sunny with cloudy intervals: The in�uence of social reporting on �rm
value 83
4.1 Motivation . . . . . . . . . . . . . . . . . . . . . . . . . . . . . . . . . 83
4.2 Background & Theory . . . . . . . . . . . . . . . . . . . . . . . . . . 85
4.2.1 Social Reporting . . . . . . . . . . . . . . . . . . . . . . . . . 85
4.2.2 Hypotheses Development . . . . . . . . . . . . . . . . . . . . . 87
4.3 Research Design . . . . . . . . . . . . . . . . . . . . . . . . . . . . . . 93
4.3.1 Data & Sample . . . . . . . . . . . . . . . . . . . . . . . . . . 93
4.3.2 Variable Operationalisation . . . . . . . . . . . . . . . . . . . 94
4.3.3 Regression Analyses . . . . . . . . . . . . . . . . . . . . . . . 97
4.3.4 Descriptive Statistics . . . . . . . . . . . . . . . . . . . . . . . 98
4.4 Results . . . . . . . . . . . . . . . . . . . . . . . . . . . . . . . . . . . 100
4.4.1 Basic Results . . . . . . . . . . . . . . . . . . . . . . . . . . . 100
4.4.2 Additional Analysis . . . . . . . . . . . . . . . . . . . . . . . . 103
4.5 Robustness . . . . . . . . . . . . . . . . . . . . . . . . . . . . . . . . 107
4.6 Conclusion . . . . . . . . . . . . . . . . . . . . . . . . . . . . . . . . . 108
ii

List of Figures
1.1 Relationships between the papers . . . . . . . . . . . . . . . . . . . . 22
2.1 Causes for di�erent results of the CSP-CFP relationship . . . . . . . 31
2.2 Validity framework . . . . . . . . . . . . . . . . . . . . . . . . . . . . 33
2.3 Model for assessing a CSP de�nition . . . . . . . . . . . . . . . . . . 50
3.1 Underlying theories . . . . . . . . . . . . . . . . . . . . . . . . . . . . 66
iii

List of Tables
1.1 Comparison of mandatory and voluntary disclosure . . . . . . . . . . 11
2.1 De�nitions of constructs in studies researching the CSP-CFP rela-
tionship . . . . . . . . . . . . . . . . . . . . . . . . . . . . . . . . . . 36
2.2 Number and source of used de�nitions . . . . . . . . . . . . . . . . . 37
2.3 Corporate social performance as framework or not . . . . . . . . . . . 41
2.4 De�nitions of corporate social responsibility . . . . . . . . . . . . . . 42
2.5 De�nitions of corporate social responsiveness . . . . . . . . . . . . . . 42
2.6 Sources of CSP measures . . . . . . . . . . . . . . . . . . . . . . . . . 43
2.7 Appropriateness of measures in CSP-CFP studies (in alphabetical
order) . . . . . . . . . . . . . . . . . . . . . . . . . . . . . . . . . . . 45
2.8 Rating of examined journals . . . . . . . . . . . . . . . . . . . . . . . 48
3.1 Possible determinants of voluntary disclosure . . . . . . . . . . . . . . 64
3.2 Countries of sample companies . . . . . . . . . . . . . . . . . . . . . . 76
3.3 Industries of sample companies . . . . . . . . . . . . . . . . . . . . . 77
3.4 Descriptive statistics and correlation coe�cients . . . . . . . . . . . . 77
3.5 Regression results . . . . . . . . . . . . . . . . . . . . . . . . . . . . . 78
4.1 GRI reports, application level, assurance . . . . . . . . . . . . . . . . 99
4.2 Descriptive Statistics - Overall . . . . . . . . . . . . . . . . . . . . . . 99
4.3 Correlation Matrix . . . . . . . . . . . . . . . . . . . . . . . . . . . . 100
4.4 Results of Regression Analysis with GRI report . . . . . . . . . . . . 101
4.5 Results of Regression Analysis with application levels as dummy vari-
ables . . . . . . . . . . . . . . . . . . . . . . . . . . . . . . . . . . . . 102
4.6 Wald Test for the equality of application level coe�cients . . . . . . . 102
4.7 Results of Regression Analysis with external assurance as dummy
variables . . . . . . . . . . . . . . . . . . . . . . . . . . . . . . . . . . 103
4.8 Wald Test for the equality of assurance coe�cients . . . . . . . . . . 103
4.9 Results of Regression Analysis with combined application levels and
external assurance as dummy variables . . . . . . . . . . . . . . . . . 105
4.10 Wald Test for the equality of combined application level and assurance
coe�cients . . . . . . . . . . . . . . . . . . . . . . . . . . . . . . . . . 106
iv

1 Cover Paper
Abstract
This paper introduces the dissertation by Carsten Albers. In the �rst
part it illustrates the understanding of corporate social performance
(CSP) and exposits important theories which explain why companies
consider stakeholders in their decisions. It will give motivations for dis-
closing voluntary information in general and especially with regard to
CSP, and it will address the standards for disclosure and assurance of
such information. The second part will give an overview of the research
�eld of CSP. Finally, it will brie�y present the content of and the rela-
tionships between the papers included in the dissertation.
1.1 Introduction
There have been many noble and generous deeds in human history. The invention
of writing made it possible to deliver such events to posterity. Beside this, writing
has also been used for other documentary tasks. The Egyptians recorded their crop
yields, the location of stars, and the planning and progress for building pyramids.
Later, double entry accounting was invented and writing has been used more and
more to support organisational processes, but also to describe special events.
Every company needs to do some kind of writing. This can be for internal pur-
poses to inform managers or other internal stakeholders, or external, to inform
shareholders or other external stakeholders such as the government which receives
tax payments from the company. Some companies act in a good way and also report
these actions. Furthermore, there can be reports about the company by someone
else, such as analysts or associations who want to inform their members or the pub-
lic about the company's activities. Normally, it is expected that a company reports
only to its owners because they �nanced the company and they made this decision
to receive high returns from their investment in relation to the risk they bear.
Doing something good for other stakeholder groups from which the company does
not, or at least not directly, bene�t could be questionable for some people. For
example, investors could think that pollution control expenditures are a �drain on
1

1 Cover Paper
resources which could have been invested pro�tably, and do not `reward' the com-
panies for socially responsible behavior� (Mahapatra, 1984: p. 37). This argument
is very linear and does take into account cross-links. Low pollution output could
decrease the regulations or fees imposed by the government, which in turn saves
expenditures in this direction. But also, links are imaginable which are not com-
putable. Most theories stating such relationships are in association with stakeholders
and their in�uence on the company.
Indeed, shareholders are also stakeholders and they su�er and react accordingly by
decreasing their investment if they assume that the company acts in an unpro�table
way. That is why corporate social performance (CSP, more in section 1.2) should be
examined more closely to �nd aspects which could help the company to be pro�table,
but also to discover the possible risks of CSP. Di�erent concepts and de�nitions exist
for this construct, and they do not necessarily harmonise in practical and academic
discussion.
It is recognisable that some companies not only act in the way preferred by many
stakeholders, but also report what they do. In most cases this reporting is voluntary
and not regulated by law. This reporting costs extra resources and as with other
social actions, does not provide any direct improvement in pro�ts. That is why the
motives of such reporting are an interesting research question. Additionally, it could
be of interest how credible this kind of disclosure is. As mentioned, in most cases it
is voluntary and it is conceivable that companies mainly report in their own favour
and leave out unfavourable aspects, or they could even disclose false data.
To evaluate and report a company's CSP, di�erent frameworks exist. In �nancial
accounting, the IFRS or US-GAAP standards are the basis for assessing important
parts of the corporate �nancial performance (CFP) of companies, and so too do
these standards and guidelines help to assess the CSP. But this latter should be
done di�erently than in �nancial statements, because many aspects of CSP are
non-monetary (or at least it is very di�cult to determine their value).
To better understand such company behaviour, the research �eld belonging to
CSP should be categorised. This can be done with the help of literature reviews of
this research stream, but also with the voluntary �nancial disclosure literature. This
should lead to the origins of CSP and its practical implementation in companies.
It is also the basis for the identi�cation of aspects which are of great interest for
researchers or where other knowledge gaps should be �lled in the future.
The contribution of this paper is to introduce these important themes to give a
basis and understanding of CSP research, especially the reporting of a company's
social behaviour. This paper is structured as follows. First, a short introduction
with regard to CSP is given and di�erent theories are introduced that not only
focus on �nancial performance as the main interest for shareholders, but also on
2
1 Cover Paper
social and environmental issues. Next are delineated di�erent information sources
for the reporting of companies in general. Additionally, it is argued why companies
report on CSP topics, followed by an introduction to the standards and guidelines
which should assist companies in assessing their CSP. Afterwards, an overview of
CSP research is given. Then, the three papers of this dissertation are delineated
which belong to this research stream and it is stated where they contribute to the
literature. Finally, a conclusion is drawn and possible further research is suggested.
1.2 Corporate social performance
The article of Wood (1991b) is, with Jones (1995) and Mitchell et al. (1997), one of
the most cited articles in corporate social performance research (De Bakker et al.,
2005: p. 303). Wood (1991b: p. 692) states that theoretical development of the
CSP de�nition has not signi�cantly moved beyond this by Wartick and Cochran
(1985). They de�ne that the �CSP model re�ects an underlying interaction among
the principles of social responsibility, the process of social responsiveness, and the
policies development to address social issues� (Wartick and Cochran, 1985: p. 758).
This de�nition is improved by Wood (1991b: p. 693) who de�nes CSP as �a business
organization's con�guration of principles of social responsibility, processes of social
responsiveness, and policies, programs, and observable outcomes as they relate to the
�rm's societal relationships�. Hence, the constructs corporate social responsibility
and corporate social responsiveness can be seen as a part of or as something standing
in close connection to corporate social performance.
There also exist de�nitions of constructs related to CSP which have not emerged
from the research literature. E.g., a de�nition given in the so-called Brundtland
report (Brundtland Report, 1987) or a de�nition from the European Commission
(European Commission, 2001). The Brundtland report is named after the Norwe-
gian prime minister Gro Harlem Brundtland who was chair of the United Nations
World Commission on Environment and Development in the 1980s. The commission
drew up the concept of sustainable development because they wanted to consider the
destruction of the earth and its resources. The work of this commission built a foun-
dation for Agenda 21 (Agenda 21, 1992), a plan of action for saving and protecting
the environment, which was adopted by more than 178 governments at the United
Nations Conference on Environment and Development in Rio de Janerio 1992. This
agenda was also rea�rmed at the World Summit on Sustainable Development in
Johannesburg 2002. In the Brundtland report it is de�ned that sustainable devel-
opment should �ensure that it meets the needs of the present without compromising
the ability of future generations to meet their own needs� (Brundtland Report, 1987:
p. 24).
3
1 Cover Paper
In European Commission (2001: p. 9) it is stated that corporate social responsi-
bility is �a concept whereby companies integrate social and environmental concerns
in their business operations and in their interaction with their stakeholders on a
voluntary basis�. This paper was published in 2001 and its intention is to deliver a
basis for debating this theme on a European and international level. This should
help to achieve the goal of the European Union �to become the most competitive
and dynamic knowledge-based economy in the world, capable of sustainable eco-
nomic growth with more and better jobs and greater social cohesion� (European
Commission, 2001: p. 4).
These de�nitions are very broad and it always depends on circumstances whether
a certain action is seen as social or sustainable. Taking the de�nition from the
Brundtland report, it can be said that our generation is the next generation from
the viewpoint of our parents and grandparents. They probably met their needs
and we probably meet our needs, too. It should rather be asked to what extent all
generations met and will meet their needs. Also the de�nition of Wood (1991b) leaves
room for interpretation, but this is not necessarily an issue because social demands
may change and so the social responsibility, processes, and actions of companies
should too. Further issues can arise because of the diversity of stakeholders. Some
actions which are seen as responsible by one stakeholder group can actually be seen
as irresponsible by another (Jones and Goldberg, 1982: p. 604).
1.3 Stakeholder centred theories
In the �nancial accounting literature, the focus is often on the wealth of shareholders
who invest money in the company in the hope of making a pro�t from this invest-
ment. They are the source of equity and their money is at higher risk than capital
given by banks and other sources of debt. They expect at least as much pro�t as
they would get from other investments with similar risk. Hence, companies try to
attract investors by increasing the shareholder value. To do so, companies also have
to satisfy the needs of stakeholders they do business with or which are otherwise im-
portant for the company. For example, a company that pays wages at a level which
is too low to give the employees an adequate living or makes them sick because they
cannot a�ord good food will su�er from unmotivated or ill employees. In a similar
vein, companies should respect their customers. If a company does not respect the
wishes of its customers it is di�cult to sell its products, which generate the pro�ts
and therefore are the basis for its shareholder value.
Out of these thoughts some questions arise. Are all individuals and institutions
stakeholders which have to be satis�ed? And if not, how can a company make a
distinction between stakeholders which add value for shareholders and those which
4

1 Cover Paper
do not? In addition, it can be asked why companies engage in activities such as char-
itable donations which apparently do not have a direct and positive in�uence on the
return for shareholders. To assess these questions, Clarkson (1995: p. 100) proposes
that researchers distinguish between the management of (primary) stakeholder is-
sues and social issues. He also advises conducting analyses at the appropriate level
which can be institutional, organisational, or individual. Often used theories which
consider stakeholders out of the society are legitimacy theory, institutional theory,
resource dependence theory, and stakeholder theory (Chen and Roberts, 2010: p.
651). These theories are compatible up to a certain level and they should be chosen
based upon the focus of the study where they are to be used.
1.3.1 Legitimacy theory
To understand legitimacy theory it is helpful to understand the term �social con-
tract�. It is expressed by Shocker and Sethi (1973: p. 97) who point out that a
company has to distribute some of its bene�ts to the groups from which it derives
its power and to foster society in general. Only when it ful�ls this contract and
demonstrates with such actions that it is useful for society will it be accepted by
society. In turn, the company gets legitimacy to work and is seen as relevant for
society, which is the basis for its operations.
If a company misses ful�lling the expectations of society, it should undertake
corrective steps to save its legitimacy (Deegan, 2000: p. 105). This is somewhat
di�erent from legal contracts, where the part who does not discharge their obligation
satisfactorily gets penalised immediately. A social contract is not written formally
by someone, it arises from societal expectations. Hence, it is possible to ful�l it
when the actions from the company are acceptable as a whole.
Because it is not a �xed contract, the possibility exists that the relevant societal
expectations may change over time Brown and Deegan (1998: p. 22). Media at-
tention to special issues often in�uence the public salience of these themes (Ader,
1995: p. 309). This means that managers have some indication what the current
social expectations could be. E.g., there was a great media coverage of Union Car-
bide, Exxon Valdez, Moura Mine, and the Iron Baron incidents, and companies tried
to preserve their legitimacy by positively in�uencing society with respect to these
incidents (Deegan, 2000: p. 126).
Lindblom (1994), as cited by Tilling and Tilt (2010: p. 61), states four strategies
for companies to defend their legitimacy: change itself, change the public, manipu-
lation, and misrepresentation. By changing itself, the company changes its activities
and adapts to the expectations of the society. By changing the public, the company
tries to change the expectations of society in a desired direction without chang-
5
1 Cover Paper
ing its own behaviour. By manipulating society, the attention from current issues
should be decreased by highlighting other more positive actions such as charitable
donations the company has given recently. Misrepresentation means an incorrect
representation of the company's activities. This would be done with the risk of
being uncovered and su�ering even more damage to its legitimacy.
1.3.2 Institutional theory
The development of institutional theory provides di�erent de�nitions and arguments
(Scott, 1987: p. 509). However, it explains the establishment of institutional norms
to which the company has to answer in a certain way (Kondra and Hinings, 1998:
p. 744). These norms arise from pressures by institutional environments which
have isomorphic structural e�ects on companies (Meyer and Rowan, 1977: p. 346).
This type of organisational change makes companies with similar environments more
equal, which does not necessarily mean more e�cient or competitive (DiMaggio and
Powell, 1983: p. 147).
To better understand the processes of conformation with the institutional envi-
ronment, Scott (2008: p. 428) proposes three elements (1) regulative, 2) normative,
3) cultural-cognitive) which should be considered when applying the institutional
theory. 1) Regulative elements include rule-setting, monitoring, and sanctioning
activities, for instance law-based rules. If the company does not comply with these
rules it has to expect �nes. 2) Normative elements are similar, but not enforceable
through legislation, but they are expected by the institutional environment as well.
Examples for these elements are the compliance with certi�cation or accreditation
standards. 3) Cultural-cognitive elements are the basis for the other two elements
(regulative, normative) and they are generally accepted by the institutional environ-
ment. They also can not be enforced by governmental agents. Training programs
for employees or charitable contributions can be seen as such cultural-cognitive ele-
ments. Hence, these elements have di�erent motives, but they all aim to sustain a
stable relationship with the environment (Scott, 2008: p. 429).
For companies there exist di�erent possible ways of responding to institutional
environmental pressures. Oliver (1991: p. 152) provides �ve di�erent strategies to
respond to institutional processes: acquiescence, avoidance, compromise, de�ance,
manipulation. Acquiescence is the most passive form of response and can harmonise
with the concept of mimetic isomorphism which is stressed by many researchers con-
sidering institutional theory. The other forms of response are more active. Whereas
with the strategy of avoidance the company tries to circumvent, with compromise
or de�ance it debates or ignores the problems arising from the environment. With
the most active strategy, manipulation, the company changes or counteracts the
6

1 Cover Paper
institutional pressure in its favour.
1.3.3 Resource dependence theory
The book The External Control of Organizations: A Resource Dependence Perspec-
tive by Pfe�er and Salancik (1978) was very in�uential in establishing the resource
dependence theory (Hillman, 2009: p. 1404). This theory describes companies as
being exposed not only to internal but also to external contingencies. They arise
because companies depend on the resources of its environment which are necessary
for the company to exist. External factors are able to control these resources to a
certain degree which can in�uence the behaviour of a company and build external
dependence. To increase their own power, companies try to minimise their own
dependence or increase the dependence of others on themselves (Ulrich and Barney,
1984: p. 472). In doing so, resource dependence theory proposes theoretically and
empirically that companies concentrate more on resources which are critical for their
long term survival (Jawahar and Mclaughlin, 2001: p. 402).
A good portion of the work by Pfe�er and Salancik (1978) concentrates on how a
company can manage dependence on its environment. Companies can adapt to their
environment or try to avoid its in�uence on them. They also can alter organisational
interdependences by engaging in mergers and acquisitions or organisational growth.
Another way is negotiating the environment by in�uencing the composition of the
board of directors or building joint ventures or other strategic alliances. There also
exists the possibility of in�uencing political decisions or regulations to create an
environment that is more favourable for the company. Furthermore, the success of
a company also depends on its executives, whch is why it is critical to choose the
right people to manage the organisation in its speci�c context.
1.3.4 Stakeholder theory
The book Strategic Management: A Stakeholder Approach by Freeman (1984) is
often seen as the starting point of the stakeholder theory (Laplume, 2008: p. 1157).
He de�nes stakeholders as �a group or individual who can a�ect or are e�ected by the
achievement of the organisation's objectives� (Freeman, 1984: p. 46). He also states
that �you must deal with those groups that can a�ect you, while to be responsive
(and e�ective in the long run) you must deal with those groups that you can a�ect�
(Freeman, 1984: p. 47). These de�nitions are very broad and can be interpreted in
many directions. Perhaps this has caused the popularity of this theory and its use
for many di�erent research questions. Laplume (2008) give a very good overview of
the development of this theory, de�nitions used, and its use as a basis for empirical
work.
7

1 Cover Paper
Nevertheless, there are some researchers who view this theory with some scep-
ticism. Jensen (2002: p. 243) compares stakeholder theory with �the widespread
failure of centrally planned socialist and communist economies� and states that with
stakeholder theory, special interests get too much power. Sundaram and Inkpen
(2004: p. 359) argue that shareholder value should be the preferred goal of a com-
pany. Freeman et al. (2004: p. 366) address these arguments and point out that
shareholders already are stakeholders and increasing their wealth does not constrict
the stakeholder theory. They discuss that managing other stakeholders than share-
holders does not necessarily decrease shareholder value and that there already exist
product tests with customers, alliances with other companies, and an increase in
supply-chain management with suppliers, all of which are stakeholders. In a com-
plex world, it is not necessarily more di�cult to manage di�erent stakeholders than
to follow only the one goal of shareholder value maximisation which is the only
requirement for the wealth and survival of companies.
For managing stakeholders, companies can use a large set of strategies (Laplume,
2008: p. 1165). Freeman (1984) has two chapters in his book that deal with the
four strategies: exploiting, defending, swinging, or reinforcing. Huse and Eide (1996:
p. 227) present three stakeholder management techniques which are labelled move-
ment, multimatum, and manipulation. Rowley (1997: p. 901) discusses strategies
depending for di�erent network con�gurations depending on the density of the stake-
holder network and the centrality of the focal organisation. Jawahar and Mclaughlin
(2001: p. 405) show possible strategies for companies in di�erent stages of their life
cycle. These strategies depend on how important particular stakeholders are for
organisational needs in these life cycle stages.
1.3.5 Application of theories
In their article Chen and Roberts (2010) discuss how the presented theories have
similar objectives, lines of arguments, and applying them should be based on the
focus of the particular study (Chen and Roberts, 2010: p. 662). They propose using
legitimacy theory if social expectations exist but the audience of corporate actions or
disclosure are not explicitly known or named. Institutional theory should be applied
when analysing companies having similar institutional structures in comparison to
other companies which have also implemented the analysed processes, programs,
or actions. Resource dependence theory is applicable when analysing interactions
between the company and other organisations who both have or strive for power
over important resources the company needs to operate and survive. Stakeholder
theory can be used in studies which examine the active management of stakeholders
or stakeholder groups.
8

1 Cover Paper
In addition, one theory, such as the stakeholder theory, can be used in di�erent
ways: narrative, descriptive/empirical, or instrumental, all of which have di�erent
application presumptions and outcomes (Donaldson and Preston, 1995: p. 71). The
identi�cation of important stakeholders is also di�cult and none of these theories
provide a consistent way to include them in research (Mitchell et al., 1997: p. 854).
However, the theories presented overlap in scope, and in the proposed strategies for
companies, and usually more than one theory can be applied for a speci�c research
question.
1.4 Information sources
There are di�erent information sources that provide data about the activities of
companies. These information sources can be provided by internal or external par-
ties. Normally, the information sources have di�erent target audiences with di�ering
informational needs for which they are prepared for. Only one broad, but not very
detailed information source for several stakeholders, which even could have di�ering
interests (Sturdivant, 1979: p. 58) could probably increase those problems and can
cause a misallocation of resources, because of insu�cient information.
For corporate �nancial disclosure Healy and Palepu (2001: p. 407) point out that
an information problem for investors before an investment decision and an agency
problem (incentive problem) after a positive investment decision for a company exist
which in�uence the content, representation and amount of disclosure. Information
asymmetry which is one reason for these problems can be decreased by di�erent
information sources. In addition, information asymmetry can a�ect other stake-
holders in a similar manner, because they interact with a company on the basis of
their knowledge as well.
1.4.1 Information problem
The information problem especially arises in markets where investors or other stake-
holders do not have full information and for example try to judge the quality of
possible investments with little available information. Akerlof (1970: p. 489-490)
explain the possible loss in market e�ciency with the example of the market for
uses cars. In this market the seller of a car knows whether his car is good or bad (a
so-called �lemon�). The buyer cannot di�er between good cars and lemons and thus
the market price for cars is an average price which is between the lower price for a
lemon and a higher price for a good car. At this price sellers of lemons get more
money than a buyer would pay for the car if they knew the real quality. Sellers of
good cars instead achieve less money than they would get if a buyer knew the real
9

1 Cover Paper
quality.
The more lemons are in the market the lower is the average market price. Thus
the seller of a good car should try to escape this information problem. This could
be done with trustworthy additional information which con�rms that his car is good
quality car. The same problem can be transferred to others who want to invest
in a company or are in another kind of business relationship with it. With only
little information they do not know how good or bad the company performs and
can only judge about general aspects like the situation in the company's industry.
Thus, additional information should increase the believe that a company performs
good for good companies and lowers it for bad companies.
1.4.2 Agency problem
If an investor (�principal�) and a manager (�agent�) have the same goals there should
be no issue, because both would choose the same or a similar way of managing a
company. This situation is de�nitely present when the investor and manager are the
same person. Once the investor hired someone else to manage the company it should
be assumed that the manager also acts in his own interests which can di�er from
those of the investor. For instance, in this situation the manager tries to increase
his own annual monetary returns, he wants to delegate more sta� than necessary to
increase his power or makes charitable contributions to projects he prefers personally
(Jensen and Meckling, 1976: p. 312). This decreases the possible wealth of the
investor and occurs because of unequal information between the principal and agent,
wrong or no incentives for the agent and is called the agency problem.
To deal with this problem the principal has to bear monitoring costs or incentive
costs which are paid for desired actions of the agent. These also include costs for
additional information the principal is willing to pay because he achieves a bene�t
from it which is greater than the costs. If a contract exists which de�nes clear
instructions the agent has to stick to, additional information acts as an incentive for
the agent to act in the desired way. In this case for the agent the information could
induce high costs of being discovered in comparison to his bene�t for not complying
with his part of the contract. Such agency problems can also be attributed to other
relationships such as companies and creditors or companies and its customers.
1.4.3 Types of information sources
To decrease the information asymmetry, several types of disclosure can be used
(Healy and Palepu, 2001: p. 409). Disclosure of information can be mandatory
or voluntary for a company. Mandatory are regulations from the government or
disclosure requirements by stock exchanges. For example, they include well-known
10

1 Cover Paper
standards such as IFRS or US-GAAP, but also the NYSE rules that companies have
to follow if they want to be listed on the New York Stock Exchange.
Voluntary disclosure can be given directly from the company to its stakeholders or
through information intermediaries. Directly given information includes information
of voluntary reports, websites, conferences, and road shows. One type of voluntary
reports are social or sustainability reports which include information about the so-
cial performance aspects of companies. Information intermediaries are the �nancial
press, �nancial analysts, or rating agencies. They get information from the company
and pass it on to the shareholders. Usually, they prepare, modify, or add information
for improved readability and comprehensibility. In contrast to mandatory reporting
which necessarily has to be done, companies consciously choose to disclose volun-
tary information which di�erentiates them from non-disclosing companies and sends
content-dependent signals to its stakeholders. Hence, voluntary disclosure provides
more information than no disclosure, but does not need to be complete, because
there are no binding standards for the company. Table 1.1 gives a short overview of
these aspects.
Table 1.1: Comparison of mandatory and voluntary disclosure
mandatory disclosure voluntary disclosure
- information for stakeholders - information for stakeholders- regulated - not regulated- binding standards - no binding standards- di�cult to hide issues - easy to hide/not report issues- mostly stand-alone reports - di�erent reporting types possible- easier to compare - more di�cult to compare- disclosure by itself has no signalling
function- disclosure by itself has a signalling
function
When companies issue freely available voluntary information, analysts have lower
costs in gathering this information. But this could also decrease the demand for their
services, because they do not have the advantage of information which is privately
provided to them by company managers which was a unique selling point (Healy
and Palepu, 2001: p. 417). Nevertheless, companies which provide more informa-
tion than their industry peers have a greater analyst following and more accurate
forecasts (Lang and Lundholm, 1996: p. 490). Similar to this Francis et al. (1997:
p. 390) �nd a greater analyst following for �rms with corporate presentations to
analysts.
11

1 Cover Paper
1.4.4 Credibility of disclosed information
Shareholders and investors react to information published by companies (Kothari,
2001: p. 196). Amir and Lev (1996: p. 28) show that the growth potential or
franchise value for cellular companies, which is non-mandatory information, are
value-relevant for investors. However, there is also evidence that positive voluntary
information from stressed companies is less credible for the market than that of non-
stressed companies (Frost, 1997: p. 184). However, also information of non-stressed
companies can be of less credibility in several circumstances. Managers could have
incentives for maintaining a state of information asymmetry to support their own
interests, which may di�er from those of the stakeholders. Thus, the information
provided by the company can be incomplete or even incorrect. Hence, the market
tends not to trust this information without additional assurances.
For mandatory reports, there is often a mandatory assurance process which is not
the case for voluntary disclosure. Assurance not only exists for �nancial statements,
but also for expanded reporting of performance, electronic commerce, or sustainabil-
ity reporting (Knechel et al., 2006: p. 145). Thus, to make voluntary disclosure, e.g.
social reports, more useful for the readers, it should be assured by a trustworthy
and independent party. Consequently, independent third-parties such as auditors
should be able to increase the credibility of social reports (Dunfee, 2003: p. 250).
Credible information can also be provided by information intermediaries, if they
are independent from the company they report about. Those intermediaries col-
lect information from several possible sources, not only the company itself. Then
they evaluate this information independently and inform their clients, e.g., investors,
about the corporate performance. Usually, this is done for �nancial information by
�nancial analysts and academic research concentrates on earnings forecasts and buy
recommendations, which indicates the value relevance of these types of information
(Healy and Palepu, 2001: p. 416). Barth and Hutton (2004: p. 91) examine analyst
earnings forecast revisions and �nd that they are positively related to future changes
in earnings. This can be seen as an indication that �nancial analysts improve mar-
ket e�ciency. The accuracy of analyst information seems to be better when the
company o�ers expanded disclosure and when they are examined by specialised an-
alysts (Gilson et al., 2001: p. 565). Consequently, it can be assumed that disclosure
by the company, external assurance of corporate information, and information by
�nancial intermediaries, provide value relevant data for shareholders and investors
(Healy and Palepu, 2001: p. 418).
12

1 Cover Paper
1.5 Causes for social reporting
Besides managing the needs of society and engaging in social activities, companies
report about those aspects which bind additional resources of the company. This
kind of disclosure is called social reporting, but the terms triple bottom line report-
ing, social and environmental reporting, or sustainability reporting, are also used.
Sustainability can be seen as a term embracing social and environmental terms
(Adams and Larrinaga-González, 2007: p. 350). Hence, considering political econ-
omy theory and two of its variants which are important for this research stream,
stakeholder theory and legitimacy theory (Branco and Rodrigues, 2007: p. 79),
potential readers of such reports are all the stakeholders. That is why a reporting
company has to consider all stakeholders which could a�ect the company in a signif-
icant way, because it can be assumed that most of its owners are mainly interested
in the �nancial performance. But if a company considers all important stakeholders
before issuing a social report, it could be that it realises that some information may
be disadvantageous for its market value (Cormier and Gordon, 2001: p. 593).
That is why social disclosure cannot be observed in all companies, and also among
the reporting companies it is unlikely that all available information is reported.
Beyer et al. (2010: p. 300) list six conditions under which companies would dis-
close all voluntary information they have: �(1) disclosures are costless; (2) investors
know that �rms have, in fact, private information; (3) all investors interpret the
�rms' disclosure in the same way and �rms know how investors will interpret that
disclosure; (4) managers want to maximise their �rms' share prices; (5) �rms can
credibly disclose their private information; and (6) �rms cannot commit ex-ante to a
speci�c disclosure policy�. If all these conditions hold, there would be no argument
for companies to not disclose their information because they should try to minimise
information problems. Following this line of argumentation, at least some of these
conditions should not be ful�lled because in fact companies do not voluntary publish
all their information.
Social reporting can be seen as a further cost factor and thus, the �rst condition
is not a given. However, it is possible that companies disclose more information if
it is relatively cheap and the bene�t of disclosing this information in�uences �rms'
share prices in a positive way which is supported by condition four. There is also a
tendency to less disclosure if proprietary costs are too high which can also be seen as
disclosure costs. Clinch and Verrecchia (1997: p. 132) formally show that increased
competition between companies results in a decreased probability of voluntary dis-
closure because companies try to hide valuable information. With respect to the
second and �fth condition it can be argued that the probability is very high that
investors do not know all about the information the company has and also do not
13

1 Cover Paper
know if the given information is credible, but indeed these assumptions are hard to
prove. That investors interpret all available information in the same way is also very
unlikely because they combine it with their own private information which is one of
the reasons stock exchanges work. If all information were interpreted in the same
way, all investors would act in the same way if they want to maximise their pro�t.
In turn it is impossible for companies to interpret this reaction because they di�er.
Condition four is, in a social context, not necessarily the only goal, but rather in-
creasing the wealth of more stakeholders and not only shareholders. The argument
against the sixth condition comes from the previous arguments and because the
disclosure of voluntary information is a discretionary decision, companies cannot be
forced to follow a speci�c strategy even if they promised a speci�c disclosure policy.
Nevertheless, companies partially disclose voluntary information which should
depend on the extent to which these conditions do apply. Thus, it can be assumed
that motives for voluntary disclosure exist. However, some state that probably
not all companies are clear about their goals due to reporting about their social
engagement (Moody-Stuart, 2006: p. 89). If a motive exists, they can either be
derived from the capital market literature which also deals with voluntary disclosure,
or from stakeholder oriented theories.
Healy and Palepu (2001: p. 420) give an overview of six hypotheses used in the
capital market literature to justify voluntary disclosure: �capital market transac-
tions, corporate control contests, stock compensation, litigation, proprietary costs,
and management talent signalling�. The �rst three hypotheses are based on the
argument of information asymmetry between company managers and shareholders
or between shareholders. Lowering this information asymmetry helps to reduce the
external �nancing costs of a company or to reduce undervaluation of the company
either to minimise takeover risk or to have adequate stock compensation. Litigation
risk can raise or lower voluntary disclosure depending on its e�ect, e.g., if the legal
system penalises insu�cient information there will be more information, if it pe-
nalises good forecasts which are false this information will be decreased. Proprietary
costs can be seen in a similar way. If it can be expected that voluntary information
would give too much information to competitors or regulators it is rather reported
in less detail. Management talent could also have an in�uence on �rm value and
managers who show through disclosure that they are aware of their environment can
be assumed to be talented.
Investors could also have an investment strategy which does not fully depend on
�nancial criteria, for instance, the Domini Social Equity Fund excludes military,
tobacco or gambling companies (Dunfee, 2003: p. 248). In such cases investors need
additional criteria to evaluate the company. Consequently, voluntary information
can be essential for an investment decision. Interestingly, with such a behaviour
14

1 Cover Paper
they restrict their own choices of possible investments which should lead to less
�nancial pro�t in comparison to someone who is able to diversify his portfolio with
all possible companies.
Other motives behind this reporting behaviour can be derived from several stake-
holder centred theories which all state that a company depends on its environment
and stakeholders. One motive could be a demand of stakeholder groups which the
company tries to satisfy. Deegan (2002: p. 291) states that many companies try
to legitimise their actions which can be explained by legitimacy theory. Releasing
such information also helps to in�uence the behaviour of stakeholders in favour of
the company so it can expect support for its activities.
Another motive is that the company wants to show its good behaviour so that
the audience for this kind of disclosure recognises it. This could help to improve
the reputation of the company. Bebbington, Larrinaga and Moneva (2008: p. 340)
analysed reputation ranking studies and argue that �ve main elements are used to
evaluate the reputation of a company: �nancial performance, quality of manage-
ment, social and environmental responsibility performance, employee quality, and
the quality of goods and services provided. At least social and environmental respon-
sibility performance should be likely to be disclosed in social reports which could
help to increase the company's reputation and help to build competitive advantages.
For instance, if people want to work for a company they want to know how it treats
its employees or if customers want to buy products they perhaps want to know if
they produce them with child labour. If they �nd the information they are seeking
and the company acts in an appropriate way with respect to their demands they
have a positive attitude towards the company and are more likely to buy from or
work for the company.
Hence, the motives and underlying bene�ts of voluntary disclosure are �more mul-
tifarious and complex than sending risk management signals to investors� (Spence,
2007: p. 860). In most cases they can not be assessed that easily, such as by �-
nancial values in annual reports. The e�ects of social actions and their reporting
often are indirect, e.g., managers who signal their talents in managing stakeholders
through social reports can not calculate how this a�ects the �rm value. Only a
functional chain of e�ects can be hypothetically identi�ed. The situation is similar
with the costs of voluntary disclosure. While the costs of preparing the report can
be quanti�ed quite well within the company, competitive disadvantages arising by
useful private information which is given to competitors can not be calculated.
15

1 Cover Paper
1.6 Standards and guidelines for social reporting
1.6.1 Reporting standards
There are some ways for companies to signal their participation in social activities.
One form is becoming a voluntary participants in the UN Global Compact. This is
an initiative which was founded in 2000 and aims to improve the wealth of economies
and society with sustainable practices. It has over 8,700 participating companies
and other stakeholders from over 130 countries. It has no legal power over its
participants and they can leave this initiative whenever they want. Participants in
the UN Global Compact are expected to support and communicate its ten principles
in the areas of human rights, labour, environment, and anti-corruption:
1. Businesses should support and respect the protection of internationally pro-
claimed human rights; and
2. make sure that they are not complicit in human rights abuses.
3. Businesses should uphold the freedom of association and the e�ective recogni-
tion of the right to collective bargaining;
4. the elimination of all forms of forced and compulsory labour;
5. the e�ective abolition of child labour; and
6. the elimination of discrimination in respect of employment and occupation.
7. Businesses should support a precautionary approach to environmental chal-
lenges;
8. undertake initiatives to promote greater environmental responsibility; and
9. encourage the development and di�usion of environmentally friendly technolo-
gies.
10. Businesses should work against corruption in all its forms, including extortion
and bribery.
These principles are also incorporated in the standards of the Global Reporting
Initiative (GRI) and AccountAbility, and they came into force for social and envi-
ronmental reporting in 1997 and 1995, respectively. These organisations developed
standards for companies to cope with their responsibilities, activities, and sustain-
able development, in social and environmental areas. The AA1000 AccountAbility
Principles Standard (AA1000APS, 2008), by AccountAbility, help to identify, pri-
oritise, and respond to sustainable challenges. The sustainability framework by
16

1 Cover Paper
GRI, which includes sustainability reporting guidelines (GRI, 2006), can be �exibly
adapted to assess and report the sustainability of a company. The GRI guidelines
are the most often applied reporting standards for social and environmental aspects
(Ballou et al., 2006: p. 66). Further standards, but rather for managing and mon-
itoring social and environmental aspects, are ISO 14001 and Social Accountability
8000.
1.6.2 Assurance standards
The assurance of social information is an integral part of the preparation of social
reports, and thus it is also voluntary and not every company facilitates the assurance
of its social report. There exist two well-known assurance standards, the ISAE 3000
(ISAE 3000, 2003) and the AA1000AS (AA1000AS, 2008), especially for making
social reports more credible, by independent external assurance. The ISAE 3000 was
released by the International Auditing and Assurance Standards Board (IAASB) in
2003. The IAASB is a board of the International Federation of Accountants (IFAC)
which also issued the International Standards on Auditing (IAS) for professional
�nancial accountants. The �rst edition of AA1000AS was released by AccountAbility
in 2003 and a revision of it was released in 2008, which is also compatible with the
ISAE 3000.
These standards support auditors in assessing various aspects of social reports. In
particular, they give recommendations for planning the assurance process so it can be
carried out e�ciently. This includes de�ning the level of assurance, the identi�cation
of assurance engagement risks, and needed competences. With such competence, the
assurer should be able to judge the appropriateness and evaluate the correctness of
the measures used for the subject matter. The risk of false judgements or evaluations
should be minimised by using quality control procedures. With this knowledge, the
assurer should document the assurance process and come to a conclusion which
points out the credibility of the social report, reasons for inappropriate aspects, and
limitations of the assurance statement.
1.7 Overview of corporate social performance
research
To get an overview of a research area, one possible approach is to read literature
reviews. That is why this section is a short literature review about the literature
reviews of CSP research. Therefore, only those studies are taken into account whose
purpose is to carry out a literature review. Thus, studies including a literature
review as part of their introduction or motivation are not considered. This review is
17

1 Cover Paper
in chronological order and presents in short the underlying purpose of the particular
review as well as its �ndings.
Arlow and Cannon (1982) review seven studies examining the relationship between
social responsiveness and economic performance. The studies are divided into those
with positive and negative or neutral relationships. They found ambiguous evidence
for this relationship and concluded that in the short run there is neither a positive nor
a negative relationship. However, it is stated that companies see socially responsible
actions as important and in the long run there may be a positive relationship.
Wood and Jones (1995) review studies researching empirical CSP studies. They
structured their review into studies with respect to community or charity, employ-
ees, social justice (or in particular equal employment opportunity), customer or
consumer, natural environment, corporate reputation, information disclosure, re-
sponsiveness, governance, manager values, and legal or regulatory behaviour. The
intention of their study is to show that many of the variables used in these studies
do not re�ect what they ought to measure. Consequently, they comment on many
studies and their limitations which often are based on inappropriate measures for
the relevant stakeholders constructs. They also �nd that the relationship between
social performance and �nancial performance is ambiguous, but that results are
more consistent for market-based measures.
Frooman (1997) performs a meta-analysis for 27 event studies which observe the
in�uence of socially irresponsible or illegal behaviour on shareholder wealth. This is
a negative formulation of the question if socially responsible and lawful behaviour
in�uences shareholder wealth. The event studies concentrate on events which re-
veal a negative behaviour of companies such as violations of laws or governmental
standards, product recalls, tax evasion, frauds, pollution of the environment, and
so on. The meta-analysis comes to the conclusion that irresponsible or illegal be-
haviour signi�cantly decreases shareholder wealth. Therefore, it can be said that
responsible behaviour serves shareholder wealth.
Mathews (1997) reviews 25 years of social and environmental accounting research
from 1971 to 1995. Not only empirical studies but also normative statements, philo-
sophical discussion, the non-accounting literature, teaching programmes, text books,
regulatory frameworks, and other reviews are included in this review. The review
is divided into three periods: 1971�1980, 1981�1990, and 1991�1995. In the �rst
period, some models or normative statements due to social accounting are devel-
oped, but empirical studies are scarce and most are only descriptive. In the second
period, more empirical studies which are less descriptive are produced and a wide
debate about social and environmental disclosure can be identi�ed. The third period
is characterised by an overweight of studies with environmental compared to those
with social themes. A lack of normative and philosophical work is identi�ed, but
18

1 Cover Paper
this area becomes more popular in educational programmes.
Roman et al. (1999) review 51 articles that are extracted from a table in a study
by Gri�n and Mahon (1997) and four new articles, and assess their validity and
contemporary relevance. Therefore, they removed �ve articles from the sample due
to missing or invalid measures for CSP or CFP, but it is also noted that some of
these studies are written to �nd other relationships. They also excluded four studies
from their sample because of signi�cant research de�ciencies and existing improved
research with the same data in their sample. The �ndings indicate that there may
be a positive link between CSP and CFP, but they suggest further research with
more valid measures and appropriate methods.
Margolis and Walsh (2003) review 30 years of research examining relationship
between CSP and CFP. They found 127 studies from 1972 to 2002. In 109 of these
studies CSP is the independent variable and in 22 studies, the dependent variable,
meaning that four studies examine both directions. They �nd that the majority
of these studies �nd a positive relationship between CSP and CFP. However, they
argue that there are causes for concern about their reliability and validity, omitted
variables, mediating or moderating variables, sample issues, and a causal theory.
A meta-analysis by Orlitzky et al. (2003) includes 52 studies from the US research-
ing the relationship between CSP and CFP. For the purpose of the meta-analysis,
only studies which reported the e�ect size and had clear results are included. Over-
all they �nd a positive relationship between CSP and CFP in di�erent industries
and contexts. It is stated that a broad construct such as CSP should be measured
in a variety of ways, which is already the case. This also in�uences the results,
for instance social responsibility has a higher impact on �nancial performance than
environmental responsibility, reputation based CSP measures have a greater in�u-
ence on CFP, and CSP has higher correlations with accounting-based than with
market-based measures.
Allouche and Laroche (2005) examine the relationship between CSP and CFP
with a meta-analysis. The analysis is based on 82 studies coming from the US,
the UK, and Canada. The sample does not include event studies or studies with
confounding variables or methodological problems. They conclude that CSP has
a positive in�uence on CFP, but the extent of this in�uence depends on the CSP
measures. CSP reputation indices have a strong impact on CFP, whereas social
disclosure seems to have a weak in�uence on CFP.
A bibliometric analysis which covers the period from 1969�2002 is done by De Bakker
et al. (2005) to evaluate research and theory development on corporate social re-
sponsibility and social performance. They constructed three datasets with literature
about corporate social responsibility with 505 articles, CSP with 155 articles, and a
combined dataset with 549 articles, because CSP articles are also included to a large
19

1 Cover Paper
extent in the corporate social responsibility dataset. They state that this research
�eld is developing, but also established, because key papers are often cited in high
ranked journals. An increase in theoretical papers in the examined datasets can also
be noticed.
A study by Parker (2005) concentrates on the research �eld of social and environ-
mental accounting. He identi�es 247 articles published in six journals from 1988 (or
the �rst volume of the journal in question) to 2003. Of these papers, 66% concen-
trated on environmental issues, 25% on social issues, and 9% on both. Hence, areas
such as employee health and safety, community relations, minority employment, or
ethical investment should be considered more often in order to carry out a better
balanced research in social and environmental accounting.
Wu (2006) conducts a meta-analysis with 121 empirical studies. In these studies
the relationship between CSP, CFP and �rm size is analysed. The results �nd a
positive relationship between CSP and CFP. The strongest correlations can be seen
with CSP as a reputation measure. The relationship is also stronger if CFP is not a
market-based measure. Contrary to many other studies, it is also stated that there
is no signi�cant relationship between �rm size and CFP or between �rm size and
CSP.
A literature review by Beurden and Gössling (2008) examines the relationship
between CSP and CFP in 34 newer studies since 1990. Of these studies, 68% �nd a
signi�cant positive, 26% no signi�cant, and 6% a negative relationship. They �nd
that reputation rankings are most often used to measure CSP, followed by social
actions such as corporate philanthropy, and, least of all, social disclosure about
social concern. They state that there is an inconsistency in the measurement of
CSP and CFP. Variables found in more than one study that could in�uence the
relationship between CSP and CFP are size, industry, R&D, and risk.
Peloza (2009) reviews 159 studies researching the relationship between CSP and
CFP from 1972 to 2008. In particular, he examines the measures used for CFP,
but also �nds that 39 di�erent CSP measures are used in the studies. Overall, the
relationship between CSP and CFP is seen as positive, but in Africa it could be
neutral or negative. 36 di�erent CFP measures are used in the reviewed studies.
One measure group includes mediating metrics such as �rm consumption, which
could in�uence the measures in the intermediate and end-state outcome metrics.
Examples for intermediate outcome metrics are energy expenses or cash �ow, and
for end-state outcome metrics, share prices or returns to assets. 91% of the studies
use end-state metrics for measuring CFP, but market-based measures are used most
often. It is concluded that a closer evaluation of CSP, especially from a stakeholder
point of view, is necessary. In addition, common measures for CSP or CFP could
produce a common base of knowledge for researchers and managers who want, �nally,
20

1 Cover Paper
to know how to act in a speci�c situation with regard to social activities.
With these reviews of the CSP literature, it can be concluded that this research
area is very active. Overall, there seems to be a positive relationship between CSP
and CFP, but on a very broad basis. CSP should be researched in more detail and for
a better comparison, the results of the studies should be compared with more similar
CSP and CFP measures. This could help to �nd more speci�c linkages between
the two broad constructs of CSP and CFP. In addition, not only environmental
measures, reputation ratings, or accounting based measures should be examined,
but also measures which could be more directly in�uenced by social activities.
1.8 Included papers
The conceptual development of the three papers included in this dissertation, the
data collection and data analysis as well as the interpretation of the results and the
written formulation of the papers, is based on the individual work of Carsten Albers,
the author of this cumulative dissertation.
The �rst paper (Escaping the fog: How to de�ne Corporate Social Performance) is
currently in the reviewal process at the journal Business & Society. I am grateful for
the support of Prof. Dr. Thomas W. Günther in providing feedback on the concept
as well as on the formulation. An early version of this paper was presented at the
5th Workshop on Visualising, Measuring and Managing Intangibles and Intellectual
Capital in 2009. I also gratefully acknowledge valuable feedback from Marc Orlitzky
on this paper.
The second paper (Disclose or not disclose: Determinants of social reporting) is
published in a re�ned version including the valuable feedback given by Prof. Dr.
Thomas W. Günther in Journal of Management Control, formerly Zeitschrift für
Planung (Albers and Günther, 2010). However, the paper included in this disserta-
tion comes without this feedback.
The third paper (Sunny with cloudy intervals: The in�uence of social reporting
on �rm value) has not been submitted to a journal yet, but it was presented at
two conferences which delivered some feedback which helped to improve this paper.
It was presented at the EAA Annual Congress 2011 in Rome in 2011 and at the
73rd Wissenschaftliche Jahrestagung des Verbandes der Hochschullehrer für Betrieb-
swirtschaft e.V. in Kaiserslautern in 2011. Under the supervision of Carsten Albers
the idea and concept of the third paper was tested empirically in a diploma thesis
by Harald Altmann with a reduced sample. I am also grateful for the support of
Prof. Dr. Thomas W. Günther in providing feedback on the concept as well as on
the formulation.
Figure 1.1 gives an overview of the three papers included in the dissertation.
21

1 Cover Paper
Figure 1.1: Relationships between the papers
The �rst paper examines di�erent de�nitions of the construct CSP and develops
a proposal for researchers to understand this term better and to �nd appropriate
measures for it. The second and the third paper analyse corporate reporting about
corporate social performance (corporate social reporting). With regard to the pro-
posed assessment of CSP in the �rst paper, they deal with social responsiveness, in
particular the answer of a company to stakeholder demands in the form of social
reports. These reports can also contain and report about other aspects such as cor-
porate social responsibilities or other social actions, but the actual content of these
reports is not examined in the papers. In particular, the second paper examines
determinants of corporate social reporting while the third paper shows the in�uence
of social reporting on CFP.
1.8.1 Paper 1: Escaping the fog: How to de�ne Corporate
Social Performance
As seen in Section 1.7, there are often concerns about the validity of the CSP
measures used. A prerequisite for construct validity which empirically tests whether
a measure measures what a de�ned construct speci�es is the validity of the subjective
consistence of measurement and construct. To provide this prerequisite this article
examines face validity of the measures of CSP with the CSP de�nitions in papers
researching the relationship between CSP and CFP. It also gives a proposal to
achieve a more common understanding and delineation of CSP.
To �nd used CSP de�nitions and measures empirical studies researching the link
between corporate social performance and corporate �nancial performance are used.
This relationship is taken, because it is the most researched relationship in this
research �eld. It is also useful to isolate the de�nitions and measures of CSP. Thus
their di�erences can be associated with the construct CSP without the probability
22

1 Cover Paper
of a distortive relationship of CSP to di�erent constructs.
De�nitions and measures of CSP used in these articles are identi�ed in a focused
literature review of 114 articles between 1970 and 2009. Showing these de�nitions a
plausible explanation for the interchangeable use of CSP, corporate social responsi-
bility, and corporate social responsiveness can be given as the two latter constructs
often are de�ned as constituents of CSP.
A subsequent step compares these de�nitions with their associated measures to
assess their face validity. It is shown that few de�nitions and measures are not face
valid. However, those which are face valid are not necessarily better. There exist
two shortcomings with CSP de�nitions. First, a lot of papers do not de�ne CSP
constructs clearly. Second, very di�erent measures could be used for some de�nitions
because the CSP construct is de�ned very broadly. These shortcomings can hinder
progress in CSP research, because they may be the source of confusion about actual
relationships between particular CSP constructs and CFP constructs.
That is why a proposal for assessing CSP as well as corporate social responsi-
bility and corporate social responsiveness is given in this paper. The suggested
model is derived from the de�nitions found in the analysed papers. This model also
incorporates two other terms often used in connection with CSP: corporate social
responsibility and corporate social responsiveness. Stakeholders are basis of this
model because they specify the social responsibilities for companies. The compa-
nies in turn have to answer to them which can be described with the term social
responsiveness. Finally, the �t between these two constructs can be seen as the so-
cial performance. This model may aid in categorising research and identifying more
precise aspects of CSP and their interactions in future research.
1.8.2 Paper 2: Disclose or not disclose: Determinants of
social reporting
This paper examines determinants of disclosing a social report or not. As such,
reports prepared with the help of the guidelines developed by the Global Reporting
Initiative (GRI) are used in this paper. There are only few papers analysing this re-
lationship, but there are also papers concentrating on speci�c voluntary information
which has not to be a separate report. Building on those both streams of literature,
possible determinants of disclosing a social report are identi�ed and examined.
This question is important because it delivers arguments for several debates. For
instance, it contributes to debates where people ask to change voluntary social dis-
closure to a mandatory one. In addition, the knowledge about the determinants of
voluntary social disclosure can help stakeholders to better judge companies on the
basis of their reporting behaviour.
23
1 Cover Paper
The sample consists of STOXX Europe 600 �rms. Thus, it is possible to analyse
country speci�c e�ects based on a broad sample of companies. These are often miss-
ing variables in prior literature. But also other important constructs which should
have an in�uence on the disclosure of a social report such as size or media coverage
are included in the analysis. This study also adds sustainability performance for the
disclosure of GRI reports as an additional possible determinant which has not been
used in prior studies researching this relationship.
The analysis reveals that size, media, country speci�c factors, industry, and sus-
tainability performance have a signi�cant in�uence on whether �rms disclose social
reports or not. The results indicate that mandatory regulation of social reports is
not that necessary, because it can be assumed that companies are more likely to
report in countries where laws do protect stakeholders, such as investors, to a lesser
extent. Thus, a kind of self-regulation due to the necessity of voluntary reporting
can be seen. It can also be stated that companies which perform well with regard
to sustainable aspects are more likely to disclose social reports. As has been stated
in previous literature risk, capital structure and �nancial performance seem to have
a negligible in�uence on this kind of voluntary reporting. Consequently, while this
study con�rms some previous �ndings, it also rejects or undermines certain others.
1.8.3 Paper 3: Sunny with cloudy intervals: The in�uence of
social reporting on �rm value
In this paper the impact of social reporting on �rm value is examined. Companies
provide more information than they are required by law. Social reports are such
a kind of voluntary information and the rationale behind its disclosure is expected
to be of �nancial nature. Thus, social reporting is hypothesised to have a positive
impact on the �rm value.
It is argued that reducing possible information asymmetries between companies
and stakeholders should increase the value of the company. Other reasons for the
increase of �rm value are given through arguments provided by stakeholder centred
theories. Further, it is expected that more information as well as an assurance of
voluntary disclosed reports should also increase the �rm value.
The sample which is used in this study consists of the Dow Jones STOXX 600
�rms from 2008 to 2010 and GRI reports are taken as social reports. All companies
in this index are located in Europe which has gone a long way in the history of social
reporting. Both the companies disclosing such reports as well as the stakeholders
reading these reports should be familiar with this kind of reporting, at least more
than on other continents. Thus, the market should reveal a �rm value which includes
such disclosure in an appropriate manner.
24

1 Cover Paper
The results show that the fact of disclosing a GRI report increases the �rm value.
More information in general also increases the �rm value, but there is a probability
that an optimum of information exists which is less than the maximum possible
information required by the GRI guidelines. However, external assurance seems
to have no in�uence on the �rm value. Only for companies with relatively little
disclosed information can it be advantageous to let the GRI assure their reports.
In conclusion, the �rst paper in the dissertation provides a basis for analysing CSP
in its details and to allocate particular research to a well-de�ned terminology which
shows its direction. The second and third paper are about voluntary disclosure of
social information which is an action of the company. This can be seen as social
responsiveness because it is assumed that companies try to satisfy a demand from
their stakeholders. Both papers are good starting points for analysing CSP in more
detail using the contents of GRI reports. This content can be de�ned with the
proposed CSP model of the �rst paper.
1.9 Conclusion and further research
CSP is a broad construct including many di�erent aspects. It not only includes
di�erent facets such as the environment and social and economic aspects, but these
aspects can be examined from di�erent perspectives. It is important to know why
companies act in a social or ethical way. This may be caused by the stakehold-
ers of the company who have other demands besides increasing shareholder value.
But it is also interesting to know if companies really respond to these demands or
if they undertake social actions which are broadly accepted and are not for their
stakeholders in particular.
Research indicates that acting in a social manner may increase �nancial perfor-
mance, but do companies know what they have to do and to what extent? Is it
better to act for the broad social community or to respond only to special stake-
holders of the company? If the latter is the case, should a company only respond
to primary or also to secondary stakeholders? Next, the question arises about too
much social engagement, which means whether there is an optimum of social actions.
For instance, McWilliams and Siegel (2001) present a supply and demand model for
corporate social responsibility. When taking this into account, positive in�uences
such as higher reputation or more support from stakeholders have to be compared
with the higher costs of social actions or of disclosing private information about the
company which could used against it.
Similar questions arise for social disclosure. Without communicating good be-
haviour, it could be that stakeholders would not notice it. This could mean that
positive e�ects do not occur, but also negative e�ects from disclosing private infor-
25

1 Cover Paper
mation do not lead to competitive disadvantages. To answer this there could also
be a maximum or minimum of social disclosure which should be applied regarding
the company's goals. The same counts for the type of information and the format
in which it is presented or how it is made credible to its audience.
Further research should concentrate on the many facets of CSP and categorise
them as precisely as possible. Researching studies using reputation rankings should
point out that this is the company's picture from the view of those who rank the
company. Studies examining charitable donations should classify these studies as
social responsiveness. This research should also be done with various methods to
show where di�erences in particular areas come from, the variables used, the cir-
cumstances such as time, country, industry, or the method used. For instance,
Schuler and Cording (2006) proposes a behavioural model which should help to un-
derstand the impact of social performance on consumers attitude towards a company.
Changes in societal expectations or those of stakeholders should also be incorporated
into CSP research because they should be the basis of social behaviour which means
that the relationship between society and companies changes with them (Warren,
1999: p. 215).
26
2 Escaping the fog: How to de�ne
Corporate Social Performance
Abstract
This article examines the use of de�nitions and measures of corporate
social performance (CSP) in prior empirical studies researching the link
between CSP and corporate �nancial performance and gives a proposal
to achieve a more common understanding and better delineation of CSP.
De�nitions of CSP used in these articles are identi�ed in a focused liter-
ature review of 114 articles between 1970 and 2009. A subsequent step
compares these de�nitions with their associated measures to assess their
face validity. Two major �ndings are derived from this analysis. Firstly,
more than 60% of the studies do not have a de�nition for their research
construct. Thus, it is not clear what is actually researched and the con-
struct has to be surmised by looking at the measures used. Secondly,
30% of the construct de�nitions are not face valid with respect to their
measures. These results can hinder progress in CSP research, because
they can be the source of confusion about actual relationships. To foster
further research, in this article we suggest a model for assessing CSP
more precisely, which is derived from the de�nitions found. This model
may aid in categorising research and identifying more precise aspects of
CSP and their interactions in future research.
2.1 Introduction
There are a plethora of papers researching the relationship between social perfor-
mance (CSP) and �nancial performance (CFP). The �rst paper investigating this
relationship was published in 1972 by Moskowitz (1972). There is an ongoing stream
of literature examining this relationship which in itself indicates its relevance, but
also suggests to some extent its inability to explain certain aspects of the relation-
ship satisfactorily. Empirical studies show con�icting results - with positive, neutral
or negative relationships (Ruf et al., 2001: p. 144). This paper does not examine
27

2 Escaping the fog: How to de�ne Corporate Social Performance
such an underlying relationship between CSP and CFP, but rather concentrates on
the measurement of the CSP construct. It analyses how CSP is de�ned and whether
the measures are appropriate in respect to these de�nitions. This should help to
build an understanding of the variety of measures used in this research �eld and
shows that many papers evidence di�culties in giving an explicit de�nition of their
constructs. Therefore, the de�nitions found are analysed, and on this basis a pro-
posal for the de�nition and measurement of CSP is proposed, in order to o�er a
basis for assessing CSP in a more structured way in future research.
This paper o�ers an overview of articles researching the relationship between CSP
and CFP. This is the basis for this paper which hones in on particular points which
may be the source of di�ering results in CSP research. First, one contribution
of the paper is in showing commonly used de�nitions for CSP and giving a plau-
sible explanation for their interchangeability with social responsibility and social
responsiveness. We suggest that these two constructs are mostly treated as being
constituents of CSP. It can also be seen that many studies do not even specify a
de�nition for CSP.
The CFP construct is not part of this paper and it is only mentioned because
many papers research its particular relationship with CSP. Thus, CFP only serves
as a constant construct in the relationship examined - which makes it easier to at-
tribute di�erent de�nitions and measures of CSP to the CSP part. By including
other relationships, e.g. CSP with reputation, it is more likely that CSP could be
de�ned or measured in other ways, in order to �t the research question. In fact, this
should not a�ect the chosen CSP construct but, as discussed above, it is one possible
factor which should be kept in mind, especially in cases where di�erent theories and
relationships with regard to CSP exist. Di�erent measures of CFP, "market-based
(investor returns), accounting-based (accounting returns), and perceptual (survey)"
(Orlitzky et al., 2003: p. 407), may also in�uence the CSP de�nition and measure-
ment. However, CFP measures are more closely related, as they all describe the
�nancial success of a company. Hence, by focussing on a CSP-CFP relationship
di�erences in CSP constructs and measures should basically arise from the author's
decision and not from the diversity of underlying relationships.
Second, another contribution of this study is the examination of the face validity
of constructs used in studies researching CSP. This is important because a study
only delivers comparable results when the researched construct is de�ned properly.
If a construct is measured with inappropriate measures it may still lead to useful
results, but these results belong to other constructs and this could be a source of
confusion for other researchers and does not foster valuable progress in this research
area. With another focus, for instance, Chatterji et al. (2009) also investigate how
well a particular rating (KLD) represents the actual environmental performance of
28
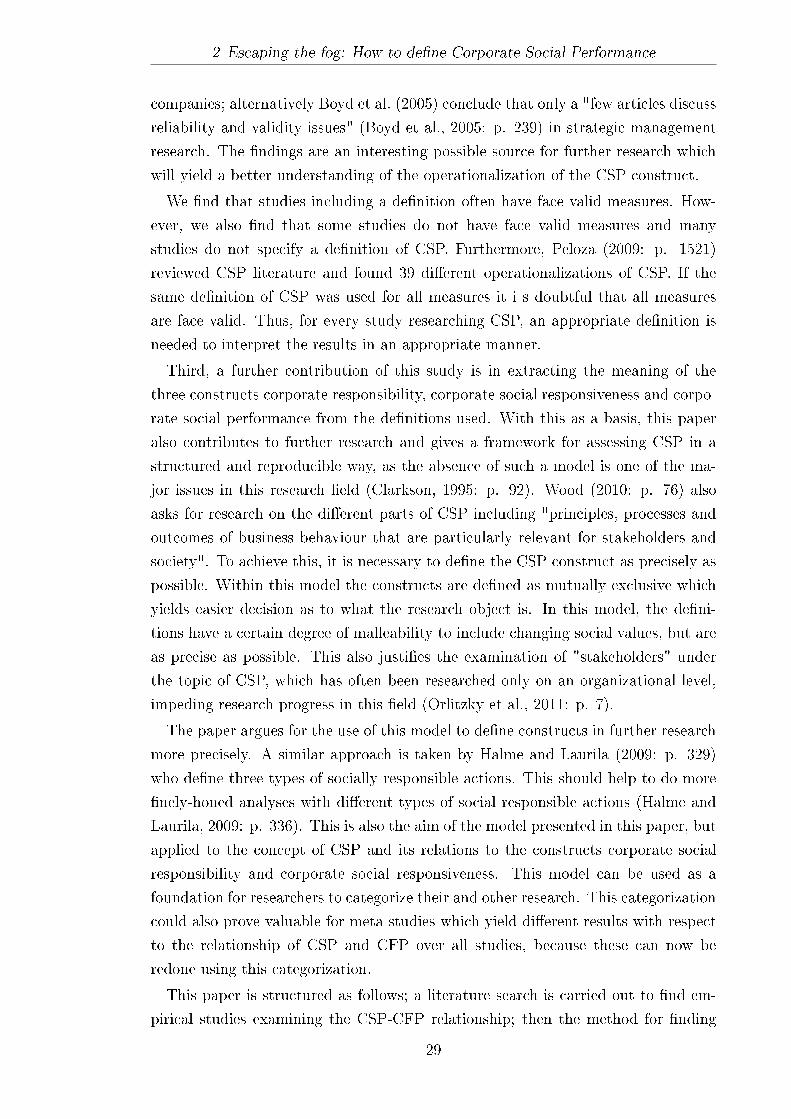
2 Escaping the fog: How to de�ne Corporate Social Performance
companies; alternatively Boyd et al. (2005) conclude that only a "few articles discuss
reliability and validity issues" (Boyd et al., 2005: p. 239) in strategic management
research. The �ndings are an interesting possible source for further research which
will yield a better understanding of the operationalization of the CSP construct.
We �nd that studies including a de�nition often have face valid measures. How-
ever, we also �nd that some studies do not have face valid measures and many
studies do not specify a de�nition of CSP. Furthermore, Peloza (2009: p. 1521)
reviewed CSP literature and found 39 di�erent operationalizations of CSP. If the
same de�nition of CSP was used for all measures it i s doubtful that all measures
are face valid. Thus, for every study researching CSP, an appropriate de�nition is
needed to interpret the results in an appropriate manner.
Third, a further contribution of this study is in extracting the meaning of the
three constructs corporate responsibility, corporate social responsiveness and corpo-
rate social performance from the de�nitions used. With this as a basis, this paper
also contributes to further research and gives a framework for assessing CSP in a
structured and reproducible way, as the absence of such a model is one of the ma-
jor issues in this research �eld (Clarkson, 1995: p. 92). Wood (2010: p. 76) also
asks for research on the di�erent parts of CSP including "principles, processes and
outcomes of business behaviour that are particularly relevant for stakeholders and
society". To achieve this, it is necessary to de�ne the CSP construct as precisely as
possible. Within this model the constructs are de�ned as mutually exclusive which
yields easier decision as to what the research object is. In this model, the de�ni-
tions have a certain degree of malleability to include changing social values, but are
as precise as possible. This also justi�es the examination of "stakeholders" under
the topic of CSP, which has often been researched only on an organizational level,
impeding research progress in this �eld (Orlitzky et al., 2011: p. 7).
The paper argues for the use of this model to de�ne constructs in further research
more precisely. A similar approach is taken by Halme and Laurila (2009: p. 329)
who de�ne three types of socially responsible actions. This should help to do more
�nely-honed analyses with di�erent types of social responsible actions (Halme and
Laurila, 2009: p. 336). This is also the aim of the model presented in this paper, but
applied to the concept of CSP and its relations to the constructs corporate social
responsibility and corporate social responsiveness. This model can be used as a
foundation for researchers to categorize their and other research. This categorization
could also prove valuable for meta studies which yield di�erent results with respect
to the relationship of CSP and CFP over all studies, because these can now be
redone using this categorization.
This paper is structured as follows; a literature search is carried out to �nd em-
pirical studies examining the CSP-CFP relationship; then the method for �nding
29

2 Escaping the fog: How to de�ne Corporate Social Performance
de�nitions of CSP is explained and major de�nitions out of these studies are pre-
sented; subsequently, the �t between the de�nition and measures used (face validity)
is analysed; and �nally, a model or process for completing structured research stem-
ming from CSP and related constructs is given with respect to its de�nition.
2.2 Background
2.2.1 Reasons for ambiguous study results
Figure 2.1 outlines possibilities for di�erent results in empirical studies researching
the relationship of CSP and CFP. These points arise from an inversion of com-
mon knowledge for good research practises as well as from the limitation sections
in articles which examine the relationship between CSP and CFP. Possible reasons
for di�erent results are the non-existence of a relationship, inadequate theories, ap-
plicability of methodologies, di�erent constructs or invalid or unreliable measured
constructs. The possibility that no relationship between CSP and CFP exists can be
disregarded at least for the existing literature with its used de�nitions and measure-
ments, because recent meta-analyses by Orlitzky et al. (2003), Allouche and Laroche
(2005) and Wu (2006) indicate a positive relationship for the measures used in CSP-
CFP studies. Therefore, it can be assumed that studies investigating an association
between CSP and CFP are examining a tangible link between the two. Neverthe-
less, there is probably more than one fundamental basis for a relationship between
CSP and CFP. This is context-dependant, and also dependant on the actual issues
that in�uence this relationship (Lankoski, 2009: p. 207). E.g., de�ning CSP as the
amount of greenhouse gases strikes one as being inappropriate when the company
employs child labour, but has nearly no emission of greenhouse gases. Halme and
Laurila (2009: p. 325) recommend an examination of the special relationships us-
ing structured research to �nd more speci�c context factors. Also De Bakker et al.
(2005: p. 310) suggest a more in-depth analyses of concepts such as corporate social
responsibility and corporate social performance.
Other possible sources for "contradictory results stem from conceptual, opera-
tionalization, and methodological di�erences in the de�nitions of social and �nan-
cial performance" (Gri�n and Mahon, 1997: p. 7). It may be the case that a
relationship exists, but an inadequate theory is employed to identify this relation-
ship. Garriga and Melé (2004: p. 51) present a selection of theories predicting a
relationship between social and �nancial performance without establishing clear and
contradictory interdependencies. These di�erent theories can only be researched by
testing them empirically and if there are results which are not in line with the theory
then the theory is inadequate in explaining the data. However, this does not mean
30
2 Escaping the fog: How to de�ne Corporate Social Performance
Figure 2.1: Causes for di�erent results of the CSP-CFP relationship
that all parts of the theory are incorrect. An example of examining di�erent theo-
ries is Preston and O'Bannon (1997) who research six possible relationships between
CSP and CFP. They state a causal e�ect of CSP on CFP or the other way round
or an mutual interaction between the two - where each interaction can be positive
or negative. They explain these di�erent possible interactions using the stakeholder
theory, the trade-o� hypothesis, the slack resources theory, the managerial oppor-
tunism hypothesis, and synergies between these theories. Similarly, Berman et al.
(1999) test two di�erent stakeholder management models. In one model, stakeholder
relationships are directly managed and thus a�ect �nancial performance directly. In
the other model stakeholder relationship management is intrinsic and in�uences �rm
strategy which in turn in�uences �nancial performance.
Moreover, it is possible that there are omitted variables such as R&D and advertis-
ing intensity which have an in�uence on CFP and which would change these results
as shown by McWilliams and Siegel (2000: p. 604). Other important variables
in�uencing CFP shown by Capon et al. (1990: p. 1148) are industry concentration,
�rm growth rate, market share, �rm size, and capital investment intensity. If these
omitted variables are not taken into account, the relationship can only be associated
with the researched variables, which can overstate or understate their in�uence.
Di�erent results can also be produced by inadequate methods. McWilliams and
Siegel (1997) for instance, examined the applicability of event studies. They criti-
cized the assumptions made by event studies, e.g. e�cient markets, unanticipated
events, which are a necessity in isolating the e�ect of an event, and the absence of
confounding events during the event window. The research design - which includes
sample size, outliers, length of the event window, and explanation of abnormal re-
turns - also in�uences the results of event studies. They replicated an event study
and showed that the results "depend critically on the length of the window and
31

2 Escaping the fog: How to de�ne Corporate Social Performance
whether researchers have isolated the events of interest, i.e., controlled for con-
founding e�ects" (McWilliams and Siegel, 1997: p. 106). Other examples of the
questionable application of methods are surveys which include inconsistencies be-
tween di�erent raters and content analyses which can lead to a bias due to the
type of the document analysed and the omission or inclusion of particular content
(Waddock and Graves, 1997: p. 304).
However, when a method is appropriate for a particular research question and
conducted in an appropriate way then di�erent methods should be allowable and
they should produce similar results. The same argument counts for di�erent con-
structs. This is why an attempt to assess validity may be done using a multitrait-
multimethod matrix which should include "at least two traits, each measured by at
least two methods" (Campbell and Fiske, 1959: p. 104).
Even if constructs are the same and adequate theory of the relationship between
CSP and CFP is applied, a study may lead to divergence in the results due to mea-
surement errors or an inappropriate operationalization of constructs used. Schmidt
and Hunter (1999: p. 183-184) state that "measures of constructs - whether physi-
cal or social sciences - contain measurement error. There is no such thing as error-
less measurement. As a result, all observed relations are relations between speci�c
measures, not relations between constructs, and are therefore biased estimates of
relations between constructs".
For the question of inappropriate measures of constructs, many measures of CSP
are one-dimensional which hinders examination of particular social aspects and
which does not represent an appropriate operationalization of the complexity of
the CSP construct (Waddock and Graves, 1997: p. 305). As such, it could also be
the case that measures are used which do not coincide or are not congruent with
the de�nitions of the constructs they should represent. There is no one measure to
evaluate a the comprehensive conceptual construct CSP (Simpson and Kohers, 2002:
p. 100). This is why Gri�n and Mahon (1997: p. 10) suggest the use of multiple
measures to assess CSP. Whether or not the construct and its operationalization
match is described by the concept of validity. There is also some confusion about
the de�nition of CSP as it is often used interchangeably with constructs such as cor-
porate social responsibility, corporate social responsiveness or corporate citizenship
(Galbreath, 2010: p. 512).
2.2.2 Validity
Agle and Kelley (2001: p. 280) provide a matrix which will help to assess the re-
liability and validity of CSP measures. They list di�erent kinds of validity (face,
content, convergent, discriminant, criterion, construct) with respect to the stake-
32

2 Escaping the fog: How to de�ne Corporate Social Performance
holders of a company, and they regard three dimensions of CSP on the basis of the
de�nition by Wood (1991b).
Figure 2.2: Validity framework
The necessity for a pre-stage of construct validity can be explained with Figure
2.2 (Libby et al., 2002: p. 795). X and Y are concepts which are represented by
variables such as X' and Y'. These concepts can be represented by variables with
the help of an auxiliary theory which states a connection between the concept and
the variable (Costner, 1969: p. 246). Construct validity is given when the variables
change in the same way as the theory between X and Y suggests. One possibility to
test this relationship is to look at the relationship between di�erent variables such
as X1' and X2' with the knowledge that one of these variables is known as construct
valid. However, before testing construct validity in an empirical way it should be
shown non-empirically that the content of the construct is adequately represented
by the variable (Edwards, 2003: p. 330).
To our best knowledge there is only one article which practically examines the
construct validity of CSP data. Sharfman (1996) analyses data provided by Kinder,
Lydenberg and Domini (KLD) and tests its construct validity with other measures,
e.g. Fortune data. Information about these two data sets can be found in section
2.5.1. He argues that "the fact that the KLD principles are well known and respected
in the social investment �eld does give the ratings `face' validity" (Sharfman, 1996:
p. 289). Further he argues that "Fortune data are not truly representative of CSP
but rather simply the image that a particular �rm has in the business community"
(Sharfman, 1996: p. 290). With this in mind, he tries to discover the construct va-
lidity of KLD data with a measure which does not truly measure CSP but the image
of a company which is rather a measure related to reputation. Nevertheless, this is a
legitimate procedure because he stated that Fortune data has been used to measure
CSP and KLD data has face validity with CSP. However, he delivers no evidence in
33

2 Escaping the fog: How to de�ne Corporate Social Performance
the form of a discussion or citation for this proposition. A measure must be at least
face valid to be included in the process of construct validation (Turner, 1979: p. 86).
Sharfman (1996) examines KLD data by adding all categories to a single unweighted
score. He also uses weighted scores with all categories and without the categories
nuclear power, military contracting and South African involvement. Fortune data is
examined with an overall score and the "Responsibility to the Community and the
Environment" score. Furthermore, he uses data from "social choice" mutual funds
to identify �rms that are in several of these funds. Such a �rm is "a better than
average �rm in terms of CSP" (Sharfman, 1996: p. 291).
Sharfman (1996: p. 289) refers to Schwab (1980) on analysing validity and for
assessing construct validity he uses a method which is known as criterion validation.
Schwab de�nes construct validity "as representing the correspondence between a
construct (conceptual de�nition of a variable) and the operational procedure to
measure or manipulate that construct" (Schwab, 1980: p. 5). This is why the con-
struct which is the conceptual de�nition of a variable should be the starting point
in evaluating construct validity. Hence, there should always be a de�nition of this
construct. Not until this is given a decision can be made as to whether construct
validity exists. When the operational variables are correlated the constructs are
not essentially correlated if the conceptual de�nition of variable does not harmonize
with its operational variable. Unfortunately Sharfman (1996) only compared the
correlation between KLD data with the Fortune corporate reputation survey which
are operational variables without mentioning the required de�nition of the underly-
ing construct. Perhaps this is the cause for his use of di�erent possible variations of
KLD and Fortune scores to examine CSP.
Sharfman (1996: p. 293) states that validity is not binary but rather continuous
and his results show in di�erent tests that there is a substantial but not overwhelming
correlation. Thus, he can con�rm his research question - "do KLD ratings correlate
su�ciently with other measures of corporate social performance" (Sharfman, 1996:
p. 293) within the limitations of his underlying assumptions. As stated above, these
limitations are a de�nition missing from CSP (which should be the basis for an
assessment of validity) and measures which are accepted as CSP measures. This
does not mean that the work of Sharfman (1996) is invalidate as it is correct under
the given assumptions. Furthermore, he is one of the few authors who address the
validity issue. Other researchers even think that a good correlation between Fortune
data and KLD data may be a result of the relatively untested KLD Index which
may be incorrect or rather should represent the reputation of a company (Gri�n
and Mahon, 1997: p. 26).
For face validity we analyse whether the operational variables match with the
construct de�nitions. Already sixty years ago there have existed some discrepancies
34
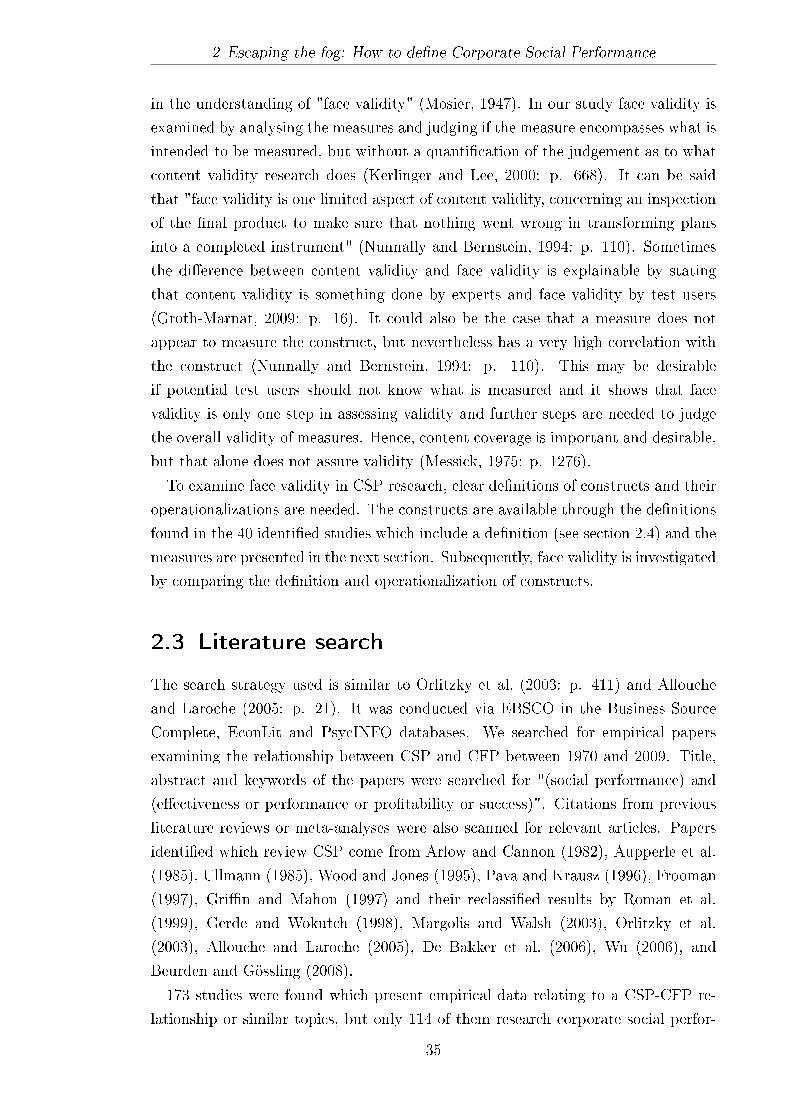
2 Escaping the fog: How to de�ne Corporate Social Performance
in the understanding of "face validity" (Mosier, 1947). In our study face validity is
examined by analysing the measures and judging if the measure encompasses what is
intended to be measured, but without a quanti�cation of the judgement as to what
content validity research does (Kerlinger and Lee, 2000: p. 668). It can be said
that "face validity is one limited aspect of content validity, concerning an inspection
of the �nal product to make sure that nothing went wrong in transforming plans
into a completed instrument" (Nunnally and Bernstein, 1994: p. 110). Sometimes
the di�erence between content validity and face validity is explainable by stating
that content validity is something done by experts and face validity by test users
(Groth-Marnat, 2009: p. 16). It could also be the case that a measure does not
appear to measure the construct, but nevertheless has a very high correlation with
the construct (Nunnally and Bernstein, 1994: p. 110). This may be desirable
if potential test users should not know what is measured and it shows that face
validity is only one step in assessing validity and further steps are needed to judge
the overall validity of measures. Hence, content coverage is important and desirable,
but that alone does not assure validity (Messick, 1975: p. 1276).
To examine face validity in CSP research, clear de�nitions of constructs and their
operationalizations are needed. The constructs are available through the de�nitions
found in the 40 identi�ed studies which include a de�nition (see section 2.4) and the
measures are presented in the next section. Subsequently, face validity is investigated
by comparing the de�nition and operationalization of constructs.
2.3 Literature search
The search strategy used is similar to Orlitzky et al. (2003: p. 411) and Allouche
and Laroche (2005: p. 21). It was conducted via EBSCO in the Business Source
Complete, EconLit and PsycINFO databases. We searched for empirical papers
examining the relationship between CSP and CFP between 1970 and 2009. Title,
abstract and keywords of the papers were searched for "(social performance) and
(e�ectiveness or performance or pro�tability or success)". Citations from previous
literature reviews or meta-analyses were also scanned for relevant articles. Papers
identi�ed which review CSP come from Arlow and Cannon (1982), Aupperle et al.
(1985), Ullmann (1985), Wood and Jones (1995), Pava and Krausz (1996), Frooman
(1997), Gri�n and Mahon (1997) and their reclassi�ed results by Roman et al.
(1999), Gerde and Wokutch (1998), Margolis and Walsh (2003), Orlitzky et al.
(2003), Allouche and Laroche (2005), De Bakker et al. (2006), Wu (2006), and
Beurden and Gössling (2008).
173 studies were found which present empirical data relating to a CSP-CFP re-
lationship or similar topics, but only 114 of them research corporate social perfor-
35

2 Escaping the fog: How to de�ne Corporate Social Performance
mance, corporate social responsibility, corporate social responsiveness or socially
responsible investing. Studies examining corporate social responsibility and corpo-
rate social responsiveness are also taken into account because as stated previously
these de�nitions are sometimes used interchangeably with CSP. This is assumed to
be the case because they were found with a search strategy that used search strings
for CSP. Socially responsible investment is considered because it looks at face value
to have similarities to corporate social responsibility. Many studies do not even ex-
plicitly name a construct. Excluded papers focus on constructs like environmental
and pollution performance, living-asset stewardship, reputation, charitable contri-
butions, ethics, or perceptions of �rm quality. These constructs are not examined
in this paper because they are not directly related to CSP. Most of these come from
the above literature reviews which do not necessarily only focus on CSP.
2.4 De�nitions
The 114 studies were reviewed for de�nitions of CSP. In addition, the operational
variables of the studies which should measure CSP were also recorded for the as-
sessment of face validity.
A de�nition is identi�ed if it �ts at least one of the following conditions:
• words like "de�ne", "de�nition" or similar are used
• de�nitions by other authors are mentioned and one is selected
• parts of de�nitions by other authors which are not contradictory are used
which can be seen as a new de�nition (does not count as self-de�ned)
• the construct is described in words which are distinct to the study, and repre-
sent a new de�nition (self-de�ned)
If only a literature review or state of the art is given this is not counted as a
de�nition.
Table 2.1: De�nitions of constructs in studies researching the CSP-CFP relationship
CorporateSocial
Performance
CorporateSocial
Responsibility
CorporateSocial Respon-
siveness
SocialResponsibilityInvesting
Total
no de�nition 27 35 2 6 70with de�nition 22 17 1 4 44Total 49 52 3 10 114
Table 2.1 shows that only 44 papers (38.6%) have a clear de�nition of the re-
searched CSP construct. For further analysis, only de�nitions which refer to CSP,
36

2 Escaping the fog: How to de�ne Corporate Social Performance
corporate social responsibility or corporate social responsiveness are considered -
this being the case for 40 studies.1 CSP and corporate social responsibility are the
most frequently researched constructs in the analysed studies, whereas CSP is de-
�ned slightly more often. The construct corporate social responsiveness was found
3 times and is de�ned once. Hence, only 40 out of 104 studies can be analysed with
regard to face validity. If a reader of studies with no clear de�nition is unable to
de�ne constructs used by himself or can not surmise with the help of the variables
used what the analysed relationship is, then these studies will be of little help for
him.
Table 2.2: Number and source of used de�nitions
de�nition by Corporate SocialPerformance
Corporate SocialResponsibility
Corporate SocialResponsiveness
Carroll (1979,1991,2000) 6 5 0Sethi (1979) 1 0 0Ullmann (1985) 1 0 0Wartick/Cochran (1985) 4 0 0Wood (1991a,b) 6 1 0Swanson (1995,1999) 1 1 0McWilliams/Siegel (2001) 0 1 0Waddock (2004) 1 0 0Heal (2005) 0 1 0Siegel/Vitaliano (2007) 0 1 0Self-de�ned 7 10 1Total 27 20 1
Analysing the sources of the construct de�nitions Table 2.2 shows those de�nitions
which have been used and how often. There are more de�nitions used than there
are studies which use a de�nition because some studies use more than one de�nition
or part of a de�nition. One study which researches social responsibility uses its own
de�nition and so there are no de�nitions by other authors used for this construct.
Most often de�nitions by Carroll (1979), Wartick and Cochran (1985) and Wood
(1991b) are used. If there is more than one de�nition to de�ne a construct, these
de�nitions are counted for each author. This is why the de�nitions add up to more
than the analysed 40 studies. From Table 2.2 it can be seen that there is a relatively
large range of de�nitions which could lead to some confusion in research, especially
if the de�nition is not taken into consideration when interpreting and adapting the
methods and results of these studies.
In the following paragraphs the de�nitions of all authors included in Table 2.2 are
presented as a time-line.
1Four studies with de�nition researching social responsible investing (SRI) are not considered infurther examination. These studies measure SRI necessarily in accordance with the de�nitionsbecause the measures are funds or stocks built upon the de�nitions. They use particularinclusion or exclusion criteria to de�ne a fund or stock as social responsible or not. Funds thatinclude companies in the tobacco or gambling industry for instance are mostly regarded as notbeing socially responsible by de�nition.
37

2 Escaping the fog: How to de�ne Corporate Social Performance
The �rst de�nition is from Carroll. He has developed a model of CSP which in-
tegrates three aspects: social responsibility, social issues and social responsiveness
(Carroll, 1979: p. 503). The aspect of social responsibility includes four compo-
nents: economic responsibilities, legal responsibilities, ethical responsibilities and
discretionary responsibilities. Economic responsibility means that a �rm has a re-
sponsibility to produce goods and services which are required by the society. Legal
responsibility describes a situation wherein a �rm has to act in a system with given
laws and rules and it is expected that the �rm adheres to these regulations. Eth-
ical responsibility covers activities which do not count as legal responsibilities but
are expected by society. Discretionary responsibilities are voluntary activities not
having explicit expectations by society members, e.g. philanthropic contributions
or training for the long-term unemployed (Carroll, 1979: p. 500).
The social issues aspect looks at the topical area of social responsibility. These can
change over time and are not speci�c for all �rms but di�er depending on industry.
Some example topics are product safety, occupational safety and health, as well as
employment discrimination. The social responsiveness aspect describes the type and
degree of reaction to social responsibility and social issues. It can be shown as a
continuum from doing nothing to doing as much as possible (Carroll, 1979: p. 501).
Carroll wrote two other articles which have been cited in the papers analysed. In
Carroll (1991) he takes his four chosen aspects and joins them to stakeholder groups
because he sees "a natural �t between the idea of corporate social responsibility and
an organization's stakeholders" (Carroll, 1991: p. 43). In another article Carroll
(2000: p. 473) notes that at least four to �ve stakeholder groups should be exam-
ined in many areas of responsibility - not only economic, legal, environmental or
philanthropic aspects in order to account for CSP .
The article by Sethi (1979) does not describe CSP directly, but corporate be-
haviour which consists of three dimensions: social obligation, social responsibility
and social responsiveness. Social obligations are proscriptive and are market forces
or legal constraints which can be related to a company. Social responsibility on
the other hand, is prescriptive and it translates to societal expectations which are
not (yet) codi�ed law. Social responsiveness is preventive and consists of actions
responding to social changes in society, eventually induced by the �rm before they
are subject to social norms or legal requirements (Sethi, 1979: pp. 65-66).
Ullmann (1985) reviewed the relationship between social disclosure, social perfor-
mance and economic performance by investigating di�erent studies with this topic.
In his paper a de�nition of social performance which "refers to the extent to which
an organization meets the needs, expectations, and demands of certain external
constituencies beyond those directly linked to the company's products/markets"
(Ullmann, 1985: p. 543) is given.
38

2 Escaping the fog: How to de�ne Corporate Social Performance
Another model is presented by Wartick and Cochran (1985) who traced the evolu-
tion of the CSP model which concludes with an exposition of a CSP model that ex-
tends the de�nition o�ered by Carroll (1979). It has three dimensions: namely social
responsibility, social responsiveness and social issues management. Each dimension
has its own direction and orientation. The social responsibility has a philosophical
orientation and describes the principle social obligations of a �rm at an economic,
legal, ethical or discretionary level. The corporate social responsiveness has an
institutional orientation and concentrates on the process of obtaining social respon-
sibility. The �rm could react in four ways: being reactive, defensive, accommodative
or proactive. The social issues management dimension has an organizational orien-
tation and delineates the policies to operationalize the social responsiveness. Under
the social issues management dimension, the three steps of issues identi�cation, is-
sues analysis and response development should be done (Wartick and Cochran, 1985:
p. 767).
Wood (1991a,b) also developed a model for CSP after examining the evolution
of the CSP literature and integrates di�erent approaches into one model. Based
on the de�nition by Wartick and Cochran (1985) she de�nes CSP as "a business
organization's con�guration of principles of social responsibility, processes of social
responsiveness, and policies, programs, and observable outcomes as they relate to the
�rm's societal relationships" (Wood, 1991b: p. 693). She identi�es three principles
of corporate social responsibility, three processes of corporate social responsiveness
and three outcomes of corporate behaviour.
The institutional principle of social responsibility is legitimacy, the organizational
principle is public responsibility and the individual principle is managerial discretion.
Legitimacy means that business has obligations on an institutional level as required
by the society. Public responsibility is on an organizational level and can di�er from
company to company. This principle implies that an organization has to react to
social problems which are caused by the organization or which a�ect it. Managerial
discretion describes individual boundaries in which a decision maker can act and
also includes personal responsibilities such as those of a moral nature.
The processes involved in corporate social responsiveness are environmental as-
sessment, stakeholder management and issues management - and these are theoret-
ically and pragmatically intertwined. They are responses to the corporate social
responsibility with which an organization is obliged to act. Environmental assess-
ment is the response to the contextual framework in which an organization works.
Stakeholder management refers to the di�erent actors who are in interaction with
a company. Issues management describes the detection and satiation of interests
which the society has in relation to the �rm.
The outcomes of corporate behaviour are the results of actions from social re-
39
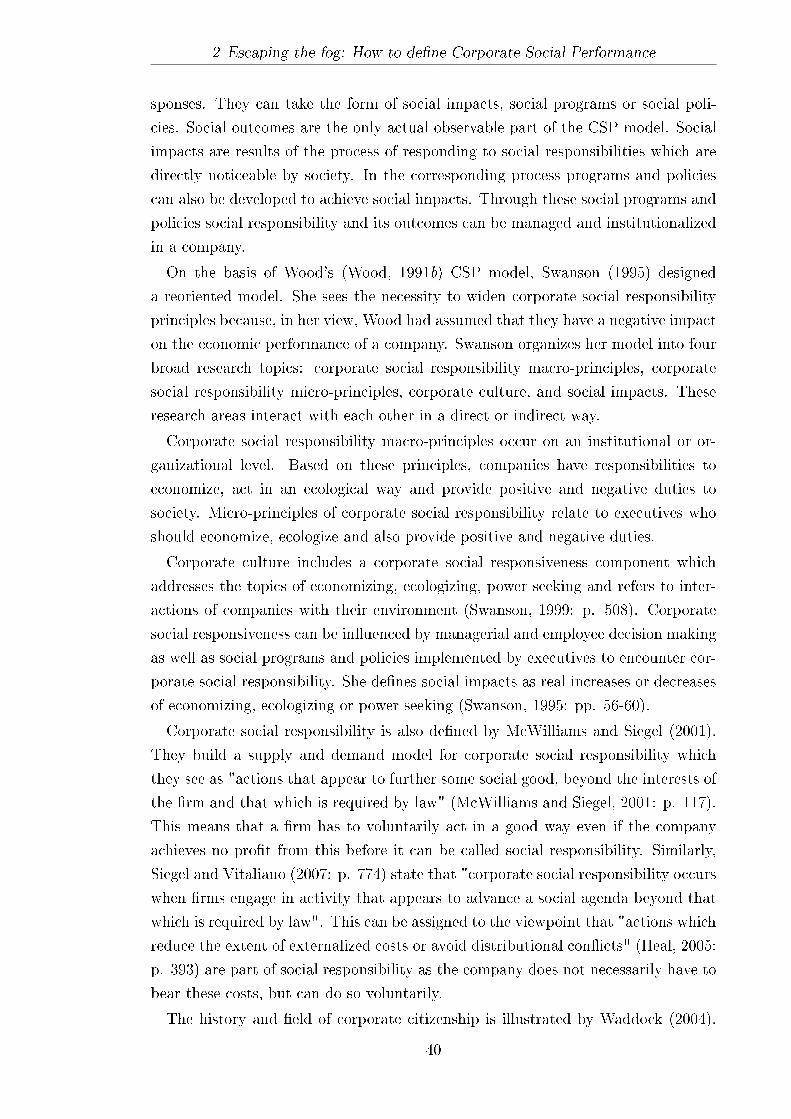
2 Escaping the fog: How to de�ne Corporate Social Performance
sponses. They can take the form of social impacts, social programs or social poli-
cies. Social outcomes are the only actual observable part of the CSP model. Social
impacts are results of the process of responding to social responsibilities which are
directly noticeable by society. In the corresponding process programs and policies
can also be developed to achieve social impacts. Through these social programs and
policies social responsibility and its outcomes can be managed and institutionalized
in a company.
On the basis of Wood's (Wood, 1991b) CSP model, Swanson (1995) designed
a reoriented model. She sees the necessity to widen corporate social responsibility
principles because, in her view, Wood had assumed that they have a negative impact
on the economic performance of a company. Swanson organizes her model into four
broad research topics: corporate social responsibility macro-principles, corporate
social responsibility micro-principles, corporate culture, and social impacts. These
research areas interact with each other in a direct or indirect way.
Corporate social responsibility macro-principles occur on an institutional or or-
ganizational level. Based on these principles, companies have responsibilities to
economize, act in an ecological way and provide positive and negative duties to
society. Micro-principles of corporate social responsibility relate to executives who
should economize, ecologize and also provide positive and negative duties.
Corporate culture includes a corporate social responsiveness component which
addresses the topics of economizing, ecologizing, power seeking and refers to inter-
actions of companies with their environment (Swanson, 1999: p. 508). Corporate
social responsiveness can be in�uenced by managerial and employee decision making
as well as social programs and policies implemented by executives to encounter cor-
porate social responsibility. She de�nes social impacts as real increases or decreases
of economizing, ecologizing or power seeking (Swanson, 1995: pp. 56-60).
Corporate social responsibility is also de�ned by McWilliams and Siegel (2001).
They build a supply and demand model for corporate social responsibility which
they see as "actions that appear to further some social good, beyond the interests of
the �rm and that which is required by law" (McWilliams and Siegel, 2001: p. 117).
This means that a �rm has to voluntarily act in a good way even if the company
achieves no pro�t from this before it can be called social responsibility. Similarly,
Siegel and Vitaliano (2007: p. 774) state that "corporate social responsibility occurs
when �rms engage in activity that appears to advance a social agenda beyond that
which is required by law". This can be assigned to the viewpoint that "actions which
reduce the extent of externalized costs or avoid distributional con�icts" (Heal, 2005:
p. 393) are part of social responsibility as the company does not necessarily have to
bear these costs, but can do so voluntarily.
The history and �eld of corporate citizenship is illustrated by Waddock (2004).
40

2 Escaping the fog: How to de�ne Corporate Social Performance
In her article she also gives de�nitions of corporate responsibility and corporate
social performance (Waddock, 2004: p. 10). From her view corporate citizenship
and corporate social responsibility are used interchangeably. Corporate citizenship
is a subset of corporate responsibility and deals with voluntary relationships with
societal and community stakeholders. It is the responsibility to these stakeholders
which is manifested in the company's strategy and operating practices. Corporate
social performance is interpreted in a similar way as that put forward by Wood
(1991b) and Swanson (1995) as a framework where principles of corporate social
responsibility at di�erent levels, processes of corporate social responsiveness and
outcomes of these processes can be assessed by integrating them to a single model.
To sum up, Table 2.3 shows that CSP is de�ned separately only by Ullmann
(1985: p. 543), but more often it is a framework including at least corporate social
responsibility and corporate social responsiveness and sometimes social issues or
outcomes. Corporate social responsibility in turn is also de�ned separately or as a
part of CSP.
Table 2.3: Corporate social performance as framework or not
Framework NoFramework
CorporateSocial Re-sponsibility
CorporateSocial
Responsive-ness
SocialIssues
Outcomes
Carroll (1979) x x xSethi (1979) x xUllmann (1985) xWartick/Cochran (1985) x x xWood (1991) x x x xSwanson (1995) x x x xWaddock (2004) x x x
Table 2.4 shows which components are included in the corporate social respon-
sibility de�nition. Consequently, half of the authors of the de�nitions connect this
term with a reduction of externalities. The remainder states that corporate so-
cial responsibility is voluntary and not codi�ed by law, but is expected by society.
However, it is also regarded as compliance with legal or economic obligations.
Corporate social responsiveness is always part of a CSP framework in the anal-
ysed de�nitions. Table 2.5 shows three of the parts which are mentioned in liter-
ature. Whereas in some de�nitions corporate social responsibility already includes
an action component most de�nitions connect actions with corporate social respon-
siveness. Furthermore it is described as the degree of reaction to the company's
social responsibility or internal structures which help the company to react to social
changes in order to comply with their social responsibilities.
Social issues management is mentioned by Carroll (1979), Wartick and Cochran
41
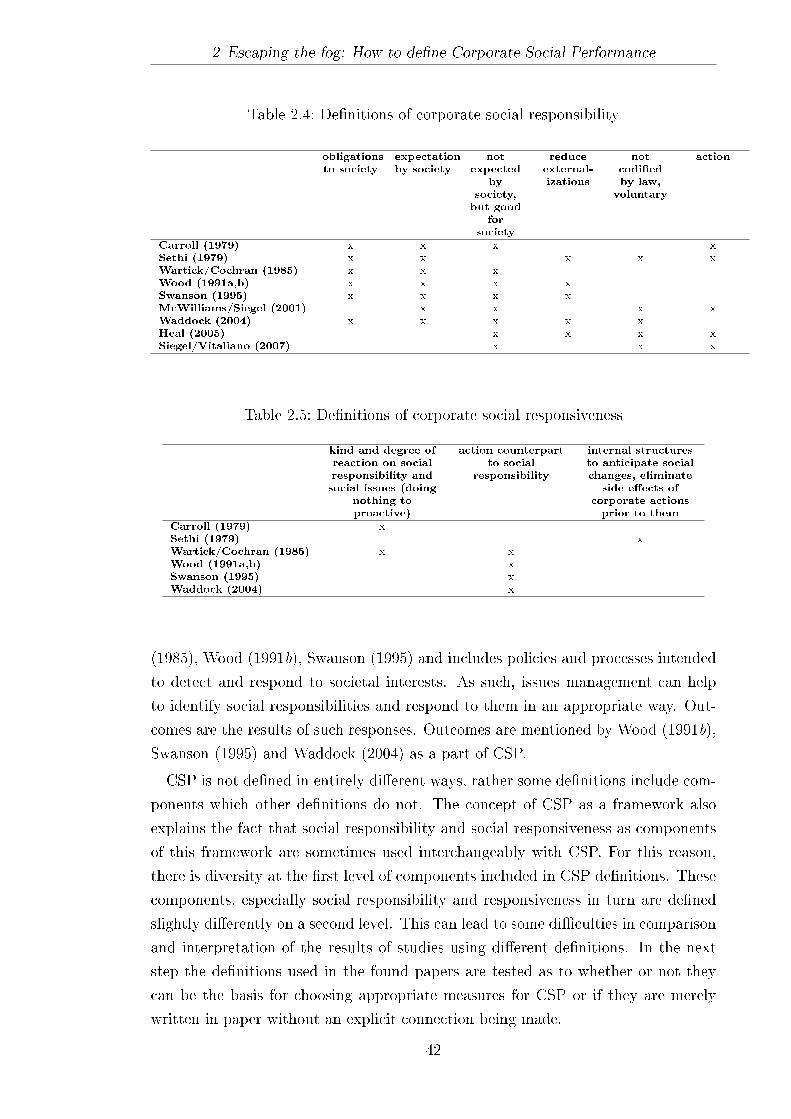
2 Escaping the fog: How to de�ne Corporate Social Performance
Table 2.4: De�nitions of corporate social responsibility
obligationsto society
expectationby society
notexpected
bysociety,but good
forsociety
reduceexternal-izations
notcodi�edby law,voluntary
action
Carroll (1979) x x x xSethi (1979) x x x x xWartick/Cochran (1985) x x xWood (1991a,b) x x x xSwanson (1995) x x x xMcWilliams/Siegel (2001) x x x xWaddock (2004) x x x x xHeal (2005) x x x xSiegel/Vitaliano (2007) x x x
Table 2.5: De�nitions of corporate social responsiveness
kind and degree ofreaction on socialresponsibility andsocial issues (doing
nothing toproactive)
action counterpartto social
responsibility
internal structuresto anticipate socialchanges, eliminateside e�ects of
corporate actionsprior to them
Carroll (1979) xSethi (1979) xWartick/Cochran (1985) x xWood (1991a,b) xSwanson (1995) xWaddock (2004) x
(1985), Wood (1991b), Swanson (1995) and includes policies and processes intended
to detect and respond to societal interests. As such, issues management can help
to identify social responsibilities and respond to them in an appropriate way. Out-
comes are the results of such responses. Outcomes are mentioned by Wood (1991b),
Swanson (1995) and Waddock (2004) as a part of CSP.
CSP is not de�ned in entirely di�erent ways, rather some de�nitions include com-
ponents which other de�nitions do not. The concept of CSP as a framework also
explains the fact that social responsibility and social responsiveness as components
of this framework are sometimes used interchangeably with CSP. For this reason,
there is diversity at the �rst level of components included in CSP de�nitions. These
components, especially social responsibility and responsiveness in turn are de�ned
slightly di�erently on a second level. This can lead to some di�culties in comparison
and interpretation of the results of studies using di�erent de�nitions. In the next
step the de�nitions used in the found papers are tested as to whether or not they
can be the basis for choosing appropriate measures for CSP or if they are merely
written in paper without an explicit connection being made.
42

2 Escaping the fog: How to de�ne Corporate Social Performance
2.5 Face validity
2.5.1 Measures of CSP
Table 2.6 presents sources used for data that measures CSP. Some articles use data
from more than one source. Most data is derived from questionnaires, where the
items di�er and often have no common basis. Other measures are extracted from
annual or sustainability reports which include data showing social aspects of com-
panies. Another source are social funds or stocks which are identi�ed by de�ning
including or excluding criteria for socially acceptable �rms. A minority of the data is
taken from the Toxic Release Inventory (TRI) of the U.S. Environmental Protection
Agency - a database which details toxic chemical releases and waste management
activities of companies - and the Council on Economic Priorities (CEP) which dis-
seminates information on the social policies of companies. Other sources such as a
list of the top 100 defence contracting organizations or data from an O�ce of Water
Services are also used. There are two measures which are presented in this section
in more detail as they are very often used in di�erent studies: ratings from KLD and
Fortune reputation surveys (also known as World's most admired company survey).
Table 2.6: Sources of CSP measures
Source of measure of CSP Numberquestionnaire 9KLD 7annual report 6social funds or stocks 6Fortune reputation survey 4CEP 2sustainability report 1TRI 1other 8Total 44
The �nancial service company KLD (in the meantime acquired by Morgan Stan-
ley Capital International Inc., MSCI) provided data through a proprietary process
in which data is collected from the company, research partners, media, public docu-
ments, governmental, and non-governmental organizations. Companies are rated on
social, environmental, and governance criteria and on controversial business involve-
ment criteria. The latter labels a company as per se one which is "bad" because it
is engaged with - abortion, adult entertainment, alcohol, contraceptives, �rearms,
gambling, the military, nuclear power, or tobacco. The social, environmental and
governance criteria are divided into "strengths" and "concerns". Themes for the
environmental criteria are climate change, products and services, operations and
management and other strengths and concerns. The social criteria include strength
and concerns for community, diversity, employee relations, human rights and prod-
43
2 Escaping the fog: How to de�ne Corporate Social Performance
ucts. Governance criteria are rated on reporting, structure and other strengths and
concerns.
KLD ratings are based on qualitative judgements and there is no explanation as to
why these criteria and not others are chosen for the rating (Wood and Jones, 1995:
p. 239). Another critical point is that KLD uses a proprietary assessment process
so that the results are not reproducible with publicly available sources (Scholtens,
2007: p. 1097). Entine (2003: p. 355) also states that the fact that there are no
good alternatives to the KLD data, but that does not make this data more credible
for using it to measure CSP.
The fortune ranking comes from the Fortune magazine which identi�es the most
admired companies each year. Until 2008 the Fortune 1000 (largest U.S. companies
by revenue) and the top foreign companies operating in the U.S. were chosen. Since
2009 non-U.S. companies in Fortune's Global 500 database with high revenues are
also included. The ranking is based on a survey of executives, directors, and ana-
lysts. They rate other companies in their own industry on nine criteria: �nancial
soundness, global competitiveness, innovation, long-term investment, people man-
agement, product/services quality, management quality, social responsibility, and
use of corporate assets. These criteria have changed slightly over time, but only in
terms of a the number or names of the criteria, e.g. there were only eight criteria,
and criteria in previous years were labelled such as employee talent, ability to attract
and retain talented people, and responsibility to the community and environment.
Bearing in mind that the ranking is based only on one �gure per criterion it is
more akin to a reputation measure than a measure for CSP (Wartick, 1988: p. 17).
The likely knowledgability of the raters does not change this fact. Furthermore,
non-U.S. �rms are included in 2009 for the �rst time. Another critical point is
the pre-selection process where only companies with a nominal high revenue are
chosen. In any case, this �nancial halo e�ect can be removed in research (Brown
and Perry, 1994, 1995), however it excludes smaller companies with smaller total
revenues, which nevertheless can have a superior revenue per capita. In addition,
each respondent to the survey has its own conditions for rating other companies
with regard to the given criteria. Nevertheless, this is an issue in every survey and
can only be solved by subdividing an item into sub-items.
As Fortune data measures reputation rather than CSP it is not an appropriate
measure for CSP. Furthermore, it does not involve distinguished stakeholders groups
in the rating process. Its reliability is also questionable (Wartick, 2002: p. 383).
Although KLD data is based on qualitative judgement the rating process includes
more objective data and is comparable, but with the rating process being hidden
from the user. There is a need for other means which measure CSP in a more
appropriate and reproducible way. However, the development of such measures
44

2 Escaping the fog: How to de�ne Corporate Social Performance
could prove di�cult when one considers the popularity of Fortune and KLD data
(Neville et al., 2005: p. 1194).
2.5.2 Face validity of CSP measures
The face validity of CSP measures is examined by comparing the de�nition of a CSP
construct and the CSP measures used in all studies on the CSP-CFP relationship
with CSP de�nitions. The process of examining face validity is based upon two
judgements per construct-variable pair. The �rst step is to investigate the often
de�ned multidimensionality or aspects that should be included with respect to the
de�nition. Subsequently, whether or not the measures really measure what is stated
in the de�nition of the construct is analysed. Table 2.7 shows which of the 40
studies with an existing de�nition have appropriate measures. Altogether there are
28 studies (70%) which cover the de�nitions with respect to face validity. 12 studies
(30%) are not appropriate for measuring what should be measured. The following
are some examples of measures which do not match with the de�nitions given in the
studies. The judgement of face validity is binary and is judged as "yes" if a measure
is appropriate with regard to the de�nition.
Table 2.7: Appropriateness of measures in CSP-CFP studies (in alphabetical order)Article De�nition
by
Source of CSP measure Appropriate
measure
Cause
Abbott and
Monsen
(1979)
self-de�ned annual report yes
Aupperle
and Van
Pham (1989)
Carroll
(1979,1991,2000)
survey from previous paper (Aupperle et al. 1985) yes
Aupperle et
al. (1985)
Carroll
(1979,1991,2000)
survey of CEOs yes
Belkaoui and
Karpik
(1989)
Ullmann
(1985)
Ernst and Ernst social disclosure survey (Ernst and Ernst 1973),
survey conducted by Business and Society review, ranking �rms'
social performance ("Industry rates itself", 1972)
no more a
reputation
survey
Boyle et al.
(1997)
Carroll
(1979,1991,2000)
list of the top 100 defence contracting organizations, in terms of
contract dollars awarded
no only mea-
sured if a
company is
an initiative
signer or not
Brammer
and
Millington
(2008)
Carroll
(1979,1991,2000)
annual reports no only chari-
table dona-
tions
Brammer et
al. (2006)
self-de�ned Ethical Investment Research Service (EIRIS) yes
Brown and
Perry (1995)
Wood
(1991a,b)
Fortune no only reputa-
tion
Buehler and
Shetty
(1976)
self-de�ned questionnaire, annual reports, pamphlets, speeches, articles by the
companies, personal letters describing social action e�orts
yes
Clarkson
(1988)
Wartick/Cochran
(1985)
available public data yes
Cox et al.
(2004)
Carroll
(1979,1991,2000)
Ethical investment Research Service (EIRIS) yes
Goll and
Rasheed
(2004)
Carroll
(1979,1991,2000)
Wood
(1991a,b)
Swanson
(1995,1999)
survey yes
45
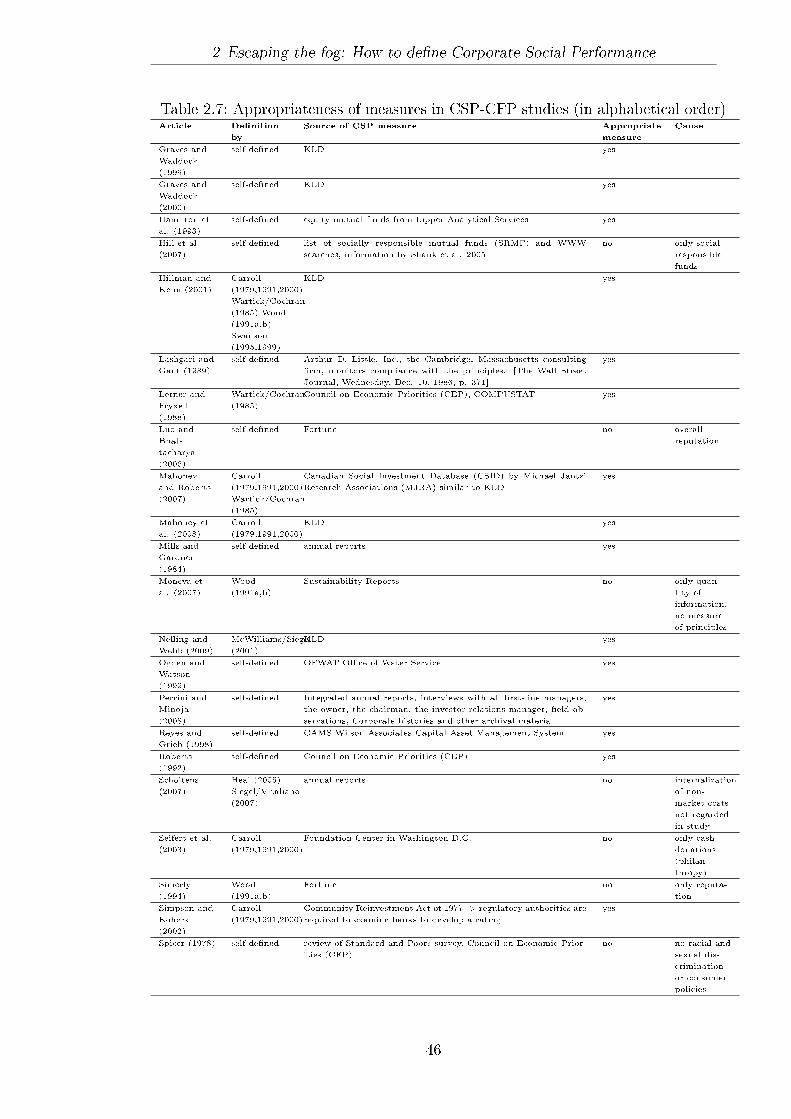
2 Escaping the fog: How to de�ne Corporate Social Performance
Table 2.7: Appropriateness of measures in CSP-CFP studies (in alphabetical order)Article De�nition
by
Source of CSP measure Appropriate
measure
Cause
Graves and
Waddock
(1999)
self-de�ned KLD yes
Graves and
Waddock
(2000)
self-de�ned KLD yes
Hamilton et
al. (1993)
self-de�ned equity mutual funds from Lipper Analytical Services yes
Hill et al.
(2007)
self-de�ned list of socially responsible mutual funds (SRMF) and WWW
searches, information by Shank et al. 2005
no only social
responsible
funds
Hillman and
Keim (2001)
Carroll
(1979,1991,2000)
Wartick/Cochran
(1985) Wood
(1991a,b)
Swanson
(1995,1999)
KLD yes
Lashgari and
Gant (1989)
self-de�ned Arthur D. Little, Inc., the Cambridge, Massachusetts consulting
�rm, monitors compliance with the principles. [The Wall Street
Journal, Wednesday, Dec. 10, 1986, p. 371]
yes
Lerner and
Fryxell
(1988)
Wartick/Cochran
(1985)
Council on Economic Priorities (CEP), COMPUSTAT yes
Luo and
Bhat-
tacharya
(2006)
self-de�ned Fortune no overall
reputation
Mahoney
and Roberts
(2007)
Carroll
(1979,1991,2000)
Wartick/Cochran
(1985)
Canadian Social Investment Database (CSID) by Michael Jantzi
Research Associations (MJRA) similar to KLD
yes
Mahoney et
al. (2008)
Carroll
(1979,1991,2000)
KLD yes
Mills and
Gardner
(1984)
self-de�ned annual reports yes
Moneva et
al. (2007)
Wood
(1991a,b)
Sustainability Reports no only quan-
tity of
information,
no measure
of principles
Nelling and
Webb (2009)
McWilliams/Siegel
(2001)
KLD yes
Ogden and
Watson
(1999)
self-de�ned OFWAT O�ce of Water Service yes
Perrini and
Minoja
(2008)
self-de�ned Integrated annual reports, interviews with all �rst-line managers,
the owner, the chairman, the investor-relations manager, �eld ob-
servations, Corporate histories and other archival material
yes
Reyes and
Grieb (1998)
self-de�ned CAMS Wilson Associates Capital Asset Management System yes
Roberts
(1992)
self-de�ned Council on Economic Priorities (CEP) yes
Scholtens
(2007)
Heal (2005)
Siegel/Vitaliano
(2007)
annual reports no internalization
of non-
market costs
not regarded
in study
Seifert et al.
(2003)
Carroll
(1979,1991,2000)
Foundation Center in Washington D.C. no only cash
donations
(philan-
thropy)
Simerly
(1994)
Wood
(1991a,b)
Fortune no only reputa-
tion
Simpson and
Kohers
(2002)
Carroll
(1979,1991,2000)
Community Reinvestment Act of 1977 -> regulatory authorities are
required to examine banks to develop a rating
yes
Spicer (1978) self-de�ned review of Standard and Poors survey, Council on Economic Prior-
ities (CEP)
no no racial and
sexual dis-
crimination
or consumer
policies
46

2 Escaping the fog: How to de�ne Corporate Social Performance
Table 2.7: Appropriateness of measures in CSP-CFP studies (in alphabetical order)Article De�nition
by
Source of CSP measure Appropriate
measure
Cause
Stanwick
and
Stanwick
(1998b)
Wood
(1991a,b)
Fortune no only reputa-
tion
Sturdivant
and Ginter
(1977)
self-de�ned Evaluation by Milton Moskowitz; Student survey (Management At-
tidude factors), Top Management survey
yes
Surroca and
Tribo (2008)
Waddock
(2004)
Sustainable Investment Research International Company, an inter-
national network of social research organizations that scrutinizes
�rms with respect to their practices toward employees, commu-
nities, suppliers, customers, the environment, and shareholders.
These data include and expand upon those of Kinder, Lyndemberg,
Domini and Company (KLD)
yes
Turban and
Greening
(1997)
self-de�ned KLD yes
Van der
Laan et al.
(2008)
Wood
(1991a,b)
KLD yes
Waddock
and Graves
(1997)
self-de�ned KLD yes
The study by Boyle et al. (1997) measures corporate social responsibility with a
dummy variable which shows whether a company is a signer of a defence contracting
initiative or not. However, corporate social responsibility was de�ned in the study
as the expectations of society which are above codi�ed law. Signing an initiative is
more an action than a responsibility and it is not clear if this is an expectation of
the society. As such, this step is more like a response if it is something demanded by
society, but even then there could be variant demands which are not measured here.
Another study by Spicer (1978) only measures pollution, but also de�nes racial and
sexual discrimination and consumer policies as part of CSP.
Seifert et al. (2003) use cash donations as a proxy for philanthropy. They intend to
measure corporate social responsibility, which comes from the de�nition used from
economic, legal, ethical and discretionary responsibilities. Again, cash donations
are more a response than a responsibility and they only fall into the area of ethical
or discretionary responsibilities, while the de�nition also demands economic and
legal responsibilities. Brammer and Millington (2008: p. 1326) de�ne CSP as a
"multidimensional construct that encompasses a large and varied range of corporate
behaviour in relation to its resources, processes, and outputs". However, in their
study they only use the one-dimensional measure of average charitable donations.
Although these donations may be made in di�erent areas, they are not di�erentiated
in the article. Furthermore, there is no relationship with this behaviour and its
resources, processes or outputs.
Measures of a company's reputation very often do not match with the given def-
initions. Consequently, not all of the measures coming out of the Fortune survey
are inappropriate in measuring CSP, as argued above. For example, Brown and
47

2 Escaping the fog: How to de�ne Corporate Social Performance
Perry (1995) take the de�nition of Wood (1991b: p. 693), but then try to measure
it only with the Fortune's criterion "responsibility to the community and environ-
ment" which is merely a measure of reputation for this criterion. Additionally,
social responses, policies, and programs or outcomes as stated in the de�nition are
not operationalized. One de�nition which sees corporate social responsibility as "a
company's activities and status related to its perceived societal or stakeholder obli-
gations" (Luo and Bhattacharya, 2006: p. 2) could perhaps be measured with the
help of the Fortune survey, but only if reputation is interpreted as satisfaction with
the companies actions in respect to the stakeholders obligations. However, this is
indicated as not being face valid because there is no assessment of the �rm's activi-
ties and it is not clear if the Fortune survey represents the satisfaction of stakeholder
obligations for the particular companies.
28 out of 40 (70%) constructs have appropriate measures with respect to face
validity. As such, they theoretically measure what is intended. Nevertheless, it
should not be forgotten that only 40 out of 110 studies (36.4%) have a more or less
clear de�nition of the underlying CSP construct. Combining both, 28 studies out of
110 (25.5%) studies have de�nitions for CSP constructs and measures that re�ect
these de�nitions appropriate.
Table 2.8: Rating of examined journals
de�nitionno yes
face validityJournal qualityABS2009-Rating
no yes Total Percentage forexisting de�nitions
Percentage for facevalidity
1 8 1 1 10 20.00% 10.00%2 11 1 3 15 26.67% 20.00%3 19 6 11 36 47.22% 30.56%4 15 3 8 26 42.31% 30.77%
no rating 11 1 5 17 35.29% 29.41%Total 64 12 28 104
It might be argue that the quality of a journal will dictate whether a de�nition
is required in passing the review process. In Table 2.8 the analysed studies are
subdivided into studies which have a de�nition and those which do not. The rating
comes from the Association of Business School (ABS) and classi�es journals into four
categories. This is an assessment by leading UK researchers, including a citation
impact factor and an evaluation of quality standards, track records, contents and
processes of each journal included. Journals with a quality rating of four publish
the most original and best executed papers whereas a quality rating of one indicates
a modest journal with research of a recognized standard. The table shows that in
journals with a relative high rating of three only every second article (47%) has a
de�nition of the construct used and in journals with a rating of one or two only every
48

2 Escaping the fog: How to de�ne Corporate Social Performance
fourth or �fth article has one. Surprisingly journals with a rating of four seem to
have a somewhat lower rate than journals with a rating of three. It should be stated
that the rating of journals is not equal over time and di�ers between the rating
institutions. However, this table shows that adequate de�nitions and face validity
of CSP measures are more usual in the higher ranked journals, whereas the number
in journals which were not in the rating is also comparatively high. With respect to
adequate de�nitions and face valid measures this also does not hinder low-prestige
journals from publishing good articles (Starbuck, 2005: p. 196). These conclusions
are robust with regard to other ratings listed in Harzing (2011).
2.6 Proposal for assessing CSP in future research
Based on the above analysis of de�nitions and face validity of CSP the following
conclusions for improving future research can be derived. Face validity could be
achieved in two ways. First, by precisely and strictly de�ning a construct as done
by Abbott and Monsen (1979). They write about social responsibility and de�ne
their research construct as social activities. In examining social activities in the
areas "environment", "equal opportunity", "personnel", "community involvement",
and "products", all of which are found in annual reports, the measures match with
their construct. Second, some constructs are de�ned broadly, but too vaguely which
makes them easier to be complied with. For example, Brammer et al. (2006) de�ne
CSP merely as a multi-dimensional construct and measure more than one dimension
(employment, environment and community) which makes it face valid per de�nition.
However, a de�nition which only demands a multi-dimensional measure without a
further speci�cation with regard to the content of these CSP dimensions is not
su�ciently de�ned.
This is why a comprehensive measure of CSP with respect to the stakeholders
should be developed and in cases where this is not achieved it should not be called
CSP (Carroll, 2000: p. 474). Nevertheless, such a multi-dimensional measure can
not be a universal measure for all situations, because this oversimpli�es a complex
construct which is in fact situation-dependent (Gri�n, 2000: p. 483). Hence, the
CSP de�nition should to some extent be �exible and should allow for adaptation
to particular circumstances. E.g., as for some companies customers are the most
important stakeholders and for others employees the companies social performance
should depend more on the stakeholder group with the most important issues.
Di�erent viewpoints could potentially negatively in�uence the progress of a re-
search �eld and the "way in which relevant variables should be measured and mod-
elled" (Pfe�er, 1993: p. 616) is one of these and "decades of research would almost
certainly have yielded more understanding of it if CSP researchers had a greater
49

2 Escaping the fog: How to de�ne Corporate Social Performance
tendency to use similar de�nitions and operationalizations" (Hull and Rothenberg,
2008: p. 781). Third, common measures are needed in this �eld of research to
improve progress. Beurden and Gössling (2008) classify CSP into three categories,
but they only look at the CSP measures and not at de�nitions which should be a
part of the underlying theory. They also argue that there is "no standard de�nition
of CSP that is properly measurable" (Beurden and Gössling, 2008: p. 421). An in-
tegrative approach developed from existing de�nitions which o�ers a starting point
for potential harmonisation is shown in Figure 2.3.
Figure 2.3: Model for assessing a CSP de�nition
This model is not a new de�nition of corporate social responsibility, corporate
social responsiveness or CSP, but does show existing ideas arranged into an un-
derstandable framework and attempts to arrange diverse de�nitions in a mutually
exclusive way. This should help empirical researchers to at least achieve face validity.
It shows that there are four steps in assessing CSP which have to be done in a certain
order. In a �rst step, the stakeholders have to be identi�ed and as a second step the
responsibilities to them must be pinpointed. In the third step, social responses by
the �rm can be examined. If these three steps are executed the CSP can be analysed
in the fourth step. These four steps are described in more detail below, but they
have to made in this sequence as they build upon each other. A similar model just
for a socially responsible management control system is described by Durden (2008:
p. 687). This model is similar to the �rst three steps, but more detailed in regard to
the process of �nding the right actions with regard to the company's responsibilities.
However, step four is missing.
The starting point in assessing CSP are the �rm's stakeholders which have dif-
ferent concerns - for instance, the environment, human resources or product safety.
These issues can be understood as the corporate social responsibility if the word "so-
cial" is interpreted as "stakeholders". In this way, "the stakeholder nomenclature
50

2 Escaping the fog: How to de�ne Corporate Social Performance
puts 'names and faces' on the societal members who are most urgent to business,
and to whom it must be responsive" (Carroll, 1991: p. 43). Clarkson (1995: p. 104)
also stated that the "organizational level is identi�ed as that of the corporation and
its stakeholder groups, the level appropriate for analysis and evaluation of CSP".
However, he argued that the institutional level, i.e. the interests of society as an en-
tity, is appropriate for analysing corporate social responsibility and corporate social
responsiveness, because these both arise from societal issues on the whole. In the
model presented in this paper society is de�ned as equal to stakeholders and thus
can also be analysed on an organisational level.
Our model does not itemize CSP over the Triple P bottom line concept with
pro�t (economic aspect), people (social aspect) and planet (environmental aspect),
but refers foremost to the stakeholder's interests, which could feasibly be included
as a second step as including the three Triple P aspects (Fauzi and Rahman, 2008:
p. 132). Stakeholders are important because they may in�uence a company's per-
formance in an implicit or explicit way (Atkinson et al., 1997: p. 27). It can be
assumed that stakeholders in�uence the performance in a positive way if their stakes
are well satis�ed. Hence, a satis�ed stakeholder or more commonly good social per-
formance should lead to good �nancial performance. This is why many scholars
believe that stakeholder theory should be the basis for exploring the �eld of CSP
(Neville et al., 2005: p. 1186).
Stakeholder theory has been used in very di�erent ways with many di�erent
methodologies and so these yield many di�ering and often poorly interpreted re-
sults, while having well-de�ned stakeholders for the CSP-CFP interaction can be
more easily interpreted (Donaldson and Preston, 1995: p. 70). It also allows a
systematic consideration of speci�c aspects such as the time or industry in which
the stakeholders or �rms are situated (Jamali and Mirshak, 2007: p. 247).
Stakeholders have their stakes in companies and construct responsibilities for com-
panies and thus they de�ne company norms (Wood and Jones, 1995: p. 231). If
the stakeholders did not exist, then a company would have no responsibilities to
them. Taking speci�c stakeholders as the basis for justifying corporate social re-
sponsibilities could even prevent the "everybody thinks so" argument used by many
researchers to justify their use of general, unspeci�ed ranking data (Wood and Jones,
1995: p. 238). Certainly, there were instances in which not "everybody thought so",
but still other illegitimate arguments were put forward. An example is the �nancial
attributes of the Fortune rating correlating closely with the �nancial performance
of a company, which is seen as evidence for the validity of the other attributes of
the Fortune rating (McGuire et al., 1988: p. 860). Because of the inclusion of
stakeholders in the process of �nding appropriate measures it can be argued that
the stakeholder de�nition and measurement is at least face valid. Subtle distinctions
51
2 Escaping the fog: How to de�ne Corporate Social Performance
between stakeholder groups can be made when particular stakeholders are de�ned
rather than only focusing on two groups of primary and secondary stakeholders
(Van der Laan et al., 2008: p. 300).
The response of a company to its social responsibilities can be interpreted as
its corporate social responsiveness. This can be in the form of a confrontation or
collaboration - for example the implementation of an entrenchment strategy against
powerful stakeholders (Surroca and Tribo, 2008: p. 752). If the responses meet
the responsibilities to the stakeholders then the stakeholders have more trust in the
company and are more satis�ed with it (Pivato et al., 2008: p. 3). The responses
to stakeholder issues allow an examination of di�erent types of social actions by
companies, as there is not merely one type of social responsibility. Examining the
most important issues could also be another step (Halme and Laurila, 2009: p. 336).
One possibility in assessing social actions with KLD data is shown in a study by
Mattingly and Berman (2006: p. 39) where they identify social actions labelled as
positive or negative.
Van der Laan et al. (2008: p. 300) have similar considerations when de�ning
corporate social responsiveness. While corporate social responsibility "refers to the
business principles that guide managerial decision making", it is mentioned above
that social responsibility comes from stakeholder's issues and thus should considered
of managers. Corporate social responsiveness is seen as "the processes through which
corporations respond, or not do so, to social demands" (Van der Laan et al., 2008:
p. 300) which is also in line with the given explanation, as the social responses and
actions in these processes are included in this view.
Corporate social performance has been described as a concept consisting of three
categories: the extent of social disclosure, corporate actions and corporate reputation
ratings (Beurden and Gössling, 2008: p. 411). However, these are measures rather
than concepts and overlap with the area of corporate social responsiveness. A more
adequate de�nition describes CSP as "a business organization's con�guration of
principles of social responsibility, processes of social responsiveness, and policies,
programs, and observable outcomes as they relate to the �rm's societal relationships"
(Wood, 1991b: p. 693). This con�guration can be seen as a process of matching the
above components in order to make the concept of corporate social "performance"
more concrete. In this way CSP is de�ned in the presented model. If the responses
do not match with the responsibilities of a company it can not be said that the
company has a high corporate social performance.
In regards to the de�nitions of CSP in the papers analysed measures derived from
the Fortune survey cannot be regarded as appropriate measures. Nevertheless, these
studies could be useful if there was a CSP de�nition in the particular studies which
acknowledges the correspondence of corporate social responsibility and corporate
52
2 Escaping the fog: How to de�ne Corporate Social Performance
social responsiveness as corporate social performance. However, to do so, social
responsibility and social responsiveness have to be analysed, as they are the basis in
judging the correspondence. A potential proxy to measure this correspondence could
be the company's reputation in the analysed areas. This should not however be the
only measure as the reputation depends on many more aspects such as advertising
or publicity.
Taking stakeholders and their issues as a starting point also helps to prevent a
stakeholder mismatch where stakeholders are associated with inappropriate mea-
sures (Wood and Jones, 1995: p. 258). E.g. if sponsoring of children events or cam-
paigns against alcohol are seen as measures of a company's social responsiveness,
but the company's stakeholders are not interested in such events, these measures
are inappropriate measures for social responsiveness. Hence, without a stakeholder
there can be no social responsibility and without a social responsibility there can be
no social responsiveness. Without social responsibility or social responsiveness, no
�t between social responsibility and social responsiveness can exist and no corporate
social performance can be measured.
Furthermore, important stakeholders and their issues can di�er depending on the
industry of a company and this must be assessed (Neville et al., 2005: p. 1194).
One possible way to identify important stakeholders is sorting them with respect
to the three attributes of power, legitimacy and urgency (Mitchell et al., 1997: p.
872). However, even in applying this concept, di�erent industries, company sizes,
countries or di�erent time periods could in�uence the results (Herremans et al.,
1993: p. 599). For example stakeholders could have di�erent issues meaning the
companies would have di�erent responsibilities at di�erent points in time (Beurden
and Gössling, 2008: p. 419). This is why such aspects should be clearly stated in
an empirical study. This would also aid in the investigation of the context under
which CSP in�uences CFP (Beurden and Gössling, 2008: p. 420).
With such a precise de�nition of CSP it is possible to �nd links between the
appropriateness of social responsiveness (actions by the company) with regarding to
social responsibilities. If CSP is high it means that a company acts in a strategic
way as it considers its stakeholders who may have the capacity to enhance the �rm's
pro�ts. Nevertheless, there is a need for measures in regards to these examined
responsibilities, and the responses and the degree of stakeholder satisfaction due to
them (Husted and De Jesus Salazar, 2006: p. 88). For example, Barnett (2007)
develops the construct of stakeholder in�uence capacity which could help to identify
companies with low or high stakeholder in�uence. This in turn in�uences their
ability to recognise social responsibility and thus their responses to them.
In investigating these constructs it should be taken into consideration that there
could be a trade-o� between di�erent stakeholders all of which are important for the
53

2 Escaping the fog: How to de�ne Corporate Social Performance
company (Mahon, 2002: p. 437). One example is consumers wishing for powerful
and fast cars which entail increased emissions compared to less powerful cars, while
environmental activists wish for cars with less emissions.
Hence, another proposal would be to specify the construct as detailed as possible
in already published studies, but with the support of stakeholder orientation. Thus,
only the stakeholders, their issues and the actions/outcomes of social responses -
rather than the measures should be changed in these studies. This could help in
specifying the construct as mutually exclusively even if one stakeholder belongs to
di�erent stakeholder groups as it refers to stakeholder speci�c interests. For example,
if an employee is also a customer of a company, he may want to have an ergonomic
workplace, and also products which are safe to use. Therefore, a table with rows as
stakeholders and columns named corporate social responsibilities, corporate social
responsiveness and corporate social performance would aid in recording the impor-
tant aspects of a study. In this table the responsibilities towards stakeholders and
the responses of the �rm could be compared to get an idea of the social performance
of companies. Further meta-analyses to try to implement this procedure for existing
papers are a possibility.
2.7 Summary
This paper provides a comprehensive list of 114 studies evaluating the relationship
between CSP and CFP between 1970 - 2009. Inspired by the diverse results, de�-
nitions and measures in these papers, de�nitions of CSP and related constructs are
analysed in a focused literature review. The measures are assessed for face validity
with regard to their constructs. Additionally, overlaps between these de�nitions are
presented, and it can be concluded that corporate responsibility and corporate re-
sponsiveness are mostly constituents of the concept of CSP. From these de�nitions
a proposal for assessing CSP in further research is given towards a more consistent
understanding of this construct.
A �rst contribution is establishing the fact that more than 60% of the papers
do not have a de�nition for their CSP constructs. For the remaining papers the
construct de�nitions were compared with their measures and it was analysed if they
correspond. The purpose of this paper is not to criticise the papers analysed, but
to show an important point researchers should look at in the future. A second
contribution is a listing of de�nitions used for CSP and a breakdown of their parts.
A third contribution is showing that in some papers the de�ned construct does not
match its measures. At least these papers include a de�nition and so it is clear what
these studies intend to elaborate. However, a well-de�ned construct is the basis for
validity. For this reason future papers should concretely de�ne social performance,
54

2 Escaping the fog: How to de�ne Corporate Social Performance
social responsibility or social responsiveness and the measures which convey this
de�nition in an appropriate way.
A fourth contribution is, clarifying some potentially misleading issues in the un-
derstanding and use of de�nitions and appropriate measures for CSP-CFP studies.
Thus, a proposal for a model which aids in distinguishing corporate social respon-
sibility, corporate social responsiveness and corporate social performance is given.
This model should aid in further research by capturing the measures with respect to
their dimensions and stakeholders. Even if one can not �nd all relevant measures for
an all-inclusive CSP construct, a di�erentiated analysis could be done for di�erent
stakeholders such as the often-seen additional consideration of environmental issues.
The model presented claims that de�nitions should be mutually exclusive and can
be used to assign measures in existing articles to certain constructs. As such, these
studies can be made face valid ex post by modifying the underlying de�nition of the
construct measured.
This proposal also contributes towards a clear distinction between corporate so-
cial responsibility, corporate social responsiveness and corporate social performance
and their relationships and aids in the examination of particular aspects of these
constructs. For example, three types (philanthropy, integration, innovation) of cor-
porate actions as used by Halme and Laurila (2009) (which belong to the corporate
social responsiveness in the presented model) can be plausibly analysed. This in
turn could be the basis for another study looking at the di�erence between acting
in a philanthropic versus an innovative way.
The model opens other more speci�c research questions for further research. Tak-
ing the example of di�erent corporate social responses, there could be a weaker
in�uence of philanthropy actions on CFP than the in�uence of integrated or innova-
tive social actions. The latter two refer to the actual business of the company and
can thus improve energy e�ciency or attract new well educated employees as side
e�ects of good environmental behaviour or improving employee health. This could
also lead to competitive advantages which help to increase the pro�tability of the
�rm.
Beside the di�erentiation within individual constructs the relations between the
three constructs presented should also be researched. What are the responsibilities
of a company from the point of view of society? Does the company have the same
view of these responsibilities? Does it respond to these responsibilities or does it
only invest in actions which are widely desired socially, but not from this company
in particular? Does the company respond to all responsibilities or only to a few
of them and if so, which of them and why? Do these actions change the reality
of stakeholders as desired or are they merely a kind of marketing strategy without
actual e�ects? With research of this kind, some topics can be further investigated
55

2 Escaping the fog: How to de�ne Corporate Social Performance
with the potential for more insights. For example, is it pro�table for a company to
concentrate and react to all varieties of responsibility or only to particular, important
ones and if so, which ones are important?
56
3 Disclose or not disclose:
Determinants of social reporting
Abstract
Building on prior literature, determinants of disclosing a social report
are examined. As such, reports prepared with the help of the guidelines
produced by the Global Reporting Initiative (GRI) are used in this pa-
per. The sample consists of STOXX Europe 600, meaning it is possible to
analyse country speci�c e�ects on a broad sample base of companies. An
analysis reveals that size, media, country speci�c factors, industry, and
sustainability performance have a signi�cant in�uence on whether �rms
disclose social reports or not. As has been stated in previous literature
risk, capital structure and �nancial performance seem to have a negli-
gible in�uence on this kind of voluntary reporting. Consequently, while
this study con�rms some previous �ndings, it also rejects or undermines
certain others and adds sustainability performance for the disclosure of
GRI reports as an additional possible determinant. These results posit
that companies disclose due to a feeling of responsibility or of complying
with the expectations of stakeholders and shareholders for information
rather than as a means to achieving the goal of reductions in capital
costs.
3.1 Introduction
Determinants of voluntary reports are not clear yet. There are two reasons for
this situation. First, most papers concentrate on the qualitative or quantitative
aspects of the reported information itself. Only a small sample of papers, such as
Baginski et al. (2002) and Brammer and Pavelin (2006) present research on whether
a �rm voluntary discloses or not. This paper, however, adds additional insights into
this particular topic in examining the circumstances under which a �rm releases a
report based on GRI Guidelines. Second, several possible determinants, e.g. the
legal system or the media visibility of a company are not included in most studies
57

3 Disclose or not disclose: Determinants of social reporting
examining voluntary disclosure, whereas in this respect the current study considers
constructs of previous studies.
Social reporting is not a new phenomenon by any means. Nearly 40 years ago a
paper by Bowman and Haire (1975: p. 49) had already identi�ed headings such as
Corporate Responsibility, Social Actions, Social Commitment, Corporate Citizen-
ship and Beyond the Pro�t Motive in annual reports. Awareness of such topics was
already evident as demonstrated by books such as �Social Responsibilities of the
Businessman� by Bowen (1953) - now nearly 60 years old. Therefore, social issues
have been a priority for many companies for more than half a century, even when
there was no need to report on social aspects if the company did not want to. Com-
panies report information on either a mandatory or voluntary basis. Mandatory
reporting is represented by �nancial reports and other regulatory �lings. Voluntary
reporting includes management forecasts, press releases, internet sites, and di�erent
kinds of corporate reports (Healy and Palepu, 2001: p. 406). Such disclosure can be
found in mandatory reports (e.g. annual reports with additional voluntary informa-
tion) or in extra voluntary reports which also include social reports. Social reports
contain information about a �rm's social performance (Jackson and Bundgard, 2002:
p. 253). Synonymous with such reports are terms used both in academic and in-
dustrial contexts such as corporate citizenship reporting, sustainability reporting,
or social and environmental reporting.
For social reports, di�erent activities and social responsibilities of companies, be-
longing to areas such as human rights, consumers, employees, society or the environ-
ment are often disclosed. Those headings can be further subdivided - for instance,
interests of employees, diversity management, safety of workplaces or educational
opportunities. As a general rule, non-monetary facts disclosed in social reports are,
at �rst glance, of less interest to shareholders who are more likely to take an interest
in mandatory annual reports. Hence, it seems that all other topics which can be
voluntarily reported in extra reports are of negligible interest to shareholders.
Nevertheless, social reporting, having become increasingly popular since the 1970s,
experienced a temporary decline in the 1990s (Marx, 1992: p. 39). Since then,
social reporting has again increased and today approximately 80% of the Global
Fortune 250 companies provide a social report (KPMG, 2008: p. 16). On the
other hand, 20% of companies belonging to the Global Fortune 250 - that is the
largest companies in terms of sales - do not disclose a social report. One question
which has been of consistent interest over years of evolution in social reporting
is �nding its determinants (Gray et al., 2001: p. 328). One motivation for such
research is that it would be interesting for a reader of a social report, whether it
is published because the company is performing rather good or bad in the �eld
voluntary reported. Another point is that for international investors it could also be
58

3 Disclose or not disclose: Determinants of social reporting
of interest which reporting behaviour they can expect from a company. With this
knowledge it should be easier to judge about the content of such reports.
Hackston and Milne (1996: p. 78) state that companies disclose social information
without having an evident theoretical framework which explains the bene�ts and
costs of social reporting. Craighead and Hartwick (1998: p. 257) argue that only
the belief of managers that voluntary reporting equates with competitive advantages
is a determinant in the preparation of social reports. As such, it can not be argued
that companies disclose voluntary reports because they know that it leads to direct
�nancial bene�ts. However, this assumption is nonetheless an expectation and no
proven fact.
Actually, some of the reported activities of �rms have a direct negative impact on
the �nancial performance of a �rm. A popular �eld of research in this direction is
engaged in �nding determinants of - and relationships with - charitable donations.
For instance, one argument in favour of a company donating to local schools is
ensuring a well educated workforce in the future (Peloza, 2006: p. 52). This could be
a viable argument in small cities, and where a company is justi�ed in assuming that
those children may well work for them in the future. It is also argued that companies
with higher pro�les make charitable contributions because they are expected to do
so and wish to avoid a reputation loss or wish to build a favourable reputation if
they donate despite no informal obligation (Seifert et al., 2003: p. 196). The latter
type of contribution may be motivated by perceived advantages to the company
or to a manager who �nds such actions personally gratifying or who contributes
to a school his children attend. These examples show that there may be several
possible reasons for making donations and reporting about it. The fact that there
are di�erent reasons also holds true for other social activities and their inclusion in
voluntary reports. Thus, theories based on agency theory, transaction costs theory
or political theory exist to explain possible determinants for social reporting from
di�erent perspectives.
Corporate social reporting as a separate report is relatively new, emerging only
in the last 15 years (Bebbington, Larrinaga-González and Moneva-Abadía, 2008: p.
371). Separate reports are of a higher qualitative leven in comparison to volun-
tary disclosure in annual reports because they dedicate speci�c and comprehensive
attention to several topics. This also raises the costs of disclosing voluntary infor-
mation in terms of searching, preparing and presenting the information. As such,
this information is not a mere side note in reports for purposes such as investor
relationship.
Europe, especially France, Germany, UK and Denmark has been at the vanguard
of social accounting and thus Bebbington et al. (2000: p. 3) say that the stakeholder
dialogue, and thus community reporting, is at a high level today. This means that
59
3 Disclose or not disclose: Determinants of social reporting
European companies are ripe for analysis, as social reporting is not totally new to
them and it can be assumed that �rms are not disclosing because it is a passing
trend. This does not mean that �rms in Europe are able to quantify costs and
bene�ts of their social reporting, but there are at least implicit con�gurations with
a historical precedent and which have evolved over time, and which determine the
decision to disclose social reports.
Corporate social reporting is under-explored in respect of the reasons such reports
are produced - and by whom they are produced (Bebbington, Larrinaga-González
and Moneva-Abadía, 2008: p. 371). In addition, it is important to further consider
the link between social performance and social reporting and to know in which social,
political and economic context voluntary disclosure is made (Adams, 2008: p. 367).
There are some contributions to an enrichment of the topic of determinants of
social reporting. Papers which examine determinants of voluntary disclosure are
considered in order to deliver an overview of this research area. Furthermore, de-
terminants of social reporting are analysed, while including both the well-known
factors and an additional measure of social responsiveness. As such, the analysis of
determinants is broad and extensive in this paper. In particular, the examination of
di�erent country-speci�c details and the measurement of social responsiveness are,
to the best knowledge of the author, a new contribution to this research area.
The remainder of this paper is organised as follows. First, a short literature re-
view of this research stream is given and important aspects which should be included
in the analysis are identi�ed. Then, theories explaining social reporting are intro-
duced - to show that determinants of voluntary reports can be viewed from di�erent
perspectives. Subsequently, a research model which builds on well-established con-
structs and one added construct is introduced so as to identify determinants of social
reporting. Finally, the results of this analysis are presented and interpreted.
3.2 Literature Review
Some recent studies already examine determinants of voluntary disclosure. The
studies can be classi�ed in two groups. The �rst group of studies examines the qual-
ity or quantity of disclosure such as (Roberts (1992), Gray et al. (1995), Hackston
and Milne (1996), Francis et al. (2005) and Boesso and Kumar (2007), Ho and Tay-
lor (2007) and Webb et al. (2008)). Others like Baginski et al. (2002) and Brammer
and Pavelin (2006) examine determinants of the act of disclosure or non-disclosure
of voluntary information. The current study belongs to the second category, but
the other studies have similar underlying theories and thus determinants can also
be derived from them. At the end of this section a table is presented containing
the determinants of voluntary disclosure examined in the reviewed studies. The
60

3 Disclose or not disclose: Determinants of social reporting
following literature review in chronological order serves as the starting point of the
current study.
Roberts (1992) identi�es determinants of corporate social responsibility disclosure.
His sample consists of 130 major companies from America. He used a measure of the
Council on Economic Priorities to classify poor, good and excellent reports. Based
on stakeholder theory he has chosen measures for stakeholder power and strate-
gic positions towards social demands. He �nds that these aspects have signi�cant
in�uence on the quality of social disclosures.
A somewhat di�erent approach was chosen by Gray et al. (1995). They analyse
companies in the UK over a time period of 13 years from 1979-1991. With this
data they are able to link historical events with the amount of voluntarily reported
information. In this way they demonstrate a change in voluntary reporting over
time, dependant on the political, social and environmental situation of �rms. In their
conclusion out of these results they highlight the possible coexistence of legitimacy
and stakeholder theory. They also conclude that such interpretations are to some
extent speculative and that further research in this direction should be done (Gray
et al., 1995: p. 67). The same data is used in a study by Gray et al. (2001)
which comes to the conclusion that voluntary disclosure is related to size, pro�t
and industry. They note that further research should specify industry in di�erent
ways and that other in�uencing factors should be used in order to better explain
the variability of disclosure (Gray et al., 2001).
Hackston and Milne (1996) analyse 47 of the largest companies listed on the
New Zealand Stock Exchange. They enumerate mentions of social topics found in
annual reports and speculate on determinants of voluntary disclosure. They run a
replication study of several studies and compare their results with those studies -
mainly regarding US and UK companies. From that they conclude that companies
in New Zealand do less voluntary reporting than companies in the US and UK.
Furthermore, the size and industry concerned has a signi�cant in�uence on voluntary
disclosure, such that industry appears to moderate the size e�ect. This means that
larger companies in high-pro�le industries which have increased visibility, risks and
competition disclose more social and environmental information.
The e�ect of the legal environment on voluntary disclosure is analysed by Baginski
et al. (2002). Their sample consists of �rms in Canada and the US which are very
similar. The main di�erence between these two countries is the legal environment
and so they use the location of the companies as a proxy for this. The �ndings indi-
cate that less litigious countries such as Canada provide more voluntary information
and have longer time horizons than the US. Because the examined voluntary disclo-
sure consists of management's earnings forecasts, they also can di�erentiate between
good and bad news as it relates to increases or decreases in earnings. They �nd that
61
3 Disclose or not disclose: Determinants of social reporting
US companies disclose more voluntary information when bad news manifests itself,
whereas Canadian �rms issue more information when good news becomes apparent.
In a study by Francis et al. (2005) manufacturing companies in 34 di�erent coun-
tries outside the USA are examined with respect to their disclosure incentives. They
�nd that companies in industries which depend more on external �nancing are more
likely to disclose higher levels of voluntary information. These results are "irrespec-
tive of a country's legal or �nancial system that might limit the e�ectiveness of such
disclosures" (Francis et al., 2005: p. 1159).
Determinants for environmental reports are examined by Brammer and Pavelin
(2006). Their data sample consists of 447 companies in the UK. They argue that
environmental reporting is negatively associated with environmental performance,
because poor performing companies try to justify their actions and save their repu-
tation via reporting. For this purpose they use �nes imposed by law courts owing to
environmental damage as a proxy for bad actions. The �ndings show that there is
no signi�cant relationship between environmental performance and the disclosing of
an environmental report. This could be caused by a limitation of their study as they
call for further research to use an improved measure of environmental performance.
For instance, a measure other than a one-dimensional one such as �nes - one which
includes more aspects of environmental performance - could be used.
In an article by Quick and Knocinski (2006) the quality of information in reports
prepared with help of the GRI guidelines is investigated. They analyse their com-
pleteness and comprehension with a scoring model. The sample consists of the 110
companies from the German stock index HDAX. The content of the researched re-
ports covers the years from 2000 to 2003. It is shown that only a small amount of
the possible content is covered by such reports and the reporting quality is low in
their sample. To show what factors in�uence the reporting quality they do further
analyses and conclude that a positive relationship between �nancial performance
and the quality of social reports exists.
Boesso and Kumar (2007) examine voluntary disclosures of companies in Italy
and the US. The sample consists of 36 companies from each country. Their study
is completed using a content analysis. They build their analysis on the stakeholder
theory and included a variety of di�erent perspectives - namely, investors, employees,
suppliers, society and environment, internal processes, and innovation and learning.
They use key performance indicators related to these stakeholder groups in order
to construct an index which measures the quality of the reports in terms of the
quantity and nature of information. With their analysis they show that stakeholder
orientation, relevance of intangibles, and market complexity a�ect the level and
quality of voluntary disclosure.
Ho and Taylor (2007) calculate an index in a similar manner by counting disclosure
62

3 Disclose or not disclose: Determinants of social reporting
items for economic, social and environmental categories of voluntary disclosure. The
sample consists of the largest 50 �rms which are located in the USA and Japan. By
choosing these countries they cover the largest worldwide economies, but it is also
possible to investigate country-speci�c aspects which come from di�erent cultures,
regulatory systems or other institutional factors (Ho and Taylor, 2007: p. 144).
Their �ndings indicate that companies disclose more voluntary information if they
are large, in the manufacturing industry, and with lower pro�tability or liquidity.
A study by Webb et al. (2008) examines the in�uence of globalization on the
disclosure of voluntary information. Their sample consists of 643 non-US �rms
from 30 countries in the year 2003. They use a voluntary disclosure index which
is based on Francis et al. (2008). In addition, they argue that other studies only
considered the legal environment or globalization, but not both at the same time.
Using di�erent measures for multinationality (e.g. ratios for foreign sales or foreign
subsidiaries) they provide this missing link by including both aspects and �nd that
there is a signi�cant interaction between legal environment and globalization. In
this way they deduce that no direct link between legal environment and voluntary
disclosure exists, but that globalization a�ects voluntary disclosure more in countries
with a weaker legal infrastructure. Hence, this e�ect depends on the home-country
of a company.
The quality and determinants of voluntary reported environmental information is
examined by Jahnke et al. (2009). For this purpose they examine annual reports
of 80 companies from Germany included in either the DAX or MDAX, the two
major stock indices in Germany. They show that companies operating in industries
which are sensitive to environmental factors rather report about their environmental
performance than other branches like banks or insurance services.
Jonas and Jones III (2010) �nd that the literature states two main causes for pub-
lishing social reports: avoiding political costs and satisfying stakeholders to create
value. They examine lobbying expenditures and litigation propensity as political
cost factors. These constructs are incorporated in the industry classi�cation within
other studies. Their sample consists of Fortune 500 companies from 2006 which also
were in this index from 2001 to 2008. The results show that lobbying expenditures
and litigation propensity are inversely related to publishing a social report.
To facilitate easier comparison, Table 3.1 includes generic terms for the variables
used in these studies. Some variables di�er slightly between the studies and are
also used to measure di�erent constructs. For example, a good portion of litera-
ture examining determinants of voluntary disclosure has found country-speci�c and
industry-speci�c in�uencing factors. These can be ascribed to institutional factors
such as the legal system, media exposure or industry.
Determinants researched in the presented previous studies and not used in the
63

3 Disclose or not disclose: Determinants of social reporting
Table 3.1: Possible determinants of voluntary disclosure
Study by Analysed determinants of voluntary disclosure CountryRoberts (1992) age, industry, �nancial performance, risk, size, stake-
holder power, strategic postureUSA
Gray et al. (1995),Gray et al. (2001)
�nancial performance, industry, size, time UK
Hackston andMilne (1996)
�nancial performance, industry, size New Zealand
Baginski et al.(2002)
country, industry, media exposure, size Canada, USA
Francis et al.(2005)
capital structure, country, size, time 34 countriesoutside USA
Brammer andPavelin (2006)
capital structure, environmental performance (mea-sured with environmental �nes), �nancial perfor-mance, media exposure, ownership structure, size
UK
Quick and Knocin-ski (2006)
�nancial performance, size Germany
Ho and Taylor(2007)
capital structure, country, �nancial performance,industry, size
USA, Japan
Boesso and Kumar(2007)
governance structure, industry, intangibles (marketto book value), risk, size, stakeholder orientation
Italy, USA
Webb et al. (2008) analyst following, capital intensity, capital structure,country, �nancial performance, globalization, infor-mation quality, size
30 countriesoutside USA
Jahnke et al.(2009)
�nancial performance, industry, ownership structure,size
Germany
Jonas and JonesIII (2010)
�nancial performance, industry, R&D intensity, size USA
current study are either not applicable or are captured by other variables. The age
of the company is not available for many �rms. Information quality should not be
a determinant of voluntary disclosure because it is a factor only after a report has
been released and this paper �rst examines whether or not a �rm issues a GRI re-
port. Time e�ects cannot be considered in this study which focuses on the analysis
of a single year. Other variables - such as stakeholder power, strategic posture, own-
ership structure, intangibles governance structure, stakeholder orientation, analyst
following and capital intensity - can either assumed to have been included in the
industry, country or size variables of this study, or are only used in one reviewed
study for a particular purpose which is not relevant or applicable the current study.
Globalization, as examined by Webb et al. (2008) is not included in this study be-
cause it cannot be su�ciently explained using the underlying theories with regard to
the actual aspect of reporting. However, multinationality is included as one possible
proxy for globalization a robustness check in section 3.5.3.
64

3 Disclose or not disclose: Determinants of social reporting
3.3 Theoretical Framework
Firm performance is the main information disclosed in social reports. However, it
does not necessarily exist in the form of �nancial performance, but rather social and
environmental performance. The concentration on the latter performance aspects
should provide acceptance within several stakeholders and thus ensure long-term
survival of the company by means of publicity and enhanced reputation.
Because of the variety of stakeholders and di�erent possible performance aspects,
studies researching in�uencing factors of voluntary disclosure apply di�erent theo-
ries. At �rst glance management is mainly accountable towards shareholders and
debtholders and so some theories try to explain a relationship between voluntary
disclosure and �nancial performance (Cormier et al., 2005: p. 4). These theories
explain either a direct or indirect in�uence of a company's �nancial performance
and are mainly applicable for shareholders. Theories which keep their focus on a
direct in�uence are derived from agency or transactions cost theory and deal with
monitoring costs and transaction costs. It can thus be argued that reduced informa-
tion asymmetry due to increased disclosure reduces the cost of capital for companies
(Leuz and Verrecchia, 2000: p. 91).
An indirect in�uence on �nancial performance is explained by political theories
which are broader than the direct theories because they usually consider more than
two or three interacting groups. Thus, these theories are stakeholder based. Stake-
holder and legitimacy theory are the theories used most often in this research �eld
and are sometimes seen as competing. However, Gray et al. (1995: p. 53) argue
that both theories discuss stakeholders - and the necessity for a company to take
them into account - but from slightly di�erent point of views. In both theories,
stakeholder theory and legitimacy theory, the relationship to economic aspects is
not directly via the stock market, but indirectly, via stakeholders. As such, not only
the shareholders and debtholders, but all stakeholders are groups in these theories
which have an in�uence on the company. Hence, stakeholder and legitimacy theory
can also explain an e�ect of voluntary disclosure on stakeholders which is important
for the �nancial performance of the company.
The theories can be divided in information asymmetry based theories which con-
centrate more on shareholders and stakeholder oriented theories. Stakeholders are
groups which a�ect or are a�ected by the company. This includes shareholders who
are also a stakeholder group. Shareholder theories show how shareholders act and
that they want high returns from their investments. In contrast, stakeholder theories
can explain how and which groups the company has to satisfy in order to achieve
high pro�ts. Consequently, stakeholder concepts are only an alternative view to the
exclusive goal of pro�t maximization (Preston and Sapienza, 1990: p. 366). The
65
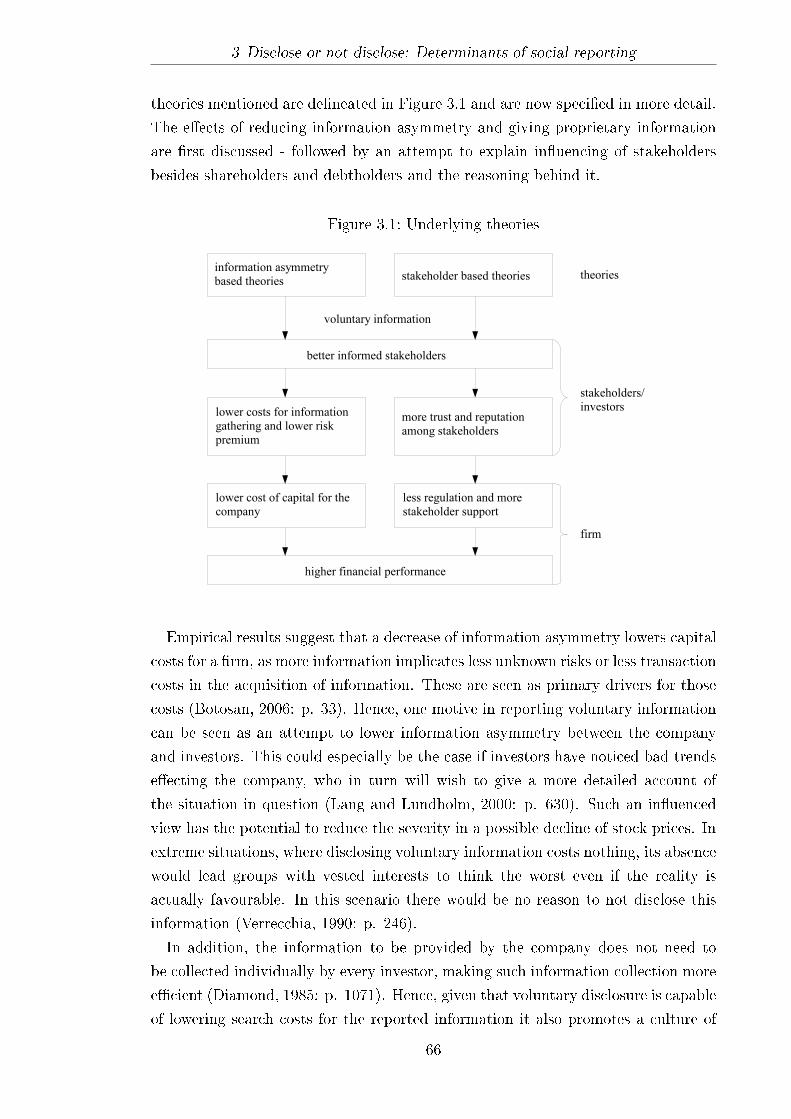
3 Disclose or not disclose: Determinants of social reporting
theories mentioned are delineated in Figure 3.1 and are now speci�ed in more detail.
The e�ects of reducing information asymmetry and giving proprietary information
are �rst discussed - followed by an attempt to explain in�uencing of stakeholders
besides shareholders and debtholders and the reasoning behind it.
Figure 3.1: Underlying theories
Empirical results suggest that a decrease of information asymmetry lowers capital
costs for a �rm, as more information implicates less unknown risks or less transaction
costs in the acquisition of information. These are seen as primary drivers for those
costs (Botosan, 2006: p. 33). Hence, one motive in reporting voluntary information
can be seen as an attempt to lower information asymmetry between the company
and investors. This could especially be the case if investors have noticed bad trends
e�ecting the company, who in turn will wish to give a more detailed account of
the situation in question (Lang and Lundholm, 2000: p. 630). Such an in�uenced
view has the potential to reduce the severity in a possible decline of stock prices. In
extreme situations, where disclosing voluntary information costs nothing, its absence
would lead groups with vested interests to think the worst even if the reality is
actually favourable. In this scenario there would be no reason to not disclose this
information (Verrecchia, 1990: p. 246).
In addition, the information to be provided by the company does not need to
be collected individually by every investor, making such information collection more
e�cient (Diamond, 1985: p. 1071). Hence, given that voluntary disclosure is capable
of lowering search costs for the reported information it also promotes a culture of
66

3 Disclose or not disclose: Determinants of social reporting
equality between investors. Managers try to mitigate any undervaluation of the
company by investors through the voluntary disclosure (Healy et al., 1999: p. 497).
In case where the investors have no access to information because it is proprietary
then it not only lowers search costs, but also provides additional information. Such
information, for instance a �rm's energy consumption, could also be of value for some
investors. If an investor compares two similar companies where one uses signi�cantly
more energy and the investor thus expects an increase of energy prices this would
be an additional argument to invest in the low energy consuming company. Again,
it can be argued that companies not disclosing this information may not be high
energy consumers. If this information can easily be collected and disseminated then
it should. The same holds for informal standards which are not required by law,
but are introduced as requirements for special awards for instance (Gibbins et al.,
1990: p. 131). Again, the relative levels of compliance or non-compliance with these
requirements should be reported.
The value relevance of non-�nancial information is shown by, for example, Hughes II
(2000: p. 225). The study comes to the conclusion that the share price of �rms
in the electric utility industry is lower when they have high amounts of pollution
because investors anticipate future environmental liabilities. This proprietary in-
formation could also be used by third parties, e.g. politicians to make companies
liable for their actions which can lead to extra costs (Li et al., 1997: p. 459). Fur-
thermore, competitors may receive important strategic information which comprises
the disclosing �rm (Darrough and Stoughton, 1990: p. 219). Firms should as such
be conscious of the particular information they disclose. This is not an argument
against preparing a social report, but rather against disclosing all information with-
out some exercising of discretion.
By disclosing proprietary information a company can also enhance its reputa-
tion as a credible discloser among its stakeholders (Cormier and Magnan, 2003: p.
47). Additionally, this information can mitigate negative reactions towards disclosed
content before it is published by newspapers in a light which is un�attering to the
company (Skinner, 1994: p. 58). For example a company which has used child
labour is perhaps better o� if it voluntarily issues reports about child labour and
its actions to reduce it rather than not reporting it and facing a story in the press
which exposes the fact of its having used child labour.
The view of legitimacy theory is that organisations have no inherent right to
resources or to exist (Deegan, 2002: p. 292). They must respect certain boundaries
and not only law - as the term legitimacy might indicate. Legitimacy in this sense
means that companies use their power as expected by society (Warren, 1999: p.
215). In reality companies are entities that operate not only in a society, but are
obliged to respect other interests, too. If they do not, they will be regulated and
67
3 Disclose or not disclose: Determinants of social reporting
enjoy less freedom. Thus, they try to operate within societally-agreed boundaries
and norms which may also change over time (Guthrie et al., 2004: p. 284).
The reciprocal dependency between a company and society is called a social con-
tract. A description of this situation is given by Shocker and Sethi (1973: p. 97):
Any social institution - and business is no exception - operates in a
society via a social contract, expressed or implied, whereby its survival
and growth are based on:
1. the delivery of some socially desirable ends to society in general,
and
2. the distribution of economic, social, or political bene�ts to groups
from which it derives its power.
In a dynamic society, neither the sources of institutional power nor the
needs for its services are permanent. Therefore, an institution must con-
stantly meet the twin tests of legitimacy and relevance by demonstrating
that society requires its services and that the groups bene�ting from its
rewards have society's approval.
It could be that society revokes the social contract with a company so it cannot
operate any more (Deegan, 2002: p. 293). This does not mean that the opinion of
the society can not be indirectly negotiated (Woodward et al., 2001: p. 357). Such a
negotiation with public opinion can be achieved, for example, with the help of social
reporting, produced with the objective of extending, maintaining or defending the
legitimacy of an organization (Ashforth and Gibbs, 1990: p. 182). By this means -
through social reports - a company can present its actions with respect to societal
expectations in a positive light and thus minimise potential con�icts (Patten, 1992:
p. 472).
Donaldson and Preston (1995: pp. 70-71) argue that stakeholder theory can be
divided into three types - descriptive, instrumental and normative. It is descrip-
tive when the actual nature or state of a company and its stakeholders is analysed.
Instrumental stakeholder theory tries to explain relationships between stakeholders
and the company. In a normative way this theory provides moral or ethical guide-
lines for actions by �rms. In the current paper, stakeholder theory is used in an
instrumental way. However, it is necessary to include the context of the company,
e.g. country, which is more descriptive. Stakeholder theory tries to integrate eco-
nomic and social aspects into one framework and it should be kept in mind that
each depends on the other (Harrison and Freeman, 1999: p. 483). For this reason,
stakeholders should be taken into consideration when they have an impact on the
company. There are di�erent possible ways to determine an impact. E.g. Mitchell
68

3 Disclose or not disclose: Determinants of social reporting
et al. (1997: p. 872) point to a signi�cant impact if stakeholders have power, urgency
or legitimacy. In satisfying the demands of stakeholders with control over critical
resources of the company �rm performance will also be enhanced - or at least will
not decrease - whereas stakeholders having only a minor in�uence tend to be ignored
(Ullmann, 1985: p. 552).
Stakeholder theory explains �rms performance from a sustainable viewpoint in-
cluding not only shareholders, but all stakeholders. As such, when preparing a
sustainability report and de�ning its content, stakeholders and their issues should
be the starting point (GRI, 2006: p. 7). Sustainability is desirable for all stakehold-
ers, because shareholders support sustained revenues, and for other stakeholders it
means for example safe workplaces or healthy products (Funk, 2003: p. 66). These
dimensions of sustainability are related to each other because sustained revenues
are only possible by concentrating on other stakeholders, that is, by satisfying cus-
tomer needs or reducing pollution as prescribed by governments who may impose
fees on polluters (Hart and Milstein, 2003: p. 57). Concentrating on such sus-
tainable actions becomes more and more important because corporate impacts and
reactions of stakeholders to such impacts are becoming more signi�cant (McLaren,
2004: p. 199). Furthermore, disclosing relevant voluntary information showing fac-
tors related to companies' stakeholders is an indicator for investors that a company
is aware of the risks and opportunities related to these factors and includes them in
the decision-making process (López et al., 2007: p. 290).
An attribution of e�ects to one presented theory is very di�cult, because social
reports always contain voluntary information. This information could be provided
by a company in order to lower information asymmetry, but also to in�uence its
stakeholders which appreciate actions of a company more with the information pro-
vided in a social report. It can only be speculated which relationship dominates
by interpreting a possible country or industry-e�ect (Cormier et al., 2005: p. 8).
Further, it can be supposed that companies are aware of di�erent e�ects of vol-
untary reporting, so that more than one theory is applicable. The same is valid
for shareholders, who anticipate further e�ects because they may speculate on how
other stakeholders such as consumers react to voluntary disclosure.
3.4 Research Design
Because of the comprehensive nature of some constructs and overlapping theories, it
is not possible to assign non-ambiguously a certain construct to a particular theory.
Hence, a variable may explain di�erent facts and an overview of the variables used
is given, along with a short description of what they are proxies for.
69
3 Disclose or not disclose: Determinants of social reporting
3.4.1 Dependent Variable
For the analysis reports prepared with the guidelines of the Global Reporting Ini-
tiative are taken into account. They are the leading reporting guidelines based on
the Triple Bottom Line (Waddock, 2004: p. 33). They incorporate the three topics
pro�t, people and planet which are evaluated in the three categories economic, social
and environment. The reporting in these categories is compatible with ISO14000
and World Business Council for Sustainable Development (Reynolds and Yuthas,
2008: p. 53). Companies can declare one of three application levels, whereas the
higher levels include additional data regarding the three categories (GRI, 2006: p.
5).
The dependent variable GRI is a binary variable which equals 1 if a GRI report
exists and 0 if not (Jonas and Jones III, 2010: p. 14). This may appear simplistic,
however it avoids problems which can arise if voluntary disclosure is measured in
other ways. Often, the quantity is also measured by pages, words or sentences
about voluntary information (Hackston and Milne, 1996: p. 84). This is not useful
for comparisons with respect to di�erent formatting styles, page sizes and other
possible ways to present visual information. Perhaps all important information is
presented in tables which may be easier to �nd and read than text sections, but
this would be a quantity of zero if sentences were counted. Furthermore, reporting
is concerned with content, and a company which reports in one sentence, that it
has no child labour, reports enough, if compared to a company which reports in
10 sentences about child labour in its manufactures in the third world. Thus, a
thorough analysis should always keep the context in mind - which can be both
labour intensive and time consuming. In pursuing this direction the point of view
switches from a quantitative approach to a qualitative one. However, this paper
attempts to identify determinants for the decision to issue GRI reports and not for
their quality.
The aspect what and how much is reported is the decision of the company and is
expected to be in accordance with its main goal which in turn can be assumed as a
good �nancial performance. This is another cause why the existence of a report and
not its coverage measured for instance as application level is taken as the dependent
variable. Nevertheless, this decision is somewhat subjective, but it seems plausible
that the barrier to prepare an extra report is higher than increasing the application
level and thus the circumstances for social reporting should be assessed easier in the
suggested way.
A decision on the existence of an extra report was made because nearly every
annual report contains some type of voluntary disclosure. However, if a company
decides to spend extra money in preparing an additional report, it can be assumed
70

3 Disclose or not disclose: Determinants of social reporting
that the �rm considers it as very important to inform stakeholders about its actions
(Clarke and Gibson-Sweet, 1999: p. 10). Moreover, annual reports are historically
developed to inform shareholders who are only one out of many stakeholder groups
and mostly interested in �nancial performance. Thus, an extra report shows that a
company cares also about other stakeholders who may be more interested in social
and environmental performance instead of �nancial performance.
3.4.2 Independent Variables
Following stakeholder theory, one argument in favour of companies publishing a
sustainability report could be that they have a very high sustainability performance
and want to show this to their stakeholders. It is assumed that the sustainability
performance is based on actions and processes of the company which can also be
called social responsiveness. Social responsiveness is examined because it seems
intuitive with regard to the theories presented in this paper that companies with
high pro�les and performance report about their good actions.
There are many di�erent possible ways to measure sustainability depending on
its de�nition. Rennings et al. (2003: p. 38) use data from the Swiss bank Sarasin &
Cie on environmental and social aspects of 300 European companies. Environmental
data is drawn from a product life-cycle approach over the value chain and social data
is derived from a stakeholder approach which includes clients, competitors, employ-
ees, investors, public and suppliers. A measure used more often is the inclusion of a
company in the FTSE4Good index, which is based on research of the Ethical Invest-
ment Research Service (EIRIS). Companies in industries such as tobacco production
or nuclear power supply are excluded from this index. Furthermore, companies are
rated on di�erent criteria such as environmental in�uence or human rights. Studies
which use this Index as a proxy for sustainability are Walmsley and Bond (2003),
Collison et al. (2008) and Collison et al. (2009).
Another index is the Dow Jones Sustainability Index which is used in many stud-
ies, e.g. Lo and Sheu (2007), López et al. (2007), Lee and Fa� (2009) and Lee et al.
(2009). This index is considered as being �advantageous because it incorporates a
best-in-class methodology to recognize the leading CSP �rms from each industry
sector� (Artiach et al., 2010: p. 34). This also means that no companies are ex-
cluded because per se they belong to a certain industry - they are all rated equally
using the same criteria.
Dow Jones STOXX Sustainability Index (DJSI STOXX) consists of the best com-
panies in terms of sustainability from the Dow Jones STOXX 600. The creation of
this index is delivered by Sustainable Asset Management (SAM) Research and starts
with an assessment of publicly available information which are mostly di�erent types
71

3 Disclose or not disclose: Determinants of social reporting
of reports, documents requested from companies, as well as questionnaires for CEOs
and heads of investor relations. These questionnaires are veri�ed by cross-checking
answers with submitted documents, media and stakeholder reports by the company.
This process is also internally and externally monitored and assured by an indepen-
dent third party. Companies are rated on di�erent criteria which are either gen-
eral for all industries or industry-speci�c. The three main dimensions (economic,
environment and social) include weighted criteria which in turn are composed of
sub-criteria. Once a company is selected for the DJSI STOXX it is continuously
monitored on its sustainable performance, which can lead to an exclusion from the
index if a company has issues such as unfair competition or ecological disasters.
Whether a company is in the DJSI STOXX or not is shown with the dummy vari-
able DJSI. This variable can also be seen as an indicator for social responsiveness
which incorporates environmental aspects in decision making and stakeholder man-
agement (Waddock, 2004: p. 10). It is expected that companies which are in the
DJSI are more likely to disclose a GRI report to their stakeholders.
Capital structure indicates the in�uence of creditors, an important stakeholder
group (Roberts, 1992: p. 602). Companies with low leverage experience less pressure
from debtholders. Creditors have two incentives towards knowing more about the
companies activities than they can get from annual reports. Firstly, they decrease
the e�ect of information asymmetry and thus the risk of a loss of credit becomes more
easily assessable and the cost of debt capital should decrease. Secondly, they may
also have more interests than merely the payback of credit. For example creditors
may only o�er credit to �rms which do not pollute and destroy the environment in
an excessive manner. In this way, a positive relation with disclosing a social report
can be expected. The capital structure LEV is measured as total debt divided by
total equity.
High levels of risk are expected to come from high uncertainty about a company's
future performance which causes increased volatility of stock prices (Boesso and
Kumar, 2007: p. 277). Companies can try to give voluntary information which is
able to decrease the volatility coming from unknown risks from the company itself.
If risk reduction is possible, investors expect a lower risk premium and so companies
are able to decrease their cost of capital (Healy and Palepu, 2001: p. 421). It is
expected that companies with high capital costs are more likely trying to decrease
their capital costs with voluntary reporting than those with low risk pro�les. The
systematic risk is de�ned as BETA.
Financial performance can in�uence voluntary disclosure, as it is easier for �nan-
cially healthy organisations to meet their obligations to stakeholders (Brammer and
Pavelin, 2006: p. 1174). It can also be argued that very pro�table companies have
managers who understand the means of managing the interests of their stakeholders
72

3 Disclose or not disclose: Determinants of social reporting
(Bowman and Haire, 1976: p. 11). This leads to the assumption that these compa-
nies are also more likely to disclose voluntarily. Furthermore, pro�table companies
have a stronger position than their competitors and so there may be less fear of
disclosing relevant information. For the �nancial performance the return on assets
ROA.
Large companies are presumed to be more visible and thus they are more likely
to disclose voluntary information (Patten, 2002: p. 765). It can also be assumed
that they have more stakeholders who demand social reports and thus the political
pressure for voluntary disclosure is higher (Watts and Zimmerman, 1978: p. 118).
Furthermore, large companies should be involved in more activities, raising the pos-
sibility that they are involved in actions which they have to legitimate for. Another
explanation is that shareholders of large �rms have a higher degree of information
asymmetry because large companies are more often engaged in di�erent countries or
have a wide spectrum of activities. In this case only investors with good information
channels are able to access this extra information. Consequently, additional infor-
mation is required to lower proprietary costs and to o�er equal access to investors
to analyse the company. Size is measured with the variable SIZE as the logarithm
of total assets.
Media visibility can also be an important factor contributing to voluntary disclo-
sure (Brown and Deegan, 1998: p. 30). If a company often appears in the media
it is automatically in the consciousness of more stakeholders. Thus, if they are
guilty of some wrongdoing, it can seem to be much worse than the reality when they
receive more public attention than other non-prominent �rms would get in these
scenarios. As a result, companies with high media visibility should prefer to disclose
social reports than those with low media visibility. Similar to SIZE media visibility
MEDIA is measured as the logarithm of the number of results in a Google news
search containing the name of a �rm.
Bushman et al. (2004: p. 210) list some studies that analyse the in�uence of a
�rm's country on �nancial reporting. It can be expected that social reporting also
depends on the country because every country has its speci�c legal environment.
Baginski et al. (2002: p. 29) state for instance that countries where managers do
not have to fear litigation if they disclose inaccurate information are more likely to
disclose voluntary information. Furthermore, the rights of investors di�er between
countries and it has been shown that countries with legal rules based on common
law protect investors more than code law countries (La Porta et al., 1998: p. 1151).
With this in mind, it can be assumed that �rms in countries with a weaker legal
infrastructure provide more voluntary information as they wish to build trust and
reputation among investors (Webb et al., 2008: p. 242). This trust should help to
reduce the cost of capital (Durnev and Kim, 2005: p. 1467). Nevertheless, there are
73

3 Disclose or not disclose: Determinants of social reporting
also di�erences between code law and common law countries with regard to other
legal requirements (Jaggi and Pek Yee, 2000: p. 500).
This is the reason why three ways to di�erentiate countries are introduced. First,
countries are divided into code law and common law countries. For this purpose a
classi�cation by La Porta et al. (1998: pp. 1118-1119) is used. They point out that
code law is the oldest legal tradition and its rules are coded very comprehensively
and are generally formulated. In contrast, common law is based on the law of
England which has speci�c cases as its foundation. If a company is in a common
law country the dummy variable LS_EN is set to 1.
Two other country-speci�c criteria - securities laws and ownership concentration
- are taken from Bushman and Piotroski (2006: pp. 145-146). Securities laws
are another possible way to assess the legal system. These laws are a contract-
ing framework for security markets and specify mandatory disclosure, or liabilities
for incorrect information (La Porta et al., 2006: p. 2). Following Bushman and
Piotroski (2006: pp. 145-146), for countries with high securities laws the dummy
variable SEC_LAW is set to 1. Ownership concentration, meaning that only a
few shareholders in a country own large stocks of companies, is argued as being a
substitute for legal protection (La Porta et al., 1998: p. 1145). As such, a high
concentration of stock ownership o�ers the possibility to in�uence companies in a
direction similar to securities laws. Although additional information can be claimed
easier by the concentrated shareholder power of few in�uential owners it is voluntary.
Hence, it is expected that companies in countries with high ownership concentra-
tion are more likely to disclose a social report. Following Bushman and Piotroski
(2006: pp. 145-146), the dummy variable OWN_CONC is 1 for countries with
high ownership concentration and 0 for countries with low ownership concentration.
When considering industry as a control variable, it is, for example, possible to
separate companies which are highly regulated from less regulated industries and
industries with a di�erent stakeholder structure. This also implies di�erent infor-
mation needs with respect to information asymmetry. Another aspect is that �rms
in some industries have to legitimate themselves more than others because they re-
ceive more attention, e.g. due to disputable �elds of action. For instance, industries
with high environmental visibility have to respond to regulations or societal pres-
sure (Bowen, 2000: p. 94). The industry classi�cation is taken from the Dow Jones
STOXX 600. INDUSTRY represents a dummy variable for each industry.
3.4.3 Empirical Model
The impact of the possible determinants introduced on GRI disclosure is examined
using the following model.
74
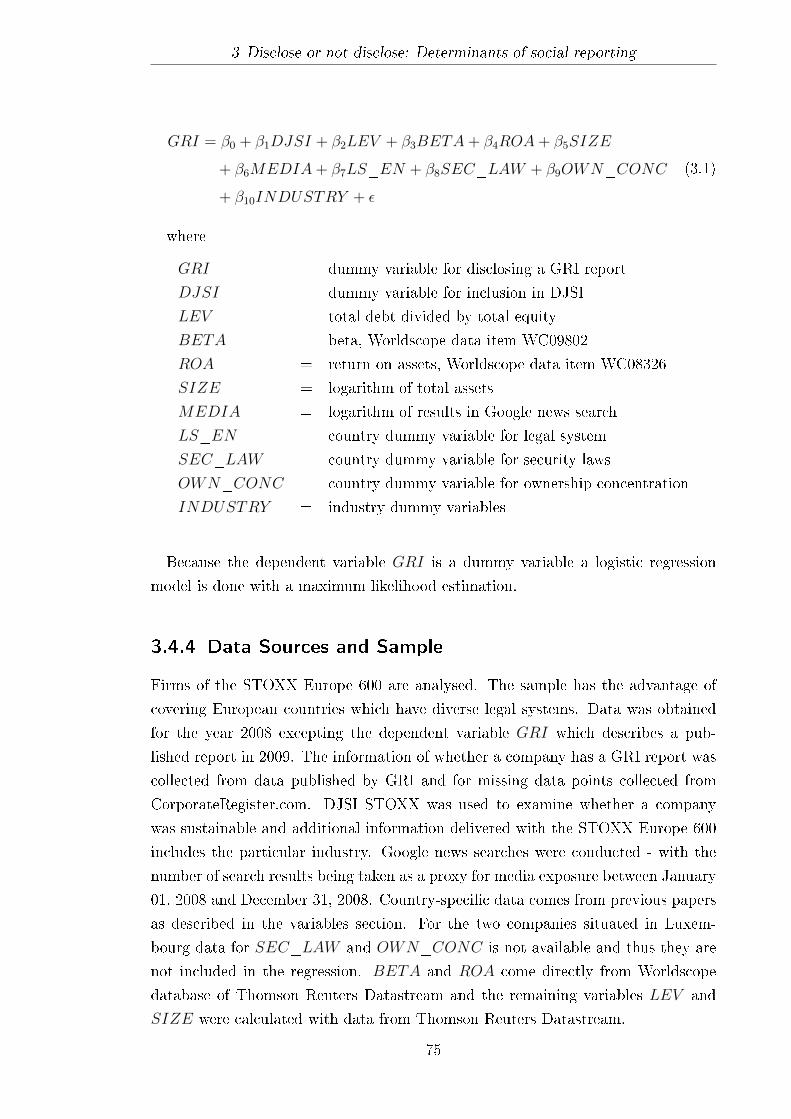
3 Disclose or not disclose: Determinants of social reporting
GRI = β0 + β1DJSI + β2LEV + β3BETA+ β4ROA+ β5SIZE
+ β6MEDIA+ β7LS_EN + β8SEC_LAW + β9OWN_CONC
+ β10INDUSTRY + ϵ
(3.1)
where
GRI = dummy variable for disclosing a GRI report
DJSI = dummy variable for inclusion in DJSI
LEV = total debt divided by total equity
BETA = beta, Worldscope data item WC09802
ROA = return on assets, Worldscope data item WC08326
SIZE = logarithm of total assets
MEDIA = logarithm of results in Google news search
LS_EN = country dummy variable for legal system
SEC_LAW = country dummy variable for security laws
OWN_CONC = country dummy variable for ownership concentration
INDUSTRY = industry dummy variables
Because the dependent variable GRI is a dummy variable a logistic regression
model is done with a maximum likelihood estimation.
3.4.4 Data Sources and Sample
Firms of the STOXX Europe 600 are analysed. The sample has the advantage of
covering European countries which have diverse legal systems. Data was obtained
for the year 2008 excepting the dependent variable GRI which describes a pub-
lished report in 2009. The information of whether a company has a GRI report was
collected from data published by GRI and for missing data points collected from
CorporateRegister.com. DJSI STOXX was used to examine whether a company
was sustainable and additional information delivered with the STOXX Europe 600
includes the particular industry. Google news searches were conducted - with the
number of search results being taken as a proxy for media exposure between January
01, 2008 and December 31, 2008. Country-speci�c data comes from previous papers
as described in the variables section. For the two companies situated in Luxem-
bourg data for SEC_LAW and OWN_CONC is not available and thus they are
not included in the regression. BETA and ROA come directly from Worldscope
database of Thomson Reuters Datastream and the remaining variables LEV and
SIZE were calculated with data from Thomson Reuters Datastream.
75

3 Disclose or not disclose: Determinants of social reporting
3.5 Results
3.5.1 Descriptive Statistics
Table 3.2 shows from which country the companies used in the sample originate.
Almost one third (181) of all analysed �rms belong to the two existing common law
countries. 309 companies are from countries with high securities laws and 173 from
countries with high ownership concentration.
Table 3.2: Countries of sample companies
Country Companies in % GRIreports
in %per
country
Commonlaw
Securitieslaws
Ownershipconcentration
United Kingdom 172 28.7% 43 25.0% yes high lowFrance 82 13.7% 26 31.7% no high lowGermany 57 9.5% 27 47.4% no low highSwitzerland 46 7.7% 14 30.4% no low lowSweden 36 6.0% 15 41.7% no low lowItaly 34 5.7% 17 50.0% no high highSpain 32 5.3% 25 78.1% no low highNetherlands 28 4.7% 18 64.3% no low lowFinland 20 3.3% 10 50.0% no low lowBelgium 17 2.8% 5 29.4% no low highDenmark 17 2.8% 5 29.4% no low lowNorway 15 2.5% 6 40.0% no low lowAustria 12 2.0% 4 33.3% no low highGreece 11 1.8% 6 54.5% no high highPortugal 10 1.7% 7 70.0% no high highIreland 9 1.5% 2 22.2% yes low lowLuxembourg 2 0.3% 1 50.0% no N/A N/ATotal 600 100.0% 231 38.5% 181 309 173Note: N/A - not available
231 companies prepare a GRI report which equates 38.5%. KPMG (2008: p. 35),
who analyse the 100 largest companies in 22 countries and the Global Fortune 250
come to 69% respectively 77% GRI reporting companies for the years 2007 and
2008. For the Fortune Global 250, Kolk (2008: p. 5) identi�ed 64% of companies
as having produced reports on sustainability in 2004. However, these are not only
reports produced in respect of the GRI guidelines. As a result the proportion of
reporting companies may seem to be relatively low in this study, but this is also
due to the inclusion of smaller companies often ignored by other studies. The three
countries with the highest portion of reporting companies are Spain, Portugal and
the Netherlands. The countries with the lowest portion of reporting are Ireland,
United Kingdom, Belgium and Denmark.
Table 3.3 lists the industries in which the companies operate. Nearly one quarter
of the companies belong to the �nancial sector. They are closely followed by the
industrials industry which is represented by 19.8% of the companies. The lowest
portion in this sample is represented by Telecommunication with 3.3% and Tech-
nologies with 4.0%.
76

3 Disclose or not disclose: Determinants of social reporting
Table 3.3: Industries of sample companies
Industry Companies in %Financials 143 23.8%Industrials 119 19.8%Consumer Services 72 12.0%Consumer Goods 67 11.2%Basic Materials 49 8.2%Oil & Gas 39 6.5%Health Care 36 6.0%Utilities 31 5.2%Technology 24 4.0%Telecommunications 20 3.3%Total 600 100.0%
Table 3.4: Descriptive statistics and correlation coe�cients
Correlation Coe�cientsVariable Mean Standard
DeviationMinimum Maximum MEDIA SIZE BETA ROA LEV
MEDIA 7.75 1.91 2.40 12.94 1SIZE 6.97 0.77 5.39 9.39 .419*** 1BETA 1.04 0.58 -0.55 3.33 .114*** .196*** 1ROA 6.10 9.24 -55.89 57.81 -.062 -.307*** -.214*** 1LEV 1.55 10.72 -225.83 99.74 .059 .210*** .046 -.073* 1Signi�cance levels: ***p < 0.01, **p < 0.05, *p < 0.10Note: The operationalisation of the variables can be found in Section 3.4.3.
Table 3.4 shows descriptive statistics for the non dummy variables. One important
fact is that there are some companies with a negative leverage which means that
they have a negative equity. The large standard deviation of MEDIA, ROA and
LEV are caused by some very high or low variables in the dataset. This dataset is
examined more closely and seems to be correct, showing no error values. However,
the negative leverage and possible outliers are considered in a robustness check. The
correlation matrix indicates that some independent variables especially SIZE and
MEDIA are correlated with the other variables, but the coe�cients are relatively
low (all below 0.5) and indicate no multi-collinearity issue.
3.5.2 Regression results
Table 3.5 provides the results for the logistic regression. Using logistic regression
there is no measure which corresponds to adjusted R2 in linear regression. However,
some examples of Pseudo R2 exist, but there is no natural interpretation for their
values and maximum likelihood estimators are not designed to maximize R2 as
classical regression models do (Greene, 2003: pp. 683-686). Nevertheless, using a
χ2-Test the overall �t of the model can be tested. With a χ2 of 225 (d.f. = 569)
77

3 Disclose or not disclose: Determinants of social reporting
it can be said that the model �ts signi�cantly (p < 0.01) better than a model with
just an intercept (null model).
12 companies are not considered in the regression due to missing data points and
the variable for the telecommunication industry was omitted from the regression as
it is the industry with the fewest �rms and it is explained perfectly by the other
industries. For industries, it is demonstrated that only �nance industry (p < 0.01)
and, with lower signi�cance consumer services (p < 0.05) and industrials (p < 0.10)
make less voluntary disclosure than the other industries. This result is consistent
with those for the �nancial industry taken from Brammer and Pavelin (2006: p.
1182). Nevertheless, their study is about voluntary environmental disclosure and
not voluntary social disclosure and they had a somewhat di�erent classi�cation of
industries, excluding that for the �nancial industry.
Table 3.5: Regression results
Predictedsign
Estimate Std. Error z value Pr(>|z|)
(Intercept) -10.87*** 1.56 -6.97 0.00DJSI β1 > 0 1.44*** 0.26 5.65 0.00LEV β2 > 0 -0.02* 0.01 -1.91 0.06BETA β3 > 0 -0.07 0.21 -0.34 0.73ROA β4 > 0 0.03** 0.02 1.96 0.05SIZE β5 > 0 1.53*** 0.22 6.83 0.00MEDIA β6 > 0 0.04 0.07 0.62 0.54LS_EN β7 < 0 -0.45 0.32 -1.41 0.16SEC_LAW β8 < 0 -0.39 0.25 -1.54 0.12OWN_CONC β9 > 0 0.59** 0.25 2.33 0.02Oil & Gas ? -0,19457 0.69 -0.28 0.78Basic Materials ? 0,44364 0.67 0.66 0.51Industrials ? -1.03* 0.61 -1.68 0.09Consumer Goods ? -0,65642 0.64 -1.03 0.30Health Care ? -1.10 0.71 -1.56 0.12Consumer Services ? -1.38** 0.65 -2.13 0.03Utilities ? -0.47 0.71 -0.65 0.51Financials ? -2.38*** 0.64 -3.71 0.00Technology ? -0.39 0.78 -0.50 0.62n = 588Signi�cance levels: *** 0.01 ** 0.05 * 0.10Null deviance: 784.33 on 587 degrees of freedomResidual deviance: 559.33 on 569 degrees of freedomχ2 = 225 with p < 0.01Note: The operationalisation of the variables can be found in Section 3.4.3.
DJSI is a determinant of GRI reporting with a strong positive signi�cant in�u-
ence (p < 0.01). Consequently, the prediction that companies with positive social
actions wish to show these to their stakeholders holds true. Vice versa, it may not
to be a mistaken assumption should stakeholders conclude that companies which do
not report on social aspects do so because they are worse than others.
78

3 Disclose or not disclose: Determinants of social reporting
The sign of the capital structure LEV indicates a signi�cant negative in�uence
(p < 0.10) on GRI. This relationship di�ers from the predicted positive relationship.
Thus, this result does not harmonise with the underlying theories. For instance,
stakeholder theory, and creditors are a stakeholder group, predicts that the company
tries to satisfy and inform their stakeholders. There are two possible reasons for this
result. First, the company reports to their creditors in a private and not a public
way, so creditors do not need extra voluntary information. Second, the results are
not robust and vary with di�erent construct variables which is tested in section
3.5.3. The latter case seems to be more likely, so that the signi�cant result could be
stochastic.
BETA has no signi�cant in�uence. It may be that risk is already incorporated in
the industry variables as they could have di�ering levels of risk. But also dropping
the industry variables from the regression does not change the signi�cance of BETA.
It can be assumed that no additional risk e�ects outside of the industry e�ects can
be held responsible for the signi�cance of the industry results.
Financial performance has a positive signi�cant in�uence (p < 0.05) on the prepa-
ration of a GRI report. This contrasts with Brammer and Pavelin (2006: p. 1182)
where �nancial performance has no signi�cant in�uence on environmental report-
ing. However, the negative e�ect (p < 0.10) of capital structure would con�rm their
results.
Company size has a signi�cant positive in�uence (p < 0.01) on GRI reporting.
This is an expected e�ect, because large companies are assumed to have more pow-
erful stakeholders and so there is more pressure to report what they do in addition
to the content of their �nancial reports. Furthermore, this helps to lower infor-
mation asymmetry between shareholders who are supposed to be di�erent in large
companies.
At �rst glance similar to Brammer and Pavelin (2006: p. 1183) media visibility
seems not to be a signi�cant determinant, althoughMEDIA is signi�cant positively
correlated with SIZE. It shows that the result does not hold if SIZE is dropped
from the regression which means that the SIZE overrides MEDIA. In this case,
as predicted, MEDIA has a signi�cant positive impact (p < 0.01) on GRI.
With respect to country-speci�c e�ects it can be shown that the legal system
(LS_EN) has no in�uence on GRI reporting. The same is true for high or low
securities laws (SEC_LAW ). This presupposes the condition that ownership con-
centration is included in the model. Countries with high ownership concentration
have a signi�cant positive (p < 0.05) in�uence on GRI reporting. It can be the case
that the e�ect of OWN_CONC is so strong that it overrides other country e�ects.
In addition, common law countries have a signi�cant negative e�ect (p < 0.05) when
OWN_CONC is dropped and if LS_EN is also dropped, high securities laws have
79

3 Disclose or not disclose: Determinants of social reporting
a signi�cant negative e�ect (p < 0.01). This can be explained by the fact that these
two aspects may be imposed by the state in question, such that these laws likely
are of high quality and the stakeholder can thus rely more on these than on any
supplementary social reports produced by the company.
3.5.3 Robustness checks
In order to test the robustness of the results construct validity is tested using di�er-
ent variables for some of the determinants. In addition, regarding company size the
variables net sales and market capitalization were also tested. For �nancial perfor-
mance Return on Assets was substituted by Total Investment Return (Worldscope
data item WC08801) and Earnings per Share (Worldscope data item WC05201) as
given by Thomson Reuters Datastream. Both are stock market return �gures for a
return per share. Finally, multinationality has been incorporated in the regression
- calculated as foreign assets divided by total assets.
With the given variation in these variables, the reported results are shown to be
quite robust. The health care industry sometimes gets a signi�cant negative as-
sociation with reporting. The presence of common law has a signi�cant negative
in�uence if size is measured with net sales or market capitalization. Two variables
which are less robust are capital structure and �nancial performance. Capital struc-
ture becomes insigni�cant if market capitalization is used as a proxy for company
size. In addition, �nancial performance remains questionable, as it becomes insignif-
icant upon a variation on size and along with other �nancial performance variables.
The inclusion of multinationality has no signi�cant in�uence on the results.
Robustness has also been tested by deleting data points with a negative leverage
LEV . A negative leverage implies that a company should no longer be in the
market because it is in an excessive state of debt. Excluding the seven companies
with excessive debt leaves a sample of 581 companies. The results are considered
robust apart from LEV itself which becomes insigni�cant.
Robustness was also tested by dropping the highest and lowest 1%, the outliers
of the dataset. Using this test, the branch industrials and leverage became in-
signi�cant. For industry consumer services and ROA, the signi�cance level declined
(p < 0.10). Without these outliers Akaike's information criterion declined from the
597.33 of the original model to a �gure of 537.89, meaning that the model with-
out outliers better explains the reporting behaviour. Thus, from these robustness
checks, conducted in conjunction with the original analysis, it can be assumed that
sustainability performance, �nancial performance, industry, size and country - with
respect to ownership concentration and legal system - may have a signi�cant impact:
whether a GRI report is disclosed or not.
80

3 Disclose or not disclose: Determinants of social reporting
3.6 Conclusion
This paper analyses determinants of voluntary disclosure using the example of GRI
reporting. Knowing determinants for voluntary disclosure can help in di�erent ways.
Firstly, standard setters for voluntary disclosure frameworks such as GRI can create
these standards either in order to help companies reporting voluntarily or to stim-
ulate non-reporting companies to do so more e�ciently. Secondly, it gives rise to a
discussion on whether social reporting should become mandatory - that companies
which are less likely to report voluntarily should perhaps be compelled to do so, as
they are likely to be worse o� with respect to sustainability performance if they do
not. Thirdly, stakeholders of companies such as shareholders or customers can evalu-
ate companies better when they know what factors stand behind a certain reporting
behaviour. For instance, the demonstrated high positive correlation between good
social responsiveness and voluntary reporting may render companies not reporting
more likely to be met with suspicion.
The topic is assessed by looking for determinants used in previous studies regard-
ing voluntary reporting. An analysis as to why companies prepare social reports in
accordance with GRI guidelines is conducted. These guidelines are a well-accepted
quasi-standard for social or sustainability reports which are disclosed voluntarily.
Variables for constructs such as media exposure, sustainability performance, indus-
try, size, capital structure, risk, �nancial performance, and country are used. Apart
from the sustainability measure, these variables are derived from constructs in other
studies examining determinants of voluntary disclosure. Sustainability or social re-
sponsiveness can be regarded as a determinant because it is plausible that companies
with positive social activities would wish to show what they have done. The sample
of this study are companies of the STOXX Europe 600 index.
The analysis is conducted using a logistic regression model. Evidence is achieved
that good sustainability has a positive signi�cant in�uence on reporting behaviour
meaning that companies would rather report positive actions than negative ones.
Another in�uencing factor is the size of a company as well as its media visibility,
whereas the e�ect of size is more in�uencing the company to publish a report. In-
dustry and country are also signi�cant. The country in which a company is based
has a mainly positive impact on reporting when there is a high ownership concen-
tration in a country. Capital structure also seems to have no in�uence and thus it
can be assumed that social reports are not intentionally prepared in order to satisfy
the requirements of debtholders.
This analysis reveals that good sustainability behaviour by a company is a de-
terminant in preparing sustainability reports. With respect to the point that the
measure for sustainability performance is also a measure for social responsiveness, it
81
3 Disclose or not disclose: Determinants of social reporting
indicates good stakeholder management policy. Indeed, social reporting can either
be an inherent part of stakeholder management or alternatively companies may want
to report their social actions to increase their good reputation among stakeholders.
For further research the following points are recommended. One major limitation
of this study is that it is based on a single year, which could be extended in further
studies. A multiple year sample also includes more companies not reporting on a
yearly basis or changing their reporting behaviour. This also allows to analyse if
the stated causal relationship is given in cases where variables only change slightly
over time. Another limitation is that only European companies and GRI reports as
an important example of social reports are included in this study. Furthermore, it
is not clear yet if the social actions of companies harmonize with the expectations
of stakeholders. It is a possible that companies only disclose what they believe
stakeholders want to hear, without actually doing what would genuinely bene�t the
stakeholders. The identi�cation of speci�c actions by companies could help to answer
this question. With regard to the results of this analysis, it could also be interesting
for standard setters to consider how less sustainable �rms could be motivated to
report on their social activities. Moreover, the results of this study could be revised
for di�erent years, with additional determinants or other classi�cations of industries
or countries. For example, the Dow Jones Sustainability Index is only one of those
measures. To get a better understanding of which social activities are determinants
of conducting voluntary disclosure, this index can be broken down into more speci�c
parts. Other proxies of social actions could also be identi�ed and used to verify the
results of this study.
82

4 Sunny with cloudy intervals:
The in�uence of social reporting
on �rm value
Abstract
In this study the impact of social reporting on �rm value is examined.
Social reporting is hypothesised to have a positive impact on the �rm
value. It is argued that the more content is reported, the higher this
impact should be. An externally assured report also should increase the
�rm value because it makes the report more credible. The sample which
is used in this study consists of the Dow Jones STOXX 600 �rms from
2008 to 2010 and GRI reports are taken as social reports. The hypothe-
ses are tested with regression analyses and measures which indicate the
quantity of information given and external assurance for the reports.
The results support the hypothesis that publishing a GRI report has a
positive in�uence on �rm value. Including more information is better in
general, but the results indicate that there could be a point of too much
information. However, external assurance seems to have no in�uence on
�rm value.
4.1 Motivation
Companies provide a lot of mandatory disclosure by law, especially annual reports,
which are relatively expensive because there is the need for special knowledge as well
as high costs for data gathering in creating such reports. Nevertheless, in addition,
many companies disclose voluntary information. If there is a rational cause for this
behaviour, the bene�t of disclosing voluntary information should be at least equal to
the costs because companies should create pro�t for their owners (Verrecchia, 2001:
p. 171).
Sustainability or social topics which are also voluntary information can be struc-
tured through the Triple P Bottom Line with pro�t, planet, and people as the basis.
83

4 Sunny with cloudy intervals: The in�uence of social reporting on �rm value
These are the main topics in sustainability reporting, which is also called triple bot-
tom line reporting (Gray, 2006: p. 73). In this article, social report is used as a
synonym for sustainability reports or triple bottom line reporting.
There is a plethora of literature analysing the relationship between corporate
social performance (CSP) and corporate �nancial performance (CFP), as recent lit-
erature reviews and meta-analyses show, e.g. by Orlitzky et al. (2003), Wu (2006),
Beurden and Gössling (2008), Peloza (2009), and Vishwanathan (2010). But little
research has been done on the in�uence of separate voluntary reports such as social
reports on corporate �nancial performance. Furthermore, results from corporate
social performance research can not be transferred �awlessly to the topic of social
reporting, because social performance and social disclosure are not necessarily cor-
related (Ullmann, 1985: p. 543). In addition, Glac (2009: p. 52) asks for further
research on the availability of information and its in�uence on investor behaviour.
This paper contributes to the literature by analysing the in�uence of social reports
on corporate �nancial performance. The �rst contribution is to answer the question
of whether GRI reports are able to increase the companies' �rm value. This helps
companies to identify the importance of social reports and if they should produce
them. This also shows whether information in such reports can be of value for stake-
holders of the company. A positive in�uence of GRI reports on �rm value has been
shown by Schadewitz and Niskala (2010) who analysed all listed Finnish �rms from
2002 to 2005. However, the present paper analyses another period from 2008 to 2010
and enlarges the sample to �rms from all European countries. A second contribution
is to evaluate how the quantity of information in social reports in�uences �rm value.
This gives some evidence a to whether it is only important to disclose a social report
or also to report in a comprehensive manner. In addition, Kolk and Perego (2010:
p. 195) ask for research on how the assurance of social reports is related to �nancial
decisions. Thus, as a third contribution, this study examines whether an audit is
an in�uencing factor on �nancial performance. Assurance can be seen as an action
to increase the reliability of the information. Hence, it either indicates how reliable
the information of the social reports is or how reliable the assurance is. To the best
knowledge of the author, the impact of the assurance of social reports on �rm value
has not been explored empirically so far.
In a meta-analysis, Orlitzky et al. (2003: p. 420) �nd that only eight studies
averaging null �ndings would be needed to bring the average sample size mean
for e�ect sizes down to 0.05 for studies using disclosure measures for CSP and
market-based measures for CFP. Hence, this study also contributes to the literature
of voluntary disclosure in the area of corporate social performance to gain more
reliable results in further meta-analyses.
To answer the research questions, regression analyses are executed to analyse
84

4 Sunny with cloudy intervals: The in�uence of social reporting on �rm value
the relationship between social reporting and �rm value. The sample consists of
the companies of the Dow Jones STOXX 600, which includes �rms from European
countries. Hence, a wide �eld of industries and countries which are not located in
the US is examined. The analysed period is the three years from 2008 to 2010.
The �ndings show that social reports in general have an impact on �rm value. This
in�uence depends on the constellation of information quantity and assurance. Social
reports with much information should not be assured by third parties to increase
the �rm value. However, GRI reports which have less information should be assured
by the Global Reporting Initiative to increase the �rm value. In all cases, assurance
by other third parties is inferior in the examined time frame.
In the next section, some background knowledge in the �eld of voluntary social
disclosure is exposited. Hypotheses are developed out of the existing theories and
results from other studies. Afterwards, the sample and data which are the basis for
the examination of whether social reports contribute to �rm value are presented.
This examination is made stepwise with the report itself, the quantity of given
information in the report, and its kind of assurance. The paper concludes with a
summary and suggestions for further research.
4.2 Background & Theory
4.2.1 Social Reporting
Measuring and reporting the social performance of a company is not a new devel-
opment and Carroll and Beiler (1975: p. 596) identi�ed early landmarks for this
evolution. They found that the identi�cation of social performance has existed at
least since 1940, when Kreps (1940) developed an external evaluation of compa-
nies. The �rst known suggestion for an internal evaluation was presented by Bowen
(1953). The interest in social reports grew rapidly till the early 1970s and disap-
peared by the early 1990s when approximately 90% of the largest companies did not
compile a social report (Marx, 1992: p. 39). Nowadays, this number has increased
again as the report from KPMG (2008) indicates: 79% of the Global Fortune 250
compile a social report. This is perhaps based on the fact that we live in a time when
stakeholders can get a lot of detailed information about companies. This indirectly
forces companies to provide this information with a justi�cation for their actions,
especially for information which otherwise could be biased and hence negatively
interpreted (Hess, 2001: p. 312).
Some organizations have developed standards to assist reporters and readers to
disclose or evaluate non-monetary or voluntary aspects in social reports. Some
examples of such initiatives are the Global Reporting Initiative (GRI), Account-
85

4 Sunny with cloudy intervals: The in�uence of social reporting on �rm value
Ability (AA), SustainAbility (SA), UN Global Compact, CSR Europe, Social In-
vestment Research Analyst Network (SIRAN), Public Environmental Reporting
Initiative (PERI), Global Environmental Management Initiative (GEMI), United
Nations Environment Programme (UNEP), and the World Industry Council for
the Environment (WICE). Examples for standards for sustainability reporting are
the GRI Guidelines and AA1000S, indices for sustainable �rms are the DJSI and
FTSE4GOOD, and norms for sustainable behaviour are the UN Global Compact,
OECD Guidelines, SA 8000, ISO 9000, and ISO 14001 (Perrini, 2005: p. 614).
Without applying a standard, there could be a huge information asymmetry be-
tween managers and stakeholders of a company, because some information would
not be published. If the information still was published, then the content and out-
line of the information would have no speci�cation and could freely be chosen, which
would impede its assessment.
KPMG (2008) analyses the state of social reporting of over 2,200 companies in
22 countries, including the Global Fortune 250 and the 100 largest companies by
revenue in these 22 countries. They remark that the social reports they include
in their analysis can di�er in terminology such as sustainability, corporate social
responsibility, corporate citizenship, and others. Since the last survey in 2005, the
percentage of reporting companies among the Fortune 250 increased dramatically
from 52% to 79% in 2008. A survey of these companies identi�ed �ve main drivers
for reporting: ethical considerations, economic considerations, reputation or brand,
innovation/learning, and employee motivation. 77% of the reporting companies fol-
low the GRI Guidelines to create their reports. A third-party commentary was
given in 56% of the Fortune 250 reports and inclusion of formal assurance state-
ments increased from 2005 to 2008 from 30% to 40%. The three main drivers for
this assurance are improving the quality of the reported information, reinforcing
its credibility to stakeholders, and improving the reporting process. The two most
used assurance standards are International Standards for Assurance (ISAE) 3000
and AA1000AS by AccountAbility.
Kolk (2008) analyses trends of social reporting in a similar way by using the
Fortune Global 250. The reporting of sustainability increased from 35% in 1998
and 45% in 2001 to 64% in 2004 (Kolk, 2008: p. 5). Of these reports, almost one
third were externally assured, but usually no reason for this assurance was given.
Reasons for external audits are increasing the credibility of the report and ensuring
the quality of the internal processes (Kolk, 2008: p. 10).
86

4 Sunny with cloudy intervals: The in�uence of social reporting on �rm value
4.2.2 Hypotheses Development
�Separate reports on aspects of social performance represent a signi�cant investment
in time and money. Thus, it seems reasonable to hypothesise that these will only
be produced by those companies which consider it very important to inform stake-
holders about their performance� (Clarke and Gibson-Sweet, 1999: p. 10). Boesso
and Kumar (2007: p. 290) also �gured out that there is more than one explanation
for disclosing voluntary reports. These reasons are mainly based on the expected
outcomes of the social reports, such as increased competitive advantages, reputa-
tion, legitimacy, decreased capital costs, or lower risk expectations. Thus, voluntary
disclosure can be driven by the information needs of investors beyond �nancial infor-
mation, by stakeholder engagement, and by the management of intangible resources
which could result in crucial competitive advantages.
However, Orlitzky and Whelan (2007: p. 313) also mention costs beside bene�ts
for the reporting organization and for its stakeholders. On the �rm side, legitimacy
for its actions and competitive advantages by signalling its strengths can be achieved.
Social reporting can lower transaction costs which arise for monitoring, collecting,
and preparing the necessary information for some stakeholders, but it can also cause
an information overload. In addition, this information can also be used against the
company's interest by competitors or other stakeholders. Nevertheless, providing
investors more information may decrease their risk and the company can present
itself in a good manner to avoid further regulatory restrictions. Thus, whether it
tries to reduce the information asymmetry or not depends on the company's decision,
which is likely based on a cost-bene�t analysis (Cormier and Magnan, 1999: p. 432).
Before discussing stakeholders and their in�uence on �rm value in general, the
ratio for disclosing social reports for investors which is an important stakeholder
group and also has a large in�uence on �rm value is discussed brie�y. Normally,
investors are not part of the company they invest in. Hence, they judge companies
on the basis of the information about �nancial and non-�nancial aspects which they
can gather from their external view. Because most companies are obliged to disclose
an annual report which includes basically �nancial information of the last �scal year,
investors are informed about economic related events in the last reporting period.
Nevertheless, there could be important information arising in the same time-period
with no immediate e�ect on �nancial statements, but with a �nancial e�ect in the
future. Mostly, managers know these events and could report additional information
in the annual report or through an additional social report. This should lower the
information asymmetry between managers and shareholders and thus the cost of
capital which comes from a lower premium risk (Easley et al., 2002: p. 2219).
Furthermore, there can be an agency problem due to di�ering interests between
87

4 Sunny with cloudy intervals: The in�uence of social reporting on �rm value
the principal and the agent, which means that investors have to trust managers
which in turn could have di�ering interests (Jensen and Meckling, 1976: p. 308).
If managers not only report about �nancial, but also about social facts, they are
more transparent and it is less likely that they would act against the interests of
the investors. Those problems are two main arguments for voluntary disclosure in
capital markets (Healy and Palepu, 2001: p. 407).
In addition, investors take non-�nancial aspects such as ethical, social, or envi-
ronmental responsibility, increasingly into account, because they want to look at
non-�nancial besides �nancial performance (Adams, 2004: p. 732). This can be the
case because they are socially minded or they think that only companies which meet
the relevant stakeholder interests are able to maximise shareholder value in the long
run (Ballou et al., 2006: p. 65). To notice such activities, the company's �nancial
reports are not suitable because they are not laid out or expected to deliver such
information. However, social reports include this information and can help to un-
cover sustainable actions. These reports are possible media for communication with
shareholders, which could have an impact on the volatility of share prices (Hock-
erts and Moir, 2004: p. 86). It has also been shown in an experimental study by
Barreda-Tarrazona et al. (2011: p. 320) that investors prefer socially responsible
companies. However, this does not mean that investors are willing to take lower
returns from such companies (Rosen et al., 1991: p. 231).
Some of these aspects have also been shown in empirical research. E.g., Botosan
(1997) examines the impact of disclosure level on equity costs. She shows that
more voluntary information in annual reports is related with lower equity costs for
companies with low analyst following. For �rms with high analyst following there is
no signi�cant association. Similar results are achieved by Poshakwale and Courtis
(2005) who examine the relationship between voluntary disclosure in annual reports
and equity costs for the banking sector. They have found a positive relationship for
banks in Australia, Europe and North America whereas the in�uence of voluntary
disclosure on equity costs in Europe is higher. In an event study Blacconiere and
Patten (1994) �gure out a less negative market reaction due to a negative event for
companies in the chemical industry which had had more extensive environmental
reporting before this event.
Hockerts and Moir (2004) interviewed investor relations sta� responsible for com-
munication with investors. They found that �corporate responsiblity� and �corporate
sustainability� are used interchangeably by the interviewees and include a social, en-
vironmental, and an economic dimension (Hockerts and Moir, 2004: p. 89). Most of
them say that corporate sustainability can lead to reduced costs, but that it is also
useful to get legitimation to operate. Anyway, there is no totally conclusive the-
oretical or empirical evidence whether or how the relationship between social and
88

4 Sunny with cloudy intervals: The in�uence of social reporting on �rm value
�nancial aspects unfolds (Kolstad, 2007: p. 143). Otherwise, it can be argued that
a company will not have good �nancial performance when it ignores other stake-
holders besides investors (Bird et al., 2007: p. 204), which can be explained with
legitimacy and stakeholder theory.
Legitimacy is important, because a company always operates in a dynamic society
and to ensure its power it has to satisfy not only its own interests but also to show
that the company is needed in the society (Shocker and Sethi, 1973: p. 97). Whether
the social report is appropriate to get this legitimation depends on whether the
company can justify its own actions conclusively or not (Lerner and Tetlock, 1999:
p. 255). Bansal and Clelland (2004) have shown that environmental information
which is able to legitimate a company's actions can lower unsystematic risk on the
stock market. The society which is addressed by legitimacy theory can be interpreted
as a pool of stakeholders and so there is a connection or overlap with the stakeholder
theory (Deegan, 2002: p. 294).
An example for publishing social reports to in�uence stakeholders is the tobacco
industry. While the tobacco industry as well as alcohol, nuclear power, or gam-
bling is excluded from socially responsible funds, tobacco companies such as British
American Tobacco (BAT) produce social reports (Yach et al., 2001: p. 6). In their
reports they do not expose all possible harmful consequences of smoking, because
this would not help them become attractive for stakeholders (Palazzo and Richter,
2005: p. 392). These reports should help to get legitimacy in society so that the
company can avoid further regulations or restrictions in respect to distribution or
marketing activities, but without using the reporting process to change their busi-
ness model (Moerman and van der Laan, 2005: p. 375). With this example and
keeping in mind that the tobacco industry already has gotten liabilities from dif-
ferent states, it can be said that �today's social issue is tomorrow's �nancial issue�
(Williams, 1999: p. 1284) and that is why companies could try to in�uence social
issues in their favour.
Investors are an essential part of stakeholders. Beside employees, NGOs, govern-
ment and customers, they are also seen as one of the target audiences of such social
reports (Spence, 2009: p. 258). Thus, a sole concentration on ethical values does
not conform with the stakeholder theory (Balmer et al., 2007: p. 10). In addition,
companies can learn to understand stakeholders if they deal with social responsibil-
ities in social reports even if those responsibilities are contradictory (Jones, 1980:
p. 65). This learning process also helps companies to improve their actions or at
least their social reporting and it shows stakeholders that they are included in the
decision processes, which leads to a kind of procedural fairness (Jones and Goldberg,
1982: p. 605).
Other stakeholder groups beside investors could also be interested in social re-
89
4 Sunny with cloudy intervals: The in�uence of social reporting on �rm value
ports. For instance, customers often have a choice of buying similar products from
di�erent companies. They look more and more at other aspects such as sustainable
products and processes before their buying decision (Fortes, 2002: p. 84). Thus,
reporting additional information could not only lower the information asymmetry
and in�uence the decisions of investors, but it could also in�uence the behaviour
of other stakeholders having an impact on the value of the company. For example,
Brown and Dacin (1997: p. 80) and Handelman and Arnold (1999: p. 40) show that
social responsibility in�uences the evaluation of companies by consumers. Sen and
Bhattacharya (2001: p. 238) come to similar results and in addition they point out
that consumers are more sensitive to negative information in evaluating companies.
Walmsley and Bond (2003) investigate the association between environmental
reporting and market value, but found no signi�cant relationship. Whether such
reports are included in investment decisions depends on the awareness of investors
and Walmsley and Bond (2003: p. 178) state that the �establishment of the Global
Reporting Initiative has been instrumental in raising awareness�. For companies in
the UK, Murray et al. (2006) also found no relationship between environmental and
social disclosure and �nancial market performance. However, because of the rapidly
changing environment and circumstances of companies and their stakeholders, it
could be the case that social reporting plays or will play a more important role,
perhaps also with other or better norms of reporting. Di�ering results due to social
reporting studies can also depend on the con�icting values of stakeholders which
can cause contradictory research results (Epstein, 1987: p. 104).
Whichever of the possible underlying arguments or theories holds, it should be
useful to disclose social activities by the company to enhance its �nancial perfor-
mance (Holder-Webb et al., 2009: p. 501). Hence, a change in �rm value can not
directly be associated with concrete value changes such as lower costs of equity or
debt capital or higher employee or customer satisfaction. For instance, some com-
panies may increase their �rm value merely by lower equity costs and others by
higher capital costs, but higher expected sales which more than compensate this
e�ect. Social reports also can lead to less uncertainty for investors which appears
in lower risk premiums. These are the basis for discounting the future cash �ow of
a �rm. If the cash �ows are discounted with lower discount rates the net present
value of a �rm is higher. Thus, an increase in �rm value can result from reduced
information asymmetry, but is also induced by reducing the uncertainties of the
other stakeholders (Boesso and Kumar, 2007: p. 270). Hence, it is barely possible
to further disaggregate a �rm value increasing e�ect with regard to the underlying
variety of possible arguments or theories. So it can be proposed:
Hypothesis 1 Disclosing a social report is positively related to �rm value.
90

4 Sunny with cloudy intervals: The in�uence of social reporting on �rm value
Not only the presence of a social report, but also the quantity of disclosed informa-
tion can have an in�uence on the �rm value. Reported �good� behaviour potentially
a�ects the �nancial performance of a company by giving stakeholders information
about a company's social aspects they want to hear (Cetindamar, 2007: p. 164).
Thus, the expected e�ects of social reports can lead to reports which include only or
mostly positive information to cast a positive light on the company (Holder-Webb
et al., 2009: p. 517). One example is given by Deegan and Rankin (1996: p. 59)
who show that companies are very retentive in providing negative environmental
information and prosecuted �rms provide more positive environmental information
than others. Hess and Dunfee (2007: p. 23) say that the costs for disclosing nega-
tive social information increase if stakeholders are intolerant to less responsible �rms.
This also motivates companies to disclose mainly positive information. Furthermore,
without signi�cant search costs, stakeholders cannot identify whether information is
undisclosed because a lot of information is only available inside the company (Hess
and Dunfee, 2007: p. 23).
Companies are also free to report about what they think is able to in�uence
stakeholders in their interest, whereas the information indeed could be true, but not
necessarily e�ective (Laufer, 2003: p. 254). For instance, for voluntary �nancial
disclosure it has been shown that only the adoption announcement of repurchase
plans increases the market value of a company even if the plans were not implemented
and the rate of adopted but not implemented plans increased at the same time
(Zajac and Westphal, 2004: p. 449). This real positive impact on the market value
could also be an incentive for companies to report primarily favourable voluntary
information.
A survey of 1,037 American households in 1994 shows that before they purchase
from a company, 16% observe always or frequently the business practices or ethics
and 50% say they try to avoid socially irresponsible companies (Gildea, 1994: p.
21). In an experimental setting Alniacik et al. (2011: p. 241) also show that
positive corporate social responsibility information in�uences consumers, employees
and investors to the bene�t of the company. Furthermore, Petersen and Vredenburg
(2009: p. 13) �nd that corporate executives as well as institutional investors believe
that social actions are positive for the �rm value.
With that knowledge it would not be astonishing if social reports are used as
advertising instruments by disclosing as much as possible positive social actions of a
�rm. If every �rm acts in this manner it can be assumed that �rms reporting more
also have more positive information and thus a better performance with respect
to these aspects. Thus, companies try to disclose as much as they can to achieve
the bene�ts outlined for hypothesis 1. At the same time companies are cautious
to report few or no negative and mostly positive information which should increase
91

4 Sunny with cloudy intervals: The in�uence of social reporting on �rm value
the �rm value. Al-Tuwaijri et al. (2004) found a signi�cant positive relationship
between good environmental performance and good economic performance while
environmental performance is also associated with higher environmental disclosure.
Furthermore, with higher levels of reported information, a company has to take
a closer look at its stakeholders and has to better know their needs (Reynolds and
Yuthas, 2008: p. 58). This is why companies reporting more should bene�t more
according to stakeholder theory. Shareholders in turn have a more complete and
comprehensive view of the company and they can better judge about the company's
performance. Hence, the following hypothesis can be posed:
Hypothesis 2 Social reports with more information are positively related to �rm
value.
Besides the quantity of given information, its reliability can also in�uence �rm
value. Social reports not only include quantitative measures, but also information
which is not measurable and thus not presentable in numbers, but rather in nar-
rative form. The presentation of qualitative information is not that precise and is
interpretable to a certain degree. Furthermore, as described above, it could be un-
favourable to disclose too much negative information. Hence, it is not to be expected
that a company is willing or able to disclose all information in a true and fair view
and it even can be the intention of a company to mislead the report reader (Gray,
2001: p. 12). This also means that it is very di�cult to verify such information
(Ballou et al., 2006: p. 67).
Thus, it can be assumed that a non-audited social report is less reliable than
an audited social report. Gray (2001: p. 13) states that an assurance is a waste
of money and time if there are no standards and well-trained auditors. But the
assurance of social reports has improved over time, and standards such as the In-
ternational Standard for Assurance Engagements (ISAE3000) and the AA1000AS
(2008) from AccountAbility which are based on the principles of inclusivity, mate-
riality, and responsiveness should help to assure the reliability of social reports.
Coram et al. (2009: p. 147) show in an experiment that assurance of voluntary
non-�nancial information in�uences stock price estimates in a positive way if the
information is also positive, but there is no signi�cant in�uence if the information
is negative. They assume that positive information is less reliable and so there is
a need for assurance. Thus, assurance should have a positive impact on �rm value
because it was concluded that companies try to publish mainly positive information.
Similar results come from Blackwell et al. (1998: p. 68) who show that interest
rates for bank loans are lower when the �nancial statements given to the bank
are voluntarily audited. Furthermore, there is empirical evidence which states that
external auditing in general is able to lower agency costs (Carey et al., 2000: p. 49).
92
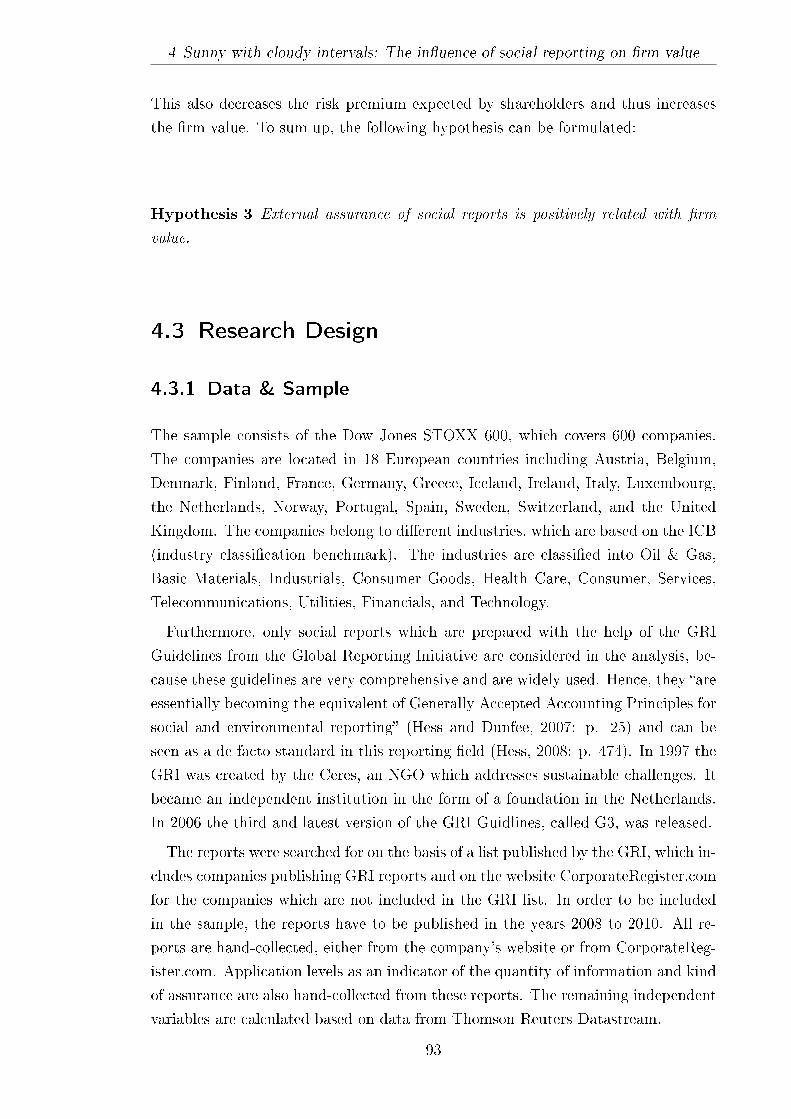
4 Sunny with cloudy intervals: The in�uence of social reporting on �rm value
This also decreases the risk premium expected by shareholders and thus increases
the �rm value. To sum up, the following hypothesis can be formulated:
Hypothesis 3 External assurance of social reports is positively related with �rm
value.
4.3 Research Design
4.3.1 Data & Sample
The sample consists of the Dow Jones STOXX 600, which covers 600 companies.
The companies are located in 18 European countries including Austria, Belgium,
Denmark, Finland, France, Germany, Greece, Iceland, Ireland, Italy, Luxembourg,
the Netherlands, Norway, Portugal, Spain, Sweden, Switzerland, and the United
Kingdom. The companies belong to di�erent industries, which are based on the ICB
(industry classi�cation benchmark). The industries are classi�ed into Oil & Gas,
Basic Materials, Industrials, Consumer Goods, Health Care, Consumer, Services,
Telecommunications, Utilities, Financials, and Technology.
Furthermore, only social reports which are prepared with the help of the GRI
Guidelines from the Global Reporting Initiative are considered in the analysis, be-
cause these guidelines are very comprehensive and are widely used. Hence, they �are
essentially becoming the equivalent of Generally Accepted Accounting Principles for
social and environmental reporting� (Hess and Dunfee, 2007: p. 25) and can be
seen as a de facto standard in this reporting �eld (Hess, 2008: p. 474). In 1997 the
GRI was created by the Ceres, an NGO which addresses sustainable challenges. It
became an independent institution in the form of a foundation in the Netherlands.
In 2006 the third and latest version of the GRI Guidlines, called G3, was released.
The reports were searched for on the basis of a list published by the GRI, which in-
cludes companies publishing GRI reports and on the website CorporateRegister.com
for the companies which are not included in the GRI list. In order to be included
in the sample, the reports have to be published in the years 2008 to 2010. All re-
ports are hand-collected, either from the company's website or from CorporateReg-
ister.com. Application levels as an indicator of the quantity of information and kind
of assurance are also hand-collected from these reports. The remaining independent
variables are calculated based on data from Thomson Reuters Datastream.
93

4 Sunny with cloudy intervals: The in�uence of social reporting on �rm value
4.3.2 Variable Operationalisation
Dependent variable
Company owners in the sample act on �nancial markets and hold shares of the
analysed companies. Financial markets estimate the value of a company on the basis
of the information available. If this information is useful and reliable, they are taking
on less risk and so they need only a smaller risk premium because the estimation
is more precise. Thus, a company which, besides mandatory �nancial information,
provides also useful information in its voluntary social reports, will achieve a higher
value. The best estimator for �rm value is the price of the security if the stock
market is e�cient (Fama, 1970: p. 408). This price is based on expectations about
long-term returns. Thus, possible long-term e�ects which are implied by reported
content should be included in this value. This is why, as in Lo and Sheu (2007: p.
351), the market-based measure Tobin's q is taken as the dependent variable which
should be in�uenced by GRI reporting. The value of a company's social aspects
is not represented by an accounting measure such as return on equity or return on
investment because they do not re�ect the evaluation of the company owner (Wood
and Jones, 1995: p. 258).
Tobin's q considers the price of securities and is de�ned as the market value of a
company's �nancial claims divided by the replacement costs of its assets. Theoreti-
cally, the replacement costs can be calculated as in Lindenberg and Ross (1981: p.
13), but practically most of the data is not available or very di�cult to get. Similar
to Chung and Pruitt (1994: p. 71) in this analysis an approximation of Tobin's q
(Q) is used where Q is the sum of a company's market value of equity (MVE), liq-
uidating value of outstanding preferred stocks (PS) and all liabilities (LIA) divided
by the book value of total assets (TA). As the liquidating value of outstanding pre-
ferred stocks is only available for U.S. companies a proxy for the included European
countries, the stated value of preferred stock, is taken. The market value is the
�rm's share price multiplied by the number of common shares outstanding and LIA
are the total liabilities as book value. Hence, Tobin's q is calculated as:
Q =MVE + PS + LIA
TA(4.1)
This market to book ratio provides the advantage that no risk adjustment or
normalization is required such as with stock returns or accounting measures (Lang
and Stulz, 1994: p. 1249). A Q greater than one indicates that �rm value is higher
than its current asset value, hence a company creates value. A Q less than one
indicates that it is expected that the company is destroying value and it would be
better to sell the current assets (Lee and Tompkins, 1999: p. 20).
94

4 Sunny with cloudy intervals: The in�uence of social reporting on �rm value
Reporting variables
For testing Hypothesis 1, the dummy variable GRI is set equal to one if a �rm
provides a GRI report. GRI only shows whether a company discloses a social
report according to GRI or not and it does not indicate a poor or rich amount of
information in the report. For testing the other hypotheses, the GRI variable is
disaggregated into sub-categories.
The application level of GRI reports is an indicator of the amount of disclosed
information. It consists of three levels: A, B, and C. An application level of C
requires the company to report at least ten performance indicators and a level of B,
20 performance indicators. The company has to report at least on all core indicators
of the GRI guidelines or it has to explain their omission to get an application level
of A. Hence, an application level A indicates the most information and C indicates
less information, but there are also non-declared reports. For this purpose new
dummy variables are introduced for testing Hypothesis 2 which di�erentiate between
application levels and undeclared reports with no application level. A, B, and C
are the application levels and AL_UN is 1 for an undeclared GRI report.
The assurance of a report can be a criterion of the reliability of the information
disclosed. Reports can be non-checked, GRI checked, or checked by another third
party. If a report is checked, it does not necessarily show how good the report is or
whether it meets all the requirements of the GRI guidelines. A report checked by
the GRI only ensures that the application level is correctly applied. The scope of a
third party assured report regularly can be found in the assurance statement. Thus,
for Hypothesis 3, the binary variable GAS describes a report checked by GRI, TAS
describes a third party assured report, and NAS is an indicator for a non-checked
report.
Control variables
The reporting variables stand for the factors of GRI reports that in�uence the de-
pendent variable, Tobin's q, representing the �rm value. To isolate the relationship
between social reports and economic performance, other in�uencing e�ects have to
be eliminated. Thus, as a summary of Morck and Yeung (1991: p. 170), Dowell
et al. (2000: p. 1064), Konar and Cohen (2001: p. 285), King and Lenox (2002: p.
291), Luo and Bhattacharya (2006: p. 7), Wahba (2008: p. 92), Walls et al. (2011:
p. 86) and Schreck (2011: p. 175), who used Tobin's q as dependent variable, con-
trol variables for R&D expenses, return on assets, leverage, risk, multinationality,
size, and industry are used.
R&D creates intangible assets which contribute to a company's market value
(Hall et al., 2005: p. 34). McWilliams and Siegel (2000) have shown for an existing
95

4 Sunny with cloudy intervals: The in�uence of social reporting on �rm value
study which has not included R&D intensity that the found positive relationship
between corporate social performance and corporate �nancial performance becomes
non-signi�cant by adding R&D intensity. Hull and Rothenberg (2008: p. 786)
who examine the relationship between corporate social performance and �nancial
performance also found a signi�cant in�uence of innovation on �nancial performance.
Additionally, Lev and Sougiannis (1999: p. 441) state in general that a higher �rm
value is positively associated with R&D capital. Thus, R&D intensity is included
as a control variable (RD) which is de�ned as R&D expenditures divided by total
assets (Rao et al., 2004: p. 132).
Return on assets (ROA) is introduced as a control variable since the pro�tability of
a company should also in�uence �rm valuation. It indicates how good management
is in utilising the resources of the company e�ciently (Lee et al., 2009: p. 33).
The capital structure which is represented by the �nancial leverage or debt level is
de�ned as long-term debt to total assets (LEV ) (Waddock and Graves, 1997: p.
309). This describes how much power creditors have and how likely an insolvency
of a �rm is. E.g., Jensen and Meckling (1976: p. 306) point out that companies
with a mixed capital structure act di�erently than companies with a sole owner.
Modigliani and Miller (1963: p. 442) state that a company tries to adjust its capital
structure also with the aim of preserving a certain degree of �exibility. The riskiness
of a �rm can be captured with beta (BETA), which describes the systematic market
risk which indicates how much a �rm's stock price depends on general stock market
movements (Fombrun and Shanley, 1990: p. 245). Barry and Brown (1985: p. 408)
argue that companies with equal risk, but di�erent levels of information, can be
valued diversely. BETA considers the risk relatively to the Dow Jones STOXX 600
on a yearly basis.
AlNajjar and Riahi-Belkaoui (1999: p. 35) and Morck and Yeung (1991: p. 167)
found a positive relationship between multinationality and the market value. From
their results they conclude that multinationality supports the internationalisation
theory which means that a higher degree of internationality o�ers a broader market
for a company where it can use its competitive advantages especially its intangible
assets (Morck and Yeung, 1991: p. 165). Thus, the variable for multinationality
(MN) is de�ned as foreign assets divided by total assets (Dowell et al., 2000: p.
1064).
Previous studies have shown an in�uence of �rm size on the market value. Some
argue that large companies have money for innovation investments while others
say that small companies can react quickly to market changes, which is especially
important in the technology sector (Connolly and Hirschey, 2005: p. 217). In this
study the size variable (SIZE) is de�ned as the logarithm to base 10 of total assets
(Dowell et al., 2000: p. 1064).
96

4 Sunny with cloudy intervals: The in�uence of social reporting on �rm value
Industry is taken into account because the competitive circumstances can vary
very strongly between industries. Pro�t margins, for instance, are mostly lower in
trading business than in manufacturing industry. The same applies to other factors,
such as the demand for information by stakeholders, which di�ers between indus-
tries and are not represented by the other control variables such as R&D intensity
(Waddock and Graves, 1997: p. 306). To capture industry speci�c e�ects for each
industry, a dummy variable (IND) is introduced. Similarly, the dummy variables
Y EAR2009 and Y EAR2010 help to di�erentiate between the three years included
in the sample, because of changing macroeconomic e�ects.
4.3.3 Regression Analyses
The basic model tests whether the �rm value di�ers between companies providing
a GRI report or not. Hence, the estimation model is:
Q = β0 + β1GRI + β2RD + β3ROA+ β4LEV + β5BETA+ β6MN
+ β7SIZE +9∑
i=1
β8iINDi + β9Y EAR2009 + β10Y EAR2010(H1)
To determine whether the application level which indicates the detail and volume
of a report and whether external assurance which indicates reliability of reports have
an in�uence on the �rm value, two further models are introduced. Equation (H2)
di�erentiates between the three application levels and undeclared reports. Equa-
tion (H3) di�erentiates between GRI assurance, other third party assurance and no
assurance.
Q = β0 + β1A+ β2B + β3C + β4AL_UN + β5RD + β6ROA+ β7LEV
+ β8BETA+ β9MN + β10SIZE +9∑
i=1
β11iINDi
+ β12Y EAR2009 + β13Y EAR2010
(H2)
Q = β0 + β1GAS + β2TAS + β3NAS + β4RD + β5ROA+ β6LEV
+ β7BETA+ β8MN + β9SIZE +9∑
i=1
β10iINDi
+ β11Y EAR2009 + β12Y EAR2010
(H3)
The analysis is done with an ordinary least squares regression to capture the in�u-
97

4 Sunny with cloudy intervals: The in�uence of social reporting on �rm value
ence of social reports on the �rm value while considering e�ects of control variables.
The �rm value is computed with measures from 31 December of a particular year
and the underlying GRI reports are published before this date, hence there is a
lag which implies that reporting should a�ect the �rm value. The analysis could
also be done with an event study, but this would lead to some event study speci�c
issues such as missing publication dates, the necessity of unanticipated events and
the absence of confounding events which are di�cult to account for (McWilliams
and Siegel, 1997: p. 99).
4.3.4 Descriptive Statistics
Table 4.1 shows that the number of published GRI reports slightly increases over
the three years from 213 to 236 reports (36% to 39% of 600 companies). Most of
them are application level A or B. There are more undeclared reports than reports
with an application level of C. The ratio of reports which have not been checked by
third parties or GRI is between 50% and 61% per year. The amount of non-checked
reports is higher for reports which have an application level of B or C. The assured
reports with an application level of A are more often checked by GRI (35% to 67%)
than by third parties (22% to 32%). Furthermore, the number of assured reports
increases from 2008 to 2009, but it decreases from 2009 to 2010 and this holds for
GRI-checked and for third-party checked reports.
Descriptive statistics for Q and control variables without industry are given in
Table 4.2. R&D intensity is very low and its median and mean are nearly zero. There
are not many R&D intensive companies included in the sample and companies in
Europe which use IFRS standards also have some possibility of not showing all R&D
expenses in their annual reports. The sample is also corrected for data points with
negative LEV and values with MN above 100 which means that these companies
are not included in the analysis. A negative BETA for companies means that the
particular company has a risk which is inverse to that of the market, but nevertheless
it is possible, hence it is not corrected. Minimum and maximum values in comparison
to means and medians show that there are some extreme values within LEV , MN
and ROA, which are considered in the robustness test in Section 4.5.
98

4 Sunny with cloudy intervals: The in�uence of social reporting on �rm value
Table 4.1: GRI reports, application level, assurance
Application levelYear A B C undeclared Total
GRI reports
2010 89 74 34 39 23637.7% 31.4% 14.4% 16.5% 100.0%
2009 81 61 32 57 23135.1% 26.4% 13.9% 24.7% 100.0%
2008 60 60 21 72 21328.2% 28.2% 9.9% 33.8% 100.0%
Third party assured
2010 22 12 4 3824.7% 16.2% 11.8% 16.1%
2009 26 21 5 5232.1% 34.4% 15.6% 22.5%
2008 13 19 2 3421.7% 31.7% 9.5% 16.0%
GRI checked
2010 31 16 7 5434.8% 21.6% 20.6% 22.9%
2009 47 10 6 6358.0% 16.4% 18.8% 27.3%
2008 40 8 6 5466.7% 13.3% 28.6% 25.4%
not checked
2010 36 46 23 39 14440.4% 62.2% 67.6% 100.0% 61.0%
2009 8 30 21 57 1169.9% 49.2% 65.6% 100.0% 50.2%
2008 7 33 13 72 12511.7% 55.0% 61.9% 100.0% 58.7%
Table 4.2: Descriptive Statistics - Overall
YEAR Q RD ROA LEV BETA MN SIZEMin. 2010 0.50 0.00 -74.75 0.01 -0.06 0.00 5.35
2009 0.47 0.00 -52.25 0.00 -0.11 0.00 5.462008 0.47 0.00 -55.89 0.02 -0.78 0.00 5.39
Median 2010 1.25 0.00 5.49 1.72 1.04 17.80 6.892009 1.24 0.00 3.97 1.87 1.07 15.14 6.862008 1.08 0.00 5.60 2.07 1.10 26.59 6.84
Mean 2010 1.60 0.01 6.79 5.20 1.06 27.26 7.052009 1.54 0.01 4.95 5.22 1.14 27.13 7.002008 1.35 0.01 6.13 5.84 1.13 31.04 6.98
Max. 2010 8.17 0.29 46.22 99.83 2.37 100.00 9.302009 8.36 0.41 75.09 197.20 4.62 100.00 9.312008 10.84 0.42 57.81 163.79 3.22 100.00 9.39
SD 2010 0.99 0.03 7.98 10.25 0.42 29.75 0.752009 0.93 0.03 8.42 11.32 0.65 30.45 0.752008 0.88 0.04 9.23 11.69 0.46 29.93 0.77
2010: n = 582, 2009: n = 588, 2008: n = 580Note: The operationalisation of the variables can be found in Section 4.3.2.
99

4 Sunny with cloudy intervals: The in�uence of social reporting on �rm value
4.4 Results
4.4.1 Basic Results
One overall Pearson correlation matrix for all three years is given in Table 4.3,
because it is similar to the yearly correlation matrices. Some companies are not
considered in further analyses because of the above-mentioned corrections or missing
values in the �nancial data which results in a sample of 580 companies in 2008,
588 companies in 2009, and 582 companies in 2010. The highest absolute value of
correlation coe�cients between the independent variables is 0.5 for LEV and SIZE
and thus there seems to be no multicollinearity issue. It can be seen that RD,
ROA, LEV , BETA, and SIZE are signi�cantly associated (p < 0.01) with the
�rm value. However, GRI and its derived measures present no signi�cant in�uence.
The derived measures are not shown in the correlation tables because the results are
very similar to those of GRI. However, they are signi�cantly correlated with GRI
because they are sub-samples of it.
Table 4.3: Correlation Matrix
Q GRI RD ROA LEV BETA MN SIZEQ 1GRI -0.03 1RD 0.23*** -0.03 1ROA 0.53*** -0.03 -0.02 1LEV -0.16*** 0.06** -0.12*** -0.17*** 1BETA -0.25*** 0 -0.14*** -0.23*** 0.22*** 1MN 0.01 0.08*** 0.04* 0.05* -0.06*** 0.1*** 1SIZE -0.43*** 0.37*** -0.21*** -0.3*** 0.5*** 0.22*** -0.02 1n = 1750, *** p < 0.01, ** p < 0.05, * p < 0.1 (two-sided)Note: The operationalisation of the variables can be found in Section 4.3.2.
Table 4.4 presents the results of the regression analysis which shows overall in-
�uences and signi�cances due to GRI and the control variables on the dependent
variable Q. The adjusted R2 for this model is 0.43 which means that the model
explains the dependent variable Q well at a signi�cant level (p < .01). GRI, ROA,
RD and SIZE and the year have the most signi�cant in�uence (p < .01) on Q.
There is also a high signi�cance (p < .01) for LEV , but its in�uence on Q is almost
zero. BETA also has a quite signi�cant (p < .05) negative impact on Q. Only
multinationality and some industry variables have no signi�cant impact on Q. The
variance in�ation factor is always less than or equal to 2.2, except in the industry
variables, where it goes up to 7.24. Often a factor above 10 is considered as an
indicator for multicollinearity and thus it seems that in this model multicollinearity
is no critical matter. Hence, the signi�cant positive in�uence of GRI on Q supports
100

4 Sunny with cloudy intervals: The in�uence of social reporting on �rm value
Hypothesis 1. It is also in line with the results of the study by Schadewitz and
Niskala (2010: p. 104) who identify a positive relation between GRI reporting and
�rm value in Finnish �rms.
Table 4.4: Results of Regression Analysis with GRI report
Coe�cients Estimate Std. Error t value Pr(> |t|)(Intercept) 4.07 0.23 17.46 0.00 ***GRI 0.24 0.04 5.89 0.00 ***ROA 0.05 0.00 21.93 0.00 ***RD 2.95 0.62 4.71 0.00 ***LEV 0.01 0.00 5.10 0.00 ***BETA -0.10 0.04 -2.55 0.01 **MN 0.00 0.00 -0.84 0.40SIZE -0.43 0.03 -13.24 0.00 ***Oil & Gas -0.20 0.12 -1.74 0.08 *Basic Materials -0.12 0.11 -1.10 0.27Industrials -0.12 0.10 -1.23 0.22Consumer Goods -0.06 0.11 -0.54 0.59Health Care 0.36 0.11 3.27 0.00 ***Consumer Services 0.02 0.11 0.18 0.85Telecommunications -0.26 0.14 -1.94 0.05 *Utilities -0.24 0.12 -1.96 0.05 *Financials -0.07 0.11 -0.67 0.50YEAR2009 0.26 0.04 6.18 0.00 ***YEAR2010 0.24 0.04 5.65 0.00 ***Signi�cance: *** p < .01, ** p < .05, * p < .10Multiple R-squared: 0.4404, Adjusted R-squared: 0.4345F -statistic: 74.68 on 18 and 1708 DF, p-value: < 2.2e-16 ***Highest VIF 7.24Note: The operationalisation of the variables can be found in Section4.3.2.
As can be seen in Table 4.5, there is a signi�cant positive in�uence of A (p < .01),
B (p < .01), C (p < .10), and AL_UN (p < .01) on Q. Table 4.6 shows p-
values for a Wald test which tests the equality of these coe�cients. It can be seen
that the coe�cient for B (0.40) is signi�cantly higher than the other coe�cients.
This con�rms a positive in�uence on the �rm value if a GRI report contains much
information. However, the coe�cient for B is higher than for A which means that
an application level of B leads to a higher Q. Thus, Hypothesis 2 can only be
partly supported. There seems to be a point of too much information beyond the
application level B where additional costs for more information are higher than
additional bene�ts from this extra information.
For external assurance, the results are presented in Table 4.7. GRI reports in
general have a signi�cant positive in�uence, because all variables GAS, TAS, and
NAS have positive coe�cients which are all signi�cant (at least with p < .10).
However, as the Wald test in Table 4.8 shows that the coe�cient for TAS (0.13)
101
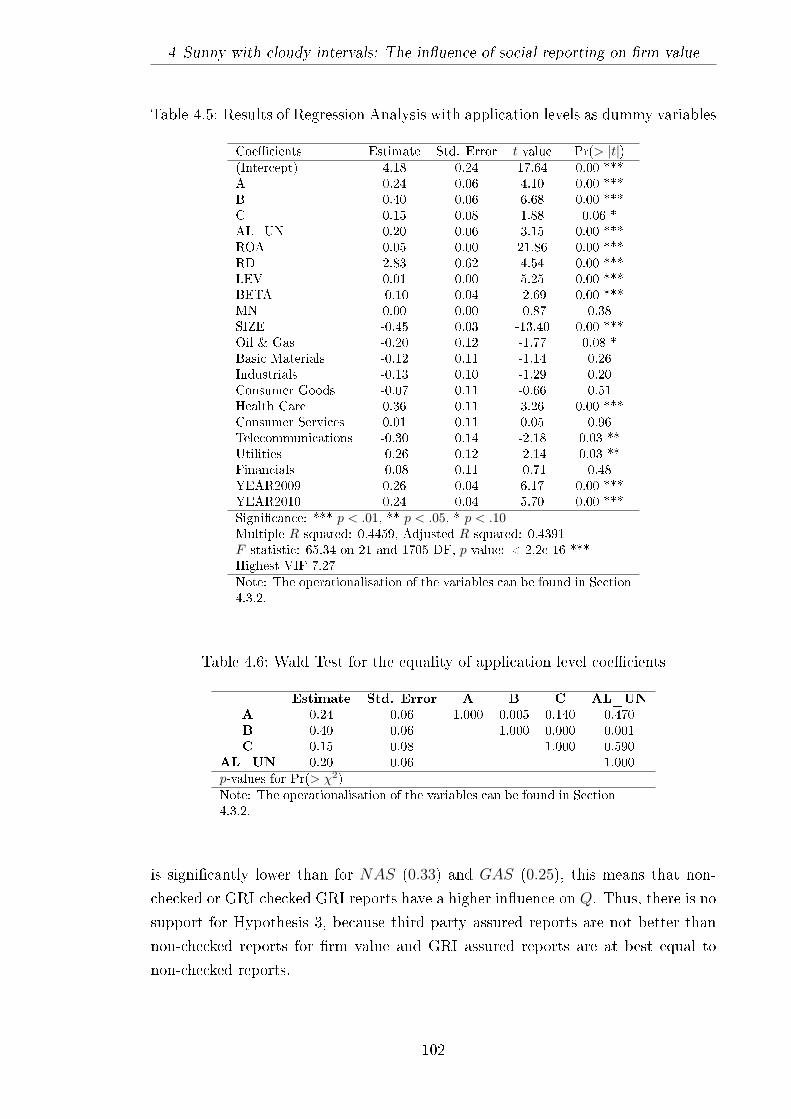
4 Sunny with cloudy intervals: The in�uence of social reporting on �rm value
Table 4.5: Results of Regression Analysis with application levels as dummy variables
Coe�cients Estimate Std. Error t value Pr(> |t|)(Intercept) 4.18 0.24 17.64 0.00 ***A 0.24 0.06 4.10 0.00 ***B 0.40 0.06 6.68 0.00 ***C 0.15 0.08 1.88 0.06 *AL_UN 0.20 0.06 3.15 0.00 ***ROA 0.05 0.00 21.86 0.00 ***RD 2.83 0.62 4.54 0.00 ***LEV 0.01 0.00 5.25 0.00 ***BETA -0.10 0.04 -2.69 0.00 ***MN 0.00 0.00 -0.87 0.38SIZE -0.45 0.03 -13.40 0.00 ***Oil & Gas -0.20 0.12 -1.77 0.08 *Basic Materials -0.12 0.11 -1.14 0.26Industrials -0.13 0.10 -1.29 0.20Consumer Goods -0.07 0.11 -0.66 0.51Health Care 0.36 0.11 3.26 0.00 ***Consumer Services 0.01 0.11 0.05 0.96Telecommunications -0.30 0.14 -2.18 0.03 **Utilities -0.26 0.12 -2.14 0.03 **Financials -0.08 0.11 -0.71 0.48YEAR2009 0.26 0.04 6.17 0.00 ***YEAR2010 0.24 0.04 5.70 0.00 ***Signi�cance: *** p < .01, ** p < .05, * p < .10Multiple R-squared: 0.4459, Adjusted R-squared: 0.4391F -statistic: 65.34 on 21 and 1705 DF, p-value: < 2.2e-16 ***Highest VIF 7.27Note: The operationalisation of the variables can be found in Section4.3.2.
Table 4.6: Wald Test for the equality of application level coe�cients
Estimate Std. Error A B C AL_UNA 0.24 0.06 1.000 0.005 0.140 0.470B 0.40 0.06 1.000 0.000 0.001C 0.15 0.08 1.000 0.590
AL_UN 0.20 0.06 1.000p-values for Pr(> χ2)Note: The operationalisation of the variables can be found in Section4.3.2.
is signi�cantly lower than for NAS (0.33) and GAS (0.25), this means that non-
checked or GRI-checked GRI reports have a higher in�uence on Q. Thus, there is no
support for Hypothesis 3, because third party assured reports are not better than
non-checked reports for �rm value and GRI assured reports are at best equal to
non-checked reports.
102

4 Sunny with cloudy intervals: The in�uence of social reporting on �rm value
Table 4.7: Results of Regression Analysis with external assurance as dummy vari-ables
Coe�cients Estimate Std. Error t value Pr(>|t|)(Intercept) 4.17 0.23 17.79 0.00 ***GAS 0.25 0.06 3.99 0.00 ***TAS 0.13 0.07 1.89 0.06 *NAS 0.33 0.05 6.70 0.00 ***ROA 0.05 0.00 21.82 0.00 ***RD 2.90 0.62 4.65 0.00 ***LEV 0.01 0.00 5.28 0.00 ***BETA -0.10 0.04 -2.59 0.00 ***MN 0.00 0.00 -0.93 0.35SIZE -0.45 0.03 -13.61 0.00 ***Oil & Gas -0.20 0.12 -1.72 0.09 *Basic Materials -0.13 0.11 -1.19 0.24Industrials -0.12 0.10 -1.19 0.23Consumer Goods -0.07 0.11 -0.66 0.51Health Care 0.36 0.11 3.28 0.00 ***Consumer Services 0.02 0.11 0.15 0.88Telecommunications -0.25 0.14 -1.84 0.07 *Utilities -0.25 0.12 -2.03 0.04 **Financials -0.07 0.11 -0.61 0.54YEAR2009 0.26 0.04 6.28 0.00 ***YEAR2010 0.25 0.04 5.83 0.00 ***Signi�cance: *** p < .01, ** p < .05, * p < .10Multiple R-squared: 0.4451, Adjusted R-squared: 0.4386F -statistic: 68.42 on 20 and 1706 DF, p-value: < 2.2e-16 ***Highest VIF 7.27Note: The operationalisation of the variables can be found in Section4.3.2.
Table 4.8: Wald Test for the equality of assurance coe�cients
Estimate Std. Error GAS TAS NASGAS 0.25 0.06 1.000 0.051 0.230TAS 0.13 0.07 1.000 0.003NAS 0.33 0.05 1.000p-values for Pr(> χ2)Note: The operationalisation of the variables can be foundin Section 4.3.2.
4.4.2 Additional Analysis
Tables 4.5 and 4.7 show that there is no unidirectional relationship between �rm
value and application level or assurance. This means a higher application level does
not necessarily provide a higher �rm value. It also cannot be a�rmed that third-
party assured reports are seen as better than GRI checked reports or that the latter
are seen as better than non-checked reports for the �rm value. With this knowledge,
there is a possibility that certain combinations of application level and assurance
103
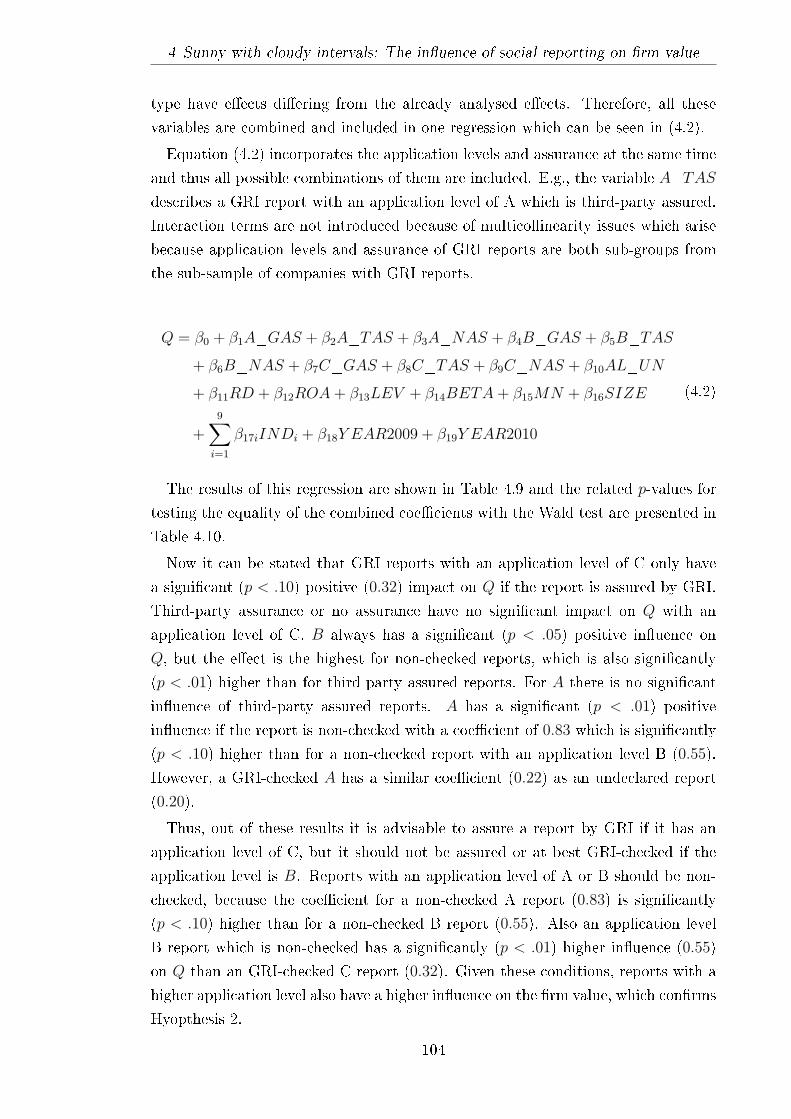
4 Sunny with cloudy intervals: The in�uence of social reporting on �rm value
type have e�ects di�ering from the already analysed e�ects. Therefore, all these
variables are combined and included in one regression which can be seen in (4.2).
Equation (4.2) incorporates the application levels and assurance at the same time
and thus all possible combinations of them are included. E.g., the variable A_TAS
describes a GRI report with an application level of A which is third-party assured.
Interaction terms are not introduced because of multicollinearity issues which arise
because application levels and assurance of GRI reports are both sub-groups from
the sub-sample of companies with GRI reports.
Q = β0 + β1A_GAS + β2A_TAS + β3A_NAS + β4B_GAS + β5B_TAS
+ β6B_NAS + β7C_GAS + β8C_TAS + β9C_NAS + β10AL_UN
+ β11RD + β12ROA+ β13LEV + β14BETA+ β15MN + β16SIZE
+9∑
i=1
β17iINDi + β18Y EAR2009 + β19Y EAR2010
(4.2)
The results of this regression are shown in Table 4.9 and the related p-values for
testing the equality of the combined coe�cients with the Wald test are presented in
Table 4.10.
Now it can be stated that GRI reports with an application level of C only have
a signi�cant (p < .10) positive (0.32) impact on Q if the report is assured by GRI.
Third-party assurance or no assurance have no signi�cant impact on Q with an
application level of C. B always has a signi�cant (p < .05) positive in�uence on
Q, but the e�ect is the highest for non-checked reports, which is also signi�cantly
(p < .01) higher than for third-party assured reports. For A there is no signi�cant
in�uence of third-party assured reports. A has a signi�cant (p < .01) positive
in�uence if the report is non-checked with a coe�cient of 0.83 which is signi�cantly
(p < .10) higher than for a non-checked report with an application level B (0.55).
However, a GRI-checked A has a similar coe�cient (0.22) as an undeclared report
(0.20).
Thus, out of these results it is advisable to assure a report by GRI if it has an
application level of C, but it should not be assured or at best GRI-checked if the
application level is B. Reports with an application level of A or B should be non-
checked, because the coe�cient for a non-checked A report (0.83) is signi�cantly
(p < .10) higher than for a non-checked B report (0.55). Also an application level
B report which is non-checked has a signi�cantly (p < .01) higher in�uence (0.55)
on Q than an GRI-checked C report (0.32). Given these conditions, reports with a
higher application level also have a higher in�uence on the �rm value, which con�rms
Hyopthesis 2.
104

4 Sunny with cloudy intervals: The in�uence of social reporting on �rm value
Table 4.9: Results of Regression Analysis with combined application levels and ex-ternal assurance as dummy variables
Coe�cients Estimate Std. Error t value Pr(> |t|)(Intercept) 4.18 0.24 17.68 0.00 ***A_GAS 0.22 0.07 3.07 0.00 ***A_TAS 0.06 0.09 0.59 0.55A_NAS 0.83 0.15 5.46 0.00 ***B_GAS 0.33 0.14 2.39 0.02 **B_TAS 0.20 0.10 2.05 0.04 **B_NAS 0.55 0.08 6.87 0.00 ***C_GAS 0.32 0.17 1.87 0.06 *C_TAS 0.10 0.20 0.48 0.63C_NAS 0.11 0.10 1.06 0.29AL_UN 0.20 0.06 3.15 0.00 ***ROA 0.05 0.00 21.55 0.00 ***RD 2.69 0.62 4.33 0.00 ***LEV 0.01 0.00 5.33 0.00 ***BETA -0.10 0.04 -2.61 0.00 ***MN 0.00 0.00 -1.18 0.24SIZE -0.45 0.03 -13.51 0.00 ***Oil & Gas -0.16 0.12 -1.38 0.17Basic Materials -0.09 0.11 -0.87 0.38Industrials -0.09 0.10 -0.90 0.37Consumer Goods -0.05 0.11 -0.45 0.66Health Care 0.38 0.11 3.52 0.00 ***Consumer Services 0.02 0.11 0.21 0.83Telecommunications -0.24 0.14 -1.80 0.07 *Utilities -0.23 0.12 -1.91 0.06 *Financials -0.05 0.11 -0.48 0.63YEAR2009 0.26 0.04 6.34 0.00 ***YEAR2010 0.25 0.04 5.90 0.00 ***Signi�cance: *** p < .01, ** p < .05, * p < .10Multiple R-squared: 0.549, Adjusted R-squared: 0.4462F -statistic: 52.52 on 27 and 1699 DF, p-value: < 2.2e-16 ***Highest VIF 7.31Note: The operationalisation of the variables can be found in Section4.3.2.
Surprisingly, in most cases external assurance has no signi�cant in�uence on �rm
value, which also means no negative in�uence. Because of less transparency and
independence in comparison to �nancial auditing Ball et al. (2000: p. 18) argue that
the reporting company has more control over the auditing process and its �ndings for
voluntary disclosed information. Not before independent auditors can ensure that
reports are not only for marketing purposes will an accurate and truthful assessment
of the company's social reports be possible (Hess, 2001: p. 320). Furthermore,
O'Dwyer and Owen (2005: p. 224) point out that assurance statements often are
not addressed to the company's stakeholders, but rather to the management of the
company. This increases the chance that they could be seen as less reliable for
important stakeholders such as shareholders. Hence, the non-existing in�uence of
105
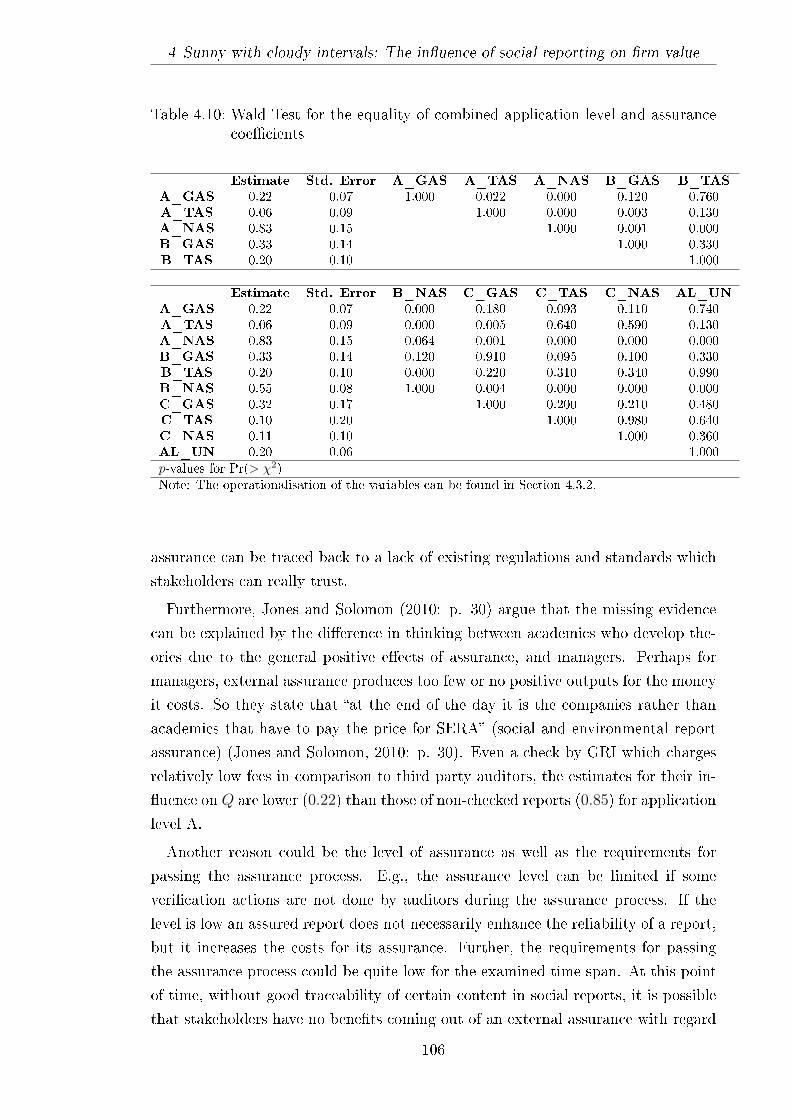
4 Sunny with cloudy intervals: The in�uence of social reporting on �rm value
Table 4.10: Wald Test for the equality of combined application level and assurancecoe�cients
Estimate Std. Error A_GAS A_TAS A_NAS B_GAS B_TASA_GAS 0.22 0.07 1.000 0.022 0.000 0.120 0.760A_TAS 0.06 0.09 1.000 0.000 0.003 0.130A_NAS 0.83 0.15 1.000 0.001 0.000B_GAS 0.33 0.14 1.000 0.330B_TAS 0.20 0.10 1.000
Estimate Std. Error B_NAS C_GAS C_TAS C_NAS AL_UNA_GAS 0.22 0.07 0.000 0.180 0.093 0.110 0.740A_TAS 0.06 0.09 0.000 0.005 0.640 0.590 0.130A_NAS 0.83 0.15 0.064 0.001 0.000 0.000 0.000B_GAS 0.33 0.14 0.120 0.910 0.095 0.100 0.330B_TAS 0.20 0.10 0.000 0.220 0.310 0.340 0.990B_NAS 0.55 0.08 1.000 0.004 0.000 0.000 0.000C_GAS 0.32 0.17 1.000 0.200 0.210 0.480C_TAS 0.10 0.20 1.000 0.980 0.640C_NAS 0.11 0.10 1.000 0.360AL_UN 0.20 0.06 1.000p-values for Pr(> χ2)Note: The operationalisation of the variables can be found in Section 4.3.2.
assurance can be traced back to a lack of existing regulations and standards which
stakeholders can really trust.
Furthermore, Jones and Solomon (2010: p. 30) argue that the missing evidence
can be explained by the di�erence in thinking between academics who develop the-
ories due to the general positive e�ects of assurance, and managers. Perhaps for
managers, external assurance produces too few or no positive outputs for the money
it costs. So they state that �at the end of the day it is the companies rather than
academics that have to pay the price for SERA� (social and environmental report
assurance) (Jones and Solomon, 2010: p. 30). Even a check by GRI which charges
relatively low fees in comparison to third party auditors, the estimates for their in-
�uence on Q are lower (0.22) than those of non-checked reports (0.85) for application
level A.
Another reason could be the level of assurance as well as the requirements for
passing the assurance process. E.g., the assurance level can be limited if some
veri�cation actions are not done by auditors during the assurance process. If the
level is low an assured report does not necessarily enhance the reliability of a report,
but it increases the costs for its assurance. Further, the requirements for passing
the assurance process could be quite low for the examined time span. At this point
of time, without good traceability of certain content in social reports, it is possible
that stakeholders have no bene�ts coming out of an external assurance with regard
106

4 Sunny with cloudy intervals: The in�uence of social reporting on �rm value
to the assured content and so it could have no impact on their decisions (Hess, 2008:
p. 471). This might change in the future. For instance, since 2011 the GRI has
required �rms to include a content index template which helps to identify disclosed
data. Such an index is also very useful for readers of GRI reports and the assurance
of its inclusion and completeness could raise the reliability of GRI reports.
Summing up, support for a positive in�uence of GRI reports on �rm value could
be shown. It also can be assumed that under certain conditions, reports with more
information have a positive in�uence on �rm value. This does not hold for assurance,
neither for third-party nor GRI-checked reports, which seem to have little or no
in�uence on �rm value, but also no negative e�ect. Assurance by GRI is only
recommended for companies who disclose with an application level of C.
4.5 Robustness
The robustness tests are done with an analysis which includes all combinations of
application level and assurance. Hence, they provide evidence on how robust the
results from Table 4.9 are.
In a �rst robustness test extreme values are considered. Thus, data points under
the 1% quantile and above the 99% quantile of LEV , MN and ROA are winsorized
because of their di�ering median and mean values which could be caused by outliers.
This leads to changes in these values for 87 companies. Except for one industry
variable there are no changes in sign or signi�cance of the coe�cients. Also the
relations between the reporting variables remain stable which con�rms the results
from Table 4.9. Additionally, with this correction adjusted R2 increases from 0.45
to 0.50.
Furthermore, a regression with the market-to-book value based on equity is done.
With this the results for reports with application levels of B or C and undeclared
reports become insigni�cant. The results that non-checked reports with an appli-
cation level of A are better do not change. Thus, it can be speculated that equity
owners only value excellent GRI reporting companies higher than others. However,
it could also be possible that equity owners incorporate the liabilities of a company
in their judgement about the importance and value of GRI reports. In this case, the
adjusted R2 also decreases from 0.45 to 0.30, which could be because it represents a
change in the dependent variable with no adjustments in the control variables which
originally were determined for Q.
MN is also rede�ned with foreign sales divided by total sales. In this regression
all results remain stable, but the variable MN itself becomes signi�cant (p < 0.10)
with a very low negative coe�cient (−0.0012). Adjusted R2 remains 0.45. With
employees as size variable, it can be con�rmed that non-checked reports reports
107

4 Sunny with cloudy intervals: The in�uence of social reporting on �rm value
with an application level of A or B have a positive in�uence on �rm value which is
signi�cantly (p < .05) higher for an application level of A. The highest signi�cant
(p < 0.10) in�uence of GRI assured reports is given for reports with an application
level of C, but this coe�cient is not signi�cantly lower than for a non-checked B
report. Undeclared reports do not have a signi�cant in�uence on �rm value in this
case. The signi�cance of the coe�cient for LEV disappears and the signi�cances
in the industry variables also vary slightly. Furthermore, the adjusted R2 decreases
from 0.45 to 0.40.
In addition, country speci�c e�ects are accounted for. For instance, it could
be that countries exist which generally have more third-party assurance of social
reports than others (Chen and Bouvain, 2009: p. 308). If companies in these
countries on average have signi�cantly di�erent �rm values than in other countries,
it could in�uence the results due to assurance. However, the inclusion of country
dummy variables does not change the signi�cance or direction of coe�cients except
for C reports which in this case have no signi�cant in�uence on �rm value even if
they are checked by GRI. Three country variables also have a signi�cant coe�cient.
Adjusted R2 remains 0.45.
Hence, it can be stated that the results are stable with respect to the fact that
non-checked reports with an application level of A are better than assured ones. This
drastic reduction of conclusions is only the case if market-to-book ratio is measured
on the basis of equity or if employees are taken as an alternative to the size variable.
However, the results are very stable if only changes are considered which lead to
an adjusted R2 which equals or exceeds the value of the original regression results
(0.45).
4.6 Conclusion
This paper argues that social reports which are voluntarily prepared and disclosed
by companies have various advantages, but also disadvantages. A social report can
lead to more openness and show important stakeholders that a company tries to
incorporate their interests. First, it is a possibility for companies to present their
good social results which are not included in �nancial statements. Second, in such
reports companies can justify events that are reported in the media and cast a
damning light on the company. Third, social reports are the basis for stakeholders
to evaluate a company with readily available information. But there also can be
disadvantages. For example, if a company reports too much, competitors can use this
information for their own interest or against the company. The same is applicable to
voluntary information which marks a company as a poor performer, which justi�es
the assumption that social reports mainly contain positive information.
108

4 Sunny with cloudy intervals: The in�uence of social reporting on �rm value
Both the advantages and disadvantages should motivate companies to primarily
report information which casts a positive light on the company. If there are no
regulations and standards for external assurance which detect such shortcomings
of presenting information, assurance is not very reliable and people can not fully
trust it. However, companies seem to have more advantages than disadvantages
in disclosing social reports because they do so in a great quantity. In this paper
positive signals of social reports are discovered by looking at companies disclosing
social reports which are prepared with the help of the popular GRI guidelines. With
an analysis of companies in respect to their reporting behaviour this study makes
several contributions to this research �eld.
First, mainly on the basis of legitimacy and stakeholder theory a positive rela-
tionship between social reporting and �rm value is assumed. This relationship can
be shown in the regression analyses. Hence, for reporting companies the bene�ts of
social reports are generally able to outweigh their costs.
Second, it is assumed that �rms which report on more indicators provide investors
more documented information in comparison to companies with less indicators or
no social reports. This lowers the costs for analysing a company and delivers a
more comprehensive picture of the company which helps to better predict its future
returns. In conjunction with the idea that mostly positive information is reported,
companies which report more have more positive actions and outcomes they can
report. This satis�es more stakeholders and according to the stakeholder theory
this leads to an increase of the �rm value. In the current study this hypothesis
could be partly con�rmed, because the analysis shows that the application level
of GRI reports is positively correlated with the �rm value if the reports have an
application level of A or B and are non-checked or GRI assured with an application
level of C.
Third, reports which are externally assured should deliver more trust to their
readers, because external validation should minimize con�icts of interest between
the preparers and the assurer of the report. This study has shown that today's
assurance has no signi�cant impact on the �rm value. This could have two reasons.
On the one hand, the indicators do not come from �nancial data and it could be
more di�cult to trace them back in order to assure them. So the assurance could
be less reliable in itself. On the other hand, there are several standards for auditing
social reports, but none of them is mandatory to be applied, so it can be expected
that the assurance is less reliable than �nancial assurance. Fourth, if despite this
fact, a company wants to assure a report, it should choose GRI assurance, because
those reports increase the �rm value more than third-party assured reports.
Further research should be done with the content of the GRI reports themselves.
If the relationship between social reports and �rm value exists, the impact of the
109

4 Sunny with cloudy intervals: The in�uence of social reporting on �rm value
particular content should be researched in more detail. It would be interesting to
di�erentiate this content to show which reported actions of �rms are able to increase
the �rm value and which not. For instance, it can be expected that in the future
better measures can help to detect companies which report positive information
although they perform poorly (Conley and Williams, 2005: p. 15). Finding spe-
ci�c relationships will enable researchers to contribute to the development of more
speci�c theories in this research �eld. Also the �rm value could be disaggregated
with a relationship to a more speci�cally determined content. This would help, for
example, to understand if environmentally active companies decrease their capital
costs because they seem to be future oriented and less risky or rather have lower
expected energy costs.
The application levels lead to another question which is whether companies report
the application level in accordance with the GRI standard. The declaration of the
application level is done by the company itself and especially without assurance it is
possible that companies report higher levels so that they are rated higher in social
performance ratings or are more likely to be included in sustainability funds. This
in turn can be an in�uencing factor for higher �rm values. Similar, a company with
mainly bad social actions could calculatedly report how good its social performance
is. Hence, research on social reporting which also includes the actual actions of
a �rm would also be very fruitful. Another research topic would be on assurance
statements, which should be examined with respect to the scope and intensity of
assurance to get an overview about the reliability of external assurance. For instance,
51% of the Global Fortune 250 which have an assurance for their social reports obtain
this assurance on a �limited level� in 2008 (KPMG, 2008: p. 66) which shows that
there is some potential to improve these statements. This research could explain
why currently external assurance mostly has no in�uence on �rm value and if there
is potential for better assurance practices.
110

Bibliography
AA1000APS (2008), `AA1000 AccountAbility Principles Standard'.
AA1000AS (2008), `AA1000 Assurance Standard'.
Abbott, W. F. and Monsen, R. J. (1979), `On the measurement of corporate socialresponsibility: Self-reported disclosures as a method of measuring corporate socialinvolvement.', Academy of Management Journal 22(3), 501�515.
Adams, C. A. (2004), `The ethical, social and environmental reporting-performanceportrayal gap.', Accounting, Auditing & Accountability Journal 17(5), 731�757.
Adams, C. A. (2008), `A commentary on: corporate social responsibility reportingand reputation risk management.', Accounting, Auditing & Accountability Journal21(3), 365�370.
Adams, C. A. and Larrinaga-González, C. (2007), `Engaging with organisationsin pursuit of improved sustainability accounting and performance.', Accounting,Auditing & Accountability Journal 20(3), 333�355.
Ader, C. R. (1995), `A longitudinal study of agenda setting for the issue of environ-mental pollution.', Journalism & Mass Communication Quarterly 72(2), 300�311.
Agenda 21 (1992), `United Nations Conference on Environment & Development',Rio de Janerio.
Agle, B. R. and Kelley, P. C. (2001), `Ensuring validity in the measurement of corpo-rate social performance: Lessons from corporate united way and pac campaigns.',Journal of Business Ethics 31(3), 271�284.
Akerlof, G. A. (1970), `The market for "lemons": Quality uncertainty and the marketmechanism.', Quarterly Journal of Economics 84(3), 488�500.
Al-Tuwaijri, S. A., Christensen, T. E. and Hughes, K. E. (2004), `The relationsamong environmental disclosure, environmental performance, and economic per-formance: A simultaneous equations approach', Accounting, Organizations andSociety 29(5-6), 447�471.
Albers, C. and Günther, T. (2010), `Disclose or not disclose: Determinants of socialreporting', Zeitschrift für Planung & Unternehmenssteuerung (Journal of Man-agement Control) 21(4), 323�347.
Allouche, J. and Laroche, P. (2005), `A meta-analytical investigation of the relation-ship between corporate social and �nancial performance', Revue de Gestion desRessources Humaines 57, 18�41.
111

Bibliography
AlNajjar, F. K. and Riahi-Belkaoui, A. (1999), `Multinationality, pro�tability and�rm value.', Managerial Finance 25(12), 31�41.
Alniacik, U., Alniacik, E. and Genc, N. (2011), `How corporate social responsibilityinformation in�uences stakeholders' intentions.', Corporate Social Responsibility& Environmental Management 18(4), 234�245.
Amir, E. and Lev, B. (1996), `Value-relevance of non�nancial information: Thewireless communications industry.', Journal of Accounting and Economics 22(1-3), 3�30.
Arlow, P. and Cannon, M. J. (1982), `Social responsiveness, corporate structure,and economic performance.', Academy of Management Review 7(2), 235�241.
Artiach, T., Lee, D., Nelson, D. and Walker, J. (2010), `The determinants of corpo-rate sustainability performance.', Accounting & Finance 50(1), 31�51.
Ashforth, B. E. and Gibbs, B. W. (1990), `The double-edge of organizational legiti-mation.', Organization Science 1(2), 177�194.
Atkinson, A. A., Waterhouse, J. H. and Wells, R. B. (1997), `A stakeholder approachto strategic performance measurement.', Sloan Management Review 38(3), 25�37.
Aupperle, K. E., Carroll, A. B. and Hat�eld, J. D. (1985), `An empirical examina-tion of the relationship between corporate social responsibility and pro�tability',Academy of Management Journal 28(2), 446�463.
Baginski, S. P., Hassell, J. M. and Kimbrough, M. D. (2002), `The e�ect of legal en-vironment on voluntary disclosure: Evidence from management earnings forecastsissued in u.s. and canadian markets.', Accounting Review 77(1), 25�50.
Ball, A., Owen, D. L. and Gray, R. (2000), `External transparency or internal cap-ture? The role of third-party statements in adding value to corporate environ-mental reports', Business Strategy & the Environment 9(1), 1�23.
Ballou, B., Heitger, D. L. and Landes, C. E. (2006), `The future of corporate sus-tainability reporting.', Journal of Accountancy 202(6), 65�74.
Balmer, J., Fukukawa, K. and Gray, E. (2007), `The nature and management ofethical corporate identity: A commentary on corporate identity, corporate socialresponsibility and ethics.', Journal of Business Ethics 76(1), 7�15.
Bansal, P. and Clelland, I. (2004), `Talking trash: Legitimacy, impression manage-ment, and unsystematic risk in the context of the natural environment.', Academyof Management Journal 47(1), 93�103.
Barnett, M. L. (2007), `Stakeholder in�uence capacity and the variability of �nan-cial returns to corporate social responsibility', Academy of Management Review32(3), 794�816.
Barreda-Tarrazona, I., Matallín-Sáez, J. and Balaguer-Franch, M. (2011), `Mea-suring investors' socially responsible preferences in mutual funds.', Journal ofBusiness Ethics 103(2), 305�330.
112

Bibliography
Barry, C. B. and Brown, S. J. (1985), `Di�erential information and security marketequilibrium.', Journal of Financial & Quantitative Analysis 20(4), 407�422.
Barth, M. E. and Hutton, A. P. (2004), `Analyst earnings forecast revisions and thepricing of accruals.', Review of Accounting Studies 9(1), 59�96.
Bebbington, J., Gray, R. and Larrinaga, C. (2000), `Editorial: environmental andsocial accounting in europe.', European Accounting Review 1, 3�6.
Bebbington, J., Larrinaga, C. and Moneva, J. M. (2008), `Corporate social reportingand reputation risk management.', Accounting, Auditing & Accountability Journal21(3), 337�361.
Bebbington, J., Larrinaga-González, C. and Moneva-Abadía, J. M. (2008), `Legiti-mating reputation/the reputation of legitimacy theory.', Accounting, Auditing &Accountability Journal 21(3), 371�374.
Berman, S. L., Wicks, A. C., Kotha, S. and Jones, T. M. (1999), `Does stakeholderorientation matter? the relationship between stakeholder management models and�rm �nancial performance.', Academy of Management Journal 42(5), 488�506.
Beurden, P. and Gössling, T. (2008), `The Worth of Values � A Literature Reviewon the Relation Between Corporate Social and Financial Performance.', Journalof Business Ethics 82(2), 407�424.
Beyer, A., Cohen, D. A., Lys, T. Z. and Walther, B. R. (2010), `The �nancialreporting environment: Review of the recent literature.', Journal of Accounting& Economics 50(2/3), 296�343.
Bird, R., D. Hall, A., Momentè, F. and Reggiani, F. (2007), `What corporate socialresponsibility activities are valued by the market?.', Journal of Business Ethics76(2), 189�206.
Blacconiere, W. G. and Patten, D. M. (1994), `Environmental disclosures, regu-latory costs, and changes in �rm value', Journal of Accounting and Economics18(3), 357�377.
Blackwell, D. W., Noland, T. R. and Winters, D. B. (1998), `The value of au-ditor assurance: Evidence from loan pricing.', Journal of Accounting Research36(1), 57�70.
Boesso, G. and Kumar, K. (2007), `Drivers of corporate voluntary disclosure: Aframework and empirical evidence from Italy and the United States', Accounting,Auditing & Accountability Journal 20(2), 269�296.
Botosan, C. A. (1997), `Disclosure level and the cost of equity capital.', AccountingReview 72(3), 323�349.
Botosan, C. A. (2006), `Disclosure and the cost of capital: what do we know?',Accounting & Business Research 36, 31�40.
Bowen, F. E. (2000), `Environmental visibility: a trigger of green organizationalresponse?', Business Strategy & the Environment 9(2), 92�107.
113
Bibliography
Bowen, H. R. (1953), Social Responsibilities of the Businessman, Harper, New York.
Bowman, E. H. and Haire, M. (1975), `A strategic posture toward corporate socialresponsibility.', California Management Review 18(2), 49�58.
Bowman, E. H. and Haire, M. (1976), `Social impact disclosure and corporate annualreports', Accounting, Organizations and Society 1(1), 11�21.
Boyd, B. K., Gove, S. and Hitt, M. A. (2005), `Construct measurement in strate-gic management research: Illusion or reality?', Strategic Management Journal26, 239�257.
Boyle, E. J., Higgins, M. M. and Rhee, G. S. (1997), `Stock market reaction to ethicalinitiatives of defense contractors: Theory and evidence', Critical Perspectives onAccounting 8(6), 541�561.
Brammer, S., Brooks, C. and Pavelin, S. (2006), `Corporate social performance andstock returns: Uk evidence from disaggregate measures.', Financial Management35(3), 97�116.
Brammer, S. and Millington, A. (2008), `Does it pay to be di�erent? an analysisof the relationship between corporate social and �nancial performance.', StrategicManagement Journal 29(12), 1325�1343.
Brammer, S. and Pavelin, S. (2006), `Voluntary environmental disclosures by largeuk companies.', Journal of Business Finance & Accounting 33(7/8), 1168�1188.
Branco, M. C. and Rodrigues, L. L. (2007), `Issues in corporate social and envi-ronmental reporting research: An overview.', Issues in Social & EnvironmentalAccounting 1(1), 72�90.
Brown, B. and Perry, S. (1994), `Removing the �nancial performance halofrom fortune's "most admired" companies.', Academy of Management Journal37(5), 1347�1359.
Brown, B. and Perry, S. (1995), `Halo-removed residuals of fortune's "responsibil-ity to the community and environment"�a decade of data', Business & Society34, 199�215.
Brown, N. and Deegan, C. (1998), `The public disclosure of environmental perfor-mance information � a dual test of media agenda setting theory and legitimacytheory.', Accounting & Business Research 29(1), 21�41.
Brown, T. J. and Dacin, P. A. (1997), `The company and the product: Corporateassociations and consumer product responses.', Journal of Marketing 61(1), 68�84.
Brundtland Report (1987), `Our common future'.
Bushman, R. M. and Piotroski, J. D. (2006), `Financial reporting incentives forconservative accounting: The in�uence of legal and political institutions', Journalof Accounting and Economics 42(1-2), 107�148.
114
Bibliography
Bushman, R. M., Piotroski, J. D. and Smith, A. J. (2004), `What determines cor-porate transparency?', Journal of Accounting Research 42(2), 207�252.
Campbell, D. T. and Fiske, D. W. (1959), `Convergent and discriminant validationby the multitrait-multimethod matrix.', Psychological Bulletin 56(2), 81�105.
Capon, N., Farley, J. U. and Hoenig, S. (1990), `Determinants of �nancial perfor-mance: A meta-analysis.', Management Science 36(10), 1143�1159.
Carey, P., Simnett, R. and Tanewski, G. (2000), `Voluntary demand for internal andexternal auditing by family businesses.', Auditing 19(1), 37�51.
Carroll, A. B. (1979), `A three-dimensional conceptual model of corporate perfor-mance.', Academy of Management Review 4(4), 497�505.
Carroll, A. B. (1991), `The pyramid of corporate social responsibility: Toward themoral management of organizational stakeholders.', Business Horizons 34(4), 39�48.
Carroll, A. B. (2000), `A commentary and an overview of key questions on corporatesocial performance measurement.', Business & Society 39(4), 466�478.
Carroll, A. B. and Beiler, G. W. (1975), `Landmarks in the evolution of the socialaudit.', Academy of Management Journal 18(3), 589�599.
Cetindamar, D. (2007), `Corporate Social Responsibility Practices and Environmen-tally Responsible Behavior: The Case of The United Nations Global Compact.',Journal of Business Ethics 76(2), 163�176.
Chatterji, A. K., Levine, D. I. and To�el, M. W. (2009), `How well do social rat-ings actually measure corporate social responsibility?', Journal of Economics &Management Strategy 18(1), 125�169.
Chen, J. and Roberts, R. (2010), `Toward a More Coherent Understanding of theOrganization-Society Relationship: A Theoretical Consideration for Social andEnvironmental Accounting Research.', Journal of Business Ethics 97(4), 651�665.
Chen, S. and Bouvain, P. (2009), `Is Corporate Responsibility Converging? A Com-parison of Corporate Responsibility Reporting in the USA, UK, Australia, andGermany.', Journal of Business Ethics 87, 299�317.
Chung, K. H. and Pruitt, S. W. (1994), `A Simple Approximation of Tobin's q.',FM: The Journal of the Financial Management Association 23(3), 70�74.
Clarke, J. and Gibson-Sweet, M. (1999), `The use of corporate social disclosures inthe management of reputation and legitimacy: a cross sectoral analysis of UKTop 100 Companies.', Business Ethics: A European Review 8(1), 5�13.
Clarkson, M. E. (1995), `A stakeholder framework for analyzing and evaluatingcorporate social performance.', Academy of Management Review 20(1), 92�117.
Clinch, G. and Verrecchia, R. E. (1997), `Competitive disadvantage and discre-tionary disclosure in industries.', Australian Journal of Management 22(2), 125�137.
115
Bibliography
Collison, D., Cobb, G., Power, D. and Stevenson, L. (2009), `FTSE4Good: exploringits implications for corporate conduct', Accounting, Auditing & AccountabilityJournal 22(1), 35�58.
Collison, D. J., Cobb, G., Power, D. M. and Stevenson, L. A. (2008), `The �nan-cial performance of the FTSE4Good indices.', Corporate Social Responsibility &Environmental Management 15(1), 14�28.
Conley, J. M. and Williams, C. A. (2005), `Engage, embed, and embellish: The-ory versus practice in the corporate social responsibility movement.', Journal ofCorporation Law 31(1), 1�38.
Connolly, R. A. and Hirschey, M. (2005), `Firm size and the e�ect of R&D on Tobin'sq.', R&D Management 35(2), 217�223.
Coram, P. J., Monroe, G. S. and Woodli�, D. R. (2009), `The value of assur-ance on voluntary non�nancial disclosure: An experimental evaluation.', Auditing28(1), 137�151.
Cormier, D. and Gordon, I. M. (2001), `An examination of social and environmentalreporting strategies.', Accounting, Auditing & Accountability Journal 14(5), 587�616.
Cormier, D. and Magnan, M. (1999), `Corporate environmental disclosure strategies:Determinants, costs and bene�ts.', Journal of Accounting, Auditing & Finance14(4), 429�451.
Cormier, D. and Magnan, M. (2003), `Environmental reporting management: acontinental european perspective.', Journal of Accounting and Public Policy22(1), 43�62.
Cormier, D., Magnan, M. and Van Velthoven, B. (2005), `Environmental disclo-sure quality in large german companies: Economic incentives, public pressures orinstitutional conditions?', European Accounting Review 14(1), 3�39.
Costner, H. L. (1969), `Theory, deduction, and rules of correspondence.', The Amer-ican Journal of Sociology 75(2), 245�263.
Craighead, A. J. and Hartwick, J. (1998), `The e�ect of CEO disclosure beliefs on thevolume of disclosure about corporate earnings and strategy.', Behavioral Researchin Accounting 10, 240�262.
Darrough, M. N. and Stoughton, N. M. (1990), `Financial disclosure policy in anentry game.', Journal of Accounting and Economics 12(1-3), 219�243.
De Bakker, F. G. A., Groenewegen, P. and Den Hond, F. (2005), `A bibliometricanalysis of 30 years of research and theory on corporate social responsibility andcorporate social performance.', Business & Society 44(3), 283�317.
De Bakker, F. G. A., Groenewegen, P. and den Hond, F. (2006), `A research note onthe use of bibliometrics to review the corporate social responsibility and corporatesocial performance literature.', Business & Society 45(1), 7�19.
116
Bibliography
Deegan, C. (2000), `Firms' disclosure reactions to major social incidents: Australianevidence.', Accounting Forum 24(1), 101�130.
Deegan, C. (2002), `The legitimising e�ect of social and environmental disclo-sures � a theoretical foundation', Accounting, Auditing & Accountability Journal15(3), 282�311.
Deegan, C. and Rankin, M. (1996), `Do Australian companies report environmentalnews objectively? An analysis of environmental disclosures by �rms prosecutedsuccessfully by the Environmental Protection Authority', Equality Diversity andInclusion: An International Journal 9(2), 50�67.
Diamond, D. W. (1985), `Optimal release of information by �rms.', Journal of Fi-nance 40(4), 1071 � 1094.
DiMaggio, P. J. and Powell, W. W. (1983), `The iron cage revisited: Institutionalisomorphism and collective rationality in organizational �elds.', American Socio-logical Review 48(2), 147�160.
Donaldson, T. and Preston, L. E. (1995), `The stakeholder theory of the corpo-ration: Concepts, evidence, and implications', Academy of Management Review20(1), 65�91.
Dowell, G., Hart, S. and Yeung, B. (2000), `Do corporate global environmentalstandards create or destroy market value?', Management Science 46(8), 1059�1074.
Dunfee, T. W. (2003), `Social investing: Mainstream or backwater?', Journal ofBusiness Ethics 43(3), 247�252.
Durden, C. (2008), `Towards a socially responsible management control system.',Accounting, Auditing & Accountability Journal 21(5), 671�694.
Durnev, A. and Kim, E. H. (2005), `To steal or not to steal: Firm attributes, legalenvironment, and valuation.', Journal of Finance 60(3), 1461�1493.
Easley, D., Hvidkjaer, S. and O'Hara, M. (2002), `Is information risk a determinantof asset returns?.', Journal of Finance 57(5), 2185�2221.
Edwards, J. R. (2003), Construct validation in organizational behavior research, inJ. Greenberg, ed., `Organizational behavior: the state of the science', LawrenceErlbaum Assoc Inc, pp. 327�371.
Entine, J. (2003), `The myth of social investing', Organization & Environment16(3), 352�368.
Epstein, E. M. (1987), `The corporate social policy process: Beyond business ethics,corporate social responsibility, and corporate social responsiveness.', CaliforniaManagement Review 29(3), 99�114.
European Commission (2001), `Promoting a European framework for corporate so-cial responsibility'. Green Paper.
117
Bibliography
Fama, E. F. (1970), `E�cient capital markets: A review of theory and empiricalwork.', Journal of Finance 25(2), 383�417.
Fauzi, H. and Rahman, A. A. (2008), `The role of control system in increasingcorporate social performance: The use of levers of control.', Issues in Social &Environmental Accounting 2(1), 131�144.
Fombrun, C. and Shanley, M. (1990), `What's in a name? reputation building andcorporate strategy.', Academy of Management Journal 33(2), 233�258.
Fortes, H. (2002), `The need for environmental reporting by companies.', GreenerManagement International 40, 77�92.
Francis, J., Hanna, J. D. and Philbrick, D. R. (1997), `Management communicationswith securities analysts.', Journal of Accounting and Economics 24(3), 363�394.
Francis, J., Nanda, D. and Olsson, P. (2008), `Voluntary disclosure, earnings quality,and cost of capital.', Journal of Accounting Research 46(1), 53�99.
Francis, J. R., Khurana, I. K. and Pereira, R. (2005), `Disclosure incentives ande�ects on cost of capital around the world.', Accounting Review 80(4), 1125�1162.
Freeman, R. E. (1984), Strategic Management: A stakeholder approach, Pitman.
Freeman, R. E., Wicks, A. C. and Parmar, B. (2004), `Stakeholder theory and �thecorporate objective revisited�.', Organization Science 15(3), 364�369.
Frooman, J. (1997), `Socially irresponsible and illegal behavior and shareholderwealth', Business & Society 36(3), 221�249.
Frost, C. A. (1997), `Disclosure Policy Choices of UK Firms Receiving Modi�edAudit Reports.', Journal of Accounting and Economics 23(2), 163�187.
Funk, K. (2003), `Sustainability and performance.', MIT Sloan Management Review44(2), 65�70.
Galbreath, J. (2010), `Drivers of corporate social responsibility: the role of formalstrategic planning and �rm culture.', British Journal of Management 21(2), 511�525.
Garriga, E. and Melé, D. (2004), `Corporate social responsibility theories: Mappingthe territory', Journal of Business Ethics 53(1), 51�71.
Gerde, V. W. and Wokutch, R. E. (1998), `25 years and going strong: A contentanalysis of the �rst 25 years of the social issues in management division proceed-ings.', Business & Society 37(4), 414�446.
Gibbins, M., Richardson, A. and Waterhouse, J. (1990), `The management of corpo-rate �nancial disclosure: Opportunism, ritualism, policies, and processes.', Jour-nal of Accounting Research 28(1), 121�143.
Gildea, R. L. (1994), `Consumer survey con�rms corporate social action a�ects buy-ing decisions.', Public Relations Quarterly 39(4), 20�21.
118
Bibliography
Gilson, S., Healy, P., Noe, C. and Palepu, K. (2001), `Analyst specialization andconglomerate stock breakups.', Journal of Accounting Research 39(3), 565 �582.
Glac, K. (2009), `Understanding socially responsible investing: The e�ect of decisionframes and trade-o� options.', Journal of Business Ethics 87(Supplement 1), 41�55.
Gray, R. (2001), `Thirty years of social accounting, reporting and auditing: what (ifanything) have we learnt?.', Business Ethics: A European Review 10(1), 9�15.
Gray, R. (2006), `Does sustainability reporting improve corporate behaviour?:Wrong question? Right time?', Accounting & Business Research 36, 65�88.
Gray, R., Javad, M., Power, D. and Sinclair, C. (2001), `Social and environmentaldisclosure and corporate characteristics: A research note and extension.', Journalof Business Finance & Accounting 28(3-4), 327�356.
Gray, R., Kouhy, R. and Lavers, S. (1995), `Corporate social and environmentalreporting: a review of the literature and a longitudinal study of UK disclosure',Accounting, Auditing & Accountability Journal 8(2), 47�77.
Greene, W. H. (2003), Econometric Analysis, Pearson Education International, Up-per Saddle River.
GRI (2006), `Sustainability reporting guidelines'. version 3.0,http://www.globalreporting.org/ReportingFramework/ReportingFrameworkDownloads/.
Gri�n, J. J. (2000), `Corporate social performance: Research directions for the 21stcentury.', Business & Society 39(4), 479�491.
Gri�n, J. J. and Mahon, J. F. (1997), `The corporate social performance and cor-porate �nancial performance debate.', Business & Society 36(1), 5�31.
Groth-Marnat, G. (2009), Handbook of psychological assessment, 5 edn, John Wileyand Sons.
Guthrie, J., R. Petty, K. Y. and Ricceri, F. (2004), `Using content analysis as a re-search method to inquire into intellectual capital reporting', Journal of IntellectualCapital 5(2), 282�293.
Hackston, D. and Milne, M. J. (1996), `Some determinants of social and environmen-tal disclosures in New Zealand companies', Accounting, Auditing & AccountabilityJournal 9(1), 77�108.
Hall, B. H., Ja�e, A. and Trajtenberg, M. (2005), `Market value and patent cita-tions.', RAND Journal of Economics 36(1), 16�38.
Halme, M. and Laurila, J. (2009), `Philanthropy, integration or innovation? explor-ing the �nancial and societal outcomes of di�erent types of corporate responsibil-ity.', Journal of Business Ethics 84(3), 325�339.
119

Bibliography
Handelman, J. M. and Arnold, S. J. (1999), `The role of marketing actions with asocial dimension: Appeals to the institutional environment.', Journal of Marketing63(3), 33�48.
Harrison, J. S. and Freeman, R. E. (1999), `Stakeholders, social responsibility, andperformance: Empirical evidence and theoretical perspectives.', Academy of Man-agement Journal 42(5), 479�485.
Hart, S. L. and Milstein, M. B. (2003), `Creating sustainable value.', Academy ofManagement Executive 17(2), 56�67.
Harzing, A.-W. (2011), `Journal quality list'. Fortieth Edition.
Heal, G. (2005), `Corporate social responsibility: An economic and �nancial frame-work', The Geneva Papers on Risk and Insurance - Issues and Practice 30(3), 387�409.
Healy, P. M., Hutton, A. P. and Palepu, K. G. (1999), `Stock performance and inter-mediation changes surrounding sustained increases in disclosure.', ContemporaryAccounting Research 16(3), 485�520.
Healy, P. M. and Palepu, K. G. (2001), `Information asymmetry, corporate disclo-sure, and the capital markets: A review of the empirical disclosure literature.',Journal of Accounting & Economics 31(1-3), 405�440.
Herremans, I. M., Akathaporn, P. and McInnes, M. (1993), `An investigation ofcorporate social responsibility and economic performance.', Accounting, Organi-zations & Society 18(7/8), 587�604.
Hess, D. (2001), `Regulating corporate social performance: A new look at socialaccounting, auditing, and reporting.', Business Ethics Quarterly 11(2), 307�330.
Hess, D. (2008), `The three pillars of corporate social reporting as new governanceregulation: Disclosure, dialogue, and development.', Business Ethics Quarterly18(4), 447�482.
Hess, D. and Dunfee, T. W. (2007), `The Kasky-Nike threat to corporate socialreporting.', Business Ethics Quarterly 17(1), 5�32.
Hillman, A. (2009), `Resource dependence theory: A review.', Journal of Manage-ment 35(6), 1404�1427.
Ho, L.-C. J. and Taylor, M. E. (2007), `An empirical analysis of triple bottom-linereporting and its determinants: Evidence from the United States and Japan.',Journal of International Financial Management and Accounting 18(2), 123�150.
Hockerts, K. and Moir, L. (2004), `Communicating corporate responsibility to in-vestors: The changing role of the investor relations function.', Journal of BusinessEthics 52(1), 85�98.
Holder-Webb, L., Cohen, J., Nath, L. and Wood, D. (2009), `The Supply of Corpo-rate Social Responsibility Disclosures Among U.S. Firms.', Journal of BusinessEthics 84(4), 497�527.
120
Bibliography
Hughes II, K. E. (2000), `The value relevance of non�nancial measures of air pollu-tion in the electric utility industry.', Accounting Review 75(2), 209.
Hull, C. E. and Rothenberg, S. (2008), `Firm performance: the interactions of cor-porate social performance with innovation and industry di�erentiation', StrategicManagement Journal 29(7), 781�789.
Huse, M. and Eide, D. (1996), `Stakeholder management and the avoidance of cor-porate control.', Business & Society 35(2), 211�243.
Husted, B. W. and De Jesus Salazar, J. (2006), `Taking friedman seriously: Maximiz-ing pro�ts and social performance.', Journal of Management Studies 43(1), 75�91.
ISAE 3000 (2003), `International standard on assurance engagements'.
Jackson, C. and Bundgard, T. (2002), `Achieving quality in social reporting: therole of surveys in stakeholder consultation.', Business Ethics: A European Review11(3), 253�259.
Jaggi, B. and Pek Yee, L. (2000), `Impact of culture, market forces and legal systemon �nancial disclosures.', International Journal of Accounting 35(4), 495�519.
Jahnke, A., Knauer, T. and Wömpener, A. (2009), `Umweltorientierte Un-ternehmensführung - hehre Zielsetzung ohne Rechenschaft?', Zeitschrift fürUmweltpolitik und Umweltrecht 32(1), 67�91.
Jamali, D. and Mirshak, R. (2007), `Corporate social responsibility (csr): The-ory and practice in a developing country context.', Journal of Business Ethics72(3), 243�262.
Jawahar, I. M. and Mclaughlin, G. L. (2001), `Toward a descriptive stakeholdertheory: An organizational life cycle approach.', Academy of Management Review26(3), 397�414.
Jensen, M. C. (2002), `Value maximization, stakeholder theory, and the corporateobjective function.', Business Ethics Quarterly 12(2), 235�256.
Jensen, M. C. and Meckling, W. H. (1976), `Theory of the �rm: Managerial behavior,agency costs and ownership structure.', Journal of Financial Economics 3(4), 305�360.
Jonas, G. A. and Jones III, A. (2010), Corporate social responsibility reporting:Examining a political cost theory using company attributes. 2010 American Ac-counting Association Annual Meeting and Conference on Teaching and Learningin Accounting.
Jones, M. J. and Solomon, J. F. (2010), `Social and environmental report assurance:Some interview evidence.', Accounting Forum 34(1), 20�31.
Jones, T. M. (1980), `Corporate social responsibility revisited, rede�ned.', CaliforniaManagement Review 22(3), 59�67.
Jones, T. M. (1995), `Instrumental stakeholder theory: A synthesis of ethics andeconomics', Academy of Management Review 20(2), 404�437.
121

Bibliography
Jones, T. M. and Goldberg, L. D. (1982), `Governing the large corporation: Morearguments for public directors.', Academy of Management Review 7(4), 603�611.
Kerlinger, F. N. and Lee, H. B. (2000), Foundations of Behavioral Research: Edu-cational, Psychological and Sociological Enquiry, 4 edn, Wadsworth.
King, A. and Lenox, M. (2002), `Exploring the locus of pro�table pollution reduc-tion.', Management Science 48(2), 289�299.
Knechel, W., Wallage, P., Eilifsen, A. and vanPraag, B. (2006), `The demand at-tributes of assurance services providers and the role of independent accountants.',International Journal of Auditing 10(2), 143�162.
Kolk, A. (2008), `Sustainability, accountability and corporate governance: explor-ing multinationals' reporting practices.', Business Strategy & the Environment17(1), 1�15.
Kolk, A. and Perego, P. (2010), `Determinants of the adoption of sustainabilityassurance statements: an international investigation.', Business Strategy & theEnvironment 19(3), 182�198.
Kolstad, I. (2007), `Why �rms should not always maximize pro�ts.', Journal ofBusiness Ethics 76(2), 137�145.
Konar, S. and Cohen, M. A. (2001), `Does the market value environmental perfor-mance?', Review of Economics & Statistics 83(2), 281�289.
Kondra, A. and Hinings, C. (1998), `Organizational diversity and change in institu-tional theory.', Organization Studies (after Jan 1, 2003) 19(5), 743�767.
Kothari, S. P. (2001), `Capital markets research in accounting.', Journal of Account-ing and Economics 31(1-3), 105�231.
KPMG (2008), `International survey of corporate responsibility reporting2008'. http://www.globalreporting.org/LearningAndSupport/GRIPublications/ResearchPublications/.
Kreps, T. J. (1940), Measurement of the Social Performance of Business, number 7in `An Investigation of Concentration of Economic Power for the Temporary Na-tional Economic Committee', United States Government Printing O�ce, Wash-ington D.C.
La Porta, R., Lopez-de Silanes, F. and Shleifer, A. (2006), `What works in securitieslaws?', Journal of Finance 61(1), 1�32.
La Porta, R., Shleifer, A. and Vishny, R. (1998), `Law and �nance.', Journal ofPolitical Economy 106(6), 1113�1155.
Lang, L. H. and Stulz, R. M. (1994), `Tobin's q, corporate diversi�cation, and �rmperformance.', Journal of Political Economy 102(6), 1248�1280.
Lang, M. H. and Lundholm, R. J. (1996), `Corporate disclosure policy and analystbehavior.', Accounting Review 71(4), 467�492.
122

Bibliography
Lang, M. H. and Lundholm, R. J. (2000), `Voluntary disclosure and equity o�erings:Reducing information asymmetry or hyping the stock?', Contemporary AccountingResearch 17(4), 623�662.
Lankoski, L. (2009), `Di�erential economic impacts of corporate responsibility is-sues.', Business & Society 48(2), 206�224.
Laplume, A. (2008), `Stakeholder theory: Reviewing a theory that moves us.', Jour-nal of Management 34(6), 1152�1189.
Laufer, W. S. (2003), `Social accountability and corporate greenwashing.', Journalof Business Ethics 43(3), 253�261.
Lee, D. D. and Fa�, R. W. (2009), `Corporate sustainability performance and id-iosyncratic risk: A global perspective', Financial Review 44(2), 213�237.
Lee, D. D., Fa�, R. W. and Lang�eld-Smith, K. (2009), `Revisiting the vexingquestion: Does superior corporate social performance lead to improved �nancialperformance?', Australian Journal of Management 34(1), 21�49.
Lee, D. E. and Tompkins, J. G. (1999), `A Modi�ed Version of the Lewellen andBadrinath Measure of Tobin's Q.', FM: The Journal of the Financial ManagementAssociation 28(1), 20�31.
Lerner, J. S. and Tetlock, P. E. (1999), `Accounting for the e�ects of accountability.',Psychological Bulletin 125(2), 255�275.
Leuz, C. and Verrecchia, R. E. (2000), `The economic consequences of increaseddisclosure.', Journal of Accounting Research 38(3), 91�124.
Lev, B. and Sougiannis, T. (1999), `Penetrating the Book-to-Market Black Box: TheR&D E�ect.', Journal of Business Finance & Accounting 26(3/4), 419�449.
Li, Y., Richardson, G. D. and Thornton, D. B. (1997), `Corporate disclosure of envi-ronmental liability information: Theory and evidence.', Contemporary AccountingResearch 14(3), 435�474.
Libby, R., Bloom�eld, R. and Nelson, M. W. (2002), `Experimental research in�nancial accounting.', Accounting, Organizations & Society 27(8), 775�810.
Lindblom, C. K. (1994), The implications of organizational legitimacy for corpo-rate social performance and disclosure, in `Critical Perspectives on AccountingConference', New York.
Lindenberg, E. B. and Ross, S. A. (1981), `Tobin's q ratio and industrial organiza-tion.', Journal of Business 54(1), 1�32.
Lo, S.-F. and Sheu, H.-J. (2007), `Is corporate sustainability a value-increasing strat-egy for business?', Corporate Governance: An International Review 15(2), 345�358.
López, M., Garcia, A. and Rodriguez, L. (2007), `Sustainable development andcorporate performance: A study based on the dow jones sustainability index.',Journal of Business Ethics 75(3), 285�300.
123

Bibliography
Luo, X. and Bhattacharya, C. (2006), `Corporate social responsibility, customersatisfaction, and market value', Journal of Marketing 70(4), 1�18.
Mahapatra, S. (1984), `Investor reaction to a corporate social accounting.', Journalof Business Finance & Accounting 11(1), 29�40.
Mahon, J. F. (2002), `Corporate reputation: Research agenda using strategy andstakeholder literature', Business & Society 41(4), 415�445.
Margolis, J. D. and Walsh, J. P. (2003), `Misery loves companies: Rethinking socialinitiatives by business.', Administrative Science Quarterly 48(2), 268�305.
Marx, T. G. (1992), `Corporate social performance reporting.', Public RelationsQuarterly 37(4), 38�44.
Mathews, M. (1997), `Twenty-�ve years of social and environmental accounting re-search: Is there a silver jubilee to celebrate?.', Accounting, Auditing & Account-ability Journal 10(4), 481�531.
Mattingly, J. E. and Berman, S. L. (2006), `Measurement of corporate social action:Discovering taxonomy in the kinder lydenburg domini ratings data.', Business &Society 45(1), 20�46.
McGuire, J. B., Sundgren, A. and Schneeweis, T. (1988), `Corporate social re-sponsibility and �rm �nancial performance.', Academy of Management Journal31(4), 854�872.
McLaren, D. (2004), `Global stakeholders: corporate accountability and investorengagement.', Corporate Governance: An International Review 12(2), 191�201.
McWilliams, A. and Siegel, D. (1997), `The role of money managers in assessingcorporate social responsibility research', Journal of Investing 6(4), 98�107.
McWilliams, A. and Siegel, D. (2000), `Corporate social responsibility and �nan-cial performance: correlation or misspeci�cation?', Strategic Management Journal21(5), 603�609.
McWilliams, A. and Siegel, D. (2001), `Corporate social responsibility: A theory ofthe �rm perspective', Academy of Management Review 26(1), 117�127.
Messick, S. (1975), `The standard problem: Meaning and values in measurementand evaluation.', American Psychologist 30(10), 955�966.
Meyer, J. W. and Rowan, B. (1977), `Institutionalized organizations: Formal struc-ture as myth and ceremony', The American Journal of Sociology 83(2), 340�363.
Mitchell, R. K., Agle, B. R. and Wood, D. J. (1997), `Toward a theory of stakeholderidenti�cation and salience: De�ning the principle of who and what really counts.',Academy of Management Review 22(4), 853�886.
Modigliani, F. and Miller, M. H. (1963), `Corporate income taxes and the cost ofcapital: A correction.', American Economic Review 53(3), 433.
124

Bibliography
Moerman, L. and van der Laan, S. (2005), `Social reporting in the tobacco in-dustry: all smoke and mirrors?', Accounting, Auditing & Accountability Journal18(3), 374�389.
Moody-Stuart, M. (2006), `Discussion of 'Does sustainability reporting improve cor-porate behaviour?: Wrong question? Right time?'.', Accounting & Business Re-search 36, 89�94.
Morck, R. and Yeung, B. (1991), `Why investors value multinationality.', Journal ofBusiness 64(2), 165�187.
Mosier, C. I. (1947), `A critical examination of the concepts of face validity.', Edu-cational and Psychological Measurement 7, 191�205.
Moskowitz, M. R. (1972), `Choosing socially responsible stocks.', Business & SocietyReview 1(1), 71�75.
Murray, A., Sinclair, D., Power, D. and Gray, R. (2006), `Do �nancial markets careabout social and environmental disclosure? Further evidence and exploration fromthe UK.', Accounting, Auditing & Accountability Journal 19(2), 228�255.
Neville, B. A., Bell, S. J. and Mengüç, B. (2005), `Corporate reputation, stakehold-ers and the social performance - �nancial performance relationship.', EuropeanJournal of Marketing 39(9/10), 1184�1198.
Nunnally, J. C. and Bernstein, I. H. (1994), Psychometric Theory, 3 edn, McGRAW-HILL.
O'Dwyer, B. and Owen, D. L. (2005), `Assurance statement practice in environ-mental, social and sustainability reporting: a critical evaluation.', The BritishAccounting Review 37(2), 205�229.
Oliver, C. (1991), `Strategic responses to institutional processes.', Academy of Man-agement Review 16(1), 145�179.
Orlitzky, M., Schmidt, F. L. and Rynes, S. L. (2003), `Corporate social and �nancialperformance: A meta-analysis', Organization Studies 24(3), 403�411.
Orlitzky, M., Siegel, D. S. and Waldman, D. A. (2011), `Strategic corporate socialresponsibility and environmental sustainability.', Business & Society 50(1), 6�27.
Orlitzky, M. and Whelan, G. (2007), `On the e�ectiveness of social and environmen-tal accounting.', Issues in Social & Environmental Accounting 1(2), 311�333.
Palazzo, G. and Richter, U. (2005), `CSR Business as Usual? The Case of theTobacco Industry.', Journal of Business Ethics 61(4), 387�401.
Parker, L. D. (2005), `Social and environmental accountability research: A view fromthe commentary box.', Accounting, Auditing & Accountability Journal 18(6), 842�860.
Patten, D. M. (1992), `Intra�industry environmental disclosures in response to thealaskan oil spill: A note on legitimacy theory.', Accounting, Organizations & So-ciety 17(5), 471�475.
125

Bibliography
Patten, D. M. (2002), `The relation between environmental performance and en-vironmental disclosure: a research note.', Accounting, Organizations & Society27(8), 763�773.
Pava, M. L. and Krausz, J. (1996), `The association between corporate social-responsibility and �nancial performance: The paradox of social cost.', Journalof Business Ethics 15(3), 321�357.
Peloza, J. (2006), `Using corporate social responsibility as insurance for �nancialperformance.', California Management Review 48(2), 52�72.
Peloza, J. (2009), `The challenge of measuring �nancial impacts from investmentsin corporate social performance.', Journal of Management 35(6), 1518�1541.
Perrini, F. (2005), `Building a European Portrait of Corporate Social ResponsibilityReporting.', European Management Journal 23(6), 611�627.
Petersen, H. L. and Vredenburg, H. (2009), `Morals or economics? Institutionalinvestor preferences for corporate social responsibility.', Journal of Business Ethics90(1), 1�14.
Pfe�er, J. (1993), `Barriers to the advance of organizational science: Paradigm devel-opment as a dependable variable.', Academy of Management Review 18(4), 599�620.
Pfe�er, J. and Salancik, G. R. (1978), The External Control of Organizations: AResource Dependence Perspective, Harper & Row, New York.
Pivato, S., Misani, N. and Tencati, A. (2008), `The impact of corporate social re-sponsibility on consumer trust: the case of organic food.', Business Ethics: AEuropean Review 17(1), 3�12.
Poshakwale, S. and Courtis, J. K. (2005), `Disclosure level and cost of equity cap-ital: evidence from the banking industry.', Managerial & Decision Economics26(7), 431�444.
Preston, L. E. and Sapienza, H. J. (1990), `Stakeholder management and corporateperformance.', Journal of Behavioral Economics 19(4), 361�375.
Preston, L. and O'Bannon, D. (1997), `The corporate social-�nancial performancerelationship: A typology and analysis', Business & Society 36(4), 419�429.
Quick, R. and Knocinski, M. (2006), `Nachhaltigkeitsberichterstattung � Em-pirische Befunde zur Berichterstattungspraxis von HDAX-Unternehmen �.',Zeitschrift für Betriebswirtschaft 76(6), 615�650.
Rao, V. R., Agarwal, M. K. and Dahlho�, D. (2004), `How is manifest brandingstrategy related to the intangible value of a corporation?.', Journal of Marketing68(4), 126�141.
Rennings, K., Schröder, M. and Ziegler, A. (2003), `The economic performance ofeuropean stock corporations.', Greener Management International 44, 33�43.
126
Bibliography
Reynolds, M. and Yuthas, K. (2008), `Moral discourse and corporate social respon-sibility reporting.', Journal of Business Ethics 78(1/2), 47�64.
Roberts, R. W. (1992), `Determinants of corporate social responsibility disclo-sure: An application of stakeholder theory.', Accounting, Organizations & Society17(6), 595�612.
Roman, R. M., Hayibor, S. and Agle, B. R. (1999), `The relationship between socialand �nancial performance.', Business & Society 38(1), 109 �125.
Rosen, B. N., Sandler, D. M. and Shani, D. (1991), `Social issues and socially re-sponsible investment behavior: A preliminary empirical investigation.', Journalof Consumer A�airs 25(2), 221�234.
Rowley, T. J. (1997), `Moving beyond dyadic ties: A network theory of stakeholderin�uences.', Academy of Management Review 22(4), 887�910.
Ruf, B. M., Muralidhar, K., Brown, R. M., Janney, J. J. and Paul, K. (2001), `Anempirical investigation of the relationship between change in corporate social per-formance and �nancial performance: A stakeholder theory perspective.', Journalof Business Ethics 32(2), 143�156.
Schadewitz, H. and Niskala, M. (2010), `Communication via responsibility report-ing and its e�ect on �rm value in Finland', Corporate Social Responsibility andEnvironmental Management 17(2), 96�106.
Schmidt, F. L. and Hunter, J. E. (1999), `Theory testing and measurement error',Intelligence 27(3), 183 98.
Scholtens, B. (2007), `Financial and social performance of socially responsible in-vestments in the netherlands.', Corporate Governance: An International Review15(6), 1090�1105.
Schreck, P. (2011), `Reviewing the business case for corporate social responsibility:New evidence and analysis.', Journal of Business Ethics 103(2), 167�188.
Schuler, D. A. and Cording, M. (2006), `A corporate social performance-corporate �-nancial performance behavioural model for consumers.', Academy of ManagementReview 31(3), 540�558.
Schwab, D. P. (1980), `Construct validity in organizational behavior.', Research inOrganizational Behavior 2, 3�43.
Scott, W. (2008), `Approaching adulthood: the maturing of institutional theory.',Theory and Society 37(5), 427�442.
Scott, W. R. (1987), `The adolescence of institutional theory.', Administrative Sci-ence Quarterly 32(4), 493�511.
Seifert, B., Morris, S. A. and Bartkus, B. R. (2003), `Comparing big givers andsmall givers: Financial correlates of corporate philanthropy.', Journal of BusinessEthics 45(3), 195�211.
127

Bibliography
Sen, S. and Bhattacharya, C. B. (2001), `Does Doing Good Always Lead to Do-ing Better? Consumer Reactions to Corporate Social Responsibility.', Journal ofMarketing Research 38(2), 225�243.
Sethi, S. P. (1979), `A conceptual framework for environmental analysis of socialissues and evaluation of business response patterns.', Academy of ManagementReview 4(1), 63�74.
Sharfman, M. (1996), `The construct validity of the kinder, lydenberg & dominisocial performance ratings data.', Journal of Business Ethics 15(3), 287�296.
Shocker, A. D. and Sethi, S. P. (1973), `An approach to incorporating societal prefer-ences in developing corporate action strategies.', California Management Review15(4), 97�105.
Siegel, D. S. and Vitaliano, D. F. (2007), `An empirical analysis of the strategic useof corporate social responsibility.', Journal of Economics & Management Strategy16(3), 773�792.
Simpson, W. G. and Kohers, T. (2002), `The link between corporate social and�nancial performance: Evidence from the banking industry.', Journal of BusinessEthics 35(2), 97�109.
Skinner, D. J. (1994), `Why �rms voluntarily disclose bad news.', Journal of Ac-counting Research 32(1), 38�60.
Spence, C. (2007), `Social and environmental reporting and hegemonic discourse.',Accounting, Auditing & Accountability Journal 20(6), 855�882.
Spence, C. (2009), `Social and environmental reporting and the corporate ego.',Business Strategy and the Environment 18(4), 254�265.
Spicer, B. H. (1978), `Investors, corporate social performance and information dis-closure: An empirical study .', Accounting Review 53(1), 94�110.
Starbuck, W. H. (2005), `How much better are the most-prestigious journals? thestatistics of academic publication.', Organization Science 16(2), 180�200.
Sturdivant, F. D. (1979), `Executives and activists: Test of stakeholder manage-ment.', California Management Review 22(1), 53�59.
Sundaram, A. K. and Inkpen, A. C. (2004), `The corporate objective revisited.',Organization Science 15(3), 350�363.
Surroca, J. and Tribo, J. A. (2008), `Managerial entrenchment and corporate socialperformance', Journal of Business Finance and Accounting 35(5-6), 748�789.
Swanson, D. L. (1995), `Addressing a theoretical problem by reorienting the corpo-rate social performance model.', Academy of Management Review 20(1), 43�64.
Swanson, D. L. (1999), `Toward an integrative theory of business and society: Aresearch strategy for corporate social performance.', Academy of ManagementReview 24(3), 506�521.
128
Bibliography
Tilling, M. V. and Tilt, C. A. (2010), `The edge of legitimacy: Voluntary social andenvironmental reporting in Rothmans' 1956-1999 annual reports.', Accounting,Auditing & Accountability Journal 23(1), 55�81.
Turner, S. P. (1979), `The concept of face validity.', Quality & Quantity 13(1), 85�90.
Ullmann, A. A. (1985), `Data in search of a theory: A critical examination of therelationships among social performance, social disclosure, and economic perfor-mance of U.S. �rms.', Academy of Management Review 10(3), 540�557.
Ulrich, D. and Barney, J. B. (1984), `Perspectives in organizations: Resource depen-dence, e�ciency, and population.', Academy of Management Review 9(3), 471�481.
Van der Laan, G., Van Ees, H. and Van Witteloostuijn, A. (2008), `Corporate socialand �nancial performance: An extended stakeholder theory, and empirical testwith accounting measures.', Journal of Business Ethics 79(3), 299�310.
Verrecchia, R. E. (1990), `Endogenous proprietary costs through �rm interdepen-dence.', Journal of Accounting and Economics 12(1-3), 245�250.
Verrecchia, R. E. (2001), `Essays on disclosure.', Journal of Accounting & Economics32(1-3), 97�180.
Vishwanathan, P. (2010), The elusive relationship between corporate social and�nancial performance: Meta-analyzing four decades of misguided evidence.Academy of Management Annual Meeting Proceedings.
Waddock, S. (2004), `Parallel universes: Companies, academics, and the progress ofcorporate citizenship.', Business & Society Review 109(1), 5�42.
Waddock, S. A. and Graves, S. B. (1997), `The Corporate Social Performance-Financial Performance Link', Strategic Management Journal 18(4), 303�319.
Wahba, H. (2008), `Does the market value corporate environmental responsibilityan empirical examination.', Corporate Social Responsibility and EnvironmentalManagement 15(2), 89�99.
Walls, J. L., Phan, P. H. and Berrone, P. (2011), `Measuring environmental strategy:Construct development, reliability, and validity.', Business & Society 50(1), 71�115.
Walmsley, J. D. and Bond, A. (2003), `An assessment of the role of environmentalreporting in supporting share values in FTSE100 companies.', Journal of Envi-ronmental Assessment Policy & Management 5(2), 149�182.
Warren, R. (1999), `Company legitimacy in the new millennium.', Business Ethics:A European Review 8(4), 214�224.
Wartick, S. L. (1988), `How issues management contribute to corporate perfor-mance.', Business Forum 13(2), 16�22.
Wartick, S. L. (2002), `Measuring corporate reputation: De�nition and data', Busi-ness & Society 41(4), 371�392.
129
Bibliography
Wartick, S. L. and Cochran, P. L. (1985), `The evolution of the corporate socialperformance model.', Academy of Management Review 10(4), 758�769.
Watts, R. L. and Zimmerman, J. L. (1978), `Towards a positive theory of the deter-mination of accounting standards.', Accounting Review 53(1), 112�134.
Webb, K. A., Cahan, S. F. and Sun, J. (2008), `The e�ect of globalization andlegal environment on voluntary disclosure.', International Journal of Accounting43(3), 219�245.
Williams, C. A. (1999), `The Securities and Exchange Commission and corporatesocial transparency.', Harvard Law Review 112(6), 1197�1311.
Wood, D. (1991a), `Social issues in management: Theory and research in corporatesocial performance', Journal of Management 17(2), 383�406.
Wood, D. J. (1991b), `Corporate social performance revisited.', Academy of Man-agement Review 16(4), 691�718.
Wood, D. J. (2010), `Measuring corporate social performance: A review', Interna-tional Journal of Management Reviews 12(1), 50�84.
Wood, D. J. and Jones, R. E. (1995), `Stakeholder Mismatching: A TheoreticalProblem In Empirical Research On Corporate Social Performance', InternationalJournal of Organizational Analysis 3(3), 229�267.
Woodward, D., Edwards, P. and Birkin, F. (2001), `Some evidence on execu-tives' views of corporate social responsibility', The British Accounting Review33(3), 357�397.
Wu, M.-L. (2006), `Corporate social performance, corporate �nancial performance,and �rm size: A meta-analysis.', Journal of American Academy of Business, Cam-bridge 8(1), 163�171.
Yach, D., Brinchmann, S. and Bellet, S. (2001), `Healthy investments and investingin health.', Journal of Business Ethics 33(3), 191�198.
Zajac, E. J. and Westphal, J. D. (2004), `The social construction of market value: In-stitutionalization and learning perspectives on stock market reactions.', AmericanSociological Review 69(3), 433�457.
130

CSP-CFP studies examined in
�Escaping the fog: How to de�ne
Corporate Social Performance�
Abbott, W. F. and Monsen, R. J. (1979), `On the measurement of corporate socialresponsibility: Self-reported disclosures as a method of measuring corporate socialinvolvement.', Academy of Management Journal 22(3), 501�515.
Alexander, G. J. and Buchholz, R. A. (1978), `Research notes. corporate socialresponsibility and stock market performance.', Academy of Management Journal21(3), 479�486.
Arora, P. (2008), Organizational slack and attainment discrepancy as antecedents ofcorporate social performance., in `Academy of Management Proceedings', pp. 1�6.
Aupperle, K. E., Carroll, A. B. and Hat�eld, J. D. (1985), `An empirical examina-tion of the relationship between corporate social responsibility and pro�tability',Academy of Management Journal 28(2), 446�463.
Aupperle, K. E. and Van Pham, D. (1989), `An expanded investigation into the re-lationship of corporate social responsibility and �nancial performance.', EmployeeResponsibilities & Rights Journal 2(4), 263�274.
Balabanis, G., Phillips, H. C. and Lyall, J. (1998), `Corporate social responsibil-ity and economic performance in the top british companies: are they linked?',European Business Review 98(1), 25�44.
Belkaoui, A. and Karpik, P. G. (1989), `Determinants of the corporate decisionto disclose social information', Accounting, Auditing & Accountability Journal2(1), 36�51.
Berman, S. L., Wicks, A. C., Kotha, S. and Jones, T. M. (1999), `Does stakeholderorientation matter? the relationship between stakeholder management models and�rm �nancial performance.', Academy of Management Journal 42(5), 488�506.
Bowman, E. H. (1976), `Strategy and the weather.', Sloan Management Review17(2), 49�62.
Bowman, E. H. (1978), `Strategy, annual reports, and alchemy.', California Man-agement Review 20(3), 64�71.
Bowman, E. H. and Haire, M. (1975), `A strategic posture toward corporate socialresponsibility.', California Management Review 18(2), 49�58.
131

CSP-CFP studies examined in �Escaping the fog: How to de�ne Corporate Social
Performance�
Boyle, E. J., Higgins, M. M. and Rhee, G. S. (1997), `Stock market reaction to ethicalinitiatives of defense contractors: Theory and evidence', Critical Perspectives onAccounting 8(6), 541�561.
Brammer, S., Brooks, C. and Pavelin, S. (2006), `Corporate social performance andstock returns: Uk evidence from disaggregate measures.', Financial Management35(3), 97�116.
Brammer, S. and Millington, A. (2008), `Does it pay to be di�erent? an analysisof the relationship between corporate social and �nancial performance.', StrategicManagement Journal 29(12), 1325�1343.
Brown, B. and Perry, S. (1995), `Halo-removed residuals of fortune's "responsibil-ity to the community and environment"�a decade of data', Business & Society34, 199�215.
Buehler, V. M. and Shetty, Y. K. (1976), `Managerial response to social responsi-bility challenge.', Academy of Management Journal 19(1), 66�78.
Chen, K. H. and Metcalf, R. W. (1980), `The relationship between pollution controlrecord and �nancial indicators revisited', Accounting Review 55(1), 168�177.
Clarkson, M. B. E. (1988), `Corporate social performance in canada, 1976-86', Re-search in Corporate Social Performance and Policy 10, 241�265.
Cochran, P. L. andWood, R. A. (1984), `Corporate social responsibility and �nancialperformance.', Academy of Management Journal 27(1), 42�56.
Cottrill, M. T. (1990), `Corporate social responsibility and the marketplace.', Jour-nal of Business Ethics 9(9), 723�729.
Cowen, S. S., Ferreri, L. B. and Parker, L. D. (1987), `The impact of corporatecharacteristics on social responsibility disclosure: A typology and frequency-basedanalysis.', Accounting, Organizations & Society 12(2), 111�122.
Cox, P., Brammer, S. B. and Millington, A. (2004), `An empirical examination ofinstitutional investor preferences for corporate social performance.', Journal ofBusiness Ethics 52(1), 27�43.
D'Antonio, L. and Johnsen, T. (1997), `Expanding socially screened portfolios: Anattribution...', Journal of Investing 6(4), 79�86.
Diltz, J. D. (1995), `The private cost of socially responsible investing.', AppliedFinancial Economics 5(2), 69�77.
Fauzi, H., Mahoney, L. S. and Rahman, A. A. (2007), `The link between corporatesocial performance and �nancial performance: Evidence from indonesian compa-nies.', Issues in Social & Environmental Accounting 1(1), 149�159.
Fernandez-Izquierdo, A. and Matallin-Saez, J. (2008), `Performance of ethical mu-tual funds in spain: Sacri�ce or premium?', Journal of Business Ethics 81(2), 247�260.
132

CSP-CFP studies examined in �Escaping the fog: How to de�ne Corporate Social
Performance�
Fogler, H. R. and Nutt, F. (1975), `A note on social responsibility and stock valua-tion.', Academy of Management Journal 18(1), 155�160.
Frooman, J., Zietsma, C. and McKnight, B. (2008), How risk mediates the csp-cfprelationship., in `Academy of Management Proceedings', pp. 1�6.
Fry, F. L. and Hock, R. J. (1976), `Who claims corporate responsibility? the biggestand the worst.', Business & Society Review 18(18), 62�65.
Fry, L. W., Keim, G. D. and Meiners, R. E. (1982), `Corporate contributions: Al-truistic or for-pro�t?', Academy of Management Journal 25(1), 94�106.
Girard, E., Rahman, H. and Stone, B. (2007), `Socially responsible investments:Goody-two-shoes or bad to the bone?', Journal of Investing 16(1), 96�110.
Goll, I. and Rasheed, A. A. (2004), `The moderating e�ect of environmental muni�-cence and dynamism on the relationship between discretionary social responsibil-ity and �rm performance.', Journal of Business Ethics 49(1), 41�54.
Graves, S. B. and Waddock, S. A. (1994), `Institutional owners and corporate socialperformance.', Academy of Management Journal 37(4), 1034�1046.
Graves, S. B. and Waddock, S. A. (1999), `A look at the �nancial-social performancenexus when quality of management is held constant', International Journal ofValue-Based Management 12(1), 87�99.
Graves, S. B. and Waddock, S. A. (2000), `Beyond built to last ... stakeholderrelations in �built-to-last� companies.', Business & Society Review (00453609)105(4), 393�418.
Greening, D. W. (1995), `Conservation strategies, �rm performance, and corporatereputation in the u.s. electric utility industry', Research in Corporate Social Per-formance and Policy Supplement 1, 345�368.
Gri�n, J. J. and Mahon, J. F. (1997), `The corporate social performance and cor-porate �nancial performance debate.', Business & Society 36(1), 5�31.
Guerard, Jr., J. B. (1997a), `Additional evidence on the cost of being socially re-sponsible in investing', Journal of Investing 6(4), 31�36.
Guerard, Jr., J. B. (1997b), `Is there a cost to being socially responsible in investing?',Journal of Forecasting 16(7), 475�490.
Hamilton, S., Jo, H. and Statman, M. (1993), `Doing well while doing good? theinvestment performance of socially responsible mutual funds.', Financial AnalystsJournal 49(6), 62�66.
He, Y., Tian, Z. and Chen, Y. (2007), `Performance implications of nonmarketstrategy in china.', Asia Paci�c Journal of Management 24(2), 151�169.
Herremans, I. M., Akathaporn, P. and McInnes, M. (1993), `An investigation ofcorporate social responsibility and economic performance.', Accounting, Organi-zations & Society 18(7/8), 587�604.
133

CSP-CFP studies examined in �Escaping the fog: How to de�ne Corporate Social
Performance�
Hickman, K. A. and Teets, W. R. (1999), `Social investing and modern portfoliotheory.', American Business Review 17(1), 72�78.
Hill, R., Ainscough, T., Shank, T. and Manullang, D. (2007), `Corporate socialresponsibility and socially responsible investing: A global perspective', Journal ofBusiness Ethics 70(2), 165�174.
Hillman, A. J. and Keim, G. D. (2001), `Shareholder value, stakeholder manage-ment, and social issues: What's the bottom line?', Strategic Management Journal22(2), 125�139.
Hull, C. E. and Rothenberg, S. (2008), `Firm performance: the interactions of cor-porate social performance with innovation and industry di�erentiation', StrategicManagement Journal 29(7), 781�789.
Ingram, R. W. (1978), `An investigation of the information content of (certain) socialresponsibility disclosures.', Journal of Accounting Research 16(2), 270�285.
Johnson, R. A. and Greening, D. W. (1999), `The e�ects of corporate governanceand institutional ownership types of corporate social performance.', Academy ofManagement Journal 42(5), 564�576.
Jones, R. and Murrell, A. J. (2001), `Signaling positive corporate social perfor-mance.', Business & Society 40(1), 59�78.
Kedia, B. L. and Kuntz, E. C. (1981), `The context of social performance: Anempirical study of texas banks', Research in Corporate Social Performance andPolicy 3, 133�154.
Kumar, R., Lamb, W. B. and Wokutch, R. E. (2002), `The end of south africansanctions, institutional ownership, and the stock price performance of boycotted�rms: Evidence on the impact of social-ethical investing.', Business & Society41(2), 133�165.
Kurtz, L. and DiBartolomeo, D. (1996), `Socially screened portfolios: An attributionanalysis of relative performance', Journal of Investing Fall, 35�41.
Lashgari, M. K. and Gant, D. R. (1989), `Social investing: The sullivan principles',Review of Social Economy 47(1), 74�83.
Lee, D. D. and Fa�, R. W. (2009), `Corporate sustainability performance and id-iosyncratic risk: A global perspective', Financial Review 44(2), 213�237.
Lee, D. D., Fa�, R. W. and Lang�eld-Smith, K. (2009), `Revisiting the vexingquestion: Does superior corporate social performance lead to improved �nancialperformance?', Australian Journal of Management 34(1), 21�49.
Lerner, L. D. and Fryxell, G. E. (1988), `An empirical study of the predictors ofcorporate social performance: A multi-dimensional analysis.', Journal of BusinessEthics 7(12), 951�959.
Levy, F. K. and Shatto, G. M. (1980), `Social responsibility in large electric utility�rms: The case for philanthropy', Research in Corporate Social Performance andPolicy 2, 237�249.
134
CSP-CFP studies examined in �Escaping the fog: How to de�ne Corporate Social
Performance�
Luck, C. and Pilotte, N. (1993), `Domini social index performance', Journal ofInvesting Fall, 60�62.
Luo, X. and Bhattacharya, C. (2006), `Corporate social responsibility, customersatisfaction, and market value', Journal of Marketing 70(4), 1�18.
Luther, R. G. and Matatko, J. (1994), `The performance of ethical unit trusts:Choosing an appropriate benchmark', The British Accounting Review 26(1), 77�89.
Luther, R. G., Matatko, J. and Corner, D. C. (1992), `The investment performance ofuk �ethical� unit trusts', Accounting, Auditing & Accountability Journal 5(4), 57�70.
Mahapatra, S. (1984), `Investor reaction to a corporate social accounting.', Journalof Business Finance & Accounting 11(1), 29�40.
Mahoney, L., LaGore, W. and Scazzero, J. A. (2008), `Corporate social performance,�nancial performance for �rms that restate earnings.', Issues in Social & Envi-ronmental Accounting 2(1), 104�130.
Mahoney, L. and Roberts, R. W. (2007), `Corporate social performance, �nancialperformance and institutional ownership in canadian �rms.', Accounting Forum31(3), 233�253.
McGuire, J. B., Sundgren, A. and Schneeweis, T. (1988), `Corporate social re-sponsibility and �rm �nancial performance.', Academy of Management Journal31(4), 854�872.
McWilliams, A. and Siegel, D. (1997), `The role of money managers in assessingcorporate social responsibility research', Journal of Investing 6(4), 98�107.
McWilliams, A. and Siegel, D. (2000), `Corporate social responsibility and �nan-cial performance: correlation or misspeci�cation?', Strategic Management Journal21(5), 603�609.
Mill, G. A. (2006), `The �nancial performance of a socially responsible investmentover time and a possible link with corporate social responsibility.', Journal ofBusiness Ethics 63(2), 131�148.
Mills, D. L. and Gardner, M. I. (1984), `Financial pro�les and the disclosure ofexpenditures for socially responsible purposes.', Journal of Business Research12(4), 407�424.
Moneva, J. M., Rivera-Lirio, J. M. and Muñoz-Torres, M. J. (2007), `The corpo-rate stakeholder commitment and social and �nancial performance.', IndustrialManagement & Data Systems 107(1), 84�102.
Moore, G. (2001), `Corporate social and �nancial performance: An investigation inthe u.k. supermarket industry.', Journal of Business Ethics 34(3/4), 299�315.
Moore, G. (2002), `The uk supermarket industry: an analysis of corporate socialand �nancial performance', Business Ethics: A European Review 11(1), 25�39.
135
CSP-CFP studies examined in �Escaping the fog: How to de�ne Corporate Social
Performance�
Moskowitz, M. R. (1972), `Choosing socially responsible stocks.', Business & SocietyReview 1(1), 71�75.
Muñoz, M. J., Rivera, J. M. and Moneva, J. M. (2008), `Evaluating sustainabilityin organisations with a fuzzy logic approach.', Industrial Management & DataSystems 108(6), 829�841.
Nelling, E. and Webb, E. (2009), `Corporate social responsibility and �nancial per-formance: the �virtuous circle� revisited', Review of Quantitative Finance andAccounting 32(2), 197�209.
Ogden, S. and Watson, R. (1999), `Corporate performance and stakeholder manage-ment: Balancing shareholder and customer interests in the u.k. privatized waterindustry.', Academy of Management Journal 42(5), 526�538.
Okamoto, D. (2009), `Social relationship of a �rm and the csp�cfp relationship injapan: Using arti�cial neural networks.', Journal of Business Ethics 87(1), 117�132.
O'Neill, H. M., Saunders, C. B. and McCarthy, A. D. (1989), `Board members, cor-porate social responsiveness and pro�tability: Are tradeo�s necessary?', Journalof Business Ethics 8(5), 353�357.
Parket, I. R. and Eilbirt, H. (1975), `Social responsibility: The underlying factor.',Business Horizons 18(4), 5�10.
Patten, D. M. (1990), `The market reaction to social responsibility disclosures: Thecase of the sullivan principles signings', Accounting, Organizations and Society15(6), 575�587.
Pava, M. L. and Krausz, J. (1996), `The association between corporate social-responsibility and �nancial performance: The paradox of social cost.', Journalof Business Ethics 15(3), 321�357.
Perrini, F. and Minoja, M. (2008), `Strategizing corporate social responsibility: ev-idence from an italian medium-sized, family-owned company.', Business Ethics:A European Review 17(1), 47�63.
Pivato, S., Misani, N. and Tencati, A. (2008), `The impact of corporate social re-sponsibility on consumer trust: the case of organic food.', Business Ethics: AEuropean Review 17(1), 3�12.
Preston, L. E. (1978), `Analyzing corporate social performance: Methods and re-sults', Journal of Contemporary Business 7, 135�150.
Preston, L. and O'Bannon, D. (1997), `The corporate social-�nancial performancerelationship: A typology and analysis', Business & Society 36(4), 419�429.
Rennings, K., Schröder, M. and Ziegler, A. (2003), `The economic performance ofeuropean stock corporations.', Greener Management International 44, 33�43.
Reyes, M. G. and Grieb, T. (1998), `The external performance of socially-responsiblemutual funds.', American Business Review 16(1), 1�7.
136

CSP-CFP studies examined in �Escaping the fog: How to de�ne Corporate Social
Performance�
Roberts, R. W. (1992), `Determinants of corporate social responsibility disclo-sure: An application of stakeholder theory.', Accounting, Organizations & Society17(6), 595�612.
Ruf, B. M., Muralidhar, K., Brown, R. M., Janney, J. J. and Paul, K. (2001), `Anempirical investigation of the relationship between change in corporate social per-formance and �nancial performance: A stakeholder theory perspective.', Journalof Business Ethics 32(2), 143�156.
Sauer, D. A. (1997), `The impact of social-responsibility screens on investment per-formance: Evidence from the domini 400 social index and domini equity mutualfund', Review of Financial Economics 6(2), 137�149.
Schnietz, K. E. and Epstein, M. J. (2005), `Exploring the �nancial value of a rep-utation for corporate social responsibility during a crisis.', Corporate ReputationReview 7(4), 327�345.
Scholtens, B. (2007), `Financial and social performance of socially responsible in-vestments in the netherlands.', Corporate Governance: An International Review15(6), 1090�1105.
Scholtens, B. (2008), `A note on the interaction between corporate social responsi-bility and �nancial performance', Ecological Economics 68(1-2), 46�55.
Seifert, B., Morris, S. A. and Bartkus, B. R. (2003), `Comparing big givers andsmall givers: Financial correlates of corporate philanthropy.', Journal of BusinessEthics 45(3), 195�211.
Sharfman, M. (1996), `The construct validity of the kinder, lydenberg & dominisocial performance ratings data.', Journal of Business Ethics 15(3), 287�296.
Simerly, R. L. (1994), `Corporate social performance and �rms' �nancial perfor-mance: An alternative perspective.', Psychological Reports 75(3), 1091�1103.
Simpson, W. G. and Kohers, T. (2002), `The link between corporate social and�nancial performance: Evidence from the banking industry.', Journal of BusinessEthics 35(2), 97�109.
Sánchez, J. L. and Sotorrío, L. (2007), `The creation of value through corporatereputation.', Journal of Business Ethics 76(3), 335�346.
Spicer, B. H. (1978), `Investors, corporate social performance and information dis-closure: An empirical study .', Accounting Review 53(1), 94�110.
Stanwick, P. A. and Stanwick, S. D. (1998a), `The determinants of corporate socialperformance: An empirical examination.', American Business Review 16(1), 86�93.
Stanwick, P. A. and Stanwick, S. D. (1998b), `The relationship between corpo-rate social performance, and organizational size, �nancial performance, and envi-ronmental performance: An empirical examination.', Journal of Business Ethics17(2), 195�204.
137

CSP-CFP studies examined in �Escaping the fog: How to de�ne Corporate Social
Performance�
Stevens, W. P. (1984), `Market reaction to corporate environmental performance',Advances in Accounting 1, 41�61.
Sturdivant, F. D. and Ginter, J. L. (1977), `Corporate social responsiveness: Man-agement attitudes and economic performance.', California Management Review19(3), 30�39.
Surroca, J. and Tribo, J. A. (2008), `Managerial entrenchment and corporate socialperformance', Journal of Business Finance and Accounting 35(5-6), 748�789.
Travers, F. J. (1997), `Socially responsible investing on a global basis: Mixing moneyand morality outside the u.s.', Journal of Investing 6(4), 50�56.
Turban, D. B. and Greening, D. W. (1997), `Corporate social performance andorganizational attractiveness to prospective employees.', Academy of ManagementJournal 40(3), 658�672.
Van der Laan, G., Van Ees, H. and Van Witteloostuijn, A. (2008), `Corporate socialand �nancial performance: An extended stakeholder theory, and empirical testwith accounting measures.', Journal of Business Ethics 79(3), 299�310.
Vance, S. G. (1975), `Are socially responsible corporations good investment risks?',Management Review 64(8), 18�24.
Waddock, S. (2000), `Performance characteristics of social and traditional invest-ments.', Journal of Investing 9(2), 27�38.
Waddock, S. A. and Graves, S. B. (1997), `The Corporate Social Performance-Financial Performance Link', Strategic Management Journal 18(4), 303�319.
Wagner, M. (2009), `Innovation and competitive advantages from the integration ofstrategic aspects with social and environmental management in european �rms.',Business Strategy & the Environment (John Wiley & Sons, Inc) 18(5), 291�306.
Wartick, S. L. (1988), `How issues management contribute to corporate perfor-mance.', Business Forum 13(2), 16�22.
Wokutch, R. E. and Spencer, B. A. (1987), `Corporate saints and sinners: The e�ectof philanthropic and illegal activity on organizational performance.', CaliforniaManagement Review 29(2), 62�77.
Ziegler, A., Schroder, M. and Rennings, K. (2007), `The e�ect of environmental andsocial performance on the stock performance of european corporations', Environ-mental and Resource Economics 37(4), 661�680.
138
Related Documents