Henley Management College What Motivates Public Sector Employees in New Zealand? The Case of the Accident Compensation Corporation by Gavin Pearce A dissertation submitted in partial fulfilment of the requirements for the degree of Master of Business Administration 2008

Welcome message from author
This document is posted to help you gain knowledge. Please leave a comment to let me know what you think about it! Share it to your friends and learn new things together.
Transcript

Henley Management College
What Motivates Public Sector Employees in New Zealand?
The Case of the Accident Compensation Corporation
by
Gavin Pearce
A dissertation submitted in partial fulfilment of the requirements for the degree of Master of Business Administration
2008

2
TABLE OF CONTENTS
1 ABSTRACT............................................................................................. 5
2 INTRODUCTION................................................................................... 8 2.1 BACKGROUND TO ACC.............................................................................. 8 2.2 BACKGROUND ON THE TOPIC ..................................................................... 8
3 AIMS, OBJECTIVES, RESEARCH QUESTION............................... 9 3.1 WHY THIS TOPIC IS IMPORTANT TO INVESTIGATE? ................................... 9 3.2 PERSONAL DEVELOPMENT OBJECTIVES ..................................................... 9 3.3 CAREER DEVELOPMENT OBJECTIVES....................................................... 10 3.4 ACC’S OBJECTIVES ................................................................................. 10 3.5 HENLEY’S OBJECTIVES ............................................................................ 10 3.6 RESEARCH QUESTIONS............................................................................. 11
4 LITERATURE REVIEW..................................................................... 12 4.1 DEFINITION OF MOTIVATION.................................................................... 12 4.2 MOTIVATIONAL THEORIES ....................................................................... 12 4.3 EARLY WORK ON MOTIVATION ............................................................... 13 4.4 SCIENTIFIC MANAGEMENT....................................................................... 14 4.5 HAWTHORNE STUDIES ............................................................................. 15 4.6 ATTITUDE SURVEYS................................................................................. 15 4.7 MASLOW’S HIERARCHY OF NEEDS THEORY ............................................ 15 4.8 THEORY X AND THEORY Y ...................................................................... 17 4.9 HERZBERG’S TWO-FACTOR MOTIVATION THEORY.................................. 18 4.10 JOB CHARACTERISTICS............................................................................. 19 4.11 EQUITY THEORY ...................................................................................... 19 4.12 EXPECTANCY THEORY ............................................................................. 20 4.13 GOAL SETTING THEORY........................................................................... 21 4.14 SOCIAL COGNITIVE THEORY .................................................................... 22 4.15 CRITICAL MANAGEMENT THEORY ........................................................... 23 4.16 THE HIGH-PERFORMANCE CYCLE............................................................ 24 4.17 MOTIVATION IN THE PUBLIC SECTOR....................................................... 26 4.18 MOTIVATION IN COUNTRIES OUTSIDE THE UNITED STATES ..................... 30 4.19 SUMMARY ................................................................................................ 31
5 RESEARCH DESIGN .......................................................................... 32 5.1 APPROACH ............................................................................................... 32
6 QUALITATIVE RESEARCH ............................................................. 33 6.1 PHENOMENOLOGY.................................................................................... 33 6.2 METHODOLOGY ....................................................................................... 35 6.3 SELECTING INTERVIEWEES....................................................................... 36 6.4 PREPARING THE INTERVIEW SCHEDULE ................................................... 37 6.5 CONDUCTING THE INTERVIEWS................................................................ 38 6.6 TRANSCRIPTION & ANALYSIS .................................................................. 39 6.7 PRACTICAL ISSUES ................................................................................... 40
3
7 QUANTITATIVE RESEARCH .......................................................... 42 7.1 POSITIVISM............................................................................................... 42 7.2 SURVEY OF HIGH PERFORMERS................................................................ 42 7.3 SELECTING THE SURVEY PARTICIPANTS................................................... 43 7.4 PREPARING THE SURVEY QUESTIONNAIRE ............................................... 43 7.5 CONDUCTING THE SURVEY ...................................................................... 45 7.6 PRACTICAL ISSUES ................................................................................... 45
8 RESULTS/DATA ANALYSIS............................................................. 47 8.1 QUALITATIVE RESEARCH ......................................................................... 47 8.2 QUANTITATIVE RESEARCH....................................................................... 50
9 FINDINGS ............................................................................................. 62 9.1 QUALITATIVE RESEARCH ......................................................................... 62 9.2 QUANTITATIVE RESEARCH....................................................................... 64
10 ALIGNMENT WITH MOTIVATIONAL THEORIES.................... 67 10.1 HERZBERG’S TWO-FACTOR THEORY ....................................................... 67 10.2 JOB DESIGN THEORY................................................................................ 67 10.3 GOAL SETTING THEORY........................................................................... 69 10.4 SOCIAL COGNITIVE THEORY .................................................................... 70 10.5 THE HIGH-PERFORMANCE CYCLE............................................................ 70
11 CONCLUSIONS AND RECOMMENDATIONS.............................. 72 11.1 WHAT MOTIVATES EMPLOYEES AT ACC................................................. 72 11.2 ALIGNMENT WITH THE HIGH-PERFORMANCE CYCLE ............................... 72 11.3 PUBLIC SECTOR MOTIVATION.................................................................. 73 11.4 MOTIVATION OF NEW ZEALAND WORKERS ............................................. 73 11.5 RECOMMENDATIONS ................................................................................ 74
12 LIMITATIONS OF THE RESEARCH.............................................. 79
13 FURTHER WORK ............................................................................... 80
14 REFERENCES...................................................................................... 81
APPENDIX 1 – QUANTITATIVE SURVEY ....................................................... 87
4

1 Abstract
1.1.1 The purpose of this study is to gain some understanding of the factors that
motivate employees working at the Accident Compensation Corporation
(“ACC”) in New Zealand.
1.1.2 ACC is a Crown Corporation, set up by the New Zealand Government to
administer New Zealand’s accident compensation scheme and provide
comprehensive 24-hour, no fault personal accident cover for all New
Zealand citizens, residents and temporary visitors to New Zealand.
1.1.3 A review of the current literature on workplace motivation has uncovered
a plethora of theories, including Maslow’s Hierarchy of Needs, Theory X,
Theory Y, Herzberg’s Two-Factor Theory, Job Characteristics Theory,
Equity Theory, Expectancy Theory, Goal Setting Theory, Social Cognitive
Theory and the High-Performance Cycle.
1.1.4 Some literature also suggests differences in motivational factors between
workers in different countries and between private and public sector
employees.
1.1.5 In this study a triangulation research approach has been taken, consisting
of primary, qualitative, phenomenology based research and secondary,
largely quantitative research in the form of a staff survey.
1.1.6 Research results indicate that the significant factors motivating employees
working at ACC are the work itself, a sense of achievement and
recognition.
1.1.7 A comparison of the research findings and theoretical models suggests that
whilst some existing theories explain some of the motivational factors
pertaining to ACC employees, Locke & Latham’s (1990) “High-
Performance Cycle” best describes the motivational construct within ACC.
1.1.8 No evidence was found to support the findings of some researchers that
there are differences between the motivational factors affecting public
sector and private sector employees.
5

1.1.9 A discussion on how the High-Performance Cycle could inform ACC’s
human resource policies and processes leads to several recommendations
including:
− Investigating job design or redesign as a source of increased
motivation, including the level of challenge, meaningfulness and
growth facilitation each role provides. Possible solutions suggested
include job enlargement (vertically and horizontally), job rotation,
secondments or one-off project work.
− Increasing the level of self-efficacy of those employees identified as
having low levels
− Identifying and reducing situational constraints
− Setting employee objectives having regard to goal commitment, goal
conflict and the alignment of individual objectives with team and
organisational objectives.
− Providing feedback through development of a “culture of feedback and
praise”
− Ensuring that employees perceive external rewards as attainable,
personal, fair and not a punishment.
− Shifting focus from employee satisfaction to employee motivation.
1.1.10 In light of this study, it is proposed that further work is required in three
areas:
− An investigation of ACC’s lower performing employees. Such a study
may provide further understanding of what motivates employees
working at ACC as well as ways of reducing the rate of turnover and
improving various human resource processes, including recruitment
and staff management.
− Investigating the motivation and performance of teams within ACC as
well as the interaction between them.
6

− An investigation of the interaction of employees’ work and non-work
motivation levels.
7
2 Introduction
2.1 Background to ACC
2.1.1 The Accident Compensation Corporation (“ACC”) is a Crown
Corporation, set up by the New Zealand Government to administer New
Zealand’s accident compensation scheme and provide comprehensive 24-
hour, no fault personal accident cover for all New Zealand citizens,
residents and temporary visitors to New Zealand.
2.1.2 ACC has gone through some significant structural change in the last 18
months. Now, senior management are starting to focus on the softer
aspects of ACC - the culture, values, competencies and motivators of its
staff.
2.2 Background on the Topic
2.2.1 As a starting point, ACC needs to gain a deeper understanding of what
motivates its employees, followed by a review of its performance
evaluation and reward systems.
2.2.2 There are numerous theories on what motivates employees – Content
Theories such as Maslow’s Hierarchy of Needs, McClelland’s Three Basic
Needs and Herzberg’s Motivators and Hygiene Factors; and Process
Theories such as Equity Theory, Latham and Locke’s Goal-Directed
Theory, Porter and Lawler’s Expectancy Theory, Bandura’s Self-Efficacy
Theory and Hackman and Oldman’s Job Design Theory.
2.2.3 There are business risks associated with ACC simply applying one or more
of these theories within the organisation. Any one theory may not apply to
ACC’s employees, or it may only apply to some, rather than all, employees.
2.2.4 Once ACC has a better understanding of what motivates its employees, it
can then set about redesigning its performance review systems to align
with this deeper understanding. That is, whilst recognising the
relationship that exists between the various elements in a performance
review system, the intended focus of this research is investigating what
motivates ACC employees.
8

3 Aims, Objectives, Research Question
3.1 Why This Topic Is Important To Investigate?
3.1.1 The topic of employee motivation has been well researched and written
about. However, most of the research has been in respect of private sector
employees in the United States. Whilst there has been some research
regarding the potential differences between private sector and public
sector employee motivation, again this is mostly with reference to North
American employees. Some studies based in other countries have
uncovered differences between what motivates employees in that country
compared to the United States.
3.1.2 A review of the literature has not revealed any studies regarding the
motivation of employees working in the New Zealand public sector.
3.1.3 The abundance of theories on employee motivation (e.g. Expectancy
Theory, Equity Theory, Need Theories, Job Design), the fact that some
theories may apply better than others in the public sector and the lack of
country specific research mean that a study of what motivates employees
working in ACC will prove useful for the organisation.
3.2 Personal Development Objectives
3.2.1 Prior to embarking on the Henley MBA course all of the author’s university
and post-university studies have been of a very technical nature. The
author holds a Master’s degree in Computing and Mathematical Sciences
and he is a qualified actuary.
3.2.2 The main reason for enrolling in the Henley MBA course was to be
exposed to, and gain a deeper understanding of, the non-actuarial aspects
of insurance business administration such as human resources, marketing
and process improvement. This dissertation, in the area of human
resources, will be the final stage of this journey.
3.2.3 Whilst conducting research in the area of employee motivation the author
hopes to be able to more accurately identify what motivates him to work
and perform to the best of his abilities. By achieving this objective the
9
author hopes to gain a better understanding of who he is, both personally
and professionally.
3.3 Career Development Objectives
3.3.1 The author is currently the Chief Actuary at ACC and manages an
Actuarial Services Team of ten staff. He expects his next career move to be
in to a general manager role. Completion of this dissertation will
demonstrate to ACC, or any prospective employer, the author’s abilities to
work outside his area of technical expertise.
3.3.2 In the author’s view, the role of a general manager is to establish the
vision/strategic direction for their division and motivate their staff to work
towards that vision. Having an appreciation of what motivates employees
will assist in this endeavour.
3.4 ACC’s Objectives
3.4.1 Following the appointment of a new Chief Executive, Dr Jan White, ACC’s
General Management team was restructured in mid to late 2006. Now that
Dr White’s desired corporate structure is in place she intends changing the
culture of ACC to a “culture of success” with the intent that employees are
motivated to, and rewarded for, performing to the best of their abilities
both individually and collectively.
3.4.2 It is important for ACC to gain a better understanding of what motivates
its staff before redesigning their performance evaluation and reward
systems. Otherwise, the various components of the proposed new systems
may not align and the desired corporate outcomes may not be achieved.
3.5 Henley’s Objectives
3.5.1 The author believes that this dissertation, on the topic of what motivates
employees working at ACC, meets the “Aims of the Dissertation” set by
Henley Management College, which are:
• to allow you to apply the learning that you have acquired during your
MBA/MSc studies to a specific management issue
10

• to provide you with an opportunity to study a topic, that is of interest
and relevance to you, in a detailed and thorough way such that you
become highly experienced in the issues under investigation
• to expose you to the principles and process of academic enquiry and
business research
• to enable you to demonstrate your ability to think conceptually, as
well as develop and communicate structured and rational thinking
3.6 Research Questions
3.6.1 The primary motivation for this research is to provide the Accident
Compensation Corporation, an organisation within the New Zealand
public sector, with some insights in to what motivates its employees.
3.6.2 The specific research questions this research will endeavour to answer are:
1. What factors motivate employees working at ACC?
2. How do the observed motivational factors compare with current
motivational theories?
11

4 Literature Review
4.1 Definition of Motivation
4.1.1 The word motivation is derived from the Latin word “movere” (to move,
stir, excite, cause).
4.1.2 Atkinson (1964) defined motivation as “the contemporary (immediate)
influence on direction, vigor, and persistence of action”.
4.1.3 Vroom (1964) defined motivation as “a process governing choice made by
persons…among alternative forms of voluntary activity”.
4.1.4 Motivation, in the context of the working environment, has also been
defined as the process by which behaviour is energised, directed, and
sustained in organisational settings (Steers & Porter, 1991).
4.1.5 According to Pinder (1998), motivation is “a set of energetic forces that
originate both within as well as beyond an individual’s being, to initiate
work related behaviour, and to determine its form, direction, intensity,
and duration.”
4.1.6 According to Steers, Mowday and Shapiro (2004) these and other
definitions are all principally concerned with the factors or events that
energise, channel, and sustain human behaviour over time.
4.1.7 The importance of work motivation is expressed by the equation (Maier,
1995):
Job Performance = Ability x Motivation
4.1.8 Further, public service motivation has been defined as an individual’s
predisposition to respond to motives grounded primarily or uniquely in
public institutions and organisations (Perry & Wise, 1990).
4.2 Motivational Theories
4.2.1 As Ambrose & Kulik (1999) state, “We cannot actually see work
motivation nor can we measure it directly. Instead, we rely on established
theories to guide us in measuring the observable manifestations of work
motivation”.
12
4.2.2 There are numerous theories regarding what motivates employees.
Ramlall (2004) suggests that “motivational theorists differ on where the
energy is derived and on the particular needs that a person is attempting to
fulfil, but most would agree that motivation requires a desire to act, an
ability to act, and having an objective”.
4.2.3 The sections below provide an overview of the major motivational theories
as they developed in roughly chronological order.
4.3 Early Work on Motivation
4.3.1 In 1913 Freud suggested that motivation was biological or sexual in
nature. However, Freud’s theories were based on sessions with people he
saw who had personal problems, rather than work related issues, with no
supporting empirical evidence (Latham, 2007).
4.3.2 Bandura (2004) noted that psychodynamic theories, including Freud’s,
faired poorly when subjected to close empirical scrutiny and also lacked
predictive power. Outcome studies showed that it was difficult to change
human behaviour by talk alone. These studies led to a shift from
unconscious psychic dynamics to causal analysis of the interplay among
personal, behavioural, and environmental influences without reference to
the unconscious (Latham, 2007).
4.3.3 At the same time as Freud, John Watson (1913) founded the philosophy of
behaviourism, which focused on the effect of the environment on
behaviour. Behaviourists believe that there is an immediate response of
some sort to every effective stimulus. Thus, the objectives of behavioural
science are to:
a) Predict the response to a known stimulus; and
b) Identify the stimulus, knowing the response (Latham, 2007).
4.3.4 An experimental psychologist, E Thorndike (1911), discovered what he
called the law of effect:
“Of several responses made to the same situation, those which are accompanied
or closely followed by satisfaction to the animal will, other things being equal, be
more firmly connected with the situation, so that, when it recurs, they will be
more likely to recur; those which are accompanied or closely followed by
13

discomfort to the animal will, other things being equal, have their connections
with that situation weakened, so that, when it recurs, they will be less likely to
occur. The greater the satisfaction or discomfort, the greater the strengthening or
weakening of the bond.”
4.4 Scientific Management
4.4.1 Fredrick Taylor (1856 – 1915) was one of the first to investigate the
“science of management” by attempting to systemically analyse human
behaviour at work. The approach Taylor took was to break down each task
in to its smallest parts and identify the best way to complete each part.
This “best approach” was then taught to all workers. In this way, Taylor
attempted to restrict workers’ behavioural alternatives and hence remove
human variability from each work task.
4.4.2 In summary, Taylor proposed the following four principles of scientific
management:
• Methods based on a scientific study of task should replace basic “rule-
of-thumb” methods.
• Ensure these science based methods are being adhered to.
• Rather than passively leaving workers to train themselves, every
worker should be scientifically selected and trained.
• Work should be divided such that managers apply scientific
management theory to work planning and the workers subsequently
perform the designed tasks.
4.4.3 The results of implementing Taylor’s ideas included increased productivity
as well as developments in industrial engineering, quality control and the
separation of planning from operations.
4.4.4 However, the application of scientific management in the workplace wasn’t
without its problems. The downside of scientific management included
employee boredom, labour/management conflicts, staff apathy and wasted
human resources (Wertheim, 2007).
14
4.5 Hawthorne Studies
4.5.1 Between 1927 and 1933 a series of studies on employee productivity were
carried out at the Hawthorne plant of the Western Electric Company.
4.5.2 During these studies, not all observed worker responses to motivational
factors were as predicted by scientific management theory. In particular,
workers showed an interest in the treatment (i.e. reward and punishment)
of their fellow workers, which was not expected. And so the “Human
Relations Movement” was borne.
4.5.3 These studies also led to the “realisation that the productivity, satisfaction,
and motivation of workers were all interrelated” (Roethlisberger, 1977).
4.5.4 The observed psychological reaction to the increase in attention the
employees received during the studies led to the phrase “the Hawthorne
effect” (Adair, 1984).
4.6 Attitude Surveys
4.6.1 The 1930s saw an increase in the popularity and use of attitude surveys,
including the use of the Thurstone (1929) scale and the simpler Likert
(1932) scale.
4.6.2 The results of these surveys brought in to question the validity of the
principle that employees are uniformly motivated by a desire for money
(Latham, 2007).
4.6.3 Two studies in particular by Houser (1938) and Hoppock (1935) on job
satisfaction were the precursor to the work of Maslow (1943) and
Herzberg (Herzberg et al, 1959).
4.7 Maslow’s Hierarchy of Needs Theory
4.7.1 Maslow (1943) proposed five basic needs arranged in a hierarchy of
prepotency – physiological (at the bottom), safety, social, esteem and self-
actualisation (at the top). Maslow suggested that the most prepotent need
will monopolise a person’s consciousness and serve as the centre of
organisation of behaviour. But when a need is fairly well satisfied, the next
prepotent (i.e. higher) need emerges in turn to dominate the person’s
consciousness, since gratified needs are not active motivators.
15

4.7.2 One criticism of Maslow’s theory was that, like Freud’s theory of
psychoanalysis, it was based on conclusions drawn from observations of
individuals who came to Maslow for assistance in coping with personal
difficulties (Latham, 2007).
4.7.3 Wahba & Bridwell’s (1976) review and evaluation of the empirical
evidence related to Maslow’s Hierarchy of Needs Theory showed little clear
or consistent support for the theory from available research findings.
Wahba & Bridwell found that some of Maslow’s propositions were totally
rejected, while others received mixed and questionable support at best.
However, Wahba & Bridwell go on to suggest that these findings do not
necessarily invalidate Maslow’s Hierarchy of Needs Theory because it is
almost a non-testable theory.
4.7.4 Maslow (1965) himself said that:
“My work on motivations came from the clinic, from a study of neurotic people.
The carry-over of this theory to the industrial situation has some support from
industrial studies, but certainly I would like to see a lot more studies of this kind
before feeling finally convinced that this carry-over from the study of neurosis to
the study of labor in factories is legitimate. The same thing is true of my studies of
self-actualizating people – there is only this one study of mine available. There
were many things wrong with the sampling, so many in fact that it must be
considered to be, in the classical sense anyway, a bad or poor or inadequate
experiment. I am quite willing to concede this – as a matter of fact, I am eager to
concede it – because I’m a little worried about this stuff which I consider to be
tentative being swallowed whole by all sorts of enthusiastic people, who really
should be a little more tentative in the way that I am.”
4.7.5 Hall & Nougaim (1968) found that, in a study of the first five years of the
careers of a group of managers, no strong evidence for either Maslow’s
hierarchy or a revised two-level hierarchy was observed. However, what
was observed, as the managers advanced, was a decrease in the need for
safety and an increase in the needs for affiliation, achievement and esteem,
and self-actualisation.
4.7.6 Alderfer (1972) reformulated Maslow’s theory based on three related
needs:
• Existence (e.g. salary, non-cash rewards)
16

• Relatedness (e.g. social interactions)
• Growth (e.g. esteem, self-actualisation).
4.7.7 Thus, this theory was referred to as the “ERG Theory” of motivation.
4.7.8 Unlike the hierarchy proposed by Maslow, Alderfer’s ERG Theory assumed
these three related needs could act simultaneously.
4.8 Theory X and Theory Y
4.8.1 Following on from early work in the area of scientific management came
the development of “Theory X” (McGregor, 1957), which was based on
the assumption that without active management intervention, people are
passive, or even resistant, to organisational needs.
4.8.2 In summary, Theory X is based on the assumptions that all workers are
lazy and attempt to avoid work, are not ambitious, dislike taking
responsibility, lack initiative and must be either rewarded or punished in
order to get them to do any work (i.e. the “carrot and stick” approach to
management).
4.8.3 Giving consideration to the results of the Hawthorne studies, McGregor
went on to show that Theory X was not an adequate approach to
motivation and in turn articulated “Theory Y”, which was based on
Maslow’s Hierarchy of Needs Theory. In particular, McGregor believed
that Maslow’s higher order needs of self-actualisation and esteem are never
completely met and could therefore be used to motivate employees.
4.8.4 Theory Y suggests that (McGregor, 1957):
“The motivation, the potential for development, the capacity for assuming
responsibility, the readiness to direct behavior toward organizational goals are all
present in people. Management does not put them there. A responsibility of
management is to make it possible for people to recognize and develop these
human characteristics for themselves.”
4.8.5 Thus, Theory Y differs from Theory X in that Theory Y emphasises self-
control and self-direction whereas Theory X is focuses on the external
control of behaviour.
17
4.9 Herzberg’s Two-Factor Motivation Theory
4.9.1 Herzberg’s Two-Factor Motivation Theory (Herzberg et al, 1959) suggests
that job satisfaction and job dissatisfaction are not opposite ends of a
spectrum. Rather, this theory suggests that there are two sets of factors.
The lack of one set (i.e. “hygiene” factors that are extrinsic to the job)
produces job dissatisfaction whilst the presence of them produces no
dissatisfaction, but does not produce job satisfaction. The presence of the
other set (i.e. “motivator” factors that are intrinsic to the job) produces job
satisfaction whilst the lack of them does not produce dissatisfaction.
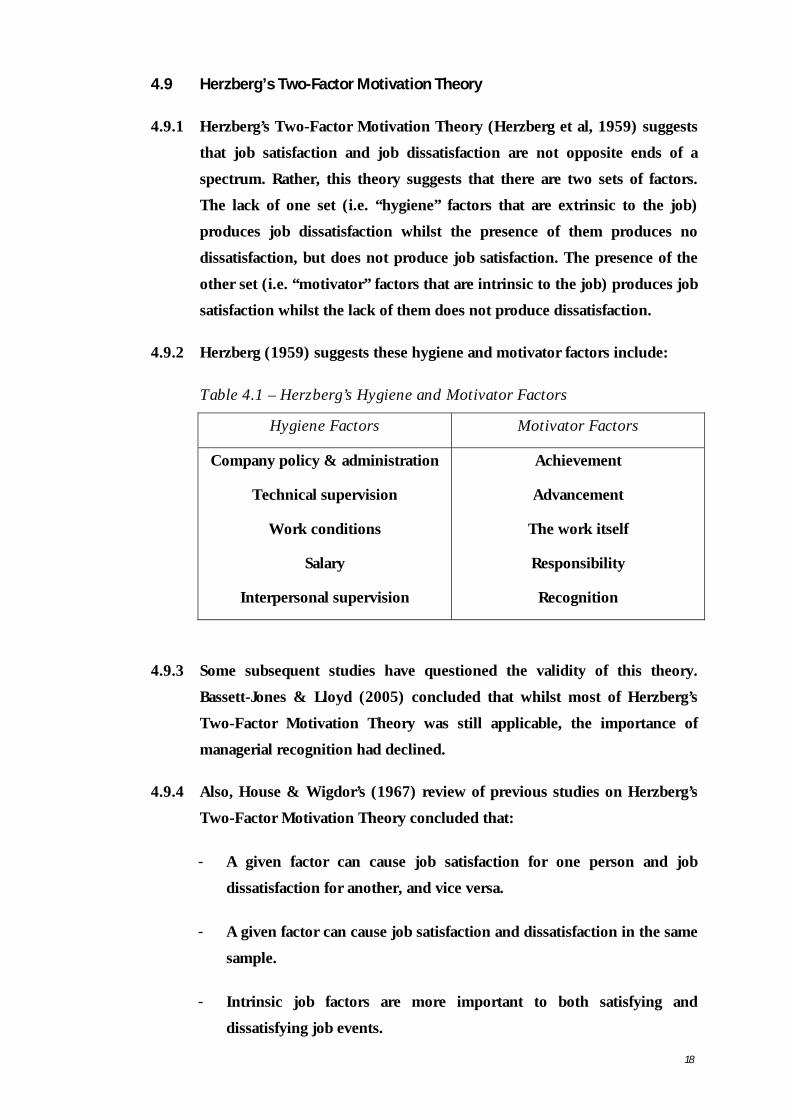
4.9.2 Herzberg (1959) suggests these hygiene and motivator factors include:
Table 4.1 – Herzberg’s Hygiene and Motivator Factors
Hygiene Factors Motivator Factors
Company policy & administration
Technical supervision
Work conditions
Salary
Interpersonal supervision
Achievement
Advancement
The work itself
Responsibility
Recognition
4.9.3 Some subsequent studies have questioned the validity of this theory.
Bassett-Jones & Lloyd (2005) concluded that whilst most of Herzberg’s
Two-Factor Motivation Theory was still applicable, the importance of
managerial recognition had declined.
4.9.4 Also, House & Wigdor’s (1967) review of previous studies on Herzberg’s
Two-Factor Motivation Theory concluded that:
- A given factor can cause job satisfaction for one person and job
dissatisfaction for another, and vice versa.
- A given factor can cause job satisfaction and dissatisfaction in the same
sample.
- Intrinsic job factors are more important to both satisfying and
dissatisfying job events.
18

- Herzberg’s Two-Factor Motivation Theory is an oversimplification of
the relationships between motivation and satisfaction, and the sources
of job satisfaction and dissatisfaction.
4.9.5 Vroom (Latham, 2007) explained the two-factor aspect of Herzberg’s
theory as a methodological artefact. He suggested that Herzberg’s results
were only replicated when the “critical incidence technique” was used.
4.10 Job Characteristics
4.10.1 Job Design Theory is based on the assumption that it is the characteristics
of the job or work itself that motivates an employee. In particular, a
challenging and varied job increases motivation whereas a boring and
monotonous job decreases motivation (Ramlall, 2004).
4.10.2 Job Characteristics Theory (Hackman & Oldman, 1976) suggests that an
employee will be intrinsically motivated by their job when that job
generates three critical psychological states:
1. The employee must feel personal responsibility for the outcomes of the
job
2. The work must be experienced as meaningful by the employee
3. The employee must be aware of how effective they are in converting
their effort in to performance
4.10.3 Hackman & Oldman (1976) stated that five job characteristics (task
significance, task identity, skill variety, feedback and autonomy) were
important in evoking these three psychological states.
4.11 Equity Theory
4.11.1 Equity Theory suggests that an employee is not only interested in the
absolute level or value of the rewards they receive, but also how their
rewards compare to others. Any perceived imbalance creates tension, and
subsequently motivation, as employees work towards what they believe is
a state of equity (Adams, 1963).
4.11.2 Carrell & Dittrich (1978) states that Equity Theory is based on three
assumptions:
19

- Employees develop beliefs about what constitutes a fair and equitable
return for their work contributions
- People tend to compare what they perceive to be the exchange they
have with their employers
- When people believe that their own treatment is not equitable, relative
to the exchange they perceive others to be making, they will be
motivated to take actions they deem appropriate
4.11.3 Equity Theory has been criticised for its lack of predictability due to its
complexity and the multitude of ways in which inequity can be resolved
(Campbell et al, 1970).
4.12 Expectancy Theory
4.12.1 Expectancy Theory is based on the assumption that people are motivated
to perform by the expectation of what they will receive in return (Vroom,
1964). This theory suggests that motivation is a combined function of the
employee’s perception that effort will lead to performance and of the
perceived desirability of outcomes that may result from the performance
(Ramlall, 2004).
4.12.2 Porter & Lawler (1968) developed an expectancy model that extended
Vroom’s work. In this model, effort was expressed as a function of the
perceived value of a reward and the perceived effort-reward probability.
This expanded theory took in to account an employee’s ability as well as
role clarity in linking a person’s effort to job performance (Steers et al,
2004).
4.12.3 Locke (1975) criticised Expectancy Theory, saying it was incorrect in
assuming that:
• people choose to maximise outcomes, or
• they usually perform complex calculations in making choices that will
enable them to maximise outcomes.
20
4.12.4 In 2003 Vroom stated that (Latham, 2007):
“The notion that people consider all possible outcomes in expectancy theory is
implausible. Furthermore, the thought that they multiply these terms and add
them up is really inconsistent with the knowledge of information processing and
cognitive psychology. They clearly don’t do that, and I knew they didn’t do that.
But, I didn’t have a theory of arousal – about what goals or expectations would be
aroused in any given moment. That’s the chief limitation of expectancy theory. It
has naïve assumptions about arousal.”
4.12.5 Schmidt (1973) was also critical of Expectancy Theory, stating that whilst
the theory assumed reward value or valence could be measured on a ratio
scale when in fact there was no known way of doing so. House, Shapiro &
Wahba (1974) reached similar conclusions following their review of
various studies which tested Expectancy Theory.
4.13 Goal Setting Theory
4.13.1 Locke & Latham (2002) define a goal as the object or aim of an action.
4.13.2 Goal Setting Theory asserts that task performance is regulated directly by
the conscious goals that individuals are trying for on the task (Locke &
Latham, 1990).
4.13.3 Goal Setting Theory is based on three propositions (Locke, 1968):
• specific high goals lead to better performance than specific easy goals,
general goals such as “do your best”, or no goals
• given goal commitment, the higher the goal the higher the
performance
• variables such as monetary incentives, participation in decision
making, feedback or knowledge of results affect performance only to
the extent that they lead to the setting of and commitment to specific
high goals
4.13.4 Locke (1996) also found that self-efficacy influenced both the difficulty of
the goal accepted and commitment to the goal.
21

4.13.5 Latham (2007) suggests that given goal commitment, job performance
improves because the goal provides a regulatory mechanism that allows
the employee to observe, monitor, subjectively evaluate, and adjust job
behaviour in order to attain the goal.
4.13.6 Bavelas & Lee (1978) suggest one limitation of Goal Setting Theory is that
an employee’s focus on one goal may be at the expense of one or more of
their other goals. For example, focusing on quantity may be at the
expenses of quality.
4.13.7 Wright et al (1993) suggest an employee who is focused on achieving their
own goals may not be inclined to help others to achieve their goals.
4.13.8 Locke et al (1994) suggest goal conflict may arise when an individual is
not able to prioritise two or more of their goals and that this conflict
usually results in the performance on both goals suffering.
4.14 Social Cognitive Theory
4.14.1 The fundamental concept underpinning Social Cognitive Theory is that
behaviour is a continuous reciprocal interaction of behavioural, cognitive
and environmental variables. That is, this theory argues that behaviour is
both determined by and affects environmental consequences, which in
turn affect an employee’s goals, and vice versa (Latham, 2007).
4.14.2 Latham (2007) suggests that Social Cognitive Theory and Goal Setting
Theory are similar in that both emphasise the importance of conscious
goals for predicting, explaining and regulating performance.
4.14.3 Social Cognitive Theory differs from Vroom’s Expectancy Theory in two
main areas. Firstly, Social Cognitive Theory includes goal setting.
Secondly, Expectancy Theory states that motivation is governed by the
expectation that effort will lead to performance which in turn will result in
outcomes that are on a continuum from unvalued to valued. In contrast,
Social Cognitive Theory argues that people exclude entire classes of
options on the basis of their perceived efficacy or ability (Latham, 2007).
22

4.15 Critical Management Theory
4.15.1 Benson (1977) suggests that the study of organisations has been guided by
a succession of theories and by positivist methodology. And in a “chicken
and egg” type situation, established theoretical constructs tend to affirm
present organisational realties and to deal with only relatively minor
adjustments within the present order. That is, any efforts to radically
transform organisations would undermine the corresponding theories.
4.15.2 Benson (1977) proposes the construction of an emancipatory alternative
approach to organisational studies: dialectical analysis. Benson (1977)
discusses four principles of dialectical analysis which, he suggests, provide
a guiding perspective for organisational studies grounded in a view of
human social life.
4.15.3 The four principles Benson (1977) developed are:
• Social Construction/Production: An appreciation of how the social
world is constructed and transformed. Through interactions with each
other, people build up social patterns and eventually a set of
institutional arrangements are established. Gradual modification or
replacement of these initial arrangements will occur through
continued interactions.
• Totality: When studying social phenomena attention needs to be given
to their multiple interconnections.
• Contradiction: The social order produced in the process of social
construction contains contradictions in the fabric of social life. These
social contradictions have an effect on the creation, constraining and
changing of social arrangements.
• Praxis: The free and creative reconstruction of social arrangements on
the basis of a reasoned analysis of both the limits and the potentials of
present social forms.
4.15.4 One important dimension of dialectical analysis is the critique of theories
which affirm the present order or which deal only with minor adjustments
or variations upon that order. Another important dimension of such
23

analysis is the search for alternatives based on the view that the future is
full of possibilities, and not necessarily a projection of the present order
(Benson, 1977).
4.15.5 Frost (1980) asserts that critical organisation science should attempt a
combination of theory and revolutionary action aimed at making
individuals fully aware of the contradictions and injustices in their
organisational existence and at assisting them to find a path out of these
contradictions.
4.15.6 Frost (1980) goes on to suggest that:
“A framework for the practice of organization science must take into account the
distinctions between what can be done and what should be done, and must
provide, through critical theory, the opportunity for rationale consensus about
what can be done as well as what should be done. Elimination of communication
distortion is a primary objective in this process and the path to this objective
requires clear identification of the way power is distributed and used in the
existing organizational arena.
Underpinning this interrelationship of empirical, practical, and critical elements
is the notion of transition, of impermanence, of socially constructed
organizational arrangements forming, stabilizing, and dissolving. Thus, any
attempt at organizational practice, at implementation, requires a commitment to
dialectical analysis”
4.16 The High-Performance Cycle
4.16.1 In 1990, Locke & Latham (1990) proposed what they described as a
coherent, data-based theory of work motivation and job satisfaction. They
called this theory the “High-Performance Cycle”, which combined aspects
of Goal Setting Theory, Expectancy Theory, Social Cognitive Theory,
Attribution Theory, Job Characteristics Theory, Equity Theory and
Turnover-Commitment Theory.
4.16.2 The High-Performance Cycle is illustrated in the following diagram.
24

Figure 4.1: The High-Performance Cycle
Demands: Challenge, high goals on meaningful, growth-facilitating tasks, or series of tasks plus high self-efficacy
Contingent rewards (internal, external)
Mediating Mechanisms: Effort Persistence Direction Task strategies (plans)
Moderating Factors: Goal commitment Feedback Ability Task complexity Situational constraints
Rewards: Non-contingent rewards
Satisfaction
Consequences: Commitment to organisation and willingness to accept future challenges
Source: Locke & Latham (1990)
4.16.3 The cycle starts on the left hand side with employees facing high challenge
or difficult goals. If high challenge is accompanied by high expectancy of
success or self-efficacy, high performance results, given that there is
commitment to the goals, feedback, adequate ability and low situational
constraints. High performance is achieved through four mechanisms:
direction of attention and action, effort, persistence and the development
of task strategies and plans. High performance, if rewarded, leads to job
satisfaction, which in turn facilitates commitment to the organisation and
its goals.
4.16.4 Latham (2007) states that the theoretical significance of the High-
Performance Cycle is that it provides a comprehensive sequence of causal
relationships that is consistent with research findings based on a number
of different theories. Latham also states that the practical significance of
the High-Performance Cycle is that it provides a model or framework for
creating both a high performing and a highly satisfied workforce.
25
4.17 Motivation in the Public Sector
4.17.1 Perry & Wise (1990) suggest that public service motivation is an
individual’s predisposition to respond to motives grounded primarily or
uniquely in public institutions and organisations.
4.17.2 In 1982, Perry & Porter (1982) noted that “the literature on motivation
tends to concentrate too heavily on employees within industrial and
business organisations”.
4.17.3 Nearly 20 years later, Wright (2001) stated that “while work on
motivation has been a prominent area of interest in organizational
behaviour and continues to be one of the most frequently discussed topics
in psychology, it has been and continues to be largely ignored by public-
sector scholars”.
4.17.4 However, there has been some work specifically focused on the motivation
of public sector employees and the potential differences when compared to
private sector employees.
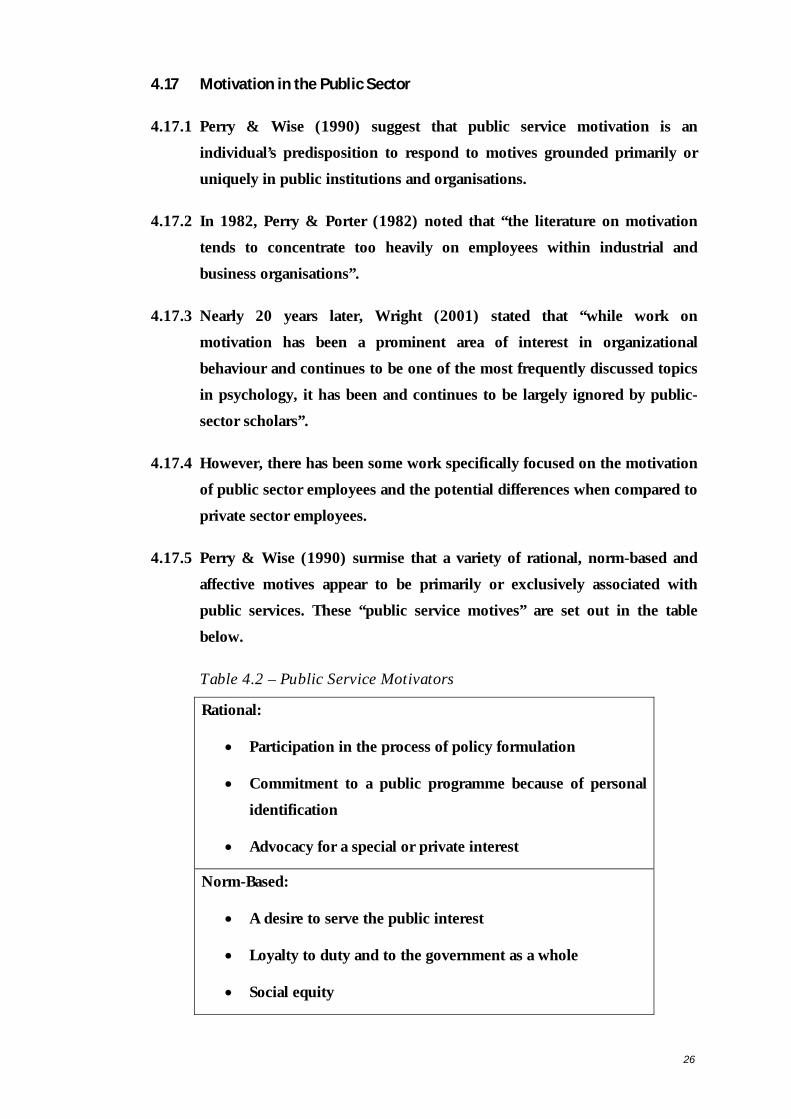
4.17.5 Perry & Wise (1990) surmise that a variety of rational, norm-based and
affective motives appear to be primarily or exclusively associated with
public services. These “public service motives” are set out in the table
below.
Table 4.2 – Public Service Motivators
Rational:
• Participation in the process of policy formulation
• Commitment to a public programme because of personal
identification
• Advocacy for a special or private interest
Norm-Based:
• A desire to serve the public interest
• Loyalty to duty and to the government as a whole
• Social equity
26

Affective:
• Commitment to a programme from a genuine conviction
about its social importance
• Patriotism of benevolence
4.17.6 Perry & Wise (1990) propose that one of the behavioural implications of
public service motivation is that public organisations that attract members
with high levels of public service motivation are likely to be less dependent
on utilitarian incentives to manage individual performance effectively.
4.17.7 Maidani (1991) compared public sector and private sector employees’
ratings of the importance of fifteen job factors. The purpose of his study
was to identify how Herzberg’s Two-Factor Motivation Theory applied to
these two different working populations. One of his conclusions was that
public sector employees place a significantly higher value on extrinsic,
hygiene factors than private sector employees. Interestingly, one of
Maidani’s other conclusions was that for both groups the extrinsic,
hygiene factors were also sources of satisfaction, which conflicts with
Herzberg’s Two-Factor Motivation Theory that hygiene factors are sources
of dissatisfaction rather than satisfaction.
4.17.8 In contrast to Maidani (1991), Wittmer (1991) found that public
employees view the importance of status or esteem needs as lower than do
private sector employees. And Newstrom et al (1976) found that there was
no difference.
4.17.9 Khojasteh (1993) investigated the differences in the motivation of private
versus public sector managers via a survey of intrinsic and extrinsic factors
based on Herzberg’s Two-Factor Motivation Theory. He concluded that
“pay” and “security” had significantly greater motivating potential for
private managers but that “recognition” had a higher motivational
potential for public sector managers.
4.17.10 Rainey & Bozeman (2000) assessed several major streams of empirical
research comparing public and private organisations. They concluded that,
in spite of general agreement that public organisations have more goal
complexity and ambiguity, public managers do not differ from business
27

managers in response to survey questions about such matters. Also, public
managers do not differ from business managers on perceptions about
organisational formalisation, in spite of assertions that government
agencies have more red tape and rules than private firms do. However,
public managers do show very sharp differences in response to questions
about constraints under personnel and purchasing rules.
4.17.11 Perry (2000) developed a process theory of public service motivation,
based on four premises:
- Rational, normative and affective processes motivate humans
- People are motivated by their self-concepts
- Preferences or values should be endogenous to any theory of
motivation
- Preferences are learned in social processes
4.17.12 Perry’s (2000) theory is summarised in the following diagram.
Figure 4.2: Perry’s Public Sector Motivation Model
Education - Professional
training - Education
level
Socialisation - Religion - Parental
relations
Life Events - Observational - Learning/
Modelling
Abilities
Competencies
Rational Choice
Rule-
Governed Behaviour
Obligation
Institutions - Beliefs - Values - Ideology
Job Characteristics
Organisational
Incentives
Work Environment
Self-Concept - Values - Identity
Self-Regulatory Processes
Sociohistorical Context
Motivational Context
Individual Characteristics
Behaviour
28

4.17.13 Research by Wright (2001a) found that nearly 75% of the variance in
work motivation among public employees was explained by the three
variables – job goal difficulty, job goal specificity and self-efficacy. As these
variables are the foundations of Goal Setting Theory and Social Cognitive
Theory, these findings support the application of both theories in the
public sector.
4.17.14 Wright’s (2001) review of the literature on public sector work motivation
led him to surmise that not only have no consistent public-private sector
differences been found, little has been done to identify whether any
differences have a meaningful impact upon work motivation.
4.17.15 Following his literature review, Wright (2001) combined theory and
empirical evidence regarding the unique characteristics of public
organisations and employees with contemporary psychological theories of
work motivation to develop a revised public sector model of work
motivation, which is summarised in the diagram below:
Figure 4.3: Wright’s Public Sector Model of Work Motivation
Employee Motives
Work Context
Job Attitudes
Job Characteristics Work
Motivation
Organisational Goals
Importance
Conflict
Specific
Rewards
Procedural Constraints
Goal Content
Difficult
Specific
Goal Commitment
Goal Importance
Self-Efficacy
4.17.16 Wright (2001) asserts that this model provides a theoretical framework
for future public sector research on work motivation that may be able to
29

identify specific leverage points that can increase work motivation, and
therefore productivity, in the public sector.
4.18 Motivation in Countries outside the United States
4.18.1 Analoui’s (2000) study of senior managers in Romania concludes that
although there are similarities between what motivates senior managers in
both Western and Eastern European countries, the differences point to the
need for better understanding of senior managers, their perception and
their views as well as organisational and the wider contexts in which they
work.
4.18.2 Jabroun & Balakrishnan’s (2000) study suggests that Porter & Lawler’s
Expectancy Theory is valid in predicting the level of motivation to
participate in decision-making among managerial employees in the public
sector setting in Malaysia.
4.18.3 Ruthankoon & Ogunlana (2003) conclude from their study that
Herzberg’s Two-Factor Motivation Theory is not entirely applicable in the
construction industry in Thailand.
4.18.4 Katsva & Condrey (2005) investigated the motivation of employees
working in nuclear power plants in Russia. They concluded that nuclear
power plant employees in Russia have the same kind of motivation as U.S.
public employees. This contradicted previous research which indicated
that the mentality of Russian employees differed from the mentality of
Western employees mainly because it is based on Orthodox rather than
Protestant values.
4.18.5 Pathak et al (2005) conducted a study of shipping companies in Cyprus.
Their findings confirmed the applicability of ‘Best Human Resource
Management Practices’ and the existence of a positive association between
employees’ experience of a high number of ‘Best Human Resource
Management Practices’ and psychological contract, higher motivation and
commitment levels.
30
4.19 Summary
4.19.1 Locke & Latham (2004) suggest that:
“When beginning to study the plethora of existing work motivation theories,
one’s reaction is sometimes bewilderment at the enormous variety of concepts
and approaches. But, if one looks closely, it is evident that, for the most part,
these theories, though flawed and/or limited in various respects, do not so much
contradict one another as focus on different aspects of the motivation process.”
4.19.2 A review of the literature has not revealed any studies regarding the
motivation of employees working in the New Zealand public sector.
4.19.3 The current motivational theories are based predominantly on employees
working in the United States private sector. There is evidence that some of
the existing theories are not valid in certain circumstances, including the
public sector and/or other countries. For the Accident Compensation
Corporation, an organisation within the New Zealand public sector, using
one of the existing theories to inform human resource decisions (e.g.
redesigning its performance evaluation and reward systems) without
considering its appropriateness or applicability could be problematic.
31

5 Research Design
5.1 Approach
5.1.1 Saunders et al (2003) suggest that research methods do not exist in
isolation. Further, it may be beneficial in a single study to combine two or
more research methods and to use both primary and secondary data.
5.1.2 Jick (1979) defines triangulation as the combining of research methods in
the study of the same phenomenon. Jick (1979) suggests it is possible that
researchers can improve the accuracy of their judgements by collecting
different kinds of data bearing on the same phenomenon.
5.1.3 Jick (1979) further states that triangulation may be used not only to
examine the same phenomenon from multiple perspectives but also to
enrich our understanding by allowing for new or deeper dimensions to
emerge.
5.1.4 It was therefore decided to employ two different research methods and two
sources of data in this study of what motivates employees at ACC:
- a qualitative method: phenomenology, where data will be collected
directly from employees via semi-structured interviews, and
- a quantitative method: structured survey, where secondary data
collected from a survey undertaken by ACC’s Human Resources
department will be used.
32

6 Qualitative Research
6.1 Phenomenology
6.1.1 Phenomenology, most simply stated, is the study of conscious phenomena:
that is, an analysis of the way in which things or experiences show
themselves. The term “phenomena” is derived from the Greek verb, which
means to show oneself or to appear (Sanders, 1982).
6.1.2 As a research method, the aim of phenomenology is to study human
phenomena without considering questions of their causes, their objective
reality, or even their appearances. The aim is to study how human
phenomena are experienced in conscious, in cognitive and perceptual acts,
as well as how they may be valued or appreciated aesthetically.
Phenomenology seeks to understand how people construct meaning and a
key concept is intersubjectivity. Individuals’ experiences of the world,
upon which their thoughts about the world are based, are intersubjective
because they experience the world with and through others. Whatever
meaning they create has its roots in human actions, and the totality of
social artefacts and cultural objects is grounded in human nature (Wilson,
2002).
6.1.3 Wilson (2002) states that phenomenology demands that the researcher
seeks to discover the world as it is experienced by those involved in to. It
is about the nature of human experience and the meanings that people
attach to their experiences. In trying to arrive at this kind of
understanding, the researcher is asked to “bracket”, or suspend belief in
the phenomena of the external world, to put them aside and focus on the
consciousness of that world. Consequently, phenomenology is not a
hypothesis testing mode of research, nor is it one that must be guided by
theoretical models.
6.1.4 According to Sanders (1982) there are three fundamental components in a
phenomenological research design:
1. Determining the limits of what and who is to be investigated. The
individuals to be investigated are those who posses the characteristics
33

under observation or those who can give reliable information on the
phenomena being researched.
2. Collection of data. It is realistic to believe that sufficient information
may be collected from interviewing approximately three to six
individuals. It is better to ask fewer questions and to probe them
intensively that it is to ask many questions assuming that more
questions will yield more data. This is simply not the case.
3. Phenomenological analysis of the data.
6.1.5 Sanders (1982) goes on to state that there are four levels of
phenomenological analysis:
1. Description of the phenomena as revealed in the interviews.
2. Identification of themes or invariants: Themes are commonalities
identified within and between narratives.
3. Development of noetic/noematic correlates: These correlates are the
subjective reflections of the emergent themes. Noema is described as
the “what” of experience, and noesis as the “how” of experience.
4. Abstraction of the “essences” from the noetic/noematic correlates:
Essence is described as the “why” of experience.
6.1.6 In summary, Sanders (1982) suggests that the phenomenological
researcher asks four questions:
1. How may the phenomenon or experience under investigation be
described?
2. What are the invariants or themes emergent on those descriptions?
3. What are the subjective reflections of those themes?
4. What are the essences present in those themes and subjective
reflections?
6.1.7 To produce lived-experience descriptions, van Manen (1990) suggests the
interviewee needs to:
34
- Describe the experience as they live/d through it, avoiding as much as
possible causal explanations, generalisations or abstract
interpretations.
- Describe the experience from the inside as it were; almost like a state
of mind: the feelings, the mood, the emotions, etc.
- Focus on a particular example or incident of the object of the
experience: describe specific events, an adventure, a happening or a
particular experience.
- Try to focus on an example of the experience which stands out for its
vividness, or as it was the first time.
- Attend to how the body feels, how things smell/ed, how they
sound/ed, etc.
- Avoid trying to beautify their narrative with fancy phrases or flowery
terminology.
6.2 Methodology
6.2.1 The rationale for choosing phenomenology as a research method is that, in
the first instance, the researcher is aiming to identify what motivates ACC
employees, rather than test whether a particular theory fits the ACC
environment.
6.2.2 The approach taken was to conduct individual semi-structured interviews
with ten ACC employees.
6.2.3 The researcher took the following steps:
1. A list of open ended questions were developed and approved for
release by ACC’s General Manager of Human Resources.
2. Identified ten suitable interviewees.
3. Conducted semi-structured interviews with these employees.
6.2.4 The reason for conducting individual semi-structured interviews, rather
than running focus groups, was to get more unbiased responses, especially
from more junior staff. That is, based on experience running work
35

meetings with groups of junior ACC staff there are usually one or two
outspoken individuals and the rest of the group tend to conform to the
views of those individuals rather than expressing their own, possibly
alternate views.
6.3 Selecting Interviewees
6.3.1 The list of interviewees was constructed via two processes. Firstly, five
ACC employees were approached directly by the researcher as they were
known to be reasonably highly motivated in their work and high
performers. All five were happy to assist in the research project. In
summary the five interviewees:
- Were aged between 36 and 55
- Had all worked elsewhere before joining ACC and had many years of
work experience.
- Were at tier 1 (i.e. the Chief Executive), tier 2 (i.e. General Manager)
or tier 3 (i.e. reported to a General Manager)
- Worked in the corporate office and were people managers
6.3.2 Secondly, the attributes of another group of potential interviewees was
identified that differed from the first group and hence provided the
greatest overall diversity between the interviewees. These attributes were:
- Less than 30 years old
- Worked at ACC less than 2 years
- Not a people manager
- ACC was either their first or second employer.
- At tier 4 or below
6.3.3 The manager of the Business Service Centre (“BSC”) was then asked to
identify four to six people with these attributes. The reason for contacting
the BSC was that, within ACC, this area has the greatest concentration of
young employees with the aforementioned attributes. This area has also
experienced a relatively high level of staff turnover in the last year. Hence,
36

an investigation in to what motivates staff in the BSC, as well as why they
join ACC and/or might leave, could be beneficial to ACC and the BSC
manager.
6.3.4 The names of six employees were provided by the BSC manager. The
researcher contacted all six employees via email and ended up conducting
interviews with five of them. The sixth person did not to respond to the
researcher’s email.
6.3.5 This method of selecting the interviewees could be described as purposive
sampling. The particular purposive sampling strategy employed is often
referred to as typical case sampling (Saunders et al, 2003).
6.3.6 In summary the ten interviewees selected:
- Ranged in age from 19 to 55, with an average age of 34.3 years.
- Ranged in length of service from 6 months to 33 years, with an average
of 5.2 years.
- Represented three of the eight ACC business groups.
- Ranged from the Chief Executive (i.e. tier 1) to tier 5 within the
organisational structure.
6.4 Preparing the Interview Schedule
6.4.1 The interview schedule consisted of the following sections and questions:
- A brief introduction on the research topic and the purpose of the
interview, including discussion on the difference between work
“satisfaction” and “motivation” as the researcher was only interested in
hearing stories about times when the interviewee was motivated to do,
but not necessarily satisfied with, the work they were doing.
- A personal commitment from the researcher not to allow the interview
recording or subsequent transcripts to be heard or seen by any third
party other than the person doing the transcribing, and that no
comments would be directly attributed to any individual in this
dissertation.
37

- Initial protocol questions to get the interviewee “warmed up” and
comfortable. These included questions about the interviewee’s age,
how long they had worked at ACC, type of work they did and a brief
history of their previous work experience.
- A question to initiate a period discussing times when the interviewee
was motivated at work. These should be specific situations or work
tasks, not necessarily at ACC, and as detailed as possible including
how the interviewee felt at the time and why they thought they had
those particular feelings.
- A question to initiate a period discussing why the interviewee took the
job at ACC, including what drew them to ACC and what criteria they
used to evaluate the job offer.
- A question to initiate a period discussing whether they are considering
leaving ACC, and if so why? Also, if they were to leave in the future,
why might they leave? That is, what criteria would they use to evaluate
their employment options?
6.4.2 A memorandum was sent to Denise Cosgrove, ACC’s General Manager of
Human Resources, outlining the intended research and interview schedule
and seeking her approval to go ahead with the proposed interviews.
Approval was given on 27 November 2007.
6.5 Conducting the Interviews
6.5.1 The interviews were all done face-to-face in meeting rooms at ACC’s
offices at 81 – 83 Molesworth Street and 110 Featherston Street,
Wellington, New Zealand.
6.5.2 The responses were recorded on a digital voice recorder, with the
agreement of the participants. This proved very useful as it meant the
researcher could concentrate on listening to the interviewee and asking for
clarification or more detail when necessary, rather than focusing their
attention on taking interview notes.
6.5.3 The researcher had anticipated the interviews taking approximately one
hour. In fact, the interviews ranged in duration between 17 and 49
minutes. The average interview time was 31 minutes.
38

6.6 Transcription & Analysis
6.6.1 Karen Jackson, the author’s partner, kindly transcribed the recorded
interviews in to separate Microsoft Word documents.
6.6.2 The researcher then employed the following transcription methodology,
loosely based on Devenish (2002) and Schweitzer’s method (cited in
Devenish, 2002), to analyse the interview transcripts:
6.6.3 Stage 1:
1. Initially read and digest each interview transcript, allowing the
information to “speak for itself”.
2. Conduct an initial analysis of each transcript, locating categories of
meaning which point to experiences and meanings related to the topic
of employee motivation. The idea being to adopt a mindset which
allows the practice of “discovery” rather than that of “verification”.
3. Construct a research key with categories related to the research topic.
4. Isolate the natural meaning units contained within each transcript.
5. Number these natural meaning units according to the categories in the
research key.
6. Sort the numbered natural meaning units into categories determined
by the research key.
7. Remove repeat and redundant natural meaning units.
8. Combine the remaining natural meaning units in to central themes.
6.6.4 Stage 2:
1. Consider the central across all the interview transcripts looking for
any trends, patterns or clusters.
2. Collate the central themes.
3. Rank the central themes in order of importance based on both the
frequency and intensity with which they were expressed by the
interviewees.
39

4. Reflect on personal motivational experiences. Also consider the
relevant literature relating to employee motivational theory.
5. Identify where central themes align to one or more of the existing
motivational theories.
6.7 Practical Issues
6.7.1 The interviewer had anticipated having problems finding willing
interviewees, especially younger employees, but this fear was unfounded
as all the people the researcher approached, except one, were happy to
assist in this research.
6.7.2 Whilst conducting the first few interviews the interviewer had to stop
himself from “leading” the interviewees based on his beliefs and
knowledge gained from reading the literature on motivation. The
researcher was struggling with one of the fundamental concepts of
phenomenology – “bracketing”. That is, rather than suspending his beliefs
regarding the phenomena of motivation the interviewer found himself
asking leading questions that tested hypotheses based on various
theoretical motivational models. Fortunately the few occasions when this
happened tended to be towards the end of the interviews and so did not
“taint” the information gained from the interview to any great extent.
6.7.3 During some of the earlier interviews the interviewer also had to stop
himself from talking too much. Sometimes, more so with younger
interviewees, rather than allowing a period of silence to continue too long
the interviewer would rephrase or expand on the original question and in
doing so appeared to interrupt the interviewee’s train of thought.
6.7.4 The interviewer also found during the first few interviews that once he got
to the end of the interview and stopped the tape recorder some
interviewees would start asking questions about the research topic. In
some cases, these completely unstructured conversations led to the
interviewee providing more valuable statements about their own sense and
sources of motivation and so the interviewer would have to turn the tape
recorder back on to capture these verbal comments. To overcome this, in
later interviews the interviewer consciously did not switch off the tape
40

recorder until all conversation had stopped and both the interviewer and
interviewee stood up to leave the meeting room.
41

7 Quantitative Research
7.1 Positivism
7.1.1 Positivism is a philosophy that states that the only authentic knowledge is
scientific knowledge and that such knowledge can only come from
positive affirmation of theories through strict scientific method
(Wikipedia, 2008).
7.1.2 The empirical research approach, of which quantitative research methods
are examples, has its root in positivism.
7.1.3 Positivism alone has been shown to be inadequate in the study of social
sciences as it neglects the complex nature of human behaviour. It is this
tension between positivism and qualitative research approaches such as
phenomenology that makes triangulation most productive.
7.2 Survey of High Performers
7.2.1 During the last quarter of 2007, prior to starting the research phase of this
dissertation, a structured survey of ACC’s “high performers” was
constructed and implemented by ACC’s Human Resources Group.
7.2.2 The main reason for the survey was to analyse reasons for staff turnover
and subsequently inform a company retention strategy. The need to
develop a retention strategy came from observations of an increasing staff
turnover rate and the negative impacts of this on the organisation. In
particular, if the turnover rate continued to trend upwards it could have a
considerable impact on the sustainability of ACC’s workforce, potentially
impacting on the quality of service to clients, ACC’s external reputation as
a good employer, the ability to recruit future talent as well as generating
higher recruitment and training costs.
7.2.3 Given the relationship between employee motivation, satisfaction and
retention (Latham, 2007), and rather than “re-inventing the wheel”, the
researcher decided to incorporate this survey in to the research phase of
this dissertation.
42
7.3 Selecting the Survey Participants
7.3.1 ACC’s current staff performance review system revolves around managers
rating each of their direct reports relative to pre-agreed objectives. The
scale of ratings is:
- Outstanding
- Exceeded
- Achieved
- Partially Achieved
- Not Achieved
7.3.2 Those employees rated as “outstanding” or “exceeded” at their last
performance review were considered “high performers”. Of the survey
participants, 42 had “exceeded” and 109 were “outstanding” at their last
performance review.
7.4 Preparing the Survey Questionnaire
7.4.1 The survey was designed to capture quantitative through the use of rating
scales and qualitative information through the use of open-ended
questions.
7.4.2 Staff were assured that their feedback would be treated in the strictest
confidence.
Job Factors
7.4.3 Staff were asked to rate the level of importance they placed on 24 different
job factors grouped in five broad categories: professional development,
remuneration & rewards, nature of job, leadership and culture. The factors
are set out in Appendix 1.
7.4.4 The rating scale was from 1 (not important at all) to 5 (very important).
7.4.5 Staff were also asked to rate the degree to which ACC meets their needs on
each of the 24 job factors.
43

Engagement
7.4.6 Using the same 1 to 5 rating scale, staff were asked to rate the degree to
which they agree with four ‘engagement’ statements:
- Overall, I am satisfied with ACC as my employer.
- I am proud to say I work for ACC.
- I am willing to ‘go the extra mile’ in my role.
- I would say ACC is a good place to work.
Future Career Plans
7.4.7 Staff were asked to indicate their career plans at this point in time. The
specific question asked was:
“As you think to the future, which of the following best describes your
career plans at this time?”
7.4.8 Staff were asked to choose between five statements:
1. Will leave ACC within the next 12 months
2. Will leave ACC within 1-2 years
3. Will leave ACC within 2-3 years
4. Will leave ACC within 3-5 years
5. No plans to leave ACC employment in the foreseeable future.
Open Ended Questions
7.4.9 Staff were then asked four open ended questions:
- What factors have contributed to your answer to the question above?
- What are the top 3 factors that would cause you to leave ACC?
- What factors or initiatives will motivate you to stay longer at ACC?
- Any further comments?
44

7.5 Conducting the Survey
7.5.1 The survey was conducted, by members of ACC’s Human Resources
department, over the phone with the 151 high performers selected.
7.5.2 The survey responses consisted of:
- a series of numbers/ratings, which were recorded in an Excel
spreadsheet, and
- statements in response to open ended questions, which were recorded
in a Word document.
7.6 Practical Issues
7.6.1 The most obvious issue when using the results of the structured survey is
that it is secondary data and hence the researcher had to take what he was
given. That is, the researcher had no input in to the design or
implementation of the survey questionnaire, including the questions
themselves and the way in which participants were asked to respond to
them (i.e. the 1 to 5 rating approach).
7.6.2 An initial analysis of the ratings pertaining to the importance of the 24 job
factors revealed that most participants rated the factors as a 4 or 5. The
following graph shows the distribution of ratings for each of the five
categories of factors as well as in total.
Figure 7.1: Distribution of Ratings
Distribution of Ratings
0%
10%
20%
30%
40%
50%
60%
1=Not important atall
2 3 4 5=Very important
Rating
Perc
enta
ge o
f Res
pons
es
A. Professional Development B. Remuneration & Rewards C. Nature of JobD. Leadership E. Culture Total
45

7.6.3 In total, 84% of the ratings given in the survey were either a 4 or 5. This
implied that most factors were either “important” or “very important” to
the survey participants. At the individual factor level, the lowest
percentage of 4 or 5 ratings was 53% for the factors “Secondments” and
“Alternative Rewards”. Given this highly skewed distribution of ratings, it
was difficult to draw any strong conclusions regarding the relative
importance of the 24 job factors and the 5 categories of factors using the
raw ratings provided.
46

8 Results/Data Analysis
8.1 Qualitative Research
8.1.1 The interviews were transcribed in to individual Word documents and
named using the format “interviewee_name.doc”. Copies of these Word
documents were also made and named using the format
“NMU_interviewee_name.doc”.
8.1.2 These “NMU_interviewee_name.doc” files were then edited, deleting
superfluous comments and identifying individual statements or sections of
the interview relating specifically to motivation (i.e. the “natural meaning
units”).
8.1.3 For each “NMU_interviewee_name.doc” document, the identified natural
meaning units were then copied from the Word documents in to an Excel
workbook. The Excel workbook included one sheet for each of the ten
interviews as well as a sheet containing the statistical information collected
during the interview process (i.e. interviewees’ ages, length of service at
ACC and length of interview).
8.1.4 Development of the research key was an iterative process as the researcher
read through and analysed the ten interview transcripts. Some “motivating
factors” were expanded and others contracted as the researcher reflected
on the identified natural meaning units within each transcript. The
identified “motivating factors” were sorted in to central themes and then
each factor was given a reference number (“REF”).
8.1.5 The final research key is set out below.
47
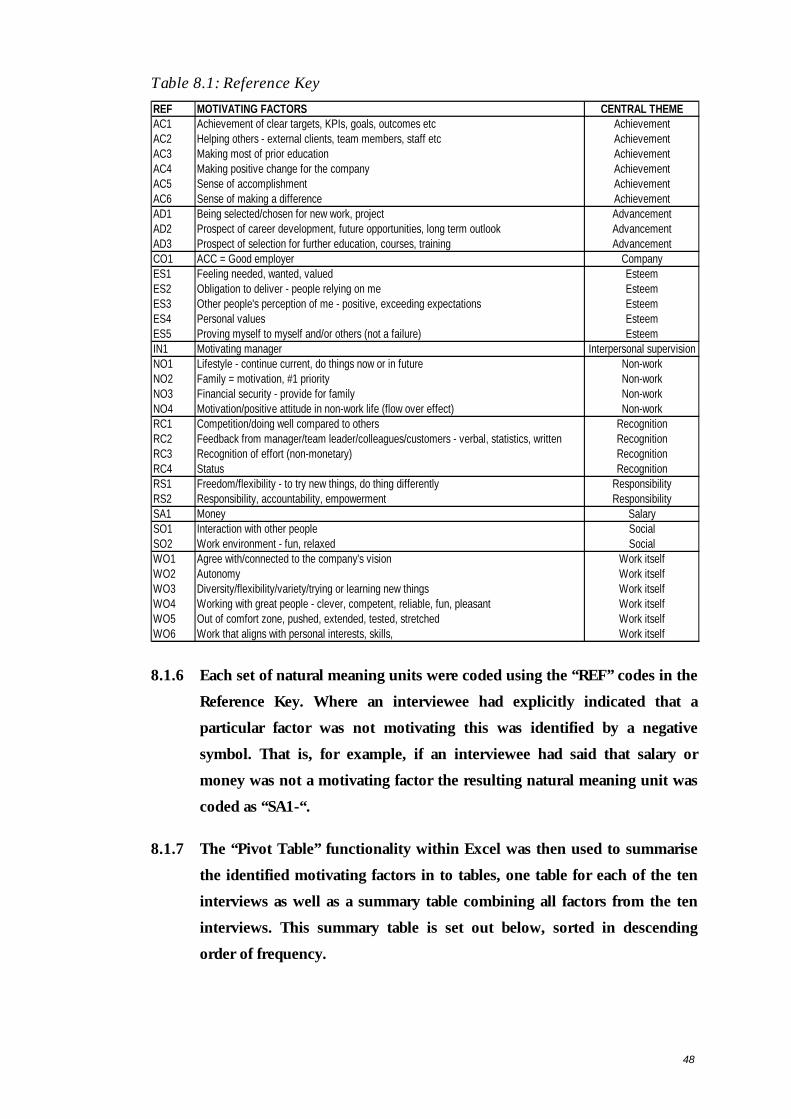
Table 8.1: Reference Key
REF MOTIVATING FACTORS CENTRAL THEMEAC1 Achievement of clear targets, KPIs, goals, outcomes etc AchievementAC2 Helping others - external clients, team members, staff etc AchievementAC3 Making most of prior education AchievementAC4 Making positive change for the company AchievementAC5 Sense of accomplishment AchievementAC6 Sense of making a difference AchievementAD1 Being selected/chosen for new work, project AdvancementAD2 Prospect of career development, future opportunities, long term outlook AdvancementAD3 Prospect of selection for further education, courses, training AdvancementCO1 ACC = Good employer CompanyES1 Feeling needed, wanted, valued EsteemES2 Obligation to deliver - people relying on me EsteemES3 Other people's perception of me - positive, exceeding expectations EsteemES4 Personal values EsteemES5 Proving myself to myself and/or others (not a failure) EsteemIN1 Motivating manager Interpersonal supervisionNO1 Lifestyle - continue current, do things now or in future Non-workNO2 Family = motivation, #1 priority Non-workNO3 Financial security - provide for family Non-workNO4 Motivation/positive attitude in non-work life (flow over effect) Non-workRC1 Competition/doing well compared to others RecognitionRC2 Feedback from manager/team leader/colleagues/customers - verbal, statistics, written RecognitionRC3 Recognition of effort (non-monetary) RecognitionRC4 Status RecognitionRS1 Freedom/flexibility - to try new things, do thing differently ResponsibilityRS2 Responsibility, accountability, empowerment ResponsibilitySA1 Money SalarySO1 Interaction with other people SocialSO2 Work environment - fun, relaxed SocialWO1 Agree with/connected to the company's vision Work itselfWO2 Autonomy Work itselfWO3 Diversity/flexibility/variety/trying or learning new things Work itselfWO4 Working with great people - clever, competent, reliable, fun, pleasant Work itselfWO5 Out of comfort zone, pushed, extended, tested, stretched Work itselfWO6 Work that aligns with personal interests, skills, Work itself
8.1.6 Each set of natural meaning units were coded using the “REF” codes in the
Reference Key. Where an interviewee had explicitly indicated that a
particular factor was not motivating this was identified by a negative
symbol. That is, for example, if an interviewee had said that salary or
money was not a motivating factor the resulting natural meaning unit was
coded as “SA1-“.
8.1.7 The “Pivot Table” functionality within Excel was then used to summarise
the identified motivating factors in to tables, one table for each of the ten
interviews as well as a summary table combining all factors from the ten
interviews. This summary table is set out below, sorted in descending
order of frequency.
48

Table 8.2: Summary of Identified Factors
REF Total Motivating FactorWO3 42 Diversity/flexibility/variety/trying or learning new thingsRC2 26 Feedback from manager/team leader/colleagues/customers - verbal, statistics, writtenAD2 22 Prospect of career development, future opportunities, long term outlookAC1 14 Achievement of clear targets, KPIs, goals, outcomes etcWO5 13 Out of comfort zone, pushed, extended, tested, stretchedWO4 13 Working with great people - clever, competent, reliable, fun, pleasantAC6 11 Sense of making a differenceES3 10 Other people's perception of me - positive, exceeding expectationsSA1 9 MoneyRS2 9 Responsibility, accountability, empowermentES5 9 Proving myself to myself and/or others (not a failure)AC2 9 Helping others - external clients, team members, staff etcSA1- 8 MoneySO1 7 Interaction with other people WO1 6 Agree with/connected to the company's visionRS1 6 Freedom/flexibility - to try new things, do thing differentlyNO1 6 Lifestyle - continue current, do things now or in futureSO2 5 Work environment - fun, relaxedIN1 5 Motivating managerRC1 5 Competition/doing well compared to othersAC5 4 Sense of accomplishmentNO2 4 Family = motivation, #1 priorityWO6 3 Work that aligns with personal interests, skills,WO2 3 AutonomyNO3 3 Financial security - provide for familyES1 3 Feeling needed, wanted, valuedCO1 3 ACC = Good employerAD1 2 Being selected/chosen for new work, projectAC4 2 Making positive change for the companyRC3 2 Recognition of effort (non-monetary)AD3 2 Prospect of selection for further education, courses, trainingES4 2 Personal valuesAC1- 1 Achievement of clear targets, KPIs, goals, outcomes etcRC4- 1 StatusES2 1 Obligation to deliver - people relying on meAD2- 1 Prospect of career development, future opportunities, long term outlookNO4 1 Motivation/positive attitude in non-work life (flow over effect)Grand Total 273
8.1.8 The identified motivating factors were also aggregated up to the next level
of “Central Theme”, as set out in the Reference Key (Table 8.1 above). The
results of this aggregation are set out in the table below, again sorted in
descending order of frequency.
49
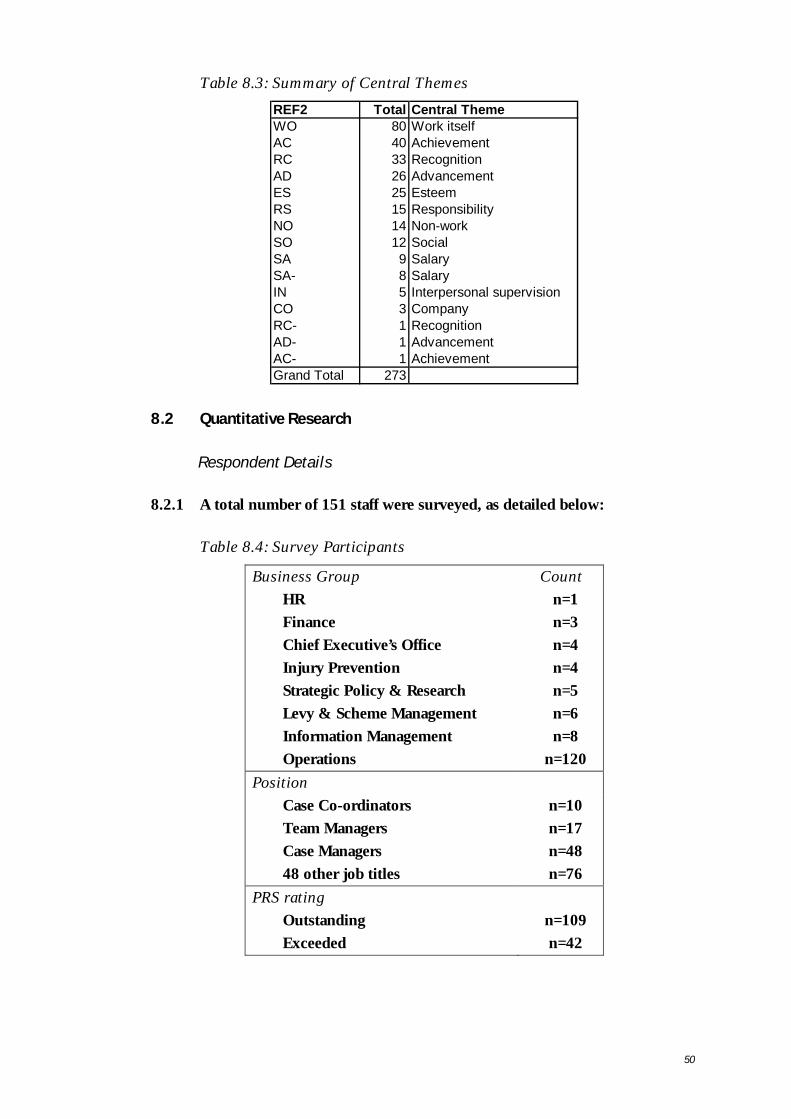
Table 8.3: Summary of Central Themes
REF2 Total Central ThemeWO 80 Work itselfAC 40 AchievementRC 33 RecognitionAD 26 AdvancementES 25 EsteemRS 15 ResponsibilityNO 14 Non-workSO 12 SocialSA 9 SalarySA- 8 SalaryIN 5 Interpersonal supervisionCO 3 CompanyRC- 1 RecognitionAD- 1 AdvancementAC- 1 AchievementGrand Total 273
8.2 Quantitative Research
Respondent Details
8.2.1 A total number of 151 staff were surveyed, as detailed below:
Table 8.4: Survey Participants
Business Group Count
HR
Finance
Chief Executive’s Office
Injury Prevention
Strategic Policy & Research
Levy & Scheme Management
Information Management
Operations
n=1
n=3
n=4
n=4
n=5
n=6
n=8
n=120
Position
Case Co-ordinators
Team Managers
Case Managers
48 other job titles
n=10
n=17
n=48
n=76
PRS rating
Outstanding
Exceeded
n=109
n=42
50

Job Factor
Importance
8.2.2 Staff were asked to rate the level of importance they placed on 24 different
job factors, grouped in to five categories, as listed in Appendix 1.
8.2.3 The graph below shows the distribution of ratings at for the 24 job factors.
At a factor level, 11 of the 24 factors were rated as 5 or “very important”
by at least 50% of respondents.
Figure 8.5: Job Factors - Level of Importance by Factor
Job Factors: Importance
6.6%
7.3%
7.3%
6.6%
6.6%
12.6%
7.9%
15.2%
6.6%
7.9%
17.9%
15.2%
17.9%
13.9%
17.2%
19.9%
22.5%
41.3%
23.2%
31.8%
25.8%
30.5%
27.2%
33.1%
32.5%
31.8%
35.8%
41.1%
34.4%
37.1%
31.1%
44.4%
43.7%
46.4%
33.1%
39.7%
37.7%
43.7%
35.1%
39.7%
40.4%
30.7%
47.0%
36.4%
72.2%
66.2%
65.6%
62.9%
58.3%
57.6%
57.0%
52.3%
51.0%
51.0%
51.0%
49.7%
48.3%
45.0%
43.7%
42.4%
42.4%
41.7%
39.1%
37.7%
35.8%
22.7%
22.5%
16.6%11.9%
7.3%
0% 20% 40% 60% 80% 100%
Quality of leadership
Support f rom manager
Work-life balance
Availability of tools and equipment to do the job
Supportive, collaborative relationships w ith colleagues
Clarity of role expectations
Authority and empow erment to do the job
Work challenge
Availability of job related training
Performance based pay
Job security
Opportunity to put one's skills and talents to best use
Effective internal communication
Feedback & recognition from manager
Opportunities for career planning & development
Base salary
Benefits
Work variety
Opportunities for career advancement/promotion
Reputation of the organisation
Work environment
Alternative rew ard systems
Availability of mentors/coaches w ithin ACC
Opportunities for secondments/ new assignments
Distribution of responses
1=Not important at all 2 3 4 5=Very important
51

8.2.4 Confidence intervals, at the 99% level of certainty, were then constructed
for the percentage of participants that rated each factor as “very
important”, based on a normal approximation to the binomial distribution.
The results of this analysis are illustrated in the graph below. The yellow
bars represent the 99% confidence interval for each factor and the vertical
line in the middle of each bar represents the observed percentage of
participants in the survey sample who rated the factor as 5 or “very
important”.
Figure 8.6: Job Factors – “Very Important”
Job Factors = "Very Important" (99% Confidence Intervals)
5% 15% 25% 35% 45% 55% 65% 75% 85%
Quality of leadership
Support from manager
Work-life balance
Availability of tools and equipment to do the job
Supportive, collaborative relationships with colleagues
Clarity of role expectations
Authority and empowerment to do the job
Work challenge
Availability of job related training
Performance based pay
Job security
Opportunity to put one's skills and talents to best use
Effective internal communication
Feedback & recognition from manager
Opportunities for career planning & development
Base salary
Benefits
Work variety
Opportunities for career advancement/promotion
Reputation of the organisation
Work environment
Alternative reward systems
Availability of mentors/coaches within ACC
Opportunities for secondments/ new assignments
52
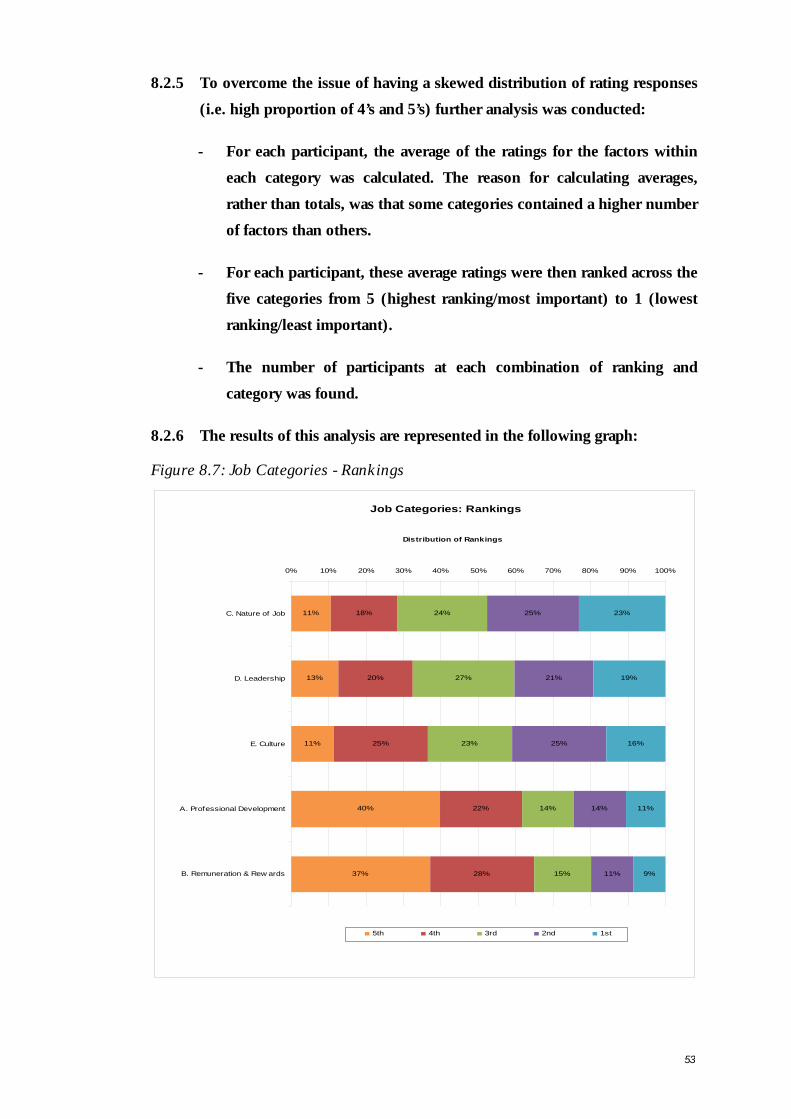
8.2.5 To overcome the issue of having a skewed distribution of rating responses
(i.e. high proportion of 4’s and 5’s) further analysis was conducted:
- For each participant, the average of the ratings for the factors within
each category was calculated. The reason for calculating averages,
rather than totals, was that some categories contained a higher number
of factors than others.
- For each participant, these average ratings were then ranked across the
five categories from 5 (highest ranking/most important) to 1 (lowest
ranking/least important).
- The number of participants at each combination of ranking and
category was found.
8.2.6 The results of this analysis are represented in the following graph:
Figure 8.7: Job Categories - Rankings
Job Categories: Rankings
11%
13%
11%
40%
37%
18%
20%
28%
24%
27%
23%
14%
15%
25%
21%
25%
14%
11%
23%
19%
16%
11%
9%
25%
22%
0% 10% 20% 30% 40% 50% 60% 70% 80% 90% 100%
C. Nature of Job
D. Leadership
E. Culture
A. Professional Development
B. Remuneration & Rew ards
Distribution of Rankings
5th 4th 3rd 2nd 1st
53
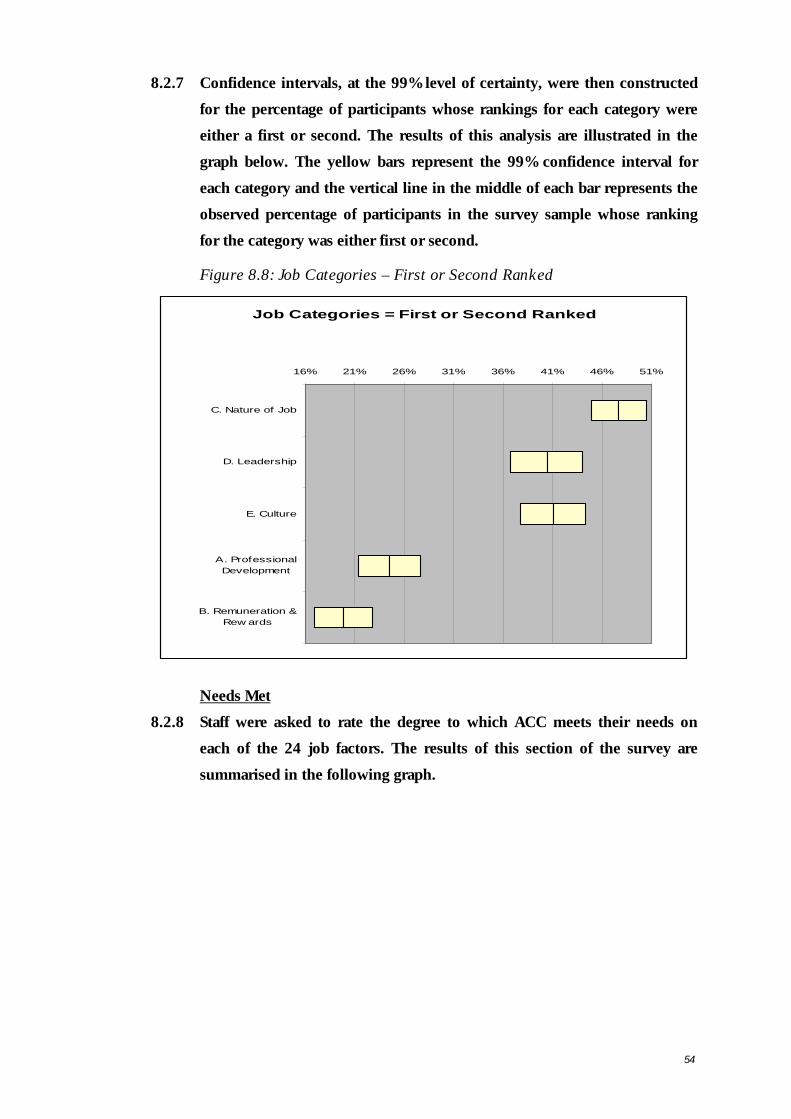
8.2.7 Confidence intervals, at the 99% level of certainty, were then constructed
for the percentage of participants whose rankings for each category were
either a first or second. The results of this analysis are illustrated in the
graph below. The yellow bars represent the 99% confidence interval for
each category and the vertical line in the middle of each bar represents the
observed percentage of participants in the survey sample whose ranking
for the category was either first or second.
Figure 8.8: Job Categories – First or Second Ranked
Job Categories = First or Second Ranked
16% 21% 26% 31% 36% 41% 46% 51%
C. Nature of Job
D. Leadership
E. Culture
A. ProfessionalDevelopment
B. Remuneration &Rew ards
Needs Met
8.2.8 Staff were asked to rate the degree to which ACC meets their needs on
each of the 24 job factors. The results of this section of the survey are
summarised in the following graph.
54

Figure 8.9: Job Factors - Degree to Which Needs are Met
Job Factors: Needs Met
9.3%
8.6%
15.9%
22.3%
11.3%
20.7%
16.6%
16.6%
9.9%
19.2%
19.9%
17.2%
16.6%
13.9%
23.8%
20.5%
27.2%
20.5%
23.2%
21.9%
32.5%
26.5%
31.1%
32.7%
34.4%
26.5%
37.2%
36.7%
28.7%
39.7%
36.4%
40.4%
46.4%
41.7%
40.4%
41.7%
45.0%
45.7%
30.5%
43.7%
35.8%
47.7%
45.0%
47.7%
31.8%
43.7%
41.1%
26.0%
27.8%
29.1%
23.0%
38.0%
29.3%
31.1%
42.4%
41.1%
39.7%
37.1%
34.4%
29.8%
29.1%
28.5%
25.8%
24.5%
23.8%
23.8%
23.2%
22.5%
21.2%
20.5%
19.2%
14.0%
13.2%
12.6%
12.2%
11.3%
10.7%
5.3%
10.7%
9.9%
8.6%
7.3%
19.2%
21.9%
20.0%
6.6%
7.3%
10.6%
6.6%
13.9%
7.9%
6.6%
0% 20% 40% 60% 80% 100%
Support from manager
Benefits
Supportive, collaborative relationships w ith colleagues
Job security
Work challenge
Feedback & recognition from manager
Work variety
Base salary
Performance based pay
Clarity of role expectations
Quality of leadership
Work environment
Authority and empow erment to do the job
Work-life balance
Availability of job related training
Opportunity to put one's skills and talents to best use
Availability of tools and equipment to do the job
Availability of mentors/coaches w ithin ACC
Opportunities for career planning & development
Opportunities for career advancement/promotion
Alternative rew ard systems
Reputation of the organisation
Opportunities for secondments/new assignments
Effective internal communication
Distribution of responses
1=Needs not met at all 2 3 4 5=Needs fully met
8.2.9 For each participant, the ratings for the factors within each category were
averaged. Unlike the average ratings for the “Importance” of each category,
these average ratings were not ranked. A participant’s highest “average
rating” may be a low number, indicating that ACC does not meet their
needs. Therefore, counting the number of participants in each category
with a ranking of “first” and concluding that this is the number of
participants whose needs are “fully met” would not be appropriate.
8.2.10 These average ratings, which varied in value between 1 and 5, were
converted in to “Needs Met” levels using the following conversion table.
55
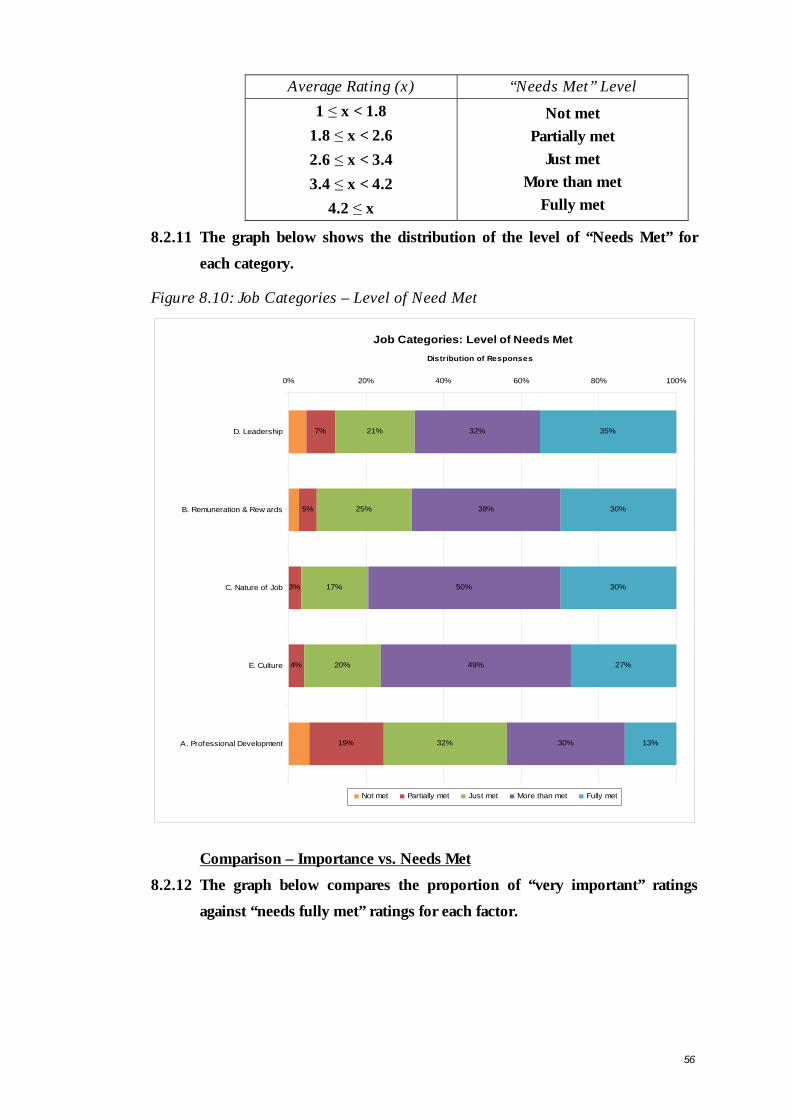
Average Rating (x) “Needs Met” Level
1 ≤ x < 1.8
1.8 ≤ x < 2.6
2.6 ≤ x < 3.4
3.4 ≤ x < 4.2
4.2 ≤ x
Not met
Partially met
Just met
More than met
Fully met
8.2.11 The graph below shows the distribution of the level of “Needs Met” for
each category.
Figure 8.10: Job Categories – Level of Need Met
Job Categories: Level of Needs Met
7%
5%
3%
4%
19%
21%
25%
17%
20%
32%
32%
38%
50%
49%
30%
35%
30%
30%
27%
13%
0% 20% 40% 60% 80% 100%
D. Leadership
B. Remuneration & Rew ards
C. Nature of Job
E. Culture
A. Professional Development
Distribution of Responses
Not met Partially met Just met More than met Fully met
Comparison – Importance vs. Needs Met
8.2.12 The graph below compares the proportion of “very important” ratings
against “needs fully met” ratings for each factor.
56

Figure 8.11: Job Factors - Level of Importance vs. Degree Needs are Met
Job Factors: Importance Vs Needs Met
72.2%
66.2%
65.6%
62.9%
58.3%
57.6%
57.0%
52.3%
51.0%
51.0%
51.0%
49.7%
48.3%
45.0%
43.7%
42.4%
42.4%
41.7%
39.1%
37.7%
35.8%
22.7%
22.5%
16.6%
23.8%
42.4%
22.5%
19.2%
39.7%
24.5%
23.2%
34.4%
21.2%
25.8%
37.1%
20.5%
5.3%
29.8%
13.2%
28.5%
41.1%
29.1%
12.6%
11.3%
23.8%
12.2%
14.0%
10.7%
0% 20% 40% 60% 80% 100%
Quality of leadership
Support from manager
Work-life balance
Availability of tools and equipment to do the job
Supportive, collaborative relationships w ith colleagues
Clarity of role expectations
Authority and empow erment to do the job
Work challenge
Availability of job related training
Performance based pay
Job security
Opportunity to put one's skills and talents to best use
Effective internal communication
Feedback & recognition from manager
Opportunities for career planning & development
Base salary
Benefits
Work variety
Opportunities for career advancement/promotion
Reputation of the organisation
Work environment
Alternative rew ard systems
Availability of mentors/coaches w ithin ACC
Opportunities for secondments/ new assignments
Distribution of responses
Very important Needs fully met
8.2.13 For the five job categories, the graph below compares the percentage of
participants who ranked the category “important” (i.e. a ranking of first or
second) with the percentage who said their needs were fully met.
57

Figure 8.12: Job Categories - Level of Importance vs. Degree Needs Met
Total Group: Importance Vs Needs Met
47.7%
40.4%
41.1%
24.5%
19.9%
29.8%
35.1%
27.2%
13.2%
29.8%
0% 10% 20% 30% 40% 50% 60%
C. Nature of Job
D. Leadership
E. Culture
A. ProfessionalDevelopment
B. Remuneration &Rew ards
Distribution of responses
Important Fully met
Engagement
8.2.14 Staff were asked to rate the degree to which they agree with four
‘engagement’ statements.
8.2.15 Results indicate that nearly three quarters of respondents strongly agree
that they are willing to go the “extra mile” in their role. Over three
quarters of respondents agreed or strongly agreed that they were satisfied
with ACC as an employer, have pride in the organisation, and believe it is
a good place to work.
Figure 8.13: Engagement with ACC
Engagement with ACC
15.9%
19.2%
8.6%
45.0%
39.7%
24.5%
46.4%
38.4%
37.1%
73.5%
43.7%
0% 20% 40% 60% 80% 100%
Overall, I am satisf ied w ith ACCas my employer
I am proud to say I w ork for ACC
I am w illing to go the 'extra mile' inmy role
I w ould say ACC is a good placeto w ork
Distribution of responses
1=Strongly Disagree 2 3 4 5=Strongly Agree
58
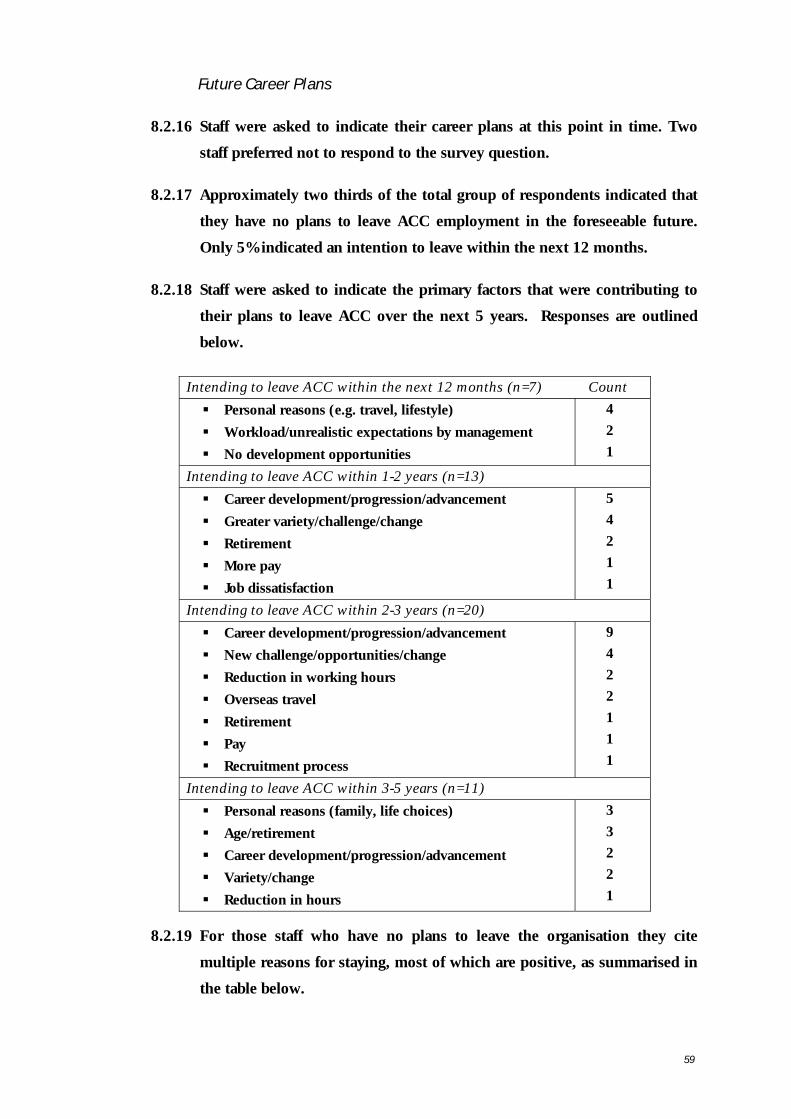
Future Career Plans
8.2.16 Staff were asked to indicate their career plans at this point in time. Two
staff preferred not to respond to the survey question.
8.2.17 Approximately two thirds of the total group of respondents indicated that
they have no plans to leave ACC employment in the foreseeable future.
Only 5% indicated an intention to leave within the next 12 months.
8.2.18 Staff were asked to indicate the primary factors that were contributing to
their plans to leave ACC over the next 5 years. Responses are outlined
below.
Intending to leave ACC within the next 12 months (n=7) Count
Personal reasons (e.g. travel, lifestyle)
Workload/unrealistic expectations by management
No development opportunities
4
2
1
Intending to leave ACC within 1-2 years (n=13)
Career development/progression/advancement
Greater variety/challenge/change
Retirement
More pay
Job dissatisfaction
5
4
2
1
1
Intending to leave ACC within 2-3 years (n=20)
Career development/progression/advancement
New challenge/opportunities/change
Reduction in working hours
Overseas travel
Retirement
Pay
Recruitment process
9
4
2
2
1
1
1
Intending to leave ACC within 3-5 years (n=11)
Personal reasons (family, life choices)
Age/retirement
Career development/progression/advancement
Variety/change
Reduction in hours
3
3
2
2
1
8.2.19 For those staff who have no plans to leave the organisation they cite
multiple reasons for staying, most of which are positive, as summarised in
the table below.
59
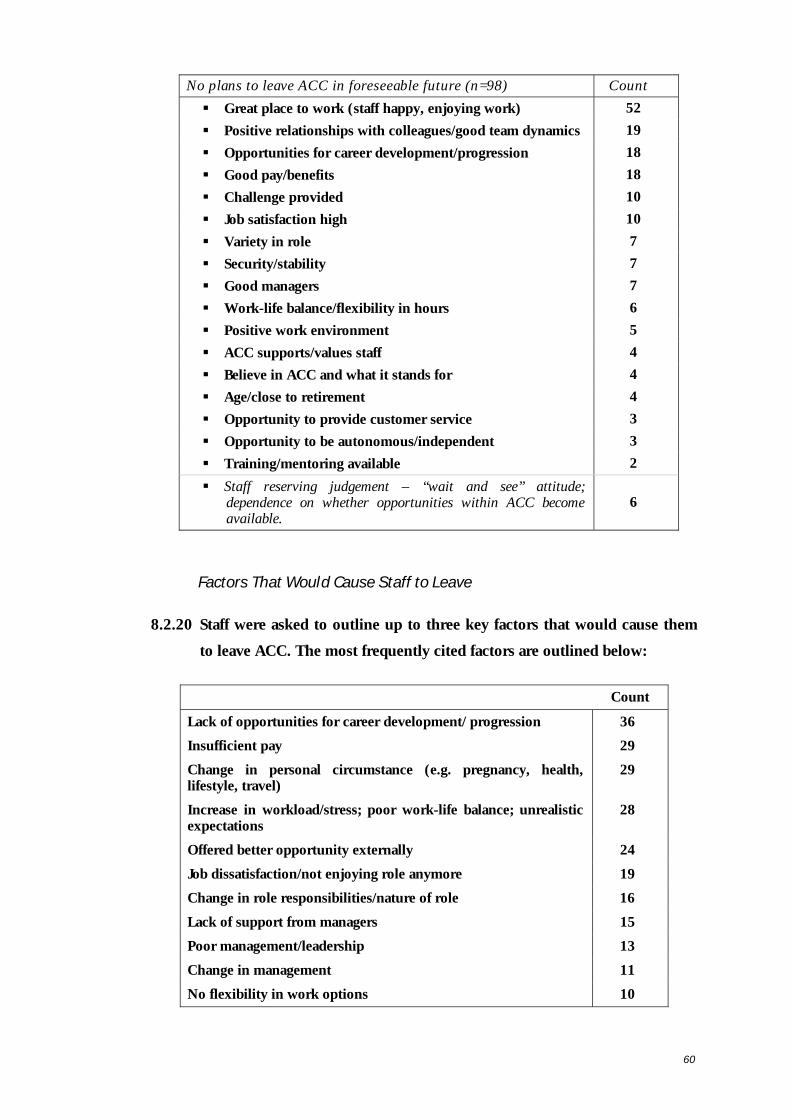
No plans to leave ACC in foreseeable future (n=98) Count
Great place to work (staff happy, enjoying work) 52
Positive relationships with colleagues/good team dynamics 19
Opportunities for career development/progression 18
Good pay/benefits 18
Challenge provided 10
Job satisfaction high 10
Variety in role 7
Security/stability 7
Good managers 7
Work-life balance/flexibility in hours 6
Positive work environment 5
ACC supports/values staff 4
Believe in ACC and what it stands for 4
Age/close to retirement 4
Opportunity to provide customer service 3
Opportunity to be autonomous/independent 3
Training/mentoring available 2
Staff reserving judgement – “wait and see” attitude; dependence on whether opportunities within ACC become available.
6
Factors That Would Cause Staff to Leave
8.2.20 Staff were asked to outline up to three key factors that would cause them
to leave ACC. The most frequently cited factors are outlined below:
Count
Lack of opportunities for career development/ progression 36
Insufficient pay 29
Change in personal circumstance (e.g. pregnancy, health, lifestyle, travel)
29
Increase in workload/stress; poor work-life balance; unrealistic expectations
28
Offered better opportunity externally 24
Job dissatisfaction/not enjoying role anymore 19
Change in role responsibilities/nature of role 16
Lack of support from managers 15
Poor management/leadership 13
Change in management 11
No flexibility in work options 10
60

Factors That Would Motivate Staff to Stay Longer
8.2.21 Key factors or initiatives that would help retain staff are outlined below.
Count
Better pay 28
Flexible work options 27
Better opportunities for career advancement/promotion 24
Improved career planning/development 20
Work-life balance/manageable workload 16
More opportunities for secondments/new assignments 10
Support from management 10
61
9 Findings
9.1 Qualitative Research
Emergent Themes
9.1.1 Summarising the ten interviews, in total there were 273 individually
identified statements pertaining to 34 different motivational factors which
were grouped in to 11 separate themes.
Work Itself
9.1.2 The strongest emergent theme was the “work itself”. Within this central
theme, the most significant motivational factor identified was doing work
that was varied, rather than routine or monotonous, and allowed the
person to try or learn new things (REF = “WO3”). This factor was
identified in every interview and on average it was identified over four
times per interview.
9.1.3 The next most significant motivational factors identified under this theme
were:
• Working with people who were perceived to be clever, competent,
reliable, fun and/or pleasant (REF = “WO4”), and
• Doing work that gave a sense of being out of one’s “comfort zone”.
That is, doing work that pushed, extended, tested and/or stretched the
person (REF = “WO5”).
9.1.4 Overall these two factors had only a third of the intensity compared to the
most significant factor “WO1”. However, these two factors were
mentioned mostly by the older interviewees and for these interviewees the
intensity was approximately equal factor “WO1”.
Achievement
9.1.5 The next most significant emergent theme was that of “Achievement”.
This theme had only half the intensity of the strongest theme “Work
Itself”. This theme emerged in all except one interview.
9.1.6 Within this theme, three factors of approximately equal intensity were
identified:
62

• Achievement of clear targets, key performance indicators, goals, or
outcomes (REF = “AC1”),
• Sense of making a difference(REF = “AC6”), and
• Helping others - external clients, team members, staff, etc (REF =
“AC2”).
9.1.7 The factors “AC2” and “AC6” were identified more by those interviewees
at or above tier 3 in the organisational structure whilst factor “AC1” came
out more strongly in the interviews with staff from tier 4 and below.
Recognition:
9.1.8 The next most significant emergent theme was that of “Recognition”. This
theme had less than half the intensity of the strongest theme “Work Itself”
and about 80% of the intensity of the theme “Achievement”.
9.1.9 The theme of “Recognition” emerged in all ten interviews. However, this
theme was more intensely identified by interviewees at tier 4 or below.
9.1.10 By far the most commonly identified factor under the theme of
“Recognition” was feedback from a manager, team leader, colleague or
customer (REF = “RC2”). Examples of feedback included verbal
comments, publication of statistics and written feedback. Again, this factor
was identified in all ten interviews but more commonly for less senior
employees.
9.1.11 Interestingly, it was not the expectation of receiving some form of
recognition at the end of a task that motivated employees to complete the
task well. Rather, it was commonly stated that positive recognition in
respect of a completed task increased one’s motivation to perform the next
assigned task well.
Other Themes & Observations
9.1.12 A desire for “Advancement” came through as a frequent, but less intense,
central theme. The most significant underlying motivational factor was the
prospect of career development or future employment opportunities. That
is, consideration of advancement in the long term was a motivating factor,
rather than the short term prospects of being selected for new work or
projects or being selected for training courses or further education. This
63
theme of “Advancement” was observed at a slightly higher intensity level
in the interviewees at or below tier 4.
9.1.13 The theme of “Esteem” was observed with reasonable intensity in the more
senior employees. In particular, this group are motivated by other people’s
perceptions of them and a desire to prove themselves, either to themselves
or others.
9.1.14 Whilst salary or money (REF = “SA1”) was mentioned by nine of the ten
interviewees, it was not mentioned with much intensity. When money was
mentioned, in nearly half the cases it was in a negative context (i.e. it was
identified explicitly as not being a motivational factor). In the remaining
cases money was considered not to be as important as the other
motivational factors cited. Two interviewees identified money as being
important only to the extent that it allowed them to continue or improve
their lifestyle.
9.1.15 Only one interviewee commented directly on their manager in the context
of being motivated. However, the three major central themes – work itself,
achievement and recognition – are all significantly influenced by one’s
manager.
9.1.16 Factors pertaining to the company itself, either as a good employer or with
reference to ACC’s mission or purpose, were hardly mentioned.
9.2 Quantitative Research
Job Factors
9.2.1 As you can see from Figure 8.6, at a 99% level of confidence, it is not
possible to distinguish, with any statistical credibility, between the relative
importance of the more highly rated factors. That is, for the top seven
factors the confidence intervals or yellow bars in Figure 8.6 overlap.
9.2.2 However, at the job category level, it appears from Figure 8.8 that “Nature
of Job” is the most highly ranking category, with “Leadership” and
“Culture” ranked second equal.
64
Needs Met
9.2.3 While there were no factors where more than 50% of staff felt their needs
were ‘fully met’ (see Figure 8.9), a significant proportion of respondents
gave a rating of ‘4’ indicating their needs were reasonably well met for
some factors. Responses indicate that the “Support from manager” and
“Benefits” factors are where staff needs tend to be more fully met.
9.2.4 By category, Figure 8.10 indicates that:
- The highest level of fully met needs was in the “Leadership” category.
- The “Professional Development” category was the lowest and the only
category with a combined percentage for “Fully met” and “More than
met” of less than 50%.
Comparison – Importance vs. Needs Met
9.2.5 Figure 8.11 compares the proportion of ‘very important’ ratings against
‘needs fully met’ ratings for each job factor. Analysis shows that the biggest
gaps in results are for the following factors (in decreasing order):
1. Quality of leadership
2. Availability of tools and equipment to do the job
3. Work-life balance
4. Effective internal communication
5. Authority and empowerment to do the job.
9.2.6 At the category level, Figure 8.12 indicates that whilst “Nature of Job” was
important (i.e. first or second ranked category) to nearly half of the
participants, only 30% said their needs were fully met in this area.
Staff Turnover
9.2.7 In the quantitative survey, only 7 of the 149 employees who responded to
the question regarding their “future career plans” indicated they intended
leaving ACC within the next 12 months. This implies a turnover rate of
less than 5% per annum, which is significantly less than the recently
65

observed turnover rate of over 17%. Even adding together the respondents
who said they are considering leaving within the next 2 years (n=20) and
assuming they all left in the next year this implies a turnover rate of just
over 13%. The likely reason for the discrepancy between the recently
observed turnover rate and the survey results is that those surveyed (i.e.
ACC’s high achievers) generally have a lower turnover rate than the rest of
ACC’s employees. This conclusion is supported by the general consensus
that higher motivated employees are more satisfied and therefore less
likely to leave.
66

10 Alignment with Motivational Theories
10.1 Herzberg’s Two-Factor Theory
10.1.1 The three top rated factors of “the work itself”, “achievement” and
“recognition” identified as motivating employees at ACC are also
identified as motivating factors in Herzberg’s (1959) Two-Factor
Motivation Theory.
10.1.2 Herzberg’s Two-Factor Theory also categorises “salary” as a hygiene factor,
which does not motivate employees but can be a source of dissatisfaction.
This is also consistent with the researcher’s observations.
10.1.3 However, a number of observations are not supported by Herzberg’s Two-
Factor Theory:
• “Interpersonal supervision” was described as being highly motivational
by one interviewee.
• “Salary” was described as being motivational by a few interviewees to
the extent it allowed them to retain a certain lifestyle.
• “Work conditions”, in particular a fun, social and friendly working
environment, was mentioned several times as a source of satisfaction
and motivation for employees.
10.2 Job Design Theory
10.2.1 The “work itself”, which was the most significant motivational factor
identified, is the foundation of a number of task and job design theories.
10.2.2 Lawler (1969) used expectancy theory to help understand and explain the
effects of job design on employee motivation. Lawler concluded that when
a job is structured so that intrinsic rewards appear to result from good
performance, then the job itself can be a very effective motivator. Lawler
also concluded that if job content is to be a source of motivation, the job
must:
• allow for meaningful feedback,
67

• test the employee’s valued abilities, and
• allow a great amount of self-control by the job holder.
10.2.3 Hackman & Oldman’s (1976) Job Characteristics Theory emphasises the
importance of five job characteristics (skill variety, task identity, task
significance, feedback and autonomy) in evoking psychological states
(meaningfulness of work, responsibility for outcomes, knowledge of
results) that result in positive individual and organisational outcomes
(Kulik, 1999).
10.2.4 Steers & Mowday (1977) reviewed seven conceptual models of the
motivational properties of tasks. They concluded that:
• It is difficult to confirm which model was “best” as it depends on the
use to which a model is put.
• Some models, based on content theories, provide specific
recommendations for people managers who want to redesign jobs.
That is, these models identify variables which have been found to be
related to performance, but do not provide commentary on how these
variables influence employee behaviour.
• Other models, based on process theories, attempt to explain the
motivational processes and the relationships between variables. These
models are often too abstract to be of much practical use to managers.
• Hackman & Oldman’s Job Characteristics Theory has attempted to
simultaneously explain the process and content elements of
motivation.
10.2.5 When the researcher compared Steer & Mowday’s (1977) findings with his
own, the following conclusions were drawn:
• The task characteristics identified as motivational factors, such as
“work itself” and “achievement”, are conceptual rather than empirical.
• During the process of identifying the motivational factors affecting
employees working at ACC, no attempt was made to allow for the role
of individual differences as potential moderators of the effects of task
68

design. This has implications for managers proposing any form of job
re-design to individual staff members.
• Using job design theories exclusively, to explain employee motivation
and/or suggest changes to managers, is dangerous insomuch as other
potentially important factors are likely to be missed. Such other factors
include employees’ skills and abilities, non-work factors, individual
employee perceptions (i.e. two employees perceiving the same task
differently) and situational or environmental differences.
10.3 Goal Setting Theory
10.3.1 A sense of “achievement”, the second most significant motivational factor
identified, was most commonly expressed as the achievement of clear
targets, key performance indicators, goals or outcomes.
10.3.2 The setting and achievement of goals is the fundamental principle
underpinning Goal Setting Theory.
10.3.3 Goal Setting Theory is based on the premise that setting of task specific
goals and, given goal commitment, employees’ subsequent attempts to
achieve these goals leads to increased performance. In particular, this
theory asserts that variables such as monetary incentives, participation in
decision making, feedback or knowledge of results affect performance to
the extent that they lead to the setting of and commitment to specific high
goals.
10.3.4 With respect to Goal Setting Theory, Latham (2007) suggested that given
goal commitment, job performance improves because the goal provides a
regulatory mechanism that allows the employee to observe, monitor,
subjectively evaluate, and adjust job behaviour in order to attain the goal.
That is, the goal provides a yardstick by which the employee’s performance
can be measured, which in turn may provide a sense of achievement if the
goal has been, or is likely to be, achieved. Achievement of the goal may
also lead to some form of recognition by the employee’s manager, team
leader, peers or customers.
10.3.5 However, interviews with a number of employees highlighted some of the
limitations of Goal Setting Theory mentioned in the literature, including:
69
• Difficulties prioritising goals or objectives, leading to goal conflict.
• Focusing on one’s own goals at the expense of helping others,
especially in a highly competitive working environment.
10.4 Social Cognitive Theory
10.4.1 Goal setting is also a core concept in Social Cognitive Theory.
10.4.2 Social Cognitive Theory goes further than Goal Setting Theory in
suggesting that self-efficacy plays an important role in an employee’s
ability to achieve their goals. That is, an employee’s belief that they have
the ability to perform a task is more important than their actual ability in
affecting performance. The consequence of this is that an employee with
high self-efficacy will persevere with a task for longer, in an attempt to
master the task or achieve the required/desired outcome, than an employee
with low self-efficacy.
10.4.3 The researcher’s observation that recognition leads to motivation of a
future task, rather than an employee being motivated to complete the
current task by the expectation of receiving some form of recognition, can
be explained by Social Cognitive Theory. That is, receiving recognition
(i.e. positive feedback on a task well done) increases an employee’s self-
efficacy. As a consequence, the employee tries harder on the next task
assigned to them and is more likely to perform well.
10.4.4 However, Social Cognitive Theory does not adequately account for
moderating factors, such as resources constraints and high levels of
bureaucracy, which were mentioned by a few of the interviewees.
10.5 The High-Performance Cycle
10.5.1 Locke and Latham’s (1990) High-Performance Cycle, which is summarised
in Figure 4.1 above, suggests that when an employee faces high challenge
or difficult goal, if this is accompanied by high expectancy of success or
self-efficacy then high performance results, given that there is commitment
to the goal, feedback, adequate ability and low situational constraints.
Further, this theory suggests that high performance, if rewarded or
recognised, leads to job satisfaction, which in turn facilitates commitment
to the organisation and its goals.
70

10.5.2 Aspects of the aforementioned theories (i.e. Job Design Theory, Goal
Setting Theory and Social Cognitive Theory) are contained within the
High-Performance Cycle.
10.5.3 The High-Performance Cycle takes into account job characteristics (e.g.
task complexity and situational constraints) and person variables (e.g.
ability, commitment and self-efficacy). It is also able to explain, or
accounts for, the researcher’s findings where some of the aforementioned
theories were unable to do so.
71

11 Conclusions and Recommendations
11.1 What Motivates Employees at ACC
11.1.1 In descending order of importance or intensity, the most significant factors
motivating employees working at ACC have been identified as:
• Work itself – work that is challenging, varied and allows person to try
or learn new things
• Sense of achievement – achievement of goals/targets, making a
difference and helping others
• Recognition – feedback from others
• Advancement - career development, progression, advancement,
opportunities
11.1.2 This conclusion, that the work itself is the most important motivational
factor, is supported by the findings of both the qualitative and quantitative
research undertaken.
11.1.3 Interestingly, remuneration/salary scored lowest in the quantitative survey
and was either not mentioned or explicitly stated as not being a motivator
by most employees during their interviews.
11.2 Alignment with the High-Performance Cycle
11.2.1 The factors identified as being significant motivators of employees at ACC
align very strongly with a number of the motivational theories found in the
literature.
11.2.2 These factors form part of the construct of a number of theoretical
motivational theories, including Herzberg’s Two-Factor Theory, Job
Design Theory, Goal Setting Theory, Social Cognitive Theory and Locke
and Latham’s High-Performance Cycle.
11.2.3 The High-Performance Cycle incorporates all of the significant
motivational factors identified by the researcher (i.e. the work itself,
72

achievement, recognition) and provides a framework linking these factors
together.
11.2.4 It is therefore concluded that, of all the theories covered in the literature
review, the High-Performance Cycle most comprehensively explains the
sources and process of motivation for employees working at ACC.
11.2.5 Also, the High-Performance Cycle was constructed to assist with
predicting, explaining and influencing a person’s work motivation. So, not
only is the High-Performance Cycle able to explain the researcher’s
findings better than the other motivational theories found in the literature,
it may also inform management practices via its abilities to predict and
influence employee work motivation.
11.3 Public Sector Motivation
11.3.1 Again given the strong linkages with the various motivational theories, the
researcher’s findings do not support the contention that public sector
employees working at ACC are motivated differently to employees
working in the private sector. This conclusion is consistent with Wright’s
(2001) assertion that no consistent public-private sector differences have
been found.
11.3.2 The “public service motives” identified by Perry & Wise (1990), and
summarised in Table 4.2 above, were mentioned infrequently and with no
intensity during the interview stage of the researcher’s investigations.
11.3.3 The researcher’s findings do not provide any evidence that ACC employees
value the hygiene factors identified in Herzberg’s Two-Factor Theory. In
particular, “salary” was not perceived as being of significant value or
motivation. This contradicts Maidani (1991), who concluded that public
sector employees place a significantly higher value on extrinsic, hygiene
factors than private sector employees.
11.4 Motivation of New Zealand Workers
11.4.1 Given the strong linkages between the researcher’s findings and various
motivational theories found in the literature, it cannot be concluded that
there are any major differences between what motivates employees
working in New Zealand and those working in other countries.
73

11.5 Recommendations
11.5.1 Given the conclusions above, ACC senior management should give
consideration to the High-Performance Cycle when making changes to
ACC’s human resource policies and processes.
11.5.2 The process of acquiring, managing and retaining staff can be summarised
in the following diagram.
Figure 10.1: The “People Management” Process
Recruit Manage Retain
Design Job Set Goals Monitor Feedback Recognition
11.5.3 The High-Performance Cycle can inform ACC’s People Management
Process as follows:
Recruitment:
During the interview process:
− Attempt to establish whether there is good job alignment with
candidates through asking competency based questions.
− Be honest about what he role at ACC, including job specifications
and expectations. Do not “over selling” a role, even if there is
some desperation to fill it. In some situations it can be much
worse, in terms of a drain on existing resources, to hire “the
wrong person” than not hiring anyone at all.
− Find out what motivates and satisfies candidates. Get them to talk
about times in the past when they have been either highly
motivated or very satisfied at work. Prospective managers should
74

then ask themselves whether they believe can satisfy the
prospective employees’ motivational needs.
Job Design:
− Each job/employee situation is different. Even the same employee
in a different role may act or react differently to essentially the
same stimuli. For each employee, their job or tasks should be
challenging, meaningful to them and growth facilitating.
− Self-efficacy: managers should check that their direct reports
believe they can perform their job or the tasks assigned to them.
− Situational constraints: managers need to ensure their direct
reports have low situational constraints. If not, the manager
should work with the employee to remove or lower identified
constraints where possible.
− ACC should look at where jobs can be re-designed to provide
more challenges for existing staff. Lawler (1969) suggests that jobs
be enlarged both vertically and horizontally to provide intrinsic
motivation.
− For new recruits, ACC needs to be aware that some jobs will not
provide challenge, meaning or growth for very long. In particular,
new staff recruited in to junior roles may find challenge, meaning
and growth in the short term but longer term the intensity of these
factors will reduce. Job enlargement, job rotation, secondments or
one-off project work may help in these situations. Such initiatives
should be taken proactively, rather than waiting until a retention
problem presents itself.
Goal Setting:
− When setting goals or objectives for staff members, managers need
to:
• Aim to gain goal commitment from employees. That is, goals
should be negotiated rather than dictated. If an employee does
75
not believe their goals are attainable this will result in a lack
of commitment and a consequential lack of performance.
• Avoid situations where an employee’s focus on one goal may
be at the expense of one or more of their other goals (Bavelas
& Lee, 1978).
• Also avoid “goal conflict” (Locke et al, 1994), which may arise
when an individual is not able to prioritise two or more of
their goals, as this conflict usually results in the performance
on both goals suffering.
− Wright et al (1993) suggest an employee who is focused on
achieving their own goals may not be inclined to help others to
achieve their goals. Given senior management is more interested
in the performance of ACC as a whole, rather than any one
individual, consideration needs to be given to how individual staff
objectives align with their team and overall company objectives.
That is, achievement of an individual’s set of objectives should
align with and add to the overall ACC performance, rather than
create any conflict between individuals or teams.
Monitoring:
− Employee objectives should be measurable. More importantly, if
they are measurable, they should be measured.
Feedback:
− Having obtained information on how well an employee is
performing relative to their objectives, it is important to provide
feedback. Feedback may be positive or negative. It is important
that both are given, but not necessarily at the same time. Negative
feedback should be framed as “constructive criticism” with a focus
on avoiding mistakes/errors or improving performance in the
future.
− ACC needs to encourage a “culture of feedback and praise”. New
Zealanders are generally terrible at both giving and receiving
76

feedback and praise. In some areas of ACC this lack of feedback
and praise is the weakest link in the human resource chain!
Recognition:
− Part of the suggested “culture of feedback and praise” is
establishing a culture of staff members recognising the efforts of
others. Employees should not just be recognised and receiving
praise from their manager but, where appropriate, from other
ACC employees.
− Employees need to believe that external rewards, such as pay rises,
bonuses and non-cash awards, are attainable. If not, then any such
rewards will have little or no influence on performance.
− Doherty (1998) suggests that employees can experience high
levels of dissatisfaction if rewards are perceived as impersonal,
unfair, or seen as a punishment. In particular, high performers
being “rewarded” with more work, relative to low performers, is
often seen as a punishment. This last point is something some
managers at ACC have been guilty of. Instead, managers should
focus on setting goals, monitoring and providing feedback to low
performers to, hopefully, lift their performance levels. At the end
of the day, there is more “room for improvement” of a lower
performer than a high performer, so focusing on the former
should lead to higher organisational performance (as well as
avoiding high performers becoming dissatisfied and leaving).
Retention:
− Be aware that employees are individuals. The High-Performance
Cycle provides a framework with which to describe, and
potentially affect, work motivation and job satisfaction. However,
it is just that, a framework. Human resource policies and processes
need to be flexible enough to allow managers discretion when it
comes to both their management style and the individual traits of
their direct reports.
77
− Nothing is static! A job, task, or goal that motivates an employee
this year may not do so next year. Therefore managers and direct
reports should meet regularly to discuss career planning, both
within existing roles and beyond.
− All else being equal, motivation results in employee satisfaction,
which in turn generates commitment to the organisation (i.e.
lower turnover). ACC currently measures staff satisfaction, and
this measure can give an indication of likely future turnover rates
(i.e. low satisfaction can result in high turnover). However, ACC
should consider measures of motivation, either quantitatively via
surveys or qualitatively via manager/employee discussions. If staff
are unmotivated they are also likely to be dissatisfied. But worse,
they are also likely not to be performing as well as they could be,
which may have consequences for the organisation as a whole.
− Employee career advancement should not be an unplanned series
of events. Managers should plan, enable and facilitate employees’
career development within roles, within teams and across the
organisation.
78
12 Limitations of the Research
12.1.1 One of the limitations of the High-Performance Cycle is that its focus, with
respect to an employee’s feelings, is primarily on job satisfaction and
organisational commitment. The effect of an employee’s feelings with
regard to trust in organisational decision makers is not included in the
High-Performance Cycle. This includes a lack of focus on the feelings of
fairness and justice in the workplace (Latham, 2007).
12.1.2 Whilst the High-Performance Cycle appears to reasonably explain the
phenomenon of employee motivation at ACC, care should be taken when
using this motivational theory to inform management actions in ACC. Any
theory or model that attempts to explain a social construct, such as work
place motivation, is a simplification of “life”. That is, a theory will not be
able to predict of inform 100% of the outcomes 100% of the time.
12.1.3 Care should also be taken that the practical application of a theory, such as
the High-Performance Cycle, does not constrain practice. The High-
Performance Cycle provides a framework to inform human resource
activities and processes. It is not a set of hard and fast rules to be followed
unquestioningly.
12.1.4 Also, managers should never lose sight of the fact that their staff are people
first and employees second. That is, people have lives outside of work,
including families, friends, hobbies, sports and other commitments. The
High-Performance Cycle does not consider the interactions, and therefore
effects, of employees’ work and non-work lives.
12.1.5 Some employees interviewed appeared to be highly motivated in their
sporting or family lives. The question then becomes: Does/can work place
motivation lead to motivation in other parts of a person’s life, or vice
versa? And is it possible, in the long term, for a person to be motivated in
one aspect of their life but not in others?
79
13 Further Work
Low Performers
13.1.1 The quantitative survey conducted by ACC’s Human Resources team
focussed exclusively on high performers. As indicated by the implied
turnover rate derived from the survey results (see paragraph 9.2.7), this
group of employees are not the cause of the observed increase in staff
turnover at ACC.
13.1.2 Hence, a further study should be conducted focussing on ACC’s low and
mid-level performers and the results compared with the initial survey of
high performers.
13.1.3 The results of such a survey may better inform ACC’s staff retention plan,
as well as provide insight on how to improve the performance levels of
these lower performing employees.
Teams
13.1.4 The focus of ACC’s recent attention has been individual employees.
Consideration should also be given to studying how individuals work
together in teams within ACC, as well as how different teams interact.
Work/Life Interactions
13.1.5 As suggested earlier, ACC staff members are people first and employees
second. A study of people’s work and non-work motivation levels should
be undertaken to better understand:
− how they interact,
− the effect of a high or low level of motivation in one area of a
person’s life on other areas, and
− the sustainability of differing levels of motivation in various areas
of a person’s life (e.g. sustainability of a high level of motivation in
one’s sporting life combined with a low level of work motivation).
80

14 References
1. Adair, J. G. (1984), The Hawthorne Effect: A Reconsideration of the
Methodological Artifact, Journal of Applied Psychology, Vol. 69.
2. Adams, J. S. (1963), Towards an Understanding of Inequity, Journal of
Abnormal and Social Psychology, Vol. 67.
3. Alderfer, C. P. (1972), Existence, Relatedness, and Growth: Human Needs in
Organizational Settings, Free Press, New York.
4. Ambrose, M.L. & Kulik, C.T. (1999), Old Friends, New Faces: Motivation
Research in the 1990s, Journal of Management, Vol. 25, No. 3, pp 231-292.
5. Analoui, F. (2000), What Motivates Senior Managers? The Case of Romania,
Journal of Managerial Psychology, Vol. 15, No. 4.
6. Atkinson, J. W. (1964). Introduction to Motivation. Princeton, New Jersey.
7. Arvey, R.D., Bouchard Jr., T.J., Segal, N.L. & Abraham, L.M. (1989), Job
Satisfaction: Environmental and Genetic Components, Journal of Applied
Psychology, Vol. 74, Issue 2.
8. Bandura, A. (2004), Swimming Against the Mainstream: The Early Years
From Chilly Tributary to Transformation Mainstream, Behaviour Research
and Therapy, Vol. 42.
9. Bassett-Jones, N. & Jones, G.C. (2005), Does Herzberg’s Motivation Theory
Have Staying Power?, The Journal of Management Development, Vol. 24,
No. 10.
10. Bavelas, J. & Lee, E. S. (1978), Effect of Goal Level on Performance: A Trade-
Off of Quantity and Quality, Canadian Journal of Psychology, Vol. 32.
11. Benson, J.K. (1977), Organizations: A Dialectical Analysis, Administrative
Science Quarterly, Vol. 22.
12. Campbell, J.P., Dunnette, M. D., Lawler, E. E. & Weick, K. E. (1970),
Managerial Behavior, Performance, and Effectiveness, McGraw-Hill, New
York.
81

13. Carrell, M.R. & Dittrich, J.E. (1978), Equity Theory: The Recent Literature,
Methodological Considerations and New Directions, Academy of
Management Review, Vol. 3, pp 202-210.
14. Doherty, E.M. (1998), Emotional and Outcome Responses to Experiences of
Negative Rewards, Psychological Reports, Vol. 82.
15. Frost, P. (1980), Towards a Radical Framework for Practicing Organization
Science, Academy of Management Review, Vol. 5, No. 4.
16. Hackman, J.R. & Oldman, G.R. (1976), Motivation through the Design of
Work: Test of a Theory, Organizational Behaviour and Human Performance,
Vol. 16, pp 250-279.
17. Hall, D. T. & Nougaim, K. E (1968), An Examination of Maslow’s Hierarchy
in an Organizational Setting, Organizational Behavior & Human
Performance, Vol. 3, Issue 1.
18. Herzberg, F. (1987), One More Time: How Do You Motivate Employees?,
Harvard Business Review, September-October 1987.
19. Herzberg, F., Mausner, B. & Snyderman, B. B. (1959), The Motivation to
Work, Wiley, New York.
20. Hoppock, R. (1935), Job Satisfaction, Harper, New York.
21. House, R.J. & Wigdor, L.A. (1967), Herzberg’s Dual-Factor Theory of Job
Satisfaction and Motivation: A Review of the Evidence and a Criticism,
Personnel Psychology, Vol. 20, Issue 4, pp 369-389.
22. House, R.J., Shane, S.A. & Herold, D.M. (1996), Rumours of the Death of
Dispositional Research are Vastly Exaggerated, Academy of Management
Review, Vol. 21, Issue 1, pp 203-224.
23. House, R.J., Shapiro, H.J., & Wahba, M.A. (1974), Expectancy Theory as a
Predictor of Work Behavior and Attitude: A Re-evaluation of Empirical
Evidence, Decision Sciences, Vol.5.
24. Houser, J.D. (1938), Measurement of the Vital Products of Business, Journal
of Marketing, Vol. 2.
82
25. Jabroun, N. & Balakrishnan, V. (2000), Participation and Job Performance
in the Malaysian Public Service Department, International Journal of
Commerce & Management, Vol. 10, No. 3 & 4.
26. Jick, T. D. (1979), Mixing Qualitative and Quantitative Methods:
Triangulation in Action, Administrative Science Quarterly, Vol. 24.
27. Katsva, M. & Condrey, S.E. (2005), Motivating Personnel at Russian Nuclear
Power Planes: A Case-Study of Motivation Theory Application, Public
Personnel Management, Vol. 34, No. 4.
28. Khojasteh, M. (1993), Motivating the Private vs. Public Sector Managers,
Public Personnel Management, Vol. 22, No. 3, pp 391-401.
29. Kulik, C. (1999), Old Friends, New Faces: Motivation Research in the 1990s,
Journal of Management, Vol. 25, No. 3.
30. Latham, G. P. (2007), Work Motivation: History, theory, Research, and
Practice, Sage Publications, Thousand Oaks.
31. Lawler, E. E. (1969), Job Design and Employee Motivation, Personnel
Psychology, Vol. 22, Issue 4.
32. Likert, R. (1932), A Technique for the Measurement of Attitudes, Archives of
Psychology, Vol. 140, No. 55.
33. Locke, E.A. (1968), Towards a Theory of Task Motivation and Incentives,
Organizational Behavior & Human Performance, Vol. 3.
34. Locke, E. A. (1975), Personnel Attitudes and Motivation, Annual Review of
Psychology, Vol. 26.
35. Locke, E.A. (1996), Motivation through Conscious Goal Setting, Applied &
Preventive Psychology, Vol. 5.
36. Locke, E.A. & Latham, G.P. (1990), Work Motivation and Satisfaction: Light
at the End of the Tunnel, Psychological Science, Vol. 1, No. 4.
37. Locke, E.A. & Latham, G.P. (2004), What Should We Do About Motivation
Theory? Six Recommendations for the Twenty-First Century, Academy of
Management Review, Vol. 29, No. 3.
83
38. Maidani, E.A. (1991), Comparative Study of Herzberg’s Two-Factor Theory
of Job Satisfaction Among Public and Private Sectors, Public Personnel
Management, Vol. 20, Issue 4.
39. Maier, N. R. F. (1955), Psychology in Industry (2nd ed.), Houghton Mifflin,
Boston.
40. Maslow, A. H. (1943), A Theory of Human Motivation, Psychological
Review, Vol. 50.
41. Maslow, A. H. (1965), Eupsychian Management: A Journal, Irwin,
Homewood, Illinois.
42. McGregor, D. M. (1957), The Human Side of Enterprise, Management
Review, Vol. 46.
43. Newstrom, J. W., Reif, W. E. & Monczka, R. M. (1976), Motivating the
Public Employee: Fact vs. Fiction, Public Personnel Management, Vol. 5.
44. Pathak, R. D., Budhwar, P. S., Singh, V. & Hannas, P. (2005), Best HRM
Practices and Employees’ Psychological Outcomes: A Study of Shipping
Companies in Cyprus, South Asian journal of Management, Vol. 12, No. 4.
45. Perry, J.L. & Porter, L.W. (1982), Factors Affecting the Context for
Motivation in Public Organizations, Academy of Management Review, Vol.
7, No. 1.
46. Perry, J.L. & Wise, L.R. (1990), The Motivational Bases of Public Service,
Public Administration Review 50(3): 367-73.
47. Perry, J.L. (2000), Bringing Society In: Towards a Theory of Public-Service
Motivation, Journal of Public Administration Research and Theory, Vol. 10,
No. 2.
48. Pinder, C.C. (1998), Work Motivation in Organisational Behaviour,
Prentice-Hall, New Jersey.
49. Porter, L. W. & Lawler, E.E. (1968), Managerial Attitudes and Performance,
Irwin, Homewood, Illinois.
84
50. Rainey, H. G. & Bozeman, B. (2000), Comparing Public and Private
Organizations: Empirical Research and the Power of the A Priori, Journal of
Public Administration Research & Theory, Vol. 10, No. 2.
51. Ramlall (2004), A Review of Employee Motivation Theories and Their
Implications for Employee Retention within Organisations, Journal of
American Academy of Business, Cambridge, Vol. 5, No. 1/2.
52. Roethlisberger, F. J. (1977), The Elusive Phenomena, Harvard University
Press, Cambridge, MA.
53. Ruthankoon, R. & Ogunlana, S. O. (2003), Testing Herzberg’s Two-Factor
Theory in the Thai Construction Industry, Engineering Construction &
Architectural Management, Vol. 10, Issue 5.
54. Sanders, P (1982), Phenomenology: A New Way of Viewing Organizational
Research, Academy of Management Review, Vol. 7, No. 3.
55. Saunders, M., Lewis, P. & Thornhill, A. (2003), Research Methods for
Business Students, Prentice Hall, Harlow, England.
56. Schmidt, F.L. (1973), Implications of a Measurement Problem for Expectancy
Theory Research, Organizational Behavior & Human Performance, Vol. 10.
57. Steers, R.M. & Mowday, R.T. (1977), The Motivation Properties of Tasks,
Academy of Management Review, October 1977.
58. Steers, R.M., Mowday, R.T. & Shapiro, D.L. (2004), The Future of Work
Motivation Theory, Academy of Management Review, Vol. 29, No. 3.
59. Steers, R.M. & Porter, L.W. (1991), Motivation and Work Behaviour,
McGraw Hill, New York.
60. Thorndike, E. (1911), Animal Intelligence, MacMillan, New York.
61. Thurstone, L. L. (1929), Theory of Attitude Measurement, Psychological
Review, Vol. 36.
62. van Manen, M. (1990), Researching Lived Experience: Human Science for an
Action Sensitive Pedagogy, Althouse Press, Ontario.
63. Vroom, V.H. (1964), Work and Motivation, Wiley, New York.
85

64. Wahba, M. A. & Bridwell, L. G. (1976), Maslow Reconsidered: A Review of
Research on the Need Hierarchy Theory, Organisational Behavior and
Human Performance, Vol. 15.
65. Watson, J.B. (1913), Psychology as the Behaviorist Views it, Psychology
Review, Vol. 22.
66. Wertheim, E. G. (2007), Historical Background of Organizational Behavior,
notes prepared by Professor Edward G. Wertheim, College of Business
Administration, Northeastern University, Noston, MA 02115.
67. Wikipedia (2008), Internet based encyclopaedia,
//en.wikipedia.org/wiki/Positivism
68. Wilson, T. D. (2002), Alfred Schutz, Phenomenology and Research
Methodology for Information Behaviour Research, a paper delivered at the
Fourth International Conference on Information Seeking in Context,
Universidale Lusiada, Lisbon, Portugal, September 11 to 13, 2002.
69. Wittmer, D. (1991), Serving the People or Serving for Pay: Reward
Preferences among Government, Hybrid Sector and Business Managers, Public
Productivity & Management Review, Vol. 14, No. 4.
70. Wright, B.E. (2001), Public-Sector Work motivation: A Review of the Current
Literature and a Revised Conceptual Model, Journal of Public Administration
Research and Theory, Vol. 11, Issue 4, pp 559-586.
71. Wright, B.E. (2001a), Work Motivation in the Public Sector: An Application
of Goal and Social Cognitive Theories, Academy of Management Proceedings
2001.
72. Wright, P.M., George, J. M., Farnsworth, S.A. & McMahan, G.C. (1993),
Productivity and Extra-Role Behavior: The Effects of Goals and Incentives on
Spontaneous Helping, Journal of Applied Psychology, Vol. 78.
86

Appendix 1 – Quantitative Survey
For sections A to E:
Rating 1 - Importance
Please rate how important each item is to you (whether it's available or not) on a
scale from 1 to 5, where 1 = not at all important and 5 = very important.
Rating 2 – Needs Met
Now rate the degree to which ACC meets your needs on each item, on a scale from
1 to 5 where 1 = my needs are not met at all and 5 = my needs are fully met.
A. Professional development
1. Availability of job related training
2. Opportunities for career planning and development
3. Opportunities for career advancement/promotion
4. Opportunities for secondments / new assignments
B. Remuneration & Rewards
5. Base salary
6. Performance based pay
7. Benefits (e.g. leave, superannuation, wardrobe subsidies, sponsorships)
8. Alternative reward systems (e.g. long service awards)
C. Nature of Job
9. Clarity of role expectations
10. Job security
11. Work challenge
12. Work variety
13. Authority and empowerment to do the job
14. Opportunity to put one’s skills and talents to best use
15. Availability of tools and equipment to do the job
D. Leadership
16. Quality of leadership
17. Availability of mentors/coaches within the organisation
18. Feedback and recognition from your manager 87

19. Support from your manager
E. Culture
20. Effective internal communication
21. Work-life balance
22. Work environment
23. Supportive, collaborative relationships with colleagues
24. Reputation of the organisation
88
Related Documents