The Use of a Ring Shear Tester to Evaluate the Flowability of Pharmaceutical Bulk Solids INAUGURAL – DISSERTATION zur Erlangung des Doktorgrades der Mathematisch-Naturwissenschaftlichen Fakultät der Heinrich-Heine-Universität Düsseldorf Vorgelegt von Hind Jaeda aus Libyen Düsseldorf, 2009

Welcome message from author
This document is posted to help you gain knowledge. Please leave a comment to let me know what you think about it! Share it to your friends and learn new things together.
Transcript
The Use of a Ring Shear Tester to Evaluate the Flowability
of Pharmaceutical Bulk Solids
INAUGURAL – DISSERTATION
zur
Erlangung des Doktorgrades der
Mathematisch-Naturwissenschaftlichen Fakultät der
Heinrich-Heine-Universität Düsseldorf
Vorgelegt von
Hind Jaeda
aus Libyen
Düsseldorf, 2009
II
Aus dem Institut für Pharmazeutische Technologie und Biopharmazie
der Heinrich-Heine-Universität Düsseldorf
Mathematisch-Naturwissenschaftliche Fakultät der
Heinrich-Heine-Universität Düsseldorf
Referent: Prof. Dr. Peter Kleinebudde
Korreferent: Prof. Dr. Jörg Breitkreuz
III
Table of content
Table of content………………………………………………………………………………III
List of abbreviations…………………………………………………………………………VII
List of figures……………………………………………………………………………….VIII
List of tables………………………………………………………………………………….XI
1 Introduction....................................................................................................................1
1.1 Flowability..............................................................................................................1
1.1.1 Flow patterns and problems.............................................................................1
1.1.2 Flow behaviour of powders (forces and stresses) .............................................2
1.1.3 Adhesive forces...............................................................................................6
1.1.4 Methods for flowability measurements............................................................9
1.1.4.1 Direct shear testers ........................................................................................10
1.1.4.1.1 Translational testers................................................................................10
1.1.4.1.2 Rotational testers ....................................................................................11
1.1.4.2 Indirect shear testers......................................................................................12
1.1.4.2.1 Uniaxial testers.......................................................................................12
1.1.4.2.2 Biaxial testers: ........................................................................................13
1.1.4.2.3 Triaxial tester .........................................................................................14
1.1.4.3 Conventional simple test methods .................................................................15
1.2 Shear testers..........................................................................................................17
1.2.1 What is measured using the Schulze ring shear tester?...................................17
1.2.2 Schulze ring shear tester (RST-01.Pc) ...........................................................18
1.2.3 Schulze ring shear tester (RST-XS) ...............................................................22
1.3 Glidants ................................................................................................................22
2 Aim of this work...........................................................................................................24
3 Results and Discussion .................................................................................................26
IV
3.1 Comparison between two ring shear testers of different size..................................26
3.1.1 Aim of this study...........................................................................................26
3.1.2 Results ..........................................................................................................27
3.1.2.1 ffc values of binary mixtures .....................................................................27
3.1.2.2 Comparison of the large and small Schulze testers.....................................30
3.1.3 Discussion.....................................................................................................34
3.2 Investigating the influence of different Aerosil types and concentrations on powder
flow using different methods ............................................................................................36
3.2.1 Introduction and objective .............................................................................36
3.2.2 Results ..........................................................................................................37
3.2.2.1 Flowability ................................................................................................37
3.2.2.2 Conventional methods ...............................................................................39
3.2.2.2.1 Angle of repose ...................................................................................39
3.2.2.2.2 Hausner ratio .......................................................................................40
3.2.2.2.3 Flow rate .............................................................................................42
3.2.2.3 Capsule filling ...........................................................................................42
3.2.2.4 SEM..........................................................................................................45
3.2.3 Discussion.....................................................................................................48
3.3 Flow behaviour of binary mixtures with different concentrations ..........................51
3.3.1 Introduction & objective................................................................................51
3.3.2 Results ..........................................................................................................52
3.3.2.1 Dicafos mixtures .......................................................................................53
3.3.2.1.1 ffc results.............................................................................................53
3.3.2.1.2 Density results .....................................................................................55
3.3.2.2 Flowlac mixtures.......................................................................................56
3.3.2.2.1 ffc results.............................................................................................56
V
3.3.2.2.2 Density results .....................................................................................58
3.3.2.3 Inhalac mixtures ........................................................................................59
3.3.2.3.1 ffc results.............................................................................................59
3.3.2.3.2 Density results .....................................................................................60
3.3.2.4 SEM..........................................................................................................62
3.3.3 Discussion.....................................................................................................63
3.4 The flow behaviour of different fats in absence and presence of Aerosil................68
3.4.1 Introduction & aim of work...........................................................................68
3.4.1.1 Lipids........................................................................................................68
3.4.1.2 Silicon dioxide (Aerosil®)..........................................................................69
3.4.2 Results ..........................................................................................................69
3.4.2.1 ffc versus % Aerosil ..................................................................................69
3.4.2.2 SEM..........................................................................................................73
3.4.2.3 BET...........................................................................................................75
3.4.3 Discussion.....................................................................................................76
4 Summary ......................................................................................................................80
5 Zusammenfassung der Arbeit........................................................................................83
6 Experimental Part .........................................................................................................87
6.1 Materials...............................................................................................................87
6.1.1 Active ingredients .........................................................................................87
6.1.2 Excipients .....................................................................................................88
6.1.3 Silicon dioxide (Aerosil®) .............................................................................89
6.1.4 Lipids............................................................................................................90
6.2 Methods................................................................................................................91
6.2.1 Samples preparation ......................................................................................91
6.2.1.1 Paracetamol/Aerosil mixtures....................................................................91
VI
6.2.1.2 Binary mixtures.........................................................................................91
6.2.1.3 Lipids / Aerosil mixtures ...........................................................................91
6.2.2 Ring shear tester............................................................................................92
6.2.3 Poured and tapped densities...........................................................................93
6.2.4 Angle of repose .............................................................................................93
6.2.5 Flow rate.......................................................................................................94
6.2.6 Capsule filling...............................................................................................94
6.3 Characterisation of powders..................................................................................94
6.3.1 Helium pycnometer density...........................................................................94
6.3.2 Porosity.........................................................................................................95
6.3.3 Laser diffractometer ......................................................................................95
6.3.4 BET gas adsorption .......................................................................................95
6.3.5 SEM..............................................................................................................96
7 References ....................................................................................................................97
VII
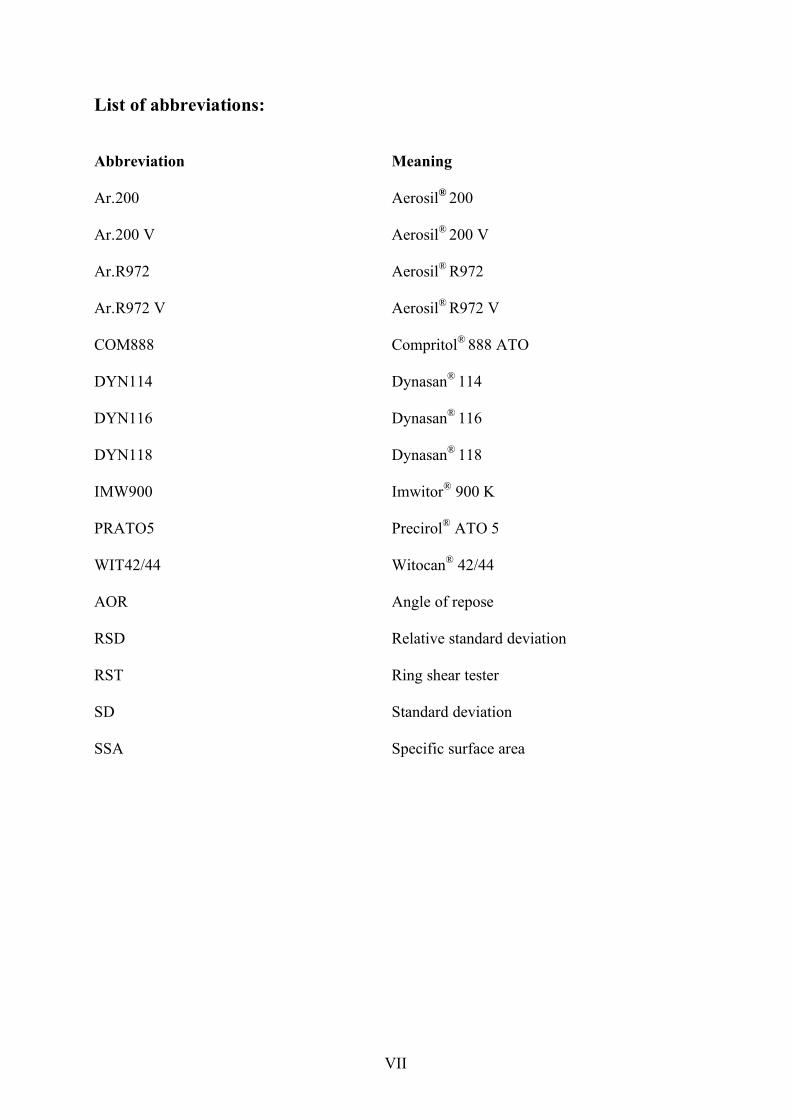
List of abbreviations: Abbreviation Meaning
Ar.200 Aerosil® 200
Ar.200 V Aerosil® 200 V
Ar.R972 Aerosil® R972
Ar.R972 V Aerosil® R972 V
COM888 Compritol® 888 ATO
DYN114 Dynasan® 114
DYN116 Dynasan® 116
DYN118 Dynasan® 118
IMW900 Imwitor® 900 K
PRATO5 Precirol® ATO 5
WIT42/44 Witocan® 42/44
AOR Angle of repose
RSD Relative standard deviation
RST Ring shear tester
SD Standard deviation
SSA Specific surface area
VIII
List of figures:
Figure 1: Powder flow patterns and common problems.
Figure 2: Element of bulk solid.
Figure 3: Force of equilibrium on an element of bulk solid, the Mohr stress circle.
Figure 4: Dependency of forces on the distance between a flat surface and a sphere, where
d = 10µm.
Figure 5: Dependency of forces on the particle size.
Figure 6: Dependency of forces on surface roughness.
Figure 7: Shear testers. Figure 8: Ring shear cell of Schulze.
Figure 9: Yield locus as constructed with a ring shear tester.
Figure 10: Mohr stress circles (σ1 consolidation stress; σc unconfined yield strength)
Figure 11: ffc values of Dicafos mixtures with Mesalazine, Dicafos PAF & Paracetamol, n=2
Figure 12: ffc values of Flowlac 100 mixtures with Mesalazine, starch, Granulac &
Paracetamol, n=2
Figure 13: ffc values of Inhalac 230 mixtures with Mesalazine, Granulac & Paracetamol,
n=2.
Figure 14: Correlation between the ffc values from both large and small tester for binary
mixtures of Flowlac100, (♦) with Mesalazine, (■) Granulac200 and (▲) with Paracetamol.
Mean value of two measurements with regression lines; ffc values >10 are not shown.
Figure 15: Correlation between the ffc values from both large and small tester for binary
mixtures of Dicafos, (♦) with Mesalazine, (■) Dicafos PAF and (▲) with Paracetamol. Mean
value of two measurements with regression lines; ffc values >10 are not shown
IX
Figure 16: Correlation between the ffc values from both large and small tester for binary
mixtures of Inhalac230, (♦) with Mesalazine, (■) Granulac200 and (▲) with Paracetamol.
Mean value of two measurements with regression lines; ffc values >10 are not shown
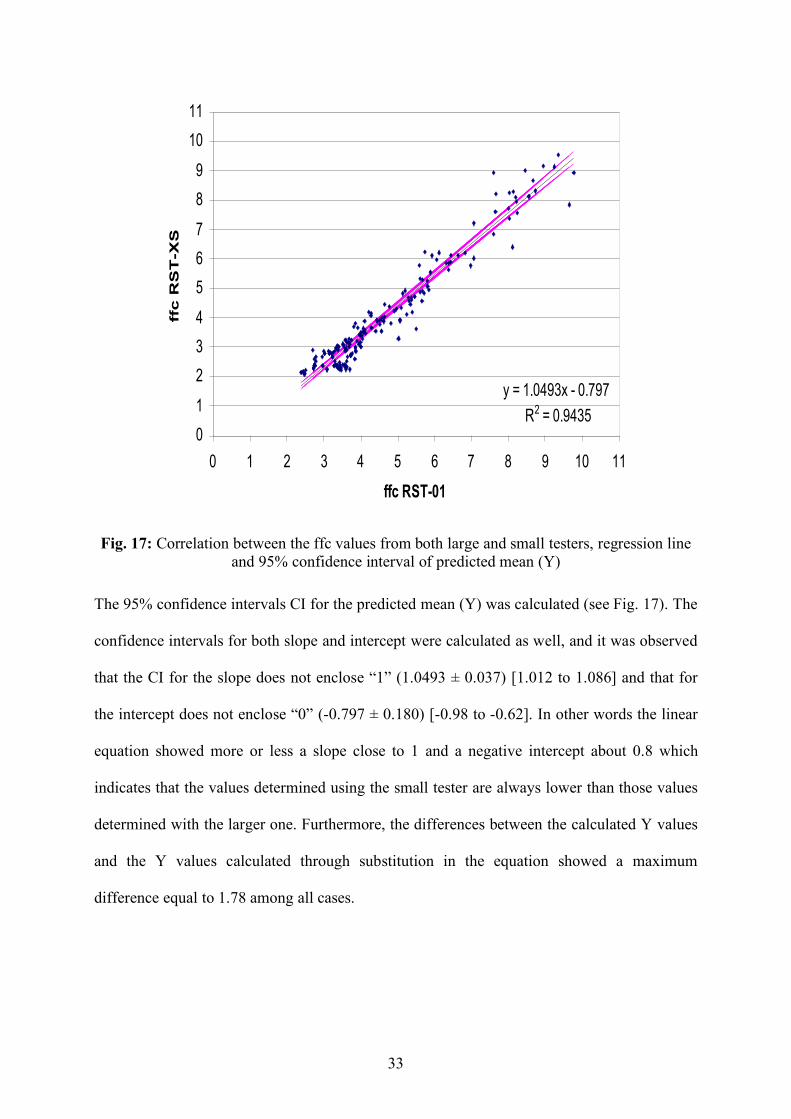
Figure 17: Correlation between the ffc values from both large and small testers, regression
line and 95% confidence interval of predicted mean (Ү)
Figure 18: The ffc versus the percentage of glidant in the mixture, n=3 mean ± S.D.
Paracetamol ffc = 3.4 ± 0.13
Figure 19: Angle of repose versus percentage of glidant in the mixture, n=3 mean ± S.D.
Paracetamol = 58°
Figure 20: Angle of repose versus ffc, n=3 mean ± S.D.
Figure 21: Hausner ratio versus % glidant, n=2, error bars indicating (maximum/ minimum
values). Paracetamol = 1.58 ± 0.004
Figure 22: Hausner ratio versus ffc, n=2, error bars indicating (maximum/ minimum values)
Figure 23: Average weight content versus ffc values, n = 3 mean value ± S.D.
Figure 24: Relative standard deviation versus ffc for all batches.
Figure 25: SEM micrographs of Paracetamol with different percentages of standard
hydrophilic and hydrophobic Aerosil
Figure 26: SEM micrographs of Paracetamol with different percentages of densified
hydrophilic and hydrophobic Aerosil
Figure 27: Log (ffc) versus % Dicafos (V/V) with Paracetamol (■), Mesalazine (♦), Dicafos
PAF (●) and Praziquantel(▲), n=2.
Figure 28: Density versus percentage of Dicafos (V/V) for all four Dicafos mixtures (notice
different scale of y-axis)
Figure 29: Log (ffc) versus % Flowlac 100 (V/V) with Paracetamol (■), Mesalazine (♦),
Starch (●) and Granulac (▲), n=2.
Figure 30: Density versus percentage of Flowlac (V/V) for all four Flowlac mixtures
X
Figure 31: Log (ffc) versus % Inhalac 230 (V/V) with Paracetamol (■), Mesalazine (♦) and
Granulac (▲), n=2.
Figure 32: Density versus percentage of Inhalac (V/V) for all three Inhalac mixtures
Figure 33: Shape of substances used in this study
Figure 34: ffc values with or without Aerosil R 972 V and Aerosil 200 V. n=3, mean value ±
S.D.
Figure 35: ffc values of Dynasan 118 and Imwitor 900K versus percentages of Aerosil R
972V and Aerosil 200V, n=3, mean ± S.D. (for some samples the standard deviation was
smaller than the size of the symbol)
Figure 36: SEM micrographs of all lipids used in this study (different magnification)
Figure 37: Relation between specific surface areas (SSA), [mean value ± S.D, n=3] as
measured with BET method and the ffc values [mean value ± S.D, n=3] of 5 different lipids
with 2% Aerosil 200 V and 2% Aerosil R 972 V

XI
List of tables: Table 1: Shear cells used in this work
Table 2: Slope, intercept and correlation coefficient r as represented with the linear regression
equation for all binary mixtures.
Table 3: Active ingredients and excipients used in these experiments
Table 4: lipids used in this study
Table 5: Further information about active ingredients used in this work
Table 6: Further information about excipients used in this work
Table 7: Glidants used in this study
Table 8: Further information about lipids used in this study

1
1 Introduction
1.1 Flowability
The word “Flow” is a verb referring to the continuous motion or movement in a stream.
However, the term flowability refers to the plastic deformation of a bulk solid due to the loads
acting on it. A free flowing powder is the one flowing easily without obstructions for example
through a silo or a hopper, while a poor flowing powder is the one experiencing obstructions
during handling [1, 2, 3, 4]. Therefore the formulation of free flowing powders is a crucial
and essential requirement for a successful production [5]. Flowability of pharmaceutical
powders affects mixing, filling and dosing processes and determines whether a product fulfils
the requirements of quality control, e.g. weight content and content uniformity. Since
approximately 80% of pharmaceutical products or the ingredients required for their
manufacture are in powder form [6] and the fact that most of these powders are not free
flowing [2], the assessment of their flowability is a crucial and essential step in the
development process. Flowability estimation is also important to design the suitable powder
handling equipment, e.g. bins and silos. Briefly, the early assessment of the flowability saves
financial costs and time as well [7].
1.1.1 Flow patterns and problems
Powders follow one of two flow patterns: mass flow or funnel flow. In mass flow (also
referred to as first in first out), which is the desirable hopper flow pattern, all of the powder in
the hopper is in motion [1, 2, 8, 9]. In funnel flow (also referred to as first in last out), the
central core of powder exits the bin or hopper first, followed by the powder at the sides of the
container [10, 11, 12].
2
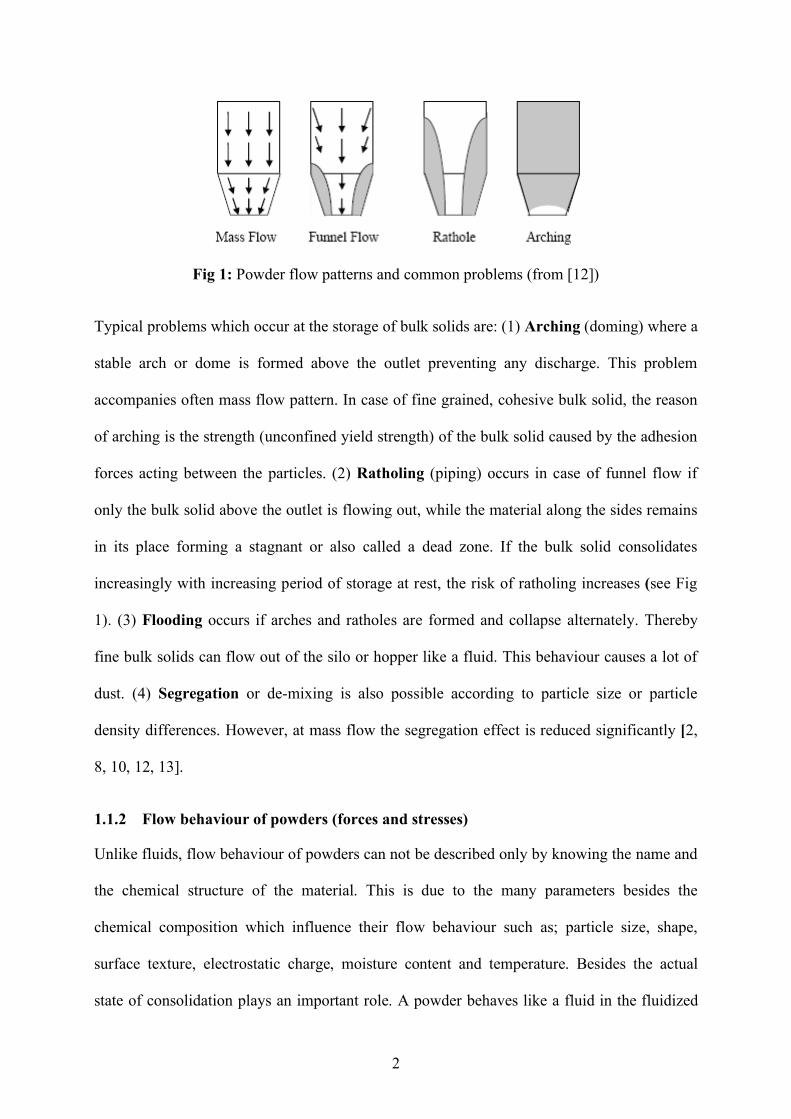
Fig 1: Powder flow patterns and common problems (from [12])
Typical problems which occur at the storage of bulk solids are: (1) Arching (doming) where a
stable arch or dome is formed above the outlet preventing any discharge. This problem
accompanies often mass flow pattern. In case of fine grained, cohesive bulk solid, the reason
of arching is the strength (unconfined yield strength) of the bulk solid caused by the adhesion
forces acting between the particles. (2) Ratholing (piping) occurs in case of funnel flow if
only the bulk solid above the outlet is flowing out, while the material along the sides remains
in its place forming a stagnant or also called a dead zone. If the bulk solid consolidates
increasingly with increasing period of storage at rest, the risk of ratholing increases (see Fig
1). (3) Flooding occurs if arches and ratholes are formed and collapse alternately. Thereby
fine bulk solids can flow out of the silo or hopper like a fluid. This behaviour causes a lot of
dust. (4) Segregation or de-mixing is also possible according to particle size or particle
density differences. However, at mass flow the segregation effect is reduced significantly [2,
8, 10, 12, 13].
1.1.2 Flow behaviour of powders (forces and stresses)
Unlike fluids, flow behaviour of powders can not be described only by knowing the name and
the chemical structure of the material. This is due to the many parameters besides the
chemical composition which influence their flow behaviour such as; particle size, shape,
surface texture, electrostatic charge, moisture content and temperature. Besides the actual
state of consolidation plays an important role. A powder behaves like a fluid in the fluidized
3
state, whereas it behaves like a solid if it has been compacted before. Therefore, during
storage and transportation of powders, loose and slightly compressed bulk solids are dealt
with [11].
In order to explain stresses acting in a powder, it is essential to mention the forces from which
those stresses are calculated. When dealing with bulk solids or powders the state of load
acting upon it does not consider individual particles, but the forces acting on the boundary
areas of volume elements and the resulting deformations [2]. In a powder forces acting on an
area (A) are:
*The normal force FN; force acting perpendicular to area A.
*The shear force FS; force acting parallel to area A.
To describe the load acting on a powder independently of the dimensions of the area, stresses
are calculated from the forces to obtain:
*The normal stress σ = FN/A; stress acting perpendicular to area A.
*The shear stress τ = FS/A; stress parallel to area A.
If a force in any direction is acting on a plane, the resolution of this force into a perpendicular
and a parallel component yields the normal and shear stresses acting on the plane [2]. To
simplify the understanding of powders behaviour some well known facts in bulk solids
technology have to be mentioned. Different shear stresses emerge in different cutting planes
due to friction and a bulk solid can transmit shear stresses even if it is at rest. Therefore
powders can have sloped surfaces even at rest. Normal stresses are mainly compressive
stresses also defined as positive normal stresses. Generally, stress conditions can be
represented with Mohr stress circles (see figure 10). The unit used for stress is Pa (Pascal)
according to the international system of units (SI) [2, 11, 14].
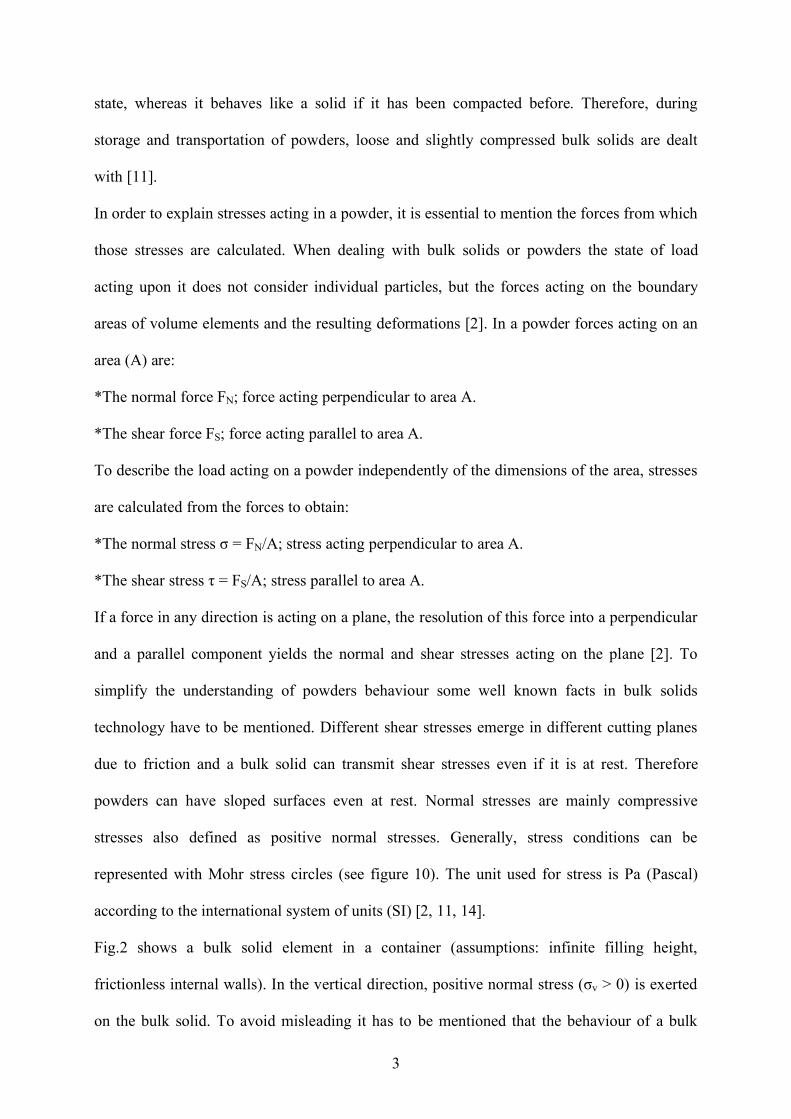
Fig.2 shows a bulk solid element in a container (assumptions: infinite filling height,
frictionless internal walls). In the vertical direction, positive normal stress (σv > 0) is exerted
on the bulk solid. To avoid misleading it has to be mentioned that the behaviour of a bulk
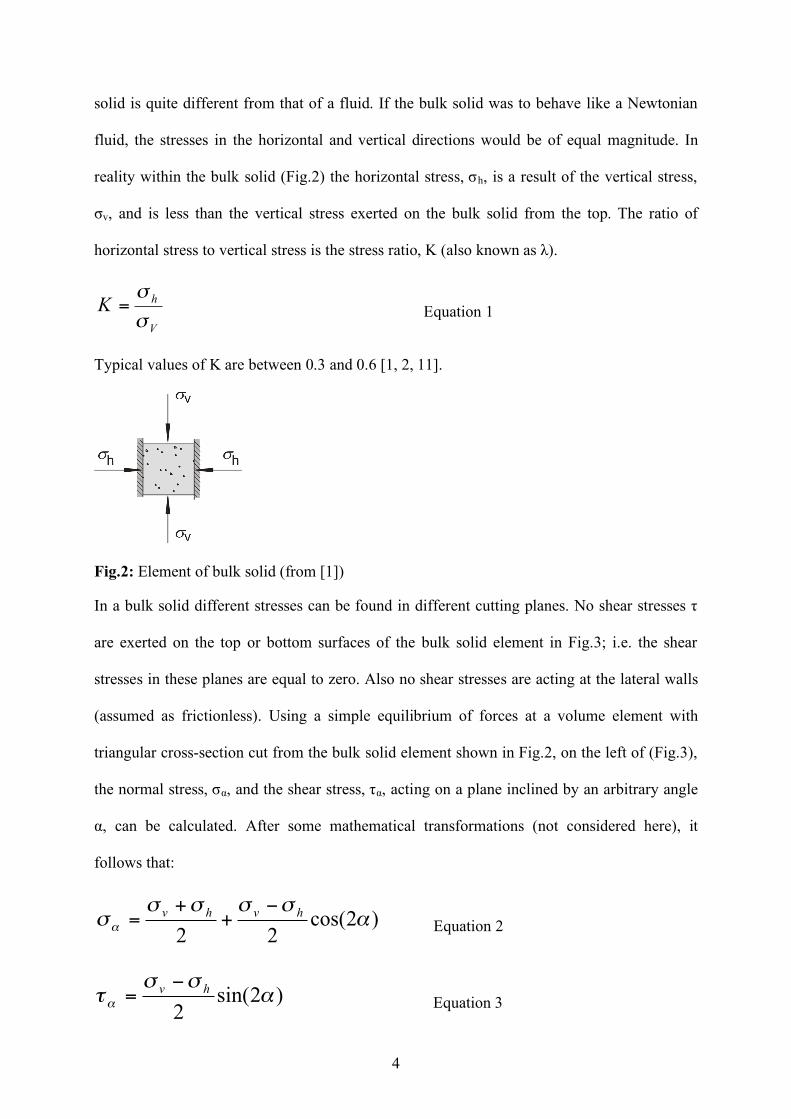
4
solid is quite different from that of a fluid. If the bulk solid was to behave like a Newtonian
fluid, the stresses in the horizontal and vertical directions would be of equal magnitude. In
reality within the bulk solid (Fig.2) the horizontal stress, σh, is a result of the vertical stress,
σv, and is less than the vertical stress exerted on the bulk solid from the top. The ratio of
horizontal stress to vertical stress is the stress ratio, K (also known as λ).
V
hK
!
!= Equation 1
Typical values of K are between 0.3 and 0.6 [1, 2, 11].
Fig.2: Element of bulk solid (from [1])
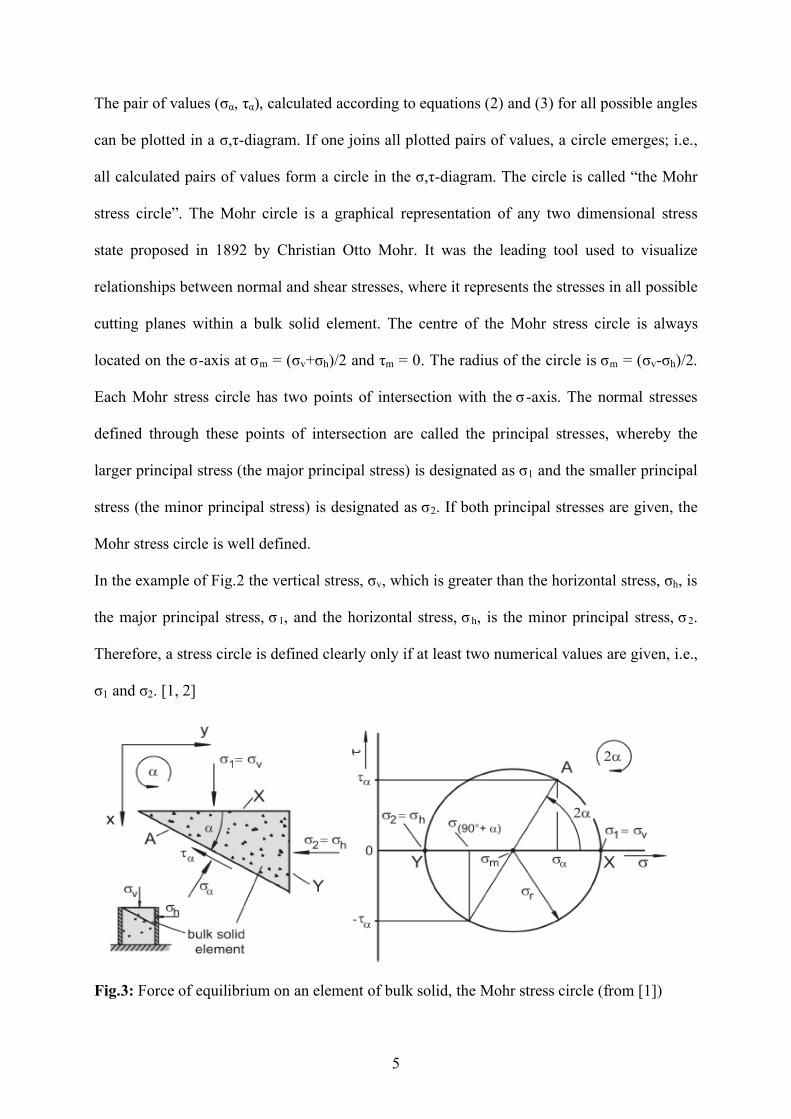
In a bulk solid different stresses can be found in different cutting planes. No shear stresses τ
are exerted on the top or bottom surfaces of the bulk solid element in Fig.3; i.e. the shear
stresses in these planes are equal to zero. Also no shear stresses are acting at the lateral walls
(assumed as frictionless). Using a simple equilibrium of forces at a volume element with
triangular cross-section cut from the bulk solid element shown in Fig.2, on the left of (Fig.3),
the normal stress, σα, and the shear stress, τα, acting on a plane inclined by an arbitrary angle
α, can be calculated. After some mathematical transformations (not considered here), it
follows that:
)2cos(22
!""""
"!
hvhv#
++
= Equation 2
)2sin(2
!""
#!hv
$= Equation 3
5
The pair of values (σα, τα), calculated according to equations (2) and (3) for all possible angles
can be plotted in a σ,τ-diagram. If one joins all plotted pairs of values, a circle emerges; i.e.,
all calculated pairs of values form a circle in the σ,τ-diagram. The circle is called “the Mohr
stress circle”. The Mohr circle is a graphical representation of any two dimensional stress
state proposed in 1892 by Christian Otto Mohr. It was the leading tool used to visualize
relationships between normal and shear stresses, where it represents the stresses in all possible
cutting planes within a bulk solid element. The centre of the Mohr stress circle is always
located on the σ-axis at σm = (σv+σh)/2 and τm = 0. The radius of the circle is σm = (σv-σh)/2.
Each Mohr stress circle has two points of intersection with the σ -axis. The normal stresses
defined through these points of intersection are called the principal stresses, whereby the
larger principal stress (the major principal stress) is designated as σ1 and the smaller principal
stress (the minor principal stress) is designated as σ2. If both principal stresses are given, the
Mohr stress circle is well defined.
In the example of Fig.2 the vertical stress, σv, which is greater than the horizontal stress, σh, is
the major principal stress, σ 1, and the horizontal stress, σ h, is the minor principal stress, σ 2.
Therefore, a stress circle is defined clearly only if at least two numerical values are given, i.e.,
σ1 and σ2. [1, 2]
Fig.3: Force of equilibrium on an element of bulk solid, the Mohr stress circle (from [1])
6
1.1.3 Adhesive forces
Whether a bulk solid is freely or poorly flowing, depends on the ratio between the
interparticle forces and the gravitational forces [5, 15, 16, 17]. The ratio of interparticle force
to the gravitational force is inversely proportional to the square of the particle diameter [5,
17]. Particles are cohesive if the interparticle adhesive forces exceed the particles weight, for
example most materials with diameters smaller than 30 µm. Therefore small particles stick
more strongly together and flow poorly with decreasing particle size [5, 16, 17]. Different
mechanisms create adhesive forces between individual particles. Major adhesive forces are
due to liquid bridges, electrostatic, and van der Waals interactions [2]. Regarding fine, dry
bulk solids at short interparticle distance (below 50 nm down to the contact distance of around
0.4 nm) [5, 15, 16], van der Waals forces are the prevailing interparticle forces. Van der Waal
forces are based on electric dipoles of atoms and molecules. Electrostatic forces are due to
different electric potentials of particle surfaces. In case of moist bulk solids, liquid bridges
between the particles usually are most important, where the particles are attracted to each
other due to surface tension [1, 2].
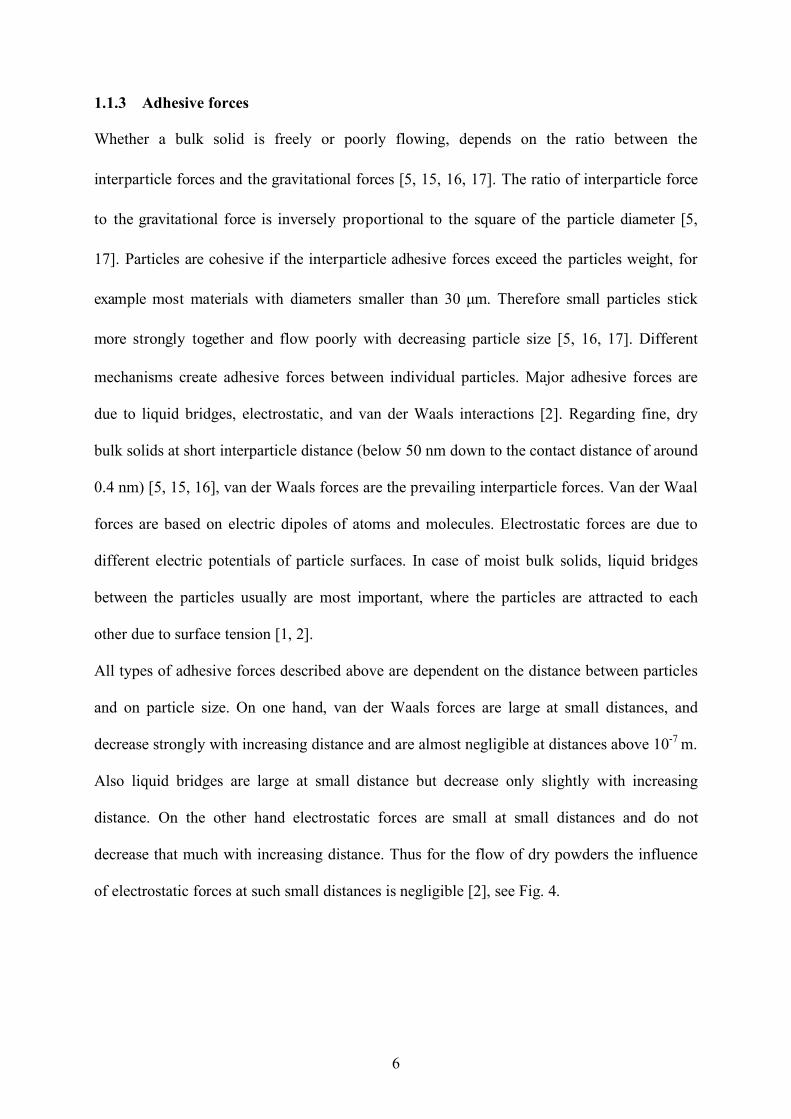
All types of adhesive forces described above are dependent on the distance between particles
and on particle size. On one hand, van der Waals forces are large at small distances, and
decrease strongly with increasing distance and are almost negligible at distances above 10-7 m.
Also liquid bridges are large at small distance but decrease only slightly with increasing
distance. On the other hand electrostatic forces are small at small distances and do not
decrease that much with increasing distance. Thus for the flow of dry powders the influence
of electrostatic forces at such small distances is negligible [2], see Fig. 4.
7
Fig. 4: Dependency of forces on the distance between a flat surface and a sphere, where d = 10µm (from [18])
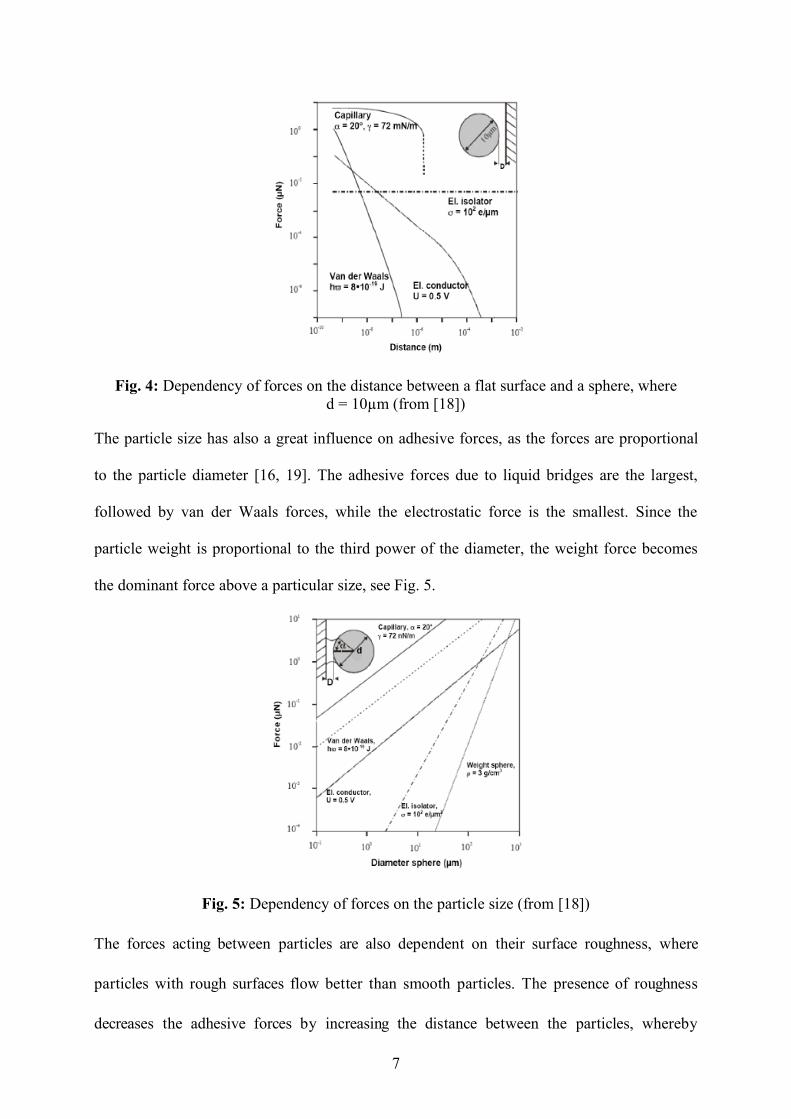
The particle size has also a great influence on adhesive forces, as the forces are proportional
to the particle diameter [16, 19]. The adhesive forces due to liquid bridges are the largest,
followed by van der Waals forces, while the electrostatic force is the smallest. Since the
particle weight is proportional to the third power of the diameter, the weight force becomes
the dominant force above a particular size, see Fig. 5.
Fig. 5: Dependency of forces on the particle size (from [18])
The forces acting between particles are also dependent on their surface roughness, where
particles with rough surfaces flow better than smooth particles. The presence of roughness
decreases the adhesive forces by increasing the distance between the particles, whereby
8
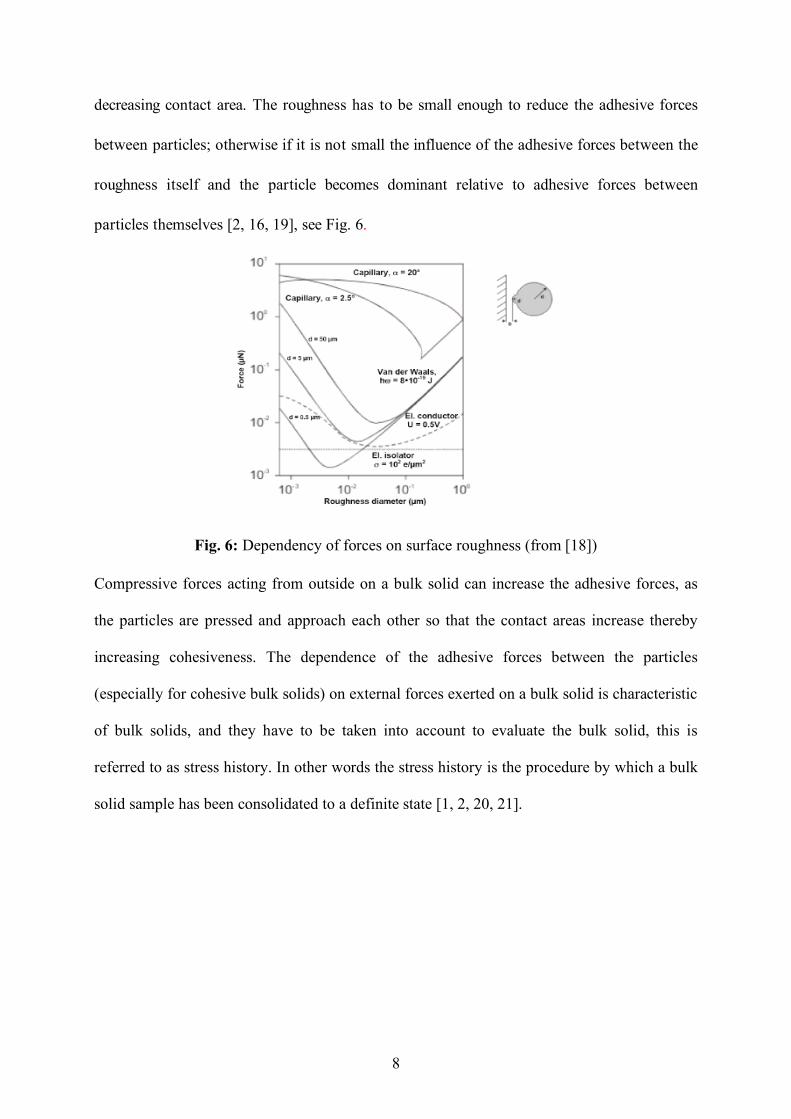
decreasing contact area. The roughness has to be small enough to reduce the adhesive forces
between particles; otherwise if it is not small the influence of the adhesive forces between the
roughness itself and the particle becomes dominant relative to adhesive forces between
particles themselves [2, 16, 19], see Fig. 6.
Fig. 6: Dependency of forces on surface roughness (from [18])
Compressive forces acting from outside on a bulk solid can increase the adhesive forces, as
the particles are pressed and approach each other so that the contact areas increase thereby
increasing cohesiveness. The dependence of the adhesive forces between the particles
(especially for cohesive bulk solids) on external forces exerted on a bulk solid is characteristic
of bulk solids, and they have to be taken into account to evaluate the bulk solid, this is
referred to as stress history. In other words the stress history is the procedure by which a bulk
solid sample has been consolidated to a definite state [1, 2, 20, 21].

9
1.1.4 Methods for flowability measurements
Schulze has given an overview of various methods used for the characterization of the
flowability of bulk solids, he also introduced the following criteria to evaluate different
methods [2, 22]:
1. Consolidation procedure followed by measurement of strength.
2. Consolidation of the bulk solids sample up to steady state flow.
3. Coincidence of the directions of major principle stresses at both consolidation and failure.
4. Reproducible stressing conditions of the bulk solid sample at consolidation (4a) and failure
(4b).
5. Known average stresses and uniform stress distribution in the plane of interest at
consolidation (5a) and failure (5b).
6. Possibility for varying the consolidation stresses (with regard to application).
7. Possibility for measuring time consolidation.
Criteria 6 and 7 are desirable capabilities but are not necessary if only flowability has to be
determined. However, the criteria listed previously are fulfilled best by shear testers [2, 22].
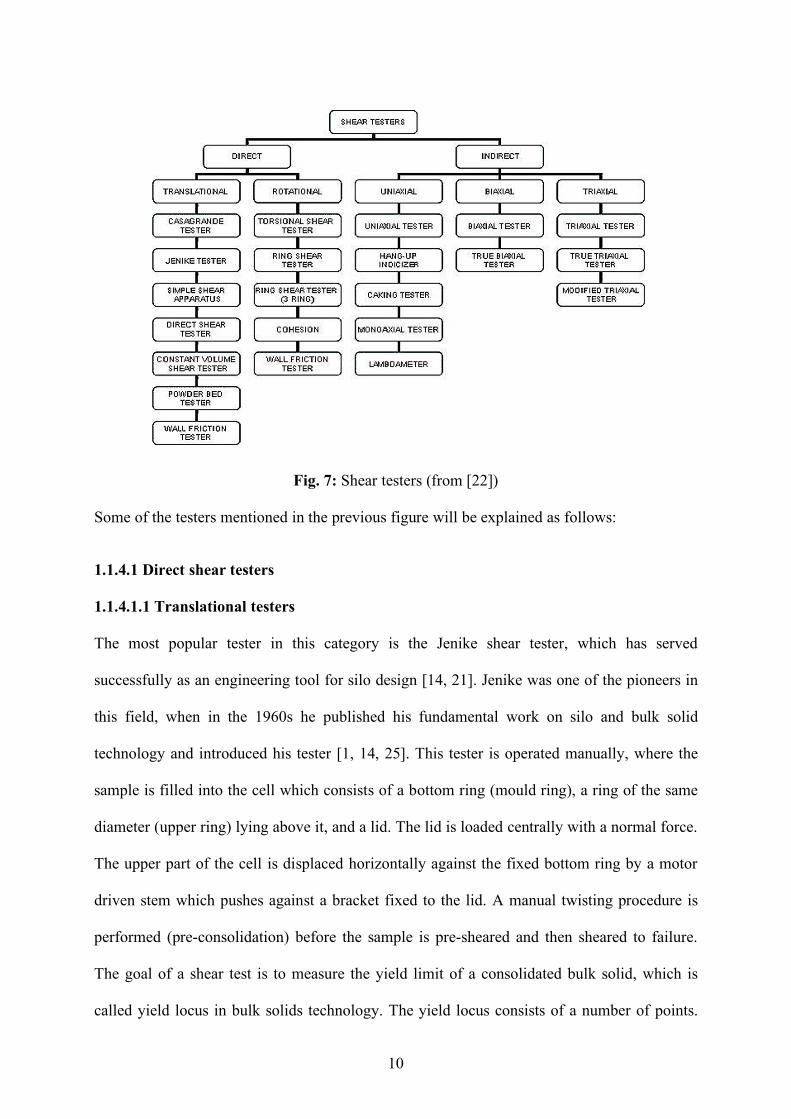
Fig. 7 gives a survey of possible shear principles and names some testers used in soil
mechanics and powder technology [21, 22, 23]. Shear testers are either direct or indirect
testers. Regarding direct shear testers, their design defines the location of the shear zone and
the major principal stress is not fixed during the test. Whereas in indirect shear testers the
shear zone develops more or less depending on the applied state of stress and the directions of
the principal stresses are fixed and remain constant during the test [21, 24].
10
Fig. 7: Shear testers (from [22]) Some of the testers mentioned in the previous figure will be explained as follows:
1.1.4.1 Direct shear testers
1.1.4.1.1 Translational testers
The most popular tester in this category is the Jenike shear tester, which has served
successfully as an engineering tool for silo design [14, 21]. Jenike was one of the pioneers in
this field, when in the 1960s he published his fundamental work on silo and bulk solid
technology and introduced his tester [1, 14, 25]. This tester is operated manually, where the
sample is filled into the cell which consists of a bottom ring (mould ring), a ring of the same
diameter (upper ring) lying above it, and a lid. The lid is loaded centrally with a normal force.
The upper part of the cell is displaced horizontally against the fixed bottom ring by a motor
driven stem which pushes against a bracket fixed to the lid. A manual twisting procedure is
performed (pre-consolidation) before the sample is pre-sheared and then sheared to failure.
The goal of a shear test is to measure the yield limit of a consolidated bulk solid, which is
called yield locus in bulk solids technology. The yield locus consists of a number of points.
11
Each point is obtained as a result of consequent preshear and shear processes. For the Jenike
tester a new specimen is required each time a point is measured on the yield locus. This tester
fulfils the criteria proposed by Schulze, but its use is restricted because it is operator sensitive,
time consuming, not suitable for all bulk solids due to its limited shear displacement
(maximum 4 to 5 mm) and measurements at very small stresses are not possible (lower limit 3
to 4 KPa) [1, 2, 14, 21, 22, 26-29].
1.1.4.1.2 Rotational testers
Among these testers are the torsional shear testers (e.g. Peschl’s tester) and the ring shear
testers (e.g. Schulze’s tester). Testers with rotational displacement have unlimited strain,
where the shear procedure is induced by rotation around a vertical axis. Therefore, these
testers can be applied for a variety of bulk solids compared to translational testers with their
limited strain. The covers of these testers are roughened or are equipped with bars to ensure
shearing within the bulk material. The base is rotating and the moment acting on the lid is
measured. The testers with a circular cross section are called torsional shear testers while
those with an annular one are called ring shear testers. The torsional shear testers have no
shear in the centre exerted on the sample i.e.; deformation in the centre is zero (ring shear
testers do not have this un-uniformity in deformation). Comparative studies between these
testers and others showed that the torsional shear testers did not always show agreement, and
if they differ they always underestimate the strength. Whereas the ring shear testers (with the
proper test procedure and proper cell design) can achieve reproducible and close results to
those obtained with Jenike shear testers. The advantages of these testers are their simplicity
and possibility to be used in an automated mode as well as the size of the cell that can be
small, thus small amounts of the sample are required. Also, they allow the measurement of a
complete yield locus with only one sample as well as measurements at very low stresses are
possible. Besides, they are neither operator dependent nor time consuming. They fulfil the
12
criteria proposed by Schulze with certain limitations with (5b) due to variation of deformation
with radius in case of torsional shear testers and the ratio of the inner to outer shear cell
diameter and appropriate test procedure for the ring shear testers [2, 21, 22, 23].
1.1.4.2 Indirect shear testers
1.1.4.2.1 Uniaxial testers
Examples for such testers are the uniaxial compression tester; monoaxial tester and Johanson
hang up indicizer.
(1) Uniaxial compression tester:
In uniaxial testers a sample is filled into a cylinder (frictionless) and consolidated vertically
by a normal consolidating stress. After removing the cylinder the sample is loaded again
with an increasing normal stress up to the point of failure, leading to the unconfined yield
strength. The uniaxial tester is regarded as a simple tester and the test can be performed
quickly but the results cannot be very accurate. It underestimates the unconfined yield
strength and overestimates the flowability, because consolidation by a vertical force only
does not guarantee a homogeneous compaction (only obtained with steady state flow
achievement). The uniaxial tester is suitable when cohesive bulk solids are tested which
guarantees a stable sample after consolidation and removing the cylinder. For the same
reason no tests are possible in the low stress region. Therefore, this tester complies with the
criteria proposed by Schulze except (2) where it does not attain steady state flow and (5a)
where this criterion is only fulfilled if cylinder’s wall is frictionless. Despite the
disadvantageous pointed out this tester is useful for time consolidation measurements of
coarse particles where other shear testers cannot be used [2, 21, 22, 23].
(2) Monoaxial shear test
This test is similar to the uniaxial compression test. Like in uniaxial tests the sample is
consolidated in vertical direction where the state of stress is well known and sufficiently

13
homogeneous. After vertical consolidation the sample is stressed horizontally with an
increasing stress up to failure, whereby the equivalent state of stress in the sample is not
homogeneous (free surface at the top) and not known. Another disadvantage of this
procedure is the direction of stress application, being perpendicular to the one at
consolidation. Compared to the uniaxial compression test (which underestimates strength),
the measured strength is further underestimated due to the anisotropic effects caused by the
difference in direction between consolidation and strength measurements. Therefore this test
complies with Schulze’s proposed criteria except (2) and (3), whereas for Criterion (5a &
5b) the walls must be frictionless [2, 21, 22, 23].
(3) Johansen indicizer
A cylindrical specimen is compressed in axial direction via a piston consisting of two
concentric areas. Subsequently the lower piston is removed and the inner part of the upper
piston pushes on the sample until failure occurs. From failure force the unconfined yield
strength can be computed. The comparative tests clearly show that the unconfined yield
strengths obtained gained with the hang-up indicizer, are likely to be lower in comparison
with Jenike’s shear tester and the Schulze ring shear tester. In such tests stresses are not
homogeneous and are not known during consolidation and failure because the stress
decreases downwards due to wall friction depending on the bulk solid’s properties and the
specimen’s geometry. Also no steady state flow can be achieved during consolidation 8 due
to uniaxial compression procedure). Therefore, this tester complies with Schulze’s criteria
except (2), (3), and (5). For fulfilling criterion (7) long term storage under consolidation
stress is a prerequisite [2, 21, 22, 23, 30].
1.1.4.2.2 Biaxial testers
A biaxial tester is a tester in which both methods of consolidation, either steady state flow or
uniaxial compression can be realized. The sample is constrained in lateral x- and y-direction
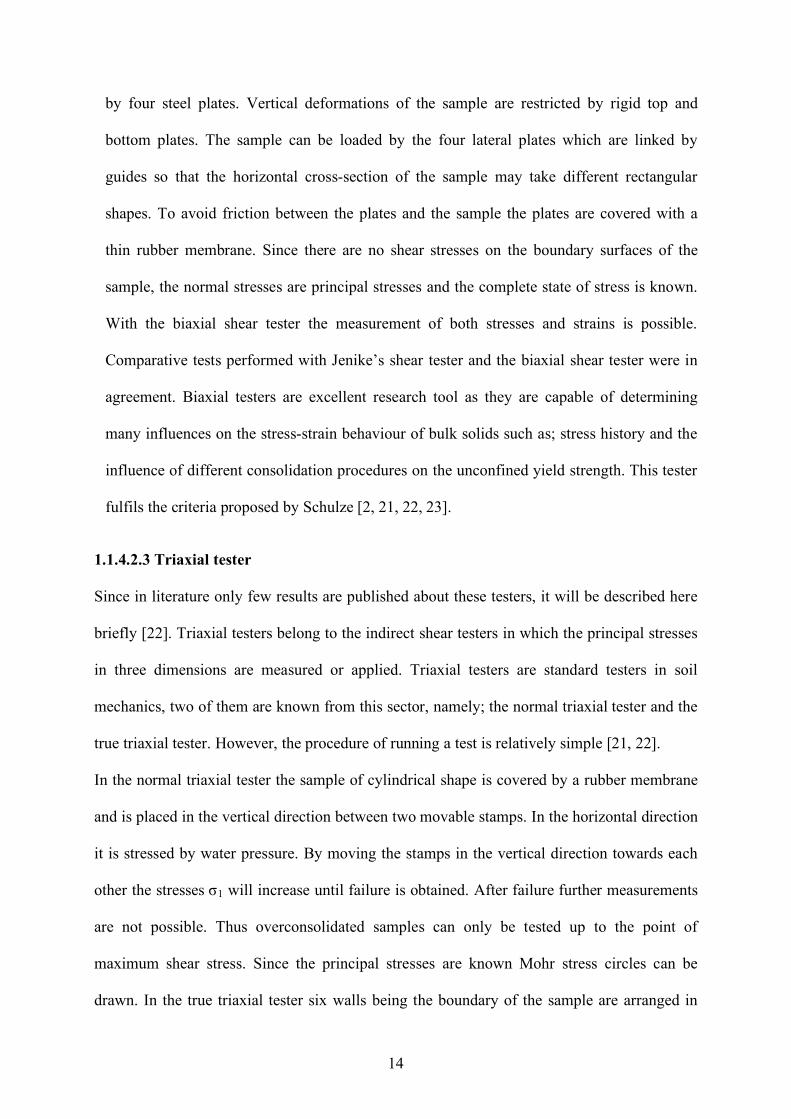
14
by four steel plates. Vertical deformations of the sample are restricted by rigid top and
bottom plates. The sample can be loaded by the four lateral plates which are linked by
guides so that the horizontal cross-section of the sample may take different rectangular
shapes. To avoid friction between the plates and the sample the plates are covered with a
thin rubber membrane. Since there are no shear stresses on the boundary surfaces of the
sample, the normal stresses are principal stresses and the complete state of stress is known.
With the biaxial shear tester the measurement of both stresses and strains is possible.
Comparative tests performed with Jenike’s shear tester and the biaxial shear tester were in
agreement. Biaxial testers are excellent research tool as they are capable of determining
many influences on the stress-strain behaviour of bulk solids such as; stress history and the
influence of different consolidation procedures on the unconfined yield strength. This tester
fulfils the criteria proposed by Schulze [2, 21, 22, 23].
1.1.4.2.3 Triaxial tester
Since in literature only few results are published about these testers, it will be described here
briefly [22]. Triaxial testers belong to the indirect shear testers in which the principal stresses
in three dimensions are measured or applied. Triaxial testers are standard testers in soil
mechanics, two of them are known from this sector, namely; the normal triaxial tester and the
true triaxial tester. However, the procedure of running a test is relatively simple [21, 22].
In the normal triaxial tester the sample of cylindrical shape is covered by a rubber membrane
and is placed in the vertical direction between two movable stamps. In the horizontal direction
it is stressed by water pressure. By moving the stamps in the vertical direction towards each
other the stresses σ1 will increase until failure is obtained. After failure further measurements
are not possible. Thus overconsolidated samples can only be tested up to the point of
maximum shear stress. Since the principal stresses are known Mohr stress circles can be
drawn. In the true triaxial tester six walls being the boundary of the sample are arranged in

15
such a way that deformations in x, y and z directions are possible at the same time,
independent and at different rates. Again the sample has to be placed in a rubber membrane,
which has to be pre-stressed in order to handle the sample before it is placed in the tester.
Thus, only tests under high stresses give reliable results [21, 22, 23].
Therefore, to guarantee the measurement of flow functions without further assumptions
Jenike’s tester, ring shear testers and biaxial shear testers can be used. All other procedures to
get a dependence of the unconfined yield strength on the consolidation stress (without
reaching steady state flow) lead to smaller unconfined yield strengths. Those relationships can
only yield estimates of the flow function. These estimates must be used with caution in case
used for silos design [21, 22]. The results obtained from testers where the state of stress is not
exactly known cannot be recommended for silo design [22].
1.1.4.3 Conventional simple test methods
Several empirical simple methods are used for the assessment of bulk solid properties, e.g.:
• Angle of repose: is the slope of a more or less conical pile of loose bulk solid, i.e. the angle
formed between the horizontal and the surface of the pile. The angle of repose is often
mentioned in literature. Different results are obtained even with this simple test procedure
according to the way by which the cone is formed, i.e. whether the angle prevails in a conical
heap, a wedge-shaped heap or a rotating drum. However, this method is suitable and
reproducible when handling free flowing bulk solids. The reproducibility gets worse with
cohesive bulk solids. The measured angle can be influenced by the way of sample
preparation, particle size and particle size distribution [1, 11, 31]. Regarding Schulze’s
criteria, criteria from (2) to (6) are not applicable. And the test does not comply with criteria
No. (1) and (7) concerning quantitative statements for flowability and time consolidation [2].
• Funnel methods: A bulk solid is allowed to flow through a funnel with varying outlet
diameters. A critical diameter can be obtained as a measure of flowability. Alternatively, as
16
described in the monograph “Flow behaviour” in the Ph. Eur. [32] the time required for a
sample of bulk solid to flow out of a funnel is determined. It is assumed that the flowability is
increased with a decreasing discharge time. Results obtained are considerably influenced by the
material and the geometry of the funnel. Thus no quantities can be derived, which only depend
on the bulk solid [2]. However, those empirical methods can be used in special applications,
but only if a correlation has been found between the special application and many empirical
tests [22]. Similar to the angle of repose this test does not comply with Schulze’s criteria No.
(1) and (7).
• Compressibility test: As described in the monograph “Apparent and tapped volume” in the
Ph. Eur. [33] for such tests two quantities are calculated, the bulk density for the loosely
poured powder in a cylinder and the tapped bulk density obtained after tapping the powder
using a tap volumeter. Two different parameters can be derived; the Hausner ratio and Carr
index. Both the Hausner ratio and the Carr index are sometimes criticized as not having a
strong theoretical basis. Despite criticism and unreliability [34] they are still used, because the
equipment required to perform the analysis is relatively cheap and the technique is easy to
learn. Similar to the previous tests, this test does not comply with Schulze’s criteria No. (1)
and (7) [1, 2, 11].
Other testers and methods for flowability assessment are available and applied but are not
mentioned here. Generally, test devices which allow the defined preparation of the sample of
bulk solid must be preferred (e.g. steady state flow as a defined consolidation procedure). It is
only possible in this way to determine the relevant flow properties (unconfined yield
strength, internal friction angle, wall friction angle, bulk density, time consolidation)
independent from the devices used [1. 11, 35].

17
1.2 Shear testers
Shear testers are the internationally recognized means to measure the flow properties of
cohesive bulk solids. In this research work two automated Schulze ring shear testers were
compared. The Schulze testers are direct shear testers with rotational displacement and
unlimited strain. Rotational displacement and consequently unlimited strain, is an advantage
when very elastic bulk solids or products like sludge or wet clay are sheared [26], in order to
assure reaching the stationary flow which is necessary for measuring a yield locus. The
Schulze ring shear testers used are fully automated and therefore measurements are neither
time consuming nor difficult to operate.
1.2.1 Flow properties measured using the Schulze ring shear tester
With the RST-control 95 software connected to the ring shear, flow properties of bulk solids
can be measured [36, 37]. The parameters which describe the flow properties can be
determined from the yield locus [12]. Flow Properties measured are:
(1) Flow property test (yield locus)
Flow property test (flowability test) is performed by measuring a yield locus, followed by
constructing Mohr circles. From the Mohr circle analysis both the consolidation stress σ1 and
unconfined yield strength, σc are obtained. The flowability factor “ffc” is calculated from the
ratio, ffc = σ 1 /σ c and used to characterize flowability numerically. In this research work the
flow property test was the point of interest, since the flowability (ffc) is the most important
quantity for quality control, comparative tests and product development.
(2) Time consolidation test
The strength of a bulk solid can increase when stored at rest. This effect is measured in a time
consolidation test. This test is performed by consolidating (preshearing) a sample of bulk
solid, storing it at a consolidation stress for a certain period of time, and then shearing the
bulk solid sample.
18
(3) Wall friction test:
For many processes, the friction between a bulk solid and the adjacent wall of a bin, a silo,
etc. is important. The ring shear tester could be equipped with a wall friction cell, a wall
friction test, i.e. the measurement of a wall yield locus, can be performed.
(4) Compressibility test
In such a test the sample is loaded by a stepwise increasing (vertical) normal stress without
shearing, i.e. the sample is subjected to uniaxial compression. From the weight and the
measured height of the bulk solid sample the mean bulk density in the shear cell is calculated
for each normal load.
(5) Attrition test
Attrition tests help to evaluate particle breakage and fines generation by abrasion. Attrition of
particles cannot be directly measured with a ring shear tester, but it is possible to shear a bulk
solid at a well defined normal stress for a certain shear displacement. For evaluation, one can
determine the amount of fines using an appropriate sieve before and after the test.
Alternatively particle size distribution measurements can be carried out before and after
shearing [1, 2, 36, 37, 38].
1.2.2 Schulze ring shear tester (RST-01.Pc)
In 1992 the ring shear tester (type RST-01.01) [2, 26] was developed by Schulze, followed by a
computer-controlled version in 1997 (type RST-01.pc). It is connected to a personal computer
running control software (RST control 95). With this control software yield loci, wall yield
loci, time consolidation, etc. can be measured and calculated automatically [1, 36, 37].
19
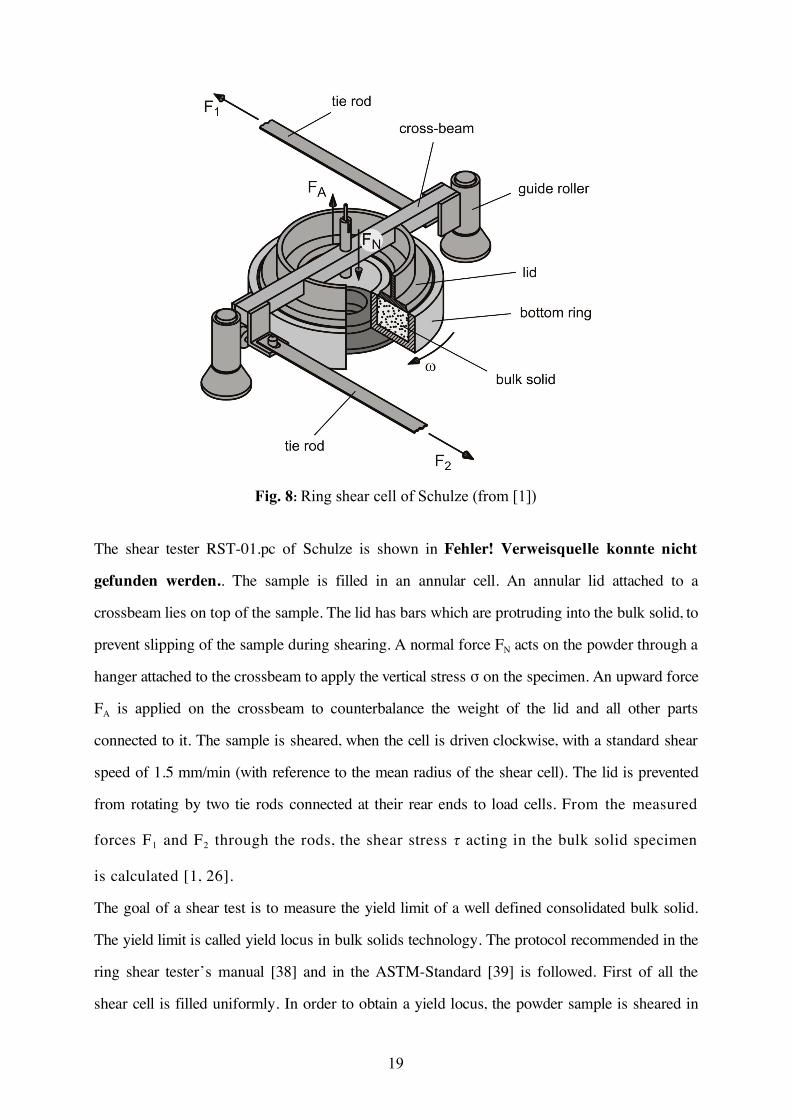
Fig. 8: Ring shear cell of Schulze (from [1])
The shear tester RST-01.pc of Schulze is shown in Fehler! Verweisquelle konnte nicht
gefunden werden.. The sample is filled in an annular cell. An annular lid attached to a
crossbeam lies on top of the sample. The lid has bars which are protruding into the bulk solid, to
prevent slipping of the sample during shearing. A normal force FN acts on the powder through a
hanger attached to the crossbeam to apply the vertical stress σ on the specimen. An upward force
FA is applied on the crossbeam to counterbalance the weight of the lid and all other parts
connected to it. The sample is sheared, when the cell is driven clockwise, with a standard shear
speed of 1.5 mm/min (with reference to the mean radius of the shear cell). The lid is prevented
from rotating by two tie rods connected at their rear ends to load cells. From the measured
forces F1 and F2 through the rods, the shear stress τ acting in the bulk solid specimen
is calculated [1, 26].
The goal of a shear test is to measure the yield limit of a well defined consolidated bulk solid.
The yield limit is called yield locus in bulk solids technology. The protocol recommended in the
ring shear tester’s manual [38] and in the ASTM-Standard [39] is followed. First of all the
shear cell is filled uniformly. In order to obtain a yield locus, the powder sample is sheared in
20
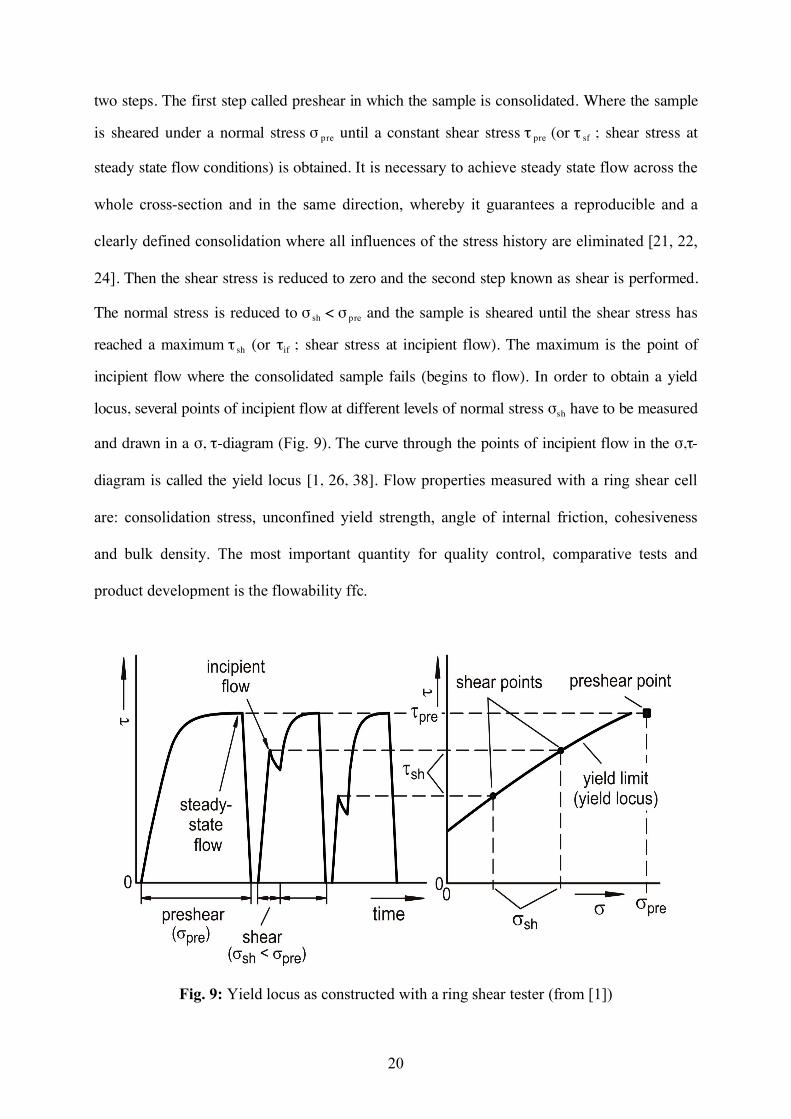
two steps. The first step called preshear in which the sample is consolidated. Where the sample
is sheared under a normal stress σ pre until a constant shear stress τ pre (or τ sf ; shear stress at
steady state flow conditions) is obtained. It is necessary to achieve steady state flow across the
whole cross-section and in the same direction, whereby it guarantees a reproducible and a
clearly defined consolidation where all influences of the stress history are eliminated [21, 22,
24]. Then the shear stress is reduced to zero and the second step known as shear is performed.
The normal stress is reduced to σ sh < σ pre and the sample is sheared until the shear stress has
reached a maximum τ sh (or τif ; shear stress at incipient flow). The maximum is the point of
incipient flow where the consolidated sample fails (begins to flow). In order to obtain a yield
locus, several points of incipient flow at different levels of normal stress σsh have to be measured
and drawn in a σ, τ-diagram (Fig. 9). The curve through the points of incipient flow in the σ,τ-
diagram is called the yield locus [1, 26, 38]. Flow properties measured with a ring shear cell
are: consolidation stress, unconfined yield strength, angle of internal friction, cohesiveness
and bulk density. The most important quantity for quality control, comparative tests and
product development is the flowability ffc.
Fig. 9: Yield locus as constructed with a ring shear tester (from [1])
21
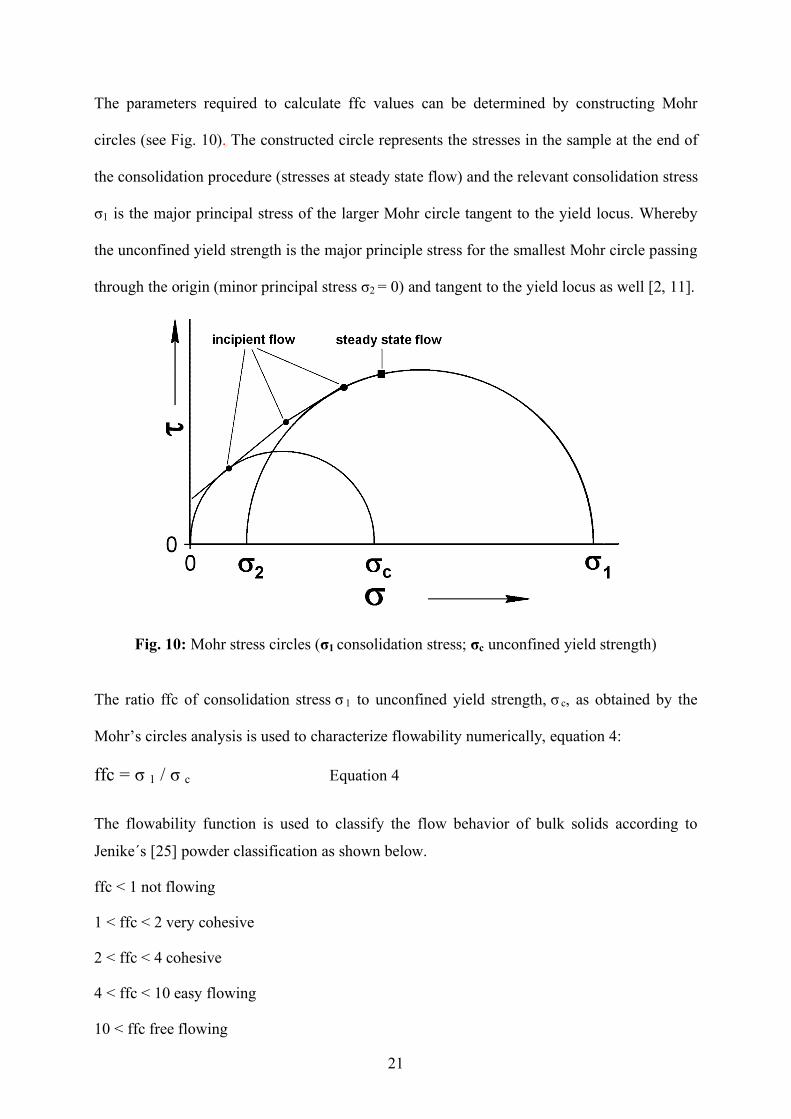
The parameters required to calculate ffc values can be determined by constructing Mohr
circles (see Fig. 10). The constructed circle represents the stresses in the sample at the end of
the consolidation procedure (stresses at steady state flow) and the relevant consolidation stress
σ1 is the major principal stress of the larger Mohr circle tangent to the yield locus. Whereby
the unconfined yield strength is the major principle stress for the smallest Mohr circle passing
through the origin (minor principal stress σ2 = 0) and tangent to the yield locus as well [2, 11].
Fig. 10: Mohr stress circles (σ1 consolidation stress; σc unconfined yield strength) The ratio ffc of consolidation stress σ 1 to unconfined yield strength, σ c, as obtained by the
Mohr’s circles analysis is used to characterize flowability numerically, equation 4:
ffc = σ 1 / σ c Equation 4
The flowability function is used to classify the flow behavior of bulk solids according to
Jenike´s [25] powder classification as shown below.
ffc < 1 not flowing
1 < ffc < 2 very cohesive
2 < ffc < 4 cohesive
4 < ffc < 10 easy flowing
10 < ffc free flowing
22
1.2.3 Schulze ring shear tester (RST-XS)
A smaller computer-controlled ring shear tester (type RST-XS) has been available since 2002.
This tester enables use of small sample volumes (9 ml, 30 ml, and 70 ml). In this study the 30 ml
cell was used. The test procedure for this tester is the same as that for the large one. See table 1 in
section 3.1 for the difference between the shear cells of both testers.
1.3 Glidants
Good flow properties are critical to the successful development of any pharmaceutical
formulation. Therefore, flow properties of powders are often modified by the addition of
materials in an attempt to improve their flow characteristics and their processability. These
materials are called “glidants”. Munzel was the first to employ the term glidant to designate
agents added in small amounts and improve flowability [31]. Glidants are fine powders
ranging from few nanometers up to 30µm in diameter incorporated into mixtures to improve
their flow properties. There is some controversy about the exact mechanism, but two theories
exist. The first is that small glidant particles coat the relatively larger host powders, increasing
interparticle distance and decreasing interparticle forces [7, 40]. The second theory is that the
glidant powders act in a manner analogous to ball-bearings, reducing friction of rough
surfaces [12] and therefore changes the resistance to shearing and the flowability of the bulk
powder [7, 41]. Glidants used in pharmacy include talc, colloidal silicon dioxide, calcium
phosphates and to a certain extent various metallic stearates (salts of fatty acids)<. Since
several groups have investigated the addition of glidants to a variety of powders and noted
that silica-type glidants are the most efficient, they have been used in this work to improve
flowability.
Silica types are characterized by their small particle size, where the submicron particles move
easily between larger particles and forms a layer on their surface to aid flow. Aerosil® is a
fine, white, fluffy and X-ray amorphous and ultra-pure powder consisting of primary particles
in the nanometre range (10-40nm). Accordingly, the specific surface area as determined by
23
BET, range from approximately 50 to 400m2/g. The primary particles are not isolated. They
are rather present as aggregates and agglomerates, the sizes of which are undefined. During
grinding and mixing processes, the agglomerates are reduced. Aerosil® also known as fumed
silica is an exceptionally pure form of silicon dioxide manufactured by hydrolysis of silicon
tetrachloride in an oxygen-hydrogen flame. The gaseous silicon tetrachloride reacts in a gas
flame burner (1000°C) with just-formed water to produce silicon dioxide. Hydrochloric acid
is the only by-product, and it is removed from the SiO2 in the separation chamber. The HCl
that remains adsorbed onto the colloidal silicon dioxide surface is removed in the de-
acidification chamber by washing with water vapour (SiCl4 + 2 H2 + O2 → SiO2 + 4HCl). The
HCl is easily separated as it remains in the gas phase, while the fumed silica is solid. The
freshly formed hydrophilic Aerosil® can react with organosilicon compounds to form
hydrophobic Aerosil®. The hydrophobic Aerosil® formed is denoted “R” for repellent.
Through hydrophobic treatment, the density of silanol groups per nm² decreases from approx.
2 for hydrophilic Aerosil® to approx. 0.75 for the hydrophobic types. Aerosil® 200 is a
hydrophilic highly dispersed colloidal silicon dioxide, where the number 200 stands for the
specific surface area of 200m2/g as measured by the BET method. This conventional colloidal
silicon dioxide has low bulk and tapped densities and can produce dust if handled improperly.
In order to improve the handling of colloidal silicon dioxide, special mechanical processes
were developed and patented by the company (Evonik) for the homogeneous compaction of
colloidal silicon dioxide [5]. As a result, densified products characterized by the suffix “V”
like Aerosil® 200 V and Aerosil® R 972 V have been recently introduced: Aerosil® 200 V is
hydrophilic and chemically identical to Aerosil® 200. It differs from conventional colloidal
silicon dioxide only in its higher tapped density and its larger secondary agglomerates. The
compacted product Aerosil® R 972 V is hydrophobic, as a result of dimethyl silyl groups
chemically bound to the silica surface [5, 42, 43].
24
2 Aim of this work
The assessment of flowability of powdered materials in the pharmaceutical industry is a
crucial step and a prerequisite for a cheap, not time consuming successful production. The
main purpose of this work was to employ the ring shear tester as a convenient, reliable and
rapid tool for the quantitative evaluation and assessment of the flowability of pharmaceutical
substances and mixtures. And to apply it as a quantitative comparative test which can replace
other inaccurate and operator influenced conventional methods, which give only poor
quantitative statement concerning flowability but are often used for their simplicity. In order
to achieve the aim of this work, the investigations were carried out in different studies. The
ring shear tester was applied to measure the flowability (flow properties) of a poor flowing
active pharmaceutical ingredient and evaluate its flowability enhancement and improvement
on the addition of different types and percentages (0.1, 0.5, and 2%) of silicon dioxide. On the
margin of this study a comparison between the ring shear tester and other conventional
methods was carried out. Also a correlation between the flowability and capsules weight
content variation was investigated. The tester was used to measure the flowability of a set of
binary mixtures, each comprising a poor flowing powder (either a pharmaceutical excipient or
an active ingredient) and a free flowing pharmaceutical excipient. It was also used to evaluate
the flowability improvement of these mixtures with different percentages of the free flowing
substance as well as estimating the volume fractions yielding the best flowability. The
packing behaviour of these binary mixtures was studied as well, taking advantage of the
ability of the ring shear tester to directly measure the samples densities under a given
consolidation stress. In another study the ring shear tester was used as a tool for the
assessment and evaluation of the flowability of powdered lipids, which according to literature
have never been assessed using such testers before, and evaluating their flowability
enhancement in the absence and presence of silicon dioxide. However, in this work two

25
automated Schulze ring shear testers were also compared. Finally to summarize the aim of
this work, the ring shear tester was employed as a tool to assess the flowability of single
components or binary mixtures of pharmaceutical excipients and active ingredients, and
evaluating their flowability enhancement by either addition of glidants or by introducing a
free flowing substance in different fractions. It was also interesting to apply the ring shear
tester for the assessment of powdered lipids flowability in the presence and absence of silicon
dioxide.
26
3 Results and Discussion
3.1 Comparison between two ring shear testers of different size
3.1.1 Aim of this study
In this work two automated Schulze ring shear testers were compared. The Schulze testers are
direct shear testers with rotational displacement and unlimited strain. The Schulze shear tester
RST-01.pc (larger tester) and the Schulze shear tester RST-XS (smaller tester) were
compared. A 200 ml shear cell was used for the measurements carried out on the RST-01.pc
tester while a 30 ml shear cell was used for the measurements on the RST-XS tester (see
Table 1). A set of binary mixtures of different active ingredients and excipients were prepared
and a total of 189 measurements were carried out on each tester. These substances were
mixed in the turbula mixer for 15 minutes then stored over night in a conditioned room at 21º C
and 45% RH. The concentration was calculated on volume to volume bases. For each sample,
yield loci were measured using both Schulze testers. The preshear normal stress was constant
about 5000 Pa. Four shear normal stress levels were selected namely 1000, 2000, 3000 and
4000 Pa. Comparison has been done between the measured ffc values. The flowability
function was used to classify the flow behaviour of bulk solids according to Jenike´s powder
classification (see section 1.3.2).
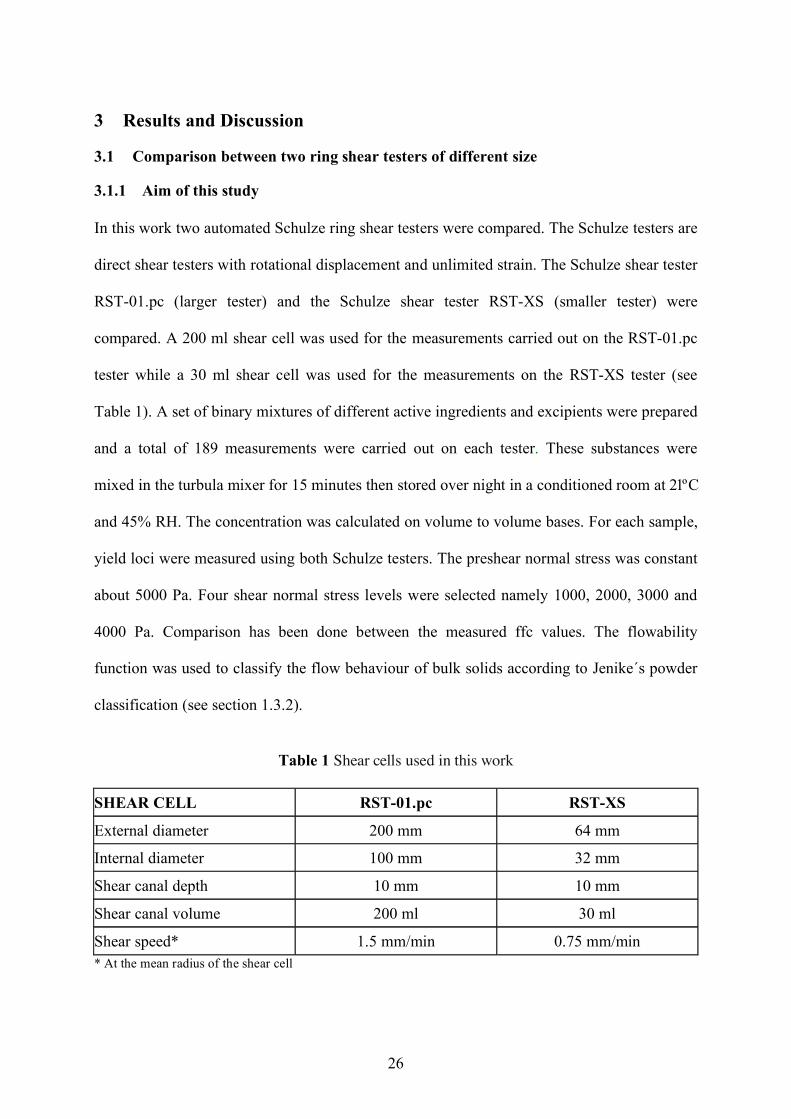
Table 1 Shear cells used in this work
SHEAR CELL RST-01.pc RST-XS
External diameter 200 mm 64 mm
Internal diameter 100 mm 32 mm
Shear canal depth 10 mm 10 mm
Shear canal volume 200 ml 30 ml
Shear speed* 1.5 mm/min 0.75 mm/min * At the mean radius of the shear cell
27
3.1.2 Results
Experiments were carried out with a number of active ingredients and excipients. For further
details about substances used, their mean particle size, shape, generic name and manufacturer
see table 3 in section 3.3.2 as well as tables 5 and 6 in sections 6.1.1 and 6.1.2 respectively.
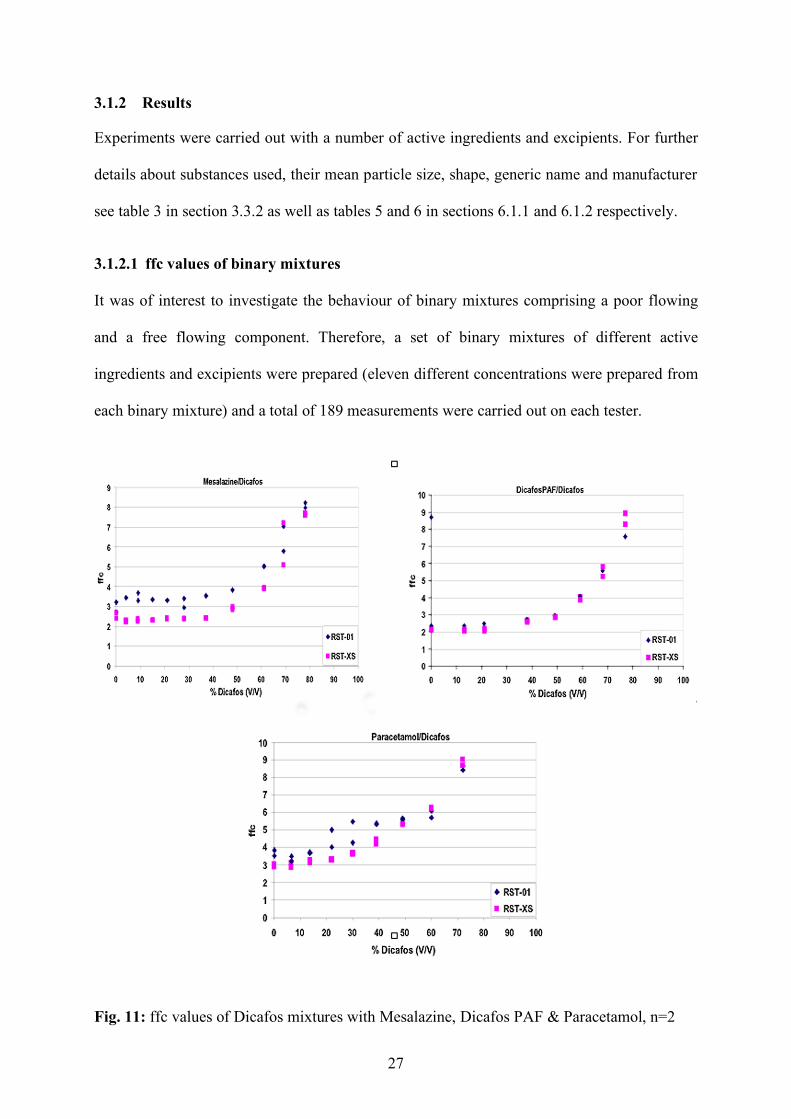
3.1.2.1 ffc values of binary mixtures
It was of interest to investigate the behaviour of binary mixtures comprising a poor flowing
and a free flowing component. Therefore, a set of binary mixtures of different active
ingredients and excipients were prepared (eleven different concentrations were prepared from
each binary mixture) and a total of 189 measurements were carried out on each tester.
Fig. 11: ffc values of Dicafos mixtures with Mesalazine, Dicafos PAF & Paracetamol, n=2
28
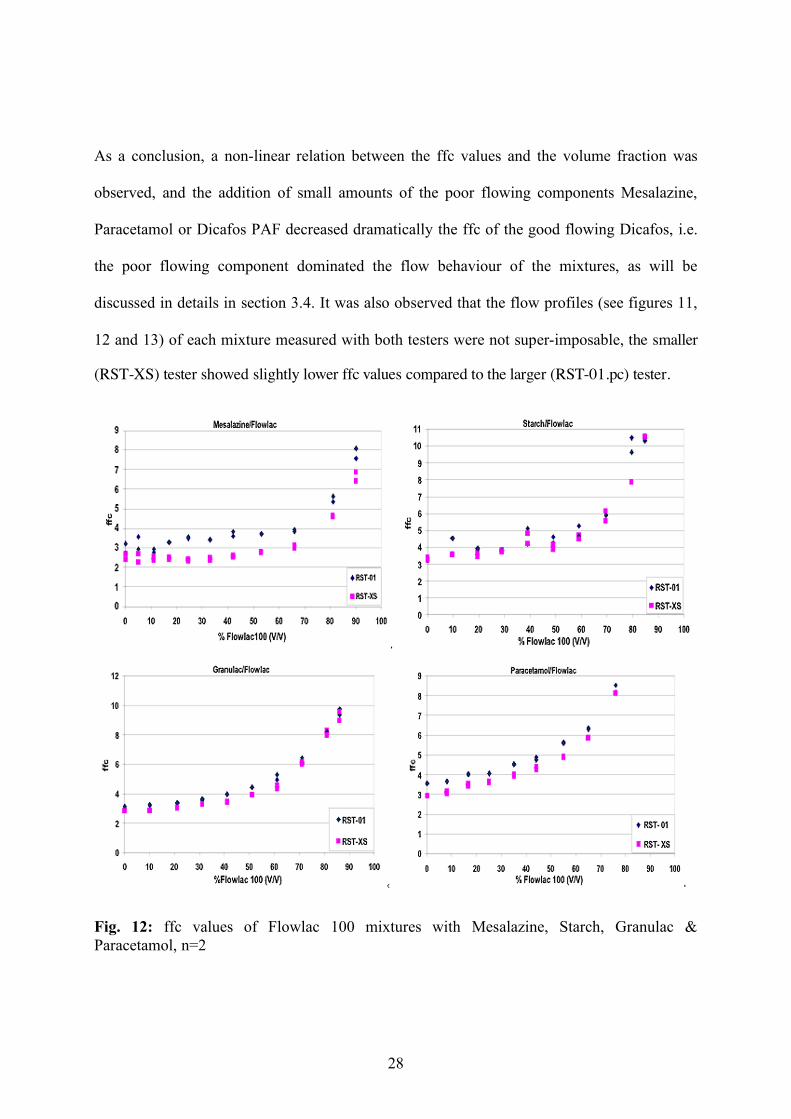
As a conclusion, a non-linear relation between the ffc values and the volume fraction was
observed, and the addition of small amounts of the poor flowing components Mesalazine,
Paracetamol or Dicafos PAF decreased dramatically the ffc of the good flowing Dicafos, i.e.
the poor flowing component dominated the flow behaviour of the mixtures, as will be
discussed in details in section 3.4. It was also observed that the flow profiles (see figures 11,
12 and 13) of each mixture measured with both testers were not super-imposable, the smaller
(RST-XS) tester showed slightly lower ffc values compared to the larger (RST-01.pc) tester.
Fig. 12: ffc values of Flowlac 100 mixtures with Mesalazine, Starch, Granulac & Paracetamol, n=2
29
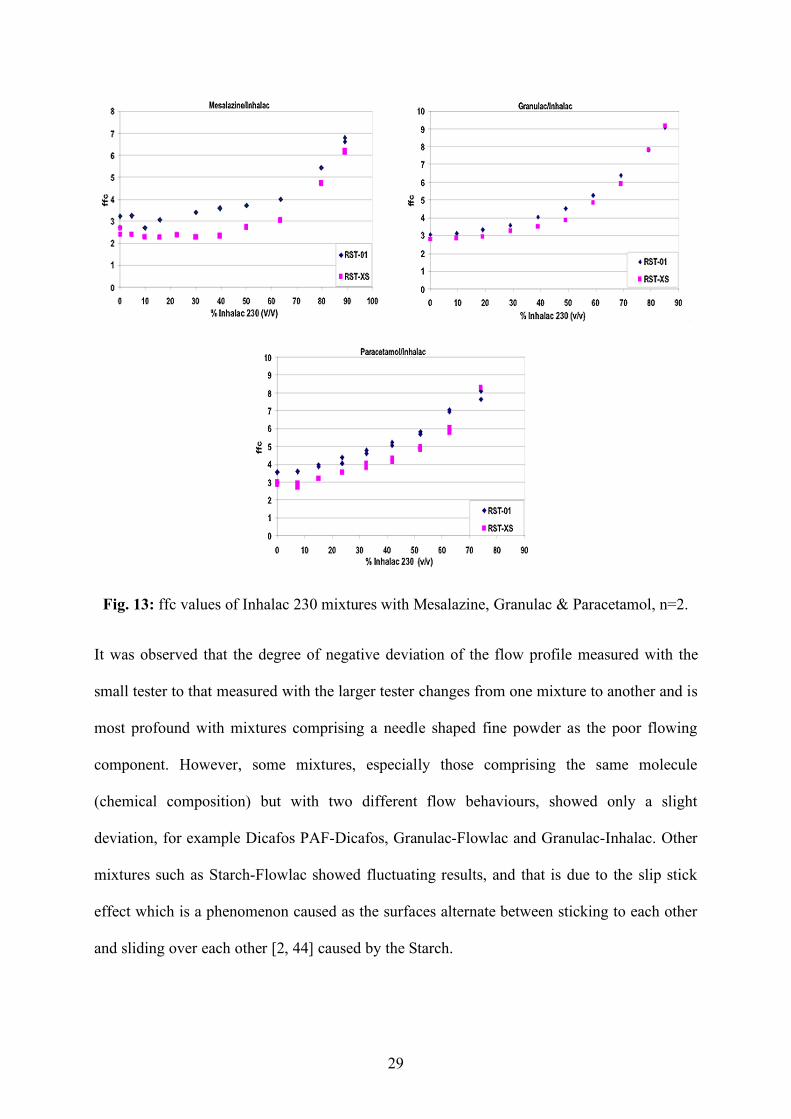
Fig. 13: ffc values of Inhalac 230 mixtures with Mesalazine, Granulac & Paracetamol, n=2.
It was observed that the degree of negative deviation of the flow profile measured with the
small tester to that measured with the larger tester changes from one mixture to another and is
most profound with mixtures comprising a needle shaped fine powder as the poor flowing
component. However, some mixtures, especially those comprising the same molecule
(chemical composition) but with two different flow behaviours, showed only a slight
deviation, for example Dicafos PAF-Dicafos, Granulac-Flowlac and Granulac-Inhalac. Other
mixtures such as Starch-Flowlac showed fluctuating results, and that is due to the slip stick
effect which is a phenomenon caused as the surfaces alternate between sticking to each other
and sliding over each other [2, 44] caused by the Starch.
30
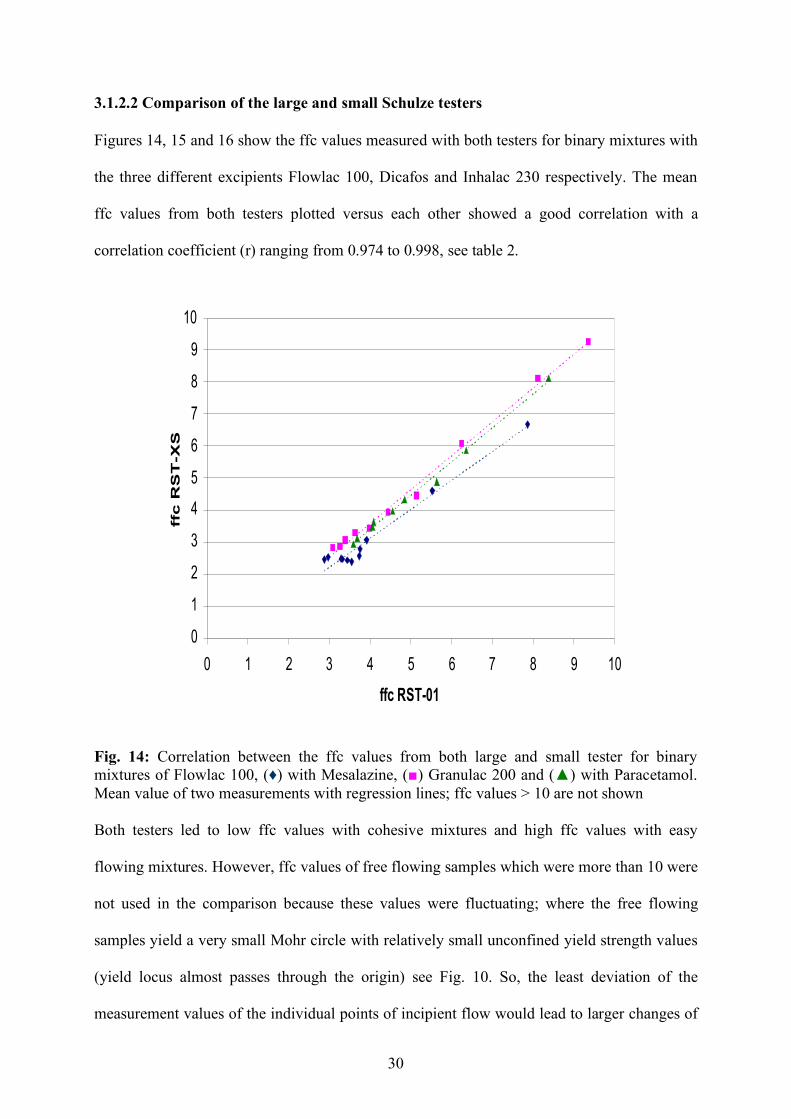
3.1.2.2 Comparison of the large and small Schulze testers
Figures 14, 15 and 16 show the ffc values measured with both testers for binary mixtures with
the three different excipients Flowlac 100, Dicafos and Inhalac 230 respectively. The mean
ffc values from both testers plotted versus each other showed a good correlation with a
correlation coefficient (r) ranging from 0.974 to 0.998, see table 2.
0
1
2
3
4
5
6
7
8
9
10
0 1 2 3 4 5 6 7 8 9 10
ffc RST-01
ffc
R
ST
-X
S
Fig. 14: Correlation between the ffc values from both large and small tester for binary mixtures of Flowlac 100, (♦) with Mesalazine, (■) Granulac 200 and (▲) with Paracetamol. Mean value of two measurements with regression lines; ffc values > 10 are not shown Both testers led to low ffc values with cohesive mixtures and high ffc values with easy
flowing mixtures. However, ffc values of free flowing samples which were more than 10 were
not used in the comparison because these values were fluctuating; where the free flowing
samples yield a very small Mohr circle with relatively small unconfined yield strength values
(yield locus almost passes through the origin) see Fig. 10. So, the least deviation of the
measurement values of the individual points of incipient flow would lead to larger changes of
31
the unconfined yield strength determined from the extrapolated yield locus towards the left in
the area of very small stresses. These changes in the denominator (confined yield strength)
lead consequently to large changes of the ratio σ 1 / σ c [45]. Besides, values above 10 still
referred to a free flowing mixture.
0
1
2
3
4
5
6
7
8
9
10
0 1 2 3 4 5 6 7 8 9 10
ffc RST-01
ffc
R
ST
-X
S
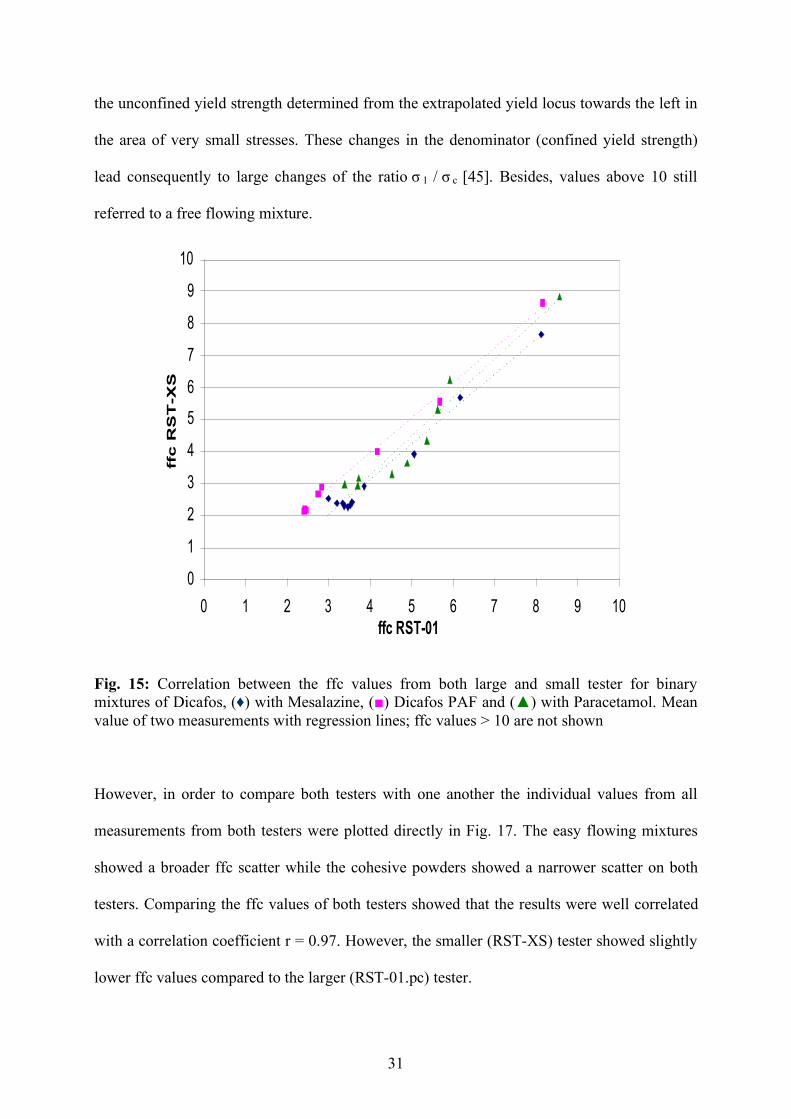
Fig. 15: Correlation between the ffc values from both large and small tester for binary mixtures of Dicafos, (♦) with Mesalazine, (■) Dicafos PAF and (▲) with Paracetamol. Mean value of two measurements with regression lines; ffc values > 10 are not shown
However, in order to compare both testers with one another the individual values from all
measurements from both testers were plotted directly in Fig. 17. The easy flowing mixtures
showed a broader ffc scatter while the cohesive powders showed a narrower scatter on both
testers. Comparing the ffc values of both testers showed that the results were well correlated
with a correlation coefficient r = 0.97. However, the smaller (RST-XS) tester showed slightly
lower ffc values compared to the larger (RST-01.pc) tester.
32
0
1
2
3
4
5
6
7
8
9
10
0 1 2 3 4 5 6 7 8 9 10
ffc RST-01
ffc
R
ST
-X
S
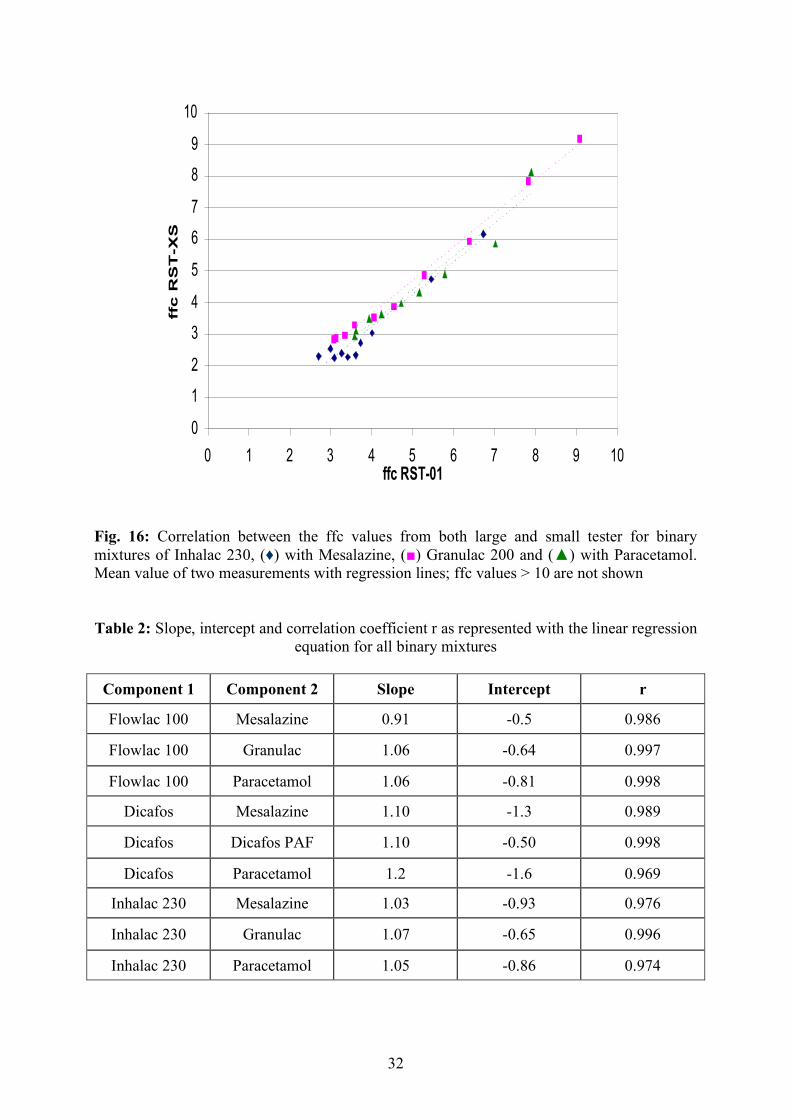
Fig. 16: Correlation between the ffc values from both large and small tester for binary mixtures of Inhalac 230, (♦) with Mesalazine, (■) Granulac 200 and (▲) with Paracetamol. Mean value of two measurements with regression lines; ffc values > 10 are not shown Table 2: Slope, intercept and correlation coefficient r as represented with the linear regression
equation for all binary mixtures
Component 1 Component 2 Slope Intercept r
Flowlac 100 Mesalazine 0.91 -0.5 0.986
Flowlac 100 Granulac 1.06 -0.64 0.997
Flowlac 100 Paracetamol 1.06 -0.81 0.998
Dicafos Mesalazine 1.10 -1.3 0.989
Dicafos Dicafos PAF 1.10 -0.50 0.998
Dicafos Paracetamol 1.2 -1.6 0.969
Inhalac 230 Mesalazine 1.03 -0.93 0.976
Inhalac 230 Granulac 1.07 -0.65 0.996
Inhalac 230 Paracetamol 1.05 -0.86 0.974
33
y = 1.0493x - 0.797
R2 = 0.94350
1
2
3
4
5
6
7
8
9
10
11
0 1 2 3 4 5 6 7 8 9 10 11
ffc RST-01
ffc
R
ST
-X
S
Fig. 17: Correlation between the ffc values from both large and small testers, regression line and 95% confidence interval of predicted mean (Ү)
The 95% confidence intervals CI for the predicted mean (Y) was calculated (see Fig. 17). The
confidence intervals for both slope and intercept were calculated as well, and it was observed
that the CI for the slope does not enclose “1” (1.0493 ± 0.037) [1.012 to 1.086] and that for
the intercept does not enclose “0” (-0.797 ± 0.180) [-0.98 to -0.62]. In other words the linear
equation showed more or less a slope close to 1 and a negative intercept about 0.8 which
indicates that the values determined using the small tester are always lower than those values
determined with the larger one. Furthermore, the differences between the calculated Y values
and the Y values calculated through substitution in the equation showed a maximum
difference equal to 1.78 among all cases.

34
3.1.3 Discussion
As mentioned by Schulze [38] comparative tests with a standard shear cell showed that the
smaller cell sometimes measured larger shear stresses compared to those measured with the
standard cell (larger cell) and led to yield loci shifted towards larger shear stresses, which
results in larger values of unconfined yield strength, and consequently lower ffc values
(equation.4). In this work the small tester’s cell with a cross sectional area about 25 cm2 gave
lower ffc values compared to the large tester with a 230 cm2 cell, as estimated with the linear
regression equation with a negative intercept equal approximately 0.8 which indicates that the
values determined using the small tester are lower than those values determined with the
larger one.
It was observed throughout all measurements that the smaller tester gave higher consolidation
stresses as well as higher unconfined yield strength values compared to the larger tester.
Consequently that led to lower ffc values. Generally, lower consolidation stresses in a range
from 8895 to 9576 Pa were measured with the large tester compared to the smaller tester
which measured a range from 9155 to 11217 Pa. However, the differences between the
consolidation stress as measured with both testers was most obvious with the Mesalazine
binary mixtures, where the smaller tester measured always a consolidation stress about 1500
to 2000 Pa more compared to that measured with a larger cell, consequently higher
unconfined yield strength values were obtained. Differences above 500 Pa and less than 1000
Pa were observed with Paracetamol binary mixtures while differences less than 500 Pa were
calculated with Granulac and Dicafos binary mixtures. These differences between the
consolidation stresses measured on both testers might be due to the difference in the methods
measuring the normal stress applied on the sample. Where, to achieve the normal stress
required, a suitable normal load (given in Kg) is applied and divided by the area of the lid.
However, regarding the large tester RST-01.pc a counterweight force (to counterbalance the
35
weight of the lid and all other parts connected to it) is known and taken into account
experimentally when adjusting the normal load. On the other hand, the small tester RST-XS is
not provided with a counterweight. Thus, here the normal stress is the result of the normal
load exerted by the normal load system and the weights of the lid of the shear cell and the
parts connected to it. This is taken into account arithmetically by the software RST-control 95
when adjusting the normal load [38].
Another argument could be also the ratio of cell size to particle size. Since the shear cells have
significantly different size dimensions (with diameters 200 mm and 64 mm for the large and the
small cells respectively) [46]. Schwedes and Schulze [23] investigated the influence of the ratio
of shear cell diameter to particle size on the shear stress at steady state flow. It was found that
the shear stress τ decreases with increasing D/x ratio (D: shear cell diameter and x: particle size)
and levels out for high D/x ratios [22]. In this work the ratio of cell size to particle size varies
widely, where D/x50 = 1250 for large tester to 400 for the small tester with the coarsest particle
size (x50 = 160 µm) and a D/x50 about 40000 for large tester to about 12000 for the small tester
with the finest particle size (x50 = 5 µm). As observed from the ratios, according to Schwedes
and Schulze investigations it would be expected that the smaller tester will yield higher shear
stresses compared to the larger tester consequently leading to slightly lower ffc values. However,
that would not be the case comparing the very high D/x ratios observed in this work with those
involved in Schwedes and Schulze investigations (maximum D/x ratio 300) [23].
Regardless the differences in composition, particle size (the finest about 5µm for Dicafos PAF
and the coarsest about 160 µm for Dicafos) and shape (spherical, angular, needle like and
irregular), comparing the ffc values of both testers showed that the results were well correlated
with a correlation coefficient, r = 0.97. However, the smaller (RST-XS) tester showed slightly
lower ffc values compared to the larger (RST-01.pc) tester according to the linear equation y=
1.0493x-0.797. For comparative tests this effect does not play a role as long as the same ring
shear tester with the same shear cell size is used throughout the measurements. However, an
advantage of the smaller cell is that a smaller amount of bulk solid is required for the
measurements, because the internal volume of the small shear cell is only about 30 cm3.
36
3.2 Investigating the influence of different Aerosil types and concentrations on powder
flow using different methods
3.2.1 Introduction and objective
Good flow properties are critical to the successful development of any pharmaceutical tablet
or capsule formulations to ensure quality and meet content uniformity specifications.
Therefore, assessment of flow behavior is to be made in early stages in the development
process so that an optimum formulation can be established, avoiding expensive and time-
consuming studies of poor alternatives [7].
The flow properties of powders are often intentionally modified by the addition of flow
additives, lubricants or glidants in order to improve their processability. The glidants promote
powder flow by reducing inter-particulate friction and cohesion and therefore change the
resistance to shearing and the flowability of the bulk powder [41].
The use of hard gelatine capsules as solid oral dosage forms is increasingly popular [47]. It
has several advantages over using tablets such as taste masking or reducing levels of fillers
used [48]. The relationship between capsule weight variation and powder flowability has been
of interest for many research works, and contradictory observations were obtained [49].
Whereas some research groups suggested that good powder flowability might not be critical
to achieve uniform weight content on a tamping type machine [49, 50], others reported an
increase in weight variation with poorly flowing powders [49, 50, 51]. However, others
suggested that an optimum flowability is required to achieve low weight variations [49, 51,
52, 53, 54].
The aim of this study is divided into two parts; the first part is concerned with investigating
how the flowability of Paracetamol is influenced by different amounts and types of silicon
dioxide (Aerosil®). A ring shear cell was used to measure shear properties, including their
yield loci when pre-consolidated and their shear strength, measuring the so called flowability
function (ffc). Besides other classical methods as the angle of repose, Hausner ratio and flow
37
rate were also used. The second part of this study investigates the variation in weight content
of capsules filled with different Paracetamol / Aerosil® mixtures and relates it with their
flowability (ffc values).
In this study silicon dioxide (fumed silica) was used as a glidant. The following types were
used; Aerosil® 200, a hydrophilic and standard fumed silica, Aerosil® 200 V a hydrophilic and
densified fumed silica, Aerosil® R 972 a hydrophobic standard and Aerosil® R 972 V, a
hydrophobic, densified fumed silica were used as received from Evonik (Düsseldorf,
Germany). Paracetamol was used as the poor flowing active ingredient as received from
Ataby (Istanbul, Turkey). Empty hard gelatin shells size # 0 Capsule, from Capsugel. Further
details about used substances are listed in section 4.1.1.
3.2.2 Results
Based on preliminary investigations, the Aerosil® concentration was set to 0.1, 0.5 and 2%
w/w. The mixtures flowability was estimated using the Schulze ring shear tester RST-01.pc,
angle of repose, Hausner ratio and flow rate as well. Besides, evaluation of the samples on a
macroscopic level was carried out using the scanning electron microscopy. All experiments
were carried out under similar conditions, 21°C and 45% relative humidity.
3.2.2.1 Flowability
The flowability was determined using a ring shear tester RST-01.pc with the cell type MV10.
During the measurements the normal load of preshear was adjusted at 5000 Pa. Shearing
proceeds at lower normal loads 1000, 2000, 3000, 4000 Pa consequently. The mean ffc value
of 3 measurements was used. The ring shear tester’s results (ffc) were depicted in Fig.18. The
flowability of Paracetamol (ffc = 3.4) was generally improved on the addition of any of the
Aerosil® types used.
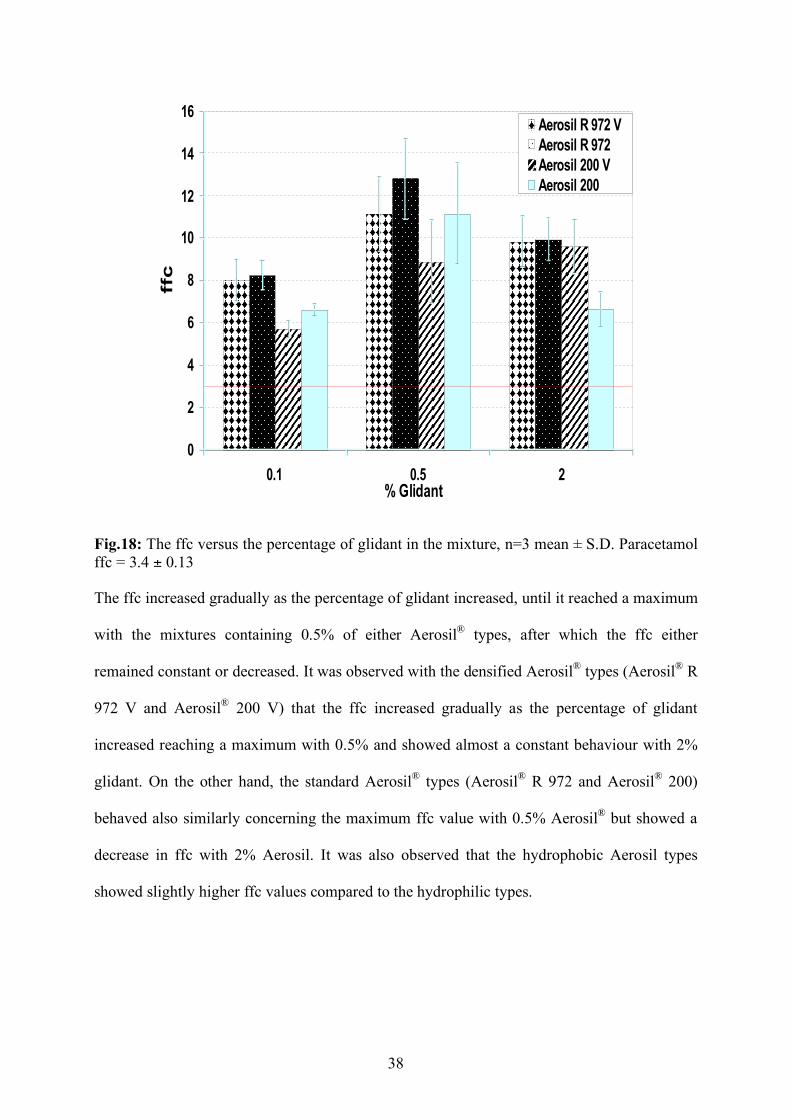
38
0
2
4
6
8
10
12
14
16
0.1 0.5 2
% Glidant
ffc
Aerosil R 972 V
Aerosil R 972
Aerosil 200 V
Aerosil 200
Fig.18: The ffc versus the percentage of glidant in the mixture, n=3 mean ± S.D. Paracetamol ffc = 3.4 ± 0.13
The ffc increased gradually as the percentage of glidant increased, until it reached a maximum
with the mixtures containing 0.5% of either Aerosil® types, after which the ffc either
remained constant or decreased. It was observed with the densified Aerosil® types (Aerosil® R
972 V and Aerosil® 200 V) that the ffc increased gradually as the percentage of glidant
increased reaching a maximum with 0.5% and showed almost a constant behaviour with 2%
glidant. On the other hand, the standard Aerosil® types (Aerosil® R 972 and Aerosil® 200)
behaved also similarly concerning the maximum ffc value with 0.5% Aerosil® but showed a
decrease in ffc with 2% Aerosil. It was also observed that the hydrophobic Aerosil types
showed slightly higher ffc values compared to the hydrophilic types.
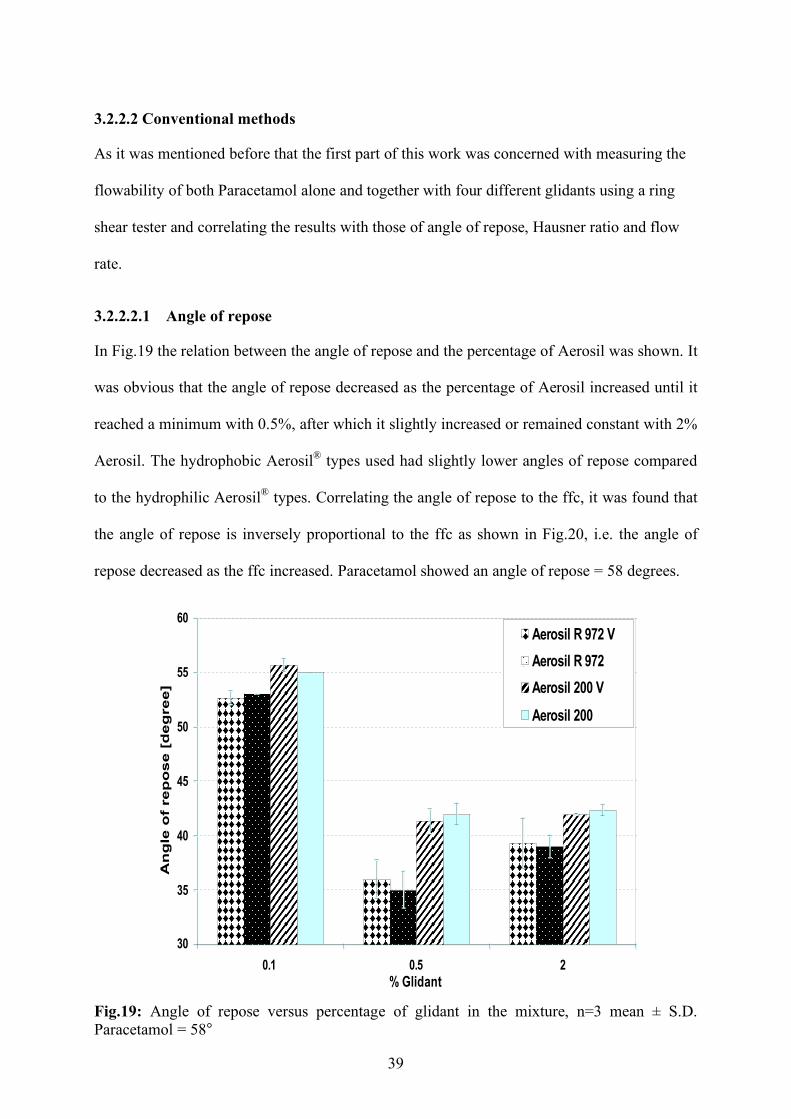
39
3.2.2.2 Conventional methods
As it was mentioned before that the first part of this work was concerned with measuring the
flowability of both Paracetamol alone and together with four different glidants using a ring
shear tester and correlating the results with those of angle of repose, Hausner ratio and flow
rate.
3.2.2.2.1 Angle of repose
In Fig.19 the relation between the angle of repose and the percentage of Aerosil was shown. It
was obvious that the angle of repose decreased as the percentage of Aerosil increased until it
reached a minimum with 0.5%, after which it slightly increased or remained constant with 2%
Aerosil. The hydrophobic Aerosil® types used had slightly lower angles of repose compared
to the hydrophilic Aerosil® types. Correlating the angle of repose to the ffc, it was found that
the angle of repose is inversely proportional to the ffc as shown in Fig.20, i.e. the angle of
repose decreased as the ffc increased. Paracetamol showed an angle of repose = 58 degrees.
30
35
40
45
50
55
60
0.1 0.5 2
% Glidant
An
gle
of
re
po
se
[d
eg
re
e]
Aerosil R 972 V
Aerosil R 972
Aerosil 200 V
Aerosil 200
Fig.19: Angle of repose versus percentage of glidant in the mixture, n=3 mean ± S.D. Paracetamol = 58°
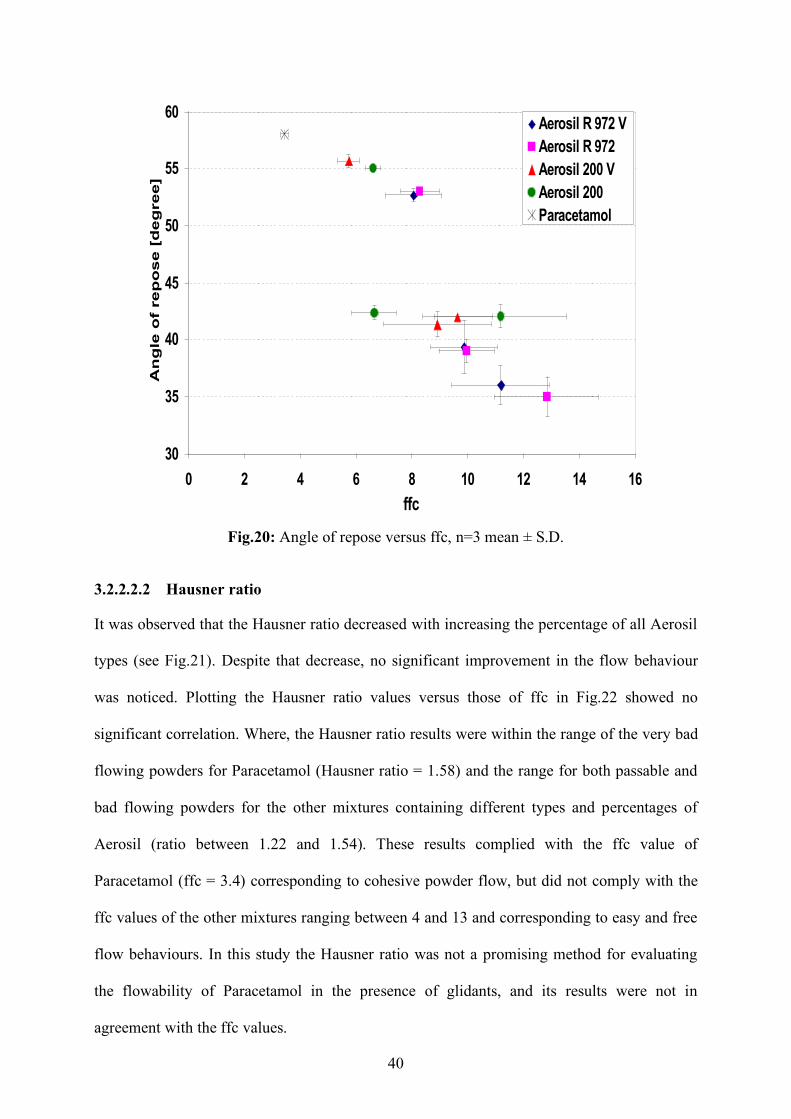
40
30
35
40
45
50
55
60
0 2 4 6 8 10 12 14 16
ffc
An
gle
of
re
po
se
[d
eg
re
e]
Aerosil R 972 V
Aerosil R 972
Aerosil 200 V
Aerosil 200
Paracetamol
Fig.20: Angle of repose versus ffc, n=3 mean ± S.D.
3.2.2.2.2 Hausner ratio
It was observed that the Hausner ratio decreased with increasing the percentage of all Aerosil
types (see Fig.21). Despite that decrease, no significant improvement in the flow behaviour
was noticed. Plotting the Hausner ratio values versus those of ffc in Fig.22 showed no
significant correlation. Where, the Hausner ratio results were within the range of the very bad
flowing powders for Paracetamol (Hausner ratio = 1.58) and the range for both passable and
bad flowing powders for the other mixtures containing different types and percentages of
Aerosil (ratio between 1.22 and 1.54). These results complied with the ffc value of
Paracetamol (ffc = 3.4) corresponding to cohesive powder flow, but did not comply with the
ffc values of the other mixtures ranging between 4 and 13 and corresponding to easy and free
flow behaviours. In this study the Hausner ratio was not a promising method for evaluating
the flowability of Paracetamol in the presence of glidants, and its results were not in
agreement with the ffc values.
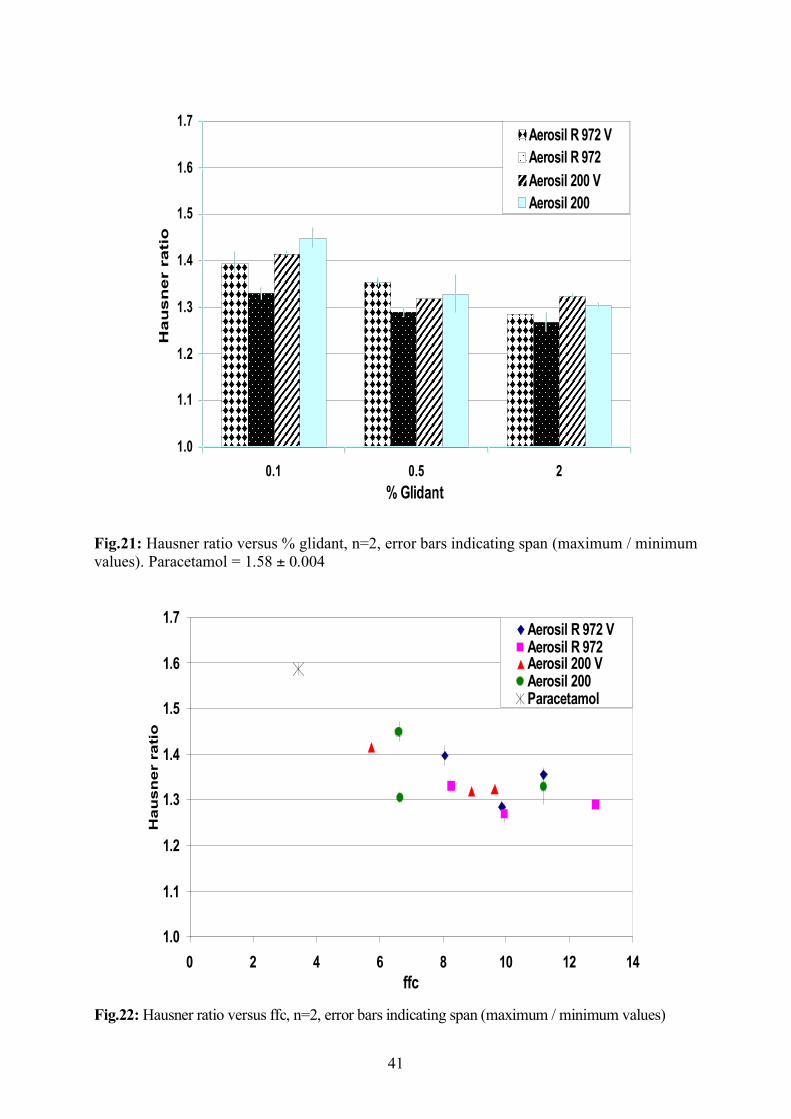
41
1.0
1.1
1.2
1.3
1.4
1.5
1.6
1.7
0.1 0.5 2
% Glidant
Ha
us
ne
r ra
tio
Aerosil R 972 V
Aerosil R 972
Aerosil 200 V
Aerosil 200
Fig.21: Hausner ratio versus % glidant, n=2, error bars indicating span (maximum / minimum values). Paracetamol = 1.58 ± 0.004
1.0
1.1
1.2
1.3
1.4
1.5
1.6
1.7
0 2 4 6 8 10 12 14
ffc
Hau
sn
er r
atio
Aerosil R 972 V
Aerosil R 972
Aerosil 200 V
Aerosil 200
Paracetamol
Fig.22: Hausner ratio versus ffc, n=2, error bars indicating span (maximum / minimum values)
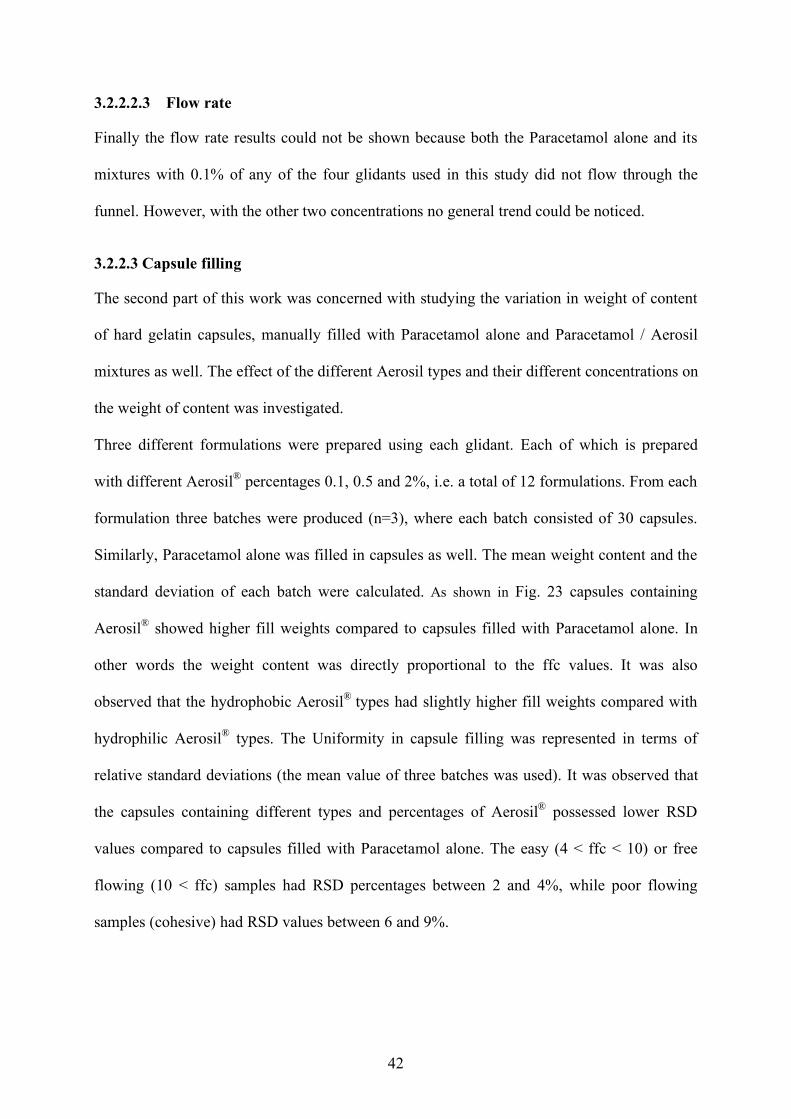
42
3.2.2.2.3 Flow rate
Finally the flow rate results could not be shown because both the Paracetamol alone and its
mixtures with 0.1% of any of the four glidants used in this study did not flow through the
funnel. However, with the other two concentrations no general trend could be noticed.
3.2.2.3 Capsule filling
The second part of this work was concerned with studying the variation in weight of content
of hard gelatin capsules, manually filled with Paracetamol alone and Paracetamol / Aerosil
mixtures as well. The effect of the different Aerosil types and their different concentrations on
the weight of content was investigated.
Three different formulations were prepared using each glidant. Each of which is prepared
with different Aerosil® percentages 0.1, 0.5 and 2%, i.e. a total of 12 formulations. From each
formulation three batches were produced (n=3), where each batch consisted of 30 capsules.
Similarly, Paracetamol alone was filled in capsules as well. The mean weight content and the
standard deviation of each batch were calculated. As shown in Fig. 23 capsules containing
Aerosil® showed higher fill weights compared to capsules filled with Paracetamol alone. In
other words the weight content was directly proportional to the ffc values. It was also
observed that the hydrophobic Aerosil® types had slightly higher fill weights compared with
hydrophilic Aerosil® types. The Uniformity in capsule filling was represented in terms of
relative standard deviations (the mean value of three batches was used). It was observed that
the capsules containing different types and percentages of Aerosil® possessed lower RSD
values compared to capsules filled with Paracetamol alone. The easy (4 < ffc < 10) or free
flowing (10 < ffc) samples had RSD percentages between 2 and 4%, while poor flowing
samples (cohesive) had RSD values between 6 and 9%.

43
0.20
0.25
0.30
0.35
0.40
0.45
0 2 4 6 8 10 12 14
ffc
Averag
e w
eig
ht
co
nte
nt
[g]
Aerosil R 972 V
Aerosil R 972
Aerosil 200 V
Aerosil 200
Paracetamol
Fig. 23: Average weight content versus ffc values, n = 3 mean value ± S.D.
Fig.24 plots the mean relative standard deviation versus the flowability function. It showed
that almost all formulations with Aerosil®, those having higher ffc values, resulted in lower
RSD% with less scattering values (with one exception, where a batch with Aerosil R 972V
showed a higher RSD% and was marked as an outlier) compared to the formulation with
Paracetamol alone which showed higher scattering values According to the classification of
flowability function by Jenike. The Paracetamol is a cohesive powder because it has an ffc
value of 3.4, while the other formulations are easy flowing powders having ffc values
between 4 and 10 or free flowing having ffc values higher than 10. In other words uniformity
in weight content can only be guaranteed by the introduction of glidants in the formulation
which decreases the interparticle forces within a cohesive powder and improves its
flowability, therefore facilitating the manual capsule filling process. However, comparing the
RSD values of all capsules no significant difference could be observed between either the
mixtures containing 0.1, 0.5 or 2% or the different types of Aerosil®.
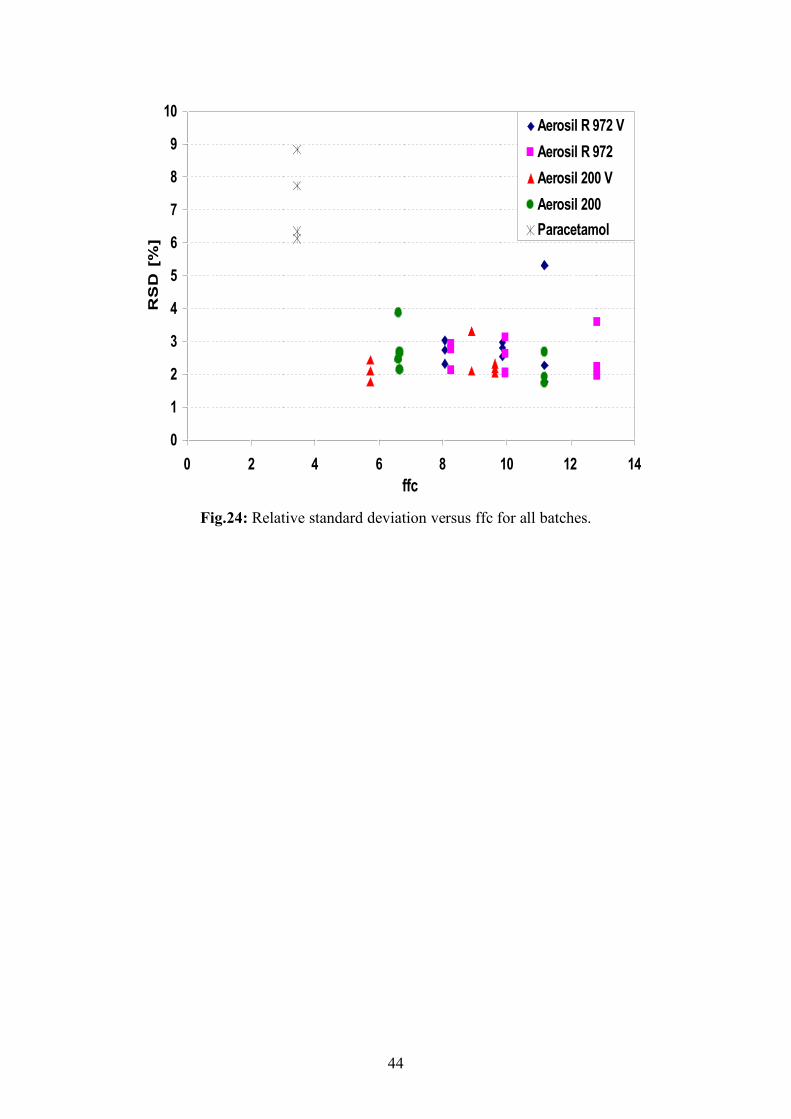
44
0
1
2
3
4
5
6
7
8
9
10
0 2 4 6 8 10 12 14
ffc
RS
D [%
]
Aerosil R 972 V
Aerosil R 972
Aerosil 200 V
Aerosil 200
Paracetamol
Fig.24: Relative standard deviation versus ffc for all batches.
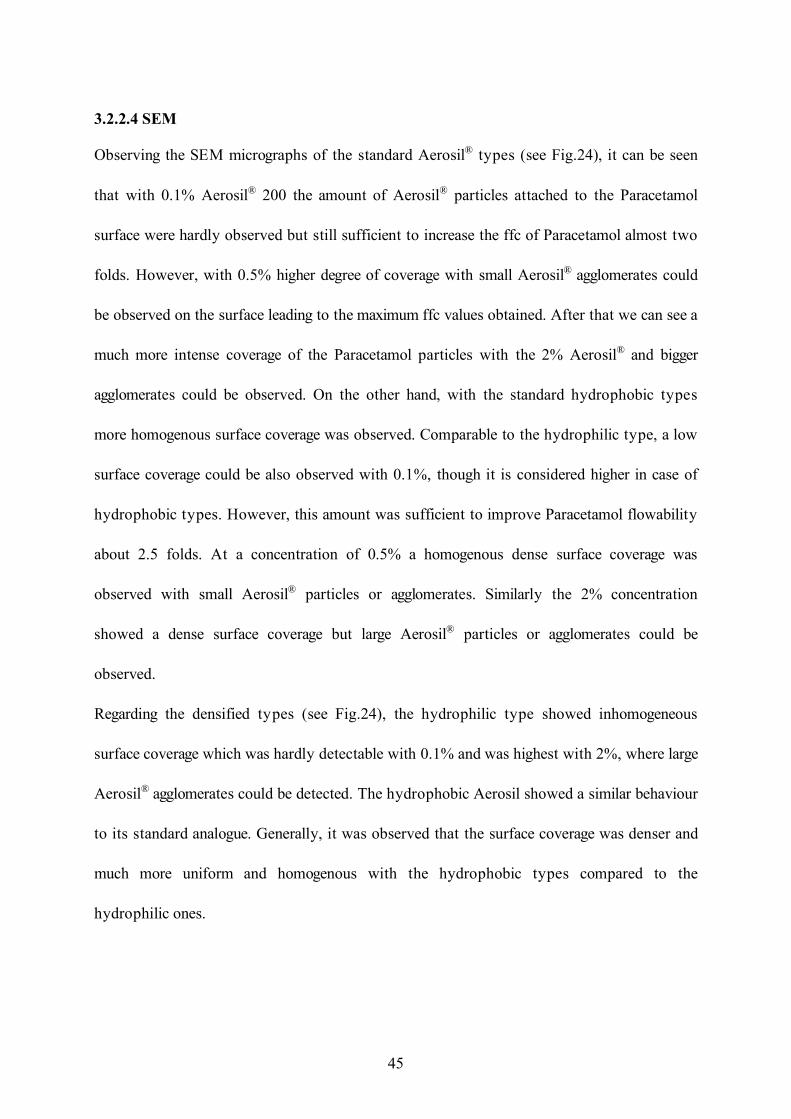
45
3.2.2.4 SEM
Observing the SEM micrographs of the standard Aerosil® types (see Fig.24), it can be seen
that with 0.1% Aerosil® 200 the amount of Aerosil® particles attached to the Paracetamol
surface were hardly observed but still sufficient to increase the ffc of Paracetamol almost two
folds. However, with 0.5% higher degree of coverage with small Aerosil® agglomerates could
be observed on the surface leading to the maximum ffc values obtained. After that we can see a
much more intense coverage of the Paracetamol particles with the 2% Aerosil® and bigger
agglomerates could be observed. On the other hand, with the standard hydrophobic types
more homogenous surface coverage was observed. Comparable to the hydrophilic type, a low
surface coverage could be also observed with 0.1%, though it is considered higher in case of
hydrophobic types. However, this amount was sufficient to improve Paracetamol flowability
about 2.5 folds. At a concentration of 0.5% a homogenous dense surface coverage was
observed with small Aerosil® particles or agglomerates. Similarly the 2% concentration
showed a dense surface coverage but large Aerosil® particles or agglomerates could be
observed.
Regarding the densified types (see Fig.24), the hydrophilic type showed inhomogeneous
surface coverage which was hardly detectable with 0.1% and was highest with 2%, where large
Aerosil® agglomerates could be detected. The hydrophobic Aerosil showed a similar behaviour
to its standard analogue. Generally, it was observed that the surface coverage was denser and
much more uniform and homogenous with the hydrophobic types compared to the
hydrophilic ones.
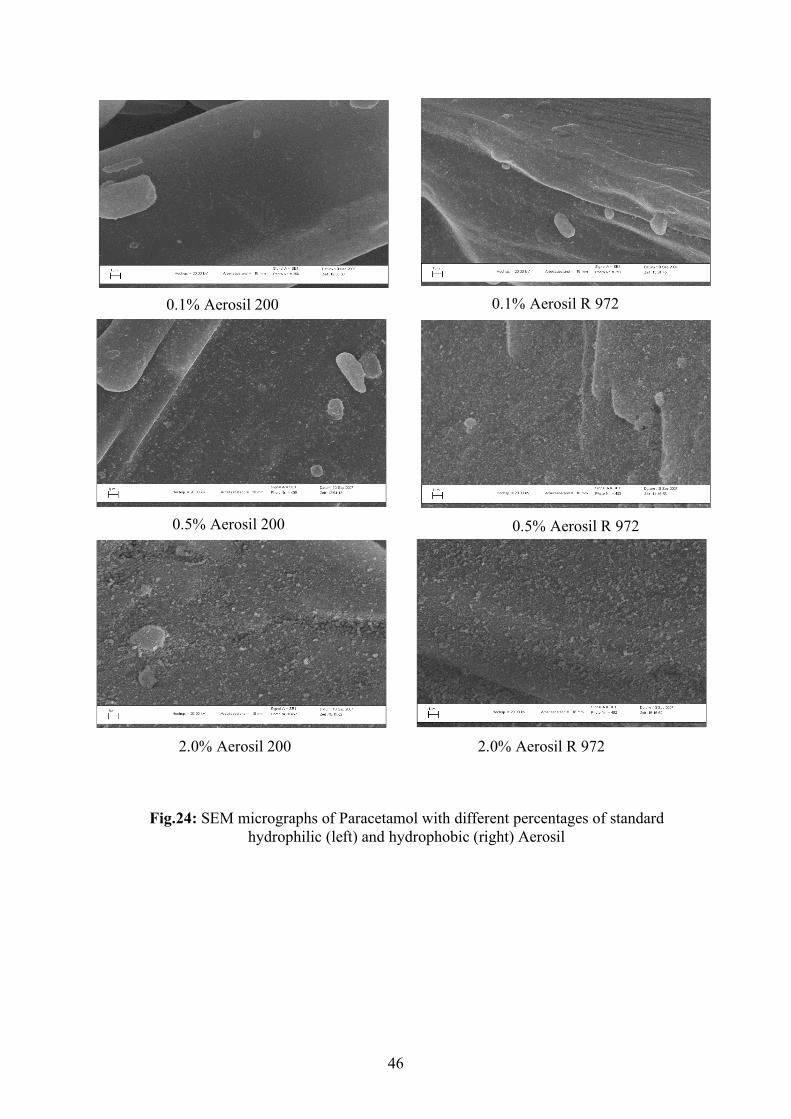
46
.
0.5% Aerosil R 972
2.0% Aerosil 200
2.0% Aerosil R 972
Fig.24: SEM micrographs of Paracetamol with different percentages of standard hydrophilic (left) and hydrophobic (right) Aerosil
0.1% Aerosil R 972
0.1% Aerosil 200
0.5% Aerosil 200
A
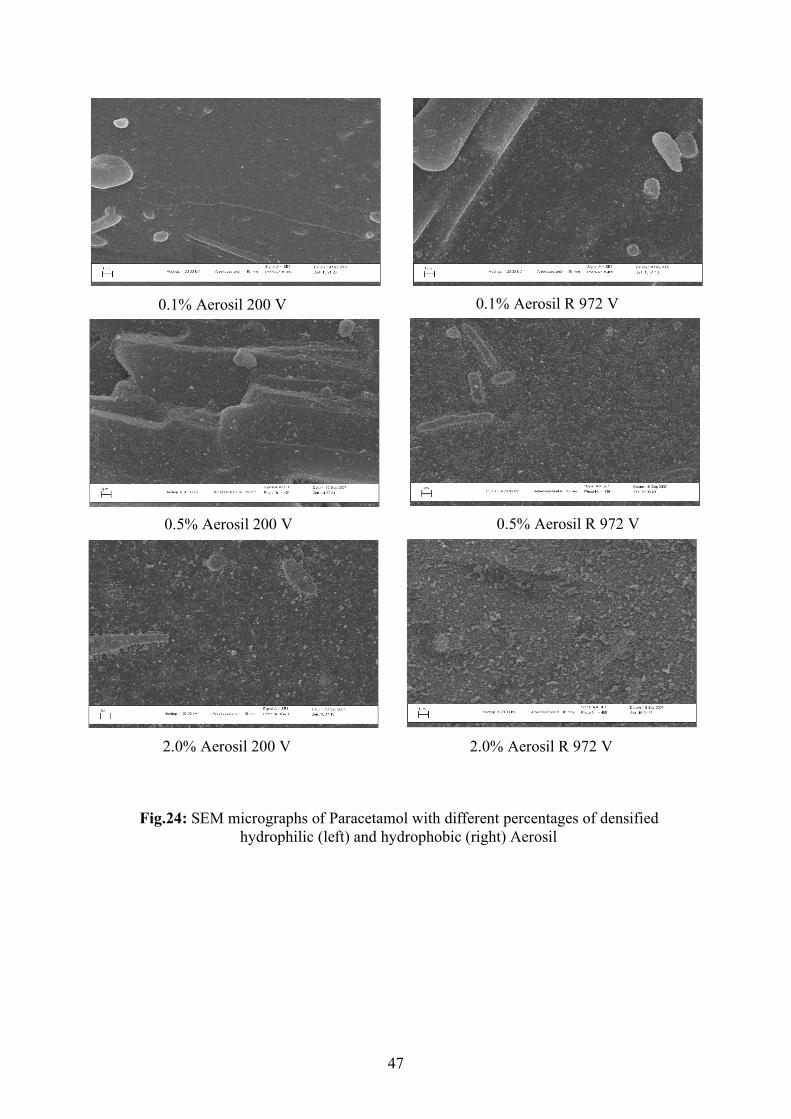
47
Fig.24: SEM micrographs of Paracetamol with different percentages of densified hydrophilic (left) and hydrophobic (right) Aerosil
2.0% Aerosil 200 V
2.0% Aerosil R 972 V
0.5% Aerosil R 972 V
0.5% Aerosil 200 V
0.1% Aerosil R 972 V
0.1% Aerosil 200 V
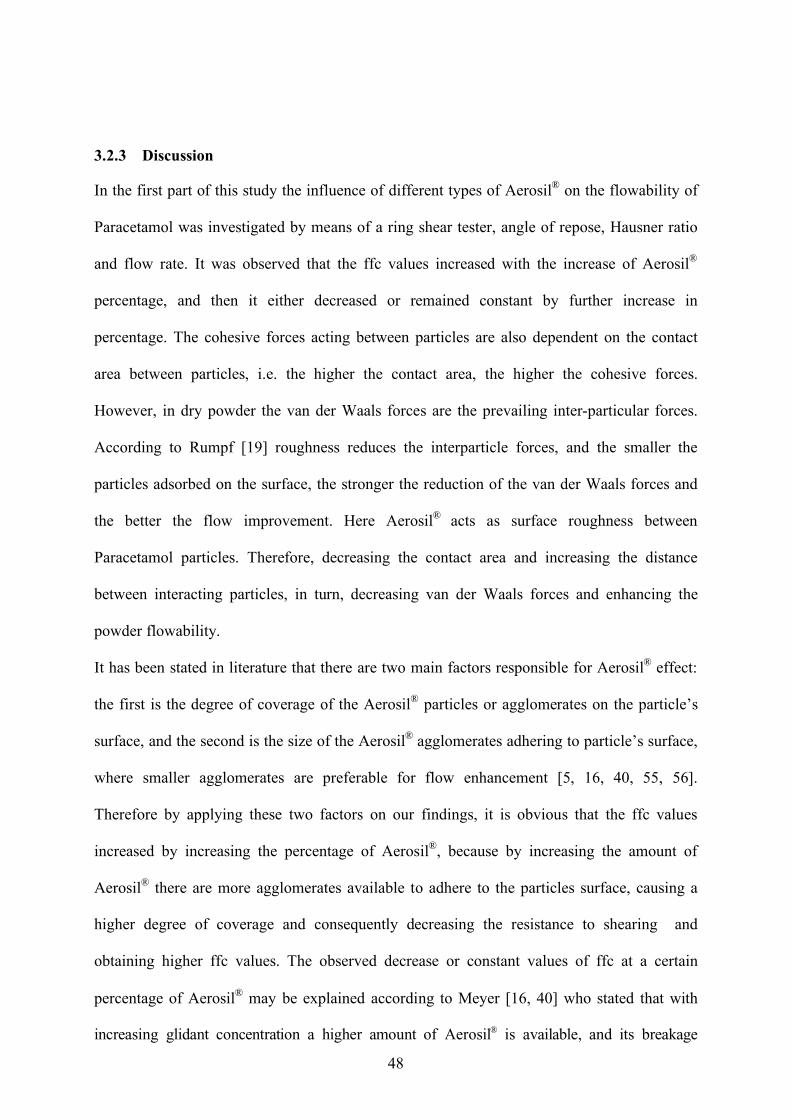
48
3.2.3 Discussion
In the first part of this study the influence of different types of Aerosil® on the flowability of
Paracetamol was investigated by means of a ring shear tester, angle of repose, Hausner ratio
and flow rate. It was observed that the ffc values increased with the increase of Aerosil®
percentage, and then it either decreased or remained constant by further increase in
percentage. The cohesive forces acting between particles are also dependent on the contact
area between particles, i.e. the higher the contact area, the higher the cohesive forces.
However, in dry powder the van der Waals forces are the prevailing inter-particular forces.
According to Rumpf [19] roughness reduces the interparticle forces, and the smaller the
particles adsorbed on the surface, the stronger the reduction of the van der Waals forces and
the better the flow improvement. Here Aerosil® acts as surface roughness between
Paracetamol particles. Therefore, decreasing the contact area and increasing the distance
between interacting particles, in turn, decreasing van der Waals forces and enhancing the
powder flowability.
It has been stated in literature that there are two main factors responsible for Aerosil® effect:
the first is the degree of coverage of the Aerosil® particles or agglomerates on the particle’s
surface, and the second is the size of the Aerosil® agglomerates adhering to particle’s surface,
where smaller agglomerates are preferable for flow enhancement [5, 16, 40, 55, 56].
Therefore by applying these two factors on our findings, it is obvious that the ffc values
increased by increasing the percentage of Aerosil®, because by increasing the amount of
Aerosil® there are more agglomerates available to adhere to the particles surface, causing a
higher degree of coverage and consequently decreasing the resistance to shearing and
obtaining higher ffc values. The observed decrease or constant values of ffc at a certain
percentage of Aerosil® may be explained according to Meyer [16, 40] who stated that with
increasing glidant concentration a higher amount of Aerosil® is available, and its breakage
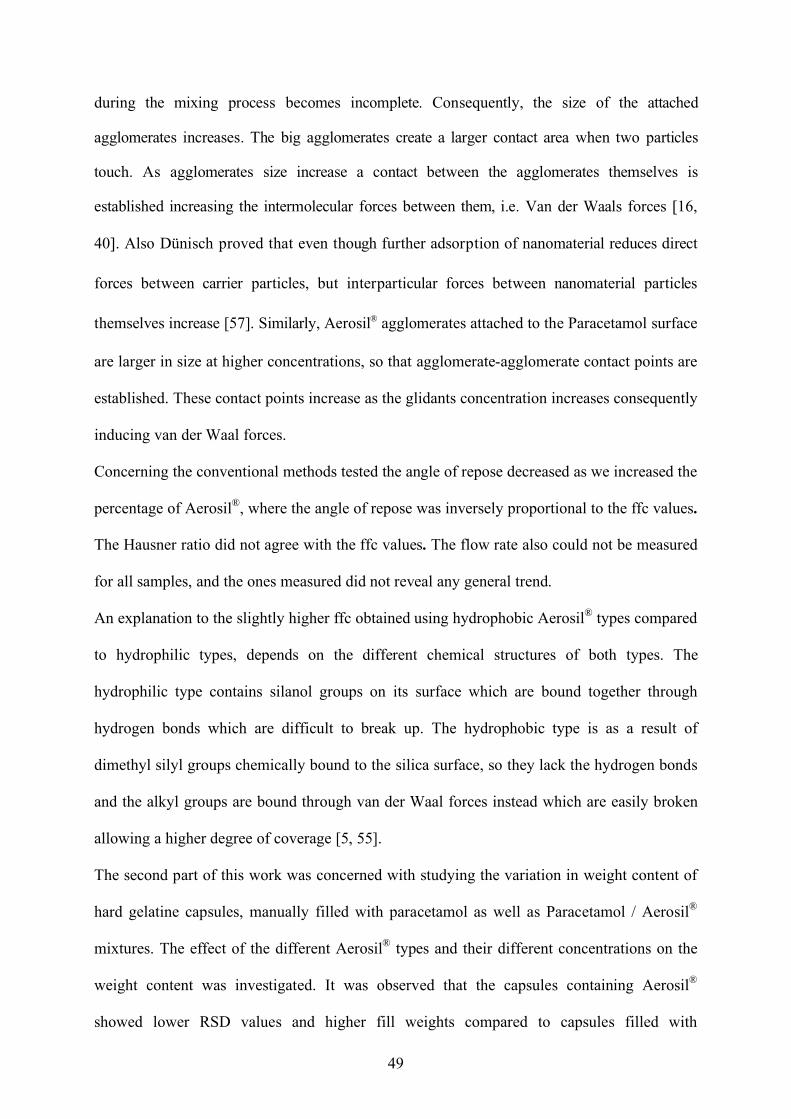
49
during the mixing process becomes incomplete. Consequently, the size of the attached
agglomerates increases. The big agglomerates create a larger contact area when two particles
touch. As agglomerates size increase a contact between the agglomerates themselves is
established increasing the intermolecular forces between them, i.e. Van der Waals forces [16,
40]. Also Dünisch proved that even though further adsorption of nanomaterial reduces direct
forces between carrier particles, but interparticular forces between nanomaterial particles
themselves increase [57]. Similarly, Aerosil® agglomerates attached to the Paracetamol surface
are larger in size at higher concentrations, so that agglomerate-agglomerate contact points are
established. These contact points increase as the glidants concentration increases consequently
inducing van der Waal forces.
Concerning the conventional methods tested the angle of repose decreased as we increased the
percentage of Aerosil®, where the angle of repose was inversely proportional to the ffc values.
The Hausner ratio did not agree with the ffc values. The flow rate also could not be measured
for all samples, and the ones measured did not reveal any general trend.
An explanation to the slightly higher ffc obtained using hydrophobic Aerosil® types compared
to hydrophilic types, depends on the different chemical structures of both types. The
hydrophilic type contains silanol groups on its surface which are bound together through
hydrogen bonds which are difficult to break up. The hydrophobic type is as a result of
dimethyl silyl groups chemically bound to the silica surface, so they lack the hydrogen bonds
and the alkyl groups are bound through van der Waal forces instead which are easily broken
allowing a higher degree of coverage [5, 55].
The second part of this work was concerned with studying the variation in weight content of
hard gelatine capsules, manually filled with paracetamol as well as Paracetamol / Aerosil®
mixtures. The effect of the different Aerosil® types and their different concentrations on the
weight content was investigated. It was observed that the capsules containing Aerosil®
showed lower RSD values and higher fill weights compared to capsules filled with
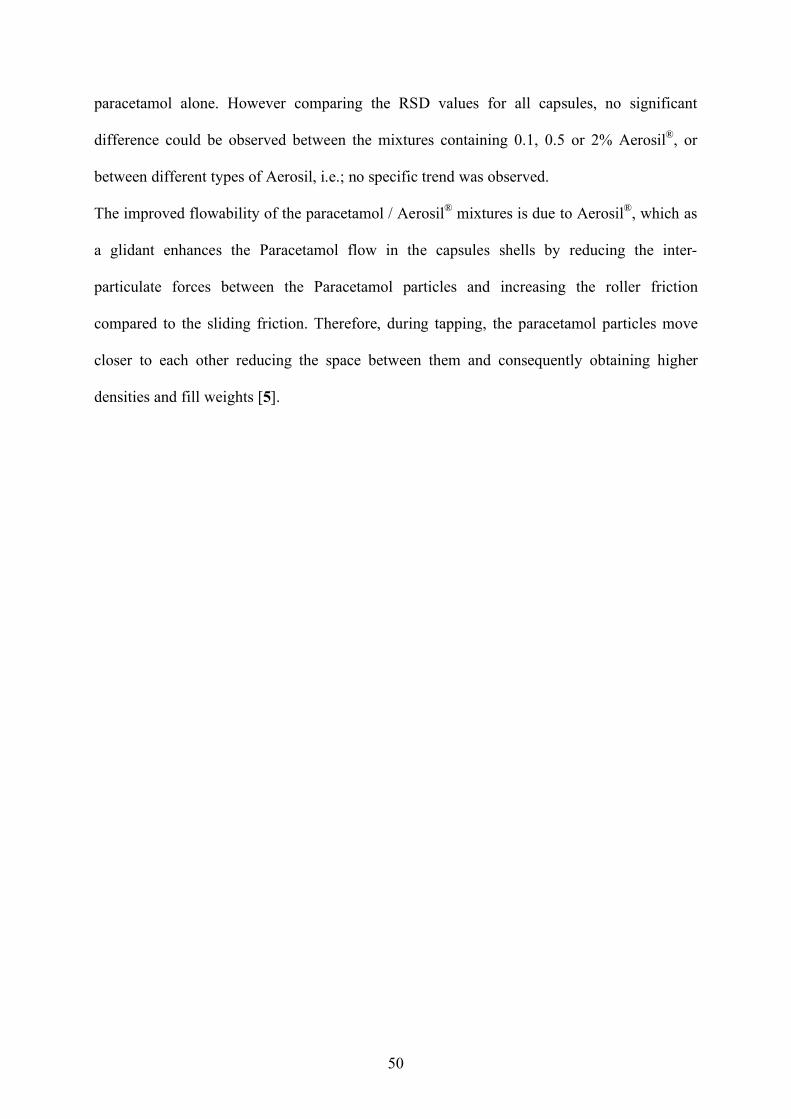
50
paracetamol alone. However comparing the RSD values for all capsules, no significant
difference could be observed between the mixtures containing 0.1, 0.5 or 2% Aerosil®, or
between different types of Aerosil, i.e.; no specific trend was observed.
The improved flowability of the paracetamol / Aerosil® mixtures is due to Aerosil®, which as
a glidant enhances the Paracetamol flow in the capsules shells by reducing the inter-
particulate forces between the Paracetamol particles and increasing the roller friction
compared to the sliding friction. Therefore, during tapping, the paracetamol particles move
closer to each other reducing the space between them and consequently obtaining higher
densities and fill weights [5].
51
3.3 Flow behaviour of binary mixtures with different concentrations:
3.3.1 Introduction and objective
In pharmaceutics the substances are not used individually as single components, but they are
rather used as multi-component mixtures and formulations. The flowability assessment of
these mixtures is a crucial and essential requirement and a prerequisite for a successful
production. In addition to flow properties information about packing properties of powders is
important as well especially in the production of solid dosage forms, where volumetric filling
of a capsule or a die is desired [58, 59]. This information is also valuable in the production of
powdered products in order to be packed in suitable containers, consequently reducing the
space they may occupy during transportation and storage [60].
Several studies have been carried out and different models have been proposed to predict the
packing properties of powders. The packing density is governed by the size ratio of coarse
particles to fine particles and the volume fraction of both of them [58]. Among all proposed
models none of them is able to predict maximum in volume reduction by application of
vibration, small pressure or simple tapping [58]. The Kawakita model mainly relates the
degree of volume reduction to the applied pressure, but it can also be employed to study the
volume reduction of powder due to tapping [58, 59]. Using this model no direct packing
density could be measured but only the maximum volume reduction due to packing as
expressed by the Kawakita constant (a). Besides, inaccurate tapped density values could be
measured according to the tapped density volumeter used, where after an initial densification
of the powder a redispersion of the particles may occur [58]. One of the properties measured
with the ring shear tester is the bulk density under certain consolidation, so it was interesting
to apply this device to obtain directly packing densities of powders. The advantage of this
procedure over comparing the loose density to its tapped density is that here the bulk density
is a result of a well defined stress [2].
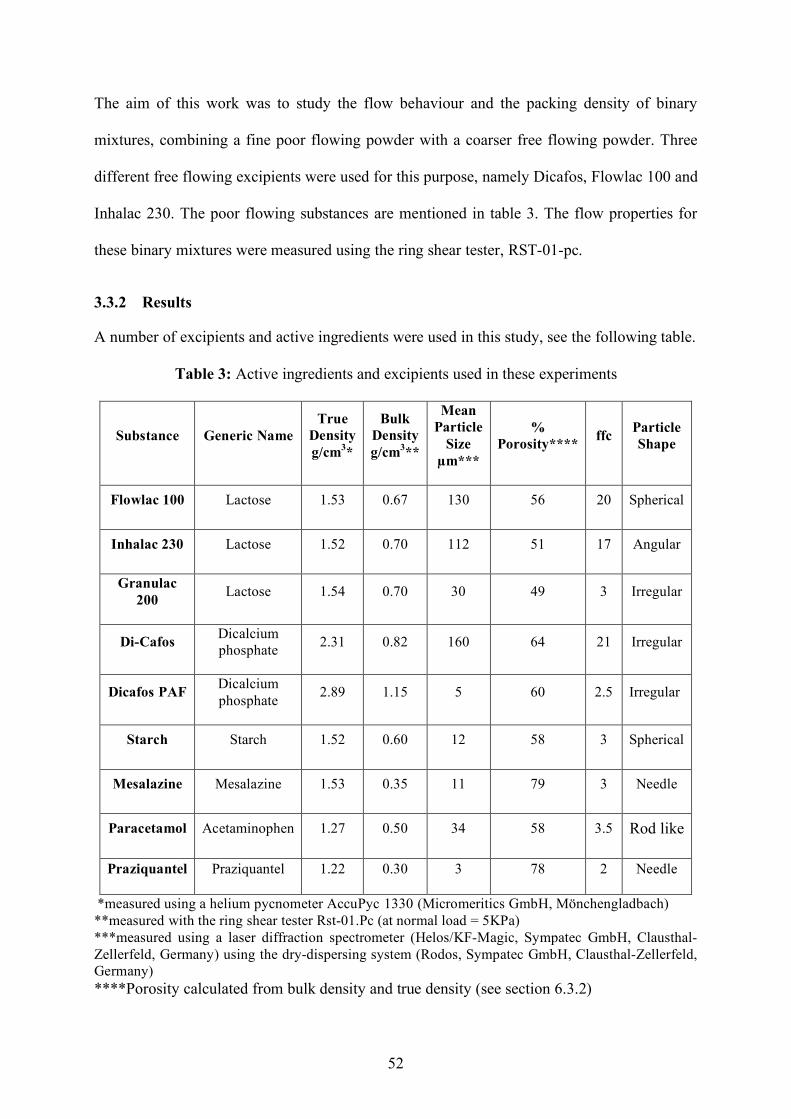
52
The aim of this work was to study the flow behaviour and the packing density of binary
mixtures, combining a fine poor flowing powder with a coarser free flowing powder. Three
different free flowing excipients were used for this purpose, namely Dicafos, Flowlac 100 and
Inhalac 230. The poor flowing substances are mentioned in table 3. The flow properties for
these binary mixtures were measured using the ring shear tester, RST-01-pc.
3.3.2 Results
A number of excipients and active ingredients were used in this study, see the following table.
Table 3: Active ingredients and excipients used in these experiments
Substance Generic Name True
Density g/cm3*
Bulk Density g/cm3**
Mean Particle
Size µm***
% Porosity**** ffc Particle
Shape
Flowlac 100 Lactose 1.53 0.67 130 56 20 Spherical
Inhalac 230 Lactose 1.52 0.70 112 51 17 Angular
Granulac 200 Lactose 1.54 0.70 30 49 3 Irregular
Di-Cafos Dicalcium phosphate 2.31 0.82 160 64 21 Irregular
Dicafos PAF Dicalcium phosphate 2.89 1.15 5 60 2.5 Irregular
Starch Starch 1.52 0.60 12 58 3 Spherical
Mesalazine Mesalazine 1.53 0.35 11 79 3 Needle
Paracetamol Acetaminophen 1.27 0.50 34 58 3.5 Rod like
Praziquantel Praziquantel 1.22 0.30 3 78 2 Needle
*measured using a helium pycnometer AccuPyc 1330 (Micromeritics GmbH, Mönchengladbach) **measured with the ring shear tester Rst-01.Pc (at normal load = 5KPa) ***measured using a laser diffraction spectrometer (Helos/KF-Magic, Sympatec GmbH, Clausthal-Zellerfeld, Germany) using the dry-dispersing system (Rodos, Sympatec GmbH, Clausthal-Zellerfeld, Germany) ****Porosity calculated from bulk density and true density (see section 6.3.2)
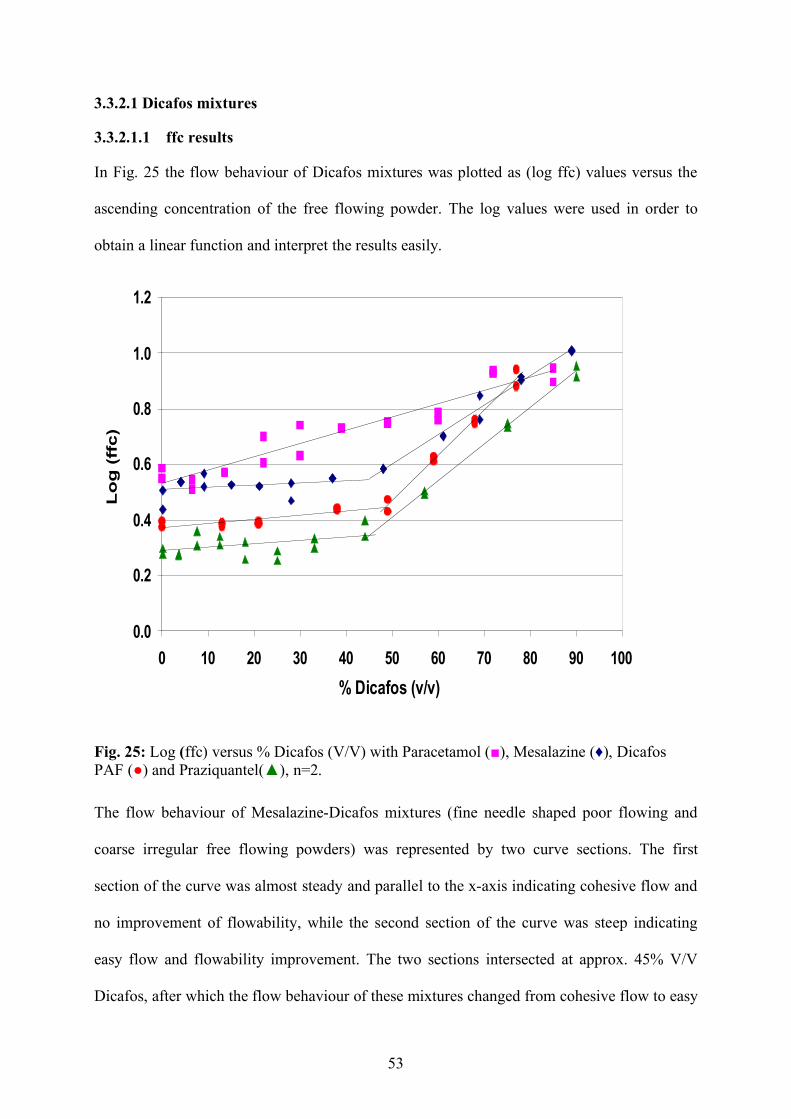
53
3.3.2.1 Dicafos mixtures
3.3.2.1.1 ffc results
In Fig. 25 the flow behaviour of Dicafos mixtures was plotted as (log ffc) values versus the
ascending concentration of the free flowing powder. The log values were used in order to
obtain a linear function and interpret the results easily.
0.0
0.2
0.4
0.6
0.8
1.0
1.2
0 10 20 30 40 50 60 70 80 90 100
% Dicafos (v/v)
Lo
g (
ffc)
Fig. 25: Log (ffc) versus % Dicafos (V/V) with Paracetamol (■), Mesalazine (♦), Dicafos PAF (●) and Praziquantel(▲), n=2.
The flow behaviour of Mesalazine-Dicafos mixtures (fine needle shaped poor flowing and
coarse irregular free flowing powders) was represented by two curve sections. The first
section of the curve was almost steady and parallel to the x-axis indicating cohesive flow and
no improvement of flowability, while the second section of the curve was steep indicating
easy flow and flowability improvement. The two sections intersected at approx. 45% V/V
Dicafos, after which the flow behaviour of these mixtures changed from cohesive flow to easy
54
flow behaviour. In other words, the flow behaviour of these mixtures was not sufficiently
influenced with Dicafos concentrations less than 45%.
Similarly, the flow behaviour of the Praziquantel-Dicafos mixtures (fine needle shaped poor
flowing and coarse irregular free flowing powders) was represented by two curve sections.
The first section indicated cohesive flow behaviour, while the second section indicated
improvement in flowability. The two sections intersected at approx. 45% V/V Dicafos.
Similar to Mesalazine-Dicafos mixtures the flow behaviour of these mixtures was not
sufficiently influenced or improved with Dicafos concentrations less than 45%. The flow
behaviour of Dicafos PAF-Dicafos mixtures (fine irregular poor flowing and coarse irregular
free flowing powders) was represented as well by two curve sections. Intersection point was
around 48% V/V Dicafos, after which the flow behaviour of these mixtures was improved.
Differently than the previous mixtures the flow behaviour of the Paracetamol-Dicafos
mixtures (fine rod shaped poor flowing and coarse irregular free flowing powders) was
represented only by one curve. The log ffc values increased proportionally with the increase
in the percentage of Dicafos in the mixtures. The linear relation indicates flowability
enhancement with very low concentrations of Dicafos (approx. 20% V/V) compared to the
previous mixtures.
In the previous Fig. 25 we may conclude that the particle size rather than the particle shape
influences to a great extent the flow behaviour of the binary mixtures. It was observed that the
flowability of the mixtures increased as the particle size of the poor flowing component
increased regardless its shape, where Mesalazine, Praziquantel and Paracetamol have almost
the same shape but showed different flow behaviours. Flowability of Dicafos mixtures
according to the poor flowing constituent could be arranged as follows; Paracetamol >
Mesalazine > Dicafos PAF > Praziquantel-Dicafos mixtures noticing that the mean particles
size are 34, 11, 5 and 3µm respectively. It was also observed that Paracetamol-Dicafos
mixtures revealed a flow improvement from the beginning where only a concentration about
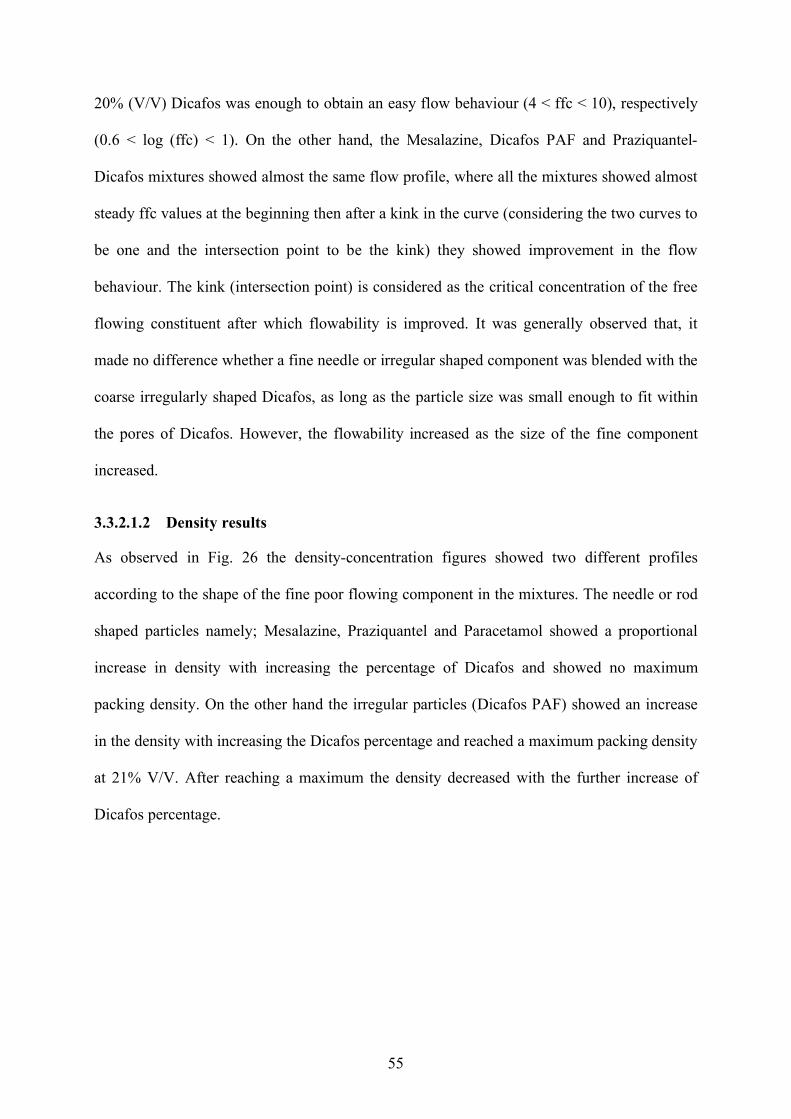
55
20% (V/V) Dicafos was enough to obtain an easy flow behaviour (4 < ffc < 10), respectively
(0.6 < log (ffc) < 1). On the other hand, the Mesalazine, Dicafos PAF and Praziquantel-
Dicafos mixtures showed almost the same flow profile, where all the mixtures showed almost
steady ffc values at the beginning then after a kink in the curve (considering the two curves to
be one and the intersection point to be the kink) they showed improvement in the flow
behaviour. The kink (intersection point) is considered as the critical concentration of the free
flowing constituent after which flowability is improved. It was generally observed that, it
made no difference whether a fine needle or irregular shaped component was blended with the
coarse irregularly shaped Dicafos, as long as the particle size was small enough to fit within
the pores of Dicafos. However, the flowability increased as the size of the fine component
increased.
3.3.2.1.2 Density results
As observed in Fig. 26 the density-concentration figures showed two different profiles
according to the shape of the fine poor flowing component in the mixtures. The needle or rod
shaped particles namely; Mesalazine, Praziquantel and Paracetamol showed a proportional
increase in density with increasing the percentage of Dicafos and showed no maximum
packing density. On the other hand the irregular particles (Dicafos PAF) showed an increase
in the density with increasing the Dicafos percentage and reached a maximum packing density
at 21% V/V. After reaching a maximum the density decreased with the further increase of
Dicafos percentage.
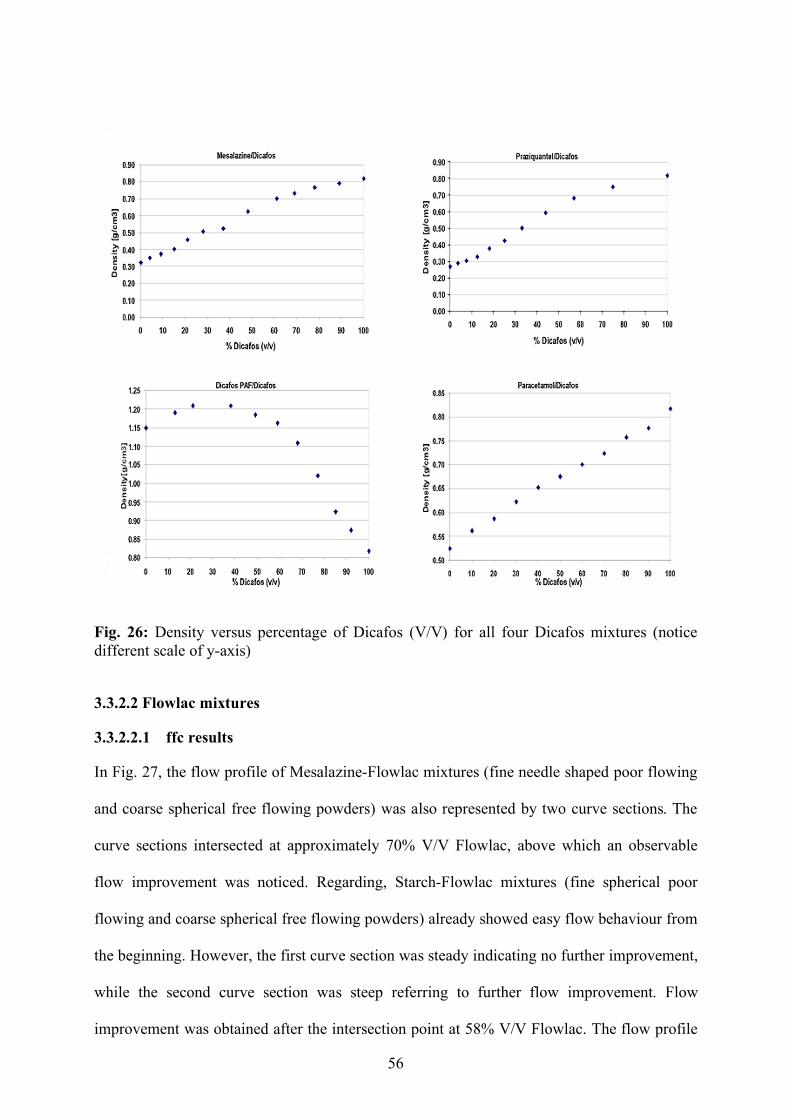
56
Fig. 26: Density versus percentage of Dicafos (V/V) for all four Dicafos mixtures (notice different scale of y-axis)
3.3.2.2 Flowlac mixtures
3.3.2.2.1 ffc results
In Fig. 27, the flow profile of Mesalazine-Flowlac mixtures (fine needle shaped poor flowing
and coarse spherical free flowing powders) was also represented by two curve sections. The
curve sections intersected at approximately 70% V/V Flowlac, above which an observable
flow improvement was noticed. Regarding, Starch-Flowlac mixtures (fine spherical poor
flowing and coarse spherical free flowing powders) already showed easy flow behaviour from
the beginning. However, the first curve section was steady indicating no further improvement,
while the second curve section was steep referring to further flow improvement. Flow
improvement was obtained after the intersection point at 58% V/V Flowlac. The flow profile
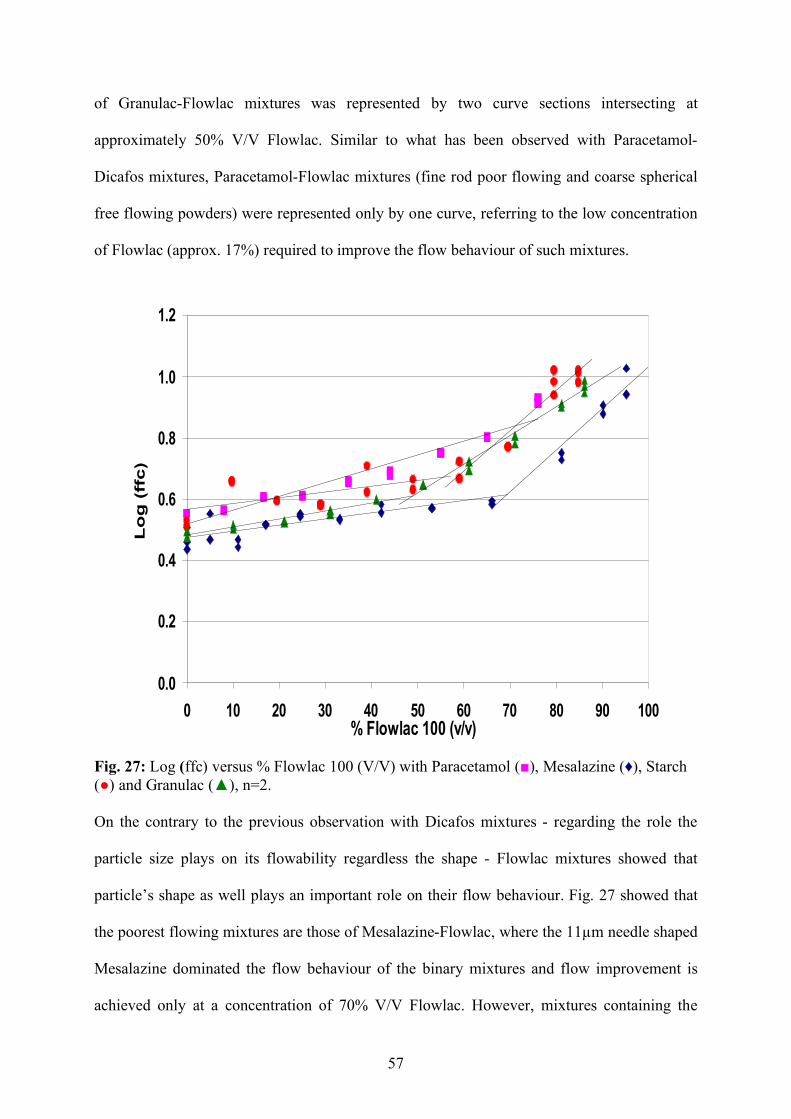
57
of Granulac-Flowlac mixtures was represented by two curve sections intersecting at
approximately 50% V/V Flowlac. Similar to what has been observed with Paracetamol-
Dicafos mixtures, Paracetamol-Flowlac mixtures (fine rod poor flowing and coarse spherical
free flowing powders) were represented only by one curve, referring to the low concentration
of Flowlac (approx. 17%) required to improve the flow behaviour of such mixtures.
0.0
0.2
0.4
0.6
0.8
1.0
1.2
0 10 20 30 40 50 60 70 80 90 100% Flowlac 100 (v/v)
Lo
g (
ffc)
Fig. 27: Log (ffc) versus % Flowlac 100 (V/V) with Paracetamol (■), Mesalazine (♦), Starch (●) and Granulac (▲), n=2. On the contrary to the previous observation with Dicafos mixtures - regarding the role the
particle size plays on its flowability regardless the shape - Flowlac mixtures showed that
particle’s shape as well plays an important role on their flow behaviour. Fig. 27 showed that
the poorest flowing mixtures are those of Mesalazine-Flowlac, where the 11µm needle shaped
Mesalazine dominated the flow behaviour of the binary mixtures and flow improvement is
achieved only at a concentration of 70% V/V Flowlac. However, mixtures containing the
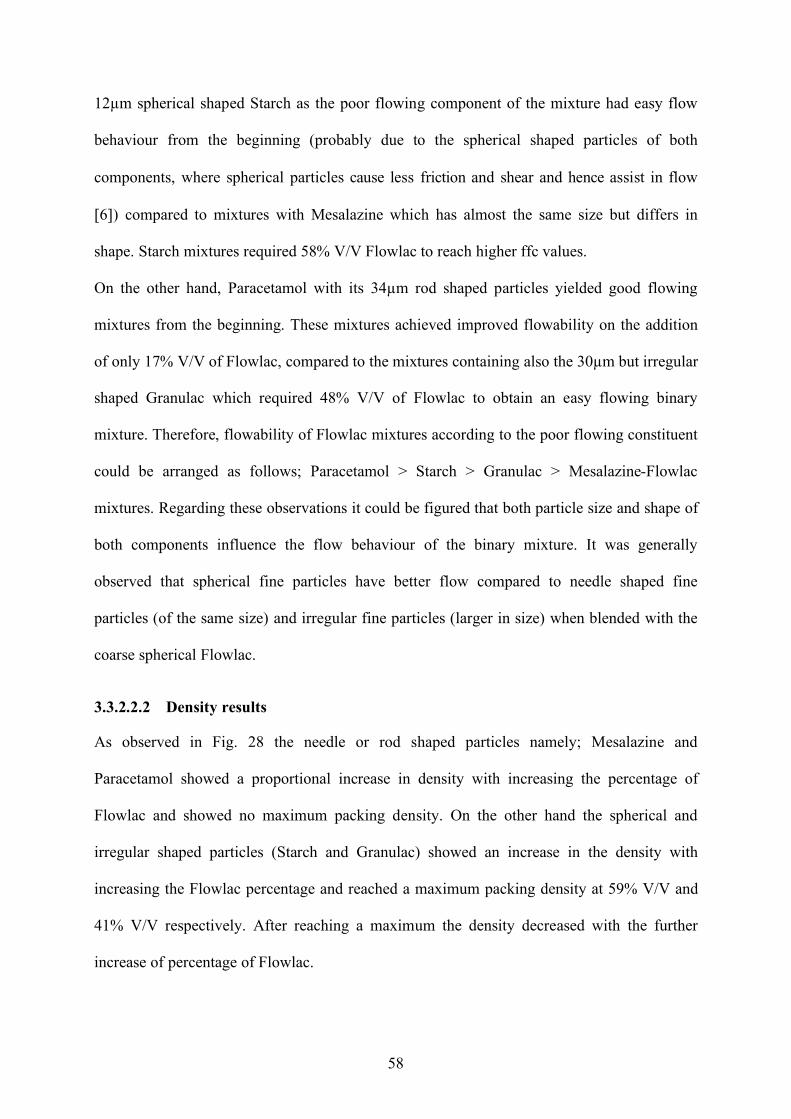
58
12µm spherical shaped Starch as the poor flowing component of the mixture had easy flow
behaviour from the beginning (probably due to the spherical shaped particles of both
components, where spherical particles cause less friction and shear and hence assist in flow
[6]) compared to mixtures with Mesalazine which has almost the same size but differs in
shape. Starch mixtures required 58% V/V Flowlac to reach higher ffc values.
On the other hand, Paracetamol with its 34µm rod shaped particles yielded good flowing
mixtures from the beginning. These mixtures achieved improved flowability on the addition
of only 17% V/V of Flowlac, compared to the mixtures containing also the 30µm but irregular
shaped Granulac which required 48% V/V of Flowlac to obtain an easy flowing binary
mixture. Therefore, flowability of Flowlac mixtures according to the poor flowing constituent
could be arranged as follows; Paracetamol > Starch > Granulac > Mesalazine-Flowlac
mixtures. Regarding these observations it could be figured that both particle size and shape of
both components influence the flow behaviour of the binary mixture. It was generally
observed that spherical fine particles have better flow compared to needle shaped fine
particles (of the same size) and irregular fine particles (larger in size) when blended with the
coarse spherical Flowlac.
3.3.2.2.2 Density results
As observed in Fig. 28 the needle or rod shaped particles namely; Mesalazine and
Paracetamol showed a proportional increase in density with increasing the percentage of
Flowlac and showed no maximum packing density. On the other hand the spherical and
irregular shaped particles (Starch and Granulac) showed an increase in the density with
increasing the Flowlac percentage and reached a maximum packing density at 59% V/V and
41% V/V respectively. After reaching a maximum the density decreased with the further
increase of percentage of Flowlac.
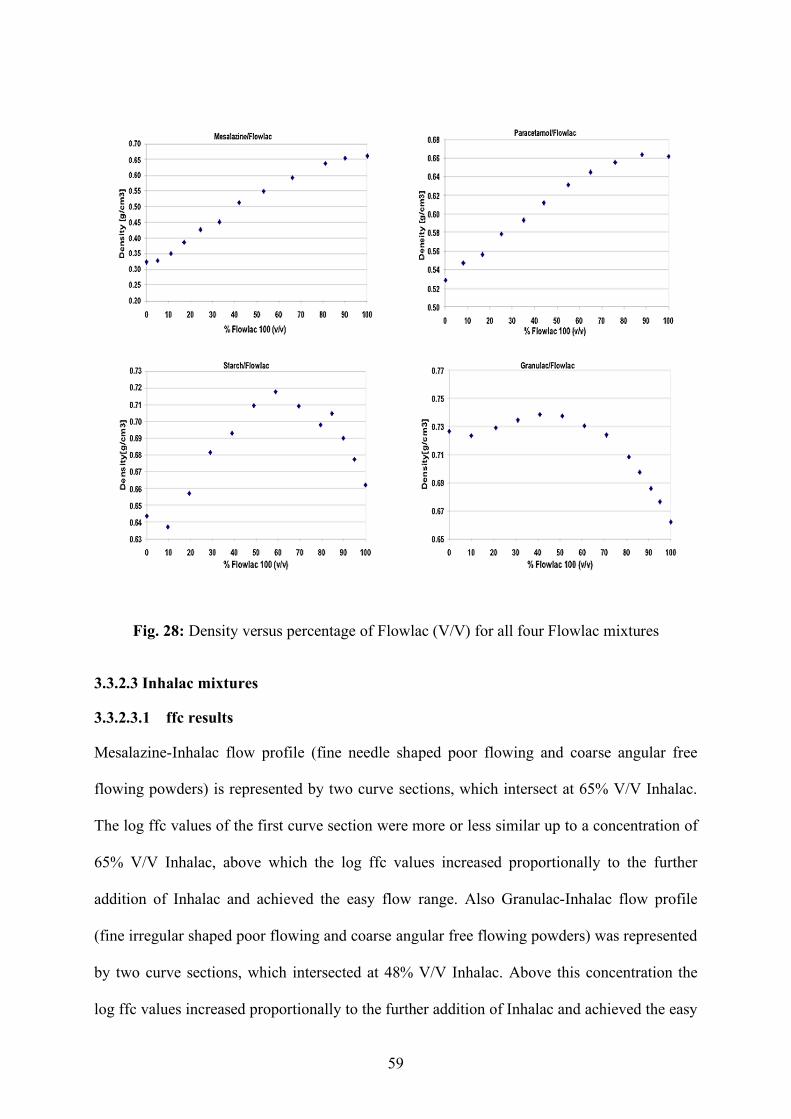
59
Fig. 28: Density versus percentage of Flowlac (V/V) for all four Flowlac mixtures
3.3.2.3 Inhalac mixtures
3.3.2.3.1 ffc results
Mesalazine-Inhalac flow profile (fine needle shaped poor flowing and coarse angular free
flowing powders) is represented by two curve sections, which intersect at 65% V/V Inhalac.
The log ffc values of the first curve section were more or less similar up to a concentration of
65% V/V Inhalac, above which the log ffc values increased proportionally to the further
addition of Inhalac and achieved the easy flow range. Also Granulac-Inhalac flow profile
(fine irregular shaped poor flowing and coarse angular free flowing powders) was represented
by two curve sections, which intersected at 48% V/V Inhalac. Above this concentration the
log ffc values increased proportionally to the further addition of Inhalac and achieved the easy
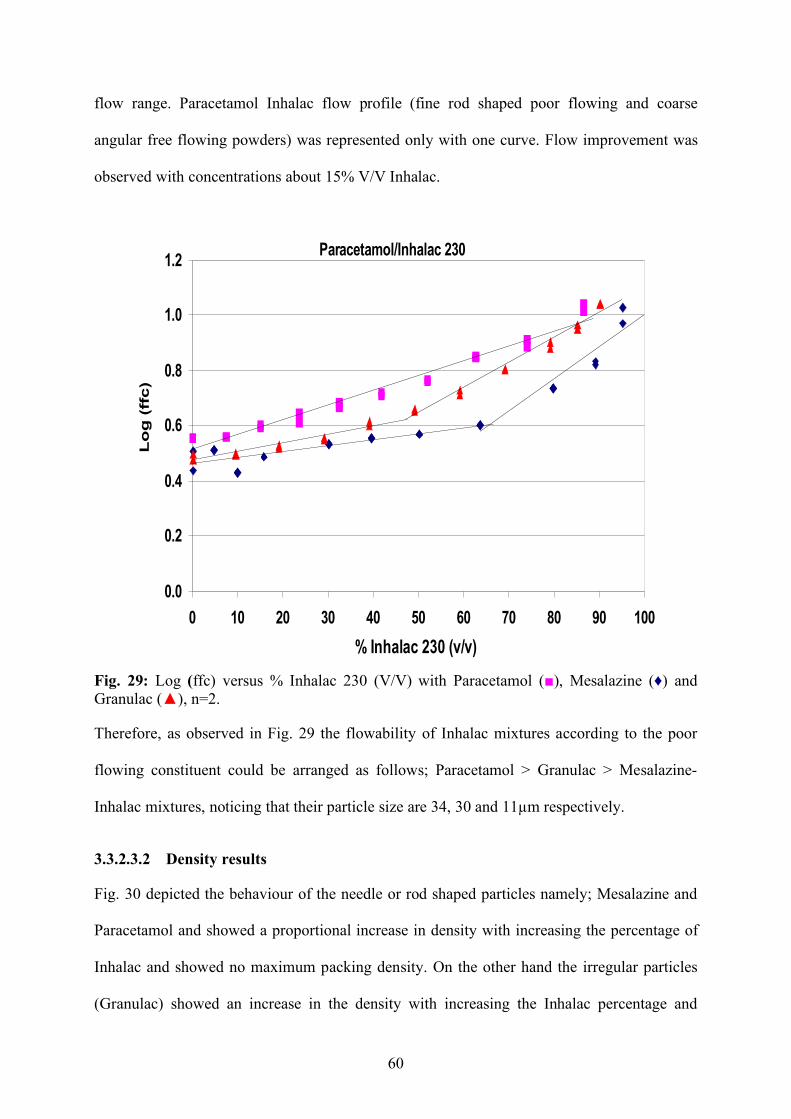
60
flow range. Paracetamol Inhalac flow profile (fine rod shaped poor flowing and coarse
angular free flowing powders) was represented only with one curve. Flow improvement was
observed with concentrations about 15% V/V Inhalac.
Paracetamol/Inhalac 230
0.0
0.2
0.4
0.6
0.8
1.0
1.2
0 10 20 30 40 50 60 70 80 90 100
% Inhalac 230 (v/v)
Lo
g (
ffc)
Fig. 29: Log (ffc) versus % Inhalac 230 (V/V) with Paracetamol (■), Mesalazine (♦) and Granulac (▲), n=2.
Therefore, as observed in Fig. 29 the flowability of Inhalac mixtures according to the poor
flowing constituent could be arranged as follows; Paracetamol > Granulac > Mesalazine-
Inhalac mixtures, noticing that their particle size are 34, 30 and 11µm respectively.
3.3.2.3.2 Density results
Fig. 30 depicted the behaviour of the needle or rod shaped particles namely; Mesalazine and
Paracetamol and showed a proportional increase in density with increasing the percentage of
Inhalac and showed no maximum packing density. On the other hand the irregular particles
(Granulac) showed an increase in the density with increasing the Inhalac percentage and
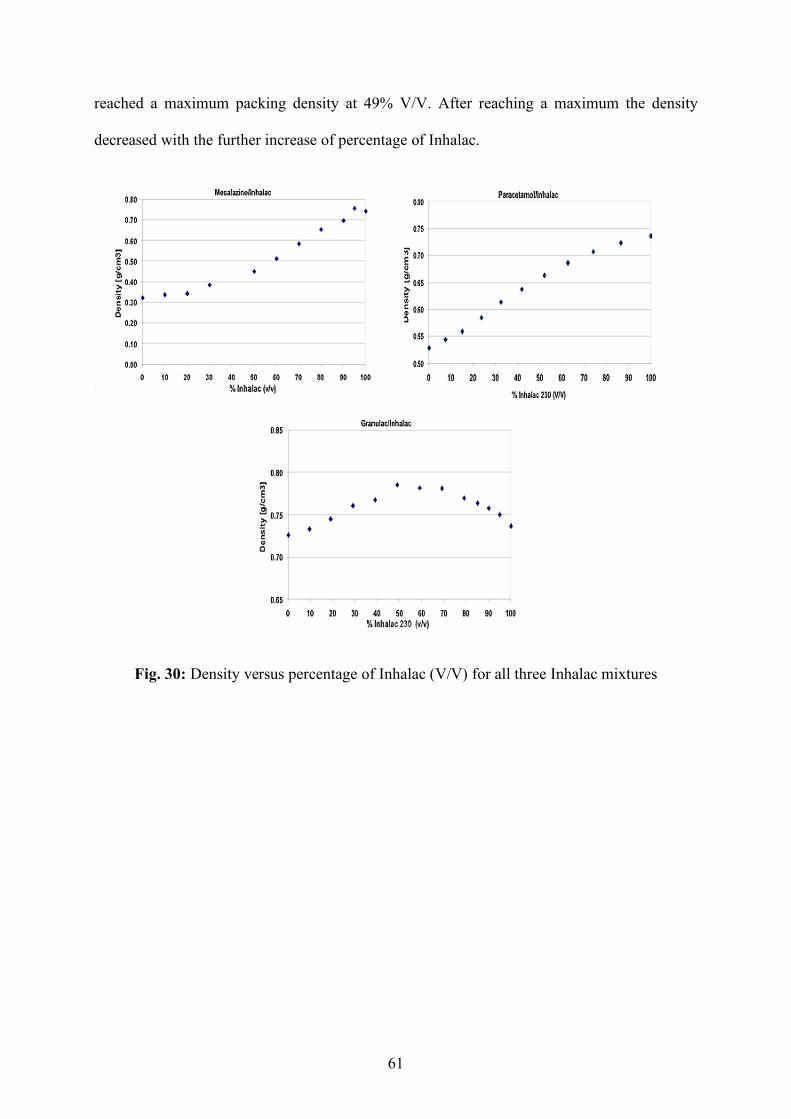
61
reached a maximum packing density at 49% V/V. After reaching a maximum the density
decreased with the further increase of percentage of Inhalac.
Fig. 30: Density versus percentage of Inhalac (V/V) for all three Inhalac mixtures
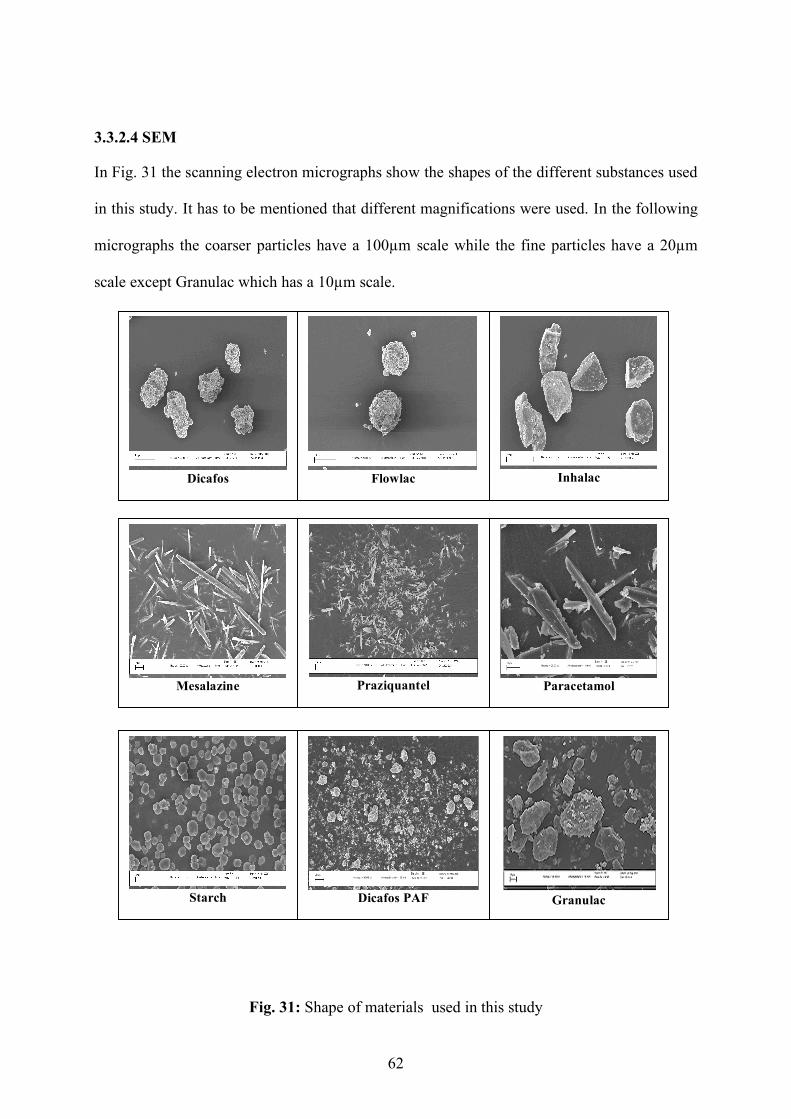
62
3.3.2.4 SEM
In Fig. 31 the scanning electron micrographs show the shapes of the different substances used
in this study. It has to be mentioned that different magnifications were used. In the following
micrographs the coarser particles have a 100µm scale while the fine particles have a 20µm
scale except Granulac which has a 10µm scale.
Fig. 31: Shape of materials used in this study
Flowlac
Paracetamol
Granulac
Inhalac
Dicafos
Praziquantel
Mesalazine
Dicafos PAF
Starch
63
3.3.3 Discussion On one hand it was observed that the flowability is influenced by the shape and size of both
binary mixture components. This finding is in agreement with Podczeck and Miah [61], who
stated that particle size and in particular particle shape influence the friction and flow
properties of powders. Also Lahdenpää et al, studied three different grades of microcrystalline
cellulose and found out that particle size and shape affected the powder flowability [62]. In
2006 Abhay [6] studied different shape factors and found that particle size is the most reliable
indicator of powder flowability, and other parameters such as particle elongation and irregularity
were also found to have an influence as well. Emery [12] also stated the dependence of
flowability on both particle size and shape. However, on the other hand it was observed from
this study that whether achieving a maximum packing density or not is mainly influenced by
the shape of the fine component in the binary mixtures.
Regarding the flow behaviour of the mixtures it was found that the flow profiles for all
mixtures examined were represented with two curve sections indicating the slight
improvement in flowability at low concentrations of the free flowing component until
reaching a critical concentration (point of intersection), after which significant flowability
improvement was noticed with the further increase in the concentration of the free flowing
component. Generally, it was observed that the flowability increased as the particle size of the
fine poor flowing component in the mixture increased, this fact agrees with studies carried out
before [6, 9, 12, 62, 63]. Only mixtures with Paracetamol as the fine poor flowing component
were represented with one curve indicating the flow improvement on the addition of very
small concentrations of the free flowing component, i.e. between 15 and 20 % V/V free
flowing component. According to Emery’s [12] findings, who determined that particle shape
had a greater impact on flowability than did particle size for powders under 30µm, it must be
referred to Paracetamol’s relatively larger particle size (above 30µm) and its relatively higher

64
ffc value (3.5) compared to the other fine poor flowing substances applied in this study.
However, in these mixtures the flow behaviour of the free flowing components dominates the
flow behaviour of the binary mixture. While the mixtures with two curve sections indicate in
most cases that the fine poor flowing component (all below 30µm) dominates the flow
behaviour of such mixture, and the intersection point differs from a mixture to another
according to the particle sizes and shapes involved in the mixtures.
Regarding the packing behaviour of the mixtures two profiles were noticed according to the
shape of the fine poor flowing component in the mixture. The first profile yielded a maximum
packing density with mixtures comprising fine (poor flowing) spherical or irregular shaped
components (Granulac, Starch and Dicafos PAF) where such mixtures showed an increase in
the density with increasing the concentration of the free flowing component and reached a
maximum packing density, after which the density decreased with the further increase of
percentage of free flowing component. That could be elucidated according to the bimodal
packing of the Furnas model where the fine particles distribute and rearrange themselves
between the pores of the larger packed particles [58, 64]. Consequently porosity is reduced
and the density reaches a maximum. The decrease in density after reaching a maximum is due
to the lack of the fine particles which could further fill in the pores [64]. The percentage of the
free flowing powder at which a maximum packing density is obtained, differs from one
mixture to another according to the particle size and shape of the components in the mixture.
Dicafos-Dicafos PAF mixtures showed a maximum at 20% V/V Dicafos, where the high
porosity of Dicafos consumed almost 80% of Dicafos PAF to fill in the voids. Comparing
Flowlac-Granulac mixtures with Flowlac-Starch mixtures, the former showed a maximum at
45% V/V Flowlac, while the later showed a higher maximum at 60% V/V Flowlac. This
result was expected because of the spherical shape of both components, where the pore space
between Flowlac particles is large and Starch incorporation lead to additional pores and
resisted closer packing at lower concentrations [58, 65]. However, according to literature
65
packing of mono-sized spherical particles, of which one fraction is coarse and the other is
fine, should result in a maximum packing between 70% and 80% w/w of the coarser
component (corresponds to approx. 70 to 80% V/V in this case) [58], but this maximum
would be shifted towards higher concentrations of the finer component with a wider particle
size distribution [65]. Finally, the Inhalac-Granulac mixtures showed maximum packing at
50% which is higher than the maximum reached by Flowlac-Granulac mixtures (45% V/V). It
is suggested that irregular particles contradict dense packing [58]. Therefore it would be
expected that incorporating such particles with spherically shaped components would improve
their packing behaviour compared to incorporating them with angular particles having more
contact points. From the previous findings it could be concluded that both particle size and
shape influence the packing behaviour of powders, and both parameters seem to interact [58,
60, 66]. That is also with agreement with Podczeck and Sharma who stated that particle shape
of both components in a binary mixture influences the maximum volume reduction due to
packing, as well as their particle sizes with the exception of angular particles [58]. The second
profile observed did not yield a maximum packing density with mixtures comprising fine
(poor flowing) needle or rod shaped components (Mesalazine, Paracetamol and Praziquantel).
However, the densities in that profile are additive and can be calculated from the densities and
volume fractions of the components. Such particles seem to entangle and interlock together,
so obstructing flowability [6] probably by building up a network through out the mixtures.
Consequently, such fine particles could not arrange them selves within the pores of the
coarser particles so that the porosity is reduced.
For all three good flowing excipients examined the mixtures comprising a fine poor flowing
needle shaped component showed the least ffc values. The poor flow behaviour of needle
shaped particles is in agreement with previous literature [6, 12, 61, 64, 67]. The fine needle
shaped component seemed to dominate the flow behaviour of the mixture probably due to
their high cohesiveness besides their interlocking behaviour. The previous explanation could
66
be applied here as well, where due to building up a network through out the mixtures, the
coarser particles are entrapped within this network until they reach a certain volume fraction
after which they are isolated, i.e. overcome and break this network. At this volume fraction
the mixture shows improved flow behaviour. It was also observed that in mixtures comprising
fine particles of the same size but of different shapes, the one with the spherically shaped fine
particles revealed better flowability e.g.; Mesalazine (11µm) and Starch (12µm), that agrees
with literature which states that flowability increase as the roundness as a shape factor
increase [6, 12], or that pharmaceutical blends containing small spherical particles exhibit
increased bulk and tapped density and hence improved flowability [12, 68].
Correlating the critical concentrations obtained (concentrations at intersection points) to the
mixtures examined; no general rules about the influence of the particle size and shape on the
flow behaviour of the mixtures could be predicted or proposed. Generally it was observed that
the critical concentrations obtained with Dicafos mixtures are lower (ranging from 45 to 48%
V/V) than the concentrations obtained with Flowlac and Inhalac mixtures (ranging from 48 to
70% V/V). Inhalac showed slightly lower concentrations compared to Flowlac mixtures.
However from these experiments it could be concluded that the irregular shaped Dicafos
showed flowability improvement at lower concentrations followed by the angular shaped
Inhalac and finally the spherical shaped Flowlac. This ranking could not be related directly
with the porosity or particle size of the excipients but it could be correlated to the bulk density
of these substances as measured with the ring shear tester at normal load equal to 5KPa. The
bulk densities of Dicafos, Inhalac and Flowlac are 0.82, 0.7 and 0.67g/cm3 respectively. It has
been already proved in a previous study that higher particle density can improve powder flow
behaviour [69]. In other words, the amount of good flowing component required to improve
flowability decreases as its density increases.
Therefore, it can be concluded that, the flowability is influenced by the shape and size of both
binary mixture components. On the other hand whether a maximum packing density achieved

67
or not is influenced mainly by the shape of the fine poor flowing component of the binary
mixtures. Generally, it has been observed that flowability of binary mixtures is improved as
the particle size of the fine poor flowing component increases. However, the mixtures
comprising the fine needle shaped poor flowing component had the worst flowability, while
mixtures comprising the fine spherically shaped poor flowing component revealed better flow
compared to mixtures comprising differently shaped, similarly sized fine particles.
68
3.4 The flow behaviour of different fats in absence and presence of Aerosil
3.4.1 Introduction and aim of work
3.4.1.1 Lipids
Lipids are a large and diverse group of naturally occurring organic compounds characterised
by their solubility in non-polar organic solvents (e.g. ether, chloroform, acetone & benzene)
and general insolubility in water. Lipids can be classified in many ways, due to their different
composition, nature and origin. According to Bloor's classification in 1920, lipids can be
divided in: simple lipids, compound lipids and derived lipids. The structure of simple lipids is
chain-like molecules consisting of glycerol and the fatty acids. Compound lipids are such as
phospholipids, sphingolipids, glycolipids and sulfolipids. Derived lipids include steroids, fat-
soluble vitamins, and prostaglandins [70].
Lipid is a collective term and includes fats and oils. They are water-insoluble substances of
plant or animal origin that consist predominantly of triglycerides. Those that are solid or
semisolid at room temperature are normally called fats, while those that are liquid under the
same conditions are called oils. Natural fats have a higher percentage of saturated fatty acids
than do oils [70]. Natural and semi-derived fats and oils are usually mixed together and are
mixtures of mono-, di-and triglycerides of fatty acids of different chain lengths. The central
component of triglycerides is glycerol, where all three hydroxyl groups are esterified with
fatty acids.
Lipid excipients have been of great interest in the pharmaceutical industry. Classical areas of
their application include the use of oils and semisolid preparations for external use such as
ointments, creams, pastes, oily eye drops or lipid based injections of lipophilic drugs or
suppositories. The interest in lipid based oral drug delivery is relatively recent and is related
to the growing need for novel drug delivery systems. Lipid excipients are used nowadays used
for bioavailability enhancement and to improve the solubility of active ingredients.
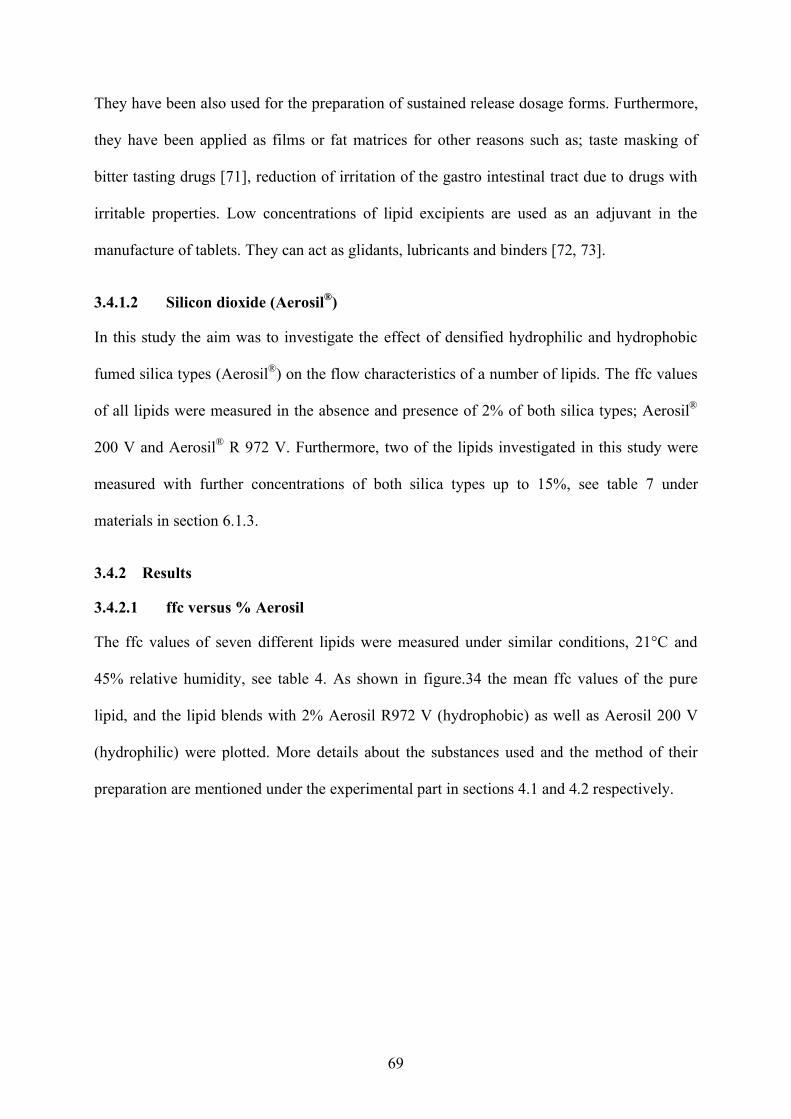
69
They have been also used for the preparation of sustained release dosage forms. Furthermore,
they have been applied as films or fat matrices for other reasons such as; taste masking of
bitter tasting drugs [71], reduction of irritation of the gastro intestinal tract due to drugs with
irritable properties. Low concentrations of lipid excipients are used as an adjuvant in the
manufacture of tablets. They can act as glidants, lubricants and binders [72, 73].
3.4.1.2 Silicon dioxide (Aerosil®)
In this study the aim was to investigate the effect of densified hydrophilic and hydrophobic
fumed silica types (Aerosil®) on the flow characteristics of a number of lipids. The ffc values
of all lipids were measured in the absence and presence of 2% of both silica types; Aerosil®
200 V and Aerosil® R 972 V. Furthermore, two of the lipids investigated in this study were
measured with further concentrations of both silica types up to 15%, see table 7 under
materials in section 6.1.3.
3.4.2 Results
3.4.2.1 ffc versus % Aerosil
The ffc values of seven different lipids were measured under similar conditions, 21°C and
45% relative humidity, see table 4. As shown in figure.34 the mean ffc values of the pure
lipid, and the lipid blends with 2% Aerosil R972 V (hydrophobic) as well as Aerosil 200 V
(hydrophilic) were plotted. More details about the substances used and the method of their
preparation are mentioned under the experimental part in sections 4.1 and 4.2 respectively.
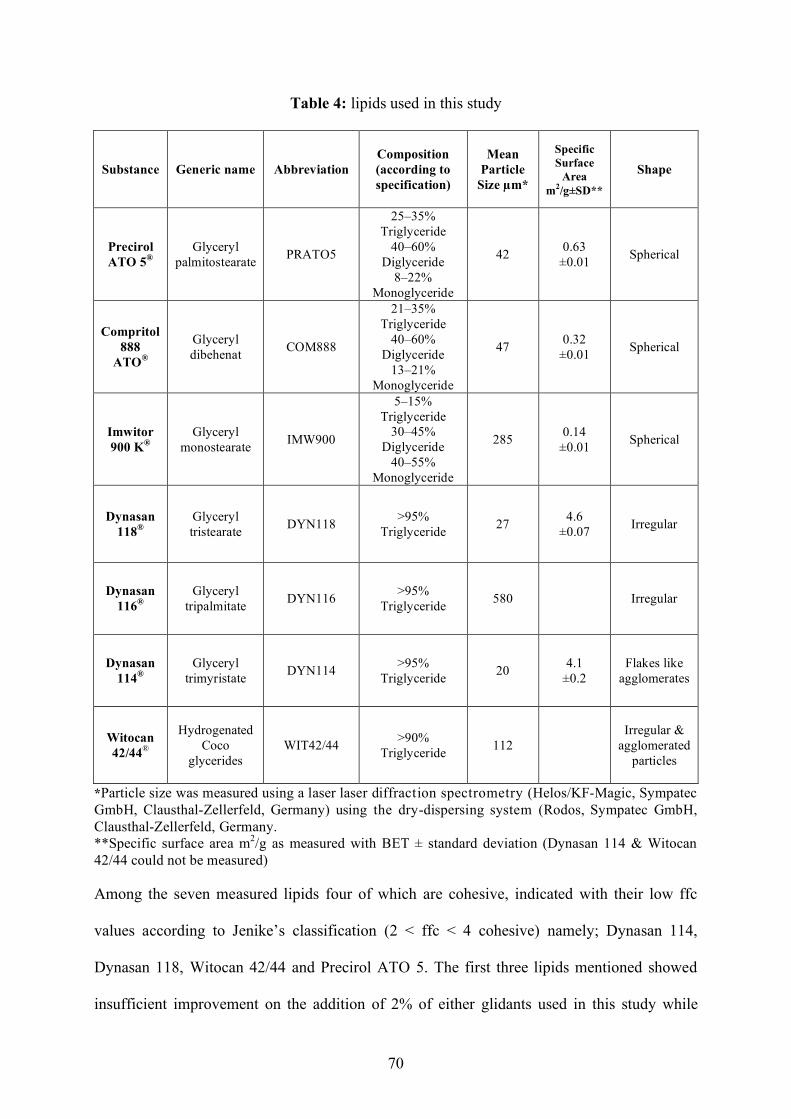
70
Table 4: lipids used in this study
Substance Generic name Abbreviation Composition (according to specification)
Mean Particle
Size µm*
Specific Surface
Area m2/g±SD**
Shape
Precirol ATO 5®
Glyceryl palmitostearate PRATO5
25–35% Triglyceride
40–60% Diglyceride
8–22% Monoglyceride
42 0.63 ±0.01 Spherical
Compritol 888
ATO®
Glyceryl dibehenat COM888
21–35% Triglyceride
40–60% Diglyceride
13–21% Monoglyceride
47 0.32 ±0.01 Spherical
Imwitor 900 K®
Glyceryl monostearate IMW900
5–15% Triglyceride
30–45% Diglyceride
40–55% Monoglyceride
285 0.14 ±0.01 Spherical
Dynasan 118®
Glyceryl tristearate DYN118 >95%
Triglyceride 27 4.6 ±0.07 Irregular
Dynasan 116®
Glyceryl tripalmitate DYN116 >95%
Triglyceride 580 Irregular
Dynasan 114®
Glyceryl trimyristate DYN114 >95%
Triglyceride 20 4.1 ±0.2
Flakes like agglomerates
Witocan 42/44®
Hydrogenated Coco
glycerides WIT42/44 >90%
Triglyceride 112 Irregular &
agglomerated particles
*Particle size was measured using a laser laser diffraction spectrometry (Helos/KF-Magic, Sympatec GmbH, Clausthal-Zellerfeld, Germany) using the dry-dispersing system (Rodos, Sympatec GmbH, Clausthal-Zellerfeld, Germany. **Specific surface area m2/g as measured with BET ± standard deviation (Dynasan 114 & Witocan 42/44 could not be measured)
Among the seven measured lipids four of which are cohesive, indicated with their low ffc
values according to Jenike’s classification (2 < ffc < 4 cohesive) namely; Dynasan 114,
Dynasan 118, Witocan 42/44 and Precirol ATO 5. The first three lipids mentioned showed
insufficient improvement on the addition of 2% of either glidants used in this study while
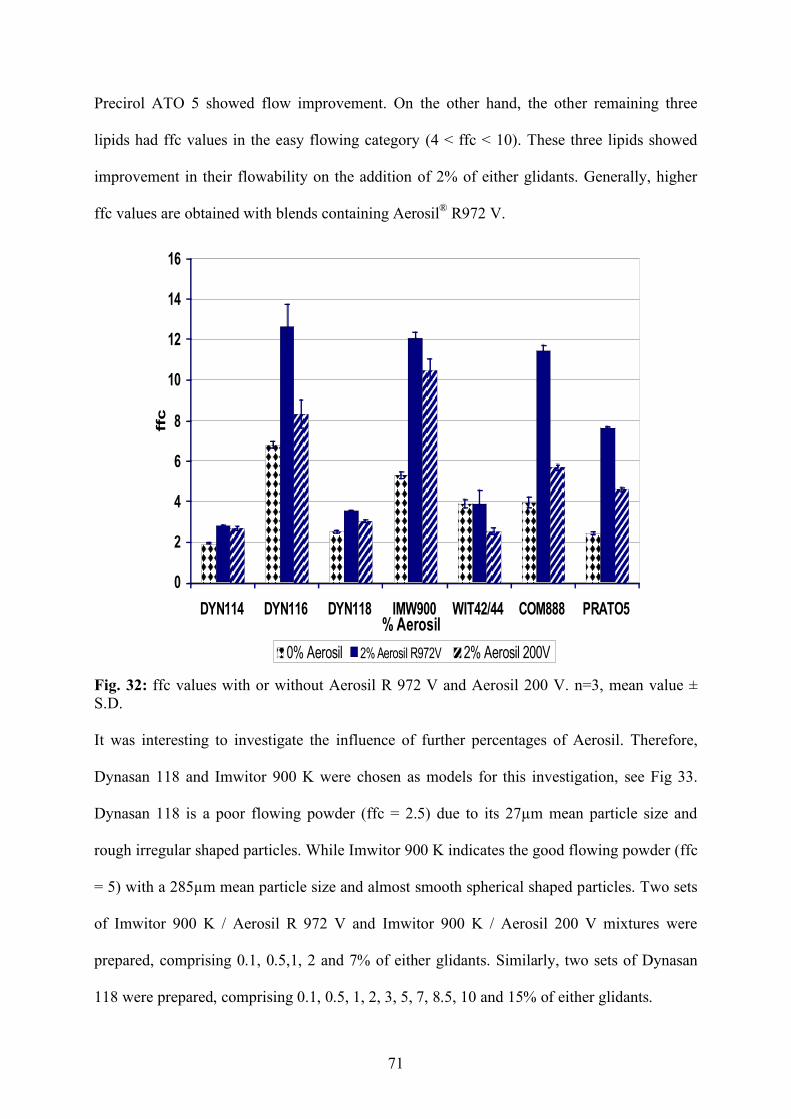
71
Precirol ATO 5 showed flow improvement. On the other hand, the other remaining three
lipids had ffc values in the easy flowing category (4 < ffc < 10). These three lipids showed
improvement in their flowability on the addition of 2% of either glidants. Generally, higher
ffc values are obtained with blends containing Aerosil® R972 V.
0
2
4
6
8
10
12
14
16
DYN114 DYN116 DYN118 IMW900 WIT42/44 COM888 PRATO5% Aerosil
ffc
0% Aerosil 2% Aerosil R972V 2% Aerosil 200V
Fig. 32: ffc values with or without Aerosil R 972 V and Aerosil 200 V. n=3, mean value ± S.D. It was interesting to investigate the influence of further percentages of Aerosil. Therefore,
Dynasan 118 and Imwitor 900 K were chosen as models for this investigation, see Fig 33.
Dynasan 118 is a poor flowing powder (ffc = 2.5) due to its 27µm mean particle size and
rough irregular shaped particles. While Imwitor 900 K indicates the good flowing powder (ffc
= 5) with a 285µm mean particle size and almost smooth spherical shaped particles. Two sets
of Imwitor 900 K / Aerosil R 972 V and Imwitor 900 K / Aerosil 200 V mixtures were
prepared, comprising 0.1, 0.5,1, 2 and 7% of either glidants. Similarly, two sets of Dynasan
118 were prepared, comprising 0.1, 0.5, 1, 2, 3, 5, 7, 8.5, 10 and 15% of either glidants.
72
0
2
4
6
8
10
12
14
16
18
20
0 2 4 6 8 10 12 14 16
% Aerosil
ffc
Dynasan118/Aerosil R 972 V
Dynasan118/Aerosil 200 V
Imwitor 900 K/Aerosil R 972 V
Imwitor 900 K/Aerosil 200 V
Fig 33: ffc values of Dynasan 118 and Imwitor 900K versus percentages of Aerosil R 972V and Aerosil 200V, n=3, mean ± S.D. (for some samples the standard deviation was smaller than the size of the symbol)
As mentioned in section 3.3 Aerosil is used as a flowability enhancer and yielded maximum
ffc values with concentrations between 0.5 & 1% further increase led to either a decreased or
constant ffc values. In this study Imwitor showed an initial flow improvement with 1%
Aerosil R 972 V and 2% Aerosil 200 V. Further increase in the glidants amount up to 7%
Aerosil concentrations led to further flow improvement with ffc values above 10. On the
contrary, Dynasan 118 showed no significant improvement in its flowability with glidant
concentration up to a 7%, where only ffc values around 4 were recorded. Further increase in
glidant concentration up to 15% showed surprisingly flow improvement only with the
hydrophilic glidant referred to with an ffc value equal approximately 6.

73
Generally, Fig 33 shows that Imwitor 900 K / Aerosil 200 V mixtures showed lower ffc
values compared to Imwitor 900 K / Aerosil R 972 V mixtures. In case of Dynasan 118
mixtures with both glidants, the values were almost overlapping except at very high
percentages, namely 15% of either Aerosil types.
3.4.2.2 SEM
Compritol and Precirol are spray dried [74, 75, 76] products with mean particle sizes 47 and
42µm respectively. They are characterized with their almost smooth spherical shapes, as
observed from the SEM micrographs (Fig.33). Compritol has a smoother surface compared to
Precirol which shows some roughness on its surface. Comparable to these products is
Imwitor, which is also spherical in shape with a mean particle size 285µm and shows
roughness on its surface. Regarding the three Dynasans used in this study they are all irregular
in shape. The Dynasan 114 with its smallest particle size 20µm has the roughest surface
among them, where it looks like agglomerated flakes. However, although Dynasan 118 and
116 have remarkably different particle sizes 27µm and 580µm respectively, their surfaces
almost look the same. Finally Witocan with its 112µm has also an irregular shape in the form
of almost spherical agglomerates. To avoid any discrepancies or misleading results it has to be
mentioned that not all the SEM micrographs reflect the actual mean particle size of some of
the lipids, for example; despite it has been mentioned that Dynasan 116 has a mean particle
size about 580µm the particle in the micrograph considering Dynasan 116 is almost 5 times
smaller than the actual particle size.

74
Witocan 42/44
Dynasan 114 Dynasan 116
Fig.33: SEM micrographs of all lipids used in this study (different magnification)
Precirol ATO 5 Compritol 888 ATO
Dynasan 118
Imwitor 900 K
75
3.4.2.3 BET
The specific surface area of the lipids was measured using the BET method, depending on the
gas adsorption phenomenon. As shown in figure 37 it was observed that the ffc values of the
lipids in the absence or presence of 2% of either Aerosil types decreased as their specific
surface area increased. The decrease of the ffc values is more profound at lower specific
surface areas. Probably that is related to the degree of coverage of the particles with Aerosil.
The glidant plays its intended role only when it reaches an optimum coverage degree on the
particles surface, where the least adhesive forces are established. Lower ffc values were
measured with hydrophilic Aerosil. This could be elucidated by the difference in the chemical
nature of both glidants, where one of which has more silanol moieties compared to the other
i.e.; hydrophilic type. Therefore, hydrogen bonds are dominant between agglomerates
rendering them stable and not easily broken. On the other hand, treatment of the silanol
groups with organosilicon compounds to create the hydrophobic silica renders its
agglomerates softer, due to lacking the strong hydrogen bonds responsible for the stability of
the agglomerates formed. In other words the softer agglomerates of hydrophobic Aerosil are
easily broken during the mixing process and are available for particles coverage. The specific
surface area of Dynasan 116 and Witocan 42/44 could not be measured due to their large
particle size and their very small surface areas.
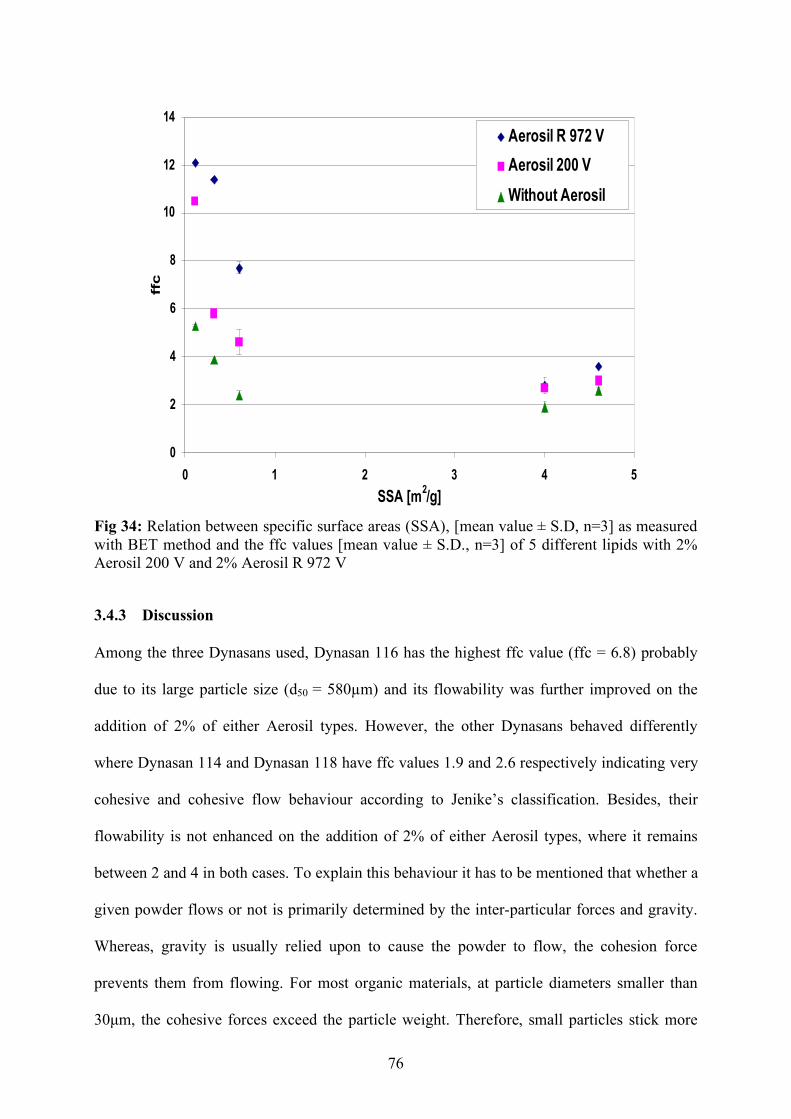
76
0
2
4
6
8
10
12
14
0 1 2 3 4 5
SSA [m2/g]
ffc
Aerosil R 972 V
Aerosil 200 V
Without Aerosil
Fig 34: Relation between specific surface areas (SSA), [mean value ± S.D, n=3] as measured with BET method and the ffc values [mean value ± S.D., n=3] of 5 different lipids with 2% Aerosil 200 V and 2% Aerosil R 972 V
3.4.3 Discussion
Among the three Dynasans used, Dynasan 116 has the highest ffc value (ffc = 6.8) probably
due to its large particle size (d50 = 580µm) and its flowability was further improved on the
addition of 2% of either Aerosil types. However, the other Dynasans behaved differently
where Dynasan 114 and Dynasan 118 have ffc values 1.9 and 2.6 respectively indicating very
cohesive and cohesive flow behaviour according to Jenike’s classification. Besides, their
flowability is not enhanced on the addition of 2% of either Aerosil types, where it remains
between 2 and 4 in both cases. To explain this behaviour it has to be mentioned that whether a
given powder flows or not is primarily determined by the inter-particular forces and gravity.
Whereas, gravity is usually relied upon to cause the powder to flow, the cohesion force
prevents them from flowing. For most organic materials, at particle diameters smaller than
30µm, the cohesive forces exceed the particle weight. Therefore, small particles stick more
77
strongly together [5]. Also mentioned by [17] that the amplitude of the interaction forces
becomes dominating compared to the weight of the particles when the size of the particles
decreases. So the small particle size of Dynasan 114 (d50 = 20µm) and Dynasan 118
(d5 0 = 27µm) is responsible for their poor flow behaviour, on the contrary to the flow
behaviour of Dynasan 116 with its larger particle size. Regarding the insignificant flow
enhancement on the addition of 2% of either Aerosil types, probably the specific surface area,
shape and surface roughness play the major role in this behaviour. That may be explained
with the degree of coverage of the particles with the glidant [5, 55, 77] or density of coverage
as referred to in other literature [40]. Observing figure 37 makes it obvious that the ffc
decreases in the presence of 2% glidant as the specific surface area increases. In other words
the 2% of glidant considered sufficient to obtain an optimum degree of coverage and improve
flow behaviour of a powder with low specific surface area, is not sufficient to improve
flowability of Dynasan 114 and Dynasan 118 with their high specific surface areas ranging
from 4 to 4.7m2/g. Besides, their large specific surface area Dynasan 114 and Dynasan 118
have irregular shapes and rough surfaces, especially Dynasan 114 with its agglomerated
flakes like surface. The roughness in these particles surfaces may be the cause of the glidants
entrapment in grooves and unevenness of the particles, making the amount of glidant
available insufficient as a flowability enhancer. Furthermore, Dynasan 118 was taken as a
model for a poor flowing lipid to investigate the optimum percentage of glidant required for
improving its flow behaviour. Percentages up to 15% of both Aerosil types were used. Easy
flowing powders were surprisingly achieved with the hydrophilic Aerosil. Considering that
Dynasans are triglycerides of saturated fatty acids (see Table 4, section 3.4.2.1) and their
hydrophobic nature, they lack the ability to form strong hydrogen bonds between their surface
and the Aerosil agglomerates.
Witocan 42/44 is also a triglyceride with its 112µm irregular shape or agglomerated particles
(agglomerated spheres) and has an ffc = 3.9. The addition of 2% Aerosil R 972 V did not
78
improve the flowability, that would be expected due to the irregular shape characterising this
powder where the grooves and cavities would be a good trap for the hydrophobic Aerosil.
Surprisingly, a decrease in the flowability (even less than the ffc value obtained with pure
Witocan) occurred on the addition of 2% Aerosil 200 V. The possible explanation for such a
decrease in ffc could be related to the melting point of Witocan (where it has the lowest
melting point among the used lipids, see table 8 in section 6.1.4) and the fact that these
experiments were carried out in summer time, mentioning that the mixing process was carried
out in an unconditioned room.
Precirol ATO 5 which is a spray dried product with its 42µm spherical particles has an ffc
value = 2.4. This product showed improved flowability on the addition of 2% of either
Aerosil types, reaching a maximum ffc of approx. 8 on addition of Aerosil R972 V. This
improvement could be referred to its small surface area (0.6m2/g) and smooth surface and its
nature as a partial glyceride comprising 40-60% diglycerides, consequently offering a high
density of hydroxyl groups on its surface to attract the Aerosil by hydrogen bonds leading to a
sufficient glidant degree of coverage. The other three lipids Dynasan116, Imwitor 900 K and
Compritol 888 ATO have ffc values equal or higher than 4, i.e. they are easy flowing powders
with 6.8, 5.3 and 3.9 ffc values respectively. Their flowability is improved on the addition of
glidants reaching the free flowing ffc ranges ≥ 10 with Aerosil R 972 V. All three powders
reached free flowing ffc ranges with hydrophobic types while only Imwitor 900 K reaches
such ranges with the hydrophilic type as well, probably due to its large spherical particles as
well as its nature as a partial triglyceride comprising 40-55% monoglycerides, offering higher
density of hydroxyl group compared to the other two products to form hydrogen bonds with
Aerosil agglomerates. However, Imwitor 900 K was used as an easy flowing lipid excipients
model to investigate percentages of glidants required to further enhancing its flow behaviour.
As shown in figure 35 the ffc values proceed to increase on the addition of 1% of the
hydrophobic type and 2% of the hydrophilic type. Further increase of glidants percentage up
79
to 7% led to ffc values higher than 10, statistically the results at this concentration overlap
with each other due to the fluctuation of the results with ffc values higher than 10. However, it
was observed that hydrophobic glidants are better flow enhancers compared to hydrophilic
glidants, in agreement with previous literature [5, 40, 57, 77, 78].
Generally, with most pharmaceutical excipients Aerosil concentrations between 0.2% and 1%
are sufficient to establish flow improvement. A maximum flow improvement is achieved at
0.5% further increase in concentration up to 2% causes decrease in flowability (see section
3.2). On the other hand the lipids showed a different behaviour compared to other
pharmaceutical substances. The easy flowing lipids required percentages of silicon dioxide
higher than 0.5% to achieve the intended flow improvement for example; Imwitor 900 K
which showed continuous flow improvement on addition of 1, 2 and 7% Aerosil. However,
the poor flowing lipids showed two different behaviours as observed in this study. They either
showed significant flow improvement with an Aerosil concentration equal 2% - believed to
decrease flowability of other substances as seen in section 3.2 - (see Fig. 32) for example;
Precirol ATO 5, or they showed no flow improvement even with very high concentrations of
Aerosil, i.e. up to 15%, for example: Dynasan 118. Generally, glidants play their role first
when reaching an optimum degree of coverage, above it or beneath it the glidant loses its flow
enhancing and improving property. The specific surface area, particle size, shape and surface
roughness play a great role on the flow enhancing property of the glidants. Comparing the
influence of Aerosil on the flow behaviour of lipids in this study with those observed in
section 3.2 (influence of Aerosil on flow behaviour of Paracetamol) it may be high-lighted
that besides the specific surface area, shape, size and surface morphology of substances, the
hydrophobic nature of lipids plays an important role on the flow enhancing property of the
glidant. This role differs from one lipid to another according to its degree of hydrophobicity.

80
4 Summary
The assessment of flowability of powdered materials in the pharmaceutical industry is a
crucial step and a prerequisite for a cheap, successful and non-time consuming production. In
this work a ring shear tester was employed as a tool for the quantitative evaluation and
assessment of the flowability of pharmaceutical substances and mixtures. The flowability (ffc)
is represented as the ratio of the consolidation stress to the unconfined yield strength. The
larger the ffc is, the better a bulk solid flows. A comparison between the large (RST-01.pc) and
small (RST-XS) Schulze testers was carried out. Regardless the differences in composition, size
and shape of the substances examined, comparing the ffc values of both testers showed that the
results were well correlated with a correlation coefficient, r = 0.97. However, the smaller tester
showed slightly lower ffc values compared to the larger tester. For comparative tests this effect
did not play a role as long as the same ring shear tester with the same shear cell size was used
throughout the measurements.
The influence of different types of Aerosil® on the flowability of Paracetamol was
investigated by means of the ring shear tester. Other conventional easy applicable methods
were also employed such as; angle of repose, Hausner ratio and flow rate. It was observed that
the ffc values increased with the increase of Aerosil® percentage, and then they either
decreased or remained constant with further increase in percentage. Aerosil percentage about
0.5% was enough to achieve a maximum flow improvement. The angle of repose decreased as
we increased the percentage of Aerosil®. The angles of repose values were inversely
proportional to the ffc values. The Hausner ratio did not show agreeable results to those of the
ffc. The flow rate also could not be measured for all samples, and even the samples measured
did not reveal any general trend. As a conclusion the ring shear tester can be applied as a
quantitative comparative test to replace other inaccurate and operator influenced conventional
methods. Besides, it was observed that the capsules containing different types and percentages
of Aerosil possessed lower relative standard deviation values (RSD) compared to capsules
81
filled with Paracetamol alone. The capsules containing Aerosil® showed higher fill weights
compared to capsules filled with paracetamol alone, where Aerosil® reduces the
interparticulate forces between paracetamol particles which consequently move closer
reducing the space between each other and obtaining higher densities and fill weights.
However, plotting the RSD versus the ffc showed that all samples prepared with Aerosil®,
which have higher ffc values, showed lower RSD values with lower scattering values
compared to those prepared with Paracetamol alone.
Also the flow behaviour of binary mixtures was investigated. It was found that the flow
profiles (the graphical presentation of the ffc values versus the percentage of the free flowing
component in the mixture) for almost all mixtures examined were represented with two curve
sections. The first section indicating the slight improvement in flowability at low
concentrations of the free flowing component until reaching a concentration (the point of
intersection between the two curve sections), after which a significant flowability
improvement - represented with the second curve section - was noticed with the further
addition of the free flowing component. In such mixtures the bulk properties of the fine poor
flowing components dominated the flow behaviour of the binary mixtures. The intersection
point differed from a mixture to another according to the particle sizes and shapes involved in
the mixtures. On the other hand mixtures with Paracetamol as the fine poor flowing
component were represented with only one curve indicating the flow improvement on the
addition of very small concentrations of the free flowing component i.e.; about 20 % V/V free
flowing component. However, in these mixtures the flow behaviour of the free flowing
components dominated the flow behaviour of the binary mixture. Regarding the packing
behaviour of the mixtures two profiles were noticed according to the shape of the fine poor
flowing component in the mixture. Mixtures comprising fine spherical or irregular shaped
components showed a profile with a maximum packing density, after which the density
decreased with the further increase of percentage of free flowing component. Mixtures
82
comprising fine needle or rod shaped components yielded a profile without a maximum
packing density. In the second profile the densities are additive and can be predicted from the
densities and volume fractions of the binary mixture components. Generally it can be
concluded that the flowability of the binary mixtures was influenced by the shape and size of
both components and whether the binary mixture achieved a maximum packing density or did
not was influenced mainly by the shape of the fine component in the binary mixtures.
However, the concentration at which maximum packing occurred depended on both
parameters of each component.
The flow behaviour of lipids in the presence and absence of Aerosil® was also examined.
Most pharmaceutical substances investigated in this work established a maximum flow
improvement with only 0.5% Aerosil, while lipids showed a different behaviour. The easy
flowing lipids (ffc > 4) required percentages of Aerosil higher than 0.5% to achieve the
intended flow improvement. However, the poor flowing lipids (ffc < 4) showed two different
behaviours as observed in this study. They either showed significant flow improvement with
2% Aerosil (believed to decrease flowability of other substances as seen in paracetamol
section), or did not show flow improvement even with very high concentrations of Aerosil
i.e.; up to 15%. Comparing the influence of Aerosil on the flow behaviour of lipids with those
observed in section 3.2 (influence of Aerosil on flow behaviour of Paracetamol), it may be
high-lighted that besides the specific surface area, shape, size and surface morphology of
substances, the hydrophobic nature of lipids plays an important role on the flow enhancing
property of the glidant. This role differs from one lipid to another according to its degree of
hydrophobicity.
83
5 Zusammenfassung der Arbeit
Die Bewertung der Fließfähigkeit von pulverförmigen Materialien in der pharmazeutischen
Industrie ist ein wichtiger Schritt und eine Voraussetzung für eine kostengünstige,
erfolgreiche und zeitsparende Produktion. In dieser Arbeit wurde ein Ringschergerät für die
quantitative Beurteilung der Fließfähigkeit von pharmazeutischen Wirkstoffen und
Mischungen eingesetzt. Die Fließfähigkeit (ffc) beschreibt das Verhältnis der
Verfestigungsspannung zur Schüttgutfestigkeit. Je größer ffc ist, desto besser fließt ein
Schüttgut. Ein Vergleich zwischen großem (RST-01.pc) und kleinem (RST-XS) Schulze-
Ringschergerät wurde durchgeführt. Ungeachtet der Unterschiede in Zusammensetzung,
Größe und Form der untersuchten Substanzen korrelierten die mit den beiden
Ringschertestgeräten gewonnenen ffc-Werte (Korrelationskoeffizient r = 0,97). Im Vergleich
mit dem größeren Tester führte der kleinere Tester zu etwas niedrigeren ffc-Werten. Für
vergleichende Untersuchungen spielte dieser Effekt keine Rolle, solange das gleiche
Ringschergerät mit der gleichen Scherzelle während der Messungen benutzt wurde.
Der Einfluss verschiedener Aerosil®-Typen auf die Fließfähigkeit von Paracetamol wurde mit
dem Ringschergerät untersucht. Andere konventionelle, einfach anwendbare Methoden
wurden ebenfalls durchgeführt, zum Beispiel Böschungswinkel, Hausner-Faktor und
Fließgeschwindigkeit. Es wurde festgestellt, dass die ffc-Werte mit Zunahme der Aerosil®-
Konzentration anstiegen und dann bei weiterer Erhöhung des Aerosil®-Anteils entweder
wieder absanken oder konstant blieben. Ein Anteil von etwa 0,5% Aerosil® war ausreichend,
um eine maximale Verbesserung der Fließfähigkeit zu erreichen. Der Böschungswinkel nahm
mit zunehmendem Aerosil®-Anteil ab. Die Werte des Böschungswinkels waren umgekehrt
proportional zu den ffc-Werten. Die Ergebnisse des Hausner-Faktors zeigten keine
Übereinstimmung mit den ffc-Werten. Die Fließgeschwindigkeit durch einen Trichter konnte
nicht für alle Proben gemessen werden, und auch die Proben, die gemessen werden konnten,

84
zeigten keinen einheitlichen Trend. Das Ringschergerät kann als eine quantitativ
vergleichende Prüfmethode verwendet werden, um andere ungenaue und vom Anwender
beeinflusste konventionelle Methoden zu ersetzen. Außerdem wurde beobachtet, dass die
Masse von Kapseln, die Aerosil® unterschiedlichen Typs und Konzentration enthielten,
niedrigere relative Standardabweichungen (RSD) im Vergleich zu Kapseln aufwiesen, die nur
mit Paracetamol gefüllt waren. Die Aerosil® enthaltenden Kapseln zeigten höhere
Füllgewichte als mit reinem Paracetamol gefüllte. Aerosil® reduziert die interpartikulären
Kräfte zwischen den Paracetamol-Partikeln, die sich folglich näher aufeinander zu bewegen
und raus höhere Dichten und Füllgewichte resultieren. Die Auftragung der RSD % gegen ffc
zeigte, dass alle Proben, die Aerosil® enthielten und höhere ffc-Werte aufwiesen, niedrige
RSD% mit einer geringeren Streuung im Vergleich zu Proben aus reinem Paracetamol
ergaben.
Auch das Fließverhalten von binären Mischungen wurde untersucht. Es wurde festgestellt,
dass die Fließprofile (grafische Darstellung der ffc-Werte gegen den Anteil an frei fließender
Komponente in der Mischung) für fast alle untersuchten Mischungen durch eine Kurve mit
zwei Kurvenabschnitten dargestellt werden konnten. Der erste Abschnitt zeigte eine leichte
Verbesserung der Fließfähigkeit bei niedrigen Konzentrationen der frei fließenden
Komponente bis zum Erreichen einer bestimmten Konzentration (der Schnittpunkt zwischen
den beiden Kurvenabschnitten), nach der eine erhebliche Verbesserung der Fließfähigkeit -
dargestellt durch den zweiten Kurvenabschnitt - mit weiterer Erhöhung der frei fließenden
Komponente festgestellt wurde. In solchen Mischungen dominierten die
Haufwerkseigenschaften der schlecht fließenden Komponenten das Fließverhalten der binären
Mischungen. Die Lage des Schnittpunkts unterschied sich von einer Mischung zur anderen in
Abhängigkeit von den Partikelgrößen und -formen der komponenten. Auf der anderen Seite
zeigten Mischungen mit Paracetamol als feine schlecht fließende Komponente nur einen
Kurvenabschnittt. Diese Mischungen zeigten bereits eine Fließverbesserung durch den Zusatz

85
geringer Mengen der frei fließenden Komponente (um 20% V/V). In diesen Mischungen
dominierte das Fließverhalten der frei fließenden Komponenten das Fließverhalten der
binären Mischung. In Bezug auf die Packungsdichte der Mischung wurden zwei Profile in
Abhängigkeit von der Form der feinen schlecht fließenden Komponente in der Mischung
erhalten. Mischungen aus feinen sphärischen oder unregelmäßig geformten Bestandteilen
ergaben ein Profil mit einen Maximum der Packungsdichte, nach dem die Dichte mit
weiterem Anstieg des Anteils der frei fließenden Komponente abnahm. Die Mischungen aus
feinen nadel- oder stäbchenförmigen Komponenten zeigten kein Maximum in der
Packungsdichte. In diesem Fall waren die Dichten additiv und konnten aus den Dichten und
Volumenanteilen der binären Mischungskomponenten vorhergesagt werden. Generell kann
festgestellt werden, dass die Fließfähigkeit der binären Mischungen durch die Form und
Größe der beiden Komponenten der binären Mischung beeinflusst wurde. Ob die binären
Mischungen eine maximale Packungsdichte erreichten oder nicht war vor allem durch die
Form der feinen Komponente in den binären Mischungen bedingt. Die Konzentration, bei der
maximale Packungsdichte auftrat, hing von beiden Parametern der einzelnen Komponenten
ab.
Das Fließverhalten von Lipiden in An- und Abwesenheit von Aerosil® wurde ebenfalls
untersucht. Die pharmazeutischen Substanzen, die in dieser Arbeit untersucht wurden,
erreichten eine maximale Fließverbesserung mit nur 0,5% Aerosil®. Die Lipide zeigten ein
anderes Verhalten. Die gut fließenden Lipide (ffc > 4) benötigten Prozentsätze von mehr als
0,5% Aerosil®, um eine vorgesehene Fließverbesserung zu erreichen. Die schlecht fließenden
Lipide (ffc < 4) zeigten zwei verschiedene Verhaltensweisen. Sie zeigten entweder eine
signifikante Fließverbesserung mit 2% Aerosil®, oder sie zeigten keine Verbesserung auch bei
sehr hohen Konzentrationen (bis zu 15%) von Aerosil®. Vergleicht man den Einfluss von
Aerosil® auf das Fließverhalten von Lipiden mit dem auf Paracetamol (Abschnitt 3.2), kann
festgestellt werden, dass neben der spezifischen Oberfläche, Form, Größe und Morphologie

86
der Oberfläche von Stoffen die hydrophobe Natur der Lipide eine wichtige Rolle für die
Verbesserung der Fließfähigkeit durch Fließregulierungsmittel spielt. Der Einfluss des
Fließregulierungsmittel unterscheidet sich von einem Lipid zu einem anderen bedingt durch
den Grad der Hydrophobie.

87
6 Experimental Part
6.1 Materials
6.1.1 Active ingredients
Three active ingredients were used through out this work, as mentioned before in Table 3 in
section 3.3.2. Further information is mentioned in the following table.
Table 5: Further information about active ingredients used in this work
Substance Generic Name Manufacturer Batch-No. Structure
Mesalazine Mesalazine Ferring
Copenhagen/Denmark KD2026
Paracetamol Paracetamol Atabay
Istanbul/Turkey 2703151
Praziquantel Praziquantel Bayer AG
Leverkusen/Germany KP04WXZ01

88
6.1.2 Excipients
Six excipients were used through out this work, as mentioned before in Table 3 in section
3.3.2. Further information is mentioned in the following table.
Table 6: Further information about excipients used in this work
Substance Generic Name Manufacturer Batch-No. Comment
Flowlac 100 α-Lactose monohydrate
Meggle AG
Wasserburg/Germany
L0605 A4921
Spray dried lactose
Inhalac 230 α-Lactose monohydrate
Meggle AG
Wasserburg/Germany 0345 Sieved
lactose
Granulac 200
α-Lactose monohydrate
Meggle AG
Wasserburg/Germany
L0532 A4172
Milled lactose
Di-Cafos Dicalcium phosphate dihydrate
Budenheim KG
Budenheim/Germany 0036997
Fine granulated
calcium phosphates
Dicafos PAF
Dicalcium phosphate anhydrous
Budenheim KG
Budenheim/Germany A59165B
Powdered calcium
phosphates
Starch Starch Cargill
Krefeld/Germany 1102159 Corn starch
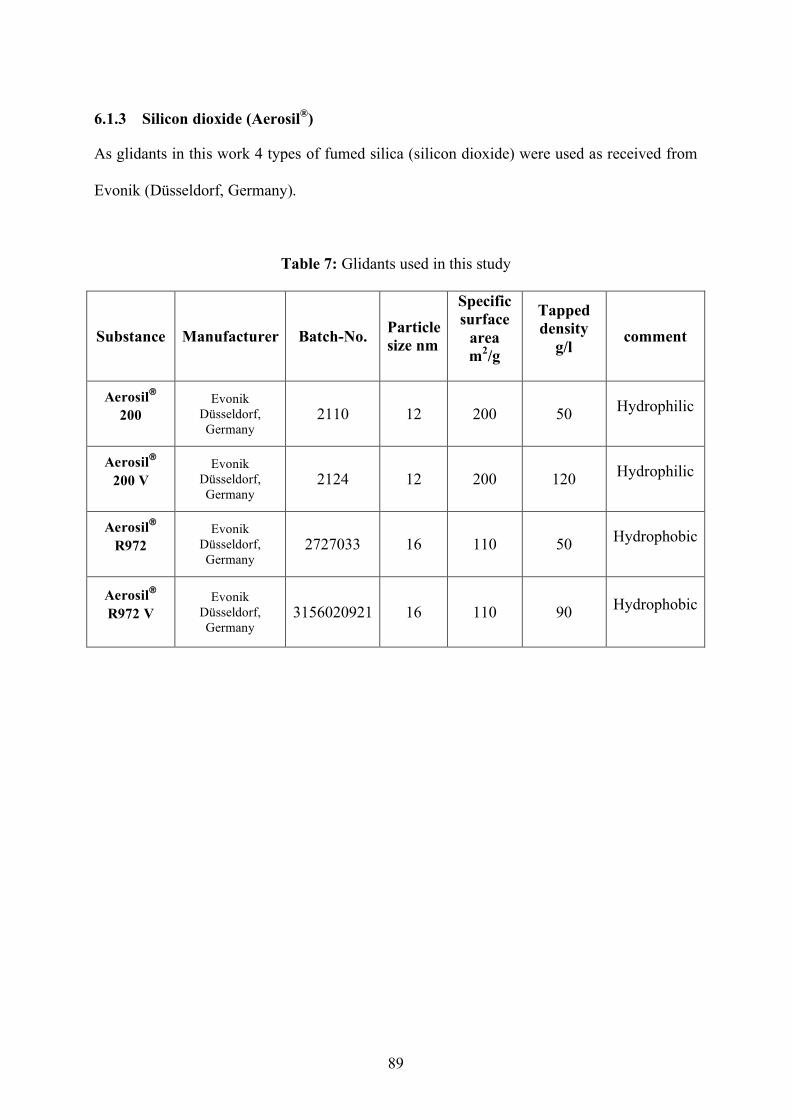
89
6.1.3 Silicon dioxide (Aerosil®)
As glidants in this work 4 types of fumed silica (silicon dioxide) were used as received from
Evonik (Düsseldorf, Germany).
Table 7: Glidants used in this study
Substance Manufacturer Batch-No. Particle size nm
Specific surface
area m2/g
Tapped density
g/l comment
Aerosil® 200
Evonik Düsseldorf, Germany
2110 12 200 50 Hydrophilic
Aerosil® 200 V
Evonik Düsseldorf, Germany
2124 12 200 120 Hydrophilic
Aerosil® R972
Evonik Düsseldorf, Germany
2727033 16 110 50 Hydrophobic
Aerosil® R972 V
Evonik Düsseldorf, Germany
3156020921 16 110 90 Hydrophobic
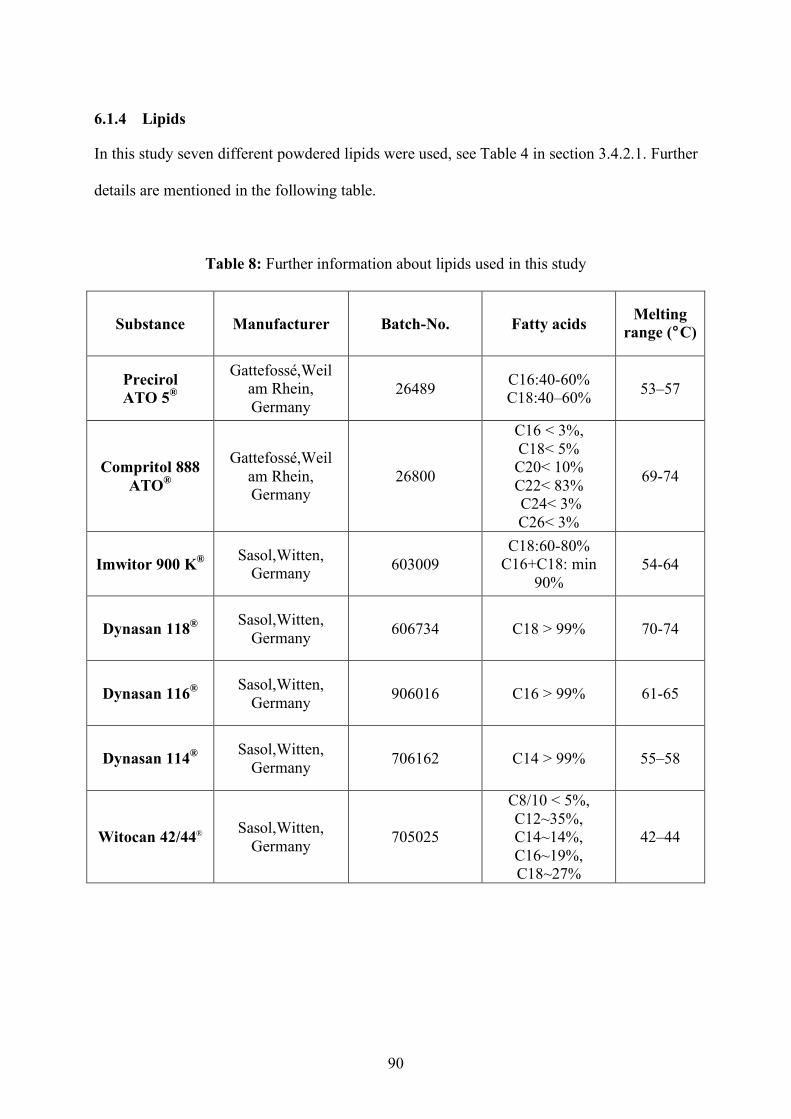
90
6.1.4 Lipids
In this study seven different powdered lipids were used, see Table 4 in section 3.4.2.1. Further
details are mentioned in the following table.
Table 8: Further information about lipids used in this study
Substance Manufacturer Batch-No. Fatty acids Melting range (°C)
Precirol ATO 5®
Gattefossé,Weil am Rhein, Germany
26489 C16:40-60% C18:40–60% 53–57
Compritol 888 ATO®
Gattefossé,Weil am Rhein, Germany
26800
C16 < 3%, C18< 5% C20< 10% C22< 83% C24< 3% C26< 3%
69-74
Imwitor 900 K® Sasol,Witten, Germany 603009
C18:60-80% C16+C18: min
90% 54-64
Dynasan 118® Sasol,Witten, Germany 606734 C18 > 99% 70-74
Dynasan 116® Sasol,Witten, Germany 906016 C16 > 99% 61-65
Dynasan 114® Sasol,Witten, Germany 706162 C14 > 99% 55–58
Witocan 42/44® Sasol,Witten, Germany 705025
C8/10 < 5%, C12~35%, C14~14%, C16~19%, C18~27%
42–44
91
6.2 Methods
6.2.1 Samples preparation
For all methods the blending process was carried out using a Turbula mixer (T10B, W. A.
Bachofen AG, Basel, Switzerland) with a rotational speed of 42 rpm. Mixing was carried out
in an unconditioned room. However, the measuring procedures and sample’s storage took
place in a conditioned room, 21°C and 45% relative humidity.
6.2.1.1 Paracetamol / Aerosil mixtures
Based on preliminary investigations, the Aerosil®concentration was set to 0.1, 0.5 and 2%
w/w. The Aerosil® was screened through a 315µm sieve before combined with the
Paracetamol. First of all half the amount of Paracetamol was weighed directly in the mixing
container then the amount of Aerosil required was added before adding the remaining amount
(other half) of Paracetamol weighed. The powders were mixed for 30 minutes in a turbula
mixer using a 1L container, and a maximum filling degree of 75%. The samples were stored
over night in a conditioned room 21º C and 45% RH and measured on the next day under the
same conditions.
6.2.1.2 Binary mixtures
The binary mixtures were prepared by first weighing the free flowing powder directly in a 1L
container and then the amount of the poor flowing substance was added. These substances
were mixed in the turbula mixer for 15 minutes then stored over night in a conditioned room
21º C and 45% RH. Eleven different concentrations were prepared from each binary mixture.
The concentration was calculated on volume to volume bases.
6.2.1.3 Lipids / Aerosil mixtures
Similar to Paracetamol/Aerosil mixtures, half the amount of lipid was weighed directly in the
mixing container then the sieved amount of Aerosil required was added before adding the
remaining amount (other half) of lipid weighed. The powders were mixed for 15 minutes in a
92
turbula mixer using a 1L container, and a maximum filling degree of 75%. The samples were
stored over night in a conditioned room 21º C and 45% RH and measured on the next day
under the same conditions.
6.2.2 Ring shear tester
The flowability was determined using fully automated Schulze ring shear testers. Two types
where used in this work a RST-01.pc (200cm3) and RST-XS (30cm3) (Dr. Dietmar Schulze
Schuettgutmesstechnik, Wolfenbuettel, Germany). More details about these testers were
mentioned in section 1.2. The powder was packed gently in the annular trough and the excess
material on the surface was removed and the surface was smoothed using a scraper without
applying any stress to the sample. The weight was determined prior to the measurement.
During the measurements the normal load of preshear was adjusted at 5000 Pa., it is the load
under which the sample is consolidated and kept in a steady state i.e; constant bulk density
and shear stress. Shearing proceeded at lower normal loads 1000, 2000, 3000, 4000 Pa
consequently. The normal stresses and determined shear stresses, where incipient flow occurs
were plotted in a σ, τ - diagram. By means of a Mohr's circles analysis a yield locus is
obtained. The ratio of the consolidation stress σ1 to the unconfined yield strength σc is called
the flowability function (ffc). The analysis of the results is performed using the software RST-
Control 95, Version 1.0 (Dr. Dietmar Schulze Schuettgutmesstechnik). For the measurements
the automatic mode of operation was used with the recommended standard settings. The yield
locus was represented as a curve consisting of straight sections (instead of a regression line).
The prorating procedure was switched on, where prorating is the mathematical procedure by
which shear stresses at shear are rated according to the ratio of the corresponding shear stress
at preshear to the yield locus mean shear stress at preshear. Slip stick detector was off with
some samples. This phenomenon is an alternating change between static and dynamic friction
which may yield inaccurate results and increase time of measurement. Shear velocity mode
was set to normal. Tolerance (accepted range of scatter of steady state flow) was increased to
93
400% in some samples. The RST-control 95 tolerates only small fluctuations for its default
settings (100%), therefore during preshear it may not recognize the steady state flow, thus
shearing will continue. So we increase the tolerance against fluctuations in order to operate in
automatic mode. The ffc was used to classify the flow behavior of bulk solids according to
Jenike´s powder classification. The mean of 2 measurements was used.
6.2.3 Poured and tapped densities According to the Ph.Eur, approximately 50 g of powder was gently poured into a tarred 250ml
graduated cylinder and the initial volume (V0) was recorded to the nearest graduated unit and
the poured density (g/ml) was calculated as the quotient m/V0. The graduated cylinder was
placed on a tap density tester (J. Engelsmann AG Tap Density Tester, Apparatebau
Ludwigshafen a. Rh.) and the volume was recorded after 10, 500 and 1250 taps, to obtain V10,
V500 and V1250 respectively. Another 1250 taps were carried out when the difference between
V500 and V1250 was greater than 2mL. The tapped density (g/ml) was expressed as the quotient
of m/V1250 or m/V2500. The Hausner ratio was calculated as follows;
H.R= ρT / ρb Equation 5
Where, ρb is the bulk density and ρT is the tapped density. Measurements were performed in
duplicate and the mean value was taken.
6.2.4 Angle of repose
It was measured according to the DIN ISO 4324/ 1983 and ISO 4324/ 1977; proceeding
according to Dr.Pfrengle. Approximately 100 g of powder is poured through a glass funnel.
The powder settles as a conical heap on a 25 mm high and 100 mm diameter transparent
plastic plate. For the poor flowing samples a stirrer was used. The angle between the slopped
surface of the conical heap and the horizontal plane is recorded as the angle of repose.
94
Lower angle of repose values represent better flow. The angle was calculated according to the
following equation;
tan ө= h/r Equation 6
Where, h is the height of the conical heap formed by the powder divided by the radius of the
plastic plate (r). Measurements were performed in triplicate and the mean value was taken.
6.2.5 Flow rate
According to the Ph. Eur. 100 g of powder is gently poured into a closed stainless steel
funnel. The funnel has three different orifice openings, namely, 10, 15 and 25 mm in
diameter. In this work the samples passed freely only through the 25 mm orifice. The orifice
is opened to allow the powder to flow. The time required for the powder to flow through the
orifice is recorded. Measurements were performed in triplicate and the mean value was taken.
6.2.6 Capsule filling
According to DAC-Anlage G-method B using a manual filling machine, powder was spread
over a tray with 30 holes containing the opened capsule bodies. Size 0 capsules (0.68ml) were
used. The capsules were filled by spreading the powder over the bodies with a scraper.
Tapping the powder manually into the capsule body was performed when required. Three
batches, 30 capsules each, were prepared from each paracetamol/Aerosil mixture and the
mean weight of content was used. Also the relative standard deviation (RSD) was calculated
for each batch and the mean RSD of three batches was used. The RSD is the standard
deviation of a batch divided by its mean multiplied by 100.
6.3 Characterisation of powders
6.3.1 Helium pycnometer density
A helium pynometer (AccuPyc 1330, Micromeritics, Norcross, Georgia, USA) was used for
the determination of the particle density. Temperature within the pycnometer was kept
95
constant during all experiments at 25 ± 0.1°C. The 10cm³ sample chamber was used. The
obtained helium density values are the mean values of three measurements.
6.3.2 Porosity
The powders porosity was calculated using the particle density (ρT) obtained by the helium
pycnometer and the bulk density (ρb) as measured with the ring shear tester (normal load
5KPa) as follows:
% Porosity = (1- ρb/ρT)*100 Equation 7
6.3.3 Laser diffractometer
The particle size measurements were determined using laser light diffraction (Helos/KF-
Magic, Sympatec GmbH, Clausthal-Zellerfeld, Germany) including a dry dispersing system
(Rodos, Sympatec GmbH, Clausthal-Zellerfeld, Germany). The powder was applied on the
Vibri feeder (Sympatec GmbH) transporting the powder to the dry dispersing system. The
atomizing air was adjusted at 2.0 bar with a feeding rate of 80%. The results were analyzed by
Windox 4.0 software (Sympatec GmbH). The value of the median (d50) is the average of three
measurements.
6.3.4 BET gas adsorption
The specific surface area of the pure materials (lipids) was determined using nitrogen gas
adsorption based on the Brunauer, Emmett and Teller (BET) method. The measurements are
carried out using the measuring device Tristar 3000 (Micromeritics GmbH Mönchengladbach,
Germany). The samples were degassed for 20 hours at 25°C using the Vac Prep 061,
Micromeritics GmbH, Mönchengladbach and their weights were recorded. After degassing the
vessels are transferred to the Tristar 3000 device and the samples are cooled with liquid
nitrogen. Nitrogen adsorption was carried out at eleven different relative pressures in the range
from 0.05 to 0.30. The saturation pressure is measured in a separate vessel. The amount of
96
nitrogen adsorbed is recorded on establishment of equilibrium at different relative pressures.
The analysis was performed using the software Win Tristar 3000 V6.00 (Micromeritics
GmbH, Mönchengladbach). The specific surface area is calculated using the BET equation.
6.3.5 SEM
Each sample was mounted on a brass pin with double sided carbon adhesive tape prior being
coated with a thin layer of gold using a sputter coater (Agar Manual Sputter Coater, Agar
Scientific Ltd., Stansted, Essex, England). The samples were sputtered with gold for 180s
under argon atmosphere. The samples morphologies were examined with a scanning electron
microscope (LEO VP 1430, Carl Zeiss NTS GmbH, Oberkochen, Germany) under vacuum
adjusting 20 kV operating voltage.
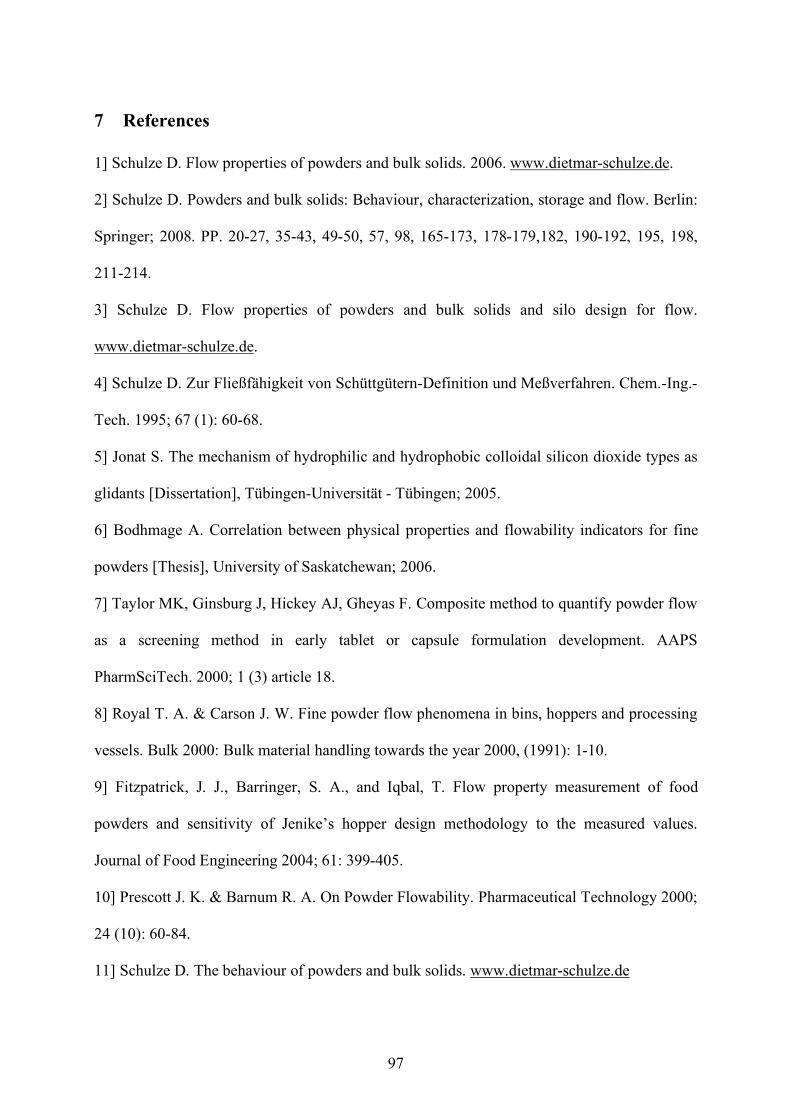
97
7 References 1] Schulze D. Flow properties of powders and bulk solids. 2006. www.dietmar-schulze.de.
2] Schulze D. Powders and bulk solids: Behaviour, characterization, storage and flow. Berlin:
Springer; 2008. PP. 20-27, 35-43, 49-50, 57, 98, 165-173, 178-179,182, 190-192, 195, 198,
211-214.
3] Schulze D. Flow properties of powders and bulk solids and silo design for flow.
www.dietmar-schulze.de.
4] Schulze D. Zur Fließfähigkeit von Schüttgütern-Definition und Meßverfahren. Chem.-Ing.-
Tech. 1995; 67 (1): 60-68.
5] Jonat S. The mechanism of hydrophilic and hydrophobic colloidal silicon dioxide types as
glidants [Dissertation], Tübingen-Universität - Tübingen; 2005.
6] Bodhmage A. Correlation between physical properties and flowability indicators for fine
powders [Thesis], University of Saskatchewan; 2006.
7] Taylor MK, Ginsburg J, Hickey AJ, Gheyas F. Composite method to quantify powder flow
as a screening method in early tablet or capsule formulation development. AAPS
PharmSciTech. 2000; 1 (3) article 18.
8] Royal T. A. & Carson J. W. Fine powder flow phenomena in bins, hoppers and processing
vessels. Bulk 2000: Bulk material handling towards the year 2000, (1991): 1-10.
9] Fitzpatrick, J. J., Barringer, S. A., and Iqbal, T. Flow property measurement of food
powders and sensitivity of Jenike’s hopper design methodology to the measured values.
Journal of Food Engineering 2004; 61: 399-405.
10] Prescott J. K. & Barnum R. A. On Powder Flowability. Pharmaceutical Technology 2000;
24 (10): 60-84.
11] Schulze D. The behaviour of powders and bulk solids. www.dietmar-schulze.de
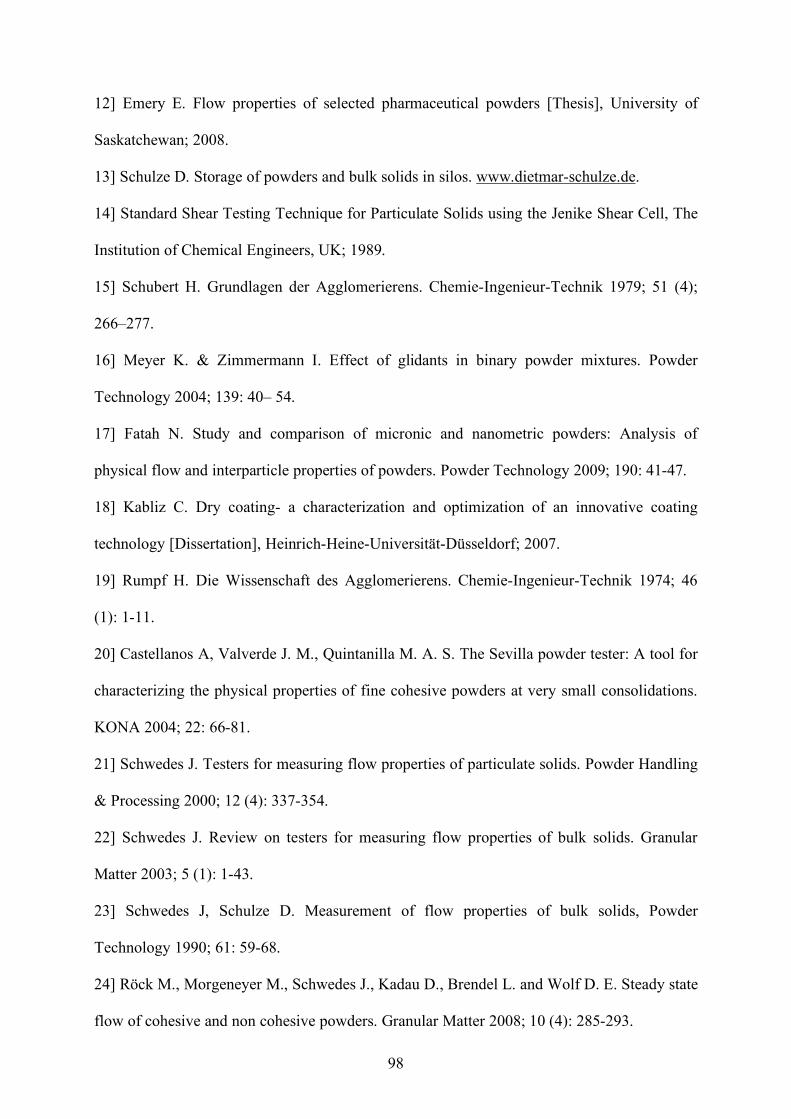
98
12] Emery E. Flow properties of selected pharmaceutical powders [Thesis], University of
Saskatchewan; 2008.
13] Schulze D. Storage of powders and bulk solids in silos. www.dietmar-schulze.de.
14] Standard Shear Testing Technique for Particulate Solids using the Jenike Shear Cell, The
Institution of Chemical Engineers, UK; 1989.
15] Schubert H. Grundlagen der Agglomerierens. Chemie-Ingenieur-Technik 1979; 51 (4);
266–277.
16] Meyer K. & Zimmermann I. Effect of glidants in binary powder mixtures. Powder
Technology 2004; 139: 40– 54.
17] Fatah N. Study and comparison of micronic and nanometric powders: Analysis of
physical flow and interparticle properties of powders. Powder Technology 2009; 190: 41-47.
18] Kabliz C. Dry coating- a characterization and optimization of an innovative coating
technology [Dissertation], Heinrich-Heine-Universität-Düsseldorf; 2007.
19] Rumpf H. Die Wissenschaft des Agglomerierens. Chemie-Ingenieur-Technik 1974; 46
(1): 1-11.
20] Castellanos A, Valverde J. M., Quintanilla M. A. S. The Sevilla powder tester: A tool for
characterizing the physical properties of fine cohesive powders at very small consolidations.
KONA 2004; 22: 66-81.
21] Schwedes J. Testers for measuring flow properties of particulate solids. Powder Handling
& Processing 2000; 12 (4): 337-354.
22] Schwedes J. Review on testers for measuring flow properties of bulk solids. Granular
Matter 2003; 5 (1): 1-43.
23] Schwedes J, Schulze D. Measurement of flow properties of bulk solids, Powder
Technology 1990; 61: 59-68.
24] Röck M., Morgeneyer M., Schwedes J., Kadau D., Brendel L. and Wolf D. E. Steady state
flow of cohesive and non cohesive powders. Granular Matter 2008; 10 (4): 285-293.
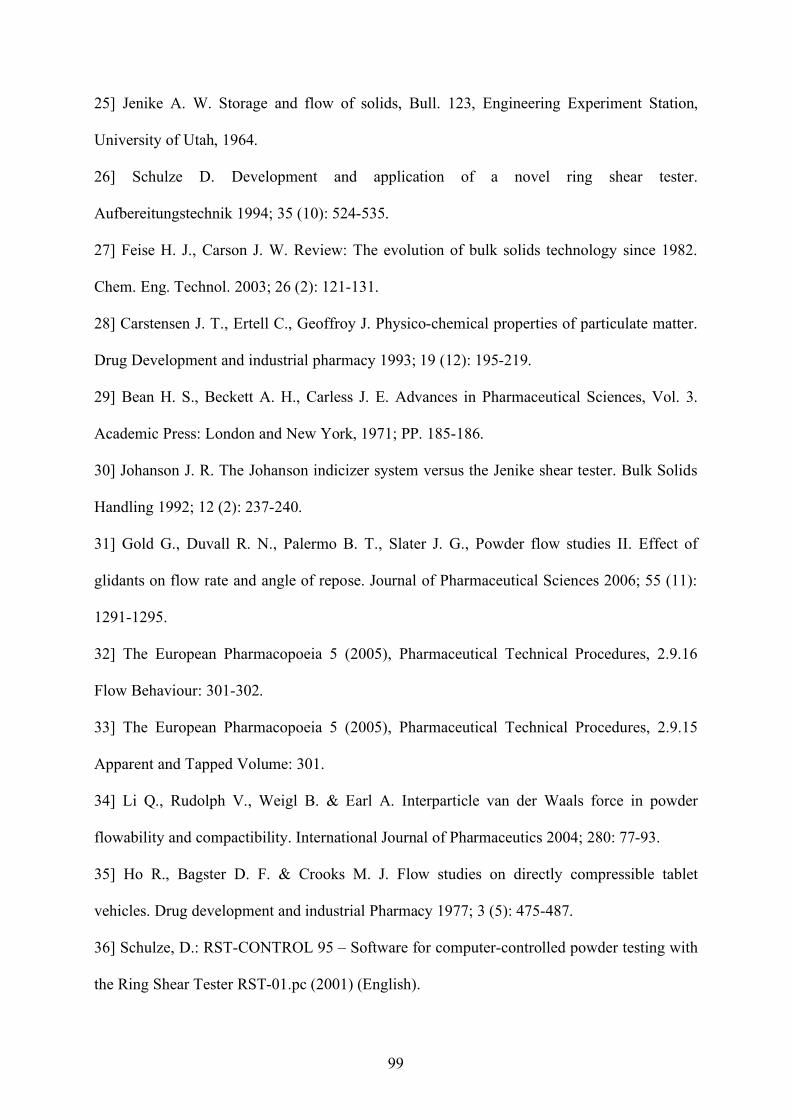
99
25] Jenike A. W. Storage and flow of solids, Bull. 123, Engineering Experiment Station,
University of Utah, 1964.
26] Schulze D. Development and application of a novel ring shear tester.
Aufbereitungstechnik 1994; 35 (10): 524-535.
27] Feise H. J., Carson J. W. Review: The evolution of bulk solids technology since 1982.
Chem. Eng. Technol. 2003; 26 (2): 121-131.
28] Carstensen J. T., Ertell C., Geoffroy J. Physico-chemical properties of particulate matter.
Drug Development and industrial pharmacy 1993; 19 (12): 195-219.
29] Bean H. S., Beckett A. H., Carless J. E. Advances in Pharmaceutical Sciences, Vol. 3.
Academic Press: London and New York, 1971; PP. 185-186.
30] Johanson J. R. The Johanson indicizer system versus the Jenike shear tester. Bulk Solids
Handling 1992; 12 (2): 237-240.
31] Gold G., Duvall R. N., Palermo B. T., Slater J. G., Powder flow studies II. Effect of
glidants on flow rate and angle of repose. Journal of Pharmaceutical Sciences 2006; 55 (11):
1291-1295.
32] The European Pharmacopoeia 5 (2005), Pharmaceutical Technical Procedures, 2.9.16
Flow Behaviour: 301-302.
33] The European Pharmacopoeia 5 (2005), Pharmaceutical Technical Procedures, 2.9.15
Apparent and Tapped Volume: 301.
34] Li Q., Rudolph V., Weigl B. & Earl A. Interparticle van der Waals force in powder
flowability and compactibility. International Journal of Pharmaceutics 2004; 280: 77-93.
35] Ho R., Bagster D. F. & Crooks M. J. Flow studies on directly compressible tablet
vehicles. Drug development and industrial Pharmacy 1977; 3 (5): 475-487.
36] Schulze, D.: RST-CONTROL 95 – Software for computer-controlled powder testing with
the Ring Shear Tester RST-01.pc (2001) (English).
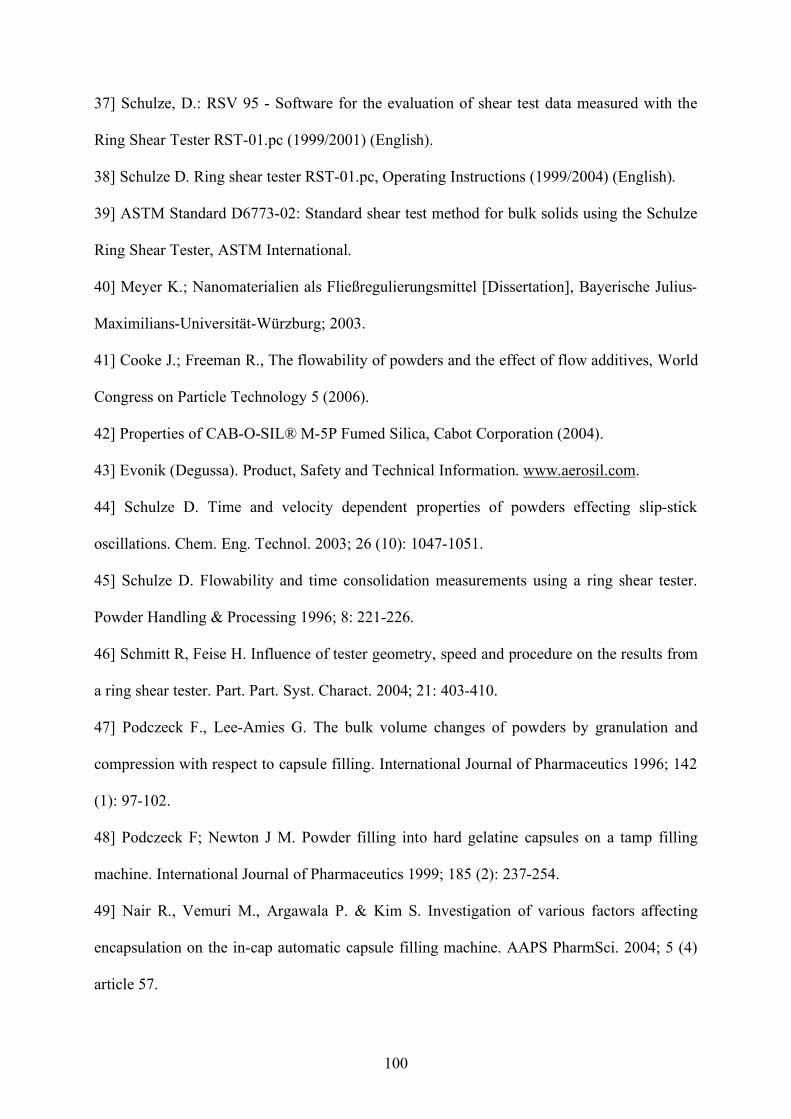
100
37] Schulze, D.: RSV 95 - Software for the evaluation of shear test data measured with the
Ring Shear Tester RST-01.pc (1999/2001) (English).
38] Schulze D. Ring shear tester RST-01.pc, Operating Instructions (1999/2004) (English).
39] ASTM Standard D6773-02: Standard shear test method for bulk solids using the Schulze
Ring Shear Tester, ASTM International.
40] Meyer K.; Nanomaterialien als Fließregulierungsmittel [Dissertation], Bayerische Julius-
Maximilians-Universität-Würzburg; 2003.
41] Cooke J.; Freeman R., The flowability of powders and the effect of flow additives, World
Congress on Particle Technology 5 (2006).
42] Properties of CAB-O-SIL® M-5P Fumed Silica, Cabot Corporation (2004).
43] Evonik (Degussa). Product, Safety and Technical Information. www.aerosil.com.
44] Schulze D. Time and velocity dependent properties of powders effecting slip-stick
oscillations. Chem. Eng. Technol. 2003; 26 (10): 1047-1051.
45] Schulze D. Flowability and time consolidation measurements using a ring shear tester.
Powder Handling & Processing 1996; 8: 221-226.
46] Schmitt R, Feise H. Influence of tester geometry, speed and procedure on the results from
a ring shear tester. Part. Part. Syst. Charact. 2004; 21: 403-410.
47] Podczeck F., Lee-Amies G. The bulk volume changes of powders by granulation and
compression with respect to capsule filling. International Journal of Pharmaceutics 1996; 142
(1): 97-102.
48] Podczeck F; Newton J M. Powder filling into hard gelatine capsules on a tamp filling
machine. International Journal of Pharmaceutics 1999; 185 (2): 237-254.
49] Nair R., Vemuri M., Argawala P. & Kim S. Investigation of various factors affecting
encapsulation on the in-cap automatic capsule filling machine. AAPS PharmSci. 2004; 5 (4)
article 57.

101
50] Felton L., Garcia D., Farmer R. Weight and weight uniformity of hard gelatine capsules
filled with microcrystalline cellulose and silicified microcrystalline cellulose. Drug
Development & Industrial Pharmacy 2002; 28: 467-472.
51] Tan S.B. & Newton J. M. Powder flowability as an indication of capsule filling
performance. International Journal of Pharmaceutics 1990; 61: 145-155.
52] Patel R. & Podczeck F. Investigation of the effect of type and source of microcrystalline
cellulose on capsule filling. International Journal of Pharmaceutics 1996; 128: 123-127.
53] Kurihara K., Ichikawa I. Effect of powder flowability on capsule filling weight variation.
Chemical & Pharmaceutical Bulletin 1978; 26: 1250-1256.
54] Heda P. K., Muteba K., & Augsburger L. L. Comparison of the Formulation
Requirements of Dosator and Dosing Disc Automatic Capsule Filling Machines. AAPS
PharmSci. 2002; 4 (3) article 17.
55] Jonat, S.; Hasenzahl, S.; Gray, A.; Schmidt, P. C. Mechanism of glidants: investigation of
the effect of different colloidal silicon dioxide types on powder flow by atomic force &
scanning electron microscopy. Journal of Pharmaceutical Sciences 2004; 93 (10): 2635-2644.
56] Applications of CAB-O-SIL® M-5P Fumed Silica in the Formulation and Design of Solid
Dosage Forms, Cabot Corporation (1995).
57] Dünisch S. Untersuchung der Wirkungsweise von nanomaterialien, [Dissertation],
Bayerische Julius-Maximilians universität – Würzburg.
58] Podczeck F., Sharma M. The influence of particle size and shape of components of binary
powder mixtures on the maximum volume reduction due to packing. International Journal of
Pharmaceutics 1996; 137: 41-47.
59] Freeman R.E., Cooke J.R, Schneider L.C.R. Volumetric dosing efficiency in relation to
the bulk, flow and shear properties of powders. Partec 2007.
60] Itiola OA.,Odeku OA. Packing and cohesive properties of some locally extracted starches.
Tropical Journal of Pharmaceutical Research 2005; 4 (1): 363-368.
102
61] Podczeck F., Miah Y. The influence of particle size and shape on the angle of internal
friction and the flow factor of unlubricated and lubricated powders. International Journal of
Pharmaceutics 1996; 144 (2): 187-194,
62] Lahdenpää, E., Niskanan, M., and Yliruusi, J. Study of some essential physical
characteristics of three Avicel PH grades using a mixture design. European Journal of
Pharmaceutics and Biopharmacetics 1996: 42 (3): 177-182.
63] Abdullah, E. C. and Geldart, D. The use of bulk density measurements as flowability
indicators. Powder Technology 1999; 102: 151-165
64] Zheng J., Carlson W. B. & Reed J. S. The packing density of binary powder mixtures.
Journal of the European Ceramic Society 1995; 15; 479-483.
65] Lam D. C. C., Nakagawa M. Packing of particles. III: Effect of particle size distribution
shape on composite packing density of bimodal mixtures. Nippon seramikkusu kyokai
gakujutsu ronbunshi 1994; 102 (2): 133-138
66] Shotton E, Obiorah BA The effect of particle shape and crystal habit on properties of
sodium chloride. J Pharm Pharmacol. 1973; 25 (Suppl): 37P-43P.
67] Larhrib, H., Martin, G. P., Prime, D. and Marriott, C. Characterisation and deposition
studies of engineered lactose crystals with potential for use as a carrier for aerosolised
salbutamol sulfate from dry powder inhalers. European Journal of Pharmceutical Science
2003; 19 (4): 211-221.
68] Kaerger J. S, Edge S &. Price R. Influence of particle size and shape on flowability and
compactibility of binary mixtures of paracetamol and microcrystalline cellulose. European
Journal of Pharmaceutical Sciences 2004; 22 (2-3): 173-179
69] Hou H., Calvin S. C. Quantifying effects of particulate properties on powder flow
properties using a ring shear tester. Journal of Pharmaceutical Sciences 2008; 97 (9): 4030-
4039.
103
70] Alvarez A., Rodriguez M. Lipids in pharmaceutical and cosmetic preparations Grasas y
Aceites 2000; 51: 74-96.
71] Krause J.; Novel paediatric formulations for the drug sodium benzoate [Dissertation],
Heinrich-Heine-Universität - Düsseldorf ; 2008.
72] Reitz C., Kleinebudde P. Solid lipid extrusion of sustained release dosage forms.
European Journal of Pharmaceutics and Biopharmaceutics 2007; 67: 440–448.
73] Reitz C.; Extrudierte Fettmatrizes mit retardierter Wirkstofffreigabe [Dissertation],
Heinrich-Heine-Universität - Düsseldorf ; 2008.
74] Pharmazeutisch-kosmetische Anwendung nanostrukturierter Lipidcarrier (NLC);
Lichtschutz und Pflege, www.diss.fu-berlin.de.- Freie Universität Berlin (2008).
75] Gattefosse GmbH. www.gattefosse.com; Pharmaceutical / products / oral (2007).
76] Michalk A. Geschmaksmaskierung durch Festfett-Extrusion [Dissertation], Heinrich-
Heine-Universität - Düsseldorf ; 2007.
77] Jonat S., Hasenzahl S., Drechsler M., Albers P., Wagner K.G., Schmidt P.C. Investigation
of compacted hydrophilic and hydrophobic colloidal silicon dioxides as glidants for
pharmaceutical excipients, Powder Technology 2004; 141: 31-43.
78] Eber M.; Wirksamkeit and Leistungsfähigkeit von nanoskaligen Fließregulierungsmitteln
[Dissertation], Bayerische Julius-Maximilians-Universität – Würzburg; 2004.

104
SELBSTSTÄNDIGKEITSERKLÄRUNG
Die hier vorgelegte Dissertation habe ich eigenhändig ohne unerlaubte Hilfe angefertigt.
Die Dissertation wurde in der vorgelegten Form bei keiner anderen Institution eingereicht.
Ich habe bisher keine erfolglosen Promotionsversuche unternommen.
Düsseldorf, den
(Hind Jaeda)
Related Documents