HUMAN ADIPOSE TISSUE IS A SOURCE OF MULTIPOTENT STEM CELLS Patricia A. Zuk, PhD* Min Zhu, MD* Peter Ashjian, MD* Daniel A. De Ugarte, MD* Jerry I. Huang, MD* Hiroshi, Mizuno, MD* Zeni C. Alfonso, PhD** John K. Fraser, PhD** Prosper Benhaim, MD* Marc H. Hedrick, MD* Running Title: Multipotent Stem Cells from Human Adipose Tissue Key Words: PLA cells, Stem cells, MSCs, differentiation, adipose tissue * Regenerative Bioengineering and Repair Laboratory. UCLA School of Medicine, Departments of Surgery and Orthopedics. Los Angeles, CA. 90095 ** UCLA School of Medicine, Division of Hematology and Oncology. Department of Medicine and the Jonsson Comprehensive Cancer Center. Los Angeles, CA. 90095 Please direct all correspondence to: Dr. Patricia Zuk UCLA 7V-136 Center for Health Sciences 650 Charles E. Young Drive South Los Angeles, CA 90095 1-310-794-4737 1-310-825-2785 (fax) [email protected] MBC in Press, published on September 24, 2002 as 10.1091/mbc.E02-02-0105

Welcome message from author
This document is posted to help you gain knowledge. Please leave a comment to let me know what you think about it! Share it to your friends and learn new things together.
Transcript

HUMAN ADIPOSE TISSUE IS A SOURCE
OF MULTIPOTENT STEM CELLS
Patricia A. Zuk, PhD*
Min Zhu, MD*
Peter Ashjian, MD*
Daniel A. De Ugarte, MD*
Jerry I. Huang, MD*
Hiroshi, Mizuno, MD*
Zeni C. Alfonso, PhD**
John K. Fraser, PhD**
Prosper Benhaim, MD*
Marc H. Hedrick, MD*
Running Title: Multipotent Stem Cells from Human Adipose Tissue Key Words: PLA cells, Stem cells, MSCs, differentiation, adipose tissue * Regenerative Bioengineering and Repair Laboratory. UCLA School of Medicine, Departments of Surgery and Orthopedics. Los Angeles, CA. 90095 ** UCLA School of Medicine, Division of Hematology and Oncology. Department of Medicine and the Jonsson Comprehensive Cancer Center. Los Angeles, CA. 90095 Please direct all correspondence to: Dr. Patricia Zuk UCLA 7V-136 Center for Health Sciences 650 Charles E. Young Drive South Los Angeles, CA 90095 1-310-794-4737 1-310-825-2785 (fax) [email protected]
MBC in Press, published on September 24, 2002 as 10.1091/mbc.E02-02-0105
2
ABSTRACT Much of the work conducted on adult stem cells has focused on mesenchymal stem cells (MSCs)
found within the bone marrow stroma. Adipose tissue, like bone marrow, is derived from the
embryonic mesenchyme and contains a stroma that is easily isolated. Preliminary studies have
recently identified a putative stem cell population within the adipose stromal compartment. This
cell population, termed Processed Lipoaspirate (PLA) cells, can be isolated from human
lipoaspirates and, like MSCs, differentiate toward the osteogenic, adipogenic, myogenic and
chondrogenic lineages. To confirm if adipose tissue contains stem cells, the PLA population and
multiple clonal isolates were analyzed using several molecular and biochemical approaches. PLA
cells expressed multiple CD marker antigens similar to those observed on MSCs. Mesodermal
lineage induction of PLA cells and clones resulted in the expression of multiple lineage-specific
genes and proteins. Furthermore, biochemical analysis also confirmed lineage-specific activity.
In addition to mesodermal capacity, PLA cells and clones differentiated into putative neurogenic
cells, exhibiting a neuronal-like morphology and expressing several proteins consistent with the
neuronal phenotype. Finally, PLA cells exhibited unique characteristics distinct from those seen
in MSCs, including differences in CD marker profile and gene expression.
3
INTRODUCTION
Stem cells are a population possessing: 1) self-renewal capacity, 2) long-term viability and 3)
multilineage potential. The multilineage potential of embryonic stem cells and adult stem cells
from the bone marrow has been characterized extensively. While embryonic stem cell potential
is enormous, many ethical and political issues accompany their use. Therefore, adult stem cells
from the bone marrow stroma (i.e. mesenchymal stem cells, or MSCs) have been proposed as an
alternative source. Originally identified as a source of osteoprogenitor cells, MSCs differentiate
into adipocytes, chondrocytes, osteoblasts and myoblasts in vitro (Ferrari et al., 1998; Grigoradis
et al., 1988; Hauner et al. et al., 1987; Johnstone et al., 1998; Pittenger et al., 1999; Wakitani et
al., 1995) and undergo differentiation in vivo (Benayahu et al., 1989; Bruder et al., 1998a),
making these stem cells promising candidates for mesodermal defect repair and disease
management. However, the clinical use of MSCs has presented problems, including pain,
morbidity and low cell number upon harvest. This has led many researchers to investigate
alternate sources for MSCs.
Adipose tissue, like bone marrow, is derived from the mesenchyme and contains a supportive
stroma that is easily isolated. Based on this, adipose tissue may represent a source of stem cells
that could have far-reaching effects on several fields. We have previously identified a putative
stem cell population within human lipoaspirates (Zuk et al., 2001). This cell population, called
Processed Lipoaspirate (PLA) cells, can be isolated from adipose tissue in significant numbers
and exhibits stable growth and proliferation kinetics in culture. Moreover, PLA cells, like
MSCs, differentiate in vitro toward the osteogenic, adipogenic, myogenic and chondrogenic
lineages when treated with established lineage-specific factors. The multilineage differentiation

4
capacity of PLA cells led us to speculate that a population of multipotent stem cells, comparable
to MSCs, can be isolated from human adipose tissue.
To confirm if PLA cells represent a stem cell population, we conducted an extensive molecular
and biochemical characterization of the PLA population and several clonal isolates, termed
Adipose-Derived Stem Cells, or ADSCs. PLA cells expressed several CD marker antigens
similar to those observed on MSC controls. Induction of PLA cells and clones toward multiple
mesodermal lineages resulted in the expression several lineage-specific genes and proteins
similar to those observed in induced MSC controls and lineage-committed precursor cell lines.
Moreover, established biochemical assays confirmed lineage-specific metabolic activity in
induced PLA populations. In addition to mesodermal capacity, PLA cells and clones
differentiated into putative neurogenic cells, exhibiting a neuronal-like morphology and
expressing several proteins consistent with the neuronal phenotype. Finally, PLA cells exhibited
unique characteristics distinct from that seen in MSCs, including differences in CD marker and
gene expression profiles. In conclusion, the results presented in this study suggest that adipose
tissue may be an additional source of unique, pluripotent stem cells with multi-germline
potential.
5
MATERIALS AND METHODS
Cell culture and differentiation:
PLA cells were obtained from raw human lipoaspirates and cultured as described in a previous
study (Zuk et al., 2001). Briefly, raw lipoaspirates were washed extensively with sterile PBS in
order to remove contaminating debris and red blood cells. Washed aspirates were treated with
0.075% collagenase (type I, Sigma) in PBS for 30 minutes at 37 °C with gentle agitation. The
collagenase was inactivated with an equal volume of DMEM/10% FBS and the infranatant
centrifuged for 10 minutes at low speed. The cellular pellet was resuspended in DMEM/10%
FBS and filtered through a 100 micron mesh filter to remove debris. The filtrate was centrifuged
as detailed above and plated onto conventional tissue culture plates in Control Medium (Table
1). Normal human osteoblasts (NHOst), normal human chondrocytes from the knee (NHCK)
and a population of MSCs from human bone marrow were purchased from Clonetics
(Walkersville, MD) and maintained in commercial medium. The murine 3T3-L1 preadipocyte
cell line (Green et al., 1974) was obtained from ATCC (Rockville, MD). NHOst, PLA cells and
3T3-L1 cells were treated with mesenchymal lineage-specific media as outlined in Table 1.
MSCs were induced using commercial control medium supplemented with the growth factors
outlined in Table 1. NHOst and NHCK cells were induced using commercially available
induction media (Clonetics).
Antibodies:
The antibodies and commercial sources used in this study are indicated in online Table S1.
Flow Cytometry

6
PLA cells and MSCs were cultured in control medium 72 hours prior to analysis. Flow
cytometry using a FACscan argon laser cytometer (Beckton Dickson, San Jose, CA) was
performed according to a previous study (Zuk et al. 2000). Briefly, cells were harvested in 0.25%
trypsin/EDTA and fixed for 30 minutes in ice-cold 2% formaldehyde. The fixed cells were
washed in Flow Cytometry Buffer (FCB; PBS, 2% FBS, 0.2% Tween-20) and incubated for 30
minutes in FCB containing FITC-conjugated monoclonal antibodies to SH3, STRO-1 and to the
following CD antigens (CDs 13, 14, 16, 31, 34, 44, 45, 49d, 56, 62e, 71, 90, 104, 105, 106). PLA
cells and MSCs were stained with a PE-conjugated non-specific IgG to assess background
fluorescence.
Histology, Immunohistochemistry and Indirect Immunofluorescence:
Indirect Immunofluorescence: PLA cells and MSCs were processed as described previously (Zuk
et al., 2001) using monoclonal antibodies to specific CD markers and lineage-specific proteins
(online Table S1).
Histology and Immunohistochemistry: Differentiated PLA cells and clones were processed as
described (Zuk et al., 2001) using the following histological assays: Alkaline Phosphatase
(osteogenesis), Oil Red O (adipogenic) and Alcian Blue (chondrogenic). Chondrogenic PLA
cells and clones were examined for collagen type 2 (CNII), keratan sulfate (KS) and chondroitin-
4-sulfate (CS) expression by immunohistochemistry, as previously described (Zuk et al., 2001).
Neurogenic PLA cells and clones were examined by immunohistochemistry for the expression of
neural-specific proteins.
Spectrophotometric Assays:
7
Alkaline Phosphatase (AP): Triplicate samples of PLA cells were differentiated in Osteogenic
Medium (OM) for up to 6 weeks. Cells were washed with PBS, harvested and AP enzyme
activity assayed using a commercial AP enzyme kit according to the method of Beresford et al.
(Beresford et al., 1986). AP activity was expressed a nmol p-nitrophenol produced/minute/µg
protein. Differentiated MSCs were assayed as positive controls while non-induced PLA cells
were assayed as a negative control. Values are expressed as the mean ± SD. A student t-test
(Paired) was performed to determine statistical significance between induced and control
samples.
Total calcium: Triplicate samples of PLA cells were differentiated in OM for up to 6 weeks.
Cells were washed with PBS (no Ca2+, no Mg2+) and harvested in 0.1N HCl. Cells were extracted
in 0.1N HCl at 4 ºC for a minimum of 4 hours and centrifuged for 5 minutes at 10000xg. Total
calcium in the supernatant was determined using a commercial kit (Sigma #587) and expressed
as mM Ca2+/µg protein. Differentiated MSC and NHOst cells were assayed as positive controls,
while non-induced PLA cells were assayed as a negative control. Values are expressed as the
mean ± SD. A student t-test (Paired) was performed to determine statistical significance between
induced and control samples.
Glycerol-3-phosphate dehydrogenase (GPDH): Triplicate samples of PLA cells were
differentiated in Adipogenic Medium (AM) for up to 5 weeks. GPDH activity was assayed
according to the method of Wise and Green (Wise et al., 1979). One unit of GPDH was defined
as the oxidation of 1 nmol of NADH per minute. GPDH activity was expressed as units
GPDH/µg. Differentiated 3T3-L1 cells were assayed as positive controls, while non-induced
PLA cells were assayed as a negative control. Value Values are expressed as the mean ± SD. A
student t-test (Paired) was performed to determine statistical significance between induced and
control samples.

8
Dimethyldimethylene Blue (DMMB): Triplicate samples of PLA cells were differentiated in
Chondrogenic Medium (CM) for up to 3 weeks using established high-density micromass
protocols (Reddi et al., 1982). PLA nodules were harvested and assayed for sulfated
proteoglycans, according to an established method (Farndale et al., 1986). Proteoglycan levels
were expressed as µg sulfated proteoglycan per µg protein. Non-induced PLA cells were assayed
as a negative control. Values are expressed as the mean ± SD. A student t-test (Paired) was
performed to determine statistical significance between induced and control samples.
RT-PCR analysis:
PLA cells were induced toward five lineages, as outlined in Table 1, for defined time periods.
Total cellular RNA was isolated and reverse transcribed using conventional protocols. PCR
amplification was performed using the primer sets outlined in online Table S2. All primer
sequences were determined using established GenBank sequences. Duplicate PCR reactions
were amplified using primers designed β-actin as a control for assessing PCR efficiency and for
subsequent analysis by agarose gel electrophoresis. The sequence of each PCR product was
confirmed using automated sequencing. Non-induced PLA cells were examined as a negative
control. Lineage-specific cell lines (NHOst, 3T3-L1 and NHCK) were analyzed as positive
controls for the osteogenic, adipogenic and chondrogenic lineages, respectively. Total human
skeletal muscle and brain RNA (Ambion, Austin, TX) were reverse-transcribed and amplified by
PCR as a positive control for the myogenic and neurogenic lineages, respectively.
Quantitative Real time PCR:
PLA cells were maintained in non-inductive Control medium for three weeks or were induced
toward the osteogenic and adipogenic lineages for one and three weeks. The expression of
9
CBFA-1 and AP was quantitated for osteogenic PLA cells, whereas the expression of LPL was
quantitated for adipogenic samples. Human GAPDH primers and probe (5’ JOE and 3’ TAMRA)
were purchased from PE Biosystems (Foster City, CA). Total cellular RNA was isolated and
reversed transcribed using the TaqMan Gold RT-PCR kit for real-time PCR (PE Biosystems).
Quantitative real-time PCR was performed using this kit according to the manufacturer and an
ABI 7700 Prism Sequence Detection System. Primer and probe sequences were designed by the
UCLA Sequencing Core Facility and synthesized by BioSource (Camarillo, CA). All probes
were designed with a 5’ fluorogenic probe 6FAM and a 3’ quencher TAMRA. The expression
of human GAPDH was used to normalize gene expression levels.
Western Blotting:
PLA cells were differentiated toward the osteogenic lineage for 7 and 28 days, washed in PBS
and lysed in 1% SDS. Equivalent amounts of protein in each lysate were resolved by denaturing
polyacrylamide gel electrophoresis (SDS-PAGE) and analyzed using standard immunoblotting
protocols. Lysates were examined for the expression of OP, ON, AP, CNI, VDR and RARα.
Expression of the TfR was used as an internal control for quantitation. Expression of α-actin
was used as a qualitative control for the Western blot procedure only. Non-induced PLA cells
were also analyzed as a negative control. To quantitate, protein levels were normalized with
respect to the transferrin receptor (TfR) and expressed relative to undifferentiated PLA controls.
Neurogenic Differentiation:
Subconfluent PLA cells were cultured for 24 hours in Preinduction Medium (DMEM, 20% FBS,
1 mM β-mercaptoethanol). Following preinduction, the cells were induced for up to 9 hours in
Neurogenic Medium (NM), according to an established protocol (Woodbury et al., 2000) and

10
analyzed by immunohistochemistry for the expression of: NeuN, NSE, NF-70 and MAP-2
(neuronal lineage), GFAP (astrocyte lineage) and GalC (oligodendrocyte lineage). Samples were
also analyzed by RT-PCR (online Table S2). Finally, PLA samples were also induced in: 1) NM
for 9 hours and maintained for 1 week in a Neural Progenitor Maintenance Medium (NPMM)
and 2) control medium supplemented with indomethacin and insulin (IIM) for up to 1 week.
Isolation and Analysis of PLA Clones:
PLA cells were plated at limiting confluence in order to result in isolated single cells. Cultures
were maintained in Control medium until the formation of well-defined colonies. The single
PLA-cell derived colonies were harvested using sterile cloning rings and expanded in Cloning
Medium (15% FBS, 1% antibiotic/antimycotic in F12/DMEM (1:1)). Expanded clones were
subcloned by limiting dilution. All clones were analyzed for osteogenic, adipogenic,
chondrogenic and neurogenic potential by immunohistochemistry. The expression of lineage-
specific genes was confirmed by RT-PCR.
Online Supplementary Material:
Figure S1: Immunofluorescent analysis of PLA and MSC populations: CD marker profile
Figure S2: Growth kinetics and histological analysis of adipo-induced PLA populations
Figure S3: Immunofluorescent and RT-PCR analysis of adipo-induced PLA cells
Figure S4: Growth kinetics of osteo-induced PLA cells
Figure S5: Immunofluorescent and RT-PCR analysis of osteo-induced PLA cells and MSCs
Figure S6: Immunohistochemical and RT-PCR analysis of PLA cells and NHCK controls
Figure S7: Immunohistochemical analysis of PLA clones
Table S1: List of antibodies

11
Table S2: List of RT-PCR oligonucleotide primers
12
RESULTS
Phenotypic characterization of PLA populations: CD marker profile
To characterize the PLA population, CD marker profile was examined and compared to a
commercial population of human MSCs (Figure 1 and online Figure S1). Both PLA and MSC
cells expressed CD29, CD44, CD71, CD90 and CD105/SH2 and SH3, which, together with SH2,
is considered a marker for MSCs (Haynesworth et al., 1992). In addition to these markers, both
PLA and MSCs expressed STRO-1 (data not shown), a marker used to isolated multilineage
progenitors from bone marrow (Dennis et al., 2002; Gronthos et al., 1994). In contrast, no
expression of the haematopoietic lineage markers CD31, CD34 and CD45 was observed in either
of the cultures. Flow cytometry confirmed the immunofluorescence results, in addition to
detecting the expression of CD13 and the absence of CD14, 16, 56, 61, 62E, 104 and 106 ( Table
2). Upon immunofluorescent and flow cytometric analysis, two CD marker antigens were found
to differ between PLA and MSC populations: CD49d (α4 integrin) and CD106 (VCAM).
Specifically, PLA cells expressed CD49d, while this antigen was not observed in MSC cultures.
Unlike MSCs, no expression of CD106 was observed in PLA samples.
PLA cells undergo adipogenic differentiation in vitro
Induction of PLA cells with Adipogenic medium (AM) resulted in an expanded cell morphology
and a time-dependent increase in intracellular Oil Red O staining, an established lipid dye
(online Figure S2). Moreover, adipogenic differentiation did not result in an appreciable increase
in PLA cell number and is consistent with growth arrest observed upon commitment of
preadipocytes (online Figure S2). Induction of PLA cells and 3T3-L1 controls resulted in a
significant upregulation in the activity of the lipogenic enzyme, GPDH (Figure 2A). However,
no significant difference in GPDH activity was detected between induced PLA samples and non-

13
induced controls until 4 weeks induction whereupon a 6.5 and 4.7-fold increase versus controls
was measured at 28 and 35 days, respectively. Moreover, statistical analysis confirmed a
significant difference between induced and control PLA samples at these time points (p<0.01).
Finally, the time-dependent increase in GPDH activity correlated with the increased percentage
of lipid-filled PLA cells within adipo-induced cultures and was consistent with adipogenic
differentiation by these cells.
Adipogenic induction of PLA cells also resulted in lineage-specific gene and protein expression.
Immunofluorescence confirmed the expression of leptin and GLUT4 in induced PLA samples
(Figure 2B), two proteins that are upregulated in differentiating adipocytes (Chen et al. et al.,
1997; Tanner et al., 1992). Expression of these proteins appeared to be mainly restricted to
mature, lipid-filled PLA cells, as low levels were observed in cells with a fibroblastic
morphology. Moreover, the expression of both leptin and GLUT4 appeared to be specific to
adipogenic PLA samples as no protein expression was detected in non-induced controls. The
expression of leptin and GLUT4 was also observed in lipid-filled MSCs upon adipogenic
induction (online Figure S3A). Adipogenic differentiation of PLA cells was further confirmed by
RT-PCR (Figure 2C). Induction of PLA cells with AM resulted in expression of the adipose-
specific transcription factor, PPARγ2. Moreover, PPARγ2 expression was specific to adipo-
induced PLA cells, in addition to MSCs and induced 3T3 cells (online Figure S3B). Initial
differentiation (i.e. 4 days) of the PLA and MSC populations was characterized by the absence of
PPARγ2, with expression of this transcription factor appearing after one week induction and
persisting throughout the remaining induction period. Expression of PPARγ1 was also detected
in adipo-induced PLA cells and MSC controls. However, constitutive expression of PPARγ1 was
observed in non-induced PLA cells, while basal expression was not observed in non-induced
14
MSCs (see online Figure S3B). In addition to the PPAR isoforms, expression of the adipogenic
genes, LPL and aP2, was also detected in PLA cells and MSC controls. Constitutive expression
of these genes was detected in both cell populations and adipogenic induction resulted in a
qualitative increase in expression level when compared to non-induced controls as detected by
conventional RT-PCR. LPL upregulation in adipo-induced PLA cells was also confirmed by
quantitative real-time PCR. Non-induced PLA controls expressed negligible levels of LPL and a
significant upregulation in expression was measured at day 7 upon induction, consistent with the
expression of this gene during the early stages of pre-adipocyte differentiation (Jonasson et al.,
1984). LPL levels beyond this point decreased with a two and four-fold drop in expression being
measured at day 21 and day 35 when compared to day 7 levels (Figure 2D). Finally, adipogenic
differentiation of PLA cells, in addition to MSC and 3T3 controls, resulted in the expression of
leptin and GLUT4 mRNA. In contrast to protein expression, non-induced PLA cells expressed
basal levels of leptin mRNA with adipogenic induction appearing to increase expression level
late in differentiation. Finally, the adipogenic induction conditions used in this study were
specific for the fat lineage and did not result in the expression of genes consistent with bone and
cartilage differentiation (OC and CNII, respectively – data not shown).
PLA cells undergo osteogenic differentiation in vitro
Induction of PLA cells with Osteogenic medium (OM) containing dexamethasone (see Table 1)
resulted in the appearance of AP activity and an increase in matrix mineralization as confirmed
by histology (online Figure S4). Moreover, distinct phases of PLA proliferation, matrix synthesis
and mineralization could be discerned in osteo-induced PLA cultures, consistent with results
observed in osteoblast cultures (online Figure S4). However, recent work has questioned the
efficacy of glucocorticoids, such as dexamethasone, in mediating osteogenesis (Cooper et al.,
1999). Therefore, PLA cells were induced in OM containing 1,25-dihydroxyvitamin D3

15
(OM/VD) rather than dexamethasone. To assess osteogenesis, levels of AP enzyme activity and
matrix mineralization were quantitated. AP activity appeared in osteo-induced PLA and MSC
samples between 2 and 3 weeks induction with PLA samples exhibiting significantly elevated
AP levels in comparison to MSC controls at 3 weeks induction (p=0.008; paired t-test) (Figure
3A). Maximum AP levels were detected in induced PLA samples at 3 weeks with an
approximate 35-fold increase in activity measured from 2 to 3 weeks induction. Furthermore, the
response to VD induction appeared to be time-dependent, producing a distinct bi-phasic pattern.
AP activity appeared one week earlier in the MSC population and maximum levels were not
observed until 6 weeks. PLA cells treated with dexamethasone exhibited significantly lower
levels of AP activity in comparison to VD-treated samples (data not shown). Interestingly,
treatment of MSCs with dexamethasone produced increased AP levels in comparison to VD
induction, suggesting a differential response to induction conditions between the PLA and MSC
populations (data not shown). AP enzyme activity was negligible in non-induced PLA controls,
indicating a low level of endogenous activity. Since AP activity is intimately involved in matrix
calcification, extracellular calcium accumulation was measured. Consistent with osteogenesis,
VD induction of PLA cells and MSC controls resulted in a time-dependent increase in matrix
mineralization with matrix calcification appearing in both populations at 3 weeks and maximum
levels detected at 6 weeks. Induction of PLA cells resulted in an approximate 30-fold increase in
matrix calcification over the 6 week treatment period. Despite the lower AP activity in
comparison to PLA cells, induced MSCs were associated with significantly more matrix
calcification, in comparison to induced PLA cells (p<0.001; 35 days induction), with a 68-fold
overall increase in calcium accumulation detected over the 6 week induction period.
To confirm osteogenesis, cells were examined by RT-PCR for the expression of several genes,
including OC, CBFA-1, AP, ON, OP, BMP2, c-fos and collagen type I (CNI), in addition to

16
receptors involved in osteogenesis (parathyroid hormone receptor/PTHR, retinoid X
receptor/RXRα and vitamin D receptor/VDR) and the homeodomain proteins, msx2 and dlx5
(Figure 3B and online Figure S5). The osteogenic induction conditions used in this study were
specific for the bone lineage and did not result in the expression of genes consistent with fat and
cartilage differentiation (data not shown). Expression of CBFA-1, a transcription factor that
binds to the promoters of several osteogenic genes (Ducy et al., 1997), was observed at all time
points in osteo-induced PLA cells, MSCs and NHOst cells. Furthermore, CBFA-1 expression
was not specific to osteo-induced cells, as basal expression was observed in non-induced PLA
cells and MSCs. Quantitation of CBFA-1 expression using real-time PCR confirmed a time-
dependent increase in gene expression when compared to non-induced controls (Figure 3C).
Initial osteogenic induction of PLA cells (i.e. 7 days) resulted in an approximate 10-fold increase
in CBFA-1 expression versus controls, while a dramatic 60-fold increase was measured by three
weeks induction. Induction of PLA cells in OM containing dexamethasone rather than VD also
resulted in a time-dependent increase in CBFA-1 expression versus controls, albeit at
significantly lower levels, again, suggesting an inhibitory effect of this glucocorticoid on PLA
osteogenesis (data not shown). Finally, AP expression was observed at all time points in
differentiated and control PLA cells, MSCs and NHOst cells. Quantitative real-time PCR
detected a decrease in AP levels after one week of induction (1.7-fold). However, continued
treatment (i.e. 21 days) resulted in an approximate two-fold increase in AP expression level and
corresponded well with the AP enzyme assays results.
In addition to CBFA-1 and AP, expression of CNI, OP and ON was also observed in
differentiated and control PLA cells, MSC and NHOst controls. While, expression of these genes
is indicative of osteogenesis, they are not specific markers. However, expression of the bone-
specific gene, OC, was observed in both induced PLA cells and MSC controls. OC expression in

17
osteo-induced PLA cells appeared to be bi-phasic, appearing as early as day 7 of induction and at
late phases of differentiation in these cells (i.e. 21 to 42 days), while no expression was detected
at 14 days. No such pattern was observed in osteo-induced MSCs with relatively consistent
expression levels being observed. Moreover, in contrast to MSCs, OC expression was restricted
to osteogenic induction, as no basal expression was seen in PLA cells maintained in non-
inductive control medium, while low basal OC expression was detected in non-induced MSCs.
Interestingly, exposure of PLA cells to dexamethasone inhibited the expression of OC at all time
points (online Figure S5). Replacement of dexamethasone with VD for the last 48 hours of
induction was sufficient to overcome this inhibitory effect (data not shown). This inhibitory
effect has also been observed in rat MSCs and human bone cultures (Beresford et al., 1986;
Jaiswal et al., 1997; Leboy et al., 1991) and suggests that dexamethasone may be inhibitory to
PLA osteogenesis. Because the actions of VD are mediated through its receptor via
heterodimerization with the RXR (Westin et al., 1988), expression of these receptors were
confirmed in both control and induced PLA populations at all time points, together with the
PTHR. Finally, both osteo- and non-induced PLA cells, MSCs and NHOsts expressed the
transcription factor c-fos and the homeodomain protein msx2, two genes involved in osteoblast
differentiation (Benson et al., 2000; Jabs et al., 1993; Newberry et al., 1998; Ryoo et al., 1997).
However, expression of the homeodomain protein dlx5 (Benson et al., 2000; Newberry et al.,
1998) and BMP-2, a member of the TGFβ superfamily known to mediate osteogenesis (Johnson
et al., 1988; Lieberman et al. et al., 1998; Wang et al., 1990), were differentially expressed
between the PLA and MSC populations. Specifically, no dlx5 and BMP2 were detected in non-
induced and induced PLA cells, while expression of both genes was observed in induced MSCs
and NHOst controls.
18
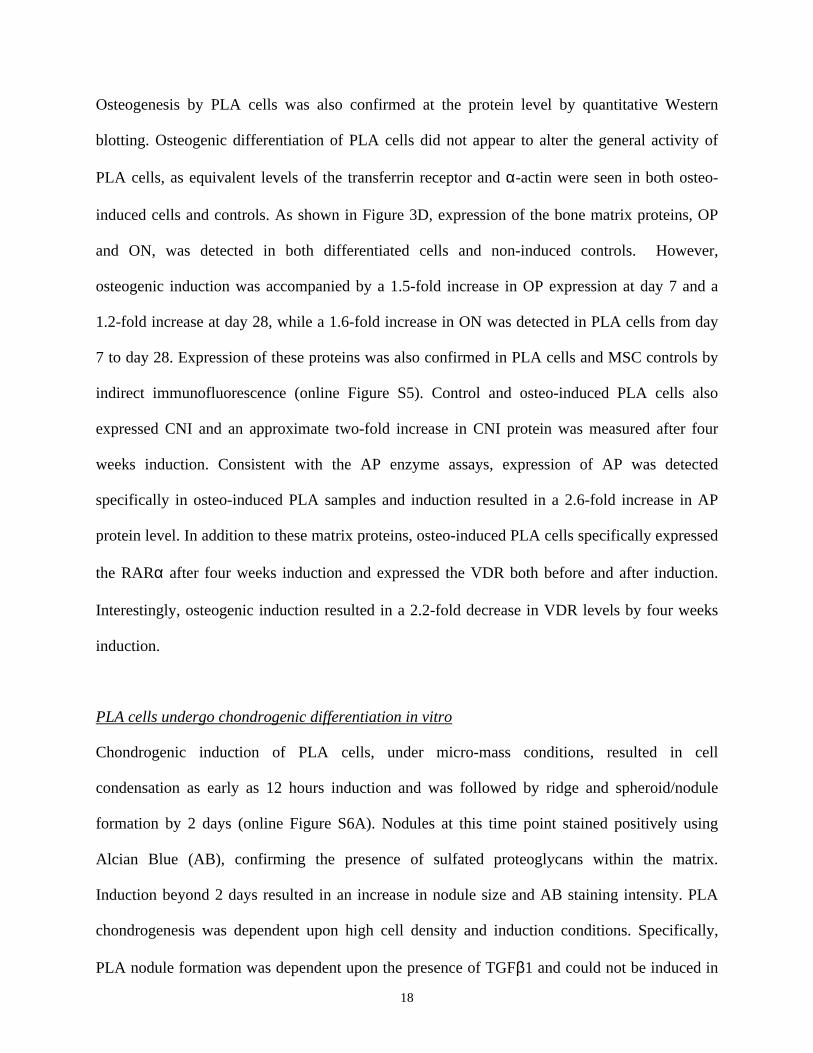
Osteogenesis by PLA cells was also confirmed at the protein level by quantitative Western
blotting. Osteogenic differentiation of PLA cells did not appear to alter the general activity of
PLA cells, as equivalent levels of the transferrin receptor and α-actin were seen in both osteo-
induced cells and controls. As shown in Figure 3D, expression of the bone matrix proteins, OP
and ON, was detected in both differentiated cells and non-induced controls. However,
osteogenic induction was accompanied by a 1.5-fold increase in OP expression at day 7 and a
1.2-fold increase at day 28, while a 1.6-fold increase in ON was detected in PLA cells from day
7 to day 28. Expression of these proteins was also confirmed in PLA cells and MSC controls by
indirect immunofluorescence (online Figure S5). Control and osteo-induced PLA cells also
expressed CNI and an approximate two-fold increase in CNI protein was measured after four
weeks induction. Consistent with the AP enzyme assays, expression of AP was detected
specifically in osteo-induced PLA samples and induction resulted in a 2.6-fold increase in AP
protein level. In addition to these matrix proteins, osteo-induced PLA cells specifically expressed
the RARα after four weeks induction and expressed the VDR both before and after induction.
Interestingly, osteogenic induction resulted in a 2.2-fold decrease in VDR levels by four weeks
induction.
PLA cells undergo chondrogenic differentiation in vitro
Chondrogenic induction of PLA cells, under micro-mass conditions, resulted in cell
condensation as early as 12 hours induction and was followed by ridge and spheroid/nodule
formation by 2 days (online Figure S6A). Nodules at this time point stained positively using
Alcian Blue (AB), confirming the presence of sulfated proteoglycans within the matrix.
Induction beyond 2 days resulted in an increase in nodule size and AB staining intensity. PLA
chondrogenesis was dependent upon high cell density and induction conditions. Specifically,
PLA nodule formation was dependent upon the presence of TGFβ1 and could not be induced in

19
monolayer culture (data not shown). PLA nodules induced for 14 days in (CM) stained positively
using AB, specifically expressing both keratan and chondroitin-4-sulfate (Figure 4A). Expression
of the cartilagenous collagen II isoform (CNII – splice variant CNIIB, mature chondrocytes
shown) was also observed. Interestingly, micromass culture of MSCs in CM did not result in
nodule formation and could not be used as a positive control in this study. Therefore, cells
derived from human articular cartilage of the knee (NHCK) cells were used. Quantitation of
sulfated proteoglycan levels revealed a time-dependent increase in cartilage-induced PLA cells
up to 2 weeks of induction (Figure 4B), followed by a slight decrease at 3 weeks. A similar
reduction was also noted in NHCK controls and may represent remodeling of the ECM (data not
shown). While control and induced PLA cells produced relatively equivalent levels of
proteoglycan within the first two weeks of induction, 14 day PLA nodules were associated with
significantly more proteoglycan (1.8-fold more, p<0.001), consistent with the increase in matrix
synthesis associated with chondrogenic differentiation.
Treatment of PLA cells with CM resulted in the expression of genes consistent with
chondrogenesis (Figure 4C and online Figure S6B). CNII expression (splice variant IIB) was
observed specifically in induced PLA cells and was restricted to day 7 and 10. A low level of
CNII expression was also observed upon chondrogenic induction of NHCK controls. In addition,
induced PLA cells also expressed the large proteoglycan, aggrecan. Like CNII, aggrecan
expression was restricted to days 7 and 10 and was specific to induced PLA samples. Aggrecan
expression was also observed upon chondrogenic induction of NHCK controls. Chondrogenic
induction of PLA nodules resulted in the specific expression of CNX, a marker of hypertrophic
chondrocytes, at day 14 only. In contrast to this, little, if any, expression of CNX could be
observed in NHCK controls and may be due to their derivation from articular cartilage. Induced
and control PLA cells, together with induced NHCK controls, were also associated with
20
additional collagen types, including CNI and CNIII with the majority of PLA samples examined
exhibiting a restricted collagen expression pattern (day 4 only) (online Figure S6B). Induced
PLA cells and NHCKs also expressed the cartilagenous proteoglycans, decorin and biglycan.
Expression of these genes was observed at all time points and was also seen in non-induced PLA
cells. No expression of OC was seen at any time point, confirming the absence of osteogenic
differentiation.
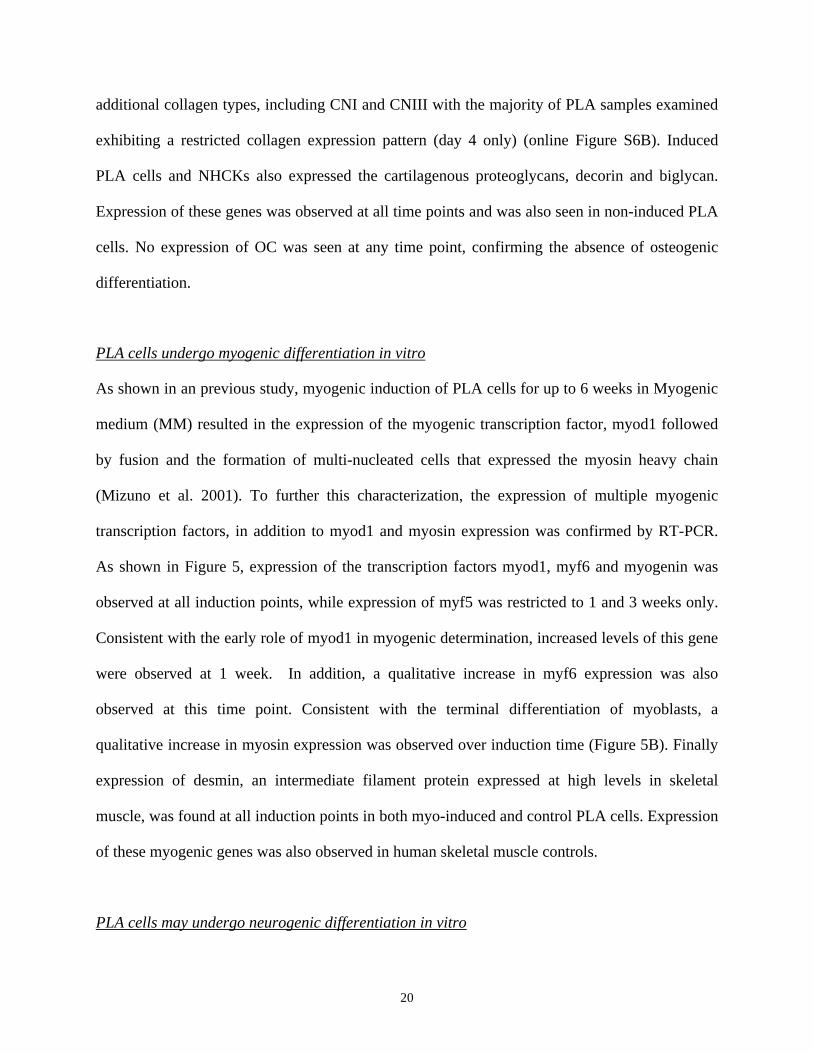
PLA cells undergo myogenic differentiation in vitro
As shown in an previous study, myogenic induction of PLA cells for up to 6 weeks in Myogenic
medium (MM) resulted in the expression of the myogenic transcription factor, myod1 followed
by fusion and the formation of multi-nucleated cells that expressed the myosin heavy chain
(Mizuno et al. 2001). To further this characterization, the expression of multiple myogenic
transcription factors, in addition to myod1 and myosin expression was confirmed by RT-PCR.
As shown in Figure 5, expression of the transcription factors myod1, myf6 and myogenin was
observed at all induction points, while expression of myf5 was restricted to 1 and 3 weeks only.
Consistent with the early role of myod1 in myogenic determination, increased levels of this gene
were observed at 1 week. In addition, a qualitative increase in myf6 expression was also
observed at this time point. Consistent with the terminal differentiation of myoblasts, a
qualitative increase in myosin expression was observed over induction time (Figure 5B). Finally
expression of desmin, an intermediate filament protein expressed at high levels in skeletal
muscle, was found at all induction points in both myo-induced and control PLA cells. Expression
of these myogenic genes was also observed in human skeletal muscle controls.
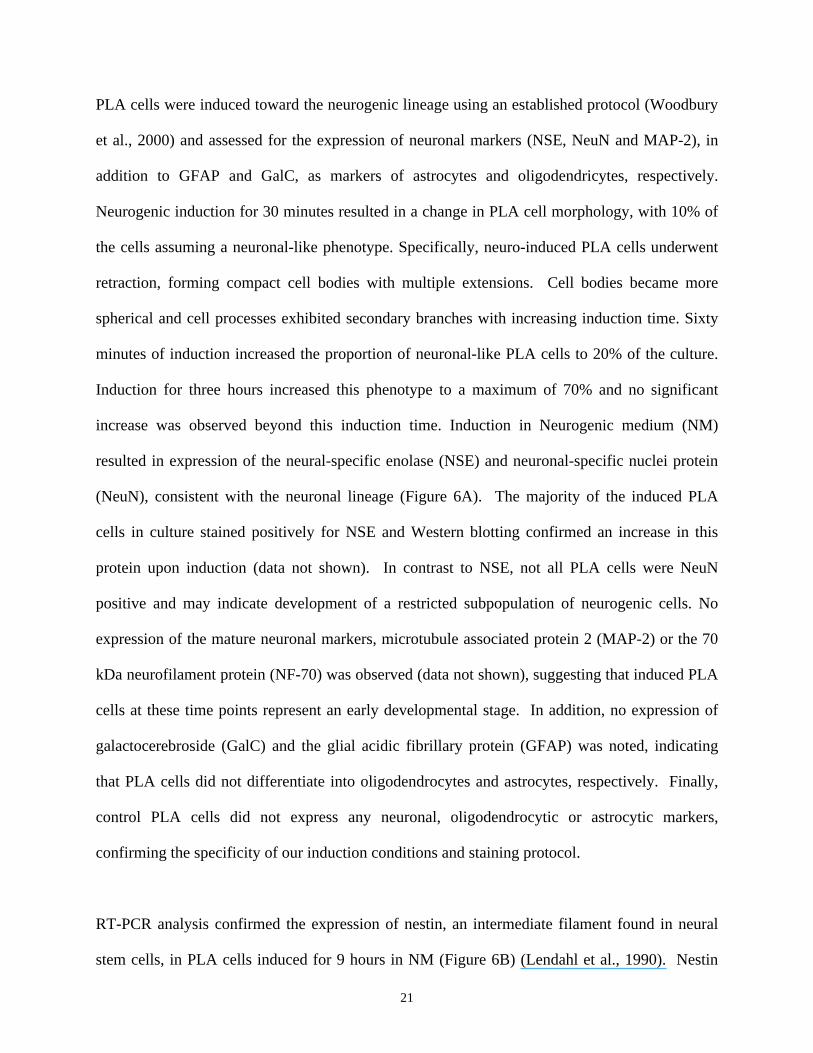
PLA cells may undergo neurogenic differentiation in vitro
21
PLA cells were induced toward the neurogenic lineage using an established protocol (Woodbury
et al., 2000) and assessed for the expression of neuronal markers (NSE, NeuN and MAP-2), in
addition to GFAP and GalC, as markers of astrocytes and oligodendricytes, respectively.
Neurogenic induction for 30 minutes resulted in a change in PLA cell morphology, with 10% of
the cells assuming a neuronal-like phenotype. Specifically, neuro-induced PLA cells underwent
retraction, forming compact cell bodies with multiple extensions. Cell bodies became more
spherical and cell processes exhibited secondary branches with increasing induction time. Sixty
minutes of induction increased the proportion of neuronal-like PLA cells to 20% of the culture.
Induction for three hours increased this phenotype to a maximum of 70% and no significant
increase was observed beyond this induction time. Induction in Neurogenic medium (NM)
resulted in expression of the neural-specific enolase (NSE) and neuronal-specific nuclei protein
(NeuN), consistent with the neuronal lineage (Figure 6A). The majority of the induced PLA
cells in culture stained positively for NSE and Western blotting confirmed an increase in this
protein upon induction (data not shown). In contrast to NSE, not all PLA cells were NeuN
positive and may indicate development of a restricted subpopulation of neurogenic cells. No
expression of the mature neuronal markers, microtubule associated protein 2 (MAP-2) or the 70
kDa neurofilament protein (NF-70) was observed (data not shown), suggesting that induced PLA
cells at these time points represent an early developmental stage. In addition, no expression of
galactocerebroside (GalC) and the glial acidic fibrillary protein (GFAP) was noted, indicating
that PLA cells did not differentiate into oligodendrocytes and astrocytes, respectively. Finally,
control PLA cells did not express any neuronal, oligodendrocytic or astrocytic markers,
confirming the specificity of our induction conditions and staining protocol.
RT-PCR analysis confirmed the expression of nestin, an intermediate filament found in neural
stem cells, in PLA cells induced for 9 hours in NM (Figure 6B) (Lendahl et al., 1990). Nestin
22
expression was also detected in non-induced PLA cells and in total RNA prepared from human
brain. No expression of markers characteristic of more mature neuronal subtypes, choline
acetyltransferase (ChaT) or GAD65, was observed. Moreover, RT-PCR did not detect other
neurogenic lineages, as no expression of GFAP (astrocytic) or myelin-binding protein (MBP -
oligodendricytic) was detected. A similar gene expression profile, including nestin, was also
observed in PLA cells induced for 9 hours in NM, followed by maintenance for up to 1 week in a
medium designed to maintain neurogenic precursors (NPMM). In addition, nestin expression
was also found in PLA cells maintained in non-inductive control medium containing
indomethacin and insulin (IIM). Taken together, the expression of nestin, NSE and NeuN,
together with the absence of ChaT, MBP or GFAP expression suggests that PLA cells may be
capable of assuming an early neuronal or neural precursor phenotype.
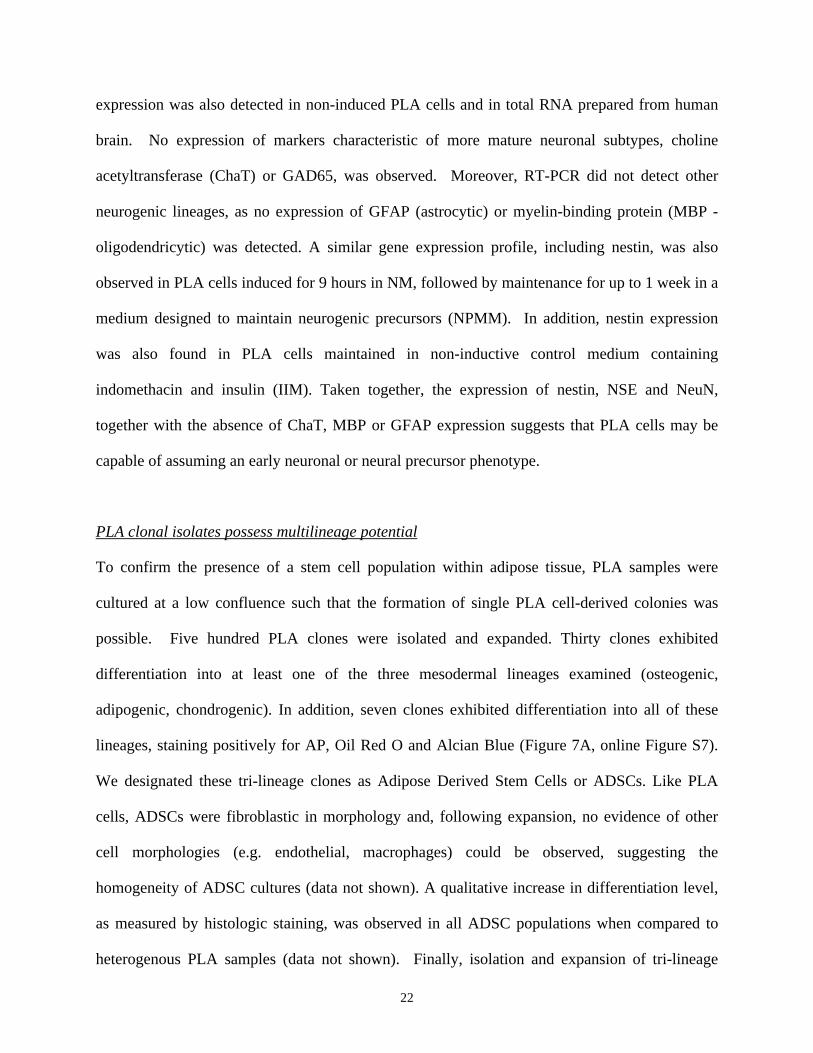
PLA clonal isolates possess multilineage potential
To confirm the presence of a stem cell population within adipose tissue, PLA samples were
cultured at a low confluence such that the formation of single PLA cell-derived colonies was
possible. Five hundred PLA clones were isolated and expanded. Thirty clones exhibited
differentiation into at least one of the three mesodermal lineages examined (osteogenic,
adipogenic, chondrogenic). In addition, seven clones exhibited differentiation into all of these
lineages, staining positively for AP, Oil Red O and Alcian Blue (Figure 7A, online Figure S7).
We designated these tri-lineage clones as Adipose Derived Stem Cells or ADSCs. Like PLA
cells, ADSCs were fibroblastic in morphology and, following expansion, no evidence of other
cell morphologies (e.g. endothelial, macrophages) could be observed, suggesting the
homogeneity of ADSC cultures (data not shown). A qualitative increase in differentiation level,
as measured by histologic staining, was observed in all ADSC populations when compared to
heterogenous PLA samples (data not shown). Finally, isolation and expansion of tri-lineage

23
ADSCs did not alter the CD expression profile as shown by immunofluorescence (data not
shown). In addition to ADSCs, other PLA-derived clones exhibiting a more restricted dual-
lineage potential (osteogenic/adipogenic, osteogenic/chondrogenic and adipogenic/osteogenic)
and single lineage potential (adipogenic) were also isolated (online Figure S7).
To confirm multilineage potential, ADSCs were examined like the heterogenous PLA population
by RT-PCR for the expression of several lineage-specific genes. Supportive of their multilineage
capacity, ADSCs expressed multiple genes characteristic of the osteogenic, adipogenic and
chondrogenic lineages (Figure 7B). Specifically, induction of ADSCs with OM resulted in the
expression of OC, ON, OP, CNI and AP. Adipose induction of ADSCs resulted in the specific
expression of aP2 and LPL, together with a low level of PPARγ2. Finally, expression of
aggrecan, CNX, decorin and biglycan was detected upon 2 weeks of chondrogenic induction.
The expression patterns of these genes in ADSCs was indistinguishable from that observed in the
heterogenous PLA population. Together with the immunohistochemistry data, the RT-PCR
results confirm the multilineage capacity of ADSC isolates and suggest that the multilineage
capacity of the PLA population is due to the presence of stem cell population.
24
DISCUSSION
In the present study, we confirm the multilineage capacity of a population of stem cells, termed
PLA cells, isolated from human lipoaspirates. Preliminary studies characterized the
heterogeneity and growth kinetics of this cell population and revealed that PLA cells may have
multilineage potential (Zuk et al., 2001). The purpose of this work was two-fold: 1) to confirm if
stem cells exist in adipose tissue and 2) to compare the differentiation potential of these cells to
MSCs, a well characterized stem cell population isolated from bone marrow. Our findings reveal
that PLA cells are capable of multiple mesodermal lineage differentiation, as shown by the
expression of several lineage-specific genes and proteins. In addition, PLA cells can also be
induced to express markers consistent with a neurogenic phenotype, suggesting an ectodermal
potential. Finally, mesodermal and ectodermal capacity was detected in PLA clonal isolates,
suggesting that adipose tissue represents a source of adult stem cells.
PLA cells are phenotypically similar to MSCs
Characterization of MSCs has been performed using the expression of cell-specific proteins and
CD markers (Bruder et al., 1998b; Conget et al., 1999; Pittenger et al., 1999). Like MSCs, PLA
cells expressed CD29, CD44, CD71, CD90, CD105/SH2 and SH3 and were absent for CD31,
CD34 and CD45 expression (online Figure S1). Moreover, flow cytometry on PLA cells
confirmed the expression of CD13, while no expression of CD14, 16, 56, 62e or 104 was
detected (Table 2). These results demonstrate that similar CD complements are expressed on
both PLA cells and MSCs. However, distinctions in two CD markers were observed: PLA cells
were positive for CD49d and negative for CD106, while the opposite was observed on MSCs.
Expression of CD106 has been confirmed in the bone marrow stroma and, specifically, MSCs
(Levesque et al., 2001) where it is functionally associated with hematopoiesis. The lack of
25
CD106 on PLA cells is consistent with the localization of these cells to a non-hematopoietic
tissue.
PLA cells differentiate into bone, fat, cartilage and muscle: multiple mesodermal lineage
capacity
As suggested in an earlier study (Zuk et al., 2001), PLA cells appear to possess the capacity to
differentiate into multiple mesodermal lineages, including bone, fat and cartilage. This
observation has led us to speculate that adipose tissue may be a source of mesodermal stem cells.
The current study supports this hypothesis, characterizing the metabolic activity of several
mesodermal lineages, in addition to confirming the expression of multiple lineage-specific genes
and proteins.
A. Adipogenesis:
Consistent with the initiation of the adipogenic program, adipo-induction of PLA cells resulted in
a significant increase in GPDH activity, a lipogenic enzyme involved in triglyceride synthesis
(Kuri-Harcuch et al., 1978). In addition to possessing metabolic activity consistent with the
formation of mature adipocytes, PLA cells expressed several genes and/or proteins involved in
lipid biosynthesis and storage, including: 1) adipo-induced specific expression of PPARγ2, a fat-
specific transcription factor that functions in the pre-adipocyte commitment (Totonoz et al.,
1994), 2) increased expression of LPL, a lipid exchange enzyme upregulated during adipogenesis
(Ailhaud et al., 1992), 3) upregulation of aP2, a protein associated with lipid accumulation within
mature adipocytes (Bernlohr et al., 1985) and, finally, 4) increased expression of both leptin and
GLUT4 and restriction of these proteins to lipid-filled PLA cells. While the expression of these
genes in induced PLA cells and MSC controls was similar to 3T3 controls and suggests
adipogenic differentiation, the timing of their expression does differ from lineage-committed

26
precursors. Specifically expression of aP2 is restricted to a late phase in developing adipocytes,
yet is detected early in PLA and MSC differentiation and preceded that of PPARγ2. This altered
sequence of adipose gene expression in PLA cells may be due to a distinct developmental
program characteristic of stem cells. Consistent with this, osteocalcin expression, an established
late marker of osteoblast differentiation, is also observed early in osteogenic PLA cell and MSC
populations. Alternatively, the observed gene sequence may be due to the asynchronous
development of cell subpopulations within the heterogenous PLA.
B. Osteogenesis:
Induction of PLA cells with OM supplemented with vitamin D resulted in several events
supportive of osteogenesis. Specifically, AP activity and mineralization capacity increased in a
time-dependent fashion upon osteogenic induction of PLA cells. However, AP kinetics were not
linear in induced PLA samples but assumed a bi-phasic pattern. Time course studies on rat
calvaria and marrow stromal cells have shown that AP peaks early, correlating with matrix
mineralization and is down-regulated during terminal differentiation into osteocytes (Malaval et
al., 1994; Owen et al., 1990). Moreover, a dose-dependent inhibition of AP activity by VD has
been measured in mature osteosarcoma cells, an effect thought to represent the return of a cell
fraction to the osteoprogenitor pool or their terminal differentiation (Majeska et al., 1982). It is
therefore possible that the bi-phasic AP enzyme pattern in PLA cells may be due to the
differentiation of multiple osteoprogenitor subpopulations with distinct temporal and
developmental profiles.
In addition to increased AP activity and matrix calcification, expression of multiple genes can be
used to confirm osteogenic differentiation. RT-PCR confirmed the expression of the majority of
the genes examined (c-fos, RXRα, VDR, PTHR, OP, ON, AP, CBFA-1 and CNI) in both non-
27
induced and induced PLA and MSC cell populations, consistent with previous results observed
in MSCs and indicative of osteogenic differentiation. Furthermore, quantitative real-time PCR
confirmed increases in CBFA-1 upon the onset of osteogenic differentiation. Increases in AP
were also measured later in PLA differentiation, consistent with the AP spectrophotometric assay
results. In addition to increases at the gene level, Western blotting also detected increases in OP
and CNI protein levels along with the specific expression of AP. While, the expression of ON,
OP and the increased expression of AP and CBFA-1 is strongly suggestive of osteogenesis, these
genes are not considered to be specific markers for differentiation. One such gene is OC. While
considered a late marker of osteoblast differentiation (Owen et al., 1990), OC is expressed early
during osteogenesis of marrow stromal cells (Malaval et al., 1994). Consistent with this,
induction of PLA cells and MSC controls resulted in early OC expression. Moreover, osteo-
induction of PLA cells resulted in a bi-phasic OC expression pattern. This pattern, similar to AP
activity, may be the response of PLA cell subpopulations at distinct developmental stages to
osteogenic induction. In support of this, several other induction agents have been shown to stage-
specific effects on osteogenesis, including TGFβ (Breen et al., 1994). Finally, OC expression by
induced PLA cells was dependent upon osteogenic agent as OC expression was inhibited upon
dexamethasone exposure, an effect not observed in MSC controls.
C. Chondrogenesis and Myogenesis:
Chondrogenic differentiation in vitro of MSCs requires high-density culture, thus duplicating the
process of cellular condensation, in addition to media supplementation. Consistent with this,
high-density culture of PLA cells in CM resulted in the formation of compact nodules that
exhibited many characteristics of cells differentiating toward the chondrogenic lineage. First,
PLA nodules were associated with a time-dependent increase in the sulfated proteoglycans
keratan- and chondroitin-sulfate, in agreement with that observed in high-density MSC cultures

28
(Yoo et al., 1998). In addition, nodules also contained the type II collagen isoform, a collagen
characteristic of cartilage (Yoo et al., 1998). Secondly, chondrogenic PLA nodules also
expressed several genes consistent with chondrogenesis including: 1) the specific expression of
CNII and the large, cartilage proteoglycan, aggrecan, in induced PLA samples, 2) expression of
the small, leucine-rich proteoglycans decorin and biglycan and 3) the late expression of CNX, a
marker of hypertrophic chondrocytes. The expression of CNX by PLA cells may indicate
possible ossification and endochondral bone formation, an event that is supported by the
expression of CNI within the PLA nodule. However, expression of many collagens including
CNI, have been observed in chondrogenic MSC nodules (Yoo et al., 1998) and in high-density
embryonic chick limb-bud cell aggregates (Osdoby et al., 1979; Tachetti et al., 1987). Moreover,
no expression of osteocalcin by chondrogenic PLA or NHCK cells was seen at any time point,
confirming the absence of osteogenic differentiation within the PLA nodule.
Finally, myogenic lineage potential in PLA cells was confirmed by the expression of several
transcription factors including myf6, myf5, myod1 and myogenin and the structural proteins
desmin and myosin. Determination and execution of the myogenic program in myoblast
precursors is controlled at the transcription level by these same transcription factors (Atchley et
al., 1994; Lassar et al., 1994), whereas terminal differentiation can be confirmed through the
expression of myosin. Therefore, the expression of these genes together with previous work
confirming the expression of myoD1 and myosin at the gene and protein level (Mizuno et al.,
2001) is supportive of the myogenic lineage in PLA cells.
Neurogenic induction of PLA cells results in the expression of neuronal markers: potential
ectodermal capacity?
29
Like MSCs, it is not surprising to observe the differentiation of putative stem cells from adipose
tissue (i.e. PLA cells) into multiple mesodermal lineages since fat tissue, like the bone marrow
stroma, is a mesodermal derivative. However, recent reports have documented the differentiation
of MSCs to neural-like cells (Sanchez-Ramos et al., 2000; Woodbury et al., 2000), suggesting
that adult stem cells may not be as restricted as previously thought. Recent work on MSCs
undergoing early neurogenic differentiation has confirmed the expression of nestin, an
intermediate filament protein thought to be expressed at high levels in neural stem cells (Lendahl
et al., 1990; Sanchez-Ramos et al., 2000). Consistent with this, nestin expression was detected in
non-induced PLA cells and those induced under several established neurogenic media conditions
(i.e. NPMM and IIM), suggesting the assumption of a neural stem cell phenotype by PLA cells.
Nestin expression has also been observed in myogenic cells, endothelial cells and hepatic cells,
indicating that it cannot be used as a marker for putative neurogenic potential. However,
neurogenic induction of PLA cells also resulted in the assumption of a neuronal-like morphology
and the increased expression of two neuron-specific proteins, NSE and NeuN. NeuN expression
is thought to coincide with terminal differentiation of developing and post-mitotic neurons
(Mullen et al., 1992) and its expression has also been used to identify neuronal development in
MSCs (Sanchez-Ramos et al., 2000). Therefore, combined with the expression of early neuronal
markers, such as NeuN, nestin expression may indicate potential neurogenic capacity in PLA
cells. Finally, induction of PLA cells appeared to restrict their development to an early, neuronal
stage as no expression of established oligodendrocyte and astrocyte markers or mature neuronal
markers were observed at the gene or protein level. The absence of mature neuronal markers has
also been observed in MSC cultures by several groups (Deng et al., 2001; Sanchez-Ramos et al.,
2000) and may reflect the induction conditions used or the need for prolonged induction time.
PLA clones possess multilineage capacity: Adipose Derived Stem Cells (ADSCs)
30
PLA multilineage differentiation may result from the commitment of multiple lineage-specific
precursors rather than the presence of a pluripotent stem cell population. Therefore, the isolation
of clones derived from single PLA cells is critical to their identification as stem cells. Clonal
analysis isolated several tri-lineage PLA clones (ADSCs), expressing multiple osteogenic,
adipogenic and chondrogenic genes, strongly suggesting that ADSCs possess multi-potentiality
and may be considered stem cells. In addition, clonal analysis also isolated samples with more
restricted potentials, including dual-lineage (osteogenic/adipogenic, osteogenic/chondrogenic,
adipogenic/chondrogenic) and single lineage (adipogenic only). In support of this, the isolation
of restricted lineage MSC clones from transgenic mice and bone marrow has been reported
(Dennis et al., 1999; Pittenger et al., 1999). Older models of mesenchymal differentiation
propose that lineage progenitors are determined by the microenvironment (Friedenstein et al.,
1990). Based on this, one would expect differentiation to be a stochastic event resulting in a
random combination of phenotypes. However, a recent model has proposed the existence of a
hierarchy in the MSC differentiation pathway, with the adipogenic lineage diverging early and
the osteogenic lineage a default pathway (Muraglia et al., 2000). While the isolation of
osteogenic/chondrogenic PLA clones is in agreement with this model, the presence of both
adipogenic/osteogenic and adipogenic/chondrogenic isolates (not previously reported in MSC
populations) suggests that the differentiation of PLA stem cells follows a more random course of
action.
Distinctions between PLA and MSC populations
Analysis of PLA cells and MSCs in this study has identified many similarities between the two
populations, lending support to the theory that stem cells can be found within adipose tissue.
However, these similarities may also indicate that PLA cells are simply an MSC population
31
located within the adipose compartment, perhaps the result of infiltration of MSCs from the
peripheral blood supply. However, we do no believe this to be the case. Firstly, the presence of
MSCs in the peripheral blood is controversial. Moreover, if present within the peripheral blood,
the number of MSCs within the bone marrow stroma is extremely low (approximately 1 MSC
per 105 stromal cells (Bruder et al., 1997; Pittenger et al., 1999; Rikard et al., 1994)) and is likely
to be even lower in the peripheral blood. This low level is unlikely to give the relatively high
levels of differentiation observed in this study. Secondly, we have observed several distinctions
between PLA and MSC populations that suggest they are similar, but not identical, cell types: 1)
Preliminary results on PLA cells indicate that sera screening is not necessary for their expansion
and differentiation (Zuk et al., 2001), a requirement for MSCs (Lennon et al., 1996), 2) MSCs
did not undergo chondrogenic or myogenic differentiation under the conditions used in this
study, suggesting distinctions in differentiation capacities and/or kinetics, 3) Immunofluorescent
analysis identified differences in CD marker profile between PLA and MSC populations. In
contrast to MSCs, expression of CD106 was not observed on PLA cells, whereas PLA cells were
found to express CD49d, 4) Distinctions between PLA and MSC populations may also extend to
the gene level. For example, osteocalcin expression was restricted to PLA samples induced
specifically with VD. While treatment of MSCs with VD also induced OC expression,
expression of this gene was also observed in dexamethasone treated and non-induced MSCs,
albeit at lower levels (data not shown and online Figure S5). In addition, PLA cells and MSCs
exhibited distinctions in BMP-2 and dlx5 expression, both of which were found in induced
MSCs only. Since dlx5 and BMP2 are known to mediate expression of multiple osteogenic
genes, it is possible that PLA and MSC populations differ in their regulation of the osteogenic
differentiation pathway. Taken together, these differences may indicate that adipose tissue
contains stem cells, distinct from those found in the bone marrow stroma. However, the
possibility that PLA cells are a clonal variant of circulating MSCs cannot be ruled out.

32
Future directions
Stem cells are considered to be cells possessing self-replicating potential and the ability to give
rise to terminally differentiated cells of multiple lineages (Hall et al., 1989). Until recently, the
embryonic stem cell (ES) has been the “gold standard”, capable of differentiating into cells from
all three embryonic germ layers (Evans et al., 1981; Shamblott et al., 1998). However, unlike ES
cells, research on adult-derived stem cells (i.e. MSCs) has suggested a more restricted potential.
The traditional view of adult stem cell differentiation believed that stem cell progeny progressed
in a linear, irreversible fashion that eliminated their stem cell propensity and restricted their fate
to within a germ line. A new, evolving theory of differentiation proposes that stem cell progeny
differentiates in a more graded fashion, giving rise to more progressively restricted daughter cells
that possess transgerm potential. There is precedence for this belief. Clonal strains of marrow
adipocytes can be directed to form bone (Bennett et al., 1991) and chondrocytes can de-
differentiate toward the osteogenic lineage (Galotto et al., 1994). Recent studies confirming the
neurogenic potential of MSCs, the induction of HSCs into hepatocytes (Legasse et al., 2000) and
the conversion of neurogenic precursors into muscle and blood (Bjornson et al., 1999; Galli et
al., 2000) have contributed to this theory and may be the beginning of a paradigm shift.
There is a physiologic need for stem cells with plasticity. However, while the mechanism of stem
cell plasticity remains unknown, several examples of this phenomenon can be found at the
molecular level. Several genes, including leptin, CBFA1 and PPARγ participate in more than
one lineage pathway. Leptin is known to participate in both adipogenesis and osteogenesis (Chen
et al. et al., 1997; Ogeuch et al., 2000). CBFA-1 is not only constitutively expressed in marrow
stromal cells but is retained as these cells differentiate into multiple cell types (e.g. osteogenic,
chondrogenic) (Satomura et al., 2000). Consistent with this, expression of both leptin and

33
CBFA1 is observed in non-induced PLA cells and cells differentiating into multiple lineages
(data not shown). It is possible that stem cells, unlike more committed precursors, are capable of
switching phenotypes at a “late” stage of development. This plasticity, together with the ability
of stem cells to cross germ layers, presents researchers with exciting possibilities and the
definition of a stem cell may need to be amended. Equally exciting, is the emerging concept that
stem cells may be found in multiple organs (e.g. muscle, heart, liver) (Lucas et al., 1992; Young
et al., 1995) and tissues, such as skin (Toma et al., 2001), placenta and, now, fat (Zuk et al.,
2001). With this, there are now multiple stem cell reservoirs available for research and clinical
applications. While further characterization of the PLA population within adipose tissue and its
application in vivo is necessary, the results presented in this study suggest that adipose tissue
may be another source of pluripotent stem cells with multi-germline potential.

34
ABBREVIATIONS USED
ADSC – Adipose–Derived Stem Cell, AG – aggrecan, AM – Adipogenic medium, AP – alkaline
phosphatase, BG – biglycan, ββββ-ME - β-mercaptoethanol, BMP-2 – bone morphogenic protein –
2, CBFA-1 – core binding factor alpha 1, ChaT – choline acetyltransferase, CM –
Chondrogenic medium, CN I, II, III, X – collagen type 1, type 2, type 3, type 10, CS –
chondroitin-4-sulfate, DEC – decorin, DES – desmin, dlx5 – distal-less 5, GalC –
galactocerebroside, GFAP – glial fibrillary acidic protein, GPDH – glycerol-3-phosphate
dehydrogenase, IBMX - isobutyl-methylxanthine, KS - keratan sulfate, LPL – lipoprotein
lipase, MBP – myelin binding protein, MD1 – myod1, MG – myogenin, MM – Myogenic
medium, MSCs – Mesenchymal Stem Cells, MYF5 – myogenic regulatory factor 5, MYF6 –
myogenic regulatory factor 6, MYS – myosin heavy chain, NeuN – neuronal nuclei protein,
NHCKs – normal human chondrocytes from the knee, NHOsts – normal human osteoblasts,
NM –Neurogenic medium, NSE -neuron-specific enolase, OC – osteocalcin, OM – Osteogenic
medium, ON – osteonectin, OP – osteopontin, PTHR – parathyroid hormone receptor, PLA -
Processed Lipoaspirate, PPARγγγγ - peroxisome proliferating agent gamma, RXRαααα - retinoid X
receptor alpha, RARαααα - retinoic acid receptor alpha, TfR – transferrin receptor, VD – 1,25-
dihydroxyvitamin D3, VDR – vitamin D receptor.
ACKNOWLEDGEMENTS
This work was funded in part by the Wunderman Family Foundation, the American Society for
Aesthetic Plastic Surgery, the Plastic Surgery Educational Foundation and the Los Angeles
Orthopaedic Hospital Foundation.
35
FIGURE LEGENDS
Figure 1: PLA cells express a unique set of CD markers.
Panel A: PLA cells and MSCs were processed by immunofluorescence for expression of
multiple CD antigens. Cells were co-stained with DAPI to visualize nuclei (blue) and the
fluorescent images combined. The differential expression of CD49d and CD106 between PLA
cells and MSCs is shown (see supplemental Figure S1 for remaining CD antigens). Panel B:
Flow cytometric analysis on PLA cells and MSCs for the expression of CD49d and CD106 was
performed (red). Cells stained with a fluorochrome-conjugated non-specific IgG were examined
as a control (γPE - green). The Geometric Mean and median values for CD49d and Cd106 are
shown below. Significant differences are shown in bold.
Figure 2: Adipogenic PLA cells express several genes and proteins consistent with
adipogenic differentiation.
Panel A: Triplicate samples of PLA cells and 3T3-L1 controls were induced for up to 5 weeks in
AM (PLA – AM, 3T3 – AM, respectively) and assayed for GPDH activity (GPDH/µg). Non-
induced PLA cells were analyzed as a negative control (PLA - Control). Values were expressed
as mean ± SD. Panel B: PLA cells were induced in AM (PLA – Fat) or maintained in non-
inductive Control medium (PLA - Control) for 14 days. Cells were examined for the expression
of GLUT4 and leptin by indirect immunofluorescence. Representative mature PLA adipocytes
are shown (arrows). Panel C: PLA cells were induced in AM or maintained in non-inductive
Control medium for up to 5 weeks. Samples were analyzed by RT-PCR for the indicated genes.
3T3-L1 cells maintained for 2 weeks in AM were analyzed as a positive control. Panel D:
Expression of the gene, LPL, was quantitated by real-time PCR in PLA cells induced in control
medium and AM for up to 5 weeks. LPL expression levels were normalized with respect to

36
endogenous GAPDH. LPL expression in PLA cells induced for 3 and 5 weeks in AM were
expressed relative to one week levels.
Figure 3: Osteo-induced PLA cells express several osteogenic genes and proteins.
Panel A: PLA cells and MSCs were induced for up to 6 weeks in OM. Cells were assayed for AP
activity and total calcium and normalized with respect to protein. Non-induced PLA cells
(Control) were analyzed as a negative control. Values were expressed as the mean ± SD. Panel
B: PLA cells were cultured in OM or non-inductive Control medium for up to 6 weeks and
analyzed by RT-PCR for the indicated genes. NHOst cells maintained in control medium (Con)
or OM for 4 weeks (28d) were analyzed as a positive control. Panel C: Expression of the genes,
CBFA-1 and AP, was quantitated by real-time PCR in PLA cells induced in control medium and
OM for up to 4 weeks. Gene expression levels were normalized with respect to endogenous
GAPDH and expressed relative to non-induced control levels. Panel D: PLA cells were cultured
in OM or Control medium for 7 and 28 days and analyzed by Western blotting for the expression
of: osteopontin (OP), osteonectin (ON), alkaline phosphatase (AP), retinoic acid receptor
(RARα), the vitamin D receptor (VDR) and CNI (CNI). Expression of the transferrin receptor
(TfR) and α-actin was assessed as internal controls.
Figure 4: PLA cells induced toward the chondrogenic lineage synthesize a cartilagenous
matrix and express genes consistent with the chondrogenic lineage.
Panel A: PLA cells were induced in CM under high-density conditions for 14 days. Nodules
were sectioned and stained with Alcian Blue (AB), in addition to antibodies to CNII, KS and CS.
Panel B: PLA cells were induced for up to 3 weeks in CM (PLA – CM). Sulfated proteoglycan
levels were determined and normalized with respect to protein (PG/µg). Non-induced PLA cells
37
(PLA - Control) were analyzed as a negative control. Values were expressed as the mean ± SD.
Panel C: PLA nodules were induced in CM for up to 14 days (PLA – CM) or maintained in non-
inductive Control medium for 10 days (PLA – Con). Samples were analyzed by RT-PCR for the
indicated genes. NHCK cells induced for 2 weeks in CM were analyzed as a positive control.
Figure 5: PLA cells induced toward the myogenic lineage express several myogenic genes.
PLA cells induced in MM for up to 6 weeks or maintained in control medium were analyzed by
RT-PCR for the expression of the indicated myogenic genes. Total RNA prepared from human
skeletal muscle (SKM) was analyzed as a positive control.
Figure 6: PLA cells exhibit neurogenic capacity in vitro.
Panel A: PLA cells were maintained in NM or Control medium for 5 hours (PLA – NM, PLA –
Control, respectively) and analyzed for expression of neural (NSE, NeuN), astrocytic (GFAP)
and oligodendricytic (GalC) markers. Panel B: PLA cells were induced in: 1) NM for 9 hrs, or
2) NM for 9 hours and maintained for 1 week in NPMM or 3) control medium supplemented
with indomethacin and insulin (IIM) for 1 week. Samples were analyzed by RT-PCR for the
indicated genes. Non-induced PLA cells (Con) were analyzed as a negative control. Total RNA
prepared from human brain (Brain) was examined as a positive control.
Figure 7: PLA clones possess multilineage potential.
Panel A: PLA clonal isolates were analyzed for osteogenic (Alkaline phosphatase), adipogenic
(Oil Red O) and chondrogenic (Alcian Blue) capacity. Panel B: Tri-lineage clones (osteogenic,
adipogenic and chondrogenic), or ADSCs, were cultured in either: OM (ADSC – Bone), AM
(ADSC – Fat) or CM (ADSC – Cartilage), in addition to control medium (ADSC – Control).
ADSCs were analyzed by RT-PCR for the indicated lineage-specific genes.

38
39
TABLES
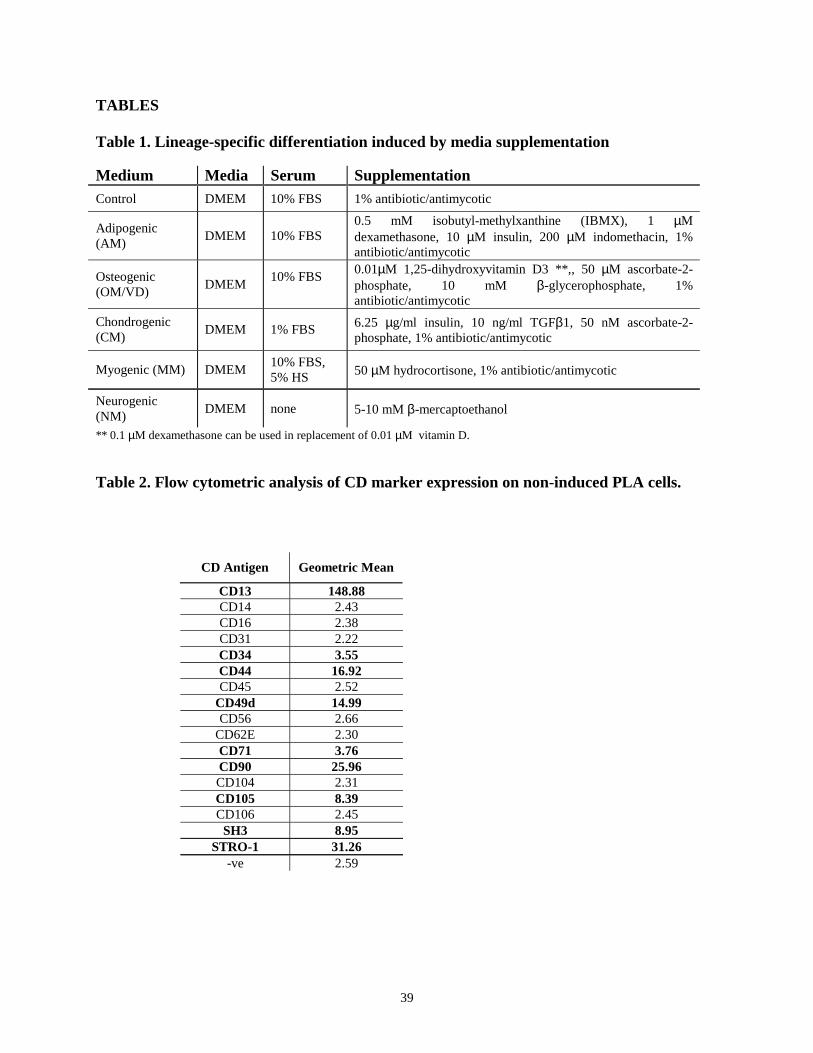
Table 1. Lineage-specific differentiation induced by media supplementation Medium Media Serum Supplementation Control DMEM 10% FBS 1% antibiotic/antimycotic
Adipogenic (AM)
DMEM 10% FBS 0.5 mM isobutyl-methylxanthine (IBMX), 1 µM dexamethasone, 10 µM insulin, 200 µM indomethacin, 1% antibiotic/antimycotic
Osteogenic (OM/VD)
DMEM 10% FBS
0.01µM 1,25-dihydroxyvitamin D3 **,, 50 µM ascorbate-2-phosphate, 10 mM β-glycerophosphate, 1% antibiotic/antimycotic
Chondrogenic (CM)
DMEM 1% FBS 6.25 µg/ml insulin, 10 ng/ml TGFβ1, 50 nM ascorbate-2-phosphate, 1% antibiotic/antimycotic
Myogenic (MM) DMEM 10% FBS, 5% HS 50 µM hydrocortisone, 1% antibiotic/antimycotic
Neurogenic (NM)
DMEM none 5-10 mM β-mercaptoethanol
** 0.1 µM dexamethasone can be used in replacement of 0.01 µM vitamin D. Table 2. Flow cytometric analysis of CD marker expression on non-induced PLA cells.
CD13 148.88 CD14 2.43 CD16 2.38 CD31 2.22 CD34 3.55 CD44 16.92 CD45 2.52
CD49d 14.99 CD56 2.66
CD62E 2.30 CD71 3.76 CD90 25.96 CD104 2.31 CD105 8.39 CD106 2.45
SH3 8.95 STRO-1 31.26
-ve 2.59
CD Antigen Geometric Mean

40
REFERENCES Ailhaud, G., Grimaldi, P., Negrel, R. (1992). Cellular and molecular aspects of adipose tissue
development. Annu. Rev. Nutr. 12,207-33.
Atchley, W.R., Fitch, W.M., and Bronner-Fraser, M. (1994). Molecular evolution of the MyoD
family of transcription factors. Proc. Natl. Acad. Sci. USA. 91,11522-11526.
Benayahu, D., Kletter, Y., Zipori, D., and Weintroub, S. (1989). Bone-marrow derived stromal
cell line expressing osteoblast phenotype in vitro and osteogenic capacity in vivo. J. Cell
Physiol. 140,1-7.
Bennett, J.H., Joyner, C.J., Triffitt, J.T., and Owen, M.E. (1991). Adipocytic cells cultured from
marrow have osteogenic potential. J. Cell Sci. 99,131-139.
Benson, M.D., Bargeon, J.L., Xiao, G., Thomas, P.E., Kim, A., Cui, Y., and Franceschi, R.T.
(2000). Identification of a homeodomain binding element in the bone sialoprotein gene
promoter that is required for its osteoblast-selective expression. J. Biol. Chem.
275,13907-13917.
Beresford, J.N., Gallagher, J.A., and Russel, R.G.G. (1986). 1,25-Dihydroxyvitamin D3 and
human bone-derived cells in vitro: effects on alkaline phosphatase, type I collagen and
proliferation. Endocrinology. 119,1776-1785.
Bernlohr, D.A., Doering, t.L., Kelly, T.J., and Lane, M.D. (1985). Tissue specific expression of
p422 protein, a putative lipid carrier in mouse adipocytes. Biochem. Biophys. Res.
Commun. 132,850-855.
Bjornson, C.R.R., Rietze, R.L., Reynolds, B.A., Magli, M.C., and Vescovi, A.L. (1999). Turning
brain into blood: a hematopoietic fate adopted by adult neural stem cells in vivo. Science.
283,534-537.

41
Breen, E.C., Ignotz, R.A., McCabe, L., Stein, J.L., Stein, G.S., and Lian, J.L. (1994). TGFbeta
alters growth and differentiation related gene expression in proliferating osteoblasts in
vitro, preventing development of the mature bone phenotype. J. Cell. Biochem. 160,323-
335.
Bruder, S.P., Jaiswal, N., and Haynesworth, S. E. (1997). Growth kinetics, self-renewal, and the
osteogenic potential of purified human mesenchymal stem cells during extensive
subcultivation and following cryopreservation. J. Cell. Biochem. 64,278-94.
Bruder, S.P., Kurth, A. A., Shea, M., Hayes, W. C., Jaiswal, N., and Kadiyala, S. (1998a). Bone
regeneration by implantation of purified, culture-expanded human mesenchymal stem
cells. J. Orthop. Res. 16,155-62.
Bruder, S.P., Jaiswal, N., Ricalton, N. S., Mosca, J. D., Kraus, K. H., and Kadiyala, S. (1998b).
Mesenchymal stem cells in osteobiology and applied bone regeneration. Clin.
Orthop.S247-56.
Chen, X., D.B. Hausman, R.G. Dean, and G.J. Hausman. (1997). Differentiation-dependent
expression of obese (ob) gene by preadipocytes and adipocytes in primary cultures of
porcine stromal-vascular cells. Biochim. Biophys. Acta. 1359,136-42.
Conget, P.A., and Minguell, J. J. (1999). Phenotypical and functional properties of human bone
marrow mesenchymal progenitor cells. J. Cell Physiol. 181,67-73.
Cooper, M.S., Hewison, M., and Stewart, P.M. (1999). Glucocorticoid activity, inactivity and the
osteoblast. J. Endocrinol. 163,159-164.
Deng, W., Obrocka, M., Fischer, I., and Prockop, D.J. (2001). In vitro differentiation of human
marrow stromal cells into early progenitors of neural cells by conditions that increase
intracellular cyclic cAMP. Biochem. Biophys. Res. Commun. 282,148-152.

42
Dennis, J.E., Merriam, A., Awadallah, A., Yoo, J. U., Johnstone, B., and Caplan, A. I. (1999). A
quadripotential mesenchymal progenitor cell isolated from the marrow of an adult mouse.
J. Bone Miner. Res.14,700-9.
Dennis, J.E., Carbillet, J.P., Caplan, A.I., and Charbord, P. (2002). The STRO1+ marrow cell
population is multipotential. Cells Tissues Organs 170, 73-82.
Ducy, P., R. Zhang, V. Geoffroy, A.L. Ridall, and Karsenty, G. (1997). Osf2/Cbfa1: a
transcriptional activator of osteoblast differentiation. Cell. 89,747-54.
Evans, M., and Kaufman, M. (1981). Establishment in culture of pluirpotent cells from mouse
embryos. Nature. 292,154-156.
Farndale, R.W., Buttle, D.J., and Barrett, A.J. (1986). Improved quantitation and discrimination
of sulphated glycosaminoglycans by use of dimethylmethylene blue. Biochim. Biophys.
Acta. 883,173-177.
Ferrari, G., Cusella-De Angelis, G., Coletta, M., Paolucci, E., Stornaiuolo, A., Cossu, G., and
Mavilio, F. (1998). Muscle regeneration by bone marrow-derived myogenic progenitors
Science. 279,1528-30.
Friedenstein, A.J. 1990. Osteogenic stem cells in the bone marrow. In Bone and Mineral
Research. Vol. 7. J.N.M. Heersche, and Kanis, J.A., editor. Elsevier Science, San Diego.
243-272.
Galli, R., Borello, U., Gritti, A., Minasi, M.G., Bjornson, C., Coletta, M., Mora, M., DeAngelis,
M.G., Fiocco, R., Cossu, G., and Vescoci, A.L. (2000). Skeletal myogenic potential of
human and mouse neural stem cells. Nat. Neurosci. 3,986-991.
Galotto, M., Campanile, G., Robino, G., Cancedda, F.P., Bianco, P., and Cancedda, R. (1994).
Hypertrophic chondrocytes undergo further differentiation to osteoblast-like cells and

43
participate in the intial bone formation in developing chick embryo. J. Bone Miner.
Res.9,1239-1249.
Green, H., and Meuth, M. (1974). An established pre-adipose cell line and its differentiation in
culture. Cell. 3,127-133.
Grigoradis, A., Heersche, J.N.M., and Aubin, J. (1988). Differentiation of muscle fat, cartilage
and bone from progenitor cells present in a bone-derived clonal cell population: effect of
dexamethasone. J. Cell Biol. 106,2139-2151.
Gronthos, S., Graves, S.E., Ohta, S., and Simmons, P.J. (1994). The STRO-1+ fraction of adult
human bone marrow contains osteogenic precursors. Blood. 84,4164-4173.
Hall, P.A., and Watt, F.M. (1989). Stem cells: the generation and maintenance of cellular
diversity. Development. 106,619-633.
Hauner, H., P. Schmid, and E.F. Pfeiffer. (1987). Glucocorticoids and insulin promote the
differentiation of human adipocyte precursor cells into fat cells. J. Clin. Endocrinol.
Metabol. 64,832-835.
Haynesworth, S.E., Baber, M.A., and Caplan, A.I. (1992). Cell surface antigens on human
marrow-derived mesenchymal cells are detected by monoclonal antibodies. Bone. 13,69-
80.
Jabs, E.W., Muller, U., Li, X., Ma, L., Luo, W., Haworth, I.S., Klisak, I., Sparkes, R., Warman,
M.L., Mulliken, J.B., Snead, M.L., and Maxson, R. (1993). A mutation in the
homeodomain of the human MSX2 gene in a family affected with autosomal dominant
craniosynostosis. Cell. 75,443-450
Jaiswal, N., Haynesworth, S. E., Caplan, A. I., and Bruder, S. P. (1997). Osteogenic
differentiation of purified, culture-expanded human mesenchymal stem cells in vitro. J.
Cell. Biochem. 64,295-312.

44
Johnson, E.E., Urist, M.R., Finerman, G.A.M. (1988). Repair of segmental defects of the tibia
with cancellous bone grafts augmented with human bone morphogenic protein. A
preliminary report. Clin. Orthop. 236,249-257.
Johnstone, B., Hering, T. M., Caplan, A. I., Goldberg, V. M., and Yoo, J. U. (1998). In vitro
chondrogenesis of bone marrow-derived mesenchymal progenitor cells. Exp. Cell Res.
238,265-72.
Jonasson, L., Hansson, G.K., Bondjers, G., Bengtsson, G., and Olivecrona, T. (1984).
Immunohistochemical localization of lipoprotein lipase in human adipose tissue.
Atherosclerosis. 51,313-326.
Kuri-Harcuch, W., Wise, L.S., and Green, H. (1978). J. Biol. Chem. 252,2158-2160.
Lassar, A., and Munsterberg, A. (1994). Wiring diagrams: regulatory circuits and the control of
skeletal myogenesis. Curr. Opin. Cell Biol. 6,432-442.
Leboy, P.S., Beresford, J.N., Devlin, C., and Owen, M.E. (1991). Dexamethasone induction of
osteoblast mRNAs in rat marrow stromal cell cultures. J. Cell Physiol. 146,370-378.
Legasse, E., Connors, H., Al-Dhalimy, M et al. (2000). Purified hematopoietic stem cells can
differentiate into hepatocytes in vivo. Nutr. Med. 6,1229-1234.
Lendahl, U., Zimmerman, L.B., and McKay, R.D.G. (1990). CNS stem cells express a new class
of intermediate filament protein. Cell. 60,585-595.
Lennon, D.P., Haynesworth, S.E., Bruder, S.P., Jaiswal, N., and Caplan, A.I. (1996). Human and
animal mesenchymal progenitor cells from bone marrow: identification of serum for
optimal selection and proliferation. In Vitro Cell Dev. Biol. 32,602-611.
Levesque, J.B., Takamatsu, Y., Hilsson, S.K., Haylock, D.N., and Simmons, R.J. (2001).
Vascular cell adhesion molecule-1 (VCAM-1) is cleaved by neutrophil proteases in the

45
bone marrow following haematopoietic cell mobilization by granulocyte colony
stimulating factor. Blood. 98,1289-12990.
Lieberman, J.R., L.Q. Le, L. Wu, G.A. Finerman, A. Berk, O.N. Witte, and S. Stevenson. (1998).
Regional gene therapy with a BMP-2-producing murine stromal cell line induces
heterotopic and orthotopic bone formation in rodents. J. Orthop. Res. 16,330-9.
Lucas, P.A., Calcutt, A.F., Mulvaney, D.J., Young, H.E., and Southerland, S.S. (1992). Isolation
of putative mesenchymal stem cells from rat embryonic and adult skeletal muscle. In
Vitro Cell Biol. 28,154A.
Majeska, R.J., and Rodan, G.A. (1982). The effect of 1, 25 (OH)2D3 on alkaline phosphatase in
osteoblastci osteosarcoma cells. J. Biol. Chem. 257,3362.
Malaval, L., Madrowski, D., Gupta, A.K., and Aubin, J.E. (1994). Cellular expression of bone-
related proteins during in vitro osteogenesis in rat bone marrow stromal cell cultures. J.
Cell. Physiol. 158,555-572.
Mizuno, H., Zuk, P.A., Zhu, M., Lorenz, H.P., Benhaim, P., and Hedrick, M.H. (2001).
Myogenic differentiation of human processed lipoaspirate cells. Plastic and Reconstr.
Surg. 109,199-209.
Mullen, R.J., Buck, C.R., and Smith, A.M. (1992). NeuN, a neuronal specific nuclear protein in
vertebrates. Development. 116,210-211.
Muraglia, A., Cancedda, R., and Quarto, R. (2000). Clonal mesenchymal progenitors from
human bone marrow differentiate in vitro according to a hierarchical model. J. Cell Sci.
113,1161-1166.
Newberry, E.P., Latifi, T., and Towler, D.A. (1998). Reciprocal regulation of osteocalcin
transcription by the homeodomain proteins msx2 and dlx5. Biochemistry. 37,16360-
16368.

46
Ogeuch, O., Sooranna, S., Nicolaides, K.H., and Johnson, M.R. (2000). The relationship between
leptin concentration and bone metabolism in the human fetus. J. Clin. Endo. Meta.
85,1997-1999.
Osdoby, P., and Caplan, A.I. (1979). Osteogenesis in cultures of limb mesenchymal cells. Devel.
Biol. 73,84-102.
Owen, T.A., M. Aronow, V. Shalhoub, L.M. Barone, L. Wilming, M.S. Tassinari, M.B.
Kennedy, S. Pockwinse, J.B. Lian, and G.S. Stein. (1990). Progressive development of
the rat osteoblast phenotype in vitro: reciprocal relationships in expression of genes
associated with osteoblast proliferation and differentiation during formation of the bone
extracellular matrix. J Cell Physiol. 143,420-30.
Pittenger, M.F., Mackay, A. M., Beck, S. C., Jaiswal, R. K., Douglas, R., Mosca, J. D.,
Moorman, M. A., Simonetti, D. W., Craig, S., and Marshak, D. R. (1999). Multilineage
potential of adult human mesenchymal stem cells. Science. 284,143-7.
Reddi, A.H. (1982). Regulation of local differentiation of cartilage and bone by extracellular
matrix: a cascade type mechanism. Prog. Clin. Biol. Res. 110 Pt B,261-8.
Rikard, D.J., Sullivan, T.A., Shenker, B.J., Leboy, P.S., and Kazhdan, I. (1994). Induction of
rapid osteoblast differentiation in rat bone marrow stromal cell cultures by
dexamethasone and BMP-2. Devel. Biol. 161,218-228.
Ryoo, H.M., Hoffmann, H.M., Beumer, T., Frenkel, B., Towler, D.A., Stein, G.S., Stein, J.L.,
van Wijnene, A.J., and Lian, J.B. (1997). Stage-specific expression of Dlx-5 during
osteoblast differentiation: involvement in regulation of osteocalcin gene expression. Mol.
Endocrinology. 11,1681-1694.
Sanchez-Ramos, J., Song, S., Cardozo-Palaez, Hazzi, C., Stedeford, T., Willing, A., Freeman,
T.B., Saporta, S., Janssen, W., Patel, N., Cooper, D.R., and Sanberg, P.R. (2000). Adult

47
bone marrow stromal cells differentiate into neural cells in vitro. Exp. Neurol. 164,247-
256.
Satomura, K., Kresbach, P., Bianco, P., Gehron-Robey, P. (2000). Osteogenic imprinting
upstream of marrow stromal cell differentiation. J. Cell Biochem. 78,391-403.
Shamblott, M.J., Axelman, J., Wang, S., Bugg, E.M., Littlefield, J.W., Donovan, P.J.,
Blumenthal, P.D., Huggins, G.R., and Gearhart, J.D. (1998). Derivation of pluripotent
stem cells from culture human primordial germ cells. Proc. Natl. Acad. Sci. USA.
95,13726-13731.
Tachetti, C., Quarto, R., Nitsch, L., Hartmann, D.J., and Cancedda, R. (1987). In vitro
morphogenesis of chick embryo hypertrophic cartilage. J. Cell Biol. 106,999-1006.
Tanner, J.W., Leingang, K.A., Mueckler, M.M., and Glenn, K.C. (1992). Cell mechanism of the
insulin-like effect of growth hormone in adipocytes. Rapid translocation of the HepG2
type and adipocyte/muscle glucose transporters. Biochem. J. 182,99-106.
Toma, J.G., Akhavan, M., Fernandes, K.J., Barnabe-Heider, F., Sadikot, A., Kaplan, D.R., and
Miller, F.D. (2001). Isolation of multipotent adult stem cells from the dermis of
mammalian skin. Nat. Cell Biol. 3,778-784.
Totonoz, P., Hu, E., Graves, R.A., Budvari, A.I., and Speigelman, B.M. (1994). mPPARγ2:
tissue-specific regulator of an adipocyte enhancer. Genes Dev. 8,1224-1234.
Wakitani, S., Saito, T., and Caplan, A. I. (1995). Myogenic cells derived from rat bone marrow
mesenchymal stem cells exposed to 5-azacytidine. Muscle Nerve. 18,1417-1426.
Wang, E.A., Rosen, V., D-Alessandro, J.S., Bauduy, M., Cordes, P., Harada, T., Israel, D.I.,
Hewick, R.M., Kerns, K.M., and Lapan, P. (1990). Recombinant human bone
morphogenic protein induces bone formation. Proc. Natl. Acad. Sci. USA. 87,2220-2224.
48
Westin, S., Kurokawa, R., Nolte, R.T., Wisely, G.B., Mcinerney, E.M., Rose, D.W., Milburn,
M.V., Rosenfield, M.G., and Glass, C.K. (1988). Nature. 395,199-202.
Wise, L.S., and Green, H. (1979). Participation of one isozyme of cytosolic glycerophosphate
dehydrogenase in the adipose conversion of 3T3 cells. J. Biol. Chem. 254,273-275.
Woodbury, D., Schwarz, E.J., Prockop, D.J., and Black, I.B. (2000). Adult rat and human bone
marrow stromal cells differentiate into neurons. J. Neurosci. Res. 61,364-370.
Yoo, J.U., Barthel, T. S., Nishimura, K., Solchaga, L., Caplan, A. I., Goldberg, V. M., and
Johnstone, B. (1998). The chondrogenic potential of human bone-marrow-derived
mesenchymal progenitor cells. J. Bone Joint Surg. Am. 80,1745-57.
Young, H.E., Mancini, M. L., Wright, R. P., Smith, J. C., Black, A. C., Jr., Reagan, C. R., and
Lucas, P. A. (1995). Mesenchymal stem cells reside within the connective tissues of
many organs. Dev. Dyn. 202,137-44.
Zuk, P.A., Zhu, M., Mizuno, H., Huang, J.I., Futrell, W.J, Katz, A.J., Benhaim, P., Lorenz, H.
P., and Hedrick, M. H. (2001). Multi-lineage cells from human adipose tissue:
implications for cell-based therapies. Tissue Engineering. 7,211-226.

49
SUPPLEMENTAL FIGURE LEGENDS
Figure S1: PLA cells express a unique set of CD markers.
PLA cells and MSCs were processed for immunofluorescence for the indicated CD antigens.
Cells were co-stained with DAPI to visualize nuclei (blue) and the fluorescent images combined.
Figure S2: Adipogenic differentiation by PLA cells is accompanied by growth arrest.
Panel A: PLA cells were harvested and plated into triplicate 35mm tissue culture dishes per
differentiation period. All dishes were maintained in Control medium until approximately 80%
confluence was reached. The cells were induced with Adipogenic medium (AM) for the
indicated days. To determine cell number, cells were harvested in 0.25% trypsin/EDTA and
directly counted using a hemocytometer. Cell number was expressed as the number of PLA cells
(# cells (105)) versus differentiation time. As observed in pre-adipocyte cell lines, adipogenic
differentiation by PLA cells was associated with growth arrest. Panel B: PLA cells were
harvested and plated into 35mm tissue culture dishes. All dishes were maintained in Control
medium until approximately 80% confluence and the cells were induced with Adipogenic
medium (AM). For each time period, the cells were stained with Oil Red O (Zuk et al. 2000) to
detect lipid accumulation. A time-dependent increase in Oil Red O/lipid accumulation was
observed.
Figure S3: Adipogenic PLA cells express several genes consistent with adipogenic
differentiation: Comparison to MSCs and pre-adipocytes.
Panel A: PLA cells and MSC controls were cultured in Adipogenic medium (PLA – Fat and
MSC –Fat) or non-inductive Control medium (PLA – Control, MSC - Control). Cells were
processed for immunofluorescence for the expression of leptin and GLUT4. Cells were co-

50
stained with DAPI to visualize nuclei (blue) and the fluorescent images combined. Panel B: PLA
cells and MSC controls were cultured in Adipogenic medium (AM) or non-inductive control
medium (Control) for the indicated days. Total RNA was isolated, cDNA synthesized and PCR
amplification performed for the indicated genes. A murine pre-adipocyte cell line (3T3-L1) was
induced in AM for 14 days as an additional positive control. Duplicate reactions were amplified
using primers to β-actin as an internal control.
Figure S4: Osteogenic PLA cells can be characterized by distinct proliferative, synthetic
and mineralization phases.
Panel A: PLA cells were harvested and plated into triplicate 35mm tissue culture dishes. All
dishes were maintained in Control medium until approximately 50% confluence was reached.
The cells were induced with Osteogenic medium (OM) and cell number was counted at the
indicated days. To determine cell number, cells were harvested in 0.25% trypsin/EDTA and
directly counted using a hemocytometer. Cell number was expressed as the number of PLA cells
(# cells (105)) versus differentiation time. Osteogenic induction appeared to result in distinct
phases of proliferation, synthesis and mineralization. Panel B: PLA cells were harvested and
plated into duplicate 35mm tissue culture dishes. All dishes were maintained in Control medium
until approximately 50% confluence was reached. The cells were induced with Osteogenic
medium (OM) for the indicated time periods. For each time period, one dish was stained for
alkaline phosphatase (AP) activity and one dish was stained using a Von Kossa stain (VK) to
detect calcium phosphate (Zuk et al. 2000). Osteogenic induction resulted in the appearance of
AP activity and an increase in matrix mineralization.
51
Figure S5: Osteo-induced PLA cells express several genes and proteins consistent with
osteogenic differentiation: Comparison to MSCs and NHOsts.
Panel A: PLA cells and MSC positive controls were cultured in OM or maintained in Control
medium for 21 days. Cells were processed for immunofluorescence for the expression of
osteopontin, (OP), osteonectin (ON) and osteocalcin (OC). Cell surface expression of OP in
osteogenic MSCs is shown (arrow). Panel B: PLA cells and MSC positive controls were cultured
in OM or non-inductive Control medium (Control) for the indicated days. Total RNA was
isolated, cDNA synthesized and PCR amplification performed for the indicated genes. A human
osteoblast cell line (NHOst) was maintained in Control medium (Con) or induced for 4 weeks in
OM as an additional positive control. Duplicate reactions were amplified using primers to β-
actin as an internal control. PCR products were resolved by conventional agarose gel
electrophoresis.
Figure S6: Chondrogenic PLA cells express several genes consistent with cartilage
differentiation: Histologic and RT-PCR analyses.
Panel A: PLA cells, under micromass culture conditions, were induced in Chondrogenic medium
(CM) for up to 7 days. At the indicated time points, PLA cultures were stained with Alcian Blue
to detect sulfated proteoglycans. PLA cell condensation at 12 hours, ridge formation at 1 day and
spheroid formation from 2 to 7 days are shown. Panel B: PLA cells, under micromass culture
conditions, were induced in Chondrogenic medium (PLA - CM) for 4, 7, 10 and 14 days or
maintained in non-inductive Control medium for 10 days (PLA - Con). Cells were analyzed by
RT-PCR for the indicated genes. A chondrocyte cell line from human knee (NHCK) was induced
in a commercial pro-chondrogenic medium for 10 days as a positive control. Duplicate reactions
were performed using primers to β-actin as an internal control.
52
Figure S7: PLA clones (Adipose-Derived Stem Cells/ADSCs) exhibit multi-lineage capacity.
PLA cells were plated at extremely low confluency in order to result in isolated single cells.
Cultures were maintained in Control medium until proliferation of single PLA cells resulted in
the formation of well-defined colonies. The colonies were harvested using sterile cloning rings
and 0.25% trypsin/EDTA, subcloned and amplified in Cloning Medium (15% FBS, 1%
antibiotic/antimycotic in F12/DMEM (1:1)). The isolated PLA clones were differentiated in OM,
AM and CM and multi-lineage capacity assessed by histology and immunohistochemistry using
the following assays: Alkaline Phosphatase (Osteogenesis = O), Oil Red O (Adipogenesis = A)
and Alcian Blue (Chondrogenesis = C). Tri-lineage, single PLA-cell derived clones (O, A, C)
were termed Adipose Derived Stem Cells (ADSCs).

53
SUPPLEMENTAL TABLES Table S1. List of Antibodies used.
Protein Antibody Name Clone Source
Osteocalcin αOC PAb OCG2 TaKaRa Shizuo
(Japan)
Osteopontin αOP PAb LF123 Dr. Larry Fisher
(NIH)
Osteonectin αON PAb LF37 Dr. Larry Fisher
(NIH)
Biglycan αBG PAb LF51 Dr. Larry Fisher
(NIH)
Decorin αDEC PAb LF136 Dr. Larry Fisher
(NIH)
Alkaline phosphatase αAP PAb LF47 Dr. Larry Fisher
(NIH)
Leptin αLEP A-20 Santa Cruz Biotechnology
(Santa Cruz, CA)
GLUT4 αG4 H-61 Santa Cruz Biotechnology
(Santa Cruz, CA) Microtubule associated
protein-2 αMAP MAb AP20 Leinco Technologies
(St. Louis, MO)
Neurofilament 70 KDa αNF MAb 8A1 Leinco Technologies
(St. Louis, MO)
Tau αTAU MAb TAU-2 Leinco Technologies
(St. Louis, MO)
Trk-a (NGF receptor) αTRK MAb 763 Santa Cruz Biotechnology
(Santa Cruz, CA)
Neuronal Nuclei αNeuN MAb Santa Cruz Biotechnology
(Santa Cruz, CA)
Glial fibrillary protein αGFAP PAb 6F2 DAKO
(Carpinteria, CA) Cytosolic heat shock
protein 70 kDa αHSC PAb Stressgen
(Victoria, BC)
Myosin Heavy Chain αMYS my-32 Biomeda
(Foster City, CA)
Collagen type II αCNII MAb II-4CII ICN
(Aurora, OH)
Keratan sulfate αKS MAb 5-D-4 ICN
(Aurora, OH)
Chondroitin-4-sulfate αCS MAb ICN
(Aurora, OH) Cluster designation
antigens αCD MAb’s BD Pharmingen (San Diego, CA)
PECAM-1 αCD31 9G11 R&D Systems
(Minneapolis, MN) Transferrin receptor
(CD71) αCD71 MAb H68.4 Zymed
(South San Francisco, CA) MAb – monoclonal antibody PAb – polyclonal antibody

55
Table S2. Oliogonucleotide primer sequences and expected PCR product sizes
Lineage Gene Oligonucleotide primers Product size 5’ TGTGGGAGCTAATCCTGTCC Osteonectin (ON) 3’ T CAGGACGTTCTTGAGCCAGT
400 bp
5’ GCTCTAGAATGAGAATTGCACTG Osteopontin (OP) 3’ GTCAATGGAGTCCTGGCTGT
270 bp
5’ GCTCTAGAATGGCCCTCACACTC Osteocalcin (OC) 3’ GCGATATCCTAGACCGGGCCGTAG
302 bp
5’ CTCACTACCACACCTACCTG Core binding factor α-1 (CBFA-1) 3’ TCAATATGGTCGCCAAACAGATTC
320 bp
5’ GAGAGAGAGGCTTCCCTGGT Collagen I (CNI) (α1 chain) 3’ CACCACGATCACCACTCTTG
300 bp
5’ TGAAATATGCCCTGGAGC Alkaline phosphatase (AP) 3’ TCACGTTGTTCCTGTTTAG
475 bp
5’ ACATGGCTTCCTTCACCAAG Retinoid X Receptor alpha (RXRα) 3’ CAGCTCAGCCTCCAGGATCC
300 bp
5’ CTCGTCCAGCTTCTCCAATC Vitamin D Receptor (VDR) 3’ GCTCCTCCTCATGCAAGTTC
400 bp
5’ CCTGTCAAGAGCATCAGCAG c-fos 3’ GTCAGAGGAAGGCTCATTGC
348 bp
5’ TTACCACATCCCAGCTCCTC msx2 3’ GCATAGGTTTTGCAGCCATT
201 bp
5’ TTGCCCGAGTCTTCAGCTAC distal-less 5 (dlx5) 3’ TCTTTCTCTGGCTGGTTGGT
254 bp
5’ AGACCTGTATCGCAGGCACT Bone morphogenic protein (BMP2) 3’ CCAACCTGGTGTCCAAAAGT
350 bp
5’ ACCGTAGCTGTGCTCATCCT
BONE
Parathyroid Hormone Receptor 1 (PTHR) 3’ CCCTCCACCAGAATCCAGTA
300 bp
5’ TGGTTGATTTTCCATCCCAT aP2 3’ TACTGGGCCAGGAATTTGAT
150 bp
5’ GAGATTTCTCTGTATGGCACC LPL 3’ CTGCAAATGAGACACTTTCTC
276 bp
5’ GCTCTAGAATGACCATGGTTGAC PPAR gamma1 (γ1)
3’ ATAAGGTGGAGATGCAGGCTC 250 bp
5’ GGCTTTGGCCCTATCTTTTC Leptin 3’ GCTCTTAGAGAAGGCCAGCA
325 bp
5’ AGCAGCTCTCTGGCATCAAT GLUT4 3’ CAATGGAGACGTAGCACATG
275 bp
5’ GCTGTTATGGGTGAAACTCTG
FAT
PPAR gamma2 (γ2) 3’ ATAAGGTGGAGATGCAGGTTC
325 bp
5’ ATGATTCGCCTCGGGGCTCC Collagen II (α1 chain)
3’ TCCCAGGTTCTCCATCTCTG 260 bp
5’ GCAGAGACGCATCTAGAAATT Aggrecan 3’ GGTAATTGCAGGGAACATCAT
505 bp
5’ CCTTTGGTGAAGTTGGAACG Decorin 3’ AAGATGTAATTCCGTAAGGG
300 bp
5’ TGCAGAACAACGACATCTCC Biglycan 3’ AGCTTGGAGTAGCGAAGCAG
475 bp
5’ TGGAGTGGGAAAAAGAGGTG
CARTILAGE
Collagen X 3’ GTCCTCCAACTCCAGGATCA
600 bp
5’ AAGCGCCATCTCTTGAGGTA MyoD1 (MD1) 3’ GCGCCTTTATTTTGATCACC
500 bp
5’ CCACCTCCAACTGCTCTGAT Myf5 3’ GGAGTTCGAGGCTGTGAATC
250 bp
5’ TGGGCGTGTAAGGTGTGTAA Myogenin (MG0 3’ TTGAGCAGGGTGCTTCTCTT
130 bp
5’ TGTGAATGCCAAATGTGCTT Myosin (MYS) 3’ GTGGAGCTGGGTATCCTTGA
750 bp
5’ AGAGAAAATCTGCCCCCACT Myf6 3’ GATGGAAGAAAGGCATCGAA
410 bp
5’ GGTGGAGGTGCTCACTAACC
MUSCLE
Desmin 3’ TGTTGTCCTGGTAGCCACTG
600 bp
5’ AATGCTGGCTTCAAGGAGAC Glial Fibrillary Acidic Protein (GFAP) 3’ CCAGCGACTCAATCTTCCTC
406 bp
5’ TGGCGATGGGATATTTTCTC GAD65
3’ GCACTCACGAGGAAAGGAAC 300 bp
5’ GGAGTCGTTTCAGATGTGGG Nestin 3’ AGCTCTTCAGCCAGGTTGTC
242 bp
5’ TACAGGCTCCACCGAAGACT
NERVE
Choline acetyltransferase (CHaT) 3’ AATCCTGGTCTCTGGCCTTC
376 bp

56

PLA MSC
CD58
CD49d CD49d
CD106 CD106
A.
CD 106
CD 49d
B.
γPE
CD 106
CD 49d
MSC
Mean Geo Mean Median8.90 7.59 7.84
7.89 6.45 6.55
24.71 18.37 19.29
CD106γPE
CD49dγPE
PLA
11.80 9.40 9.14
14.24 12.33 12.04
9.00 5.98 6.39
Mean Geo Mean Median
CD106γPE
CD49dγPE

A.
PLA - Control
PLA - Fat
Leptin GLUT4B.
GLUT4
4 7 14 21 28 35
Differentiation time (days)
GPD
H//u
g
PLA - AMPLA - CM3T3 - AM
0
0.0005
0.0010
0.0015
0.0020
0.0025
0.0030
C. D.
-3.5
-3.0
-2.5
-2.0
-1.5
-1.0
-0.5
0
1.0
2.0
3.0
D21 D35
-fol
d ch
ange
in e
xpre
ssio
n le
vel
(vs.
1 w
eek
indu
ctio
n)
LPL
-4.0
-4.5
ControlAMPLA
4 7 14 21 28 35
aP2
LPL
γ1
γ2
β-actin
4 7 14 21 28 35
Leptin
3T3-L1

B.
MSC - Control
A.
C.7d 28d
OMCon
CNI
Tfn
OP
ON
AP
VDR
Actin
RAR
D.
AP Ca2+
PLA
MSC
0
5
10
15
20
25
30
35
40
45
50
55
4 7 14 21 28 35 42
nmol
p-ni
trop
heno
l/min
/ug
Differentiation period (days)
0
0.5
1.0
1.5
2.0
2.5
3.0
3.5
4.0
4.5
4 7 14 21 28 35 42
Differentiation period (days)
mM
Ca2
+ /ug
0
5
10
15
20
25
30
35
40
45
50
55
4 7 14 21 28 35 42Differentiation period (days)
nmol
p-ni
trop
heno
l/min
/ug
0
0.5
1.0
1.5
2.0
2.5
3.0
3.5
4.0
4.5
4 7 14 21 28 35 42
Differentiation period (days)
mM
Ca2
+ /ug
OMControl
-7.0
-6.0
-5.0
-4.0
-3.0
-2.0
-1.0
0
1.0
2.0
3.0
7d21d
-fol
d ch
ange
in e
xpre
ssio
n(v
s. c
ontr
ol)
AP
0
10
20
30
40
50
60
70
7d 21d
induction time(days)
-fol
d ch
ange
in e
xpre
ssio
n(v
s. c
ontr
ol)
Cbfa-1
induction time(days)
OM Control
PLA
4 7 14 21 28 35 42 4 7 14 21 28 35 42
OC
Cbfa-1AP
CN1
β-actin
OP
ON
RXR
VDR
c-fos
msx2
dlx5
PTHR
BMP2
NHOST
Con 28
OMControl
OMControl
OMControl
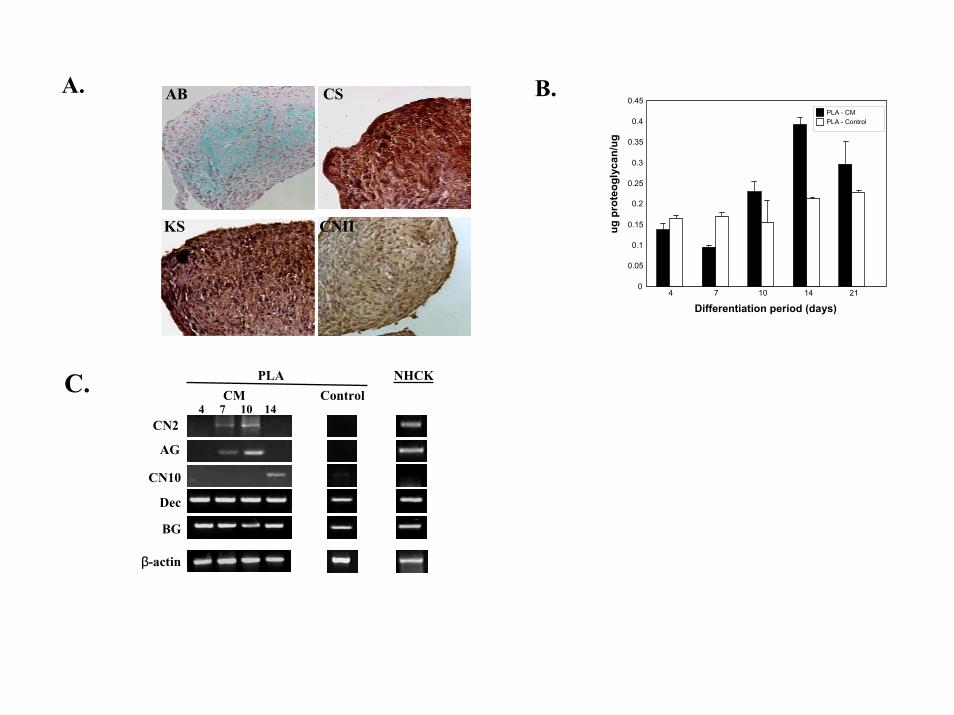
A. AB
KS
CS
CNII
B.
Differentiation period (days)
ugpr
oteo
glyc
an/u
g
PLA - CMPLA - Control
0
0.05
0.1
0.15
0.2
0.25
0.3
0.35
0.4
0.45
4 7 10 14 21
CM4 7 10 14
AG
CN2
CN10
Dec
BG
β-actin
ControlC. PLA NHCK

PLA SKM
1 3 6
MD1
MYS
Myf5
MG
β-actin
Myf6
DES
ConMM

PLA - Control PLA - NMA. B. Brain
α-NSE
α-NeuN
α-MAP2
α-GFAP
α-GalC
PLA
Nestin
ChaT
GAD65
GFAP
β-actin
Con
MBP
9h NPMMIIM
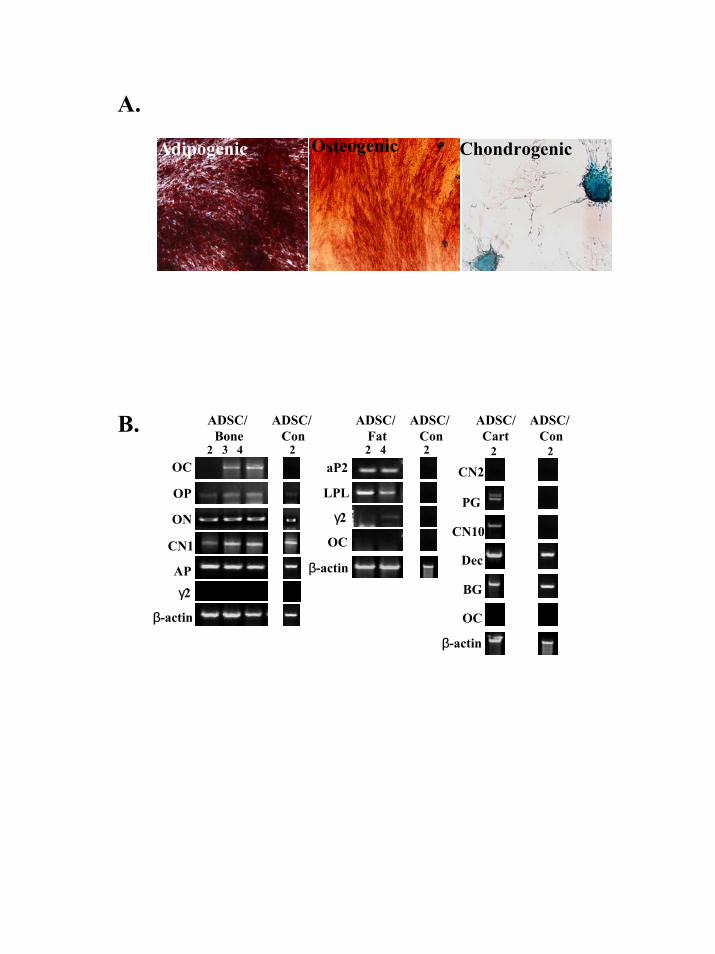
Adipogenic Osteogenic Chondrogenic
A.
ADSC/Cart
PG
CN2
CN10
Dec
BG
ADSC/ Con
22
OC
β-actin
ADSC/ Bone
2 3 4OC
OP
ADSC/ Con
2
ON
β-actin
CN1
APγ2
ADSC/ Fat
ADSC/ Con
2 4 2aP2
LPL
γ2
β-actin
OC
B.

PLA MSC PLA MSC
CD29 CD29
CD31 CD31
CD34
CD44 CD44
CD45 CD45 CD140
CD90 CD90
CD71 CD71
CD58 CD58
CD34
CD105
SH3 SH3
CD105
CD90

4 days 7 days 21 days 28 days
A.
B.
0
1.0
2.0
3.0
4.0
5.0
6.0
7.0
8.0
# ce
lls (x
105 )
1 3 5 7 9 11 13 191715
Differentiation time(days)

Leptin
MSC - Control
MSC - Fat
Glut4
PLA - Control
PLA - Fat
Leptin Glut4
Control
MSCAM Control
PLA4 7 14 21 28 35
aP2
LPL
γ1
γ2
β-actin
AM4 7 14 21 28 35 4 7 14 21 28 35 4 7 14 21 28 35
3T3-L1
A. B.
Leptin
GLUT4

d3 d13d7 d21
A.
0
# ce
lls (x
106 )
0.00
0.50
1.00
1.50
2.00
2.50
3.00
3.50
4.00
4.50
5.00
5.50
1 3 5 7 9 11 13 15 17 19
6.00
6.50
7.00
7.50
21 23 25 27 29 31 33 35
B.
d14 d21 d28 d35
d35d28
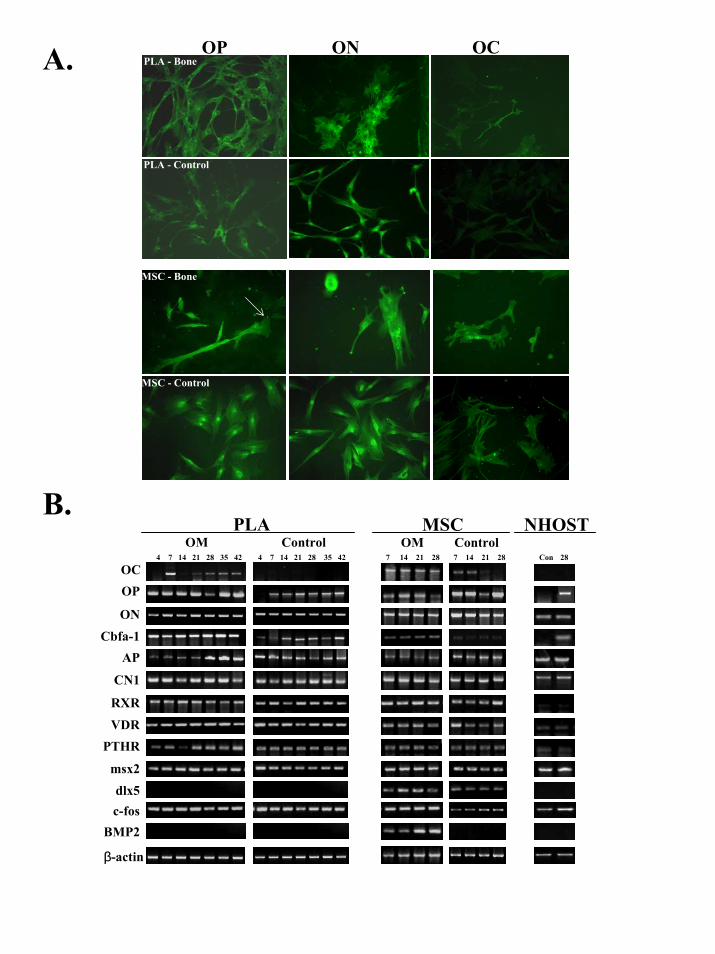
OM ControlPLA
4 7 14 21 28 35 42 4 7 14 21 28 35 42
OC
Cbfa-1AP
CN1
β-actin
OP
ON
RXR
VDR
MSCOM Control
7 14 21 28 7 14 21 28
NHOSTCon 28
c-fos
msx2dlx5
PTHR
BMP2
MSC - Bone
MSC - Control
ONOP OCPLA - Bone
PLA - Control
A.
B.
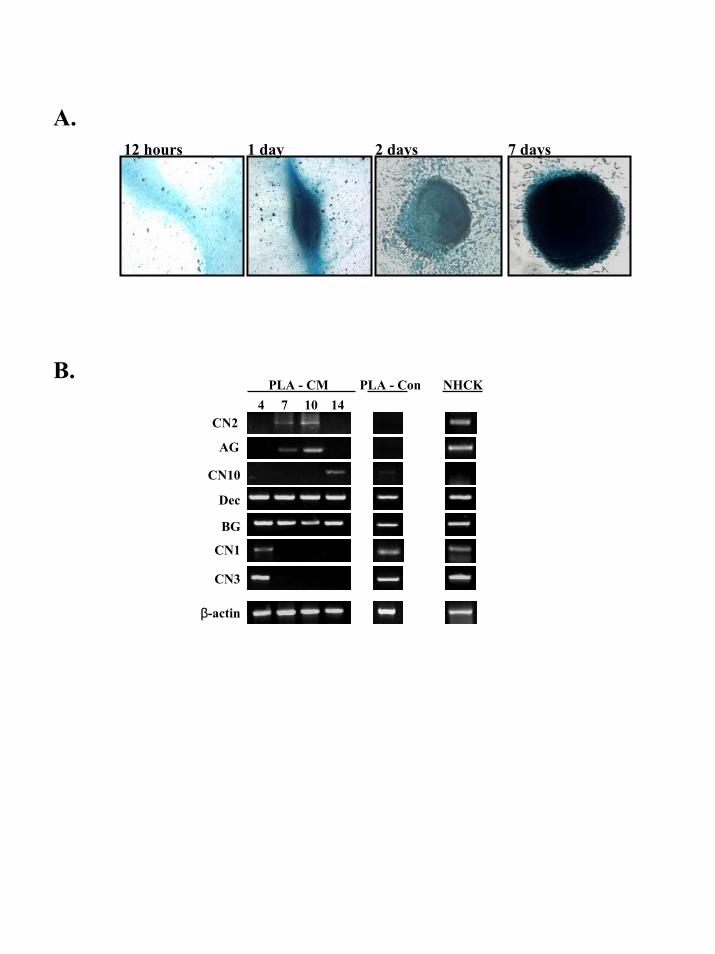
PLA - CM4 7 10 14
AG
CN2
CN10
Dec
BG
β-actin
CN1
PLA - Con
CN3
NHCK
12 hours 1 day 2 days 7 days
A.
B.

Adipogenic Osteogenic Chondrogenic
Tri: (A, O, C)
Dual: (A, C)
Dual: (O, C)
Dual: (A, O)
Single: (A)
Related Documents