This article appeared in a journal published by Elsevier. The attached copy is furnished to the author for internal non-commercial research and education use, including for instruction at the authors institution and sharing with colleagues. Other uses, including reproduction and distribution, or selling or licensing copies, or posting to personal, institutional or third party websites are prohibited. In most cases authors are permitted to post their version of the article (e.g. in Word or Tex form) to their personal website or institutional repository. Authors requiring further information regarding Elsevier’s archiving and manuscript policies are encouraged to visit: http://www.elsevier.com/copyright

Welcome message from author
This document is posted to help you gain knowledge. Please leave a comment to let me know what you think about it! Share it to your friends and learn new things together.
Transcript
This article appeared in a journal published by Elsevier. The attachedcopy is furnished to the author for internal non-commercial researchand education use, including for instruction at the authors institution
and sharing with colleagues.
Other uses, including reproduction and distribution, or selling orlicensing copies, or posting to personal, institutional or third party
websites are prohibited.
In most cases authors are permitted to post their version of thearticle (e.g. in Word or Tex form) to their personal website orinstitutional repository. Authors requiring further information
regarding Elsevier’s archiving and manuscript policies areencouraged to visit:
http://www.elsevier.com/copyright
Author's personal copy
Research report
Dissecting the component deficits of perceptual imbalancein visual neglect: Evidence from horizontalevertical lengthcomparisons
Pom Charras a,b,*, Juan Lupianez a, Raffaella Migliaccio b,c, Monica Toba b,Pascale Pradat-Diehl d, Christophe Duret e and Paolo Bartolomeo b,c
aUniversidad de Granada, Spainb Inserm-UPMC UMRS 975, Hopital Pitie-Salpetriere, Paris, FrancecDepartment of Psychology, Catholic University, Milan, ItalydAPHP e Hopital Pitie-Salpetriere Service de Medecine Physique et Readaptation, Paris, FranceeService de Reeducation et de Readaptation Fonctionnelle, Clinique Les Trois Soleils, Boissise le Roi, France
a r t i c l e i n f o
Article history:
Received 17 August 2010
Revised 22 September 2010
Accepted 13 January 2011
Action editor Robert McIntosh
Published online 3 February 2011
Keywords:
Neglect
Left underestimation
Right overestimation
Pre-attentive mechanisms
Symmetry
a b s t r a c t
Introduction: Signs of left unilateral neglect often occur after damage to the right hemi-
sphere and entail a lefteright imbalance in stimulus processing. Typically, neglect patients
deviate rightward when bisecting lines. An underestimation of the left portion of the line
and/or a right overestimation could explain this effect.
Methods: Here we dissected their respective contribution by asking participants to compare
a vertical segment to a horizontal segment, either on the left or on the right. We also tested
whether neglect patients exhibited the symmetry law, whereby normal participants
underestimate symmetrically bisected lines as compared to asymmetrically bisected lines.
Results: Controls and patients underestimated symmetric figures. Depending on the degree
of lefteright horizontal competition, neglect patients underestimated left-sided stimuli or
overestimated right-sided stimuli.
Conclusions: We concluded that two independent deficits contribute to neglect signs:
a deficit in attentional orienting to the left, which can be worsened by left hemianopia,
perhaps depending on impaired functioning of right-hemisphere attentional networks,
and a tendency for attention to be captured by right-sided stimuli, possibly resulting from
the activity of an isolated left hemisphere. Finally, the symmetry law was preserved in
neglect patients, and thus appears to be driven by pre-attentive mechanisms.
ª 2011 Elsevier Srl. All rights reserved.
1. Introduction
Patients with right posterior brain damage often show signs of
left visual neglect, which typically entail a lefteright imbalance
in stimulus processing (Vallar, 2001; Bartolomeo, 2007; Mort
et al., 2003). For example, when asked to bisect horizontal
lines, neglect patients shift the subjectivemidpoint towards the
right (Schenkenberg et al., 1980). This effect has often been
* Corresponding author. Departamento de Psicologıa Experimental y de Fisiologıa del Comportamiento, Campus de Cartuja, S/N. C.P.18071, Granada, Spain.
E-mail address: [email protected] (P. Charras).
Available online at www.sciencedirect.com
Journal homepage: www.elsevier.com/locate/cortex
c o r t e x 4 8 ( 2 0 1 2 ) 5 4 0e5 5 2
0010-9452/$ e see front matter ª 2011 Elsevier Srl. All rights reserved.doi:10.1016/j.cortex.2011.01.008
Author's personal copy
accounted for by neglect of the left-sided part of the line.
Patients seemto ignore theextreme left part of the lineand thus
underestimate its length ascompared to the right. But left-sided
impairment can also be accompanied by a bias towards right-
sided objects (D’Erme et al., 1992; Gainotti et al., 1991; Natale
et al., 2005; Bartolomeo and Chokron, 2002) that might also
contribute to the lefteright imbalance. For example, right-sided
objects exert a sort of “magnetic attraction” on patients’ gaze
and attention (Gainotti et al., 1991; see alsoDeRenzi et al., 1989),
as if they automatically captured attention (Gainotti et al., 1991;
Bartolomeo and Chokron, 1999; Marshall and Halligan, 1989). A
deterioration of the processing of left-sided stimuli by themere
presence of right-sided stimuli also occurs in visual extinction
(Baylis et al., 1993; Ward and Goodrich, 1996; Humphreys et al.,
1994). Therefore, even though the ipsilesional visual field is
sometimes considered as being “intact”, it is important to
underline that right-sided stimuli are not correctly or normally
processed, but can rather be over-enhanced or over-prioritized
(Snow and Mattingley, 2006, 2008; Kinsbourne, 1993;
Bartolomeo and Chokron, 1999; Bartolomeo et al., 1999).
Consistent with this proposal, the rightward bias in line bisec-
tion can be reduced, although not eliminated, by cuing the left
endpoint of the line (Heilman and Valenstein, 1979; Riddoch
and Humphreys, 1983; Bonato et al., 2008). The fact that cuing
the left endpointof the linedoesnoteliminatebutonlyweakens
the rightward bias, suggests that the lefteright imbalance
cannot rely exclusively on neglect of the left part of the line.
Consequently, the role of the right part in the global lefteright
imbalance has to be reconsidered (Ishiai et al., 2000; see also
McIntosh et al., 2005). Recently, Urbanski and Bartolomeo (2008)
focused on the role of the right portion in the lefteright imbal-
ance by using an imaginal endpoint task in which patients had
to place the left and right endpoints of an imaginary line for
which the centre was provided. To test the importance of the
rightpart, theorder ofmarking (left-to-rightor right-to-left)was
manipulated: participants had to place first the left endpoint
and then the right, or vice-versa. Their results clearly showed
that although the typical rightwards error persisted in the right-
to-left condition, it was eliminated or even reversed in the left-
to-right condition (i.e., when patient first drew the left endpoint
and then the right one). This finding suggests that right over-
processing in the framework of a competition between right-
and left-sided objects might be an important determinant of
lefteright imbalance in neglect.
More recently, Charras et al. (2010) proposed a novel
methodological approach to separately assess the relative
roles of left underestimation and right overestimation in the
final lefteright imbalance, characteristic of neglect. They used
a line extension task, in which a vertical line was centrally
displayed on a sheet of paper. Participants were asked to trace
a horizontal segment, perpendicular to the vertical (L shape)
either on the left or right side. Thus, it was possible to disso-
ciate the relative roles of left underestimation and right
overestimation in the lefteright imbalance. The results
showed that performance of neglect patients was biased on
the left side, consistent with a left underestimation, but was
identical to controls on the right side.
In the present study, our first objective was to replicate this
result using a line length comparison task in which partici-
pants had to judgewhich one of the two linese vertical versus
horizontal e was the longest. Vertical lines were always cen-
trally presented, while horizontal lines were displayed either
to the left or to the right of the vertical line. Therefore,
a vertical line was either compared to a left-sided horizontal
line to test the left underestimation (see Fig. 1, left L) or to
a right-sided horizontal line to test the right overestimation
(see Fig. 1, right L). On the basis of the results of Charras et al.
(2010), we expected to observe left underestimation rather
than right overestimation. Note that in these two L configu-
rations, there is no lefteright competition, as the horizontal
line is either displayed towards the left or the right of the
vertical line. A further aim was to induce a lefteright
competition in the configurations. To do so, we added
configurations in which the vertical line remained centrally
presented but horizontal lines were bisected, such that one
part falls in the left side of space and the other in the right side
(see left and right Ts and Xs1 in Fig. 1). Previous studies with
normal participants revealed that vertical lines are slightly
overestimated in the left and right Ts as compared to hori-
zontal lines, but horizontal lines are overestimated in the left
and right Xs as compared to vertical lines (Charras and
Lupianez, 2009, 2010). Therefore, we were able to test the
role of lefteright competition in the case of vertical emphasis
(in the T configurations), or of horizontal emphasis (in the X
configurations). Note that the vertical or horizontal emphasis
was assumed to directly result from the vertical
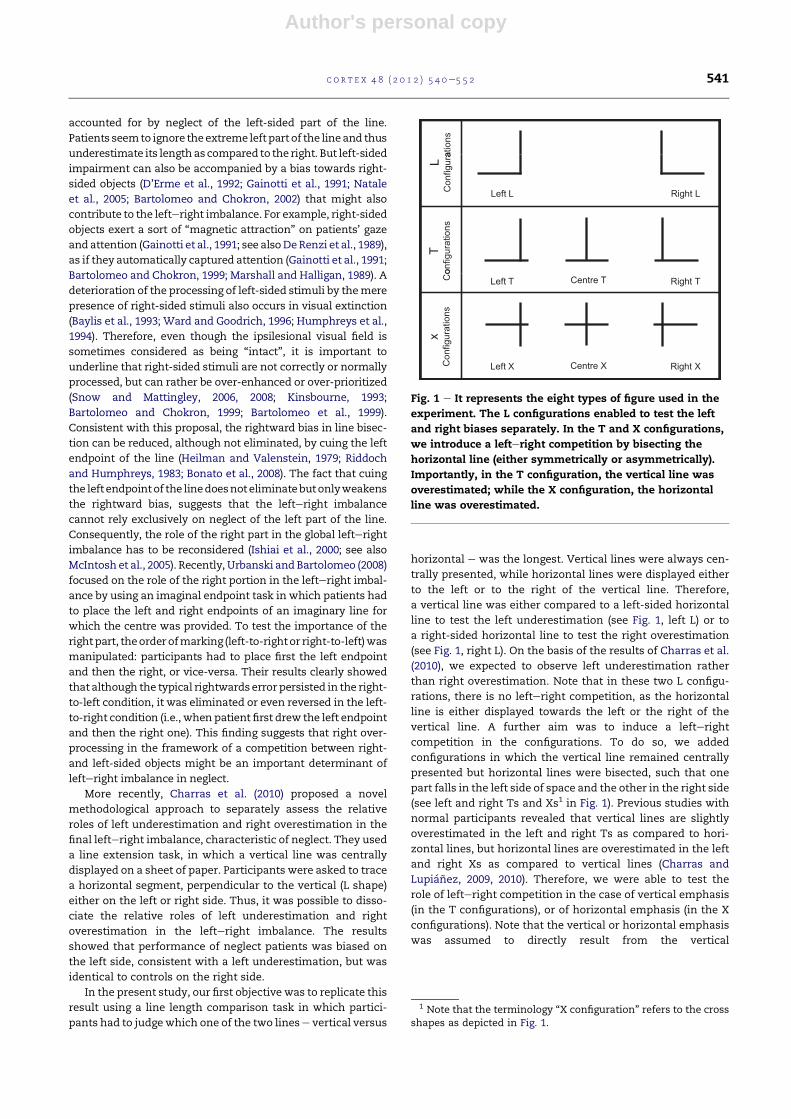
Fig. 1 e It represents the eight types of figure used in the
experiment. The L configurations enabled to test the left
and right biases separately. In the T and X configurations,
we introduce a lefteright competition by bisecting the
horizontal line (either symmetrically or asymmetrically).
Importantly, in the T configuration, the vertical line was
overestimated; while the X configuration, the horizontal
line was overestimated.
1 Note that the terminology “X configuration” refers to the crossshapes as depicted in Fig. 1.
c o r t e x 4 8 ( 2 0 1 2 ) 5 4 0e5 5 2 541
Author's personal copy
overestimation in the T configurations or from the horizontal
overestimation in the X configurations.2
In two further configurations, the centre T and X, the hori-
zontal line was symmetrically bisected. In the visual percep-
tion literature, it is well known that symmetry drastically
influences line length estimation. The horizontal vertical illu-
sionwith so-called “centreT” stimuli (see Fick, 1851; Kunnapas,
1955, 1957; Finger and Spelt, 1947; Avery and Day, 1969) best
demonstrates this kind of perceptual distortion (Fig. 1).
In this configuration the horizontal line is perceived as
being shorter than the vertical line, even though they are of
the same physical length. This horizontal underestimation is
mainly caused by the symmetric bisection of the horizontal
line. Indeed, symmetric bisections are underestimated
(Kunnapas, 1955; Wolfe et al., 2005; Charras and Lupianez,
2009). But importantly, as soon as the two lines are symmet-
rically bisected (see centre X in Fig. 1), the visual distortion is
abolished, and none of the lines is overestimated by normal
participants (Charras and Lupianez, 2010).
Therefore, the present study also aimed at testing whether
neglect patients, like controls, would underestimate the hori-
zontal line in the centre T configuration, but would show no
bias in the centre X, thus suggesting that the symmetry law
might rely on different mechanisms, perhaps at a lower pro-
cessing level than those implicated inpatients’ attentional bias.
Further issues of interest include the anatomical bases of
biased length estimation. The lesional bases of biased line
bisection have often been referred to posterior brain lesions
(Binder et al., 1992; Rorden et al., 2006). Thiebaut de Schotten
et al. (2005) were recently able to directly probe the anatom-
ical bases of rightward deviation on line bisection by using
electrical cortical and subcortical stimulation in human
neurosurgical patients. They found small but significant
deviations with temporary inactivation of the supramarginal
gyrus of the parietal lobe and of the temporaleparietal junc-
tion; however, the most dramatic deviations occurred in one
patient upon temporary disconnection of a branch of the
superior longitudinal fasciculus (SLF), consistent with
previous evidence from stroke patients (Doricchi and
Tomaiuolo, 2003). In further work using diffusion tensor
imaging (DTI) tractography in stroke patients, damage to the
inferior fronto-occipital fasciculus (IFOF) was also found to be
present in neglect patients, but absent in patients with similar
cortical lesions in the right hemisphere and no signs of neglect
(Urbanski et al., 2008). In the present study, we obtained high-
definition magnetic resonance imagings (MRIs) for all the
patients. Lesions were mapped and localized in relation both
to cortical and subcortical grey matter structures (Rorden
et al., 2007) and to the course of major white-matter fasciculi
(Catani and Thiebaut de Schotten, 2008).
The present study had two principal aims: (1) to disen-
tangle the relative contribution of left underestimation and
right overestimation to line bisection errors in visual neglect;
(2) to explore the integrity of early perceptual processes in
neglect, such as those implicated in the symmetry law. We
used a new methodology, which allowed us to separately test
and quantify left and right biases by comparing vertical lines
to either left or right horizontal lines (see Charras et al., 2010).
2. Methods
2.1. Participants
Eight right-handed patients with unilateral lesions in the right
hemisphere [seven men; mean age, 57 years; standard devi-
ation (SD), 14.5] participated in this study. All of them showed
signs of moderate to severe left unilateral spatial neglect on
a battery of paper-and-pencil tests including the following
standard clinical tests: line cancellation (Albert, 1973), bell
cancellation (Gauthier et al., 1989), letter cancellation and line
bisection (Azouvi et al., 2002). Four patients had intact visual
fields on confrontation; the remaining four had left homony-
mous hemianopia (HLH), confirmed by Goldmann perimetry
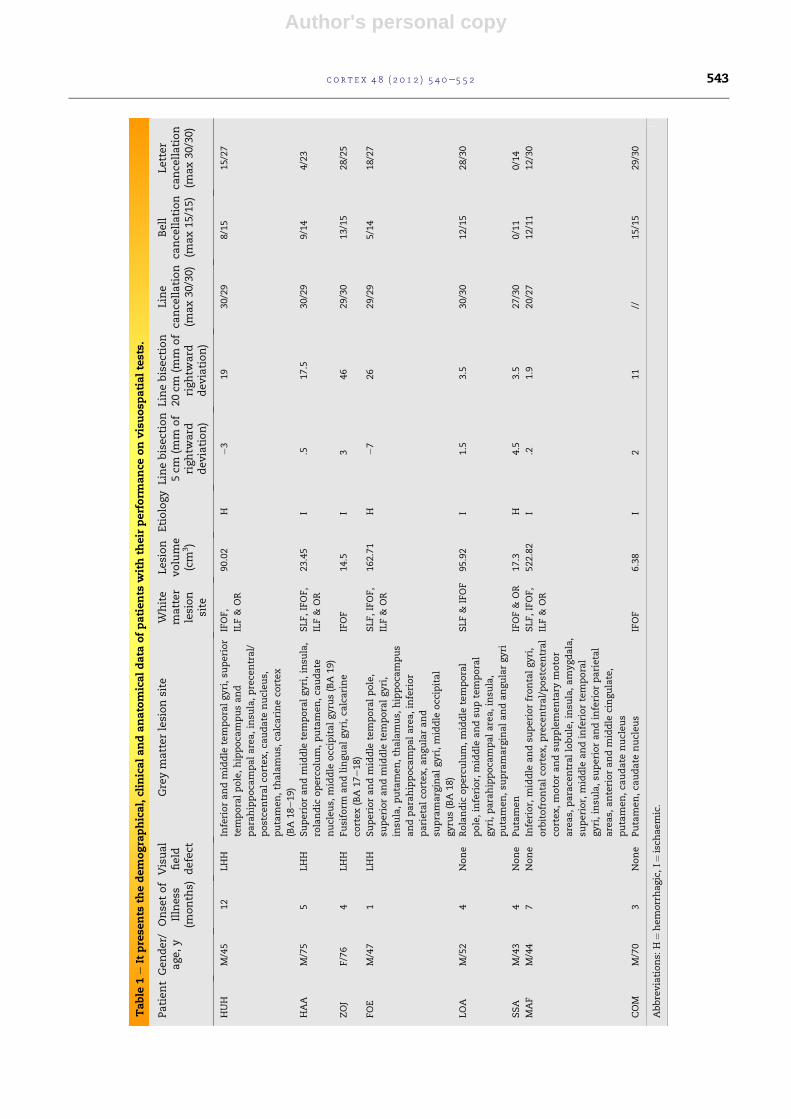
in two cases. Clinical and anatomical data for each patient are
represented in Table 1, with the detailed description of both
grey and white matter lesion involvement. Eight right-handed
healthy participants without neurological impairment (seven
men; mean age, 54 years; SD, 12) also consented to participate
in the experiment.
2.2. Brain imaging and lesion analysis
Brain MRI scans included T1, T2, fluid attenuated inversion
recovery, and diffusion images obtained with standard
parameters on a 3T General Electric scanner. Lesion extent
was determined for each patient by manually drawing the
lesion borders images directly onto the original 3D T1 MRI, by
using a 325� 203 mm pen tablet (Wacom Intous4 large, http://
www.wacom.com). To reduce lesion-induced registration
errors, spatial normalization was performed using a mask
that excluded the damaged areas of the brains, thereby pre-
venting these areas from biasing the transformation (Brett
et al., 2001). The 3D brain scan and lesion volume were then
normalized to the standard Montreal Neurological Institute
(MNI) template in Statistical Parametric Mapping-5 (http://
www.fil.ion.ucl.ac.uk/spm) running under Matlab 7.5 (http://
www.mathworks.com). After normalization, the brain lesion
was segmented and its borders were redefined in the
normalized brain. MRIcron software (www.mricro.com/
mricron; Rorden and Brett, 2000) was used to estimate the
lesion and to label the lesion sites based on the Automated
Anatomical Labelling map volume (Tzourio-Mazoyer et al.,
2002, see their Table 1). Furthermore the MRIcron software
was applied to generate group-specific lesion overlay plots for
all patients (Fig. 4A) and subtraction plots displaying voxels
selectively involved in patients with hemianopia (all neglect
patients minus patients without hemianopia, see Fig. 4B).
Finally, in order to identify the involvement of specific white
matter fiber tracts, recent work by Catani and Thiebaut de
Schotten (2008) based on DTI-tractography on normal partic-
ipants, was used as a reference. This study is in the same
space as the MNI reference brain. The overlapping between
the lesion map and specific white-matter tracts in the right
hemisphere was visually assessed. The tracts we considered
2 In the present manuscript, the under or overestimations ofthe vertical or horizontal lines are not absolute, but ratherrelative and highly dependent of the verticalehorizontalcomparison process at hand in the task.
c o r t e x 4 8 ( 2 0 1 2 ) 5 4 0e5 5 2542
Author's personal copy
Table
1e
Itprese
nts
thedem
ogra
phical,clin
icalandanatom
icaldata
ofpatients
withth
eir
perform
ance
onvisuosp
atialtests.
PatientGender/
age,y
Onse
tof
Illnes
s(m
onth
s)
Visual
field
defect
Greymatterlesionsite
White
matter
lesion
site
Lesion
volume
(cm
3)
Etiology
Linebisec
tion
5cm
(mm
of
rightw
ard
deviation)
Linebisection
20cm
(mm
of
rightw
ard
deviation)
Line
cance
llation
(max30/30)
Bell
cance
llation
(max15/15)
Letter
cance
llation
(max30/30)
HUH
M/45
12
LHH
Inferiorandmiddle
temporalgyri,su
perior
temporalpole,hippoca
mpusand
parahippoca
mpalarea,insu
la,prece
ntral/
postce
ntralco
rtex,ca
udate
nucleus,
putamen,th
alamus,
calcarineco
rtex
(BA
18e19)
IFOF,
ILF&
OR
90.02
H�3
19
30/29
8/15
15/27
HAA
M/75
5LHH
Superiorandmiddle
temporalgyri,insu
la,
rolandic
opercolum,putamen,ca
udate
nucleus,
middle
occ
ipitalgyru
s(BA
19)
SLF,IFOF,
ILF&
OR
23.45
I.5
17.5
30/29
9/14
4/23
ZOJ
F/76
4LHH
Fusiform
andlingualgyri,ca
lcarine
cortex(BA
17e18)
IFOF
14.5
I3
46
29/30
13/15
28/25
FOE
M/47
1LHH
Superiorandmiddle
temporalpole,
superiorandmiddle
temporalgyri,
insu
la,putamen,th
alamus,
hippoca
mpus
andparahippoca
mpalarea,inferior
parietalco
rtex,angularand
supramarginalgyri,middle
occ
ipital
gyru
s(BA
18)
SLF,IFOF,
ILF&
OR
162.71
H�7
26
29/29
5/14
18/27
LOA
M/52
4None
Rolandic
operculum,middle
temporal
pole,inferior,
middle
andsu
ptemporal
gyri,parahippoca
mpalarea,insu
la,
putamen,su
pramarginalandangulargyri
SLF&
IFOF
95.92
I1.5
3.5
30/30
12/15
28/30
SSA
M/43
4None
Putamen
IFOF&
OR
17.3
H4.5
3.5
27/30
0/11
0/14
MAF
M/44
7None
Inferior,
middle
andsu
periorfrontalgyri,
orb
itofrontalco
rtex,prece
ntral/postce
ntral
cortex,motorandsu
pplementary
motor
areas,
parace
ntrallobule,insu
la,amygdala,
superior,
middle
andinferiortemporal
gyri,insu
la,su
periorandinferiorparietal
areas,
anteriorandmiddle
cingulate,
putamen,ca
udate
nucleus
SLF,IFOF,
ILF&
OR
522.82
I.2
1.9
20/27
12/11
12/30
COM
M/70
3None
Putamen,ca
udate
nucleus
IFOF
6.38
I2
11
//15/15
29/30
Abbreviations:
H¼hemorrhagic,I¼
isch
aemic.
c o r t e x 4 8 ( 2 0 1 2 ) 5 4 0e5 5 2 543
Author's personal copy
were the optic radiations (OR), whose disconnection typically
results in contralateral hemianopia, and tracts whose
disconnection has been implicated in the occurrence of
neglect signs, such as the SLF (see Doricchi and Tomaiuolo,
2003; Bartolomeo et al., 2007), the IFOF (Urbanski et al., 2008)
and the inferior longitudinal fasciculus (ILF; Bird et al., 2006).
2.3. Stimuli and procedure
Participants sat in front of a laptop screen (12.1 inches) at an
approximate distance of 50 cm.
E-Prime software (Schneider et al., 2002) controlled the
presentation of the stimuli, timing operations, and data
collection. At the beginning of each trial, the word “Pret?”
(“Ready?” in French) appeared at the centre of the screen and
the trial began after pressing the space bar. A fixation point (a
white asterisk) was displayed for 1000 msec on the black
background and was followed by the target stimulus, a white
configuration composed of a horizontal line and a vertical line.
Target presentation time decreased from block to block,
ranging from 3000 to 150 msec (3000 msec, 1000 msec,
500 msec 150 msec and 150 msec), depending on performance
at judging the centre X. If accuracy for the centre X configu-
ration was superior or equal to 80%, then presentation time
decreased (note that all participants’ performance for the
centre Xwas good enough to reach the 5th and last block). The
task was to judge which one of the two perpendicular lines
was longer. The participants vocally reported the answer
ehorizontal or verticale and the “experimenter” pressed the
corresponding button on a computer mouse. Participants
were instructed to respond as accurately as possible.
The horizontal line was always of the same standard
length (41 mm or 4.7�) whereas the vertical line could vary
from 22.5 mm (2.6�) to 59.5 mm (6.8�). From a standard vertical
length line (41 mm), several lengths were calculated, ranging
from 55% to 145% of the standard line. In the 1st and 2nd
blocks of trials, horizontal length varied from 55% to 145% in
six steps (55, 75, 95, 105, 125 and 145%). Depending on accu-
racy, task difficulty increased so that horizontal line in the 3rd
block ranged from 75% to 125% (75, 85, 95, 105, 115 and 125%).
As previously mentioned, all participants appropriately per-
formed the task so that task difficulty increased. All the lines
subtended .8� in width. The vertical line was always centrally
presented. Although the horizontal line was always presented
perpendicularly to the vertical one, its position along the
vertical line varied and provided three types of configuration.
The L configurations: in these two configurations, the two
lines form an L shape, the horizontal line being displayed
either to the left or the right of the vertical line (left L or right L
respectively, see Fig. 1).
The T configurations: the horizontal line was displayed at
the bottom of the vertical line. In one configuration, the
horizontal line was bisected in the middle by the vertical line
(centre T). And in the two remaining configurations, the
horizontal line was asymmetrically bisected. The largest part,
which represented 3/4 of the total length, could be either on
the left (left T) or on the right (right T, see Fig. 1).
The X configurations: in the configuration called “centre X”,
the two lines crossed in their middle, thus forming a cross
shape. When the horizontal line was displaced towards the
left, the configuration was the “left X”, while a right
displacement led to the “right X” (see Fig. 1).
2.4. Design
The present experiment had two within participant factors:
Configuration and Vertical line length. Vertical line length
could take six different values, three inferior and three supe-
rior to the standard horizontal line (see section Stimuli for
further details). We used eight configurations: two L configu-
rations (left L and right L); three T configurations (left T, centre
T, right T) and three X configurations (left X, centre X, right X).
The current experiment was divided in four sessions of 120
trials (total of 480 trials). Participants performed eight practice
trials before proceeding with every experimental session. The
eight configurations were judged 60 times each. Every exper-
imental session had five blocks, time presentation (3000, 1000,
500, 150 and 150 msec) and length range decreasing with
accuracy across blocks (between 55% and 145% in blocks 1 and
2; between 75% and 125% in blocks 3, 4 and 5).
3. Data analysis
The method of the constant stimuli was used. One stimulus
considered as standard remained identical in length in all
trials (here the horizontal line), while the comparative stim-
ulus varied (here the vertical line). From the six possible
lengths of the vertical line, we computed the point of subjec-
tive equality (PSE). This measure represents the estimated
length of the vertical line in order for it to be perceived as
identical to the standard horizontal line. For the sake of
simplicity, the PSE was transformed into a percentage of
illusory extent. So, we obtained a percentage of under or
overestimation for the eight configurations. Note that the
closer to zero the value is, the less biased length perception is.
Negative values refer to horizontal underestimation whereas
positive ones refer to horizontal overestimation.
4. Results
Data were analyzed separately as a function of Side (centre,
left, right) and submitted to Group (Controls vs Neglect) by
Configuration (L, T, X) mixed analysis of variances (ANOVAs).
We also conducted planned single sample t-tests to test the
reliability of the under and overestimations.
4.1. Line length perception
4.1.1. Centred horizontal line (centre T and X)We performed the first analysis for the two configurations in
which the horizontal line was displayed in the middle (centre
T and centre X) to test whether as already observed with
normal participants, the horizontal line was underestimated
in the centre T but well estimated in the centre X (Charras and
Lupianez, 2009, 2010). The main effect of Group was far from
significance, F(1,14)< 1, suggesting that controls and patients
performed in a similar way. There was a main effect of
Configuration (T vs X), F(1,14)¼ 156.7, p< .001. Participants
c o r t e x 4 8 ( 2 0 1 2 ) 5 4 0e5 5 2544
Author's personal copy
underestimated the horizontal line in the centre T but not in
the centre X. Group and Configuration interacted, F(1,14)¼7.42, p¼ .02, because neglect patients showed a tendency to
underestimate more the horizontal line in the centre T than
controls, F(1,14)¼ 3.39, p¼ .09. Planned comparisons
confirmed that both patients and control participants under-
estimated the horizontal line in the centre T but not in the
centre X [t(7)¼ 10.48, p< .001 and t(7)¼�9.31, p< .001 for the
centre T; t(7)¼ .58, p¼ .57, ns and, t(7)¼�1.05, p¼ .32, ns for
the centre X respectively for control participants and neglect
patients].
4.1.2. Left-sided horizontal lineWe conducted an analysis with the items with leftward-
oriented horizontal lines in the three configurations (L, T, X).
There were principal effects of Group, F(1,14)¼ 9.02, p¼ .009,
as well as of Configuration, F(2,28)¼ 21.73, p< .001. The two
factors did not interact, F(2,28)¼ 1.48, p¼ .24, suggesting that
neglect patients, as compared to controls, underestimated the
length of the left-sided horizontal line, independently of the
configuration. This result was highly expected on the basis of
neglect patients’ tendency to ignore left-sided items. The
effect of Configuration resulted from the horizontal line being
estimated as longer in the left X, than in the left T, F(1,14)¼47.69, p< .001, consistentwith the symmetry law, according to
which an asymmetrically bisected line (here the horizontal
line) is overestimated as compared to a symmetrically bisec-
ted line (the vertical line). Importantly, the symmetry law
influenced in a similar way the performance of both patients
and control participants (see for example in the centre and
right panels of Fig. 2, the difference in length perception
between the T and X configurations).
4.1.3. Right-sided horizontal lineFor the three configurations (L, T, X) inwhich thehorizontal line
was right-sided, there were a main effect of Group [F(1,14)¼4.62, p¼ .05], a main effect of Configuration [F(2,28)¼ 46.83,
p< .001] and a highly significant interaction [F(2,28)¼ 5.96,
p¼ .007]. This suggests that even though both groups were
sensitive to line symmetry, neglect patients had anexaggerated
horizontal overestimation in the right X. Planned comparisons
confirmed that patients and control participants had similar
performance for the right L andrightT [F(1,14)¼ 1.43,p¼ .25 and
F(1,14)< 1, p¼ .82], but not for the right X, where neglect
patients showed an enhanced horizontal overestimation
[F(1,14)¼ 10.92, p¼ .005].
4.2. Effect of left HLH on line length perception
Half of the neglect patients in our study presented visual field
deficits. We performed an additional statistical analysis in
which we investigated the effect of visual field defects on line
estimation. It has long been known that left HLH dramatically
increases patients’ rightwards error in line bisection
(Bartolomeo, 1987; Doricchi and Angelelli, 1999), presumably
because at each fixation it nullifies the perceptual salience of
the left part of the line, thus further increasing the biased
competition in favour of the right part (Bartolomeo et al., 2003).
We compared the performance of patients with and without
hemianopia to test the competition hypothesis. First, we con-
ducted a repeated-measures ANOVA with the factors Hemi-
anopia [neglect patients with hemianopia (NHþ) vs neglect
patients without hemianopia (NH�) and Configuration for
centred horizontal lines (centre T and centre X) to test whether
NH� and NHþ patients performed differently when the hori-
zontal line was symmetrically bisected. Hemianopia did not
influence performance [F(1,6)< 1, p¼ .73, ns], but the configu-
ration did [F(1,6)¼ 78.01, p< .001]. Importantly, the interaction
Hemianopia�Configurationwas far fromsignificance [F(1,6)<
1, p¼ .93], suggesting that both groups of patients under-
estimated the horizontal line in the centre T while showing
relativelyunbiasedperception for the centreX [t(3)¼ .46,p¼ .67
and t(3)¼ .27, p¼ .80 respectively, see left panel of Fig. 3]. Thus,
both NH� and NHþ patients correctly perceived the left-sided
50% of each horizontal line (if not, they would have under-
estimated the horizontal lines length in the centre X).
We then conducted two repeated-measures ANOVAs with
the factors Configuration (L, T or X) and Hemianopia (NHþ vs
NH�) as a function of the side of the horizontal line. For left-
sided lines, there were main effects of Hemianopia [F(1,6)¼17.05, p¼ .006] and of Configuration [F(1,6)¼ 11.82, p¼ .001],
but no interaction [F(1,6)¼ 2.39, p¼ .13]. As expected, NHþpatients showed a stronger bias to underestimate left-sided
lines than NH� patients, and this occurred for the three
configurations. The effect of Configuration showed that the
left underestimation decreased for the left X configuration as
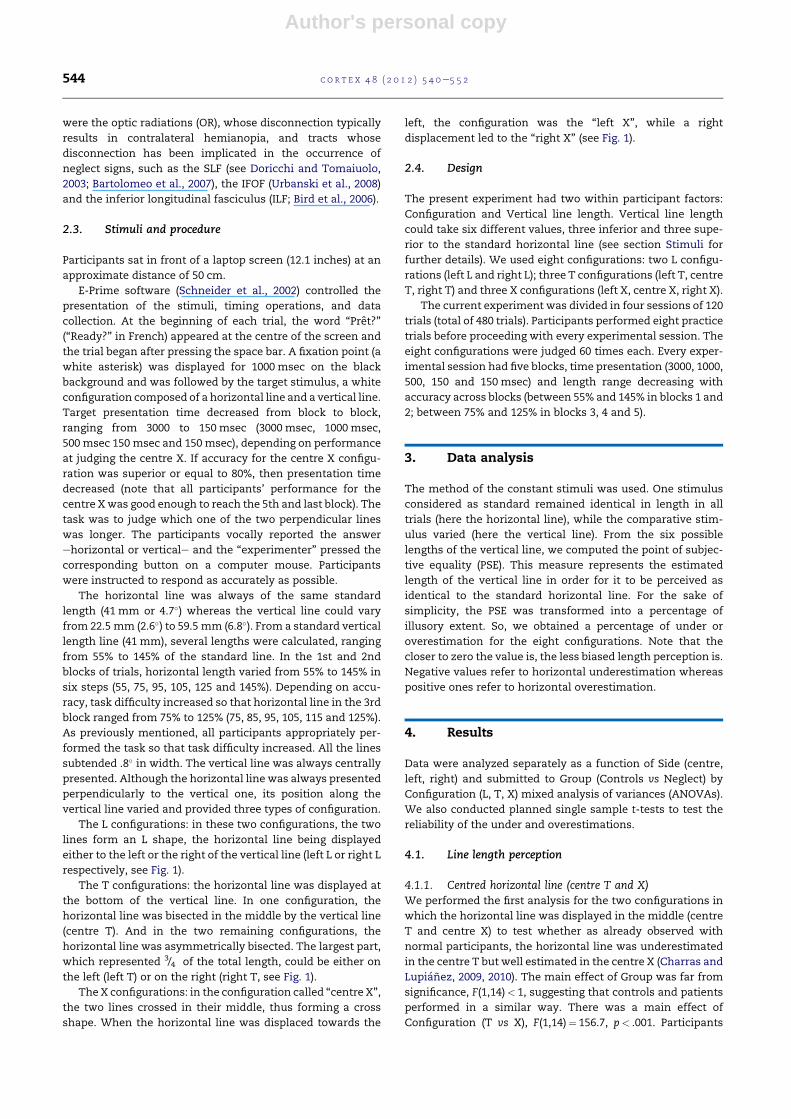
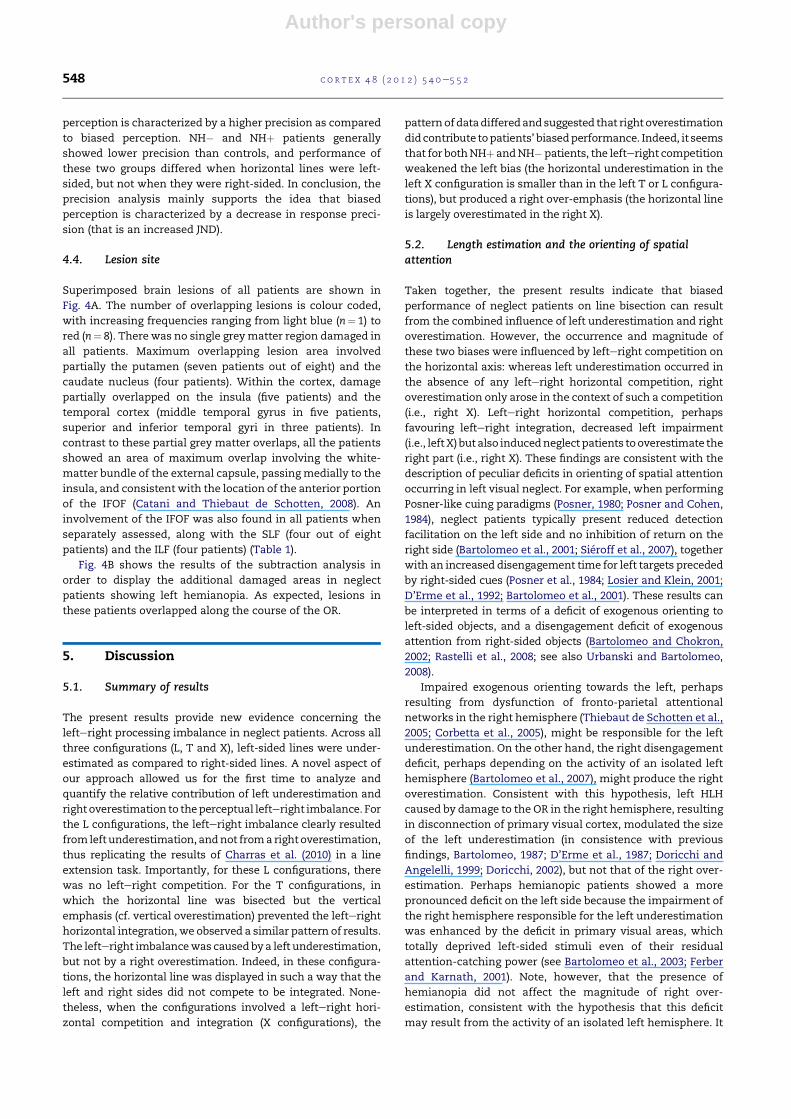
Fig. 2 e It shows the mean percentages of horizontal underestimation (negative values) and/or horizontal overestimation
(positive values) and SDs as a function of Side and Configuration for control participants and neglect patients.
c o r t e x 4 8 ( 2 0 1 2 ) 5 4 0e5 5 2 545
Author's personal copy
compared to the left T and L. However, for NH� patients, the
horizontal line was eventually overestimated in the left X
[t(3)¼ 4.64, p¼ .02] whilst NHþ patients persisted in
underestimating the horizontal line in this configuration
[t(3)¼�3.90, p¼ .03]. Although this distortion almost reached
40%, it was not clear whether it was due to sensory or
attentional deficits. Indeed, the lack of vertical under or over-
estimation in the centre X indicated that NHþ patients were
able to correctly process the 50%of thehorizontal line thatwas
displayed on the left. Taking into account that in the left X, 75%
of the horizontal line was left-sided (instead of 50% in the
centre X), sensory deficits could only explain 25% of the
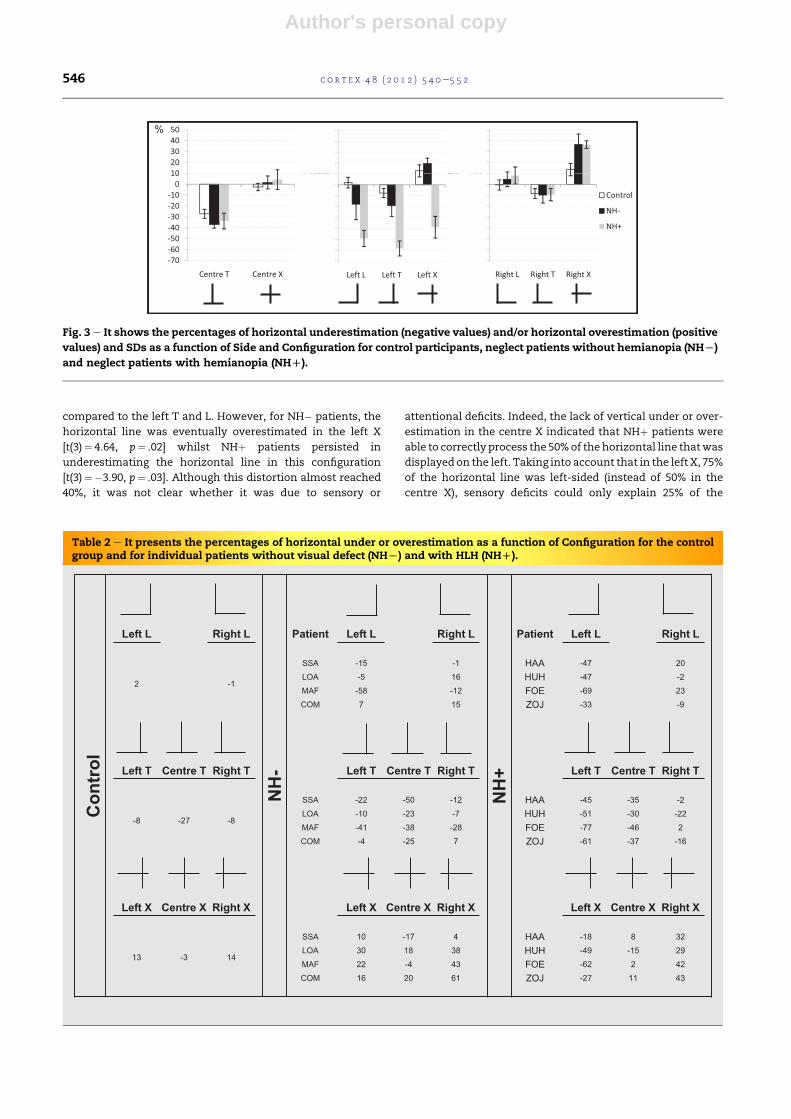
Table 2 e It presents the percentages of horizontal under or overestimation as a function of Configuration for the controlgroup and for individual patients without visual defect (NHL) and with HLH (NHD).
lo
rt
no
C
HN
- +H
N
Left L Right L Patient Left L Right L Patient Left L Right L
2 -1
SSA -15 -1 HAA -47 20LOA -5 16 HUH -47 -2MAF -58 -12 FOE -69 23COM 7 15 ZOJ -33 -9
Left T Centre T Right T Left T Centre T Right T Left T Centre T Right T
-8 -27 -8
SSA -22 -50 -12 HAA -45 -35 -2LOA -10 -23 -7 HUH -51 -30 -22MAF -41 -38 -28 FOE -77 -46 2COM -4 -25 7 ZOJ -61 -37 -16
Left X Centre X Right X Left X Centre X Right X Left X Centre X Right X
13 -3 14
SSA 10 -17 4 HAA -18 8 32LOA 30 18 38 HUH -49 -15 29MAF 22 -4 43 FOE -62 2 42COM 16 20 61 ZOJ -27 11 43
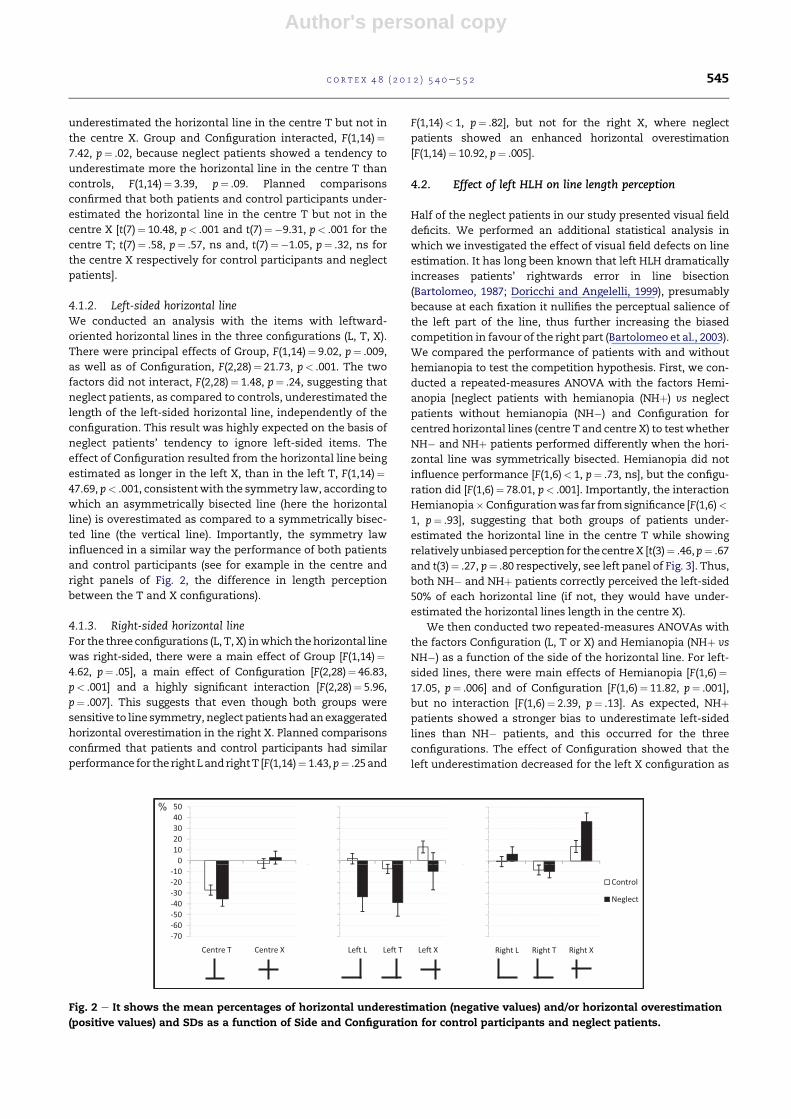
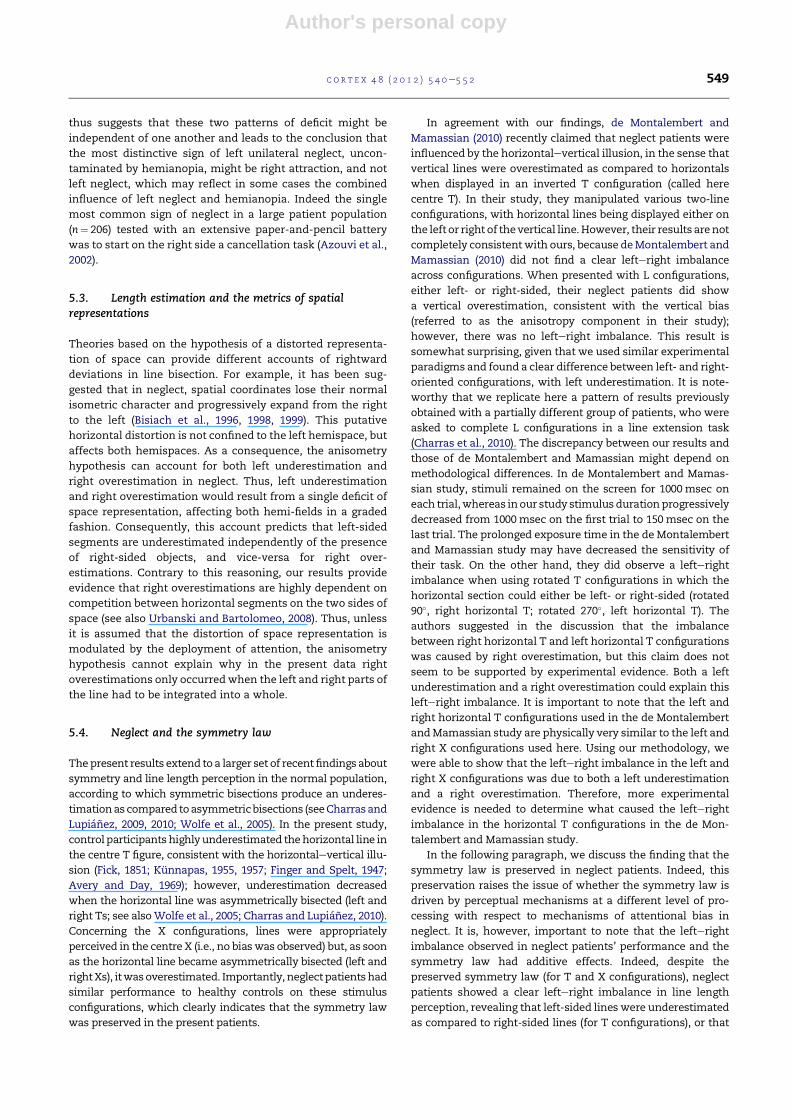
Fig. 3 e It shows the percentages of horizontal underestimation (negative values) and/or horizontal overestimation (positive
values) and SDs as a function of Side and Configuration for control participants, neglect patients without hemianopia (NHL)
and neglect patients with hemianopia (NHD).
c o r t e x 4 8 ( 2 0 1 2 ) 5 4 0e5 5 2546
Author's personal copy
underestimation out of the 40%. Therefore, visual field deficits
leave15%oftheeffectunexplained.However,singlesample t-test
showed that the underestimation in the left X was not statisti-
cally different from an underestimation of 25% [t(3)¼�1.40,
p¼ .25]. Inotherwords, thisunderestimationwasnotstatistically
different fromwhat would cause the sensory deficits.
For right-sided lines, there was a main effect of Configu-
ration, F(1,6)¼ 33.85, p< .001, but no effect of Hemianopia,
F(1,6)< 1, p¼ .88, and no interaction, F(1,6)< 1, p¼ .95.
Thus, NHþ patients showed a more severe deficit on the
left side than NH� patients did, but they had similar perfor-
mance when the horizontal line was centred or right-sided
(Table 2).
4.3. Precision of line length perception
As the method of the constant stimuli was used, we could
calculate, additionally to the PSE, an indicator of response
precision called the just noticeable difference (JND). The JND
corresponds to the minimum value necessary to discrimi-
nating two stimuli. Consequently, the higher the JND is, the
lower the precision of line length perception is. We conducted
a repeated-measures ANOVA with the factors Group (control,
NH� and NHþ) and Configuration for centred horizontal lines
(centre T and centre X) to test whether response precisionwas
modulated by these factors. As one could expect, we observed
a main effect of Group on the JND: response precision was
better for controls than for NH� or NHþ patients [F(2,13)¼7.65, p¼ .006]. However, no significant difference was
observed between NH� and NHþ patients (F< 1). A main
effect of Configuration was also observed [F(1,13)¼ 17.26,
p¼ .001], indicating that JNDwas smaller for the centre X than
for the centre T. This finding consistently reveals that
unbiased perception (centre X) is more precise than biased
perception (centre T). The interaction between Group and
Configuration was far from significance (F< 1).
Then we conducted another repeated-measures ANOVA
with the factors Group (control, NH� and NHþ) and Configu-
rationbut for left-sidedhorizontal lines (left L, left T and left X).
We observed a main effect of Group [F(2,13)¼ 27.63, p< .0001]
revealing that controls showed a higher precision than NH�patients [even though this effectwas tendencial; F(1,13)¼ 4.07,
p¼ .06], and that NH� showed a higher precision than NHþpatients [F(1,13)¼ 26.87, p¼ .0004]. The effect of Configuration
was not significant [F(2,26)¼ 1.13, p¼ .39] in opposition to the
interaction between these two factors [F(4,26)¼ 2.67, p¼ .054].
The interaction suggests that response precision for NHþpatients drastically decreased when there was a vertical
emphasis [left T as compared the left L or X; F(1,13)¼ 10.12,
p¼ .007]. Finally, we conducted a repeated-measures ANOVA
with the factors Group (control, NH� and NHþ) and Configu-
ration but for right-sided horizontal lines (right L, right T and
right X). We found a main of Group [F(2,13)¼ 12.65, p¼ .0008],
showing that response precision of controls was much higher
than that of NH� and NHþ patients. No difference was
observed between NH� and NHþ patients (F< 1). The effect of
Configuration and the interaction between Group and Config-
urationwere significant [F(2,26)¼ 19.58, p< .0001 and F(4,26)¼5.49, p¼ .002 respectively]. The interaction revealed that for
both NH� and NHþ patients, response precision decreased
when there was a horizontal emphasis, that is when the
horizontal linewas greatly overestimated (rightX as compared
to right T and right L; for NH�, F(1,13)¼ 19.80, p¼ .0006; for
NHþ, F(1,13)¼ 7.11, p¼ .02; for controls, F< 1).
The precision analysis is very consistent with the line
length perception analysis (PSE) in the sense that unbiased
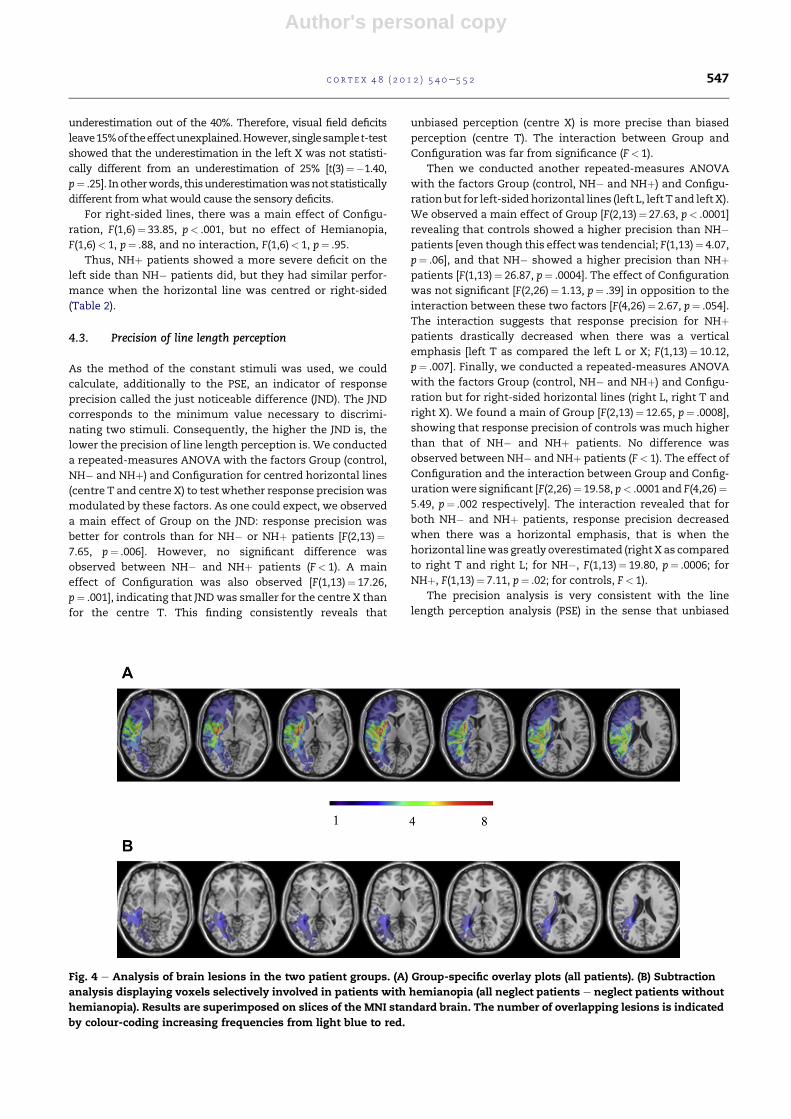
Fig. 4 e Analysis of brain lesions in the two patient groups. (A) Group-specific overlay plots (all patients). (B) Subtraction
analysis displaying voxels selectively involved in patients with hemianopia (all neglect patients e neglect patients without
hemianopia). Results are superimposed on slices of the MNI standard brain. The number of overlapping lesions is indicated
by colour-coding increasing frequencies from light blue to red.
c o r t e x 4 8 ( 2 0 1 2 ) 5 4 0e5 5 2 547
Author's personal copy
perception is characterized by a higher precision as compared
to biased perception. NH� and NHþ patients generally
showed lower precision than controls, and performance of
these two groups differed when horizontal lines were left-
sided, but not when they were right-sided. In conclusion, the
precision analysis mainly supports the idea that biased
perception is characterized by a decrease in response preci-
sion (that is an increased JND).
4.4. Lesion site
Superimposed brain lesions of all patients are shown in
Fig. 4A. The number of overlapping lesions is colour coded,
with increasing frequencies ranging from light blue (n¼ 1) to
red (n¼ 8). There was no single greymatter region damaged in
all patients. Maximum overlapping lesion area involved
partially the putamen (seven patients out of eight) and the
caudate nucleus (four patients). Within the cortex, damage
partially overlapped on the insula (five patients) and the
temporal cortex (middle temporal gyrus in five patients,
superior and inferior temporal gyri in three patients). In
contrast to these partial grey matter overlaps, all the patients
showed an area of maximum overlap involving the white-
matter bundle of the external capsule, passingmedially to the
insula, and consistent with the location of the anterior portion
of the IFOF (Catani and Thiebaut de Schotten, 2008). An
involvement of the IFOF was also found in all patients when
separately assessed, along with the SLF (four out of eight
patients) and the ILF (four patients) (Table 1).
Fig. 4B shows the results of the subtraction analysis in
order to display the additional damaged areas in neglect
patients showing left hemianopia. As expected, lesions in
these patients overlapped along the course of the OR.
5. Discussion
5.1. Summary of results
The present results provide new evidence concerning the
lefteright processing imbalance in neglect patients. Across all
three configurations (L, T and X), left-sided lines were under-
estimated as compared to right-sided lines. A novel aspect of
our approach allowed us for the first time to analyze and
quantify the relative contribution of left underestimation and
right overestimation to theperceptual lefteright imbalance. For
the L configurations, the lefteright imbalance clearly resulted
from left underestimation, andnot froma right overestimation,
thus replicating the results of Charras et al. (2010) in a line
extension task. Importantly, for these L configurations, there
was no lefteright competition. For the T configurations, in
which the horizontal line was bisected but the vertical
emphasis (cf. vertical overestimation) prevented the lefteright
horizontal integration, we observed a similar pattern of results.
The lefteright imbalancewas causedby a left underestimation,
but not by a right overestimation. Indeed, in these configura-
tions, the horizontal line was displayed in such a way that the
left and right sides did not compete to be integrated. None-
theless, when the configurations involved a lefteright hori-
zontal competition and integration (X configurations), the
patternofdatadifferedandsuggested that right overestimation
didcontribute topatients’ biasedperformance. Indeed, it seems
that for bothNHþ andNH� patients, the lefteright competition
weakened the left bias (the horizontal underestimation in the
left X configuration is smaller than in the left T or L configura-
tions), but produced a right over-emphasis (the horizontal line
is largely overestimated in the right X).
5.2. Length estimation and the orienting of spatialattention
Taken together, the present results indicate that biased
performance of neglect patients on line bisection can result
from the combined influence of left underestimation and right
overestimation. However, the occurrence and magnitude of
these two biases were influenced by lefteright competition on
the horizontal axis: whereas left underestimation occurred in
the absence of any lefteright horizontal competition, right
overestimation only arose in the context of such a competition
(i.e., right X). Lefteright horizontal competition, perhaps
favouring lefteright integration, decreased left impairment
(i.e., leftX) but also inducedneglect patients tooverestimate the
right part (i.e., right X). These findings are consistent with the
description of peculiar deficits in orienting of spatial attention
occurring in left visual neglect. For example, when performing
Posner-like cuing paradigms (Posner, 1980; Posner and Cohen,
1984), neglect patients typically present reduced detection
facilitation on the left side and no inhibition of return on the
right side (Bartolomeo et al., 2001; Sieroff et al., 2007), together
with an increased disengagement time for left targets preceded
by right-sided cues (Posner et al., 1984; Losier and Klein, 2001;
D’Erme et al., 1992; Bartolomeo et al., 2001). These results can
be interpreted in terms of a deficit of exogenous orienting to
left-sided objects, and a disengagement deficit of exogenous
attention from right-sided objects (Bartolomeo and Chokron,
2002; Rastelli et al., 2008; see also Urbanski and Bartolomeo,
2008).
Impaired exogenous orienting towards the left, perhaps
resulting from dysfunction of fronto-parietal attentional
networks in the right hemisphere (Thiebaut de Schotten et al.,
2005; Corbetta et al., 2005), might be responsible for the left
underestimation. On the other hand, the right disengagement
deficit, perhaps depending on the activity of an isolated left
hemisphere (Bartolomeo et al., 2007), might produce the right
overestimation. Consistent with this hypothesis, left HLH
caused by damage to the OR in the right hemisphere, resulting
in disconnection of primary visual cortex, modulated the size
of the left underestimation (in consistence with previous
findings, Bartolomeo, 1987; D’Erme et al., 1987; Doricchi and
Angelelli, 1999; Doricchi, 2002), but not that of the right over-
estimation. Perhaps hemianopic patients showed a more
pronounced deficit on the left side because the impairment of
the right hemisphere responsible for the left underestimation
was enhanced by the deficit in primary visual areas, which
totally deprived left-sided stimuli even of their residual
attention-catching power (see Bartolomeo et al., 2003; Ferber
and Karnath, 2001). Note, however, that the presence of
hemianopia did not affect the magnitude of right over-
estimation, consistent with the hypothesis that this deficit
may result from the activity of an isolated left hemisphere. It
c o r t e x 4 8 ( 2 0 1 2 ) 5 4 0e5 5 2548
Author's personal copy
thus suggests that these two patterns of deficit might be
independent of one another and leads to the conclusion that
the most distinctive sign of left unilateral neglect, uncon-
taminated by hemianopia, might be right attraction, and not
left neglect, which may reflect in some cases the combined
influence of left neglect and hemianopia. Indeed the single
most common sign of neglect in a large patient population
(n¼ 206) tested with an extensive paper-and-pencil battery
was to start on the right side a cancellation task (Azouvi et al.,
2002).
5.3. Length estimation and the metrics of spatialrepresentations
Theories based on the hypothesis of a distorted representa-
tion of space can provide different accounts of rightward
deviations in line bisection. For example, it has been sug-
gested that in neglect, spatial coordinates lose their normal
isometric character and progressively expand from the right
to the left (Bisiach et al., 1996, 1998, 1999). This putative
horizontal distortion is not confined to the left hemispace, but
affects both hemispaces. As a consequence, the anisometry
hypothesis can account for both left underestimation and
right overestimation in neglect. Thus, left underestimation
and right overestimation would result from a single deficit of
space representation, affecting both hemi-fields in a graded
fashion. Consequently, this account predicts that left-sided
segments are underestimated independently of the presence
of right-sided objects, and vice-versa for right over-
estimations. Contrary to this reasoning, our results provide
evidence that right overestimations are highly dependent on
competition between horizontal segments on the two sides of
space (see also Urbanski and Bartolomeo, 2008). Thus, unless
it is assumed that the distortion of space representation is
modulated by the deployment of attention, the anisometry
hypothesis cannot explain why in the present data right
overestimations only occurredwhen the left and right parts of
the line had to be integrated into a whole.
5.4. Neglect and the symmetry law
Thepresent results extend to a larger set of recent findings about
symmetry and line length perception in the normal population,
according to which symmetric bisections produce an underes-
timationas compared toasymmetricbisections (seeCharrasand
Lupianez, 2009, 2010; Wolfe et al., 2005). In the present study,
control participants highlyunderestimated thehorizontal line in
the centre T figure, consistent with the horizontalevertical illu-
sion (Fick, 1851; Kunnapas, 1955, 1957; Finger and Spelt, 1947;
Avery and Day, 1969); however, underestimation decreased
when the horizontal line was asymmetrically bisected (left and
right Ts; see alsoWolfe et al., 2005; Charras and Lupianez, 2010).
Concerning the X configurations, lines were appropriately
perceived in the centre X (i.e., no biaswas observed) but, as soon
as the horizontal line became asymmetrically bisected (left and
rightXs), itwasoverestimated. Importantly, neglect patientshad
similar performance to healthy controls on these stimulus
configurations, which clearly indicates that the symmetry law
was preserved in the present patients.
In agreement with our findings, de Montalembert and
Mamassian (2010) recently claimed that neglect patients were
influenced by the horizontalevertical illusion, in the sense that
vertical lines were overestimated as compared to horizontals
when displayed in an inverted T configuration (called here
centre T). In their study, they manipulated various two-line
configurations, with horizontal lines being displayed either on
the left or right of thevertical line.However, their results arenot
completely consistentwith ours, because deMontalembert and
Mamassian (2010) did not find a clear lefteright imbalance
across configurations. When presented with L configurations,
either left- or right-sided, their neglect patients did show
a vertical overestimation, consistent with the vertical bias
(referred to as the anisotropy component in their study);
however, there was no lefteright imbalance. This result is
somewhat surprising, given that we used similar experimental
paradigms and found a clear difference between left- and right-
oriented configurations, with left underestimation. It is note-
worthy that we replicate here a pattern of results previously
obtained with a partially different group of patients, who were
asked to complete L configurations in a line extension task
(Charras et al., 2010). The discrepancy between our results and
those of de Montalembert and Mamassian might depend on
methodological differences. In de Montalembert and Mamas-
sian study, stimuli remained on the screen for 1000 msec on
each trial,whereas inour study stimulusdurationprogressively
decreased from 1000msec on the first trial to 150 msec on the
last trial. The prolonged exposure time in the deMontalembert
and Mamassian study may have decreased the sensitivity of
their task. On the other hand, they did observe a lefteright
imbalance when using rotated T configurations in which the
horizontal section could either be left- or right-sided (rotated
90�, right horizontal T; rotated 270�, left horizontal T). The
authors suggested in the discussion that the imbalance
between right horizontal T and left horizontal T configurations
was caused by right overestimation, but this claim does not
seem to be supported by experimental evidence. Both a left
underestimation and a right overestimation could explain this
lefteright imbalance. It is important to note that the left and
right horizontal T configurations used in the de Montalembert
andMamassian study are physically very similar to the left and
right X configurations used here. Using our methodology, we
were able to show that the lefteright imbalance in the left and
right X configurations was due to both a left underestimation
and a right overestimation. Therefore, more experimental
evidence is needed to determine what caused the lefteright
imbalance in the horizontal T configurations in the de Mon-
talembert and Mamassian study.
In the following paragraph, we discuss the finding that the
symmetry law is preserved in neglect patients. Indeed, this
preservation raises the issue of whether the symmetry law is
driven by perceptual mechanisms at a different level of pro-
cessing with respect to mechanisms of attentional bias in
neglect. It is, however, important to note that the lefteright
imbalance observed in neglect patients’ performance and the
symmetry law had additive effects. Indeed, despite the
preserved symmetry law (for T and X configurations), neglect
patients showed a clear lefteright imbalance in line length
perception, revealing that left-sided lines were underestimated
as compared to right-sided lines (for T configurations), or that
c o r t e x 4 8 ( 2 0 1 2 ) 5 4 0e5 5 2 549
Author's personal copy
right-sided lines were overestimated as compared to left-sided
lines (for X configurations inNH� patients), or, finally, that both
phenomena occurred (for X configurations in NHþ patients).
The finding that a/symmetry influenced both control and
neglect participants indicates that the detection of a/
symmetry might be driven by low perceptual level, perhaps
pre-attentive, mechanisms. It has often been found that
behaviours resulting from pre-attentive mechanisms are
intact after right parietal damage and neglect or extinction
(Mattingley et al., 1997; Halligan and Marshall, 1995;
Shomstein et al., 2010). Indeed, neglect patients’ perfor-
mance is influenced by visual illusions such as the Brentano
version of the MullereLyer illusion (Mattingley et al., 1995;
Vallar et al., 2000; Daini et al., 2002). Gestalt laws such as
grouping or connectedness are known to remain intact after
right parietal damage (Mattingley et al., 1997; Robertson et al.,
2003; Esterman et al., 2000). For instance, perceptual grouping
helps neglect patients to detect left-sided targets (Robertson
et al., 2003), perhaps because left and right are integrated
into a “perceptual whole”. The authors concluded that pre-
attentive mechanisms responsible for grouping enable the
conceptualization of left and right as a unique object, thus
preventing or at least decreasing left neglect. The symmetry
law explored here might rely on similar mechanisms. The
detection of a/symmetry may shape the attentional distribu-
tion all around the locus of bisection, in order to map the
whole configuration. Consequently, the distribution of atten-
tionmight encourage the orienting of attention to the left, and
thus reduce the left underestimation. Biased perception of
a horizontal metal rod can be modulated in a similar way by
the intention to act: neglect-based deviation to the right of
centre was decreased when patients reached towards the rod
as if to pick it up in the centre, compared towhen they pointed
to its centre (Robertson et al., 1995).
Note, however, that even though the attentional distribu-
tion improved left processing, it could not wholly restore left
orienting in the case of neglect plus hemianopia.3
We thus claim here that line a/symmetry can improve line
processing by reducing the lefteright imbalance. However,
this idea seems to be contradictory to what is typically
observed in the landmark task (Milner, et al., 1993; Harvey
et al., 1995). In the landmark task, observers are presented
with a line divided by a small vertical marker and have to
judge which one of the two parts is longer. Usually, neglect
patients still show a lefteright imbalance in this task, i.e., they
tend to judge the right-sided portion as being longer. The
apparent discrepancies between the landmark task and our
results could be accounted for by the fact that the dividing
segment is relatively short in the landmark task, whereas in
the present X configurations it was grossly comparable to the
length of the horizontal segment, with vertical lines being
approximately twice shorter to twice longer than horizontal
lines. Relatively long vertical lines might have helped patients
to further spread their attentional focus (see Halligan and
Marshall, 1994), to the extent of including a relatively long
part of the left segment and thus decreasing the perceptual
imbalance.
5.5. Anatomical considerations
Although the present patient sample was relatively small, the
analysisof theanatomyof lesions thanks tohigh-resolutionMRI
did produce reliable results. No single grey matter area was
invariably damaged in the present sample of neglect patients.
This finding is consistent with the view that the lesion over-
lapping method may not always provide precise data on ana-
tomo-clinical relationships (Bartolomeo, 2006; Godefroy et al.,
1998; Catani and Mesulam, 2008). On the other hand, all
patients presented damage in a white-matter location consis-
tent with the course of the IFOF. Accumulating evidence corre-
lates neglect signswith dysfunction of fronto-parietal networks
in the right hemisphere, linkedbybranches of theSLF (Thiebaut
de Schotten et al., 2005; Doricchi and Tomaiuolo, 2003; Corbetta
et al., 2005; Bartolomeo et al., 2007; Doricchi et al., 2008).
However, IFOF disconnection in the right hemisphere has also
been described in a group of neglect patients with relatively
ventral lesions, which only marginally impinged upon the
parietal lobe and the SLF (Urbanski et al., 2008). IFOF discon-
nection might provoke signs of left neglect by impairing the
topedown influences of frontal regions to visual cortex, or by
depriving frontal areas of visual input from the left visual field.
Thus, the present case could be a typical example of failure to
observe consistent grey matter correlates of a neurological
deficit, because the deficit actually stems from damage to
different parts of a long-range white-matter fasciculus (Catani
and Mesulam, 2008). Finally, as expected, damage to the OR
was only observed in hemianopic patients, thus validating our
anatomo-clinical approach.
5.6. Conclusions
We described a new approach for investigating the global
lefteright imbalance, characteristic of left unilateral neglect, by
dissociating the relative contribution of the left and right biases
(see also Charras et al., 2010). The results indicate that left
impairment occurs independently of lefteright competition, in
opposition to the right bias. Indeed, right over-enhancement
appeared to be consecutive to perceptual lefteright integration;
when no lefteright competition was present, neglect patients
performed in a similar way as controls on the right side. In
addition, left HLHmodulated the left but not the right bias, thus
making the case for the independenceof these twobiases. Based
on the present results, we propose distinct neural bases for right
overestimation, resulting from the activity of an isolated left
hemisphere, and left underestimation, dependent on impaired
functioning of right-hemisphere attentional networks.
Acknowledgements
This research was supported by the Spanish “Ministerio de
Educacion y Ciencia” (by a predoctoral grant -AP-2006-3911- to
thefirst author, and a research grant -PSI2008-03595PSIC- to the
second author). Please direct correspondence concerning this
3 As previously detailed, the left underestimation did notsimply result from sensory deficit like hemianopia, which couldaccount for 25% of underestimation, whilst the effect reachedabout 40%.
c o r t e x 4 8 ( 2 0 1 2 ) 5 4 0e5 5 2550
Author's personal copy
article to: Pom Charras, Departamento de Psicologıa Experi-
mental y Fisiologıa del Comportamiento, Facultad de Psicolo-
gıa, Universidad de Granada, Campus Universitario de Cartuja
S/N, 18071, Granada, Spain. E-mail: [email protected].
r e f e r e n c e s
Albert M. A simple test of visual neglect. Neurology, 23:658e664, 1973.
Avery G and Day R. Basis of the horizontal vertical illusion. Journalof Experimental Psychology, 81(2): 376e380, 1969.
Azouvi P, Samuel C, Louis-Dreyfus A, Bernati T, Bartolomeo P,Beis J-M, et al. Sensitivity of clinical and behavioural tests ofspatial neglect after right hemisphere stroke. Journal ofNeurology, Neurosurgery and Psychiatry, 73(2): 160e166, 2002.
Bartolomeo P. Aspetti dell’emi-inattenzione spaziale nelle lesioniemisferiche: Fattori che influenzano la bisezione di linee [aspects ofspatial hemi-inattention: Factors influencing line bisectionperformance]. Secondary Titl. Roma: Universita Cattolica, 1987.
Bartolomeo P. A parieto-frontal network for spatial awareness inthe right hemisphere of the human brain. Archives ofNeurology, 63(9): 1238e1241, 2006.
Bartolomeo P. Visual neglect. Current Opinion in Neurology, 20(4):381e386, 2007.
Bartolomeo P and Chokron S. Left unilateral neglect or righthyperattention. Neurology, 53(9): 2023e2027, 1999.
Bartolomeo P and Chokron S. Orienting of attention in leftunilateral neglect. Neuroscience and Biobehavioral Reviews,26(2): 217e234, 2002.
Bartolomeo P, Chokron S, and Sieroff E. Facilitation instead ofinhibition for repeated right-sided events in left neglect.NeuroReport, 10(16): 3353e3357, 1999.
Bartolomeo P, Sieroff E, Decaix C, and Chokron S. Modulating theattentional bias in unilateral neglect: The effects of the strategicset. Experimental Brain Research, 137(3/4): 424e431, 2001.
Bartolomeo P, Thiebaut de Schotten M, and Doricchi F. Leftunilateral neglect as a disconnection syndrome. CerebralCortex, 17(11): 2479e2490, 2007.
Bartolomeo P, Urbanski M, Chokron S, Chainay H, Moroni C,Sieroff E, et al. Neglected attention in apparent spatialcompression. Neuropsychologia, 42(1): 49e61, 2003.
Baylis GC, Driver J, and Rafal RD. Visual extinction and stimulusrepetition. Journal of Cognitive Neuroscience, 5(4): 453e466, 1993.
Binder J, Marshall R, Lazar R, Benjamin J, and Mohr JP. Distinctsyndromes of hemineglect. Archives of Neurology, 49(11):1187e1194, 1992.
Bird CM, Malhotra P, Parton A, Coulthard E, Rushworth MF, andHusain M. Visual neglect following right posterior cerebralartery infarction. Journal of Neurology, Neurosurgery andPsychiatry, 77(9): 1008e1012, 2006.
Bisiach E, Neppi-Modona M, Genero R, and Pepi R. Anisometry ofspace representation in unilateral neglect: Empirical test ofa former hypothesis. Consciousness and Cognition, 8(4):577e584, 1999.
Bisiach E, Pizzamiglio L, Nico D, and Antonucci G. Beyondunilateral neglect. Brain, 119(3): 851e857, 1996.
Bisiach E, Ricci R, and Modona MN. Visual awareness andanisometry of space representation in unilateral neglect: Apanoramic investigation by means of a line extension task.Consciousness and Cognition, 7(3): 327e355, 1998.
Bonato M, Priftis K, Marenzi R, and Zorzi M. Modulation ofhemispatial neglect by directional and numerical cues in theline bisection task. Neuropsychologia, 46(2): 426e433, 2008.
Brett M, Leff AP, Rorden C, and Ashburner J. Spatial normalizationof brain images with focal lesions using cost functionmasking. NeuroImage, 14(2): 486e500, 2001.
Catani M and Mesulam M. The arcuate fasciculus and thedisconnection theme in language and aphasia: History andcurrent state. Cortex, 44(8): 953e961, 2008.
Catani M and Thiebaut de Schotten M. A diffusion tensor imagingtractography atlas for virtual in vivo dissections. Cortex,44(8): 1105e1132, 2008.
Charras P and Lupianez J. The relevance of symmetry in linelength perception. Perception, 38(10): 1428e1438, 2009.
Charras P and Lupianez J. Length perception of horizontal andvertical bisected lines. Psychological Research, 74(2): 196e206, 2010.
Charras P, Lupianez J, and Bartolomeo P. Assessing the weights ofvisual neglect: A new approach to dissociate defectivesymptoms from productive phenomena in length estimation.Neuropsychologia, 48(11): 3371e3375, 2010.
Corbetta M, Kincade MJ, Lewis C, Snyder AZ, and Sapir A. Neuralbasis and recovery of spatial attention deficits in spatialneglect. Nature Neuroscience, 8(11): 1603e1610, 2005.
D’Erme P, DeBonis C, and Gainotti G. Influenza dell’emi-inattenzione e dell’emianopsia sui compiti di bisezione dilinee nei pazienti cerebrolesi. Archivio di Psicologia, Neurologiae Psichiatria, 48: 165e189, 1987.
D’Erme P, Robertson IH, Bartolomeo P, Daniele A, and Gainotti G.Early rightwards orienting of attention on simple reactiontime performance in patients with left-sided neglect.Neuropsychologia, 30(11): 989e1000, 1992.
Daini R, Angelelli P, Antonucci G, Cappa SF, and Vallar G.Exploring the syndrome of spatial unilateral neglect throughan illusion of length. Experimental Brain Research, 144(2):224e237, 2002.
de Montalembert M and Mamassian P. The verticalehorizontalillusion in hemi-spatial neglect. Neuropsychologia, 48(11):3245e3251, 2010.
De Renzi E, Gentilini M, Faglioni P, and Barbieri C. Attentionalshift towards the rightmost stimuli in patients with left visualneglect. Cortex, 25(2): 231e237, 1989.
Doricchi F. The contribution of retinotopic and multimodalcoding of space to horizontal space misrepresentation inneglect and hemianopia. In Karnath HO, Milner AD, andVallar G (Eds), The Cognitive and Neural Bases of Spatial Neglect.New York: Oxford University Press, 2002.
Doricchi F and Angelelli P. Misrepresentation of horizontal spacein left unilateral neglect: Role of hemianopia. Neurology,52(9): 1845e1852, 1999.
Doricchi F, Thiebaut de Schotten M, Tomaiuolo F, andBartolomeo P. White matter (dis)connections and gray matter(dys)functions in visual neglect: Gaining insights into thebrain networks of spatial awareness. Cortex, 44(8):983e995, 2008.
Doricchi F and Tomaiuolo F. The anatomy of neglect withouthemianopia: A key role for parietalefrontal disconnection?NeuroReport, 14(17): 2239e2243, 2003.
Esterman M, McGlinchey-Berroth R, and Milberg WP. Parallel andserial search in hemispatial neglect: Evidence for preservedpreattentive but impaired attentive processing.Neuropsychology, 14(4): 599e611, 2000.
Ferber S and Karnath HO. Size perception in hemianopia andneglect. Brain, 124(3): 527e536, 2001.
Fick A. De errore quodam optico asymetrica bulbi effecto. Marburg:J. A. Kochin.
Finger FW and Spelt DK. The illustration of the horizontal verticalillusion. Journal of Experimental Psychology, 37(3): 243e250, 1947.
Gainotti G, D’Erme P, and Bartolomeo P. Early orientation ofattention toward the half space ipsilateral to the lesion inpatients with unilateral brain damage. Journal of Neurology,Neurosurgery and Psychiatry, 54(12): 1082e1089, 1991.
Gauthier L, Dehaut F, and Joanette Y. The bells test: A quantitativeand qualitative test for visual neglect. International Journal ofClinical Neuropsychology, 11(2): 46e54, 1989.
c o r t e x 4 8 ( 2 0 1 2 ) 5 4 0e5 5 2 551
Author's personal copy
Godefroy O, Duhamel A, Leclerc X, Saint Michel T, Henon H, andLeys D. Brain-behaviour relationships. Some models andrelated statistical procedures for the study of brain-damagedpatients. Brain, 121(8): 1545e1556, 1998.
Halligan PW and Marshall JC. Right-sided cueing can ameliorateleft neglect. Neuropsychological Rehabilitation, 4(1): 63e73, 1994.
Halligan PW and Marshall JC. Grounding figural attention in leftneglect. Neurocase, 1: 79e82, 1995.
Harvey M, Milner AD, and Roberts RC. An investigation ofhemispatial neglect using the landmark task. Brain & Cognition,27(1): 59e78, 1995.
Heilman KM and Valenstein E. Mechanisms underlyinghemispatial neglect. Annals of Neurology, 5(2): 166e170, 1979.
Humphreys GW, Romani C, Olson A, Riddoch MJ, and Duncan J.Non-spatial extinction following lesions of the parietal lobe inhumans. Nature, 372: 357e359, 1994.
Ishiai S, Koyama Y, Seki K, and Izawa M. Line versusrepresentational bisections in unilateral spatial neglect. Journalof Neurology, Neurosurgery and Psychiatry, 69(6): 745e750, 2000.
Kinsbourne M. Orientational bias model of unilateral neglect:Evidence from attentional gradients within hemispace. InRoberston IH and Marshall JC (Eds), Unilateral Neglect: Clinicaland Experimental Studies. Hillsdale, NJ: Lawrence ErlbaumAssociates, Inc, 1993: 63e86.
Kunnapas TM. An analysis of the “vertical horizontal illusion”.Journal of Experimental Psychology, 49(2): 134e140, 1955.
Kunnapas TM. Vertical horizontal illusion and surrounding field.Acta Psychologica, 13: 35e42, 1957.
Losier BJ and Klein RM. A review of the evidence for a disengagedeficit following parietal lobe damage. Neuroscience andBiobehavioral Reviews, 25(1): 1e13, 2001.
Marshall JC and Halligan PW. When right goes left: Aninvestigation of line bisection in a case of visual neglect.Cortex, 25(3): 503e515, 1989.
Mattingley JB, Bradshaw JL, and Bradshaw JA. The effects ofunilateral visuospatial neglect on perception of muller-lyerillusory figures. Perception, 24(4): 415e433, 1995.
Mattingley JD, David G, and Driver J. Preattentive filling-in ofvisual surfaces in parietal extinction. Science, 275(5300):671e674, 1997.
McIntosh RD, Schindler I, Birchall D, and Milner AD. Weights andmeasures: A new look at bisection behaviour in neglect.Cognitive Brain Research, 25(3): 833e850, 2005.
Milner AD, Harvey M, Roberts RC, and Forster SV. Line bisectionerrors in visual neglect: Misguided action or size distortion?Neuropsychologia, 31(1): 39e49, 1993.
Mort DJ, Malhotra P, Mannan SK, Rorden C, Pambakian A,Kennard C, et al. The anatomy of visual neglect. Brain, 126(9):1986e1997, 2003.
Natale E, Posteraro L, Prior M, and Marzi CA. What kind of spatialattention is impaired in neglect? Neuropsychologia, 43(7):1072e1085, 2005.
Posner M, Walker J, Friedrich F, and Rafal R. Effects of parietalinjury on covert orienting of attention. Journal of Neuroscience,4(7): 1863e1874, 1984.
Posner MI. Orienting of attention. Quarterly Journal ExperimentalPsychology, 32(1): 3e25, 1980.
Posner MI and Cohen Y. Components of visual orienting. InBouma H and Bouwhuis D (Eds)Attention and performance.London: Lawrence Erlbaum, 1984: 531e556.
Rastelli F, Funes MJ, Lupianez J, Duret C, and Bartolomeo P. Leftneglect: Is the disengage deficit space- or object-based?Experimental Brain Research, 187(3): 439e446, 2008.
Riddoch MJ and Humphreys GW. The effect of cueing onunilateral neglect. Neuropsychologia, 21(6): 589e599, 1983.
Robertson LC, Mirjam E, and Knight R. Grouping influences inunilateral visual neglect. Journal of Clinical and ExperimentalNeuropsychology, 25(3): 297e307, 2003.
Robertson IH, Nico D, and Hood BM. The intention to act improvesunilateral left neglect: Two demonstrations. NeuroReport, 7(1):246e248, 1995.
Rorden C, Berger MF, and Karnath HO. Disturbed line bisection isassociated with posterior brain lesions. Brain Research, 1080(1):17e25, 2006.
Rorden C and Brett M. Stereotaxic display of brain lesions.Behavioural Neurology, 12(4): 191e200, 2000.
Rorden C, Karnath HO, and Bonilha L. Improving lesion-symptommapping. Journal of Cognitive Neuroscience, 19(7): 1081e1088,2007.
Schenkenberg T, Bradford DC, and Ajax ET. Line bisection andunilateral visual neglect in patients with neurologicimpairment. Neurology, 30(5): 509e517, 1980.
Schneider W, Eschman A, and Zuccolotto A. E-prime User’s Guide.Pittsburg: Psychology Software Tools Inc., 2002.
Shomstein S, Kimchi R, Hammer M, and Behrmann M. Perceptualgrouping operates independently of attentional selection:Evidence from hemispatial neglect. Attention, Perception &Psychophysics, 72(3): 607e618, 2010.
Sieroff E, Decaix C, Chokron S, and Bartolomeo P. Impairedorienting of attention in left unilateral neglect: Acomponential analysis. Neuropsychology, 21(1): 94e113,2007.
Snow JC and Mattingley JB. Goal-driven selective attention inpatients with right hemisphere lesions: How intact is theipsilesional field? Brain, 129(1): 168e181, 2006.
Snow JC and Mattingley JB. Central perceptual load does notreduce ipsilesional flanker interference in parietal extinction.Neuropsychology, 22(3): 371e382, 2008.
Thiebaut de Schotten M, Urbanski M, Duffau H, Volle E, Levy R,Dubois B, et al. Direct evidence for a parietalefrontal pathwaysubserving spatial awareness in humans. Science, 309(5744):2226e2228, 2005.
Tzourio-Mazoyer N, Landeau B, Papathanassiou D, Crivello F,Etard O, Delcroix N, et al. Automated anatomical labeling ofactivations in SPM using a macroscopic anatomicalparcellation of the MNI MRI single-subject brain. NeuroImage,15(1): 273e289, 2002.
Urbanski M and Bartolomeo P. Line bisection in left neglect:The importance of starting right. Cortex, 44(7):782e793, 2008.
Urbanski M, Thiebaut de Schotten M, Rodrigo S, Catani M,Oppenheim C, Touze E, et al. Brain networks of spatialawareness: Evidence from diffusion tensor imagingtractography. Journal of Neurology, Neurosurgery and Psychiatry,79(5): 598e601, 2008.
Vallar G. Extrapersonal visual unilateral spatial neglect and itsneuroanatomy. NeuroImage, 14(1): 52e58, 2001.
Vallar G, Daini R, and Antonucci G. Processing of illusion of lengthin spatial hemineglect: A study of line bisection.Neuropsychologia, 38(7): 1087e1097, 2000.
Ward R and Goodrich S. Differences between objects andnonobjects in visual extinction: A competition for attention.Psychological Science, 7(3): 177e180, 1996.
Wolfe U, Maloney LT, and Tam M. Distortions of perceived lengthin the frontoparallel plane: Tests of perspective theories.Perception and Psychophysics, 67(6): 967e979, 2005.
c o r t e x 4 8 ( 2 0 1 2 ) 5 4 0e5 5 2552
Related Documents