Display States, Class I Areas Home extent set to 36km grid

Display States, Class I Areas Home extent set to 36km grid.
Dec 19, 2015
Welcome message from author
This document is posted to help you gain knowledge. Please leave a comment to let me know what you think about it! Share it to your friends and learn new things together.
Transcript

Display States, Class I Areas
Home extent set to 36km grid
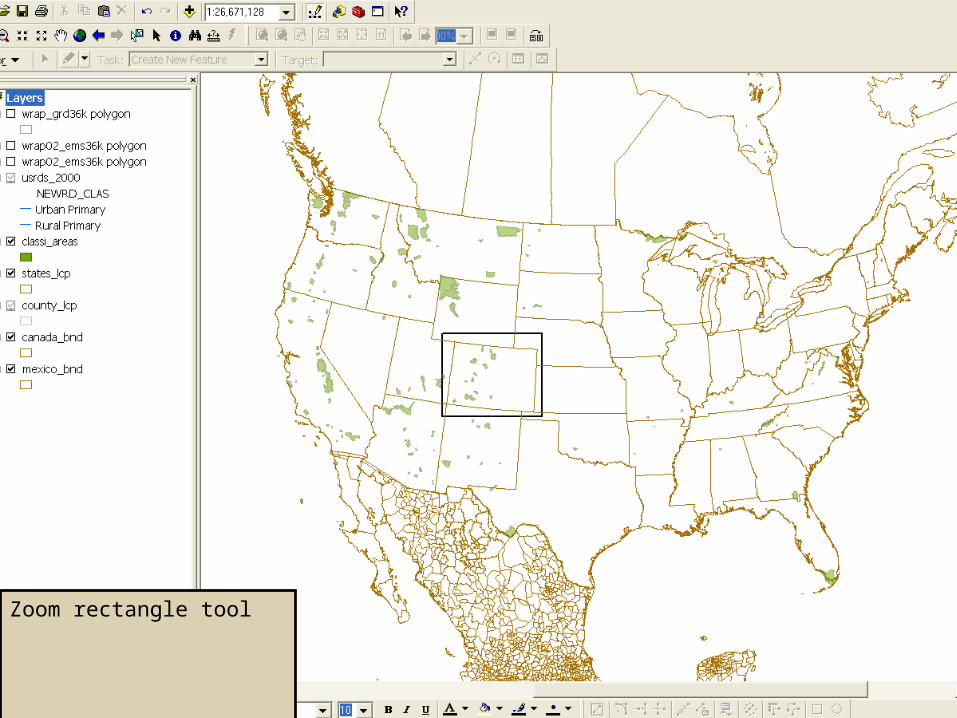
Zoom rectangle tool

Class I Areas labeled when zoomed beyond 1:5,000,000
Counties appear when zoomed beyond 1:5,000,000

Zoom further in

Roads appear when zoomed beyond 1:2,000,000

Turn on gridded emissions layer for VOC

Zoom to Bay Area to test identify tool

Identify by grid cell to get gridded emissions values (all pollutants shown)

Turn on gridded emissions layer for NOX

Zoom in and identify by grid cell to get gridded emissions values (all pollutants shown)

Turn on county-based SMOKE emissions layer for SO2

Zoom in and identify by county to get county emissions values (all pollutants shown)

View zoomed area with grid cells displayed; could be used for selecting a grid cell but actually querying county-based emissions

Potential Data Items for Identify Tool
• CMAQ model input emissions by grid cell (shown here)• SMOKE emissions summary by county (shown here)• SMOKE emissions summary by grid cell• SMOKE emissions summary by state• IDA file emissions by county (FIPS) or state• Model output concentrations by grid cell
Based on grid cell IJ (for domain of interest), county FIPS or state FIPS
Related data tables
One pollutant at a time vs. All pollutants at once
Related Documents