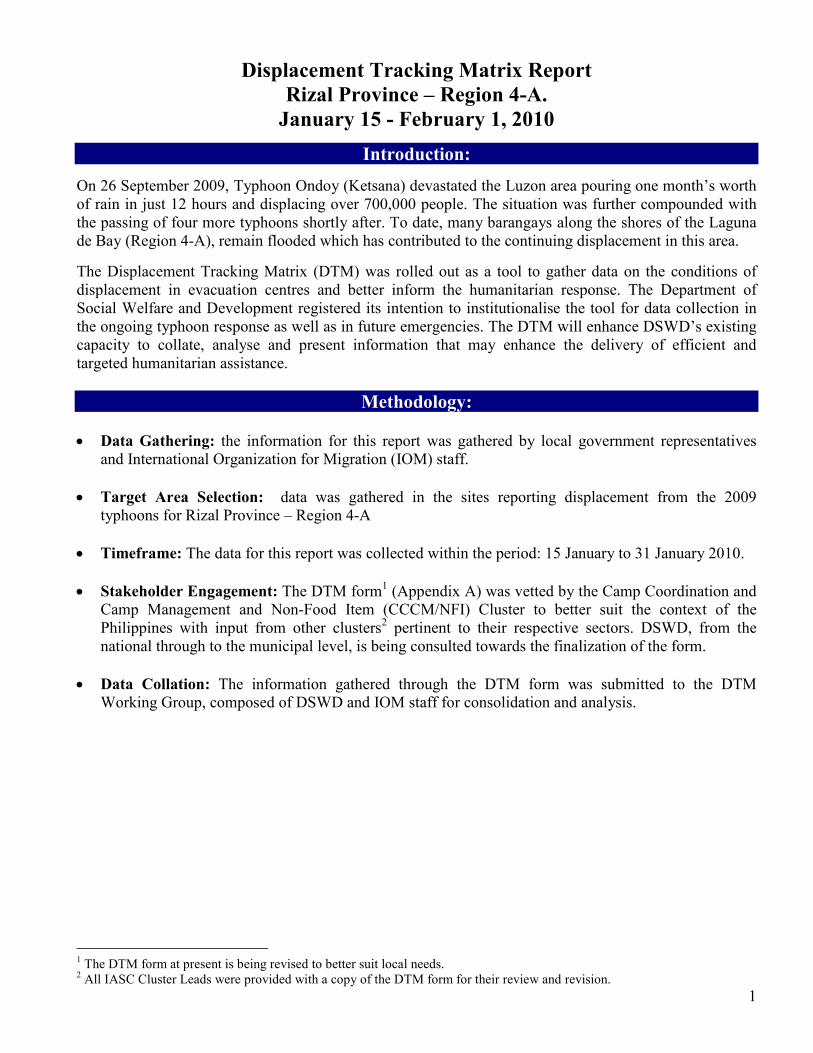
1 Displacement Tracking Matrix Report Rizal Province – Region 4-A. January 15 - February 1, 2010 Introduction: On 26 September 2009, Typhoon Ondoy (Ketsana) devastated the Luzon area pouring one month’s worth of rain in just 12 hours and displacing over 700,000 people. The situation was further compounded with the passing of four more typhoons shortly after. To date, many barangays along the shores of the Laguna de Bay (Region 4-A), remain flooded which has contributed to the continuing displacement in this area. The Displacement Tracking Matrix (DTM) was rolled out as a tool to gather data on the conditions of displacement in evacuation centres and better inform the humanitarian response. The Department of Social Welfare and Development registered its intention to institutionalise the tool for data collection in the ongoing typhoon response as well as in future emergencies. The DTM will enhance DSWD’s existing capacity to collate, analyse and present information that may enhance the delivery of efficient and targeted humanitarian assistance. Methodology: • Data Gathering: the information for this report was gathered by local government representatives and International Organization for Migration (IOM) staff. • Target Area Selection: data was gathered in the sites reporting displacement from the 2009 typhoons for Rizal Province – Region 4-A • Timeframe: The data for this report was collected within the period: 15 January to 31 January 2010. • Stakeholder Engagement: The DTM form 1 (Appendix A) was vetted by the Camp Coordination and Camp Management and Non-Food Item (CCCM/NFI) Cluster to better suit the context of the Philippines with input from other clusters 2 pertinent to their respective sectors. DSWD, from the national through to the municipal level, is being consulted towards the finalization of the form. • Data Collation: The information gathered through the DTM form was submitted to the DTM Working Group, composed of DSWD and IOM staff for consolidation and analysis. 1 The DTM form at present is being revised to better suit local needs. 2 All IASC Cluster Leads were provided with a copy of the DTM form for their review and revision.

Welcome message from author
This document is posted to help you gain knowledge. Please leave a comment to let me know what you think about it! Share it to your friends and learn new things together.
Transcript
1
Displacement Tracking Matrix Report
Rizal Province – Region 4-A.
January 15 - February 1, 2010
Introduction:
On 26 September 2009, Typhoon Ondoy (Ketsana) devastated the Luzon area pouring one month’s worth
of rain in just 12 hours and displacing over 700,000 people. The situation was further compounded with
the passing of four more typhoons shortly after. To date, many barangays along the shores of the Laguna
de Bay (Region 4-A), remain flooded which has contributed to the continuing displacement in this area. The Displacement Tracking Matrix (DTM) was rolled out as a tool to gather data on the conditions of
displacement in evacuation centres and better inform the humanitarian response. The Department of
Social Welfare and Development registered its intention to institutionalise the tool for data collection in
the ongoing typhoon response as well as in future emergencies. The DTM will enhance DSWD’s existing
capacity to collate, analyse and present information that may enhance the delivery of efficient and
targeted humanitarian assistance.
Methodology:
• Data Gathering: the information for this report was gathered by local government representatives
and International Organization for Migration (IOM) staff.
• Target Area Selection: data was gathered in the sites reporting displacement from the 2009
typhoons for Rizal Province – Region 4-A
• Timeframe: The data for this report was collected within the period: 15 January to 31 January 2010.
• Stakeholder Engagement: The DTM form1 (Appendix A) was vetted by the Camp Coordination and
Camp Management and Non-Food Item (CCCM/NFI) Cluster to better suit the context of the
Philippines with input from other clusters2 pertinent to their respective sectors. DSWD, from the
national through to the municipal level, is being consulted towards the finalization of the form.
• Data Collation: The information gathered through the DTM form was submitted to the DTM
Working Group, composed of DSWD and IOM staff for consolidation and analysis.
1 The DTM form at present is being revised to better suit local needs.
2 All IASC Cluster Leads were provided with a copy of the DTM form for their review and revision.
2
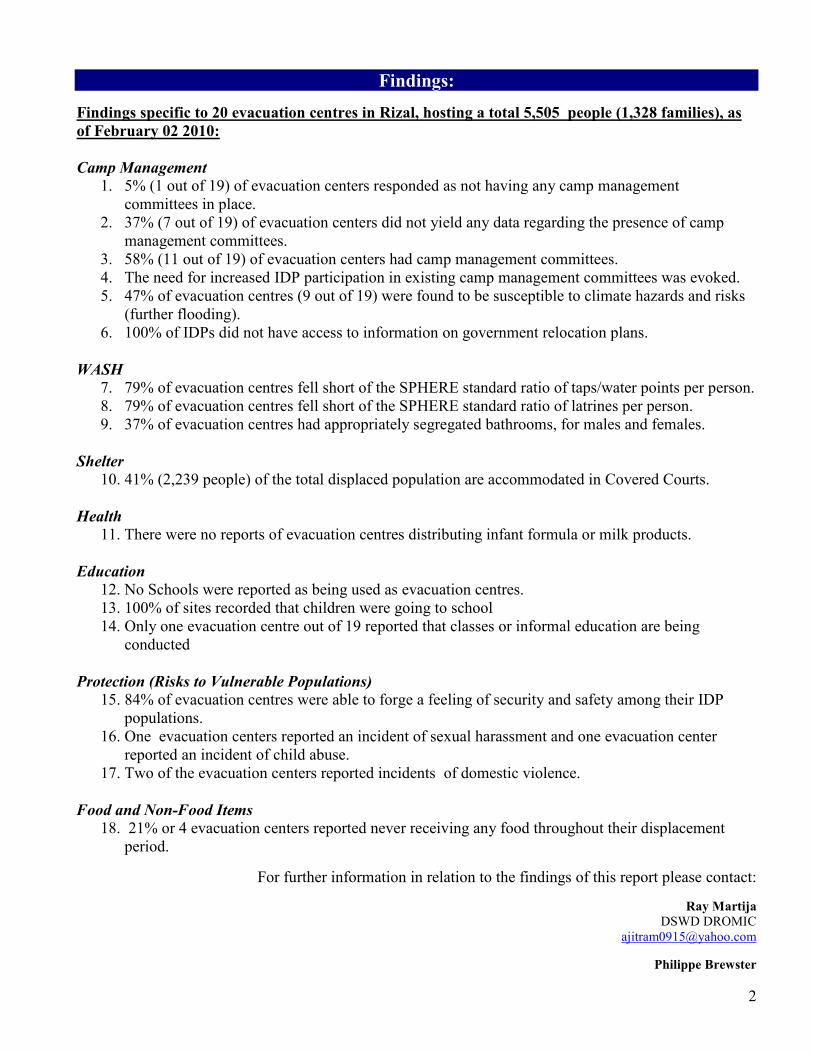
Findings:
Findings specific to 20 evacuation centres in Rizal, hosting a total 5,505 people (1,328 families), as
of February 02 2010:
Camp Management
1. 5% (1 out of 19) of evacuation centers responded as not having any camp management
committees in place.
2. 37% (7 out of 19) of evacuation centers did not yield any data regarding the presence of camp
management committees.
3. 58% (11 out of 19) of evacuation centers had camp management committees.
4. The need for increased IDP participation in existing camp management committees was evoked.
5. 47% of evacuation centres (9 out of 19) were found to be susceptible to climate hazards and risks
(further flooding).
6. 100% of IDPs did not have access to information on government relocation plans.
WASH
7. 79% of evacuation centres fell short of the SPHERE standard ratio of taps/water points per person.
8. 79% of evacuation centres fell short of the SPHERE standard ratio of latrines per person.
9. 37% of evacuation centres had appropriately segregated bathrooms, for males and females.
Shelter
10. 41% (2,239 people) of the total displaced population are accommodated in Covered Courts.
Health
11. There were no reports of evacuation centres distributing infant formula or milk products.
Education
12. No Schools were reported as being used as evacuation centres. 13. 100% of sites recorded that children were going to school
14. Only one evacuation centre out of 19 reported that classes or informal education are being
conducted
Protection (Risks to Vulnerable Populations)
15. 84% of evacuation centres were able to forge a feeling of security and safety among their IDP
populations.
16. One evacuation centers reported an incident of sexual harassment and one evacuation center
reported an incident of child abuse.
17. Two of the evacuation centers reported incidents of domestic violence.
Food and Non-Food Items
18. 21% or 4 evacuation centers reported never receiving any food throughout their displacement
period.
For further information in relation to the findings of this report please contact:
Ray Martija
DSWD DROMIC
Philippe Brewster

3
Evacuation Centres Per Province
1
3
1
10
2019
0
5
10
15
20
25
BENGUET NCR PAMPANGA ZAMBALES LAGUNA RIZAL
CAR NCR Region 3 Region 4-A
Evacuation Centre Population
122663
1,000
12,202
4,8265,505
-
2,000
4,000
6,000
8,000
10,000
12,000
14,000
BENGUET NCR PAMPANGA ZAMBALES LAGUNA RIZAL
CAR NCR Region 3 Region 4-A
CCCM/NFI Cluster Coordinator
Results
1. EVACUATION CENTRE (EC) MANAGEMENT:
DEMOGRAPHICS
• There are a total of 19 evacuation centres in the province of Rizal (in Region 4-A) hosting
5,505 people (1,328 families).
• An average of 48/73% of IDPs are female and 51.27% are male.
� 30 evacuation centre residents are reported as living with a physical disability, 6 people are reported as living with a mental disability, 17 people are reported as living with a sensory
disability, 28 people are reported as being chronically ill (see appendix B).
• Appendix B provides demographic breakdown by age, sex and province and includes
information on population at risk
Types of Evacuation Centres (See figure 1.3)
• In 21% (4 sites) of evacuation centres are covered courts (see figure 1.3). 41% (2,239 people)
of the total displaced population are accommodated in covered courts (see figure 1.4).
CAMP MANAGEMENT COMMITTEES
Figure 1.2
Figure 1.1
Figure 1.3 Figure 1.4

4
58% (11 sites) of evacuation centres report that camp management committees are in place (see figure
1.6).
• Appendix 1 details the list of evacuation centres reporting no camp committees
established
Note: Though Camp Management Committees are in place, further information gathered through a Camp
Management Lessons Learnt and De-briefing Activity indicate that further strengthening of the existing
mechanisms and a possible re-evaluation of the structure of the committees is necessary.
POPULATION DENSITY
Based on the interpretation by each enumerator using a sliding scale with 1 being lowest and 3 highest.
Three sites were reported as being very crowded (See figure 2.1). In addition, out of the total 19
evacuation centres, 9 sites reported that the sites are susceptible to the weather or further flooding.
• Appendix 2 details the list of ECs reported as crowded.
Figure 2.1
Figure 1.6

5
ELECTRICITY ON SITE
• 7 out of 19 evacuation centres reported having no electricity supplied on site
3. WATER, SANITATION AND HYGIENE (WASH)
26% (5 sites) of evacuation centres reported there was insufficient drinking water (see figure 3.1), 74%
(14 sites) reported that there were no functioning taps or water points (See figure 3.2)
• 79% (15 sites) of evacuation centres are reported as falling below Sphere Standards in terms of
taps or maximum of 250 persons per water point (See figure 3.3)
• 79% (15 sites) of evacuation centres are reported as falling below Sphere Standards in terms of
latrines or maximum of 20 persons per latrine.
• 37% (7 sites) of evacuation centres are reported as having separate men and women bathrooms
• Appendix 3 details the list of evacuation centres reporting insufficient drinking water.
• Appendix 4 details the list of evacuation centres with insufficient water points as compared to
Sphere Standards
• Appendix 5 details the list of evacuation centres with insufficient toilets as compared to Sphere
Standards
Figure 3.1

6
Figure 3.2
Figure 3.3
7
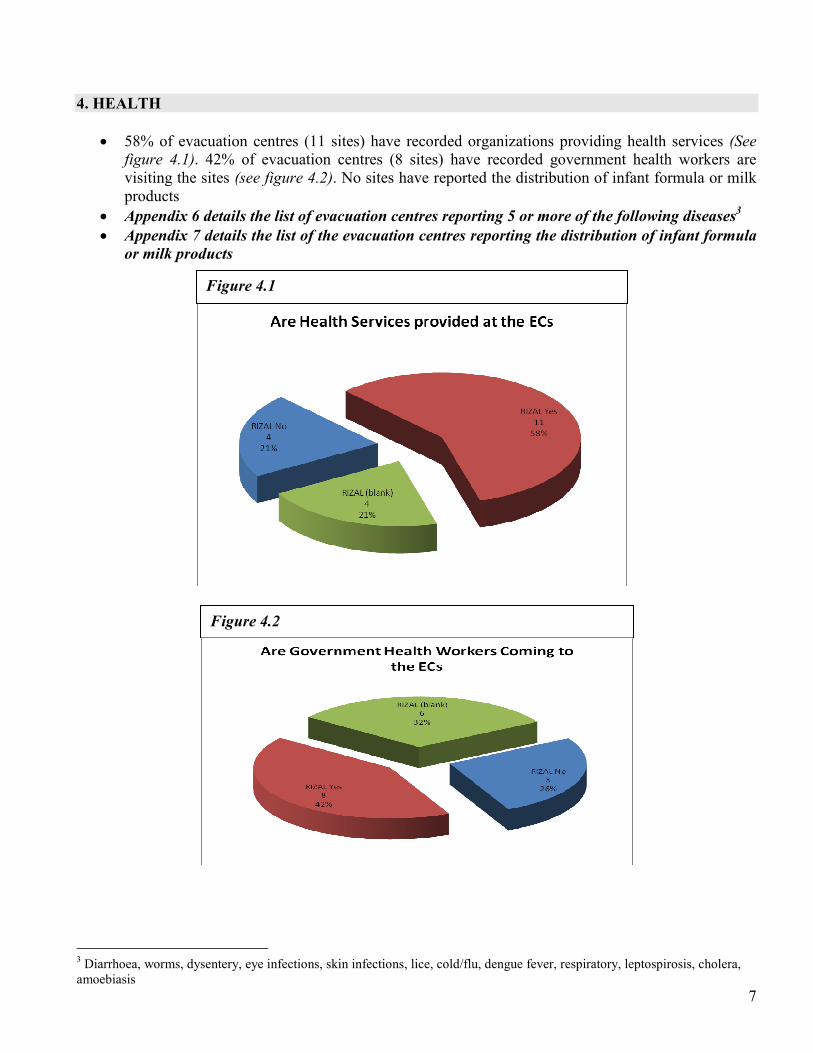
4. HEALTH
• 58% of evacuation centres (11 sites) have recorded organizations providing health services (See
figure 4.1). 42% of evacuation centres (8 sites) have recorded government health workers are
visiting the sites (see figure 4.2). No sites have reported the distribution of infant formula or milk
products
• Appendix 6 details the list of evacuation centres reporting 5 or more of the following diseases3
• Appendix 7 details the list of the evacuation centres reporting the distribution of infant formula
or milk products
3 Diarrhoea, worms, dysentery, eye infections, skin infections, lice, cold/flu, dengue fever, respiratory, leptospirosis, cholera,
amoebiasis
Figure 4.1
Figure 4.2

8
5. EDUCATION
No Public schools were used evacuation centres are public schools (See figure 1.3).
Although 100% of the evacuation centres report that children are going to school, only 1 out of 19
evacuations centres report that classes or informal education are being conducted
• Appendix 8 details the list of evacuation centres reporting that children are not attending school
6. RISK TO VULNERABLE POPULATIONS
It is of import to emphasize that the information gathered for this section was gathered by volunteers,
evacuation centre managers and humanitarian actors that do not have technical experience in identifying
protection issues. The information was gathered by asking yes or no questions to IDP leaders and
community members within the sites. Further validation of the report finding is necessary to adequately
inform actions related to this section.
Majority of the evacuation centres, 84% (16 sites) reported that vulnerable groups feel safe within the
evacuation centres. However there were some reports of safety concerns within the sites (See figure 6.1).
Serious protection concerns reported include:
• 1 evacuation centre with reports of child abuse
• 1 evacuation centre with reports of domestic violence
• Appendix 9 details the list of evacuation centres reporting serious protection concerns
Figure 5.1
Figure 6.1
9
Vulnerability in Evacuation Centres
13
16
7
6
2
1
3
2
1 1
4
2
4
Is security
provided?
Do Vulnerable
groups feel safe?
Specific services
provided for
WOMEN?
Specific services
provided for
Children?
Specific services
provided for
Persons with
DISABILITIES?
Specific services
provided for Older
Persons?
Specific services
provided for
Persons with
CHRONIC
MEDICAL
CONDITIONS?
Are there reports of
DOMESTIC
VIOLENCE?
Are there reports of
SEXUAL
HARASSMENT?
Are there reports of
CHILD ABUSE?
Is there FRICTION
WITHIN the camp
Population?
Is ther FRICTION
with the HOST
COMMUNITY?
Are there
ALCOHOL or
DRUG-related
problems?
Category Questions
EC
s re
po
rtin
g A
ffir
ma
tiv
e R
esp
on
ses
to C
ate
go
ry Q
ue
stio
ns
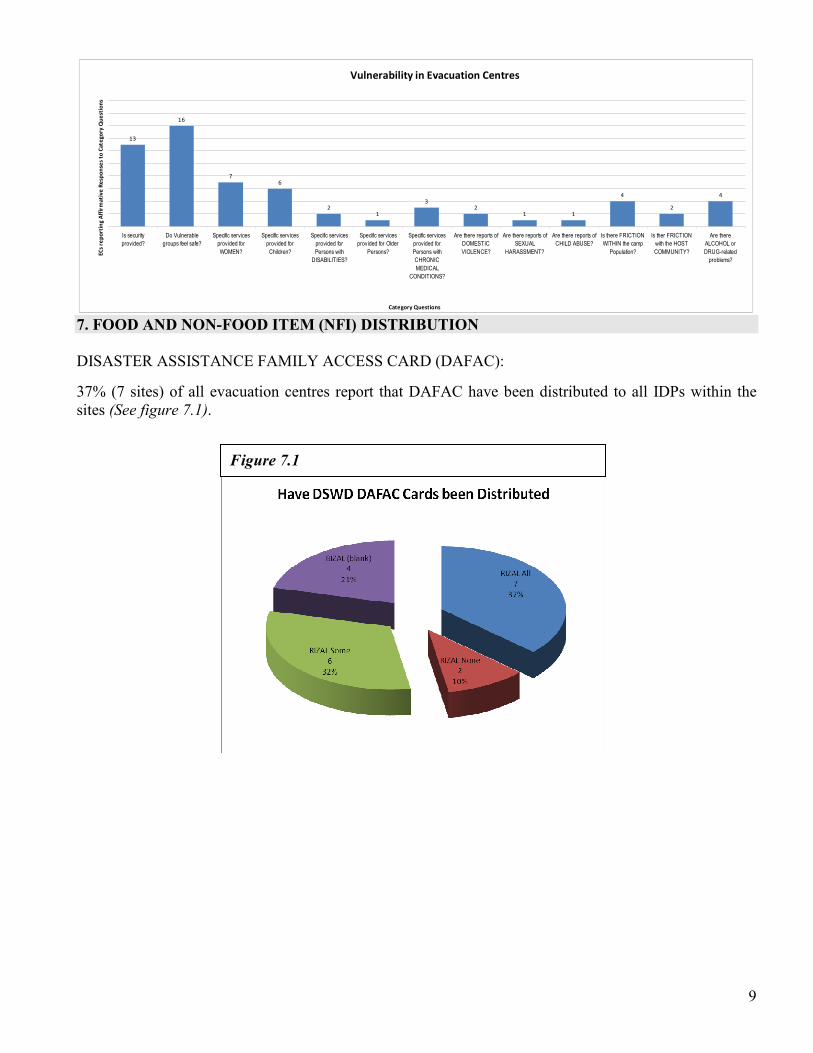
7. FOOD AND NON-FOOD ITEM (NFI) DISTRIBUTION
DISASTER ASSISTANCE FAMILY ACCESS CARD (DAFAC):
37% (7 sites) of all evacuation centres report that DAFAC have been distributed to all IDPs within the
sites (See figure 7.1).
Figure 7.1
10
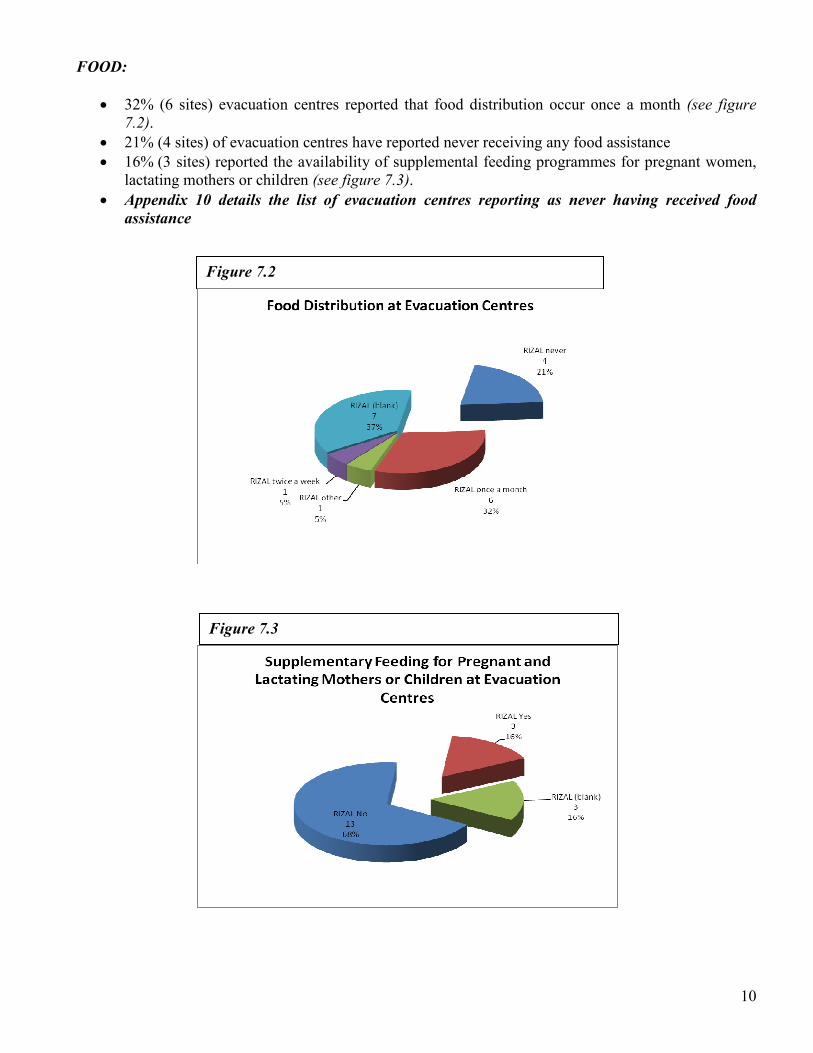
FOOD:
• 32% (6 sites) evacuation centres reported that food distribution occur once a month (see figure
7.2).
• 21% (4 sites) of evacuation centres have reported never receiving any food assistance
• 16% (3 sites) reported the availability of supplemental feeding programmes for pregnant women,
lactating mothers or children (see figure 7.3).
• Appendix 10 details the list of evacuation centres reporting as never having received food
assistance
Figure 7.3
Figure 7.2
11
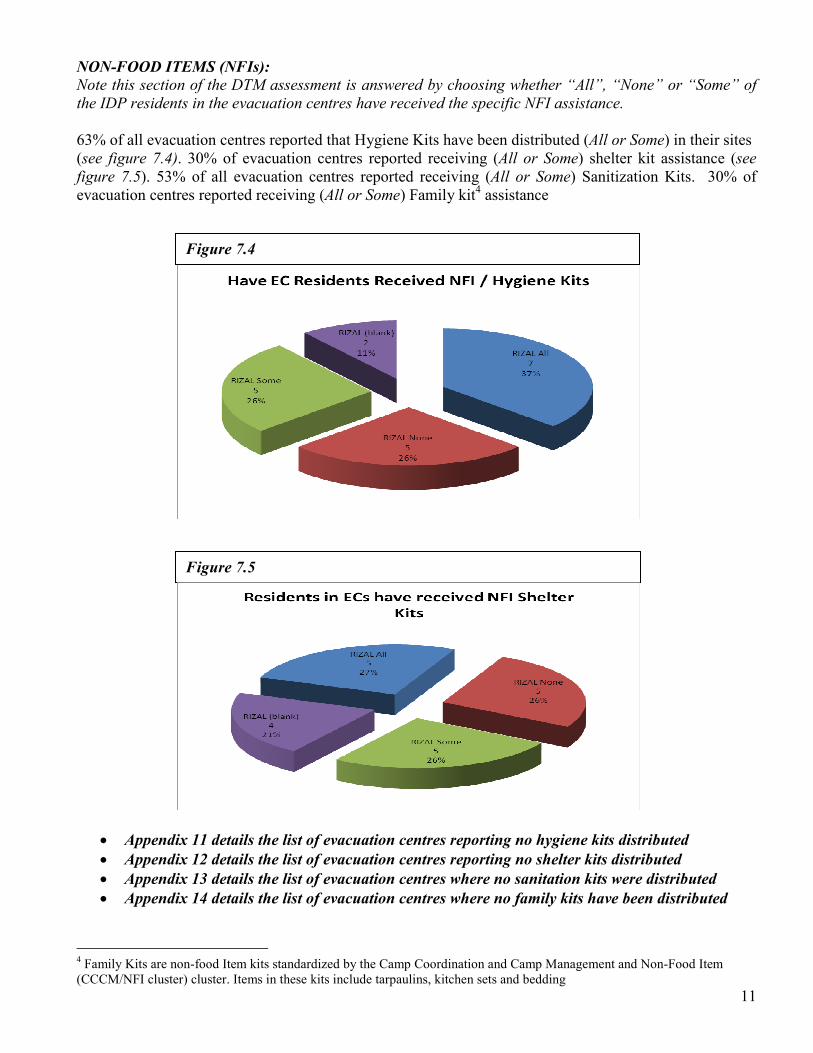
NON-FOOD ITEMS (NFIs):
Note this section of the DTM assessment is answered by choosing whether “All”, “None” or “Some” of
the IDP residents in the evacuation centres have received the specific NFI assistance.
63% of all evacuation centres reported that Hygiene Kits have been distributed (All or Some) in their sites
(see figure 7.4). 30% of evacuation centres reported receiving (All or Some) shelter kit assistance (see
figure 7.5). 53% of all evacuation centres reported receiving (All or Some) Sanitization Kits. 30% of
evacuation centres reported receiving (All or Some) Family kit4 assistance
• Appendix 11 details the list of evacuation centres reporting no hygiene kits distributed
• Appendix 12 details the list of evacuation centres reporting no shelter kits distributed
• Appendix 13 details the list of evacuation centres where no sanitation kits were distributed
• Appendix 14 details the list of evacuation centres where no family kits have been distributed
4 Family Kits are non-food Item kits standardized by the Camp Coordination and Camp Management and Non-Food Item
(CCCM/NFI cluster) cluster. Items in these kits include tarpaulins, kitchen sets and bedding
Figure 7.4
Figure 7.5

12
8. EVACUATION CENTRE CLOSURE
• All of the 19 evacuation centres report that their residents do not have information on relocation
initiatives.
Related Documents