As a response to the humanitarian crisis that is currently affecting the Democratic Republic of Congo, the International Organization for Migration (IOM) launched Displacement Tracking Matrix exercises (DTM) in seven (7) provinces of the country in order to collect up-to-date information on forcibly displaced persons and returnees. These results will provide a better understanding of the displacement dynamics in DRC and support the humanitarian response. This report provides the main findings of the DTM assessments that were conducted in the Lomami province from the 13th of April to the 12th of May 2018 within 312 health areas (aires de santé). The information provided in this report reflects population movements that occured in 2016, 2017, and during the first quarter of 2018. These assessments were conducted following standard DTM methodologies and tools that were developed by IOM in various countries in the world. IOM field teams have reached all the accessible villages in the Lomami province and collected data through key informants interviews. 266,575 252,918 IDPs* Returnees* Key informants Villages Assessed 2,684 Forced displacement and Return movements in Lomami - Assessment Report Sources: basemap RGC (Référentiel Géographique commun de la RDC), DTM assessment DRC / PDHPES, 13 April – 12 May. 2018. This map is for illustration purposes only. 1 8,977 * Estimations - The results presented in this report are based on estimations provided by key informants in each village. DISPLACEMENT TRACKING MATRIX – Democratic Republic of Congo Report #1: June 2018 – Province of Lomami # IDPs per Health Zone # Returnees per Health Zone DTM Assessment coverage per HZ For these assessments, a total of 2,684 villages have been evaluated through 8,977 key informants’ interviews by IOM’s partner PDHPES, in collaboration with the DPS (Division Provinciale de la Santé). In general, most of the IDPs in the province have been identified in the territories of Luilu and Mwene-Ditu (35 % and 31 % respectively). In Mwene-Ditu, Kalenda, and Makota health zones, the displaced population represents 18 %, 15,4 % and 12,6 % of the IDPs identified in the Lomami province, respectively. Although only 6 % of the IDPs of the province were recorded in Kamiji, the displaced population in this health zone represents 18 % of the local population. Luilu, which is the territory mostly affected by internal displacement movements, is also the main returning area where 40,6 % of the return movements have occurred. Around 30 % of the returnees in the province live in Kalenda health zones, they represent 38 % of the local population in this area.

Welcome message from author
This document is posted to help you gain knowledge. Please leave a comment to let me know what you think about it! Share it to your friends and learn new things together.
Transcript

As a response to the humanitarian crisis that is currently affecting the Democratic Republic ofCongo, the International Organization for Migration (IOM) launched Displacement TrackingMatrix exercises (DTM) in seven (7) provinces of the country in order to collect up-to-dateinformation on forcibly displaced persons and returnees. These results will provide a betterunderstanding of the displacement dynamics in DRC and support the humanitarian response.
This report provides themain findings of the DTMassessments that wereconducted in the Lomamiprovince from the 13th ofApril to the 12th of May2018 within 312 healthareas (aires de santé). Theinformation provided inthis report reflectspopulation movementsthat occured in 2016,2017, and during the firstquarter of 2018.
These assessments wereconducted followingstandard DTMmethodologies and toolsthat were developed byIOM in various countriesin the world. IOM fieldteams have reached allthe accessible villages inthe Lomami province andcollected data throughkey informants interviews.
266,575252,918
IDPs* Returnees*Key informants
VillagesAssessed
2,684
Forced displacement and Return movements
in Lomami - Assessment Report
Sources: basemap RGC (Référentiel Géographique commun de la
RDC), DTM assessment DRC / PDHPES, 13 April – 12 May. 2018.
This map is for illustration purposes only.
1
8,977
* Estimations - The results presented in this report are based on estimations provided by key informants in each village.
DISPLACEMENT TRACKING MATRIX – Democratic Republic of Congo Report #1: June 2018 – Province of Lomami
# IDPs per HealthZone
# Returnees per Health Zone
DTM Assessmentcoverage per HZ
For these assessments, a total of 2,684 villages have been evaluated through 8,977 key informants’ interviews by IOM’s partnerPDHPES, in collaboration with the DPS (Division Provinciale de la Santé). In general, most of the IDPs in the province have beenidentified in the territories of Luilu and Mwene-Ditu (35 % and 31 % respectively). In Mwene-Ditu, Kalenda, and Makota healthzones, the displaced population represents 18 %, 15,4 % and 12,6 % of the IDPs identified in the Lomami province, respectively.Although only 6 % of the IDPs of the province were recorded in Kamiji, the displaced population in this health zone represents18 % of the local population. Luilu, which is the territory mostly affected by internal displacement movements, is also the mainreturning area where 40,6 % of the return movements have occurred. Around 30 % of the returnees in the province live inKalenda health zones, they represent 38 % of the local population in this area.

Villages assessed
Methodology and geographic coverage
Nearly all the villages reported by the Health provincial division in the Lomami province have been evaluated (2,684). Thecoverage of some areas has remained incomplete because of logistical and security limitations. In many health zones, bridgesand roads were missing which has prevented the teams to reach every villages. In Kanda Kanda, the presence of manycrocodiles has detered the enumerators to reach their intended location. The lack of infrastructures in the province remains asignificant challenge for local population. Many villages are located in remote areas that humanitarian actors are not able toreach. While some villages did not exist on the original list provided by the DPS, a total of 184 new villages have been found andevaluated by the enumerators in the field. For the majority of these villages, the GPS coordinates have been recorded. Thoughhealth zones were all accessible, in particular in Kalambayi Kabanga, the security limitations caused by inter-communal conflictshave prevented the field teams to cover the areas in an exhaustive way. However, for those areas, many assessments havebeen conducted remotely through the key informants. *
*Data regarding the villages accesssibility is available upon request. ** The GPS coordinates of some villages are not available 2
For some villages, the rate is higher than 100%: this isexplained by the fact that new villages have been foundin the field, those villages were not recorded in the listprovided by the DPS.
What are Health zones and Health areas? In DRC, the DTM teams are working in close collaboration with the Ministry of Health and itsprovicincial divisions - the DPS (Division Provinciale de la Santé). These provincial divisions work at three geographical levels ofsubdivisions: territories, health zones and health areas. The territories are comprised of a set of health zones which are themselvescomposed of a lower set of subdivisions called health areas (aires de santé).
Assessment coverage rate
DISPLACEMENT TRACKING MATRIX – Democratic Republic of Congo Report #1: June 2018 – Province of Lomami
In Ludimbi Lukula Health zone, field teams could not reach most of thevillages (65 %) and record accurate GPS coordinates: in those cases,assessments were conducted remotely. Many of these villages are extremelyisolated and disconnected from the rest of the province. The populationdensity is the weakest in the province, its inhabitants suffer from the lack oftransport infrastructures (bridges and good road conditions) and drinkingwater. To a lesser extent, this situation has also been observed in Kabinda,Kamana and Lubao health zones where nearly 30 % of the villages could notbe reached because of similar reasons.
21,9%
15,3%
14,2%13,5%1,5%
28,6%
4,9%
Key informants
Village leader
Religious leader
Teacher
Registered nurse
Head of zoneDoctorCommunity leader
Sources: basemap RGC (RGC, Referentiel Geographique commun de
la RDC). DTM assessment DRC / PDHPES, 13 April – 12 May.
2018. This map is for illustration purposes only.
Health zonesAll Villages
(DPS)
# Villages
DTM
Coverage
rate
Kabinda 266 272 102,3%
Kalonda 169 160 94,7%
Ludimbi Lukula 218 219 100,5%
Makota 93 94 101,1%
Mwene Ditu 195 203 104,1%
Kalenda 184 177 96,2%
Kandakanda 233 177 76,0%
Luputa 150 139 92,7%
Wikong 69 71 102,9%
Kamiji 73 91 124,7%
Kalambayi 206 148 71,8%
Mulumba 165 179 108,5%
Ngandajika 108 186 172,2%
Kamana 170 180 105,9%
Lubao 254 261 102,8%
Tshofa 129 127 98,4%
Total 2682 2684 100,1%

Displaced persons
The territories of Luilu and Mwene-Ditu host most of the IDPs inthe province (34,8 % and 30,6 %, respectively). With 45,722 IDPs,Mwene-Ditu is the most affected health zone, followed byKalenda and Makota. More over, Cim, in Mwene-Ditu, is thehealth area that has received the highest number of IDPs in theprovince. The pressure of the displacement is extremely high inKalanda health zone, in particular in Ngoyi Banda, Tshilomba andTsimanda health areas: indeed, the presence of the IDPsrepresent 62 %, 80 % and 103 % of the local population,respectively.
More broadly, the population densities in Mwene-Ditu andMakota health zones are higher than in other affected areas inthe province such as Kalenda and Kanda Kanda. In Kalenda andMwene-Ditu, the IDP population represents 18 % and 10 % of thelocal population, respectively. Local populations in these twohealth zones may therefore certainly feel the presence of theIDPs differently.
Forced displacement
and demography
3
% of IDP / total
population in
Health zone
DISPLACEMENT TRACKING MATRIX – Democratic Republic of Congo Report #1: June 2018 – Province of Lomami
Sources: basemap RGC (Référentiel Géographique commun de la RDC). DTM
assessment DRC / PDHPES, DPS population estimates 2018, 13 April – 12 May.
2018. This map is for illustration purposes only.
Health zones
per territory# IDPs
% IDPs / Total IDP
population
% IDP / HZ
population
KABINDA 23 712 9,4% 9,6%
KABINDA 12 275 4,9% 3,6%
KALONDA EST 5 205 2,1% 2,1%
LUDIMBI LUKULA 6 232 2,5% 3,8%
KAMIJI 16 073 6,4% 15,4%
KAMIJI 16 073 6,4% 15,4%
LUBAO 19 398 7,7% 10,1%
KAMANA 10 037 4,0% 4,9%
LUBAO 5 091 2,0% 2,3%
TSHOFA 4 270 1,7% 2,9%
LUILU 87 891 34,8% 42,7%
KALENDA 38 824 15,4% 18,2%
KANDA KANDA 20 915 8,3% 8,6%
LUPUTA 14 479 5,7% 4,9%
WIKONG 13 673 5,4% 10,9%
MWENE-DITU 77 490 30,6% 22,9%
MAKOTA 31 768 12,6% 12,8%
MWENE-DITU 45 722 18,1% 10,1%
NGANDAJIKA 28 354 11,2% 9,7%
KALAMBAYI KABANGA6 805 2,7% 3,2%
MULUMBA 13 116 5,2% 3,9%
NGANDAJIKA 8 433 3,3% 2,6%
Total 252 918 100,0% 6,50%
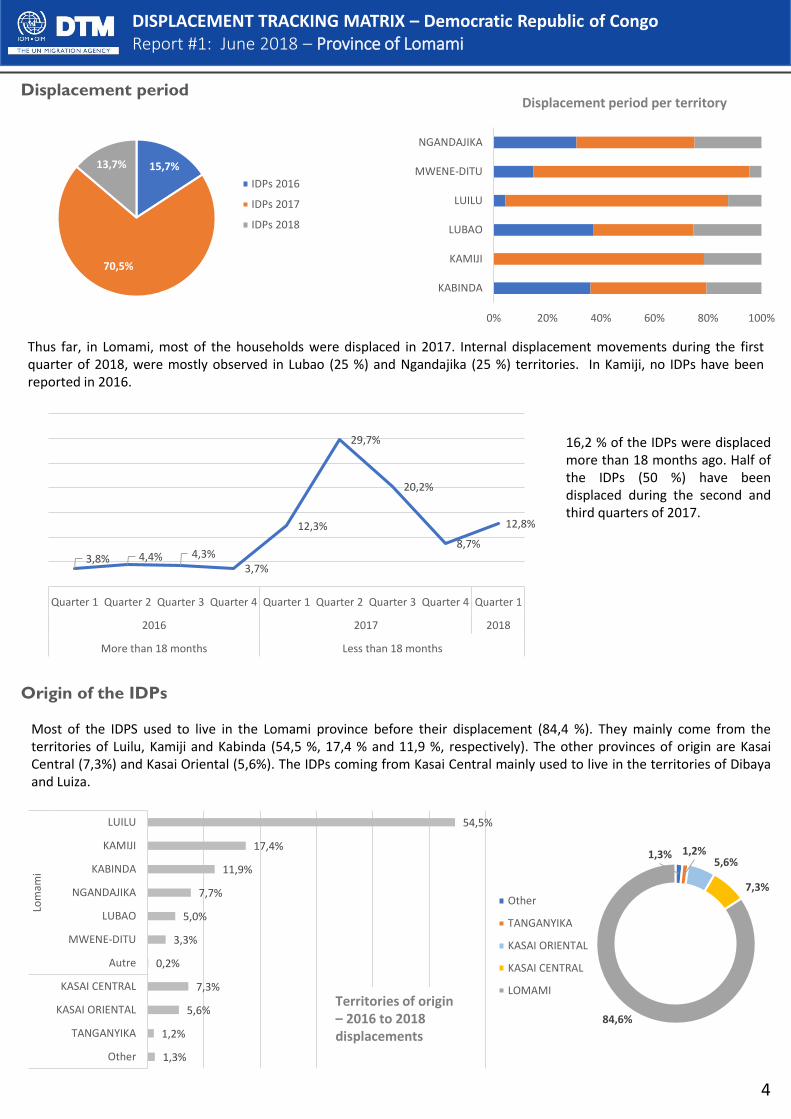
Displacement period
Most of the IDPS used to live in the Lomami province before their displacement (84,4 %). They mainly come from theterritories of Luilu, Kamiji and Kabinda (54,5 %, 17,4 % and 11,9 %, respectively). The other provinces of origin are KasaiCentral (7,3%) and Kasai Oriental (5,6%). The IDPs coming from Kasai Central mainly used to live in the territories of Dibayaand Luiza.
Origin of the IDPs
4
Thus far, in Lomami, most of the households were displaced in 2017. Internal displacement movements during the firstquarter of 2018, were mostly observed in Lubao (25 %) and Ngandajika (25 %) territories. In Kamiji, no IDPs have beenreported in 2016.
16,2 % of the IDPs were displacedmore than 18 months ago. Half ofthe IDPs (50 %) have beendisplaced during the second andthird quarters of 2017.
DISPLACEMENT TRACKING MATRIX – Democratic Republic of Congo Report #1: June 2018 – Province of Lomami
15,7%
70,5%
13,7%
IDPs 2016
IDPs 2017
IDPs 2018
0% 20% 40% 60% 80% 100%
KABINDA
KAMIJI
LUBAO
LUILU
MWENE-DITU
NGANDAJIKA
Displacement period per territory
1,3% 1,2%5,6%
7,3%
84,6%
Other
TANGANYIKA
KASAI ORIENTAL
KASAI CENTRAL
LOMAMI
1,3%
1,2%
5,6%
7,3%
0,2%
3,3%
5,0%
7,7%
11,9%
17,4%
54,5%
Other
TANGANYIKA
KASAI ORIENTAL
KASAI CENTRAL
Autre
MWENE-DITU
LUBAO
NGANDAJIKA
KABINDA
KAMIJI
LUILU
Lom
ami
Territories of origin– 2016 to 2018 displacements
3,8% 4,4% 4,3%3,7%
12,3%
29,7%
20,2%
8,7%
12,8%
Quarter 1 Quarter 2 Quarter 3 Quarter 4 Quarter 1 Quarter 2 Quarter 3 Quarter 4 Quarter 1
2016 2017 2018
More than 18 months Less than 18 months

5
IDPs’ origin in Lomami
DISPLACEMENT TRACKING MATRIX – Democratic Republic of Congo Report #1: June 2018 – Province of Lomami
Base Map Source: basemap RGC (Référentiel Géographique commun de la RDC).DTM assessment DRC / PDHPES, C, 13 April – 12 May. 2018
This map is for illustration purposes only. The depiction and use of boundaries,geographic names, and related data shown on maps and included in this reportare not warranted to be free of error nor do they imply judgment on the legalstatus of any territory, or any endorsement or acceptance of such boundaries byIOM.
.
Provinces of Origin # IDPs
Other 3 395
TANGANYIKA 2 912
KASAI ORIENTAL 14 180
KASAI CENTRAL 18 362
LOMAMI 214 069
Total 252 918
6
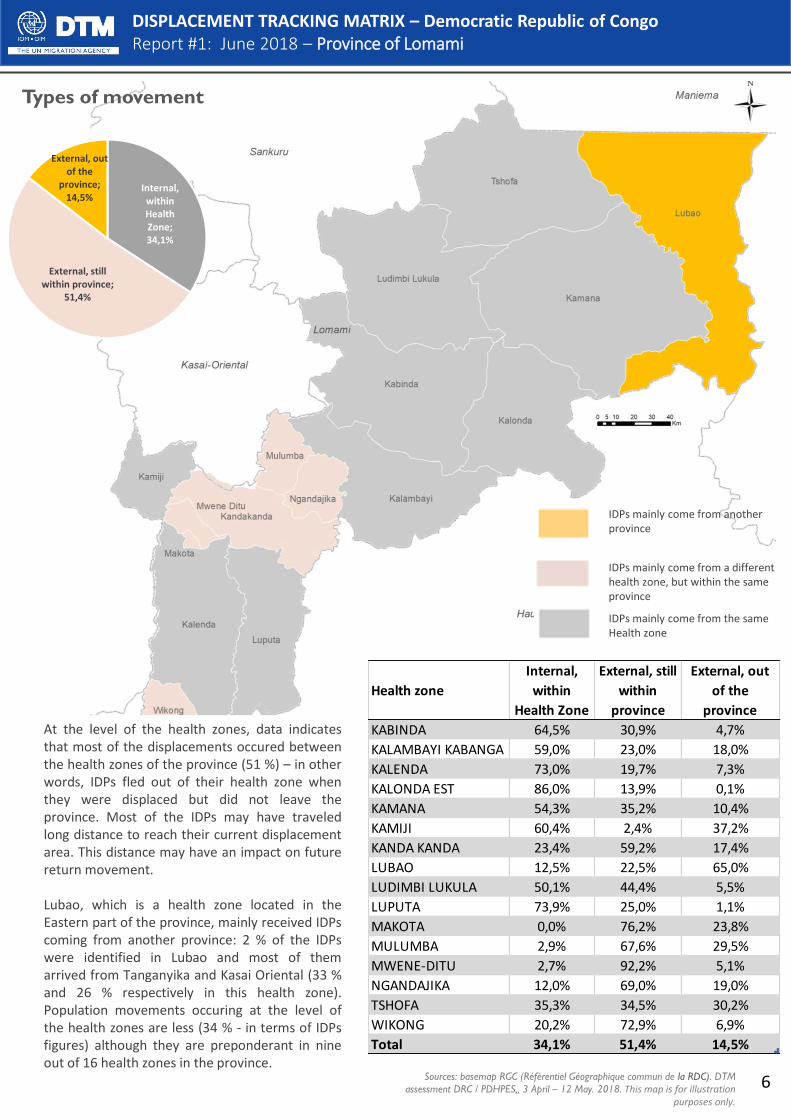
At the level of the health zones, data indicatesthat most of the displacements occured betweenthe health zones of the province (51 %) – in otherwords, IDPs fled out of their health zone whenthey were displaced but did not leave theprovince. Most of the IDPs may have traveledlong distance to reach their current displacementarea. This distance may have an impact on futurereturn movement.
Lubao, which is a health zone located in theEastern part of the province, mainly received IDPscoming from another province: 2 % of the IDPswere identified in Lubao and most of themarrived from Tanganyika and Kasai Oriental (33 %and 26 % respectively in this health zone).Population movements occuring at the level ofthe health zones are less (34 % - in terms of IDPsfigures) although they are preponderant in nineout of 16 health zones in the province.
Types of movement
IDPs mainly come from the sameHealth zone
IDPs mainly come from anotherprovince
IDPs mainly come from a differenthealth zone, but within the sameprovince
DISPLACEMENT TRACKING MATRIX – Democratic Republic of Congo Report #1: June 2018 – Province of Lomami
Health zone
Internal,
within
Health Zone
External, still
within
province
External, out
of the
province
KABINDA 64,5% 30,9% 4,7%
KALAMBAYI KABANGA 59,0% 23,0% 18,0%
KALENDA 73,0% 19,7% 7,3%
KALONDA EST 86,0% 13,9% 0,1%
KAMANA 54,3% 35,2% 10,4%
KAMIJI 60,4% 2,4% 37,2%
KANDA KANDA 23,4% 59,2% 17,4%
LUBAO 12,5% 22,5% 65,0%
LUDIMBI LUKULA 50,1% 44,4% 5,5%
LUPUTA 73,9% 25,0% 1,1%
MAKOTA 0,0% 76,2% 23,8%
MULUMBA 2,9% 67,6% 29,5%
MWENE-DITU 2,7% 92,2% 5,1%
NGANDAJIKA 12,0% 69,0% 19,0%
TSHOFA 35,3% 34,5% 30,2%
WIKONG 20,2% 72,9% 6,9%
Total 34,1% 51,4% 14,5%
Internal, within Health Zone; 34,1%
External, still within province;
51,4%
External, out of the
province; 14,5%
Sources: basemap RGC (Référentiel Géographique commun de la RDC). DTM
assessment DRC / PDHPES,, 3 April – 12 May. 2018. This map is for illustration purposes only.

According to the data collected, most of the individuals were displaced in 2017 because of Armed group attacks (67%). By contrast, in 2016 and 2018, most of the individuals fled inter-communal conflicts and food crisis (between 32and 35 % on average). However, it is worth noting that since 2016, food crisis has forced a large number ofindividuals to flee - between 11 000 and 15 000 individuals each year.
Reasons for displacement
7
Presence of IDPs and Returnees in the villages
Aproximately 22 % of the villages assessed in Lomami have not been affected by internal displacement and do not hostIDPs nor Returnees. Moreover, at the level of the province there are both IDPs and Returnees in 38 % of the villages. IDPshave been reported in all the villages assessed in Mwene-Ditu territory, and, in Kamiji, nearly 94 % of the villages host IDPsand returnees.
DISPLACEMENT TRACKING MATRIX – Democratic Republic of Congo Report #1: June 2018 – Province of Lomami
Reasons for displacement
# Individuals
displaced in
2016
% Individuals
displaced in
2016
# Individuals
displaced in 2017
% Individuals
displaced in 2017
# Individuals
displaced in 2018
% Individuals
displaced in
2018
# IDPs Total % IDPs Total
Inter-communal conflict 12 889 32,4% 38 229 21,4% 12 307 35,5% 63 425 25,1%
Food Crisis 13 740 34,5% 15 160 8,5% 11 695 33,7% 40 595 16,1%
Armed group attacks 7 842 19,7% 119 236 66,8% 7 052 20,3% 134 130 53,0%
Other 5 354 13,4% 5 765 3,2% 3 413 9,8% 14 532 5,7%
Does not know 0 0,0% 0 0,0% 236 0,7% 236 0,1%
Total 39 825 100,0% 178 390 100,0% 34 703 100,0% 252 918 100,0%
0% 20% 40% 60% 80% 100%
% IDPs2016
% IDPs 2017
% IDPs 201825,1%
16,1%53,0%
5,7% 0,1% Inter-communalconflict
Food Crisis
Armed group attacks
Other
Does not know
0% 20% 40% 60% 80% 100%
KABINDA
KAMIJI
LUBAO
LUILU
MWENE-DITU
NGANDAJIKA
Presence of IDPs and Returnees in villages per Territory
22,4%
38,1%
33,3%
6,2%
No IDPs, noreturnees
IDPs and Returnees
IDPSs only
Returnees only

Returnees and demography
Returnees
8
Luilu, which is the territory mostly affected by internaldisplacement movements, is also the main returning areawhere 40,6 % of the return movements have occurred.Around 30 % of the returnees in the province live in Kalendahealth zone, they represent 38 % of the local population in thishealth zone. The territory of Kamiji is much more affected byreturn movements by new internal displacement movements :30,4 % of the returnees have been identified in this territory.In total, in Kamiji, the returnees represent nearly 80 % of thelocal population. In other words, almost the entire populationof Kamiji has been displaced since 2016.
In total, 266,575 individuals have returned to their area oforigin since 2016 and are no longer counted as IDPs. The mainhealth zones where return movements have been observedare Kalenda (30,4 %), Kamiji (30,4 %), and Mwene-Ditu (11,9%). These return movements may be more or less significantas regards to the proportion of returnees compared to thetotal population: the returnees represent 38 %, 77,7 % and 7% of the local population, respectively, in the correspondingzones.
# Returnees per
Village
% Returnees /
Health Zone
population
DISPLACEMENT TRACKING MATRIX – Democratic Republic of Congo Report #1: June 2018 – Province of Lomami
Health zones per
territory# Returnees
% Returnees /
Total returnees
% Returnees / HZ
population
KABINDA 9 042 3,4% 3,5%
KABINDA 3 295 1,2% 1,0%
KALONDA EST 4 984 1,9% 2,0%
LUDIMBI LUKULA 763 0,3% 0,5%
KAMIJI 81 099 30,4% 77,7%
KAMIJI 81 099 30,4% 77,7%
LUBAO 8 681 3,3% 4,4%
KAMANA 4 874 1,8% 2,4%
LUBAO 2 262 0,8% 1,0%
TSHOFA 1 545 0,6% 1,0%
LUILU 108 138 40,6% 55,2%
KALENDA 80 976 30,4% 38,1%
KANDA KANDA 2 558 1,0% 1,1%
LUPUTA 7 830 2,9% 2,7%
WIKONG 16 774 6,3% 13,4%
MWENE-DITU 53 203 20,0% 15,6%
MAKOTA 21 377 8,0% 8,6%
MWENE-DITU 31 826 11,9% 7,0%
NGANDAJIKA 6 412 2,4% 2,1%
KALAMBAYI KABANGA1 019 0,4% 0,5%
MULUMBA 2 879 1,1% 0,9%
NGANDAJIKA 2 514 0,9% 0,8%
Total 266 575 100,0% 6,9%
Sources: basemap RGC (Référentiel Géographique commun de la RDC). DTM
assessment DRC / PDHPES, DPS population estimates 2018, 13 April – 12 May.
2018. This map is for illustration purposes only.

Return period
The data collected indicates that most of the return movements occured in 2017. Since the beginning of 2018, it is worthnoting that all these territories have already received returnees especially in Kabinda and Ngandajika – where respectively 42% and 32% of the return movements have occured in 2018.
Reasons for Return movements
The data collected indicates that 72,5 % of the returneeswent back to their area of origin because the securitysituation had improved. In 2016, nearly 30 % of thereturnees declared that they were willing to rejoin theirfamily and relatives – this return driver has beendecreasing since 2016 as in 2018, only 10,4 % of thereturnees went back to their village of origin for familyreasons.
9
DISPLACEMENT TRACKING MATRIX – Democratic Republic of Congo Report #1: June 2018 – Province of Lomami
2,8%
83,1%
14,1%
Returnees 2016
Returnees 2017
Returnees 2018
0% 20% 40% 60% 80% 100%
KABINDA
KAMIJI
LUBAO
LUILU
MWENE-DITU
NGANDAJIKA
Return period per territory
72,5%
4,8%
0,8%
8,2%
1,1%
10,0%2,6%
Better security (Conflicts)
Better food security
Better health situation
Economic opportunities
School
Rejoin family / relatives
No answer
Other
Reason for return # Returnees
2016
% Returnees
2016
# Returnees
2017
% Returnees
2017
# Returnees
2018
% Returnees
2018Total % Total
Better security (Conflicts) 2 026 27,2% 170 176 76,8% 21 095 56,1% 193 297 72,5%
Better food security 1 019 13,7% 6 231 2,8% 5 446 14,5% 12 696 4,8%
Better health situation 526 7,1% 990 0,4% 671 1,8% 2 187 0,8%
Economic opportunities 1 481 19,9% 14 999 6,8% 5 311 14,1% 21 791 8,2%
School 44 0,6% 2 430 1,1% 462 1,2% 2 936 1,1%
Rejoin family / relatives 2 225 29,8% 20 526 9,3% 3 896 10,4% 26 647 10,0%
No answer 25 0,3% 0 0,0% 5 0,0% 30 0,0%
Other 108 1,4% 6 181 2,8% 702 1,9% 6 991 2,6%
Total 7 454 100,0% 221 533 100,0% 37 588 100,0% 266 575 100,0%

Infrastructures and priority needs
The situation of the villages regarding access to health care, education and security, is worrying. The weak density of theseareas is very much linked to the lack of operational infrastructures. Indeed, out of the villages assessed, only in 32,3 %, the localpopulation has access to an operational health center. In Kamiji and Kanda Kanda, this rate reaches 80 % and 88,6 %respectively. Furthermore, only 46,2 % of the villages evaluated can count on an operational school and 85,9 % of the villageslack of an operational police antenna. Beyond these figures, field enumerators also reported severe protection incidents inMalenga and Kele health areas (Kamiji health zone) and in Wikong and Luputa health zones*. More generally, field reportsindicate that the level of humanitarian assistance in the province remains very low.
In 34 % of the villages, access to drinking water hasbeen raised as a priority need. In Luilu territory inparticular, access to drinking water is a priority for 25% of the villages on average. More generally, in themost affected territories by internal displacement(Makota, Mwene-Ditu and Kalenda), access to foodfollowed by drinking water and education have beenraised by the key informants as the main needs in thevillages.
Internally displaced persons and returnees have beenseeking relatively safer places after having fled – thissituation is reflected in the data collected that shows that77,6 % of all the villages that have been evaluated havenot been affected by violence. However, 18 % of thevillages have been partially destroyed. Most of thosevillages are located in Kalenda and Kamiji.
10
DISPLACEMENT TRACKING MATRIX – Democratic Republic of Congo Report #1: June 2018 – Province of Lomami
0,9%
1,1%
2,5%
2,7%
4,7%
7,5%
9,9%
15,6%
21,2%
33,9%
Other
Essential household items
Protection (Care services)
WASH
Shelter
Access to agricultural input and equipment
Access to food
Education
Health care
Drinking water
1,9%
1,6%
77,6%
18,1%
0,8%
Situation of the villages
No information
Destroyed
Not affected by violence
Partially destroyed
Emptied of its population
2,5%
1,8%
64,1%
31,5%
0,2%
1,1%
9,7%
16,6%
71,3%
1,3%
No information
Destroyed
Not affected by violence
Partially destroyed
Emptied of its population
Returnees IDPs
* For more information on protection incidents, please contact us directly.
More precisely, respectively 71,3 % of thereturnees and 31,5 % of the IDPs now live inpartially destroyed villages whereas 16,6 % of thereturnees and 64 % of the IDPs live in village thathave not been affected by violence.
1,3%
66,4%
32,3%
Noinformation
No
Yes
The majority of the villages, which corresponds to 66,4%, does not have access to an operational healthstructure, either health post, health center or generalhospital. These rates are particularly high in the mostaffected zones of the province (Kalenda, Mwene-Ditu,
Kanda Kanda).

DISPLACEMENT TRACKING MATRIX – Democratic Republic of Congo Report #1: June 2018 – Province of Lomami
Displacement pressure
The graph below shows the distribution of the villages according to a specific displacement pressure indicator. Thisindicator rates the villages from 1 to 10, 1 being the villages in the less critical situation, 10 the villages in the most criticalone. This specific methology combines, on one hand, demographic data (rate of IDP and returnee population per village,corresponding health zone population density, presence of both IDPs and returnees in the same village) and on the otherhand, the data related to access to health infrastructures, level of destruction of the village, and priority needs (water,food and health)*.
According to this distribution, there are 176 villages with a rate higher than 3 and for which the situation remains highlycritical: 47 of these villages are located in Kalenda health zone, 56 in Kamiji, 20 in Kanda Kanda.
* Details on the calculation methodology are available upon request
Displacement pressure indicator per villages
13
1108
577
22286 50 23 14 3 0
601
0200400600800
10001200 # Villages per category
Sources: basemap RGC (Référentiel Géographique commun de
la RDC). DTM assessment DRC / PDHPES, DPS population
estimates 2018, 13 April – 12 May. 2018. This map is for illustration purposes only. 11

Legend
DTM activities in the province of Lomami are supported by:12
DISPLACEMENT TRACKING MATRIX – Democratic Republic of Congo Report #1: June 2018 – Province of Lomami
Access to operational health infrastructures
in villages
Infrastructures in the Lomami province
Sources: basemap RGC
(Référentiel Géographique
commun de la RDC). DTM
assessment DRC / PDHPES, DPS,
13 April – 12 May. 2018. This map is for illustration purposes
only.
Health zone per
territory
No operational
health
infrastructure
Operationnal
health
infrastructures
No information
KABINDA 65,3% 32,7% 2,0%
KABINDA 65,8% 31,3% 2,9%
KALONDA EST 57,5% 40,0% 2,5%
LUDIMBI LUKULA 70,3% 29,2% 0,5%
KAMIJI 80,2% 19,8% 0,0%
KAMIJI 80,2% 19,8% 0,0%
LUBAO 69,7% 29,8% 0,5%
KAMANA 56,7% 42,8% 0,6%
LUBAO 81,2% 18,4% 0,4%
TSHOFA 64,6% 34,6% 0,8%
LUILU 62,9% 34,6% 2,5%
KALENDA 52,0% 42,9% 5,1%
KANDA KANDA 88,6% 10,2% 1,1%
LUPUTA 53,2% 45,3% 1,4%
WIKONG 45,1% 53,5% 1,4%
MWENE-DITU 51,7% 47,3% 1,0%
MAKOTA 69,1% 29,8% 1,1%
MWENE-DITU 43,6% 55,4% 1,0%
NGANDAJIKA 74,1% 25,7% 0,2%
KALAMBAYI KABANGA70,3% 29,1% 0,7%
MULUMBA 76,5% 23,5% 0,0%
NGANDAJIKA 74,7% 25,3% 0,0%
Total 66,4% 32,3% 1,3%
Related Documents