Dispersion of Multiwalled Carbon Nanotubes in a Rubber Matrix Using an Internal Mixer: Effects on Rheological and Electrical Properties Maxime Charman, 1,2 Fre ´ de ´ ric Le ´ onardi, 1 Se ´ bastien Dominguez, 1 Ce ´ dric Bissuel, 2 Christophe Derail 1 1 Universite ´ de Pau et de Pays de l’Adour/CNRS IPREM UMR5254- Equipe de Physique et Chimie des Polyme ` res, 2, Avenue du Pre ´ sident Angot, 64053 Pau ce ´ dex 9, France 2 EMAC Elastome ` res, BP 52, 64130 Maule ´ on, France Correspondence to: C. Derail (E-mail: [email protected]) Received 22 June 2011; revised 8 August 2011; accepted 8 August 2011; published online DOI: 10.1002/polb.22350 ABSTRACT: The dispersion of multiwalled carbon nanotubes (CNTs) in an ethylene propylene rubber matrix was investigated using an internal mixer. Poly(ethylene-co-polyvinyl acetate) (EVA) statistic copolymer was used as a dispersing agent. The effects of the concentration of the dispersing agent and the ma- trix viscosity on the quality of the dispersion of 1 wt % of CNTs were studied by using microscopy and rheology in the melt state. It was demonstrated that the dispersion is governed prin- cipally by the viscosity of the matrix. As expected, better disper- sion was observed when the matrix exhibited a lower viscosity. The influence of the filler content on the rheological and electri- cal properties is presented. A Cross model with a yield stress is proposed to describe the rheological behavior of these materi- als, which exhibit a viscoelastic solid behavior from 1 wt % CNT content. Electrical measurement data indicate that the electrical percolation threshold was 2.9 wt %. V C 2011 Wiley Periodicals, Inc. J Polym Sci Part B: Polym Phys 000: 000–000, 2011 KEYWORDS: carbon nanotubes; elastomer; rheology; banbury internal mixer; viscosity; modeling; electrical threshold INTRODUCTION Conductive polymer composites have many applications in fields such as electronics, electrical industries, electrostatic charge dissipation, electromagnetic interference shielding, and various other electronic or electrical applica- tions. The outstanding properties of carbon nanotubes (CNTs), such as high tensile modulus, 1,2 high electrical con- ductivity, 3 and high aspect ratio, make them ideal candidates for use in composite domains, particularly in those based on a rubber matrix. 4–8 It has been demonstrated that CNTs can give a better level of reinforcement and a lower electrical percolation threshold than those obtained with carbon black or silica. 4,7 Nevertheless, the properties obtained for the composites based on CNTs are still below expectations, which can be explained by the presence of aggregates and agglomerates arising from Van der Waals interactions between individual tubes and by the lack of affinity between CNTs and various polymers. To obtain an improvement of the properties of the composites based on CNTs, a good degree of dispersion of this type of filler within the matrix is crucial. It was shown that the grafting of blocks copolymer onto the nanotube surface 9,10 or their encapsulation by a co- polymer 11 improved their dispersion. Nevertheless, CNT sur- face modification or polymerization in the presence of the CNTs (in situ polymerization) 10 are two ways that will be difficult to transfer in the industry due to the environmental and cost problems. A dispersing agent can be also used as a solution to improve the dispersion. 12,13 As an example, dif- ferent authors postulate that poly(ethylene-co-vinyl acetate) statistic copolymer (EVA) exhibits a good affinity with CNTs and improves their dispersion. 14–16 More particularly, Peeter- broeck et al. 14 have demonstrated that CNT dispersion was better when the matrix polarity was improved and obtained a total dispersion of the nanofillers in a pure poly(vinyl ace- tate) matrix. The association between the ethylene propylene rubber (EPM) and EVA is very current in the rubber industry (such as in wire and cable covering, supplies for medium voltage domain …). Several studies have been conducted on EP(D)M- EVA blends. 17–20 The blends of this study were prepared using an internal batch mixer and an open two-roll mill to evaluate the efficiency of this classical industrial technique in rubber preparation on the CNT dispersion. 22 First, we have verified the influence of the EVA content and/or the matrix viscosity on the rheological and electrical properties of a 1 wt % CNT dispersion in different EPM-EVA blends. Additional Supporting Information may be found in the online version of this article. V C 2011 Wiley Periodicals, Inc. WWW.MATERIALSVIEWS.COM JOURNAL OF POLYMER SCIENCE: PART B: POLYMER PHYSICS 2011, 000, 000–000 1 WWW.POLYMERPHYSICS.ORG FULL PAPER

Welcome message from author
This document is posted to help you gain knowledge. Please leave a comment to let me know what you think about it! Share it to your friends and learn new things together.
Transcript
Dispersion of Multiwalled Carbon Nanotubes in a Rubber Matrix Using an
Internal Mixer: Effects on Rheological and Electrical Properties
Maxime Charman,1,2 Frederic Leonardi,1 Sebastien Dominguez,1
Cedric Bissuel,2 Christophe Derail1
1Universite de Pau et de Pays de l’Adour/CNRS IPREM UMR5254- Equipe de Physique et Chimie des Polymeres, 2,
Avenue du President Angot, 64053 Pau cedex 9, France
2EMAC Elastomeres, BP 52, 64130 Mauleon, France
Correspondence to: C. Derail (E-mail: [email protected])
Received 22 June 2011; revised 8 August 2011; accepted 8 August 2011; published online
DOI: 10.1002/polb.22350
ABSTRACT: The dispersion of multiwalled carbon nanotubes
(CNTs) in an ethylene propylene rubber matrix was investigated
using an internal mixer. Poly(ethylene-co-polyvinyl acetate)
(EVA) statistic copolymer was used as a dispersing agent. The
effects of the concentration of the dispersing agent and the ma-
trix viscosity on the quality of the dispersion of 1 wt % of CNTs
were studied by using microscopy and rheology in the melt
state. It was demonstrated that the dispersion is governed prin-
cipally by the viscosity of the matrix. As expected, better disper-
sion was observed when the matrix exhibited a lower viscosity.
The influence of the filler content on the rheological and electri-
cal properties is presented. A Cross model with a yield stress is
proposed to describe the rheological behavior of these materi-
als, which exhibit a viscoelastic solid behavior from 1 wt % CNT
content. Electrical measurement data indicate that the electrical
percolation threshold was 2.9 wt %. VC 2011 Wiley Periodicals,
Inc. J Polym Sci Part B: Polym Phys 000: 000–000, 2011
KEYWORDS: carbon nanotubes; elastomer; rheology; banbury
internal mixer; viscosity; modeling; electrical threshold
INTRODUCTION Conductive polymer composites have manyapplications in fields such as electronics, electrical industries,electrostatic charge dissipation, electromagnetic interferenceshielding, and various other electronic or electrical applica-tions. The outstanding properties of carbon nanotubes(CNTs), such as high tensile modulus,1,2 high electrical con-ductivity,3 and high aspect ratio, make them ideal candidatesfor use in composite domains, particularly in those based ona rubber matrix.4–8 It has been demonstrated that CNTs cangive a better level of reinforcement and a lower electricalpercolation threshold than those obtained with carbon blackor silica.4,7 Nevertheless, the properties obtained for thecomposites based on CNTs are still below expectations,which can be explained by the presence of aggregates andagglomerates arising from Van der Waals interactionsbetween individual tubes and by the lack of affinity betweenCNTs and various polymers. To obtain an improvement ofthe properties of the composites based on CNTs, a gooddegree of dispersion of this type of filler within the matrix iscrucial. It was shown that the grafting of blocks copolymeronto the nanotube surface9,10 or their encapsulation by a co-polymer11 improved their dispersion. Nevertheless, CNT sur-face modification or polymerization in the presence of the
CNTs (in situ polymerization)10 are two ways that will bedifficult to transfer in the industry due to the environmentaland cost problems. A dispersing agent can be also used as asolution to improve the dispersion.12,13 As an example, dif-ferent authors postulate that poly(ethylene-co-vinyl acetate)statistic copolymer (EVA) exhibits a good affinity with CNTsand improves their dispersion.14–16 More particularly, Peeter-broeck et al.14 have demonstrated that CNT dispersion wasbetter when the matrix polarity was improved and obtaineda total dispersion of the nanofillers in a pure poly(vinyl ace-tate) matrix.
The association between the ethylene propylene rubber(EPM) and EVA is very current in the rubber industry (suchas in wire and cable covering, supplies for medium voltagedomain …). Several studies have been conducted on EP(D)M-EVA blends.17–20 The blends of this study were preparedusing an internal batch mixer and an open two-roll mill toevaluate the efficiency of this classical industrial techniquein rubber preparation on the CNT dispersion.22 First, wehave verified the influence of the EVA content and/or thematrix viscosity on the rheological and electrical propertiesof a 1 wt % CNT dispersion in different EPM-EVA blends.
Additional Supporting Information may be found in the online version of this article.
VC 2011 Wiley Periodicals, Inc.
WWW.MATERIALSVIEWS.COM JOURNAL OF POLYMER SCIENCE: PART B: POLYMER PHYSICS 2011, 000, 000–000 1
WWW.POLYMERPHYSICS.ORG FULL PAPER
The state of dispersion was analyzed by optical analysis,transmission electron microscopy (TEM) and melt rotationalrheometry. Second, after choosing the better formulation, theinfluence of the nanofiller content on the rheological andelectrical properties was explored. The conclusion containsinteresting results obtained from blends prepared with asmooth mixing technique.
EXPERIMENTAL
MaterialsIn this work, three commercial poly(ethylene-co-polypropyl-ene) statistical copolymers were investigated as matrices.The dispersing agent was a poly(ethylene-co-polyvinylace-tate) statistical copolymer. Important parameters arereported in Table 1.
GraphistrenghVR
multiwalled, noted CNTs in this paper, wereprovided by Arkema (France) and were used without purifi-cation. They were synthesized using catalytic chemical vapordeposition. Their diameters were in the range of 10–15 nm,and 0.1�10 lm for their lengths. The chemical compositionof the multiwalled CNTs was 99.7% carbon and 0.3% oxy-gen, as determined by X-ray photoelectron spectroscopyanalysis. The CNTs are agglomerated as shown in SupportingInformation Figure 1.
Preparation of the CompositesAll of the samples were blended with a Banbury internalmixer (1.5 L) for 12 min with a fill factor equal to 70%. Themixing chamber and the rotors were heated with a circula-tion of vapor, and the increase of the temperature in the mix-ing chamber was obtained by self-heating. Then, the sampleswere worked on an open two-roll mill to homogenize andcalendar the nanocomposites. The blend without nanofillerswas denoted pureblend followed by the same number of thecharged blend. The nanofiller content (particularly inblend2) was increased from 1 to 20 wt %. The correspond-ing blends were denoted blend2_X, where X corresponds tothe wt % of the CNTs.
The compositions of the formulations are reported in Table 2.The pureblend1 is composed by a blend of pure EPM1 andEPM2 to obtain a similar ratio of poly(ethylene)/poly (pro-pylene) as in the EPM3.
Evaluation of the Dispersion and Measurementof the Rheological and Electrical PropertiesEvaluation of the DispersionThe morphology and the state of the dispersion of the nano-fillers within the elastomeric matrix were examined by opti-cal microscopy using a Leica IM with a magnification equalto 100 and TEM with a Philips CM200 operating at 200 kV.For TEM observations, the blends were included in an epoxyresin. The samples were prepared using a cryomicrotomeREICHERT Ultracut E fitted with a diamond knife and cooledat –40 �C by liquid nitrogen. The samples had a thickness of�50 nm.
Rheological and Electrical MeasurementsTwo different techniques were used to evaluate the rheologi-cal behavior of the samples. The Mooney viscosities of thecompounds were measured at 100 �C with a Mooney visco-simeter MV 2000 from Alpha Technologies, and equippedwith the large rotor rotating at a speed equal to 2 rad min�1
which corresponds to an angular frequency estimated to1 s�1. The preheating and the test times were 1 and 4 min,respectively. The spectromechanical analyses were performedby using a dynamic rotational rheometer (ARES, TA Instru-ment) working with imposed strain. The complex shear mod-ulus (G0, storage part and G00, loss part) was measured as afunction of circular frequency and/or temperature by using aparallel plate geometry (25 mm). A strain sweep was per-formed before each experiment to evaluate the linear visco-elastic region. The mechanical spectroscopy experimentswere performed in the circular frequency range [10�2–100]rad s�1 at different temperatures between 100 and 160 �Cto determine the rheological behavior of the polymer in theterminal zone. The time–temperature superposition principlewas used to build a master curve at a reference temperatureof 120 �C for all master curves reported in this article. Forhigher NTC contents, the time–temperature superpositionprinciple is verified from 100 to 140 �C.
The electrical surface conductivity was measured on films(e ¼ 200 lm) using the standard four-point probe techniqueat room temperature. The electrodes were connected to aKeithley 6430 electrometer.
Dynamic Mechanical MeasurementVulcanizing agents were introduced into the blends using anopen two-roll mill. The vulcanization system was composed
TABLE 1 Composition and Viscosity of the Matrices and Dispersing Agent
Code Commercial Name
Polyethylene
Content (wt %)
Mooney Viscosity
ML (1þ4)/Temperature (�C)
EPM1 VISTALON 404 (ExxonMobil) 45 40/100
EPM2 DUTRAL CO O54 (Polimeri Europa) 59 44/100
EPM3 KELTAN 1200 (DSM) 49 10/100
Vinyl acetate
content (wt %)
Melt flow index @
190 �C/2,16 Kg (g/10 min)
EVA ELVAX 420 (DuPont) 18 150
FULL PAPER WWW.POLYMERPHYSICS.ORG
2 JOURNAL OF POLYMER SCIENCE: PART B: POLYMER PHYSICS 2011, 000, 000–000
of 8 phr (part per hundred of rubber) of dicumyl peroxide(Arkema, LuperoxV
R
DC40) and 2 phr of the coagent, triallyl-cyanurate (Kettlitz, TAC GR70). The samples were cured in arectangular mold (140 � 140 mm) at 180 �C for 10 minunder a pressure of 73 bar in a standard hot press.
The dynamic mechanical properties of the cured rubberwere determined on rectangular specimens (30*10*2) mmby using a dynamic rotational rheometer (RDAII, TAInstruments). The tests were performed in torsion deforma-tion mode, at the fixed frequency of 1 rad s�1, a temperaturerange from �70 to 70 �C and a heating rate equal to 2 �Cmin�1.
RESULTS AND DISCUSSION
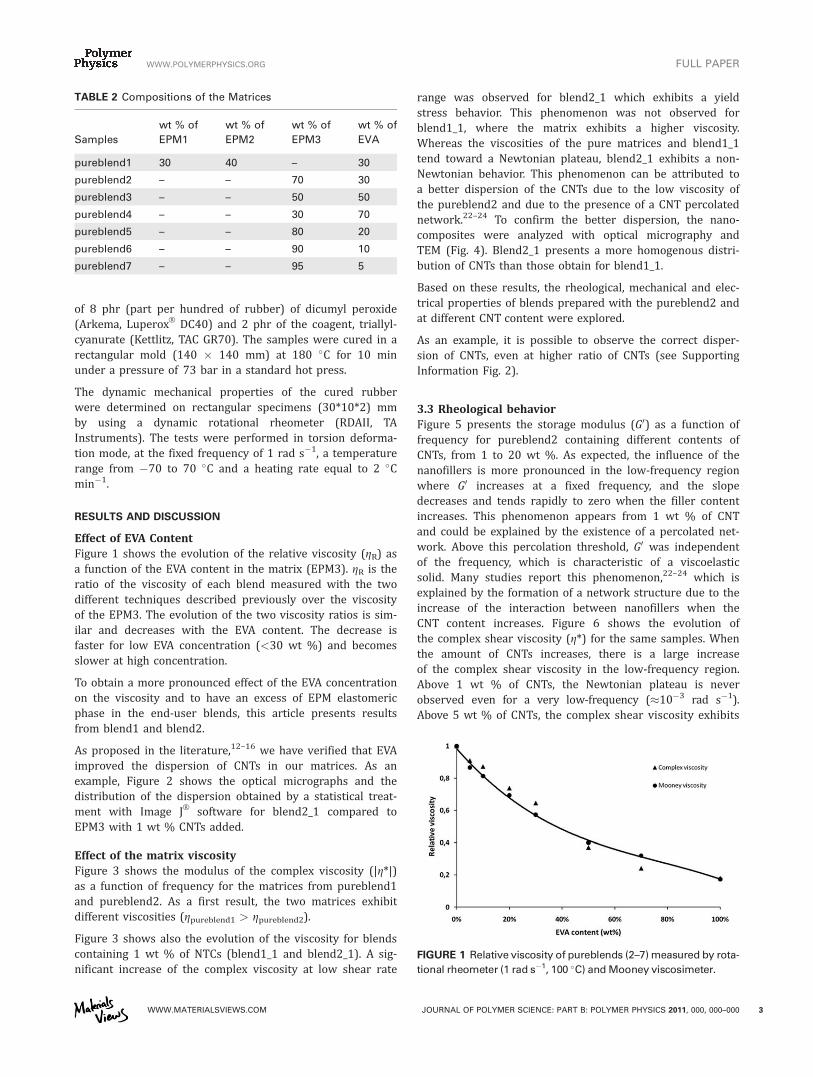
Effect of EVA ContentFigure 1 shows the evolution of the relative viscosity (gR) asa function of the EVA content in the matrix (EPM3). gR is theratio of the viscosity of each blend measured with the twodifferent techniques described previously over the viscosityof the EPM3. The evolution of the two viscosity ratios is sim-ilar and decreases with the EVA content. The decrease isfaster for low EVA concentration (<30 wt %) and becomesslower at high concentration.
To obtain a more pronounced effect of the EVA concentrationon the viscosity and to have an excess of EPM elastomericphase in the end-user blends, this article presents resultsfrom blend1 and blend2.
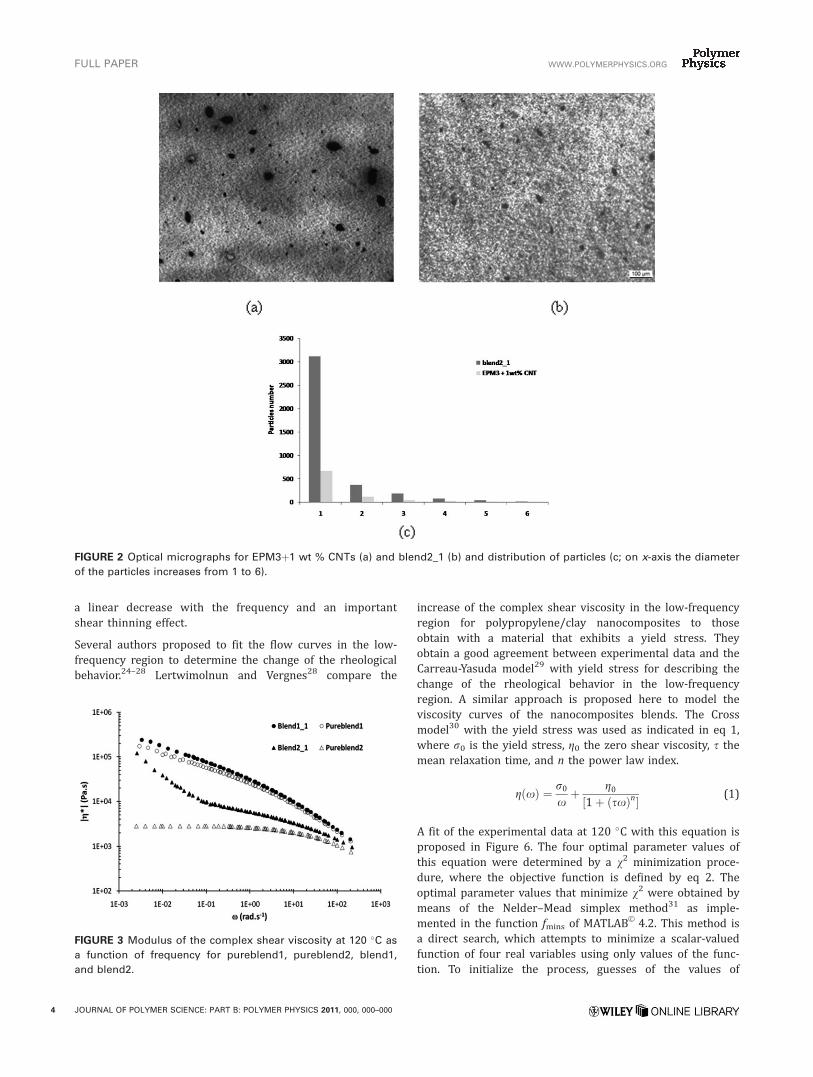
As proposed in the literature,12–16 we have verified that EVAimproved the dispersion of CNTs in our matrices. As anexample, Figure 2 shows the optical micrographs and thedistribution of the dispersion obtained by a statistical treat-ment with Image JV
R
software for blend2_1 compared toEPM3 with 1 wt % CNTs added.
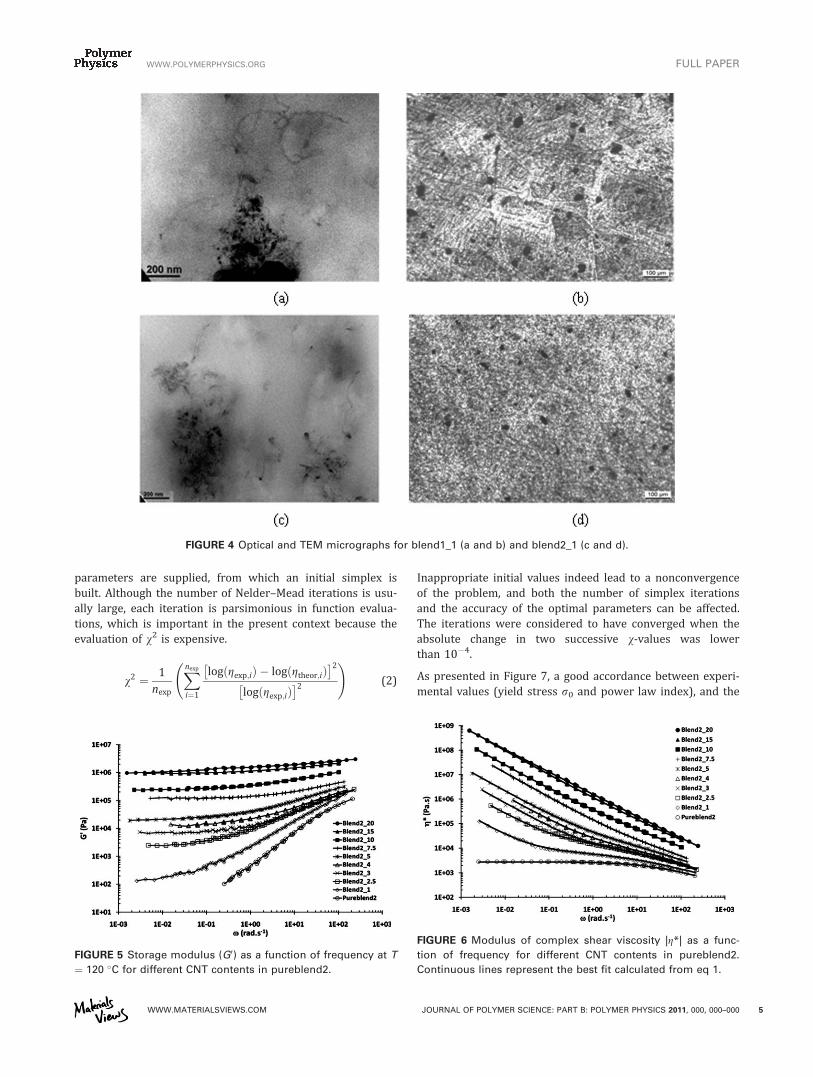
Effect of the matrix viscosityFigure 3 shows the modulus of the complex viscosity (|g*|)as a function of frequency for the matrices from pureblend1and pureblend2. As a first result, the two matrices exhibitdifferent viscosities (gpureblend1 > gpureblend2).
Figure 3 shows also the evolution of the viscosity for blendscontaining 1 wt % of NTCs (blend1_1 and blend2_1). A sig-nificant increase of the complex viscosity at low shear rate
range was observed for blend2_1 which exhibits a yieldstress behavior. This phenomenon was not observed forblend1_1, where the matrix exhibits a higher viscosity.Whereas the viscosities of the pure matrices and blend1_1tend toward a Newtonian plateau, blend2_1 exhibits a non-Newtonian behavior. This phenomenon can be attributed toa better dispersion of the CNTs due to the low viscosity ofthe pureblend2 and due to the presence of a CNT percolatednetwork.22–24 To confirm the better dispersion, the nano-composites were analyzed with optical micrography andTEM (Fig. 4). Blend2_1 presents a more homogenous distri-bution of CNTs than those obtain for blend1_1.
Based on these results, the rheological, mechanical and elec-trical properties of blends prepared with the pureblend2 andat different CNT content were explored.
As an example, it is possible to observe the correct disper-sion of CNTs, even at higher ratio of CNTs (see SupportingInformation Fig. 2).
3.3 Rheological behaviorFigure 5 presents the storage modulus (G0) as a function offrequency for pureblend2 containing different contents ofCNTs, from 1 to 20 wt %. As expected, the influence of thenanofillers is more pronounced in the low-frequency regionwhere G0 increases at a fixed frequency, and the slopedecreases and tends rapidly to zero when the filler contentincreases. This phenomenon appears from 1 wt % of CNTand could be explained by the existence of a percolated net-work. Above this percolation threshold, G0 was independentof the frequency, which is characteristic of a viscoelasticsolid. Many studies report this phenomenon,22–24 which isexplained by the formation of a network structure due to theincrease of the interaction between nanofillers when theCNT content increases. Figure 6 shows the evolution ofthe complex shear viscosity (g*) for the same samples. Whenthe amount of CNTs increases, there is a large increaseof the complex shear viscosity in the low-frequency region.Above 1 wt % of CNTs, the Newtonian plateau is neverobserved even for a very low-frequency (�10�3 rad s�1).Above 5 wt % of CNTs, the complex shear viscosity exhibits
TABLE 2 Compositions of the Matrices
Samples
wt % of
EPM1
wt % of
EPM2
wt % of
EPM3
wt % of
EVA
pureblend1 30 40 – 30
pureblend2 – – 70 30
pureblend3 – – 50 50
pureblend4 – – 30 70
pureblend5 – – 80 20
pureblend6 – – 90 10
pureblend7 – – 95 5
FIGURE 1 Relative viscosity of pureblends (2–7)measured by rota-
tional rheometer (1 rad s�1, 100 �C) andMooney viscosimeter.
WWW.POLYMERPHYSICS.ORG FULL PAPER
WWW.MATERIALSVIEWS.COM JOURNAL OF POLYMER SCIENCE: PART B: POLYMER PHYSICS 2011, 000, 000–000 3
a linear decrease with the frequency and an importantshear thinning effect.
Several authors proposed to fit the flow curves in the low-frequency region to determine the change of the rheologicalbehavior.24–28 Lertwimolnun and Vergnes28 compare the
increase of the complex shear viscosity in the low-frequencyregion for polypropylene/clay nanocomposites to thoseobtain with a material that exhibits a yield stress. Theyobtain a good agreement between experimental data and theCarreau-Yasuda model29 with yield stress for describing thechange of the rheological behavior in the low-frequencyregion. A similar approach is proposed here to model theviscosity curves of the nanocomposites blends. The Crossmodel30 with the yield stress was used as indicated in eq 1,where r0 is the yield stress, g0 the zero shear viscosity, s themean relaxation time, and n the power law index.
g xð Þ ¼ r0x
þ g01þ sxð Þn½ � (1)
A fit of the experimental data at 120 �C with this equation isproposed in Figure 6. The four optimal parameter values ofthis equation were determined by a v2 minimization proce-dure, where the objective function is defined by eq 2. Theoptimal parameter values that minimize v2 were obtained bymeans of the Nelder–Mead simplex method31 as imple-mented in the function fmins of MATLABVC 4.2. This method isa direct search, which attempts to minimize a scalar-valuedfunction of four real variables using only values of the func-tion. To initialize the process, guesses of the values of
FIGURE 2 Optical micrographs for EPM3þ1 wt % CNTs (a) and blend2_1 (b) and distribution of particles (c; on x-axis the diameter
of the particles increases from 1 to 6).
FIGURE 3 Modulus of the complex shear viscosity at 120 �C as
a function of frequency for pureblend1, pureblend2, blend1,
and blend2.
FULL PAPER WWW.POLYMERPHYSICS.ORG
4 JOURNAL OF POLYMER SCIENCE: PART B: POLYMER PHYSICS 2011, 000, 000–000
parameters are supplied, from which an initial simplex isbuilt. Although the number of Nelder–Mead iterations is usu-ally large, each iteration is parsimonious in function evalua-tions, which is important in the present context because theevaluation of v2 is expensive.
v2 ¼ 1
nexp
Xnexpi¼1
logðgexp;iÞ � logðgtheor;iÞ� �2
logðgexp;iÞ� �2
!(2)
Inappropriate initial values indeed lead to a nonconvergenceof the problem, and both the number of simplex iterationsand the accuracy of the optimal parameters can be affected.The iterations were considered to have converged when theabsolute change in two successive v-values was lowerthan 10�4.
As presented in Figure 7, a good accordance between experi-mental values (yield stress r0 and power law index), and the
FIGURE 4 Optical and TEM micrographs for blend1_1 (a and b) and blend2_1 (c and d).
FIGURE 5 Storage modulus (G0) as a function of frequency at T
¼ 120 �C for different CNT contents in pureblend2.
FIGURE 6 Modulus of complex shear viscosity |g*| as a func-
tion of frequency for different CNT contents in pureblend2.
Continuous lines represent the best fit calculated from eq 1.
WWW.POLYMERPHYSICS.ORG FULL PAPER
WWW.MATERIALSVIEWS.COM JOURNAL OF POLYMER SCIENCE: PART B: POLYMER PHYSICS 2011, 000, 000–000 5
model was obtained. The parameters are strongly influencedby the CNT content. First, the power law index does notchange significantly for CNT contents less than 10 wt %. Thevalue is between 0.5 and 0.6. Above this value, the powerlaw index increases. The evolution of the yield stress r0 withCNT content can be described by a power law which is givenin Table 3. In the same way, the values of g0 and s exhibita large increase with the CNT content as described in theTable 3.
3.4 Electrical measurementMany studies have demonstrated that the incorporation ofCNTs into a polymer matrix leads to conductive materi-als.4,7,25,26 Figure 8 shows the effect of the CNT content (/)on the surface conductivity (r) of blend2. At very low fillerconcentration (<2 wt %), the conductivity is dominated bythe matrix behavior, and the composites are insulating mate-rials because the CNTs are well dispersed and have no con-tact. However, at a concentration equal to 2.93 wt %, calledthe percolation threshold (/c), the conductivity increasessignificantly. This change is due to the creation of a CNTnetwork within the matrix. After this critical concentration,the composites become conductive materials.
Above the percolation threshold, the evolution of electricalconductivity with the filler content can be modeled with apower law,32,33 as indicated in eq 3, where /c is the percola-tion threshold concentration and t is the critical exponent.
rðuÞ / u� ucð Þt (3)
The value of t can be determined precisely by the evolutionof r as a function of /–/c on a double logarithm scale fordifferent values of /c in the interval from 2.5 to 3 wt %. Thebest fit was found for /c ¼ 2.93 6 0.03 wt % with the expo-nent t ¼ 2.2 6 0.1 (see inset in Fig. 8). The calculated valueof the critical exponent t is close to the universal value forthree-dimensional percolating systems, which has been pre-dicted to be equal to 2.34–36 The value obtains for the electri-cal percolation threshold is close to those obtain for rubbernanocomposites prepared by using a solvent dissolution andhigh shear mixing7,37 or a combination of solution mixingand melt mixing.38 Bokobza and Kolodziej7 obtained an elec-trical percolation threshold between 2.9 and 3.8 wt % ofCNTs in natural rubber. Das et al.38 mixed CNTs in surfac-tant-ethanol solution and putted it by melt mixing in a 50/50 blend of BR-SBR rubber. They measured a percolationthreshold close to 2 wt % of CNTs. The experimental valuehere is better than those obtain by melt mixing.39 However,this value is higher than those obtain by melt mixing forthermoplastic polymers, such as polycarbonate,40 poly(ethyl-ene terephthalate),41 or polypropylene.42 The difference is
FIGURE 7 The evolution of yield stress r0 (a) and power law index (b) as a function of the CNT content at T ¼ 120 �C for the
blend2_X with X ¼ 0 to X ¼ 20. The full line corresponds to the model (eq 1).
TABLE 3 Results of the Least Squares Regression for the Three
Parameters as a Function of CNT Content /
Parameters Regression Law
r0 r0 ¼ 2.108 � /2.9
g0 g0 ¼ 3852 � e49.9/
s s ¼ 0.053 � e61.7/
FIGURE 8 Effect of CNT content on the surface conductivity of
blend2_X. The insert shows the variation of logr versus log (/�/c) with /c ¼ 2.93 wt % and t ¼ 2.2.
FULL PAPER WWW.POLYMERPHYSICS.ORG
6 JOURNAL OF POLYMER SCIENCE: PART B: POLYMER PHYSICS 2011, 000, 000–000
certainly due to the higher shear rate obtained in a twinscrew extruder (generally estimated at 1000 s�1) than thoseobtain by using a Banbury mixer. To evaluate the shear ratedistribution within the internal mixer used in this study, wehave used flow simulation reported in the literature43–46: themaximal shear rate was situated between the wall of themixer chamber and the top of the rotor, and a maximal valueof the shear rate equal to 100 s�1 was determined for arotor speed close to 90 rpm.
3.5 Mechanical propertiesThe stress–strain curves obtained from different CNT con-tents in pureblend2 are presented in Figure 9. These curveswere obtained on cured samples (see Supporting Informa-tion Fig. 2 for curing kinetic). An important increase of stressis observed when the CNT content increases. CNTs have avery marked reinforcing effect on the rubber composites,and, at the same time, the strain at break decreases whenthe CNT content increases.47,48
Figure 10(a) shows the variation of the storage modulus (G0)as a function of the temperature for pureblend2 at variousCNT compositions. G0 presents a classical evolution with aglassy domain where G0 is constant and equal to about 1 GPa.G0 decreases rapidly in the glassy transition region (Ta ��55 �C) and tends toward a smooth decrease variation. Figure10(b) shows the evolution of the tan d peak as a function oftemperature for the nanocomposites. The incorporation ofCNTs reduces the height of the tan d peak. Furthermore, a lin-ear shift of the tan d peak toward lower temperatures withthe addition of the fillers is observed.47 The glass-rubber tem-perature goes from �53.3 �C for unfilled rubber to �56.2 �Cfor rubber filled with 20 wt % of CNTs. Above this transition,an inflection (above �35 �C) is observed, which can be attrib-uted to CNT network relaxation. This phenomenon appears at4 wt % of CNTs. The storage modulus has a very significantincrease with the filler content at a given temperature. Thisphenomenon is attributed to the hydrodynamic reinforcement.To define the level of reinforcement elastomeric nanocompo-sites with the CNT content, the values of the relative modulus(G0/G0
0) is presented in Figure 11. The experimental datawere fitted with the Guth model49 based on the aspect ratio, f,and the volume fraction, /, of fillers (see eq. 4). To use eq 4,the weight fractions were converted to volume fractions byusing densities of 2.1 g cm�3 for CNTs and of 0.882 g cm�3
for the EPM-EVA matrix.
G0
G00
¼ 1þ 0:67fUþ 1:62f 2U2 (4)
FIGURE 9 Stress–strain curves for pureblend2 with different
contents of CNTs.
FIGURE 10 G0 (a) and tan d (b) as a function of temperature for
pureblend2 with different CNTs contents.
FIGURE 11 Experimental relative elastic modulus at 25 �C as a
function of volume fraction of CNTs fitted with the Guth
model.
WWW.POLYMERPHYSICS.ORG FULL PAPER
WWW.MATERIALSVIEWS.COM JOURNAL OF POLYMER SCIENCE: PART B: POLYMER PHYSICS 2011, 000, 000–000 7
The best fit of the experimental data is reached with a valueof f equal 30, which is lower than the expectation. This valueis situated at the lower end of the range [10–1000] calcu-lated from the typical CNT dimensions given by the supplier.The agglomeration of CNTs can explain the reduction of theaspect ratio. However, the value of f is of the same order ofmagnitude as those obtained with other rubber nanocompo-sites and prepared by melt mixing39 or solvent mixing.4
CONCLUSIONS
The properties of blends based on a rubber matrix and CNTsprepared with a smooth method derived from industrialmethods largely used in the rubber industry were studied. Byusing a statistical copolymer as a dispersing agent, differentnanocomposites with good dispersion were obtained, whichled to conductive blends with a low CNT content despite themethod of preparation. The results were similar to thoseobtained by preparation in a solvent for the same type ofmatrices. This work confirms that the choice of the dispersingagent is suitable to well disperse the CNTs in a rubber matrix.
ACKNOWLEDGMENTS
The IPREM-EPCP authors thank EMAC Elastomeres for thefinancial support and the experimental support for the prepa-ration of the samples. The authors also thank ARKEMA forCNTs supply. This study benefits from the support of AgenceNationale de la Recherche et de la Technologie and of ConseilRegional d’Aquitaine.
REFERENCES AND NOTES
1 Treacy, M. M. J.; Ebbesen, T. W.; Gibson, J. M. Nature 1996,
381, 678–680.
2 Krishnan, A.; Dujardin, E.; Ebbesen, T. W.; Yianilos, P. N.;
Treacy, M. M. J. Phys. Rev. B 1998, 58, 14013–14019.
3 Hamada, N.; Sawada, S.; Oshiyama, A. Phys. Rev. Lett. 1992,
68, 1579–1581.
4 Bokobza, L. Polymer 2007, 48, 4907–4920.
5 Frogley, M. D.; Ravich, D.; Wagner, H. D. Comp. Sci. Tech.
2003, 63, 1647–1654.
6 Valentini, L.; Biagiotti, J.; Kenny, J. M.; Lopez-Manchado, M.
A. J. Appl. Polym. Sci. 2003, 89, 2657–2663.
7 Bokobza, L.; Kolodziej, M. Polym. Int. 2006, 55, 1090–1098.
8 Shanmugharaj, A. M.; Bae, J. H.; Lee, K. Y.; Noh, W. H.; Lee,
S. H.; Ryu, S. H. Comp. Sci. Tech. 2007, 67, 1813–1822.
9 Datsyuk, V.; Guerret-Piecourt, C.; Dagreou, S.; Billon; L.
Dupin, J. C.; Flahaut, E.; Peignet, A.; Laurent, C. Carbon 2005,
43, 873–876.
10 Courbaron Gilbert, A. C.; El Bounia, N. E.; Pere, E.; Billon,
L.; Derail, C. Adv. Mat. Res. 2010, 112, 29–36.
11 Bhattacharyya, A. R.; Potschke, P.; Abdel-Goad, M.; Fischer,
D. Chem. Phys. Lett. 2004, 392, 28–33.
12 Gong, X.; Liu, J.; Baskaran, S.; Voise, R. D.; Young, J. S.
Chem. Mater. 2000, 12, 1049–1052.
13 Jin, Z.; Pramoda, K. P.; Goh, S. H.; Xu, G. Mater. Res. Bull.
2002, 37, 271–278.
14 Peeterbroeck, S.; Breugelmans, L.; Alexandre, M.; Nagy, J. B.; Viv-
ille, P.; Lazzaroni, R.; Dubois, P.Comp. Sci. Tech. 2007, 67, 1659–1665.
15 Li, S. H.; Yang, M. B.; Hu, Z. Q.; Xu, X. B.; Huang, R. Mater.
Lett. 2004, 58, 3967–3970.
16 George, J. J.; Bhowmick, A. K. Nanoscale Res. Lett. 2009, 4,
655–664.
17 Ray, I.; Khastgir, D. Plast. Rubber Comp. Process Appl.
1994, 22, 305–314.
18 Das, N. C.; Chaki, T. K.; Khastgir, D. Carbon 2002, 40, 807–816.
19 Das, N. C.; Chaki, T. K.; Khastgir, D.; Chakraborty, A. Adv.
Polym. Tech. 2001, 20, 226–236.
20 Mishra, S.; Baweja, B.; Chandra, R. J. Appl. Polym. Sci.
1999, 74, 2756–2763.
21 Salahudeen, S. A.; Elleithy, R. H.; Alothman, O.; Alzahrani,
S. M. Chem. Eng. Sci. 2011, 66, 2502–2511.
22 Zhao, J.; Morgan, A. B.; Harris, J. D. Polymer 2005, 46, 8641–6860.
23 Zhang, Q.; Rastogi, S.; Chen, D.; Lippits, D.; Lemstra, P. J.
Carbon 2006, 44, 778–785.
24 Potschke, P.; Fornes, T. D.; Paul, D. R.Polymer 2002, 43, 3247–3255.
25 Du, F.; Scogna, R.C.; Zhou, W.; Brand, S.; Fischer, J. E.;
Winey, K. E. Macromolecules 2004, 37, 9048–9055.
26 Wagener, R.; Reisinger, T. J. G. Polymer 2003, 44, 7513–7518.
27 Costa, F. R.; Wagenknecht, U.; Jehnichen, D.; Abdel-Goad,
M.; Heinrich, G. Polymer 2006, 47, 1649–1660.
28 Lertwimolnun,W.; Vergnes, B. Polymer 2005, 46, 3462–3471.
29 Yasuda, K.; Armstrong, R. C., Cohen, R. E. Rheol. Acta 1981,
20, 163–178.
30 Cross, M. M. J. Colloid. Sci. 1965, 20, 417–437.
31 Nelder, J. A.; Mead, R. Comput. J. 1965, 7, 308–313.
32 Kirkpatrick, S. Introduction to percolation theory. Rev. Mod.
Phys. 1973, 45, 574–588.
33 Stauffer, D. Taylor & Francis: London, 1985.
34 Derrida, B.; Stauffer, D.; Herrmann, H. J.; Vannimenus, J. J.
Phys. Lett. 1983, 44, 701–706.
35 Adler, J.; Meir, Y.; Aharony, A.; Harris, A. B. Phys. Rev. B
1990, 41, 9183–9206.
36 Gingold, D. B.; Lobb, C. J. Phys. Rev. B 1990, 42, 8220–8224.
37 Ciselli, P.; Lu, L.; Busfield, J. J. C; Peijs, T. e-Polymers 2010, 14.
38 Das, A.; Stockelhuber, K. W.; Jurk, R.; Fritzsche, J.; Kluppel,
M.; Heinrich, G. Carbon 2009, 47, 3313–3321.
39 Perez, L. D.; Zuluaga, M. A.; Kyu, T.; Mark, J. E.; Lopez, B. L.
Polym. Eng. Sci. 2009, 49, 868–874.
40 Potschke, P.; Abdel-Goad, M.; Alig, I.; Dudkin, S.; Lellinger,
D. Polymer 2004, 45, 8863–8870.
41 Logakis, E.; Pissis, P.; Pospiech, D.; Korwitz, A.; Krause, B.;
Reuter, U., et al. Eur. Polym. J. 2010, 46, 928–936.
42 Lee, S. H.; Kim, M. W.; Kim, S. H.; Youn, J. R. Eur. Polym. J.
2008, 44, 1620–1630.
43 Cheng, J. J.; Manas-Zloczower, I. Polym. Eng. Sci. 1989, 29,
1059–1065.
44 Ghoreishy, M. H. R.; Nassehi, V. Adv. Polym. Tech. 1997, 16,
45–68.
45 Salahudeena, S. A.; Elleithya, R. H.; AlOthmanb, O.; AlZah-
ranib, S. M. Chem. Eng. Sci. 2011, 66, 2502–2511.
46 Valette, R.; Bruchon, J.; Digonnet, H.; Laure, P.; Leboeuf, M.;
Silva, L.; Vergnes, B.; Coupez, T. Meca. Ind. 2007, 8, 251–258.
47 Bhattacharyya, S.; Sinturel, C.; Bahloul, O.; Saboungi, M. L.;
Thomas, S.; Salvetat, J. P. Carbon 2008, 46, 1037–1045.
48 Ismail, H.; Ramly, F.; Othman, N. Polym. Plast. Tech. Eng.
2010, 49, 260–266.
49 Guth, E. J. Appl. Phys. 1945, 16, 20–25.
FULL PAPER WWW.POLYMERPHYSICS.ORG
8 JOURNAL OF POLYMER SCIENCE: PART B: POLYMER PHYSICS 2011, 000, 000–000
Related Documents