152 Bulgarian Chemical Communications, Volume 47, Special Issue D (pp. 152 – 157) 2015 Dispersion model for assessing oily components of produced water discharges from South Pars Gas offshore G. Bahmannia 1 , A.H. Javid 2* , A.M. Moradi 2 , S.A. Mirbagheri 1 1 Department of Environment and Energy, Science and Research Branch, Islamic Azad University, Tehran, Iran 2 Department of Marine Science and Technology, Science and Research Branch, Islamic Azad University, Tehran, Iran Received June 26, 2015, Revised September 10, 2015 The discharge of produced water accounts for the largest volume of waste associated with offshore oil and gas production operations. With the development and expansion of Iran's offshore gas reserves in the South Pars fields, there is concern over the potential long-term impacts of produced water discharges in the Persian Gulf. To deal with this emerging issue, the present study focused on modeling and assessment of environmental impacts associated with produced water discharges based on the integration of Gulf hydrodynamic and oily components dispersion models. It provides three-dimensional hydrodynamic input to a Random Walk model focused on the dispersion of oily pollutant components within the produced water effluent stream at a regional spatial scale. In this paper at first the quantity and quality of produced water are measured and reported for one year and some statistical reviews has done . Determination of the oil content of effluent water - Extraction and infra-red spectrometric and OSPAR Reference Method which is the standard method for dispersed oil in produced water analysis in the UK for both oil and gas facilities was used as standard method. Advection, diffusion and fate of oil spills by wind and tidal currents and transport are indirectly taken into account in this study. Hydrodynamic, oil spill and path of the oil pollutants in Offshore Gas Platforms in South Pars Gas Field in 3 month has been simulated in a few scenarios. The results of modeling in this research approved the risk of oily components pollution nearby of onshore ecosystems through 3 months. Key Words: Modeling, Dispersion, Oil, Offshore, Persian Gulf INTRODUCTION The most significant energy development project, the South Pars field, produces about 44 percent of total natural gas in Iran. Discovered in 1990 and located 62 miles offshore in the Persian Gulf, South Pars has a 24-phase development scheme. Phases 1-10, which are operational and are allocated for the domestic market for consumption and reinjection for EOR Produced water is the largest effluent discharge associated with South Pars offshore gas production. (Fig. 1&2) The total volume of produced water effluent is expected to increase with future anticipated development of offshore gas reserve. The environmental impact potentially which is caused by produced water is related to the fate and transport of its individual components including organic and inorganic compounds (e.g., petroleum hydrocarbons, heavy metals, nutrients, natural radionuclide), as well as the formation water and treating chemicals. Although produced water discharges are associated with rapid dilution and low-to-trace levels of pollutants, the potential for cumulative toxic effects under regional ocean currents warrants a need to assess the long-term risks on the marine ecosystems Recently, the increasing development of economy has considerably raised the demand for fossil fuels all over the world. Consequently, oil spill disasters in coastal areas, which may be the result of oil production or transportation, have become one of the most serious threats against marine environment. Understanding the nature of oil spills in coastal areas plays a crucial role in alleviating destructive impacts of oil spill disasters on marine environment [1]. Produced water consists of water naturally present in the oil and gas reservoir (formation water); flood water previously injected into the formation, and/or, in the case of some gas production condensed water. Produced water is part of the well stream together with oil and/or gas. Oil and/or gas are separated from the produced water on the production platform. The produced water is treated to reduce the dispersed oil content to below the regulatory maximum limit of 40 mg/1, set by OSPAR, before it is discharged from the production platform. Typical produced water flow diagrams of studied platforms are shown in Fig.3. The package is designed to process a feed rate of 2000 bpd liquids and to reduce suspended oil in water content of the separated water to 40 ppm wt. max. To whom all correspondence should be sent: E-mail: [email protected] 2015 Bulgarian Academy of Sciences, Union of Chemists in Bulgaria

Welcome message from author
This document is posted to help you gain knowledge. Please leave a comment to let me know what you think about it! Share it to your friends and learn new things together.
Transcript
152
Bulgarian Chemical Communications, Volume 47, Special Issue D (pp. 152 – 157) 2015
Dispersion model for assessing oily components of produced water discharges from
South Pars Gas offshore
G. Bahmannia1, A.H. Javid2*, A.M. Moradi2, S.A. Mirbagheri1
1Department of Environment and Energy, Science and Research Branch, Islamic Azad University, Tehran, Iran 2Department of Marine Science and Technology, Science and Research Branch, Islamic Azad University, Tehran, Iran
Received June 26, 2015, Revised September 10, 2015
The discharge of produced water accounts for the largest volume of waste associated with offshore oil and gas
production operations. With the development and expansion of Iran's offshore gas reserves in the South Pars fields,
there is concern over the potential long-term impacts of produced water discharges in the Persian Gulf. To deal with this
emerging issue, the present study focused on modeling and assessment of environmental impacts associated with
produced water discharges based on the integration of Gulf hydrodynamic and oily components dispersion models. It
provides three-dimensional hydrodynamic input to a Random Walk model focused on the dispersion of oily pollutant
components within the produced water effluent stream at a regional spatial scale. In this paper at first the quantity and
quality of produced water are measured and reported for one year and some statistical reviews has done. Determination
of the oil content of effluent water - Extraction and infra-red spectrometric and OSPAR Reference Method which is the
standard method for dispersed oil in produced water analysis in the UK for both oil and gas facilities was used as
standard method. Advection, diffusion and fate of oil spills by wind and tidal currents and transport are indirectly taken
into account in this study. Hydrodynamic, oil spill and path of the oil pollutants in Offshore Gas Platforms in South Pars
Gas Field in 3 month has been simulated in a few scenarios. The results of modeling in this research approved the risk
of oily components pollution nearby of onshore ecosystems through 3 months.
Key Words: Modeling, Dispersion, Oil, Offshore, Persian Gulf
INTRODUCTION
The most significant energy development
project, the South Pars field, produces about 44
percent of total natural gas in Iran. Discovered in
1990 and located 62 miles offshore in the Persian
Gulf, South Pars has a 24-phase development
scheme. Phases 1-10, which are operational and are
allocated for the domestic market for consumption
and reinjection for EOR Produced water is the
largest effluent discharge associated with South
Pars offshore gas production. (Fig. 1&2) The total
volume of produced water effluent is expected to
increase with future anticipated development of
offshore gas reserve. The environmental impact
potentially which is caused by produced water is
related to the fate and transport of its individual
components including organic and inorganic
compounds (e.g., petroleum hydrocarbons, heavy
metals, nutrients, natural radionuclide), as well as
the formation water and treating chemicals.
Although produced water discharges are associated
with rapid dilution and low-to-trace levels of
pollutants, the potential for cumulative toxic effects
under regional ocean currents warrants a need to
assess the long-term risks on the marine ecosystems Recently, the increasing development of economy
has considerably raised the demand for fossil fuels
all over the world. Consequently, oil spill disasters
in coastal areas, which may be the result of oil
production or transportation, have become one of
the most serious threats against marine
environment. Understanding the nature of oil spills
in coastal areas plays a crucial role in alleviating
destructive impacts of oil spill disasters on marine
environment [1]. Produced water consists of water
naturally present in the oil and gas reservoir
(formation water); flood water previously injected
into the formation, and/or, in the case of some gas
production condensed water. Produced water is part
of the well stream together with oil and/or gas. Oil
and/or gas are separated from the produced water
on the production platform. The produced water is
treated to reduce the dispersed oil content to below
the regulatory maximum limit of 40 mg/1, set by
OSPAR, before it is discharged from the production
platform.
Typical produced water flow diagrams of
studied platforms are shown in Fig.3. The package
is designed to process a feed rate of 2000 bpd
liquids and to reduce suspended oil in water content
of the separated water to 40 ppm wt. max.
To whom all correspondence should be sent:
E-mail: [email protected]
2015 Bulgarian Academy of Sciences, Union of Chemists in Bulgaria

G. Bahmannia et al.: Dispersion model for assessing oily components of produced water discharges from South Pars Gas…
153
Fig. 1. A typical platform.
Fig. 2. The South Pars Gas Field location
Fig. 3. Typical produced water flow diagram of
platforms and oil spills changes in Sea.
MATERIALS AND METHODS
Sampling, preparation and measurement of total
petroleum hydrocarbons (TPH) as main oily
components in produced water of each platforms
has done based on OSPAR Agreement 2005-15 and
ISO 9377-2 and ISO 5667-3 test methods[3]. The
calibrated GC-FID as an accurate laboratory
equipment used for all 52 times analysis of samples
and expert personnel through a year carried out
reliable tests (Fig. 4).
The MIKE 21/3 software provides three-
dimensional hydrodynamic input to a Random
Walk model focused on the dispersion of oily
pollutant components within the produced water
effluent stream at a regional spatial scale.
Fig. 4. GC- FID test equipment and lab experts.
RESULTS
The quantity and quality of produced water are
measured and reported for one year and assumed
for modeling and some statistical reviews. Table 1
includes oil content of produced water discharge
within 3 months on the platform No.5. An average
of daily BBL of produced water discharges per
each platforms and average of TPH components are
shown in Table 1.

G. Bahmannia et al.: Dispersion model for assessing oily components of produced water discharges from South Pars Gas…
154
Table 1. Data of oil content in platforms no. 5.
Oil Gasoline
(C6-C10)
Diesel
(C10-C20)
Heavy Oil
(C20-C28)
160 92 53 15
180 101 67 12
177 98 62 17
165 105 51 9
155 80 56 9
145 100 38 7
176 111 55 11
160 115 35 10
166 107 48 11
154 99 41 14
166 111 45 10
170 135 30 5
163 109 41 13
144 88 46 10
130 75 48 17
134 85 35 14
144 92 42 10
136 87 43 6
190 122 60 8
185 129 51 5
Statistical review by SPSS started with Manova
method for 8 platforms TPH data in 26 times
measurement. It assumed that sampling was
random and error of first type was a = 0.05.
This analysis shows that data of platforms are
acceptable and useful for mathematical modeling
input which is an effective tool for the management
of Persian Gulf operational platforms’ oily water
discharges.
MODEL SETUP
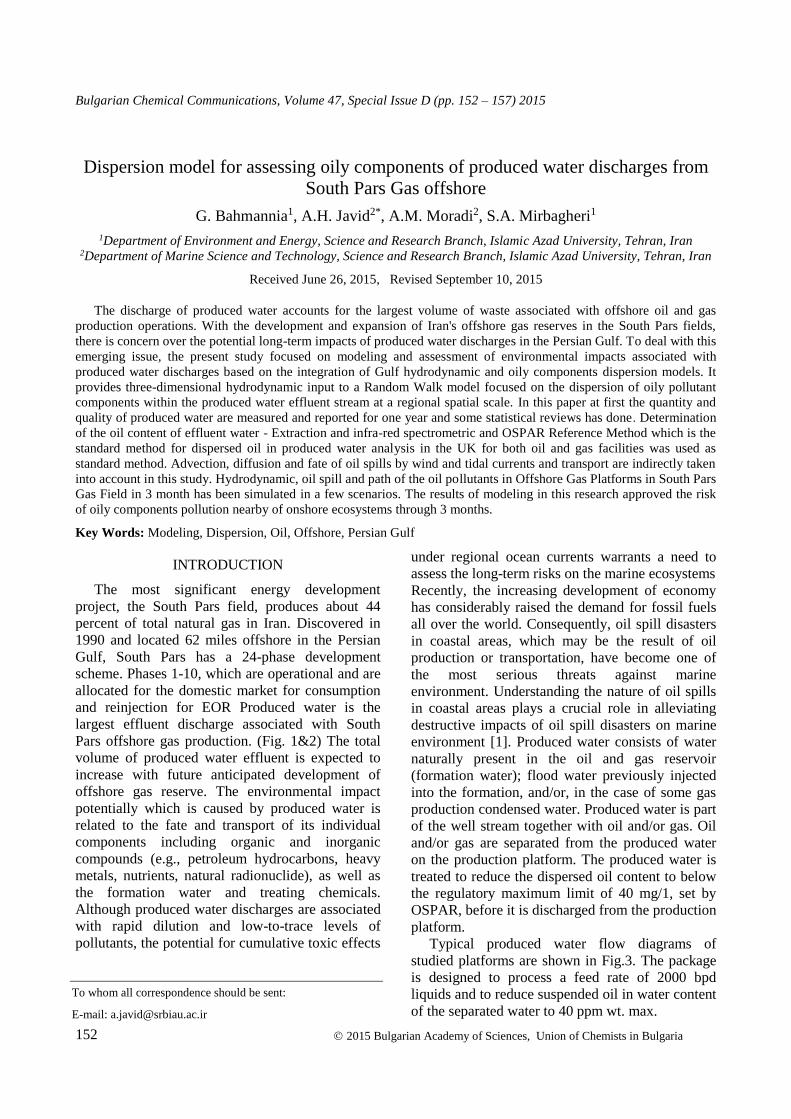
In order to the model input data the bathymetry
is used by structure distances of geographical width
2 minute in Southern- Northern direction, and the
geographical 2 minute in Western-Eastern direction
related to ETOPO1 altimetry data in NOAA site. So
by the use of these data in 0.10 structure, the
altimetry features of the place is counted and
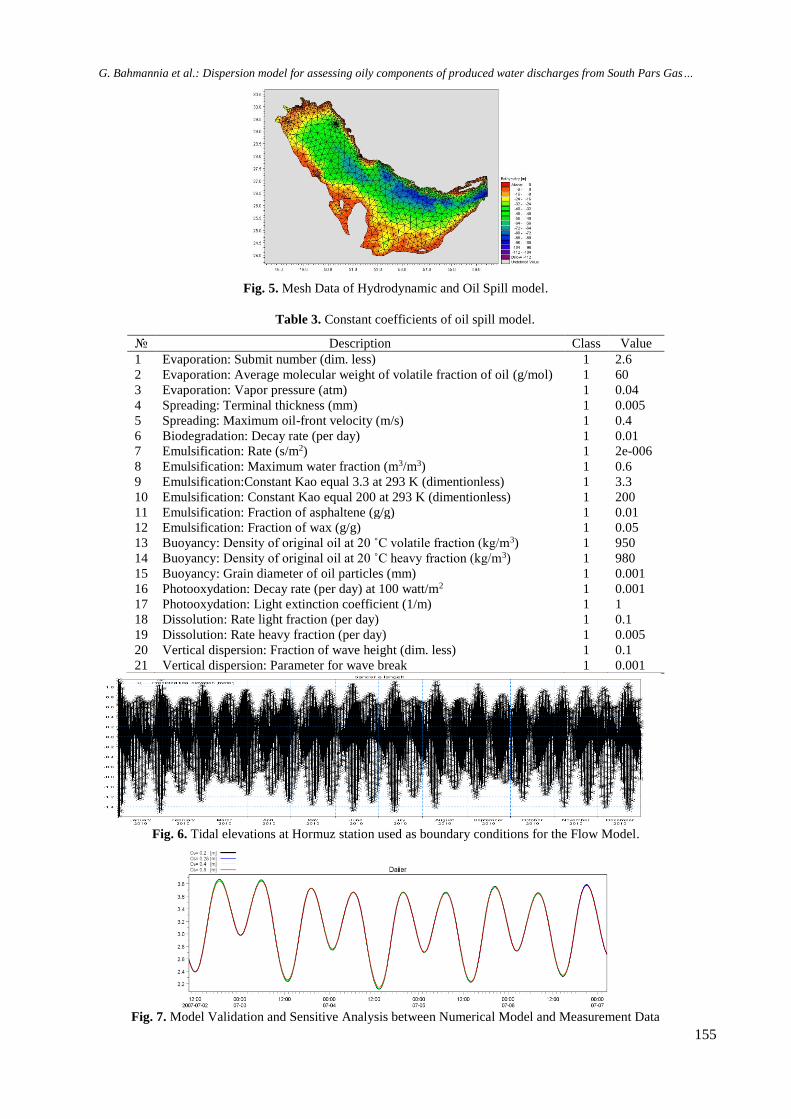
rendered in model (Fig. 5). Tidal surface elevation
in Hormuz station utilized for Flow Model FM
boundary condition that is shown in Fig 6. Also
constant coefficients of oil spill model of Mike 21
are shown in Table 3.
Table 2. Data of platforms.
Platforms SPD1&2 SPD3 SPD4 SPD5 SPD6 SPD7 SPD8 SPD9 SPD10 SPD11
Water bbl./D 541 167 326 732 1664 389 430 304 2042 1987
Ave. TPH mg/L 43 0 0 155 192 215 330 177 143 208
Table 3. Multivariate Tests.
Effect Value F Hypo-
thesis df Error df Sig.
Intercept
Pillai's Trace .999 a38754.175 4.000 197.000 .000
Wilks' Lambda .001 a38754.175 4.000 197.000 .000
Hotelling's Trace 786.887 a38754.175 4.000 197.000 .000
Roy's Largest Root 786.887 a38754.175 4.000 197.000 .000
platform
Pillai's Trace 1.686 20.822 28.000 800.000 .000
Wilks' Lambda .002 109.934 28.000 711.716 .000
Hotelling's Trace 149.993 1047.271 28.000 782.000 .000
Roy's Largest Root 148.352 b4238.641 7.000 200.000 .000
a. Exact statistic-
b. The statistic is an upper bound on F that yields a lower bound on the significance level.
c. Design: Intercept + platform
G. Bahmannia et al.: Dispersion model for assessing oily components of produced water discharges from South Pars Gas…
155
Fig. 5. Mesh Data of Hydrodynamic and Oil Spill model.
Table 3. Constant coefficients of oil spill model.
№ Description Class Value
1 Evaporation: Submit number (dim. less) 1 2.6
2 Evaporation: Average molecular weight of volatile fraction of oil (g/mol) 1 60
3 Evaporation: Vapor pressure (atm) 1 0.04
4 Spreading: Terminal thickness (mm) 1 0.005
5 Spreading: Maximum oil-front velocity (m/s) 1 0.4
6 Biodegradation: Decay rate (per day) 1 0.01
7 Emulsification: Rate (s/m2) 1 2e-006
8 Emulsification: Maximum water fraction (m3/m3) 1 0.6
9 Emulsification:Constant Kao equal 3.3 at 293 K (dimentionless) 1 3.3
10 Emulsification: Constant Kao equal 200 at 293 K (dimentionless) 1 200
11 Emulsification: Fraction of asphaltene (g/g) 1 0.01
12 Emulsification: Fraction of wax (g/g) 1 0.05
13 Buoyancy: Density of original oil at 20 ˚C volatile fraction (kg/m3) 1 950
14 Buoyancy: Density of original oil at 20 ˚C heavy fraction (kg/m3) 1 980
15 Buoyancy: Grain diameter of oil particles (mm) 1 0.001
16 Photooxydation: Decay rate (per day) at 100 watt/m2 1 0.001
17 Photooxydation: Light extinction coefficient (1/m) 1 1
18 Dissolution: Rate light fraction (per day) 1 0.1
19 Dissolution: Rate heavy fraction (per day) 1 0.005
20 Vertical dispersion: Fraction of wave height (dim. less) 1 0.1
21 Vertical dispersion: Parameter for wave break 1 0.001
Fig. 6. Tidal elevations at Hormuz station used as boundary conditions for the Flow Model.
Fig. 7. Model Validation and Sensitive Analysis between Numerical Model and Measurement Data

G. Bahmannia et al.: Dispersion model for assessing oily components of produced water discharges from South Pars Gas…
156
RESULTS
In this research, hydrodynamic parameters such
as tidal surface elevation that measured in Daiier
Port have been used for model validation (Fig 6).
Comparing numerical results and field
measurements shows a good agreement between
numerical results and field measurements in Daiier
Port. Hydrodynamic results of are shown in Fig 7.
Oil dispersion model, which includes
hydrodynamic model and qualitative water model
from produced water, has been done for a year for
each discharge location. Oil spill modeling in
Offshore Gas Platforms in South Pars Gas Field is
shown in Fig 8. Path of the oil pollutants in
Offshore Gas Platforms in South Pars Gas Field is
shown in Fig 9.
Fig. 8. Flow velocity vectors in the surrounding area
of Asalooye.
CONCLUSIONS AND DISCUSSION
Comparing Industry development and growing
marine transportation, together with oil spill
disasters in the seas and oceans have resulted in
contamination of marine environments. Advection,
diffusion and fate of oil spills by wind and tidal
currents and transport are indirectly taken into
account in this study. This study was done on Gas
Platforms in South Pars Gas Field in Iran; however
there are other platforms belonging to Qatar, so
there are actually produced water discharges and
pollutants from those platforms, too. Therefore,
Fig. 9. Path of the oil pollutants in offshore gas
platforms in South Pars Gas Field during the simulation
period.

G. Bahmannia et al.: Dispersion model for assessing oily components of produced water discharges from South Pars Gas…
157
future studies can be done on other platforms in
South Pars Gas Field and the obtained results can
be compared, so better and more accurate results
can be achieved.
REFERENCES
1. P. Tkalich, X. B. Chao, Accurate Simulation of Oil
Slicks, Proceedings of the International Oil Spill
Conference 26-29 March 2001, Florida, Washington
DC, 2001, p. 1133.
2. J.A. Fay, The Spread of Oil Slick on a Calm Sea,
Hoult, D.P. (Ed), Oil on the Sea. Plenum Press, New
York, NY , 1969, p. 53.
3. R. Perianez, Modeling the Dispersion of Radio
Nuclides in the Marine Environment, Springer, 2005.
4. D. Mackay, S. Paterson, K. Trudel, A Mathematical
Model of Oil Spill Behavior, Environmental Protection
Service, Fisheries and Environmen, Canada, 1980.
5. A. Johansen, Spill Technol. Newslett., III, 134
(1982).
6. M. Fingas, J. Adv. Marine Technol., 11, 41 (1994).
7. A.J. Elliot, Deutsche Hydrographische Zeitschrift,
39, 113 (1986).
Related Documents


