Image Segmentation, Representation and Description Wei-De Chang E-mail:[email protected] Graduate Institute of Communication Engineering National Taiwan University, Taipei Taiwan, ROC Abstract Image segmentation is an essential preliminary step in most automatic pictorial pattern recognition and scene analysis algorithms. The purpose of representation and description is used to be the application of image. In the application of image processing, we have to choose an approach and to do representation and description, just like recognition of the word, picture, and so on. 1.Introduction Segmentation is to subdivide an image into constituent regions or objects. Image segmentation algorithms are generally based on one of the two basic properties of intensity value: discontinuity and similarity. In this section, we discuss many different approaches to detect the boundary choose of threshold, and so on. After an image is segmented into regions, each region is represented and described in a form suitable for further computer processing. Basically, there are two ways to represent a region involves two choices. The external representation is used when the primary focus is on shape characteristics. The internal representation is used when the primary focus is on regional properties. Of course, sometimes it may be necessary to use both type.

Welcome message from author
This document is posted to help you gain knowledge. Please leave a comment to let me know what you think about it! Share it to your friends and learn new things together.
Transcript

Image Segmentation, Representation and Description
Wei-De ChangE-mail:[email protected]
Graduate Institute of Communication EngineeringNational Taiwan University, Taipei Taiwan, ROC
Abstract
Image segmentation is an essential preliminary step in most automatic pictorial pattern recognition and scene analysis algorithms. The purpose of representation and description is used to be the application of image. In the application of image processing, we have to choose an approach and to do representation and description, just like recognition of the word, picture, and so on.
1. Introduction
Segmentation is to subdivide an image into constituent regions or objects. Image segmentation algorithms are generally based on one of the two basic properties of intensity value: discontinuity and similarity. In this section, we discuss many different approaches to detect the boundary choose of threshold, and so on. After an image is segmented into regions, each region is represented and described in a form suitable for further computer processing. Basically, there are two ways to represent a region involves two choices. The external representation is used when the primary focus is on shape characteristics. The internal representation is used when the primary focus is on regional properties. Of course, sometimes it may be necessary to use both type.
2. Edge-Based Segmentation
There are three basic types of gray-level discontinuities in a digital image: points, lines, and edges. The most common way to look for discontinuities is to run a mask
through the image. And the response of the mask at any point in the image is
given by
(2-1)

2.1 Point DetectionWe say that a point has been detected at the location on which the mask is centered if
(2.1-1)
-1 -1 -1-1 8 -1-1 -1 -1
Fig.2-1 a point detection mask
2.2 Line Detection
In the line detection, we use the same way of point to detect different angle of line. Fig.1.2 illustrates the line detection mask at horizontal direction.
-1 -1 -12 2 2-1 -1 -1
Fig.2-2 a mask of horizontal direction
2.3 Edge Detection
Although point and line detection certainly are important in any discussion on segmentation, edge detection is by far the most common approach for detecting meaningful discontinuities in gray level. About the edge detection, we discuss approaches for implementing first- and second-order digital derivatives for the detection lf edges in an image.

Fig.2.3 Gray-level profile First derivative Second derivative
2.3.1 Gradient operation
The gradient of an image at location (x, y) is defined as the vector
(2.3.1-1)
We can use this to find the magnitude direction angle
(2.3.1-2)
(2.3.1-3)
2.3.2 The Laplacian
The Laplacian of a 2-D function f(x, y) is a second-order derivative defined as
(2.3.2-1)
The Laplacian of Gaussian(LOG) is a operation that
(2.3.2-2)
Fig.1.3-1 and 1.3-2 is a 3-D plot image and the mask
(a) (b)

Fig1.3 (a) 3-D plot (b) 5 5 mask approximation to the shape of (a)
2.4 Edge Linking and Boundary Detection
2.4.1 Local Processing
The two principal properties used for establishing similarity of edge pixels in this kind of analysis are (1) the strength of the response of the gradient operator used to produce the edge pixel; and (2) the direction of the gradient vector. If
(3.1-1)
(3.1-2)
The point is detected.
2.4.2 Global Processing via the Hough Transform
Fig.2.4.2 Illustration of the Hough transform
2.4.3 Global Processing via Graph-Theoretic Techniques

(a) (b) (c)Fig.2.4.3-1 (a) A 3 3 image region (b) Edge segments and their costs (c) Edge
corresponding to the lowest-cost path graph shown in Fig.2.4
Fig.2.4.3-2 Graph for the image in Fig.2.3 (a). The lowest-cost path is shown dashed.
3. Thresholding
In this section, we introduce an approach to produce the two-level image from the gray level image. After we decide a threshold T, we make the gray level value become 1 if the value more than T, and vice versa. The formula is shown as following.
(4-1)
3.1 Basic Global Thresholding
The following algorithm can be used to obtain T automatically:(1) Select an initial estimation for T(2) Segment the image using T. This will produce two groups of pixels: G1 consisting of all pixels with gray level values >T and G2 consisting of pixels with values<=T

(3) Compute the average gray level values u1 and u2 for the pixels in regions G1 ane G2/(4) Compute a new threshold value: T=1/2(u1+ u2).(5) Repeat steps 2 through 4 until the difference in T in successive iterations is smaller than a predefined parameter T0
3.2 Basic Adaptive Thresholding
Because of the role of illumination, we find an approach to solve this problem that is subdividing Image into individual subimages. The following graph shows the result of the adaptive thresholding.
(a) (b)
(c) (d)Fig.4.2 (a) Original image (b) Result of global thresholding (c) An image subdivided into subimages (d) Result of adaptive thresholding
3.3 Optimal Global and Adaptive Thresholding
If gray level values belong to Gaussian distribution. Threshold is calculated as following when error rate is minimized.

(4.3)
4. Region-Based Segmentation
4.1 Region Growing
Region growing is a procedure that groups pixels or subregion into larger regions based on predefined criteria. The basic approach is to start with a set of “seed” points and from these grow regions by appending to each seed those neighboring pixels that have properties similar to the seed.
(a) (b)
(c) (d)Fig.4.1-1 (a) Image showing defective welds (b) Seed points (c) Result of region growing (d) Boundaries of segmented defective welds
Region and merging in region growing is an important step. The result of region splitting and merging is better than threshold. Because the image segmentation by threshold just have two gray level value, but the image use region splitting and merging have similar sharp with original image. There is a procedure of region splitting and merging below.

(a) (b)Fig.4.1-2 (a) Partitioned image (b) Corresponding quadtree
4.2 Unseeded region growing
A characteristic of USRG different to SRG is no explicit seed selection is necessary, the seeds can be generated by the segmentation procedure automatically. And the automatic segmentation is by added benefit of robustness from region-based segmentation. Advantages of it are easy to use and can readily incorporate higher level knowledge of the image composition through region threshold.
4.3 Mean Shift Algorithm
The mean shift algorithm is a nonparametric clustering technique which does not require the prior knowledge of clusters, and does not constrain the shape of the windows and clusters. A advantage is good in shape of match. And a disadvantage is the slow speed.
4.4 Fast scanning Algorithm
The fast scanning algorithm somewhat resembles unseeded region growing (USRG) we had mentioned in sub-section 4.2Error: Reference source not found. Both two algorithms are region-based approaches and the number of clusters of both results would not be decided before an image passing through them as well. We list the steps of algorithm as below.
1. Make the first pixel (Mostly, it will be the top-left one) we scan as the first
clustering. See the pixel (x,1) in the image as one cluster . See the pixel which
we are scanning as .
2. From the first column, scan the next pixel (x,1+1) and make a decision with the threshold if it will be merged into the first clustering or to be a new clustering.

If , we merge into and recount the centroid of
.
If , we make as a new cluster .
3. Repeat Step 2 until all the pixels in the same column have been scanned.
4. Scan the next column with pixel (x+1,1) and compare it to the region which is
in the upper side of it. And make the merge decision see if we have to merge pixel
(x+1,1) to the region .
If we merge into and recount the centroid of
.
If , we make as a new cluster , where n is the
cluster number so far.
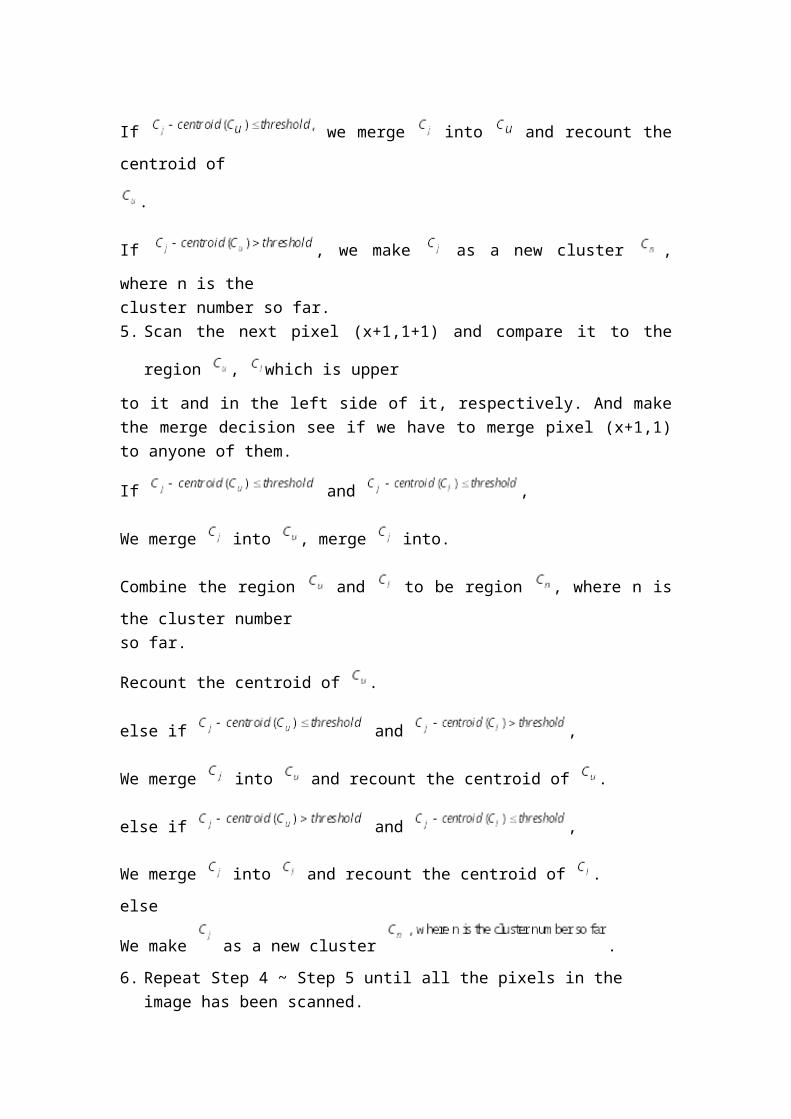
5. Scan the next pixel (x+1,1+1) and compare it to the region , which is upper
to it and in the left side of it, respectively. And make the merge decision see if we have to merge pixel (x+1,1) to anyone of them.
If and ,
We merge into , merge into.
Combine the region and to be region , where n is the cluster number
so far.
Recount the centroid of .
else if and ,
We merge into and recount the centroid of .
else if and ,

We merge into and recount the centroid of .
else
We make as a new cluster .
6. Repeat Step 4 ~ Step 5 until all the pixels in the image has been scanned.7. Process the small regions which are classified from step 1~ step 4It is important to deal with the isolated small regions carefully. The algorithm provides an approach in step 5 to disappear many fragmentary results after segmenting the image. The concept is to classify the isolated small regions into the big region which is already classified and is adjacent to these isolated small regions.
4.4.1 Use Morphological to Improve Fast Scanning Algorithm
There are some morphological operations like erosion, dilation, thinning, opening, closing. In the below we briefly illustrate the results of those operations and how to using these ones.1. Binary dilation is a primary one of morphological operations. It is a combination of two sets by vector addition of set elements. If a digital image A referred as set and kernel B is structuring element. It is said that dilation of A by B:
(4.4.1-1)
Fig.4.4.1-1 Dilation operation and their corresponding binary images. The red point is
origin of .
Binary dilation is with below properties:(1) Dilation A by kernel with origin guaranteed to contain A.(2) Extensive: operators whose output contains input dilation extensive when kernel
contains origin.(3) Dilation preserves order
(4.4.1-2)
(4) Increasing: preserves order.
2. Binary erosion is another primary morphological operation. If a set represented by “A”, and a kernel set by B. The definition of erosion of A by B is
(4.4.1-3)
Fig. 4.4.1-2 Binary erosion of a set A by a structuring element B.
The property of binary erosion is
(4.4.1-4)
3. Binary Opening and Closing
Binary opening and closing are composed from dilation and erosion. Opening of

image B by kernel K is represented as
(4.4.1-5)
Opening with disk kernel would produce smoothes contours and breaks narrow isthmuses, or neck, moreover, eliminates small islands, sharp peaks, and capes.Closing operator is represented as
(4.4.1-6)
Closing with disk kernel would also produce smoothes contours but fuses narrow breaks, long, thin gulfs, in the same time, eliminates small holes and fill gaps on the contours.
4. Gray Scale Morphology
Not only binary image but also gray level one could be processed by morphological operations. It is obvious that definitions of gray scale morphological operations differ from binary ones. Gray scale morphological operations introduce minimum or maximum operation to perform dilation and erosion.Grayscale dilation is represented by
(4.4.2-1)
Grayscale erosion is similarly represented by
(4.4.2-2)

Fig.4.4.1-3 Structuring elements, the values of all points are zero
5. Improvement of Fast Scanning with Morphological Operation
The outcome of fast scanning algorithm is not enough matching physical objects. For improving the result of fast scanning, we use the operations of morphology to diminish some flaws. The step of first scheme is described at Fig.4.4.1-4. Because of binary and dilation for every region are time consumptive. To shorten the consumption time, we calculate the binary erosion of every region in one time instead of one by one and consider the duality property between binary erosion and dilation, and it is second scheme. The step of second scheme is described at Fig.4.4.1-5. The flow chart of first scheme is

Fig.4.4.1-4 flow chart of improvement approach
The flow chart of second scheme is
Fig.4.4.1-5 flow chart of improvement approach4.4.2 Use Geometrical Mathematic to improve fast scanning
A potential issue of morphological technique is might be sustained a kernel size problem in which a too small kernel makes whole improvement structure trivial. It will confuse us that how to decide the size of kernel. In this chapter, we replace morphological technique with making use of other concept: geometrical mathematics. The approach can improve matching physical objects of fast scanning algorithm.
4.4.2.1 Strategy for Extra Cutting Off
While an image had been segmented, we could hypothesize that every segmented regions are all polygons. Before transforming segmented regions to polygons, we should firstly know which points in boundary of region could be seen as vertices. Supposing that all picked points of one region from split approach are vertices of polygon. Then, the following process is finding out the vertices with their interior angle which is bigger than 180 degree.
Next, we will descript the criterion of extra cutting off. Before, we had introduced the

tactic of improvement in previous section, but a core issue is in which condition the region must be cut off. In previous tactic, we want to find the vertices with interior angle over 180 degree. Now, we call this vertex “vertex”. And that we introduce three matrixes below. First matrix below is called as straight line distance matrix. Second and third matrixes are individually clockwise and counterclockwise distances along boundaries of region.
(a) (b) (c)Fig.4.4.2.1-1 (a) a matrix of mutual straight line distances (b) a matrix of clockwise distances along boundaries of region (c) a matrix of counterclockwise distances along boundaries of region
After this three type matrixes are found. We calculate the minimum elements matrix.
(4.4.2-1)
The final step is to calculate the ratio matrix of minimum of distance (4.4.2-1) to mutual distance. The matrix is showed in below:
(4.4.2-2)
This matrix is the final determination matrix, in this thesis we define a pre-threshold. The geometric meaning of threshold is the acceptable minimum ratio of boundary-along distance to straight geometric distance among two points. And the threshold equal to 10.

Compare every element in (4.4.2-2) with the threshold. The following is a determination rule, indeed, as (4.4.2-2) is symmetric matrix, we could just focus on upper triangle elements. Also, according to the definition of ratio matrix, diagonal elements are concerning relation between vertex and itself. It is trivial for discussion.
(a) If exist just only one element is bigger than threshold, where , then
picking up point and point . And connect these two vertices in order to cutting off
the objective region into two parts.
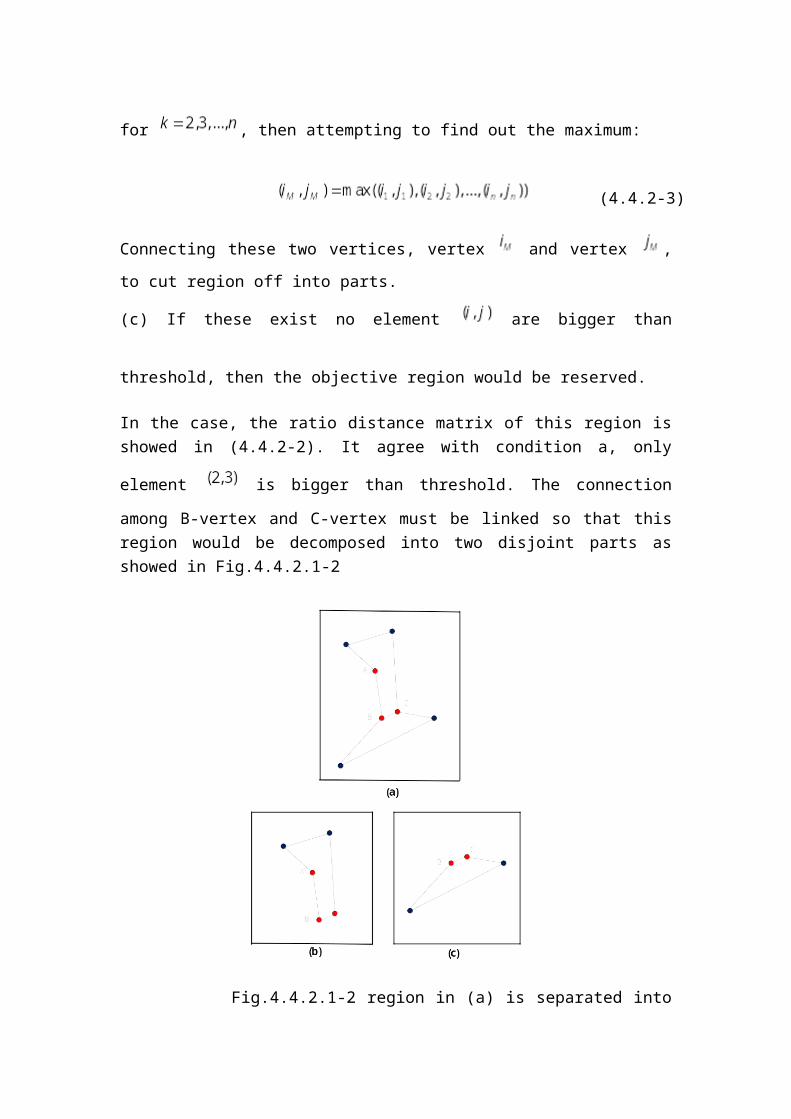
(b) If there exist more than or equal to two elements are
bigger than threshold, where for , then attempting to find out the
maximum:
(4.4.2-3)
Connecting these two vertices, vertex and vertex , to cut region off into parts.
(c) If these exist no element are bigger than threshold, then the objective region
would be reserved.
In the case, the ratio distance matrix of this region is showed in (4.4.2-2). It agree with
condition a, only element is bigger than threshold. The connection among B-
vertex and C-vertex must be linked so that this region would be decomposed into two disjoint parts as showed in Fig.4.4.2.1-2

Fig.4.4.2.1-2 region in (a) is separated into two parts (b), (c).
4.5 Segmentation by Morphological Watersheds
When the rising water in distinct catchment basins is about to merge, a dam is built to prevent the merging. The flooding will eventually reach a stage when only the tops if the dams are visible above the water line.
(a) (b)

(c) (d)Fig.4.5 (a) Original image (b)Topographic view (c)-(d) Two stages of flooding
4.5.1 Dam Construction
(a)
(b)
(c) Fig.4.5.1 (a) Two partially flooded catchment basins at stage n-1 of flooding (b) Flooding at stage n, showing that water has spilled between basins (c) Structuring element used for dilation (d) Result of dilation and dam construction

4.5.2 The Use of Markers
This graph is before using markers.
(a) (b)Fig.4.5.2-1(a) Electrophoresis image (b) Result of applying the watershed segmentation algorithm to the gradient image
The graph below is after using markers.
(c) (d)Fig.4.5.2-2 (c) Image showing internal markers and external markers (d) Result of segmentation
5 Representation
Representation
The segmentation techniques usually consider the pixel along a boundary and pixel contained in the region. And an approach to obtain the descriptor that is compact the data into representation. There are several approaches above.
5.1 Chain Code
The chain code is used to represent a boundary by the length and the direction of straight-line segments. Typically, this representation is based on 4- or 8- connectivity of the segments.
(a) (b)
Fig.5.1.1 (a) 4-directional chain code (b) 8-directional chain code.
(a) (b)
(c) (d) Fig.5.1.2 (a) Digital boundary with resampling grid srperimposed. (b) Result of
resample. (c) 4-directional chain code. (d) 8-directional chain code

Digital images are uaually processed in a grid format, but it may not match shape of the boundary if the chain of codes is quite long or the boundary is distributed by the noise. An approach frequently used to circumvent the problems just discussed is to resample the boundary by selecting a larger grid spacing. It can be seen that the accuracy and samples is related to grid spacing. 5.2 Polygonal Approximations
The goal of polygonal approximation is to capture the essence of the boundary shape with the fewest possible polygonal segments. Several polygonal approximation techniques of middle complexity and processing requirements are suitable for image processing applications.
5.2.1 Minimum Perimeter Polygons
We visualize this enclosure as two walls corresponding to the outside and inside boundaries of the strip of cells, and think of the object boundary as a rubber band contained within the wall. If the rubber band is allowed to shrink, it takes the shape shown in Fig.5.2.1
(a) (b)
Fig.5.2.1 (a) Object boundary enclosed by cells, and (b) Minimum perimeter polygon. 5.2.2 Merging Techniques
Merging techniques based on average error or other criteria have been applied to the problem of polygonal approximation. The approach is to merge points along a boundary until the least square error line fit of the points merged so far exceeds a

preset threshold.
Fig.5.2.2 Merge approach of a set of digital boundary
5.2.3 Splitting Techniques
An approach of the splitting techniques is subdivided a segment successively into two part until a criterion is satisfied. For instance, a requirement might be that the maximum perpendicular distance from a boundary segment to the line joining its two end point not exceed a preset threshold.
5.3 Signature
Signature is a approach that translate 2-D function to 1-D function. One of the simplest is to plot the distance from the center to the boundary as a function of angle, as illustrated in Fig.6.3.
(a) (b)
Fig.5.3 (a), (b): Distance signature of circle and rectangular shapes.

5.4 Boundary Segments
Decomposing a boundary into segments often is useful. Decomposition reduces the boundary’s complexity. This approach is useful when the boundary contains one or more concavities. In this case use of the convex hull of the region enclosed by the boundary is a powerful tool for robust decomposition of the boundary.
5.5 Skeletons
Skeletons mean thinning. The skeleton of a region may be defined via the MAT (medial axis transformation) proposed by Blum [1967]. According to the definition,
the step 1 flags a contour point for deletion if the following conditions are
satisfied: (a)
(b)
(c) =0
(d) (5.5-1)
Where is the number of nonzero neighbors of : that is,
(5.5-2)
Fig.6.5 Neighborhood arrangement used by the thinning algorithm
In section 2, conditions (a) and (b) remain the same, but conditions (c) and (d) are changed to
=0

=0 (5.5-3)
The iteration of the thinning algorithm consists of (1) applying step 1 to flag border points for deletion; (2) deleting the flagged points; (3) applying step 2 to flag the remaining border points for deletion; and (4) deleting the flagged points.
6. Descriptor
In this section, we discuss boundary descriptors and regional descriptors.
6.1 Boundary Descriptors
There are several approaches to describe the boundary of a region. We illustrate as follows.
6.1.1 Some Simple Descriptors
There are several simple descrioptors. Just like basic rectangular, eccentricity, curvature and so on. Basic rectangular is the rectangular that generate by major axis and minor axis. Eccentricity is the ratio of major axis and minor axis. Curvature is defined as the rate of the boundary that use convex and concave to describe the boundary.
6.1.2 Shape Numbers
The first difference of a chain-coded boundary depends on the starting point. The shape number of such a boundary, based on the 4-directional code is defined as the first difference of smallest magnitude. For a desired shape order, we find the rectangle of order n whose eccentricity best approximates that of the basic rectangle and use this new rectangle to establish the grid size.
6.1.3 Fourier Descriptors
The Fourier descriptors are starting at an arbitrary point . Each coordinate pair
can be treated as a complex number so that

(6.1.3-1)
This representation has one great advantage that it reduces a 2-D to a 1-D problem.
The discrete Fourier transform (DFT) of is
(6.1.3-2)
for .The complex coefficients are called the Fourier
descriptors of the boundary. The inverse Fourier transform of these coefficients
restore . That is,
(6.1.3-3)
for . Suppose, however, that instead of all the Fourier coefficients,
only the first P coefficient is used. This is equivalent to setting for .
The result is the following approximation to :
(6.1.3-4)
The smaller P becomes, the more detail that is lost on the boundary. And the bigger P becomes, it more similar to boundary.
6.1.4 Statistical Moments
The shape of boundary segments can be described quantitatively by using simple statistical moments, such as the mean, variance, and higher-order moments. Let us treat the amplitude of g as a discrete random variable v and form an amplitude
histogram , , where A is the number of discrete amplitude
increments in which we divide the amplitude scale, and p() is the probability of value vi. The equation of nth moment about its mean is
(6.1.4-1)

where
(6.1.4-2)
An alternative approach is to normalize g(r) to unit area and treat it as a histogram. In
other words, is now treated as the probability of value occurring. In this case,
r is treated as the random variable and the moments are
(6.1.4-3)
where
(6.1.4-4)
In this notation, K is the number of points on the boundary, and is directly
related to the shape of . Basically, what we have accomplished is to reduce the
description task to that of describing 1-D functions. The advantage of moments over other techniques is that implementation of moments is carry a physical explain of boundary shape and this approach is insensitive to rotation. 6.2 Regional Descriptors
In this section, we consider various approaches for describing image regions.
6.2.1 Some Simple Descriptor
The area and the perimeter are sometimes used as descriptors. A more frequent use of these two descriptors is in measuring compactness of a region.
6.2.2 Topological Descriptor
Topological is the study of properties of a figure that are unaffected by any deformation, as long as there is no tearing. It can be defined by the number of holes, and connected component. In this section, we define the Euler formula:
(6.2.2-1)

V: the number of verticesQ: the number of edgesF: the number of facesC: the number of connected componentH: the number of holes
6.2.3 Texture
An important approach to region description is to quantify its texture content. There are three approaches introduced above.
1. Statistical approaches
Statistical approaches yield characterizations of textures as smooth, coarse, and grainy, and so on. One of the approaches for describing texture is to use statistical moments of the gray-level histogram of an image or region. The nth moment of z about the mean is
(6.2.3-1)
Where
(6.2.3-2)
The second moment is important. It is a measure of gray- level contrast that can be used to establish descriptors of relative smoothness. For example, the measure of constant intensity
(6.2.3-3)
The third moment is a measure of the skewness of the histogram. The fourth moment is a measure of its relative flatness. The fifth and higher moments are not so easily related to histogram shape. Some useful approaches established in the histogram is measuring of uniformity
(6.2.3-4)
and measuring of an average entropy
(6.2.3-5)

2. Structural Approaches
Structural techniques deal with the arrangement of image primitives. Suppose that we
have a rule of the form , which indicates that the symbol may be rewritten as . If represents a circle [Fig.3.2.3 (a)] and the meaning of “circles to the right” is assigned to a string of the form aaa…., the rule allows generation of the texture pattern shown in Fig.3.2.3-2 (b).
(a) (b)
Fig.6.2.3 (a) Texture primitive. (b) Pattern generated by the rule .
3. Spectral Approaches
Spectral techniques are based on properties of the Fourier spectrum and are used primarily to detect global periodicity in an image by identifying high energy, narrow peaks in the spectrum. Interpretation of spectrum features just mentioned often are
simplified by expressing the spectrum in polar coordinates to yield a function ,
where S is the spectrum function and r and are the variables in this coordinate
system. Analyzing for a fixed value of yield the behavior of the spectrum
along a radial direction from the origin, whereas analyzing for a fixed value of
r yields the behavior along a circle centered on the origin.
(6.2.3-6)
(6.2.3-7)
Descriminating the different texture patterns by analyzing their corresponding S(θ)
and S(r) waveforms would be straightforward.

6.2.4 Use of Principal Components for Description
The material discussed is applicable to boundaries and regions. Suppose that we are given the n component images of such a color. The n images can be treated as a unit by expressing each group of n corresponding pixels as a vector. These n elements con be expressed in the form of a 3-D column vector, x where
(6.2.4-1)
We discuss the mean vector and covariance matrix
(6.2.4-2)
(6.2.4-3)
The diagonal of is the variance of vector. And we can find the correlation of any
tow elements. Let A be a matrix whose rows are formed form the eigenvectors of ,
ordered so that the last row is the eigenvector corresponding to the smallest eigenvalue.Suppose that we use A as a transformation matrix to map the x into vectors denoted by y, as follows
(6.2.4-4)
This expression is called the Hotelling transform. The covariance matrix of y is

(6.2.4-5)
The off-diagonal elements of this covariance matrix are 0, so the elements of the y vectors are uncorrelated.The concept of aligning a 2-D object with its principal eigenvectors plays an important role in description. As noted earlier, description should be as independent as possible to variations in size, translation, and rotation. The ability to align the object with its principal axes provides a reliable means for removing the effects of rotation. The eigenvalues are the variances along the eigen axes, and can be used for size normalization. The effects of translation are account mind the fact that the method of description derived in this section is equally applicable to both regions and boundaries.
6.2.5 Relational Descriptors
Relational descriptors apply equally well to boundaries or regions, and their main purpose is to capture in the form of rewriting rules basic repetitive patterns in a boundary or region. By defining the two primitive elements a and b, we use it to establish the code, and use rewriting rules to transform it.
(a)(b)(c)
(1,2,1,2,1,3) Fig.6.2.5 is coded structure
Because strings are 1-D structures, their application to image description requires establishing an appropriate method for reducing 2-D positional relations to 1-D form.An approach is to follow the contour of an object and code the result with segments of

specified direction and/or length. Another approach is to describe sections of an image by directed line segments. String descriptions are best suited for applications in which connectivity of primitives can be expressed in a head-tail or other continuous manner. Sometimes regions that are similar in terms of texture or other descriptor may not be contiguous, and techniques are required for describing such situations. An approach is use tree descriptors.
6.3 Polynomial Approximation
6.3.1 Lagrange Polynomial
In this part, we introduce nth Lagrange Polynomial. This polynomial is given by
(6.3.1-1)where k=0, 1, 2,….,n
,and (6.3.1-2)
6.3.2 Error Term of Lagrange Polynomial
Suppose are distinct numbers in the interval [a, b] and .
Then, for each x in , a number (generally unknown) in exists with
, 1001\*
MERGEFORMAT (..)
where is the interpolating polynomial.
So the error is
. 2002\*
MERGEFORMAT (..)

A practical difficulty with Lagrange interpolation is that since the error term is difficult to apply, the degree of the polynomial needed for the desired accuracy is generally not known until computations are determined. From this error term, we can approximate boundary which we want to descript.
6.3.3 Cubic Spline Interpolation
Fig.6.3 Cubic spline interpolation
Given a function defined on [a, b] and a set of nodes ,
a cubic spline interpolant S for is a function on that satisfies the following
conditions:
(a) S(x) is a cubic polynomial, denoted , on the subinterval for each
;
(b) and for each .
(c) for each ;
(d) for each ;
(e) for each ;
(f) One of the following sets of boundary conditions is satisfied:
(i) (free pr natural boundary);
(ii) and (clamped boundary).
To construct the cubic spline interpolant for a given function , the conditions
in the definition are applied to the cubic polynomials
for each . (6.3.3-1)
Since , condition (c) can be applied to obtain
for each . (6.3.3-2)
Since the terms are used repeatedly in this development, it is convenient to
introduce the simpler notation
, for each . (6.3.3-3)
If we also define , then the equation
holds for each . (6.3.3-4)
In a similar manner, define and observe that
for each . (6.3.3-5)
Imply , for . Applying condition (d) gives
(6.3.3-6)
Another relationship between the coefficients of is obtained by defining

and applying condition (e). then, for each ,
(6.3.3-7)
Solving for in and substituting this value into
and , for each ,
The new equations
(6.3.3-7)
And
(6.3.3-8)
The final relationship involving the coefficients is obtained by solving the appropriate
equation in the form of Eq.(3.8), first for ,
(6.3.3-9)
And then, with a reduction of the index, for . This gives
(6.3.3-10)
Substituting these values into the equation derived from Eq.(3.9), with the index reduced by one, gives the linear system of equations
(6.3.3-11)
For each . This system involves only the as unknowns since the
values of and are given, respectively, by the spacing of the nodes
and the values of at the nodes.

Note that once the values of are determined, it is a simple matter to find the
remainder of the constants from Error: Reference source not found and
from Error: Reference source not found, and to construct the cubic polynomials
.
6.4 Proposed Method
In this section, we hope that the error term between boundaries and approximated curves is as small as possible. Moreover, the data necessary to recovery the information is also expected to be small as possible. The idea is somewhat like cubic spline interpolation method, but it using too much data to describe the significant information, start point, end point, and four coefficients. Our proposed method just needs to record start point, end point, and one coefficient compared to cubic spline interpolation method. Next part, we illustrate the process of the proposed method. Before the proposed method being implemented, boundary must be divided into some sections. We create a new coordinate system as meeting a section of boundary. Making start point as an origin and end point also lied in x-axis for all being processing curves. The transform process is illustrated in Fig.6.4.1
Fig.6.4.1Transformation of coordinate
Next, we construct a second order polynomial function to compare the square of this curve. The second order polynomial function is shown in Fig.6.4.2

Fig.6.4.2 describing polynomial function
From this figure, is caculated as following
. (6.4-1)
The square error between and could be written as
, (6.4-2)
where .
From (6.4-2), we can use the first order derivation to find “b” to minimize the error.
(6.4-3)
Now, we can descript the boundary from this polynomial function . In practical

experimentation, for convenience, we take the split approach to perform play the division role in Step one.
7. Conclusions7.1 Segmentation
The segmentation we have discussed here having many focuses. In this section, we focus on the match of physical objects of fast scanning segmentation. From the previous section, we know the result of fast scanning segmentation is not really matching the physical object. In order to improve that, we proposed two approaches based on fast scanning algorithm. An approach is involving morphological operations, its gray scale operations could smooth and blur the image. Therefore, the segmented region would be reduced and the high frequency part could be grouping into one region. Moreover, its binary operations could eliminate the unnecessary links. Alternative approach is finding the relative minimal distance from a pixel with reflex angle to another. A pair pixels among boundaries with minimal distance will be connected, thereby, a region is dividing into two regions. There two approaches improve the ability of matching physical objects, and do not consume a lot of time.
7.2 Boundary Description
There are shape numbers, Fourier descriptor, polynomial descriptors, and so on. In this section, we focus on proposed method. This method comprises of a split processing which dividing a closed boundary into a set of opened sections and a fitting processing to produce a second order polynomial function that represent to objective section. Existing methods usually consider only continuity of boundary even one order, slope, and two order, variation of slope, differentiations. The proposed method have a advantage of minimize the mean square error between objective boundary and fitting function, which guarantees the resultant polynomial function is closest to boundary. Summary, the proposed method uses fewer necessary data to reconstruct boundary, in the same time, the accurate rate keeps high.
Reference
[1] R. Adams and L. Bischof, "Seeded region growing," in IEEE Trans. Pattern Anal. Mach. Intelligence, vol. 16 no.6, pp. 641-647, June 1994.[2] R. Beare and H. Talbot, "Exact seeded region growing for image segmentation," in Proc. DICTA, 5th Bienn. Conf. Aust. Patt. Rec.Soc, pp. 132-137, December 1999.
[3] C. J. Kuo, "A New Compression-Oriented Fast Image Segmentation Technique" Master thesis, National Taiwan University, Taipei, Taiwan, June 2009.[4] Susanta Mukhopadhyay and Bhabatosh Chanda, "Multiscale Morphological Segmentation of Gray-Scale Images," in IEEE Trans. on Image Proc., vol. 12, no. 5, May 2003.[5] Hakan BULU and Adil ALPKOCAK, "Comparison of 3D Segmentation Algorithms for Medical Imaging," in Twentieth IEEE International Symposium on Computer-Based Medical Systems, [6] S. Ilic and B. Ulicny, "Seeded Region Growing Method for Image Segmentation", Assignment for Computer Vision Work Paper Presentation, The Swiss Federal Institute of Technology, 2000.[7] T. Pavlidis and S. L. Horowitz, "Segmentation of Plane Curves" in IEEE Trans. on Computers, C-23 (1974), pp. 860-870. GC:153.[8] J. Sklansky, V. Gonzalez, "Fast polygonal approximation of digitized curves" in Pattern Recognition, 12(5): pp.327-331, 1980.[9] G. M. Schuster and A. K. Katsaggelos, "An Optimal Polygonal Boundary Encoding Scheme in the Rate Distortion Sense" in IEEE Transactions on Image Processing, vol.7, no.1, January 1998.[10] H. Musmann, M. H¨otter, and J. Ostermann, "Object-oriented analysis-synthesis coding of moving images," in Signal Process.: Image Commun., vol. 1, pp. 117–138, Oct. 1989.[11] M. H¨otter, "Object-oriented analysis-synthesis coding based on moving two-dimensional objects" in Signal Process.: Image Commun., vol. 2, pp.409-428, Dec. 1990.[12] G. M. Schuster and A. K. Katsaggelos, "Fast and efficient mode and quantizer selection in the rate distortion sense for H.263" in SPIE Proc. Conf. Visual Communications and Image Processing, pp.784-795, ar. 1996.[13] A. Pikaz and I. Dinstein, "Optimal polygonal Approximation of Digital Curves" in Pattern Recognition, 1995.[14] J. Sklansy, R. L. Chazin and B. J. Hansen, "Minimum Perimeter Polygons of Digitized Silhouettes" in IEEE Trans. Comput., C-21(3), pp.260-268, March 1972.[15] Y. M. Sharaiha and N. Christofides, "An optimal algorithm for the Straight Segmentation Approximation of Digital Arcs" in CVGIP: Graphical Models and Image Processing 55(5), pp. 397-407, September 1993.[16] A. Pikaz, "Processing and recognition of digital planar curves." Master Sc. Thesis, Ben-Gurion University, Israel, in Hebrew, July 1992.[17] T. Pavlidis "Applications of Splines to Shape Descriptions"' in Visual Form: Analysis and Recognition, Plenum Press, pp. 431-441, in New York, 1992.

[18] R. Espelid and I. Jonassen, "A comparison of splitting methods for the identification of corner-points" in Pattern Recognition Letters, 1991.
Related Documents