Disparities in the Food Environments of New York City Public Schools Kathryn M. Neckerman, PhD, Michael D.M. Bader, PhD, Catherine A. Richards, MPH, Marnie Purciel, MPH, MUP, James W. Quinn, MA, Juli Simon Thomas, MA, Caitlin Warbelow, MUP, Christopher C. Weiss, PhD, Gina S. Lovasi, PhD, Andrew Rundle, DrPH Background: Studies of the food environment near schools have focused on fast food. Research is needed that describes patterns of exposure to a broader range of food outlet types and that examines the influence of neighborhood built environments. Purpose: Using data for New York City, this paper describes the prevalence of fıve different food outlet types near schools, examines disparities by economic status and race/ethnicity in access to these food outlets, and evaluates the extent to which these disparities are explained by the built environment surrounding the school. Methods: National chain and local fast-food restaurants, pizzerias, small grocery stores (“bodegas”), and convenience stores within 400 m of public schools in New York City were identifıed by matching 2005 Dun & Bradstreet data to 2006 –2007 school locations. Associations of student poverty and race/ethnicity with food outlet density, adjusted for school level, population density, commercial zoning, and public transit access, were evaluated in 2009 using negative binomial regression. Results: New York City’s public school students have high levels of access to unhealthy food near their schools: 92.9% of students had a bodega within 400 m, and pizzerias (70.6%); convenience stores (48.9%); national chain restaurants (43.2%); and local fast-food restaurants (33.9%) were also prevalent within 400 m. Racial/ethnic minority and low-income students were more likely to attend schools with unhealthy food outlets nearby. Bodegas were the most common source of unhealthy food, with an average of nearly ten bodegas within 400 m, and were more prevalent near schools attended by low-income and racial/ethnic minority students; this was the only association that remained signifıcant after adjustment for school and built-environment characteristics. Conclusions: Nearly all New York City public school students have access to inexpensive, energy- dense foods within a 5-minute walk of school. Low-income and Hispanic students had the highest level of exposure to the food outlets studied here. (Am J Prev Med 2010;39(3):195–202) © 2010 American Journal of Preventive Medicine A lthough the prevalence of child obesity has in- creased in all population groups, low-income, African-American, and Hispanic children face a higher risk of obesity and related health problems than do other children. 1 Differences in children’s food environ- ments may help explain these disparities. Low-income and minority neighborhoods tend to have more fast-food restaurants, convenience stores, and small groceries, and fewer fruit and vegetable markets, bakeries, and health food stores. 2–7 These differences may have implications for children’s food intake. 8 –11 One component of children’s food environment is the food available near their schools. 12,13 Fast-food restau- rants, convenience stores, and other outlets near schools offer inexpensive and energy-dense foods for consump- tion before and after school and at lunch. 14,15 Two recent studies have found that students attending schools with fast-food restaurants nearby were more likely to be obese; another analysis found modest and inconsistent effects of From the Center for Health and the Social Sciences (Neckerman), Univer- sity of Chicago, Chicago, Illinois; Robert Wood Johnson Foundation Health & Society Scholars Program (Bader), University of Pennsylvania, Philadelphia, Pennsylvania; Department of Epidemiology, Mailman School of Public Health (Richards, Lovasi, Rundle) and Institute for Social and Economic Research and Policy (Purciel, Quinn, Thomas, Warbelow, Weiss), Columbia University, New York, New York Address correspondence to: Kathryn M. Neckerman, PhD, Center for Health and the Social Sciences, University of Chicago, 5841 S. Maryland Avenue, MC 1000, Suite M200, Chicago IL 60637. E-mail: [email protected]. 0749-3797/$17.00 doi: 10.1016/j.amepre.2010.05.004 © 2010 American Journal of Preventive Medicine • Published by Elsevier Inc. Am J Prev Med 2010;39(3)195–202 195

Welcome message from author
This document is posted to help you gain knowledge. Please leave a comment to let me know what you think about it! Share it to your friends and learn new things together.
Transcript

Ah
FsHPoEW
HAk
©
Disparities in the Food Environmentsof New York City Public Schools
Kathryn M. Neckerman, PhD, Michael D.M. Bader, PhD,Catherine A. Richards, MPH, Marnie Purciel, MPH, MUP, James W. Quinn, MA,Juli Simon Thomas, MA, Caitlin Warbelow, MUP, Christopher C. Weiss, PhD,
Gina S. Lovasi, PhD, Andrew Rundle, DrPH
Background: Studies of the food environment near schools have focused on fast food. Research isneeded that describes patterns of exposure to a broader range of food outlet types and that examinesthe influence of neighborhood built environments.
Purpose: Using data for New York City, this paper describes the prevalence of fıve different foodoutlet types near schools, examines disparities by economic status and race/ethnicity in access tothese food outlets, and evaluates the extent to which these disparities are explained by the builtenvironment surrounding the school.
Methods: National chainand local fast-foodrestaurants,pizzerias, smallgrocerystores (“bodegas”), andconvenience stores within 400 m of public schools in New York City were identifıed by matching 2005Dun&Bradstreet data to 2006–2007 school locations. Associations of student poverty and race/ethnicitywith food outlet density, adjusted for school level, population density, commercial zoning, and publictransit access, were evaluated in 2009 using negative binomial regression.
Results: New York City’s public school students have high levels of access to unhealthy food neartheir schools: 92.9%of students had a bodegawithin 400m, andpizzerias (70.6%); convenience stores(48.9%); national chain restaurants (43.2%); and local fast-food restaurants (33.9%) were alsoprevalent within 400 m. Racial/ethnic minority and low-income students were more likely to attendschools with unhealthy food outlets nearby. Bodegas were the most common source of unhealthyfood, with an average of nearly ten bodegas within 400 m, and were more prevalent near schoolsattended by low-income and racial/ethnic minority students; this was the only association thatremained signifıcant after adjustment for school and built-environment characteristics.
Conclusions: Nearly all New York City public school students have access to inexpensive, energy-dense foods within a 5-minute walk of school. Low-income and Hispanic students had the highestlevel of exposure to the food outlets studied here.(Am J Prev Med 2010;39(3):195–202) © 2010 American Journal of Preventive Medicine
omarfff
frotsf
lthough the prevalence of child obesity has in-creased in all population groups, low-income,African-American, andHispanic children face a
igher risk of obesity and related health problems than do
rom the Center for Health and the Social Sciences (Neckerman), Univer-ity of Chicago, Chicago, Illinois; Robert Wood Johnson Foundationealth & Society Scholars Program (Bader), University of Pennsylvania,hiladelphia, Pennsylvania;Department of Epidemiology,Mailman Schoolf Public Health (Richards, Lovasi, Rundle) and Institute for Social andconomic Research and Policy (Purciel, Quinn, Thomas, Warbelow,eiss), Columbia University, New York, New YorkAddress correspondence to: Kathryn M. Neckerman, PhD, Center forealth and the Social Sciences, University of Chicago, 5841 S. Marylandvenue, MC 1000, Suite M200, Chicago IL 60637. E-mail:[email protected].
a0749-3797/$17.00doi: 10.1016/j.amepre.2010.05.004
2010 American Journal of Preventive Medicine • Published by El
ther children.1 Differences in children’s food environ-ents may help explain these disparities. Low-incomendminority neighborhoods tend to havemore fast-foodestaurants, convenience stores, and small groceries, andewer fruit and vegetable markets, bakeries, and healthood stores.2–7 These differences may have implicationsor children’s food intake.8–11
One component of children’s food environment is theood available near their schools.12,13 Fast-food restau-ants, convenience stores, and other outlets near schoolsffer inexpensive and energy-dense foods for consump-ion before and after school and at lunch.14,15 Two recenttudies have found that students attending schools withast-food restaurants nearbyweremore likely to be obese;
nother analysis foundmodest and inconsistent effects ofsevier Inc. Am J Prev Med 2010;39(3)195–202 195

fdfsrslaa
sscsolaAmtpaasFsictdretie
tpsncstidBostttpo
chwds
MS
Dc2EAptlfs
wc(w(a
cdagsGCltolds
Suwwlbe
s is
196 Neckerman et al / Am J Prev Med 2010;39(3):195–202
ood outlet density on BMI growth in young chil-ren.16–18 Urban schools are more likely to have fast-ood restaurants nearby; in a national study, 67.5% ofecondary schools in large cities had a fast-food restau-ant within about 800 m.19 There is some evidence thatchools located in low-income neighborhoods or servingow-income students are more likely to be near fast-foodnd convenience stores,19–21 whereas research on racialnd ethnic disparities fınds inconsistent results.19,21
Although research on the food environment nearchools has opened a productive line of inquiry, existingtudies have limitations. Most studies focus on nationalhain fast-food restaurants and convenience stores, butmall grocery stores and other food service and food retailutlets are also important sources of unhealthy food inow-income, urban neighborhoods and have received lessttention in research on food outlets near schools.14,22–24
more comprehensive examination of the food environ-ent will inform research on environmen-
al determinants of childhood obesity andublic policy to promote child health.25 Inddition, little is known about how zoningnd other aspects of the built environmenthape the food environment near schools.26
ood outlets are more prevalent nearchools in areas with higher levels of urban-zation and commercial land use.13,19–21 Be-ause low-income and minority studentsend to live and attend school in more urbanized areas,isparities in the food environment near schools mayeflect socioeconomic and racial differences in the builtnvironments surrounding those schools. Documentinghese relationships can inform public policy by identify-ng potentially modifıable factors that contribute to foodnvironment disparities.Using data for New York City, the present study has
hree objectives. The fırst is to describe the relativerevalence of fıve different types of food outlets nearchools in a densely settled urban area. In addition toational chain fast-food restaurants, the present studyonsidered “local” fast-food, pizzerias, conveniencetores, and “bodegas” or small grocery stores in ordero capture food outlet types common in many low-ncome urban communities. The second objective is toescribe disparities in access to these food outlet types.ecause many students attend school outside theirwn neighborhood, especially at the middle and highchool levels, the study considered disparities based onhe economic status and racial/ethnic composition ofhe school rather than the neighborhood. The third iso evaluate the extent to which food environment dis-arities across racial/ethnic and socioeconomic strata
reComby Nthi
f the student body are explained by built-environment a
haracteristics. The authors hypothesized that schools withigher proportions of low-income and minority studentsill havemoreunhealthy foodoutlets nearby, and that theseifferencesamongschoolswill be reducedafter adjusting forchool-level and built-environment characteristics.
ethodschool Characteristics
ata on public school locations and student composition wereompiled from public sources. A list of public schools open in006–2007 was obtained from the New York City Department ofducation (DOE) website (schools.nyc.gov/Offıces/Financeanddministration/DIIT/OOD/default.htm). After excluding publicreschool programs, the list consisted of 1579 schools including char-er schools and vocational, special education, and high school equiva-ency degree programs, which the DOE identifıed as distinct schoolsor administrative purposes. The DOE website and other Internetources were used to obtain information on school enrollment and
composition. School composition measures in-cluded the proportion of students identifıed asblack,Hispanic, orAsian and theproportion eligi-ble for free lunch, used as a proxy for low-incomestatus. For 70.7% of schools, enrollment andracial/ethnic composition were obtained fromthe Department of Education website (schools.nyc.gov/) and the percentage of students eligiblefor free lunch from schools.nyc.gov/offıces/d_chanc_oper/budget/dbor/allocationmemo/fy06_07/fy07_pdf/sam03.pdf. Several other websites
ere consulted to fıll inmissing informationon enrollment or studentomposition: nces.ed.gov/ (28.0%of schools);www.schooldigger.com11.4%); www.city-data.com (8.3%); www.insideschools.org (7.0%);ww.schoolmatters.com (3.9%); and www.publicschoolreview.com0.9%), in some cases drawing information frommultiplewebsites forsingle school.Of the 1579 schools, 699 shared a location (a building or
ampus) with another school, with up to eight administrativelyistinct schools per location. In the present study, the unit ofnalysis is the school location; enrollment and student demo-raphics were aggregated for all students attending school at theame location. Each school was geocoded to a tax lot usingeoSupport (software published by the NYC Department ofity Planning), and schools or programs sharing the same taxot were identifıed. The resulting aggregated data set included aotal of 1135 school locations, of which 1089 had complete datan enrollment and student characteristics for all schools at thatocation. Dichotomous variables indicated enrollment of mid-le or high school students. Hereafter, “school” will refer to allchools and programs sharing a single location.
chool neighborhood. School neighborhoods were defınedsing 400- and 800-m network buffers around each school. Net-ork buffers use the street network (removing limited-access high-ays) as the organizing geography and represent the accessibility ofocations to pedestrians traveling along the street. To construct theuffers, all points on the street network that were n distance fromach point of entrance to each school were joined together to create
eedntarytle insue.
Selatmees
n irregularly shaped polygon.
www.ajpm-online.net
csrocbpmesi
Flrrnblcmfi((
NsnCmsYplf
S
Ndpcaagso
F od b
Neckerman et al / Am J Prev Med 2010;39(3):195–202 197
S
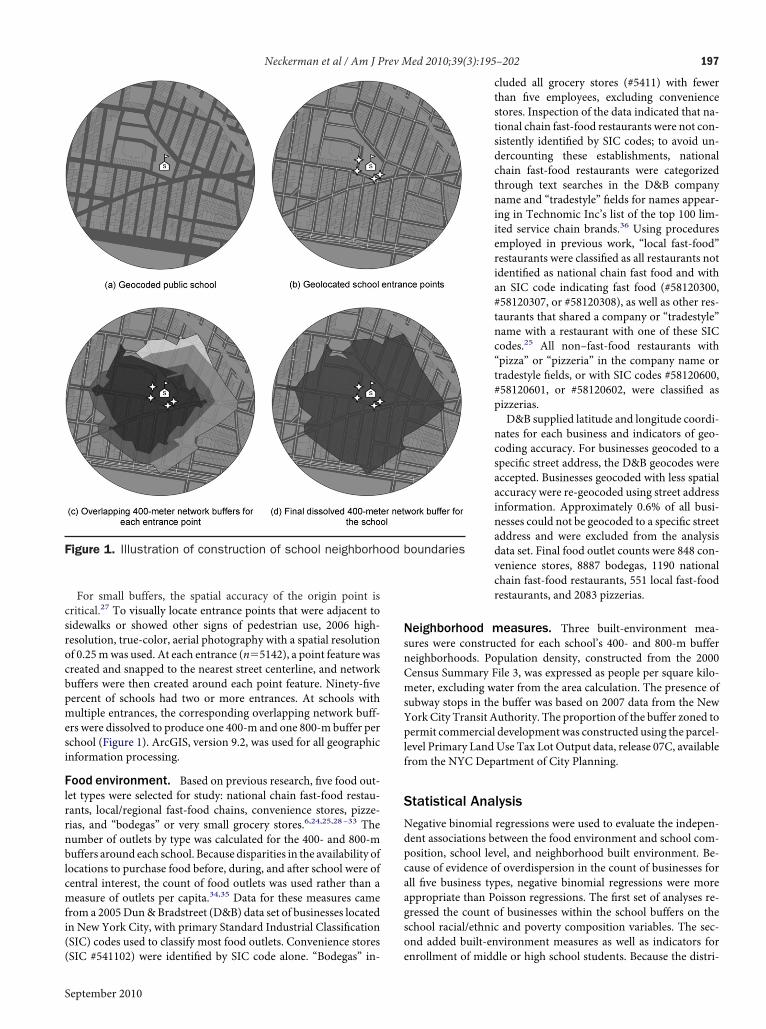
For small buffers, the spatial accuracy of the origin point isritical.27 To visually locate entrance points that were adjacent toidewalks or showed other signs of pedestrian use, 2006 high-esolution, true-color, aerial photography with a spatial resolutionf 0.25mwas used. At each entrance (n�5142), a point feature wasreated and snapped to the nearest street centerline, and networkuffers were then created around each point feature. Ninety-fıveercent of schools had two or more entrances. At schools withultiple entrances, the corresponding overlapping network buff-rs were dissolved to produce one 400-m and one 800-m buffer perchool (Figure 1). ArcGIS, version 9.2, was used for all geographicnformation processing.
ood environment. Based on previous research, fıve food out-et types were selected for study: national chain fast-food restau-ants, local/regional fast-food chains, convenience stores, pizze-ias, and “bodegas” or very small grocery stores.6,24,25,28–33 Theumber of outlets by type was calculated for the 400- and 800-muffers around each school. Because disparities in the availability ofocations to purchase food before, during, and after school were ofentral interest, the count of food outlets was used rather than aeasure of outlets per capita.34,35 Data for these measures came
rom a 2005Dun&Bradstreet (D&B) data set of businesses locatedn New York City, with primary Standard Industrial ClassifıcationSIC) codes used to classify most food outlets. Convenience stores
igure 1. Illustration of construction of school neighborho
SIC #541102) were identifıed by SIC code alone. “Bodegas” in- e
eptember 2010
cluded all grocery stores (#5411) with fewerthan fıve employees, excluding conveniencestores. Inspection of the data indicated that na-tional chain fast-food restaurants were not con-sistently identifıed by SIC codes; to avoid un-dercounting these establishments, nationalchain fast-food restaurants were categorizedthrough text searches in the D&B companyname and “tradestyle” fıelds for names appear-ing in Technomic Inc’s list of the top 100 lim-ited service chain brands.36 Using proceduresemployed in previous work, “local fast-food”restaurants were classifıed as all restaurants notidentifıed as national chain fast food and withan SIC code indicating fast food (#58120300,#58120307, or #58120308), as well as other res-taurants that shared a company or “tradestyle”name with a restaurant with one of these SICcodes.25 All non–fast-food restaurants with“pizza” or “pizzeria” in the company name ortradestyle fıelds, or with SIC codes #58120600,#58120601, or #58120602, were classifıed aspizzerias.D&B supplied latitude and longitude coordi-
nates for each business and indicators of geo-coding accuracy. For businesses geocoded to aspecifıc street address, the D&B geocodes wereaccepted. Businesses geocoded with less spatialaccuracy were re-geocoded using street addressinformation. Approximately 0.6% of all busi-nesses could not be geocoded to a specifıc streetaddress and were excluded from the analysisdata set. Final food outlet counts were 848 con-venience stores, 8887 bodegas, 1190 nationalchain fast-food restaurants, 551 local fast-foodrestaurants, and 2083 pizzerias.
eighborhood measures. Three built-environment mea-ures were constructed for each school’s 400- and 800-m buffereighborhoods. Population density, constructed from the 2000ensus Summary File 3, was expressed as people per square kilo-eter, excluding water from the area calculation. The presence ofubway stops in the buffer was based on 2007 data from the Nework City Transit Authority. The proportion of the buffer zoned toermit commercial development was constructed using the parcel-evel Primary LandUse Tax Lot Output data, release 07C, availablerom the NYC Department of City Planning.
tatistical Analysis
egative binomial regressions were used to evaluate the indepen-ent associations between the food environment and school com-osition, school level, and neighborhood built environment. Be-ause of evidence of overdispersion in the count of businesses forll fıve business types, negative binomial regressions were moreppropriate than Poisson regressions. The fırst set of analyses re-ressed the count of businesses within the school buffers on thechool racial/ethnic and poverty composition variables. The sec-nd added built-environment measures as well as indicators for
oundaries
nrollment of middle or high school students. Because the distri-

bzctauti
RTmssMsh
pow
44l8rmhnpt
soasatwtsltiion
bww
Ts
Tc(
a
198 Neckerman et al / Am J Prev Med 2010;39(3):195–202
utions of population density and percentage of commerciallyoned land were skewed, the natural log of each was used. Out-omes were weighted by the student population of the school; thus,he rate ratios reported here represent the associations for theverage New York City public school student. Robust SEs weresed to calculate CIs, adjusting the errors to account for the clus-ering of students within each school. All analyses were conductedn 2009 using Stata, version 10.0.
esultsable 1 reports the sociodemographic and built environ-ent characteristics of the schools included in the analy-is. As these fıgures indicate, the New York City publicchools serve a largely poor and minority population.ost school neighborhoods have a high population den-
ity, include some land zoned for commercial use, andave a subway stop nearby.The prevalence of the fıve types of food outlets is dis-layed in Table 2. Bodegas were the most common foodutlets near schools; 92% of schools had at least one
able 1. Sociodemographic and built-environmentharacteristics of schools included in the analysisN�1089)
Characteristics M Median
Student composition (%)
Black 34.56 26.39
Hispanic 38.47 32.70
Asian 12.21 3.84
White 14.31 3.24
Low-income 66.34 72.10
School levela (% of schools)
Elementary 69.05 —
Middle 36.00 —
High school 25.53 —
Characteristics of 400-m bufferneighborhood
Population density (10,000s per km2) 2.025 1.764
Land zoned for commercial use (%) 13.38 11.19
Subway station present (% of schools) 34.16 —
Characteristics of 800-m bufferneighborhood
Population density (10,000s per km2) 1.950 1.767
Land zoned for commercial use (%) 13.43 11.77
Subway station present (% of schools) 65.47 —
Mean percentages sum to more than 100% because some schoolsinclude students of more than one level.
ithin 400 m. Most schools also had a pizzeria within
00 m. Schools had an average of 9.7 bodegas within00m;mean counts of other food outlet types weremuchower. Prevalence and count measures were higher for00-m than for 400-m buffer neighborhoods, but theanking of food outlet types was identical. Figures forinimum distance to each outlet type also indicate veryigh levels of accessibility. The mean distance to theearest bodega was 211 m, compared with 376 m forizzerias, 568 m for convenience stores, 596 m for na-ional chain fast food, and 760 m for local fast food.Table 3 presents student-level food environment mea-
ures for the 400-m neighborhoods; school-level countsf students in each sociodemographic category were cre-ted from the school composition measures thenummed across all schools to develop citywide percent-ges of students in each sociodemographic category at-ending a school with a particular type of food outletithin 400 m. Hispanic students had more access to eachype of food outlet within 400 m of their school; blacktudents also had high levels of access to these food out-ets, whereaswhite students had the lowest levels of accesso most food outlet types. There was no difference byncome in access to national chain fast food, but low-ncome students were more likely to have access to thether types of food outlets. Results for the 800-m buffers,ot shown, were similar.Tables 4 and 5 present results of school-level negativeinomial regressions predicting the counts of foodoutletsithin 400 m. (Results for the 800-m buffers, not shown,ere similar.) The fırst models included only the school
able 2. Food environment within 400 m and 800 m ofchools
Food environment
Schools withany food
outlet (%)
Meannumber
of outlets
400-m neighborhoods
National chain fast food 41.6 0.97
Local fast food 34.3 0.53
Convenience stores 49.0 0.83
Pizzerias 70.7 1.87
Bodegas 92.3 9.73
800-m neighborhoods
National chain fast food 80.0 3.72
Local fast food 71.0 1.88
Convenience stores 85.0 2.98
Pizzerias 94.9 6.60
Bodegas 99.3 33.37
www.ajpm-online.net

rptp(hfcsowsfes
oesfbwhcc
iiwsattls
sls4Lenpcocatsaipwhw
sdosoncaaaf
T4
0.5
Neckerman et al / Am J Prev Med 2010;39(3):195–202 199
S
acial/ethnic and income composition measures, ex-ressed in deciles. Therefore, the relative rates representhe predicted change in outcome associated with a 10–ercentage point increase in the composition measuresee Table 4). Schools with more low-income studentsad more bodegas and convenience stores but slightlyewer national chain fast-food restaurants. Net of incomeomposition, the proportion of Hispanic students inchools was associated with higher counts of all fıve foodutlet types. The proportions of black andAsian studentsere both associated with higher counts of bodegas;chools with high proportions of black students also hadewer pizzerias. As these results indicate, student race/thnicity and income composition had independent andignifıcant associations with the counts of bodegas.The second set ofmodels added indicators for presencef middle or high school students as well as the built-nvironment measures (Table 5). Schools enrolling highchool students had signifıcantly more national chainast-food restaurants andmore pizzerias. In addition, theuilt-environment measures had strong associationsith food outlet density: schools located in neighbor-oods with higher population density, more commer-ially zoned land, and more subway stops had signifı-antly higher counts of nearly all food outlet types.After adjustment for school-level and built-environment
ndicators, most associations of school race/ethnicity andncome composition with counts of food outlets becameeaker andmanywereno longer signifıcant, suggesting thatchool-level and built-environment characteristics partiallyccount for the associationbetween school composition andhe food environment near schools. The associations be-ween the proportions of Asian, black, Hispanic, andow-income students and counts of bodegas remained
able 3. Percentage of students attending school with ea00 m
CharacteristicsNational chain
fast foodLocal fast
foodConve
st
All students 43.2 33.9 4
Race/ethnicity
Black 42.4 32.9 4
Hispanic 46.2 39.1 5
Asian 42.6 30.9 4
White 37.3 25.4 3
Poverty status
Low-income 43.2 36.3 5
Not low-income 43.1 29.8 4
ignifıcant even after adjustment for school level and built l
eptember 2010
environment. However,the proportion of His-panic students was nolonger signifıcantly asso-ciated with proximity toother outlet types.
DiscussionThe present study fındsthat nearly all New YorkCity public school studentshave access to inexpensive,energy-dense foods withina 5-minute walk of theirschools. Although somestudies have focused onfast-food restaurants andconvenience stores near
chools, small grocery stores or bodegas were themost preva-ent among the fıve food outlet types studied. The averagechool had almost ten bodegas or small grocery stores within00 m, with the nearest bodega an average of 211 m away.ow-income and Hispanic students had the highest level ofxposure to most food outlets studied here. School-level andeighborhood built-environment characteristics, includingopulation density, commercial zoning, and public transit ac-ess, explained some ethnic and income differences in foodutlet access. However, Hispanic, black, Asian, and low-in-ome students hadhigher levels of access to bodegas even afterdjustment for school level andbuilt-environmentcharacteris-ics. The fındings about food environment disparities are con-istentwithmost previous studies of food outlets near schools,nd for themost part parallel racial/ethnic and incomedispar-ties in body size in New York City, where low-income, His-anic, and black children have a higher prevalence of over-eight and obesity. Asian children are the exception, withigher levels of access to bodegas but low prevalences of over-eight andobesity.37
Strengths of the current study include spatially precisepecifıcation of school neighborhoods, use of networkistances, inclusion of data on zoning and other featuresf the built environment, and adjustment for clustering oftudents within school.26 Limitations of the study includemission of some inexpensive take-out restaurants (thoseot identifıed as pizzerias or as national or local fast-foodhains) and of sidewalk stands and mobile food carts. Inddition, no data were available on open-campus policiesllowing children to eat lunch off campus; these policiesre set by individual schools. The study is based on dataor New York City, where the density of food outlets is
ype of food outlet within
cePizzeria Bodega
70.6 92.9
64.1 93.9
78.8 96.4
68.9 90.9
65.0 83.0
73.3 95.3
66.0 88.6
ch t
nienore
8.9
7.6
7.5
1.1
6.3
3.8
ikely to be relatively high. Lastly, the current study does

Table 4. Incidence rate ratios (95% CIs) of outlets within 400 m of school
Characteristics National chain fast food Local fast-food restaurants Convenience stores Pizzerias Bodegas
Ethnicity (%)
Black 1.04 (0.956, 1.132) 1.064 (0.976, 1.159) 1.035 (0.962, 1.113) 0.938* (0.890, 0.990) 1.087*** (1.038, 1.138)
Hispanic 1.175** (1.051, 1.312) 1.150** (1.040, 1.271) 1.150*** (1.061, 1.246) 1.107*** (1.042, 1.176) 1.199*** (1.141, 1.259)
Asian 1.023 (0.915, 1.144) 1.121 (0.971, 1.295) 1.048 (0.951, 1.155) 0.998 (0.922, 1.082) 1.141*** (1.063, 1.223)
Low-income (%) 0.903* (0.832, 0.980) 1.007 (0.921, 1.102) 1.108* (1.023, 1.199) 0.98 (0.930, 1.033) 1.084*** (1.044, 1.125)
Note: Student composition measures are expressed in deciles. Boldface indicates significance.*p�0.05, **p�0.01, ***p�0.001
Table 5. Incidence rate ratios (95% CIs) of outlets within 400 m of school, adjusted for school level and built environment
Characteristics National chain fast food Local fast-food restaurants Convenience stores Pizzerias Bodegas
Ethnicity (%)
Black 0.95 (0.876, 1.030) 1.002 (0.918, 1.094) 1.013 (0.938, 1.094) 0.874*** (0.836, 0.914) 1.056** (1.020, 1.093)
Hispanic 1.014 (0.925, 1.111) 0.998 (0.908, 1.096) 1.071 (0.985, 1.165) 0.973 (0.927, 1.021) 1.092*** (1.050, 1.136)
Asian 0.956 (0.869, 1.050) 1.044 (0.924, 1.180) 1.028 (0.934, 1.131) 0.946 (0.894, 1.002) 1.105*** (1.055, 1.156)
Low-income (%) 0.932 (0.863, 1.007) 0.99 (0.910, 1.078) 1.059 (0.979, 1.145) 0.984 (0.943, 1.028) 1.037* (1.006, 1.068)
School
Middle 0.885 (0.723, 1.082) 0.866 (0.702, 1.070) 0.989 (0.821, 1.192) 0.974 (0.859, 1.105) 0.959 (0.886, 1.037)
High school 1.442** (1.141, 1.822) 1.179 (0.913, 1.523) 0.943 (0.739, 1.203) 1.253** (1.074, 1.461) 1.024 (0.933, 1.125)
Ln population density 0.981 (0.818, 1.176) 1.804*** (1.442, 2.255) 1.515** (1.175, 1.954) 1.363*** (1.206, 1.541) 1.887*** (1.741, 2.046)
Ln % commercially zoned 1.885*** (1.620, 2.195) 1.607*** (1.276, 2.025) 1.191*** (1.105, 1.284) 1.437*** (1.317, 1.568) 1.224*** (1.168, 1.283)
Subway station present 1.575*** (1.268, 1.957) 1.680*** (1.333, 2.119) 1.265* (1.036, 1.545) 1.451*** (1.265, 1.664) 1.378*** (1.265, 1.501)
Note: Student composition measures are expressed in deciles. Boldface indicates significance.*p�0.05, **p�0.01, ***p�0.001
200Neckerm
anetal/A
mJPrev
Med
2010;39(3):195–202
www.ajpm
-online.net

ne
sasnnmescmtcatlsah
saiacfiaafnavacisln
TFEN
o
R
1
1
1
1
1
1
1
1
1
1
2
2
2
2
Neckerman et al / Am J Prev Med 2010;39(3):195–202 201
S
ot examine effects on dietary intake or BMI of the foodnvironment near schools.The current study has two main implications for re-
earch. First, future studies of the food environmentround schools should include small grocery stores. Suchtores were the most common source of unhealthy foodear New York City schools. While more research iseeded to characterize their nutritional environ-ent,24,32 it is apparent that small grocery stores offernergy-dense food at very inexpensive prices; a recenttudy in Philadelphia found that schoolchildren visitingorner stores bought an average of 356 calories for littleore than $1.14 Second, future research on environmen-
al influences on childhood obesity should take into ac-ount the association between neighborhood walkabilitynd access to unhealthy food. Neighborhood characteris-ics such as population density, transit access, and mixedand use are believed to promote physical activity,38,39 buttudents attending schools in walkable neighborhoodslso have high levels of exposure to inexpensive and un-ealthy food.As the present study suggests, a comprehensive under-
tanding of the food environment is critical for policiesimed at promoting healthy eating among children. Fornstance, zoning to limit fast food has gained attention asstrategy to improve students’ food environment; theity of Detroit prohibits fast-food restaurants within 500eet (152.4 m) of a school.40 Such a law would have littlempact in New York City, however, because few schoolsrewithin 500 feet of a national chain fast-food restaurantnd because other types of food outlets supply unhealthyoodnear schools. Itmay bemore effective to improve theutritional quality in existing food outlets, for instance bydding more healthy choices such as baked chips, indi-idual portions of fruits and vegetables, and diet bever-ges and using pricing or in-store displays to promoteonsumption of healthy items. In addition, calorie label-ng and school-based nutrition education may promotetudents’ awareness of healthy eating, and closed-campusunch policies would reduce access to unhealthy foodear school.14,41
his study was supported by Robert Wood Johnsonoundation Active Living Research Grant #65762, “Builtnvironment and Childhood Fitness and Overweight inew York City,” PI: Andrew Rundle.No fınancial disclosures were reported by the authorsf this paper.
eptember 2010
eferences1. OgdenCL, Flegal KM,CarrollMD, JohnsonCL. Prevalence and trends
in overweight among U.S. children and adolescents, 1999–2000.JAMA 2002;288(14):1728–32.
2. Moore LV, Diez Roux AV. Associations of neighborhood characteris-tics with the location and type of food stores. Am J Public Health2006;96(2):325–31.
3. Alwitt LF, Donley TD. Retail stores in poor urban neighborhoods. JConsum Aff 1997;31(1):139–64.
4. Block JP, Scribner RA, DeSalvo KB. Fast food, race/ethnicity, andincome—a geographic analysis. Am J Prev Med 2004;27(3):211–7.
5. Dunkley B, Helling A, Sawicki DS. Accessibility versus scale—examin-ing the tradeoffs in grocery stores. J Plann Educ Res 2004;23(4):387–401.
6. Morland K, Filomena S. Disparities in the availability of fruits andvegetables between racially segregated urban neighborhoods. PublicHealth Nutr 2007;10(12):1481–9.
7. Lovasi GS, Hutson MA, Guerra M, Neckerman KM. Built environ-ments and obesity in disadvantaged populations. Epidemiol Rev2009;31:7–20.
8. Bodor JN, Rose D, Farley TA, Swalm C, Scott SK. Neighborhood fruitand vegetable availability and consumption: the role of small foodstores in an urban environment. Public Health Nutr 2008;11:413–20.
9. Timperio A, Ball K, Roberts R, Campbell K, Andrianopoulos N, Craw-ford D. Children’s fruit and vegetable intake: associations with theneighborhood food environment. Prev Med 2008;46(4):331–5.
0. Jago R, Baranowski T, Baranowski J, Cullen K, Thompson D. Distanceto food stores and adolescent male fruit and vegetable consumption:mediation effects. Int J Behav Nutr Phys Act 2007;4(1):35.
1. Powell LM, Bao Y. Food prices, access to food outlets and child weight.Econ Hum Biol 2009;7(1):64–72.
2. Story M. The Third School Nutrition Dietary Assessment Study: fınd-ings and policy implications for improving the health of U.S. children.J Am Diet Assoc 2009;109(2S1):S7–13.
3. Austin SB, Melly SJ, Sanchez BN, Patel A, Buka S, Gortmaker SL.Clustering of fast-food restaurants around schools: a novel applicationof spatial statistics to the study of food environments. Am J PublicHealth 2005;95(9):1575–81.
4. Borradaile KE, Sherman S, Vander Veur SS, et al. Snacking in children:the role of urban corner stores. Pediatrics 2009;124(5):1293–8.
5. Kipke MD, Iverson E, Moore D, et al. Food and park environments:neighborhood-level risks for childhood obesity in east Los Angeles. JAdolesc Health 2007;40(4):325–33.
6. Currie J, DellaVigna S, Moretti E, Pathania V. The effect of fast foodrestaurants on obesity. In: NBER Working Papers. Cambridge MA:National Bureau of Economic Research, 2009.
7. Davis B, Carpenter C. Proximity of fast-food restaurants to schools andadolescent obesity. Am J Public Health 2009;99(3):505–10.
8. Sturm R, Datar A. Body mass index in elementary school children,metropolitan area food prices and food outlet density. Public Health2005;119(12):1059–68.
9. Zenk SN, Powell LM. U.S. secondary schools and food outlets. HealthPlace 2008;14(2):336–46.
0. SimonPA,KwanD,AngelescuA, ShihM, Fielding JE. Proximity of fastfood restaurants to schools: do neighborhood income and type ofschool matter? Prev Med 2008;47(3):284–8.
1. SturmR. Disparities in the food environment surroundingU.S. middleand high schools. Public Health 2008;122(7):681–90.
2. Graham R, Kaufman L, Novoa Z, Karpati A. Eating in, eating out,eating well: access to healthy food inNorth and Central Brooklyn. NewYork NY: New York City Department of Health and Mental Hygiene,2006.
3. Gittelsohn J, Franceschini MCT, Rasooly IR, et al. Understanding thefood environment in a low-income urban setting: implications for food
store interventions. J Hunger Environ Nutr 2008;2(2):33–50.
2
2
2
2
2
2
3
3
3
3
3
3
3
3
3
3
4
4
202 Neckerman et al / Am J Prev Med 2010;39(3):195–202
4. Laska MN, Borradaile KE, Tester J, Foster GD, Gittelsohn J. Healthyfood availability in small urban food stores: a comparison of four U.S.cities. Public Health Nutr 2010;13(7):1031–5.
5. Rundle A, Neckerman KM, Freeman L, et al. Neighborhood foodenvironment and walkability predict obesity in New York City. Envi-ron Health Perspect 2009;117(3):442–7.
6. Spielman S. Appropriate use of the K function in urban environments.Am J Public Health 2006;96(2):205.
7. Zandbergen PA, Green JW. Error and bias in determining exposurepotential of children at school locations using proximity-based GIStechniques. Environ Health Perspect 2007;115(9):1363–70.
8. Franco M, Diez Roux AV, Glass TA, Caballero B, Brancati FL. Neigh-borhood characteristics and availability of healthy foods in Baltimore.Am J Prev Med 2008;35(6):561–7.
9. Kaufman L, Karpati A. Understanding the sociocultural roots of child-hood obesity: food practices among Latino families of Bushwick,Brooklyn. Soc Sci Med 2007;64(11):2177–88.
0. Block D, Kouba J. A comparison of the availability and affordability ofamarket basket in two communities in the Chicago area. Public HealthNutr 2006;9(7):837–45.
1. Neckerman KM, Bader M, Purciel M, Yousefzadeh P. Measuring foodaccess in urban areas. Ann Arbor MI: National Poverty Center Work-ing Paper, 2009.
2. Farley T, Rice J, Bodor J, Cohen D, Bluthenthal R, Rose D. Measuringthe food environment: shelf space of fruits, vegetables, and snack foods
in stores. J3. Horowitz CR, Colson KA, Hebert PL, Lancaster K. Barriers to buyinghealthy foods for people with diabetes: evidence of environmentaldisparities. Am J Public Health 2004;94(9):1549–54.
4. Glanz K. Measuring food environments: a historical perspective. Am JPrev Med 2009;36(4S 1):S93–8.
5. Papas MA, Alberg AJ, Ewing R, Helzlsouer KJ, Gary TL, KlassenAC. The built environment and obesity. Epidemiol Rev 2007;29:129–43.
6. Technomic Inc. Sales and % change for top 100 restaurants. www.technomic.com/facts/Top100_page1.html.
7. Thorpe LE, List DG, Marx T, May L, Helgerson SD, Frieden TR.Childhood obesity in New York City elementary school students. Am JPublic Health 2004;94(9):1496–500.
8. Frank L, Sallis JF, Conway JM, Chapman JE, Saelens BE, BachmanW.Many pathways from land use to health: associations between neigh-borhood walkability and active transportation, body mass index, andair quality. J Am Plann Assoc 2006;72(1):75–87.
9. Frank LD, Kerr J, Chapman JE, Sallis JF. Urban form relationships withwalk trip frequency and distance among youth. Am J Health Promot2007;21(4S):305.
0. Mair JS, Pierce MW, Teret SP. The city planners guide to the obesityepidemic: zoning and fast food. Washington DC: Center for Law andthe Public’s Health at Georgetown and Johns Hopkins Universities,2005.
1. FlournoyR,Treuhaft S.Healthy food, healthy communities: improvingaccess and opportunities through food retail. Oakland CA: PolicyLink,
Urban Health 2009;86(5):672–82. 2005.
Did you know?AJPM launched a new Video Pubcast program.
Visit www.ajpm-online.net to watch the latest video pubcast!
www.ajpm-online.net
Related Documents