PhD Dissertation International Doctorate School in Information and Communication Technologies DISI - University of Trento Risk-based vulnerability management Exploiting the economic nature of the attacker to build sound and measurable vulnerability mitigation strategies Luca Allodi Advisor: Prof. Fabio Massacci Universit` a degli Studi di Trento Committee: Prof. Julian Williams University of Durham Prof. Radu Sion Stony Brook University Prof. Bruno Crispo Universit` a degli Studi di Trento April 2015

Welcome message from author
This document is posted to help you gain knowledge. Please leave a comment to let me know what you think about it! Share it to your friends and learn new things together.
Transcript

PhD Dissertation
International Doctorate School in Information andCommunication Technologies
DISI - University of Trento
Risk-based vulnerability managementExploiting the economic nature of the attacker to build sound and
measurable vulnerability mitigation strategies
Luca Allodi
Advisor:Prof. Fabio MassacciUniversita degli Studi di Trento
Committee:Prof. Julian WilliamsUniversity of Durham
Prof. Radu SionStony Brook University
Prof. Bruno CrispoUniversita degli Studi di Trento
April 2015


Pursuing this PhD work and writing this Thesis wouldn’t have been possible with-out the priceless help and support of many around me including family, friends, andcolleagues. Among many, I especially thank my father Adriano for his silent, but uncon-ditional support; my mother Maria Giovanna for her very verbose, but still unconditional,support and encouragement; my brother Alessandro, because profound esteem goes wellbeyond academic milestones; my Кукуруза, because love motivates everything; and myPhD supervisor, Prof. Fabio Massacci, for his endless and patient scientific support andguidance. Finally, I want to thank this Thesis’ committee for their helpful feedback andcomments, that all contributed in making this work a better one.
Thank you all.
3


“The pride of youth is still upon you; late have youbecome young: but he who would become a childmust surmount even his youth.” [..] And therewas spoken to me for the last time: “O Zarathustra,your fruits are ripe, but you are not ripe for your fruits!”
Friedrich Nietzsche.Thus Spoke Zarathustra, Pt. 2 (22) The Stillest Hour.
5


Abstract
Vulnerability bulletins and feeds report hundreds of vulnerabilities a monththat a system administrator or a Chief Information Officer working for anorganisation has to take care of. Because of the load of work, vulnerabilityprioritisation is a must in any complex-enough organisation. Currently, theindustry employs the Common Vulnerability Scoring System (CVSS in short)as a metric to prioritise vulnerability risk. However, the CVSS base scoreis a technical measure of severity, not of risk. By using a severity measureto estimate risk, current practices assume that every vulnerability is charac-terised by the same exploitation likelihood, and that vulnerability risk canbe assessed through a technical analysis of the vulnerability.
In this Thesis we argue that this is not the case, and that the economicforces that drive the attacker are a key factor in understanding vulnerabilityrisk. In particular, we argue that attacker’s rationality and the economicinfrastructure supporting cybercrime’s activities play a major role in deter-mining which vulnerabilities will the attackers massively exploit, and there-fore which vulnerabilities will represent a (substantially higher than the rest)risk. Our ultimate goal is to show that ‘risk-based’ vulnerability manage-ment policies, as opposed to currently employed ‘criticality-based’ ones, arepossible and can outperform current practices in terms of patching efficiencywithout losing in effectiveness (i.e. reduction of risk in the wild).
To this aim we perform an extensive data-collection work on vulnerabil-ities, proof-of-concept exploits, exploits traded in the cybercrime markets,
7

and exploits detected in the wild. We further collaborated with Symantecto collect actual records of attacks in the wild delivered against about 1Mmachines worldwide. A good part of our data-collection efforts has been alsodedicated in infiltrating and analysing the cybercrime markets.
We used this data collection to evaluate two ‘running hypotheses’ un-derlying our main thesis: vulnerability risk is influenced by the attacker’srationality, and the underground markets are credible sources of risk thatprovide technically proficient attack tools, are mature and sound from aneconomic perspective. We then put this in practice and evaluate the effec-tiveness of criticality-based and risk-based vulnerability management policies(based on the aforementioned findings) in mitigating real attacks in the wild.We compare the policies in terms of the ‘risk reduction’ they entail, i.e. thegap between ‘risk’ addressed by the policy and residual risk. Our resultsshow that risk-based policies entail a significantly higher risk reduction thancriticality-based ones, and thwart the majority of risk in the wild by ad-dressing only a small fraction of the patching work prescribed by currentpractices.
KeywordsVulnerability Management, Attacker model, Attacker Economics
8
Contents
1 Introduction 3
1.1 Risk Management and the Inefficiency Problem . . . . . . . . 51.2 Research Problem . . . . . . . . . . . . . . . . . . . . . . . . 81.3 Thesis Contribution . . . . . . . . . . . . . . . . . . . . . . . 91.4 Thesis Outline . . . . . . . . . . . . . . . . . . . . . . . . . . 10
2 Reserach Objectives and Methods 13
2.1 Are Risk-based Policies Possible? . . . . . . . . . . . . . . . . 132.2 The attacker is rational and work-averse . . . . . . . . . . . . 162.3 The underground is a sustainable market economy . . . . . . 19
2.3.1 Proposition 1: The underground markets are mature . 202.3.2 Proposition 2: The technology traded in the under-
ground is effective . . . . . . . . . . . . . . . . . . . . 262.4 Risk-based Policies are Possible . . . . . . . . . . . . . . . . . 272.5 Research methodology and scope of work . . . . . . . . . . . 30
3 Measuring Vulnerabilities, Exploits, and Attackers 35
3.1 Software Vulnerabilities and Measures . . . . . . . . . . . . . 353.1.1 The Common Vulnerability Scoring System . . . . . . 363.1.2 Vulnerability and patch management . . . . . . . . . . 38
3.2 Security Actors and Threats . . . . . . . . . . . . . . . . . . 403.3 Markets for Vulnerabilities . . . . . . . . . . . . . . . . . . . 42
i

3.4 Attacker model and risk . . . . . . . . . . . . . . . . . . . . . 45
4 Data Collection 47
4.1 Vulnerabilities and Attacks in the Wild . . . . . . . . . . . . 474.2 The Underground Markets . . . . . . . . . . . . . . . . . . . 51
4.2.1 Markets description . . . . . . . . . . . . . . . . . . . 524.2.2 Infiltrating HackMarket.ru . . . . . . . . . . . . . . . . 54
5 Data Exploration 57
5.1 A Map of Vulnerabilities . . . . . . . . . . . . . . . . . . . . 575.1.1 CVSS score breakdown . . . . . . . . . . . . . . . . . 58
5.2 The Heavy Tails of Vulnerability Exploitation . . . . . . . . . 63
6 On the Feasibility of Risk-based Vulnerability Management 69
6.1 The Attacker is Rational and Work-Averse . . . . . . . . . . . 716.1.1 Data preparation . . . . . . . . . . . . . . . . . . . . 736.1.2 Analysis . . . . . . . . . . . . . . . . . . . . . . . . . 756.1.3 Robustness check . . . . . . . . . . . . . . . . . . . . 826.1.4 Discussion . . . . . . . . . . . . . . . . . . . . . . . . 83
6.2 The Underground is a Sustainable Market Economy . . . . . 866.2.1 The Underground Markets are Mature . . . . . . . . . 866.2.2 The Technology Traded in the Underground is Effective 1076.2.3 The Markets are Sustainable . . . . . . . . . . . . . . 121
7 Risk-based Policies for Vulnerability Management 139
7.1 Risk-based vs Criticality-based Policies . . . . . . . . . . . . 1407.2 Randomized Case-Control Study . . . . . . . . . . . . . . . . 141
7.2.1 Experiment run . . . . . . . . . . . . . . . . . . . . . 1467.2.2 Parameters of the analysis . . . . . . . . . . . . . . . 1487.2.3 Results . . . . . . . . . . . . . . . . . . . . . . . . . . 149
ii

7.3 Effectiveness of Risk-Based Policies . . . . . . . . . . . . . . 1537.3.1 Potential of Attack (pA) . . . . . . . . . . . . . . . . 1547.3.2 Quantification of patching workloads and pA reduction 155
7.4 Discussion . . . . . . . . . . . . . . . . . . . . . . . . . . . . 157
8 Limitations and Future Work Directions 1598.1 Limitations and Extensions . . . . . . . . . . . . . . . . . . . 1598.2 Future Research Venues . . . . . . . . . . . . . . . . . . . . . 161
9 Conclusion 165
Bibliography 167
iii


List of Tables
2.1 Summary of running hypotheses and hypothesis testing in thisThesis. . . . . . . . . . . . . . . . . . . . . . . . . . . . . . . 29
3.1 Summary table of CVSS base score metrics and submetrics. . 38
4.1 Summary of our datasets . . . . . . . . . . . . . . . . . . . . 51
4.2 Summary of data and collection methodologies. . . . . . . . . 56
5.1 Incidence of values of CIA triad within NVD. . . . . . . . . . 61
5.2 Combinations of Confidentiality and Integrity values per dataset.. . . . . . . . . . . . . . . . . . . . . . . . . . . . . . . . . . 62
5.3 Exploitability Subfactors for each dataset. . . . . . . . . . . . 62
5.4 Categories for vulnerability classification and respective num-ber of vulnerabilities and attacks recorded in WINE. . . . . . 63
5.5 p% of vulnerabilities responsible for L(p)% of attacks, re-ported by software category. . . . . . . . . . . . . . . . . . . 66
6.1 Excerpt from our dataset. CVE-IDs are obfuscated as a, b,c, etc. Each <1st attack, 2nd attack, delta> tuple isunique in the dataset. The column Affected machines re-ports the number of unique machines receiving the second at-tack delta days after 1st attack. The column Volume of
attacks is constructed similarly but for the number of re-ceived attacks. . . . . . . . . . . . . . . . . . . . . . . . . . . 74
v
6.2 Results for Hypothesis 1a. Significance (***) is reported forp < 0.01. . . . . . . . . . . . . . . . . . . . . . . . . . . . . . 80
6.3 Carders.de User roles . . . . . . . . . . . . . . . . . . . . . . . 89
6.4 Carders.de number of users per identified group . . . . . . . . 90
6.5 Classification of 50 Private Message Threads in Carders.de . . 95
6.6 Enforcement of regulation mechanisms in HackMarket.ru. . . . 100
6.7 Comparison of results for Carders.de and HackMarket.ru. . . . 106
6.8 Operating systems and respective release date. Configurationsare right-censored with respect to the 6 years time window. . 110
6.9 List of tested exploit kits . . . . . . . . . . . . . . . . . . . . 111
6.10 Software versions included in the experiment. . . . . . . . . . 112
7.1 Criticality-based and risk-based policies. . . . . . . . . . . . . 141
7.2 Output format of our experiment. . . . . . . . . . . . . . . . 147
7.3 Sample thresholds . . . . . . . . . . . . . . . . . . . . . . . 147
7.4 Risk Reduction and significance levels for our risk factors PoCand BMar. Significance is indicated as follows: A **** indi-cates the Bonferroni-corrected equivalent of p < 1E − 4; ***p < 0.001; ** p < 0.01; * p < 0.05; nothing is reported forother values. . . . . . . . . . . . . . . . . . . . . . . . . . . . 150
vi

7.5 Risk Reduction for a sample of thresholds. Risk Reduction ofvulnerability exploitation depending on policy and informa-tion at hand (CVSS, PoC, Markets). Significance is reportedby a Bonferroni-corrected Fisher Exact test (data is sparse) forthree comparison (CVSS vs CVSS+PoC vs CVSS+BMar) perexperiment [29]. A **** indicates the Bonferroni-correctedequivalent of p < 1E − 4; *** p < 0.001; ** p < 0.01; *p < 0.05; nothing is reported for other values. Non-significantresults indicate risk factors that perform indistinguishably atmarking ‘high risk’ vulnerabilities than random selection. . . 152
7.6 No. of vulnerabilities to fix by policy. . . . . . . . . . . . . . 1547.7 Workloads and reduction in pA for each policy. Risk-based
policies allow for an almost complete coverage of the attackpotential in the wild with a fraction of the effort entailed by acriticality-based policy. . . . . . . . . . . . . . . . . . . . . . 156
vii


List of Figures
5.1 Map of vulnerabilities per dataset. Overlapping areas rep-resent common vulnerabilities among the datasets, as identi-fied by their CVE-ID. Area size is proportional to the numberof vulnerabilities. In red vulnerabilities with CV SS ≥ 9.Medium score vulnerabilities (6 ≤ CV SS < 9) are orange;low score vulnerabilities are cyan and have CV SS < 6. CVSSscores are extracted from the NVD database as indexed by therespective CVE-ID. The two small rectangles outside of NVDare vulnerabilities whose CVEs were not present in NVD atthe time of sampling. These CVEs are now present in NVD. . 58
5.2 Histogram and boxplot of CVSS Impact subscores per dataset. 595.3 Distribution of CVSS Exploitability subscores. . . . . . . . . 635.4 Top row: histogram distribution of logarithmic exploitation
volumes. Bottom row: Lorentz curves for exploitation vol-umes in the different categories. p % of the vulnerabilities areresponsible for L(p)% of the attacks. . . . . . . . . . . . . . . 65
6.1 Regression of number of attacked machines (left) and volumeof attacks (right) as a function of time. Attacks against thesame software are represented by the dashed line; attacksagainst different software are represented by the solid line.Shaded areas represent 95% confidence intervals around themean. . . . . . . . . . . . . . . . . . . . . . . . . . . . . . . . 76
ix
6.2 Targeted machines as a function of time for the three typesof attack. A1 is represented by a solid black line; A2 by along-dashed red line; A3 by a dashed green line. . . . . . . . . 78
6.3 Fraction of systems receiving the same attack repeatedly intime (red, solid) compared to those receiving a second attackagainst a different vulnerability (black, dashed). The verti-cal line indicates the amount of days after the first attackswhere it becomes more likely to receive an attack against anew vulnerability rather than against an old one. . . . . . . . 81
6.4 Distribution of average days between first exploit attempt andthe appearance of an attack attempting to exploit a differentvulnerability in the respective category. . . . . . . . . . . . . 83
6.5 Categories of the Carders.de forum. The German market com-prises more discussion sections and more market levels thanthe English market. Similarly, we found most of the activityto happen in the German section of Carders.de. . . . . . . . . 88
6.6 From left to right: 1) Reputation levels for normal users andbanned users (whole market). 2) Users active in the tier 1 mar-kets and tier 2 market. 3) Reputation of banned and normalusers in tier 2. Banned users showed consistently higher rep-utation than normal users, even when considering only thoseactive in the tier 2 market. The reputation mechanism is in-effective in both market sections. . . . . . . . . . . . . . . . . 92
6.7 Users in tier 2 with more and less than 150 posts at the mo-ment of their first post in tier 2. Most users had access to tier2 before reaching the declared 150 posts threshold. D=Doubleaccounts; N=Normal Users; R=Rippers; S=Spammers; U=Unidentifiedbanned users. . . . . . . . . . . . . . . . . . . . . . . . . . . 93
x

6.8 Time Distribution of Posts for Users in Tier 2. Most of theposting activity of users in Tier 2 happened well before theyreached the required 4 months waiting period. . . . . . . . . . 94
6.9 Initiated trades for Ripper users and Normal users. Thereis no difference in the number of trades the users of the twocategories are involved in. Consistently with the analysis sofar, this indicates that market participants are not able todistinguish good traders from bad traders. . . . . . . . . . . . 96
6.10 Boxplot representation of reputation distribution among cat-egories. Reputation levels are statistically higher for highercategories when compared to reputation at lower categories.Only the categories Trustee and Specialist do not show sta-tistical difference; these two are elective categories to whichbelong users deemed noteworthy by the administrator. . . . . 97
6.11 Scheme of drive-by-download attack . . . . . . . . . . . . . . 108
6.12 Sample advertisment for a popular exploit kit in 2011- mid2012, “Eleonore”. . . . . . . . . . . . . . . . . . . . . . . . . . 109
6.13 Flowchart of an experimet run. This flowchart describes a fullexperiment run for each system in Table 6.8. Configurationsare generated in chronological order, therefore if the first con-trol on YSys fails, every other successive configuration would aswell and the experiment ends. Snapshots enable us to re-usean identical installation of a configuration multiple times. . . 113
6.14 Stacked barplot of configuration installs by software. The in-stallation procedure was successful the majority of the time,the only exception being Flash for which we have a 20% de-tected failure rate. . . . . . . . . . . . . . . . . . . . . . . . . 117
xi

6.15 Infection rates per time window. Exploit kits obtain a peak ofabout 30% successful infections and maintain this level for 3years on average. Afterwards infection rates drop significantly.Only after 8 years overall exploitation rate goes to zero. . . . 118
6.16 Number of configurations that each exploit kit was able tosuccessfully attack in each time window. Number of exploitedconfigurations are reported on the Y-axis, and time windowson the X-axis. We can identify three groups of exploit kits.Lousy kits (mpack, Seo, ElFiesta, AdPack, IcePack, gPack)are rip-off of each other and perform precisely the same andare consistently the worst. Long-term exploit kits (Crimepack,Shaman) achieve higher exploitation rate and maintain non-zero exploitation rates for up to 7 years. Time-specific exploitkits (Eleonore, Bleeding Life) achieve the highest exploitationrates within a particular time frame but their success ratedrops quickly afterwards. . . . . . . . . . . . . . . . . . . . . 119
7.1 Sensitivity (solid line) and specificity (dotted line) levels fordifferent CVSS thresholds. The red line identifies the thresh-old for PCI DSS compliance (cvss = 4). The green line iden-tifies the threshold between LOW and MEDIUM+HIGH vulnera-bilities (cvss = 6). No CVSS configuration, regardless of theinclusion of additional risk factors, achieves satisfactory levelsof Specificity and Sensitivity simultaneously. . . . . . . . . . . 149
xii

7.2 Risk reduction (RR) entailed by different risk factors. TheBlack Markets represent the most important risk factor withan entailed RR of up to 80%. The existence of a proof-of-concept exploit is significant as well and is stable at a 40%level. The CVSS score alone is never significant and its medianRR lays in the whereabouts of 4%. . . . . . . . . . . . . . . . 151
xiii


List of Publications
[1] Luca Allodi and Fabio Massacci. The work-averse attacker model. InIn the Proceedings of the European Conference on Information Systems(ECIS), 2015.
[2] Luca Allodi, Marco Corradin, and Fabio Massacci. Then and now: Onthe maturity of the cybercrime markets. IEEE Transactions on Emerg-ing Topics in Computing, 2015.
[3] Luca Allodi. The heavy tails of vulnerability exploitation. In Proceed-ings of the 2015 Engineering Secure Software and Systems Conference(ESSoS’15), 2015.
[4] Luca Allodi and Fabio Massacci. Tutorial: Effective security manage-ment: using case control studies to measure vulnerability risk. In 25thIEEE International Symposium on Software Reliability Engineering (IS-SRE), 2014.
[5] Luca Allodi and Fabio Massacci. Comparing vulnerability severity andexploits using case-control studies. ACM Transactions on Informationand System Security, 17(1):1:1–1:20, August 2014.
[6] Luca Allodi, Vadim Kotov, and Fabio Massacci. Malwarelab: Experi-mentation with cybercrime attack tools. In Proceedings of the 2013 6thWorkshop on Cybersecurity Security and Test, 2013.
1
List of Publications Chapter 0
[7] Luca Allodi and Fabio Massacci. How cvss is dossing your patchingpolicy (and wasting your money). BlackHat USA 2013 arXiv:1301.1275[cs.CR], 2013.
[8] Luca Allodi, Shim Woohyun, and Fabio Massacci. Quantitative assess-ment of risk reduction with cybercrime black market monitoring. In InProceedings of the 2013 IEEE S&P International Workshop on CyberCrime., 2013.
[9] Luca Allodi. Attacker economics for internet-scale vulnerability riskassessment. In Presented as part of the 6th USENIX Workshop on Large-Scale Exploits and Emergent Threats. USENIX, 2013.
[10] Luca Allodi and Fabio Massacci. Poster: Analysis of exploits in the wild.In IEEE Symposium on Security & Privacy, 2013.
[11] Woohyun Shim, Luca Allodi, and Fabio Massacci. Crime pays if youare only an average hacker. In Proceeding of the 2012 IEEE ASE CyberSecurity Conference, 2012.
[12] Luca Allodi and Fabio Massacci. A preliminary analysis of vulnerabilityscores for attacks in wild. In Proceedings of the 2012 ACM CCS Work-shop on Building Analysis Datasets and Gathering Experience Returnsfor Security, 2012.
[13] Luca Allodi. The dark side of vulnerability exploitation: a researchproposal. In Proceedings of the 2012 Engineering Secure Software andSystems Conference Doctoral Symposium, 2012.
2
Chapter 1
Introduction
The management of IT security is becoming a more and more prevalentchallenge as system complexity increases. The evolving nature of IT systemsfurther complicates the scenario: on the one side the increasing complexityof software often translates in more software flaws and vulnerabilities to fix[89], and on the other system threats continuously evolve, changing the riskoutlook as new vulnerabilities and attack vectors emerge [58, 19]. For thisreason, to measure the risk associated with a software vulnerability becomesa central point in any strategy for system security management. This isalso reflected in the recent development, both in academia and industry, ofsoftware risk measures [83, 68, 124] and vulnerability management strategies[79, 40, 95] that are now adopted as a standard-de-facto worldwide [123].
However, the nature of the risk associated with these vulnerabilities re-mains largely unexplored. Risk is typically defined as the product of theimpact or severity of an event, and its likelihood. While technical measuresof vulnerability impact and exposure have been defined in the past [79, 68],a precise notion of likelihood of exploit remains to be found [30, 124]. Onthe other hand, this is crucial to a meaningful definition of vulnerability risk:attacks against two measurably similar vulnerabilities from a technical per-spective (e.g. both allowing remote code execution via freed memory reuse)
3

Chapter 1
are not necessarily similarly distributed in the wild. A meaningful risk es-timation should indeed assign a higher risk score to the most frequentlyattacked vulnerability. Yet, this is not reflected in current practices and re-search [108, 68, 124, 79, 83]: current approaches focus mainly on a technicalassessment of the exposure of the system to the vulnerability, and likelihoodmeasures are often derived from the technical assessment itself [83, 30]. Onthe other hand, hackers’ and cybercriminals’ attitudes toward cyber attacksare known to go well beyond the mere technical matters: the attacker may bemotivated by political or social reasons [115], as well as economic ones [58].Attackers with different motivations and technological or infrastructural ca-pabilities can be expected to generate attacks with different risk profiles bothin terms of technical sophistication and distribution in the wild. This opens aset of interesting questions on the decision process of the attacker: how doesthe attacker choose which vulnerabilities to (massively) exploit? Accordingto what process does the engineering of a new exploit translate into the finalrisk suffered by the user? It is not clear how current attacker models, oftenused to prove the security of a communication or cryptographic protocol [44],can be used to define the notion of vulnerability risk: attackers are usuallythought of as very powerful (e.g. can access all systems and have completeinformation about the target) [2], but whether this is representative of thecurrent status of cyber attacks remains an open issue [58, 73, 25].
In contrast, in this Thesis we develop the notion of the ‘economic at-tacker’ that is utility-oriented and work-averse (i.e. perceives work effort asa disutility), and that relies on a technological infrastructure for cyberat-tacks that he can access from the cybercrime markets [58]. We argue thatthe economic nature and capabilities of an attacker are an important driverfor technological and operational risk. In particular, in this Thesis we showthat vulnerability risk is largely influenced by the attacker’s rationality indeciding which vulnerabilities to exploit, and by the economic environment
4
Chapter 1 1.1. Risk Management and the Inefficiency Problem
the attacker operates in. By accounting for these factors, we define a novelattacker model that, when factored in the risk assessment, allows us to iden-tify vulnerability patching strategies that are significantly more efficient thancurrent best practices.
The remainder of this Chapter unfolds as follows: in Section 1.1 we givea more detailed introduction on current practices for vulnerability manage-ment and we outline the inefficiency problem that they entail. In Section1.2 we define our research problem, and in Section 1.3 we outline the maincontributions of this Thesis work. Finally, Section 1.4 presents an outline ofthis manuscript’s organisation.
1.1 Risk Management and the Inefficiency Problem
When it comes to risk mitigation best practices, stating a rule that defineswhat represents ‘unacceptable risk’ is probably the most immediate approach.A ‘rule’ usually sets a critical threshold over some technical dimension [78].The chosen technical dimension(s) correspond to a point estimate of someexpected property of the component. The underlying assumption here isthat the considered point estimate has a certain descriptive power relative tothe distribution. By setting a rule that covers a wide fraction of the proba-bility distribution of ‘bad events’, one hopes to achieve almost full coverageagainst possible hazards. However, in computer security this ‘point estimate’is difficult to obtain given the wide diversity of systems and technologies in-volved in the assessment, and the disparate nature and resources available todevelopers, system administrators, attackers, and system stakeholders [78].
A clear example of this problem emerges from an overview of how vul-nerability management currently works: organizations that want a securityclearance to operate in certain fields (e.g. in the financial sector) or that sim-ply need guidance to prevent and mitigate security incidents are obliged to
5

1.1. Risk Management and the Inefficiency Problem Chapter 1
comply to security standards (e.g. PCI-DSS for credit card security [127]) orprotocols and best practices (e.g. the NIST SCAP Protocol [95]) to managethe security of their IT systems. These standards and best practices prescribea ‘criticality-based’ vulnerability management i.e. based on a measure of howtechnically severe the vulnerability is. We define criticality-based policies inthe following way:
Definition. Criticality-based policies for vulnerability management de-fine a critical level of the technical measure of a vulnerability above whichpatching is required.
Being a technical measure, the defined ‘rule’ is to be applied equally re-gardless of the organisation’s security needs and resources. While this ‘tech-nical assessment’ has the advantage of being easily manageable by the issuinginstitution of the certification (as it does not change among organisations),the organisation may suffer from substantial inefficiencies in implementingthe rule as prescribed: Is the rule actually fit to the threat types the or-ganisation faces? How can the organisation measure how effective and aptthe ‘rule’ is for them? Can the organisation do any better while remainingwithin the limits for compliance? Unfortunately, a technical measure is notsuitable to answer any of these questions because it can not reflect, by def-inition, other elements that are proper to the organisation and its specificthreat model and operative environment. In other words, organisations areleft operating over their vulnerabilities without a way to estimate the riskthey are subject to and to evaluate which mitigation strategy works betterin their context.
This is particularly undesirable as vulnerability management can be veryexpensive and risky from a business continuity perspective: in today’s highlyconnected and diverse operative environments, it is difficult to foresee whateffects a change upstream may have down the network. For this reasonextensive testing is often needed before deploying a patch over a system
6

Chapter 1 1.1. Risk Management and the Inefficiency Problem
(e.g. providing a service) or set of systems (e.g. interfacing with the service).With hundreds of vulnerabilities to manage per year [122, 114], this operationcan become very expensive and fraught with organisational problems: whichvulnerability(-ies) should the organisation start from? What is the actualreturn in terms of additional security gained from the investment? Is it worththe time and the money it requires? This effect is clearly visible in the recent2015 Verizon report on PCI Compliance, where the vulnerability managementand testing requirements (i.e. requirements 5,6 and 11) are among the leastmet by companies [123]. It is therefore clear that vulnerability prioritisationbecomes central to any vulnerability management process. This is in turnrepresentative of a more general issue, that is ‘to measure’ how better off theorganisation is if a certain mitigation action is taken sooner than another.Yet, without a characterisation of ‘vulnerability risk’ it is currently not clearhow to obtain this measure.
Every vulnerability management product available on the market (provid-ing also tools supporting compliance to a number of standards) is essentiallybased on a ‘red-yellow-green’ assessment of vulnerability severity: a simplecomputation of the number of vulnerabilities present on the system and theirtechnical severity. This approach is also employed by the scientific literature[108, 83, 30, 103].
The main problem with this ‘criticality-based’ approach is that it implic-itly assumes that a vulnerability’s technical severity level can be considereda proxy for vulnerability risk. Whilst it is certainly true that a critical vul-nerability will sooner or later need to be fixed, it is not necessarily true thatless critical vulnerabilities will pose a lower immediate risk. Even within thesame ‘criticality level’ different vulnerabilities may pose different risk (e.g.because of some known and publicly available proof-of-concept exploit). Inthis logic, to immediately fix ‘higher criticality’ vulnerabilities may cause‘high risk’ vulnerabilities to remain untouched longer than necessary, while
7

1.2. Research Problem Chapter 1
the workload remains bloated with unnecessary work over severe but low-risk vulnerabilities. This can be clearly very inefficient and, possibly moreimportantly, will not necessarily benefit the overall security profile of theorganisation - if not worsen it as more resources are put in fixing low-riskvulnerabilities rather than in other mitigation actions.
1.2 Research Problem
The inefficiency issue outlined above opens a series of challenges to the com-munity on how to measure how better off an organisation’s overall securityis after a mitigating action has been taken. The following excerpt is takenfrom a recent report by the Ponemon institute [92]:
The majority of security professionals [..] aren’t sure howto distil this information [on security risk] into metrics thatare understandable, relevant and actionable to senior busi-ness leadership. [..] Finding meaningful ways to successfullybridge this communication gap is critical to broader adoptionof risk-based security programs. .
Indeed, one can use metrics such as attack surfaces [68] to estimate theoverall exposure to potential security threats, but can not obtain an esti-mate in terms of diminished risk to communicate to the business’ decisionmaker or to employ to engineer a better security plan. Being able to measurevulnerability risk can also be beneficial when communicating with auditorsfor compliance, that have to verify the soundness of the implementation ofsecurity requirements for the standard certification. Currently, to justify anunmet requirement the organisation has to produce lengthy (and expensive)documentation justifying the decision in relation to the organisation’s in-frastructure and existing countermeasures [127]. With a sound measure for
8

Chapter 1 1.3. Thesis Contribution
risk the lengthy and expensive documentation could be ideally synthesisedas follows: ‘I haven’t yet fully pursued this requirement because its fulfilmententails for me only a 1% reduction in risk, which is negligible when comparedto the 90% reduction of this other mitigation action.’
In order to make such statements possible, one has to shift from a purelytechnical decision model (i.e. current criticality-based policies) to a risk-driven one whereby impact and exploitation likelihood are both accountedfor. We define risk-based vulnerability management policies as follows:
Definition. Risk-based policies for vulnerability management define ameasure for vulnerability risk based on vulnerability severity and likelihoodof exploitation.
Our research goal is therefore to show that risk-based vulnerability man-agement policies are possible, and that the economic nature of the attackerand his/her rationality are determinant factors in designing more effectivevulnerability management practices.
1.3 Thesis Contribution
The principal contribution of this thesis is that we demonstrate that vulner-ability risk hugely varies among vulnerabilities, and that the rational andeconomic nature of the attacker and of the environment he/she operates inare of major importance in creating this gap. To demonstrate that this isthe case, in this Thesis we:
1. Present a unique set of datasets comprising vulnerabilities, exploits,exploits traded in the black markets, attacks in the wild, and data onblack market operations. The collection of these datasets required a fullyear of ethnographic research (to identify and infiltrate the cybercrimemarkets) and planning to meet the requirements needed to have access to
9

1.4. Thesis Outline Chapter 1
real attack data provided by Symantec. This data is used orthogonallyto validate each claim and conclusion made in this Thesis.
2. Show that the attacker is rational in choosing which exploits to engineerand massively deploys in the wild, and that this generates a skeweddistribution of risk for the final user.
3. The economic activities of the attacker operating in the undergroundmarkets characterise a foremost source of risk for the final user. Wedemonstrate that these markets are economically and technologicallysound and conclude that they are not a temporary phenomenon.
4. The attacker’s rational nature and economic environment can be ex-ploited to design better vulnerability management strategies based onthe notion of vulnerability risk. These strategies offer great advantagesin terms of patching efficiency over current best practices.
1.4 Thesis Outline
This Thesis unfolds as follows. In the next Chapter we outline the objectivesof this Thesis and provide a detailed discussion of the methods employedfor hypothesis testing. Chapter 3 frames the problem this Thesis addressesby discussing related works on vulnerabilities, exploits and attackers, andby identifying open problems currently not addressed in the literature. Thediscussion then moves to introducing our datasets, with a focus on the datacollection methodology (Chapter 4). A high-level overview of our data isgiven in Chapter 5. The core of this dissertation unfolds in Chapter 6, wherewe discuss and test attacker rationality and economics as an enabler forrisk-based vulnerability management. Chapter 7 tests the effectiveness ofrisk-based policies and evaluates their advantages over criticality-based ones.
10

Chapter 1 1.4. Thesis Outline
Finally, Chapter 8 and Chapter 9 conclude this dissertation by discussinglimitations and future research venues and conclusions respectively.
11

1.4. Thesis Outline Chapter 1
12
Chapter 2
Reserach Objectives and Methods
2.1 Are Risk-based Policies Possible?
The current practice on vulnerability management is based on the conser-vative notion that, if a vulnerability is there, sooner or later an attackerwill exploit it. This is an inheritance from more traditional aspects of secu-rity, such as cryptography, where the existence of one flaw in the protocolis enough to invalidate it [44]. For example, Bruce Schneier famously statedin 2005 that “Security is only as strong as the weakest link” [2]. Similarly,Williams and Chuvakin, domain experts for PCI-DSS compliance (the stan-dard for credit card management security), state “Don’t spend a huge amountof time and effort prioritizing [vulnerability] risks, since in the end they allneed to be fixed” [127]. Somewhat ironically, Chuvakin himself will later ac-knowledge the importance of the risk prioritisation problem [7]. Still, thegeneral consensus is that if a vulnerability is there and is technically critical,it must be fixed with high priority.
The implicit assumption here is that all vulnerabilities of the same crit-icality entail the same risk level, i.e. that attacks are uniformly distributedover similar vulnerabilities. In this scenario, a criticality-based policy statinga criticality level for mandatory patching is a good solution and one thatcan be hardly improved: because all vulnerabilities are equally likely to be
13
2.1. Are Risk-based Policies Possible? Chapter 2
ultimately exploited, removing only one vulnerability would leave the systemat the same level of risk, irrespective of which vulnerability is fixed.
Yet, this may not be the case in practice. In recent years, the figure of theattacker moved from the ‘curious hacker’ or ‘script-kiddie’ to the ‘organisedcyber criminal’ that can rely on a pre-existent organisational and technologi-cal infrastructure to deliver attacks. The main consequence of this evolutionis that attacks are nowadays ‘commoditized’ [58] through underground mar-kets where the technology producers sell the exploitation technology to amultitude of buyers that are users of the technology. Therefore, the attackertends now to be a rational economic actor operating in a market.
The main intuition in this direction is that the rational attacker’s levelof interest in attacking a vulnerability should be a function of the expected‘return-on-investment’ from the exploitation. We think of the vulnerabilityexploitation process as a two-phase process whereby the exploit first needs tobe engineered, and then either deployed in the wild or sold to other attackersoperating in the cybercrime markets [4, 58]. We make two key observationson this regard:
1. Engineering phase: Vulnerabilities get fixed in ‘chunks’ by the vendorwith the release of a new software version [38]. Each software versionoften addresses tens of vulnerabilities. The attacker has therefore, foreach software version, tens of vulnerabilities to potentially exploit. Yet,because a software version is vulnerable to all these vulnerabilities, therational attacker will only need to exploit (a sufficiently powerful) one:exploiting two or more vulnerabilities will not increase the number ofsuccessful attacks that can be launched, because all users of that soft-ware version are equally vulnerable until the next upgrade, when no userwill be vulnerable to any of those vulnerabilities. It makes therefore noeconomic sense for the attacker to exploit more than one vulnerabilityper software version. For this same reason, the attacker that aims at
14

Chapter 2 2.1. Are Risk-based Policies Possible?
a mass exploitation of final users will need to engineer a new exploitonly when a sufficiently high number of users will have switched to anew software version. We therefore hypothesise that few vulnerabilitiesare high return vulnerabilities, and that therefore only few vulnerabil-ities will be massively exploited by the attacker, generating a skeweddistribution in risk for the final user.
2. Commercialisation phase: Vulnerability exploits are reportedly tradedin the underground black markets [4, 58]. Because these markets enablemass exploitation of final users [58], we argue that these exploits areengineered following the rationale described above. As in any market,there is a 1:n distribution rate of technology, i.e. one vendor sells a tech-nological solution to n users of the technology. In a criminal market,this translates in one vulnerability exploit being used to massively gen-erate attacks by the n buyers of that exploit. We therefore hypothesisethat the cybercrime underground markets can represent a significantmultiplier factor in the final risk for the user.
A ‘risk-based’ approach to vulnerability management seems therefore moresensible than the classic criticality-based approach whereby all similar vulner-abilities represent equal risk. Importantly, in this scenario a criticality-basedapproach to vulnerability mitigation may be largely suboptimal as it mayrequire to address a number of vulnerabilities that could otherwise be safelyignored or postponed in the patching schedule. This defines the main thesisof this dissertation:
Thesis. Risk-based vulnerability management policies are possible andcan significantly improve the efficiency of current vulnerability mitigationpractices.
The discussion above outlines two key enabler factors to risk-based vul-
15

2.2. The attacker is rational and work-averse Chapter 2
nerability management policies: attacker rationality, and functioning (andstable) cybercrime markets. Both these conditions need to be verified be-fore proceeding with testing our Thesis: were the attackers not rational, orthe markets not sound, any measured effect of risk-based policies may bea temporary (or casual) one. We formulate three running hypotheses, thatare presented in the remainder of this Chapter alongside the relative testingmethodology. Table 2.1 provides a birds-eye view of this setting.
2.2 The attacker is rational and work-averse
Our first hypothesis aims at establishing that the attacker acts rationally.Rationality is a widely-accepted underlying assumption in the broad fields ofeconomics and information security economics [118, 32], whereby economicactors are driven by a utility maximization function, i.e. each actor tries tomaximise his/her own gain from the execution of certain actions.
In the case of the cyber attacker, his/her goal is to maximise the returnfrom the execution of an attack. Because finding and exploiting vulnera-bilities is a time-consuming and therefore costly process [81], the rationalattacker will choose to exploit a vulnerability only if this represents a highenough gain in terms of increased attack capability with respect to his/hercurrent capabilities. In other words, the attacker will develop a new exploitonly if the expected returns from the exploitation of the new vulnerabilityare lower than the cost of developing and deploying the new attack.
In particular we observe that the exploitation of multiple vulnerabilitiesdoes not necessarily imply a more ample pool of potential victims for theattacker. To contain testing, deployment and costumer support costs, soft-ware vendors patch vulnerabilities in bulks [38] by releasing a new softwareversion. Therefore, to attack a certain software version j the attacker canchoose among n vulnerabilities vj,i ∈ Nj, with Nj the set of vulnerabilities
16
Chapter 2 2.2. The attacker is rational and work-averse
affecting version j and its cardinality n often much greater than 1.The by-product of this process is that every user that is vulnerable to a
certain vulnerability vj,i is also vulnerable to the remaining n − 1 vulnera-bilities for that software version. In this scenario, the attacker that aims atattacking that set of vulnerable users can do so by exploiting one vulnera-bility only of the available n1. As a consequence, for each software versionthe rational attacker will tend to exploit at most one vulnerability, and leaven − 1 vulnerabilities unexploited. Extending this to the overall picture, weformulate the following hypothesis on attacker’s rationality:
Hypothesis 1 The attacker ignores most vulnerabilities and massively de-ploys exploits for a subset only.
If Hyp 1 holds attackers’ rationality implies that attacks are not uniformlydistributed among vulnerabilities. A criticality-based approach to vulnera-bility management may therefore be not optimal.
Hypothesis testing
To test Hypothesis 1, we identify two constraints that the attacker has torespect to be ‘work-averse’. Our first observation is that the work-averseattacker needs to exploit only one vulnerability per software version, as ex-ploiting more would not result in an increased volume of final infections. Thisis because the user of a certain software version will be equally vulnerable toall vulnerabilities affecting that version. If the overall picture of attacks inthe wild does not respect this constraint, than we can not conclude that theattacker acts rationally as a work-averse actor. We therefore hypothesise thefollowing:
1Clearly, not all these n vulnerabilities are necessarily technically comparable. Some vulnerabilities(e.g. Cross-Site-Scripting vulnerabilities) are less powerful than others (e.g. Buffer Overflows). Similarly,the exploitation of different vulnerabilities may carry different costs for the attacker (for example, somecountermeasures deployed at the system level make memory exploitation harder).
17
2.2. The attacker is rational and work-averse Chapter 2
Hypothesis 1a The attacker will massively use only one exploit per soft-ware version.
Then, because patching rates on the side of the user are often slow [69], weexpect the work-averse attacker to wait a considerable amount of time beforemassively deploying a new exploit, as an old one should provide a satisfactorylevel of infections. If not, then again the attacker would arguably be doingmore work than what optimally prescribed by his/her rationality.
Hypothesis 1b The fraction of attacks driven by a particular vulnerabilitywill decrease slowly in time.
Update rates and software types. From Hyp. 1a and 1b we argue that theaverage user behaviour in updating a system determines the rate at whichthe efficacy of an exploit declines. However, not all software is updatedat the same pace both on the vendor side (that is slower in developing thepatches ([105]) and the users’ side (that may be more likely to apply availablepatches for a software type than for another ([69])). Lately, some software(e.g. internet browsers) started adopting a ‘quick development cycle’ ([86])that quickly patches vulnerabilities and sends automatic updates to the users.The attacker behaviour may change with respect to the software type. Forexample, users may seldom update their Java plugin, whereas they run thelatest version of the Internet Explorer browser.
Corollary to Hyp. 1b The attacker waits a longer period of time to in-troduce an exploit for software types under a slow update cycle than forothers.
This corollary will serve as a robustness check to the Hypotheses above,as their acceptance would be incoherent with the rejection of this Corollary.
18

Chapter 2 2.3. The underground is a sustainable market economy
2.3 The underground is a sustainable market economy
Our second hypothesis investigates the economic sustainability of cybercrimemarkets. The typical agency problems any market has to address [48] are,in the cybercrime markets case, particularly prominent: the criminal, andlargely anonymous and virtual nature of these markets make contract com-pleteness and enforcement hard to achieve. Market operation can be dif-ficult in these conditions. Identifying bad agents and disincentivize unfairbehaviour (e.g. in terms of moral hazard) become in this setting centralmechanisms of a functioning market [56]. These mechanisms have howeverbeen shown to be at best poorly addressed in the cybercrime IRC-based mar-kets [63], where information asymmetry problems effectively push all ‘goodagents’ out of market. On the contrary, we argue that current forum-basedcybercrime markets [130, 82] can enforce mechanisms that are effective inmitigating or solving these issues. We formulate the following Hypothesis:
Hypothesis 2 The underground markets are sound from an economic per-spective.
If Hyp. 2 holds, we conclude that the markets are not a transient sourceof risk for the final user and are therefore key and permanent enablers of the‘risk-based’ approach to vulnerability mitigation we propose.
As anticipated, a most prominent issue in a market for criminals is theagency problem, whereby a principal commissions a work to an agent via anenforceable contract. The setting of a criminal virtual community is partic-ularly interesting in this respect as market participants can only stipulateincomplete contracts, as contract enforcement can not be guaranteed by acontrolling authority. Moreover, a buyer interested in a good has access toonly a limited amount of information to decide whether a particular attacktechnology fits his needs, or simply if this technology works. Market partici-pants operate therefore in a bounded rationality setting where uncertainties
19

2.3. The underground is a sustainable market economy Chapter 2
on the trustworthiness of the seller and the quality of the traded good needbe addressed in order for the market to be sustainable.
We therefore formulate two propositions following Hypothesis 2, address-ing respectively the existence of market mechanisms to mitigate trade un-certainties, and the overall quality of the traded goods. Finally, to testHypothesis 2 we develop a two-stage model of the underground markets werewe formally show that the mechanisms tested under proposition 1, and theproduct quality shown under proposition 2 allow for a sustainable cybercrimemarket environment that encourages fair trading and discourages scammersfrom participating.
2.3.1 Proposition 1: The underground markets are mature
Recent literature reports how attackers are now en-masse operating in under-ground markets. This may represent a multiplicative factor for vulnerabilityrisk as the same exploit may be distributed to multiple attackers. This opensthe question whether these markets are really functioning, or are just a tran-sient phenomenon. If this is not the case, then this multiplicative effectwould be a permanent factor favouring risk-based policies over criticality-based policies.
Market design is a problem of great interest in economics, as a successfulmarket necessarily involves an equilibrium of forces that on one side en-courages ‘traders’, and on the other discourages “cheaters”. In particular, amarket where everybody cheats is not a sustainable market and is doomedto fail because nobody would eventually initiate a trade (or, equivalently, allsellers will eventually exit). Cybercrime markets represent therefore a fas-cinating case study: they are run by criminals (who are not trustworthy bydefinition), are typically run on-line, and are to a degree anonymous. Howcan anonymous criminals trust other anonymous criminals in delivering thepromised service or good after the payment has been issued? And even if
20
Chapter 2 2.3. The underground is a sustainable market economy
the buyer gets ‘something’, how can she be sure that what she thinks she isbuying is effectively what she will end up with? If a trade goes sour, a buyercannot call the police to apprehend the scammer.
Florencio et al. [63] showed that IRC cybercrime markets (Markets runthrough Internet Relay Chats) may be no different from the notorious mar-ket for lemons captured by Akerlof [13], where effectively the asymmetry ofinformation between the seller and the buyer is such that “bad sellers” areincentivized in participating in the market to the point that it makes no sensefor the “good sellers” to remain active. In Akerlof’s case, a “bad seller” is aseller that trades ‘lemons’ (a defective car that is advertised as a good one).If the customer can not assess the quality of the car before buying it (e.g.because she knows little about cars), then she will buy the cheapest she canfind on the market. Since ‘lemons’ are cheaper than good cars, ‘good sellers’are ultimately forced out of the market. In Florencio et al.’s case, a ‘lemon’was a credit card number with (allegedly) a certain amount of money readyto be used by the buyer. As shown in Akerlof’s work, discerning ‘good sellers’from ‘bad sellers’ is therefore a critical point of a market design. Florencioet al. clearly demonstrated that it is virtually impossible to do so in the IRCcybercrime markets. On the other hand, recent reports show that cybercrimetools and infrastructure seem to work [112, 58]. Following these observations,we formulate the following Proposition:
Proposition 1 The underground markets evolved from a scam-for-scammermodel to a mature state whereby fair trade is possible and incentivised by theenforced trading mechanisms.
If Prop. 1 holds, we conclude that the underground markets can be asustainable operating environment for the rational attacker. The ‘multipliereffect’ in attack volume, enabled by marketed vulnerabilities (as opposed tolittle known ones), will make technically identical vulnerabilities different in
21

2.3. The underground is a sustainable market economy Chapter 2
terms of final risk to the user depending on whether they are traded in themarkets or not.
Testing Proposition 1 Forum markets In order to understand whether cy-bercrime markets evolved to a mature state, we compare two forum under-ground markets: one that failed and one that is still active. We label thesemarkets Carders.de and HackMarket.ru. Carders.de (which failed) specializedmostly in credit cards, while HackMarket.ru (still active) specializes mostlyin cyber-crime tools, albeit some transactions are also about monetary goods(e.g. credentials for Skype accounts). We give a more precise description ofboth markets in Chapter 4.
Both Carders.de and HackMarket.ru are forum-based markets. They haveadministrators, moderators, users’ registration procedures, reputation mech-anisms and so on. The major difference with Alibaba, eBay, or Craiglist isthat they mostly advertise ‘illegal’ goods.
At first, notice that even legitimated forum markets are rife with scams.After 20 years since eBay’s foundation, many frauds reported by FBI’s 2013Internet Crime Reports [50] rely on legitimate forum markets to performscams: good old lemons are advertised and sold via eBay [50, pag. 8]; bogusreal estates are sold via Craiglist; failed delivery or payment of goods arecommon places; etc.
To create ‘safe trading places’ where only experienced and trustworthyusers participate, forum-based markets have created a number of mecha-nisms aimed at distinguishing ‘good’ and ‘bad’ users. A system to effectivelymanage reputation is a key issue in the trust of an on-line market place.For example, eBay filed its own reputation based mechanisms for patentingin 2000 [97] and at the beginning of 2015 has almost 200 patents listed onGoogle’s patent with the keyword ‘user reputation”.
The forum mechanisms in legal on-line markets have provided a ‘satisfy-
22

Chapter 2 2.3. The underground is a sustainable market economy
ing’, in the sense of Simon [109], protection to legitimate users to make thosemarkets thrive. For example, Melnik and Alm showed that reputation doesmatter in sales [80]; Resnick and Zeckhauser showed that buyers and sellersactively and deliberatively provide positive or negative ratings, with positiveratings being the majority [98].
From a legal perspective, reputation mechanisms only provide partial cov-erage. Law scholars have discussed the issue at length (see e.g. [33, 14] forsome of the earliest papers). However, if the reputation mechanism fails, anda ‘lemon’ is sold via eBay, a customer can always resort to the FBI Inter-net Crime Center which will pass the complain to the local prosecutor [50,pag. 18]. Similar protections are available to customers in other countries.Such last resort is not available to victims of trades gone sour in criminalforums.
Therefore, illegal markets must either make the reputation mechanismmore robust or compensate for the failure of the mechanism with prosecutionprocedures. Absence or failure of these additional enforcement mechanismswould intuitively re-create the same conditions that Florencio et al. [63]identified for the IRC markets: information asymmetry would favour ‘ripping’behaviour and eventually bring the market to fail.
We formulate a number of hypotheses from the description of Carders.de’sand HackMarket.ru’s regulatory mechanisms (reputation being just one ofthem). The goal is to compare the two markets on the same regulatoryground and see if newer and still active markets solved the regulatory prob-lems present in the failed ones.
Effectiveness of reputation mechanism If the reputation mechanism works,known scammers should have the lowest reputation among all user.
Proposition 1a Banned users have on average lower reputation than nor-mal users.
23

2.3. The underground is a sustainable market economy Chapter 2
If Proposition 1a is true, it is evidence that the regulatory mechanism forreputation is effectively enforced, and provides to forum users an instrumentto evaluate traders’ historical trustworthiness. If the data does not supportthis, “reputation” in the forum is not a good ex-ante indicator of a users’trustworthiness.
Fora may present a hierarchy of roles or status groups that each user can‘escalate’ to. In a functioning system the status should be reflected in thereputation rating.
Proposition 1b Users with a higher status should on average have a higherreputation than lower status users.
If Hypotheses 1a and 1b do not hold, it may as well be because moderatorsleft a part of the market to its own and concentrated all regulatory effortson the higher market tiers. For example, in the Carders.de market, there arethree Tiers of traders and the first Tier may just represent noise in the data.
To check this possibility, we can restrict Hyp1a to hold only for users thatare higher in the hierarchy.
Proposition 1c Banned users who happened to have a higher status have alower reputation than other users with the same status.
If even Hyp. 1c does not hold, we conclude that the reputation mechanismseven after controlling for market alleged ‘status’ provide no meaningful wayfor the forum users to distinguish between “bad traders” and “good traders”.
Enforcement of rules Reputation may fail to provide effective information,but the hard-wired categories of the forum users (the ones under the directcontrol of the administrators) may provide a better indicator of quality. Nor-mally, access to the higher market tiers should be subject to some rules. Themarket is reliable if such rules are consistently enforced.
24

Chapter 2 2.3. The underground is a sustainable market economy
To see whether this regulation is enforced we can test the following Propo-sition:
Proposition 1d The ex-ante rules for assigning a user to a category areenforced.
Once transactions fail, Carders.de and HackMarket.ru users cannot turn tolegitimate law enforcement agencies for a redress. Therefore, the forum musthave some alternative rules to manage trades gone sour.
Proposition 1e There are ex-post rules for enforcing trades contemplatingcompensation or banning violators.
Market existence An obvious, but important question to ask is whetherthe market actually exists. In other words, whether actual transactions takeplace (took place for Carders.de). Indeed, the role of the forum boards isto provide a platform for sellers and buyers to advertise their merchandise.The actual finalization of the trade usually happens through the exchange ofprivate messages between the trading parties [52, 63].
Proposition 1f Users finalize their contracts in the private messages mar-ket.
If Hyp 1f holds, than the exchange of private messages would be a goodproxy for us to measure the successfulness of ‘normal’ users and ‘rippers’in closing trades. To check whether ‘normal users’ are significantly moresuccessful than ‘rippers’ we test the following Proposition:
Proposition 1g Normal users receive more trade offers than known rippersdo.
For Carders.de, where we have access to the whole forum, a suitable proxyis counting the number of times a forum user initiates a trade with another
25

2.3. The underground is a sustainable market economy Chapter 2
forum user i.e. the number of unsolicited incoming private messages a userreceives. The proportion of private messages that are trade-initiation canbe calculated to answer the previous Proposition. For HackMarket.ru suchanalysis must be qualitative as downloading the whole forum would revealour presence.
We would expect the results for Hyp. 1g to be coherent with the resultsobtained so far for the forum. In other words, if the reputation mechanismworks, the tier system is properly enforced, and the exchange of privatemessages is used to conclude the trading process, then we would expectnormal users to conclude more trades than rippers do. This is because theconsistent enforcement of the forum rules would give market participants aninstrument to discern rippers from normal users. Otherwise, if the evidencegathered so far suggests a systematic failure in the market regulation, thenwe would expect rippers to be indistinguishable from normal users becausethe user cannot do better than randomly picking a seller from the wholepopulation.
2.3.2 Proposition 2: The technology traded in the undergroundis effective
Besides a mature economic setting to operate upon, a successful market needsgoods to be exchanged. Traded goods can be of any nature, but for the econ-omy to be sustainable the goods have to deliver the advertised functionality(or buyers will simply stop buying products). From the perspective of a cy-bercriminal operating in the black markets, the good must deliver the attackas promised by the vendor.
Recent industry reports [122, 113] and scientific studies [58] reported onthe attack capacity of the infrastructure provided by the underground mar-kets; some studies estimate the fraction of attacks that can be traced back toattack tools traded in the underground [93], but no study empirically and ex-
26

Chapter 2 2.4. Risk-based Policies are Possible
plicitly evaluates their effectiveness. We aim at filling this gap by formulatingand testing the following Proposition:
Proposition 2 The tools bought and used by the attackers are well engi-neered products that are effective when deployed in the wild.
If we find evidence supporting Hyp. 2 we conclude that the cybercrimemarkets distribute effective attack technology to multiple attackers that ul-timately deploy those attacks.
Testing Proposition 2 We will directly test for Proposition 2 by testing theeffectiveness and resiliency of tools traded in the cybercrime markets againstevolving system configurations. These test are run in a laboratory built forthis purposes at the University of Trento, the MalwareLab.
2.4 Risk-based Policies are Possible
Hypotheses 1 and 2 postulate the feasibility of risk-based policies. In par-ticular, Hyp. 1 postulates that ‘high return’ vulnerabilities will carry higherrisk for the final user than most vulnerabilities. Hyp. 2 postulates that theunderground markets act (and will keep on acting) as ‘risk amplifiers’. Wetherefore formulate the following concluding hypothesis:
Hypothesis 3 It is possible to construct risk-based policies that, leveregingthe economic nature of the attacker, can greatly improve over criticality-basedpolicies.
In particular, due to the multiplicative effect we predict from Hyp. 2, weexpect risk-based policies that account for the presence of a vulnerability inthe black markets to be the most effective ones. We therefore formulate thefollowing corollary to Hyp. 3:
27

2.4. Risk-based Policies are Possible Chapter 2
Corollary to Hyp. 3 Risk-based policies accounting for cybercrimemarkets are the most effective in reducing risk for the final user.
Hypothesis testing
We evaluate the effectiveness of risk-based policies as opposed to that ofcriticality-based policies by developing a case control study accounting forvulnerabilities, exploits in the wild, and cybercrime activities and actors (asestablished with Hypotheses 1-2). In particular, we evaluate policy effective-ness by measuring the risk reduction it entails: risk reduction is a relativemeasure of the leftover risk after a certain patching decision is taken. Toaccept Hypothesis 3, we further provide an application example wherebywe compare workloads and benefits in terms of foiled attacks in the wild ofrisk-based and criticality based policies.
Table 2.1 summarises this Section’s discussion.
28

Chapter 2 2.4. Risk-based Policies are PossibleTa
ble2.1:
Summaryof
runn
inghy
potheses
andhy
pothesis
testingin
this
Thesis.
Run
ning
Hyp
othesis
Hyp
othesesTesting
Hyp
.1.
The
attacker
igno
resmost
vulnerab
ilities
andmassively
deploy
sexploits
forasubset
only.
Hyp
.1a
.The
attacker
will
massively
useon
lyon
eexploitpe
rsoftwareversion.
Hyp
.1b
.The
fraction
ofattacksdriven
byapa
rticular
vulnerab
ility
will
decrease
slow
lyin
time.
Cor
olla
ryto
Hyp
.1b
.The
attacker
waits
along
erpe
riod
oftimeto
introd
ucean
exploitforsoftwaretype
sun
deraslow
upda
tecyclethan
forothers.
Hyp
.2.
The
undergroun
dmarkets
aresoun
dfrom
anecon
omic
perspe
ctive.
Pro
p.
1.The
undergroun
dmarkets
evolvedfrom
ascam
-for-scammer
mod
elto
amaturestatewhereby
fair
trad
eis
possible
andincentivised
bytheenforced
trad
ing
mecha
nism
s.
•P
rop.
1a.Ban
nedusersha
veon
averagelower
repu
tation
than
norm
alusers.
•P
rop.
1b.Users
withahigh
erstatus
shou
ldon
averageha
veahigh
errepu
-tation
than
lower
status
users.
•P
rop.
1c.Ban
neduserswho
happ
ened
toha
veahigh
erstatus
have
alower
repu
tation
than
otheruserswiththesamestatus.
•P
rop.
1d.The
ex-anterulesforassign
ingauser
toacategory
areenforced.
•P
rop.
1e.There
areex-postrulesforen
forcingtrad
escontem
platingcom-
pensationor
bann
ingviolators.
•P
rop.
1f.Users
finalizetheircontractsin
theprivatemessagesmarket.
•P
rop.
1g.Normal
usersreceivemoretrad
eoff
ersthan
know
nripp
ersdo
.
Pro
p.
2.The
toolsbo
ught
andused
bytheattackersarewellengineered
prod
ucts
that
areeff
ective
whendeployed
inthewild
,as
tested
intheMalwareL
abagainst
evolving
softwareconfi
guration
s.H
yp.
2.Develop
atw
o-stagemod
elof
theun
dergroun
dmarkets
toshow
that
the
underlying
econ
omic
mecha
nism
issoun
d.H
yp.
3.It
ispo
ssible
toconstruct
risk-based
policiesthat,leveregingthe
econ
omic
nature
oftheattacker,c
angreatlyim
proveover
criticality-ba
sed
policies.
Cor
olla
ryto
Hyp
.3
Risk-basedpoliciesaccoun
ting
forcybercrimemarkets
arethe
mosteff
ective
inredu
cing
risk
forthefin
aluser.
Develop
acase
controls
tudy
toevalua
tetheoverallr
isk-redu
ctionof
risk
basedan
dcriticalityba
sedvu
lnerab
ility
man
agem
entpo
licies.
Avalid
atingexam
pleou
tlines
thebe
nefitsof
risk-based
policiesover
criticality
based
ones
interm
sof
patching
workloads
andeff
ectiveness
infoiling
real
attacksin
thewild
.
29

2.5. Research methodology and scope of work Chapter 2
2.5 Research methodology and scope of work
This thesis’ contribution is grounded on empirical research. Empirical re-search methodologies are usually divided in two main categories: qualitativeand quantitative research methodologies [128].
• Qualitative research aims at studying the phenomenon of interest in itsnatural setting, usually in order to understand why something happensrather than trying to assess how or how frequently does it happen.
• Quantitative research aims at measuring some quantity of interest [74].The goal is usually to compare these measures among groups that theresearcher can control (as in an experiment) or observe and control aposteriori (as in a case control study) in order to evaluate a certainhypothesis of interest.
In this Thesis we employ both approaches. In particular, we employ a casestudy to (qualitatively) study the cybercrime markets, and a case controlstudy to (quantitatively) study vulnerability risk.
• Case studies are concerned with understanding one particular setting ofinterest over well-specified dimensions [74]. Case studies are often usedfor exploratory and descriptive purposes [99], whereby the researcheraims at both deriving a ‘big picture’ perspective over the phenomenon ofinterest, and at deriving the fundamental ‘building blocks’ necessary todescribe it. If the case is general enough, or it fits exactly the boundariesof the research (i.e. is representative of the analysed problem), a casestudy can also be employed for explanatory purposes [102]. From anexploratory and descriptive analysis is also possible to derive modelsfor the analysis that use the qualitative results of the study to buildand validate a model of the phenomenon of interest. Our case study
30

Chapter 2 2.5. Research methodology and scope of work
is focused on one particularly active underground market that features,among its participants, the main cybercrime players and products oftencited in the media [8, 87] and the literature [58, 75].
• A case control study is typically run over field data, i.e. data collectedthrough some pre-existent collection mechanism, or through interviews[41]. A case control study looks at existing data to derive, throughthe implementation of proper controls, conclusions on the correlationbetween an observation and an ‘explanatory variable’ (i.e. a certain hy-pothesis on why an effect can be measured in the data). Case controlstudies have notably been employed to initially link smoking and carci-noma of the lung [45], and use of seat belts and likelihood of death in acar accident [49]. As exemplified by these two examples, a case controlstudy is typically run when an experiment can not be run for practicalor ethical reasons: one can not randomly assign patients to a twenty-year smoking period, and measure whether they get cancer down theline. Similarly, we can not ask participants to stay vulnerable and thenmeasure who gets their bank accounts emptied. We therefore rely onfield data collected by Symantec and use a case control study to deriveour conclusions.
Data gathering. The initial part of this work has been dedicated entirelyto gather data on vulnerabilities, exploits, and black markets. In particu-lar, we collected data from public datasets such as the National Vulnera-bility Database (NVD) for the ‘universe of vulnerabilities’ and the ExploitDatabase (Exploit-db) for proof-of-concept exploits (i.e. exploits that demon-strate the exploitability of a vulnerability). We further collected three addi-tional datasets that are not fully or directly available in the public sphere.EKITS is a dataset reporting vulnerabilities traded in the black markets. It isbuilt over Contagio’s Exploit Pack table [11], that we however substantially
31

2.5. Research methodology and scope of work Chapter 2
expanded by integrating it with data on more than 90 Exploit kits and 100unique vulnerabilities for a total of about 900 records. SYM and WINE area collection of exploited vulnerabilities (SYM) and records of attacks againstvulnerabilities (WINE) reported by Symantec through their Worldwide In-telligence Network Environment Data Sharing Programme [46]. WINE isavailable to use for researchers pursuing projects selected by Symantec.
As per the cybercrime markets, we collected data on two case studies: onefor a failed underground market, whose database eventually leaked throughunderground channels, and a second for an active market, that we infiltrated.These two case studies allow us to perform two analyses:
1. By comparing the two markets over a set of hypotheses on the effective-ness of their regulatory mechanisms, we can highlight the differencesbetween an old and failed market and a new and active one. We per-form this analysis through a mixture of quantitative and qualitativeanalysis of the two markets.
2. By thoroughly analysing the active market we first describe its tradeoperations, and how issues such as information asymmetry [13] (typi-cal of any principal-agent problem were contracts are incomplete [48])are addressed. Based on this analysis, we build a model of the under-ground market activities and show that the mechanism we observe iseconomically sound.
We provide a more thorough outline of these datasets and their collectionmethodology in Chapter 4.
Case-control studies. Vulnerability data is fraught with reporting and con-trol problems: time-of-disclosure and time-of-patch is filled with “noise ofunknown size” [105] and data on software versions and vendors is biasedby limitations inherent to the disclosure process [38]. Unfortunately these
32

Chapter 2 2.5. Research methodology and scope of work
limitations are often ignored in literature [38], and generate hard to inter-pret conclusions (notable examples are [20, 108]). We propose the use ofcase control studies as a statistically sound way to measure different ‘fea-tures’ of vulnerability data. Although case-control studies are certainly notnovel [45, 49], their use in information security is entirely novel. In ourcase, case-control studies represent an easily reproducible way to evaluatethe effectiveness of vulnerability management policies by estimating the RiskReduction they entail. Because case-control studies run on hindsight data toestimate correlations valid in foresight, their application can be extended toany operative environment that collects historical data on received attacks.This will be discussed in detail in Chapter 7.
Scope of work. Our data collection and research methodology requires somefurther consideration on the scope of this Thesis’ work. In particular, fielddata adds realism to the analysis but limits the ‘generality’ of one’s conclu-sions as it is often hard to extend results to other settings. Most attacks aredelivered in an untargeted manner through web attacks [58, 93, 28], spam[64] and social engineering [26]. In this Thesis we focus on the ‘general at-tacker’ that ‘massively deploys attacks in the wild against the populationof users’. We make no claim on target attacks or the so-called APTs (Ad-vanced Persistent Threats) that aim at a particular system of a particularorganisation. For this reason we distinguish between dedicated and averageattackers. A general model for the former type of attacker may be hard todesign mainly because the attacker’s motivation and target can be hard topredicted a-priori [62], and there is little data available to investigate thisthreat [28]. Consequently, evaluating the risk represented by a dedicatedattacker is a rather pointless task as this is strongly case-dependent.
Case control studies represent a strong aid toward the internal and ex-ternal validity of one’s conclusions. Yet, they are not quite as powerful as
33

2.5. Research methodology and scope of work Chapter 2
a (controlled) experiment setting is [128]. In particular, because in a casecontrol study not all aspects of the ‘experiment’ are under the control of theresearcher (e.g. data is collected elsewhere through an only partially knownprocess), it is hard to build ‘causal links’ between an hypothesis and an ob-servation. Rather, a case control study is limited to highlight the correlation(as opposed to causation) between the two.
34

Chapter 3
Measuring Vulnerabilities, Exploits,and Attackers
3.1 Software Vulnerabilities and Measures
One of the first large-scale studies on the life-cycle of a vulnerability has beenconducted in 2004 by Arora et al. [20], where they evaluated how differentvulnerability disclosure policies impact the velocity of patch and exploit ar-rival. They find that patching response time largely depends on vendor size,and that public disclosure of the vulnerability increases both the rapidity ofthe patching action and the arrival of the first exploit. This approach hasrecently been expanded by Shahzad et al. [108], who used data from pub-lic vulnerability sources [9, 10] to estimate vendor’s performances by eval-uating the average severity of the disclosed vulnerabilities and the averagetime between patch release and vulnerability disclosure. Unfortunately, thecomplexities of the vulnerability disclosure process [81, 105, 38] make thesecomparison hardly significant and representative of the real performance ofthe vendor. For example, certain vendors may have more ‘hackers’ or ‘secu-rity researchers’ interested in finding critical vulnerabilities in their softwarethan the ‘average vendor’ . Moreover, real patching and disclosure timesare ‘obscured’ by the disclosure process itself and therefore, to say it in the
35

3.1. Software Vulnerabilities and Measures Chapter 3
words of the authors of NIST’s NVD dataset, “the computation of patchtimes and exploit times would contain errors of unknown size.” [9, 105]. Forthis same reason, the identification of so-called zero-day vulnerabilities (i.e.vulnerabilities exploited in the wild before being disclosed to the vendor)can be tricky. [108], by comparing exploit dates on OSVDB with disclosuredates on NVD, find that about 88% of vulnerabilities have a zero-day ex-ploits. A figure in sharp contrast with this estimation is given by [28] who,by analysing records of attacks in the wild provided by Symantec, find thatonly a handful of vulnerabilities have an exploit in the wild before the date ofdisclosure. The vulnerability discovery process has been extensively studiedin literature. ‘Vulnerability Discovery Models’ (VDMs) aim at modelling theoverall number of vulnerabilities that will affect a certain software at a givenpoint in time. Alhazmi et al. propose an exhaustive analysis of the mainVDMs proposed in literature [15]. While numerous case studies are provided,including Operating Systems [16] and server software [129], the applicabilityof VDM remains uncertain [86].
3.1.1 The Common Vulnerability Scoring System
On top of the difficulties represented by estimating vulnerability and exploitdisclosure and patch availability, remains the more general problem of ‘mea-suring’ the criticality of a vulnerability. The Common Vulnerability ScoringSystem (CVSS) [79], at its second version at the time of writing, is thestandard-de-facto vulnerability metric used in the industry1. A CVSS scoreis assigned to each disclosed vulnerability, identified by a CVE-ID (CommonVulnerabilities and Exposures IDentifier). The CVSS score has been designedto give a readily available and standardised measure of the potential impactof a vulnerability over a system. Unfortunately its usage often deviates fromits definition, and is often employed as a risk metric instead.Although CVSS
1The release of CVSS v3 is scheduled to happen in June 2015
36

Chapter 3 3.1. Software Vulnerabilities and Measures
resembles the form of a risk metric (Score = likelihood× impact), the char-acterisation of the ‘likelihood’ variable is not clear in the CVSS case [30].This is also reflected in the words of one of the authors of the CVSS score:“CVSS does not, and never has, made the claim that base score is significantlycorrelated with exploit probability” [100].
The CVSS framework considers three separate metrics: the base metric,the temporal metric, and the environmental metric. The first characterisesthe technical details of the vulnerability. The second captures characteristicsthat may vary with time, such as the existence of a patch, a known exploit,or of a workaround for the vulnerability. The third considers additional envi-ronmental factors to tailor the final estimation to the particular environmentsubject of the analysis. However the Temporal and Environmental metricsare not normally assigned to a vulnerability at the time of disclosure. Rather,the assessment along these metrics has to be carried within the vulnerableorganization. Moreover, standards and common practices explicitly indicatethe base score to be used for the assessment of the vulnerability [40, 95]. Forthis reason, we will limit this discussion to the latter.
The CVSS base score is divided in two submetrics: Exploitability andImpact. The former characterises the ‘easiness’ of exploitation of the vulner-ability by measuring the complexity of its exploitation, how ‘remote’ from thesystem the attacker can be to deliver the exploit, and whether the attackerhas to be authenticated on the system. From its composition it is easy to seewhy ‘Exploitability’ is often regarded as ‘likelihood of exploitation’: the eas-iness of exploit is interpreted as a proxy for likelihood of exploit. Althoughthis claim has already been questioned [30], it is often implied in literature[108, 83, 38]. The CVSS ‘Impact’ metric provides an estimation of the impactof the vulnerability exploitation on the vulnerable system in terms of poten-tial loss in Confidentiality, Integrity and Availability of the data. Table 3.1reports a summary description of the CVSS base score submetrics.
37

3.1. Software Vulnerabilities and Measures Chapter 3
Table 3.1: Summary table of CVSS base score metrics and submetrics.Impact Exploitability
SubMetric Description SubMetric DescriptionConf. Loss in data confidentiality Access Vector Where can the attacker at-
tack from (e.g. remotely)Integ. Loss in data integrity Access Complexity Whether the successful ex-
ploitation depends on fac-tors outside the attacker’scontrol.
Avail. Loss in service availability Authentication Whether the attacker needsto be logged in the system.
3.1.2 Vulnerability and patch management
Recent studies showed that several months pass between the release of a vul-nerability patch and its application on the software [84]. In the literature,users’ failure to take basic security measures has often been attributed tothe incomplete model users have of cybersecurity threats [125, 37]. In anenterprise setting, patch management becomes critical as the application ofsoftware patches may break untested functionalities or dependencies, as wellas causing downtimes that can affect system productivity [107, 54]. Thetrade-offs associated with patch management have often been pointed out inthe literature [107, 36, 34]. Among these, Serra et al. [107] recently sug-gested a Pareto-optimal approach to vulnerability patching in enterprises,that merges attack graphs and vulnerability measures to maximise vulnera-bility coverage and system functionality. Similarly, Okhravi et al. [88] studythe optimal amount of pre-patching testing that should be carried out inorder to guarantee the best response time to the vulnerability disclosure andthe best possible system uptime. Differently, Chen et al. [36] address the vul-nerability patching trade-off from a slightly different perspective, and suggestthat rather than diminishing the attack surface of the system or network [68]
38
Chapter 3 3.1. Software Vulnerabilities and Measures
by applying software patches, it may be possible to obtain a similar resultthrough software diversity. The rationale is that, because vulnerability ex-ploits and malware are platform-specific, system diversity will substantiallyincrease the cost of traversing the attack graph for the attacker. In fact, anexploit shellcode or a piece of malware engineered to work on a specific plat-form (e.g. Windows 7, service pack 1), will not necessarily work on similarbut not identical platforms (e.g. Win 7, SP 2) even if the vulnerability isstill there. Differentiating the platform type entirely adds an additional layerof complexity as an attack against a Windows platform must be completelyre-engineered to work on a Linux or MacOS or *nix platform [110, 106].
The economics of vulnerability patching have also been considered in theliterature, both in terms of patching efficiency [31] and from a game-theoreticperspective [35, 34]. Additionally, Gordon and Loeb [55] showed that themost economically viable patching solution may be one that leaves the mostvaluable assets vulnerable. This depends on the distribution of patchingcosts over assets. These economic aspects are especially interesting as thedecision to patch a vulnerability has several consequences that are not limitedto emerging technical issues or difficulties; on the contrary, in the literaturehas been shown that the decision to patch or not patch a vulnerability hasexternality effects lowering the general level of security due to the decentral-isation of the patching decision [27], can affect stock prices [117], and cancause damage to non-vulnerable users (either because they have already ap-plied the patch, or because they are not vulnerable - i.e. they don’t havethe vulnerable appliance installed on the system). These externalities havealso been considered in the developing the new version of the Common Vul-nerability Scoring System (v3) that, with the inclusion of the Scope metric,effectively measures whether the effect of a vulnerability resides on a different‘system’ than the vulnerability itself [116].
39

3.2. Security Actors and Threats Chapter 3
3.2 Security Actors and Threats
To the aim of this thesis, we identify three main players relevant in thesecurity management scenario: the software developer, the defender, and theattacker.
The software developer is the player who develops the software and typ-ically has to maintain it by deploying software patches. The software in-terested by the security process can be either an open source software or aclosed source software. The main difference between the two models is thatopen source code can be audited (and is written) by the user and developercommunity, while in closed source software this is not possible. In both casesvulnerability patching is an expensive process [71], and vendor performancemay vary. A number of studies tried to identify ‘good’ and ‘bad’ softwarevendors that respond quicker to the vulnerability disclosure [108, 20]. Theorganisational and reputation costs attached to the patching and disclosureof a vulnerability are often high2, and different disclosure and mitigationpolicies may emerge for different software vendors. For example, to containcosts of both type CISCO Systems discloses only ‘high severity vulnerabili-ties’ in their security advisories, while remaining vulnerabilities are disclosedthrough less prominent channels [5]. Accounting for this, no significant differ-ence in patching behaviour between open and closed source software vendorsis found [105], as otherwise often implied [108, 21].
The defender is the actor that has to deploy the patches to defend againstthe attacker and maintain the service continuity of the system or network.Patch deployment is a critical moment in system maintenance that sees onthe one hand a better overall system security, and on the other the risk of ‘ser-
2While exact figures on the cost of patching are hard to find and may vary significantly betweensoftware developers, a representative of a major European player estimated, in a private conversationwith the author, that only acknowledging that a bug exists in the code costs for them about 100 US $,let alone verifying whether the bug represents a security threat, fixing it and testing and deploying thepatch.
40

Chapter 3 3.2. Security Actors and Threats
vice disruption’ as the deployed patch may ‘break’ some functionality criticalto the normal operation of the system [36]. For this reason, the criticalityof the patch deployment process increases with the number of vulnerabilitiesto fix. Deploying all available patches immediately is usually not feasiblein practice [36, 107] for technical and organisational reasons3, and availabledata shows that indeed patching waiting times on users machines can varywidely [84]. Vulnerabilities to patch are therefore ordered in a queue, usuallyfollowing a measure of vulnerability severity [95, 40]. A number of interna-tional standards and best practices exist to aid the system administrator inthis process. Two notable examples are the NIST SCAP protocol [95], thesoftware security management guidelines proposed by the NIST, and PCI-DSS [40], arguably the most applied international standard used for securingcredit card transactions. On top of this exist a plethora of industry toolsby Symantec, Rapid7, Qualys etc. that aim at helping the system admin-istrator to prioritize patching work. All these approaches (standards, bestpractices, or commercial solutions) have a common denominator: the use ofthe Common Vulnerability Scoring System (CVSS in short) as a metric forvulnerability risk.
The hacker is the actor that finds and exploits the vulnerability. Theterm ‘hacker’ originally identified ‘curious’ and technologically-oriented ac-tors whose main goal was to understand the inner functionalities of a pieceof technology, a software, or a process [115, 120]. More recently, this ‘re-verse engineering’ capability has been put in use by cyber-criminals to exploitsoftware design and implementation flaws to modify the normal operationalfunctionalities of the ‘hacked’ object (being that a telephone, a software, or ahuman answering a phone call or reading an email) to their advantage. Thefigure of the hacker remains however split in two main categories: white hats
3These include testing all the patches and their dependencies to assure that system and service func-tionality will not be affected, distributing the patch to the organisation’s vulnerable systems, and ad-dressing potential issues that may arise after the update
41

3.3. Markets for Vulnerabilities Chapter 3
and black hats. The former are hackers that find vulnerabilities in software,write ‘proof-of-concept’ exploits, and ultimately disclose the vulnerabilityeither directly to the vendor or to some third-party organisation such asiDefense or the Zero-Day Initiative. The white-hat has traditionally beena ‘free-lancer’, i.e. a security researcher that looks independently at soft-ware vulnerabilities and tries to sell them to the interested party [81]. Thewhite-hat hacker is however often faced with the inherent difficulties of thevulnerability disclosure process, which may make the effort itself of disclosingthe vulnerability not worth it. As noted by Miller [81], the vendor is oftenunhappy with the disclosure, and sometimes the hacker can face legal action.Recently the professional figure of the white-hat hacker changed to that of a‘corporate white-hat’, i.e. a white hat that is now contracted by a corpora-tion to find vulnerabilities in software (not necessarily of its own production).One notable example of this is Google’s Project Zero [6], a project run byGoogle where hired white-hat hackers look for vulnerabilities in software, in-cluding Google’s competitors’ such as Microsoft and Apple. Similarly, thefigure of the black-hat hacker has also gained momentum: black-hat hackersmoved from the solitary, self-employed figure of the cybercriminal to moreorganised underground activities where the hacking is aided by a multitudeof technical and infrastructural resources [58]. The figure of the black-hathas also been explored from a social standpoint [65, 120, 115].
3.3 Markets for Vulnerabilities
The importance of a clear understanding of the economic incentives andmechanisms standing behind the information security process have been out-lined several times in literature [53, 17, 121, 90, 55]. New markets for in-formation security have recently been proposed: for example, auction-basedmarkets for vulnerability disclosure [90] have been suggested in the past, and
42

Chapter 3 3.3. Markets for Vulnerabilities
bug bounty programs [51] are nowadays becoming more and more popular.These initiatives partially address the problems attached to vulnerabilitymining and disclosure that Miller outlined in 2007 at WEIS [81]. As alsooutlined by Van Eeten et al. [121], market for malware and vulnerabilitiesoffer sometimes perverse incentives that can undermine the security propertythey are supposed to enforce. For example, Asghari et al. [24] showed thatthe market incentives behind the release of cryptographic certificates (e.g.used to encrypt and sign the content retrieved from a web server) make moreconvenient to adopt bad security practices when releasing a certificate, orto hide entirely the compromise of a Certification Authority (as it alreadyhappened several times in the past [104]). Similarly, software vendors mayhave market incentives that go in the opposite direction of vulnerability dis-closure [3, 117] and patching [55]; this, in turn, may discourage the securityresearcher from disclosing the vulnerability to the vendor in the first place,and may encourage instead the selling of the vulnerability to criminals. Thedebate on the best vulnerability disclosure strategy has been a prolongedone [20, 91, 23, 39], and is still not completely sedated [12]. Vulnerabilitydisclosure may affect the reputation of the vendor, and indeed in the litera-ture have been reported significant effects of vulnerability disclosure on themarket value of the firm [117]. On top of this, the hacker who wants to sellthe information about the vulnerability to the vendor has to ‘prove’ thatthe vulnerability exists without revealing too much information (otherwisehe/she effectively gives the vulnerability away). Moreover, the issue of fairvulnerability pricing remains: how to evaluate the market price of a vulner-ability? Bug bounty programs are now run by many major players in theIT industry, including Google, Microsoft and Facebook. A bug bounty pro-gram effectively encourages the disclosure of the vulnerability to the vendorby fixing vulnerability prices ahead of the disclosure, for different types ofvulnerabilities. The security researcher can therefore assess beforehand the
43

3.3. Markets for Vulnerabilities Chapter 3
value of his/her finding [1], and knowns that the disclosure will not result inlegal action against him/her.
A perhaps more controversial portion of the market for vulnerabilities isdedicated to vulnerability and exploit trading between private researchers oragencies (the sellers), and governments (the buyers). Existing reports outlineprices in the order of the hundred thousands dollars [4], much higher than thetens-of-thousands figures proposed by Google. These numbers have howeverbeen disputed by agencies selling malware and cyber-attacks to governments,such as France’s Vupen and Italy’s HackingTeam. The pricing of hackingtools and the value of the cybercrime markets have been often at the centreof discussion, and figures vary again widely. McAffee and Presided Obamareport the cost of cybercrime markets to be around one trillion dollars (about6% of the United States GDP in 20144), while other figures are much moremodest [19].
One of the issues that generates such wild estimations is that cybercrimemarkets are yet not very well understood. The trading dynamics of thesemarkets, their operability and technological/economic (in)efficiencies are notfully comprehended. Cybercrime markets have recently been shown to befraught with information asymmetry problems that make the trading in themarkets effectively unsustainable [63]. Yet, empirical evidence from numer-ous studies shows that the attack tools traded in these markets do work[112, 18, 58, 26, 122], and the losses caused by cybercrime are real [57]. Howcan these observations be reconciled with the understanding that cybercrimemarkets cannot work? The explanation is that current markets are run undera different structure than IRC markets: rather than anonymous, free-to-join,unregulated communities of criminals, modern cybercrime markets are runas virtual forums [75, 18, 130, 82]. Forums provide an easy way for the com-munity administrators to control the flow of users into the community and
4http://www.tradingeconomics.com/united-states/gdp
44

Chapter 3 3.4. Attacker model and risk
to enforce, through moderation, a number of rules that can be aimed - ina coherent market design structure - at mitigating the issues of informationasymmetry [130]. The existence of operative cybercrime markets has indeedbeen reported in the literature [58, 82], and numerous studies analyzed thetechnical details behind the infection processes [93, 75] and the creation ofbotnets [111, 59]. A similar line of research also gave insights on the mechan-ics of spam [72] and diffusion of attacks [42]. Still, a precise understandingof the inner economic workings of these markets is not present in literature.
3.4 Attacker model and risk
Part of the problem that (not) understanding the economics of the attackerentails is that estimating the threat represented by the attacker is is a diffi-cult exercise. The attacker model generally (explicitly or implicitly) acceptedwhen planning security action is that of the all-powerful all-knowing attacker,an inheritance from cryptography [44]. In fairness, other attacker models ex-ist, such as the ‘Honest but curious’ attacker that rather than acting outrightmaliciously, exploits the opportunity he/she might have of exfiltrating infor-mation from some channel. This model could be for example applied to therecent Snowden case, where an insider effectively used his access rights cor-rectly until the ‘last operation’ was executed. The overall picture howeverdoes not change: the attacker can and will exploit any vulnerability on thesystem [2]. Somewhat in contrast, [93] showed that about two thirds of webattacks are generated automatically as opposed to being engineered for thatspecific attack. Moreover, the most popular cyber-criminal tools used to gen-erate these attacks [112] feature in the order of 10-15 exploits [75]. It appearstherefore that the majority of attacks may be skewed toward certain vulner-abilities only, and that assuming that the attacker can and will pursue alland every vulnerability in the system is, in most cases, unrealistic. Indeed, in
45

3.4. Attacker model and risk Chapter 3
the literature evidence exists that attackers prefer certain vulnerabilities overothers [85], and that most vulnerabilities remain simply unexploited [114].The disparity between the current perception of the attacker and the trendsshown in the data challenges the (conservative) intuition that ‘one vulnera-bility is too many’. Yet, this philosophy is at the root of any standard orbest practice for vulnerability and risk mitigation [40, 95], that requires ac-tion to be taken over effectively almost any vulnerability. This perceptionleads to ‘naive’ risk metrics whereby the risk is calculated as the sum of thevulnerabilities CVSS scores multiplied by the number of vulnerabilities withthat criticality level [83]. More elaborated metrics of exposure to attacksexist [67, 124]; still, the substance remains the same: count the number ofvulnerabilities in the system and use some criticality score such as CVSSto estimate the impact and the likelihood of an attack to happen. None ofthese methodologies account for the strong skew in attacker preferences con-sistently present in historical attack data [85, 114], and substantially rely onthe ‘allmighty attacker’ model5.
5 The overestimation of the attacker capabilities (and/or willingness to attack) is a common problemin security, that sometimes leads to important (and unfounded) consequences [73].
46

Chapter 4
Data Collection
4.1 Vulnerabilities and Attacks in the Wild
In this Chapter we provide a comprehensive description of our datasets andthe respective collection methodologies. Table 4.2, at the end of this Chapter,provides a summary of our collection efforts.
The universe of vulnerabilities. The National Vulnerability Database (NVD)is NIST’s database for disclosed vulnerabilities. It reports a list of disclosedvulnerabilities that have been confirmed by software vendors, identified bythe universal identifier ‘CVE-ID’ (Common Vulnerabilities and ExposuresID). Along with a description of the CVE, the dataset reports the vulnerablesoftware and relevant software versions, and the CVSS base score associatedwith the vulnerability. Additional details on the technical properties of thevulnerability are also reported in NVD via the CVSS vector that specifiesthe value for each CVSS metric.
Data collection methodology: This dataset is publicly available at http://nist.nvd.gov.
The “white hat” exploits market. White-hat hackers report vulnerabilities tovendor and release proof-of-concept (PoC) exploitation code to demonstrate
47

4.1. Vulnerabilities and Attacks in the Wild Chapter 4
the existence of the vulnerability. Datasets that report disclosed PoCs arethe Exploit database (EDB) and the OpenSourced Vulnerability DataBase(OSVDB). Both these datasets cooperate with the Metasploit framework togather data on exploits. However, it is important to note that, if an exploitis featured in EDB or OSVDB, it is not evidence that some company or indi-vidual actually reported to have suffered the exploitation in the wild. It onlymeans some proof-of-concept exploitation code is known to exist. Moreover,proof-of-concept exploitation code may be hardly capable of crashing thevulnerable application, rather than allowing the attacker to actually exploitthe vulnerability.
Data collection methodology: This dataset is publicly available at http://www.exploit-db.com. However, the archival version of the dataset doesnot directly refer to the CVE-ID of the vulnerability affected by the proof-of-concept exploit. In order to obtain this data, we built a Python scriptthat collects the correct CVE-ID based on the exploit ID reported in thedownloaded dataset.
The black markets for exploits. The EKITS dataset is a collection of vul-nerabilities whose exploits are traded in the black markets and are bundledexploit kits (widely used attack tools in the underground [58]). Among theexploit kits considered for our study, we have the “most popular” ones asreported by Symantec in 2011 [112]. After a long process of ethnographicresearch, EKITS comprises almost 900 entries and 103 unique CVEs tradedin the black market. Vulnerabilities included in the EKITS dataset affectonly client-side and consumer applications running on Windows.
Data collection methodology: EKITS is partially based on Contagio’s Ex-ploit Pack Table, from where we got the names of the most popular exploitkits and some CVE entries. We expanded this list in both the list of exploitkits available in the markets, and the list of vulnerabilities bundled in the kits.
48

Chapter 4 4.1. Vulnerabilities and Attacks in the Wild
To do so, after much ‘ethnographic research’ we infiltrated the black marketsand monitored the tools and vulnerabilities advertised there. A more precisedescription of the infiltration process is given in Section 4.2. To keep the listof vulnerabilities updated we created a web parser (in Python) that, hiddenbehind a TOR proxy, would scrape daily the main market page for new en-tries matching several (Cyrillic) keywords such as “связк*” (kit), “отстук”(the term commonly used to describe exploit success rates), “цен*” (russianfor ‘price’), and many others. The script’s goal was to identify potentiallyinteresting discussion topics in the forum markets. The integration of thisdata in EKITS was manual. This was a necessary step to perform given theimpossibility of reliably parse Cyrillic text that often involves technical slangor abbreviated terms / typing errors.
Exploits in the wild. Obtaining reliable data on exploits in the wild is chal-lenging. Companies are not prone to release data on the cyber-attacks theysuffered from, for obvious commercial and reputation reasons. To the bestof our knowledge, no reliable or reputable source for attacks against corpo-rations exists yet. On the contrary, more reliable data can be found for non-targeted attacks. Symantec keeps two public datasets of signatures for localand network threats: the AttackSignature1 and ThreatExplorer2 datasets.These datasets contain all the entries identified as viruses or network threatsby Symantec’s commercial products at a given moment. Our SYM databaseis directly derived from these sources. However, it must be pointed out thatthis dataset is, by construction, limited to threats that Symantec identifies.These therefore mainly include threats directed against home systems, whichare not, in general, victims of targeted attacks.
Data collection methodology: this dataset is publicly available on Syman-
1http://www.symantec.com/security_response/attacksignatures/2http://www.symantec.com/security_response/threatexplorer/
49

4.1. Vulnerabilities and Attacks in the Wild Chapter 4
tec’s Security Response website. However, the dataset is largely unstruc-tured with respect to the vulnerability information we are interested into,as it only reports a general description of the detected attack signature. Inorder to assess whether we could meaningfully use the dataset to collect ex-ploited vulnerabilities, we sustained an extensive exchange with Symantecrepresentatives to understand the nature of the available data and whethera reported CVE could be considered the CVE affected by a certain attacksignature. From our exchange resulted that Symantec’s effort in reporting aCVE in their attack signature description has substantially improved after2009, with the initiation of their data sharing program WINE. Furthermore,we got assured that the reported CVE are always relevant to the affectedsignature. Because of the unstructured nature of this dataset, we built twoindependent parsers (the second one has been written by Dr. V.H. Nguyen)and checked that the result was the same. We are therefore confident thatour data collection and interpretation is complete and correct with respectto Symantec’s data creation process.
Records of attacks in the wild. Symantec runs a data sharing program,the Worldwide Intelligence Network Environment, or WINE in short3. Theintrusion-prevention telemetry dataset within WINE provides informationabout network-based attacks detected by Symantec’s products. WINE is in-dexed by attack signature IDs, unique identifiers for an attack detected bythe firm’s security solutions, which can be linked to the affected CVE, if any,through Symantec’s Security Response4 dataset (i.e. SYM). Data for theexperiments reported in this thesis is referenced and available for sharing atSymantec Research Labs under the WINE Experiment ID WINE-2012-008.
Data collection methodology: in order to have access to the WINE dataset
3https://www.symantec.com/about/profile/universityresearch/sharing.jsp4https://www.symantec.com/security_response/
50

Chapter 4 4.2. The Underground Markets
Table 4.1: Summary of our datasetsDB Content #EntriesNVD CVEs vulnerabilities 49.624EDB Publicly exploited CVEs 8.189SYM CVEs exploited in the wild 1.289EKITS CVEs in the black market 103WINE Records of attacks in the wild 75.000.000
researchers have to write a research proposal that is subject to Symantec’sinternal review process. We wrote and got our proposal accepted in May2012. Access to the WINE platform is possible only in loco over at Syman-tec Research Labs. It was therefore necessary to extensively prepare theexperiment before moving to the other side of the ocean to perform the datacollection. Given the extension of the WINE dataset this preparation phaselasted several months during which frequent calls and e-mail exchange withSymantec where necessary to make sure the experiment design was correct.To complete the design phase we used the database schema of WINE and aVM provided by Symantec.
Table 4.1 summarizes the content of each dataset and the collection method-ology. The datasets are available for the scientific community upon request.
4.2 The Underground Markets
From September 2011 to November 2011 we performed an informal analysiswith security experts working in the cybercrime domain to identify the mostprominent markets in the underground. These resulted to be all run in Rus-sian, with a few exceptions only. The results of that analysis identified onemarket in particular, HackMarket.ru5, that was very active and where the ma-
5HackMarket.ru is a fictional name we attribute to the market to not hinder future research.
51
4.2. The Underground Markets Chapter 4
jor players of the cybercrime community allegedly operate. In November 2011we infiltrated HackMarket.ru and observed that there we could find for tradeall the attack tools and malware pieces reported as ‘most prominent in theunderground’ by multiple industry reports [112, 26, 111, 77, 70, 76], as well asthe most influential malware authors such as Paunch [8] and others. We keptmonitored other markets as well, but those revealed to be not top-of-the-classmarkets, where few tools where actually advertised and where interested cos-tumers were much less active when compared to HackMarket.ru. We thereforekeep HackMarket.ru as our case study of an underground market. The parserwritten to build the EKITS dataset was originally designed to monitor Hack-Market.ru as well as the other markets, but for the aforementioned reasons itis now built around HackMarket.ru exclusively.
4.2.1 Markets description
Carders.de In 2010 an online underground market for credit cards and otherillegal goods, Carders.de, have been exposed by a hacking team named “inj3ct0r”and leaked, at the time, through underground channels (i.e. a Google searchwouldn’t help) [82]. We obtained the original dataset through side channels.We have no means to assess whether the dataset was manipulated. Directcomparison with other releases of the dump show no difference. The leakedpackage contains a Structured Query Language (SQL) dump of the database,a copy of the Owned and Exp0sed Issue no. 1 (documenting the leak) and anadded text file containing all private messages on the forum. By examiningthe added notes Owned and Exp0sed Issue no. 1 we were able to create areplica of the original Carders.de forum. This allows us to explore market op-erations, evaluate the reputation mechanisms that were implemented at thattime, and go through users’ posting history and dates. The data consists offorum posts and private message records spanning 12 months from 1 May,2009 to May 1, 2010 containing a total of 215.328 records.
52

Chapter 4 4.2. The Underground Markets
HackMarket.ru HackMarket.ru is a market for exploits, botnets and malware.It is also one of the main markets that introduced exploit-as-a-service [58]in the cyberthreat scenario, as we find there the main players and productsthat the industry reports be driving the majority of reported web-attacks[113]. Indirect evidence of this markets’ efficacy is the recent burst in cy-berattacks driven by means of tools, services and infrastructures traded orrented in these markets [58, 111, 18]. HackMarket.ru appeared in 2009 in theRussian underground. Differently from Carders.de, HackMarket.ru has a flattrading structure, whereby traders all participate in the same marketplace.In contrast to other hacker fora studied in the literature [65], it is not public.HackMarket.ru is run in Russian, and very little interaction happens in En-glish. The trading sections in this market are, like in Carders.de, organisedby ‘topic of interest’. The virus-related area of the market is by far the mostpopular one, with tens of thousands of posts at the time of writing. Othergoods of interest for the marketeers of HackMarket.ru are ‘Internet traffic’(i.e. redirectable user connections for spam or infection purposes), stolen ac-cess credentials, access to infected servers, spam, bank accounts, credit cardsand other compromised financial services. To access the market the forumadministrators perform a background check on the participant, that has toprovide additional profiles that provably belong to him/herself on other un-derground communities. We joined this community in 2011 and remainedundercover since. For HackMarket.ru we do not have an SQL dump of themarket, but we will provide instead first-hand evidence that the problemswe highlighted for Carders.de are not present here. We index our qualitativeanalysis by referencing internal archived references taken from HackMarket.ruin the format [ID n], with ID being an internal code we use to classify theevidence and n being the document number.
53

4.2. The Underground Markets Chapter 4
4.2.2 Infiltrating HackMarket.ru
To infiltrate HackMarket.ru has proven to be a far from simple task. Weinfiltrated HackMarket.ru twice, as our first account was banned from themarket. The two operations have been characterised by very different prob-lems we had to address. The first time, the real issue has been to identifya significant and interesting market to infiltrate. Choosing HackMarket.ruas a market representative for cybercrime operations was possible only aftermuch ethnological research on several other underground communities. Notspeaking Russian and lacking of scientific guidance from the literature (wheredata analysis involving underground markets is performed over leaked datarather than data collected first-hand) made things worse in this respect. Thisresearch effort lasted about three months. Once found and selected Hack-Market.ru, the first obstacle was to have access to the communities withoutexposing the University or myself to future possible hazards. The obvioussolution to this has been to access the communities only behind the TORnetwork. In order to first access the markets we registered an email addresswith a Russian domain and compiled a ‘user description’ in correct Russian,with the help of a colleague, Anton Philippov. This was enough to have ourfirst access to the community granted. This however lasted a few monthsonly, after which we were banned from accessing the forum. This ban andthe additional segregation of the community that followed was motivated bythe arrest of one prominent member of the market community: Paunch, theauthor of the infamous Black Hole exploit kit6.
To re-enter the community proved to be substantially harder than in ourfirst try. The community closed the entrance to anybody who was not explic-itly selected by the forum administrators. We often tried to re-subscribe withseveral different (fictitious) identities, but systematically failed7. The effort
6http://krebsonsecurity.com/2013/12/meet-paunch-the-accused-author-of-the-blackhole-exploit-kit/7The author, not trusting free proxy services in Moscow, exploited a personal trip to Russia to use a
54

Chapter 4 4.2. The Underground Markets
required to re-access the markets lasted several months, and was partiallyperformed with the help of Stanislav Dashevskyi. We employed a bottom-upapproach: the idea was to study the low-end markets as a means to accessthe high-end market we were (re-) aiming for. We infiltrated several of thoseand, with the help of Stanislav, built a profile for each community, tryingto outline those that are the most tied with HackMarket.ru. Research overthese communities was aimed at outlining the social, linguistic, and technicalcharacteristic of a ‘typical’ market participant in these communities. Lever-aging this understanding, we built a user profile on one market communitywe selected for its apparent closeness to HackMarket.ru. This process lastedabout 6 months. We then applied to access HackMarket.ru again and gaveas a credential our participation in the other community. This attempt wassuccessful. We are now ‘mild participators’ in the community, in order toavoid running in the same problem again were other prominent members ofthe community arrested.
Saint Petersbourg IP address to attempt a new subscription, but with no success.
55

4.2. The Underground Markets Chapter 4
Table4.2:
Summaryof
data
andcollectionmetho
dologies.
Dataset
CollectionMetho
dology
Typ
eof
analysis
Collectioneff
orts
NVD
XMLpa
rsing
Qua
ntitative;
Exp
loratory;
Casecontrols
tudy
Dow
nloa
d
EDB
Web
parsing
Qua
ntitative;
Exp
loratory;
Casecontrols
tudy
Dow
nloa
dan
dbu
ildweb
parsers
SYM
Web
parsing
Qua
ntitative;
Exp
loratory;
Casecontrols
tudy
2weeks.DiscussionwithSy
man
tecto
understand
theircollectionan
drepo
rt-
ingprocess.
EKIT
SMan
ual
exploration
+Con
tagio’sExp
loit
pack
table
Qua
ntitative;
Exp
loratory;
Casecontrols
tudy
;Field
data
6mon
ths.
Infiltration
ofthe
black
markets;bu
iltstealth
parsers;
ethn
o-grap
hicresearch.
WIN
EParticipa
tion
inSy
man
-tecInc.’s
WIN
Eproject
Qua
ntitative;
Field
data
8mon
ths.
Propo
salto
Syman
tec;
project
valid
ation
and
preparation.
VisitingSy
man
tecoversea(2
weeks).
Car
ders
.de
Collection
throug
hside
chan
nels
Qua
litative;
quan
titative;case
stud
yFindtheda
taset.
Hac
kMar
ket.ru
Marketinfiltration
Qua
litative;
quan
titative
(only
forpa
rticipan
trepu
tation
lev-
els);c
asestud
y
1.5yearsforan
alysis
andda
tacollec-
tion
.Add
itiona
l3mon
thsforfirst
en-
try,
and6mon
thsforsecond
entry.
56

Chapter 5
Data Exploration
In this Chapter we provide a first explorative description of our datasets.In particular, in Section 5.1 we outline a map of vulnerabilities to see howdo our datasets overlap and how the CVSS score for vulnerability severityis mapped over exploits in the wild and disclosed vulnerabilities. In Section5.2 we look at our WINE data to explore how vulnerability exploitation (andtherefore vulnerability risk) is distributed among vulnerabilities.
5.1 A Map of Vulnerabilities
In the following we provide a first high-level view of the problem with criticality-based vulnerability management practices that ultimately use the CVSS scoreas an ordering metric for vulnerability mitigation. Figure 5.1 reports a Venndiagram of our datasets. Area size is proportional to the number of vulnera-bilities that belong to it; the color is an indication of the CVSS score. Red,orange and cyan areas represent HIGH, MEDIUM and LOW score vulnerabilitiesrespectively. This map gives a first intuition of the problem with using theCVSS base score as a ‘risk metric for exploitation’: the ‘red vulnerabilities’located outside of SYM are ‘CVSS false positives’ (i.e. HIGH risk vulnera-bilities that are not exploited); the ‘cyan vulnerabilities’ in SYM are instead‘CVSS false negatives’ (i.e. LOW and MEDIUM risk vulnerabilities that are ex-
57

5.1. A Map of Vulnerabilities Chapter 5
Figure 5.1: Map of vulnerabilities per dataset. Overlapping areas represent commonvulnerabilities among the datasets, as identified by their CVE-ID. Area size is proportionalto the number of vulnerabilities. In red vulnerabilities with CV SS ≥ 9. Medium scorevulnerabilities (6 ≤ CV SS < 9) are orange; low score vulnerabilities are cyan and haveCV SS < 6. CVSS scores are extracted from the NVD database as indexed by therespective CVE-ID. The two small rectangles outside of NVD are vulnerabilities whoseCVEs were not present in NVD at the time of sampling. These CVEs are now present inNVD.
ploited). A relevant portion of CVSS-marked vulnerabilities seem thereforeto represent either false positive or false negatives.
5.1.1 CVSS score breakdown
In this Section we perform a breakdown of the CVSS Impact and Exploitabil-ity subscores (see Table 3.1) in our datasets.
Breakdown of the Impact subscore
Figure 5.2 depicts a histogram distribution of the Impact subscore. Thedistribution of the Impact score varies sensibly depending on the dataset.For example, in EDB scores between six and seven characterize the great
58

Chapter 5 5.1. A Map of Vulnerabilities
NVD
Impact score
Fre
quen
cy
0 2 4 6 8 10
050
0015
000
EDB
Impact score
Fre
quen
cy0 2 4 6 8 10
020
0040
00
EKITS
Impact score
Fre
quen
cy
0 2 4 6 8 10
020
4060
80
SYM
Impact score
Fre
quen
cy
0 2 4 6 8 10
020
040
060
0
●
●
●●
●
●●●●
●
●
●●
●
●●●●●
●
●●
●
●●
●●●
●●●●●●●
●
●
●●●●●
●●●
●
●●●●
●
●●●●
●●
●●
●●●●
●
●●
●
●●●●●
●●
●●
●
●
●●●●●●
●
●●●●●●
●
●
●
●●
●
●●●●
●●
●
●●●●
●
●●●●●●●
●
●
●
●
●
●●●●●●
●●
●
●●
●●●●●●
●●
●
●
●●●●
●●
●●●●●●●●●●
●
●●
●
●●●●●
●●●●●
●
●●●●●●●●
●
●
●●●
●●
●
●
●●●●●●
●
●
●
●
●●
●●
●●
●●
●
●
●
●●●
●
●
●●
●●
●
●●●●●
●
●
●
●
●
●
●●●●
●●●●●●●
●
●
●
●●●
●
●
●●●●●
●
●●
●●●●
●
●
●
●●●●
●
●
●●●
●
●●●
●
●
●
●●
●
●●●●●●●●●●●●●●●●●●●●●●●●●●●●●●●●●●●
●
●●●●
●
●●
●
●●●●●
●
●●●●●●●●●
●
●●●
●●
●
●
●
●●
●●●●●●●
●●●●●
●●
●●
●
●
●●
●●●
●●●●
●●
●
●●●
●●●
●●●●●●
●
●
●●●
●●
●
●
●●●●
●●
●●
●
●●
●
●
●
●
●
●●●●●
●●
●●
●●●
●
●
●●●●
●●●●●
●●●●●●
●●●●
●
●●●
●
●●●●●
●
●
●
●●●●●●●●●●●
●●●
●
●●●●●
●
●
●
●●
●
●●●●
●
●
●●
●
●
●●●●●●●●
●●
●●●●●●●●●●●
●●●
●
●●●
●●●●●●
●
●
●
●●
●
●●●
●
●
●
●●●
●●
●
●
●●●●
●
●●
●●●●●●●●●
●
●
●●●●●●
●
●
●●●
●
●●
●●
●●●●
●
●
●●●●●
●●●●●
●●
●
●
●
●
●
●●●●●●
●
●●●●●●●
●
●
●
●●
●●
●●
●●●
●●●●●●
●
●●
●
●●●
●
●●
●
●●
●
●
●
●●●●●●●●
●
●
●●
●●
●●
●
●●●●
●●●●
●●
●
●
●
●
●
●
●●●●●●●●●
●●●●
●
●●
●
●
●●
●
●●
●
●●
●
●●●●●
●
●●
●●●
●●●
●
●●
●●●●●●●●●
●
●
●
●●●●
●
●●●●●●●
●●●●●
●●●●
●●
●
●
●●
●
●
●●●
●
●●●
●●●
●●
●●●
●
●
●
●
●
●●
●●
●
●●●
●
●●
●●●
●
●●●●
●
●
●●●●
●
●●●
●
●
●●
●
●
●
●
●
●
●
●
●
●●●
●
●
●
●
●●●
●
●
●
●
●
●●●
●
●
●
●
●●●●
●●●●
●
●
●
●●●
●●●
●
●
●
●
●
●●
●
●●
●
●
●●●●●
●
●
●
●●●
●●
●●
●
●●
●●●●●●
●
●●●●●
●●
●●●●●●
●●●●
●
●
●
●●
●●
●
●
●
●
●●
●●
●
●
●●
●
●
●●
●
●●
●
●
●
●
●
●●●
●
●●
●
●
●●●●●●●
●
●
●
●●
●●●
●●
●●
●
●●
●
●●●
●●●
●
●
●●
●
●
●
●●●●●
●
●
●●
●●
●
●●
●●
●●●●●●●●●●●
●●●●
●
●
●
●
●●
●●●●
●
●
●
●●●
●
●
●
●●●●●●
●
●
●
●●
●
●
●●●
●●●●
●●
●
●
●
●
●●
●
●●
●●●●
●●●
●●●●●
●●
●●
●
●
●
●
●●
●
●
●
●●●
●
●●
●
●
●●
●
●●
●
●●●
●
●●
●
●●●
●●●●
●
●
●●
●
●
●
●
●●●●
●●
●●●●●
●
●●
●
●●●
●
●
●
●●
●
●
●●
●
●●
●●
●●●
●●●
●
●
●
●●
●
●
●
●
●
●
●
●
●●●
●
●●●
●
●
●
●●
●
●●
●●
●
●●●
●●●●
●●●
●●
●
●
●●
●
●
●●
●●●
●
●
●●●
●●
●
●●
●●
●
●
●
●
●
●
●●
●
●
●
●●
●
●●●●
●●
●●●●●
●●●
●
●●●
●
●
●
●●
●
●●●●●●●●●●●●
●
●●●
●
●●●●●●●●
●
●
●
●●●●●●●●●
●
●●
●
●●
●●●●
●●●
●●
●
●
●●●
●
●●
●●
●●
●
●
●●
●●●
●●●
●
●●●●●●●●●●●●●
●
●
●
●●●
●
●●●●●●●●
●
●
●●
●●
●
●
●
●
●●●●●
●●●
●
●●●
●●
●●●
●●
●●●●●●●●●●●●
●
●●●
●
●
●●●●●
●
●
●
●
●●
●●●●●
●
●●
●
●●
●
●
●
●
●
●●●●●
●
●
●
●●●●●●
●
●●●
●
●
●●●
●
●●●●
●
●●●
●
●
●●●●
●
●●
●
●●
●●
●●●
●
●●●
●●
●
●
●
●●
●
●
●
●●
●
●
●●
●
●
●
●
●
●
●●
●●
●
●
●●
●
●●●●●
●●
●
●●●
●
●●
●●●
●
●●●
●
●●
●●
●●●
●●
●
●●
●●●
●●●●
●
●
●●●
●●
●
●
●●●●●●
●●
●●
●
●
●●●●
●
●●
●●●●●●
●●●●●
●●
●
●●
●
●●●
●●●
●●
●●
●●
●
●
●
●●●
●
●
●●
●●●●●
●
●
●●
●●
●●●
●
●●●●●●●
●
●
●
●
●
●
●●●
●
●●
●●●
●●
●●
●●
●●
●
●
●●●
●●
●
●●●
●●
●●
●●●
●
●
●
●●●
●
●
●●
●
●
●●
●
●
●●
●
●●
●
●●
●●●●●●●
●●
●●
●
●
●
●
●
●●●
●
●
●
●●
●●●
●●●
●●●●●●
●●
●
●
●
●●
●
●
●
●●●
●●
●
●
●●
●●
●
●
●●
●●●
●
●●●●
●
●
●
●
●
●●
●
●●
●
●
●
●
●●
●
●
●●
●
●●
●●●●
●●
●
●●●
●
●●
●●
●●
●
●
●
●
●●
●
●
●
●
●
●
●●
●●
●
●●
●
●
●●●
●
●●
●●
●
●
●
●●●●
●●●
●
●●●
●●
●
●●●●●●●●●●
●●●●●
●●●
●
●●●
●
●
●
●●
●
●●
●
●
●●
●●●
●
●
●
●●●
●
●
●●●●●
●●●
●
●
●●●
●●●
●
●
●
●●
●
●
●●
●●●
●
●●●
●●●
●
●●
●
●
●
●●●
●●●●
●
●●
●
●
●
●
●
●
●
●
●●
●●
●
●
●
●
●
●●
●
●
●●
●
●
●●
●●●
●
●●
●
●
●
●
●
●
●
●
●●
●
●
●
●
●
●●
●
●●●
●●
●
●
●
●●
●
●
●●●
●●
●
●
●
●●●
●●●●●●●●
●
●
●●
●●●●●●●●●●
●
●●
●
●●●
●●
●
●●
●●●●
●
●●●
●
●
●
●●
●●●●
●●●
●
●●
●
●
●●
●●
●●
●
●
●
●
●
●
●●●●
●●
●●●
●
●
●
●●●●●●●●●●
●●
●
●
●
●●●
●
●
●
●
●●●●●●●●●●●●●
●
●●●●●●●●●●
●●●
●●●●●●●●●●●
●
●
●
●●
●
●●●
●
●
●●●●
●●
●●●●
●●
●
●●
●
●
●
●
●●
●
●●●
●
●●●●
●●●
●●
●●●
●
●
●
●
●●●●
●
●
●
●●
●●●
●●●●●●●●●●
●
●
●
●
●
●
●
●●●
●
●
●
●
●
●●
●●
●●
●●●
●
●
●
●
●
●
●
●●
●●
●
●
●●●
●●
●
●
●●●●●
●
●
●●●●●●●●●
●
●
●
●
●
●
●
●
●
●
●●●
●
●●
●●●
●
●
●●●●●●●●●●
●
●●●
●
●
●
●●●●
●
●
●
●
●
●●●
●
●
●
●
●
●
●●●●
●
●●●
●
●●
●●●
●
●
●●●●
●
●
●●●
●●●
●
●
●
●●●●●●
●
●●
●
●●●
●
●
●
●
●
●
●
●
●
●
●
●
●
●
●●
●
●●●
●
●
●
●●
●
●
●
●
●
●
●
●
●
●●●
●
●
●
●
●
●
●●●●
●
●●●●
●
●●●
●
●●●
●
●
●
●●●●
●
●
●
●
●
●
●
●
●
●
●●●●●●●
●
●●
●
●
●●●●
●
●●●●●
●
●●●
●
●
●
●●
●
●●
●●●●●●
●
●
●●
●●●●
●
●●●
●●●
●
●
●
●●
●●●
●
●●●
●
●
●
●●●
●
●
●●
●
●●●
●
●●●
●
●
●
●●●
●●
●
●●
●●
●
●
●
●
●
●
●●
●
●●●●
●
●●
●
●●
●●●
●
●●●
●
●
●
●●●●
●
●
●
●
●●
●
●
●
●
●
●
●●
●●●●
●
●
●●●●
●●●
●
●●●
●
●●●●
●
●●●●●
●
●●●●●●
●
●
●
●
●●
●●
●
●●●●
●
●●
●●●●●
●●●●
●●
●
●
●
●
●●
●
●
●
●
●●●
●
●
●
●●
●
●●
●
●●●●
●
●●●●
●
●●●●●●●
●
●●●
●
●●
●
●●●●
●●●
●
●
●
●●●
●●
●●
●
●
●●●
●●
●●
●
●●●●●
●●
●●●●●●●●●●●●●●●
●
●●●●●●●●●●●●●●
●
●●●
●●
●
●●
●●
●●●
●●
●●●
●
●●●●
●
●●
●
●●
●
●
●
●●
●
●●
●
●
●●●●
●●●●●●●●●
●
●●●●
●
●●●
●●
●
●●●●●●●●●
●
●●●●
●●●
●
●●
●●
●●
●
●●●●●●●●
●
●●●●●
●
●
●
●
●
●
●
●
●
●
●●●●
●●
●
●●
●●
●
●●
●
●●
●
●●
●
●
●
●
●●
●●●●●●●●●●
●
●●
●
●●●
●●
●●●
●
●●●
●
●●●
●
●●●●●●●
●
●●●
●
●●●●●●
●●
●
●●●
●●●●●●●●●●●●
●●
●
●
●●●●●●●
●●●●●●●●
NVD EDB EKITS SYM
02
46
810
The histogram on the left represents the frequency distribution of the CVSS Impact values among the
datasets. The boxplot on the right reports the distribution of values around the median (represented by
a thick horizontal line). Outliers are represented by dots.
Figure 5.2: Histogram and boxplot of CVSS Impact subscores per dataset.
majority of vulnerabilities, while in SYM and EKITS most vulnerabilitieshave Impact scores greater than nine. This is an effect of the different natureof each dataset: for example, a low Impact vulnerability may be of too littlevalue to be worth the bounty by a security researcher, and therefore these maybe under-represented in EDB [81]; medium-score vulnerabilities may insteadrepresent the best trade-off in terms of market value and effort required todiscover or exploit. In the case of SYM and EKITS vulnerabilities, it isunsurprising that these yield a higher Impact than the average vulnerabilityor proof-of-concept exploit: these datasets feature vulnerabilities actuallychosen by attackers to deliver attacks, or to be bundled in tools designed toremotely execute malware. The different distribution of the CVSS Impactsubscore among the datasets is apparent in the boxplot reported in Figure 5.2.The distribution of Impact scores for NVD and EDB is clearly different from(and lower than) that of EKITS and SYM.
To explain the gaps in the histogram in Figure 5.2, we decompose the
59

5.1. A Map of Vulnerabilities Chapter 5
distribution of Impact subscores for our datasets. In Table 5.1 we first reportthe incidence of the existing CIA values in NVD. It is immediate to see thatonly few values are actually relevant. For example there is only one vulner-ability whose CIA impact is ‘PCP’ (i.e. partial impact on confidentiality,complete on integrity and partial on availability). Availability almost alwaysassumes the same value of Integrity, apart from the case where there is noimpact on Confidentiality, and looks therefore of limited importance for adescriptive discussion.
For the sake of readability, we exclude Availability from the analysis, andproceed by looking at the two remaining Impact variables in the four datasets.This inspection is reported in Table 5.2. Even with this aggregation on placemany possible values of the CIA assessment remain unused. ‘PP’ vulnera-bilities characterize the majority of disclosed vulnerabilities (NVD) and vul-nerabilities with a proof-of-concept exploit (EDB). Differently, in SYM andEKITS most vulnerabilities score ‘CC’. This shift alone can be consideredresponsible for the different distribution of scores depicted in Figure 5.2 andunderlines the difference in the type of impact for the vulnerabilities capturedby the different datasets.1
Breakdown of the Exploitability subscore
Figure 5.3 shows the distribution of the Exploitability subscore for eachdataset. Almost all vulnerabilities score between eight and ten, and fromthe boxplot it is evident that the distribution of exploitability subscores is
1 Metrics to measure the impact of a vulnerability other than the CVSS CIA assessment could bederived from environmental or infrastructural considerations on the vulnerable systems. Possible examplesof this are the criticality of the vulnerable system or software in the particular operative context of anorganisation, or the impact factor of the system or its components measured over a decay in performancecaused by the vulnerability [60]. While several possible metrics to measure vulnerability impact can bedevised, we refer here to CVSS’s CIA assessment as it is standardised in the industry, and general enoughto abstract away from case-specific assessments of vulnerability impact (e.g. using attack surfaces ormore case-specific metrics like performance decay indicators).
60

Chapter 5 5.1. A Map of Vulnerabilities
Table 5.1: Incidence of values of CIA triad within NVD.Confidentiality Integrity Availability Absolute no. Incidence
C C C 9972 20%C C P 0 -C C N 43 <1%C P C 2 <1%C P P 13 <1%C P N 3 <1%C N C 15 <1%C N P 2 <1%C N N 417 1%P C C 5 <1%P C P 1 <1%P C N 0 -P P C 22 -P P P 17550 35%P P N 1196 2%P N C 9 <1%P N P 110 <1%P N N 5147 10%N C C 64 <1%N C P 1 <1%N C N 43 <1%N P C 17 <1%N P P 465 1%N P N 7714 16%N N C 1769 4%N N P 5003 10%N N N 16 <1%
indistinguishable among the datasets. In other words, Exploitability can notbe used as a proxy for likelihood of exploitation in the wild. A similar result(but only for proof-of-concept exploits) has also been reported in [30]).
In Table 5.3 we decompose the Exploitability subscores and find that most
61
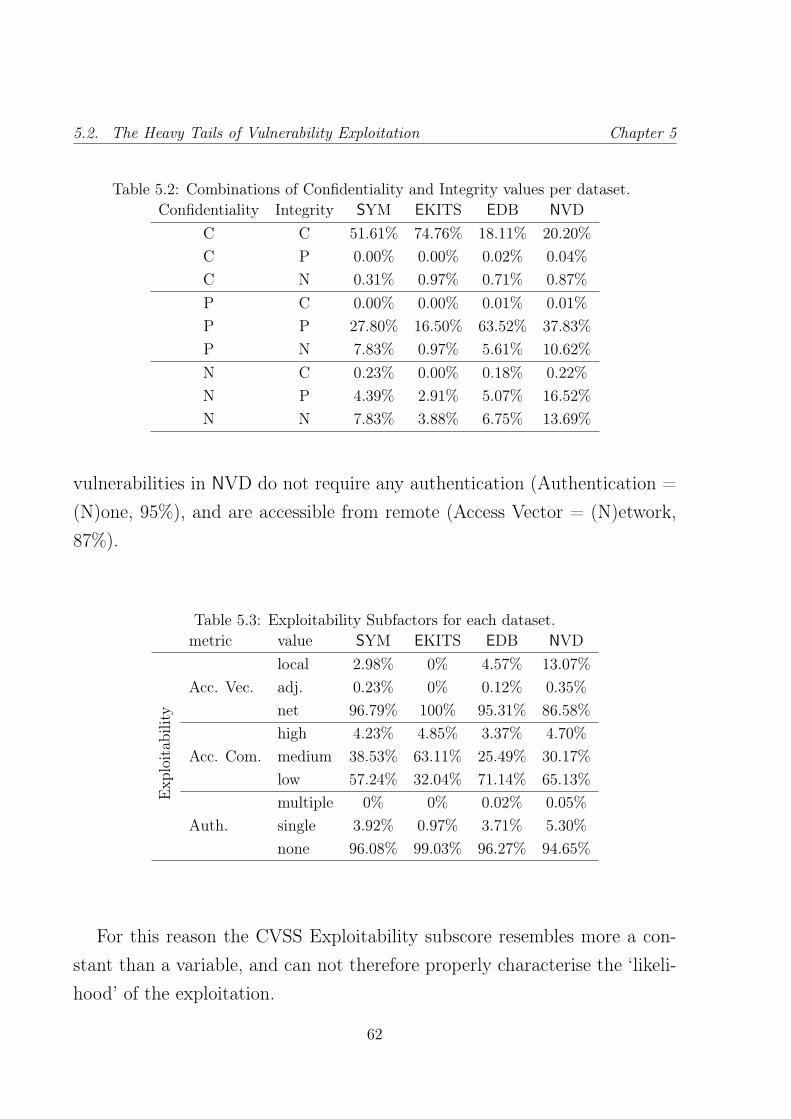
5.2. The Heavy Tails of Vulnerability Exploitation Chapter 5
Table 5.2: Combinations of Confidentiality and Integrity values per dataset.Confidentiality Integrity SYM EKITS EDB NVD
C C 51.61% 74.76% 18.11% 20.20%C P 0.00% 0.00% 0.02% 0.04%C N 0.31% 0.97% 0.71% 0.87%P C 0.00% 0.00% 0.01% 0.01%P P 27.80% 16.50% 63.52% 37.83%P N 7.83% 0.97% 5.61% 10.62%N C 0.23% 0.00% 0.18% 0.22%N P 4.39% 2.91% 5.07% 16.52%N N 7.83% 3.88% 6.75% 13.69%
vulnerabilities in NVD do not require any authentication (Authentication =(N)one, 95%), and are accessible from remote (Access Vector = (N)etwork,87%).
Table 5.3: Exploitability Subfactors for each dataset.metric value SYM EKITS EDB NVD
Exp
loitab
ility
Acc. Vec.local 2.98% 0% 4.57% 13.07%adj. 0.23% 0% 0.12% 0.35%net 96.79% 100% 95.31% 86.58%
Acc. Com.high 4.23% 4.85% 3.37% 4.70%medium 38.53% 63.11% 25.49% 30.17%low 57.24% 32.04% 71.14% 65.13%
Auth.multiple 0% 0% 0.02% 0.05%single 3.92% 0.97% 3.71% 5.30%none 96.08% 99.03% 96.27% 94.65%
For this reason the CVSS Exploitability subscore resembles more a con-stant than a variable, and can not therefore properly characterise the ‘likeli-hood’ of the exploitation.
62

Chapter 5 5.2. The Heavy Tails of Vulnerability Exploitation
NVD
Exploitability score
Fre
quen
cy
0 2 4 6 8 10
010
000
2000
0
EDB
Exploitability score
Fre
quen
cy0 2 4 6 8 10
020
0040
00
EKITS
Exploitability score
Fre
quen
cy
0 2 4 6 8 10
020
4060
SYM
Exploitability score
Fre
quen
cy
0 2 4 6 8 10
020
040
060
0
●●●
●
●●●●
●●●●
●
●
●
●●●
●
●
●
●
●
●
●
●
●
●●●●●●
●●
●
●
●●●●●●
●
●
●
●
●
●●●
●
●
●
●●
●
●
●
●
●
●
●
●●●●●
●●●
●
●
●
●●
●
●
●
●●
●●●
●
●
●
●
●
●
●
●
●
●
●●
●
●●●●●
●
●
●
●
●
●
●
●
●
●
●
●
●
●●
●
●
●●
●
●
●●
●
●
●●
●
●
●
●
●
●
●
●
●
●
●●
●
●●●
●
●●●
●
●
●
●
●
●●
●●●●●●●
●●●
●●
●●
●●
●
●
●
●
●●
●●●
●
●
●●
●●●
●
●●
●
●●●
●
●
●●●
●●●●
●
●●●
●
●
●
●●
●
●
●●
●
●●
●
●●●
●
●
●
●●
●●
●
●
●
●
●
●
●●
●
●
●●●●●●●●●●
●●●
●
●
●
●
●
●
●
●●●
●
●●
●
●
●●
●●●●●●●●●●●●
●
●
●
●
●
●
●
●●
●
●
●
●
●●
●
●
●●
●
●
●
●●●●
●
●●
●
●
●
●●●●●●●
●●
●●
●●
●●
●●
●
●
●
●
●●●●
●●
●●●●
●
●
●
●●
●
●●●
●
●
●
●
●
●●●
●●
●●
●●
●
●●●●
●
●●●
●
●●
●
●
●
●
●
●●●●●●●●●●●●●●●
●
●
●●
●●●●●
●
●
●
●
●
●
●
●
●
●
●
●
●●●
●
●
●●●●
●●●●
●
●●
●
●
●
●●
●
●
●
●●
●
●
●●●●
●
●
●
●
●●
●●
●
●
●
●
●
●
●
●●
●
●
●●
●
●
●●●●●
●●
●●●●●●●●●●●●●●●●●●●●●
●
●
●●●
●
●●●
●●
●
●●
●
●●
●
●
●
●
●
●●
●●●
●●●●
●●
●●
●●●●
●
●●
●
●●●
●
●●
●●
●
●
●●
●
●
●
●
●
●
●
●
●●
●
●
●
●
●
●
●●
●
●
●
●
●●
●
●
●●
●
●
●●●●●●●●●●●●●●●
●●●
●●
●●●●
●
●●●●
●
●
●
●●
●
●
●
●●
●
●
●
●
●
●
●
●
●
●
●
●
●●
●
●●●●
●●●●●●●●●●●●●●●●●●●●●●●●●●●●●●●●●●●●●●●●●●●●●●●●●●
●●●●●●●●●
●●
●
●
●
●●●●
●
●
●
●
●●
●●●
●
●
●●
●
●●
●
●●●
●●
●●
●●
●
●●
●●
●
●●
●●
●
●
●
●
●
●
●
●●●
●
●
●
●
●
●
●●
●●
●
●
●
●●
●
●
●
●
●●●●
●●
●
●
●●
●
●
●
●
●
●●
●
●●
●
●●●
●
●
●●
●
●●
●
●
●
●
●●●●●●●●●●●●
●
●●
●
●
●
●
●●●●
●
●●●
●●
●●●●●●
●●
●●●●●
●
●
●●●
●
●●●
●●
●
●
●●
●●
●
●●●●
●
●
●●
●
●
●
●●
●
●
●
●
●●
●
●●●
●
●
●
●
●●
●●
●
●
●
●
●
●
●
●
●
●
●●●
●●
●
●●●●●●●●●●●●●●●●●●●●●●●●●●●●●●●●
●●
●
●●
●●●●
●●●
●
●
●
●
●
●
●
●●
●
●●●●●●●●●
●●
●
●●●●
●
●●●●●
●
●
●
●
●
●
●●
●
●
●
●
●
●
●●
●
●
●
●
●
●
●
●
●
●●●●●
●●
●
●
●
●
●
●●
●
●
●
●●
●●
●
●●●●
●
●
●
●
●●●●
●
●●
●
●
●●
●
●
●
●●
●●●
●
●
●
●
●●●
●
●
●
●
●●
●●
●
●
●
●●
●
●
●●●●
●
●
●
●●●
●●
●
●
●●●●
●●●
●●●
●
●●●●
●
●●
●●
●●
●●
●●●
●
●●
●
●
●
●●
●●●●●
●
●
●●●●●●●
●
●●●●
●●●
●
●●●●
●
●
●●●
●
●
●
●
●●
●
●
●●●
●●
●
●
●
●●
●
●
●●●
●
●
●
●●
●
●●●
●
●●●
●
●
●●
●●●●●
●
●
●
●
●
●
●
●
●
●●
●
●
●
●
●
●
●●●
●●
●●
●
●
●●
●
●
●
●
●●●●
●
●
●●
●
●
●
●●●●●●●●●
●●
●
●
●●
●
●
●
●
●●
●●●
●
●
●
●
●
●●●
●
●●
●●●
●
●●●●
●●
●
●
●●●
●●
●
●●
●
●
●
●●
●
●●●
●●●
●
●
●●●●
●
●
●
●
●●
●
●
●
●
●
●●●●
●●
●
●
●●
●
●
●
●●
●●●●●●●●●●●
●
●
●
●●●●
●
●
●●
●
●
●
●
●●●●●
●
●
●
●
●
●
●
●
●●
●●
●●●●●●
●●
●
●
●
●
●●
●
●
●
●●●
●
●
●
●
●●●●●●●●
●
●
●
●
●
●
●
●●
●
●●●
●
●
●
●
●
●
●
●●
●
●
●
●
●●●●●●
●●
●●●●
●
●●
●●
●
●
●●●
●
●●●●
●
●●
●
●
●●
●
●
●●●●●●
●
●●●
●
●
●
●
●
●
●●
●●
●
●●●
●
●
●
●
●
●
●●
●
●●
●●●
●
●
●
●
●
●
●
●
●●●●●
●
●●●●
●
●●●●
●
●
●●
●
●●●
●●
●●
●
●●●●
●
●
●
●●
●●
●●
●
●●
●
●
●●●●●●●●
●
●●●●●●●●●●●●●
●
●●●
●
●
●●
●●
●
●
●
●
●
●
●
●●
●●●
●
●
●
●●●●
●
●●
●●
●
●●●●
●
●
●
●●●●●
●
●
●
●
●●●
●
●
●
●●
●
●
●
●
●
●
●
●●
●
●●
●
●
●
●●
●
●●
●
●●
●●
●
●
●
●
●
●
●
●
●●
●
●
●
●
●●●●
●
●
●
●
●
●●
●●
●●
●
●●●●●●●
●●
●●●●
●
●
●
●
●●●●
●
●
●●
●
●
●●●●●
●
●
●
●
●●●●●
●
●
●
●
●
●
●●
●
●
●●●●
●
●●
●
●
●●●●
●
●
●
●
●
●●
●
●
●●
●
●
●●
●●
●
●●●●
●●●●
●●●●●
●
●
●●●●●●●
●●
●
●●●●●●●●
●●●
●●
●
●
●●●●●
●●
●
●
●●
●●●●●
●
●●●●●
●●
●●
●
●
●
●
●
●
●●●
●
●
●
●●●
●●●●
●
●●●●●●●
●●
●
●●●●
●
●●
●
●
●●●
●●●
●
●●●
●●
●
●
●
●●
●●●
●●●●●●●●●
●●
●●●●●
●
●●
●
●●
●
●●
●
●
●●
●●●
●●
●●
●●●●
●
●
●
●
●●
●
●
●
●
●
●
●
●
●●
●
●
●●●●
●●
●
●●
●
●●●●●
●
●●●●●●●
●●●●●
●
●●●
●
●
●
●
●●
●
●●●●
●
●
●
●
●●
●●●●
●●●●
●
●
●
●●●●●
●
●●●●●●●●●●●●●●●●●●
●
●●●●●
●
●
●
●
●●
●●●
●
●●
●
●●●●●●●●●●●●●●●●●●●●●
●
●
●
●●
●●●●●●●●
●
●
●
●
●
●●●●●●●
●
●●●●●●●●●●●●●●●●●●●●●●●●●●●●●●●
●
●●●●●●●●●●●●●●●●●●●
●
●
●●●
●●
●●
●●
●●
●●
●
●
●
●●●
●
●
●
●●
●
●●
●
●●●
●
●
●
●●
●
●
●
●
●
●
●
●●●●
●
●●●●
●
●
●
●
●
●
●
●
●
●
●●●●●
●
●
●
●
●
●
●
●
●
●
●●
●●
●
●●●●
●
●
●
●●
●●
●
●
●
●
●●●
●●●
●
●
●●●●●●●●●●●
●
●●●
●
●●
●
●●
●
●●●●
●
●●●
●
●
●●●●●
●●●
●
●●●
●
●
●
●
●
●
●●
●●
●
●●●●
●
●●●
●
●●●
●●
●●●
●
●●●
●●●
●
●
●●
●
●
●
●
●
●●
●
●
●
●●
●
●
●●
●
●
●
●
●●●
●
●
●
●
●●●●●
●
●
●●●
●
●●
●●●
●
●
●●
●
●
●
●
●
●●
●
●●●●●
●
●●
●
●
●
●●●
●●
●●●
●
●
●
●●
●
●●●●●
●
●●●●●●●●●●
●
●
●
●●
●●
●●
●
●
●●●●●
●
●●●●
●●
●●
●
●●
●
●
●
●
●
●●●●
●
●
●
●●●●
●
●
●●
●●
●●
●●
●
●
●
●
●
●●●
●
●●●●●●●●
●●
●●●●
●
●●
●
●
●
●
●●●
●
●●●
●
●
●
●●●
●
●
●●
●
●●●
●
●●●●
●
●●
●
●
●●
●●
●●
●
●
●●●●●●
●
●●
●●
●●
●
●
●●●●●●●●●
●
●
●●●●●●●●●●●●●●●●●●●●●
●
●
●●
●
●●●
●
●●
●●
●
●
●
●
●
●
●●
●
●
●
●●●●
●●●
●●●●●●
●
●
●
●
●
●
●
●
●●●●
●
●
●●●●●●●●●●●●●●●
●
●●●●
●
●●
●
●●●●●●●
●
●
●●●●
●
●
●●●●
●
●
●●
●●
●●●●●
●●●●●●
●●●●●●
●
●●
●
●●●
●●●●
●●●
●
●●
●
●●
●●●
●
●
●
●
●
●●●●●●●
●
●
●
●
●
●
●
●
●●●
●●
●●●
●
●
●
●●
●
●
●●●●●●
●●●●●
●
●●●●●
●●
●
●
●
●●●
●
●
●
●
●
●
●●●
●●
●●●●
●
●
●
●
●●●●●●●●
●●
●●●●
●
●
●●●●●●●●●
●
●
●
●
●
●
●●●●
●
●●
●
●
●●
●●
●●●●●
●●●
●
●
●●
●
●
●
●
●●
●●●
●●
●
●
●●
●
●●●
●●
●●
●●●●●●
●
●●
●●
●●●●
●
●●
●
●
●
●
●●●
●●●●
●●●
●●
●
●
●
●
●
●
●
●
●●
●
●
●●●
●
●
●
●
●
●●
●
●●
●
●
●
●
●●●
●●●●●
●
●●
●
●●●
●
●
●
●
●●
●●●●●●●
●
●
●
●●
●
●
●
●
●●
●
●
●●●
●
●●
●
●
●
●
●●●
●
●●
●
●
●●
●
●●●●
●●
●
●
●
●●
●
●
●
●
●
●●●
●
●●●●●
●
●
●●
●
●
●
●
●●●●●
●
●●●●
●
●●●
●
●
●
●●
●
●●
●●
●●●
●●
●
●
●
●
●
●
●
●●●●●
●●
●●●●
●
●
●
●●
●
●●
●
●
●
●●
●
●●
●
●
●
●
●
●
●
●●●
●
●
●
●
●
●
●
●●
●
●
●●
●
●
●
●●
●
●●
●
●●
●
●●●●●
●
●●
●●
●
●●●
●
●●
●
●●●
●
●●●●
●
●●
●
●
●
●
●
●
●●
●
●
●●
●
●●
●●●
●
●
●
●
●
●
●
●●
●
●
●
●●
●
●
●●
●●●
●●
●
●
●●
●
●●
●
●●●
●
●●●●●●
●
●●●
●●●
●
●●
●
●
●
●
●
●
●
●
●
●
●
●
●
●
●
●
●●●●
●●
●●●
●●
●
●
●
●●●●●
●
●●●●●
●
●●
●
●
●
●●●
●●
●●
●
●
●
●
●●
●
●
●
●
●
●
●●
●
●
●
●
●●
●●●
●
●
●
●
●●
●
●●●
●●
●
●●●●●
●
●●●
●
●
●
●●
●●●
●●
●●●●
●
●
●
●●●
●
●
●
●●
●●
●
●
●
●
●
●
●
●
●
●
●
●
●●
●●●
●
●
●●●●●
●
●
●●
●
●●
●
●
●●
●
●
●
●●
●●●●●●●
●●●●●
●
●●
●●
●
●
●●
●●
●
●
●
●●
●●
●●●●●●●
●
●
●
●
●
●●●●
●●●
●●
●●●●●
●
●●
●●
●
●
●
●
●
●
●●●●
●
●
●
●
●●●●●
●
●●
●●
●●●●●
●
●
●●
●
●
●
●●
●
●●
●
●●
●
●
●●
●●●●
●
●
●
●
●
●●●●●
●●●
●●
●●
●
●
●●●●
●
●
●●
●●●
●●
●
●●
●
●
●
●●●●●
●
●●
●●
●
●
●●
●
●●
●●●
●●●●●●●
●●
●●●
●
●●
●
●●●●●●●●●
●
●
●●●
●●●●●
●
●
●
●●●●●●
●
●
●●
●●●●●●●●●●●●●●
●
●●
●
●
●
●●
●
●●●●
●
●
●●
●●●●
●
●●●●●●●●
●
●●
●
●●●●●●●●●●
●●●●●●●●●●●●●
●●●●
●●●
●●●●
●
●
●●
●●●●
●
●●
●
●
●
●●
●●●●
●●
●
●
●
●
●
●●●
●●●
●
●
●●
●
●●●●●●●
●
●●●
●
●
●●
●●
●
●●●
●
●
●●
●
●●
●●
●
●●●●●●●
●●●●
●
●●
●●
●●●
●●●
●
●●●●
●●●
●●●●●
●●●
●●●●
●●●●
●
●
●
●●●●
●
●●●●●
●
●●●●●
●
●●●
●●●
●
●●
●●
●
●●●
●●●
●
●
●
●
●
●●●●●
●
●
●●●●●●
●●
●
●●●
●●
●●●●●●●●
●●●
●●●●●●●●●
●
●
●●
●
●
●●●
●
●●●●●
●●●
●●
●
●
●
●
●
●●●
●●
●●●●●
●●
●●
●
●
●
●●●●
●●●●●●
●●●
●
●●
●●●
●
●
●●
●
●●
●●●●
●●●●
●
●
●
●
●
●●●●●●●●●
●
●
●●●●
●
●
●●
●
●
●●●●
●
●
●
●
●
●●
●
●●
●●●●
●●●●
●●
●
●
●
●
●●
●●
●
●
●
●●
●●●●●●●●
●
●
●
●●●●●●●●●●●●●
●
●●●●●●●●●●●●●●●●●●●●●●●●●●●●●●●●●●●●●●●
●●●
●●●
●
●
●●
●
●
●●●
●
●●
●
●●
●●
●
●
●●●●●●●●●●●●●●
●
●●●●
●
●●
●●●
●
●
●●●●●
●
●●●●●●●●●●●●●●●●●●
●
●●●
●
●
●
●●●●●●●●●●●●●●●●●
●
●●●
●
●
●●
●●●
●
●
●●
●●●
●
●●●●
●
●●●●
●●
●●●●
●
●
●●●●
●
●●●●
●
●●
●
●
●
●
●●
●●
●
●●
●
●
●●
●
●●●
●
●●●
●
●●
●
●●●
●●
●
●
●●●●●●●
●●
●
●●●
●●●●
●●●
●●●
●●
●●●
●●●
●●●●●●
●
●●●●
●●
●●●●
●
●●●●●●●●●●●●●●●
●
●●
●
●
●●●●●●●
●●●
●
●●●
●
●●●
●
●
●
●●●
●
●
●●
●
●●●●●●
●
●●
●●●
●●●●
●
●●●●
●
●●●●●●●●●
●
●●
●
●
●●●●●
●●
●●●●●
●
●●●
●
●
●
●●●
●●●
●●●
●●●●●
●
●
●●●●●●
●●
●●
●●●●
●
●●
●●
●●●●●●●●●●●●●
●●●●●
●●
●
●
●●●
●
●●●
●
●
●
●●
●
●●●
●
●●
●
●
●
●
●●
●●
●
●
●
●
●
●
●
●
●●●
●
●
●
●●●
●●●
●
●●●
●●●●
●
●
●
●
●
●●●●
●●
●
●●●
●
●●●●●●
●
●
●
●
●●●
●
●●●
●●
●
●●
●●
●●
●
●●●●●●●●
●
●●●
●
●●●●
●●
●
●
●●●●●●●
●
●●●
●
●●
●●●
●
●●●
●
●●
●●●●
●
●
●●●●●●●●
●
●
●
●●●●●
●●
●●●●●
●●
●●●●●●●●●●
●●●●
●
●
●
●
●●●●●
●
●●
●●●
●
●●
●●
●
●●●
●●
●●●●
●
●●●●●●●●●●●●●●
●
●●
●
●
●●
●
●●
●
●
●●
●●●●●
●
●●●●
●
●
●●●●●●
●
●
●
●
●
●●
●
●●●
●
●●
●
●
●●●●●●
●●●
●
●
●
●●●●●
●
●●●●●●●●●●●
●●
●
●
●●●●●●●●●●●●
●
●●●●
●●●●●
●●●
●
●
●
●●●●●●
●
●
●●
●
●●●●●●●●
●●●●●
●●●
●
●
●●
●●
●
●●
●●●●
●
●
●
●●●●●●
●●
●●●●●●
●
●●●●●
●
●●●●
●
●
●
●●●
●
●●
●
●
●
●
●●●●●●●●●●
●●●
●
●
●
●
●●●
●
●●●●●
●
●
●
●●●●●●●●
●
●
●●●●●
●●●●●●●●●●●●●●●●●●●●●●●
●●●●●
●●●●
●●
●
●●●●●
●●
●●●●●
●
●
●●●●●●
●
●●●
●
●
●
●●
●
●●●●●●●●●●●●●●●
●
●
●●
●
●●●●●
●
●
●●
●●●●
●
●●●●●●●●●
●
●●●●●●●●●●●
●
●●●●●●●●●●●
●●●●
●●●●●
●
●●●●●
●●
●
●
●●●●
●
●●
●
●●●●●
●●●
●
●
●●●●●●●●●
●
●
●
●
●●●
●
●●●●●●●
●●
●●
●
●●●●
●
●●●●●
●
●●
●●●
●●●●●
●
●
●
●●●●●●●●●
●●●●●●
●●●●●●●●●●●●●
●
●●
●
●
●
●●●●●●●●
●●●●
●●●●●●●●
●●●
●●
●
●●
●●
●
●●
●●●
●
●
●
●●
●●●●●●●●●●
●
●●●●●●●●●●
●●●●●●
●●
●
●
●
●●●●●
●●
●●
●
●●●●●●●●
●●●●
●
●●
●●●●●●●●●●●●
●●●●
●●●●●
●
●●
●●●●●●●●●●●●●●●●●●
●
●●●●
●
●●
●
●
●●●
●
●●
●
●
●
●●●●●
●●●
●●
●
●
●
●●
●
●●●
●
●●
●
●●●●●●
●
●●●
●
●●
●
●●●●●
●
●●●●●●
●
●●●
●
●
●
●
●●●
●
●
●
●●
●
●●●●●●●●●●
●
●●●●
●
●●●●●●●●●●●●●●●
●
●
●●
●●●●●●
●
●●●●
●
●●
●
●●
●●●●●●
●●●●
●
●
●●
●●●●●●●●●
●
●●●●●●●●
●●
●●●●
●
●●●●●
●●
●
●
●●●●●●●●●●
●
●●
●
●
●
●●●●●●●●●●●●●●●
●●●
●
●●●●●●●
●●●
●●●
●
●●
●
●●●
●●●
●
●
●●●●●●●●●●●●
●
●●●●●●●●●●●●●●●●●●●●●
●●
●
●
●●●●●●●●●●
●
●●●
●
●
●
●●
●
●●●
●●●●
●
●●●
●
●
●
●
●
●
●
●
●●
●●●●●●●●●●
●
●
●
●●●
●
●●●●
●
●
●●●●●●●●●●●●●●●
●
●●●●●●●●●●●●●●●
●
●●●●●●
●
●●●●●●●●●●●●●●
●
●●
●
●●●
●
●●
●
●●
●
●●●●●
●●
●
●
●●●
●
●●●●●
●
●●●●●●●●
●
●●●●●●●●●●●
●●
●●
●
●●
●●●●●●
●●
●
●
●●
●●
●
●
●
●
●
●
●●
●
●●●●●●
●
●●●●●●●●●●●●●●●●
●
●●●●
●
●●
●
●●●●●●
●
●●●●
●
●●●
●
●●●●
●
●●●●●●●●
●
●●●●●●●●●●●●●
●●
●
●
●●●
●
●●●●●●●●●●●
●
●●●●●●●●●●●●●●●●●
●
●●●
●●
●●●●●●●●
●
●●●
●
●●●●●●●
●
●●●
●
●●●
●
●●●●●●
●
●●●●●●●●●●●●●●●●●
●●
●●
●
●●●●●●●●●●●●●●●●●●●●●●●●●●●
●●●
●●
●●●●
●●
●
●●
●
●
●
●
●●
●●●●●
●
●
●●●●
●
●●●●●●●●●●●●●●●●●●●●
●
●
●
●●●●●
●
●●●●●●
●
●●●
●●
●●●●●●●●●●●●●●●
●
●●●●●●●●●●●●●●●●●●●●●●●
●
●●●
●
●
●●
●
●
●●●●●●●●●●
●
●●
●●
●
●●
●
●
●●●●
●
●●●●
●
●
●
●●
●●
●
●●●●●●●●●
●
●●●
●
●●●●●●●●●●●●
●
●●
●
●●
●
●●
●●●●●●●●●
●
●●●●●
●
●
●
●●●●●●●●●●●●●●●●●●
●
●●●
●
●●●●●●●●●●
●
●●●●
●●
●●●●●●●●●●●●●●●●●●●●●●●●●
●
●●●●●●●●●●
●
●●●●●●
●
●●●●●●●●●●●●●●●●●●●●●●●●
●
●●●●●●●●●●●●
●
●●●●●●●●●
●
●
●
●●
●
●●●●●●●●
●
●●
●
●●●●●●●●●●
●
●●●●●●●●●●
●
●●●●●●●
●
●
●●●
●
●
●●●●●●●●●●●●●●●●●●●●●
●
●●●
●
●●●●●●●●
●
●●●●●●●●●
●
●●●●●●●●
●
●●●●●●●●
●
●
●●
●●●●●●●●●
●●●●
●●●
●
●
●●
●
●●
●
●
●●●●●●●●●●●●
●
●●●●●●●●●●●●●●●●
●
●
●
●●●●●●●●●●●●●●●●●●●●●●●●●●●●●●●●●
●
●●●●●●●
●
●●●●●●●●●●●●●●●●●●●●●●●●●
●
●●●●●●●●●●●●●●●●●●●●●●●●●
●
●●●●●●●●●●
●
●●●●●●●●●●●●
●
●
●
●●●●●●●●●●●●
●
●●●●●●●●●●●●●●●●●●
●
●●●●●●●●●●●●●●●●●●●
●
●●●●●●●●●●●●●●
●
●●●●●●
●
●●●●●●●●●●●●●●●
●
●●●●●●●●●●●●●●●●●●
●
●●●●●●●●●●●●●●●
●
●●●●●●●●●●●●●●
●
●●●
●
●
●●
●●●●●●●
●
●
●
●
●●●●●●●●●●
●
●
●●
●●●
●●●
●●
●●
●●
●
●
●●●●●●●●●●●
●
●●●
●
●
●●
●
●●●
●●●
●
●●●●●●●●●●●●●
●
●●●●●●●●●●●●
●
●●●●
●
●●●●●●●●●●●●●●●●●●●●●●
●●
●●●●●●●●●●●●●●●●●●●●●●●●●●●●●●●●●●
●
●●●●●●●●●●●●●●●●●●
●
●●●●●●
●
●●●●●●●●●●●●●●●
●
●●
●
●●●●●●
●●
●
●
●
●●
●●●●●●
●
●●
●
●●●●●●●●●
●
●●●●●●●●●●●●
●
●●●●●
●
●●●●●●●●●
●●
●●●●●●●
●
●●
●
●●●●●●●
●
●●●●●●●●●●
●
●●●●●●●●●●●●●●●●●●●●●●●●●●●●
●
●●
●●●●●
●●
●●
●
●
●
●●●●●●●●●●●
●●
●●
●
●●●●●●●●●●●●●●●●●●●●●●●●●●
●
●●●●●●●●●●
●
●●●●●●●●●●●●●●●●●●●●●●●●●●●●●●●●●●●●●●●●●●●●●●●●●●●●●●●●●●●●●●●●●●●●
●
●●●●●●●●●●
●
●●●
●
●●●●
●●
●
●●●●●●●●●●●
●
●●●●●●●●●●
●
●●●●
●
●●●
●
●●
●
●●●
●●
●●●●●
●
●●●●●●
●
●
●●
●
●
●
●
●●●●●
●●●●
●
●●●●
●
●●
●●●●
●●●●●●●●
●
●●●●●
●
●●●●●
●
●●●●●●●●●
●
●●●●●●●●●●●●●●●●●
●
●●●●●●●●●●●●●●●●●●●●●●●●●●●●
●
●
●●●●●●●●●●●
●
●●●
●
●●●●●●●●●
●
●●●●●●●●●●●●●●
●
●●●●●
●
●●●●●●●●●
●
●
●●●●●●●
●
●●●●
●
●●●●●
●
●●●●●●●●●●●
●●●
●●●●●●●●●●●
●●
●
●●●●●●
●
●●
●
●●●●●●●●●●●●●●●
●
●●●●●●●●●●●●●●
●●
●●●●●
●
●●●●●●●●●
●●
●
●
●
●
●●●●●●●
●
●●●
●●
●●●●●●●●
●
●●●●●
●
●
●
●●●●
●
●●●●●
●
●●●●●
●
●●●●●●●●●
●●●
●
●
●●●●●●●●●●●●●●
●
●●●●●●●●
●
●●●●●●●●●●●●●
●
●●●
●
●●
●
●
●
●●
●●●●●●●
●
●●●●●●
●●
●
●
●
●●
●●●
●
●●●●●●●●●●●●●
●
●●●●●●●●●●●●●●●●●●●
●
●
●
●
●●●●●●
●
●●●●●●●
●●●
●●●●●●●●●●●●●●●●●●●●●
●
●●●●●●●●●●●●●●
●
●●
●
●●●●●
●
●●●●●
●
●●●●●●
●
●●●●●●●●
●●●●●
●●●●●●
●
●●●●●●●●●
●
●●●●●●●
●
●●●●●
●
●●●●●●●●●●●●●●●●●●●●●●●●●●●●●●●●●●●●●●●●●●●●●●●●●●●●
●
●●●●●●●●●●●●
●●
●●●●●●●●●●●●●●●●●●
●
●●●●●●●●●●●●●●●
●
●●●●●●●●
●
●●●●●●●●●●●●●●●●●●●●●●●●●
●
●●●●●●●●●●●●●●●●●●
●
●●●●●●●●●●●●●●
●
●●●●●●●●●●●
●
●●●●●
●
●
●●
●●●
●
●●●●●
●
●●●
●
●●●●●
●
●●●
●
●●
●
●●●●●●●●●●●●●●●
●●●
●●●●●
●
●●●●●●●●●●●●●
●
●●●●●●●●
●
●●●
●●
●
●●
●●●●●●●●●●●●
●
●●
●●
●●●●●●●●●
●
●
●●●●●●●●●
●
●●●●●●●
●
●●
●●●●●●
●●●●●●●●●●●●●●
●●
●●●●
●
●
●
●●●●●●●●●●●●●●●●●●●●●●●●●●
●
●●
●●
●●●●●●●●●●●
●
●●●●●●
●
●
●
●
●●●●●●●●●●●●●●●●●●●●●●●●●●●●●●●●●●●●●●●●●●●
●
●●
●
●●
●
●●●●●●●●●●●●●●
●
●●●●●●●●●●●●●●●●
●
●●●●
●
●●●●●●●●●
●
●●●
●
●●●●●●●●●
●
●
●
●
●
●●
●
●
●
●
●
●
●
●
●
●●
●
●●
●●●●
●
●●
●
●
●
●
●●●●
●●
●●●●●●
●
●
●
●●●●
●
●
●
●
●●●
●
●
●
●●
●
●
●
●●
●●●
●
●●
●●
●
●
●
●
●
●●
●
●●
●●●
●
●●
●
●●●
●
●
●
●
●●●
●
●
●●
●
●
●●●●●●●●●●
●
●
●
●
●
●●●●
●
●
●
●
●
●
●
●
●●●
●
●
●
●
●●
●●
●●
●
●
●
●●
●
●
●●●●●●
●●
●
●●
●
●
●●●●
●●●●
●
●
●
●
●
●●
●●
●●●●
●
●
●●●
●
●
●
●●
●
●●
●●
●
●●
●
●
●
●●●●
●
●●●●●●●●●●
●●
●●
●
●
●
●
●
●
●●●
●
●
●
●●●●
●
●
●●
●
●●
●●
●
●
●
●
●
●
●
●●
●
●
●
●
●
●
●
●
●
●
●
●●●
●
●
●●
●
●
●●●●●●●
●●●
●●●●
●●
●●●●●●●●●●●●●●●●●●●●●●●●●●
●
●●●
●
●●●●●●●●
●
●
●
●●●●
●
●●●●●●●●●●●●●●●●●●●●●●
●
●●●●●
●
●
●
●●●●●
●●
●●●●●●●●●●●●●●●●●●●●●●●●●●●●●●●●●●●●●●●●●●●
●
●●●●
●●●
●●●●●
●
●●
●
●●●●
●●
●
●●●●
●
●
●
●●
●●●
●●
●
●●
●
●●●●●●●●●●
●
●
●●●●
●
●●
●
●●●●
●
●●●●●●●●●●●●●●●●●●●●●●●●●●●●●●●●●●●●●
●
●●●
●
●
●
●●●●
●
●●●
●
●●●●
●
●●●
●●●
●●●●●●●●●●●●●●●●●●●●●●●●●●●●●●●●●●●●●●●●●
●
●●●
●
●●●●●●
●
●●●●●●●●●●●●●●●●●●●●●●●●●●
●●●●●
●
●
●
●●
●
●
●
●
●
●
●
●
●●
●
●●
●
●●●
●
●
●●
●
●
●●
●
●
●
●●●
●●●●●
●●
●
●
●
●●
●
●●●●●●●●●●●●●●●●●●●●●
●
●●●●●●●●
●●●●●●
●●●
●●
●●
NVD EDB EKITS SYM
24
68
10
Figure 5.3: Distribution of CVSS Exploitability subscores.
Table 5.4: Categories for vulnerability classification and respective number of vulnerabil-ities and attacks recorded in WINE.
Category Sample of Software names No. Vulns. Attacks (Millions)PLUGIN Acrobat reader, Flash Player 86 24.75PROD Microsoft Office, Eudora 146 3.16WINDOWS Windows XP, Vista 87 47.3Internet Explorer Internet Explorer 55 0.55Tot 374 75.76
5.2 The Heavy Tails of Vulnerability Exploitation
From Figure 5.1 it appears that only a small fraction of vulnerabilities isexploited in the wild. This however has two limitations:
1. We are only looking at the boolean variable ‘Exploit exists’ (Yes or No),without considering that volumes of attack per vulnerability may bestrongly skewed.
2. We are not accounting for the selection bias inherent in SYM, wherebyonly vulnerabilities covered by Symantec’s commercial products are re-ported.
63
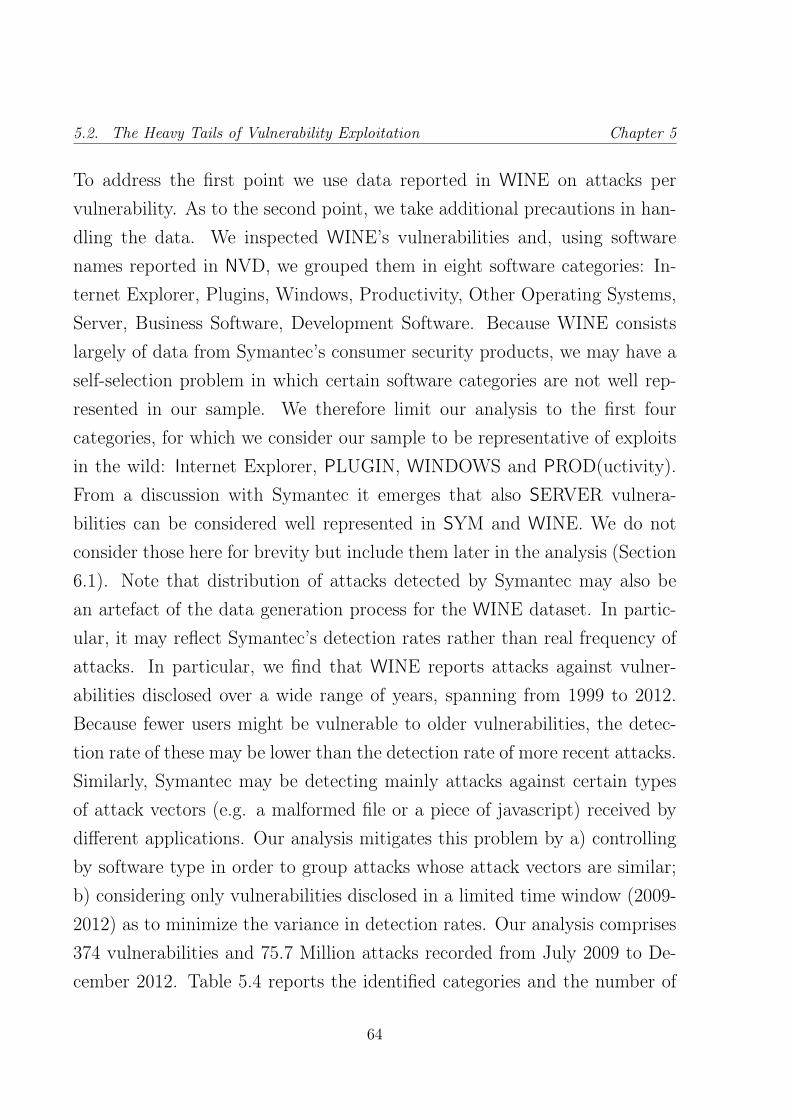
5.2. The Heavy Tails of Vulnerability Exploitation Chapter 5
To address the first point we use data reported in WINE on attacks pervulnerability. As to the second point, we take additional precautions in han-dling the data. We inspected WINE’s vulnerabilities and, using softwarenames reported in NVD, we grouped them in eight software categories: In-ternet Explorer, Plugins, Windows, Productivity, Other Operating Systems,Server, Business Software, Development Software. Because WINE consistslargely of data from Symantec’s consumer security products, we may have aself-selection problem in which certain software categories are not well rep-resented in our sample. We therefore limit our analysis to the first fourcategories, for which we consider our sample to be representative of exploitsin the wild: Internet Explorer, PLUGIN, WINDOWS and PROD(uctivity).From a discussion with Symantec it emerges that also SERVER vulnera-bilities can be considered well represented in SYM and WINE. We do notconsider those here for brevity but include them later in the analysis (Section6.1). Note that distribution of attacks detected by Symantec may also bean artefact of the data generation process for the WINE dataset. In partic-ular, it may reflect Symantec’s detection rates rather than real frequency ofattacks. In particular, we find that WINE reports attacks against vulner-abilities disclosed over a wide range of years, spanning from 1999 to 2012.Because fewer users might be vulnerable to older vulnerabilities, the detec-tion rate of these may be lower than the detection rate of more recent attacks.Similarly, Symantec may be detecting mainly attacks against certain typesof attack vectors (e.g. a malformed file or a piece of javascript) received bydifferent applications. Our analysis mitigates this problem by a) controllingby software type in order to group attacks whose attack vectors are similar;b) considering only vulnerabilities disclosed in a limited time window (2009-2012) as to minimize the variance in detection rates. Our analysis comprises374 vulnerabilities and 75.7 Million attacks recorded from July 2009 to De-cember 2012. Table 5.4 reports the identified categories and the number of
64

Chapter 5 5.2. The Heavy Tails of Vulnerability Exploitation
WINDOWS
log(attacks)
Fre
quen
cy
0 2 4 6 8
05
1015
20
0 1 2 3 4 5 6 7 8
PROD
log(attacks)
Fre
quen
cy
0 1 2 3 4 5 6 70
1020
3040
0 1 2 3 4 5 6 7
Internet Explorer
log(attacks)
Fre
quen
cy
0 1 2 3 4 5 6
05
1015
0 1 2 3 4 5 6
PLUGIN
log(attacks)
Fre
quen
cy
0 2 4 6 8
010
2030
4050
0 1 2 3 4 5 6 7 8
0.0 0.2 0.4 0.6 0.8 1.0
0.0
0.2
0.4
0.6
0.8
1.0
WINDOWS
p
L(p)
0.0 0.2 0.4 0.6 0.8 1.0
0.0
0.2
0.4
0.6
0.8
1.0
PROD
p
L(p)
0.0 0.2 0.4 0.6 0.8 1.0
0.0
0.2
0.4
0.6
0.8
1.0
Internet Explorer
p
L(p)
0.0 0.2 0.4 0.6 0.8 1.0
0.0
0.2
0.4
0.6
0.8
1.0
PLUGIN
p
L(p)
Figure 5.4: Top row: histogram distribution of logarithmic exploitation volumes. Bottomrow: Lorentz curves for exploitation volumes in the different categories. p % of thevulnerabilities are responsible for L(p)% of the attacks.
respective vulnerabilities in WINE.
In Figure 5.4 we report the histogram distribution of the (logarithmic)attack volumes for each vulnerability by the category (top row) and therespective Lorentz curve distribution (bottom row). The histogram distri-bution clearly shows that for WINDOWS, PROD and Internet Explorer thefrequency of vulnerabilities with x attacks is inversely proportional to thelogarithm of x. In other words, a (very) small fraction of vulnerabilities isresponsible for orders of magnitude more attacks than the remaining vulner-abilities.
A clear way to visualize this is through a Lorentz curve. A Lorentz curvedescribes the p percentage of the population (of vulnerabilities) that are re-sponsible for the L(p) percent of attacks. The diagonal represents an ‘equi-librium state’ where each vulnerability is responsible for the same volume ofattacks. The further away the two curves are, the higher the ‘disparity’ in
65
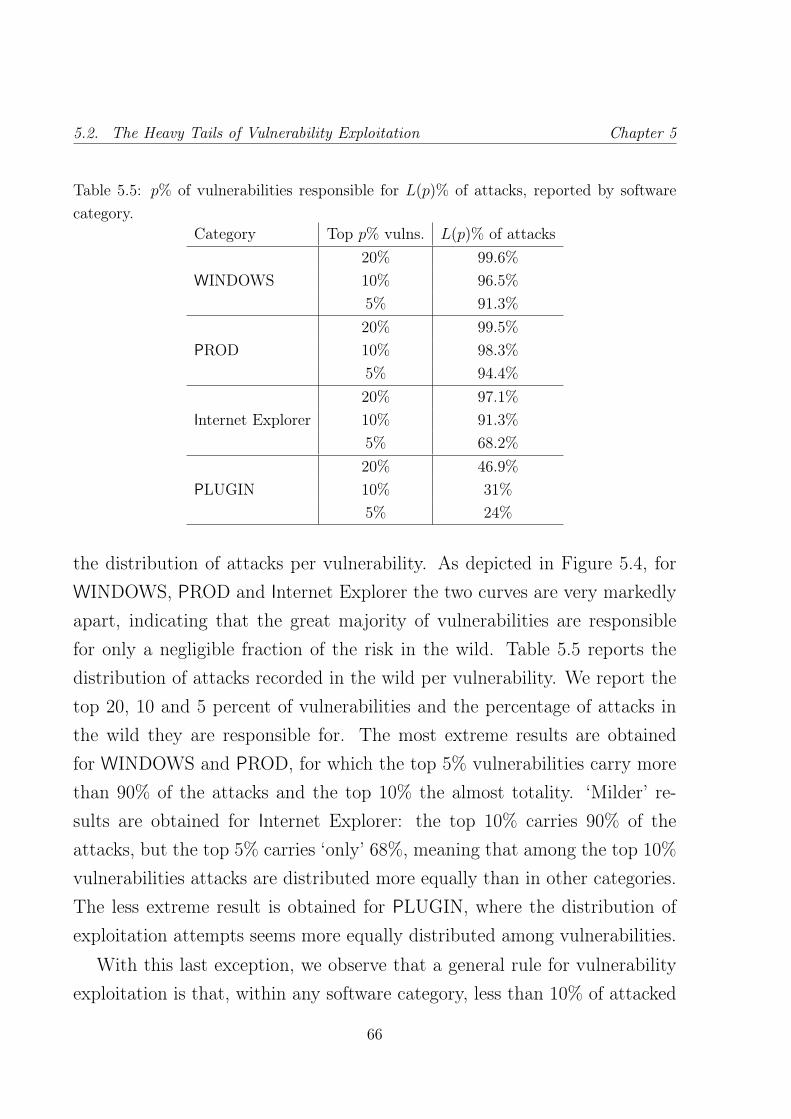
5.2. The Heavy Tails of Vulnerability Exploitation Chapter 5
Table 5.5: p% of vulnerabilities responsible for L(p)% of attacks, reported by softwarecategory.
Category Top p% vulns. L(p)% of attacks20% 99.6%
WINDOWS 10% 96.5%5% 91.3%20% 99.5%
PROD 10% 98.3%5% 94.4%20% 97.1%
Internet Explorer 10% 91.3%5% 68.2%20% 46.9%
PLUGIN 10% 31%5% 24%
the distribution of attacks per vulnerability. As depicted in Figure 5.4, forWINDOWS, PROD and Internet Explorer the two curves are very markedlyapart, indicating that the great majority of vulnerabilities are responsiblefor only a negligible fraction of the risk in the wild. Table 5.5 reports thedistribution of attacks recorded in the wild per vulnerability. We report thetop 20, 10 and 5 percent of vulnerabilities and the percentage of attacks inthe wild they are responsible for. The most extreme results are obtainedfor WINDOWS and PROD, for which the top 5% vulnerabilities carry morethan 90% of the attacks and the top 10% the almost totality. ‘Milder’ re-sults are obtained for Internet Explorer: the top 10% carries 90% of theattacks, but the top 5% carries ‘only’ 68%, meaning that among the top 10%vulnerabilities attacks are distributed more equally than in other categories.The less extreme result is obtained for PLUGIN, where the distribution ofexploitation attempts seems more equally distributed among vulnerabilities.
With this last exception, we observe that a general rule for vulnerabilityexploitation is that, within any software category, less than 10% of attacked
66

Chapter 5 5.2. The Heavy Tails of Vulnerability Exploitation
vulnerabilities are responsible for more than 90% of the attacks.This first, exploratory analysis of the distribution of attacks in the wild
is prima-facie evidence that vulnerability exploitation is not uniformly dis-tributed among vulnerabilities, and consequently that certain vulnerabilitiesmay represent much higher risk for the final user than most others.
67

5.2. The Heavy Tails of Vulnerability Exploitation Chapter 5
68
Chapter 6
On the Feasibility of Risk-basedVulnerability Management
From the Analyses in Section 5.1 and 5.2 it emerges that on the one hand theattacker is not choosing vulnerabilities to exploit using the CVSS score, andon the other that he/she tends to exploit a small fraction of vulnerabilitiesonly that, as a result, are responsible for the great majority of risk in thewild. From a high-level perspective, these observations seem to support ourThesis.
To further investigate this, in this Chapter we provide evidence supportingthe ‘enabling hypotheses’ outlined in Section 2.1. This Chapter unfolds asfollows: Section 6.1 presents the model of the Work-Averse Attacker, wherebythe attacker acts rationally when choosing which vulnerabilities to exploit.Importantly, from the model the exploitation trends shown in Figure 5.4emerge naturally. Our findings strongly support Hypothesis 1.
In Section 6.2 we investigate the maturity and economic and technologicalsustainability of the cybercrime markets. The discussion starts in Section6.2.1 where we investigate the maturity of cybercrime markets (Proposition1). The analysis unfolds by comparing data on two underground markets,Carders.de and HackMarket.ru, with respect to a common set of Hypothesestesting their stability as economic entities. From our analysis we conclude
69

Chapter 6
that Proposition 1 is supported by the data.To test Proposition 2, in Section 6.2.2 we test in our MalwareLab a set
of attacking tools leaked from the black markets. In particular, we testtheir exploit reliability and resiliency against continuous software updates.Our findings confirm that these tools are efficient and capable of successfullyexploiting vulnerabilities over configurations spanning several years.
Finally, in Section 6.2.3 we propose a two-stage model of the undergroundmarkets whereby the seller that sells the exploit has strong incentives inbehaving fairly in order to maximise his/her profit function. By solving themodel we show that the underground markets are economically sound froma trading perspective, and conclude therefore that Hypothesis 2 holds.
Each Section starts with a brief summary of the Hypotheses outlined inChapter 2.
70

Chapter 6 6.1. The Attacker is Rational and Work-Averse
6.1 The Attacker is Rational and Work-Averse
Running Hypothesis Hypotheses TestingHyp. 1. The attacker ignores mostvulnerabilities and massively deploysexploits for a subset only.
Hyp. 1a. The attacker will massively use only oneexploit per software version.Hyp. 1b. The fraction of attacks driven by a par-ticular vulnerability will decrease slowly in time.Corollary to Hyp. 1b. The attacker waits a longerperiod of time to introduce an exploit for softwaretypes under a slow update cycle than for others.
The idea that an attacker may not be interested in exploiting ‘all’ vul-nerabilities in the system emerges from a simple observation: in most cases,he/she needs to attack only one (‘powerful’ enough) vulnerability among themany that affect that particular software.1 In a broader sense, the expectedutility of an exploit for a vulnerability v at time t E[Ut,v] comes from therevenue r the attacker can extract from the fraction n(t, v) ∈ [0, N ] of theN systems in the wild the vulnerability allows him to attack at time t. Therevenue r an attacker can get from the system out of the exploitation of onevulnerability may depend on two factors:
1. The potential value of the attacked system.
2. The impact I of the vulnerability on the system. For example, a vulner-ability granting full administrative access is likely to allow the attackerto extract more revenue from the attacked system.
We therefore model the extracted revenue per attacked system r(I(vi)) asa function of the vulnerability impact. The cost c of the attack comprises thecost of developing/buying the exploit and the cost of delivering the attackby means, for example, of some attacking infrastructure ([18, 58]).
1We here refer to a ‘worse-averse’ agent as an agent that sees work effort as a disutility, i.e. as emergesfrom the agent’s utility function.
71

6.1. The Attacker is Rational and Work-Averse Chapter 6
The expected utility of an exploit for a vulnerability v at time t is there-fore:
E[Ut,v] = n(t, v)× r(I(v))− c(v) (6.1)
Note that limt→∞n(t, v) = 0 as users update their systems and the exploitfor v loses efficacy in the wild. When the efficacy of the old exploit drops toolow, the attacker will dedicate his/her resources (abandoning v)2 to look fora new exploit v′.
Under the assumption that exploit development is costly and an attackeris work averse, s/he will develop the exploit for a new vulnerability v′ aftersome time t + δ > t if the expected value for v at t + δ is lower than theexpected value for v′ at t+ δ:
E[Ut+δ,v′∪V ]− E[Ut+δ,V ] > 0 (6.2)
where V is the set of vulnerabilities the attacker already exploits. Theboundary condition to choose v′ is therefore:
n(t+ δ, v′ ∪ V )× r(I(v′ ∪ V ))− c(v′) > E[Ut+δ,V ] (6.3)
By generalising Eq. 6.3 it is possible to obtain the decision condition forthe attacker over an arbitrary vulnerability vj
n(t+ δ, vj ∪ V )× n× r(I(vj ∪ V ))− c(vj) >j−1∑i=1
E[Ut+δ,vi] (6.4)
At this point, the attacker will introduce a new exploit for vj if:
c(vj) < n(t+ δ, vj ∪ V )× r(I(vj ∪ V ))−j−1∑i=1
E[Ut+δ,vi] (6.5)
2The vulnerability finding and exploit writing processes are very time consuming and require theallocation of plenty of resources ([81, 18, 58]). While an attacker can always re-use old technology(i.e. old exploits), maintaining a certain exploit operative requires maintenance costs in terms of bothtechnological resources and time. When not looking for a new exploit, we do not put any constraint onhow many exploits the attacker wants to use.
72

Chapter 6 6.1. The Attacker is Rational and Work-Averse
The cost for vj is therefore bounded by the revenue that can be extractedfrom all pre-existing exploits the attacker may maintain. It is immediateto see that the more previous exploits have been developed, the higher thepotential revenue from vj must be in order to overcome the cost constraint.With
∑j−1i=1 E[Ut+δ,vi∪V ] growing with the number of available exploits, the
upper-bound cost c(vj) for the new exploit tends to zero. The diminishingreturn seen in Eq. 6.5 has two main consequences:
1. The attacker is able to afford a diminishing amount of exploits in time.
2. Assuming a direct relationship between exploit quality and cost of theexploit ([81, 22]), the quality of the new exploits would tend to decreasewith the amount of exploits available to the attacker.
The cost constraint is positive and greater than zero only when n(t+δ, vj∪V )
is greater than∑j−1
i=1 n(t+ δ, vi ∪ V ) because dn(t+ δ, vj ∪ V ) +∑j−1
i=1 n(t+
δ, vi∪V )e ≤ N , so there is a cap on the total revenue that can be extracted.In other words, the attacker will build a new reliable exploit only when theoverall revenue the attacker can extract from the old exploits drops becauseof too few vulnerable systems in the wild (i.e. because users at large upgradedtheir systems).
6.1.1 Data preparation
To build our dataset, we first reconstruct the history of attacks received byevery user in WINE. To evaluate the sequence of attacks against a certainsoftware, we then collect all the pairs < attack1, attack2 > of attacks that auser received, and keep track of the time delay (measured in days) betweenthe two attacks. We then group the data by pairs of attacks and delta intime, and count how many users have been affected by that sequence andhow many attacks of that type have been observed in the wild. Table 6.1reports an excerpt from the dataset. Each row represents a succession of
73

6.1. The Attacker is Rational and Work-Averse Chapter 6
1st attack 2nd attack Delta days Affected machines Volume of attacksa a 192 23544 58322b c 11 6 6b e 580 10 10d f 861 389 432e b 644 26 43
Table 6.1: Excerpt from our dataset. CVE-IDs are obfuscated as a, b, c, etc. Each <1stattack, 2nd attack, delta> tuple is unique in the dataset. The column Affectedmachines reports the number of unique machines receiving the second attack delta daysafter 1st attack. The column Volume of attacks is constructed similarly but for thenumber of received attacks.
attacks. The first column and the second column report respectively the(censored) CVE-ID of the attacked vulnerability in the first and in the secondattack. The third column reports the number of unique systems in the WINEplatform affected at least once by that tuple; the fourth column reports theoverall number of attacks detected; the fifth the distance between the twoattacks expressed in days. Note that for anonymity reasons we aggregate theattacks against each unique machine in WINE into an ensemble of identicalattacks. This does not represent a threat to the generality of our results aswe are here interested in measuring attacks at an aggregate level rather thansingularly for each user. The columns reporting the software affected by thevulnerability, the latest affected software version and the software’s categoryare here omitted for brevity.
Additional care must be taken when evaluating vulnerability timing data[105]. In particular, because we are evaluating attackers’ attitude at develop-ing new vulnerability exploits in time, we need to 1) identify vulnerabilitiesthat are disclosed at the same time and 2) eliminate subsequent attackstargeting vulnerabilities that are very far away in time, as these say littleabout the attackers’ exploit development process. For this reasons, we onlyconsider the tuples <1st attack, 2nd attack> respecting the following
74

Chapter 6 6.1. The Attacker is Rational and Work-Averse
constraints:
1. The vulnerability exploited in the first attack was disclosed before orat most 120 days after the vulnerability for the second attack. This ro-bustly large interval has been chosen according to how the vulnerabilitydisclosure process works.
2. The second exploited vulnerability is less than three years older thanthe first. We choose this time frame as it matches the length of the his-toric records we have for each WINE user, given the three-year intervalcovered by our sample.
In the first row of Table 6.1 the two subsequent attacks are against thesame vulnerability. The tuple < a, a > affected most machines and wasthe vector of a high number of attacks in the sample. For example, we findalmost 60 thousand attacks against 23.5 thousand users that have receiveda second attack against a 192 days (6months) after the first. The secondand third row report two instances where an attack on b has been followedby an attack against two other vulnerabilities. The third and fourth rowsreport other two combinations. We present our results for Internet Explorer,PROD, PLUGIN and SERVER vulnerabilities. WINDOWS vulnerabilitiesare excluded because updating windows versions often results in a new WINEID for the user, and therefore we are unable to trace a users’ attack historythroughout his/her Windows updates.
6.1.2 Analysis
We first give an overview of our dataset. Figure 6.1 shows a generalizedregression ([61]) of attacked systems (left) and volume of attacks (right) as afunction of time.3 The shaded areas represent the 95% confidence intervals
3 Regression generated by fitting to a generalized additive model (gam) of the form g(E(V olume)) =
s(Delta) where g() is the link function of the expected volume of attacks (E(V olume)) and s(Delta) is
75

6.1. The Attacker is Rational and Work-Averse Chapter 6
10
0 300 600 900 1100Time (days)
Affe
cted
mac
hine
s
Attack on different software Attack on same software
10
0 300 600 900 1100Time (days)
Vol
ume
of a
ttack
s
Attack on different software Attack on same software
Figure 6.1: Regression of number of attacked machines (left) and volume of attacks (right)as a function of time. Attacks against the same software are represented by the dashedline; attacks against different software are represented by the solid line. Shaded areasrepresent 95% confidence intervals around the mean.
around the fitted line. Subsequent attacks directed towards the same softwareare represented by the dashed line. Subsequent attacks against differentsoftware are represented by the solid line. We observe that the distributionof attacked machines (left) follows closely the distribution of recorded attacks(right). In this study we will consider only the number of affected machines,
an unspecified smoothing function of the time between attacks (Delta). Note that the prediction powerof our regression is likely very limited as it does not account for additional covariates of interest, suchas geographical location, source of attack, or user type. This is because we are here only interested in afirst, exploratory depiction of the relation between volume of attacks and time within our dataset. Thegoal of this is to pinpoint possible macro-differences in the trends of attacked machines and volume ofattacks in time, not to predict future attack volumes. Thus, the model used should not be interpretedas an estimator of future trends of attacks, as this likely requires a more fine-grained analysis accountingfor additional covariates. A more suitable model for this analysis could be of the form V olumet = β0 +
β1(GEOt)+β2(USERTY PEt)+β3(ATTSOURCEt)+β4(Deltat)+µt , where βi are model parameters tobe estimated, GEO,USERTY PE,ATTSOURCE,Delta are the independent variables of the regression,and µt is the error term. Note that the model above likely suffers from some degree of heteroscedasticity,as the variance in volumes of attacks (V ar(V olumet)) likely depends on the same variables as its expectedvalue (E(V olumet)). This may be problematic in the estimation as the independence assumption on theerror distribution, required for classic linear regression and generalised models, is not valid anymore [43].Were any heteroscedastic effects present, adjustments to the model may be required in order to improvethe efficiency of the estimator [126]. We keep this analysis for future work.
76

Chapter 6 6.1. The Attacker is Rational and Work-Averse
as this gives us a more direct measure of how many users are affected bya certain attack. We keep a closer analysis of volume of attacks for futurework. We further observe that subsequent attacks against the same softwareare more frequent than subsequent attacks against different software. This isintuitive as the received attack depends on the software usage habits of theuser. For example, a user that uses his/her system to navigate the Internetmight be more prone in receiving attacks against Internet Explorer thanagainst Microsoft Office. Because of this we will focus in this study onsubsequent attacks against the same software. This will allow us to assessthe attacker’s attitude toward creating new exploits for the same softwareplatform. We further observe that the fitted curves do not have a clearpositive or negative slope as functions of time. This suggests that attacks areonly weakly correlated with time, and other factors (such as users’ patchingattitudes, or just technological chances) may explain the trend.
Hypothesis 1a. To check the veracity of Hyp. 1a we evaluate how manyusers receive two attacks, after a certain δt, of either of these types:
1. A1=A(cve = cve′|δt & sw = sw′): Against the same vulnerability andsame software version.
2. A2=A(cve < cve′& vers 6= vers′|δt & sw = sw′): Against a newvulnerability and a different software version.
3. A3=A(cve < cve′& vers = vers′|δt & sw = sw′): Against a newvulnerability and same software version.
In accordance with Hyp. 1a the attacker should prefer to (a) attack thesame vulnerability multiple times, and (b) create a new exploit when he/shewants to attack a new software version. Therefore, according to Hyp. 1a weexpect the following ordering in the data to be generally true: A3 < A2 <
A1. An exception may be represented by SERVER vulnerabilities: SERVER
77

6.1. The Attacker is Rational and Work-Averse Chapter 6
Internet Explorer PLUGIN
PROD SERVER
10
1000
10
1000
1
10
1
10
100
0 300 600 900 1100 0 300 600 900 1100
0 300 600 900 1100 0 300 600 900 1100Delta (days)
Atta
cked
mac
hine
s
A1:Same cve A2:Diff cve diff version A3:Diff cve same version
Figure 6.2: Targeted machines as a function of time for the three types of attack. A1 isrepresented by a solid black line; A2 by a long-dashed red line; A3 by a dashed green line.
environments are typically better maintained than ‘consumer’ environments,which may affect an attacker’s attitude toward developing new exploits. Forexample, SERVER software is often protected by perimetric defences such asfirewalls or IDSs. This may require the attacker to engineer different attacksfor the same software version in order to escape the additional mitigatingcontrols in place. For this reason we expect the difference between A2 andA3 to be narrower or reversed for the SERVER category.
Figure 6.2 reports a fitted regression of targeted machines as a functionof time by software category. As expected, A1 dominates in all softwaretypes. The predicted order is valid for PLUGIN and PROD. For PRODsoftware we find no new attacks against different software versions, thereforeA2 = A3 = 0. This may be an effect of the typically low update rate of thistype of software and relatively short timeframe considered in our dataset(3 years), or of a scarce attacker interest in this software type. Results for
78

Chapter 6 6.1. The Attacker is Rational and Work-Averse
SERVER are mixed as discussed above: the difference between A2 and A3
is very narrow and A3 is higher than A2: attackers forge more exploits perSERVER software version than for other types of software.
Internet Explorer. Internet Explorer is an interesting case in itself. Here,contrary to our prediction, A3 is higher than A2. By further investigating thedata, we find that the reversed trend is explained by one single outlier tuple:<CVE-2010-0806,CVE-2009-3672>. Both these CVEs refer to vulnerabili-ties affecting Internet Explorer version 7. The two vulnerabilities have beendisclosed 98 days apart, 22 days short of our 120 days threshold. More in-terestingly, these two vulnerabilities are very similar, as they both affect amemory corruption bug in Internet Explorer 7 that allows for an heap-sprayattack that may result in arbitrary code execution4. Two observations areparticularly interesting to make:
1. Heap spray attacks are unreliable attacks that may result in a significantdrop in exploitation success. This is reflected in the “Access Complex-ity=Medium” assessment assigned to both vulnerabilities by the CVSSv2 framework. In our model, this is reflected in a lower n(v, t) value,as the unreliable exploit may affect less machines than those that arevulnerable.
2. The exploitation code found on Exploit-DB5 is essentially the same forthese two vulnerabilities. The code for CVE-2010-0806 is effectively arearrangement of the code for CVE-2009-3672, with different variablenames. In our model, this would indicate that the cost c(v) to buildan exploit for the second vulnerability is negligible, as most of the ex-ploitation code can be re-used from the old vulnerability.
4CVE-2009-3672: http://web.nvd.nist.gov/view/vuln/detail?vulnId=CVE-2009-3672CVE-2010-0806: http://web.nvd.nist.gov/view/vuln/detail?vulnId=CVE-2010-0806
5CVE-2009-3672: http://www.exploit-db.com/exploits/16547/CVE-2010-0806: http://www.exploit-db.com/exploits/11683/
79
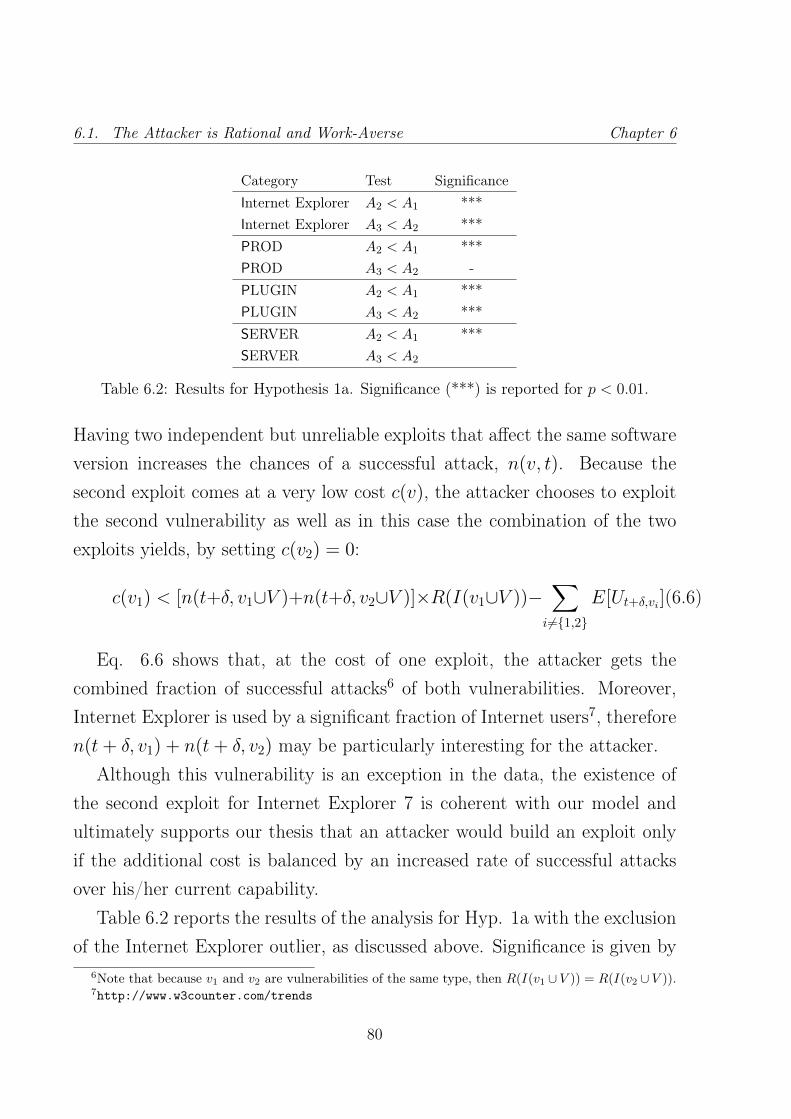
6.1. The Attacker is Rational and Work-Averse Chapter 6
Category Test SignificanceInternet Explorer A2 < A1 ***Internet Explorer A3 < A2 ***PROD A2 < A1 ***PROD A3 < A2 -PLUGIN A2 < A1 ***PLUGIN A3 < A2 ***SERVER A2 < A1 ***SERVER A3 < A2
Table 6.2: Results for Hypothesis 1a. Significance (***) is reported for p < 0.01.
Having two independent but unreliable exploits that affect the same softwareversion increases the chances of a successful attack, n(v, t). Because thesecond exploit comes at a very low cost c(v), the attacker chooses to exploitthe second vulnerability as well as in this case the combination of the twoexploits yields, by setting c(v2) = 0:
c(v1) < [n(t+δ, v1∪V )+n(t+δ, v2∪V )]×R(I(v1∪V ))−∑
i6={1,2}
E[Ut+δ,vi](6.6)
Eq. 6.6 shows that, at the cost of one exploit, the attacker gets thecombined fraction of successful attacks6 of both vulnerabilities. Moreover,Internet Explorer is used by a significant fraction of Internet users7, thereforen(t+ δ, v1) + n(t+ δ, v2) may be particularly interesting for the attacker.
Although this vulnerability is an exception in the data, the existence ofthe second exploit for Internet Explorer 7 is coherent with our model andultimately supports our thesis that an attacker would build an exploit onlyif the additional cost is balanced by an increased rate of successful attacksover his/her current capability.
Table 6.2 reports the results of the analysis for Hyp. 1a with the exclusionof the Internet Explorer outlier, as discussed above. Significance is given by
6Note that because v1 and v2 are vulnerabilities of the same type, then R(I(v1 ∪ V )) = R(I(v2 ∪ V )).7http://www.w3counter.com/trends
80

Chapter 6 6.1. The Attacker is Rational and Work-Averse
Same CVE
New CVE
0.00
0.25
0.50
0.75
1.00
0 300 600 900 1100Time (days)
Fra
ctio
n of
atta
cked
mac
hine
s
Figure 6.3: Fraction of systems receiving the same attack repeatedly in time (red, solid)compared to those receiving a second attack against a different vulnerability (black,dashed). The vertical line indicates the amount of days after the first attacks where itbecomes more likely to receive an attack against a new vulnerability rather than againstan old one.
a Wilcoxon paired test. All comparisons but SERVER accept the alternativethat A2 < A1 and A3 < A2. Overall, we find strong statistical evidencesupporting Hyp 1a.
Hypothesis 1b. We now check how the trends of attacks against a softwarechange with time. Hyp. 1b states that the exploitation of the same vulner-ability persists in time and decreases slowly at a pace depending on users’update behaviour. This is in contrast with other models in literature wherenew exploits arrive very quickly after the date of disclosure, and attacksincrease following a steep curve ([20]).
Figure 6.3 reports the fraction of systems receiving, once an attack arrived,a subsequent attack against the same vulnerability (red, solid) as opposed toan attack against a different vulnerability (black, dashed). The x-axis reportsthe elapsed time since the first attack, in days. As hypothesised, the rate atwhich the same attack arrives decreases slowly with time and is still 20% afteralmost three years (1000 days). Notably, the event of receiving an attack
81

6.1. The Attacker is Rational and Work-Averse Chapter 6
against a different vulnerability becomes more likely than its counterpartonly 800 days (or 2 years, see dotted vertical line in Figure 6.3) after the firstattack happens. This is interesting in itself as it indicates that attackers usethe same exploit for a long period of time before substituting it at scale witha new one.
6.1.3 Robustness check
The distribution reported in Figure 6.3 depends on users’ patching attitudes.In particular, according to the model presented here, software that is patchedmore often should see a quicker arrival rate of new exploits in time. We expectthat software that is more rarely updated by users receives attacks againstnew vulnerabilities with a larger delay than software that is updated moreoften.
To the best of our knowledge there is no available data on the averagerate at which users update different software types. However, as previouslydiscussed, we expect SERVER software to be patched regularly ([95]), andto be generally maintained better than consumer software. Therefore, weexpect the arrival of new exploits to be quicker for SERVER vulnerabili-ties than for other software types. This would also be coherent with theresults in Table 6.2, as for SERVER A3 ≥ A2 (i.e. the attacker does notwait for a new version to build a new exploit). We expect Internet Ex-plorer to be fairly often updated as Microsoft releases patches every monthand automatically pushes it to the users via the Microsoft Update system.PLUGIN software is traditionally seldom updated by the users, as only veryrecently a few PLUGIN vendors started pushing update notifications. Still,we expect PLUGIN exploits to arrive on average later in time than for othercategories. As discussed previously, we have no data on subsequent attacksagainst PROD software affecting different vulnerabilities.
Figure 6.4 reports the distribution of days for the appearance of a new
82

Chapter 6 6.1. The Attacker is Rational and Work-Averse
Internet Explorer PLUGIN PROD SERVER
100
200
300
400
500
600
Tim
e (d
ays)
Figure 6.4: Distribution of average days between first exploit attempt and the appearanceof an attack attempting to exploit a different vulnerability in the respective category.
attack for each software in the respective category. The delay for the appear-ance of a new exploit for PLUGIN software is the highest one (p = 0.02),with a median arrival delay of 454 days since first exploit. New exploitsfor Internet Explorer vulnerabilities arrive with a median delay of 214 days.SERVER attacks are the quickest to arrive, with a median delay of 117 days,but the difference with Internet Explorer is statistically significant for the al-ternative “SERVER exploits arrive faster than for Internet Explorer” at the10% confidence level (p = 0.08).
6.1.4 Discussion
In this Section we discussed the Model of the Work-Averse Attacker as anew model to understand cyber threats. Our proposal is attacker-centricand models the attacker as a resource-limited actor that has to choose whichvulnerabilities to exploit. We here only address the general case where theattacker aims at the ‘mass of systems’ in the wild In the ‘general threat’case, the cost constraints emerging from the model prevent the attacker from
83
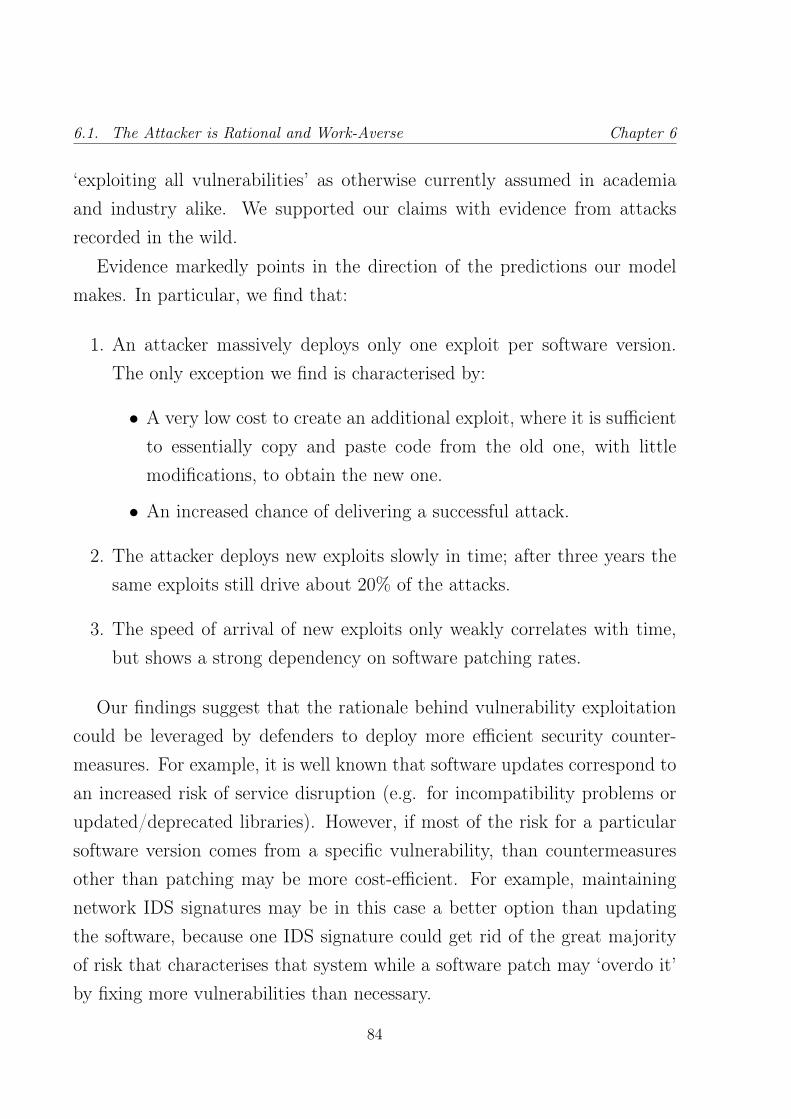
6.1. The Attacker is Rational and Work-Averse Chapter 6
‘exploiting all vulnerabilities’ as otherwise currently assumed in academiaand industry alike. We supported our claims with evidence from attacksrecorded in the wild.
Evidence markedly points in the direction of the predictions our modelmakes. In particular, we find that:
1. An attacker massively deploys only one exploit per software version.The only exception we find is characterised by:
• A very low cost to create an additional exploit, where it is sufficientto essentially copy and paste code from the old one, with littlemodifications, to obtain the new one.
• An increased chance of delivering a successful attack.
2. The attacker deploys new exploits slowly in time; after three years thesame exploits still drive about 20% of the attacks.
3. The speed of arrival of new exploits only weakly correlates with time,but shows a strong dependency on software patching rates.
Our findings suggest that the rationale behind vulnerability exploitationcould be leveraged by defenders to deploy more efficient security counter-measures. For example, it is well known that software updates correspond toan increased risk of service disruption (e.g. for incompatibility problems orupdated/deprecated libraries). However, if most of the risk for a particularsoftware version comes from a specific vulnerability, than countermeasuresother than patching may be more cost-efficient. For example, maintainingnetwork IDS signatures may be in this case a better option than updatingthe software, because one IDS signature could get rid of the great majorityof risk that characterises that system while a software patch may ‘overdo it’by fixing more vulnerabilities than necessary.
84

Chapter 6 6.1. The Attacker is Rational and Work-Averse
Of course, the attacker may react to changing defenders’ behaviour: inthe game-theoretic view of the problem, the defender always moves first andtherefore the attacker can adapt his/her strategy to overcome the defenders’.This is an unavoidable problem in security that is common to any threatmitigation strategy.
A more precise and data-grounded understanding of the attacker posesnonetheless a strategic advantage for the defender. For example, softwarediversification and code differentiation has already been proposed as a possi-ble alternative to vulnerability mitigation ([36, 66]). By diversifying softwarethe defender effectively decreases the fraction n(t, v) of systems the attackercan compromise with one exploit. If the risk over a software version comesfrom only one vulnerability, than a possible counter-strategy to the attack-ers’ adaptive behaviour is to first patch the high risk vulnerability, and thenrandomise the additional defences against the remaining vulnerabilities tominimize the attacker’s chances of choosing the ‘right’ exploit to develop (asthe attacker’s multiple targets will likely choose a different set of vulnera-bilities to patch). Diversifying defences may be in fact less onerous thanre-compiling code bases (when possible) ([66]) or maintaining extremely di-verse operational environments ([36]).
Conclusion 1 From our analysis we find strong supporting evidence for Hy-pothesis 1. We therefore conclude that the attacker is rational and will as aresult massively deploy exploits for only a subset of vulnerabilities.
85

6.2. The Underground is a Sustainable Market Economy Chapter 6
6.2 The Underground is a Sustainable Market Econ-omy
Running Hypothesis Hypotheses TestingHyp. 2. The underground marketsare sound from an economicperspective.
Hyp. 2. Test Prop. 1 and Prop. 2. Develop a two-stage model of the underground markets to show thatthe underlying economic mechanism is sound.
In this section we test Hypothesis 2 to demonstrate that the cybercrimeeconomy is sustainable from a market perspective. This section unfoldsas follows: first, we analyse the mechanisms that are available to marketparticipants to overcome market difficulties such as contract incompleteness(Proposition 1). This analysis is given in Section 6.2.1. We then proceed withanalysing the quality of the technology traded in these markets (Proposition2), in Section 6.2.2. Finally, we present in Section 6.2.3 a two-stage model ofthe markets that show, accounting for the discussion given in Sections 6.2.1and 6.2.2, the sustainability of the market (Hyp. 2).
6.2.1 The Underground Markets are Mature
To investigate Proposition 1, we analyse two different cybercrime markets,Carders.de and HackMarket.ru, by comparing their regulating mechanismsand the effect those have on market effectiveness. The analysis results forHackMarket.ru are in sharp contrast with those of Carders.de and clearlyshow prima-facie evidence that underground cybercrime communities canbe mature (and functioning) market .
The Carders.de market
This forum has a strict separation of trade related boards and non-trade re-lated boards. Advertisement of (illegal) goods is permitted in the dedicatedtrading section. Members in this section are also allowed to request specific
86
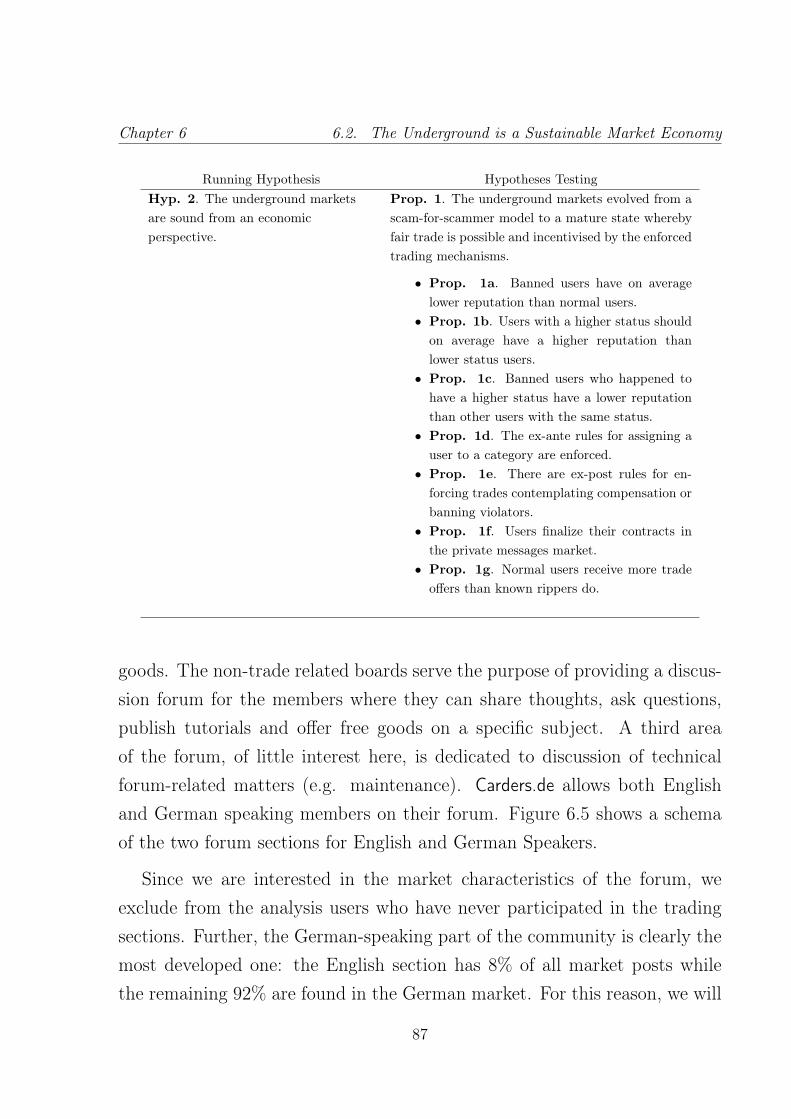
Chapter 6 6.2. The Underground is a Sustainable Market Economy
Running Hypothesis Hypotheses TestingHyp. 2. The underground marketsare sound from an economicperspective.
Prop. 1. The underground markets evolved from ascam-for-scammer model to a mature state wherebyfair trade is possible and incentivised by the enforcedtrading mechanisms.
• Prop. 1a. Banned users have on averagelower reputation than normal users.
• Prop. 1b. Users with a higher status shouldon average have a higher reputation thanlower status users.
• Prop. 1c. Banned users who happened tohave a higher status have a lower reputationthan other users with the same status.
• Prop. 1d. The ex-ante rules for assigning auser to a category are enforced.
• Prop. 1e. There are ex-post rules for en-forcing trades contemplating compensation orbanning violators.
• Prop. 1f. Users finalize their contracts inthe private messages market.
• Prop. 1g. Normal users receive more tradeoffers than known rippers do.
goods. The non-trade related boards serve the purpose of providing a discus-sion forum for the members where they can share thoughts, ask questions,publish tutorials and offer free goods on a specific subject. A third areaof the forum, of little interest here, is dedicated to discussion of technicalforum-related matters (e.g. maintenance). Carders.de allows both Englishand German speaking members on their forum. Figure 6.5 shows a schemaof the two forum sections for English and German Speakers.
Since we are interested in the market characteristics of the forum, weexclude from the analysis users who have never participated in the tradingsections. Further, the German-speaking part of the community is clearly themost developed one: the English section has 8% of all market posts whilethe remaining 92% are found in the German market. For this reason, we will
87

6.2. The Underground is a Sustainable Market Economy Chapter 6
Figure 6.5: Categories of the Carders.de forum. The German market comprises morediscussion sections and more market levels than the English market. Similarly, we foundmost of the activity to happen in the German section of Carders.de.
focus on the German market.Users that join the community for selling or buying products are active in
one of the market tiers within the forum. A user can advertise a product bycreating a topic in the designated board in which this specific product falls.
In this newly created thread, other users discuss the product, ask ques-tions and when a user shows interest as a potential buyer they contact theadvertiser. According to the forum regulation, product trading should befinalized via private messages between the two parties.
Member roles
An important part of our study is to distinguish between different types ofusers. A user’s status in the forum is also reflected by its membership inone of 12 user roles identified by the forum administrators. Table 6.3 showsthese roles with the category to which they belong. The entry rank Newbielabels a newly registered user in the forum. After passing this role a newbiegets the role of normal user. Further up in the hierarchy, the user becomesa 2nd and 3rd tier user and have access to more specialized marketplaces. Averified vendor sells goods that are verified by the administrative team and
88

Chapter 6 6.2. The Underground is a Sustainable Market Economy
Table 6.3: Carders.de User rolesRole Forum Admins OtherNewbie ×Normal user ×2nd Tier user ×3rd Tier user ×Verified Vendor ×Redaktion ×Moderator ×Global Moderator ×Administrator ×Scammers and banned ×
therefore ought to be more trusted by market participators. In contrast toother forum roles, a verified vendor does not require to climb up the rankladder to achieve this entitlement.
Users with an administrative role manage, maintain and administer theforum. Members of the ‘Redaktion’ are editors of the forum. They publishnews, events, regulation and other administrative information. The modera-tors maintain the forum and enforce regulation.
Administrative users are also responsible for banning users who have beenreported for “ripping” other users in a transaction, or who have violated someinternal rules.
Another important distinction to make is among banned users, which mayhave been excluded from the forum for a variety of reasons. Banned users areusually assigned an (arbitrary) string tag that describes the reason of the ban.By manual inspection we identified five categories of banned users: Rippers,Double accounts, Spammers, Terms of Service violators and an additional“Uncategorized” group for users banned without a reported reason. Table 6.4shows the number of users for each group.
Each user in Carders.de can assign positive or negative reputation points
89
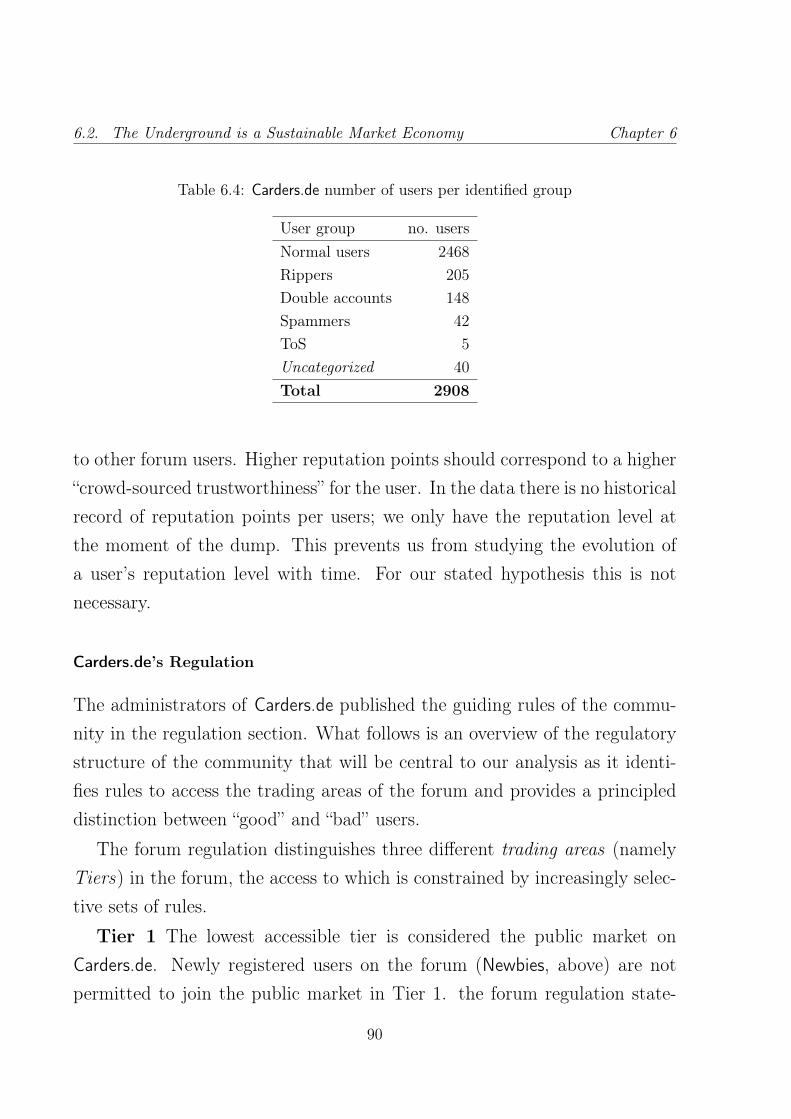
6.2. The Underground is a Sustainable Market Economy Chapter 6
Table 6.4: Carders.de number of users per identified group
User group no. usersNormal users 2468Rippers 205Double accounts 148Spammers 42ToS 5Uncategorized 40Total 2908
to other forum users. Higher reputation points should correspond to a higher“crowd-sourced trustworthiness” for the user. In the data there is no historicalrecord of reputation points per users; we only have the reputation level atthe moment of the dump. This prevents us from studying the evolution ofa user’s reputation level with time. For our stated hypothesis this is notnecessary.
Carders.de’s Regulation
The administrators of Carders.de published the guiding rules of the commu-nity in the regulation section. What follows is an overview of the regulatorystructure of the community that will be central to our analysis as it identi-fies rules to access the trading areas of the forum and provides a principleddistinction between “good” and “bad” users.
The forum regulation distinguishes three different trading areas (namelyTiers) in the forum, the access to which is constrained by increasingly selec-tive sets of rules.
Tier 1 The lowest accessible tier is considered the public market onCarders.de. Newly registered users on the forum (Newbies, above) are notpermitted to join the public market in Tier 1. the forum regulation state-
90

Chapter 6 6.2. The Underground is a Sustainable Market Economy
ment reports that users that have obtained the role of “normal user” canaccess this area. Access rule: To become a normal user a newbie has to haveposted at least 5 messages on the board.
Tier 2 This market section is intended to be reserved to the ‘elite’ of theforum. More restrictive rules limit access to higher tiers. Access rules: 1)Only users with at least 150 posts are allowed in Tier 2. 2) Users must havebeen registered to the forum for at least 4 months.
Tier 3 This tier is an invitation-only section of the market. Access rules:1) The user has been selected by a team member of the forum to be grantedaccess to Tier 3. 2) Access to Tier 2 is required. This division clearly aims atcreating ‘elitist’ sub-communities within the forum where the most reliableand active users participate. One would also assume that users of Tier 2 and3 would be generally considered, in a working market, more trustworthy thanusers with Tier 1 only access. We however exclude Tier 3 from our analysisbecause it features only 5 users, including one administrator, and 17 posts.It is a negligible part of the overall market.
Carders.de Analysis
A failure of reputation mechanisms
To test our hypotheses we analyze reputation values for users in the Carders.demarket. Figure 6.6 summarizes the distribution between banned and normalusers, possibly accounting for the respective tiers. The data is on a logarith-mic scale. The distribution of outliers suggests that reputation points makelittle sense with respect to user categories.
A Mann-Whitney unpaired test (chosen for its robustness to outliers andnon-normality assumption) with null hypothesis “The difference in reputationbetween banned and normal users is zero” and alternative hypothesis “bannedusers have higher reputation than normal users” rejects the null (p = 5.2e−
91

6.2. The Underground is a Sustainable Market Economy Chapter 6
100
10000
Banned Users Normal Users
User Group
Rep
utat
ion
(log)
100
10000
Tier 1 Tier 2
Users
Rep
utat
ion
(log)
100
10000
Banned Users Normal Users
User Group
Rep
utat
ion
(log)
Figure 6.6: From left to right: 1) Reputation levels for normal users and banned users(whole market). 2) Users active in the tier 1 markets and tier 2 market. 3) Reputation ofbanned and normal users in tier 2. Banned users showed consistently higher reputationthan normal users, even when considering only those active in the tier 2 market. Thereputation mechanism is ineffective in both market sections.
15). We conclude that banned users have on average higher reputation thannormal users. Proposition 1a is therefore rejected.
The Mann-Whitney test rejects the null “Tier 1 and Tier 2 users havethe same reputation distribution” and accepts the alternative “Tier 1 usershave a higher reputation than Tier 2 users” (p = 4.8e − 06). Hyp. 1b isrejected as well: reputation levels do not reflect membership in a “highermarket level” and are effectively misleading.
Finally, we check whether reputation is at least a satisfactory indicator ofuser trustworthiness in Tier 2. It is not: Tier 2’s normal users have on averagea lower reputation than banned users. Hyp. 1c is rejected (p = 4.9e− 16).
All evidence suggests that the reputation mechanism in the forum didnot work. We therefore exclude that reputation could have been a significantand useful instrument in the hands of the user to identify trustworthy tradingpartners. This also means that cheaters, or rippers, had no “fear” of havingreputation points decreased by a disgruntled costumer, as reputation itselfhad no meaning whatsoever in the market. The only evidence is that it wasused by bad users to inflate their own ratings.
92

Chapter 6 6.2. The Underground is a Sustainable Market Economy
0
25
50
75
100
D N R S U
User Group
Am
ount
of u
sers
(%
)
Posts < 150 > 150
Figure 6.7: Users in tier 2 with more and less than 150 posts at the moment of their firstpost in tier 2. Most users had access to tier 2 before reaching the declared 150 posts thresh-old. D=Double accounts; N=Normal Users; R=Rippers; S=Spammers; U=Unidentifiedbanned users.
A failure of regulations
Carders.de had no ex-post system of regulations (Hyp. 1e) and therefore weconcentrate on the presence of ex-ante enforcement rules (Hyp. 1d). To testthe validity of Proposition 1d we need to check each individual rule.
If rules are enforced in the first tier this would mean that no user with lessthan 5 posts is able to participate in Tier 1. We find that more than 50%of the users in Tier 1 accessed it before their fifth post in the community.Despite this being a very simple and straightforward rule to automate, thereis no evidence of its implementation in the forum.
The first rule for access to Tier 2 states that users should have at least 150posts before posting their first message in Tier 2. Figure 6.7 reports a break-down of the posting history for each user category. The totality of users withdouble accounts posts in Tier 2 before reaching the 150 post limit threshold.This may suggest that users already familiar with the forum (e.g. previously
93
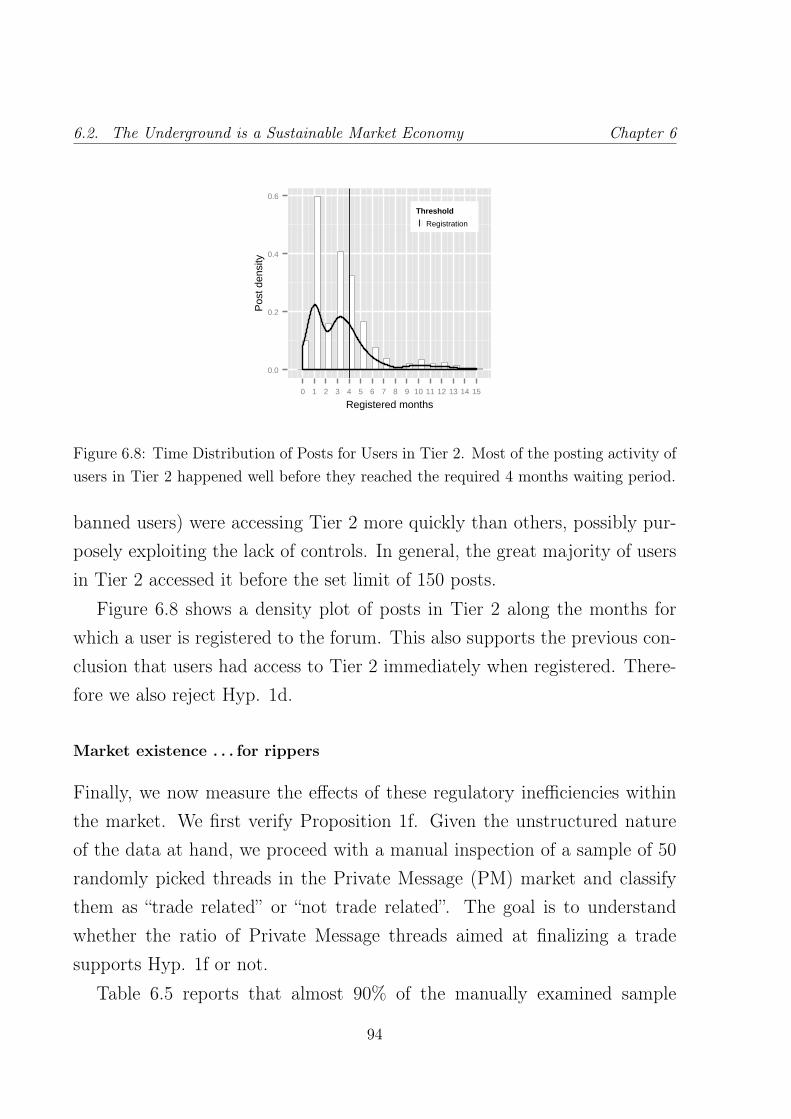
6.2. The Underground is a Sustainable Market Economy Chapter 6
0.0
0.2
0.4
0.6
0 1 2 3 4 5 6 7 8 9 10 11 12 13 14 15
Registered months
Pos
t den
sity
Threshold
Registration
Figure 6.8: Time Distribution of Posts for Users in Tier 2. Most of the posting activity ofusers in Tier 2 happened well before they reached the required 4 months waiting period.
banned users) were accessing Tier 2 more quickly than others, possibly pur-posely exploiting the lack of controls. In general, the great majority of usersin Tier 2 accessed it before the set limit of 150 posts.
Figure 6.8 shows a density plot of posts in Tier 2 along the months forwhich a user is registered to the forum. This also supports the previous con-clusion that users had access to Tier 2 immediately when registered. There-fore we also reject Hyp. 1d.
Market existence . . . for rippers
Finally, we now measure the effects of these regulatory inefficiencies withinthe market. We first verify Proposition 1f. Given the unstructured natureof the data at hand, we proceed with a manual inspection of a sample of 50randomly picked threads in the Private Message (PM) market and classifythem as “trade related” or “not trade related”. The goal is to understandwhether the ratio of Private Message threads aimed at finalizing a tradesupports Hyp. 1f or not.
Table 6.5 reports that almost 90% of the manually examined sample
94

Chapter 6 6.2. The Underground is a Sustainable Market Economy
threads are trade related. 54% of the trade-related PM threads also con-
Table 6.5: Classification of 50 Private Message Threads in Carders.deType # ThreadsTrade Initiated 43 86%Trade Initiated & Concluded 27 54%
Almost all threads in the PM section of Carders.de are about finalizing trades andmore than half of them come to a close.
tained contact information between the parties (e.g. ICQ, Post Address andPayPal) and led to a concluding contract between the two. The evidencetherefore supports Hyp. 1f: there has actually been a market.
We are now interested in seeing whether users that have been bannedfor explicitly ripping other users are more or less successful than normalusers. Given the results we obtained so far, we expect the two types to beindistinguishable: if there is no available tool to distinguish between ‘good’and ‘bad’ users (as the evidence indicates up to here), then choosing withwhom to trade can be no better than randomly picking from the population oftraders. Figure 6.9 is a boxplot representation of initiated trades for Rippersand Normal users in the forum. The two distributions overlap significantly.A Mann-Whitney test accepts the null hypothesis “There is no differencein the average number of received private messages for rippers and normalusers” (p = 0.98). As expected in light of the evidence so far, the systematicfailure of the forum mechanisms made rippers and normal users effectivelyindistinguishable to the trade initiator.
The comparison with HackMarket.ru
In this section we provide an introductory overview of the HackMarket.rumar-ket which is still an active and arguably well-functioning cybercrime market.
95

6.2. The Underground is a Sustainable Market Economy Chapter 6
1
10
100
Normal Users Ripper Users
User Group
Am
ount
of P
Ms
(log)
Figure 6.9: Initiated trades for Ripper users and Normal users. There is no difference inthe number of trades the users of the two categories are involved in. Consistently with theanalysis so far, this indicates that market participants are not able to distinguish goodtraders from bad traders.
A successful reputation mechanism
The forum regulation outlines seven user groups [DMN 5]. The following listpresents these groups in descending order of trustworthiness, i.e. those ontop of the list are the most reliable users in the community.
1. Admin.
2. Moderator.
3. Trustee: members of the community that “own important services, orare moderators or administrators of other forums” [DMN 5].
4. Specialist: Users elected in this group are considered “advanced” users”with a “high level of literacy”.
5. User: Normal users.
6. Rippers: users that have been reported and have been found guilty of“scamming”. It is explicitly recommended “to have no deals (business,
96
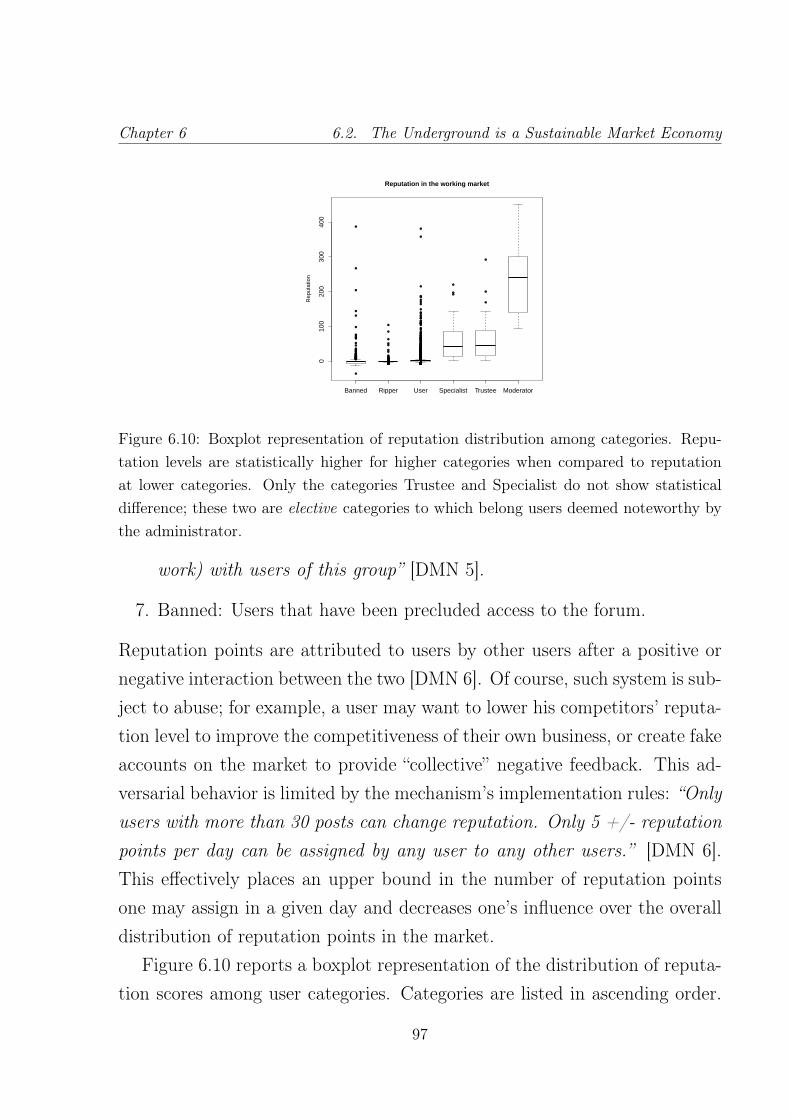
Chapter 6 6.2. The Underground is a Sustainable Market Economy
●
●
●
●
●
●
●●●●
●
●
●●●●●●●●●●●●●●●●●●●●●●●●●●●●●●●●●●●●
●
●
●
●
●●
●●
●●●●●●●●●●●●●●●●●●●●●●●●●●●●●●●●●●●●●●●●●●●●●●●●●●●●●●●●●●●●●●●●●●●●●●
●●●●●●●●●●●●●●●●●●●●●●●●●●●●●●●
●
●
●
●●
●●●
●
●●●●●●
●●●●●●●●
●●●●●●●●●●●●●●●●●●●●●●●●●●●●●●●●●●●●●●●●●●●●●●●●●●●●●●●●●●●●●●●●●●●●●●●●●●●●●●●●●●●●●●●●●●●●●●●●●●●●●●●●●●●●●●●●●●●●●●●●●●●●●●●●●●●●●●●●●●●●●●●●●●●●●●●●●●●●●●●●●●●●●●●●●●●●●●●●●●●●●●●●●●●●●●●●●●●●●●●●●●●●●●●●●●●●●●●●●●●●●●●●●●●●●●●●●●●●●●●●●●●●●●●●●●●●●●●●●●●●●●●●●●●●●●●●●●●●●●●●●●●●●●●●●●●●●●●●●●●●●●●●●●●●●●●●●●●●●●●●●●●●●●●●●●●●●●●●●●●●●●●●●●●●●●●●●●●●●●●●●●●●●●●●●●●●●●●●●●●●●●●●●●●●●●●●●●●●●●●●●●●●●●●●●●●●●●●●●●●●●●●●●●●●●●●●●●●●●●●●●
●●●●●●●●●●●●●●●●●●●●●●●●●●●●●●●●●●●●●●●●●●●●●●●●●●●●●●●●●●●●●●●●●●●●●●●●●●●●●●●●●●●●●●●●●●●●●●●●●●●●●●●●●●●●●●●●●●●●●●●●●●●●●●●●●●●●●●●●●●●●●●●●●●●●●●●●●●●●●●●●●●●●●●●●●●●●●●●●●●●●●●●●●●●●●●●●●●●●●●●●●●●●●●●●●●●●●●●●●●●●●●●●●●●●●●●●●●●●●●●●●●●●●●●●●●●●●●●●●●●●●●●●●●●●●●●●●●●●●●●●
●
●●
●
●
●
Banned Ripper User Specialist Trustee Moderator
010
020
030
040
0
Reputation in the working market
Rep
utat
ion
Figure 6.10: Boxplot representation of reputation distribution among categories. Repu-tation levels are statistically higher for higher categories when compared to reputationat lower categories. Only the categories Trustee and Specialist do not show statisticaldifference; these two are elective categories to which belong users deemed noteworthy bythe administrator.
work) with users of this group” [DMN 5].
7. Banned: Users that have been precluded access to the forum.
Reputation points are attributed to users by other users after a positive ornegative interaction between the two [DMN 6]. Of course, such system is sub-ject to abuse; for example, a user may want to lower his competitors’ reputa-tion level to improve the competitiveness of their own business, or create fakeaccounts on the market to provide “collective” negative feedback. This ad-versarial behavior is limited by the mechanism’s implementation rules: “Onlyusers with more than 30 posts can change reputation. Only 5 +/- reputationpoints per day can be assigned by any user to any other users.” [DMN 6].This effectively places an upper bound in the number of reputation pointsone may assign in a given day and decreases one’s influence over the overalldistribution of reputation points in the market.
Figure 6.10 reports a boxplot representation of the distribution of reputa-tion scores among user categories. Categories are listed in ascending order.
97
6.2. The Underground is a Sustainable Market Economy Chapter 6
It is here clear that higher rankings are reflected in higher reputation levelsof the users. We run a Mann-Whitney unpaired test to check if the differ-ence in reputation levels between categories is significant, and we find thatreputation levels significantly increase with higher categories. The only ex-ception is for the Trustee and Specialist categories, for which no difference isfound (which is explained by the elective nature of these categories). Whilethis does not mean that higher reputation results in a higher ranking (as anumber of endogenous factors other than reputation may be related to theinclusion in a user group - i.e. there is a self-selection problem), it does showthat the reputation mechanism is effectively enforced and results in coherentdistributions among users. For HackMarket.ru we accept Proposition 1a-1c.
Enforced ex-post regulations
Since there is no market hierarchy, Proposition 1d does not apply to Hack-Market.ru. With regard to the ex-post type of regulations (Hyp 1e), userscan effectively report other users to the board of administrators when theythink they have been scammed. The administrators remark that “We ex-pose [cheaters] with pleasure.” [ADM 6]. The exposure of a user in the listof cheaters is a fairly refined process, that requires a report to be filed, aninvestigation to be carried, and that allows the ‘alleged scammer’ the rightto defend himself before the decision by the moderators. The whole phasetakes place in a dedicated sub-community of the market, a sort of ‘court ofjustice’ where the offended reports the (alleged, at this point) offender.
The reporting is to be filed according to a specific procedure establishedin the market regulation, that includes the “name, contacts, a proof of thefact (log, screenshot of correspondence, money transfers,..) and a link tothe user’s profile.” Following the filing, an actual ‘trial’ takes place. Thedefendant has the obligation of replying to the accusation, as not doing sowithin seven days from the filing results in the accuser automatically winning
98
Chapter 6 6.2. The Underground is a Sustainable Market Economy
the case. The investigation can be carried both by moderators and admin-istrators, while the final decision usually belongs to the administrator. Thecommunity is also often active in the discussion, reporting further evidenceor personal experience with the accused, or helping in the investigations. Anexample of regulation during a trial is reported in the following, where theadministrator is stating clearly the points of dispute:
Key issues, without which it would be impossible to objectively consider[to put the accused in the] Black [list of scammers]:
1. Whether the transfer happened at all
2. Whether the transfer was cashed
3. Exactly who received/took off with the money. [DMN 1]
A key point is to understand how the punishment mechanism is applied inpractice. In particular, we are interested in understanding whether trials un-fold with significant discussions, and whether the final decision is ultimatelyenforced.
To this aim, in Table 6.6 we illustrate three example trials held in themarket, two of which ended with a user being ‘black listed’, and one wherethe accused is acquitted and no punishment is imposed. We define ‘accuser’the user that reports the complaint, and ‘defender’ the reported user.
99

6.2. The Underground is a Sustainable Market Economy Chapter 6Ta
ble6.6:
Enforcementof
regu
lation
mecha
nism
sin
Hac
kMar
ket.ru.
Case
Cha
lleng
edam
ount
#Users
in-
volved
Evidence
#Messages
Duration
Outcome
Reason
Defender
noshow
390$
7Cha
ttran
-scripts
117da
ysDefender
bann
edDefendernevershow
edup
.
Defender
loses
2800
$7
Screenshots,
tran
sac-
tion
logs,
chat
tran
-scripts.
2929
days
Defender
bann
ed.
Defenderdid
notprov
ideexha
us-
tive
evidence
that
thepa
ymentwas
ultimately
committed
infavo
rof
theaccuser.
Defender
wins
1400
$3
Cha
ttran
-scripts,
screen-
shots.
911
days
Defender
foun
dno
tgu
ilty,
noaction
taken.
The
defend
erdemon
strated
that
good
was
notdeliv
ered
becausethe
paym
entha
ppened
during
atechni-
calm
alfunction
ofhisInternet
con-
nection,
andhe
thereforecouldno
tackn
owledg
eit.
Trialr
egulationis
strictly
enforced.Evidencebrou
ghtin
supp
ortto
thecase
ofeither
thedefend
eror
theaccuserisa
lway
scritically
analyzed;m
orecontroversial
trials
requ
irelong
ertimeto
beconcluded,
andthefin
aldecision
canbe
infavo
rof
either
participan
t,depe
ndingon
howconv
incing
theevidence
supp
orting
one’s
case
was.
100

Chapter 6 6.2. The Underground is a Sustainable Market Economy
All three cases were filed by disgruntled clients who paid the sellers but didnot receive the goods. All trials above took place within an observation year.In every case, the HackMarket.ru community joins in into the investigation,either providing additional details on the current status of the users involvedin the case, or as witnesses with past experience in dealing with the accuseror the defender. As expected, controversial cases take more time than easierones. In Table 6.6, the first case is quickly closed as simply the defender doesnot show up in time. This complies with the forum regulation noted above.The second case is the most controversial of the three, with the defenderaggressively participating in the discussion and providing more and more(unsatisfactory) evidence of his innocence. The amount of evidence provided,and the intricacy of the discussion require time for the administrator to cometo a verdict, which happens after a month. In the third case, the defenderwas able to show that he never “cashed” the sent payment. The accuser stopsreplying soon after that and the administrator closes the case.
Evidence is carefully analyzed by the forum administrator as the followingexcerpt shows:Judging from the screen from post #num, there is a transfer, and it was re-ceived. Double-check that, you can verify online with Western. But I haven’tseen proof of receipt. To get the answer for the third question, we need toask to whom the money was sent through Western. If I am not mistaken,upon request of the sender they can provide full information.Therefore, we will do as follows. Sender, i.e. #buyer nickname get all de-tails and full information from Western, report here the result before Friday#date.[DMN 1]
In some cases, the administrator tries to arbitrate the question as s/heclearly values both buyer and seller: It would be great if you two [buyer andseller] contact each other and sort this matter out. We only need to knowthe details for the recipient, and it will immediately be clear who is at fault,
101

6.2. The Underground is a Sustainable Market Economy Chapter 6
even without [proceeding with] the Black [list]. [DMN 1]On a qualitative note we observed what follows:
1. the defender always reports detailed information on the accused userand on the case of complaint.;
2. many witnesses appear in ‘court’ giving opinions on the evolution of thecase, or providing supporting evidence for either the accuser and thedefender;
3. the moderators and the administrators are always present in each report,and actively moderate the discussion;
4. when the defender does not show up within the time limit specified bythe administrator [DMN 6], the case always goes to the defender;
5. when the defender shows up, he/she always publishes evidence of his/hercase, being those screenshots of chats with the accuser or Webmoneytransaction logs;
6. some cases last several months, with all parties actively participating inthe discussion and new evidence being examined or asked for iteratively;
7. when the evidence provided by either of the defender or the accuser isnot conclusive, the case goes to the opponent or a ‘null’ is thrown (whenneither of the two is convincing, nobody wins);
8. users that end up being found guilty are always exposed in the list ofcheaters and/or are banned from the forum. The latter is a harsh pun-ishment: in contrast to IRC markets,re-entry into the forum is neithereasy in effort nor short in time.
We therefore accept Proposition 1e for HackMarket.ru.
102
Chapter 6 6.2. The Underground is a Sustainable Market Economy
Market existence
We have not direct access to the private conversation of participants in Hack-Market.ru, but we collected exhaustive evidence on their private transactionsthrough the conversation logs reported in the trials. In every case reported,the finalization of the contract and the transaction always happen throughsome type of private communication, usually thought the ICQ chat messagingsystem or Jabber.ru. We therefore accept Proposition 1f.
Participants initiating a trade also often declare to have performed a back-ground check on the seller by either contacting the administrators or bychecking the official blacklist of the forum. One example of this is given in[NTL 12]: “[The] admin [of the forum] confirmed me that you [the seller] arenot a rookie trader ”. Evidence for background checks such as this is frequent.We therefore accept Proposition 1g.
Discussion
“Regulation” is the main advantage that a forum-based community has overan IRC-based community: it provides the forum users with a set of rules andmechanisms to assess the information they can collect on a particular trade.The analyzed markets attempted to enforce this by providing a regulatorymechanism for user reputation and access to “elite” market tiers. This maybe not sufficient for the user to have complete information on the transac-tion; yet, it could provide her with some baseline information on her tradingpartner, ruling out part of the information asymmetry problem identified forother markets [63], and precisely by mitigating the adverse selection problem[48]. For legitimate markets, reputation proved to be an effective mechanismalbeit not a definitive solution.
Table 6.7 reports the summary of Hypothesis testing for the two markets.The organizational and structural differences of HackMarket.ru with respect
103

6.2. The Underground is a Sustainable Market Economy Chapter 6
to Carders.de is evident. In Carders.de, each of the regulation mechanismshas been faultily implemented and the potential means for a user to assessex-ante a trade are pointless or even misleading. The systematic failure of theregulatory mechanisms clearly led to a market were users had no incentives inconducting fair transactions and had no means to distinguish “good traders”from “bad traders”. We showed that there is in fact no difference in thenumber of trades initiated with a ripper and trades initiated with a normaluser. This effect alone may have brought to the failure of the market, whichwe show being effectively of the same nature of Florencio et al.’s IRC market.
In HackMarket.ru the reputation and punishment mechanisms generatemeaningful information for the user:
1. Evidence supports the hypothesis that reputation points are meaning-fully assigned to users and this arguably results in a useful tool for theuser to asses potential trading partners.
2. The punishment mechanism is a well-regulated one and direct evidencesuggests that ‘trials’ are conducted in a fair manner. This boost marketactivity and incentivizes ‘honest’ behavior.
3. Users that have been found guilty are, if not banned, publicly exposedand assigned to the ‘scammers’ group. This allows other users to clearlyassess a scammer’s trading history and make an informed decision withwhom to trade.
It appears that the punishment mechanism is enforced coherently withthe stated rules (e.g. the time frame for the defendant to show up is firmlyenforced). We find evidence that trials in the market involve an in-depthdiscussion on the issue raised by the accuser, and witnesses are called tosupport one’s claims. Importantly, evidence supporting the case of boththe defender and the accuser (e.g. transaction logs and previous exchangesbetween the two parties) is always requested and analyzed. This shows that
104

Chapter 6 6.2. The Underground is a Sustainable Market Economy
the forum administrators tend to take well-informed decisions. This is inaccordance with the overall reputation levels among categories (Figure 6.10).
The very fact that defendants do show up is a proof that they see a valuein preserving their reputation as users and do not just register with a newaccount. The difficulties of the registration process makes dropping and re-registering a costly and lengthy process.
Conclusion 2 From our analysis we therefore accept Proposition 1. Weconclude that the cybercrime markets evolved from an unsustainable modelto one where strong regulation and reputation mechanisms may allow marketparticipants to overcome the asymmetry problems inherent in this setting.
105

6.2. The Underground is a Sustainable Market Economy Chapter 6
Table6.7:
Com
parisonof
resultsfor
Car
ders
.dean
dH
ackM
arke
t.ru.
Propo
sition
Description
Tested
Prop.
#Car
ders
.de
Hac
kMar
ket.ru
Reputationmecha
nism
swork
Ban
nedusersha
velower
repu
tation
than
norm
alusers.
Prop.
1aRejected
Verified
Higherstatus
usersha
veahigh
errepu
tation
than
lower
status
users
Prop.
1bRejected
N.A
.
Ban
ned
userswith
ahigh
erstatus
have
alower
repu
tation
than
otheruserswiththesamestatus
Prop.
1cRejected
N.A
.
Regulations
areenforced
Preventive(ex-an
te)rulesareenforced
Prop.
1dRejected
N.A
.Pun
ishm
ent(ex-po
st)rulesareenforced
Prop.
1eN.A
.Verified
The
marketworks
Users
privatelyfin
alizetheircontracts
Prop.
1fVerified
Verified
Normal
usersreceivemoretrad
eoff
ersthan
know
nripp
ers
Prop.
1gRejected
Verified
Hyp
othesesaimed
atassessingtherelia
bilityof
therepu
tation
mech-
anism,theenforcem
entof
regu
lation
,an
dmarketfairness
areallre-
jected
for
Car
ders
.de.
Incontrast,H
ackM
arke
t.ru
appe
arsto
beawell-
function
ingmarket.
106

Chapter 6 6.2. The Underground is a Sustainable Market Economy
6.2.2 The Technology Traded in the Underground is Effective
Running Hypothesis Hypotheses TestingHyp. 2 Prop. 2. The tools bought and used by the attack-
ers are well engineered products that are effectivewhen deployed in the wild, as tested in the Malware-Lab against evolving software configurations.
To investigate Proposition 2 we test 10 exploit kits leaked from the un-derground markets to investigate their efficacy in the wild. In particular wetest whether they are resilient to the changing operative environment in thewild (i.e. updating software configurations), or if they are effective only forsmall windows of time.
Exploit kits’ main purpose is to silently download and execute malwareon the victim machine by taking advantage of browser or plugin vulnerabili-ties. Errors in applied programming interfaces or memory corruption basedvulnerabilities allow an exploit to inject a set of instructions (shellcode) intothe target process. Shellcode on its turn downloads an executable malwareon the victim’s hard drive and executes it. The executable installed on thetarget system is completely independent from the exploit pack (see [58] forsome statistics on the pairings).
Figure 6.11 depicts the generic scenario of drive-by-download attack [58,75]. A victim visits a compromised web site, from which he/she gets redi-rected to the exploit kit page. Various ways of redirection are possible: an<iframe> tag, a JavaScript based page redirect etc. The malicious web pagethen returns an HTML document, containing exploits, which are usually hid-den in an obfuscated JavaScript code. If at least one exploit succeeds, thenthe victim gets infected. An exploitation is successful when the injected shell-code successfully downloads and execute a malicious program on the victimsystem.
These tools are advertised and traded in the black markets. An example
107

6.2. The Underground is a Sustainable Market Economy Chapter 6
CompromisedWeb Site
1) Visit a compromized web site
2) Redirect to an exploit kit
Exploit Kit
3) Visit an exploit kit page
4) Return exploits
5) Download malware
Victim
Figure 6.11: Scheme of drive-by-download attack
of such advertisement is given in Figure 6.12. In this ad are reported thevulnerabilities included in the kit and the expected success rate of about20%. We find similar success rates to be declared in the advertisement of thecompetition as well.
Design of the experiment
To evaluate exploit kit resiliency, we test exploit kits in a controlled en-vironment, our MalwareLab. The core of our design is the generation of“reasonable” home-system configurations to test against the infection mecha-nism and capabilities of exploit kits. We test those configurations as runningon Windows XP, Windows Vista and Windows 7. Table 6.8 reports versionsand release dates of each operating system and service pack considered (fromhere on, system). After an initial phase of application testing on the selectedsystems, we fix the life-time of an operating system to be 6 years for com-
108

Chapter 6 6.2. The Underground is a Sustainable Market Economy
Figure 6.12: Sample advertisment for a popular exploit kit in 2011- mid 2012, “Eleonore”.
patibility of software. Ysys indicates the working interval of each operatingsystem.
For our experiment we selected 10 exploit kits (see Table 6.9) out of the34, leaked from the black markets, we gathered. Some of them proved tobe not fully-functional or impossible to be deployed (e.g. because of missingfunctions). Out of those that were deployable and armed, we selected 10according to the following criteria: (a) popularity of the exploit kit [112]; (b)year of release; (c) unique functionality (e.g. only one of multiple versions ofthe same kit family is selected).
Configuration selection
The automated installation of software configurations on each machine fol-lowed the definition of a criteria to select software to be installed. As oftenhappens, this is subject to a number of assumptions that define the criteriathemselves. For our experiment to be realistic, we need to build configura-tions that are reasonable to exist at a certain point in time. As an example,we consider unlikely to have Firefox 12, released in April 2012, installed on
109

6.2. The Underground is a Sustainable Market Economy Chapter 6
Table 6.8: Operating systems and respective release date. Configurations are right-censored with respect to the 6 years time window.
Op. system Service Pack Ysys
Windows Xp
None 2001 - 20071 2002 - 20082 2004 - 20103 2008 - 2013*
Windows VistaNone 2006 - 20121 2008 - 2013*2 2008 - 2013*
Windows 7None 2009 - 2013*1 2011 - 2013*
the same machine with Adobe Flash 9, released 6 years earlier in June 2006.We therefore fix a two-years window that defines which software can coexist.The window is based on the month and year of release of a particular soft-ware. Since our oldest exploit kit is from early 2007, we are testing softwareonly released in the interval (2005, 2013). Table 6.10 shows the softwareversions we consider8.
The algorithm to generate each configuration iterates through all yearsYconf from 2006 to 2013, and chooses at random a version of each software(including “no version”, meaning that that software is not installed for thatconfiguration) that satisfy YswRel ∈ [Yconf − 1, Yconf ]. For each Yconf we gen-erate 30 random configurations. Given the construction of YswRel, we end upwith seven windows and therefore 210 configurations per system reported inTable 6.8. However for compatibility reasons each system has a time win-dow of 6 years starting one year before its release date. Because we wantto measure the resiliency of exploit kits, we keep the number of configura-
8We did not include Google Chrome as it was first released halfway through the timeline consideredin our experiment (2008). Introducing Chrome samples in 2008 would have changed the probability ofa particular software to be selected. In turn, this would make comparing time windows before and after2008 statistically biased. We plan to include Chrome in future experiment designs.
110

Chapter 6 6.2. The Underground is a Sustainable Market Economy
Table 6.9: List of tested exploit kits
# Name Version Release Year1 Crimepack 3.1.3 20102 Eleonore 1.4.4mod 20113 Bleeding Life 2 20104 Elfiesta 1.8 2008*5 Shaman’s Dream 2 2009*6 Gpack UNK 20087 Seo UNK 20108 Mpack 0.86 2007*9 Icepack platinum 200710 Adpack UNK 2007*
For some exploit kits we could not find the respective release advertisement on the black markets, and
therefore a precise date of release for the product cannot be assessed. For those (*) we approximate the
release date to the earliest mention of that exploit kit in underground discussion forums and security
reports. This identifies an upper bound of the release date.
tions per year constant (otherwise results would not be comparable betweendifferent runs). This means that some systems are tested, overall, againsta lower number of configurations than others. For example, Windows XPService Pack 1 (2002-2008) will be tested only against configurations in thetime windows{[2006, 2008),[2007-2009))}9, which gives us 60 configurations.Windows Vista with no Service Pack (2006-2012) will instead be tested, forthe same reason, with 180 configurations. This guarantees that each exploitkit is tested for each system against the same number of configurations peryear.
The algorithm iterates through each configuration and runs it against theavailable exploit kits. Figure 6.13 is a representation of an experiment runfor each system. At each iteration i, we select the configuration conf i. If
9Note that the last year of the time window is not included. For example, [2006,2008) includesconfigurations from January 2006 to December 2007a.
111

6.2. The Underground is a Sustainable Market Economy Chapter 6
Table 6.10: Software versions included in the experiment.
Software Versions # of versionsMozilla Firefox 1.5.0.2 - 17.0.1.0 122Microsoft Internet Explorer 6-10 5Adobe Flash 9.0.16.0-11.5.502.135 54Adobe Reader 8.0.0-10.1.4 17Java 1.5.0.7-7.10.0.0 49
Total 247
Overall 9 software versions were excluded from the experiment setup because the corresponding installa-
tion package was either not working or we could not find it on the web.
Yconfi ∈ Ysys, we automatically install the selected software on the virtualmachine using the “silent install” interface provided by the vendor or by themsi installer. A configuration install is successful when all software in thatconfiguration is installed.
When the installation process ends, we take a “snapshot” of the virtualmachine. Every run for confi will restore and use this snapshot. The advan-tages of this are twofold: at first we eliminate possible confounding factorsstemming from slightly different configurations, because only the exploit kitchanges; secondly, this is also faster than re-installing the configuration everytime, which would have considerably stretched the (already not short) com-pletion time. When all exploit kits are tested, a new configuration is eligiblefor selection.
Data collection
In the course of our experiment we keep track of (a) the successfulness ofthe automated installation of a configuration on a victim machine (VICTIM)at any given time; (b) the successfulness of infection attempts from exploitkits. This data is stored in two separate tables, Configurations and Infectionsrespectively.
112

Chapter 6 6.2. The Underground is a Sustainable Market Economy
d
Figure 6.13: Flowchart of an experimet run. This flowchart describes a full experimentrun for each system in Table 6.8. Configurations are generated in chronological order,therefore if the first control on YSys fails, every other successive configuration would aswell and the experiment ends. Snapshots enable us to re-use an identical installation of aconfiguration multiple times.
1. Configurations is needed to control for VICTIM configurations thatwere not successfully installed; this way we can correctly attribute (un)successfulexploitation to the right set-ups. This is desirable when looking for infectionrates of single configurations or software.
2. Infections stores information on each particular configuration runagainst an exploit kit. We set our infection mechanism to make a call to theMalware Distribution Server (MDS) each time it is executed on the VICTIMmachine. A “call back” to the MDS can in fact only happen if the “malware”is successfully executed on VICTIM. TheMDS stores the record in Infections,alongside (snapshot_id, toolkit_name, toolkit_version, machine, IP, date,successful). Exploit kits have an “administrative panel” reporting infectionrates [75]. However, we decide to implement our own mechanism because (a)it allows us to have more control on the data in case of errors or unforeseencircumstances; (b) exploit kits statistics may not be reliable (e.g. developersmight be incentivated in exaggerating infection rates).
To minimise detection [58], some exploit kits avoid attacking the same
113

6.2. The Underground is a Sustainable Market Economy Chapter 6
machine twice (i.e. delivering the attack the same IP). This behaviour isenabled by an internal database controlled by the kit, independent from ourInfections table. In some cases, e.g. when the experiment run needs tobe resumed from a certain configuration, our Infections table may reportun-successful attacks of an exploit kit, when instead the exploit kit did notdeliberately deliver the attack in the first place. We therefore need to controlfor this possibility by resetting the exploit kit statistics when needed.
Operational realization
In this Section we present the technical implementation of our experimentdesign in its three key points: (1) virtualised system infrastructure; (2) au-tomated execution; (3) operative data collection;
Virtualised System Infrastructure
When testing for malware, an isolated, virtualised infrastructure is desirable[101]. We set up a five machine network that includes a Malware Distribu-tion Server (MDS) and four machines hosting the Victim Virtual Machines(VICTIMs). Initially, the setup also included an IDS and a network auditinginfrastructure to log the traffic; however, to eliminate possible confound-ing factors caused by the network monitoring and auditing, we decided toeliminate this part of the infrastructure from the design reported here. Forpractical purposes (i.e. scripting), all machines are run on a linux-basedoperating systems, upon which the virtualised infrastructure is installed.
The purpose of the MDS is to deliver the attacks. Because of the nature ofexploit kits, all we need to attack VICTIMs is an Apache Web-Server listeningon HTTP port 80 upon which the kits are deployed. As mentioned, weimplemented and armed the exploit kits with our own “malware”, Casper.exe(our Ghost-in-the-browser [94]) to help us keep track of infected systems.In order to make it compatible with all Windows versions we have linked
114
Chapter 6 6.2. The Underground is a Sustainable Market Economy
it statically with the appropiate libraries (e.g. Winsock). Casper reads aspecial configuration information file that we put on each victim machineand send its content to a PHP script on the MDS by using the WinsockAPI. This script (trojan.php) simply stores the received data along with theVICTIM IP address and timestamp into the Infections table in our database.
Automated execution
We use VirtualBox to virtualise victim machines. In order to automate thetests we take advantage of the tool that is shipped with VirtualBox calledVBoxManage. It is a command line tool that provides all the necessaryfunctions to start/stop virtual machines, create/delete snapshots and runcommands in the guest operating system. The main program, responsiblefor running the experiment is a Python script that makes a sequence of callsto VBoxMange via subprocess Python module.10
At each run, our scripts read configurations.csv, a file containing all thegenerated configurations for that machine. The scripts iteratively install con-figurations upon the VICTIM system. The mapping between software versionpointers in configurations.csv and the actual software to be installed is hard-coded in the core of the implementation. The automated installation happensvia the silent install interface bundled in the installation packages distributedby most software vendors. However, because of a lack of a “standard” inter-face and the inconsistencies between different versions of the same software,we could not deploy one-solution for all software. We used instead a “trial-and-error” approach and online documentation to enumerate the argumentsto pass to the installers and map them with the right software versions. Eachconfiguration is then automatically and iteratively run against every exploit
10It should be noted that there is Python API for VirtualBox, that allows to run VirtualBox commandsdirectly from within the Python environment. We tried to use it during our first (failed) experiment, buthad to switch to VBoxManage, because Python VirtualBox API functions proved not to be very reliableon our machines.
115

6.2. The Underground is a Sustainable Market Economy Chapter 6
kit on the MDS.Despite the experiment being completely automated, we found that some
machines were failing at certain points in the run, most often while savingsnapshots or uploading files to the VICTIMs. We therefore implemented a“resume functionality” that allows us to “save” the experiment at the latestvalid configuration, and in case of failure restore the run from that point.
To reset exploit kits statistics and guarantee the soundness of the statisticscollected in the Configuration and Infections tables, we have implemented aPHP script that clears the records on delivered attacks the kit keeps. Thisstep was rather easy to accomplish: we used the code snippets responsible forstatistics reset in each exploit kit, and copy-pasted them into a single script.
We keep track of software installations on the VICTIM machines by meansof a second dedicated script. To build it, we manually checked where eachprogram puts its data on the file system at the installation. Because it wasimpossible to look at every application installation directory we sampled asubset of programs to check whether they always put data in the same place.Then we wrote a batch file that checks for the presence of the correspondingdata directories after the alleged installation. The results of the batch fileinspection are then passed to a Python script on the host machine, sent tothe MDS, and stored in the Configurations table on our dataset.
To collect the infection data, when theMDS receives a call from a VICTIMmachine, theMDS adds a record in the Infections table, setting the successfulrecord to 0 (the default). When executed, Casper connects to the MDS viaa PHP page we set up (namely infection.php). This updates the successfulbit of the corresponding run record in Infections to 1.
Experiment results
The automatic installation procedure proved to be rather reliable. Figure6.14 depicts a 100%-stacked barplot of configuration installs by software. As
116

Chapter 6 6.2. The Underground is a Sustainable Market Economy
Figure 6.14: Stacked barplot of configuration installs by software. The installation pro-cedure was successful the majority of the time, the only exception being Flash for whichwe have a 20% detected failure rate.
one can see, Firefox and Java were practically always successfully deployedon the machine. In contrast, 6% of Adobe Acrobat and 21% of Flash instal-lations were reported to be not successfully completed. However, it provedpractically unfeasible to manually check failures of our detection mechanism(e.g. the files for that software version on that configuration may be on adifferent location). We cannot therefore assess the level of false negatives ourdetection mechanism generates.
Figure 6.15 reports an overview of the infection rates of all exploit kitsin each time window. Intuitively, because the exploit kits are always thesame, the general rate of infection decreases with more up-to-date software.Observationally, from 2005 up to 2009 the success rate of exploit kits seem notto be affected by system evolution. A marked decrease in the performanceof our exploit kits starts only after 2010. This observation is confirmedby looking at a break-up of volumes of infections per exploit kit per year,depicted in Figure 6.16. Generally speaking, each exploit kit (apart fromBleeding Life) seem to remain effective mainly within the first three time
117

6.2. The Underground is a Sustainable Market Economy Chapter 6
Figure 6.15: Infection rates per time window. Exploit kits obtain a peak of about 30%successful infections and maintain this level for 3 years on average. Afterwards infectionrates drop significantly. Only after 8 years overall exploitation rate goes to zero.
windows, from 2005 to 2009. Eleonore, CrimePack and Shaman lead thevolume of infections in those years, with Eleonore peaking at more than 100infections for 2006-2008, which amounts at about 50% of the configurationsfor that window. Interestingly, a few exploit kits seem identical in termsof performance. Seo, mPack, gPack, ElFiesta, AdPack, IcePack all performidentically throughout the experiment. Most exploit kits’s efficacy drops inthe fourth time-window, were configurations spanning from 2008 to 2010 areattacked. However, Bleeding Life is here an outliner, as its efficacy in infectingthese machines rises and tops in 2009-2011 to more than twice its infectionrates for 2005-2009. After 2011, however, its infection capabilities drop tozero. In the last but one time window (2010-2012), the only still effectiveexploit kits are Crimepack and Shaman. Overall three types of exploit kitsseem to emerge:
1. Lousy exploit kits. Some exploit kits in the markets seem to be identicalin terms of effectiveness in infecting machines. Not only they perform
118

Chapter 6 6.2. The Underground is a Sustainable Market Economy
Figure 6.16: Number of configurations that each exploit kit was able to successfully attackin each time window. Number of exploited configurations are reported on the Y-axis, andtime windows on the X-axis. We can identify three groups of exploit kits. Lousy kits(mpack, Seo, ElFiesta, AdPack, IcePack, gPack) are rip-off of each other and performprecisely the same and are consistently the worst. Long-term exploit kits (Crimepack,Shaman) achieve higher exploitation rate and maintain non- zero exploitation rates forup to 7 years. Time-specific exploit kits (Eleonore, Bleeding Life) achieve the highestexploitation rates within a particular time frame but their success rate drops quicklyafterwards.
equally, but the identical trend throughout our experiment suggests thatthe exploits they bundle are themselves identical. This may indicatethat some exploit kits may be rip-offs of others, or that an exploit kitauthor may re-brand the same product.
2. Long-term exploit kits. From our results, a subset of exploit kits (inour case Crimepack and Shaman) perform particularly well in terms ofresiliency. Crimepack and Shaman are the only two exploit kits thatremain active from 2005 to 2012, despite not being the most recentexploit kits we deployed (see Table 6.9). For example, in the period 2008-
119

6.2. The Underground is a Sustainable Market Economy Chapter 6
2012 Shaman performs up to two times better than Eleonore, despitebeing two years older. In other words, some exploit kits appear to bedesigned and armed to affect a wider variety of systems in time thanthe competition.
3. Time-specific exploit kits. As opposed to long-term exploit kits, somekits seem to be extremely effective in short periods of time only to “die”shortly after. Eleonore and Bleeding Life belong to this category. Theformer achieves the highest amount of infection per time window in 2006-2008, and drops then to the minimum within the next two years. Thelatter is the only exploit kit capable of infecting “recent” machines, i.e.those with configurations since 2009 on. Bleeding Life was in particularclearly designed to attack machines around the period of the release ofthe kit (2010).
Overall, we find that exploit kits are capable of delivering successful at-tacks over a prolonged period of time. This supports our Proposition thatattack tools traded in the black markets are effective and well-engineeredpieces of software that represent a non-transient risk factor for the final user.
Conclusion 3 From our analysis, we accept Proposition 2. We concludethat the goods traded in the underground are well-engineered and differenti-ated attack tools that are capable of maintaining the infections over a signif-icant period of time.
120

Chapter 6 6.2. The Underground is a Sustainable Market Economy
6.2.3 The Markets are Sustainable
Running Hypothesis Hypotheses TestingHyp. 2. The underground marketsare sound from an economicperspective.
Hyp. 2. Develop a two-stage model of the un-derground markets to show that the underlying eco-nomic mechanism is sound.
For this analysis we utilize qualitative case-study data obtained by infil-trating HackMarket.ru to provide evidence regarding the nature of cognitionand bounded rationality in information rich communities engaged in trans-action relationships. Our specific goal is to illustrate the emergent marketdesign in communities where contracts are incomplete by construction andthe only mechanism of enforcement is based on the shadow-of-the-future.
In particular, we identify three central points that are relevant for ouranalysis11:
1. The markets are strongly regulated, have a coherent reputation mech-anism and have trials in place to evaluate ‘ripping cases’ reported bymarket participants. The trials effectively represent a punishing mech-anism whereby the ripper is collectively punished by being effectivelyexposed as such and listed in the ‘do not trade with these users’ list.
2. Buyers regularly leave positive and negative feedback on a seller’s prod-uct by posting publicly on the forum their usage impressions. In thisway, buyers that ‘arrive second’ have additional information on the qual-ity of traded good, and sellers that receive negative feedback will effec-tively be out of market.
3. To encourage the first buyer in engaging in the trade (as he does nothave the cognitional advantages of the second buyer), the seller oftenprovides trial periods, demos and videos of the tool in action. This effort
11For conciseness, we do not report here the full record of evidence supporting these claims. Part of itis outlined in Section 6.2.1. A future article version of this Section will contain the full set of evidence.
121

6.2. The Underground is a Sustainable Market Economy Chapter 6
on the side of the seller decreases the level of uncertainty for the firstbuyer, effectively addressing part of the asymmetry between her (theseller) and him (the buyer).
We build a two-phase cognition model whereby a seller and a buyer stipu-late a contract A for the delivery of a technology. In particular, we considertwo independent and a-priori indistinguishable buyers, B1 and B2, that maybe interested in buying the tool. Because there is no guarantee that the ad-vertised product is not a lemon, the buyer that goes second has an inherentadvantage over the first because he can leverage from the first buyer’s expe-rience to decide whether A is good for him. Therefore, no buyer would bewilling to go first. We show how, to overcome this problem, the seller pro-vides a cognitional advantage to the first buyer (e.g. by giving a trial of theproduct). Because the seller’s goal is to extract maximum value from bothbuyers, by ‘discounting’ the cost for B1 (by decreasing the cognitional effortneeded to decide that A is good for him) she (the seller) creates the conditionswhereby the profit πB1 for the first buyer equals that of the second buyer,πB2. This solves the ‘trade entry’ problem whereby the first buyer wouldalways want to go second. We show that the condition πB1 = πB2 leads toan equilibrium whereby the model solves. We will show that the moderatingactivity described in Section 6.2.1 is central to establish the equilibrium. Byshowing that the model is analytically tractable, we conclude that the marketmechanism is sound from an economic perspective.
A two period cognition model
We follow [119] and consider a contract to provide a technology denoted A,which may or may not be suitable for a particular buyer. The specificityof the market means that production of A is very costly and that its use isextremely specialised. We will also see that the messaging board type ap-proach to sales means that a single price is generally posted for this product.
122

Chapter 6 6.2. The Underground is a Sustainable Market Economy
The very nature of the market, anonymous posts by cyber criminals on aclosed forum, means that enforcement of all contracts is incomplete and theonly punishment is via a credible removal of future transactions through amultilateral punishment action or via the dissemination of information aboutcontractual arrangements that have not been fulfilled.
In our case we have a two period set-up, with ex-ante identical buyerslabelled B1 and B2 contracting from a single seller S. Buyers are ex-anteidentical and receive payoff v if the technology A is appropriate for theirrequirements. Following the notation of [119] the probability that A is thecorrect technology is denoted 1 − ρ. This outcome is independent for allbuyers, therefore each buyer has an independent probability ρ of receivingthe incorrect technology. Whilst buyers are ex-ante identical, cognition onbehalf of the seller for a specific buyer is not deemed to be transferable. Inthe event that the technology A is not appropriate then the buyer suffers apenalty ∆ ≤ v and as such receives only v−∆, rather than v. In the main wewill use the working assumption that if the technology is not appropriate then∆ = v and in effect the buyer will receive no surplus from its deployment.
We view each buyer-seller interaction as being a separate experiment.However, the degree of common knowledge gained in phase one is assumedto permeate into phase two. For instance, buyers post feedback about theefficacy of technology, for good or for bad and this feedback allows futurebuyers to narrow down their choices. We can think of A as being the stan-dard, or pro-forma, technology and A′, the technology suitable for the buyer,is some bespoke arrangement. Therefore each buyer may or may not requirethe standard arrangement of A and suffer a loss of utility if it turns out thatA is not appropriate. As such neither seller not buyer know precisely whatthe buyers requirements are.
Buyers and sellers can engage in costly cognition to determine whetherA is the correct technology for them. For the first buyer, B1, the cost of
123
6.2. The Underground is a Sustainable Market Economy Chapter 6
discovering with probability b1, whether A is the appropriate technology forthem is denoted TB1
= TB(b1). We follow the standard assumptions in thecognition literature and [119] in particular and assume that the cognitioncosts originate at the origin, are strictly increasing and have a singularity atunity. Hence, TB(0) = 0, T ′B(0) = 0, 0 < TB(z) < ∞,∀0 < z < 1 andTB(1) = ∞, where z = {b1, b2}. For simplicity we assume that the secondbuyer has an advantage over the first buyer in discovering if A is appropriateby a fixed cost factor 0 ≤ δ ≤ 1, therefore the cost of cognition for B2 isTB2
= δTB(b2). Sellers can also engage in costly cognition by studying thebuyer and their own technology and can discover if A is suitable for a givenbuyer independently with probability s that may or may not be revealed tothe buyer. Similarly to the buyer we assume that the cost of cognition isdenoted TS(s) and that TS(0) = 0, T ′S(0) = 0, 0 < TS(z) < ∞,∀0 < z < 1
and TS(1) =∞, however TB(z) need not equal TS(z) for a given z. We willassume that TS is the same for the seller in both periods; whilst this appearsto be a limiting assumption our analysis will in general focus on cognitionby the seller with buyer B1. We assume that buyers will be indifferent frombeing first or second if their respective pay-offs are the same.
For analytical tractability we will show that it is simpler to relax theT ′B(0) = 0 assumption and place a constraint on the parameters of the func-tion TB(z) to ensure that the optima of the function lies within 0 < z∗ < 1
range.
We assume that TS(s) is independent of bi, therefore seller cognition doesrequire costly buyer cognition as an input. This non-collaborative conditionis justifiable for many types of technology, whereby the cost of cognitionfor buyer or seller is in the revelation of the ‘modality’ of the technology,e.g. the revealing of source code or methods of forcing memory overflowsby exploitation of certain key vulnerabilities in common software. From theviewpoint of the seller, in-the-main, this is a one sided cost as the buyer now
124

Chapter 6 6.2. The Underground is a Sustainable Market Economy
has the information needed to replicate the sellers technology at near zerocost.
The cognition mechanism
We now assume two update functions: First ρ(bi∈{1,2}), which is the privateex-ante probability that the buyer knows if A is suitable. By constructionwhen bi = 1, ρ(bi∈{1,2}) = 0, that is Buyer i knows with certainty the suit-ability of A. When bi = 0, ρ(bi∈{1,2}) = ρ, that is Buyer i is subject to theunconditional probability ρ of A being incorrect. Second, when the sellerprovides costly cognition to assist the buyer in the first sub-step and thebuyer then chooses their own costly cognition in the second step, we denotethis ρ(s, bi∈{1,2}). Following [119] Bayesian updating we find the followingfunctional forms:
ρ(bi∈{1,2}) =ρ(1− bi)1− ρbi
ρ(s, bi∈{1,2}) =ρ(1− s)(1− bi)
1− ρs− ρbi(1− s)≡ ρ(s)(1− bi)
1− ρ(s), (6.7)
where, ρ(s) =ρ(1− s)1− ρs
When A is incorrect, the buyer suffers a variance of utility v > ∆ > 0 fromthe endowment v, therefore the good now provides is v −∆ rather than ∆.Let us consider a price p provided by the seller, in the event that the sellerprovides some costly cognition to the buyer s > 0, then the buyers expectedpayoff for any given bi is:
πBi= v − p− ρ(s, bi)∆− TBi
, for i ∈ {1, 2}, (6.8)
where
TBi=
{TB1
(b1) = TB(b1), for i = 1
TB2(b2) = δTB(b2), for i = 2, and, 0 ≤ δ ≤ 1
(6.9)
125

6.2. The Underground is a Sustainable Market Economy Chapter 6
if the seller engages in no cognitive effort then this is denoted:
πBi= v − p− ρ(bi)∆− TBi
, for i ∈ {1, 2} (6.10)
When 0 < δ < 1, the buyer in period 2, B2, has a cognitive advantage thatfor any given probability b2, the cost of acquiring this ‘extra’ reduction inlikelihood that A is not the correct technology is cheaper than for the firstbuyer. We justify this by presuming that the level of common-knowledgeabout the technology, on the buyer side, may increase with use. This alsoforms the basis of our initial hold-up problem, as it is obvious that the secondbuyer will have a higher pay-off, in expectations for any given p. We shallnow demonstrate this effect.
The Price Setting Seller Assumption
We consider a seller S who is a price setter with bargaining power such thathe extracts all of the joint surplus of the Buyers. This assumption simplifiesthe price setting problem such that the sellers optimal price is that whichmaximises their surplus πS and has a boundary such that the buyers mustat least breaking even πBi∈{1,2} ≥ 0.12 The seller anticipates that for a givenbuyer Bi∈{1,2}, the highest surplus maybe extracted by the buyer engagingin cognition and reducing the likelihood of the buyer obtaining v−∆ ratherthan ∆. This brings us to our first case when the seller suffers no penaltyfor selling A when it is not suitable for a given buyer in one or both periods.
The Tight Margins assumption
Let 0 ≤ γ ≤ 1 be the discount rate between period one and period two. Letthe seller incur deterministic cost c1 and c2 in each period for producing thetechnology A, the cost c1 + c2 is assumed to be committed. We assume thatprofit margins are tight therefore (1− ρ)p ≤ ci∈{1,2} and (1− ρ)p+ ρ(b∗)p >
12In the [119] set-up this is setting σ = 1 and hence β = 0.
126

Chapter 6 6.2. The Underground is a Sustainable Market Economy
ci∈{1,2}, where b∗ is a degree of cognition on the equilibrium path. Thisassumption is simply to push our model to a unique solution with bothbuyers.
The Price Commitment assumption
Our fundamental assumption, in terms of cultural constraints, is that oncethe price is announced by the seller she has to commit to this price acrossboth time periods. Our evidence from the market is that prices are extremelysticky, in fact we have found no evidence of a single change in price withouta substantial change in the good on sale. The major reason for this is thatwe can think of the product being simultaneously advertised to both B1 andB2 and the time interval between purchases is effectively the time taken tolicence the technology and deploy the malware. This maybe measured ina few days. Once B1 has deployed the malware ‘in-the-wild’ then the nextbuyer B2 will now be able to view the modality of the technology by simpleobservation of its performance for specific tasks on the internet and by thereaction of security firms in attempting to mitigate its impact. The newbuyer knows their particular requirements and hence they can update theirposition on the effectiveness of the malware or the supply of compromisedmachines more cheaply than B1.
The need for the seller’s cognition effort
We here consider two cases: in the first the seller does not sustain any cogni-tion cost. We will show that in this case the first buyer will always want togo second, and therefore no trade would be initiated. In the second case, theseller engages in costly cognition to alleviate the costs for buyer one, suchthat the revenue buyer one can extract from the trade equals that of thesecond buyer.
Our two cases are therefore defined in the following way:
127

6.2. The Underground is a Sustainable Market Economy Chapter 6
1. Seller engages in no cognitive effort with either buyer.
πS = (1− ρ)p+ ρ(b1)p− c1 + γ((1− ρ)p+ ρ(b2)p− c2) (6.11)
2. Seller engages in cognitive effort with first buyer.
πS = (1−ρ)p+ρ(s, b1)p−c1−TS(s)+γ((1−ρ)p+ρ(b2)p−c2)(6.12)
Proposition 1a: The buyer equality problem When 0 < δ < 1 the the sellercannot set a unique price p in both periods such that the buyer surplusesmaybe equalized, i.e. πB1
= πB2, for the unique optimal choices of cognition
b1 and b2, denoted b†1 and b†2 respectively.
Proposition 1b: The price hold-up problem It follows that even when theseller has complete bargaining power, when 0 < δ < 1, when the seller setswhen πB1
= 0, for an optimal choice of b1, denoted b†1, the surplus of thesecond buyer, πB2
will be greater than zero, for the unique optimal choice ofb2, denoted b†2.
Following [119] we constrain ourselves to the cases where v−∆ > 0. Theseller is a price setter able to extract all of the joint surplus, therefore themaximum available price is that which sets min(πBi
(b∗i ) = 0) for i ∈ {1, 2}.In our set-up the price does not affect the cognition choice, only the trade-offbetween TBi
(bi) and ρ(bi), this is evident as the seller’s statistical model ofthe buyer solves separately π′Bi
= 0. For the case when the seller engagesin no cognition s = 0 for either buyer, this yields an optimal cognition of b†ithat satisfies:
T ′Bi(bi) = − (ρ− 1)ρ
(biρ− 1)2∆, for, i ∈ {1, 2} (6.13)
by definition TB2(b2) = δTB1
(b2), where 0 < δ < 1.Let Ti(bi) = ρ(bi)∆+TBi
(bi), be the cognition trade-off. The sub-problemof each buyer is equivalent to b†i , arg minbi Ti(bi). Consider any b
†i , i ∈ {1, 2}
128
Chapter 6 6.2. The Underground is a Sustainable Market Economy
that solves the cognition for the first buyer, we know that by constructionδTB(b†1) < TB(b†1), hence B2 can always find a b†2 ≥ b†1 that provides anidentical or greater reduction in uncertainty for lower cost, as such T2(b†) <T1(b†),∀0 < b† < 1. Is b†1 = b†2 = 0 cognition a viable optimal point inequalizing the expected loss of utility to ρ∆ for both B1 and B2? No, asagain by construction of the cognition cost function T ′B(0) = 0, therefore by ifv > ∆ > 0 then it is always better to conduct at least a finite amount of non-zero cognition, hence b†i > 0, i ∈ {1, 2} and the seller can still find a positiveprice p > 0 such that min(πBi
) ≥ 0. Therefore, by construction πB16= πB2
and T1(b†) < T2(b†) for b† = b†1 = b†2, the lower bound of B′2s optimalcognition. Furthermore, for any given price p† that the seller optimally setsfor either B1 or B2, the pay-off πB2
will be greater than πB1as the term
T2(b†2) will always be finite and smaller than T1(b†1)
Hence, from a buyer point of view it is always sub-optimal to be the firstbuyer even if the seller sets a price on or above πB1 = 0 as a better payoff canalways be achieved by going second when 0 < δ < 1, similarly if the sellersets a price to extract the surplus of B2, the surplus of B1 will be negative .Whilst Proposition 1a and 1b trivially fall out of the model construction, it isworth noting their implication. When prices are very sticky, it is sub-optimalto enter into a contract for a good with a potentially random pay-off as afirst buyer. The advent of social learning and hence the ability to conductcheaper cognition as a buyer in the second phase results in a natural hold-upthat would not occur if the buyers had equal inter-temporal cognition costs.Whilst trial period sales are usually a mechanism of reducing the impact ofdeviation in consumption (measure by ∆ here) by the buyer at each step wedemonstrate a new mechanism, which is the dissemination of new informationand the ability to cheaply process this after the fact.
129

6.2. The Underground is a Sustainable Market Economy Chapter 6
How much surplus is gained by going second?
We have established that Seller Case 1 results in a hold-up as B1 will alwaysprefer to be B2 as B2 has greater bargaining power than B1 directly becauseof the cognition channel. By setting a specific functional form to TB we canexactly quantify the implicit cognition discount the second buyer receives.This also provides insight on the trade-offs the seller must make to acquirethe best price given her explicit bargaining power.
Consider now the case whereby we choose p such that πB2= 0. The
seller’s statistical model of the buyer indicates that his cognition trade-off isindependent of v and p therefore we can set:
p = v−T2(b†2) ≡ v−ρ(b†2)∆−TB(b†2), where b†2 , arg minb2T2(b2)(6.14)
We know that p is the highest price the seller can charge before B2 dropsout and is therefore the upper boundary on the sellers price range. FromProposition 2b we know that at p, B1 will now be below break-even asT1(b†1) > T2(b
†2).
In contrast the seller can set¯p as the lower boundary price under consid-
eration by the seller. By construction of the model this is set to be the pricewhen πB1
= 0. Because the difference in cognition costs is independent ofthe price, the seller will need to compensate the first buyer by T1(b†1)−T2(b
†2)
whatever the price of A. The optimal cost of doing this TS(s‡) will be atleast the same at
¯p as any other price.
However, once the seller engages in cognition, the price cannot exceed p asthis eliminates buyer 2. Is it possible for the seller to engage in cognition anddrive the price above p? Yes it is possible; if the seller has a relatively flatcognition function, when 0 < s < 1 and the likelihood of A not being suitableis relatively small then the seller can drive the first buyers ρ(s, b1) → 0
inexpensively (from the viewpoint of decreasing the revenue from ρ(s, b1)p
and increasing costs associated with TS(s)). Subsequently the buyers choice
130
Chapter 6 6.2. The Underground is a Sustainable Market Economy
of cognition b1 will also tend to zero, limb1→0 TB(b1) = 0 and hence the breakeven price the seller can charge and still leave B1 at break-even tends to v.We eliminate this case by appealing to our ‘Tight-Margins’ assumption, thatis the seller must sell to both buyers, rather than using cheap cognition toeliminate B2 and extract maximum revenue from B1.
The seller’s optimization problem now appears more complex. In the firstcase the seller had no direct control over the first and second buyers cognition,however this led to no single price equalising the surplus of both buyers andhence a hold–up. Now that the seller chooses to engage in non-zero cognitionto equalise the first buyers costs, she now directly impacts her own surplusby directly influencing the probability that the first buyer will not be in errorin choosing A, by increasing s, she pushes the term ρ(s, b†1)p towards zeroand hence she pushes her own profit towards her cost constraint c1 in period1.
Let us assume that the seller engages in non-zero cognition and transfersthis to the buyer, then B1 will adjust their choice of cognition b1 to a newoptimum b‡1 by solving:
∂TB1(b1)
∂b1= −∂ρ(b1)
∂b1∆ ≡ − (ρ− 1)ρ(s− 1)
(bρ(s− 1)− ρs+ 1)2∆.
Recall that the seller does not influence ρ(b†2)p in this instance. Furthermore,recall that as the seller pushes the term ρ(b†2)∆ lower she can now extractmore surplus from the buyer at cost TS(s) to herself. However, we can seeby simple inspection that the constraint:
T1(b†1)− T2(b†2) = ∆(ρ(b†1)− ρ(s‡, b‡1)) + TB(b‡1)− δTB(b†2) (6.15)
is required to solve for the required amount of cognition, regardless of price.Whilst depending on the functional form of TB(b1), the optimal s‡ mightsimplify, the strict ordering to ensure the seller creates maximum extractablesurplus for the buyer requires s‡ to be solved backwards from b‡. Recall that
131

6.2. The Underground is a Sustainable Market Economy Chapter 6
the seller has buying power, so the best s may not be the joint minimizationof T 1(s, b1) = ρ(s, b1)∆ + TB(b1). To ensure that she chooses the smallestviable s she rearranges the constraint in (6.15) to give b‡1 as a function ofs. The joint solution with (6.15) is the unique level of cognition needed toprovide B1 with the same cognition cost – error trade-off as B2, who benefitsfrom the global improvement in technology cognition through the factor δ.
Quantifying the trade-off
We will now investigate a case where the seller is will engage in cognitionin order to overcome the hold-up. We will then quantify the boundary atwhich cognition is now too expensive for the seller to overcome the hold-upand still at least break-even.
It is useful at this juncture to place a functional form on TB(·) and TS(·)so that we can illustrate the trade-offs and simplify the discussion for ourapproach to the re-contracting phase. An obvious choice for TB(·) isHz2/(1−z2). To ensure analytical tractability, we specify:
Tj(z) =
{Hjz1−z 0 < z ≤ 1Hjz
2
1−z2 z = 0, j ∈ {B, S}, (6.16)
this enforces an interior solution on the problem, but permits a tractablesolution, where Hjj ∈ {B, S} is a scale parameter that we will refer to asthe “scale of costs”. In general we will focus on the b† > 0, therefore thesolutions to T ′B(b1) = −ρ′(b1)∆ are constrained to cases when
HB < −∆(ρ2 − ρ) (6.17)
similarly, when the seller engages cognition with the first buyer and sets0 > s > 1, we restrict ourselves to analyzing the cases where
HB < −∆ρ2 − ρ− ρ2s+ ρs
ρ2s2 − 2ρs+ 1. (6.18)
132

Chapter 6 6.2. The Underground is a Sustainable Market Economy
The constraints are needed to ensure that the TB(z) function forces a solutionwithin the 0 < bi < 1. The more general interpretation of this is thatif cognition is relatively expensive for 0 < bi < 0 then this ceases to bethe major issue for the contracting phase. Furthermore, for (6.18), we cansubstitute for s the functional form for s‡, to compute the upper bound onHB.
The optimal cognition bundle with and without seller cognition effort
It is helpful in the following discussion to specify the following pair of auxil-iary functions that form components of the optimal solutions for bi∈{1,2}.
Hi =√−δi∆HB(ρ− 1)3ρ, (6.19)
where,
{δi = 1, i = 1
δi = δ, i = 2
Dj = ρ(sj − 1)(∆(1− ρ) + δiHBρ(sj − 1)), (6.20)
where,
{sj = 0, j = 0
sj = s, j = s
we can interpret Hi/Dj as the relative probabilistic advantage of choosinga particular level of b relative to the costs (again in probability equivalents)created by the uncertainty in the quality of A. When the seller engages inno cognition, Seller Case 1 and the functional form of TB(z) is as specifiedin (6.16) then the optimal choice of bi for each of the buyers is given by:
b†i =1
D0(∆(ρ− 1)ρ+ δiHBρ+H1), for, i ∈ {1, 2} (6.21)
where ∆ and HB are subjective to the conditions specified in (6.17). ForSeller Case 2 when s is non-zero the optimal choice of b1 is given by:
b‡1 =1
Ds(ρ(s− 1)(∆(1− ρ) +HB(ρs− 1)) +H1) (6.22)
it is relatively trivial to show that b† is always greater than b‡ when 0 < δ < 1
and hence T1(b†) > T1(b‡). The optimal solution for B2 will be the same as
133

6.2. The Underground is a Sustainable Market Economy Chapter 6
B1 in both Seller Case 1 and Seller Case 2, which is the rearrangement ofthe solution for b†1 with δH instead of H. To compute the optimal cognitions that the seller should choose to ensure that B1 and B2 receive the samepay-offs we replace the optimal solutions for b†1 and b
†2 and b
‡1 into (6.15) and
solve for s‡, this is our next proposition.
Proposition 2: The seller’s optimal level of cognition
When TB(z) is defined as in (6.16), the Sellers required cognition s‡ neededto equalise the expected surplus of B1 and B2 is determined by
s‡ = ±2√
∆(ρ− 1)2ρ2(∆(ρ− 1)2 − 1
2H1 −HB(ρ+ δ − 1)(ρ− 1))
HB(ρ− 1)ρ2
+2∆(ρ− 1)
HBρ− H1
2HB(ρ− 1)ρ− δ − 1
ρ(6.23)
Notice that both roots of (6.23) can provide a solution to s† in the 0 < s‡ < 1
domain, the seller would obviously choose the lower s.We have not yet optimized the sellers pay-off explicitly. This is because
the highest available price p† can be already charged to buyer B2 and at thisstage the cognition is solely dependent on the first buyers relative cognitivedisadvantage to the second buyer. Furthermore, the optimal cognition choicefor the second buyer is, by construction, not affected by the price. Hence, forthe seller, if cognition is the only mechanism of discount then for any higherprice the seller violates the ‘tight margins’ constraint as B2 will drop out.Furthermore, the hold-up discount needed by B1 is not connected to the priceat all, cognition apart, he is ex-ante identical to B2, so the only driver for thedegree of s needed by B1 in order to motivate him to transact in period oneis the relative cognition costs. As such s‡ is the required level of cognitionneeded to ensure that buyers do not strictly prefer to go second. However,the level of s‡ may not be consistent with the break-even requirement of theseller. We shall now explore the implication and observe how a social planner
134

Chapter 6 6.2. The Underground is a Sustainable Market Economy
can set a re-contracting penalty that increases the domain of solutions overwhich pairs of two period buyers and sellers can enter into arrangements thatovercome cognition based hold-up problems.
The seller’s cost constraint
Following convention we assume that the seller only enters into a contractwhen πS ≥ 0. It is trivial to show that by inspection there is a critical upperlevel on HS, after which the seller finds the process of cognition too expensiveto equalize the pay-offs of both B1 and B2 hence overcoming the hold-up.This upper bound denoted HS is given by
HS =s‡ − 1
s‡c1 −
(s‡ − 1)
∆(ρ− 1)4s‡(∆ρ(ρ− 1)2 +
+Hs(−(ρ− 1)(δHB − ρv + v)−H1),
where Hs =√
∆HB(ρ− 1)3ρ(s‡ − 1)), therefore for any given configurationof the structural parameters v, ρ, δ, c1,HB and ∆, seller cognition costs aboveHS result in a systematic cognition hold-up that the seller cannot overcomewhilst still at least breaking even. We can interpret seller cognition costsbeyond this boundary as a market failure as systematically buyers will preferto delay going first and sellers cannot provide enough cognition to discountB1.
The role of the board moderator
A simple case exists where the cost of cognition for the seller is high enoughthat they cannot provide enough of a cognition discount to B1 to preventdelay without violating the sellers expectation of at least breaking even. Fora criminal market any promise or requirement by a social planner is, of course,incomplete. By their very nature a buyer within a criminal market cannotenforce a re-contracting phase so that the seller provides and adjustment
135

6.2. The Underground is a Sustainable Market Economy Chapter 6
to compensate for the variance from v to v − ∆. Let us assume that re-contracting costs for the seller to provide an adjustment are given by λ(a),where a is a proportion of ∆ recouped by the Buyer if A is not suitable.Alternatively, we can think of a as a promised transfer of surplus from theseller to the buyer ex-post.
Let us consider a cognition cost coefficient H∗S > HS. Here the cost ofcognition for the seller needed to discount the initial buyers is too high. If B1
believes that the seller will provide appropriate adjustment or compensationthen the seller can reduce their costly cognition by promising an ex-postcorrection upon discovery of whether A is suitable for the buyer. Given thatboth the buyer and seller assumes that ex-post all contracts are incompletethere is a commitment issue. If the seller provides a guarantee of offsettingan a- priori agreed fraction after the buyer has taken possession of A then thebuyer will not trust that this off-set will be delivered as there is no mechanismto enforce the contract. Similarly, if the seller provides collateral (for instancea trial discount) then they have no guarantee that the buyer will pay for thefull value of the good, if A turns out to be suitable.
However, if the seller and buyer can provide guarantees the seller will beable to find a solution to the H∗S > HS. Furthermore, the seller will, in alllikelihood, be able to rebalance the expected surplus of the buyer and sellerat a cheaper rate, even if H∗S is not greater than HS. However, at this stage itis instructive to address the stage at which the seller must be able to providethis guarantee in order to ensure an initial sale to B1. The sellers objectiveis to finance (via cognition or compensation)
T1(b†1)− T2(b†2) =
1
(ρ− 1)2(2(H1 −H2) +HB(δ + ρ− δρ− 1)) (6.24)
as cheaply as possible. This is achievable by compensating a∆ with proba-bility ρ(s, b1) ex-post or by cognition ∆(ρ(b†1)− ρ(s, b1)) + TB(b†1)− TB(b∗1).
136

Chapter 6 6.2. The Underground is a Sustainable Market Economy
Therefore the seller needs to discount the buyer by
ρ(b†)∆ + TB(b†)− ρ(b∗1, s∗)(∆− a∗∆)− TB(b∗1) = T1(b†1)− T2(b
†2)(6.25)
In this case we have one constraint and two decision variables a and s chosenby the seller and the anticipated b1 from the sellers statistical model of thefirst buyer.
Proposition 3: Existence of the buyer’s optimal compensation and cognitionbundle
When the cognition function TB(z) is as defined in (6.16) if the seller canprovide a full commitment to B1, then from the sellers statistical model ofthe buyer the optimal choice of cognition for the seller is given by:
b∗1(a∗, s) =
1
Daρ(s− 1)((a∗ − 1)∆(ρ− 1) + (6.26)
+HB(ρs− 1)) +1√δDa
√(a∗ − 1)(s− 1)H1
where Da = ρ(s− 1)((a− 1)∆(ρ− 1) +HBρ) the seller’s optimal choice ofcompensation, denoted a∗, for a given level of s by:
a∗(s) =1
4∆(ρ− 1)2ρ(s− 1)× (6.27)
4(δ + ρs− 1)H1 +HB(ρ− 1)(δ + ρs− 1)2 +
−4∆ρ(ρ− 1)2(δ + s− 1)
Further substitution into the expression for the buyer profit function, denotedπS(a∗(s), b∗(a∗, s)), permits a one dimensional optimization with respect tothe optimal cognition s∗. The expression for s∗ can be derived analytically.We provide its formulation in the internet Appendix.
Conclusion 4 By showing that a cognition bundle exists that solves themodel, we showed that the market is sustainable. We therefore accept Hy-pothesis 2.
137

6.2. The Underground is a Sustainable Market Economy Chapter 6
138

Chapter 7
Risk-based Policies for VulnerabilityManagement
The analyses proposed in the previous Chapter all strongly support the ideathat vulnerability exploitation and attacker preference can represent a signif-icant factor to think of more efficient risk-based vulnerability managementpractices as opposed to current criticality-based practices. We therefore pro-ceed in testing our last running hypothesis:
Running Hypothesis Hypotheses TestingHyp. 3. It is possible to constructrisk-based policies that, levereging theeconomic nature of the attacker, cangreatly improve over criticality-basedpolicies.
Corollary to Hyp. 3 Risk-based policies account-ing for cybercrime markets are the most effective inreducing risk for the final user.Develop a case control study to evaluate the over-all risk-reduction of risk based and criticality basedvulnerability management policies. A validating ex-ample outlines the benefits of risk-based policies overcriticality based ones in terms of patching workloadsand effectiveness in foiling real attacks in the wild.
In the following we present our case control methodology to assess theeffectiveness of a vulnerability management policy, and show that risk-basedpolicies outperform by far current criticality-based ones in terms of patchingefficiency. In particular, we:
1. Introduce the ‘case-control study’ as a fully-replicable methodology to
139

7.1. Risk-based vs Criticality-based Policies Chapter 7
soundly analyze vulnerability and exploit data.
2. Check the suitability of the current use of the CVSS score as a riskmetric by comparing it against exploits recorded in the wild and byperforming a break-down analysis of its characteristics and values.
3. We use the case-control study methodology to show and measure howthe current criticality-based CVSS practice can be improved by consid-ering additional risk factors defining a risk-based policy. To do this, weprovide a quantitative measure of the reduction in risk of exploitationyield by the resulting policies.
7.1 Risk-based vs Criticality-based Policies
Following the analysis provided in Chapter 6 we conclude that cost of exploitand existence of the exploit in the underground markets are significant factorsfor likelihood of exploitation. In order to measure these factors, we accountfor:
1. The existence of a proof-of- concept exploit that lowers the attacker’scost to deploy a working exploit (Section 6.1).
2. The existence of technology traded in the black markets that bundlesthe exploit (Section 6.2.1-6.2).
This, in combination with a criticality measure, results in the definitionof a risk-based policy that accounts for both the likelihood of exploitationand the criticality of the vulnerability. Table 7.1 reports the criticality-basedand risk-based policies we consider here. Whereas a criticality-based policyrelies solely on the CVSS score, a risk- based policy leverages the presenceof a risk factor as an indicator of likelihood of exploitation. This gives a riskestimation of the vulnerability that corresponds more closely to the classic
140
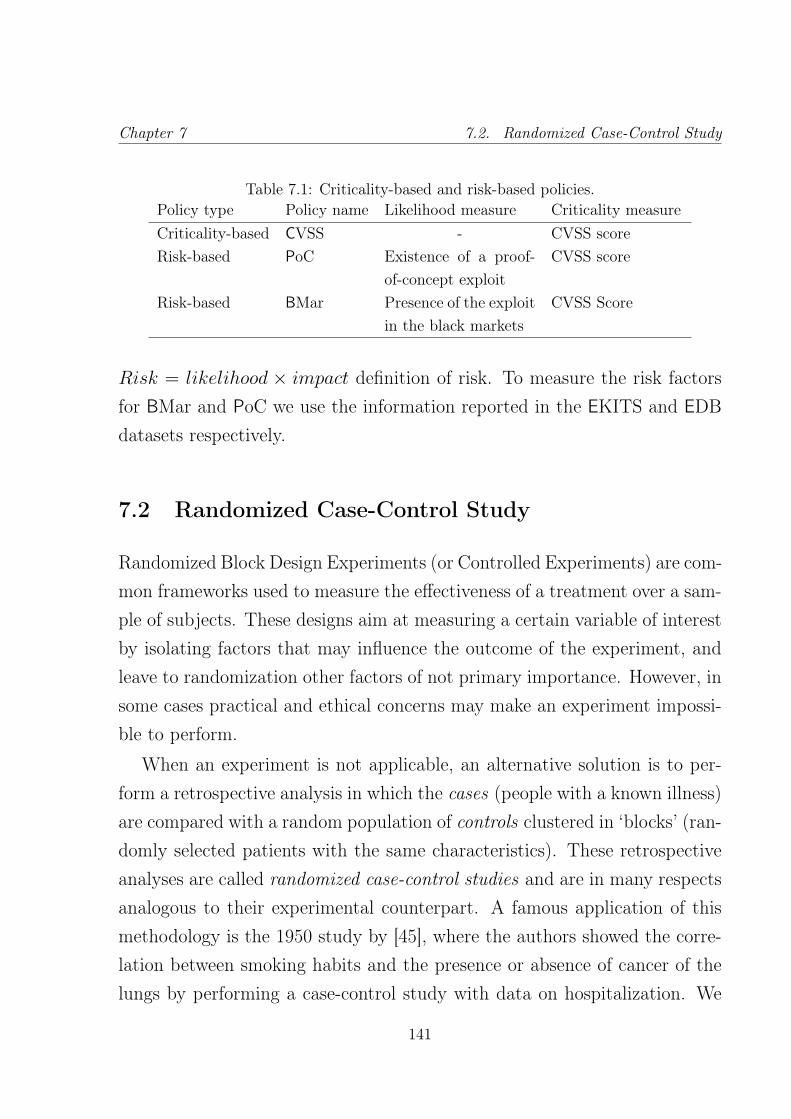
Chapter 7 7.2. Randomized Case-Control Study
Table 7.1: Criticality-based and risk-based policies.Policy type Policy name Likelihood measure Criticality measureCriticality-based CVSS - CVSS scoreRisk-based PoC Existence of a proof-
of-concept exploitCVSS score
Risk-based BMar Presence of the exploitin the black markets
CVSS Score
Risk = likelihood × impact definition of risk. To measure the risk factorsfor BMar and PoC we use the information reported in the EKITS and EDBdatasets respectively.
7.2 Randomized Case-Control Study
Randomized Block Design Experiments (or Controlled Experiments) are com-mon frameworks used to measure the effectiveness of a treatment over a sam-ple of subjects. These designs aim at measuring a certain variable of interestby isolating factors that may influence the outcome of the experiment, andleave to randomization other factors of not primary importance. However, insome cases practical and ethical concerns may make an experiment impossi-ble to perform.
When an experiment is not applicable, an alternative solution is to per-form a retrospective analysis in which the cases (people with a known illness)are compared with a random population of controls clustered in ‘blocks’ (ran-domly selected patients with the same characteristics). These retrospectiveanalyses are called randomized case-control studies and are in many respectsanalogous to their experimental counterpart. A famous application of thismethodology is the 1950 study by [45], where the authors showed the corre-lation between smoking habits and the presence or absence of cancer of thelungs by performing a case-control study with data on hospitalization. We
141
7.2. Randomized Case-Control Study Chapter 7
revisit this methodology to assess whether a vulnerability risk factor (likethe CVSS score) can be a good predictor for vulnerability exploitation, andwhether it can be improved by additional information.
We start by giving the reader some terminology:
• Cases. The cases of a control study are the subjects that present theobserved effect. For example, in the medical domain the cases couldbe the patients whose status has been ascertained to be ‘sick’. In acomputer security scenario, a ‘case’ could be a vulnerability that hasbeen exploited in the wild. For us a case is therefore a vulnerability inSYM.
• Explanatory variable or risk factor. A risk factor is an effect that canexplain the presence (or increase in likelihood) of the illness (or attack).Considered risk factors for cancer may be smoking habits or pollution.As reported in Table 7.1, for vulnerability exploitation we consider theexistence of a Proof-of-Concept exploit (vuln ∈ EDB) and the presenceof an exploit in the black markets (vuln ∈ EKITS).
• Confounding variables are other variables that, combined with a riskfactor, may be an alternative explanations for the effect, or correlatewith its observation. For example, patient age or sex may be confound-ing factors for some types of cancer. In our case the existence of anexploit in SYM may depend on factors such as type of vulnerabilityimpact, time of disclosure, and affected software.
• Control group. A control group is a group of subjects chosen at randomfrom a population with similar characteristics (e.g. age, social status,location) to the cases. In the original design of a case-control study, thecontrol group was composed of healthy people only. However, with thatapplication of the case-control study we can only ascertain whether the
142
Chapter 7 7.2. Randomized Case-Control Study
risk factor of interest has a greater incidence for the cases than for thecontrols. We relax this condition and leave open the (random) chancethat cases get included in the control group. This relaxation allowsus to perform additional computations on our samples (namely CVSSsensitivity, specificity and risk reduction). This, however, introduces(random) noise in the generated data. To address this issue, we performthe analysis with bootstrapping.
• Bootstrapping. A classic statistical significance test allows the researcherto relax certain conditions on the linear relationship between dependentvariables (our cases) and independent variables (our hypotheses, or riskfactors). However, the precision of these tests often depends on the un-derlying data distribution, that need be known. In our case the realdata generation process (DGP) underlying our observations is howeverunknown: we do not have a precise model of the engineering of anexploit, its delivery in the wild, and of the probability distribution ofdetection by Symantec. Bootstrapping is a statistical technique thatallows us to overcome this problem by re-sampling cases, with replace-ment, from our distribution of exploits in the wild. The FundamentalTheorem of Statistics guarantees, in fact, that with enough random andindependent extractions from a distribution, the ‘empirical distributionfunction’ (EDF) that is obtained converges to the real one [43], as doesthe statistic of interest (e.g. the mean, or a p-value). Therefore, bybootstrapping our sample, we can compute our statistics over an EDFthat converges asymptotically with the real distribution of exploits inthe wild (that we can not observe). This improves the statistical effi-ciency of our estimation, and therefore the precision of our conclusions.
Confounding variables Deciding which confounding factors to include in acase-control study is usually left to the intuition and experience of the re-
143

7.2. Randomized Case-Control Study Chapter 7
searcher [45]. Because SYM is the ‘critical point’ of our study (as it reportsour cases), we consulted with Symantec to decide which factors to consideras confounding. While this list can not be considered an exhaustive one,we believe that the identified variables capture the most important aspectsof the inclusion of a vulnerability in SYM. In the following we discuss theconfounding variables we choose and the enforcement of the respective con-trolling procedure:
• Year. Symantec’s commitment in reporting exploited CVEs may changewith time. After a detailed conversation with Symantec it emerged thatthe inclusion of a CVE in an attack signature is an effort on Symantec’sside aimed at enhancing the usefulness of their datasets. Specifically,Symantec recently opened a data sharing program called WINE whoseaim is to share attack data with security researchers [47]. The dataincluded in the WINE dataset spans from 2009 to the present date.Given the explicit sharing nature of their WINE program, we considervulnerabilities disclosed after 2009 to be better represented in SYM. Wetherefore consider only those in our study.
Enforcement: Unfortunately vulnerability time data in NVD is verynoisy due to how the vulnerability disclosure mechanism works [105, 81].For this reason, an exact match for the disclosure date of the sampledvulnerability svi and the SYM vulnerability vi is undesirable. In our casea coarse time data granularity is enough, as we only need to cover theyears in which Symantec actively reported attacked CVEs. We thereforeenforce this control by first selecting for sampling only vulnerabilitieswhose disclosure dates span from 2009 on, and then by performing anexact match in the year of disclosure between svi and vi.
• Impact type. Our analysis (Section 5.1.1) showed that some CIAtypes are more common in SYM than elsewhere (e.g. CIA=‘CCC’).
144

Chapter 7 7.2. Randomized Case-Control Study
An explanation for this may be that attackers contrasted by Symantecmay prefer to attack vulnerabilities that allow them to execute arbitrarycode rather than ones that enables them to get only a partial access onthe file system. We therefore also control for the CVSS Confidentiality,Integrity and Availability assessments.
Enforcement: The CVSS framework provides a precise assessments ofthe CIA impact. We therefore perform an exact match between the CIAvalues of the sampled vulnerability svi and that of vi (in SYM).
In addition, we ‘sanitize’ the data by Software. Symantec is a securitymarket leader and provides a variety of security solutions but its largestmarket share is in the consumer market. In particular, the data in SYMis referenced to the malware and attack signatures included in commercialproducts that are often installed on consumer machines. These are typicallyMicrosoft Windows machines running commodity software like Microsoft Of-fice and internet plugins like Adobe Flash or Oracle Java1 [46]. Because ofthis selection problem, SYM may represent only a subset of all the softwarereported in NVD, EDB or EKITS.
Enforcement: Unfortunately no standardized way to report vulnerabilitysoftware names in NVD exists, and this makes it impossible to directly controlthis confounding variable. For example, CVE-2009-0559 (in SYM) is reportedin NVD as a “Stack-based buffer overflow in Excel”, but the main affectedsoftware reported is (Microsoft) Office. In contrast, CVE-2010-1248 (in SYMas well) is a “Buffer overflow in Microsoft Office Excel” and is reported as anExcel vulnerability. Thus, performing a perfect string match for the softwarevariable would exclude from the selection relevant vulnerabilities affectingthe same software but reporting different software names.
1Unix software is also included in SYM. However we do not consider this sample to be representativeof Unix exploited vulnerabilities.
145

7.2. Randomized Case-Control Study Chapter 7
The problem with software names extends beyond this. Consider for ex-ample a vulnerability in Webkit, an HTML engine used in many browsers(e.g. Safari, Chrome, and Opera). Because Webkit is a component of othersoftware, a vulnerability in Apple Safari might also be a Webkit vulnerabilityin Google Chrome.
For these reasons, to match the ‘software’ string when selecting svi wouldintroduce unknown error in the data. We can therefore only perform a ‘besteffort’ approach by checking that the software affected by svi is included inthe list of software for ∀vi ∈ SYM . In this work software is therefore usedas a ‘sanitation’ variable rather than a proper control.
7.2.1 Experiment run
We divide our experiment in two parts: sampling and execution. In theformer we generate the samples from NVD, EDB and EKITS. In the latterwe compute the relevant statistics on the samples. What follows is a textualdescription of these processes.
Sampling To create the samples, we first select a vulnerability vi from SYMand set the controls according to the values of the confounding variablesfor vi. Then, for each of NVD, EDB and EKITS we randomly select, withreplacement, a sample vulnerability svi that satisfies the conditions definedby vi. We then include svi in the list of selected vulnerabilities for thatdataset sample. We repeat this procedure for all vulnerabilities in SYM. Thesampling has been performed with the statistical tool R-CRAN [96]. Our Rscript to replicate the analysis is available on our Lab’s webpage2.
Execution Once we collected our samples, we compute the frequency withwhich each risk factor identifies a vulnerability in SYM. Our output is repre-
2https://securitylab.disi.unitn.it/doku.php?id=software
146

Chapter 7 7.2. Randomized Case-Control Study
Table 7.2: Output format of our experiment.Risk Factor level v ∈ SYM v 6∈ SYMAbove Threshold a bBelow Threshold c d
Table 7.3: Sample thresholdsCVSS ≥ 6CVSS ≥ 9CVSS ≥ 9 & v ∈EDBCVSS ≥ 9 & v ∈EKITS
sented in Table 7.2. Each risk factor is defined by a CVSS threshold level t incombination with the existence of a proof-of-concept exploit (v ∈ EDB) or ofa black-marketed exploit (v ∈ EKITS). Examples of thresholds for differentrisk factors are reported in Table 7.3. We run our experiment for all CVSSthresholds ti with i ∈ [1..10]. For each risk factor we evaluate the number ofvulnerabilities in the sample that fall above and below the CVSS threshold,and that are included (or not included) in SYM: the obtained table reportsthe count of vulnerabilities that each risk factor correctly and incorrectlyidentifies as ‘at high risk of exploit’ (∈ SYM) or ‘at low risk of exploit’ ( 6∈SYM).
The computed values depend on the random sampling process. In anextreme case we may therefore end up, just by chance, with a sample con-taining only vulnerabilities in SYM and below the current threshold (i.e.[a = 0; b = 0; c = 1277; d = 0]). Such an effect would be likely due to chancealone. To mitigate this we repeat, for every risk factor, the whole experi-ment run 400 times and keep the median of the results. We choose this limitbecause we observed that around 300 repetitions the distribution of resultsis already markedly Gaussian. Any statistic reported here to be intended asthe median of the generated distribution of values.
147
7.2. Randomized Case-Control Study Chapter 7
7.2.2 Parameters of the analysis
Sensitivity and specificity In the medical domain, the sensitivity of a test isthe conditional probability of the test giving positive results when the illnessis present. The specificity of the test is the conditional probability of the testgiving negative result when there is no illness. Sensitivity and specificity arealso known as True Positive Rate (TPR) and True Negatives Rate (TNR)respectively. High values for both TNR and TPR identify a good test3. In ourcontext, we want to assess to what degree a positive result from our currenttest (the CVSS score) matches the illness (the vulnerability being actuallyexploited in the wild and tracked in SYM). The sensitivity and specificitymeasures are computed as:
Sensitivity = P (v’s Risk factor above t| v ∈ SYM) = a/(a+ c) (7.1)
Specificity = P (v’s Risk factor below t| v 6∈ SYM) = d/(b+ d) (7.2)
where t is the threshold. Sensitivity and specificity outline the performanceof the test in identifying exploits, but say little about its effectiveness interms of diminished risk.
Risk Reduction To understand the effectiveness of a policy we adopt anapproach similar to that used in [49] to estimate the effectiveness of seatbelts in preventing fatalities. In Evan’s case, the ‘effectiveness’ was givenby the difference in the probability of having a fatal car crash when wear-ing a seatbelt and when not wearing it (Pr(Death & Seat belt on) −Pr(Death & not Seat belt on)).
In our case, we measure the ability of a risk factor to predict the actual3Some may prefer the False Positive Rate (FPR) to the TNR. Note that TNR=1-FPR (as in our case
d/(b + d) = 1 − b/(b + d)). We choose to report the TNR here because 1) it has the same direction ofthe TPR (higher is better); 2) it facilitates the identification of the threshold with the best trade-off byintersecting TPR.
148
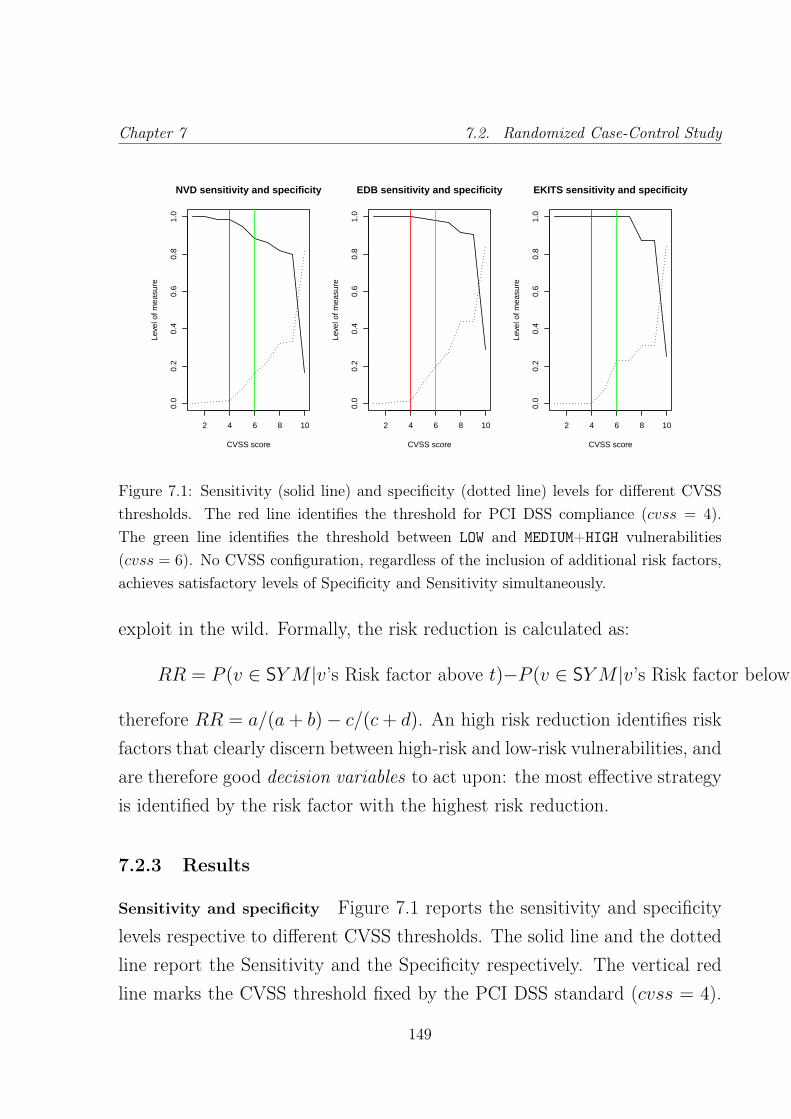
Chapter 7 7.2. Randomized Case-Control Study
2 4 6 8 10
0.0
0.2
0.4
0.6
0.8
1.0
NVD sensitivity and specificity
CVSS score
Leve
l of m
easu
re
2 4 6 8 10
0.0
0.2
0.4
0.6
0.8
1.0
EDB sensitivity and specificity
CVSS score
Leve
l of m
easu
re
2 4 6 8 10
0.0
0.2
0.4
0.6
0.8
1.0
EKITS sensitivity and specificity
CVSS score
Leve
l of m
easu
re
Figure 7.1: Sensitivity (solid line) and specificity (dotted line) levels for different CVSSthresholds. The red line identifies the threshold for PCI DSS compliance (cvss = 4).The green line identifies the threshold between LOW and MEDIUM+HIGH vulnerabilities(cvss = 6). No CVSS configuration, regardless of the inclusion of additional risk factors,achieves satisfactory levels of Specificity and Sensitivity simultaneously.
exploit in the wild. Formally, the risk reduction is calculated as:
RR = P (v ∈ SYM |v’s Risk factor above t)−P (v ∈ SYM |v’s Risk factor below t)(7.3)
therefore RR = a/(a+ b)− c/(c+ d). An high risk reduction identifies riskfactors that clearly discern between high-risk and low-risk vulnerabilities, andare therefore good decision variables to act upon: the most effective strategyis identified by the risk factor with the highest risk reduction.
7.2.3 Results
Sensitivity and specificity Figure 7.1 reports the sensitivity and specificitylevels respective to different CVSS thresholds. The solid line and the dottedline report the Sensitivity and the Specificity respectively. The vertical redline marks the CVSS threshold fixed by the PCI DSS standard (cvss = 4).
149

7.2. Randomized Case-Control Study Chapter 7
Table 7.4: Risk Reduction and significance levels for our risk factors PoC and BMar.Significance is indicated as follows: A **** indicates the Bonferroni-corrected equivalentof p < 1E−4; *** p < 0.001; ** p < 0.01; * p < 0.05; nothing is reported for other values.
Factor RR 95% RR conf. int. SignificancePoC 36% 35% ; 38% ****BMar 46% 44% ; 48% ****
The green vertical line marks the threshold that separates LOW CVSS vul-nerabilities from MEDIUM+HIGH CVSS vulnerabilities (cvss = 6). Unsurpris-ingly, low CVSS scores show a very low specificity, as most non-exploitedvulnerabilities are above the threshold. With increasing CVSS thresholds,the specificity measure gets better without sensibly affecting sensitivity. Thebest trade-off obtainable with the sole CVSS score is achieved with a thresh-old of eight, where specificity grows over 30% and sensitivity sets at around80%. To further increase the threshold causes the sensitivity measure tocollapse. In EKITS, because most vulnerabilities in the black markets areexploited and their CVSS scores are high, the specificity measure can notsignificantly grow without collapsing sensitivity.
Risk reduction First, we analyse the significance of our risk factors alone,i.e. the significance of PoC and BMar over the patching decision. Table7.4 reports the RR results for our risk factors alone, without consideringthe criticality level indicated by the CVSS score. This gives us a measureof the significance of the risk factors in the vulnerability assessment. Theentailed RR is high in both cases, with BMar performing better than PoC.We therefore can conclude that the Black Markets represent a significantrisk factor for vulnerability exploitation. Similarly, PoC-based policies canachieve satisfactory Risk Reduction levels at a high significance. Yet, BMarand PoC are only measures for ‘likelihood’ of exploitation and, considered bythemselves, are not yet qualified to be employed as risk metrics. To achieve
150

Chapter 7 7.2. Randomized Case-Control Study
2 4 6 8 10
0.0
0.2
0.4
0.6
0.8
1.0
Median Differential Risk
CVSS score
Med
ian
Diff
eren
tial R
isk
● ●
●●
● ●●
●
●
CVSS onlyCVSS + PoCCVSS + Markets
Figure 7.2: Risk reduction (RR) entailed by different risk factors. The Black Marketsrepresent the most important risk factor with an entailed RR of up to 80%. The existenceof a proof-of-concept exploit is significant as well and is stable at a 40% level. The CVSSscore alone is never significant and its median RR lays in the whereabouts of 4%.
this, we couple our risk factors with the CVSS assessment on the vulnerabilitycriticality. We expect the RR levels to increase significantly.
In Figure 7.2 we report our results on risk reduction (RR) for each riskfactor coupled with all CVSS levels. The mere CVSS score (green squares),irrespectively of its threshold level, always defines a poor patching policy withvery low risk reduction. The existence of a public proof-of-concept exploitconfirms its significance as a risk factor, yielding higher risk reduction levels(40%). As expected, this is also an improvement over the sole use of PoCwithout considering vulnerability criticality. The presence of an exploit inthe black markets is the most effective risk factor to consider; in the caseof BMar, the maximum risk reduction (80%) is achieved at CVSS levelswithin the interval [5, 7]. Outside of these boundaries the risk factor becomesinsignificant; we can conclude that attackers do not trade vulnerabilities inthe black markets below a CVSS score of 5, and trade vulnerabilities above
151
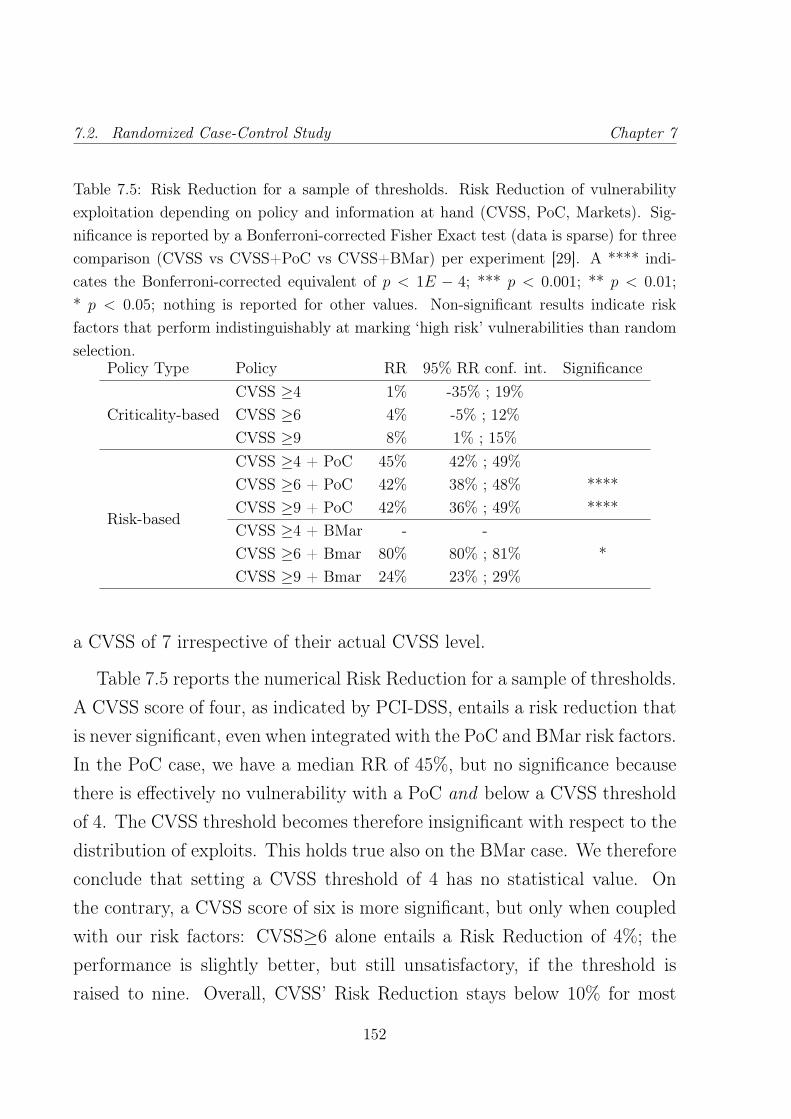
7.2. Randomized Case-Control Study Chapter 7
Table 7.5: Risk Reduction for a sample of thresholds. Risk Reduction of vulnerabilityexploitation depending on policy and information at hand (CVSS, PoC, Markets). Sig-nificance is reported by a Bonferroni-corrected Fisher Exact test (data is sparse) for threecomparison (CVSS vs CVSS+PoC vs CVSS+BMar) per experiment [29]. A **** indi-cates the Bonferroni-corrected equivalent of p < 1E − 4; *** p < 0.001; ** p < 0.01;* p < 0.05; nothing is reported for other values. Non-significant results indicate riskfactors that perform indistinguishably at marking ‘high risk’ vulnerabilities than randomselection.
Policy Type Policy RR 95% RR conf. int. Significance
Criticality-basedCVSS ≥4 1% -35% ; 19%CVSS ≥6 4% -5% ; 12%CVSS ≥9 8% 1% ; 15%
Risk-based
CVSS ≥4 + PoC 45% 42% ; 49%CVSS ≥6 + PoC 42% 38% ; 48% ****CVSS ≥9 + PoC 42% 36% ; 49% ****CVSS ≥4 + BMar - -CVSS ≥6 + Bmar 80% 80% ; 81% *CVSS ≥9 + Bmar 24% 23% ; 29%
a CVSS of 7 irrespective of their actual CVSS level.
Table 7.5 reports the numerical Risk Reduction for a sample of thresholds.A CVSS score of four, as indicated by PCI-DSS, entails a risk reduction thatis never significant, even when integrated with the PoC and BMar risk factors.In the PoC case, we have a median RR of 45%, but no significance becausethere is effectively no vulnerability with a PoC and below a CVSS thresholdof 4. The CVSS threshold becomes therefore insignificant with respect to thedistribution of exploits. This holds true also on the BMar case. We thereforeconclude that setting a CVSS threshold of 4 has no statistical value. Onthe contrary, a CVSS score of six is more significant, but only when coupledwith our risk factors: CVSS≥6 alone entails a Risk Reduction of 4%; theperformance is slightly better, but still unsatisfactory, if the threshold israised to nine. Overall, CVSS’ Risk Reduction stays below 10% for most
152

Chapter 7 7.3. Effectiveness of Risk-Based Policies
thresholds. Even by considering the 95% confidence interval, we can concludethat CVSS-only based policies may be unsatisfactory from a risk-reductionpoint of view. Unsurprisingly, the test with the CVSS score alone results invery high p-values, that in this case testify that CVSS as a risk factor doesnot mark high risk vulnerabilities any better than random selection woulddo. We therefore conclude that criticality-based vulnerability mitigation isineffective in identifying vulnerabilities to patch with high priority.
The existence of a proof-of-concept exploit (PoC) improves greatly theperformance of the policy: with ‘CVSS ≥ 6 + PoC’ a RR of 42% can beachieved with very high statistical significance. This result is comparable towearing a seat belt while driving, which entails a 43% reduction in risk [49].The highest risk reduction (80%) is obtained by considering the existence ofan exploit in the black markets. The significance for BMar with a CVSS ≥9 is below the threshold (p = 0.19).
7.3 Effectiveness of Risk-Based Policies
We now evaluate the effectiveness of risk-based policies by measuring thereduction in workload and the number of foiled attacks they entail. Wewill focus on the advantages in this terms entailed by risk-based policies asopposed to criticality-based policies.
Policy workload. Each policy may require different levels of effort tobe implemented. For example, the same vulnerability could be present inhundreds of machine or could reside in a server for which a 1 hour downtimeis already too much. This information is company dependent and therefore wecan not consider it here. We discuss in Chapter 8 how the whole frameworkcan be lifted to include this (and adjust the risk notion accordingly). Weconsider here a simpler proxy for cost, that is the number of vulnerabilitiesthat should be considered by each policy (workload). The cost-effectiveness
153

7.3. Effectiveness of Risk-Based Policies Chapter 7
Table 7.6: No. of vulnerabilities to fix by policy.Policy WorkloadAll 14380CV SS ≥ 4 13715CV SS ≥ 6 8341CV SS ≥ 9 3081PoC 3030PoC + CV SS ≥ 4 3004PoC + CV SS ≥ 6 2416PoC + CV SS ≥ 9 550BMar 58BMar + CV SS ≥ 4 58BMar + CV SS ≥ 6 54BMar + CV SS ≥ 9 48
of a policy is then reflected in the relation between workload and the volumeof attacks in the wild the policy thwarts.
Workloads for our policies over a sample of vulnerabilities are reported inTable 7.6. The full set comprises 14380 vulnerabilites, 3030 of which havea PoC and 58 are in BMar. The workloads decrease with increasing CVSSthreshold as more vulnerabilities to ‘ignore’ fall below the CVSS level.
7.3.1 Potential of Attack (pA)
In order to better visualize and independently validate the effectiveness ofthe selection of policies based on risk reduction we introduce a new notionto capture the number of attacks that would be thwarted by deploying it.
In chemistry, the pH of a solution is a function of the concentration inhydrogen ions [H+]. To be precise, it is an empirical measure of the capacityof the hydrogen ions to be involved in chemical reactions (and thereforedetermine the degree of acidity of a solution). Because the concentration ofthese ions is typically low, pH is calculated as the logarithm of the inverse
154
Chapter 7 7.3. Effectiveness of Risk-Based Policies
of [H+]. More formally, pH = log101
[H+] .We define pA as an empirical measure of the potential for attack of a
vulnerability. Specifically, we define pA as the base ten logarithm of thevolume of attacks in the wild received by 106 machines (i.e. those sampledin the WINE dataset). We define
pA = log10(Av) (7.4)
where Av is the number of attacks observed in the wild for the vulnerabilityv. The reason we choose a base 10 logarithm is that this allows us to makea direct comparison of the volume of recorded attacks with the number ofmachines in the wild potentially affected by it. Further, this gives a moreimmediate intuition of the diverse order of magnitude of attacks (e.g. anattack with pA = 6 is ten times more common than one with pA = 5).4
For example, a pA of 6 indicates that the attack has the potential to bedistributed to every machine included in the dataset. In WINE pA ranges in[0..7.5]. Its distribution has two modes at pA = 1 and pA = 6. The medianpA is 1.6.
7.3.2 Quantification of patching workloads and pA reduction
Table 7.7 reports the fraction of patching workload entailed by the policyand the reduction in pA. At first glance we see that most of the reported pAcolumns have the same value across the rows. It should be noticed that theactual values are not equal. pA is a logarithm in base 10 and it is truncated tothe first decimal. It offers a bird’s eye view on the attacks, eliminating mostof the noise. It shows that there is very little difference in the magnitudeof foiled attacks between ‘high-workload’ policies and ‘low-workload’ ones.
4Bases other than base ten could have been chosen for pA. For example, e is a base commonlyused in econometrics to define likelihood measures [43]. However, this does not allow, without furthertransformations, for a direct comparison between different volume of attacks and attacked machines, anddoes not give a direct intuition of the relative distances between attacks with different pA.
155
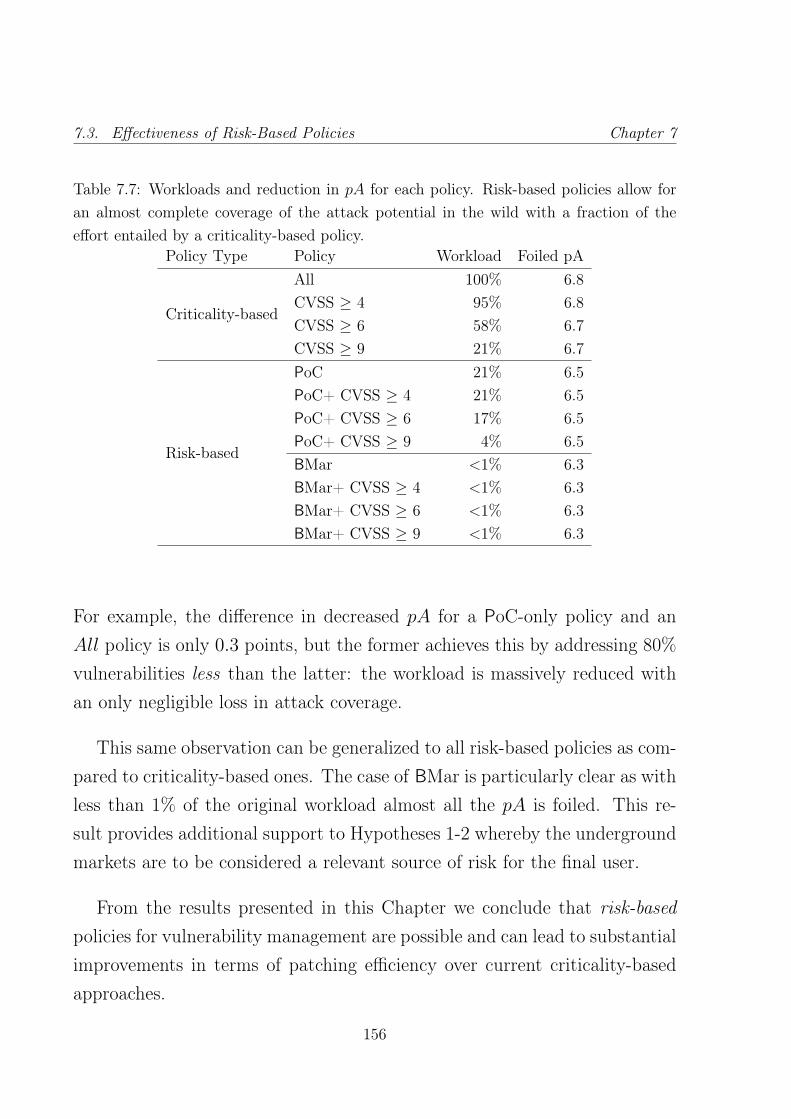
7.3. Effectiveness of Risk-Based Policies Chapter 7
Table 7.7: Workloads and reduction in pA for each policy. Risk-based policies allow foran almost complete coverage of the attack potential in the wild with a fraction of theeffort entailed by a criticality-based policy.
Policy Type Policy Workload Foiled pA
Criticality-based
All 100% 6.8CVSS ≥ 4 95% 6.8CVSS ≥ 6 58% 6.7CVSS ≥ 9 21% 6.7
Risk-based
PoC 21% 6.5PoC+ CVSS ≥ 4 21% 6.5PoC+ CVSS ≥ 6 17% 6.5PoC+ CVSS ≥ 9 4% 6.5BMar <1% 6.3BMar+ CVSS ≥ 4 <1% 6.3BMar+ CVSS ≥ 6 <1% 6.3BMar+ CVSS ≥ 9 <1% 6.3
For example, the difference in decreased pA for a PoC-only policy and anAll policy is only 0.3 points, but the former achieves this by addressing 80%vulnerabilities less than the latter: the workload is massively reduced withan only negligible loss in attack coverage.
This same observation can be generalized to all risk-based policies as com-pared to criticality-based ones. The case of BMar is particularly clear as withless than 1% of the original workload almost all the pA is foiled. This re-sult provides additional support to Hypotheses 1-2 whereby the undergroundmarkets are to be considered a relevant source of risk for the final user.
From the results presented in this Chapter we conclude that risk-basedpolicies for vulnerability management are possible and can lead to substantialimprovements in terms of patching efficiency over current criticality-basedapproaches.
156

Chapter 7 7.4. Discussion
7.4 Discussion
In this Thesis we explored the idea of implementing risk-based policies forvulnerability management. The resulting contribution adds to current scien-tific literature in several ways.
1. We showed that current criticality-based vulnerability management poli-cies are widely suboptimal in prioritising the vulnerability mitigationprocess. Their shortcoming is that they lack of a proper characterisationof exploitation likelihood, a fundamental part of any risk assessment.
2. We hypothesised that a significant factor for likelihood of exploitationare exploit cost and availability in the underground markets for cyber-crime. These two line of research led to the following conclusions:
(a) The attacker is rational and has incentives to re-use the same exploituntil the overall number of vulnerable users drops significantly. Asa consequence, the same exploit is used in subsequent attacks formore than two years before being substituted at large with a newone. Similarly, new attacks arrive quicker as the pace of softwareupdates increases.
(b) Contrary to present claims in the scientific literature, the under-ground markets are mature and economically sound. Current un-derground markets show strong internal regulation that incentivizesfair trading, and indeed the traded technology works well and reli-ably against software configurations spanning as many as 8 years.We developed a two-stage model of the underground markets andshowed that the economic principles over which they are foundedare sound.
3. Building on these conclusions, we develop a methodology based on thenotion of case-control studies to measure the reduction in risk entailed by
157

7.4. Discussion Chapter 7
current criticality-based policies and two risk-based policies. On the onehand, we show that criticality-based policies are statistically equivalentto ‘randomly picking’ vulnerabilities to patch. On the other, we showthat the exploitation factors discussed above are indeed significant forvulnerability management and can lead to risk reductions as high as80% (as opposed to current practices’ 4%).
4. We showed how risk-based policies enable vulnerability managementpractices that get rid of the almost totality of risk in the wild by address-ing a few vulnerabilities only. Our methodology is therefore suitable toguide the prioritisation of vulnerability mitigation actions.
Conclusion 5 The results of our case-control study and the validation ex-ample confirm that risk-based policies significantly improve over criticality-based ones. We therefore accept Hypothesis 3. As expected from the analysisprovided in Chapter 6, we find that risk-based policies based on cybercrimeblack markets benefit from the multiplicative factor they enable. We thereforealso accept the Corollary to Hypothesis 3.
158

Chapter 8
Limitations and Future WorkDirections
In this Chapter we discuss some limitations of this work and how it couldbe extended to account for additional considerations on the value and costsassociated to the vulnerable system. Further, we outline what we believe areinteresting venues for future research on these same lines, in particular froma policy perspective.
8.1 Limitations and Extensions
The results on risk-based policies presented in this Thesis are not accountingfor additional variables such as the value of the vulnerable system, that hasa clear impact on the level of acceptable risk. In the current formalizationof risk reduction we do not consider the fact that a company has typicallymany instances of software and therefore many instances of the software’svulnerabilities, and that different companies may effectively face differentcosts according the their specific environment. Rather, because RR is ameasure conditional on the existence of at least one exploit, it provides an“upper bound” of risk reduction.
It is however impossible for us to consider these costs explicitly in our case-
159

8.1. Limitations and Extensions Chapter 8
control experiment for two reasons: 1) the estimation is necessarily boundedto a particular case-study, which can only reproduce our results after a generalvalidation is available (i.e. the work presented here); 2) even in a case-studyscenario, a correct estimation of these costs may be very difficult to calculate.Therefore, in our study we have simply considered cost to linearly increasewith the number of vulnerabilities, i.e. every vulnerability has a unit cost.
To tailor our results to a more case-oriented application, a more appro-priate cost estimation should account for the occurrences of a vulnerabilityv in nv systems:
Costmult =∑
v∈Selected
nv (8.1)
In this case we should also revise the notion of risk reduction with multipleoccurrences, because we should consider also the number of occurrences ofeach vulnerability v in the nv systems.
RRmult=
∑v∈Attack∩Selected nv∑
v∈Selected nv−∑
v∈Attack∩Selected nv∑v∈Selected nv
(8.2)
The value of RRmulti would therefore be company specific since it dependson the number of instances of the installed software base.
Calculating the risk reduction with this formula is again an approximation.It assumes that all instances of software where the vulnerability is presentwill be affected by the patching policy and that they will all be equallyattacked. The former assumption is correct (if the policy is implementedcorrectly), but the latter is an approximation. In practice only a subsetof the systems with the vulnerability will be attacked (albeit they are allpotentially attackable). This approximation is conservative from a securityperspective: it overestimates the risk reduction that can be obtained whenwe decide to patch a vulnerability that is present in many systems but couldbe attacked only in some of them.
160

Chapter 8 8.2. Future Research Venues
Another variable worth mentioning is “infrastructural impact” , i.e. thecost of having a critical system impacted by an attack. A vulnerability couldaffect a mission critical system at the core of the corporation or a computer inan obscure subsidiary. Yet, by itself the vulnerability has no “infrastructuralimpact”. It is the compromise of the system on which the vulnerability ispresent that can lead to a more or less severe cost. “Infrastructural impact”should not therefore be considered in the actual calculation of risk reduction,but rather when deciding which is the appropriate risk level for the systemsunder consideration. In this sense the RRmult can be normalized by a sys-tem criticality estimation when limiting its evaluation on a particular set ofsystems. A company could therefore decide that a risk reduction of 50%is a good trade-off for the desktop of the subsidiary while a moderate 10%reduction is worth the money for the mission critical system.
8.2 Future Research Venues
This work outlined on the one hand the importance of attacker economics inthe general threat scenario, and on the other how this could be exploited todesign better vulnerability management practices.
The main point behind this body of work is that attackers are rational.Rationality and market activities have a dual effect in our context: first,they enable the attacker in more proficient and focused attack capabilities.Second, and more interestingly for us, it makes the attacker’s decisions pre-dictable to a degree: if the attacker has to act rationally, economic theorywill point in the direction of the attacker’s next step. For example, an at-tacker that has to decide which vulnerability to massively exploit next, willnecessarily choose the one providing the highest return on investment.
Similarly, the economic environments that empower the attacker are based,as shown in this Thesis, on well-known economic principles that ultimately
161

8.2. Future Research Venues Chapter 8
make it work. From this perspective, it is possible to leverage this knowl-edge to drive future international policies in the direction of ‘discouraging’the formation of these markets. The attempt of influencing the convenienceof criminal activities through policies is certainly not new in itself, but thecybercrime markets represent a brand new and interesting field that is yetunexplored.
The idea of designing ‘rational vulnerability management’ practices canand should go beyond the mere ‘application of a patch’: an interesting direc-tion would be to define policies to develop vulnerability patches, i.e. policiesto decide, on the vendor’s side, which vulnerabilities to address first. This isa different issue from that of installing a new patch on an existent system:the system administrator (may) know his source of threat, while for a de-veloper shipping the software to hundred of thousands customers this is notpossible (as the threat is ultimately on the customer and not the developer).In other words, there is a balance in positive and negative ‘externalities’ thatthe patching decision can create. This certainly requires future research tobe carried in this direction.
Finally, in this work we have considered only the ‘general’ attacker thataims at masses rather than on specific targets. Extending a ‘risk-based’ ap-proach to the latter scenario may be, however, a pointless exercise: there isan inherent asymmetry there between the attacker and the defender wherebythe attacker knows more about the affected system than the defender does.For example, if the attacker exploits a 0-day vulnerability or a non-defaultconfiguration that makes an otherwise harmless vulnerability reachable thereis nothing that the defender may really do. Unfortunately, software vulnera-bilities are not going to disappear from code [89], and therefore this problemis unlikely to be solved in the foreseeable future. A different approach mayinstead be more sensible to apply. Rather than focussing on risk mitigation,the defender may accept that something he cannot avoid, and be instead
162
Chapter 8 8.2. Future Research Venues
prepared to reacting quickly and efficiently to an attack. In the practitionercommunity this is an often-acclaimed concept, but it is hardly formalisedand remained largely untouched in the scientific literature.
A particular type of ‘dedicated attacker’ is a ‘governmental attacker’, i.e.an organisation or person working for a governmental agency that deploys acertain attack for monitoring or surveillance purposes. Without discussinghere the ethical issues attached to this practice, it is clear that establishinga sensible policy to govern and limit this capability is of central importancefor the future society. Establishing a field of research that aims at filling thisregulation gap requires a clear understanding of the technical, economic, andgovernance aspects of the problem.
163

8.2. Future Research Venues Chapter 8
164

Chapter 9
Conclusion
The contribution of this Thesis is twofold. On the one hand, it provides apreviously unexplored perspective over the economic environment in whichattackers operate. In particular, by infiltrating and studying the HackMar-ket.ru market and testing real attack tools in our MalwareLab we were ableto draw a picture of the resources available to the attacker that starts fromthe economic infrastructure supporting him or her, to the technical qualityof the goods in his or her hands. Importantly, we showed that the modelunderlying cybercrime market operations is sound form an economic per-spective, and there is therefore no good reason to believe these markets willstop operating anytime soon without an external intervention (e.g. by meansof international policies).
The economic rationality of the attacker is also at the core of the defi-nition of a new attacker model, the ‘Work-Averse Attacker’ model, wherebythe attacker’s decision of massively deploying a new exploit depends on theexpected utility of the new exploit relative to the already present one.
We argued that these considerations on the economic nature of the at-tacker are the key enablers for more efficient vulnerability management strate-gies that account for the risk represented by a vulnerability rather thanmerely its technical severity. We tested this hypothesis by running a case
165

Chapter 9
control study over vulnerabilities and exploits in the wild, and showed thatindeed a risk-based approach enables for much more efficient vulnerabilitymanagement. Further, we showed that this efficiency translates in vulner-ability management strategies that address few vulnerabilities only and arestill able to address the overwhelming majority of risk in the wild. Withthis methodology and taking in account our considerations, an organisationmay ultimately be able to design more sensible vulnerability managementstrategies that are easy to communicate and effective to enforce.
166

Bibliography
[1] Google reward program. [online] http://www.google.com/about/
appsecurity/reward-program/.
[2] Schneier: Security is as strong as its weakest link, 2005. [online]https://www.schneier.com/blog/archives/2005/12/weakest_
link_se.html.
[3] Software vulnerability disclosure: The chilling ef-fect, 2007. [online] http://www.csoonline.
com/article/2121727/application-security/
software-vulnerability-disclosure--the-chilling-effect.
html.
[4] Shopping for zero-days: A price list for hack-ers’ secret software exploits, 2012. [online] http:
//www.forbes.com/sites/andygreenberg/2012/03/23/
shopping-for-zero-days-an-price-list-for-hackers-secret-software-exploits/.
[5] Cisco vulnerability disclosure policy, 2014. [online] http:
//www.cisco.com/web/about/security/psirt/security_
vulnerability_policy.html#asr.
[6] Google project zero, 2014. [online] http://googleprojectzero.
blogspot.se.
167

Bibliography Chapter 9
[7] Defeat the casual attacker first!!, 2015. [online] http:
//blogs.gartner.com/anton-chuvakin/2015/01/28/
defeat-the-casual-attacker-first.
[8] Meet paunch: The accused author of the blackhole exploitkit, 2015. [online] http://krebsonsecurity.com/2013/12/
meet-paunch-the-accused-author-of-the-blackhole-exploit-kit/.
[9] NIST National Vulnerability Database (NVD), 2015. [online] http://nvd.nist.gov.
[10] Open Sourced Vulnerability Database (OSVDB), 2015. [online] http://osvdb.org.
[11] An overview of exploit packs (update 22) jan 2015, 2015.[online] http://contagiodump.blogspot.it/2010/06/
overview-of-exploit-packs-update.html.
[12] When google squares off with microsoft on bug disclosure, only userslose, 2015. [online] http://arstechnica.com/security/2015/01/
google-sees-a-bug-before-patch-tuesday-but-windows-users-remain-vulnerable/.
[13] George A. Akerlof. The market for "lemons": Quality uncertainty andthe market mechanism. The Quarterly Journal of Economics, 84:pp.488–500, 1970.
[14] Miriam R Albert. E-buyer beware: Why online auction fraud shouldbe regulated. American Business Law Journal, 39(4):575–644, 2002.
[15] Omar Alhazmi and Yashwant Malaiya. Modeling the vulnerability dis-covery process. In Proceedings of the 16th IEEE International Sympo-sium on Software Reliability Engineering (ISSRE’05), pages 129–138,2005.
168
Chapter 9 Bibliography
[16] Omar Alhazmi and Yashwant Malaiya. Application of vulnerabilitydiscovery models to major operating systems. IEEE Transactions onReliability, 57(1):14–22, 2008.
[17] Luca Allodi. Attacker economics for internet-scale vulnerability riskassessment. In Presented as part of the 6th USENIX Workshop onLarge-Scale Exploits and Emergent Threats. USENIX, 2013.
[18] Luca Allodi, Vadim Kotov, and Fabio Massacci. Malwarelab: Experi-mentation with cybercrime attack tools. In Proceedings of the 2013 6thWorkshop on Cybersecurity Security and Test, 2013.
[19] R. Anderson, C. Barton, R. Bohme, R. Clayton, M.J.G. van Eeten,M. Levi, T. Moore, and S. Savage. Measuring the cost of cybercrime.In Proceedings of the 11th Workshop on Economics and InformationSecurity, 2012.
[20] A. Arora, R. Krishnan, A. Nandkumar, R. Telang, and Y. Yang. Impactof vulnerability disclosure and patch availability-an empirical analysis.In Proceedings of the 3rd Workshop on Economics and InformationSecurity, 2004.
[21] Ashish Arora, Ramayya Krishnan, Rahul Telang, and Yubao Yang. Anempirical analysis of software vendors’ patch release behavior: Impactof vulnerability disclosure. Information Systems Research, 21(1):115–132, March 2010.
[22] Ashish Arora, Ramayya Krishnan, Rahul Telang, and Yubao Yang. Anempirical analysis of software vendors; patch release behavior: Impactof vulnerability disclosure. Information Systems Research, 21(1):115–132, 2010.
169
Bibliography Chapter 9
[23] Ashish Arora, Rahul Telang, and Hao Xu. Optimal policy for softwarevulnerability disclosure. Management Science, 54(4):642–656, 2008.
[24] Hadi Asghari, Michel Van Eeten, Axel Arnbak, and Nico Van Eijk. Se-curity economics in the https value chain. Available at SSRN 2277806,2013.
[25] W. Baker, M. Howard, A. Hutton, and C. David Hylender. 2012 databreach investigation report. Technical report, Verizon, 2012.
[26] Jonell Baltazar. More traffic, more money: Koobface draws more blood.Technical report, TrendLabs, 2011.
[27] Johannes M Bauer and Michel JG Van Eeten. Cybersecurity: Stake-holder incentives, externalities, and policy options. Telecommunica-tions Policy, 33(10):706–719, 2009.
[28] Leyla Bilge and Tudor Dumitras. Before we knew it: an empiricalstudy of zero-day attacks in the real world. In Proceedings of the19th ACM Conference on Computer and Communications Security(CCS’12), pages 833–844. ACM, 2012.
[29] J Martin Bland and Douglas G Altman. Multiple significance tests:the bonferroni method. 310(6973):170, 1995.
[30] Mehran Bozorgi, Lawrence K. Saul, Stefan Savage, and Geoffrey M.Voelker. Beyond heuristics: Learning to classify vulnerabilities andpredict exploits. In Proceedings of the 16th ACM International Con-ference on Knowledge Discovery and Data Mining, July 2010.
[31] B. Brykczynski and R.A. Small. Reducing internet-based intrusions:Effective security patch management. Software, IEEE, 20(1):50–57,Jan 2003.
170

Chapter 9 Bibliography
[32] Ahto Buldas, Peeter Laud, Jaan Priisalu, Mart Saarepera, and JanWillemson. Rational choice of security measures via multi-parameterattack trees. In Javier Lopez, editor, Proceedings of the 1st Inter-national Workshop on Critical Information Infrastructures Security,volume 4347 of Lecture Notes in Computer Science, pages 235–248.Springer Berlin / Heidelberg, 2006.
[33] Mary M Calkins. My reputation always had more fun than me: Thefailure of ebay’s feedback model to effectively prevent online auctionfraud. Rich. JL & Tech., 7:33–34, 2001.
[34] Hasan Cavusoglu, Huseyin Cavusoglu, and Jun Zhang. Security patchmanagement: Share the burden or share the damage? ManagementScience, 54(4):657–670, 2008.
[35] Huseyin Cavusoglu, Hasan Cavusoglu, and Jun Zhang. Economics ofsecurity patch management. In WEIS, 2006.
[36] Pei-yu Chen, Gaurav Kataria, and Ramayya Krishnan. Correlated fail-ures, diversification, and information security risk management. MISQuaterly-Management Information Systems, 35(2):397–422, 2011.
[37] Erika Chin, Adrienne Porter Felt, Vyas Sekar, and David Wagner. Mea-suring user confidence in smartphone security and privacy. In Proceed-ings of the Eighth Symposium on Usable Privacy and Security, page 1.ACM, 2012.
[38] Steve Christey and Brian Martin. Buying into the bias: why vulnera-bility statistics suck. https://www.blackhat.com/us-13/archives.html#Martin, July 2013.
[39] Sandy Clark, Stefan Frei, Matt Blaze, and Jonathan Smith. Familiaritybreeds contempt: the honeymoon effect and the role of legacy code in
171

Bibliography Chapter 9
zero-day vulnerabilities. In Proceedings of the 26th Annual ComputerSecurity Applications Conference, pages 251–260, 2010.
[40] PCI Council. Pci dss requirements and security assessment procedures,version 2.0., 2010.
[41] Bill Curtis, Herb Krasner, and Neil Iscoe. A field study of the softwaredesign process for large systems. Commun. ACM, 31(11):1268–1287,November 1988.
[42] D. Dagon, C. Zou, and W. Lee. Modeling botnet propagation usingtime zones. In Proceedings of the 13th Annual Network and DistributedSystem Security Symposium, 2006.
[43] Russell Davidson and James G MacKinnon. Econometric theory andmethods, volume 5. Oxford University Press New York, 2004.
[44] D. Dolev and A. Yao. On the security of public key protocols. IEEETransactions on Information Theory, 29(2):198 – 208, mar 1983.
[45] Richard Doll and A Bradford Hill. Smoking and carcinoma of the lung.British Medical Journal, 2(4682):739–748, 1950.
[46] Tudor Dumitras and Petros Efstathopoulos. Ask wine: are we safertoday? evaluating operating system security through big data analysis.In Proceeding of the 2012 USENIX Workshop on Large-Scale Exploitsand Emergent Threats, LEET’12, pages 11–11, 2012.
[47] Tudor Dumitras and Darren Shou. Toward a standard benchmark forcomputer security research: The worldwide intelligence network en-vironment (wine). In Proceedings of the First Workshop on Build-ing Analysis Datasets and Gathering Experience Returns for Security,pages 89–96. ACM, 2011.
172

Chapter 9 Bibliography
[48] Kathleen M Eisenhardt. Agency theory: An assessment and review.Academy of management review, 14(1):57–74, 1989.
[49] L. Evans. The effectiveness of safety belts in preventing fatalities. Ac-cident Analysis & Prevention, 18(3):229–241, 1986.
[50] FBI. Internet crime report 2013. Technical report, Internet CrimeComplaint Center, 2013.
[51] Matthew Finifter, Devdatta Akhawe, and David Wagner. An empiricalstudy of vulnerability rewards programs. In Presented as part of the22nd USENIX Security Symposium (USENIX Security 13), pages 273–288, Washington, D.C., 2013. USENIX.
[52] J. Franklin, V. Paxson, A. Perrig, and S. Savage. An inquiry into thenature and causes of the wealth of internet miscreants. In Proceedings ofthe 14th ACM Conference on Computer and Communications Security(CCS’07), pages 375–388, 2007.
[53] Stefan Frei, Dominik Schatzmann, Bernhard Plattner, and Brian Tram-mell. Modeling the security ecosystem - the dynamics of (in)security. InTyler Moore, David Pym, and Christos Ioannidis, editors, Economicsof Information Security and Privacy, pages 79–106. Springer US, 2010.
[54] Thomas Gerace and Huseyin Cavusoglu. The critical elements of thepatch management process. Commun. ACM, 52(8):117–121, August2009.
[55] Lawrence A. Gordon and Martin P. Loeb. The economics of informationsecurity investment. ACM Transactions on Information and SystemSecurity, 5(4):438–457, 2002.
173

Bibliography Chapter 9
[56] Avner Greif. Contract enforceability and economic institutions in earlytrade: The maghribi traders’ coalition. The American Economic Re-view, pages 525–548, 1993.
[57] Mark Greisiger. Cyber liability & data breach insurance claims a studyof actual claim payouts. Technical report, NetDiligence, 2013.
[58] Chris Grier, Lucas Ballard, Juan Caballero, Neha Chachra, Chris-tian J. Dietrich, Kirill Levchenko, Panayiotis Mavrommatis, DamonMcCoy, Antonio Nappa, Andreas Pitsillidis, Niels Provos, M. ZubairRafique, Moheeb Abu Rajab, Christian Rossow, Kurt Thomas, VernPaxson, Stefan Savage, and Geoffrey M. Voelker. Manufacturing com-promise: the emergence of exploit-as-a-service. In Proceedings of the19th ACM Conference on Computer and Communications Security(CCS’12), pages 821–832. ACM, 2012.
[59] Julian B. Grizzard, Vikram Sharma, Chris Nunnery, Brent ByungHoonKang, and David Dagon. Peer-to-peer botnets: overview and casestudy. In Proceedings of the first conference on First Workshop onHot Topics in Understanding Botnets, 2007.
[60] Salim Hariri, Guangzhi Qu, Tushneem Dharmagadda, ModukuriRamkishore, and Cauligi S Raghavendra. Impact analysis of faults andattacks in large-scale networks. IEEE Security & Privacy, (5):49–54,2003.
[61] Trevor Hastie and Robert Tibshirani. Generalized additive models.Statistical science, pages 297–310, 1986.
[62] C. Herley. When does targeting make sense for an attacker? IEEESecurity and Privacy, 11(2):89–92, 2013.
174

Chapter 9 Bibliography
[63] C. Herley and D. Florencio. Nobody sells gold for the price of silver:Dishonesty, uncertainty and the underground economy. Economics ofInformation Security and Privacy, 2010.
[64] Cormac Herley. Why do nigerian scammers say they are from nigeria?In Proceedings of the 11th Workshop on Economics and InformationSecurity, 2012.
[65] Thomas J Holt, Deborah Strumsky, Olga Smirnova, and Max Kilger.Examining the social networks of malware writers and hackers. Inter-national Journal of Cyber Criminology, 6(1):891–903, 2012.
[66] Andrei Homescu, Steven Neisius, Per Larsen, Stefan Brunthaler, andMichael Franz. Profile-guided automated software diversity. In 2013IEEE/ACM International Symposium on Code Generation and Opti-mization (CGO), pages 1–11. IEEE, 2013.
[67] M. Howard, J. Pincus, and J.M. Wing. Measuring relative attack sur-faces. Computer Security in the 21st Century, pages 109–137, 2005.
[68] Michael Howard, Jon Pincus, and Jeannette M. Wing. Measuring rel-ative attack surfaces. In Proceedings of Workshop on Advanced Devel-opments in Software and Systems Security, 2003.
[69] A.E. Howe, I. Ray, M. Roberts, M. Urbanska, and Z. Byrne. Thepsychology of security for the home computer user. In Proceedings ofthe 33rd IEEE Symposium on Security and Privacy, pages 209–223,2012.
[70] Group IB. State and trends of the russian digital crime market. Tech-nical report, Group IB, 2011.
175

Bibliography Chapter 9
[71] Christos Ioannidis, David Pym, and Julian Williams. Information se-curity trade-offs and optimal patching policies. European Journal ofOperational Research, 216(2):434 – 444, 2011.
[72] Chris Kanich, Christian Kreibich, Kirill Levchenko, Brandon Enright,Geoffrey M. Voelker, Vern Paxson, and Stefan Savage. Spamalytics:an empirical analysis of spam marketing conversion. In Proceedings ofthe 15th ACM Conference on Computer and Communications Security(CCS’08), CCS ’08, pages 3–14. ACM, 2008.
[73] Chaim Kaufmann. Threat inflation and the failure of the marketplaceof ideas: The selling of the iraq war. International Security, 29(1):5–48,2004.
[74] Barbara Kitchenham, Lesley Pickard, and Shari Lawrence Pfleeger.Case studies for method and tool evaluation. IEEE Software, 12(4):52–62, 1995.
[75] Vadim Kotov and Fabio Massacci. Anatomy of exploit kits. preliminaryanalysis of exploit kits as software artefacts. In Proc. of ESSoS 2013,2013.
[76] Thomas Kurt, Grier Chris, Paxson Vern, and Song Dawn. Suspendedaccounts in retrospect:an analysis of twitter spam. In Proceedings ofthe ACM 2011 Internet Measurement Conference. ACM, 2011.
[77] M86 Labs. Security labs report july-december 2011 recap. Technicalreport, M86 Security Labs, 2011.
[78] J.D. McCalley, V. Vittal, and N. Abi-Samra. An overview of risk basedsecurity assessment. In Power Engineering Society Summer Meeting,1999. IEEE, volume 1, pages 173–178 vol.1, Jul 1999.
176
Chapter 9 Bibliography
[79] Peter Mell, Karen Scarfone, and Sasha Romanosky. A complete guide tothe common vulnerability scoring system version 2.0. Technical report,FIRST, Available at http://www.first.org/cvss, 2007.
[80] Mikhail I Melnik and James Alm. Does a seller’s ecommerce reputa-tion matter? evidence from ebay auctions. The journal of industrialeconomics, 50(3):337–349, 2002.
[81] C. Miller. The legitimate vulnerability market: Inside the secretiveworld of 0-day exploit sales. In Proceedings of the 6th Workshop onEconomics and Information Security, 2007.
[82] Marti Motoyama, Damon McCoy, Stefan Savage, and Geoffrey M.Voelker. An analysis of underground forums. In Proceedings of theACM 2011 Internet Measurement Conference, 2011.
[83] Mendes Naaliel, Duraes Joao, and Madeira Henrique. Security bench-marks for web serving systems. In Proceedings of the 25th IEEE Inter-national Symposium on Software Reliability Engineering (ISSRE’14),2014.
[84] Antonio Nappa, Richard Johnson, Leyla Bilge, Juan Caballero, andTudor Dumitras. The attack of the clones: A study of the impact ofshared code on vulnerability patching. 2015.
[85] Kartik Nayak, Daniel Marino, Petros Efstathopoulos, and Tudor Du-mitras. Some vulnerabilities are different than others. In Proceedings ofthe 17th International Symposium on Research in Attacks, Intrusionsand Defenses, pages 426–446. Springer, 2014.
[86] Viet Hung Nguyen and Fabio Massacci. An independent validation ofvulnerability discovery models. In Proceeding of the 7th ACM Sympo-
177
Bibliography Chapter 9
sium on Information, Computer and Communications Security (ASI-ACCS’12), 2012.
[87] Russian Ministry of Internal Affairs (MVD). Arrested 13 members ofcriminal society who “earned” 70m rubles with internet virus. http:
//mvd.ru/news/item/1387267/, December 2013.
[88] Hamed Okhravi and D Nicol. Evaluation of patch management strate-gies. International Journal of Computational Intelligence: Theory andPractice, 3(2):109–117, 2008.
[89] Daniela Oliveira, Marissa Rosenthal, Nicole Morin, Kuo-Chuan Yeh,Justin Cappos, and Yanyan Zhuang. It’s the psychology stupid: Howheuristics explain software vulnerabilities and how priming can illumi-nate developer’s blind spots. In Proceedings of the 30th Annual Com-puter Security Applications Conference, pages 296–305. ACM, 2014.
[90] Andy Ozment. Bug auctions: Vulnerability markets reconsidered. InThird Workshop on the Economics of Information Security, 2004.
[91] Andy Ozment. The likelihood of vulnerability rediscovery and the socialutility of vulnerability hunting. In Proceedings of the 4th Workshop onEconomics and Information Security, 2005.
[92] Ponemon. The state of risk-based security management. Technicalreport, Ponemon / Tripwire, 2013.
[93] Niels Provos, Panayiotis Mavrommatis, Moheeb Abu Rajab, andFabian Monrose. All your iframes point to us. In Proceedings of the17th USENIX Security Symposium, pages 1–15, 2008.
[94] Niels Provos, Dean McNamee, Panayiotis Mavrommatis, Ke Wang, andNagendra Modadugu. The ghost in the browser analysis of web-based
178
Chapter 9 Bibliography
malware. In Proceedings of the first conference on First Workshop onHot Topics in Understanding Botnets, pages 4–4, 2007.
[95] Stephen D. Quinn, Karen A. Scarfone, Matthew Barrett, and Christo-pher S. Johnson. Sp 800-117. guide to adopting and using the securitycontent automation protocol (scap) version 1.0. Technical report, Na-tional Institute of Standards & Technology, 2010.
[96] R Core Team. R: A Language and Environment for Statistical Com-puting. R Foundation for Statistical Computing, Vienna, Austria, 2013.
[97] R.J. Ratterman, R. Maltzman, and J.D. Knepfle. Determining a com-munity rating for a user using feedback ratings of related users in anelectronic environment, 2000. US Patent 8,290,809.
[98] Paul Resnick and Richard Zeckhauser. Trust among strangers in in-ternet transactions: Empirical analysis of ebay’s reputation system.Advances in applied microeconomics, 11:127–157, 2002.
[99] Colin Robson. Real world research, volume 2. Blackwell publishersOxford, 2002.
[100] Sasha Romanosky. Email exchange with author. Personal email com-munication, July 2012.
[101] Christian Rossow, Christian J. Dietrich, Chris Grier, ChristianKreibich, Vern Paxson, Norbert Pohlmann, Herbert Bos, and Maartenvan Steen. Prudent practices for designing malware experiments: Sta-tus quo and outlook. In Proceedings of the 33rd IEEE Symposium onSecurity and Privacy, 2012.
[102] Per Runeson and Martin Host. Guidelines for conducting and report-ing case study research in software engineering. Empirical SoftwareEngineering, 14(2):131–164, 2009.
179

Bibliography Chapter 9
[103] Karen Scarfone and Peter Mell. An analysis of cvss version 2 vul-nerability scoring. In Proceedings of the 3rd International Symposiumon Empirical Software Engineering and Measurement, pages 516–525,2009.
[104] Bruce Schneier. https://www.schneier.com/blog/archives/2012/02/verisign_hacked.html.
[105] Guido Schryen. A comprehensive and comparative analysis of thepatching behavior of open source and closed source software vendors.In Proceedings of the 2009 Fifth International Conference on IT Secu-rity Incident Management and IT Forensics, IMF ’09, pages 153–168,Washington, DC, USA, 2009. IEEE Computer Society.
[106] Edward J Schwartz, Thanassis Avgerinos, and David Brumley. Q: Ex-ploit hardening made easy. In USENIX Security Symposium, 2011.
[107] Edoardo Serra, Sushil Jajodia, Andrea Pugliese, Antonino Rullo, andVS Subrahmanian. Pareto-optimal adversarial defense of enterprise sys-tems. ACM Transactions on Information and System Security (TIS-SEC), 17(3):11, 2015.
[108] Muhammad Shahzad, Muhammad Zubair Shafiq, and Alex X. Liu. Alarge scale exploratory analysis of software vulnerability life cycles. InProceedings of the 34th International Conference on Software Engi-neering, pages 771–781. IEEE Press, 2012.
[109] Herbert A Simon. Theories of decision-making in economics and behav-ioral science. The American Economic Review, 49(3):253–283, 1959.
[110] Kevin Z Snow, Fabian Monrose, Lucas Davi, Alexandra Dmitrienko,Christopher Liebchen, and Ahmad-Reza Sadeghi. Just-in-time code
180

Chapter 9 Bibliography
reuse: On the effectiveness of fine-grained address space layout ran-domization. In Security and Privacy (SP), 2013 IEEE Symposium on,pages 574–588. IEEE, 2013.
[111] Brett Stone-Gross, Marco Cova, Bob Gilbert, Richard Kemmerer,Christopher Kruegel, and Giovanni Vigna. Analysis of a botnettakeover. IEEE Sec. & Priv. Mag., 9(1):64–72, 2011.
[112] Symantec. Analysis of Malicious Web Activity by At-tack Toolkits. Symantec, Available on the web athttp://www.symantec.com/threatreport/topic.jsp?id=threat_activity_trends&aid=analysis_of_malicious_web_activity,online edition, 2011. Accessed on June 1012.
[113] Symantec. Symantec corporation internet security threat report 2013.Technical Report 18, 2012 Trends, April 2013.
[114] Cisco Systems. Cisco 2015 annual security report. Technical report,Cisco, 2015.
[115] P.A. Taylor. Hackers: crime in the digital sublime. Psychology Press,1999.
[116] CVSS SIG Team. Common vulnerability scoring system v3.0: Specifi-cation document. Technical report, First.org, 2015.
[117] Rahul Telang and Sunil Wattal. An empirical analysis of the impactof software vulnerability announcements on firm stock price. , IEEETransactions on Software Engineering, 33(8):544–557, 2007.
[118] W. Tirenin and D. Faatz. A concept for strategic cyber defense. In Mil-itary Communications Conference Proceedings, 1999. MILCOM 1999.IEEE, volume 1, pages 458–463 vol.1, 1999.
181

Bibliography Chapter 9
[119] Jean Tirole. Cognition and incomplete contracts. The American Eco-nomic Review, 99:265–294, 2009.
[120] O Turgeman-Goldschmidt. Hackers’ accounts: Hacking as a social en-tertainment. Social Science Computer Review, 23(1):8, 2005.
[121] Michel Van Eeten and Johannes Bauer. Economics of malware: Secu-rity decisions, incentives and externalities. Technical report, OECD,2008.
[122] Verizon. Verizon 2014 pci compliance report. Technical report, VerizonEnterprise, 2014.
[123] Verizon. Pci compliance report. Technical report, Verizon Enterprise,2015.
[124] Lingyu Wang, Tania Islam, Tao Long, Anoop Singhal, and Sushil Jajo-dia. An attack graph-based probabilistic security metric. In Proceedingsof the 22nd IFIP WG 11.3 Working Conference on Data and Appli-cations Security, volume 5094 of Lecture Notes in Computer Science,pages 283–296. Springer Berlin / Heidelberg, 2008.
[125] Rick Wash. Folk models of home computer security. In Proceedings ofthe Sixth Symposium on Usable Privacy and Security, 2010.
[126] Halbert White. A heteroskedasticity-consistent covariance matrix esti-mator and a direct test for heteroskedasticity. Econometrica, 48(4):pp.817–838, 1980.
[127] Branden R Williams and Anton Chuvakin. PCI Compliance: Under-stand and implement effective PCI data security standard compliance.Syngress Elsevier, 2012.
182
Chapter 9 Bibliography
[128] Claes Wohlin, Per Runeson, Martin Host, Magnus C Ohlsson, BjornRegnell, and Anders Wesslen. Experimentation in software engineering.Springer Science & Business Media, 2012.
[129] Sung-Whan Woo, Omar Alhazmi, and Yashwant Malaiya. Assessingvulnerabilities in Apache and IIS HTTP servers. In Proceedings of the2nd IEEE International Symposium on Dependable, Autonomic andSecure Computing, 2006.
[130] Michael Yip, Nigel Shadbolt, and Craig Webber. Why forums? anempirical analysis into the facilitating factors of carding forums. 2013.
183
Related Documents


![DISI - University of Trento · Management (ISCRAM), pages 230-241, 2008. [80]: Maurizio Marchese, Lorenzino Vaccari, Pavel Shvaiko, and Juan Pane. An application of approximate ontology](https://static.cupdf.com/doc/110x72/5f0e23377e708231d43dcaac/disi-university-of-trento-management-iscram-pages-230-241-2008-80-maurizio.jpg)