Copyright ã Author(s) 2002 * Centre for Development Studies, Trivandrum; secondment Centre for Studies in Science Policy (Jawaharlal Nehru University), New Delhi This is a revised version of the paper originally prepared for the UNU/WIDER Conference on the New Economy in Development, 10-11 May 2002, Helsinki. Discussion Paper No. 2002/78 Growth of ICT and ICT for Development Realities of the Myths of the Indian Experience K. J. Joseph* August 2002 Abstract While there is an increasing realization of the potential that IT offers for human welfare, IT-induced productivity and growth are confined to the developed world. It is argued that even though the international digital divide is a reality, there are certain specific characteristics of the new technology that leave scope for mitigating, if not totally bridging, the gap when appropriate policies are in place. During the last decade India has attempted to profit from the growth of ICT through export-oriented growth strategy, and the issue of ICT in development has not received the attention it deserves. The paper highlights the perils of the strategy followed by India and underlines the need to focus on development through ICT. The study shows that the unprecedented export performance of India’s software has to be seen in the context of the national system of innovation that evolved during the last five decades when the state played a proactive role. Also, the country’s high export growth cannot be attributed entirely to the market- oriented policies of the 1990s. Higher growth rates in exports notwithstanding, it is shown that net export earnings have been much lower. While the low net export …./ Keywords: ICT, growth, development, India, software exports JEL classification: L86, O32

Welcome message from author
This document is posted to help you gain knowledge. Please leave a comment to let me know what you think about it! Share it to your friends and learn new things together.
Transcript

Copyright� Author(s) 2002
* Centre for Development Studies, Trivandrum; secondment Centre for Studies in Science Policy(Jawaharlal Nehru University), New Delhi
This is a revised version of the paper originally prepared for the UNU/WIDER Conference on the NewEconomy in Development, 10-11 May 2002, Helsinki.
Discussion Paper No. 2002/78
Growth of ICT and ICT for Development
Realities of the Myths of the IndianExperience
K. J. Joseph*
August 2002
Abstract
While there is an increasing realization of the potential that IT offers for human welfare,IT-induced productivity and growth are confined to the developed world. It is arguedthat even though the international digital divide is a reality, there are certain specificcharacteristics of the new technology that leave scope for mitigating, if not totallybridging, the gap when appropriate policies are in place. During the last decade Indiahas attempted to profit from the growth of ICT through export-oriented growth strategy,and the issue of ICT in development has not received the attention it deserves. Thepaper highlights the perils of the strategy followed by India and underlines the need tofocus on development through ICT. The study shows that the unprecedented exportperformance of India’s software has to be seen in the context of the national system ofinnovation that evolved during the last five decades when the state played a proactiverole. Also, the country’s high export growth cannot be attributed entirely to the market-oriented policies of the 1990s. Higher growth rates in exports notwithstanding, it isshown that net export earnings have been much lower. While the low net export
…./Keywords: ICT, growth, development, India, software exports
JEL classification: L86, O32

UNU World Institute for Development Economics Research (UNU/WIDER)was established by the United Nations University as its first research andtraining centre and started work in Helsinki, Finland in 1985. The purpose ofthe Institute is to undertake applied research and policy analysis on structuralchanges affecting the developing and transitional economies, to provide aforum for the advocacy of policies leading to robust, equitable andenvironmentally sustainable growth, and to promote capacity strengtheningand training in the field of economic and social policy making. Its work iscarried out by staff researchers and visiting scholars in Helsinki and throughnetworks of collaborating scholars and institutions around the world.
UNU World Institute for Development Economics Research (UNU/WIDER)Katajanokanlaituri 6 B, 00160 Helsinki, Finland
Camera-ready typescript prepared by Liisa Roponen at UNU/WIDERPrinted at UNU/WIDER, Helsinki
The views expressed in this publication are those of the author(s). Publication does not implyendorsement by the Institute or the United Nations University, nor by the programme/project sponsors, ofany of the views expressed.
ISSN 1609-5774ISBN 92-9190-280-2 (printed publication)ISBN 92-9190-281-0 (internet publication)
earnings reduced the possibility of real appreciation, the boom in the IT sector is likelyto have had an adverse influence, at least in the short run, on other sectors competing forskilled manpower because of the resource movement effect. Thus while an IT-induceddevelopment strategy could have been instrumental in enhancing efficiency,competitiveness and growth, export-oriented IT growth strategy seems to have enabledother countries to become more efficient and competitive. The export-oriented growthstrategy also had an adverse effect on the innovative performance of firms. The findingsof the paper tend to underscore the need to recognize the complementary role of thedomestic market in promoting innovation and exports on the one hand and IT-inducedproductivity, competitiveness and growth on the other. Hence there is need for a policythat focuses on ICT for development. This in turn calls for comprehending the socialmarginal product of a dollar worth of IT exports vis-à-vis its domestic consumption.
Acknowledgements
I have benefited from discussions with Professor Ashok Parthasarathi while preparingthis paper. I am also thankful to Professor Amtab Kundu for discussions, especially onsome methodological issues, and to Ms Brigit Joseph, Mr Mahesh Sarma andMs Syamala Krishnamurthy for their timely help. I also gratefully acknowledgecomments by Professor Sheila Ryan Johansson and other participants at theUNU/WIDER conference. I am also thankful to Professor Mathew Tharakan for hisdetailed comments. Copy editing by Ms Liisa Roponen contributed to the readability ofthe paper. The usual disclaimers follow..

1
1 Introduction and background
Today, we are living in a world where information communication technology (ICT)1 isbeing diffused into almost all spheres of human activity at an unprecedented rate. Sideby side with this development, there is also an intense debate on the contribution of thistechnology towards productivity and growth on the one hand and human welfare on theother in both developed and developing countries. By juxtaposing the slowdown inproductivity growth in the US since the late 1960 against the dramatic increase in ITspending over the same period, studies have come up with the ‘productivity paradox’,arguing that IT has not resulted in expected productivity improvements (Roah 1987;1988) Strassman (1997). If evidence from recent cross-country studies is any indication,returns to investments in information technology in terms of productivity and growthare substantial (Pohjola 2001; Kraemer and Dedrick 2001). Pohjola finds the outputelasticity of IT capital to be as high as 0.31 for a full sample of 39 countries and 0.23 inan OECD subsample. Another cross-country study by IMF (2001) also has similarconclusions to offer. Country-specific studies like the one for Singapore (Wong 2001)find that the net return to IT capital (37.9 per cent) is about two and a half times higherthan that for non-IT capital (14.6 per cent). These studies also show that IT inducedproductivity and growth still remain a phenomenon of the developed (OECD) countriesand that the developing countries are yet to catch up.
This takes us to the other dimension of the ongoing debate—the international digitaldivide. Given the present unequal access to ICT, it has been argued that new technologyreinforces disparities between postindustrial societies at the core of the network anddeveloping countries in the periphery. Multilateral organizations like OECD and UNDPshare the same view. OECD (2000) states that affluent states at the cutting edge oftechnological change have reinforced their lead in the new knowledge economy, but sofar benefits have not yet trickled down to Southern, Central and Eastern Europe, letalone to the poorest areas in the Sub-Saharan Africa, Latin America or South East Asia.In a similar vain, UNDP (1999) argues that productivity gains from informationtechnology may widen the gulf between the most affluent nations and those that lack theskills, resources and infrastructure to invest in information technology. Hence, anydiscussion on ICT induced development has to begin with the question: unlike earliertechnologies, are there any unique characteristics of the new technology that make itpossible to mitigate the international digital divide, if not bridge it altogether?
Analytically, the contribution of ICT can be viewed at two different but interrelatedlevels—ICT growth and ICT diffusion. The former refers to the contribution in output,employment, export earning, etc., resulting from the production of ICT related goods2
and services that are limited to just one segment of the economy (Kraemer and Dedrick2001). The latter refers to IT induced development through enhanced productivity,competitiveness, growth and human welfare resulting from the use of this technology bydifferent sectors of the economy and society. India has mainly attempted to profit fromICT growth through a series of institutional innovations and export oriented policy
1 In this paper I use the terms ICT and IT interchangeably.
2 Such benefits are not confined to the developed countries alone. A classic example is India, which hasemerged as a major player in the ICT trade in recent years.

2
measures,3 based on the implicit assumption that market-oriented ICT growth strategywill also result in the diffusion of new technology and ICT induced development.Hence, the often-claimed achievements with respect to India’s ICT have not been interms of harnessing new technology for enhanced efficiency and productivity growth,but instead for promoting export earnings for the economy. Indeed, India’s exportperformance has been unique in comparison to other export products, not only in termsof growth rates but also in terms of its stability. Hence, the question to be addressed inthe context of countries like India is, whether if left to itself, would the development ofICT result in IT induced progress and human welfare?
Governmental task forces4 and the academia on the one hand and journalists on theother have contributed to a burgeoning literature on the different aspects of ICT inIndia. However, most of these studies have focused on the direct benefits of ICTgrowth, and the issue of IT in development has not received the attention it deserves.The unavoidable outcome has been the proliferation of a number of assertions regardingthe benefits of IT growth to the economy. Theseprima facieappear convincing but anin-depth analysis with supporting data suggests that the IT scene in the country isburdened with a number of myths. The purpose of this paper is to highlight the realitiesof some of these myths and clear the debris, at least partly, so as to make developmentthrough ICT the focus of research and policymaking in India. We propose to undertakethis against a critical analysis of the empirical basis of the arguments regardinginternational digital divide.
The myths, arising from the often followed practice of substituting casual observationfor rigorous analysis, range from the role of state in the sector’s growth performance toits growth dynamicsper se, as well as its implications on the rest of the economy. Thus,it has been argued that India’s growth ICT dynamism has been the result of a benignneglect of the sector by the state (Kattuman and Iyer 2001; Aroraet al. 2002). Let uscall this the ‘myth of benign state neglect’. Second, and related to the policy myth is theoften-made claim that growth performance of this sector under the globalization-liberalization period has been unprecedented. This could be labelled as the ‘myth ofliberalism induced growth’. Third, we undertake critical analysis of the directcontribution of ICT to export earnings, and reflect on the implications of the IT boomon the rest of the economy. Finally, it has been argued that an export-oriented policyregime is more conducive to attaining technological dynamism and growth. Hence, thedeveloping countries in general have been swinging between import substitution and thefree trade fever. In this context, I intent to test this hypothesis with respect to theinnovative behaviour of Indian IT firms. The central message of the paper is that insteadof focusing on ICT growth, it is high time for India to shift its focus towardsICT induced development. In what follows next, I take up each of these issues andsubject them to analytical and empirical scrutiny within the limits of data availability.
3 This is not to argue that the importance of ICT diffusion has not been recognized. For example thesoftware policy of 1986 explicitly recognized importance of balanced (software for export anddomestic use) development of software. Similarly, the IT taskforce also underlined the need for citizeninterface and e-governance. However, the explicit policy measures were mainly aimed at developingan IT base for export.
4 Here the reference is to the national taskforce on information technology and software development,taskforce on human resource development for IT and the taskforce on knowledge society.

3
2 Digital divide: An unbridgeable divide?
Notwithstanding the current unequal access to IT, it has been argued that in the currentera of globalization the ability to harness technology improves the capability ofdeveloping country-firms to withstand competition from multinational corporations orto develop partnership with them. At the same time, IT poses a potential threat. If thedeveloping countries are unable to harness this new source of wealth, they will fall evenfurther behind (Pohjola 1998). Moreover, developing countries are expected to gainsubstantially through ICT spillovers (Mohnen 2001). Drawing on the new growththeories, it may be argued that ICT could be instrumental in breaking the vicious circleof idea gap and object gap (Romer 1993)—the rootcause of persistent poverty andunderdevelopment. No wonder developing countries have shown great interest andpegged high hopes on information technology as the shortcut to prosperity (UNDP1999; World Bank 1999).
But given the current state of ICT access wherein half a billion people in Sub-SaharanAfrica share 14 million telephone lines—which is fewer than in Manhattan or inTokyo—and almost half of the world population have never made a telephone call, howrealistic are the claims made above? What is more, studies have shown that inter-country differences in the rate of IT diffusion are significantly related to the generallevel of socioeconomic development (per capita GDP, R&D expenditure and levels ofhuman development) (Hargittai 1999; Rodriguez and Wilson 2000). These results tendto indicate that to achieve IT induced development, developing countries will have towait until they cross the hub of per capita income growth and human development. Thusviewed, developing countries are trapped in the vicious circle of low per capita incomethat leads to a low level of IT diffusion, resulting in turn in low per capita income andgrowth.
Such a pessimistic view has been further articulated by Norris (2001). In her analysis ofthe correlation between levels of diffusion of old media (television, radios, telephones,newspapers) and new media (PCs, internet, etc.) across different countries, she found ahighly positive and statistically significant relationship (see Table 1).
Based on this finding, it was concluded that there was little distinction between old andnew media, and the proportion of those online in each country was most strongly relatedto the distribution of hosts, telephones and PCs, but was also significantly and stronglyrelated to the distribution of radios, TV sets and newspaper readership in each country.5
These studies, therefore, suggest that ‘to them that hath, shall be given’.
In reaching such pessimistic conclusions, the studies cited above seem to have failed torecognize certain unique characteristics of the new technology which do not make theleapfrogging impossible as long as appropriate policies are in place. To begin with,unlike earlier technologies, investment in new technology essentially complementsinvestments already made in communications technologies, like satellites, telephonenetworks and cable TV networks. Thus there can be substantial returns with marginalinvestments. Second, newly developed technology like the ‘wireless in local loop’(WILL) by the Indian Institute of Technology, Chennai, makes it possible to connectremote villages and thus greatly reduce the cost of last mile connectivity (Planning
5 It was also noted that there are a few outliers that may have significant implications for policyinitiatives designed to broaden the spread of the wired world (Norris 2001: 54).

4
Commission 2001). Third, new technology is multi-user by nature which, in turn, leavesscope for internet kiosks, internet cafes and community internet centres, providingaccess to many. What is more, with the Moore’s Law6 in operation, real investmentrequirements in new technology decline over time. Finally, in developing countries likeIndia that are late entrants, investments have not been tied up in old technologies andthese countries, therefore, take advantage of frontline technology and cost-effectiveinfrastructure (Planning Commission 2001). Thus, despite the efforts needed to attractnew investment in ICT infrastructure and to encourage ICT usage in ways appropriatein the developing country contexts, real opportunities exist for promoting ICT diffusionthrough the involvement of public and private sector organizations, NGOs and otherstakeholders (Mansell 1999).
There are also certain empirical problems in the studies presented above. Thecorrelation analysis outlined above, which uses cross-section data for differentcountries, essentially presents a static analysis, whereas the diffusion of technology is adynamic process, which has to be analysed in a dynamic perspective. Moreover, thetechnologies considered in the analysis vary in terms of their age. For example in theUS, Internet is a post-1994 phenomenon, whereas television was introduced more than50 years ago. Therefore, the present level of TV diffusion (844 sets per 1000inhabitants) has been achieved over a period of more than five decades, while thecurrent level of Internet diffusion (266 per 1000 inhabitants) has been reached in justover 8 years. Correlation analysis implicitly assumes that the different technologiesunder comparison essentially have the same characteristics. Literature shows that thediffusion of any technology is conditioned not only by the characteristics and strategiesadopted by diffusion agents (Brown 1981), but also by factors specific to technology.Thus viewed, the rate of IT diffusion is governed by diffusion agents such as Internetservice providers, government, non-governmental organizations and other stakeholders.While a detailed analysis which includes all these aspects is beyond the scope of thispaper, I shall present a preliminary analysis by looking at the rate of diffusion ratherthan the level of diffusion.
Table 1Correlations in use of the new and old media
Online Hosts PCs Radio TVs Newspapers PhonesMobilephones
Hosts 0.854
PCs 0.806 0.745
Radio 0.788 0.708 0.818
TVs 0.692 0.614 0.769 0.848
Newspapers 0.725 0.715 0.788 0.749 0.734
Phones 0.791 0.710 0.886 0.837 0.861 0.839
Mobile phones 0.809 0.827 0.845 0.754 0.715 0.830 0.872
Source: Norris (2001).
6 In the 1960s Intel’s founder, Gordon Moore, predicted that, for the foreseeable future, chip density,and hence the computing power, would double every eighteen months while cost would remainconstant.

5
Table 2Correlation coefficient between the rate of diffusion of different technologies:
Entire sample
Television Radio Internet PCs
Television 1
Radio 0.694 1
Internet 0.561 0.618 1
PCs 0.568 0.639 0.913 1
Table 3Correlation coefficient between the rate of diffusion of different technologies:
Developed countries
Television Radio Internet PCs
Television 1
Radio 0.787 1
Internet 0.689 0.698 1
PCs 0.711 0.763 0.872 1
Table 4Correlation coefficient between the rate of diffusion of different technologies:
Developing countries
Television Radio Internet PCs
Television 1
Radio 0.577 1
Internet 0.372 0.340 1
PCs 0.319 0.418 0.0672 1
I have made use of the cross-section data for different countries obtained from ITU andthe World Bank, and have focused on the rate of diffusion. In the absence of time-seriesdata, I have estimated a proxy measure of the rate of diffusion (present level of diffusiondivided by the number of years taken).7 The estimated correlation coefficients betweenthe rate of diffusion across different technologies for the entire sample, for developedcountries, and for less developed countries are presented in Tables 2, 3 and 4.
It is evident from Tables 2 and 3 that the value of the correlation coefficient based onthe rate of diffusion is much lower than the correlation coefficient between the levels ofdiffusion. More important, the value of the correlation coefficient declined substantiallyin the case of the developing countries. What does this finding signify? While I have notbeen able to fully comprehend the implications, some tentative inferences may be inorder.
7 A major problem with such a measure of the diffusion rate is the assumption that diffusion takes alinear path, whereas the diffusion of technologies generally takes the form of a logistic curve.

6
Unlike old technologies which are more demand-driven, new technology is moresupply-driven and leaves greater scope for the diffusion agents (non-governmentalorganizations, government, private sector and other actors) to influence the diffusionprocess. Hence, even with low connectivity, innovations like kiosks, cafes andcommunity centres focussing on Internet can greatly offset the limits imposed by lowerconnectivity and poor information infrastructure. There are a number of organizations inthe developing countries that are involved in one or more aspects of ICT developmentand use. The multi-institutional stakeholder networks, involving public and privatesector and private sector organizations, NGOs and other stakeholders as argued byMansell (1999) must be instrumental in the diffusion of ICTs in developing countries.
In the case of India, lately there have been a number of initiatives by the central andstate governments along with NGOs and private sector to help the diffusion of ICT todifferent economic sectors (see Appendix). Such initiatives have been unprecedentednot only in terms of scale but also with regard to new organizational innovations. Whilemost are in their initial stage, available evidence suggests that ICT could effectively beused to transform rural regions even in a developing country like India.
Using a desk-based research method, Miller and Mansell (1999) have also documenteda number of cases of ICT use in different business applications in micro and smallenterprises, education and library information services and environmental/geographicalinformation systems in India, Jamaica and South Africa. The cases illustrateapplications of ICT specifically intended for use either by users in disadvantagedcommunities or for use by intermediaries who are closely involved in networks of socialrelationships that enable their use of applications to provide benefits to users.
Until today, there has been no specific policy in India’s industrial sector to address theissue of IT diffusion. Nonetheless, available evidence suggests that a significantbeginning has been made. Computers for accounting and management are becomingwidespread, with office computers available in more than 34 per cent of the factories(see Table 5). With regard to Internet, some export-oriented industries (textiles, orknowledge-intensive industries such scientific instruments) are ahead of otherindustries. Evidence suggests that Indian firms, in the current era of globalization, areharnessing new technology in order to enhance their productivity and competitiveness.Thus, even though ICT for development is a lower priority, it is obvious that newtechnology is being diffused into different sectors of the economy. But what are thereturns to such investments? How to account for the inter-firm and inter-industryvariation in the levels of ICT usage? What are the constraints, and what policyinitiatives are called for in order to accelerate the diffusion process? These are some ofthe issues on which our understanding is rudimentary and further research is required inorder to make informed policy decisions.
Against this background, we now examine the processes and outcomes ofexport-oriented growth strategy for IT. Since the growth of IT sector, particularlysoftware, has been subjected to a number of detailed enquiries,8 I will highlight therealities of some of the myths, and analyse some of the implications of export-orientedIT growth.
8 For example, Heeks (1996); Kumar (2001a); Joseph and Harilal (2001); Aroraet al. (2002); Nath andHazra (2002).

7
Table 5Indicators of IT use in India’s industrial sector (1997)
Per cent of factories with:
Industries (2 digit level)Total no. of
factoriesComputersin the office Network Internet
Robots or computerin production
Food products 14,695 13.01 0.84 1.39 0.29
Other food products 8,109 24.17 1.38 2.01 1.64
Beverages tobacco, etc. 8,669 47.81 0.36 0.28 0.14
Cotton textiles 9,227 22.28 0.54 1.87 1.37
Wool/silk manufacture of textiles 3,989 49.76 1.25 2.28 0.25
Jute & other vegetable fibre textiles 503 16.70 0.40 3.78 0.60
Textiles prod., incl. apparel 5,409 51.32 3.18 11.31 2.09
Wood and wood products 3,787 8.98 0.40 0.95 0.24
Paper and paper products 6,304 38.50 1.84 3.73 4.71
Leather products 1,742 37.60 1.89 7.18 0.29
Basic chemicals and related products 9,357 50.69 2.91 5.58 2.56
Rubber plastic and coal 7,597 42.57 2.80 4.01 1.59
Non-met. mineral products 11,376 13.37 0.41 0.95 1.09
Basic metal and alloys 6,915 41.94 0.93 3.69 1.72
Metal products 8,243 31.68 0.92 2.86 1.01
Machinery and equipment 8,203 44.46 2.12 5.63 2.66
Electric machinery and equipment 5,743 55.77 3.53 10.92 4.89
Transport equipment 3,999 46.96 1.63 7.15 2.58
Scientific equipment 2,243 48.02 4.01 14.00 3.97
Repair of capital goods 2,240 25.89 0.80 1.96 0.36
Electricity 3,644 64.71 0.93 3.10 3.24
Gas and steam 80 75.00 2.50 3.75 5.00
Water works and supply 293 10.58 0.68 1.02 0.68
Non conventional energy 4 25.00 25.00 25.00 0.00
Storage and warehousing 1,078 0.37 0.37 0.09 0.00
Sanitation 102 0.00 0.00 0.00 0.00
Motion pictures, etc 51 7.84 7.84 27.45 0.00
Laundry and others 94 0.00 0.00 0.00 0.00
Repair services 1,966 2.59 2.59 1.12 0.00
All industries 135,679 34.70 1.50 3.72 1.77
Source: Central Statistical Organization (Annual Survey of Industries) 1997.
3 The myth of benign state neglect
The central question that we address next is whether the international competitivenessand credibility, if any, that the ICT software and service firms have been able toestablish over the years have been facilitated by the benign neglect or by proactiveintervention of the state. This issue assumes importance because it has been argued that

8
India’s commendable performance in IT exports was the handiwork of the prophet ofmarket. To appreciate the role of the state, one has to place India’s IT achievementsagainst the backdrop of the national system of innovation (NSI) that evolved over thelast fifty years. NSI refers to the national network of public and private institutions andpolicy initiatives for the development and diffusion of various technologies (Freeman1987; Nelson 1993; Lundvall 1992). NSI in India has been instrumental in the creationof an extensive infrastructure base for the development of innovative and skill intensiveactivities like ICT. This includes,interalia, one of the largest and expanding mass oftechnically trained manpower, a network of centres of international reputation inspecific sciences such as Indian Institute of Science, Indian Institute of Technologies(IITs) and national laboratories, as well as a number of software technology parks tofacilitate the export of ICT software and services. Next is a brief account of the variousstate initiatives for the development of ICT and software sector in India.
3.1 Policy measures
Contrary to general perception, the importance of promoting software development,particularly for export, had been recognized by the erstwhile Department of Electronics(DoE). Suitable policies and programmes were put in place as far back as 1972(Parthasarathi and Joseph 2002). During a period when very high tariff and non-tariffbarriers were the rule, the import of computer systems on a duty-free basis and withoutindigenous clearance was permitted for firms dealing in software exports. Furthermore,in spite of restrictions on FDI, totally foreign-owned companies were permitted to set upsoftware export operations, provided that they locate in the Santacruz electronics exportprocessing zone (Government of India 1972). Later in January 1982, a software exportpromotion policy was initiated by the Department of Electronics (Government of India1982).
The Computer Policy of 1984 gave further thrust to software development byunderlining the need for institutional and policy support on a number of fronts. Thepolicy, for example, called for the setting-up of a separate software developmentpromotion agency (SDPA) under the Department of Electronics. The import of inputsneeded for software development was made more liberal. However, the policy alsoemphasized that
Effective software export promotion on a sustained basis can be effectivein the long run only if it is planned as part of an overall softwarepromotion scheme covering both export and internal requirementsincluding import substitution. Also planning for software development isintegrally connected with the plan for hardware development and systemengineering (Government of India 1985).
After 1984, however, the accelerated growth of the computer industry posed numerousproblems for the software industry, calling for a rationalization of the policies on theimports and development of software in the country, and using the domestic base forpromoting software exports. At the same time, world trade in computers was expectedto reach US$100 billion by 1990, more than half of which was estimated to be insoftware. India’s software export projections were based on a target of US$300 million,which corresponded to about 0.6 per cent of the world’s software trade. Based on this, itwas felt that there was a need for more concrete policies for the promotion of software
9
development and export. Thus, in 1986 an explicit policy was announced, identifyingsoftware as one of the key sectors in India’s agenda for export promotion, andunderlining the importance of an integrated development of software for the domesticand export markets (Government of India 1986). The policy had the followingobjectives:
− To promote software exports to a take a quantum jump and capture a sizeable share ininternational software markets;
− To promote the integrated development of software in the country for domestic as wellas export markets;
− To simplify the existing procedures to enable the software industry to grow at a fasterpace;
− To establish a strong base for the software industry in the country;
− To promote the use of the computer as a decisionmaking tool; to increase workefficiency and to promote appropriate applications which are of developmentcatalysing nature with due regard to the long-term benefits of computerization to thecountry as a whole.
To achieve the objectives, the policy, emphasizing the need to simplify existingprocedures, provided various commercial incentives to the software firms. Theseincluded tax holidays, income tax exemption on software exports, export subsidies, andduty-free import of hardware and software for 100 per cent export purposes.
With the initiation of economic reforms in the early 1990s, an assessment was made bythe Finance Ministry. This highlighted the fact that, apart from the general orientation ofindustries towards export markets, India’s comparative advantage was in softwareinstead of hardware. Therefore, a major thrust was consciously given to softwareexports. Accordingly, new policy measures have been initiatedinteralia for the removalof entry barriers for foreign companies, lifting of restrictions on foreign technologytransfers, participation of the private sector in policymaking, provisions to financesoftware development through equity and venture capital, reforms for faster and cheaperdata communication facilities, and the reduction/rationalization of taxes, duties andtariffs, etc. (Narayanamurthy 2000).9
Along with policy reforms by the national government, various state governments (18as of today) have enacted IT policies to promote ICT growth in the respective states.These generally focus on the key issues of infrastructure, electronic governance, ITeducation, and an environment for increasing IT proliferation.10
9 Mention needs to be made of the substantial reduction in duties and tariffs across the board forcomponents and sub-assemblies, zero duty for software imports and zero income tax on profits fromsoftware exports.
10 A detailed comparative analysis of the policies initiated by different state governments against thebackdrop of the national policies would be highly rewarding, but falls beyond the scope of this paperand is thus reserved for future work. For details of policies enacted by different state governments, thereader may visit the home page of Nasscom at www.Nasscom.org.

10
3.2 Institutional interventions
In addition, the government introduced certain institutional interventions. No less thanfour major national task forces have studied all aspects of IT in the last four years andmost of their recommendations have been acted on. More significantly, chief executivesof leading private IT companies have been fully involved in these task forces. A numberof government agencies involved in different aspects of IT were brought together intoan integrated Ministry of Information Technology. This was followed by an IT Act todeal with a wide variety of issues relating to the IT industry (Parthasarathi 2001).
One notable improvement has been the establishment of software technology parks11
(STP) to provide the necessary infrastructure for software export. Among the first werethe parks at Bangalore, Pune and Bhubaneshwar, which were set up in August, Octoberand December 1990, respectively. In 1991, four more STPs were started by the DoE atNoida, Gandhinagar, Trivandrum and Hyderabad.12 Today, there are 18 such parks indifferent parts of the country and they play a significant role in software exports. Thetotal number of units registered with the STPs increased from 164 in 1991 to 5,582 in1999, accounting for about 68 per cent of India’s IT exports (see Table 6). The facilitiesavailable in these STPs include, among others, modern computers and communicationsnetwork which are beyond the reach of individual firms. The STPs also envisage atransparent policy environment and a package of concessions:
− Approvals given under the ‘single window clearance’ mechanism and permission of100 per cent foreign equity;
− The STP authorities issue approvals for projects costing Rs 30 million or less withno foreign equity participation;
− Units eligible for five-year tax holiday with no value addition norms;
− Duty-free imports while domestic purchases are eligible for benefit of deemedexports; and
− Subcontracting of software development activity by STP permitted and sales inDTA permissible up to 25 per cent of the export (Oberoi 1991).
11 A software technology park (STP) is similar in all respects to a free trade zone, but exclusively set up forsoftware. Specific objectives include:
− Establishing and managing infrastructural resources such as data communication facilities, corecomputer facilities, built-up space, common amenities, etc.
− Providing services (import certification, software valuation, project approvals, etc.) to users whoundertake software development for export purposes.
− Promoting the development and export of software and software services through technologyassessments, market analysis, marketing support, etc.
− Training professionals and encouraging design and development in software technology andengineering (Oberoi 1991).
12 In 1991 there was also a policy change with regard to the management of the STPs. The earlierautonomous societies for managing each park were dissolved and a new society, Software TechnologyPark of India registered in June 1991, was given responsibility of managing all the STPs in the countrythrough individual executives in each park. Under the new scheme, participating companies have theadvantage of being fully involved in all decisionmaking processes, including fixing of rent, selection ofhardware, etc. Each company is represented on the executive board which manages the park under theoverall supervision of a governing council.

11
In June 2000, a new STP, consisting of a business support centre and an India infotechcentre, was set up in Silicon Valley to facilitate software exports by small and medium-sized Indian firms to US.13 The centre also fosters business relationships by providingaccess to American financial institutions, venture capital funds and specialized tradebodies to promote partnerships and strategic alliances between the US and Indian ICTsoftware and service companies.
Table 6Trend in IT export from units registered with software technology parks
YearNo. of units registered
with STPsTotal exports from India
($ million)Share of STP units in
total exports
1991-92 164 164 na
1992-93 227 225 8
1993-94 269 330 12
1994-95 364 485 16
1995-96 521 734 29
1996-97 667 1,085 46
1997-98 844 1,750 54
1998-99 1,196 2,650 58
1999-00 5,582 3,900 68
3.3 Measures to address manpower bottleneck
While policy measures and the setting-up of the STPs have led to a substantial increasein the investment in ICT exports (Venkitesh 1995), the supply of technical manpowerappeared to be a major constraint (Schware 1987; Sen 1995). Software development is askill-intensive activity, albeit the intensity of skill requirements varies. Development ofsoftware involves broadly the following stages—requirement specification, prototyping,designing, coding, testing and maintenance. While the first few stages call for highlyskilled manpower, the skill requirement is relatively low in the later stages (Schware1987).
Traditionally, the main source of ICT and software professionals has been India’s publicsector educational institutes such as the IITs (Indian institutes of technology) ITIs,(industrial training institutes) and engineering colleges. In 1984, the SampathCommittee reviewed the training needs for electronics and software, and in 1985 astanding committee on computer education was set up to plan further action. By 1996new courses, introduced at about 400 institutions under the computer manpowerdevelopment programme supported by DoE, had produced some 15,000 softwarepersonnel (Heeks 1996). The DoE’s support has not been restricted only to financialgrants, but also involves curricula development. In addition to these courses, a numberof enterprises and other institutions promoted by DoE, have provided training insoftware development. These include NCST and C-DAC (offering advanced software
13 Economic Times(2000).

12
engineering courses) and CMC Ltd., ETTDC, and NIC (providing routine softwareapplication training).
Furthermore, the government has permitted private investment in IT training since theearly 1980s. By now 80 private companies operate over 4,000 privately-run trainingcentres nationwide that offer different types of courses through networks of franchises(Kumar 2001b). These offer diplomas ranging from short-term specialized courses tolonger-term basic courses. Given the uneven quality of training imparted by the privatesector, DoE began an accreditation scheme to standardize the courses. A scheme calledDOEACC was started in 1990 to provide accreditation to specified levels,14 and byJanuary 2000, a total of 699 institutes had been accredited. The DOEACC Societyconducts examinations for the four levels twice a year and awards certificates/diplomas(Kumar 2001b). These institutes primarily cater to the middle- and lower-levelmanpower needs of the IT industry. At the same time, seven Indian Institutes ofInformation Technologies (IIIT) were set up to provide academic training on par withthe IITs. Available estimates indicate that in 1999 there were over 1,832 educationalinstitutions, contributing more than 67,785 trained computer software professionals peryear (Nasscom 1999a). The structure of the current turnout of technical manpower fromthese institutes indicates that the three categories, viz., B-techs, diploma and the ITIcertificate holders, account for nearly 70 per cent of the total IT force; B-techs accountfor as much as 24 per cent, while the share of M-techs and PhD holders is only 3.14 and0.14 per cent, respectively.
Another notable intervention by the state was the provision of data communication andnetworking infrastructure to the educational and research community and to thesoftware industry. This was critical to the country’s IT development. The Education andResearch Network (ERNET) project was initiated in 1986 with the participation ofNCST Mumbai, IISc Bangalore, five IITs, and support of DoE and the UNDP with theobjective of enhancing the national capability in computer communications. ERNEThas evolved into a separate institution which now provides computer networkingservices to over 80,000 users in 750 academic and research institutions with itsdedicated satellite data transfer backbone (Kumar 2001b).
3.4 Measures to address software piracy
Until recently, India’s weak copyright regime has facilitated the proliferation ofsoftware piracy. This, in turn, has been a disincentive for firms to develop softwareproducts. The magnitude of the problem is illustrated by the Lotus DevelopmentCorporation, who estimate that out of 150,000 copies of Lotus 1-2-3 in India in the early1990s, 140,000 were pirated (Schware 1992). To address the problem, the governmentinitiated a series of measures, including the protection of the computer softwarecopyright under the Indian Copyright Act of 1957. Major changes were made to the lawin 1994, making it a punishable act to make or distribute copies of copyrighted software,with a minimum jail term of 7 days extendable up to 3 years, or a fine ranging fromRs 0.05 million to Rs 0.2 million. In addition, the government, in cooperation with theNational Association of Software and Service Companies (Nasscom) conducts regularantipiracy raids to discourage software piracy. As a result, the piracy rate has droppedfrom 89 per cent in 1993 to 60 per cent 1997 (Nasscom 1999a).
14 These include the O-basic course, A-advanced diploma, B-MCA level, and C-m.tech level.

13
It may be myopic to attribute the IT dynamism entirely to state initiatives. Other factorswere also involved, including, but not limited to, the availability of a highly-skilled Englishspeaking labour force at a wage rate much lower than in the developed countries; the timedifference between India and the US, still a major export market. On the demand side, theworld market for IT has been increasing at a much faster rate during the past decadebecause of the Y2K problem, and so on. While state initiatives laid the foundation forfaster growth, the industry associations,15 particularly the Nasscom, have played animportant role. In addition to lobbying at central and state government levels, the Nasscomwas also heavily involved in projecting India’s image in the global IT market. Forexample, in 1993 Nasscom appointed a full-time firm in Washington to lobby for theparticipation of Indian firms in large international IT exhibitions and to promote India’scapabilities in the sphere of IT. Nasscom’s influence in getting the visa rules relaxed by thedeveloped countries, especially USA, is well known. Also, in 1994 Nasscom initiated theantipiracy measures in India, when Intellectual Property Rights (IPR) became a major issuein the Indo-US relations. To take up the campaign against software piracy, it conducted anumber of well-publicized raids.16
From the foregoing, it is obvious that the international competitiveness and credibility, ifany, achieved by India’s IT sector over the last decade has to be viewed in the context ofthe national system of innovation, where the state played a key role. The form and contentof state intervention, however, has changed since 1991-92, when the state began tofacilitate private sector initiatives, while simultaneously reducing its own directparticipatory role. Moreover, the focus of the state has been mainly on the promotion of theICT software and service sector for foreign exchange earning purposes rather thanforeign exchange saving purposes, as in the 1980s. But what seemingly was overlooked inthe obsessively export-oriented strategy is a concerted effort to diffuse IT into differentsectors of the economy so as to reap the benefits of this powerful technology for improvedefficiency, productivity, competitiveness and growth.
4 The myth of liberalism induced export growth
Most of the studies on the Indian ICT sector have characterized its dynamism as aphenomenon of the last decade, whereas its software exports doubled in every threeyears even during the 1980s (Joseph 1997). If the analysis is limited to the last decade,studies have attributed the growth of the sector to the liberalization policies adopted bythe state in the early 1990s. Next, by making use of export data for 1980-99, we attemptto determine if the export growth acceleration is a post-liberalization phenomenon. Inthis exercise we make use of the Nasscom data on IT exports, which have been usedboth by the task forces and other researchers.
15 Initially there was the Computer Society of India, essentially an association of academics andprofessionals, which did not address many of the issues faced by the industry. Hence a newassociation known as the Manufacturers Association of Information Technology (MAIT), consistingof both hardware and software firms, was formed in 1982. Later an association, currently known asNasscom, was formed to address specific issues being faced by the software and service companies.
16 For a detailed account of Nasscom activities in promoting IT and the role played by the late MrDewang Metha, seeBusiness India(19 February to 4 March 2001).
14
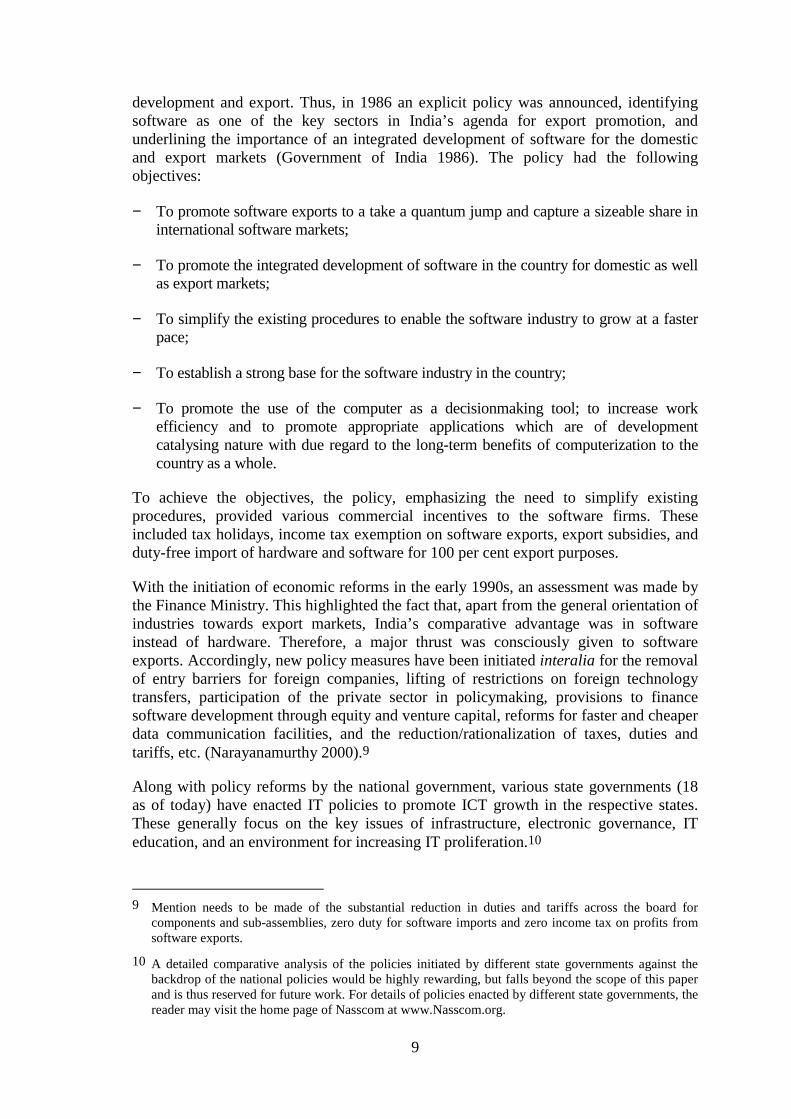
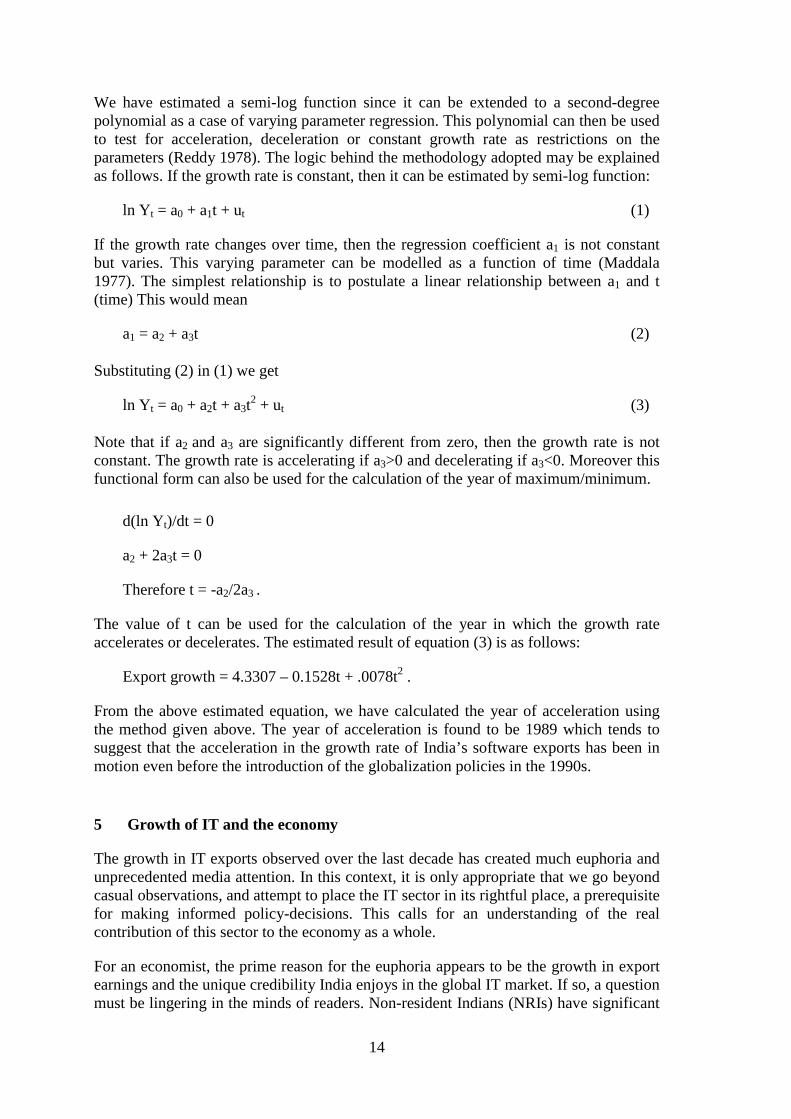
We have estimated a semi-log function since it can be extended to a second-degreepolynomial as a case of varying parameter regression. This polynomial can then be usedto test for acceleration, deceleration or constant growth rate as restrictions on theparameters (Reddy 1978). The logic behind the methodology adopted may be explainedas follows. If the growth rate is constant, then it can be estimated by semi-log function:
ln Yt = a0 + a1t + ut (1)
If the growth rate changes over time, then the regression coefficient a1 is not constantbut varies. This varying parameter can be modelled as a function of time (Maddala1977). The simplest relationship is to postulate a linear relationship between a1 and t(time) This would mean
a1 = a2 + a3t (2)
Substituting (2) in (1) we get
ln Yt = a0 + a2t + a3t2 + ut (3)
Note that if a2 and a3 are significantly different from zero, then the growth rate is notconstant. The growth rate is accelerating if a3>0 and decelerating if a3<0. Moreover thisfunctional form can also be used for the calculation of the year of maximum/minimum.
d(ln Yt)/dt = 0
a2 + 2a3t = 0
Therefore t = -a2/2a3 .
The value of t can be used for the calculation of the year in which the growth rateaccelerates or decelerates. The estimated result of equation (3) is as follows:
Export growth = 4.3307 – 0.1528t + .0078t2 .
From the above estimated equation, we have calculated the year of acceleration usingthe method given above. The year of acceleration is found to be 1989 which tends tosuggest that the acceleration in the growth rate of India’s software exports has been inmotion even before the introduction of the globalization policies in the 1990s.
5 Growth of IT and the economy
The growth in IT exports observed over the last decade has created much euphoria andunprecedented media attention. In this context, it is only appropriate that we go beyondcasual observations, and attempt to place the IT sector in its rightful place, a prerequisitefor making informed policy-decisions. This calls for an understanding of the realcontribution of this sector to the economy as a whole.
For an economist, the prime reason for the euphoria appears to be the growth in exportearnings and the unique credibility India enjoys in the global IT market. If so, a questionmust be lingering in the minds of readers. Non-resident Indians (NRIs) have significant

15
credibility in countries like the US and they make remittances valued at least three timesthat of the software exports. Why, then, is there no similar excitement over the foreignexchange earned by the NRIs? Even though the software sector brings in foreignexchange, the state had already invested substantially in building up the human as wellas the physical capital that facilitated the IT export upswing. To this, one must add theseries of fiscal concessions provided by the state. Yet, India has workers in plantations,fisheries, leather goods, and diamond cutting plants, etc. who earn substantial foreignexchange without any significant investment by the state towards their skill formation.So why is there no hype about the foreign exchange earned by them? Perhaps theunderlying reasoning may be best summarized in economic terms, as ‘a dollar worth ofpotato chips is not equal to a dollar worth of micro chips’. Unlike the traditional sectors,the IT sector is known for its spillover benefits and linkages to the rest of the economy.
Whether the IT sector under the export-oriented growth strategy generates anyspillovers and linkages with the rest of the economy is an issue that needs separateinquiry. In the absence of serious research, no definite conclusion is warranted.Nonetheless, based on preliminary data, some propositions may be in order. The growthof the sector, mostly driven by the export market, remains an enclave in the economywith hardly any forward or backward linkages. This is because the Indian IT industry iscurrently locked to low-level design, coding and maintenance, where linkages to rest ofthe economy may be negligible (D’Costa 2001). In terms of location, even today almost90 per cent of the software development and export activity is confined to four majormetropolitans (Bangalore, Mumbai, Delhi and Chennai) and this tends to accentuaterather than mitigate regional disparities (see Table 7). Thus, as observed by Mansell(1999), the export-oriented IT growth strategies seem to have generated only a fewspillover benefits.
The macroeconomic implications of the IT export boom may be viewed in a moreprecise way from two angles—its implications on the product market and on the labourmarket. We have the ‘Dutch disease’ models in trade theory, which can be used as ananalytical tool to reflect on both of these implications in the short run. The centralargument of these models is that windfall booms of external income can causeproblems. They may result in an unexpected de-industrialization of the economy. Theliterature on Dutch disease and the ‘resource curse thesis’ underline such backwasheffects of a primary commodity boom (Corden 1984 and Van Wijnbergen 1984).17
The Dutch disease syndrome is explained in terms of two symptomatic effects of anexport upswing, namely, the ‘spending effect’ and the ‘resource movement effect’(Corden and Neary 1982; Fardmanesh 1991). Spending the extra income from an exportboom tends to increase prices of non-tradable goods vis-à-vis tradable goods, leading toan appreciation and erosion of the competitiveness of the tradable sector. The ‘spendingeffect’ refers to the contraction of non-booming tradable sectors, reflecting the realappreciation. The tendency for the prices of production factors and non-tradables toincrease adversely affect the non-booming tradable sectors exposed to external
17 ‘Dutch disease’ economics is so named after the experience of the Netherlands in the 1960s, when thecountry experienced a boom of natural gas discoveries. The more the Netherlands developed itsnatural gas production, the more depressed its manufacturers of traded goods became (Lindert 1986).Dutch disease models were later found to have general applicability in the context of oil exporters,and countries experiencing primary export upswings in general (Kamas 1986; Fardmanesh 1991; Usui1996).

16
competition. The expansion and increased profitability of the booming sector draws outthe mobile factor (labour) from the other sectors and hikes up its price. The resultingcontraction of the stagnating tradable sectors, caused by the heightened competition onproduction factors, is referred to as the ‘resource movement effect’. Analytically, thespending effect deals with implications on the product market whereas resourcemovement effect is associated with the factor market, or more specifically, the labourmarket. Here it may be noted that these two effects are neither mutually exclusive nordo they operate in isolation. Instead, each reinforces the other and the ultimate impactwill be a combined effect of both. Hence, our distinction between product market(spending effect) and factor market (resource movement effect) may be considered aspedagogical scaffolding.
Table 7Distribution of software sales and exports across major locations in India
Sales % Exports %
Location 1997 1998 1997 1998
Bangalore 33.9 27.9 30.3 29.7
Mumbai 24.3 24.7 27.5 24.0
Delhi/Noida 15.9 20.3 15.3 18.5
Chennai 14.8 16.8 15.5 17.3
Hyderabad 4.2 5.4 5.3 6.3
Calcutta 3.3 2.3 1.5 1.3
Others 3.6 2.6 4.6 2.9
Source: Estimated from Nasscom (1999b).
5.1 IT boom and the product market
Impacts on the product market operate essentially through price increases and theaccompanying real appreciation. Increased export earnings can lead to a rise in exchangereserves and money supply, causing domestic inflation, which in turn leads to realappreciation and makes domestic producers less competitive. The decline in industrialgrowth and exports since 1995 in an environment of increased IT export earnings andgrowing foreign exchange reserves have been attributed to support the theory of an ITexport induced Dutch disease in India (Mukherji 2000). To empirically gauge the veracityof this argument, we need to place IT exports in the context of the external sector of theeconomy.
Table 8 presents the breakdown of each major item contributing to the reduction incurrent account deficit and the increase in foreign exchange reserves. Some interestinginferences can be made. To begin with, given the fact that trade deficit almost doubledduring the period under consideration, commodity trade had no positive impact on thereduction observed in the current account deficit. The major contribution, notwithstandingthe yawning trade gap, was made by the invisibles, where net private transfers recordedan almost six-fold increase during the period under consideration (see Table 8). Anotheritem that has had a positive impact on the invisibles is miscellaneous services, an itemwhich includes IT exports. It may be noted that in the final year the net export earningsfrom miscellaneous services are much less than total IT exports, which is only one of theitems in this category. This takes us to a close look at the net export earnings from IT.

17
Table 8IT exports and India’s external balance
1990-91 1999-2000
(million US dollars)
Trade balance -9,438 -17,098
Invisible (net) -242 12,935
Of which:Private transfersMiscellaneous services
2,069161
12,2563,198
IT exports 128 3,900
Current account deficit -9,680 -4,163
Total capital account 7,056 10,242
Overall balance -2,492 6,402
Foreign exchange reserves 5,384 38,036
Notes: All items except IT exports are given as net. IT exports are from Nasscom (1999b)
Source: Reserve Bank of India (RBI Bulletin, different issues).
Table 9Trend in export import and import export ratio for a sample of software firms
Year Total exports Total imports Import export ratio
1992-93 (20) 124.34 75.18 0.60
1993-94 (34) 253.28 146.31 0.58
1994-95 (59) 429.70 238.35 0.55
1995-96 (74) 667.27 412.25 0.62
1996-97 (87) 894.32 539.57 0.60
1997-98 (115) 1,840.45 960.70 0.52
1998-99 (155) 3,426.52 1,508.53 0.44
Notes: Total exports and imports given in Rs crores. Figures in brackets give the number of firms in thesample.
Source: Estimates based on PROWESS (Center for Monitoring Indian Economy 2000).
Despite the importance of IT, reliable data on IT trade (export and import) are difficultto obtain. There are three major data sources pertaining to the software trade: theMinistry of Information Technology, the Nasscom and the Reserve Bank of India (RBI).For reasons unknown, the first two sources remain silent about software imports. Butthe Reserve Bank of India, which has provided data on software exports since the fiscalyear 1997/8, reports that software imports totalled US$223 million, US$348 million andUS$468 million, respectively, for the financial years 1997, 1998 and 1999. This appearsnegligible. These figures, however, pose problems. First, the import of software neednot necessarily be by the software exporters. Second, there is substantial import ofhardware associated with software export, which cannot be isolated from the RBI data.Third, data by RBI may not include software embodied in imported capital goods.Viewed thus, the RBI data may be grossly underestimated and thus not reflect reality.For our purposes, therefore, the only alternative is to depend on import data provided bythe software firms at the firm-level.

18
We obtained the firm-level data from the computerized database of the Centre forMonitoring Indian Economy. Table 9 presents data on the import intensity of arepresentative set of firms. It is evident that total exports by the sample of firmsincreased from Rs 124 crores in 1992/3 to over Rs 3,400 crores in 1998/9. Thisrepresents an annual compound growth rate of over 73 per cent (in rupee terms) and isin tune with the growth rates obtained from Nasscom’s export data for the sector as awhole. At the same time, imports similarly recorded an increase of 53.5 per cent,resulting in an import-export ratio of around 60 per cent until 1996-97. Despite thedecline in import intensity after 1996/7, it is too early to determine if this marks thebeginning of a negative trend. Nonetheless, even today, import intensity is as high is 44per cent, a fact barely noted by existing studies. If the data in Table 9 are an indication,one could safely conclude that despite the recent decline in import intensity, the netearnings from India’s software exports constitute no more than 55 per cent of grossexports.
If net earnings from software exports account for only 55 per cent, then the cumulativecontribution of IT to foreign exchange reserves can only be in the magnitude ofUS$6.3 billion from 1990/1 to 1999/2000, or 16 per cent of total reserves. It also needsto be noted that the export estimates used above are based on Nasscom data which canbe substantially overestimated (Parthasarathi and Joseph 2002).18 If this overestimationis taken into account, net IT contribution to the external sector drops to about US$4.5billion for the last decade. Based on the evidence presented so far, it is possible that thecountry’s net IT export earnings will grow to a level which will induce, through thespending effect, a major adverse impact on the growth and competitiveness of othersectors (product market). Next, we examine implications of the IT upsurge on othersectors of the economy through the resource movement effect.
5.2 IT boom and the factor (labour) market
First, it should be noted that IT is a highly labour-intensive activity. An examination ofthe share of labour (wages) in the gross value added for 155 IT firms in 1998/9 showsthat wages accounted for as much as 66 per cent. Unlike most other labour-intensiveindustries, the IT sector employs mostly skilled labour, albeit with a varying skill leveldepending on the nature of the firm’s activities. Available empirical evidence suggeststhat the IT export boom of the last decade has to be seen in the context of India’s labourcost advantage (see Table 10). Needless to add, the IT sector upswing has led toincreases both in the demand for labour and in the wage rate.19 The shortage of ITemployees has encouraged professionals with training in chemical engineering, civilengineering, mechanical engineering, etc. to migrate to the IT sector.
The implications of the increased IT labour demand and the rising wage levels on theone hand, and the subsequent transfer of professional from other sectors on the otherhand may be examined in terms of the resource movement effect.20 It should, however,
18 Based on data obtained from a sample of 155 firms, it has been shown that the extent ofoverestimation in exports during 1998-99 was some 33 per cent.
19 Available evidence suggests that in the 1990s wages and salaries of IT professionals have grown at arate of 30 to 35 per cent.
20 This section draws heavily from Joseph and Harilal (2001).

19
be remembered that the resource movement effect is limited to economic sectors thatcompete with IT for skilled manpower. For analytical purposes, the sectors requiringtechnical manpower are divided into two broad groups: (i) those engaged in theproduction of services and (ii) those engaged in the production of goods (such ashardware, communication, control instrumentation, etc). The service sector, in turn, isfurther subdivided into: (i) the software sector,21 and (ii) other service-producingsectors (research, teaching, training, etc).
In terms of the labour movement effect, the boom in the software export sector,interalia reflecting the exogenous increase in global demand, produces an additionaldemand for labour in that sector. This raises the wage rate, and naturally higher softwaresector wages attract labour (which is mobile) from other manpower-competing sectors.Thus, salaries for technical professionals increase. As other economic sectors are notexperiencing an upswing, they adjust to the new circumstances (in the short run) byreducing the number of employees, thus reducing output. On the other hand,employment in the software sector (and hence output) increases. The observed rise inwage rate is unlikely to have any adverse impact on the software-exporting firmsbecause wage rates globally are still higher than locally. The wage difference, therefore,continues to give the software exporting firms a competitive advantage.22
Our argument that there could be a reduction in the employment and output of otherservice sectors competing for the skilled manpower could be better appreciated ifviewed in the context of the recent finding made by the task force on human resourcedevelopment in IT, which reported a deficit of about 10,000 teachers in softwaretraining.23 How to account for such a shortage? Given the fact that technical manpowerfor software development and software training is substitutable, and that labour ismobile, there seems to be a preference for employment in the software industry ascompared to software training which is less rewarding at present.
The resource movement effect could also lead to reduced employment and output in thegoods-producing sector which includes hardware, communications, etc. According toNasscom, production of hardware and peripherals together recorded an annualcompound growth rate (in dollar terms) of 10.5 per cent during 1994-95 to 1998-99, lessthan one-fourth of the growth rate for IT exports. Here again, an overestimation in theNasscom data may be possible. To substantiate further, in 1994, according to theerstwhile Department of Electronics, total production of data processing systems(including peripherals) amounted to only Rs 13,000 million (Government of India1996), whereas according to Nasscom (1999b) the corresponding figure in 1994-95 wasRs 28,570 million. This implies an overestimation of more than 100 per cent.
21 It is possible to divide software into those meant for export and domestic market, and the same modelmay be employed to explore the plausible implications of software export on the production ofsoftware for domestic market. Such an attempt is made in Joseph (1996).
22 The prediction of general rise in wage rates may not be robust if the labour market is segmented (assumedso here). The reality is likely to be that firms in sectors competing for skilled labour would be left with thechoice that (i) they either pay salaries on par with the software firms, or (ii) by paying lower wages, besatisfied with second best workers. While this is an empirical question, one could safely infer that eitherstrategies could have adverse effects on firms operating in high-skilled sectors.
23 SeeEconomic Times(2001).

20
Table 10IT labour costs across different countries in 1995
Sw
itzer
land
US
A
Can
ada
UK
Irel
and
Gre
ece
Indi
a
(US$ per annum)
Project leader 74,000 54,000 39,000 39,000 43,000 24,000 23,000Business analyst 74,000 38,000 36,000 37,000 36,000 28,000 21,000Systems analyst 74,000 48,000 32,000 34,000 36,000 15,000 14,000Systems designer 67,000 55,000 36,000 34,000 31,000 15,000 11,000Development programmer 56,000 41,000 29,000 29,000 21,000 13,000 8,000Support programmer 56,000 37,000 26,000 25,000 21,000 15,000 8,000Network analyst/designer 67,000 49,000 32,000 31,000 26,000 15,000 14,000Quality assurance specialist 71,000 50,000 28,000 33,000 29,000 15,000 14,000Database data analyst 67,000 50,000 32,000 22,000 29,000 24,000 17,000Metrics/process specialist 74,000 48,000 29,000 31,000 na 15,000 17,000Documentation/training staff 59,000 36,000 26,000 21,000 na 15,000 8,000Test engineer 59,000 47,000 25,000 24,000 na 13,000 8,000
Note: Figures are averages for 1995. They are likely to rise circa 5-10 per cent per annum, with ratesbeing slightly higher in lower-income countries.
Source: Heeks (1996) adapted from Rubin et al. (1996).
The plausible adverse impact of resource movement on hardware production supportsthe observation made by the IT task force, which reported ‘a steady decline of the IThardware industry over the 7-8 years due to faulty and deficit policies, should beimmediately reversed into a growth path through the introduction by a set of policiesconducive to growth and international competitiveness’. Thus today we have an ITrevolution with a lagging hardware sector.24 The fate of communications equipment hasnot been much different, either. The task force, while attributing hardware’s negligiblegrowth entirely to faulty policies, seems to have failed to recognize the labour marketlinkage between the hardware and software sector.
From the discussion so far. the following tentative conclusion may be made. To beginwith, the net foreign exchange contribution of the IT sector has been much lower thanwhat has been often claimed in terms of gross exports. While the adverse impact onother sectors from the spending effect might have been limited, there is some merit inthe argument that IT boom might have had a dampening effect on the cost andcompetitiveness of other sectors through the resource movement effect. Again, thismight have been confined mostly to those sectors which compete with the IT sector forskilled manpower. Thus, while the IT has the potential of contributing towardsproductivity and growth, the short-term impact of the export-oriented growth strategy ofICT in India seems to have been in terms of a negative influence on sectors needingskilled manpower.
24 The poor performance of the hardware sector calls for a separate inquiry. Suffice to note here thatseeds of the stagnation in the 1990s were already sown in the 1980s itself. See Joseph (1987) fordetails.

21
6 Liberalism induced innovative performance
It has been argued in the literature that liberal economic policies associated with exportorientation facilitate technological advancement and hence faster growth of output(Fransman 1985). The positive correlation between export orientation and innovation isbased on the premise that the competitive pressure associated with exports inducesimprovements in product quality and reductions in cost. The opportunities to learn fromconsumers and other firms also are an inducement to innovation. Moreover, withexpanding markets, firms can benefit from the economies of scale and increaseddivision of labour. To this, one may also add the greater availability of foreign exchangefacilitating the import of necessary inputs needed for exports. While the literature in thisarea is enormous and still growing, Rodrik (1995) states that the analytical foundationsof most studies have been too ambiguous and the preferred method ranges from casualappeal to common sense. Yet, we are living in a world wherein export-oriented policieshave been religiously pursued as the panacea to most of the problems faced by thedeveloping world, even in the big emerging markets of India and China. In this context,the relevance of an empirical verification of this issue cannot be overemphasized.
As the first step in the empirical analysis, we have to address the issue of defininginnovative performance. It has been generally acknowledged in the literature that theprimary manifestation of innovative performance is improvement in productivity.Productivity can be defined either in terms of partial productivity (output per unit of anyof the inputs like labour or capital) or total factor productivity. In the present context,given the human capital-intensive nature of the process involved, we could measureinnovative performance in terms of labour productivity (output per unit of labouremployed). However, this measure is not without its own problems and there arelimitations for comparisons across time and across companies. First, a variation inlabour productivity across firms may be caused by differences in the quality of labour.Second, diverging labour productivity over time may be due to inflation or exchangerate fluctuations. Moreover, because of India’s excess labour demand in the softwareindustry, compensation levels have increased 20-30 per cent per annum during the post-1995 period. Thus, the estimated growth rate in labour productivity can exceed the ratefor improvements in efficiency. Therefore, following Kumar (2001a), it is possible toestimate productivity in terms of revenue per unit of wage bill. In the empiricalestimation that follows, we use these two alternate labour productivity measures.
The influence of export-oriented strategy is measured in terms of the followingvariables:
− Export intensity, measured as the proportion of output that is exported;
− Import intensity, measured in terms of the ratio of total imports to sales;
− Foreign collaboration dummy which takes the value one for firms having foreigncollaboration and zero for those with no foreign collaboration; and
− MNC dummy which takes the value one if foreign equity share is more than 10 percent and zero otherwise (this in tune with IMF classification).
As per neoliberal theories, all these variables are hypothesized to have a positive effecton innovative performance. In terms of the theoretical premises of the structure-

22
conduct-performance paradigm, innovative performance (labour productivity) ishowever, affected by a number of other factors that are specific to the firm, the industry,and the economy. Given the fact that we are dealing with a cross-section of firmsoperating in one specific industry, the industry-specific and economy-wide factors areassumed to be the same for all firms and are not included in our analysis. Next is a briefdescription of other firm-specific factors incorporated in the analysis.
Ever since the pioneering work by Galbraith (1952), the literature on the relationshipbetween firm size and innovation is growing, but without a consensus on the issue.25
The fact that there are inter-industry differences for innovative opportunities acrossdifferent industries also depends on the method used to gauge innovation. In the case ofconventional industries, firm size, as measured by the firm’s gross fixed assets, isgenerally hypothesized to have a positive influence on innovative performance, becauseof the possible economies of scale associated with these industries. Given the techno-economic characteristics of the new high-tech industries like ICT and software services,biotechnology, etc., it may be possible that size does not have a major bearing oninnovative performance. Hence we hypothesise that the relationship between innovativeperformance and size can be either negative or positive. To test for the existence of anynon-linear relationship, we have also included a square term in the estimated model.
The role of R&D in influencing innovative performance is obvious, and we haveincorporated R&D intensity (R&D as a proportion of sales) in the model. In askill-intensive industry like IT software and services, one can postulate a positiverelationship between innovative performance and the skill profile of the firms.However, the available dataset does not permit us to precisely define skill profile interms of academic qualifications and experience of the employees. Hypothesizing apositive relationship between innovative performance and skill intensity, we measurethe ratio of software employees to total employees as a proxy for skill intensity. Wehave also included the age of the firms to discern for the possible effect of accumulatedexperience. Finally, we have incorporated the ratio of selling cost to sales to highlightthe influence of sales efforts.
The influence of the different variables has been empirically verified using thefollowing regression equation:
Productivity = a0 + a1export Intensity + a2 import Intensity + a3colldum +a4mncdum +a5size + a6size2 a7 skill + a8sellingcost + a9 age + error term.
6.1 Results of the model
Table 11 presents the results of the two models. In the model I, the innovativeperformance is measured in terms of labour productivity and in model II, in terms ofrevenue per unit of wage bill. Model I has been estimated using the new dataset that wehave developed by merging the Nasscom and CMIE data set for two years, namely1997-98 and 1998-99, whereas the second model has been estimated by pooling theNasscom data for the period 1994-95 to 1998-99
25 For a recent survey of studies with focus on methodological issues, the interested reader may refer toCohen (1995)

23
To begin with, the analysis reveals that export intensity, the most important variable inthe model, has a negative and statistically significant sign in both of the models. Thistends to suggest that export orientation, if any, has a dampening effect on the innovativeperformance of the firms. Thus, the nature of export demand has not been conducive toenhancing innovative performance of the firms. This finding supports the observationsmade in earlier studies, which report that the comparative advantage of Indian firms isin the export of services such as customized software development, with only a wellknown proprietary-package products in the international market (Arora and Asundi1999). Here again, the emphasis of Indian firms is at the lower end of the value chain,focussing on low design, coding and maintenance aspects. (Kattuman and Iyer 2001).Thus the Indian ICT and software services sector competes primarily on the costadvantage factor, with very limited innovation capacity (Mahajan (2000). As a result,the revenue per employee in the ICT software and services industry is estimated in 1999to be only US$16,000, whereas comparable figures are almost ten times higher forIsrael (US$150,000) and more than four times (US$70,000) for Ireland (Aroraet al.2001) The empirical evidence, therefore, underscores the need for greater focus on thedomestic market to promote innovative performance of our ICT software and serviceindustry where opportunities for much higher revenue per employee exist, but are beingharvested by CMC contracts for railway passenger reservation systems and railwayfreight operation information systems (Parthasarathi and Joseph 2002).
Among the other variables incorporated to gauge the influence of export-orientedgrowth strategy, import intensity was found to have a statistically significant positivesign in the first model, whereas it was not significant in the second model. If the resultof the first model is any indication, we may conclude that firms with a better innovationrecord also have high import intensity. The coefficient of MNC dummy was found to benegative statistically significant in the second model, but not statistically significant inthe first model. This also points to the nature of activities undertaken by the foreignfirms. The coefficient of collaboration dummy, though positive, was not statisticallysignificant in any of the equations. Both these findings point to the fact that greaterforeign participation or technology import is not likely to have any significant bearingon the innovation performance of the ICT software and service firms in India.
Among the firm specific variables, size is found to be positive and statisticallysignificant in both equations. While the selling cost turned out to be significant in thefirst model, it was not significant in the second model. The statistically significantpositive sign of size underscores the scale factor in promoting innovative performance.The negative influence of selling costs has to be viewed against the current structure ofexports wherein software services, especially on-site services, dominate. Selling cost isrelevant only in the case of software products. It has been noted that in the case of highvalue-added software products, large multinational companies dominate the market andthey spend up to 60-65 per cent of the price component of packages on marketing anddistribution (Kumar 2001a).
The estimated model also shows that age does not have any significant influence oninnovative performance. It is surprising to note that the estimated coefficient for skill isnegative (though not statistically significant). This probably reflects that fact that thenature of data that we had was not sufficient to capture the skill profile in a precisemanner. Until such a detailed analysis is carried out, a robust conclusion is notwarranted. The coefficient of R&D intensity also turned out to be statistically not

24
significant. This has to be viewed against the fact that there are only a very few firmsengaged in R&D and even their R&D intensity is not very high.
Table 11Results of the regression models on innovative performance
Variables Model 1 Model 2
Export intensity -0.0374(-2.484)
-27.800(-2.434)
Import intensity 0. 0471(1.768)
-12.272(-0.760)
Collaboration dummy 0.0075(0.683)
-14.963(-1.300)
MNC dummy -0.0054(-0.477)
-17.986(-1.889)
Size 0.0209(3.225)
6.475(2.682)
Size2 -0.0005(-0.389)
0.512(0.717)
Skill intensity -0.0252(-1.112)
Selling costs -0.1359(-2.174)
-3.879(-0.235)
R&D intensity -0.0003(-0.002)
-0.909(-0.391)
Age 9.8006(0.809)
-0.007(-0.605)
Constant 0.0617(3.451)
29.958(5.701)
Number of observations 108 452
R2 0.39 0.50
F 6.28 2.36
Notes: Figures in brackets show t values. Coefficients given in bold are statistically significant at least at10 per cent level.
7 Concluding observations
While there is an increasing realization of the potential that IT offers for human welfare,IT induced productivity and growth are limited to the developed world. Even though theinternational digital divide is a reality, it is argued that there are certain specificcharacteristics of the new technology which leave scope for mitigating, if not totallybridging, the gap as long as appropriate policies are in place. This calls for a concertedaction by the different agents involved—the government and non-governmentalorganizations—and the private sector. While such multi-institutional stakeholdernetworks could be instrumental in harnessing the new technology for development (andattempts have been made by governmental and non-governmental organizations), thereis a paucity of efforts to assess their impact or to suggest measures for accelerating theprocess of IT diffusion. Available evidence suggests that in the current era of
25
globalization, firms in India’s manufacturing sector are also in the process of harnessingthe new technology for improving productivity and competitiveness. But what has beenthe return to these investments? How to account for the inter-firm and inter-industryvariation in the levels of ICT usage? What are the constraints and what policy initiativesare called for in order to hasten the diffusion process? These are some of the issues onwhich detailed research is required for informed policymaking.
The perils of the export-oriented IT growth strategy followed to date in India are evidentfrom the findings of a recent study by IMF (2001), which reports that IT-using countriestend to benefit somewhat more than IT-producing countries. The disappointing welfaregains for IT producers are attributed to a deterioration in the terms of trade. Based on apanel data for a sample of 41 countries over the years 1992-99, estimates have shownthat the increase in consumer surplus is quite large, already accounting for severalpercentage points in the GDP. Countries with largest consumer surplus gain (more than3.5 per cent of GDP) are the United States, United Kingdom, Singapore, Australia andNew Zealand.
India, in adopting to become a major producer by drawing on the strengths of thenational system of innovation that had evolved over the years, had to be among thelosers. Export-oriented growth strategy notwithstanding; the real contribution in termsof net export earnings has been much lower than gross exports. This was mainly causedby the nature of the export demand which in turn necessitated large-scale imports andthe dominance of onsite services. The study finds that while low net export earningsreduced the possibility of real appreciation, the IT-sector boom is likely to have hadadverse effect on other economic sectors needing skilled labour, at least in the short run,because of the resource movement effect. Thus, while an IT induced developmentstrategy could have been instrumental in enhancing efficiency, productivity and growth,the strategy of export-oriented IT growth seems to have had an adverse impact on othersectors.
We have also argued that the country’s export-oriented growth strategy had an adverseeffect on the innovative performance of firms. This perhaps points to the nature andcomposition of the export demand, wherein the tasks assigned to Indian firms by foreigncounterparts were did not encourage innovative efforts at all. This finding tends tounderscore the need to recognize the complementary role of the domestic market inpromoting innovation and exports on the one hand, and IT induced productivity andgrowth on the other. Hence, there is need for a policy which focuses on ICT fordevelopment. This, in turn, calls for comprehending the social marginal product of adollar worth of IT exports vis-à-vis its domestic consumption.
In this context, it is encouraging to note that the report by the taskforce on knowledgesociety (Planning Commission 2001) marks a major turnaround in our thinking towardsICT. It underlines the need for harnessing the new technologies (like IT, BioTechnology, space and materials technology) and management structures for thegeneration of wealth and employment on the one hand and societal transformation andknowledge protection on the other. The report, while exhaustive in its coverage,ambitious in its targets and futuristic in its perspective, appears to be ambiguous interms of the implementation strategy even to a modest critique. Hence, it is likely toremain as an esoteric report with limited impact, unless appropriate implementationstrategies are introduced by taking the different stakeholders into play. While a numberof issues addressed in the report fall under the jurisdiction of the state governments, the

26
apparent topdown approach appears contradictory to the basic tenants of an informationsociety. Instead of the taskforce identifying a few states as ‘success pilots’ and imposingthe articulated strategy, different states should have been encouraged to draw up theirown action plans against the broad contours set by the taskforce, but also by taking intoaccount the specificities of each state. Perhaps we are yet to realize that the ‘Delhi-centric’ approach has to give way to a more decentralized approach if we are toeffectively address any of the developmental issues, including ICT diffusion.

27
Appendix
A1 Bridging the digital divide: Selected experiments from Indian states26
Andhra Pradesh
The state of Andhra Pradesh, which includes 23 districts, 1,125mandals, 295 assemblyconstituencies and 28,245 revenue villages, has been digitized to a certain level. Theseare being connected a state Wide Area Network called APSWAN. With theestablishment of such a network, the state administration is geared up to tackle severalissues and help extend the reach of people and government alike. Further, over 70marketplaces across the state are computerized and networked to the AgriculturalMarket Yard department at the state government headquarters. This provides total on-line connectivity to monitor arrivals of the commodities, the prevailing prices etc. athead quarters as well as at the market yards. This enables the farmer to determine theprices at which to sell his produce or direct his produce to another market to fetch abetter price. The farmer also gets information about various services available at themarket yard such as tariffs for storage facility, weighing and handling charges, etc.The process thus eliminates the commission agents and exploitation of the farmer. Theinformation available in the network enables the government not only to monitorthe functioning of the markets, but also helps in formulating appropriate strategic plansfor the state. Since the system generates all the necessary reports online, it enables thegovernment agencies to improve efficiency of operations and extend better services tothe farmers. Therefore AP government is rightly giving priority to connectivity. TheKarnataka government has also undertaken a similar project.
Madhya Pradesh
The feasibility of universal access to information has been demonstrated by theGyandoot Doctom project in Madhya Pradesh. This experiment is carried outsuccessfully in Dhar district. A total of 21 centres in five blocks in Dhar district havebeen wired with locally made servers and multimedia kits for each centre in a costeffective way. The centres are located in thepanchayat gharand electricity costs areborne by thepanchayats. The person who manages the centre pays the cost of telephonelinks with the state wide Intranet and villagers are required to pay a nominal charge forobtaining government related services such as access to documents like land records,regular market updates and other useful information. This substantially reduces the roleof middlemen. Each centre caters to 15 grampanchayatsituated in 30 villages having apotential clientele of around half a million inhabitants in the Dhar district. The successof this unique experiment has shown that mass empowerment can only come throughsuch innovative experiments. The potential of such a project has been recognizedinternationally for introducing a new paradigm in the use of IT in bringing about socialtransformation.
26 Source: Planning Commission (2001).

28
Karnataka
Reliance, in collaboration with the government of the state of Karnataka, has decided toestablish 7,500mahiti centres (information kiosks) of which 745 centres would be usedfor maintaining a data base of land records and other documents, which could beaccessed for a nominal fee. It is estimated that around six million farmers will getbenefited. Another experiment worth mentioning is the initiative in floriculture industryat Tumkur. The industry regularly participates in the international bid for exporting tulipflowers to the Amsterdam and other European markets on a regular basis making fulluse of IT. The flowers are dispatched to the respective destinations at the right time.
Tamil Nadu
A comprehensive database of land records in various parts of the state has been created.A set of application software for use attaluk and district levels has been developed,tested, finalized and has been installed in 50 taluk offices. Further, two pilot projects arerunning in fourtaluksof the state for digitization of the cadastral maps as the first steptowards creating data base of digitized land maps. The state has also implementedapplication software for monitoring development projects at the block level and most ofthe district headquarters through video conferencing facility. The thrust of these projectsis to make the citizen interface with the government both pleasant and purposeful.
Uttar Pradesh
Kashika telecom has established in eastern UP low-cost e-maildhabasfinanced throughbank loans. Computer education programmes are also available through these Kiosks.These Kiosks also help local farmers regarding information about paddy prices and landrecords to a limited extent.
A2 Private sector initiatives
Zee Interactive Learning Systems project provides interactive learning throughblending, satellite, video, the internet multimedia and cable network. The project willhave several ZED points (kiosks) and it involves launching of an exclusive project foreducating rural children. The teaching will be interactive through the combined use ofTV and PC. The aim is to construct ‘knowledge building communities’ at an affordablecost even to rural population, where students and faculty around the globe cancollaborate.
Intel Corporation has taken the initiative to set up teacher training laboratories to train100,000 schoolteachers in India. The company also plans to participate on a jointproject with the department of Education to develop an effective program for computeraided learning in schools. It also envisages operating ‘cyber school on wheels’ projectespecially targeted towards educating rural masses.

29
References
Arora, A., and Jai Asundi (1999). ‘Quality Certification and Economics of ContractSoftware Development: A Study of Indian Software Industry’. NBER Working PaperNo. 7260. Cambridge, MA: National Bureau of Economic Research.
Arora, A., V. S. Arunachalam, J. Asundi, and F. Ronald (2000). ‘The Indian SoftwareServices Industry’.Research Policy, 30: 1267-87.
Brown, L. A. (1981).Innovation Diffusion: A New Perspective. London: Methuen.
Business India(2001). ‘Power Lobbying’. 19 February to 4 March.
Center for Monitoring the Indian Economy (CMIE) (2000). ‘PROWESS’: TheComputerized Database on India’s Corporate Sector. Mumbai: CMIE.
Cohen, W. (1995). ‘Empirical Studies of Innovative Activity’, in P. Stoneman (ed.),Handbook of the Economics of Technological Change. Cambridge: BlackwellPublishers.
Corden, W. M., and J. Peter Neary (1982). ‘Booming Sector and De-industrialisation ina Small Open Economy’.The Economic Journal, 92: 825-48.
Corden, W. M. (1984). ‘Booming Sector and Dutch Disease Economics: Survey andConsolidation’.Oxford Economic Papers, 35: 359-80.
D’Costa, A. (2001). ‘Export Growth and Path Dependence: The Locking in ofInnovations in the Software Industry’. New Delhi: University of PennsylvaniaInstitute for the Advanced Study of India. Mimeo.
Economic Times(2000). ‘STPI Now Opens Office at Silicon Valley, USA’. SpecialSupplement on Software Technology Parks of India. 11 June. New Delhi.
Economic Times(2001). ‘IT Panel Sees Manpower Crisis’. 16 January.
Fardmanesh, M. (1991). ‘Dutch Disease Economics and the Oil Syndrome: AnEmpirical Study’.World Development, 19 (6): 711-17.
Fransman, M. (1986).Technology and Economic Development. Brighton: WheatsheafBooks.
Freeman, C. (1987).Technology Policy and Economic Performance: Lessons from Japan.London: Pinter.
Galbraith, J. K. (1952).American Capitalism: The Concept of Countervailing Power.Boston: Houghton Mifflin.
Government of India (1972).Annual Report. New Delhi: Department of Electronics.
Government of India (1982).Annual ReportNew Delhi: Department of Electronics.
Government of India (1985). ‘New Computer Policy’.The Gazette of India.31 August: 679-81.
Government of India (1986). ‘Policy on Computer Software Exports, SoftwareDevelopment and Training’. New Delhi: Department of Electronics.

30
Government of India (1996).Guide to Electronics Industry in India.New Delhi:Department of Electronics
Government of India (1998). ‘Report of the IT Task Force’. Available at www.IT-taskforce.Nic.in .
Griliches, Z. (1995). ‘R&D and Productivity: Econometric Results and MeasurementIssues’, in P. Stoneman (ed.),Handbook of the Economics of Technological Change.Cambridge, MA: Blackwell Publishers.
Hargittai, E. (1999) ‘Weaving the Western Web: Explaining Differences in InternetConnectivity among OECD Countries’.Telecommunications Policy, 23 (10-11):701-18.
Heeks, R. (1996).India’s Software Industry: State Policy, Liberalization and IndustrialDevelopment. New Delhi: Sage Publications, and London: Thousand Oaks.
IMF (2001). World Economic Outlook: The Information Technology Revolution.Washington, DC: IMF.
Joseph, K. J (2001). ‘IT Boom, the Economy and Labour’.Labour and Development,7 (2): 1-36.
Joseph, K. J. (1996). ‘Software Development and Export in India: An Application of theSpecific factors Model’. Paper presented in the Eastern Economic AssociationMeeting, Boston.
Joseph, K. J. (1997).Industry Under Economic Liberalization The Case of IndianElectronics. New Delhi: Sage Publications, and London: Thousand Oaks.
Joseph, K. J., and K. N. Harilal (2001). ‘Structure and Growth of India’s IT Exports:Implications of an Export-Oriented Growth Strategy’.Economic and PoliticalWeekly, 36 (34): 3263-70.
Kamas, L. (1986) ‘Dutch Disease Economics and the Colombian Export Boom’.WorldDevelopment, 14 (9):1177-98.
Kattuman, P., and K. Iyer ( 2001). ‘Human Capital in the Move up the Value Chain:The Case of Software and Services Industry’. Cambridge: Department of AppliedEconomics, University of Cambridge. Mimeo.
Katz, J. (1984). ‘Domestic Technological Innovations and Dynamic ComparativeAdvantage’.Journal of Development Economics, 16 (1-2).
Kraemer, K. L., and J. Dedrick (2001). ‘Information Technology and EconomicDevelopment: Results and Policy Implications of Cross-Country Studies’, inM. Pohjola (ed.), Information Technology, Productivity and Economic Growth.Oxford: Oxford University Press.
Kumar, N. (2001a). ‘Indian Software Industry Development: International and NationalPerspective’.Economic and Political Weekly, 36.
Kumar, N. (2001b). ‘National Innovation System and Indian Software IndustryDevelopment’. Background paper for World Industrial Development Report. NewDelhi: Research and Information System for Non-Aligned Countries (RIS).
Lindert, P. (1986).International Economics. New Delhi: AITBS, 99-100.

31
Lundvall, B. A. (1992). National Systems of Innovation: Towards a Theory ofInnovation and Interactive Learning. London and New York: Pinter.
Maddala, G. S. (1977).Econometrics.New York: McGraw Hill Book Company.
Mahajan, R. (2000) ‘Moving India’s Software Industry up the International ValueChain: The Role of State in Creating the Institutional Capacity for Innovation’. Paperpresented in the Third Triple Helix International Conference, 26-29 April. Rio deJaneiro.
Mansell, R. (1999). ‘Global Access to Information Communication Technologies’.Johannesburg and Canada: International Development Center.
Miller, J., and R. Mansell (1999). ‘Software Applications and Poverty Reduction: AReview of Experience’. INK@SPRU, University of Sussex.
Mohnen, P. (2001). ‘International R&D Spillovers and Economic Growth’, inM. Pohjola (ed.), Information Technology, Productivity and Economic Growth.Oxford: Oxford University Press.
Mukherji, J. (2000). ‘Information Technology in India: Yet Another MissedOpportunity?’.Standard and Poor’s Credit Week, 12 July.
Narayanamurthy, N. R. (2000). ‘Making India a Significant IT Player in ThisMillennium’, in Romila Thapar (ed.),India: Another Millennium. New Delhi:Viking, and Penguin Books.
Nasscom (1999a).The Software Industry in India: A Strategic Review. New Delhi.Nasscom.
Nasscom (1999b).Directory of Indian Software and Service Companies. New Delhi:Nasscom.
Nath, P., and A. Hazra (2002). ‘Configuration of Indian Software Industry’Economicand Political Weekly, 37 (8).
Neary, J. P. (1978). Short Run Capital Specificity in the Pure Theory of InternationalTrade’.The Economic Journal, 88: 488-510
Neary. V. W., and S. Van Wijnbergen (1986).Natural Resources and the MacroEconomy.Cambridge: MIT Press.
Nelson, R. R. (ed.) (1993).National Innovation Systems: A Comparative Analysis.NewYork: Oxford University Press.
Norris, P. (2001).Digital Divide: Civic Engagement, Information Poverty and the InternetWorldwide. Cambridge: Cambridge University Press.
Oberoi, S. S. (1991). Software Technology Park: Concepts, Procedures and Status’.Electronics Information and Planning, 19 (3): 42-46.
OECD (2000).Information Technology Outlook. Paris: OECD.
Parthasarathi, A. (2001). ‘Tackling the Brain Drain from India’s Information andCommunication Technology Sector: Need for a New Industrial and S&T Strategy’.Paper presented in the ACU Conference of Executive Heads on Configurations inGlobalization, 22-26 April, Cyprus.

32
Parthasarathi, A., and K. J. Joseph (2002). ‘Limits to Innovation Set by Strong ExportOrientation: The Experience of India’s Information Communication TechnologySector’.Science, Technology and Society, 7 (1): 13-49.
Planning Commission (2001). ‘India Knowledge Super Power: Strategy forTransformation’. New Delhi: Planning Commission.
Pohjola, M. (1998) ‘Information Technology and Economic Development: AnIntroduction to the Research Issues’. WIDER Working Paper No. 153. Helsinki:UNU/WIDER.
Pohjola, M. (2001). ‘Information Technology and Economic Growth: A Cross-CountryAnalysis’, in M. Pohjola (ed.),Information Technology, Productivity and EconomicGrowth. Oxford: Oxford University Press.
Reddy, V. N. (1978). ‘Growth Rates’.Economic and Political Weekly, 13 (23): May 13.
Roah, S. (1987).America’s Technology Dilemma: A Profile of the InformationEconomy. New York: Morgan Stanley.
Roah, S. (1988).White-collar Productivity: A Glimmer of Hope?New York: MorganStanley.
Rodriguez, F., and E. Wilson (2000). ‘Are Poor Countries Losing the InformationRevolution?’ The World Bank Infodev. Available at: www.infodev/library/wilsonrodriguez.doc
Rodrik, D. (1995). ‘Trade and Industrial Policy Reform’, in J. Behrman and T. N.Srinivasan (eds),Handbook of Development Economics, Vol. IIIB. New York:Elsevier.
Romer, P. M. ( 1993). ‘Ideas Gaps and Objects Gaps in Economic Development’.Journalof Monitory Economics, 32: 543-73.
Rubin, H. A. et al. (1996).Worldwide Benchmark Project. Pound Ridge, NY: RubinSystems.
Schware, R. (1987). ‘Software Industry in the Third World: Policy Guide Lines,Institutional Options and Constraints’.World Development, 15 (10/11): 1249-67.
Schware, R. (1992). ‘Software Entry Strategies for Developing Countries’.WorldDevelopment, 20 (2): 143-64.
Sen, P. (1995). ‘Indian Software Exports: An Assessment’.Economic and PoliticalWeekly, 30 (7 & 8): 2053-58.
Strassman, P (1997). ‘Computers Are Yet to Make Companies More Productive’.Computerworld,15 September.
Thimothy, S. N. (1998). ‘Foreign Aid and Economic Performance in Tanzania’.WorldDevelopment, 26 (7): 1235-40.
UNDP (1999). Human Development Report 1999. New York for UNDP: OxfordUniversity Press.
Usui, N. (1996) ‘Policy Adjustment to the Oil Boom and their Evaluation: The DutchDisease in Indonesia’.World Development, 24 (5): 887-900.

33
Van Wijnbergen, S. (1984). ‘Inflation, Employment and the Dutch Disease in OilExporting Countries: A Short run Disequilibrium Analysis’.Quarterly Journal ofEconomics, 19 (2): 233-50.
Venkitesh, P. (1995). India’s Software Exports: A Study with Special Reference toTechnology Parks. Trivandrum: Center for Development Studies, JNU. M Phildissertation.
Wong, P. K. (2001). ‘The Contribution of Information Technology to the RapidEconomic Growth of Singapore’, in M. Pohjola (ed.),Information Technology,Productivity and Economic Growth. Oxford: Oxford University Press.
World Bank (1999).Knowledge for Development. World Development Report 1998/99,New York: Oxford University Press for the World Bank.
Related Documents