DISCRIMINATION REPORT ESTCP UXO DISCRIMINATION STUDY ESTCP PROJECT # MM-0437 Courtesy of Chris Gardner, Public Affairs Specialist, U.S. Army Engineering and Support Center, Huntsville SITE LOCATION: CAMP SIBERT, GADSDEN, AL DEMONSTRATOR: LAWRENCE BERKELEY NATIONAL LABORATORY ONE CYCLOTRON ROAD, MS: 90R1116 BERKELEY, CA 94720 p.o.c. Erika Gasperikova, [email protected], 510-486-4930 TECHNOLOGY TYPE/PLATFORM: BUD/CART DECEMBER 2007

Welcome message from author
This document is posted to help you gain knowledge. Please leave a comment to let me know what you think about it! Share it to your friends and learn new things together.
Transcript

DISCRIMINATION REPORT
ESTCP UXO DISCRIMINATION STUDY ESTCP PROJECT # MM-0437
Courtesy of Chris Gardner, Public Affairs Specialist, U.S. Army Engineering and Support Center, Huntsville
SITE LOCATION:
CAMP SIBERT, GADSDEN, AL
DEMONSTRATOR: LAWRENCE BERKELEY NATIONAL LABORATORY
ONE CYCLOTRON ROAD, MS: 90R1116 BERKELEY, CA 94720
p.o.c. Erika Gasperikova, [email protected], 510-486-4930
TECHNOLOGY TYPE/PLATFORM: BUD/CART
DECEMBER 2007

TABLE OF CONTENTS
1. INTRODUCTION ...................................................................................................................................................6 1.1 BACKGROUND .....................................................................................................................................................6 1.2 OBJECTIVE OF THE DEMONSTRATION ..................................................................................................................6
1.2.1 Objectives of the ESTCP UXO Discrimination Study .................................................................................6 1.2.2 Technical objectives of the Discrimination Study .......................................................................................7 1.3.2 Specific Objective of the Demonstration .....................................................................................................8
2. TECHNOLOGY DESCRIPTION.........................................................................................................................8 2.1 TECHNOLOGY DEVELOPMENT AND APPLICATION................................................................................................8 2.2 PREVIOUS TESTING OF THE TECHNOLOGY .........................................................................................................16 2.3 ADVANTAGES AND LIMITATIONS OF THE TECHNOLOGY ....................................................................................16
3. DEMONSTARTION DESIGN............................................................................................................................17 3.1 OPERATIONAL PARAMETERS FOR THE TECHNOLOGY.........................................................................................17 3.2 PERIOD OF OPERATION ......................................................................................................................................22
4. DATA ANALYSIS AND INTERPRETATION.................................................................................................24 4.1 UXO DISCRIMINATION USING TRAINING DATA ................................................................................................30
5. PERFORMANCE ASSESSMENT .....................................................................................................................38 6. COST ASSESSMENT..........................................................................................................................................43
6.1 COST ANALYSIS.................................................................................................................................................43 7. REFERENCES .....................................................................................................................................................43
2

LIST OF FIGURES
FIGURE 1. BERKELEY UXO DISCRIMINATOR (BUD) ...................................................................... 9 FIGURE 2. INVERSION RESULTS FOR THE PRINCIPAL POLARIZABILITIES, LOCATION AND
ORIENTATION OF 81 MM M821A1 PROJECTILE....................................................................... 11 FIGURE 3. INVERSION RESULTS FOR THE PRINCIPAL POLARIZABILITIES, LOCATION AND
ORIENTATION OF 105 MM M60 PROJECTILE............................................................................ 11 FIGURE 4. INVERSION RESULTS FOR THE PRINCIPAL POLARIZABILITIES, LOCATION AND
ORIENTATION OF 19X8 CM SCRAP METAL............................................................................... 12 FIGURE 5. 10% UNCERTAINTY IN LOCATION AS A FUNCTION OF OBJECT DIAMETER AND DEPTH OF
THE DETECTION FOR BUD WITH RECEIVERS 0.2 M ABOVE THE GROUND ................................ 13 FIGURE 6. 10% UNCERTAINTY IN LOCATION AS A FUNCTION OF OBJECT DIAMETER AND DEPTH OF
THE DISCRIMINATION FOR BUD WITH RECEIVERS 0.2 M ABOVE THE GROUND........................ 14 FIGURE 7. BUD DETECTION PLOT - A FIELD VALUE NORMALIZED BY A BACKGROUND VARIATION
FOR A 4.2” MORTAR AS A FUNCTION OF DEPTH FOR BUD RECEIVERS 0.2 M ABOVE THE GROUND. SOLID LINE INDICATES THE RESPONSE FOR A HORIZONTAL ORIENTATION OF THE 4.2” MORTAR (LEAST FAVORABLE). DASHED LINE INDICATES THE RESPONSE FOR A VERTICAL ORIENTATION OF THE 4.2” MORTAR (MOST FAVORABLE). ...................................................... 15
FIGURE 8A. PRINCIPAL POLARIZABILITY CURVES AS A FUNCTION OF TIME FOR AL SPHERE. ......... 18 FIGURE 8B. PRINCIPAL POLARIZABILITY CURVES AS A FUNCTION OF TIME FOR SHOTPUT #1......... 18 FIGURE 8C. PRINCIPAL POLARIZABILITY CURVES AS A FUNCTION OF TIME FOR SHOTPUT #2......... 19 FIGURE 8D. PRINCIPAL POLARIZABILITY CURVES AS A FUNCTION OF TIME FOR MORTAR #1. ........ 19 FIGURE 8E. PRINCIPAL POLARIZABILITY CURVES AS A FUNCTION OF TIME FOR MORTAR #2. ........ 20 FIGURE 9. BUD DATA COVERAGE MAP AT THE FORMER CAMP SIBERT, AL. COLORED AREAS HAVE
CONTINUOUS DATA COVERAGE, BLACK PLUSES INDICATE LOCATIONS OF CUED MEASUREMENTS, AND BLUE DOTS REPRESENT LOCATION OF TRAINING DATA SET FOR THE DISCRIMINATION. ................................................................................................................... 22
FIGURE 10. BUD GPO DETECTION MAP........................................................................................ 26 FIGURE 11. PHOTOS OF (A) 4.2” MORTAR, AND (B) A HALF-ROUND. .............................................. 26 FIGURE 12. PRINCIPAL POLARIZABILITY CURVES AS A FUNCTION OF TIME FOR 4.2” MORTAR. ...... 27 FIGURE 13. PRINCIPAL POLARIZABILITY CURVES AS A FUNCTION OF TIME FOR A HALF-ROUND. ... 27 FIGURE 14. BUD DETECTION MAP OF SE1 AREA........................................................................... 28 FIGURE 15. PRINCIPAL POLARIZABILITY CURVES AS A FUNCTION OF TIME FOR A SMALL SCRAP.... 29 FIGURE 16. PRINCIPAL POLARIZABILITY CURVES AS A FUNCTION OF TIME FOR A BASE PLATE....... 29 FIGURE 17: ROC CURVE FOR THE CUED TARGETS PRIORITY DIG LIST............................................. 39 FIGURE 18: ROC CURVE FOR SE1 AREA FOR THE FIRST PRIORITY DIG LIST.................................... 40 FIGURE 19: ROC CURVE FOR SE1 AREA FOR THE SECOND PRIORITY DIG LIST................................ 40 FIGURE 20: ESTIMATED ROC CURVE FOR CUED TARGETS PRIORITY DIG LIST. ............................... 42 FIGURE 21: ESTIMATED ROC CURVE FOR SE1 AREA TARGETS PRIORITY DIG LIST......................... 42
3

LIST OF TABLES
TABLE 1: CALIBRATION TARGETS ............................................................................................... 17 TABLE2. TOTAL TIME OF MAJOR DEMONSTRATION ACTIVITIES.................................................... 22
4

ACRONYMS
AEM Active Electromagnetic System BUD Berkeley UXO Discriminator DoD Department of Defense ESTCP Environmental Security Technology Certification Program FPGA Field Programmable Gate Array FUDS Formerly Used Defense Site GPO Geophysical Prove Out GPS Global Positioning System IDA Institute for Defense Analyses LBNL Lawrence Berkeley National Laboratory RTK Real Time Kinematic QA/QC Quality Assurance/Quality Control SERDP Strategic Environmental Research and Development Program UXO Unexploded Ordnance YPG Yuma Proving Ground
5

1. INTRODUCTION
1.1 Background
The FY06 Defense Appropriation contains funding for the “Development of Advanced,
Sophisticated, Discrimination Technologies for UXO Cleanup” in the Environmental Security
Technology Certification Program. In 2003, the Defense Science Board observed: “The …
problem is that instruments that can detect the buried UXOs also detect numerous scrap metal
objects and other artifacts, which leads to an enormous amount of expensive digging. Typically
100 holes may be dug before a real UXO is unearthed! The Task Force assessment is that much
of this wasteful digging can be eliminated by the use of more advanced technology instruments
that exploit modern digital processing and advanced multi-mode sensors to achieve an improved
level of discrimination of scrap from UXOs.”
Significant progress has been made in discrimination technology. To date, testing of these
approaches has been primarily limited to test sites with only limited application at live sites.
Acceptance of discrimination technologies requires demonstration of system capabilities at real
UXO sites under real world conditions. Any attempt to declare detected anomalies to be
harmless and requiring no further investigation require demonstration to regulators of not only
individual technologies, but of an entire decision making process. This discrimination study was
be the first phase in what is expected to be a continuing effort that will span several years.
1.2 Objective of the Demonstration
1.2.1 Objectives of the ESTCP UXO Discrimination Study
As outlined in the Environmental Security Technology Certification Program (ESTCP)
Unexploded Ordnance (UXO) Discrimination Study Demonstration Plan, the objectives of the
6

study were twofold. First, the study was designed to test and validate UXO detection and
discrimination capabilities of currently available and emerging technologies on real sites under
operational conditions. Second, the ESTCP Program Office and their demonstrators are
investigating, in cooperation with regulators and program managers, how UXO discrimination
technologies can be implemented in cleanup operations.
1.2.2 Technical objectives of the Discrimination Study
The study was designed to test and evaluate the capabilities of various UXO discrimination
systems each of which consists of a selected sensor hardware system, a survey mode, and a
software-based processing step. These advanced methods will be compared to existing practices
and will validate the pilot technologies for the following:
• Detection of UXOs
• Identification of features that can help distinguish scrap and other clutter from
UXO
• Reduction of false alarms (items that could be safely left in the ground that are
incorrectly classified as UXO) while maintaining acceptable Pd’s
• Quantification of the cost and time impact of advanced methods on the overall
cleanup process as compared to existing practices
Additionally, the study aims to understand the applicability and limitations of the selected
technologies in the context of project objectives, site characteristics, and suspected ordnance
contamination. Sources of uncertainty in the discrimination process will be identified and their
impact quantified to support decision making. This includes issues such as the impact of data
quality due to how the data are collected. The process for making the dig − no dig decision
process will be explored. Potential quality assurance/quality control (QA/QC) processes for
discrimination also will be explored. Finally, high-quality, well documented data will be
collected to support the next generation of signal processing research.
7

1.3.2 Specific Objective of the Demonstration
The demonstration objective was to determine the discrimination capabilities, cost and reliability
of the Berkeley UXO Discriminator (BUD). Lawrence Berkeley National Laboratory performed
a detection and discrimination survey of the SE1 area (~ 5 acres) of the Camp Sibert Formerly
Used Defense Site (FUDS) in Alabama. In addition, BUD was used in a cued mode to
interrogate 200 selected anomalies within Site 18 (SE1, SE2, and SW areas). The data were
collected in accordance with the overall study demonstration plan including system
characterization with the emplaced calibration items and targets in the Geophysical Prove Out
(GPO).
2. TECHNOLOGY DESCRIPTION
2.1 Technology Development and Application
The Environmental Security Technology Certification Program, ESTCP, has supported
Lawrence Berkeley National Laboratory (LBNL) in the development of the Berkeley UXO
Discriminator (BUD) that not only detects the object itself but also quantitatively determines its
size, shape, and orientation. Furthermore, BUD performs target characterization from a single
position of the sensor platform above a target. BUD was designed to detect UXO in the 20 mm
to 155 mm size range for depths between 0 and 1.5 m, and to characterize them in a depth range
from 0 to 1.1 m. The system incorporates three orthogonal transmitters, and eight pairs of
differenced receivers. The transmitter-receiver assembly together with the acquisition box, as
well as the battery power and global positioning system (GPS) receiver, is mounted on a small
cart to assure system mobility. System positioning is provided by state-of-the-art Real Time
Kinematic (RTK) GPS receiver. The survey data acquired by BUD is processed by software
developed by LBNL, which is efficient and simple, and can be operated by relatively untrained
personnel. BUD is shown in Figure 1.
8

Figure 1. Berkeley UXO Discriminator (BUD)
Eight receiver coils are placed horizontally along the two diagonals of the upper and lower
planes of the two horizontal transmitter loops. These receiver coil pairs are located on symmetry
lines through the center of the system and each pair sees identical fields during the on-time of
current pulses in the transmitter coils. They are wired in opposition to produce zero output
during the on–time of the pulses in three orthogonal transmitters. Moreover, this configuration
dramatically reduces noise in measurements by canceling background electromagnetic fields
(these fields are uniform over the scale of the receiver array and are consequently nulled by the
differencing operation), and by canceling noise contributed by the tilt of the receivers in the
Earth’s magnetic field, and greatly enhances receivers sensitivity to gradients of the target
response.
Data acquisition is performed on a single board. The transmitter coils are powered by circuits
which are separate from the data acquisition board. These pulsers provide resonant circuit
9

switching to create bi-polar half-sine pulses of 350 μs width. The current peaks at 18 A which
results in a resonant receiver circuit voltage of ~750 Volts. The operational overall half-sine
duty cycle is ~12%. The resonant frequency of the inductive load is ~90 kHz. Transients are
digitized with a sampling interval of 4 μs. The sensors are critically damped 6-inch 325 turn
loops with a self-resonant frequency of 25 kHz. The data acquisition board has 12 high-speed
ADC channels. Eight of these channels are used for the signal from receiver coils, and the
remaining four channels provide information about the system (i.e. tilt information, odometer).
It has been demonstrated that a satisfactory classification scheme is one that determines the
principal dipole polarizabilities of a target – a near intact UXO displays a single major
polarizability coincident with the long axis of the object and two equal transverse polarizabilities.
The induced moment of a target depends on the strength of the transmitted inducing field. The
moment normalized by the inducing field is the polarizability. This description of the inherent
polarizabilities of a target constitutes a major advance in discriminating UXO from irregular
scrap metal. Figures 2-4 illustrate a discrimination capability of the system for UXO objects
(Figures 2 and 3), and scrap metal (Figure 4). All three figures have estimated principal
polarizabilities as a function of time plotted on the left, values of true and estimated location and
orientation on the right, and object images at the bottom. While UXO objects have a single
major polarizability coincident with the long axis of the object and two equal transverse
polarizabilities (Figure 2-3), the scrap metal exhibits three distinct principal polarizabilities
(Figure 4). The locations and orientations are recovered within a few percent of true values for
all three objects.
These results clearly show that a multiple transmitter – multiple receiver system can resolve the
intrinsic polarizabilities of a target and that there are very clear distinctions between symmetric
intact UXO and irregular scrap metal.
10

Figure 2. Inversion results for the principal polarizabilities, location and orientation of 81 mm
M821A1 projectile
Figure 3. Inversion results for the principal polarizabilities, location and orientation of 105 mm
M60 projectile
11

Figure 4. Inversion results for the principal polarizabilities, location and orientation of 19x8 cm
scrap metal
The detection performance of the system is governed by a size-depth curve shown in Figure 5.
This curve was calculated for BUD assuming that the receiver plane is 0.2 m above the ground.
Figure 5 shows that, for example, BUD can detect an object with 0.1 m diameter down to the
depth of 0.9 m with depth uncertainty of 10%. Any objects buried at a depth of more than 1.3 m
will have a low probability of detection. The discrimination performance of the system is
governed by a size-depth curve shown in Figure 6. Again, this curve was calculated for BUD
assuming that the receiver plane is 0.2 m above the ground. Figure 6 shows that, for example,
BUD can discriminate an object with 0.1 m diameter down to the depth of 0.63 m with depth
uncertainty of 10%. Any objects buried at the depth more than 0.9 m will have a low probability
of discrimination.
Object orientation estimates and equivalent dipole polarizability estimates used for large and
shallow UXO/scrap discrimination are more problematic as they are affected by higher order
(non-dipole) terms induced in objects due to source field gradients along the length of the
objects. For example, a vertical 0.4 m object directly below the system needs to be about 0.90 m
deep for perturbations due to gradients along the length of the object to be of the order of 20 %
12

of the uniform field object response. Similarly, vertical objects 0.5 m, and 0.6 m long need to be
1.15 m, and 1.42 m, respectively, below the system. For horizontal objects the effect of
gradients across the objects' diameter are much smaller. For example, 155 mm and 105 mm
projectiles need to be only 0.30 m, and 0.19 m, respectively, below the system. A polarizability
index (in cm3), which is an average value of the product of time (in seconds) and polarizability
rate (in m3/s) over the 35 sample times logarithmically spaced from 153 to 1387 μs, and three
polarizabilities, can be calculated for any object. We used this polarizability index to decide
when the object is in a uniform source field. Objects with the polarizability index smaller than
600 cm3 and deeper than 1.8 m below BUD, or smaller than 200 cm3 and deeper than 1.35 m, or
smaller than 80 cm3 and deeper than 0.90 m, or smaller than 9 cm3 and deeper than 0.20 m below
BUD are sufficiently deep that the effects of vertical source field gradients should be less than
15%. All other objects are considered large and shallow objects.
Figure 5. 10% uncertainty in location as a function of object diameter and depth of the detection
for BUD with receivers 0.2 m above the ground
13

Figure 6. 10% uncertainty in location as a function of object diameter and depth of the
discrimination for BUD with receivers 0.2 m above the ground
To assure proper object identification and UXO/scrap discrimination, in the case of large and
shallow objects, we took measurements at five sites spaced 0.5 m along a line traversing the
object. Initially, object orientation was estimated from the response at the most distant of these
sites. Then, the site, for which the line from the object center to the BUD bottom receiver plane
center that was closest to being 90° to the orientation of the objects' interpreted axis of greatest
polarizability, was selected. The data from this site have the smallest source field gradients in
the direction of the estimated axis of greatest polarizability. The results of polarizability
inversion from this site was used for object classification.
At Camp Sibert the primary UXO targets expected were 4.2” (107 mm) mortars that are about
0.4 m long. The BUD detection threshold is based on the signal strength relative to levels of
background response variation observed at Yuma Proving Ground. Measured signal strengths
(field value) normalized by this background variation for a 4.2” mortar as a function of depth are
14

shown in Figure 7. The solid line indicates the response of a 4.2” mortar in a horizontal (least
favorable) orientation, and the dashed line indicated the response of a 4.2” mortar in a vertical
(most favorable) orientation. The detection threshold was set to 10, which is 50% of the value
that would be measured for the 4.2” mortar at the depth equal to 11 x diameter of the mortar.
Figure 7. BUD detection plot - a field value normalized by a background variation for a 4.2”
mortar as a function of depth for BUD receivers 0.2 m above the ground. Solid line indicates the
response for a horizontal orientation of the 4.2” mortar (least favorable). Dashed line indicates
the response for a vertical orientation of the 4.2” mortar (most favorable).
Since scrap from exploded 4.2" mortars is in general significantly smaller than these, and since
smaller objects of similar composition generally have smaller polarizability responses, a simple
criterion for scrap/UXO in this case is based on the magnitude of polarizability responses. For
the 4.2” mortar the polarizability index is larger than 300 cm3. Consequently, any polarizability
15
responses from Camp Sibert with a polarizability index greater than 150 cm3 were considered
conservatively as most likely due to a UXO or a large fragment thereof. In addition to this,
polarizability responses were matched to catalog responses as described in Chapter 4.
2.2 Previous Testing of the Technology
The performance of the BUD has been demonstrated at a local test site in California, as well as at
the Calibration and Blind Test Grids and the Open Field Range at the Yuma Proving Ground
(YPG), Arizona. The results have been presented at various meetings and published in scientific
journals.
2.3 Advantages and Limitations of the Technology
This is the first AEM system that can not only detect UXO but also discriminate it from non-
UXO/scrap and give its characteristics (location, size, polarizability). Moreover, the object can
be characterized from a single position of the sensor platform above the object. BUD was
designed to detect UXO in the 20 mm to 155 mm size range buried anywhere from the surface
down to 1.5 m depth. Any objects buried at the depth more than 1.5 m will have a low
probability of detection. In addition, BUD was designed to characterize UXO in the same size
range in depths between 0 and 1.1 m. Any objects buried at the depth more than 1.1 m will have
a low probability of discrimination. With existing algorithms in the system computer it is not
possible to recover the principal polarizabilities of large objects close to the system. Detection of
large shallow objects is assured, but at present discrimination is not. Post processing of the field
data is required for shape discrimination of large shallow targets. See Chapter 2.1 for details.
16

3. DEMONSTARTION DESIGN
3.1 Operational Parameters for the Technology
We shipped all the equipment and supplies to the test site using a container and a commercial
trucking company. Personnel flew and drove to the site in rented vehicles. Equipment was
stored in a support building provided by the host facility. The demonstration team consisted of 2
people, and a PI was there at the beginning of the survey.
Assembling the cart, connecting the batteries, checking the data acquisition system and verifying
the data records took about 30 minutes every morning. This was followed by about 30 minutes
system calibration along the calibration line established be the ESTCP office. This line was
measured every morning and evening. Responses of all calibration targets were consistent and
repeatable throughout the survey. The list of calibration targets is given in Table1.
TABLE 1: CALIBRATION TARGETS
Item Easting
(m) Northing
(m) Depth (cm)
Grid Orientation
(deg) Length
(m)
4" Al Sphere 578849.204 3752001.662 6 N/A N/A
Shotput #1 578846.064 3751994.346 10 N/A N/A
Shotput #2 578843.346 3751989.040 20 N/A N/A
4.2" Mortar #1 578839.851 3751981.456 35 293 0.469
4.2" Mortar #2 578836.607 3751975.109 57 302 0.394
The principal polarizability curves as a function of time for targets listed in Table 1 are shown in
Figures 8a-8e.
17

Figure 8a. Principal polarizability curves as a function of time for Al Sphere.
Figure 8b. Principal polarizability curves as a function of time for Shotput #1.
18

Figure 8c. Principal polarizability curves as a function of time for Shotput #2.
Figure 8d. Principal polarizability curves as a function of time for Mortar #1.
19

Figure 8e. Principal polarizability curves as a function of time for Mortar #2.
We demonstrated two modes of BUD operation – (1) simultaneous detection and
characterization/ discrimination, and (2) the cued mode. Mode (1) was used over a calibration
strip, the GPO, and 5 acres of SE1 area. The survey area was divided into hundred ~200-m long
lines in more less east-west direction. Line spacing in the orthogonal direction (north-south) was
1 m. We conducted the survey at a speed of 0.5 m/s. Five 200 m long string lines were laid out
at any point in time to help the operator with BUD navigation and to assure full area coverage.
BUD was pushed along the line at a constant speed in a search mode. Data were recorded and
stored continuously. In principle, any object within the 1 m x 1 m footprint of the horizontal
transmitter coil and 1.2 m in front of the system can be detected and characterized. The
detection threshold was set to 10, and it was based on the signal strength relative to levels of
background response variation observed at Yuma Proving Ground and the GPO area at Camp
Sibert. In the search mode the operator was alerted to the presence of a target every time the
signal level exceeded the detection threshold. The threshold value was recorded together will
data file name, and acquisition time, and BUD GPS location. If the target was inside of the BUD
footprint, the operator stopped and a full sequence of measurements was initiated. The three
discriminating polarizability responses were recorded and visually presented on the computer
20
screen. The depth and horizontal location with respect to the cart were recorded, together with
the GPS location of the reference point on the cart. Then the cart again moved at a constant
speed in search mode until next target was detected and the discrimination process was repeated.
This mode of operation has the advantage that target reacquisition is not necessary for
characterization. As described in Chapter 2.1, object orientation estimates and equivalent dipole
polarizability estimates used for large and shallow UXO/scrap discrimination are more
problematic as they are affected by higher order (non-dipole) terms induced in objects due to
source field gradients along the length of the objects. In the case when a large shallow object
was found, we collected five measurements spaced 0.5 m along a line traversing the object (i.e. if
the object location was at 0.0, measurements were taken at 1.0 m, 0.5 m, 0.0 m, -0.5 m, and -1.0
m) so that system got further away from the object, and hence minimized source gradients, at one
or more locations. The measurement that best satisfied the criteria described earlier was used for
the object characterization.
In addition, we performed a cued survey over 200 objects selected by the ESTCP Office. In this
case BUD was brought to marked locations and ran in the discrimination mode. The three
discriminating polarizability responses were recorded and visually presented on the computer
screen. The depth and horizontal location with respect to the cart was recorded, together with a
GPS location of the reference point on the cart. As described earlier, for large shallow objects
we collected five measurements spaced 0.5 m along a line traversing the object (i.e. if the object
location was at 0.0, measurements were taken at 1.0 m, 0.5 m, 0.0 m, -0.5 m, and -1.0 m). The
measurement that best satisfied the criteria described earlier was used for the object
characterization.
Figure 9 shows areas covered in this survey, as well as location of training data for the
discrimination. Colored areas have continuous data coverage, black pluses indicate locations of
cued measurements, and blue dots represent location of training data set for the discrimination.
21

Figure 9. BUD data coverage map at the Former Camp Sibert, AL. Colored areas have
continuous data coverage, black pluses indicate locations of cued measurements, and blue dots
represent location of training data set for the discrimination.
3.2 Period of Operation
The survey was performed between May 1, 2007 and May 22, 2007.
The time required for the major activities involved in the field demonstration are provided in
Table 2.
TABLE2. TOTAL TIME OF MAJOR DEMONSTRATION ACTIVITIES
Task Time Notes
Site Orientation, Safety
Briefing
3 hr
GPS Base Setup 8.5 hr 30 min/day
Field Checks & Calibrations 17 hr 1 hr/day system and
22

background calibration
GPO 3 days 1 acre
Detection and Discrimination
Survey
9 days 5 acres
Cued Survey 3 days 200 targets
Data Processing, Quality
Assurance &Archiving
18 days
Contingencies 3 days background response
variations, repeat
measurements, weather related
issues
Total Time 18 days
The following GPS coordinates were used for BUD positioning. For the GPO area, the north
part of the SE1 area, and SW area our base station was located at (Easting, Northing) = (578833,
3751629). For the south part of the SE1 area, and SE2 area the base station was located at
(Easting, Northing) = (578807, 3751707). These GPS locations were provided to us by the
ESTCP office.
Demobilization consisted of disassembly and removal of the system which took about 2 hours.
BUD and all materials and supplies were removed from the site and shipped in the container
back to Berkeley, California after the survey.
23

4. DATA ANALYSIS AND INTERPRETATION
The first step prior to data collection was a system calibration and a background level estimation.
We measured the background noise with the transmitters in the off-position and calculated the
spectrum for all channels. Then we turned the transmitters on and measured the background
field on all channels. This step was repeated at least twice to make sure the background field
was stable and could be used as the baseline measurement that was subtracted from the data.
The next step was to take data over calibration targets on the calibration line. While surveying
the GPO area we encountered significant variations in the background, possible due to presence
of magnetic soil, and we had to modify our algorithm to account for that. The SE1 area didn’t
suffer from these background variations.
Twelve channels of field data are recorded at a rate of 250 k-samples/second for each of three
transmitters. Field data were stacked together in a field programmable gate array (FPGA) and
transferred to a field computer (laptop) forming a primitive stack, labeled with header
information (instrument position, tilt and heading, odometer, time stamp, channels of transmitter
current, etc). An even number of primitive stacks was averaged together to form stacked data for
further processing.
The peak transmitter current was estimated from the stacked transmitter current channel record,
and the data were normalized by that value. Nominal transmitter shut-off time was estimated,
and induction responses were computed at 35 logarithmically spaced times between 153 and
1283 μs, averaged in half-sine windows with widths 10% of the center time after transmitter
pulse shut-off. Responses were differenced with background responses collected over a nearby
site determined to be relatively free of metallic objects by having a system response which varies
little with system translation. Error bars were computed for these based on the scatter in raw 4
μs samples at late time, and used to estimate uncertainties in field inversions of equivalent dipole
polarizability responses and object position. These uncertainties are overly optimistic, as a
greater source of noise is a variation in the system background response.
24

In post processing, the data were reprocessed, with the background response for each line of data
computed using a trimmed median response at each time and receiver, for each transmitter
response. The trimmed median used is the median of all points within 2 median absolute
deviations (MAD) of the (untrimmed) median response at each time, receiver, and transmitter.
As the background variation is a larger source of uncertainty than the previously mentioned noise
estimated from scatter in raw 4 μs, 1.48 times the MAD in individual line responses was used as
the estimated noise level in later processing. The resulting 24 channels of normalized responses
were then inverted for candidate object position and principal polarizabilities as a function of
time after transmitter shut-off. Data before 140 μs were ignored.
The first area we surveyed was the GPO area. The detection map is shown in Figure 10. The
color represents strength of the measured response normalized by the background variation
(same property as the y-axis value in Figure 7). The detection threshold was set to 10, therefore
red and yellow colors represent the background response, while green and blue colors indicate
locations of metallic objects. Pluses indicate locations of 4.2” mortars, while circles indicate
locations of half-rounds. The GPO area was seeded with these items in order to test capabilities
and limitations of selected technologies included in this demonstration. Hence, although BUD
detected additional metallic objects in the area they were not excavated and we have no ground
truth for them. A picture of a typical 4.2” mortar is shown in Figure 11a, while a picture of a
half-round is shown in Figure 11b. Principal polarizability curves as a function of time for both
objects are shown in Figure 12 and Figure 13, respectively. Figures 12 and 13 illustrate the
discrimination capability of principal polarizabilities between symmetric UXO, in this case the
4.2” mortar, and scrap, in this case the half-round. The 4.2” mortar has a single major
polarizability coincident with the long axis of the object and two equal transverse polarizabilities
(Figure 12); the half-round has three distinct principal polarizabilities (Figure 13). As mentioned
above this area had a highly variable background, especially at its north edge. This had an effect
on a signal level from deep 4.2” mortars, and in turn on our inversion results which made
25

identification of these mortars challenging. None of the anomalies that were not dug had
response either of the 4.2” mortar or the half-round; they were all considered scrap.
Figure 10. BUD GPO detection map.
(a) (b)
Figure 11. Photos of (a) 4.2” mortar, and (b) a half-round.
26
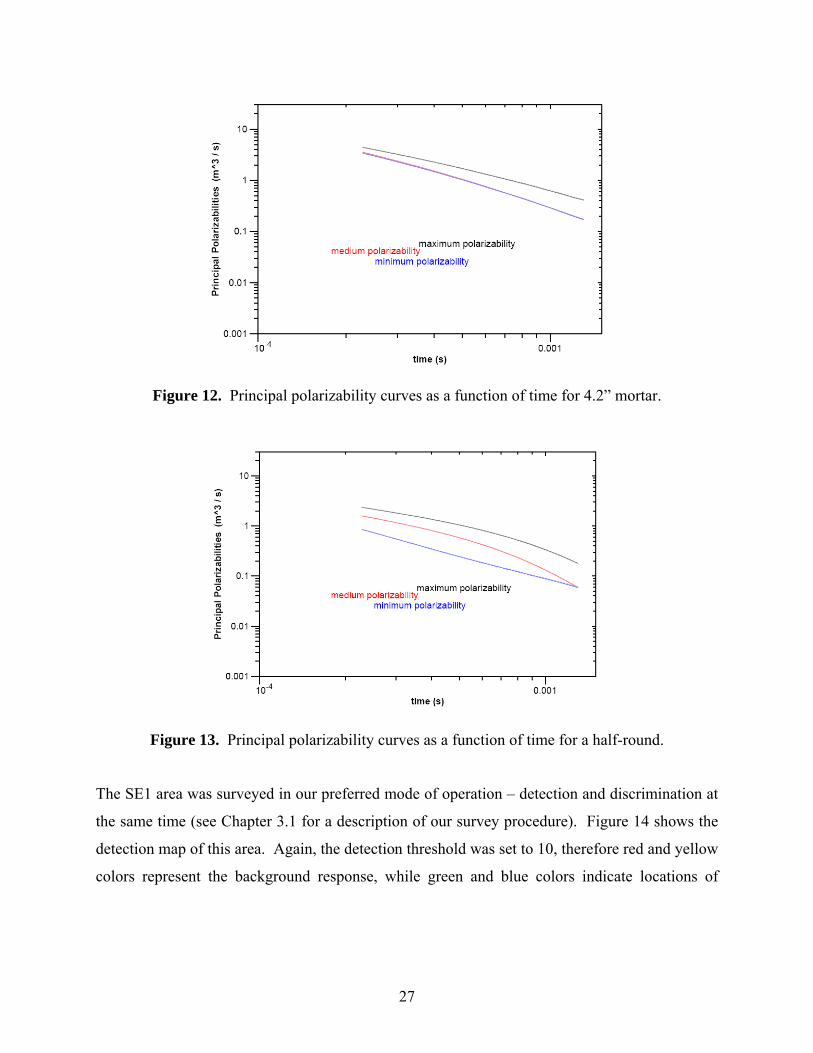
Figure 12. Principal polarizability curves as a function of time for 4.2” mortar.
Figure 13. Principal polarizability curves as a function of time for a half-round.
The SE1 area was surveyed in our preferred mode of operation – detection and discrimination at
the same time (see Chapter 3.1 for a description of our survey procedure). Figure 14 shows the
detection map of this area. Again, the detection threshold was set to 10, therefore red and yellow
colors represent the background response, while green and blue colors indicate locations of
27

metallic objects. The detection list contained every object with the response above the detection
threshold or polarizability index larger than 150 cm3. We identified 358 such locations.
Figure 14. BUD detection map of SE1 area.
In addition to the responses of 4.2” mortars and half-rounds shown in Figure 12 and 13, the area
contained a lot of scrap metal and some representative responses are shown in Figure 15 and 16.
All the objects have distinct polarizability signatures which allows for a clear discrimination
between 4.2” mortars and scrap.
28
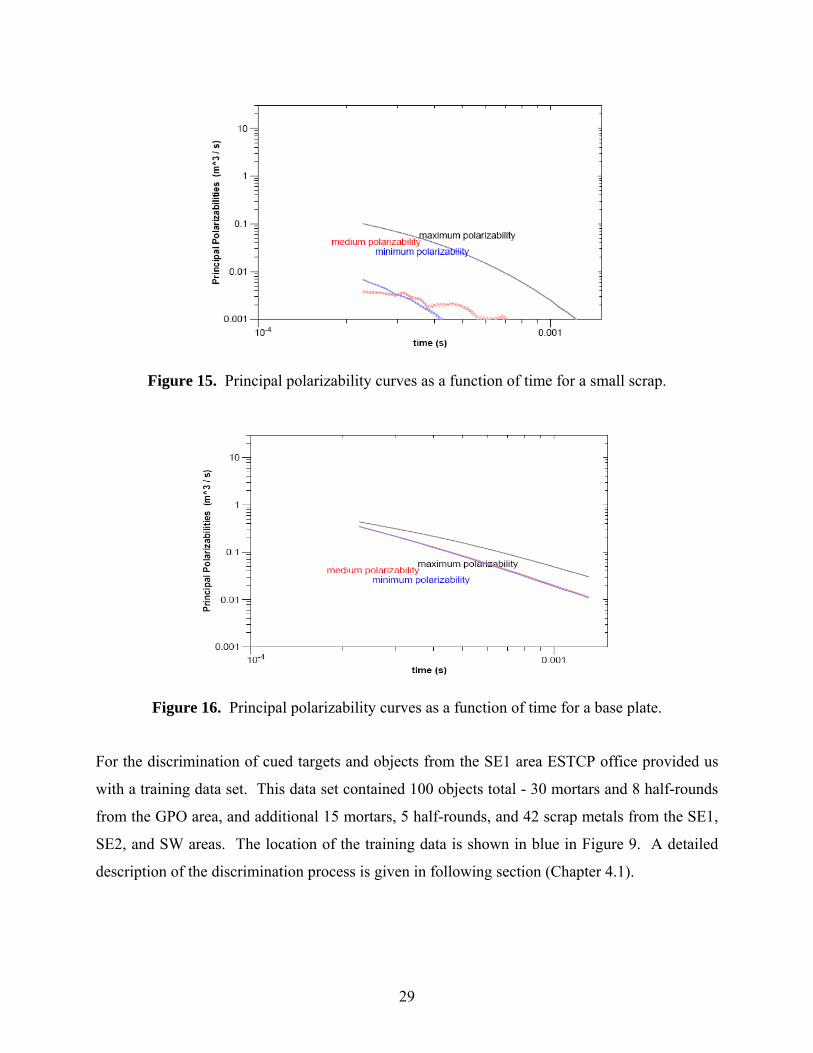
Figure 15. Principal polarizability curves as a function of time for a small scrap.
Figure 16. Principal polarizability curves as a function of time for a base plate.
For the discrimination of cued targets and objects from the SE1 area ESTCP office provided us
with a training data set. This data set contained 100 objects total - 30 mortars and 8 half-rounds
from the GPO area, and additional 15 mortars, 5 half-rounds, and 42 scrap metals from the SE1,
SE2, and SW areas. The location of the training data is shown in blue in Figure 9. A detailed
description of the discrimination process is given in following section (Chapter 4.1).
29

From 200 cued survey locations 27 objects were in the training data set, and 23 of them were
identified as multiple objects and therefore excluded from the set. We provided discrimination
results for remaining 150 objects in form of two priority dig lists. In the first one the ‘stop
digging’ point was when any object past this mark had a very little probability of being 4.2”
mortar. This list indicated that 90 objects can be left in the ground, and 60 objects have to be
dug. The second priority dig list had the ‘stop digging’ point at 90% probability of any object
being 4.2” mortar. In this list only 43 objects were identified as ‘need to dig’ while 107 could be
left safely in the ground.
The SE1 area discrimination set contained 266 objects. Again, we produced two priority dig
lists. The first one with the ‘stop digging’ point when any object past this mark had very little
probability of being 4.2” mortar, and the second one with the ‘stop digging’ point at 90%
probability of any object being 4.2” mortar. In the first priority dig list we indicated that 75
objects have to be dug, while 191 objects can be left in the ground. The second priority list
classified 63 objects as ‘need to dig’ and 203 objects as scrap.
4.1 UXO Discrimination Using Training Data
The release of object identities for a discrimination training data set allowed for exploration of a
more extensive feature set than the simple averaged product of polarizability and time initially
proposed. Training data consisted of a set of principal polarizability responses at 34
logarithmically spaced times centered from 153 μs to 1300 μs after transmitter shut-off, from
objects identified as UXO (mortars), large fragments of UXO (half-rounds, half-shells), scrap
(clutter), and cultural items (such as wrenches). Discrimination was made for two separate
problems: discriminating mortar and half-round responses from scrap responses, and
discriminating mortar responses from half-round and scrap responses. We treated the
mathematics of these two problems identically, and both were treated below as the general
problem of discriminating ‘mortar’ responses from ‘scrap’ responses. Since there was an
insufficient number of responses of cultural items found in area, we were not able to develop a
30

reasonable estimate of the distribution for their responses, so they were ignored; any cultural
item responses to be classified later will be classified ‘arbitrarily’ as ‘scrap’ or ‘mortars’.
The data time interval was sub-divided logarithmically into a number ndiv of sub-intervals (e.g.,
6). The product of each principal polarizability with its sample time was averaged over each of
these intervals. Since there are three principal polarizabilities, this results in nfeat = 3ndiv reduced
data, hence forth called ‘features’. The number of sub-divisions ndiv was chosen using cross
validation. In cross validation, an analysis method is applied to most of a training data set and
the results are used to predict something about the remaining (excluded) training data. This is
done many times, excluding a different set of training data each time, and a choice made, e.g.,
the value of ndiv, based on what gives the best predictions averaged over many times.
In our application, two thirds of the training data were randomly selected for direct use in
training, and one third was reserved for later calibration and is termed ‘reserved data’. Based on
the selected 2/3 of the training data, the probability that an observation is due to ‘scrap’ is
estimated from a ratio of empirical probability density estimates for feature values. Empirical
probability distributions are probability distribution estimates made based on observed data.
Empirical probability distributions will be constructed below.
Within the selected 2/3 of the training data (‘non-reserved’ data), additional responses were
randomly selected for exclusion in cross validation, and are termed ‘excluded data’. In this
work, a constant number of ‘mortar’ training data, and a constant number of ‘scrap’ training data
were excluded at a time, in roughly equal proportions. The number of excluded data was chosen
so that one response was withheld at a time from the smaller of the sets of non-reserved ‘mortar’
and ‘scrap’ training data. For example, in mortars vs. scrap (this includes half-rounds)
discrimination problem, we used 45 mortar training responses and 55 scrap responses. Two
thirds were used for training – 30 mortars and 37 scrap responses; one third - 15 mortars and 18
scrap responses were not used in training, but were reserved for later use. In cross validation one
31

mortar and one scrap were withheld from the training responses at a time. This was cycled
through 30 choices of excluded responses excluding each mortar and most scrap responses once.
We estimate empirical probability densities separately from ‘mortar’ and ‘scrap’ classes. In
constructing an empirical probability distribution for either ‘mortar’ or ‘scrap’ responses, it is
desirable to smear probability associated with any particular data point into a region centered
around it, as it is extremely unlikely that another data point will have a value somewhere in the
neighborhood. To get an idea of how much to smear out the probability associated with each
data point in forming an empirical probability distribution, a trimmed cross power matrix is
constructed for variation of data vectors about their median values. To do this, within training
data for a class, values of each feature are sorted, the median and median absolute deviation
(MAD) from the median are noted. In finding these medians and MADs, responses reserved for
calibration and responses excluded for cross-validation are omitted. The values for each feature
are then shifted by subtracting its median value. As the scale of different features may vary from
feature to feature, before forming the trimmed cross power matrix, the shifted feature values for
each feature are normalized by dividing their MAD resulting in shifted normalized feature
vectors, vi(mort) for mortar responses, and vi
(scrap) for scrap responses. Trimmed cross power
matrices C(class) are computed from these, with superscript (class) meaning either (mort) or (scrap). To
compute the trimmed cross power matrix for a class, values of |vi(scrap)| are computed for the
class’s training data and sorted to find median(|vi(scrap)|), omitting reserved and excluded data.
Then the class trimmed cross power matrices are computed as
]v
)v(vmedian)v(v[
n~1C 2)class(
i
t)class(i
)class(i
medianv,classini
2t)class(i
medianv,classini
)class(i)class(
)class(
)class(i
)class(i
∑∑>≤
+= (1)
where ñ(class) ≡ n(class) − n(class)rsrv - n(class)
with, and n(class)rsrv, is the number of (class) responses
reserved for subsequent calibration, and n(class)with is the number of (class) responses excluded as
a part of cross validation. The sums are over all non-excluded non-reserved class responses, t
denotes transpose, and median means median(|vi(scrap)|). In the second sum, the contribution of
32

large magnitude feature vectors are downweighted. Feature vector vi(class) probability density
function is estimated empirically as proportional to
[ ]∑ +−− −−+=
classini2/)n3(n2/1)class(
ij1)class(t
ij
)class(j
)class(featfeat ])n~)(vv()C()vv(228.01
1K)v(f (2)
with
2/1)class(n/)n1()class( ))C(det()n~(K/1 featfeat+= (3)
where superscript (class) has been omitted from vi(class) and vj
(class) in the denominator, and reserved
and excluded vi(class) terms omitted from the sum. Quantity in Eq. (2) will be referred to as a
density, although strictly speaking a density is normalized to have unit integral, and quantity in
Eq. (2) has not been normalized. Eq. (2) is a generalization of a Cauchy distribution, with the
outer exponent being the smallest half integer value yielding a finite variance.
In cross validation, densities (Eq. (2)) are computed for ‘mortar’ and ‘scrap’ classes from non-
excluded responses, and feature vectors vj(mort) and vj
(scrap) are computed for excluded training
responses not reserved for calibration, where for the j’th response, the two differ in component
offsets and normalizations. The first is used in estimating the response’s likelihood as a ‘mortar’
response, and the second in estimating its likelihood as a ‘scrap’ response. For a given response,
assuming that the proportionality constant is the same for both ‘mortar’ and ‘scrap’ estimated
densities, the probability that the response is due to a ‘scrap’ would be
)scrap(j
)scrap()mort(j
)mort(
)scrap(j
)scrap(
v(fvf)v(f
+ (4)
as the common proportionality factor cancels in their ratio. The probability that is due to
‘mortar’, would be one less this number. Allowing for a ratio of proportionality constants to be
α2, the densities are then αf(mort) (vj(mort)) and f(scrap) (vj
(scrap))/α (within a common scale factor),
and the probability that the response is due to ’scrap’ is
)v(f)v(f
)v(fv(p )scrap(
j)scrap()mort(
j)mort(2
)scrap(j
)scrap()scrap(
j)scrap(
−α= (5)
33

and the ‘mortar’ probability its compliment (1 - scrap). The probability in Eq. (5) depends only
on α2, ) , and . The latter two are computed and saved for each excluded
training datum, and proportionality constant α2 chosen subsequently.
mort(j
)mort( vf )scrap(j
)scrap( vf
In short, after computing f(scrap) (vj(scrap)) and f(mort) (vj
(mort)) for the set of excluded responses not
reserved for calibration, the set of excluded responses is changed, trimmed feature covariance
matrices recomputed, and densities computed for the set of new unreserved excluded responses.
Again, n(scrap)with is the number of ‘scrap’ training data withheld as a part of cross validation in
each cycle, n(mort)with is the similar number of ‘mortar’ training data withheld in each cycle.
Letting ncycl be the number of cycles of excluding some training data, ncycl x n(scrap)with unreserved
‘scrap’ training responses’, and ncycl x n(mort)with unreserved ‘mortar’ training responses are cycled
through the excluded set. For a given value of α2, the ‘scrap’ probabilities associated with these
values are summed as
∑=reservednotexludedj
)scrap(j
)scrap()scrap( )v(pn~ (6)
Since the number of ‘scrap’ responses that have been thus excluded is known to be ncycl x
n(scrap)with, parameter α2 is adjusted, so that
<ñ(scrap)> = ncycl x n(scrap)with (7)
Eq. (6) is monotonic in α2, so solution is unique. Newton’s method started from α2 = 1, keeping
α2 from decreasing to less than 0.1 of its previous value on any iteration, works very well. Since
p(scrap) = 1 - p(mort), the criterion for setting α2 also sets the sum of p(mort) (vj(mort)) to the number of
mortar responses cycled through the excluded training data set ncycl x n(mort)with.
For a prospective number of interval sub-divisions ndiv, cross power matrices C(class) are 3 ndiv x 3
ndiv square matrices requiring at least 3 ndiv vector outer products to be summed (in Eq. (1)) to
avoid singularity. This limits the prospective numbers of time interval sub divisions to
ndiv ≤ min(ñ(scrap), ñ(mort))/3 (8)
but sub-divisions near the limiting value are expected to give poor results due to variance in the
cross power matrix estimates.
34
In general ‘mortar’ identifications are made by choosing a threshold value po(mort) above which
responses are considered to be due to ‘mortars’. To obtain as few missed identifications as
possible for a given level of po(mort), it is desirable to have as few true ‘mortar’ responses with
p(mort) below this level as possible, that is, as many with p(scrap) = 1 - p(mort) below po(scrap) = 1 -
po(mort) as possible. To select a number of interval sub-divisions that will work well with a
variety of threshold values, we choose ndiv minimizing the sum
∑=reservednot,mortarj
)scrap(j
)scrap()miss( )v(pn~ (9)
If some ‘mortar’ response looks totally like a ‘scrap’ response then would contribute 1 to
<ñ(miss)> in summation in Eq. (9); if it looks nothing like ‘scrap’ responses it would contribute 0
to <ñ(miss)>. So, quantity <ñ(miss)> is a measure of how much the ‘mortar’ training data look like
‘scrap’ responses under the classifier (choice of ndiv) being considered. For each value of ndiv
tried, <ñ(miss)> is computed using values p(scrap) (vj(scrap) which are computed using cross
validation.
Recapping, 1/3 of the training data is reserved for later use; the remaining ‘mortar’ and ‘scrap’
data are randomly ordered within each of these classes. A sequence of candidate ndiv values are
cycled through as an outer loop. Sets of excluded ‘mortar’ and ‘scrap’ training data are chosen
starting with the first on their randomly ordered lists. Trimmed feature covariance matrices are
computed excluding these and the reserved data. Quantities f(scrap) (vj(scrap)) and f(mort) (vj
(mort)) are
computed for the excluded data. The sets of excluded responses are changed (moving down the
random ordered lists), trimmed feature covariance matrices recomputed, and densities computed
for the new set of unreserved excluded responses, based on the non-excluded unreserved
responses. After cycling essentially all of the non-reserved training data through the excluded
sets, α2 is chosen (for the current ndiv) using Newton’s method to enforce criterion in Eq. (7).
That is, so that the sum of ‘scrap’ probabilities over responses that have been, in turn, excluded
from the covariance matrix sums (Eq. (1)) and the empirical density sum (Eq. (2)), is equal to the
number of ‘scrap’ responses among these. Then, with this value of α2, the sum of estimated
35

‘scrap’ probabilities over the ‘mortar’ responses that have been in turn excluded, is computed
(Eq. (9)). This whole sequence is repeated for each candidate value of ndiv, and ndiv giving the
lowest value of Eq. (9) is selected.
Once ndiv has been selected, covariance matrices C(mort) and C(scrap) are recomputed using all non-
reserved training data to compute feature medians and MADs for ‘mortar’ and for ‘scrap’
responses, and in forming the covariance matrices themselves. Similarly, all non-reserved
training data are then used in reforming empirical distributions for ‘scrap’ and ‘mortar’ classes
analogously to Eqs. (2) and (3) but summed over all the non-reserved responses, omitting any
self-response terms (i = j), with the numbers of non-reserved ‘mortar’ and ‘scrap’ responses
ñ(mort) and ñ(scrap), replacing ñ(class) appropriately. Then all data, reserved and non-reserved, is
used in computing an estimated number of scrap responses <n(scrap)> analogously to Eq. (6), and
α2 reselected, so that the resulting <n(scrap)> is equal to the total number of scrap responses, to
calibrate the resulting empirical distributions and probabilities. In this step, the inclusion of non-
reserved data (which entered into the covariance matrices) in the probability sums used in the
final calibration, may bias the resulting probabilities somewhat, but is thought to be more than
compensated for in reduced variance in the final value of α2 obtained. The inclusion of the 1/3
of reserved data, that was omitted in estimation of the feature covariance matrices, in the
probability sum <n(scrap)> used in the final calibration, lessens the effect of any such bias.
The resulting covariance estimates, empirical probability distributions for vscrap and vmort and
proportionality constant α2 are then used to evaluate the probability that a response is due to
‘scrap’ through Eq. (5) evaluated using the response’s feature vector, shifted and normalized as a
prospective ‘scrap’ response vscrap and as a prospective ‘mortar’ response vscrap.
As mentioned earlier, in application to Camp Sibert training data, the process is used separately
for classification of responses into (a) mortar/half-round vs. scrap classes, and (b) mortar vs.
half-round/scrap classes. For training, 45 mortar, 13 half-round, and 42 scrap training data
polarizability responses were available from the GPO, SE-1, SE-2, and SW areas at Camp Sibert.
36
This resulted into classes with 57 and 42 training data for the discrimination problem (a) and
with 44 and 55 training data for the discrimination problem (b).
Between 1 and 6 data time interval divisions (ndiv) were tried in cross validation. For the
mortar/half-round vs. scrap problem, <ñmiss> ranges from a maximum of 0.0364 for ndiv = 1, to a
minimum of 0.0342 for ndiv = 2, so ndiv = 2 was selected. When reserved data is included,
<ñmiss> drops to 0.0324 for ndiv = 2. These rates are consistent with two of the training data
mortar or half-round responses being very similar to scrap responses. For the mortar vs. half-
round/scrap problem, in cross validation, <ñmiss> ranges from a maximum of 0.0892 for ndiv = 3,
to a minimum of 0.0336 for ndiv = 6, so ndiv = 6 was selected. When reserved data is included,
<ñmiss> drops to 0.0222 for ndiv = 6. The latter rate is consistent with one training data mortar
response being very similar to half-round or scrap responses.
Probability in Eq. (5), or its compliment (in unity) forms the basis for discrimination between
‘mortar’ and ‘scrap’ classes; a threshold value may be selected and every response with
pmort(v(mort)) less than the threshold is classified as ‘scrap’, the rest is classified as ‘mortars’.
From cued object interrogations, and the SE1 area survey 530 responses were selected as being
likely due to induction in metallic objects, 172 cued, and 358 un-cued. 109 (45 cued) objects
have probability greater than 90% of being mortars, 30 (22 cued) objects have probabilities
between 0.1 and 90% of being mortars, and the remaining 390 objects have less than 0.1%
chance of being a mortar. Similarly, 159 objects have greater than 90% probability of being
either a mortar or half-shell, 116 objects have probabilities between 0.1 and 90% of being either
a mortar or half-shell, with the remaining 254 objects having less than a 0.01% chance of being
either a mortar or half shell.
37

5. PERFORMANCE ASSESSMENT
We have adopted performance criteria commonly used for surveys at the test sites. In addition to
these criteria, we provide target characteristics (location, size, and polarizability) for detected
objects as follows:
(a) x, y, z (depth below the surface) location of object
(b) principal polarizability responses vs. time (as in Figures 2-4)
(c) identification as a scrap or intact UXO
From 200 cued survey locations 23 objects were excluded from the discrimination set because
they were identified as multiple objects, and 27 objects were in the training data set. Hence we
provided discrimination results for remaining 150 objects. The ground truth shows that 34 of
them were 4.2” mortars. We produced two priority dig lists. In the first one the ‘stop digging’
point was when any object past this mark had a very little probability of being 4.2” mortar. This
list indicated that 90 objects can be left in the ground and 60 objects have to be dug. Scoring
results from IDA showed that we correctly identified all 4.2” mortars, we didn’t miss any, and
we had 26 false positives – we identified scrap as UXO 26-times. The second priority dig list
had the ‘stop digging’ point at 90% probability of any object being 4.2” mortar. In this list only
43 objects were identified as ‘need to dig’ while 107 could be left safely in the ground. Scoring
results from IDA showed that if we would use this priority list we would again correctly
identified all 4.2” mortars, and moreover we would reduce false positives to 9. The ROC curve
for the first priority dig list is shown in Figure 17.
38

Figure 17: ROC curve for the cued targets priority dig list.
The SE1 area discrimination set contained 266 objects. The ground truth indicated that 56 of
them were single 4.2” mortars. Again, we produced two priority dig lists. The first one with the
‘stop digging’ point when any object past this mark had very little probability of being 4.2”
mortar, and the second one with the ‘stop digging’ point at 90% probability of any object being
4.2” mortar. In the first priority dig list we indicated that 75 objects have to be dug, while 191
objects can be left in the ground. Scoring results from IDA showed that we identified correctly
all 56 4.2” mortars, and 19-times we identified scrap as 4.2” mortar (19 false positives). The
ROC curve for this priority dig list is shown in Figure 18. The second priority list classified 63
objects as ‘need to dig’ and 203 objects as scrap. Scoring results from IDA showed that in this
case we again identified correctly all 56 4.2” mortars, and reduced false positives to 7. The ROC
curve for the second priority dig list is shown in Figure19.
39

Figure 18: ROC curve for SE1 area for the first priority dig list.
Figure 19: ROC curve for SE1 area for the second priority dig list.
40

Estimation of Receiver Operating Characteristic (ROC) Curves
This section describes how we estimated ROC curves without knowing the ground truth. This
approach is applicable in cases when the ground truth is not know.
Given a set of objects with probability p of being UXO and a threshold p0 for considering object
with p≥p0 to be identified as UXO, if p≥p0 then all are considered UXO. However, on average a
fraction (1-p) of them were not actually UXO, so they were false alarms. If p0>p then all are
considered non-UXO (scrap), but on average a fraction p of them were actually UXO, so these
are missed identifications. Extending this to a set of m objects with probabilities pi, i=1, m of
being UXO, the expected overall false alarm rate is
∑≥
−0pp
ip1m1 (10)
and the expected overall false negative rate is
∑< 0pp
ipm1 (11)
where these rates are per total number of targets. Given the same set of identification
probabilities, the expected number of UXO is
2i
ii
ii ppp −± ∑∑ , (12a)
and of non-UXO is
2i
ii
ii ppp1 −±− ∑∑ (12b)
where the uncertainties are given by the square root of the sum of the variances of the m terms in
the sums, and are the same for the two sums. Using these to renormalize Eqs. (10) and (11), the
expected false alarm rate per non-UXO is
∑∑
−
−≥
ii
ppi
p1
p10i , (13)
and the expected false negative rate per UXO is
41

∑∑
<
ii
ppi
p
p0i . (14)
ROC curves for the two identification problems described above are given in Figures 20 and 21.
Figure 20: Estimated ROC curve for cued targets priority dig list.
Figure 21: Estimated ROC curve for SE1 area targets priority dig list.
42
6. COST ASSESSMENT
6.1 Cost Analysis
Our preferred mode of operation involves detection and characterization/discrimination at the
same time. The advantage of this mode of operation is that target reacquisition is not necessary
for discrimination. Hence, this eliminates surveying costs and a second, cued, survey at the
expense of smaller daily coverage. We demonstrated this mode of operation in the SE1 area. It
took us 9 days to cover the area (~0.5 acres/day). A field crew consists of 2 people, so the cost
of doing this kind of survey was ~$23,000. It took us 3 days to survey 200 cued targets (60-70
targets/day). The cost was ~$8,000.
If EM61 survey costs $2,500/acre, and surveying of 100 flags costs $5,000 - $6,000, the total
cost of the discrimination of the same area in detection and then cued mode would cost $26,000 -
$29,000 + cost of cued targets reacquisition. None of these numbers include
mobilization/demobilization costs. However, in the traditional detection and then cued mode
mobilization/demobilization is required three times, while in our approach only one
mobilization/demobilization is necessary.
7. REFERENCES
Becker, A., Gasperikova, E., Morrison, H.F., Smith, J.T., 2002, Configuring the AEM System:
Partners in Environmental Technology Technical Symposium and Workshop, Washington D.C.
Gasperikova, E., 2003, A new-generation EM system for the detection and classification of buried
metallic objects: SEG Expanded Abstracts, pp. 2379-2382.
43

Gasperikova, E., Becker, A., Morrison, H.F., Smith, J.T., 2003, EM sensors for detection and
characterization of buried metallic objects: Partners in Environmental Technology Technical
Symposium and Workshop, Washington D.C., p. 36.
Gasperikova, E., Becker, A., Morrison, H.F., Smith, J.T., 2005, A multisensor system for the
detection and characterization of UXO: SAGEEP, Atlanta.
Gasperikova, E., Smith, J.T., Morrison, H.F., Becker, A., 2006, UXO detection and
characterization using new Berkeley UXO Discriminator (BUD): Joint Assembly, Baltimore.
Gasperikova, E., Smith, J.T., Morrison, H.F., Becker, A., 2006, Berkeley UXO Discriminator
(BUD) for UXO Detection and Discrimination: Partners in Environmental Technology Technical
Symposium and Workshop, Washington D.C.
Gasperikova, E., Smith, J.T., Morrison, H.F., Becker, A., 2007, Berkeley UXO Discriminator
(BUD): SAGEEP, Denver.
Gasperikova, E., Smith, J.T., Morrison, H.F., Becker, A., 2007, UXO Detection and
Discrimination with Berkeley UXO Discriminator (BUD): UXO Forum, Orlando, FL.
Gasperikova, E., Smith, J.T., Morrison, H.F., Becker, A., 2007, Berkeley UXO Discriminator
(BUD) at Camp Sibert, AL: Partners in Environmental Technology Technical Symposium and
Workshop, Washington D.C.
Morrison, H.F., 2004, A Multisensor System for the Detection and Characterization of UXO,
ESTCP Proposal UX-0437.
44

45
Morrison, H.F., Becker, A., Gasperikova, E., Smith, J.T., 2004, A multisensor system for the
detection and characterization of UXO: Partners in Environmental Technology Technical
Symposium and Workshop, Washington D.C.
Morrison, H.F., Smith, J.T., Becker, A., Gasperikova, E., 2005, Detection and Classification of
Buried Metallic Objects, SERDP UX-1225 Final Report.
Smith, J.T., and Morrison, H.F., 2004, Estimating equivalent dipole polarizabilities for the
inductive response of isolated conductive bodies: IEEE Trans. Geosci. Remote Sensing, 42, p.
1208-1214.
Smith, J.T., and Morrison, H.F., Becker, A., 2004a, Parametric forms and the inductive response of
a permeable conducting sphere: Journal of Env. And Engin. Geophysics, 9, p. 213-216.
Smith, J.T., and Morrison, H.F., Becker, A., 2004b, Resolution depths for some transmitter-
receiver configurations: IEEE Trans. Geosci. Remote Sensing, 42, p. 1215-1221.
Smith, J.T., and Morrison, H.F., Becker, A., 2005, Optimizing receiver configurations for
resolution of equivalent dipole polarizabilities in situ: IEEE Trans. Geosci. Remote Sensing, 43, p.
1490 - 1498.
Smith, J.T., and Morrison, H.F., 2006, Approximating spheroid inductive responses using
spheres: Geophysics, 71, p. G21-G25.
Smith, J.T., Morrison, H.F., Doolittle, L.R., and Tseng, H-W., 2007, Multi-transmitter null
coupled systems for inductive detection and characterization of metallic objects: Journal of
Applied Geophysics, 61, p. 227–234
Related Documents