Journal of the Science of Food and Agriculture J Sci Food Agric 86:2092–2098 (2006) Discrimination of teas based on total luminescence spectroscopy and pattern recognition L Nitin Seetohul, Meez Islam, ∗ William T O’Hare and Zulfiqur Ali School of Science and Technology, University of Teesside, Middlesbrough TS1 3BA, UK Abstract: This paper reports on the application of total luminescence spectroscopy to discriminate between seven different types of tea: four bottled liquid Japanese teas (oolong, green, houji and black teas) and three leaf teas (Kenya, Assam and Ceylon teas). Total luminescence spectra were recorded by measuring the emission spectra in the range 300 – 700 nm at excitation wavelengths from 250 to 590 nm. Discrimination of teas based on their spectral data was performed by principal component analysis, a common chemometric method used for data reduction and visualisation. The results demonstrate the ability of fluorescence techniques to differentiate between green tea (unfermented), black tea (fermented) and oolong tea (partially fermented). 2006 Society of Chemical Industry Keywords: total luminescence; tea classification; green tea; oolong tea; black tea; houji tea INTRODUCTION Tea is the most widely consumed beverage aside from water, 1,2 with an annual production of 1.8 × 10 6 t of dry leaves and a per capita worldwide consumption of approximately 40 L of beverage per year. It is estimated that (18–20) × 10 6 cups (6 oz) of tea are drunk daily on our planet. 3,4 Tea quality depends mainly on leaf variety, grow- ing environment, manufacturing conditions, size of ground tea leaves and infusion preparation. Qual- ity is measured on the basis of liquor (bright- ness, briskness, colour, etc.), aroma (flavour) and leaf appearance. The production of most branded teas involves blending several varieties to main- tain consistency of taste. Assuring the optimum blend requires the tea taster to sample hundreds of liquors. 5–8 Tea leaf, in common with all plant leaf matter, contains enzymes, biochemical intermediates, carbo- hydrates, proteins, lipids and structural elements nor- mally associated with plant growth and photosynthesis. In addition, tea leaf is distinguished by its remarkable content of methylxanthines and polyphenols. These two groups of compounds are predominantly respon- sible for the unique properties of tea that account for its popularity as a beverage. The most impor- tant chemical constituents that influence the taste and flavour of tea infusions are polyphenols, flavonols, caf- feine, sugars, organic acids, amino acids and volatile flavour compounds. Phenolic compounds of tea such as theaflavins and thearubigins are very important from an intrinsic quality point of view and make up 60% of the total water-soluble constituents of black tea. Moreover, they are responsible for the major organoleptic properties of colour, brightness (bright orange/red tone) and astringency. 5,9,10 Researchers have endeavoured to develop meth- ods for classifying different types of tea. Teas have been classified according to their metal content, 2,11,12 chemical composition and colour difference, 13 volatile components, 14 physicochemical properties 15 and Fourier transform infrared spectra 16 and also using an electronic nose 17 and an electronic tongue. 18 In tea manufacturing, the human senses of smell and sight are used as important tools for quality diagnosis. Sensory evaluation is subjective, but, with careful design of a scoring system and rigorous training of the assessors, the evaluation becomes more objective. However, it remains an expensive option. Instrumental methods for the determination of odour, colour and taste, such as gas chromatography/mass spectrometry (GC/MS), high- performance liquid chromatography (HPLC), colour difference meters, inductively coupled plasma atomic emission spectrometry (ICP-AES) and inductively coupled plasma mass spectrometry (ICP-MS) are costly, require trained personnel and are often of limited value and time-consuming. As a result, there has been an effort to investigate devices or instrumental methods for more objective and inexpensive analysis of tea that do not require specialist technicians. These devices would be less prone to drift and more consistent than sensory assessment, but the responses must be correlated with sensory techniques. 19–22 Fluorescence spectroscopy is a well-established, simple, fast, accurate and non-destructive technique that so far has not been used for classification of teas. Its high sensitivity and non-destructive nature ∗ Correspondence to: Meez Islam, School of Science and Technology, University of Teesside, Middlesbrough TS1 3BA, UK E-mail: [email protected] (Received 18 May 2005; revised version received 15 November 2005; accepted 27 April 2006) Published online 31 July 2006; DOI: 10.1002/jsfa.2578 2006 Society of Chemical Industry. J Sci Food Agric 0022–5142/2006/$30.00

Welcome message from author
This document is posted to help you gain knowledge. Please leave a comment to let me know what you think about it! Share it to your friends and learn new things together.
Transcript

Journal of the Science of Food and Agriculture J Sci Food Agric 86:2092–2098 (2006)
Discrimination of teas based on totalluminescence spectroscopy and patternrecognitionL Nitin Seetohul, Meez Islam,∗ William T O’Hare and Zulfiqur AliSchool of Science and Technology, University of Teesside, Middlesbrough TS1 3BA, UK
Abstract: This paper reports on the application of total luminescence spectroscopy to discriminate between sevendifferent types of tea: four bottled liquid Japanese teas (oolong, green, houji and black teas) and three leaf teas(Kenya, Assam and Ceylon teas). Total luminescence spectra were recorded by measuring the emission spectra inthe range 300–700 nm at excitation wavelengths from 250 to 590 nm. Discrimination of teas based on their spectraldata was performed by principal component analysis, a common chemometric method used for data reductionand visualisation. The results demonstrate the ability of fluorescence techniques to differentiate between green tea(unfermented), black tea (fermented) and oolong tea (partially fermented). 2006 Society of Chemical Industry
Keywords: total luminescence; tea classification; green tea; oolong tea; black tea; houji tea
INTRODUCTIONTea is the most widely consumed beverage aside fromwater,1,2 with an annual production of 1.8 × 10⁶ t ofdry leaves and a per capita worldwide consumptionof approximately 40 L of beverage per year. It isestimated that (18–20) × 106 cups (6 oz) of tea aredrunk daily on our planet.3,4
Tea quality depends mainly on leaf variety, grow-ing environment, manufacturing conditions, size ofground tea leaves and infusion preparation. Qual-ity is measured on the basis of liquor (bright-ness, briskness, colour, etc.), aroma (flavour) andleaf appearance. The production of most brandedteas involves blending several varieties to main-tain consistency of taste. Assuring the optimumblend requires the tea taster to sample hundreds ofliquors.5–8
Tea leaf, in common with all plant leaf matter,contains enzymes, biochemical intermediates, carbo-hydrates, proteins, lipids and structural elements nor-mally associated with plant growth and photosynthesis.In addition, tea leaf is distinguished by its remarkablecontent of methylxanthines and polyphenols. Thesetwo groups of compounds are predominantly respon-sible for the unique properties of tea that accountfor its popularity as a beverage. The most impor-tant chemical constituents that influence the taste andflavour of tea infusions are polyphenols, flavonols, caf-feine, sugars, organic acids, amino acids and volatileflavour compounds. Phenolic compounds of tea suchas theaflavins and thearubigins are very importantfrom an intrinsic quality point of view and make up60% of the total water-soluble constituents of blacktea. Moreover, they are responsible for the major
organoleptic properties of colour, brightness (brightorange/red tone) and astringency.5,9,10
Researchers have endeavoured to develop meth-ods for classifying different types of tea. Teas havebeen classified according to their metal content,2,11,12
chemical composition and colour difference,13 volatilecomponents,14 physicochemical properties15 andFourier transform infrared spectra16 and also usingan electronic nose17 and an electronic tongue.18
In tea manufacturing, the human senses ofsmell and sight are used as important tools forquality diagnosis. Sensory evaluation is subjective,but, with careful design of a scoring system andrigorous training of the assessors, the evaluationbecomes more objective. However, it remains anexpensive option. Instrumental methods for thedetermination of odour, colour and taste, such as gaschromatography/mass spectrometry (GC/MS), high-performance liquid chromatography (HPLC), colourdifference meters, inductively coupled plasma atomicemission spectrometry (ICP-AES) and inductivelycoupled plasma mass spectrometry (ICP-MS) arecostly, require trained personnel and are often oflimited value and time-consuming. As a result, therehas been an effort to investigate devices or instrumentalmethods for more objective and inexpensive analysisof tea that do not require specialist technicians.These devices would be less prone to drift and moreconsistent than sensory assessment, but the responsesmust be correlated with sensory techniques.19–22
Fluorescence spectroscopy is a well-established,simple, fast, accurate and non-destructive techniquethat so far has not been used for classification ofteas. Its high sensitivity and non-destructive nature
∗ Correspondence to: Meez Islam, School of Science and Technology, University of Teesside, Middlesbrough TS1 3BA, UKE-mail: [email protected](Received 18 May 2005; revised version received 15 November 2005; accepted 27 April 2006)Published online 31 July 2006; DOI: 10.1002/jsfa.2578
2006 Society of Chemical Industry. J Sci Food Agric 0022–5142/2006/$30.00
Discrimination of teas by total luminescence spectroscopy
mean that this technique could be used for continuousmeasurement of tea quality during the various stagesof manufacturing. Total luminescence spectroscopy(TLS) is a multidimensional fluorescence techniquethat involves simultaneous acquisition of multiple exci-tation and emission wavelengths in order to increasemethod selectivity. The total luminescence spectra areobtained from the excitation–emission data matrix,i.e. by plotting fluorescence intensity as a combinedfunction of excitation and emission wavelengths. Theexcitation–emission matrices (EEMs) can be used asfingerprints for individual or mixtures of fluorescentcomponents. TLS has been used for discrimination offuels,23 water quality monitoring24 and classificationof oils,25 but not of teas.
Miyazawa and Nakagawa26 reported the chemilu-minescence of catechins, theaflavins and anthocyaninsto have a maximum emission wavelength at 630, 690and 675 nm respectively. As TLS of teas is related tothe content of polyphenols and flavanoids, and thesecompounds are responsible for the major organolepticproperties, it is proposed that TLS could be used as ameasure of quality for teas. It is further proposed that,rather than calibrate the TLS data to quantify individ-ual components and then relate these concentrationsto organoleptic quality, it might be possible to relatethe data more directly to quality using statistical meth-ods such as principal component analysis (PCA). PCAis a statistical tool commonly used for the unsuper-vised classification of multivariate data.27,28 The mainaim of PCA is to reduce the dimensionality of data,giving a small number of principal components (PCs)that represent the vast majority of variance in the data.PCA finds an alternative set of axes about which a dataset may be represented and indicates along which axisthere is most variation. This enables more effectivevisualisation and classification of multivariate data.29
The method allows natural clustering of the data tobe observed as well as providing an insight into howeffectively a pattern recognition system could classifythe data.
Several applications of PCA may be found in theliterature with respect to establishing the differencebetween dissimilar teas using quality control data,trace metal content,11 colour,13 volatile components14
and organic compounds.16
In this study, TLS has been used as a fingerprint,and pattern recognition applied to these fingerprintsallowed the discrimination of different types of tea.This objective instrumental method is inexpensive,sensitive, relates to the quality of tea, has potentialfor automation and also is not subjective like sensoryevaluation by tea graders.
MATERIALS AND METHODSApparatusTotal luminescence measurements were carried outusing a Hitachi F-2000 (Tokyo, Japan) spectrofluo-rimeter with a quartz cell (VWR, Leicestershire, UK)
of 10 mm path length. The apparatus was remotelyoperated using F3D software (Hitachi) on a PC con-nected via an RS232 port. The light source was a long-life 150 W xenon lamp with ozone self-dissociationfunction. The wavelength scan rate and the band-pass were maintained at 1200 nm min−1 and 10 nmrespectively.
TeasSeven different types of tea were used in thisstudy: three leaf teas – Assam (Sainsbury), Kenya(Sainsbury) and Ceylon (Tea Plucker pure Ceylontea) teas – and four bottled liquid Japanese teas – black(Kirin Beverages), oolong (Suntory), green (Ito-EnBeverages) and houji (Ito-En Beverages) teas. TheJapanese teas were kindly donated by the GENFoundation (London, UK). Water purified by reverseosmosis was used throughout.
Preparation of leaf tea samples for fluorescenceanalysisTea samples (0.5 g) were weighed and transferred into60 mL brown glass bottles. Hot water (80 ◦C, 30 mL)was added to each bottle by means of a pipette. Thetea was allowed to infuse for 5 min and the liquorwas then filtered through Whatman No 1 filter paper(125 mm diameter). The filtration process removestea particles that produce scattering of the incidentexcitation light. The filtrate was collected and storedin a brown glass flask for 15 min to allow the brew tocool to room temperature before being analysed in thefluorimeter. This simple procedure was repeated foreach tea sample.
Preparation of bottled tea samples forfluorescence analysisThe bottled teas were used without further filtration.It was found that they did not contain any particlesthat might interfere with the fluorescence analysis, asthey are filtered during the manufacturing process.The bottled teas available for this study were found tobe too concentrated, as self-quenching was observedwhen the EEMs were recorded. Hence the teas werediluted twofold with purified water and then stored inbrown glass bottles before analysis in the fluorimeter,as this produced an active concentration similar to thatof the leaf infusions.
Sampling procedureThe diluted solutions were placed in quartz cuvettesof 10 mm path length, and the total luminescencemeasurement was carried out using the fluorimeter.The temperatures of the samples were recorded beforeeach run to ensure that they were at room temperature.The excitation wavelength was set from 250 to 590 nmat intervals of 20 nm. The emission wavelength was setfrom 300 to 700 nm at intervals of 5 nm. The contourinterval was set at 10 nm.
J Sci Food Agric 86:2092–2098 (2006) 2093DOI: 10.1002/jsfa
L Nitin Seetohul et al.
Statistical analysisThe data were standardised using Minitab Version14 (Minitab Inc, State College PA 16801-3008,USA). The 3D EEMs were constructed and PCAwas carried out using The Unscrambler Version 9(CAMO Software Inc, Woodbridge, USA).
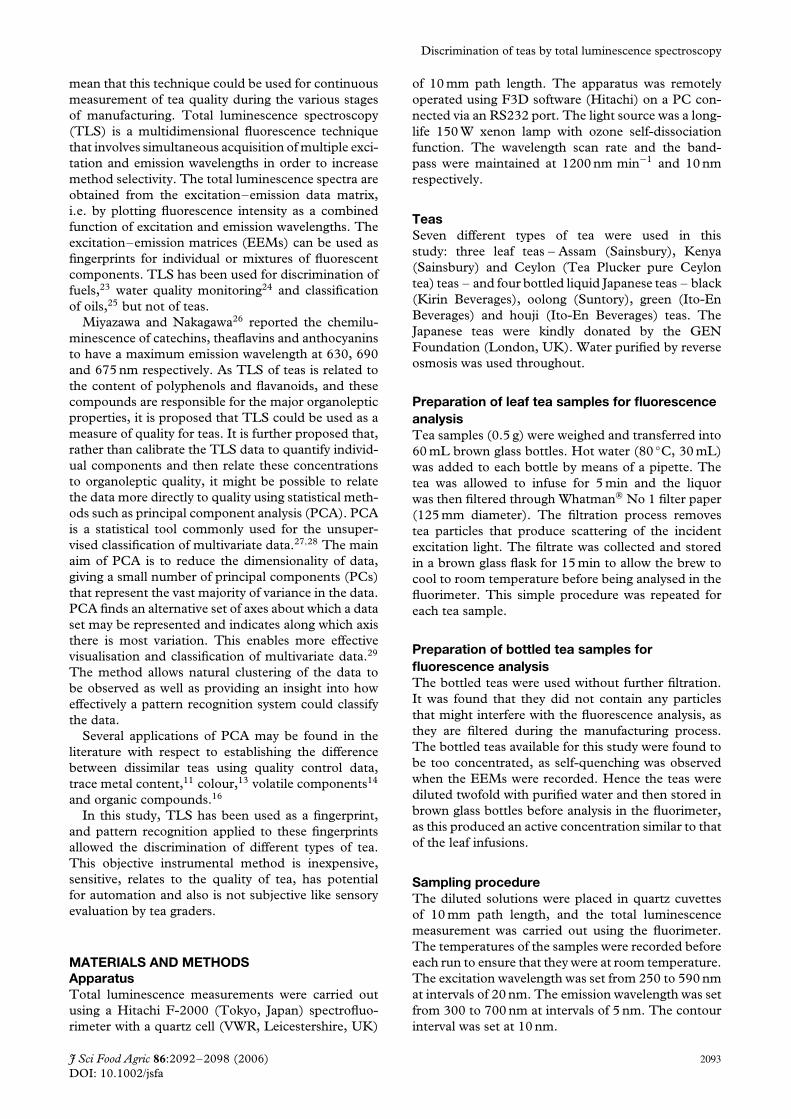
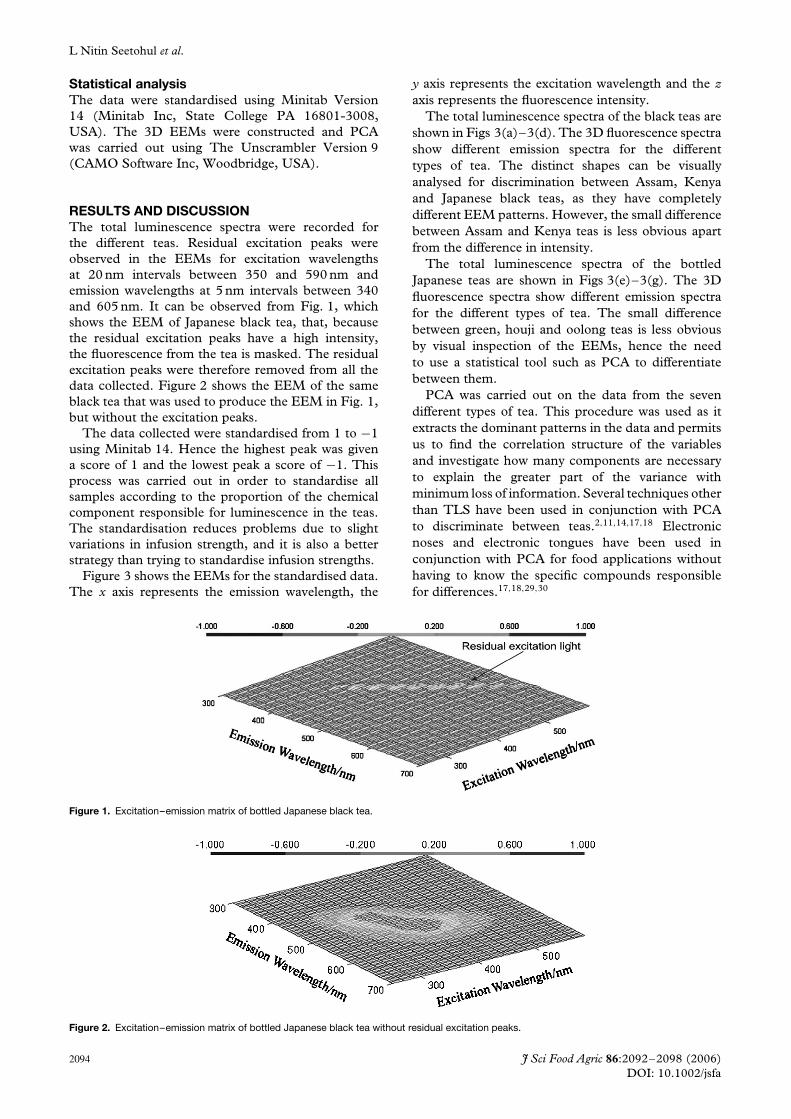
RESULTS AND DISCUSSIONThe total luminescence spectra were recorded forthe different teas. Residual excitation peaks wereobserved in the EEMs for excitation wavelengthsat 20 nm intervals between 350 and 590 nm andemission wavelengths at 5 nm intervals between 340and 605 nm. It can be observed from Fig. 1, whichshows the EEM of Japanese black tea, that, becausethe residual excitation peaks have a high intensity,the fluorescence from the tea is masked. The residualexcitation peaks were therefore removed from all thedata collected. Figure 2 shows the EEM of the sameblack tea that was used to produce the EEM in Fig. 1,but without the excitation peaks.
The data collected were standardised from 1 to −1using Minitab 14. Hence the highest peak was givena score of 1 and the lowest peak a score of −1. Thisprocess was carried out in order to standardise allsamples according to the proportion of the chemicalcomponent responsible for luminescence in the teas.The standardisation reduces problems due to slightvariations in infusion strength, and it is also a betterstrategy than trying to standardise infusion strengths.
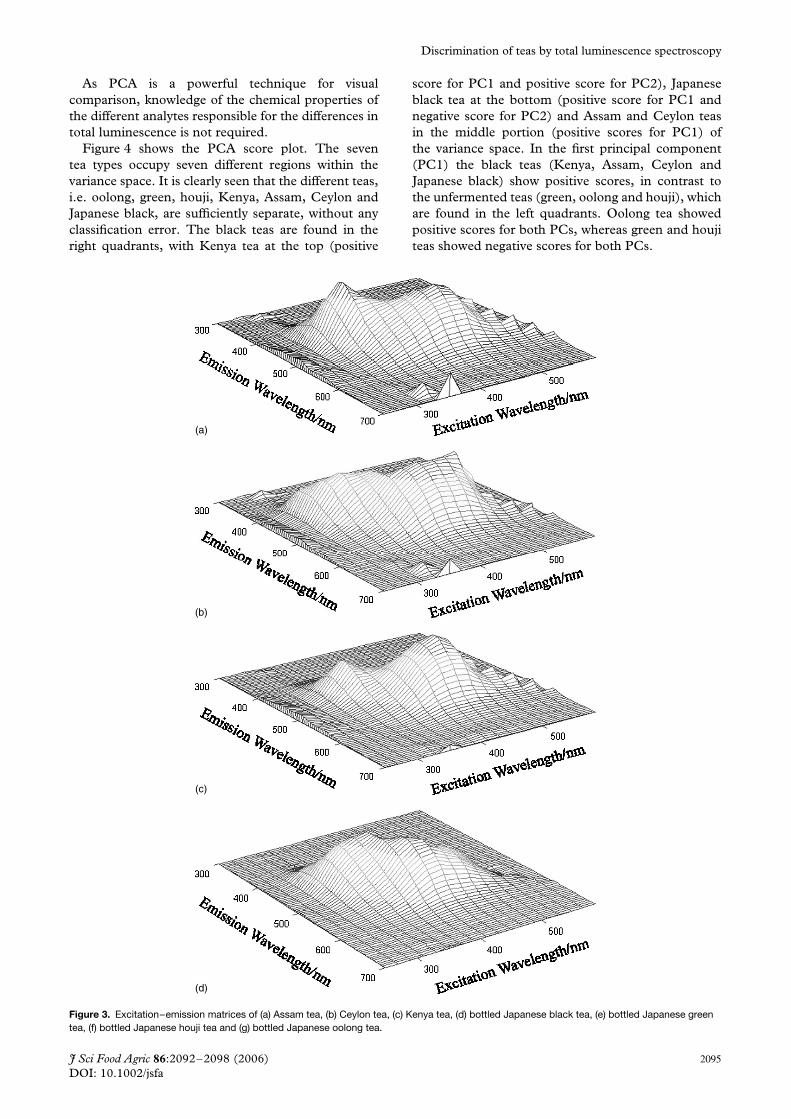
Figure 3 shows the EEMs for the standardised data.The x axis represents the emission wavelength, the
y axis represents the excitation wavelength and the zaxis represents the fluorescence intensity.
The total luminescence spectra of the black teas areshown in Figs 3(a)–3(d). The 3D fluorescence spectrashow different emission spectra for the differenttypes of tea. The distinct shapes can be visuallyanalysed for discrimination between Assam, Kenyaand Japanese black teas, as they have completelydifferent EEM patterns. However, the small differencebetween Assam and Kenya teas is less obvious apartfrom the difference in intensity.
The total luminescence spectra of the bottledJapanese teas are shown in Figs 3(e)–3(g). The 3Dfluorescence spectra show different emission spectrafor the different types of tea. The small differencebetween green, houji and oolong teas is less obviousby visual inspection of the EEMs, hence the needto use a statistical tool such as PCA to differentiatebetween them.
PCA was carried out on the data from the sevendifferent types of tea. This procedure was used as itextracts the dominant patterns in the data and permitsus to find the correlation structure of the variablesand investigate how many components are necessaryto explain the greater part of the variance withminimum loss of information. Several techniques otherthan TLS have been used in conjunction with PCAto discriminate between teas.2,11,14,17,18 Electronicnoses and electronic tongues have been used inconjunction with PCA for food applications withouthaving to know the specific compounds responsiblefor differences.17,18,29,30
Figure 1. Excitation–emission matrix of bottled Japanese black tea.
Figure 2. Excitation–emission matrix of bottled Japanese black tea without residual excitation peaks.
2094 J Sci Food Agric 86:2092–2098 (2006)DOI: 10.1002/jsfa
Discrimination of teas by total luminescence spectroscopy
As PCA is a powerful technique for visualcomparison, knowledge of the chemical properties ofthe different analytes responsible for the differences intotal luminescence is not required.
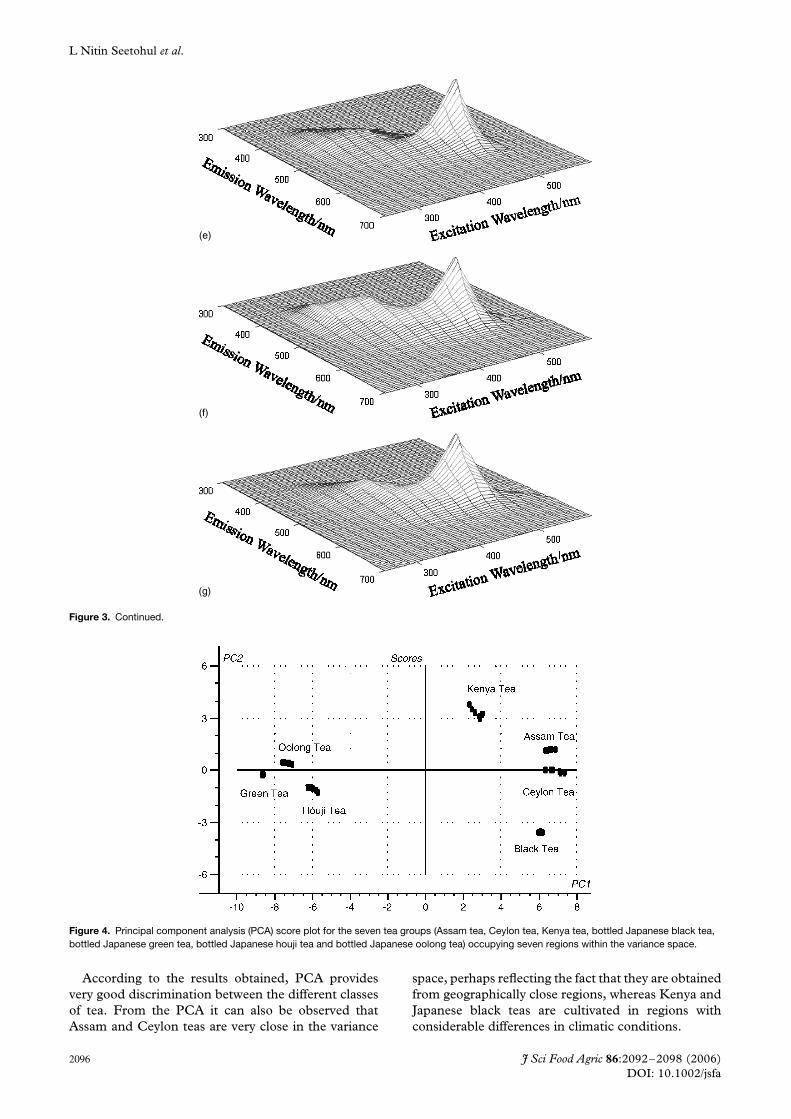
Figure 4 shows the PCA score plot. The seventea types occupy seven different regions within thevariance space. It is clearly seen that the different teas,i.e. oolong, green, houji, Kenya, Assam, Ceylon andJapanese black, are sufficiently separate, without anyclassification error. The black teas are found in theright quadrants, with Kenya tea at the top (positive
score for PC1 and positive score for PC2), Japaneseblack tea at the bottom (positive score for PC1 andnegative score for PC2) and Assam and Ceylon teasin the middle portion (positive scores for PC1) ofthe variance space. In the first principal component(PC1) the black teas (Kenya, Assam, Ceylon andJapanese black) show positive scores, in contrast tothe unfermented teas (green, oolong and houji), whichare found in the left quadrants. Oolong tea showedpositive scores for both PCs, whereas green and houjiteas showed negative scores for both PCs.
(a)
(b)
(c)
(d)
Figure 3. Excitation–emission matrices of (a) Assam tea, (b) Ceylon tea, (c) Kenya tea, (d) bottled Japanese black tea, (e) bottled Japanese greentea, (f) bottled Japanese houji tea and (g) bottled Japanese oolong tea.
J Sci Food Agric 86:2092–2098 (2006) 2095DOI: 10.1002/jsfa
L Nitin Seetohul et al.
(e)
(f)
(g)
Figure 3. Continued.
Figure 4. Principal component analysis (PCA) score plot for the seven tea groups (Assam tea, Ceylon tea, Kenya tea, bottled Japanese black tea,bottled Japanese green tea, bottled Japanese houji tea and bottled Japanese oolong tea) occupying seven regions within the variance space.
According to the results obtained, PCA providesvery good discrimination between the different classesof tea. From the PCA it can also be observed thatAssam and Ceylon teas are very close in the variance
space, perhaps reflecting the fact that they are obtainedfrom geographically close regions, whereas Kenya andJapanese black teas are cultivated in regions withconsiderable differences in climatic conditions.
2096 J Sci Food Agric 86:2092–2098 (2006)DOI: 10.1002/jsfa
Discrimination of teas by total luminescence spectroscopy
This work has shown the potential of fluorescencespectroscopy to distinguish between seven types of tea.Visual inspection of the EEMs of tea samples makesit possible to assign a large number of samples tothe expected type. This study demonstrates that TLScould potentially form the basis of a simple methodto discriminate between different types of tea in thetea-manufacturing industry.
According to the statistical analysis, green, houji andoolong teas are different from black teas. This couldbe explained by the fact that green tea is unoxidisedas it is steamed immediately after picking in order toavoid fermentation, brown teas (oolong and houji) arenot fully oxidised as the fermentation process utilisesoxidising enzymes originally contained in tea leaves,and black teas are fully oxidised as they are producedby full fermentation during which various compoundsare produced. Black teas also show broader emissionspectra, possibly owing to the formation of morecompounds in the manufacturing process, whichinvolves the intensive oxidation of green tea catechinsto catechin quinines, eventually leading to theformation of coloured complex polyphenols knownas theaflavins and thearubigins.7 The data from thePCA plot could be of use as a tool in the tea industryfor discriminating between different types of tea andalso as a monitoring tool during the processing ofteas.
This work lays the foundation for the further workthat is required to develop a cheap, robust, objectivedevice to determine the quality of tea rather than usingcostly subjective assessment by tea tasters and teagraders. This work will be extended to classificationof leaf teas from a single region, hopefully allowingprediction of quality allocations made by trainedtea tasters, and also to classification of blendedteas.
REFERENCES1 Harbowy ME and Balentine DA, Tea chemistry. Crit Rev Plant
Sci 16:415–480 (1997).2 Fernandez-Caceres PL, Martin MJ, Pablos F and Gonza-
lez AG, Differentiation of tea (Camellia sinensis) varieties andtheir geographical origin according to their metal content. JAgric Food Chem 49:4775–4779 (2001).
3 Weisburger JH, Tea and health: a historical perspective. CancerLett 114:315–317 (1997).
4 International Tea Committee, Annual Bulletin of Statistics.International Tea Committee, London (1995).
5 Astill C, Birch MR, Dacombe C, Humphrey PG and Mar-tin PT, Factors affecting the caffeine and polyphenol con-tents of black and green tea infusions. J Agric Food Chem49:5340–5347 (2001).
6 Englehardt U, Antioxidative phenolic compounds in green-black tea and other methylxanthine-containing beverages.Caffeinated Beverages Symp, 219th Am Chem Soc Meet,Anaheim, CA, pp. 111–118 (1999).
7 Ponce E and Taylor AJ, Phenolic compounds as astringentfactors in black tea liquors, in Flavour Chemistry ofEthnic Foods, ed. by Shahidi F and Ho CT. KluwerAcademic/Plenum, New York, NY, pp. 197–210 (1997).
8 Ramadurai N, Global trade trends in tea. Planters Chron537–545 (2000).
9 Larger PJ, Jones AD and Dacombe C, Separation of teapolyphenols using micellar electrokinetic chromatographywith diode array detection. J Chromatogr A 799:309–320(1998).
10 Obanda M, Owuor PO, Mang’oka R and Kavoi MM, Changesin thearubigin fractions and theaflavin levels due to variationsin processing conditions and their influence on black tealiquor brightness and total colour. Food Chem 85:163–173(2004).
11 Moreda-Pineiro A, Fisher A and Hill SJ, The classification oftea according to region of origin using pattern recognitiontechniques and trace metal data. J Food Compos Anal16:195–212 (2003).
12 Fernandez PL, Pablos F, Martin MJ and Gonzalez AG, Multi-element analysis of tea beverages by inductively cou-pled plasma atomic emission spectrometry. Food Chem76:483–489 (2002).
13 Liang Y, Lu J, Zhang L and Wu S, Estimation of black tea qualityby analysis of chemical composition and colour difference oftea infusions. Food Chem 80:283–290 (2003).
14 Togari N, Kobayashi A and Aishima T, Pattern recognitionapplied to gas chromatographic profiles of volatile compo-nents in three tea categories. Food Res Int 28:495–502 (1995).
15 Borse BB, Jagan Mohan Rao L, Nagalakshmi S and Krishna-murthy N, Fingerprint of black teas from India: identificationof the regio-specific characteristics. Food Chem 79:419–424(2002).
16 Budinova G, Vlacil D, Mestek O and Volka K, Application ofinfrared spectroscopy to the assessment of authenticity of tea.Talanta 47:255–260 (1998).
17 Dutta R, Hines EL, Gardner JW, Kashwan KR and Bhuyan M,Tea quality prediction using a tin oxide-based electronic nose:an artificial intelligence approach. Sens Actuat B 94:228–237(2003).
18 Ivarsson P, Holmin S, Hojer NE, Krantz-Rulcker C and Win-quist F, Discrimination of tea by means of a voltammetricelectronic tongue and different applied waveforms. Sens ActuatB 76:449–454 (2001).
19 Pecore S and Kellen L, A consumer-focused QC/sensoryprogram in the food industry. Food Qual Prefer 13:369–374(2002).
20 Annor-Frempong IE, Nute GR, Wood JD, Whittington FWand West A, The measurement of the responses to differentodour intensities of ‘boar taint’ using a sensory panel and anelectronic nose. Meat Sci 50:139–151 (1998).
21 Frank M, Ulmer H, Ruiz J, Visani P and Weimar U, Comple-mentary analytical measurements based upon gas chromatog-raphy–mass spectrometry, sensor system and human sensorypanel: a case study dealing with packaging materials. AnalChim Acta 431:11–29 (2001).
22 Wittig De Penna E, Zuniga MJ, Fuenzalida R and Lopez-Planes R, Chemical and sensory characterization of tea (Theasinensis) consumed in Chile. Arch Latinoam Nutr 55:93–100(2005).
23 Patra D, Lakshmi Sireesha K and Mishra AK, Characterizationand investigation of polycyclic aromatic compounds presentin petrol, diesel, kerosene and 2T oil using excitationemission matrix fluorescence. Indian J Chem A 40:374–379(2001).
24 Baker A, Fluorescence properties of some farm wastes: impli-cations for water quality monitoring. Water Res 36:189–195(2002).
25 Scott SM, James D, Ali Z, O’Hare WT and Rowell FJ,Total luminescence spectroscopy with pattern recognitionfor classification of edible oils. Analyst 128:966–973(2003).
26 Miyazawa T and Nakagawa K, Structure-related emissionspectrometric analysis of the chemiluminescence of catechins,theaflavins and anthocyanins. Biosci, Biotechnol Biochem62:829–832 (1998).
27 Pearson K, On lines and planes of closest fit to systemsof points in space. Lond Edinburgh Philos Mag 2:559–572(1901).
J Sci Food Agric 86:2092–2098 (2006) 2097DOI: 10.1002/jsfa

L Nitin Seetohul et al.
28 Gardiner WP, Statistical analysis methods for chemists,in Multivariate Analysis Methods in Chemistry, RoyalSociety of Chemistry, Cambridge, UK, pp. 293–307(1997).
29 Boothe DDH and Arnold JW, Electronic nose analysis ofvolatile compounds from poultry meat samples, fresh and
after refrigerated storage. J Sci Food Agric 82:315–322(2002).
30 Legin A, Rudnitskaya A, Vlasov Y, Di Natale C, Davide F andD’Amico A, Tasting of beverages using an electronic tongue.Sens Actuat B 44:291–296 (1997).
2098 J Sci Food Agric 86:2092–2098 (2006)DOI: 10.1002/jsfa
Related Documents