Discriminant Function Analysis Mu Wu Naglaa Kamel COM 531 March 26, 2009 Model: Using the National Community Data Set IVs: Q9 Q15 Q26 Q28 Q29 Q31 Q96 Q105 Key: Q9 – Importance of neighborhood or community Q15 – Importance of personal or political philosophy Q26 - I’d feel lost if I had to move from my neighborhood Q28 - I feel a strong identification with my community Q29 - I enjoy living in my neighborhood. Q31 - Public officials don’t care much what people like me think. Q96 - My chances of being involved in a violent crime within the next year are very low Q105 - Education completed DV: Income 1 – Below $30,000 2 – Between $30,000 and $75,000 3 – Above $75,000 DF1: Education DF2: Public officials’ opinion 1

Welcome message from author
This document is posted to help you gain knowledge. Please leave a comment to let me know what you think about it! Share it to your friends and learn new things together.
Transcript

Discriminant Function Analysis Mu Wu
Naglaa Kamel
COM 531
March 26, 2009
Model:
Using the National Community Data Set
IVs:
Q9
Q15
Q26
Q28
Q29
Q31
Q96
Q105
Key:
Q9 – Importance of neighborhood or community
Q15 – Importance of personal or political philosophy
Q26 - I’d feel lost if I had to move from my neighborhood
Q28 - I feel a strong identification with my community
Q29 - I enjoy living in my neighborhood.
Q31 - Public officials don’t care much what people like me think.
Q96 - My chances of being involved in a violent crime within the next year are very low
Q105 - Education completed
DV:
Income
1 – Below $30,000
2 – Between $30,000 and $75,000
3 – Above $75,000
DF1: Education
DF2: Public officials’ opinion
1
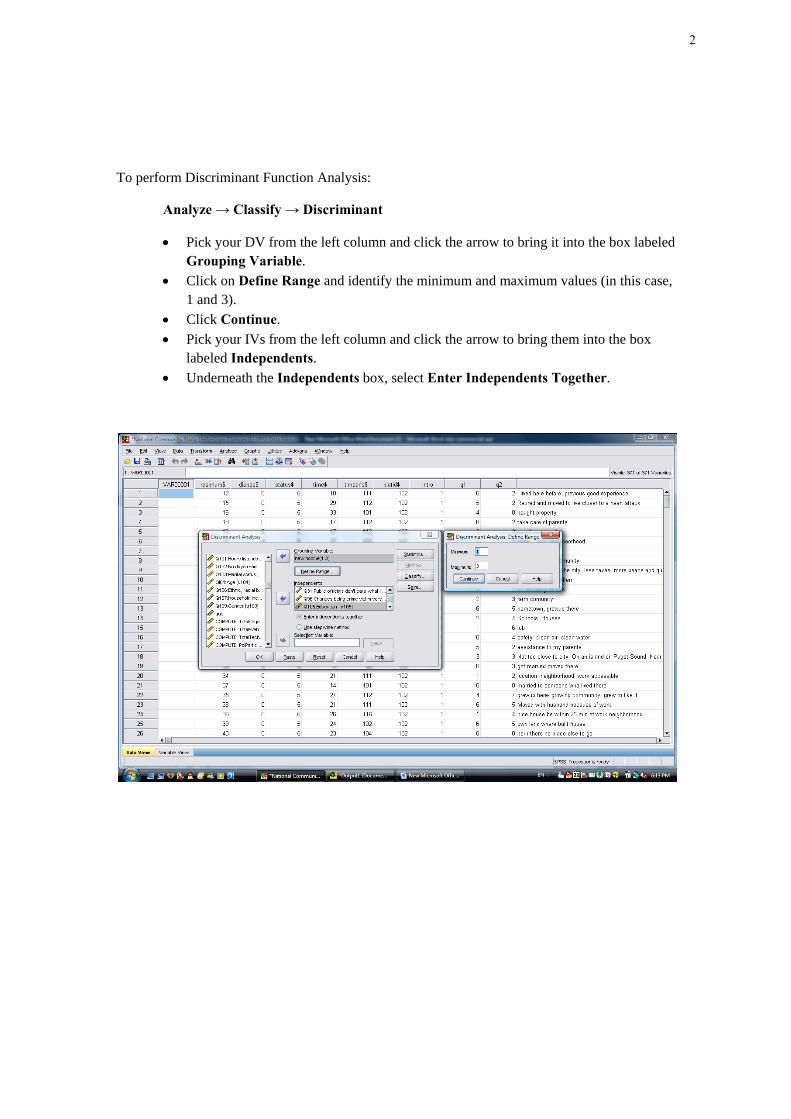
To perform Discriminant Function Analysis:
Analyze → Classify → Discriminant
• Pick your DV from the left column and click the arrow to bring it into the box labeled Grouping Variable.
• Click on Define Range and identify the minimum and maximum values (in this case, 1 and 3).
• Click Continue. • Pick your IVs from the left column and click the arrow to bring them into the box
labeled Independents. • Underneath the Independents box, select Enter Independents Together.
2

To perform Discriminant Function Analysis cont.
• Click on the Statistics button. • In the Discriminant Analysis: Statistics window, select Means, Univaritate ANOVAs,
and Box’s M. • Under Functions Coefficients check Fisher’s. • Click Continue.
3

To perform Discriminant Function Analysis cont.
• Click on Classify. • Under Prior Probabilities, choose All Groups Equal. • Under Display, select Casewise Results, Limit Cases to First 20, and Summary Table. • Under Use Covariance Matrix, choose Within-Groups. • Under Plots, select Territorial Map. • Click Continue and OK to run the Discriminant Analysis output.
4

GET FILE='N:\COM 531\data\National Community Study (Jeffres)\National Community Study (Jeffres).sav'. DATASET NAME DataSet0 WINDOW=FRONT. DISCRIMINANT /GROUPS=Newincome(1 3) /VARIABLES=q9 q15 q26 q28 q29 q31 q96 q105 /ANALYSIS ALL /PRIORS EQUAL /STATISTICS=MEAN STDDEV UNIVF BOXM COEFF TABLE /PLOT=MAP /PLOT=CASES(20)
/CLASSIFY=NONMISSING POOLED. Discriminant
[DataSet1] N:\COM 531\data\National Community Study (Jeffres)\National Community Study (Jeffres)
.sav
Analysis Case Processing Summary
Unweighted Cases N Percent
Valid 342 71.0
Excluded Missing or out-of-range group
codes 61 12.7
At least one missing
discriminating variable 17 3.5
Both missing or out-of-range
group codes and at least one
missing discriminating variable
62 12.9
Total 140 29.0
Total 482 100.0
5
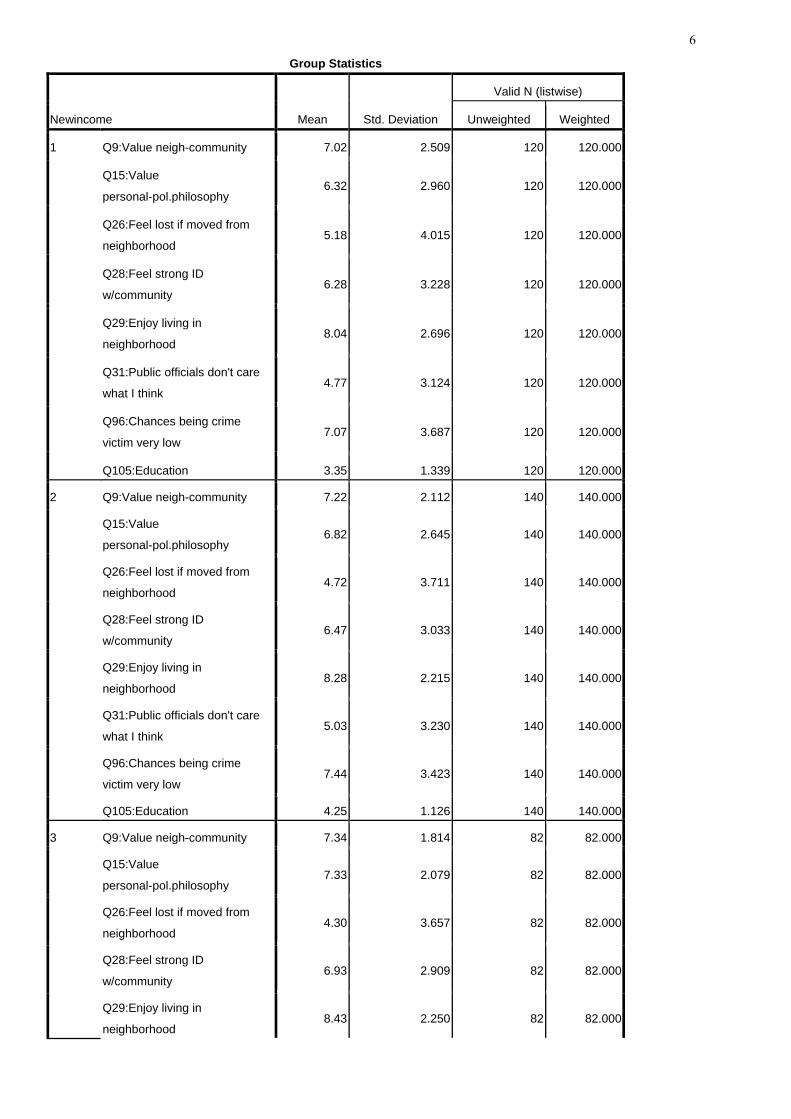
Group Statistics
Newincome Mean Std. Deviation
Valid N (listwise)
Unweighted Weighted
1 Q9:Value neigh-community 7.02 2.509 120 120.000
Q15:Value
personal-pol.philosophy 6.32 2.960 120 120.000
Q26:Feel lost if moved from
neighborhood 5.18 4.015 120 120.000
Q28:Feel strong ID
w/community 6.28 3.228 120 120.000
Q29:Enjoy living in
neighborhood 8.04 2.696 120 120.000
Q31:Public officials don't care
what I think 4.77 3.124 120 120.000
Q96:Chances being crime
victim very low 7.07 3.687 120 120.000
Q105:Education 3.35 1.339 120 120.000
2 Q9:Value neigh-community 7.22 2.112 140 140.000
Q15:Value
personal-pol.philosophy 6.82 2.645 140 140.000
Q26:Feel lost if moved from
neighborhood 4.72 3.711 140 140.000
Q28:Feel strong ID
w/community 6.47 3.033 140 140.000
Q29:Enjoy living in
neighborhood 8.28 2.215 140 140.000
Q31:Public officials don't care
what I think 5.03 3.230 140 140.000
Q96:Chances being crime
victim very low 7.44 3.423 140 140.000
Q105:Education 4.25 1.126 140 140.000
3 Q9:Value neigh-community 7.34 1.814 82 82.000
Q15:Value
personal-pol.philosophy 7.33 2.079 82 82.000
Q26:Feel lost if moved from
neighborhood 4.30 3.657 82 82.000
Q28:Feel strong ID
w/community 6.93 2.909 82 82.000
Q29:Enjoy living in
neighborhood 8.43 2.250 82 82.000
6

Q31:Public officials don't care
what I think 3.65 3.040 82 82.000
Q96:Chances being crime
victim very low 7.95 2.828 82 82.000
Q105:Education 4.85 1.090 82 82.000
Total Q9:Value neigh-community 7.18 2.194 342 342.000
Q15:Value
personal-pol.philosophy 6.77 2.661 342 342.000
Q26:Feel lost if moved from
neighborhood 4.78 3.812 342 342.000
Q28:Feel strong ID
w/community 6.51 3.076 342 342.000
Q29:Enjoy living in
neighborhood 8.23 2.400 342 342.000
Q31:Public officials don't care
what I think 4.61 3.187 342 342.000
Q96:Chances being crime
victim very low 7.43 3.396 342 342.000
Q105:Education 4.08 1.330 342 342.000
7

Tests of Equality of Group Means
Wilks' Lambda F df1 df2 Sig.
Q9:Value neigh-community .997 .545 2 339 .580
Q15:Value
personal-pol.philosophy .979 3.568 2 339 .029
Q26:Feel lost if moved from
neighborhood .992 1.328 2 339 .266
Q28:Feel strong ID
w/community .993 1.115 2 339 .329
Q29:Enjoy living in
neighborhood .996 .672 2 339 .511
Q31:Public officials don't care
what I think .970 5.227 2 339 .006
Q96:Chances being crime
victim very low .990 1.660 2 339 .192
Q105:Education .806 40.849 2 339 .000
Analysis 1 Box's Test of Equality of Covariance Matrices
Log Determinants
Newincome Rank Log Determinant
1 8 15.491
2 8 13.598
3 8 11.315
Pooled within-groups 8 14.144
The ranks and natural logarithms of determinants printed are
those of the group covariance matrices.
Test Results
Box's M 144.643
F Approx. 1.938
df1 72
df2 2.235E5
Sig. .000
Tests null hypothesis of equal
population covariance matrices.
8

Summary of Canonical Discriminant Functions
Eigenvalues
Function Eigenvalue % of Variance Cumulative %
Canonical
Correlation
1 .270a 92.2 92.2 .461
2 .023a 7.8 100.0 .150
a. First 2 canonical discriminant functions were used in the analysis.
Wilks' Lambda
Test of
Function(s) Wilks' Lambda Chi-square df Sig.
1 through 2 .770 87.868 16 .000
2 .978 7.611 7 .368
Standardized Canonical Discriminant Function
Coefficients
Function
1 2
Q9:Value neigh-community -.009 .108
Q15:Value
personal-pol.philosophy .285 -.135
Q26:Feel lost if moved from
neighborhood -.117 .088
Q28:Feel strong ID
w/community .102 -.251
Q29:Enjoy living in
neighborhood -.019 .186
Q31:Public officials don't care
what I think -.033 .969
Q96:Chances being crime
victim very low .121 -.118
Q105:Education .911 .295
9

Structure Matrix
Function
1 2
Q105:Education .944* .105
Q15:Value
personal-pol.philosophy .278* -.094
Q96:Chances being crime
victim very low .187* -.129
Q26:Feel lost if moved from
neighborhood -.170* .034
Q29:Enjoy living in
neighborhood .121* .022
Q9:Value neigh-community .109* .022
Q31:Public officials don't care
what I think -.208 .914*
Q28:Feel strong ID
w/community .147 -.183*
Pooled within-groups correlations between discriminating
variables and standardized canonical discriminant functions
Variables ordered by absolute size of correlation within
function.
*. Largest absolute correlation between each variable and
any discriminant function
Functions at Group Centroids
Newinco
me
Function
1 2
1 -.635 -.088
2 .132 .177
3 .705 -.173
Unstandardized canonical
discriminant functions evaluated at
group means
10

Classification Statistics
Classification Processing Summary
Processed 482
Excluded Missing or out-of-range group
codes 0
At least one missing
discriminating variable 79
Used in Output 403
Prior Probabilities for Groups
Newinco
me Prior
Cases Used in Analysis
Unweighted Weighted
1 .333 120 120.000
2 .333 140 140.000
3 .333 82 82.000
Total 1.000 342 342.000
Classification Function Coefficients
Newincome
1 2 3
Q9:Value neigh-community .828 .838 .819
Q15:Value personal-pol.philosophy .657 .726 .806
Q26:Feel lost if moved from neighborhood .052 .035 .009
Q28:Feel strong ID w/community -.067 -.063 -.015
Q29:Enjoy living in neighborhood .903 .917 .885
Q31:Public officials don't care what I think .789 .863 .749
Q96:Chances being crime victim very low .554 .573 .605
Q105:Education 2.369 3.018 3.368
(Constant) -17.451 -20.989 -22.701
Fisher's linear discriminant functions
11
Territorial Map Canonical Discriminant Function 2 -4.0 -3.0 -2.0 -1.0 .0 1.0 2.0 3.0 4.0 ┼─────────┼─────────┼─────────┼─────────┼─────────┼─────────┼─────────┼─────────┼ 4.0 ┼ 12 23 ┼ │ 12 23 │ │ 12 23 │ │ 12 23 │ │ 12 23 │ │ 12 23 │ 3.0 ┼ ┼ ┼ 12 ┼ ┼ ┼ ┼ 23 ┼ ┼ │ 12 23 │ │ 12 23 │ │ 12 23 │ │ 12 23 │ │ 12 23 │ 2.0 ┼ ┼ ┼ 12 ┼ ┼ 23 ┼ ┼ ┼ │ 12 23 │ │ 12 23 │ │ 12 23 │ │ 12 23 │ │ 12 23 │ 1.0 ┼ ┼ ┼ ┼ 12 ┼ ┼23 ┼ ┼ ┼ │ 12 23 │ │ 12 23 │ │ 12 23 │ │ 12 23 │ │ 12 * 23 │ .0 ┼ ┼ ┼ ┼ 12 ┼ 23 ┼ ┼ ┼ ┼ │ * 12 23 * │ │ 12 23 │ │ 12 23 │ │ 123 │ │ 13 │ -1.0 ┼ ┼ ┼ ┼ 13 ┼ ┼ ┼ ┼ │ 13 │ │ 13 │ │ 13 │ │ 13 │ │ 13 │ -2.0 ┼ ┼ ┼ ┼ 13 ┼ ┼ ┼ ┼ │ 13 │ │ 13 │ │ 13 │ │ 13 │ │ 13 │ -3.0 ┼ ┼ ┼ ┼ 13 ┼ ┼ ┼ ┼ │ 13 │ │ 13 │ │ 13 │ │ 13 │ │ 13 │ -4.0 ┼ 13 ┼ ┼─────────┼─────────┼─────────┼─────────┼─────────┼─────────┼─────────┼─────────┼ -4.0 -3.0 -2.0 -1.0 .0 1.0 2.0 3.0 4.0 Canonical Discriminant Function 1 Symbols used in territorial map Symbol Group Label ------ ----- -------------------- 1 1 2 2 3 3 * Indicates a group centroid
12

Casewise Statistics
Case
Number
Actual
Group
Highest Group Second Highest Group Discriminant Scores
Predicted
Group
P(D>d | G=g)
P(G=g | D=d)
Squared
Mahalanobis
Distance to
Centroid Group
P(G=g
| D=d)
Squared
Mahalanobis
Distance to
Centroid
Function
1
Function
2
p df
Original 1 1 1 .930 2 .432 .146 2 .332 .669 -.435 -.414
2 2 3** .770 2 .599 .523 2 .309 1.850 1.424 -.246
3 1 1 .200 2 .825 3.215 2 .145 6.698 -2.421 -.246
4 1 1 .946 2 .515 .111 2 .307 1.145 -.776 -.391
5 3 3 .861 2 .560 .300 2 .312 1.471 1.104 -.547
6 1 2** .581 2 .453 1.087 3 .386 1.408 .755 1.013
7 1 1 .342 2 .589 2.149 2 .230 4.028 -.934 -1.523
8 2 3** .241 2 .751 2.844 2 .197 5.523 1.959 -1.300
9 2 2 .557 2 .458 1.171 1 .336 1.788 -.246 1.191
10 1 1 .216 2 .554 3.066 2 .227 4.849 -.764 -1.834
11 1 2** .773 2 .344 .516 1 .330 .599 .001 -.529
12 2 1** .943 2 .532 .117 2 .302 1.245 -.848 -.356
13 1 1 .801 2 .499 .443 2 .358 1.105 -.855 .540
14 3 2** .421 2 .460 1.729 1 .363 2.204 -.404 1.378
15 3 3 .428 2 .647 1.699 2 .245 3.641 1.296 -1.335
16 1 2** .170 2 .503 3.540 3 .381 4.094 1.046 1.822
17 1 3** .181 2 .507 3.422 2 .423 3.786 1.613 1.439
18 2 2 .188 2 .506 3.344 3 .370 3.967 .972 1.801
20 2 1** .975 2 .428 .050 2 .362 .389 -.484 .075
21 1 1 .824 2 .572 .388 2 .312 1.599 -1.128 .294
**. Misclassified case
13

Classification Resultsa
Newincome
Predicted Group Membership
Total 1 2 3
Original Count 1 71 28 21 120
2 40 45 55 140
3 11 16 55 82
Ungrouped cases 18 16 27 61
% 1 59.2 23.3 17.5 100.0
2 28.6 32.1 39.3 100.0
3 13.4 19.5 67.1 100.0
Ungrouped cases 29.5 26.2 44.3 100.0
a. 50.0% of original grouped cases correctly classified.
14

Table 1
Standardized discriminant function coefficients
IVs DF1
Standardized Coefficients
DF2 Standardized Coefficients
Education DF1 Correlation
Public officials’ opinion
DF2 Correlation Q9 -.009 .108 .109* .022
Q15 .285 -.135 .278* -.094 Q26 -.117 .088 -.170* .034 Q28 .102 -.251 .147 -.183* Q29 -.019 .186 .121* .022 Q31 -.033 .969 -.208 .914* Q96 .121 -.118 .187* -.129 Q105 .911 .295 .944* .105
* Indicates largest correlation between each variable and any discriminant function
15
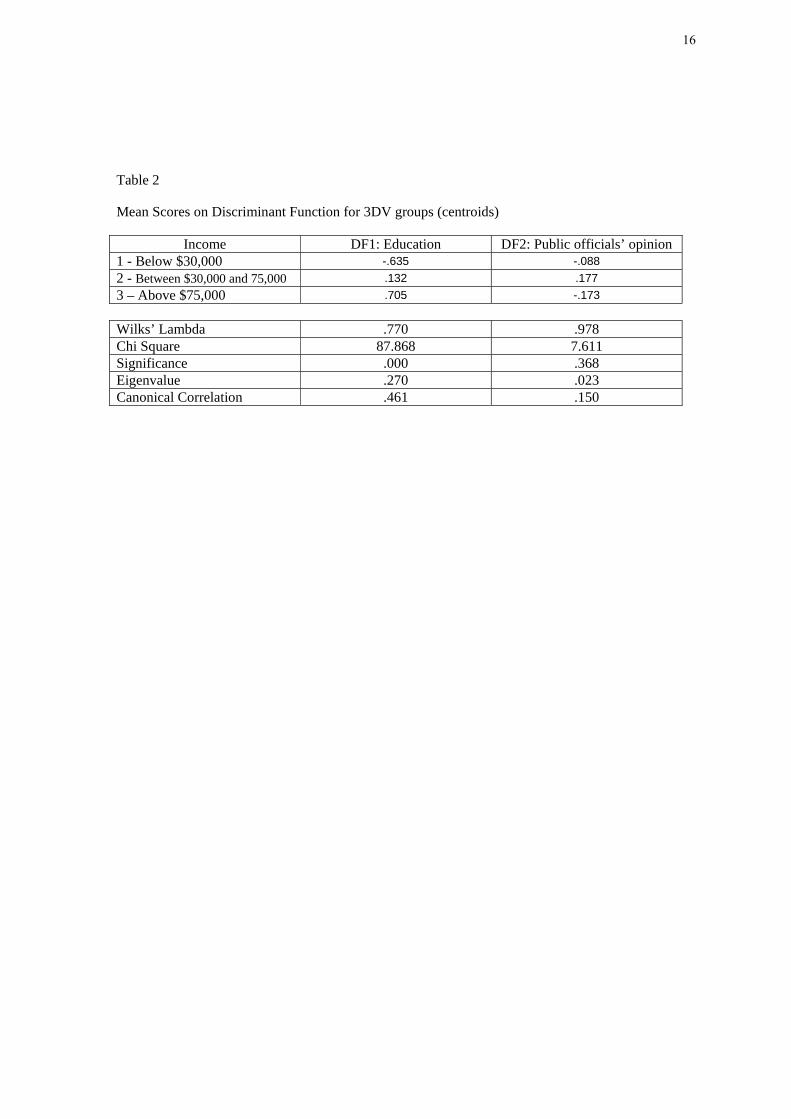
Table 2
Mean Scores on Discriminant Function for 3DV groups (centroids)
Income DF1: Education DF2: Public officials’ opinion 1 - Below $30,000 -.635 -.088 2 - Between $30,000 and 75,000 .132 .177 3 – Above $75,000 .705 -.173
Wilks’ Lambda .770 .978 Chi Square 87.868 7.611 Significance .000 .368 Eigenvalue .270 .023 Canonical Correlation .461 .150
16

Table 3
Classification Matrix results for 3 group discriminant analysis
Actual Group Predicted Group Group Actual Group
Size 1 – Below $30,000
2 - Between $30,000 and $75,000
3 – Above $75,000
1 - Below $30,000 120 71 28 21 2 - Between $30,000 and $75,000
140 40 45 55
3 - Above $75,000 82 11 16 55 Total 342 50.0% of original grouped cases correctly classified
Press’ Q:
N= 342
n= 171
K= 3
=
=
=42.75
df =1 on chi square table
Significant at less than .001
17

A discriminant function analysis was applied to assess how well an individual’s income
could be predicted from eight items from National community data set. These eight
discriminating independent variables include importance of neighborhood, political
philosophy, moving from neighborhoods, identification with community, enjoying
neighborhoods, public officials’ opinion, involved in a violent crime, and educational
level. The dependent variable is income, and was recoded from original 9 choices, to
include only three types of income categories: below $30,000, between $30,000 and
$75,000, and above $75,000. Before recoding, the original 9 choices for income were:
10,000 or less, $10,001 to $20,000, $20,001 to $30,000, $30,001 to $40,000, $40,001 to
$50,000, $50,001 to $75,000, $75,001 to $100,000, $100,001 to $150,000, and more than
$150,000.
After performing the analysis, two discriminant functions were derived. The two
functions were labeled “education” and “public officials’ opinion”. As Table 1 shows, the
first function is called “education” because the variables in this function are highly
correlated with the function; importance of neighborhoods or community (r =.109),
political philosophy (r=.278), moving from neighborhoods (r=-.170), enjoy
neighborhoods (r=.121), involved in in a violent crime (r=.187), and, primarily,
educational level (r=.944). The second function called “public officials’ opinion” has the
following two variables are highly correlated with the function; identification with
community (r=-.183) and public officials’ opinion (r=.914).
Looking at Table 2, it shows that only one discriminant function was statistically
significant, at a level of p< .001. The Wilks’ Lambda examines how much the groups
differ on the set of independent variables. The “education” discriminant function has a
18
significant value of < .001 and the Wilks’ Lambda is .770. The “Public officials’ opinion”
function was not significant with a p value of .368 and a Wilks’ Lambda value of .978.
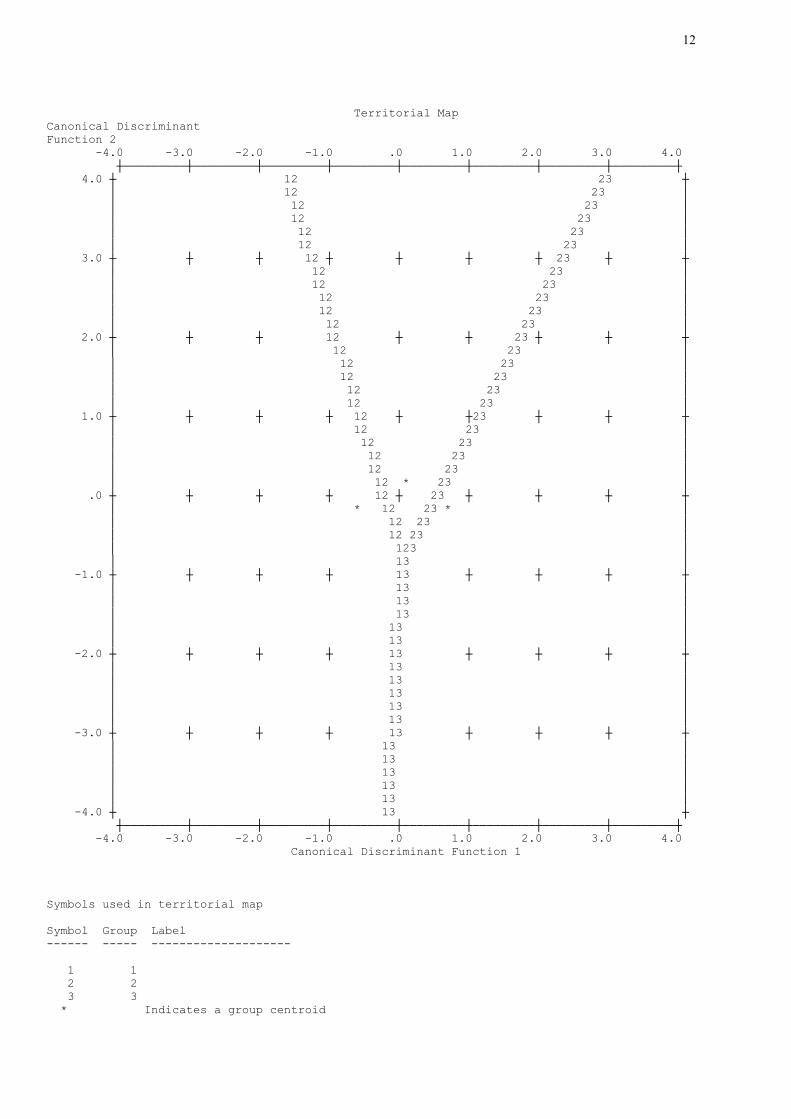
The group centroids show a pattern which suggests that people with income above
$75,000 have a higher educational level.
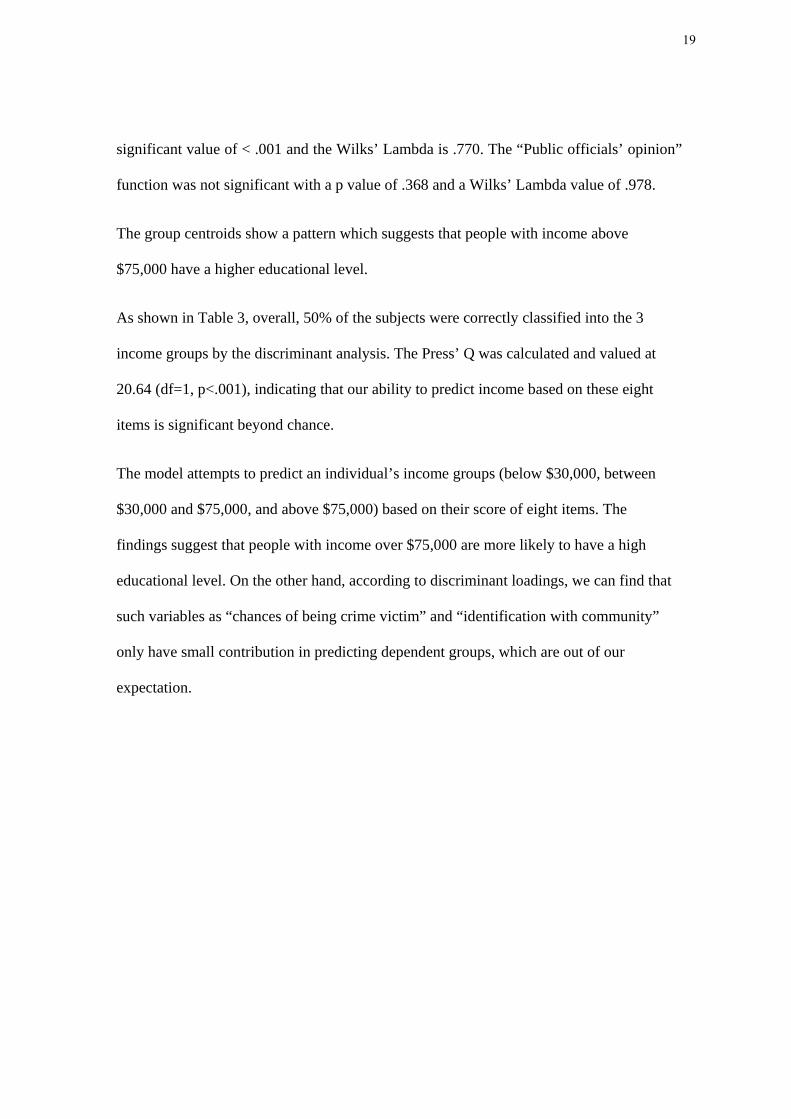
As shown in Table 3, overall, 50% of the subjects were correctly classified into the 3
income groups by the discriminant analysis. The Press’ Q was calculated and valued at
20.64 (df=1, p<.001), indicating that our ability to predict income based on these eight
items is significant beyond chance.
The model attempts to predict an individual’s income groups (below $30,000, between
$30,000 and $75,000, and above $75,000) based on their score of eight items. The
findings suggest that people with income over $75,000 are more likely to have a high
educational level. On the other hand, according to discriminant loadings, we can find that
such variables as “chances of being crime victim” and “identification with community”
only have small contribution in predicting dependent groups, which are out of our
expectation.
19
Related Documents