Discovery of a Byzantine Church in Iznik/Nicaea, Turkey: an Educational Case History of Geophysical Prospecting with Combined Methods in Urban Areas W. RABBEL 1 * , E. ERKUL 1 , H. STÜMPEL 1 , T. WUNDERLICH 1 , R. PAŠTEKA 2 , J. PAPCO 3 , P. NIEWÖHNER 4 , Ş. BARIŞ 5 , O. ÇAKIN 5 AND E. PEKŞEN 5 1 Institut für Geowissenschaften, Otto-Hahn-Platz 1, 24118, Kiel, Germany 2 Department of Applied and Environmental Geophysics, Faculty of Sciences, Comenius University, Mlynska dol., 842 15, Bratislava, Slovakia 3 Department of Theoretical Geodesy, Faculty of Civil Engineering, Slovak University of Technology, Radlinského 11, 813 68, Bratislava, Slovakia 4 Institute of Archaeology, University of Oxford, 36 Beaumont Street, Oxford OX1 2PG, UK 5 Kocaeli Üniversitesi, Mühendislik Fakültesi, Jeofizik Mühendisligi Bölümü, 41040, Izmit-Kocaeli, Turkey ABSTRACT The city of Iznik, called Nikaia or Nicaea in ancient times, is located in northwest Anatolia, Turkey. Nicaea is renowned especially for the first Council of Nicaea convened by the Roman emperor Constantine in AD 325 in an attempt to unify the Church. During an international field course on the geophysical exploration of archaeological targets we detected the remains of a small previously unknown Byzantine church on a fallow lot of land inside the city. The church is oriented parallel to the ancient Hippodamian street grid that deviates from the modern street system of the quarter by ~45°. We found the contours of the nave, two aisles and three apses as well as evidence of a partly refilled grave. The geophysical measurements indicate that the foundations of the church consist of low-porosity hard rock with a low magnetic susceptibility, probably limestone or sandstone embedded in fluvial sediments. The field study is based on ground-penetrating radar (GPR), magnetics, electric resistivity tomography (ERT) and microgravimetry. It highlights the strength and necessity of combining different geophysical methods in exploring and characterizing archaeological sites. In fact, the foundation walls of the church do not show any magnetic anomaly but could be delineated clearly only by GPR. The wall remains appear as highly resistive spots in ERT. By converting the three-dimensional GPR image into an electric resistivity model we could verify that the ERT results fully correspond to the ruins found by GPR. The structure interpreted as a loosely refilled grave is indicated mainly by a weak gravity anomaly (~9 μGal) and a diffuse reflection pattern in GPR. Electric forward modelling shows that this structure leads to an additional increase of a high resistivity anomaly, which is primarily caused by foundation rocks, but it cannot be resolved within the ERT pattern a priori. Copyright © 2014 John Wiley & Sons, Ltd. Key words: Ground-penetrating radar; electrical resistivity tomography; gravimetry; magnetic; Byzantine church; combined interpretation Introduction Using geophysical methods to solve archaeological questions requires careful analysis of the interplay of geological background, embedded archaeological targets, their physical properties, dimensions and the resolution potential of the applied exploration method. Teaching this sort of thought, together with imparting experience in geophysical field measurements and interpretation, was the objective of a series of interna- tional summer schools organized annually from 2008 to 2010 by the Universities of Kiel (Germany), Bratislava (Slovakia) and Izmit/Kocaeli (Turkey) under the umbrella of the European Union Erasmus programme. Course participants were students of geophysics and archaeology from the three partner * Correspondence to: W. Rabbel, Institut für Geowissenschaften, Otto-Hahn-Platz 1, 24118 Kiel, Germany. E-mail: wrabbel@geophysik. uni-kiel.de Copyright © 2014 John Wiley & Sons, Ltd. Received 3 February 2014 Accepted 2 July 2014 Archaeological Prospection Archaeol. Prospect. (2014) Published online in Wiley Online Library (wileyonlinelibrary.com) DOI: 10.1002/arp.1491

Welcome message from author
This document is posted to help you gain knowledge. Please leave a comment to let me know what you think about it! Share it to your friends and learn new things together.
Transcript
* Correspondence to: W.Otto-Hahn-Platz 1, 24118 Kuni-kiel.de
Copyright © 2014 John
Archaeological ProspectionArchaeol. Prospect. (2014)Published online in Wiley Online Library(wileyonlinelibrary.com) DOI: 10.1002/arp.1491
Discovery of a Byzantine Church inIznik/Nicaea, Turkey: an Educational CaseHistory of Geophysical Prospecting withCombined Methods in Urban Areas
W. RABBEL1*, E. ERKUL1, H. STÜMPEL1, T. WUNDERLICH1, R. PAŠTEKA2,J. PAPCO3, P. NIEWÖHNER4, Ş. BARIŞ5, O. ÇAKIN5 AND E. PEKŞEN5
1 Institut für Geowissenschaften, Otto-Hahn-Platz 1, 24118, Kiel, Germany2 Department of Applied and Environmental Geophysics, Faculty of Sciences, Comenius University,Mlynska dol., 842 15, Bratislava, Slovakia3 Department of Theoretical Geodesy, Faculty of Civil Engineering, Slovak University of Technology,Radlinského 11, 813 68, Bratislava, Slovakia4 Institute of Archaeology, University of Oxford, 36 Beaumont Street, Oxford OX1 2PG, UK5 Kocaeli Üniversitesi, Mühendislik Fakültesi, Jeofizik Mühendisligi Bölümü, 41040, Izmit-Kocaeli, Turkey
ABSTRACT The city of Iznik, called Nikaia or Nicaea in
ancient times, is located in northwest Anatolia, Turkey. Nicaea is renownedespecially for the first Council of Nicaea convened by the Roman emperor Constantine in AD 325 in an attempt to unifythe Church. During an international field course on the geophysical exploration of archaeological targets we detectedthe remains of a small previously unknown Byzantine church on a fallow lot of land inside the city. The church isoriented parallel to the ancient Hippodamian street grid that deviates from the modern street system of the quarterby ~45°. We found the contours of the nave, two aisles and three apses as well as evidence of a partly refilled grave.The geophysical measurements indicate that the foundations of the church consist of low-porosity hard rock with alow magnetic susceptibility, probably limestone or sandstone embedded in fluvial sediments. The field study is basedon ground-penetrating radar (GPR), magnetics, electric resistivity tomography (ERT) and microgravimetry. It highlightsthe strength and necessity of combining different geophysical methods in exploring and characterizing archaeologicalsites. In fact, the foundation walls of the church do not show any magnetic anomaly but could be delineated clearlyonly by GPR. The wall remains appear as highly resistive spots in ERT. By converting the three-dimensional GPRimage into an electric resistivity model we could verify that the ERT results fully correspond to the ruins found byGPR. The structure interpreted as a loosely refilled grave is indicated mainly by a weak gravity anomaly (~9 μGal)and a diffuse reflection pattern in GPR. Electric forward modelling shows that this structure leads to an additionalincrease of a high resistivity anomaly, which is primarily caused by foundation rocks, but it cannot be resolved withinthe ERT pattern a priori. Copyright © 2014 John Wiley & Sons, Ltd.Key words: Ground-penetrating radar; electrical resistivity tomography; gravimetry; magnetic; Byzantine church;combined interpretation
Introduction
Using geophysical methods to solve archaeologicalquestions requires careful analysis of the interplay ofgeological background, embedded archaeologicaltargets, their physical properties, dimensions and the
Rabbel, Institut für Geowissenschaften,iel, Germany. E-mail: wrabbel@geophysik.
Wiley & Sons, Ltd.
resolution potential of the applied exploration method.Teaching this sort of thought, together with impartingexperience in geophysical field measurements andinterpretation, was the objective of a series of interna-tional summer schools organized annually from 2008to 2010 by the Universities of Kiel (Germany),Bratislava (Slovakia) and Izmit/Kocaeli (Turkey)under the umbrella of the European Union Erasmusprogramme. Course participants were students ofgeophysics and archaeology from the three partner
Received 3 February 2014Accepted 2 July 2014
W. Rabbel et al.
universities. In order to relate the course programmemost closely to realworld conditions,fieldmeasurementswere generally performed on previously unexploredtargets that were proposed by the local municipalities,archaeological institutions or on-going projects.Amongst the archaeological targets investigated one
stood out, as it turned into a key example of the applica-bility and mutual completion of different near-surfacegeophysical exploration methods – the detection of aByzantine church in the city of Iznik, the ancient Nicaea,Turkey. The sequence of measurements, leading to thedetection and geophysical characterization of theremnants of this church, and their archaeological inter-pretation are the subject of this article. It comprisesmagnetics, ground penetrating radar (GPR), electricresistivity tomography (ERT) and microgravimetricinvestigations. The study demonstrates the strengthsand weaknesses of the different methods and how theiroutcomes combine in the interpretation. Indeed, weare presenting an example where magnetics – as thebackbone of archaeological prospection – fails to detecta major archaeological target. The archaeologicalmeaning of the geophysical results is carefully analysedand viewed in the context of the historical topographyof Iznik/Nicaea.The geophysical methods applied in our course have
become increasingly established in archaeologicalprospecting since the late 1980s. Therefore, we referto the literature regarding basics and methods. Intro-ductions to near-surface geophysical exploration andarchaeological applications can be found, for example,in Scollar (1990), Butler (2005), Witten (2006) Aspinellet al. (2008) and Conyers (2013). Studies showing thevalue of combining different geophysical methods inarchaeological prospecting have been publishedsporadically since the 1990s, with increasing frequencyin the past decade (e.g. Brizzolari et al., 1992;Cammarano et al., 1997, 1998; Stümpel et al., 1999; Erkulet al., 2007; Gaffney, 2008). Niewöhner et al. (2013),Panisova et al. (2013), Udphuay et al. (2010) andPerez-Garcia et al. (2009) recently provided field exam-ples of geophysical investigations of remains of ancientsacral buildings based on GPR and combined methods.The investigation area of this study is a vacant lot of
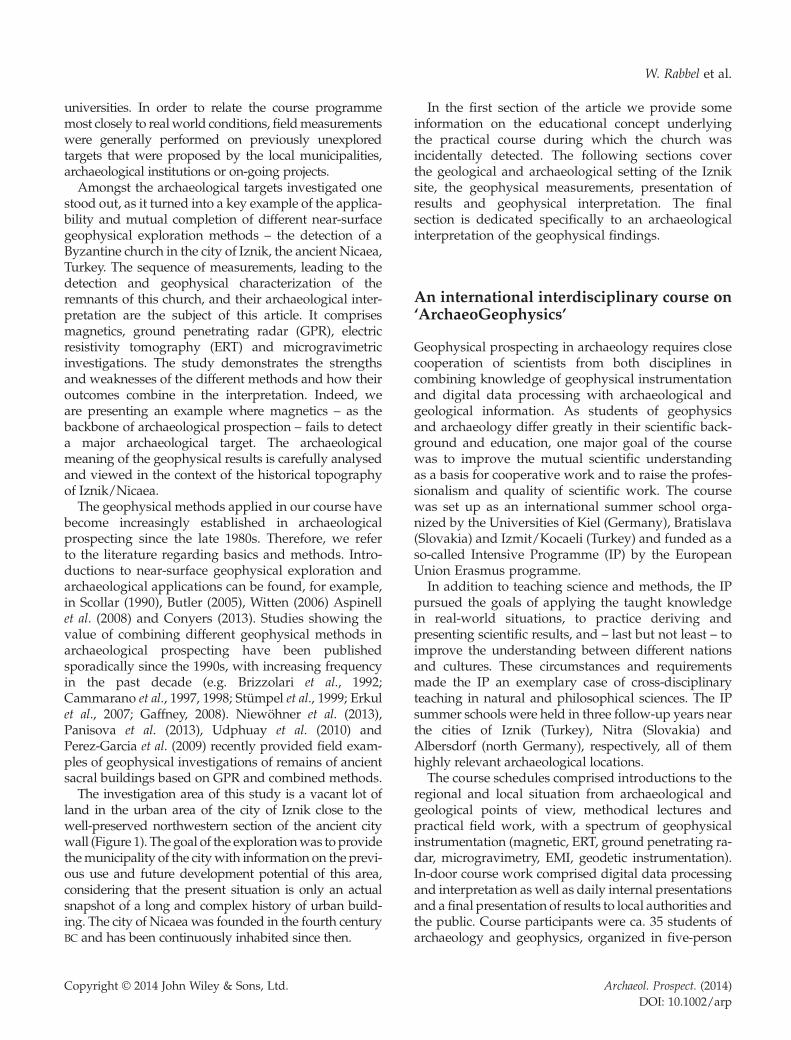
land in the urban area of the city of Iznik close to thewell-preserved northwestern section of the ancient citywall (Figure 1). The goal of the explorationwas to providethemunicipality of the citywith information on the previ-ous use and future development potential of this area,considering that the present situation is only an actualsnapshot of a long and complex history of urban build-ing. The city of Nicaea was founded in the fourth centuryBC and has been continuously inhabited since then.
Copyright © 2014 John Wiley & Sons, Ltd.
In the first section of the article we provide someinformation on the educational concept underlyingthe practical course during which the church wasincidentally detected. The following sections coverthe geological and archaeological setting of the Izniksite, the geophysical measurements, presentation ofresults and geophysical interpretation. The finalsection is dedicated specifically to an archaeologicalinterpretation of the geophysical findings.
An international interdisciplinary course on‘ArchaeoGeophysics’
Geophysical prospecting in archaeology requires closecooperation of scientists from both disciplines incombining knowledge of geophysical instrumentationand digital data processing with archaeological andgeological information. As students of geophysicsand archaeology differ greatly in their scientific back-ground and education, one major goal of the coursewas to improve the mutual scientific understandingas a basis for cooperative work and to raise the profes-sionalism and quality of scientific work. The coursewas set up as an international summer school orga-nized by the Universities of Kiel (Germany), Bratislava(Slovakia) and Izmit/Kocaeli (Turkey) and funded as aso-called Intensive Programme (IP) by the EuropeanUnion Erasmus programme.In addition to teaching science and methods, the IP
pursued the goals of applying the taught knowledgein real-world situations, to practice deriving andpresenting scientific results, and – last but not least – toimprove the understanding between different nationsand cultures. These circumstances and requirementsmade the IP an exemplary case of cross-disciplinaryteaching in natural and philosophical sciences. The IPsummer schools were held in three follow-up years nearthe cities of Iznik (Turkey), Nitra (Slovakia) andAlbersdorf (north Germany), respectively, all of themhighly relevant archaeological locations.The course schedules comprised introductions to the
regional and local situation from archaeological andgeological points of view, methodical lectures andpractical field work, with a spectrum of geophysicalinstrumentation (magnetic, ERT, ground penetrating ra-dar, microgravimetry, EMI, geodetic instrumentation).In-door course work comprised digital data processingand interpretation as well as daily internal presentationsand a final presentation of results to local authorities andthe public. Course participants were ca. 35 students ofarchaeology and geophysics, organized in five-person
Archaeol. Prospect. (2014)DOI: 10.1002/arp
Figure 1. Location maps: simplified street map of the city of Iznik (top) and plan of the investigation site (bottom). The location and orientation of thenewly detected church are shown in the overlain GPR time slice: the church axis is parallel to the orientation of the Hippodamian street system.Crosses mark measurements that were taken in the ruins of a church east of Bağkur Evleri.
Byzantine Church Iznik
groups, each including members from all countries anddisciplines. In cooperation with the local authorities, rel-evant new investigation sites were selected in order todemonstrate the different potential and requirementsof geophysical prospection in archaeology. The sitescomprised urban areas as well as sites in the country-side, such as the prospecting of future constructionground, ancient and recent water-supply systems, pre-historic settlement mounds and geological features.The field examples were chosen in order to demonstratethe advantages, and often the need, to combine different
Copyright © 2014 John Wiley & Sons, Ltd.
exploration methods in order to obtain conclusiveresults in terms of imaging and material (soil, rock)analysis. Also the strengths and weaknesses of thedifferent prospectionmethods were to be demonstrated.The courses contained the following teaching
elements intended to bring motivation and excitementto both students and teachers:
• project-oriented work performed by applying state-of-the-art professional equipment for measurement andinterpretation based on cross-disciplinary discussion;
Archaeol. Prospect. (2014)DOI: 10.1002/arp
W. Rabbel et al.
• availability of relevant investigation sites, subject ofthe interest of external experts or authorities actingas ‘customers’;
• daily archaeological discoveries as such and relateddiscussions;
• daily internal plenary meeting with presentations ofintermediate results and final presentation to thepublic with attendance of external scientists, localauthorities and interested citizens;
• last but not least, an inspiring international atmo-sphere, communication and community experience.
The incidental detection of the Byzantine church that isthe subject of this articlewas thehighlight of thefirst of theseIP summer schools, which was held in the area of Iznik.
Geological and archaeological setting
The city of Iznik is built on fluvial sediments overlyingand derived from Mesozoic and Palaeozoic rocks of theso-called Iznik Metamorphic Assemblage (e.g. Yılmazet al., 1995). This bedrock sequence consists in large partsof metamorphosed limestone and pelagic sediments withintercalated basaltic lavas. At the investigation site thesoil appeared homogeneous, compacted, and was driedout from the hot climate. As typical for an urban environ-ment, geological sediments were found mixed withanthropogenic remains such as sherds and rubbish,which may create significant heterogeneity at centimetreto decimetre scales near the Earth’s surface. The area tobe prospected, about 30×50m in size, was cleared ofsuperficial waste before the beginning of investigations.The ancient city of Nicaea was set up in an orthogonal
north–south and east–west oriented street system – theso-called Hippodamian system – that can be still berecognized today (Karnapp and Schneider, 1938).However, streets and modern building that surroundthe open area are oriented NW–SE, orthogonal tothe Roman city wall nearby (Figure 1), providing apossibility to distinguish ancient from modern housefoundations. Intact buildings from Roman and Byzan-tine times elsewhere at Nicaea indicate that foundationsof ruined structures from those periods may be foundclose to the Earth’s surface at depths of 0.5 to 2m. Thesefoundations are normally built of limestone. Risingwalls may also include layers of burnt brick.
Geophysical data acquisition and processing
Magnetic mapping is generally considered as the back-bone of geophysical prospecting of archaeological
Copyright © 2014 John Wiley & Sons, Ltd.
sites, although there are many geological and archaeo-logical settings where it may fail. With regard to theurban exploration target of the present study, basicallytwo problems were to be expected: (i) strong near-surface heterogeneity caused by rubbish of highmagnetic susceptibility or remanent magnetizationthat may obscure anomaly patterns of archaeologicalremains; and (ii) generally weak magnetizationcontrast between, for example, fluvial sediment andembedded limestone foundations. Therefore, the initialsurvey, performed in July 2008, was set up in twocomponents: magnetic mapping covering the wholesite and complementary three-dimensional GPR mea-surements on a smaller area considered to be represen-tative. The magnetic map did not show any evidenceof buried construction whereas the GPR controlbrought clear evidence of spatially coherent structureunderneath. In the following the GPR survey wasextended and repeated with antennae of differentfrequencies (200 and 400MHz) in order to optimizedepth penetration and resolution. At this stage thecontours of a small church were discovered. Based onthe resulting floor plan, ERT was carried out along aswath in order to better characterize the constructionmaterial. In the GPR sections an isolated patternappeared that could correspond to a grave, but couldnot be identified definitively. The question whether ornot this structure represented an underground cavitywas finally approached by a microgravity survey.The magnetic measurements were carried out with
six differential fluxgate magnetometers mounted on ahandcart with a horizontal spacing of 50 cm. Thesensors (manufactured by Foerster) are 40 cm long,drift compensated and have a sensitivity of ±0.3 nT.The output represents the difference of the verticalcomponent of the Earth’s magnetic field between 20and 60 cm above ground. Positioning was performedsynchronously with a Leica DGPS of 2 cm relativelocation accuracy. Data were sampled while traversing(‘inline’) with ~2 cm spacing. After the measurementsthe trend was removed from the inline records andthe whole dataset resampled and interpolated into aregular 20 × 20 cm grid. The main magnetic anomaliesof point sources (dipoles) show half-widths approxi-mately equal to the distance between point sourceand sensor (half-width means the width betweenpoints where the amplitude is half the extremum).Therefore, the magnetic array is dense enough tosample the anomalies of even small objects lying closebeneath the Earth’s surface.The GPR survey was performed along parallel
profiles with a GSSI SIR-20 unit and 200 and 400MHzantennae. Due to its higher centre frequency and smaller
Archaeol. Prospect. (2014)DOI: 10.1002/arp
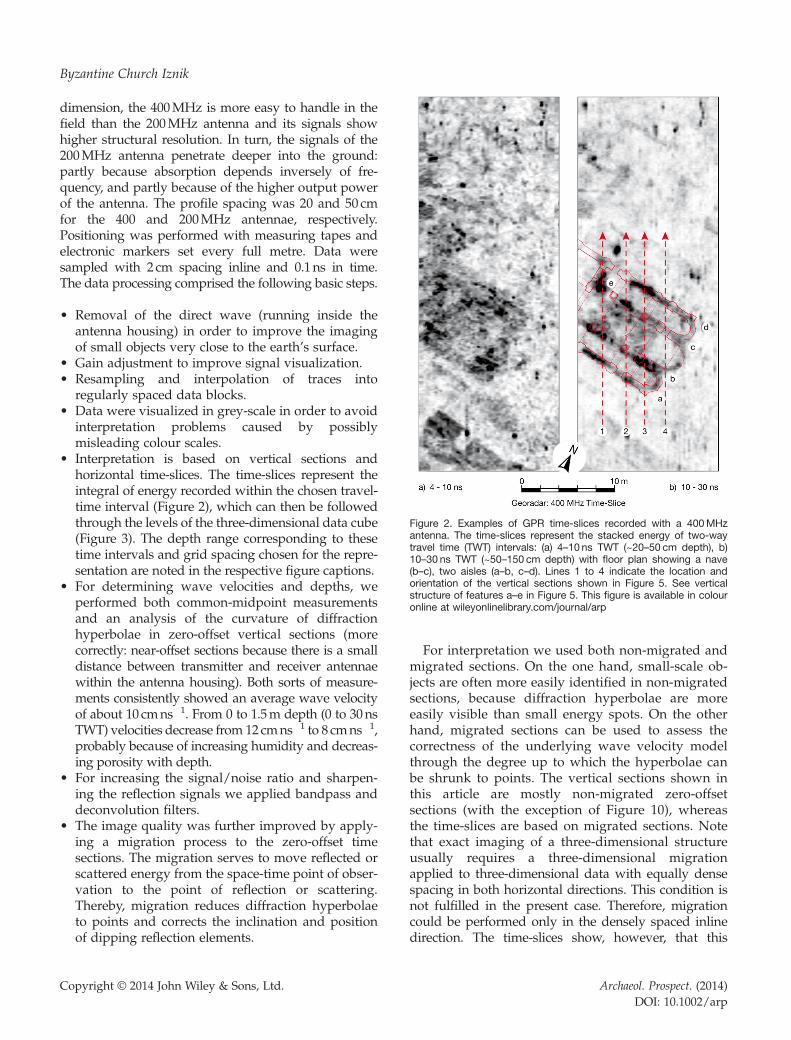
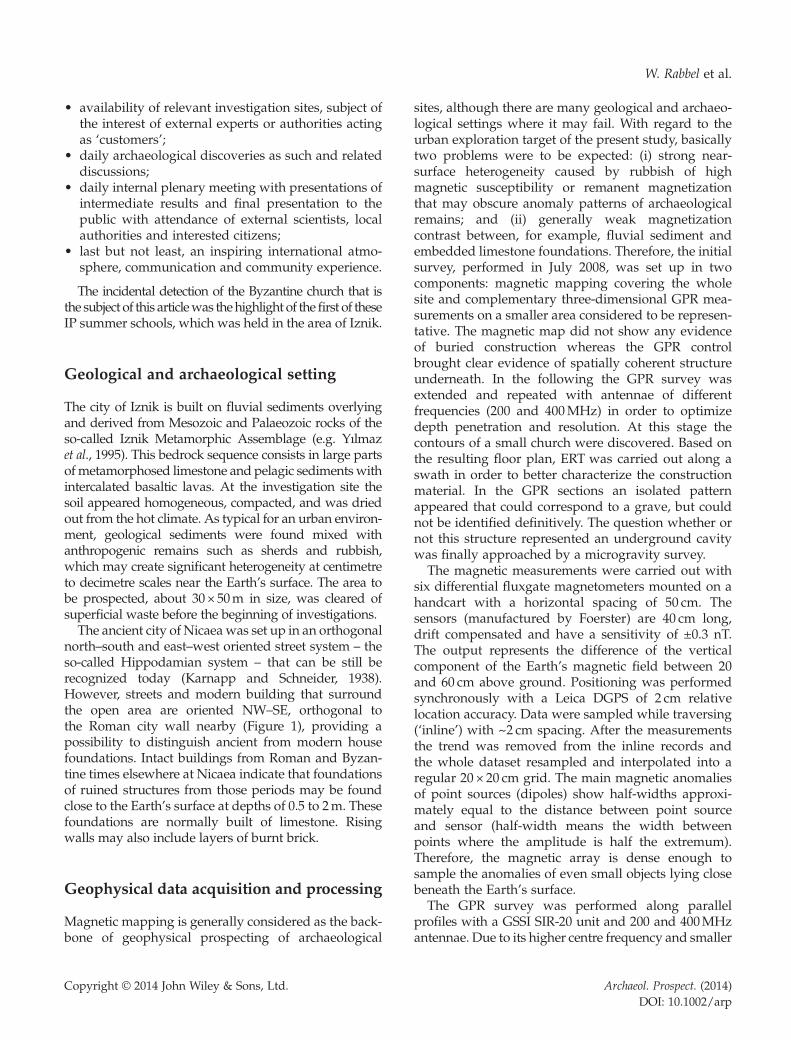
Figure 2. Examples of GPR time-slices recorded with a 400MHzantenna. The time-slices represent the stacked energy of two-waytravel time (TWT) intervals: (a) 4–10 ns TWT (~20–50 cm depth), b)10–30 ns TWT (~50–150 cm depth) with floor plan showing a nave(b–c), two aisles (a–b, c–d). Lines 1 to 4 indicate the location andorientation of the vertical sections shown in Figure 5. See verticalstructure of features a–e in Figure 5. This figure is available in colouronline at wileyonlinelibrary.com/journal/arp
Byzantine Church Iznik
dimension, the 400MHz is more easy to handle in thefield than the 200MHz antenna and its signals showhigher structural resolution. In turn, the signals of the200MHz antenna penetrate deeper into the ground:partly because absorption depends inversely of fre-quency, and partly because of the higher output powerof the antenna. The profile spacing was 20 and 50 cmfor the 400 and 200MHz antennae, respectively.Positioning was performed with measuring tapes andelectronic markers set every full metre. Data weresampled with 2 cm spacing inline and 0.1ns in time.The data processing comprised the following basic steps.
• Removal of the direct wave (running inside theantenna housing) in order to improve the imagingof small objects very close to the earth’s surface.
• Gain adjustment to improve signal visualization.• Resampling and interpolation of traces into
regularly spaced data blocks.• Data were visualized in grey-scale in order to avoid
interpretation problems caused by possiblymisleading colour scales.
• Interpretation is based on vertical sections andhorizontal time-slices. The time-slices represent theintegral of energy recorded within the chosen travel-time interval (Figure 2), which can then be followedthrough the levels of the three-dimensional data cube(Figure 3). The depth range corresponding to thesetime intervals and grid spacing chosen for the repre-sentation are noted in the respective figure captions.
• For determining wave velocities and depths, weperformed both common-midpoint measurementsand an analysis of the curvature of diffractionhyperbolae in zero-offset vertical sections (morecorrectly: near-offset sections because there is a smalldistance between transmitter and receiver antennaewithin the antenna housing). Both sorts of measure-ments consistently showed an average wave velocityof about 10 cmns�1. From 0 to 1.5m depth (0 to 30nsTWT) velocities decrease from 12cmns�1 to 8 cmns�1,probably because of increasing humidity and decreas-ing porosity with depth.
• For increasing the signal/noise ratio and sharpen-ing the reflection signals we applied bandpass anddeconvolution filters.
• The image quality was further improved by apply-ing a migration process to the zero-offset timesections. The migration serves to move reflected orscattered energy from the space-time point of obser-vation to the point of reflection or scattering.Thereby, migration reduces diffraction hyperbolaeto points and corrects the inclination and positionof dipping reflection elements.
Copyright © 2014 John Wiley & Sons, Ltd.
For interpretation we used both non-migrated andmigrated sections. On the one hand, small-scale ob-jects are often more easily identified in non-migratedsections, because diffraction hyperbolae are moreeasily visible than small energy spots. On the otherhand, migrated sections can be used to assess thecorrectness of the underlying wave velocity modelthrough the degree up to which the hyperbolae canbe shrunk to points. The vertical sections shown inthis article are mostly non-migrated zero-offsetsections (with the exception of Figure 10), whereasthe time-slices are based on migrated sections. Notethat exact imaging of a three-dimensional structureusually requires a three-dimensional migrationapplied to three-dimensional data with equally densespacing in both horizontal directions. This condition isnot fulfilled in the present case. Therefore, migrationcould be performed only in the densely spaced inlinedirection. The time-slices show, however, that this
Archaeol. Prospect. (2014)DOI: 10.1002/arp
Figure 3. Three-dimensional views of GPR data volume. Amplitudesrepresent the average reflection energy recorded in TWT intervals of2 ns. This figure is available in colour online at wileyonlinelibrary.com/journal/arp
W. Rabbel et al.
two-dimensional migration reduced the diffraction hy-perbolae enough to enable sharp images of under-ground walls.For the DC-electric resistivity profiling we used a
RESECS multi-electrode unit (manufactured byGeoserve). An area of 9m×28m was covered by 10profiles with a profile spacing of 1m and an inline elec-trode spacing of 0.5m. Both Wenner–alpha (WA) anddipole–dipole (DD) configurations were applied. Theelectrode spacing of WA was varied in steps of 0.5mfrom 0.5m to a maximum of 7.5m, corresponding toa spread width of 1.5–22.5m. For DD a dipole lengthof 0.5m was used and dipole distance varied from0.5 to 4.5m in steps of 0.5m. Before the tomographicinversion, field data were edited by rejecting datapoints that showed standard deviations> 10%. The
Copyright © 2014 John Wiley & Sons, Ltd.
ERTwas performed in both two and three dimensionsby applying a joint inversion to WA and DD data(Res3DInv software by Loke and Barker, 1995; Loke,2013). The applied tomographic inversion is based onminimizing the sum of absolute values of the residualsof apparent resistivities (L1-norm), which is lesssensitive to outliers and scattered data points than aleast-squares fit (L2-norm). Two- and three-dimensionalinversions converged after the third and fifth iterationsleaving final root mean square residuals of 8 and 16%,respectively: the Jacobian matrix was recalculated aftereach iteration.Based on the GPR results a 100m2 area was selected
where microgravimetric measurements were performedwith 1m grid-point spacing. We used a Scintrex CG-5gravity meter with an observation cycle of 60 s on eachpoint. The edited data set used for interpretation in-cludes only gravity data points with a standard devia-tion lower than 40 μGal. From these raw data averagevalueswere computed that show errors of ±3 to ±5 μGal.We applied a drift correction and a simple Bouguer cor-rection to the field data using a correction density of2000 kgm�3. The regional field component was approx-imated by the linear trend and removed from the data.Finally, data gaps caused by editing were filled by inter-polation in order to generate a residual anomaly map.
Results of geophysical measurements
Ground penetrating radar
Coherent structure – in form of locally concentrateddiffraction hyperbolae and horizontally extendingreflection elements – was identified previously inthe first GPR measurements. Compiled into horizontalslices these measurements show a rectangularpartitioning of the uppermost layer (20–50 cm depthreferred to as Stratum I), corresponding to houseconstructions, from which the floor plan of a smallchurch crystallizes as the depth of the slices increase(Figures 2 and 3). Time slices of greater depth levels(e.g. 50–150 cm in Figure 2 right) clearly show the planof a nave with two side aisles and curved apses. Thewhole building seems to be ca. 15m long and 10mwide. In the vertical sections (Figure 4) the remains ofthe wall construction show up as dense stacks ofdiffraction hyperbolae. The GPR signals from the wallscan be traced down to 40 ns two-way traveltime (TWT)(ca. 2m depth). The time-slice sequence of Figure 5provides a closer look at the interior of the buildingat different depth levels. The vertical resolution is ofthe order of 30 cm. The time-slices show that the space
Archaeol. Prospect. (2014)DOI: 10.1002/arp
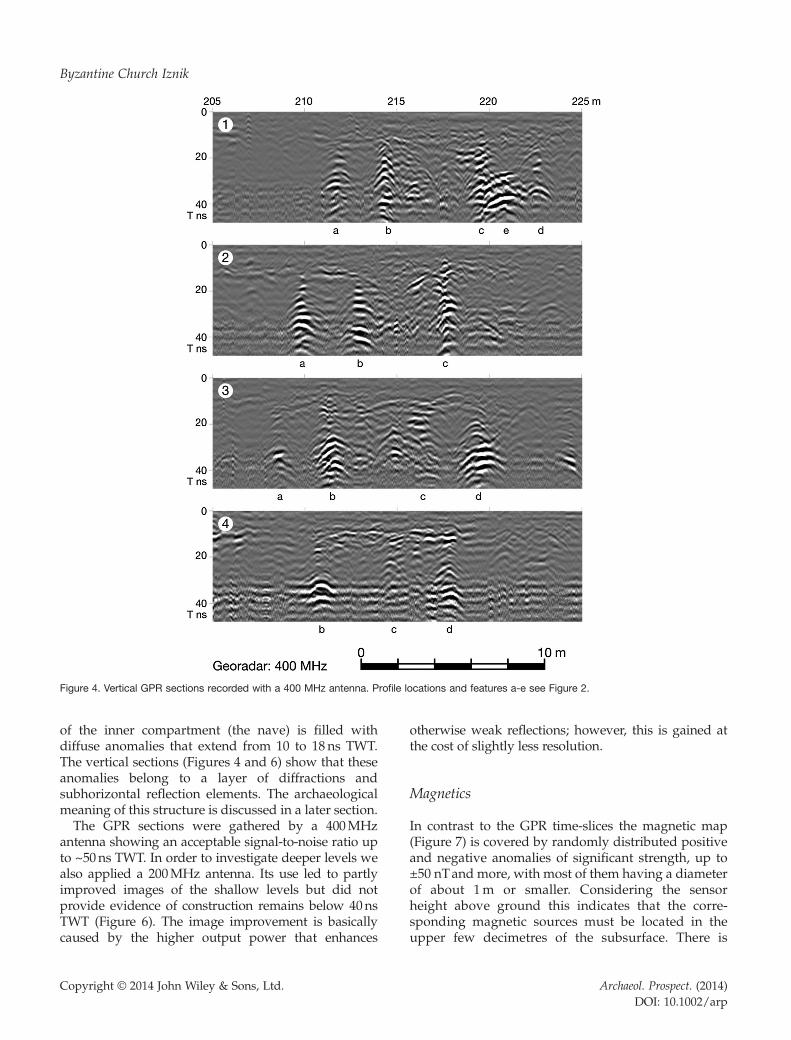
Figure 4. Vertical GPR sections recorded with a 400 MHz antenna. Profile locations and features a-e see Figure 2.
Byzantine Church Iznik
of the inner compartment (the nave) is filled withdiffuse anomalies that extend from 10 to 18 ns TWT.The vertical sections (Figures 4 and 6) show that theseanomalies belong to a layer of diffractions andsubhorizontal reflection elements. The archaeologicalmeaning of this structure is discussed in a later section.The GPR sections were gathered by a 400MHz
antenna showing an acceptable signal-to-noise ratio upto ~50ns TWT. In order to investigate deeper levels wealso applied a 200MHz antenna. Its use led to partlyimproved images of the shallow levels but did notprovide evidence of construction remains below 40nsTWT (Figure 6). The image improvement is basicallycaused by the higher output power that enhances
Copyright © 2014 John Wiley & Sons, Ltd.
otherwise weak reflections; however, this is gained atthe cost of slightly less resolution.
Magnetics
In contrast to the GPR time-slices the magnetic map(Figure 7) is covered by randomly distributed positiveand negative anomalies of significant strength, up to±50 nTand more, with most of them having a diameterof about 1m or smaller. Considering the sensorheight above ground this indicates that the corre-sponding magnetic sources must be located in theupper few decimetres of the subsurface. There is
Archaeol. Prospect. (2014)DOI: 10.1002/arp
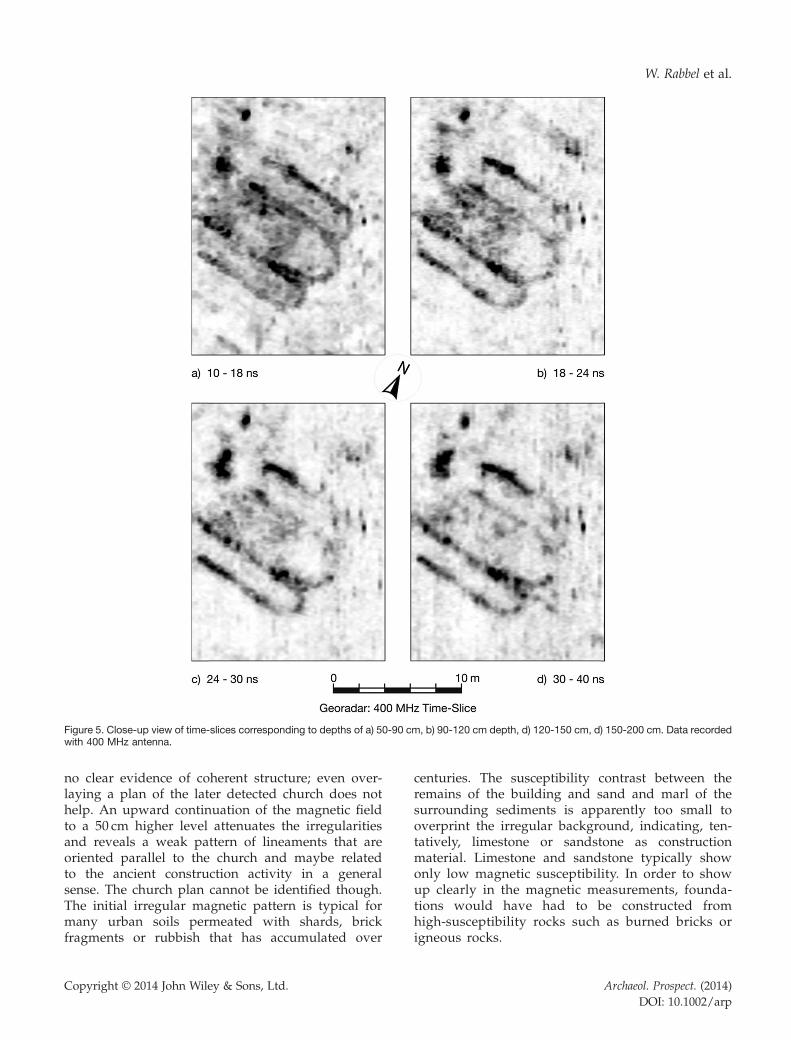
Figure 5. Close-up view of time-slices corresponding to depths of a) 50-90 cm, b) 90-120 cm depth, d) 120-150 cm, d) 150-200 cm. Data recordedwith 400 MHz antenna.
W. Rabbel et al.
no clear evidence of coherent structure; even over-laying a plan of the later detected church does nothelp. An upward continuation of the magnetic fieldto a 50 cm higher level attenuates the irregularitiesand reveals a weak pattern of lineaments that areoriented parallel to the church and maybe relatedto the ancient construction activity in a generalsense. The church plan cannot be identified though.The initial irregular magnetic pattern is typical formany urban soils permeated with shards, brickfragments or rubbish that has accumulated over
Copyright © 2014 John Wiley & Sons, Ltd.
centuries. The susceptibility contrast between theremains of the building and sand and marl of thesurrounding sediments is apparently too small tooverprint the irregular background, indicating, ten-tatively, limestone or sandstone as constructionmaterial. Limestone and sandstone typically showonly low magnetic susceptibility. In order to showup clearly in the magnetic measurements, founda-tions would have had to be constructed fromhigh-susceptibility rocks such as burned bricks origneous rocks.
Archaeol. Prospect. (2014)DOI: 10.1002/arp
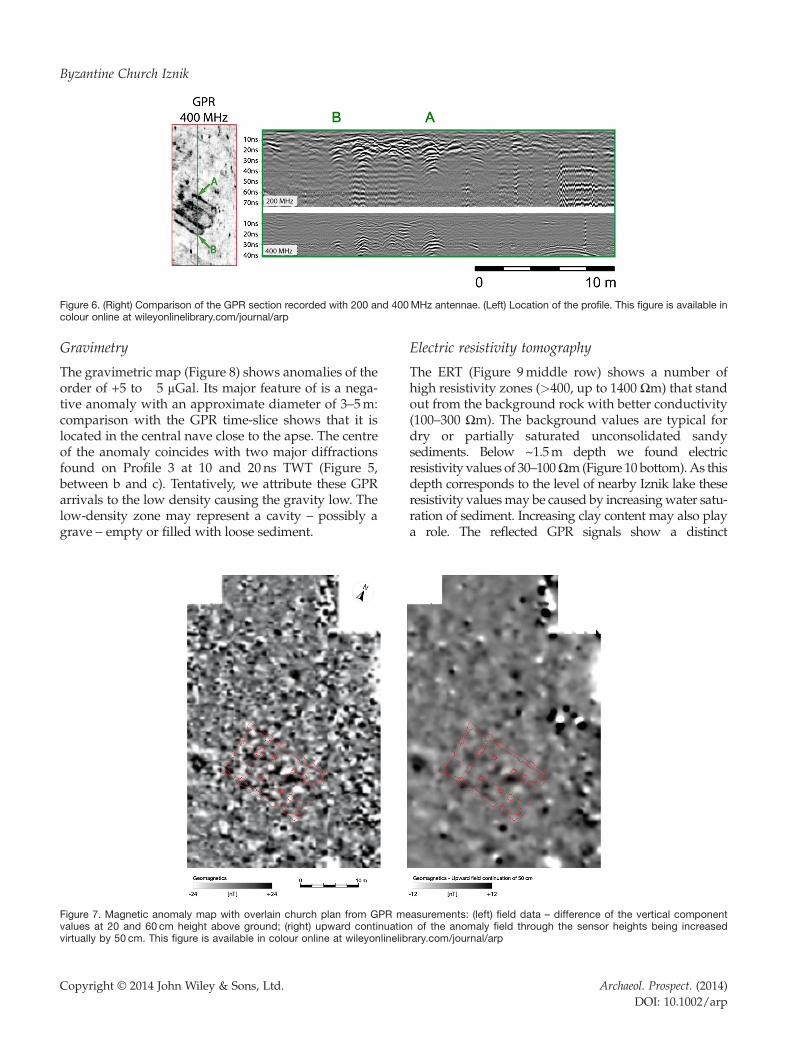
Figure 6. (Right) Comparison of the GPR section recorded with 200 and 400MHz antennae. (Left) Location of the profile. This figure is available incolour online at wileyonlinelibrary.com/journal/arp
Byzantine Church Iznik
Gravimetry
The gravimetric map (Figure 8) shows anomalies of theorder of +5 to �5 μGal. Its major feature of is a nega-tive anomaly with an approximate diameter of 3–5m:comparison with the GPR time-slice shows that it islocated in the central nave close to the apse. The centreof the anomaly coincides with two major diffractionsfound on Profile 3 at 10 and 20 ns TWT (Figure 5,between b and c). Tentatively, we attribute these GPRarrivals to the low density causing the gravity low. Thelow-density zone may represent a cavity – possibly agrave – empty or filled with loose sediment.
Figure 7. Magnetic anomaly map with overlain church plan from GPR mevalues at 20 and 60 cm height above ground; (right) upward continuatiovirtually by 50 cm. This figure is available in colour online at wileyonlinelib
Copyright © 2014 John Wiley & Sons, Ltd.
Electric resistivity tomography
The ERT (Figure 9middle row) shows a number ofhigh resistivity zones (>400, up to 1400 Ωm) that standout from the background rock with better conductivity(100–300 Ωm). The background values are typical fordry or partially saturated unconsolidated sandysediments. Below ~1.5m depth we found electricresistivity values of 30–100Ωm(Figure 10 bottom).As thisdepth corresponds to the level of nearby Iznik lake theseresistivity valuesmay be caused by increasingwater satu-ration of sediment. Increasing clay content may also playa role. The reflected GPR signals show a distinct
asurements: (left) field data – difference of the vertical componentn of the anomaly field through the sensor heights being increasedrary.com/journal/arp
Archaeol. Prospect. (2014)DOI: 10.1002/arp
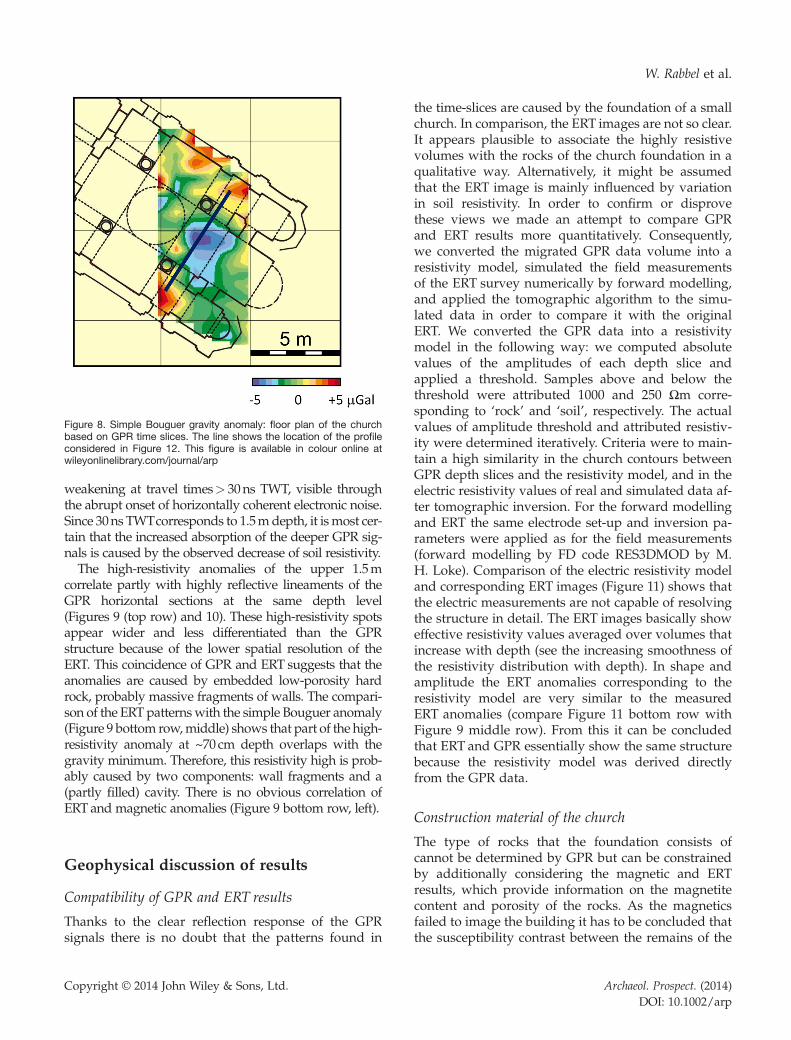
Figure 8. Simple Bouguer gravity anomaly: floor plan of the churchbased on GPR time slices. The line shows the location of the profileconsidered in Figure 12. This figure is available in colour online atwileyonlinelibrary.com/journal/arp
W. Rabbel et al.
weakening at travel times> 30ns TWT, visible throughthe abrupt onset of horizontally coherent electronic noise.Since 30ns TWTcorresponds to 1.5mdepth, it ismost cer-tain that the increased absorption of the deeper GPR sig-nals is caused by the observed decrease of soil resistivity.The high-resistivity anomalies of the upper 1.5m
correlate partly with highly reflective lineaments of theGPR horizontal sections at the same depth level(Figures 9 (top row) and 10). These high-resistivity spotsappear wider and less differentiated than the GPRstructure because of the lower spatial resolution of theERT. This coincidence of GPR and ERT suggests that theanomalies are caused by embedded low-porosity hardrock, probably massive fragments of walls. The compari-son of the ERT patternswith the simple Bouguer anomaly(Figure 9 bottom row,middle) shows that part of the high-resistivity anomaly at ~70cm depth overlaps with thegravity minimum. Therefore, this resistivity high is prob-ably caused by two components: wall fragments and a(partly filled) cavity. There is no obvious correlation ofERT and magnetic anomalies (Figure 9 bottom row, left).
Geophysical discussion of results
Compatibility of GPR and ERT results
Thanks to the clear reflection response of the GPRsignals there is no doubt that the patterns found in
Copyright © 2014 John Wiley & Sons, Ltd.
the time-slices are caused by the foundation of a smallchurch. In comparison, the ERT images are not so clear.It appears plausible to associate the highly resistivevolumes with the rocks of the church foundation in aqualitative way. Alternatively, it might be assumedthat the ERT image is mainly influenced by variationin soil resistivity. In order to confirm or disprovethese views we made an attempt to compare GPRand ERT results more quantitatively. Consequently,we converted the migrated GPR data volume into aresistivity model, simulated the field measurementsof the ERT survey numerically by forward modelling,and applied the tomographic algorithm to the simu-lated data in order to compare it with the originalERT. We converted the GPR data into a resistivitymodel in the following way: we computed absolutevalues of the amplitudes of each depth slice andapplied a threshold. Samples above and below thethreshold were attributed 1000 and 250 Ωm corre-sponding to ‘rock’ and ‘soil’, respectively. The actualvalues of amplitude threshold and attributed resistiv-ity were determined iteratively. Criteria were to main-tain a high similarity in the church contours betweenGPR depth slices and the resistivity model, and in theelectric resistivity values of real and simulated data af-ter tomographic inversion. For the forward modellingand ERT the same electrode set-up and inversion pa-rameters were applied as for the field measurements(forward modelling by FD code RES3DMOD by M.H. Loke). Comparison of the electric resistivity modeland corresponding ERT images (Figure 11) shows thatthe electric measurements are not capable of resolvingthe structure in detail. The ERT images basically showeffective resistivity values averaged over volumes thatincrease with depth (see the increasing smoothness ofthe resistivity distribution with depth). In shape andamplitude the ERT anomalies corresponding to theresistivity model are very similar to the measuredERT anomalies (compare Figure 11 bottom row withFigure 9 middle row). From this it can be concludedthat ERT and GPR essentially show the same structurebecause the resistivity model was derived directlyfrom the GPR data.
Construction material of the church
The type of rocks that the foundation consists ofcannot be determined by GPR but can be constrainedby additionally considering the magnetic and ERTresults, which provide information on the magnetitecontent and porosity of the rocks. As the magneticsfailed to image the building it has to be concluded thatthe susceptibility contrast between the remains of the
Archaeol. Prospect. (2014)DOI: 10.1002/arp
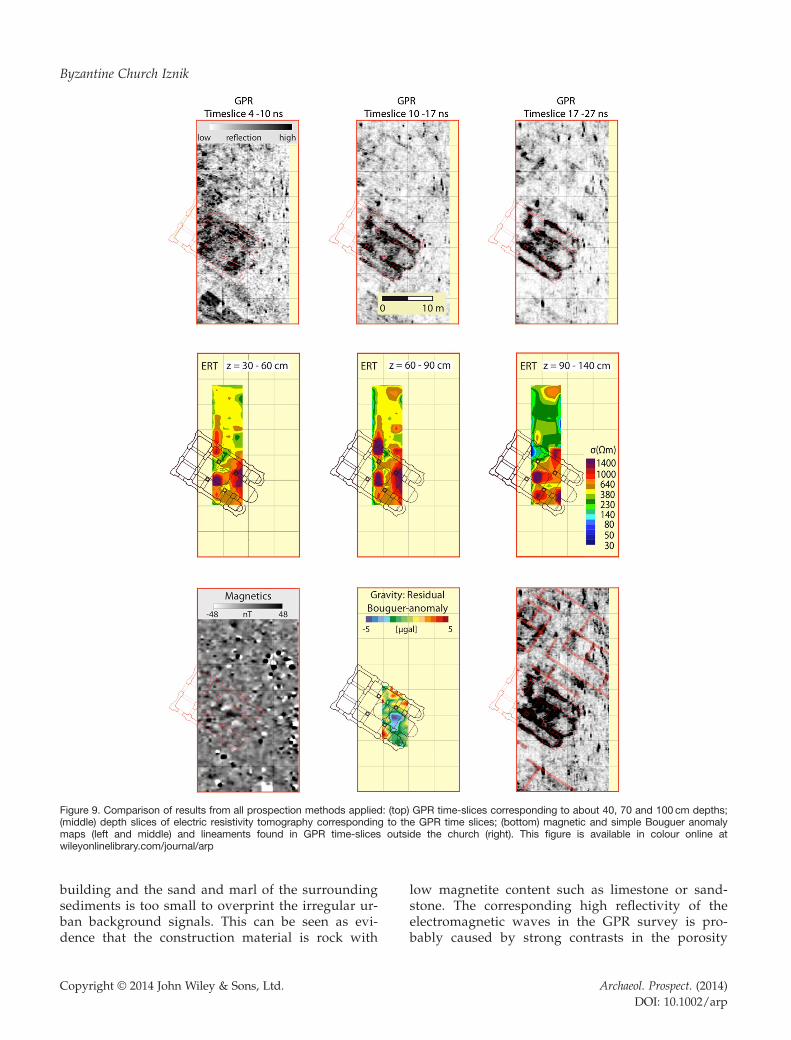
Figure 9. Comparison of results from all prospection methods applied: (top) GPR time-slices corresponding to about 40, 70 and 100 cm depths;(middle) depth slices of electric resistivity tomography corresponding to the GPR time slices; (bottom) magnetic and simple Bouguer anomalymaps (left and middle) and lineaments found in GPR time-slices outside the church (right). This figure is available in colour online atwileyonlinelibrary.com/journal/arp
Byzantine Church Iznik
building and the sand and marl of the surroundingsediments is too small to overprint the irregular ur-ban background signals. This can be seen as evi-dence that the construction material is rock with
Copyright © 2014 John Wiley & Sons, Ltd.
low magnetite content such as limestone or sand-stone. The corresponding high reflectivity of theelectromagnetic waves in the GPR survey is pro-bably caused by strong contrasts in the porosity
Archaeol. Prospect. (2014)DOI: 10.1002/arp
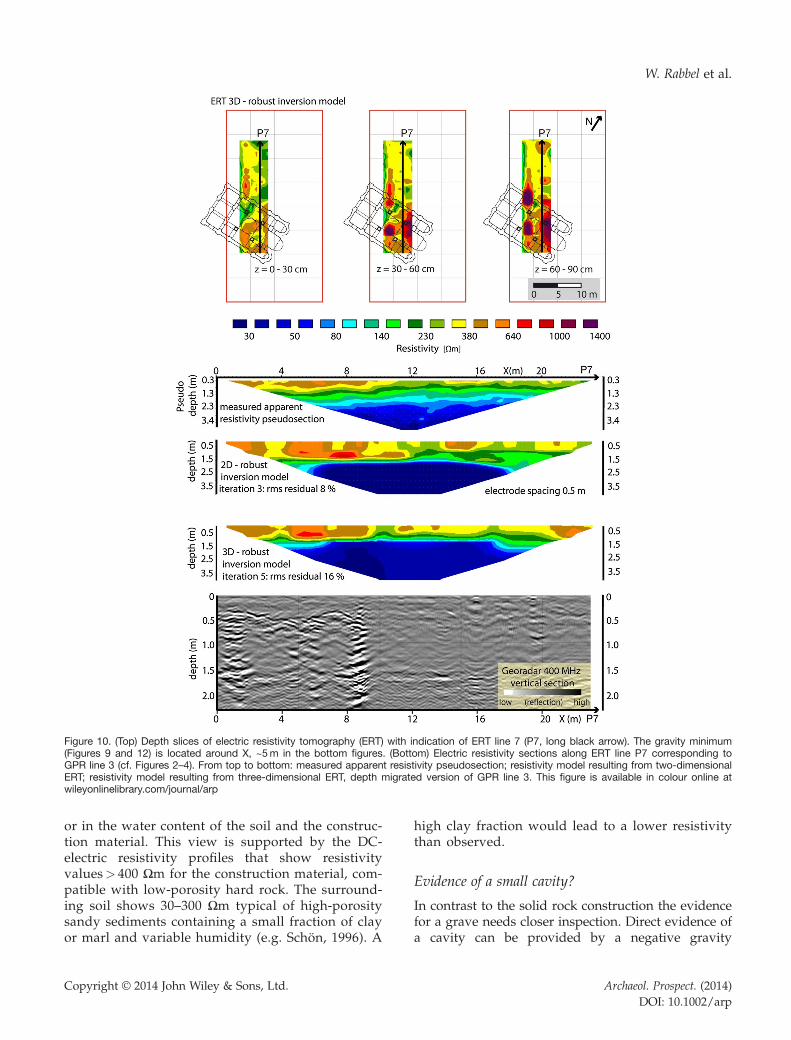
Figure 10. (Top) Depth slices of electric resistivity tomography (ERT) with indication of ERT line 7 (P7, long black arrow). The gravity minimum(Figures 9 and 12) is located around X, ~5m in the bottom figures. (Bottom) Electric resistivity sections along ERT line P7 corresponding toGPR line 3 (cf. Figures 2–4). From top to bottom: measured apparent resistivity pseudosection; resistivity model resulting from two-dimensionalERT; resistivity model resulting from three-dimensional ERT, depth migrated version of GPR line 3. This figure is available in colour online atwileyonlinelibrary.com/journal/arp
W. Rabbel et al.
or in the water content of the soil and the construc-tion material. This view is supported by the DC-electric resistivity profiles that show resistivityvalues> 400 Ωm for the construction material, com-patible with low-porosity hard rock. The surround-ing soil shows 30–300 Ωm typical of high-porositysandy sediments containing a small fraction of clayor marl and variable humidity (e.g. Schön, 1996). A
Copyright © 2014 John Wiley & Sons, Ltd.
high clay fraction would lead to a lower resistivitythan observed.
Evidence of a small cavity?
In contrast to the solid rock construction the evidencefor a grave needs closer inspection. Direct evidence ofa cavity can be provided by a negative gravity
Archaeol. Prospect. (2014)DOI: 10.1002/arp
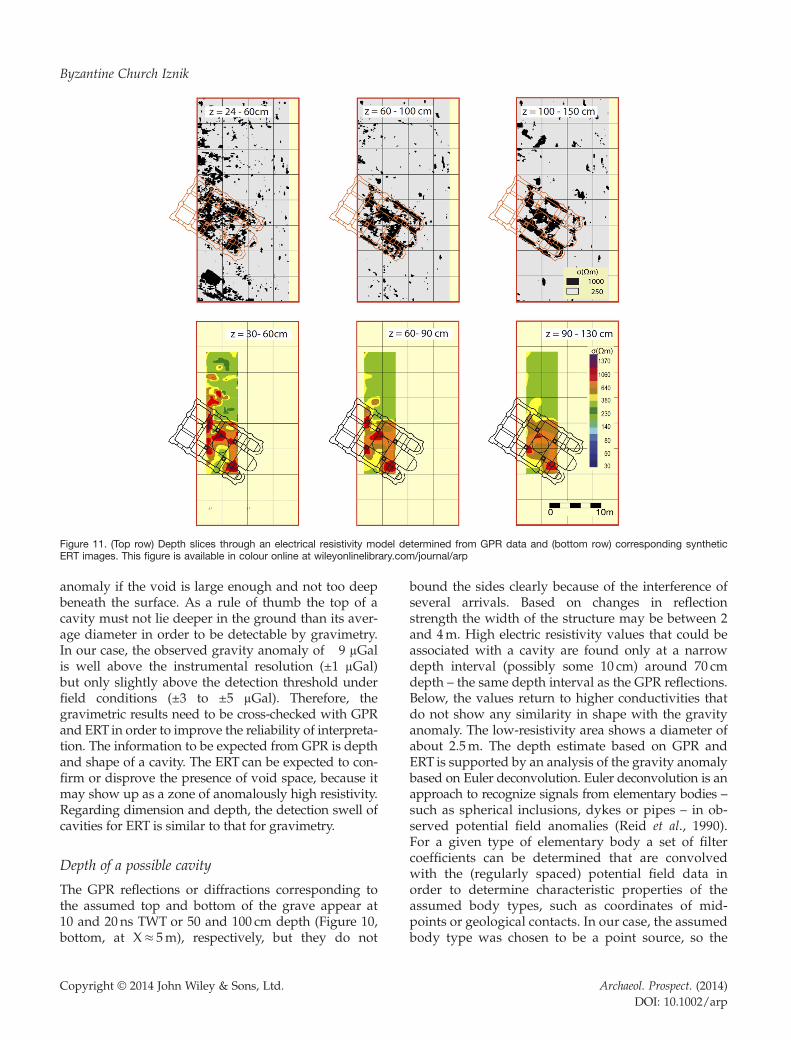
Figure 11. (Top row) Depth slices through an electrical resistivity model determined from GPR data and (bottom row) corresponding syntheticERT images. This figure is available in colour online at wileyonlinelibrary.com/journal/arp
Byzantine Church Iznik
anomaly if the void is large enough and not too deepbeneath the surface. As a rule of thumb the top of acavity must not lie deeper in the ground than its aver-age diameter in order to be detectable by gravimetry.In our case, the observed gravity anomaly of �9 μGalis well above the instrumental resolution (±1 μGal)but only slightly above the detection threshold underfield conditions (±3 to ±5 μGal). Therefore, thegravimetric results need to be cross-checked with GPRand ERT in order to improve the reliability of interpreta-tion. The information to be expected from GPR is depthand shape of a cavity. The ERT can be expected to con-firm or disprove the presence of void space, because itmay show up as a zone of anomalously high resistivity.Regarding dimension and depth, the detection swell ofcavities for ERT is similar to that for gravimetry.
Depth of a possible cavity
The GPR reflections or diffractions corresponding tothe assumed top and bottom of the grave appear at10 and 20 ns TWT or 50 and 100 cm depth (Figure 10,bottom, at X≈ 5m), respectively, but they do not
Copyright © 2014 John Wiley & Sons, Ltd.
bound the sides clearly because of the interference ofseveral arrivals. Based on changes in reflectionstrength the width of the structure may be between 2and 4m. High electric resistivity values that could beassociated with a cavity are found only at a narrowdepth interval (possibly some 10 cm) around 70 cmdepth – the same depth interval as the GPR reflections.Below, the values return to higher conductivities thatdo not show any similarity in shape with the gravityanomaly. The low-resistivity area shows a diameter ofabout 2.5m. The depth estimate based on GPR andERT is supported by an analysis of the gravity anomalybased on Euler deconvolution. Euler deconvolution is anapproach to recognize signals from elementary bodies –such as spherical inclusions, dykes or pipes – in ob-served potential field anomalies (Reid et al., 1990).For a given type of elementary body a set of filtercoefficients can be determined that are convolvedwith the (regularly spaced) potential field data inorder to determine characteristic properties of theassumed body types, such as coordinates of mid-points or geological contacts. In our case, the assumedbody type was chosen to be a point source, so the
Archaeol. Prospect. (2014)DOI: 10.1002/arp
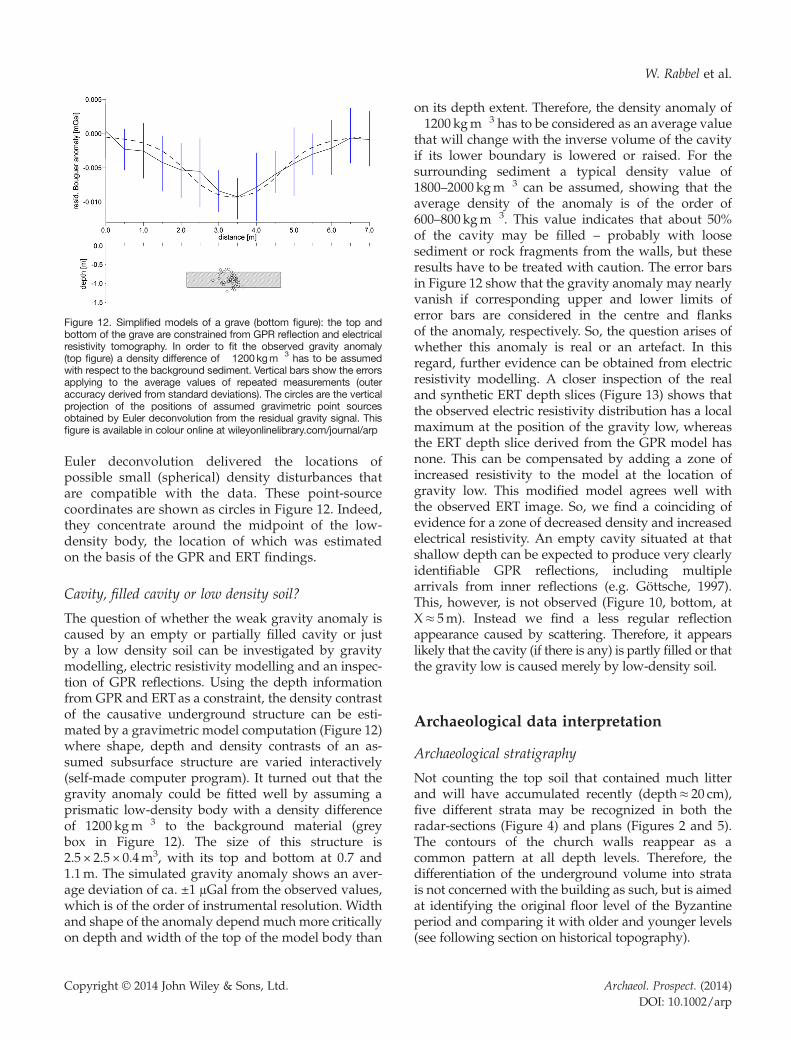
Figure 12. Simplified models of a grave (bottom figure): the top andbottom of the grave are constrained from GPR reflection and electricalresistivity tomography. In order to fit the observed gravity anomaly(top figure) a density difference of �1200 kgm�3 has to be assumedwith respect to the background sediment. Vertical bars show the errorsapplying to the average values of repeated measurements (outeraccuracy derived from standard deviations). The circles are the verticalprojection of the positions of assumed gravimetric point sourcesobtained by Euler deconvolution from the residual gravity signal. Thisfigure is available in colour online at wileyonlinelibrary.com/journal/arp
W. Rabbel et al.
Euler deconvolution delivered the locations ofpossible small (spherical) density disturbances thatare compatible with the data. These point-sourcecoordinates are shown as circles in Figure 12. Indeed,they concentrate around the midpoint of the low-density body, the location of which was estimatedon the basis of the GPR and ERT findings.
Cavity, filled cavity or low density soil?
The question of whether the weak gravity anomaly iscaused by an empty or partially filled cavity or justby a low density soil can be investigated by gravitymodelling, electric resistivity modelling and an inspec-tion of GPR reflections. Using the depth informationfrom GPR and ERTas a constraint, the density contrastof the causative underground structure can be esti-mated by a gravimetric model computation (Figure 12)where shape, depth and density contrasts of an as-sumed subsurface structure are varied interactively(self-made computer program). It turned out that thegravity anomaly could be fitted well by assuming aprismatic low-density body with a density differenceof 1200 kgm�3 to the background material (greybox in Figure 12). The size of this structure is2.5 × 2.5 × 0.4m3, with its top and bottom at 0.7 and1.1m. The simulated gravity anomaly shows an aver-age deviation of ca. ±1 μGal from the observed values,which is of the order of instrumental resolution. Widthand shape of the anomaly depend much more criticallyon depth and width of the top of the model body than
Copyright © 2014 John Wiley & Sons, Ltd.
on its depth extent. Therefore, the density anomaly of�1200 kgm�3 has to be considered as an average valuethat will change with the inverse volume of the cavityif its lower boundary is lowered or raised. For thesurrounding sediment a typical density value of1800–2000 kgm�3 can be assumed, showing that theaverage density of the anomaly is of the order of600–800 kgm�3. This value indicates that about 50%of the cavity may be filled – probably with loosesediment or rock fragments from the walls, but theseresults have to be treated with caution. The error barsin Figure 12 show that the gravity anomaly may nearlyvanish if corresponding upper and lower limits oferror bars are considered in the centre and flanksof the anomaly, respectively. So, the question arises ofwhether this anomaly is real or an artefact. In thisregard, further evidence can be obtained from electricresistivity modelling. A closer inspection of the realand synthetic ERT depth slices (Figure 13) shows thatthe observed electric resistivity distribution has a localmaximum at the position of the gravity low, whereasthe ERT depth slice derived from the GPR model hasnone. This can be compensated by adding a zone ofincreased resistivity to the model at the location ofgravity low. This modified model agrees well withthe observed ERT image. So, we find a coinciding ofevidence for a zone of decreased density and increasedelectrical resistivity. An empty cavity situated at thatshallow depth can be expected to produce very clearlyidentifiable GPR reflections, including multiplearrivals from inner reflections (e.g. Göttsche, 1997).This, however, is not observed (Figure 10, bottom, atX≈ 5m). Instead we find a less regular reflectionappearance caused by scattering. Therefore, it appearslikely that the cavity (if there is any) is partly filled or thatthe gravity low is caused merely by low-density soil.
Archaeological data interpretation
Archaeological stratigraphy
Not counting the top soil that contained much litterand will have accumulated recently (depth≈ 20 cm),five different strata may be recognized in both theradar-sections (Figure 4) and plans (Figures 2 and 5).The contours of the church walls reappear as acommon pattern at all depth levels. Therefore, thedifferentiation of the underground volume into stratais not concerned with the building as such, but is aimedat identifying the original floor level of the Byzantineperiod and comparing it with older and younger levels(see following section on historical topography).
Archaeol. Prospect. (2014)DOI: 10.1002/arp
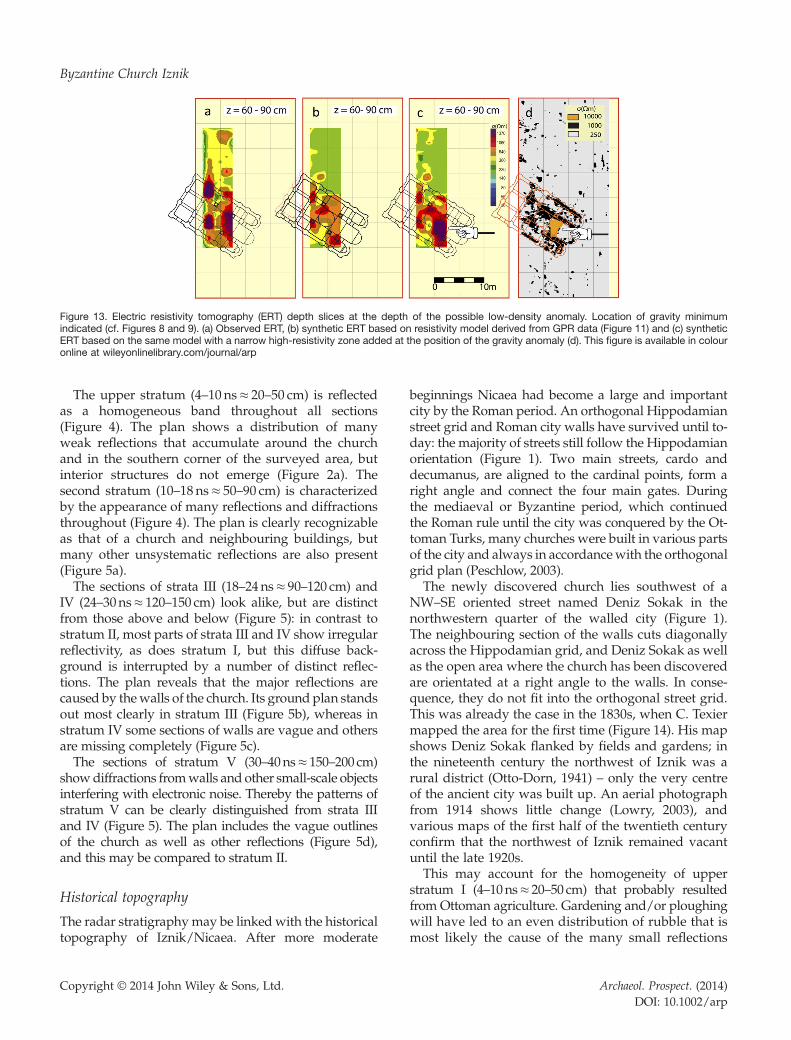
Figure 13. Electric resistivity tomography (ERT) depth slices at the depth of the possible low-density anomaly. Location of gravity minimumindicated (cf. Figures 8 and 9). (a) Observed ERT, (b) synthetic ERT based on resistivity model derived from GPR data (Figure 11) and (c) syntheticERT based on the same model with a narrow high-resistivity zone added at the position of the gravity anomaly (d). This figure is available in colouronline at wileyonlinelibrary.com/journal/arp
Byzantine Church Iznik
The upper stratum (4–10 ns≈ 20–50 cm) is reflectedas a homogeneous band throughout all sections(Figure 4). The plan shows a distribution of manyweak reflections that accumulate around the churchand in the southern corner of the surveyed area, butinterior structures do not emerge (Figure 2a). Thesecond stratum (10–18 ns≈ 50–90 cm) is characterizedby the appearance of many reflections and diffractionsthroughout (Figure 4). The plan is clearly recognizableas that of a church and neighbouring buildings, butmany other unsystematic reflections are also present(Figure 5a).The sections of strata III (18–24 ns≈ 90–120 cm) and
IV (24–30ns≈ 120–150 cm) look alike, but are distinctfrom those above and below (Figure 5): in contrast tostratum II, most parts of strata III and IV show irregularreflectivity, as does stratum I, but this diffuse back-ground is interrupted by a number of distinct reflec-tions. The plan reveals that the major reflections arecaused by thewalls of the church. Its ground plan standsout most clearly in stratum III (Figure 5b), whereas instratum IV some sections of walls are vague and othersare missing completely (Figure 5c).The sections of stratum V (30–40ns≈150–200 cm)
showdiffractions fromwalls and other small-scale objectsinterfering with electronic noise. Thereby the patterns ofstratum V can be clearly distinguished from strata IIIand IV (Figure 5). The plan includes the vague outlinesof the church as well as other reflections (Figure 5d),and this may be compared to stratum II.
Historical topography
The radar stratigraphymay be linked with the historicaltopography of Iznik/Nicaea. After more moderate
Copyright © 2014 John Wiley & Sons, Ltd.
beginnings Nicaea had become a large and importantcity by the Roman period. An orthogonal Hippodamianstreet grid and Roman city walls have survived until to-day: the majority of streets still follow the Hippodamianorientation (Figure 1). Two main streets, cardo anddecumanus, are aligned to the cardinal points, form aright angle and connect the four main gates. Duringthe mediaeval or Byzantine period, which continuedthe Roman rule until the city was conquered by the Ot-toman Turks, many churches were built in various partsof the city and always in accordancewith the orthogonalgrid plan (Peschlow, 2003).The newly discovered church lies southwest of a
NW–SE oriented street named Deniz Sokak in thenorthwestern quarter of the walled city (Figure 1).The neighbouring section of the walls cuts diagonallyacross the Hippodamian grid, and Deniz Sokak as wellas the open area where the church has been discoveredare orientated at a right angle to the walls. In conse-quence, they do not fit into the orthogonal street grid.This was already the case in the 1830s, when C. Texiermapped the area for the first time (Figure 14). His mapshows Deniz Sokak flanked by fields and gardens; inthe nineteenth century the northwest of Iznik was arural district (Otto-Dorn, 1941) – only the very centreof the ancient city was built up. An aerial photographfrom 1914 shows little change (Lowry, 2003), andvarious maps of the first half of the twentieth centuryconfirm that the northwest of Iznik remained vacantuntil the late 1920s.This may account for the homogeneity of upper
stratum I (4–10ns≈ 20–50 cm) that probably resultedfrom Ottoman agriculture. Gardening and/or ploughingwill have led to an even distribution of rubble that ismost likely the cause of the many small reflections
Archaeol. Prospect. (2014)DOI: 10.1002/arp
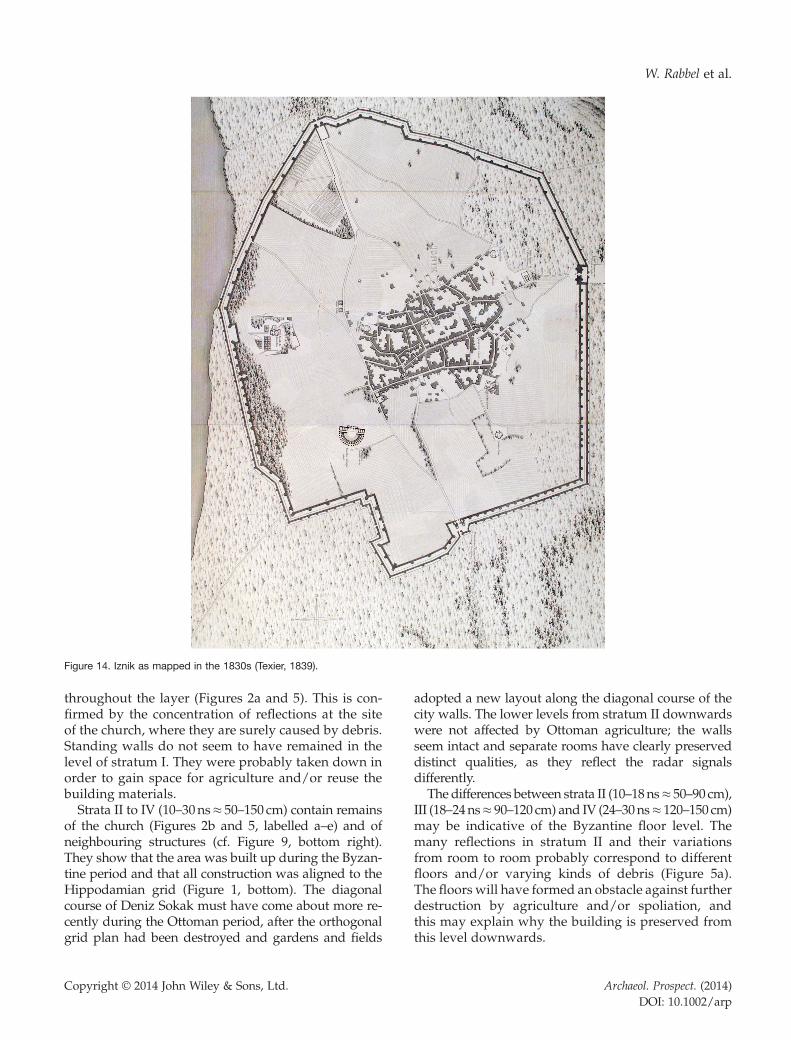
Figure 14. Iznik as mapped in the 1830s (Texier, 1839).
W. Rabbel et al.
throughout the layer (Figures 2a and 5). This is con-firmed by the concentration of reflections at the siteof the church, where they are surely caused by debris.Standing walls do not seem to have remained in thelevel of stratum I. They were probably taken down inorder to gain space for agriculture and/or reuse thebuilding materials.Strata II to IV (10–30ns≈ 50–150 cm) contain remains
of the church (Figures 2b and 5, labelled a–e) and ofneighbouring structures (cf. Figure 9, bottom right).They show that the area was built up during the Byzan-tine period and that all construction was aligned to theHippodamian grid (Figure 1, bottom). The diagonalcourse of Deniz Sokak must have come about more re-cently during the Ottoman period, after the orthogonalgrid plan had been destroyed and gardens and fields
Copyright © 2014 John Wiley & Sons, Ltd.
adopted a new layout along the diagonal course of thecity walls. The lower levels from stratum II downwardswere not affected by Ottoman agriculture; the wallsseem intact and separate rooms have clearly preserveddistinct qualities, as they reflect the radar signalsdifferently.The differences between strata II (10–18ns≈50–90 cm),
III (18–24ns≈ 90–120 cm) and IV (24–30ns≈120–150 cm)may be indicative of the Byzantine floor level. Themany reflections in stratum II and their variationsfrom room to room probably correspond to differentfloors and/or varying kinds of debris (Figure 5a).The floors will have formed an obstacle against furtherdestruction by agriculture and/or spoliation, andthis may explain why the building is preserved fromthis level downwards.
Archaeol. Prospect. (2014)DOI: 10.1002/arp
Byzantine Church Iznik
Strata III and IVare unruffled apart from the walls ofthe church (Figure 5b and c), and this may result fromtheir lying below floor level. There would not be anydebris at this level, rather a homogeneous infill inorder to create a stable substratum for the floors. Thenave forms an exception in so far as stratum III reflectsas strongly as stratum II (Figure 5b). This may havesomething to do with an exceptionally massive floorand/or especially heavy debris that could havepressed the floor down from the second into the thirdstratum (see below).Next to the church, strata II and III contain other
orthogonal structures with the same orientation(Figure 5a and b), but in stratum IV these neighbouringbuildings are hardly visible (Figure 5c). They probablyform thinner foundation walls of less depth that willhave supported less weighty superstructures.Stratum V (30–40ns≈150–200cm) will pre-date the
church, because it contains structures that seem to be older.The most obvious example is a wall that continues alongthe line of the foundations between the nave and thesouthern aisle, but to the east outside of the church(Figure 5d). Indeed, this wall segment is visible only in this
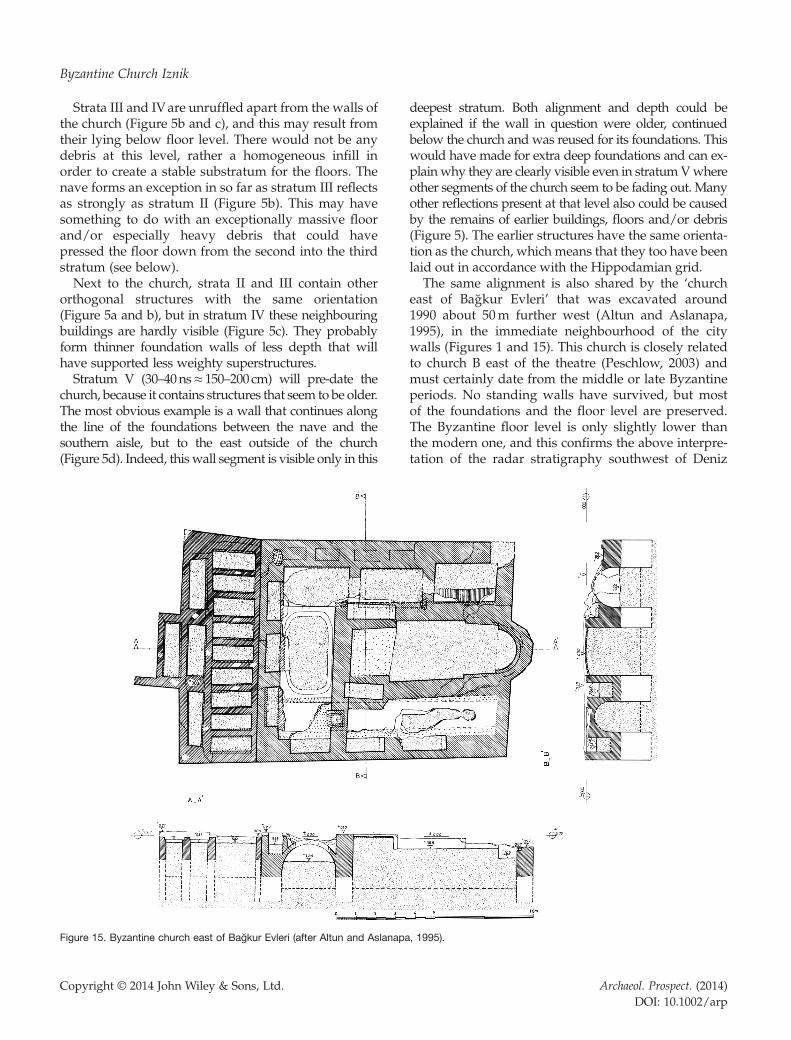
Figure 15. Byzantine church east of Bağkur Evleri (after Altun and Aslanapa
Copyright © 2014 John Wiley & Sons, Ltd.
deepest stratum. Both alignment and depth could beexplained if the wall in question were older, continuedbelow the church and was reused for its foundations. Thiswould have made for extra deep foundations and can ex-plain why they are clearly visible even in stratumVwhereother segments of the church seem to be fading out. Manyother reflections present at that level also could be causedby the remains of earlier buildings, floors and/or debris(Figure 5). The earlier structures have the same orienta-tion as the church, which means that they too have beenlaid out in accordance with the Hippodamian grid.The same alignment is also shared by the ‘church
east of Bağkur Evleri’ that was excavated around1990 about 50m further west (Altun and Aslanapa,1995), in the immediate neighbourhood of the citywalls (Figures 1 and 15). This church is closely relatedto church B east of the theatre (Peschlow, 2003) andmust certainly date from the middle or late Byzantineperiods. No standing walls have survived, but mostof the foundations and the floor level are preserved.The Byzantine floor level is only slightly lower thanthe modern one, and this confirms the above interpre-tation of the radar stratigraphy southwest of Deniz
, 1995).
Archaeol. Prospect. (2014)DOI: 10.1002/arp
W. Rabbel et al.
Sokak; the surviving remains occur at floor level andconsist of foundations only.
Reconstruction of the church
On first sight, the church southwest of Deniz Sokakseems to be a three-aisled basilica with three apses(Figure 2). Its size is rather small, though: the nave isonly about 4m wide, the aisles each less than 2m.Similar small basilicas are not uncommon in westernAsia Minor, and some of them also have three apses,but these churches normally belong to small ruralsettlements of little consequence. In contrast, Nicaeawas an important city that competed withNicomedia for the leadership in Bithynia andbeyond, hosted the ecumenical councils of AD 325and 787, and also temporarily served as capitalduring the Latin occupation of Constantinople.Other cities of comparable standing have muchlarger basilicas, and the church of St Sophia, theonly basilica known in Iznik, is twice as large(Möllers, 1994).The newly discovered church is therefore probably
not a basilica, but may instead be reconstructed as across-in-square (Figure 2). This type of church wascommon during the middle and late Byzantine periodsand were often built on a small scale, even in theleading cities of the empire. A comparable examplecan be found in Iznik itself only a few hundred metresnortheast of Deniz Sokak close to the northern orIstanbul gate, and is commonly referred to as churchA (Peschlow, 2003). This cross-in-square has almostthe same dimensions as the newly discovered churchsouthwest of Deniz Sokak, and – slightly scaled down –could have been constructed on the same foundations(Figure 2).The GPR plan southwest of Deniz Sokak probably
looks like that of a basilica, because the church hasbeen preserved only from floor level downwards. Onthis level the plans of other cross-in-square churchesalso appear like basilicas, if west–east stylobates (sillsfor columns) and/or foundations transverse the north-ern and southern arms of the cross.It was noted previously that the nave reflects more
strongly than the aisles, both in stratum II and III(Figure 4a and b). These reflections are concentratedin the centre of the nave to the west of the sanctuaryand may have been caused by especially heavy debrisfrom the dome. An alternative explanation may besought in marble flooring that was frequently usedin the nave, whereas the sanctuary and the aisleshad different floors. Such Byzantine marble floorswere commonly built with reused slabs that were
Copyright © 2014 John Wiley & Sons, Ltd.
often thicker than necessary and could also have ledto the strong reflections. The possible cavity belowthe floor of the nave (Figure 8) might be a Byzantinegrave, like those in the church east of Bağkur Evleri(Figure 15). An ancient grave can be ruled out insidethe city walls, where in antiquity burial wasprohibited. A crypt probably also can be excluded,as that should be located further east in front of theapse and beneath the altar. The western end of thechurch has not been registered by the geophysicalsurvey and may not have survived.
Conclusions
Based on three-dimensional GPR measurements wefound the buried remnants of a previously unknownsmall (10m×15m) church in Iznik/Nicaea, Turkey. Theground plan can be interpreted as a cross-in-square fromthe medieval period, that is, from the last centuries ofRomano-Byzantine rule before the Turkish conquest.The church may have served the local parish or belongedto an urban monastery. It is not aligned with the modernstreets that surround it, but deviates by about 45° andfollows the orthogonal street grid of Roman Nicaea. Thisfinding shows that the ancient city was continuouslyinhabited throughout the mediaeval Byzantine period.The tradition was only disrupted much later after theTurkish conquest, when the ancient grid was given upand eventually replaced by a new layout.Microgravity measurements, constrained by GPR
and ERT, suggest a low-density zone at about 1mdepth that could be interpreted as a grave filled withloose sediment. By combining GPR with ERT andmagnetic measurements it can be shown that thechurch foundation consists of low-porosity hard rockwith a low magnetic susceptibility, probably limestoneor sandstone. Magnetic mapping failed to identifythe church because of a low contrast in magneticsusceptibility and a strong heterogeneity of urban soil.From a more general methodical perspective our
study confirms the view that archaeological prospectingshould not rely on applying just one geophysicalmethod. Indeed, magnetics – often regarded as ‘the’standard prospecting tool – failed completely to detectstructure in the present case. Because of the types of soiland embedded foundation rocks, the building wasdetectable only by GPR and ERT: the GPR and ERTresults agree closely. This was shown by forwardmodel-ling of the ERT anomalies on the basis of a resistivityderived from GPR data. The resolution of the ERT islimited by the minimum electrode spacing at the earthsurface and becomes coarser nearly proportional to
Archaeol. Prospect. (2014)DOI: 10.1002/arp
Byzantine Church Iznik
depth. Therefore, details of the construction could not beresolved by ERT. Indeed, the building was identifiable asa church only by GPR, because this method showsresolution at the decimetre-scale until maximum pene-tration depth. So, for the electrically low-conductivityenvironment investigated, GPR turned out to be the bestchoice for mapping archaeological structure. However,once the church was detected, magnetics and ERT con-tributed to characterizing the type of foundation rock(non-magnetic, low-conductive). Finally, the (admittedlyweak) evidence of a partially filled grave was providedbasically by gravimetry; the corresponding GPR reflec-tions could be associated with its top and bottom onlylater. However, while praising GPR, one must not forgetthat depth penetration of GPRmay break down severelyin highly conductive soils. In this case ERT might havebeen the only way to detect the church foundations.In summary, the presented field example highlights the
strength of a prospecting approach based on combiningdifferent geophysical methods. In the educational frame-work of the IP summer school programme, during whichthe church was detected, it was the most spectacular andstimulating of the chosen field examples that fitted ex-tremely well to the particular goal of demonstratingstrengths andweaknesses of archaeo-geophysical explora-tionmethods. The style of the courseswas adopted for reg-ular practical courses in Bachelor andMaster programmes.Finally, the discovery inspired on-going archaeologicalinvestigations at the Iznik site. While this article wassubmitted one more, probably Byzantine, church wasdiscovered on the floor of Iznik Lake, near the shoreline.
Acknowledgements
The International Course on ArchaeoGeophysics 2008,during which the Byzantine church was discovered,was funded by the EuropeanUnion ERASMUS-IntensiveProgram of Lifelong Learning (grant DE-2007-ERA/MOBIP-ZuV01-28321-1). We gratefully acknowledge ad-ditional financial and logistic support by the Governorof the Iznik district, the Major of the city of Iznik, by theKocaeli University and the Graduate School of HumanDevelopment in Landscape of the University of Kiel.We are grateful to L. Conyers, M. Everett, U. Werbanand two anonymous reviewers whose commentshelped to improve the article.
References
Altun A, Aslanapa O. 1995. Iznik Çini Fırınları Kazısı1994 Mevsimi Çalışmaları. Kazι Sonuçlarι Toplantιsι 17:411–428
Copyright © 2014 John Wiley & Sons, Ltd.
Aspinall A, Gaffney C, Schmidt A. 2008. Magnetometry forArchaeologists. Altamira Press: Latham, MD; 208 pp.
Brizzolari E, Ermolli F, Orlando L, Piro S, Versino L. 1992.Integrated geophysical methods in archaeologicalsurveys. Journal of Applied Geophysics 29: 47–55.
Butler DK (ed.). 2005. Near Surface Geophysics.Investigations in Geophysics 13. Society of ExplorationGeophysicists: Tulsa, OK; 732 pp.
Cammarano F, Mauriello P, Piro S. 1997. High-resolutiongeophysical prospecting with integrated methods. Theancient Acropolis of Veio (Rome, Italy). ArchaeologicalProspection 4: 157–164.
Cammarano F, Mauriello P, Patella D, Piro S, Rosso F,Versino L. 1998. Integration of high resolution geophysicalmethods. Detection of shallow depth bodies ofarchaeological interest. Annali di Geofisica 41: 359–368.
Conyers LB. 2013. Ground-Penetrating Radar for Archaeology.Altamira Press: Latham, MD; 258p.
Erkul E, Klein C, Rabbel W, Stümpel H. 2007. Integratedprospection methods – multisensor geophysicalprospectiong of the archaeological site of Metaponte(Gulf of Tarent, Italy). In Geophysik und Ausgrabung –Einsatz und Auswertung zerstörungsfreiere Prospektion inder Archöologie, Posselt M, Zickgraf B, Dobiat C (eds).Verlag Marie Leidorf: Rahden; 11–16.
Gaffney C. 2008. Detecting trends in the prediction oft heburied past: A review of geophysical techniques inArchaeology. Archaeometry 50: 313–336.
Göttsche F.M. 1997. Identification of cavities by extrac-tion of characteristic parameters from ground probingradar reflection data. PhD thesis, University of Kiel;141 pp.
Karnapp AW, Schneider AM. 1938. Die Stadtmauer vonIznik (Nicaea). Istanbuler Forschungen. DeutschesArchäologisches Institut: Berlin; 9.
Loke MH. 2013. Tutorial: 2-D and 3-D Electrical ImagingSurveys. 173 pp. http://www.geotomosoft.com/down-loads.php
Loke MH, Barker RD. 1995. Least-squares deconvolutionof apparent resistivity pseudosections. Geophysics 60:1682–1690.
Lowry HW. 2003. Ottoman Iznik (Nicaea): Through theEyes of Travelers & as Recorded in Administrative Doc-uments, 1331–1923. In Iznik Throughout History, AkbaygilI, İnalcık H, Aslanapa O (eds). Türkiye İş Bankasι:Istanbul; 135–174.
Möllers S. 1994.Die Hagia Sophia in Iznik/Nikaia. Verlag undDatenbank für Geisteswissenschaften: Alfter, Germany.
Niewöhner P, Dikilitaş G, Erkul E, Giese S, Gorecki J,Prochaska W, Sarı D, Stümpel H, Vardar A, WaldnerA, Walser AV, Woith H. 2013. Bronze Age höyüks, IronAge hilltop forts, Roman poleis and Byzantine pilgrim-age in Germia and its vicinity.‘Connectivity’and a lackof ‘definite places’ on the central Anatolian highplateau. Anatolian Studies 63: 97–136.
Otto-Dorn K. 1941. Das islamische Iznik. IstanbulerForschungen. Deutsches Archäologisches Institut:Berlin; 13.
Panisova J, Fraštia M, Wunderlich T, Pašteka R, KušnirákD. 2013. Microgravity and ground-penetratingradar investigations of subsurface features at theSt Catherine’s Monastery, Slovakia. ArchaeologicalProspection 20: 163–174.
Archaeol. Prospect. (2014)DOI: 10.1002/arp
W. Rabbel et al.
Perez-Gracia V, Caselles JO, Clapes J, Osorio R, MartínezG, Canas JA. 2009. Integrated near-surface geophysicalsurvey of the Cathedral of Mallorca. Journal of Archaeo-logical Science 36: 1289–1299.
Peschlow U. 2003. The churches of Nicaea/Iznik. In IznikThroughout History, Akbaygil I, İnalcık H, Aslanapa O(eds). Türkiye İş Bankasι: Istanbul; 201–218.
Reid AB, Allsop JM, Granser H, Millet AJ, Somerton IW.1990. Magnetic interpretation in three dimensionsusing Euler deconvolution. Geophysics 55: 80–91.
Schön JH. 1996. Physical Properties of Rocks: Fundamentalsand Principles of Petrophysics. Handbook of Seismic Explo-ration, Vol. 18. Pergamon Press: Amsterdam; 583 pp.
Scollar I. 1990. Archaeological Prospecting and Remote Sens-ing. Topics in Remote Sensing 2. Cambridge UniversityPress: Cambridge; 696 pp.
Copyright © 2014 John Wiley & Sons, Ltd.
Stümpel H, Demirel F, Rabbel W, Trinks I, Wölz S. 1999:Geophysikalische Prospektion im Umfeld von Milet1996–1997. Deutsches Archäologisches Institut, Archäolo-gischer Anzeiger 1999: 89–98.
Texier C. 1839. Description de L’Asie Mineure 1. Paris.Udphuay S, Paul VL, Everett ME, Warden RB. 2010.Ground-penetrating radar imaging of twelfth centuryRomanesque foundations beneath the thirteenth centuryGothic abbey church of Valmagne, France. ArchaeologicalProspection 17: 199–212.
Witten AJ. 2006. Handbook of Geophysics in Archaeology.Equinox: Sheffield; 329 pp.
Yılmaz Y, Genç ŞC, Yiğitbaş E, Bozcu M, Yılmaz K. 1995.Geological evolution of the late Mesozoic continentalmargin of Northwestern Anatolia. Tectonophysics 243:155–171.
Archaeol. Prospect. (2014)DOI: 10.1002/arp
Related Documents