Discovery Informatics: Multimodal Information Interfaces for Creating & Analyzing Large Data Sets By Jeff Stanton School of Information Studies Syracuse University

Discovery informaticsstanton
Jul 19, 2015
Welcome message from author
This document is posted to help you gain knowledge. Please leave a comment to let me know what you think about it! Share it to your friends and learn new things together.
Transcript

Discovery Informatics: Multimodal Information Interfaces
for Creating & Analyzing Large Data Sets
By Jeff Stanton
School of Information Studies
Syracuse University
Where are we going?
Ever increasing amounts of data to display/diagnose
Traditional data exploration methods
Emerging alternatives for creating/analyzing big data
Example Application
Discovery Informatics for Psychology

McKinsey: 40% growth in data per year with only 5% growth in IT spending.
WalMart: Collects 2.5 PB per hour from customer transactions.
IDC: Big data not simply a matter of size, but rather of growth rate, speed of acquisition, rate of decay, linkage complexity, and format heterogeneity.
Gartner: 1.47 million big data jobs unfilled
The Dimensions of Big Data

An organization employing 1,000 knowledge workers loses $5.7 million annually in time wasted reformatting data as it moves among applications. Search failures cost that same organization an additional $5.3m a year. (Source: IDC)
The Costs of Big Data

The (Human) Cost of “Joins”

R/R-Studio
Commercial support from R comes from Revolution Analytics;
Oracle, IBM, Mathematica, SPSS, are among the major companies offering R integrationIBM Platform HPC provides parallel computing options for R (jaql, netezza)


0
1
2
3
4
5
Channels
(log)Kbits/Sec
(log) FrameRate, Hz
Sensing Big Data
Rough estimates based on Balasubramanian(2006), Current Biology
• Hearing is multi-directional – does not require attentional focus on a single source• Hearing is the most acute of the senses in detecting the frequency of occurrence
of events – as little as 5 ms apart• Hearing supports “multi-tasking” by allowing the brain to detect events occurring
at different frequencies and time-scales simultaneously
Pitch discrimination: >90 pitchesLoudness discrimination: >40 levelsTiming discrimination: 20 msHorizontal localization: ~8 positionsVertical localization: ~4 positionsTimbre variations: ∞
Image credit: “The Five Senses” by Fabio Pantoja


Holographic Table Display


Example Application
1. Research goal: Translate selection test items and re-check psychometric characteristics
2. Assemble baseline data from validation study(ies) in original language
3. Crowdsource item and answer translations with bilingual native speakers
4. Use natural language processing to visualize most common wording variations by regional dialect by linking to map data
5. Choose most universal item texts and answers
6. Crowdsource backtranslations with bilingual native speakers; return to step 3 as needed
7. Deploy final version of test; compare results to baseline data and return to step 3 as needed
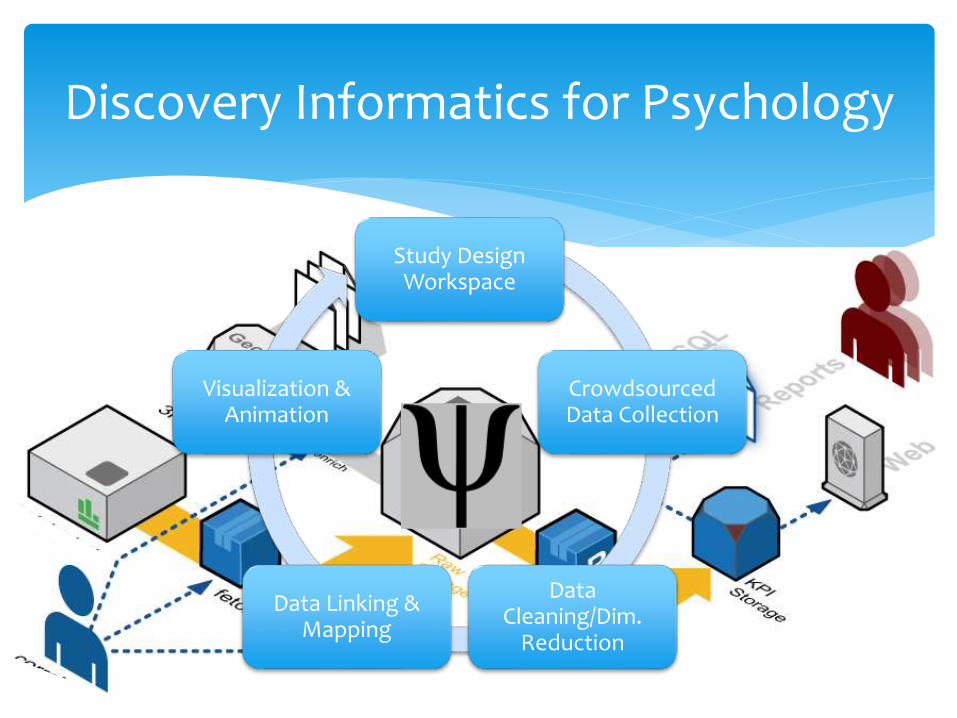
Discovery Informatics for Psychology
Study Design Workspace
CrowdsourcedData Collection
Data Cleaning/Dim.
Reduction
Data Linking & Mapping
Visualization & Animation
Related Documents