Noname manuscript No. (will be inserted by the editor) Discovering Rare Categories from Graph Streams Dawei Zhou · Arun Karthikeyan · Kangyang Wang · Nan Cao · Jingrui He Received: date / Accepted: date Abstract Nowadays, massive graph streams are produced from various real- world applications, such as financial fraud detection, sensor networks, wireless networks. In contrast to the high volume of data, it is usually the case that only a small percentage of nodes within the time-evolving graphs might be of interest to people. Rare category detection (RCD) is an important topic in data mining, focusing on identifying the initial examples from the rare classes in imbalanced data sets. However, most existing techniques for RCD are designed for static data sets, thus not suitable for time-evolving data. In this paper, we introduce a novel setting of rare category detection on time-evolving graphs. To address this problem, we propose two incremental al- gorithms, SIRD and BIRD, which are constructed upon existing density-based techniques for RCD. These algorithms exploit the time-evolving nature of the data by dynamically updating the detection models enabling a “time-flexible” RCD. Moreover, to deal with the cases where the exact priors of the minority classes are not available, we further propose a modified version named BIRD- LI based on BIRD. Besides, we also identify a critical task in RCD named query distribution, which targets to allocate the limited budget among multi- ple time steps, such that the initial examples from the rare classes are detected as early as possible with the minimum labeling cost. The proposed incremen- tal RCD algorithms and various query distribution strategies are evaluated empirically on both synthetic and real data sets. Keywords Rare Category Detection, Time-evolving Graph, Incremental Learning. Dawei Zhou(B), Arun Karthikeyan, Kangyang Wang, Jingrui He CIDSE, Arizona State University, Tempe, AZ 85281 E-mail: [email protected] Nan Cao New York University Shanghai, Shanghai, China 200122

Welcome message from author
This document is posted to help you gain knowledge. Please leave a comment to let me know what you think about it! Share it to your friends and learn new things together.
Transcript
Noname manuscript No.(will be inserted by the editor)
Discovering Rare Categories from Graph Streams
Dawei Zhou · Arun Karthikeyan ·Kangyang Wang · Nan Cao · Jingrui He
Received: date / Accepted: date
Abstract Nowadays, massive graph streams are produced from various real-world applications, such as financial fraud detection, sensor networks, wirelessnetworks. In contrast to the high volume of data, it is usually the case thatonly a small percentage of nodes within the time-evolving graphs might be ofinterest to people. Rare category detection (RCD) is an important topic in datamining, focusing on identifying the initial examples from the rare classes inimbalanced data sets. However, most existing techniques for RCD are designedfor static data sets, thus not suitable for time-evolving data.
In this paper, we introduce a novel setting of rare category detection ontime-evolving graphs. To address this problem, we propose two incremental al-gorithms, SIRD and BIRD, which are constructed upon existing density-basedtechniques for RCD. These algorithms exploit the time-evolving nature of thedata by dynamically updating the detection models enabling a “time-flexible”RCD. Moreover, to deal with the cases where the exact priors of the minorityclasses are not available, we further propose a modified version named BIRD-LI based on BIRD. Besides, we also identify a critical task in RCD namedquery distribution, which targets to allocate the limited budget among multi-ple time steps, such that the initial examples from the rare classes are detectedas early as possible with the minimum labeling cost. The proposed incremen-tal RCD algorithms and various query distribution strategies are evaluatedempirically on both synthetic and real data sets.
Keywords Rare Category Detection, Time-evolving Graph, IncrementalLearning.
Dawei Zhou(B), Arun Karthikeyan, Kangyang Wang, Jingrui HeCIDSE, Arizona State University, Tempe, AZ 85281E-mail: [email protected]
Nan CaoNew York University Shanghai, Shanghai, China 200122
2 Dawei Zhou et al.
1 Introduction
Compared with the tremendous and rapidly changing data, the examples ofinterest to us only hold a very small portion. For instance, in financial syn-thetic identity detection [29], only a tiny proportion of identities are fraudu-lent, generated by mixing the identifying information from multiple sources.Such identities are created with the sole purpose of committing financial fraud.Another example is insider threat detection [9], where only a small popula-tion amongst a big organization are malicious insiders involved in treacherousbehaviors, such as sabotage, espionage, etc. The small percentage of data ofinterest to us is called the minority class or rare category, since such examplesare often self-similar. Due to the rarity of the minority classes and the limitedbudget on querying the labeling oracle who can provide the true label of anyexample at a fixed cost, it is difficult to identify examples from such classesvia random sampling. To efficiently deal with this problem, rare category de-tection has been proposed to identify the very first example from the minorityclass, by requesting only a small number of labels from the oracle [28].
Most, if not all, of existing rare category detection techniques are designedfor static data. However, in many real-world applications, the data is notstatic but evolves with time, and so are the minority classes. Examples of suchscenarios are listed as follows.
– In financial synthetic identity detection, within the transaction network,each identity could correspond to one specific node, and each transactionactivity could correspond to one edge. Since each identity may keep updat-ing his or her information, such as daily transactions and real-time onlinebanking activities, the data is evolving over time. Our goal is to identifythe identities and transactions, which have unusual characteristics and sig-nificantly differ from the majorities in the networks.
– In insider threat detection, the insiders intentionally change their behaviorpatterns over time to avoid being caught. In other words, the insiders maynot be abnormal all the time when compared with normal employees. Thus,how to distinguish insiders and normal employees from evolving data is achallenge.
– In event detection in social networks, the snapshots of social networks areevolving every single second with updated vertex sets and updated edgesets, which means the event related vertex sets may shrink, expand or shiftwithin the time-evolving social networks. Hence, how to model, captureand track the changing target events over evolving social networks wouldbe the main task.
Straight-forward applications of existing RCD techniques in the precedingscenarios would be very time-consuming by constructing the models fromscratches at each time step. Additionally, it is critical to allocate queries amongdifferent time steps from labeling oracle, which may help detect the initial rareexamples as early as possible to avoid further damage.

Discovering Rare Categories from Graph Streams 3
Addressing this issue, in this paper, for the first time, we study the problemof incremental RCD. Specifically, we first propose two incremental algorithms,i.e., SIRD and BIRD, to detect the initial examples from the minority classesunder different dynamic settings. The key idea is to efficiently update ourdetection model by local changes instead of reconstructing it from scratchesbased on the updated data at a new time step, so as to reduce the time costof redundant and repeating computations. Furthermore, we relax the require-ment of the exact priors with a soft upper bound for all the minority classesto provide a modified version - BIRD-LI. Finally, we study a unique problemof query distribution under the dynamic settings, which distributes allocatedlabeling budget among different time steps, and propose five query distribu-tion strategies. This paper is extended from our previous work [36] in termsof the detailed algorithm, theoretical justification and the comprehensive ex-periments on real time-evolving graph data sets.
The rest of our paper is organized as follows. In Section 2, we briefly reviewthe related work on both RCD and time-evolving graph mining. In Section 3,we study incremental RCD and propose three algorithms, i.e., SIRD, BIRDand BIRD-LI, to address different dynamic settings. Then, in Section 4, weintroduce the unique problem of query distribution under the dynamic settings,and propose five strategies for allocating the labeling budget among differenttime steps. In Section 5, we demonstrate our models on both synthetic andreal data sets. Finally, we conclude this paper in Section 6.
2 Related Work
2.1 Rare Category Analysis
Rare category detection refers to the problem of identifying the initial exam-ples from under-represented minority classes in an imbalanced data set. Lotsof techniques have been developed for solving the problem of RCD in the pastdecade. [28] proposed a mixture model-based algorithm, which is the firstattempt in this area. In [15, 16], the authors developed an innovative methodto detect rare categories via unsupervised local-density-differential samplingstrategy. [7] presented an active learning scheme via exploiting the clusterstructure in data sets. In [17], the authors introduced a novel problem calledrare category characterization, which not only detects but also characterizesthe rare categories, and proposed an optimization framework to explore thecompactness of rare categories. More recently, in [26], two prior-free methodswere proposed in order to address the rare category detection problem with-out any prior knowledge. In [35], the authors proposed a framework namedMUVIR, which could leverage existing rare category detection models on eachsingle view and estimate the overall probability of each example belonging tothe minority classes. However, all of the preceding works focus on the staticdata sets, and few works have been proposed to address the problem of rarecategory detection under dynamic settings.
4 Dawei Zhou et al.
2.2 Outlier Detection on Streaming Data
With the improvement of hardware technology on data collection, many appli-cations require efficient mechanisms to process the outlier detection on stream-ing data [13]. Tons of algorithms have been proposed in the past decade.[33, 34] presented an online discounting learning algorithm to incrementallyupdate a probabilistic mixture model and capture outliers in data streams.In [1], the authors proposed online clustering methods, which maintained adynamic clustering model to identify outliers under dynamic settings. Insteadof only updating parameters of the prediction model, Dynamic Bayesian Net-work (DBN) [19], a modifiable model, was proposed to detect anomalies fromenvironmental sensor data. Different from regular data streams, distributeddata streams are collected from distributed sensors over time. [6, 11] studiedthe problem of outlier detection on multiple types of distributed data streams,such as air temperature sensor network data, water pollution sensor networkdata and wind sensor network data. Different from outlier detection, rare cate-gory detection assumes that the anomalies belong to multiple distinct classes,in the sense that the within-class similarities are much larger than the between-class similarities. In this paper, we aim to discover these rare categories overa series of time-evolving graphs.
2.3 Graph Based Anomaly Detection
In the literature, there are abundant works focusing on anomaly detection instatic graphs. Basically, all of the existing works study two types of staticgraphs: plain static graphs and attributed static graphs. Plain graph assumesthe only information we have is the structure of graph. This category ofanomaly detection methods aims to exploit the structure of graphs and minethe unrepresentative pattern of anomalies, e.g., global graph structure meth-ods [20, 18]; local graph structure methods [2, 21, 14]. Attributed graph as-sumes both the structure and the coherence of attributes are given. [27, 12]proposed node outlier ranking methods on static attributed graphs. Yagada [8]characterized anomalies by discrediting the numerical attributes into “outlierscore”. In [31], the authors proposed a fast algorithm which could detect thenode relationships for localizing anomalous changes in time-evolving graphs.
More recently, an increasing number of research has been conducted un-der dynamic graph settings. For examples, in [25], the authors analyzed theproperties of the time evolution of real graphs and proposed a “forest fire”graph-generative model; [4] studied the problem of community evolution anddeveloped a novel method to measure the movement of individuals amongcommunities; in [24], the authors focused on the difficulties of conversationdynamics and proposed a simple mathematical model in order to generatebasic conversation structures; in [5, 22], the authors proposed several graphsimilarity measurements to detect the discontinuity in dynamic social net-works. Besides, to reduce the time complexity, in [32], the authors proposed a
Discovering Rare Categories from Graph Streams 5
fast proximity tracking method for dynamic graphs; in [23], the authors usedtensor decomposition techniques to efficiently obtain the “scores” for anoma-lies on dynamic graphs; in [10], the authors proposed a new graph-patternmatching algorithm, which can avoid cubic-time computation; [3] raised adivide-and-conquer framework, which could find the k-nearest-neighbors effi-ciently on high volume of time-evolving graphs. BIRD approach [36] provideda fast updating method for the challenging problem of RCD on time-evolvinggraphs. In this paper, we propose several fast-updating RCD methods whichcould incrementally update the models based on local changes on time-evolvinggraphs. This paper extends our previous work [36] substantially by providingthe detailed algorithm, theoretical justification and the comprehensive empir-ical evaluations on real-world time-evolving graph data sets, which are notpresented in the previous version.
3 Incremental Rare Category Detection
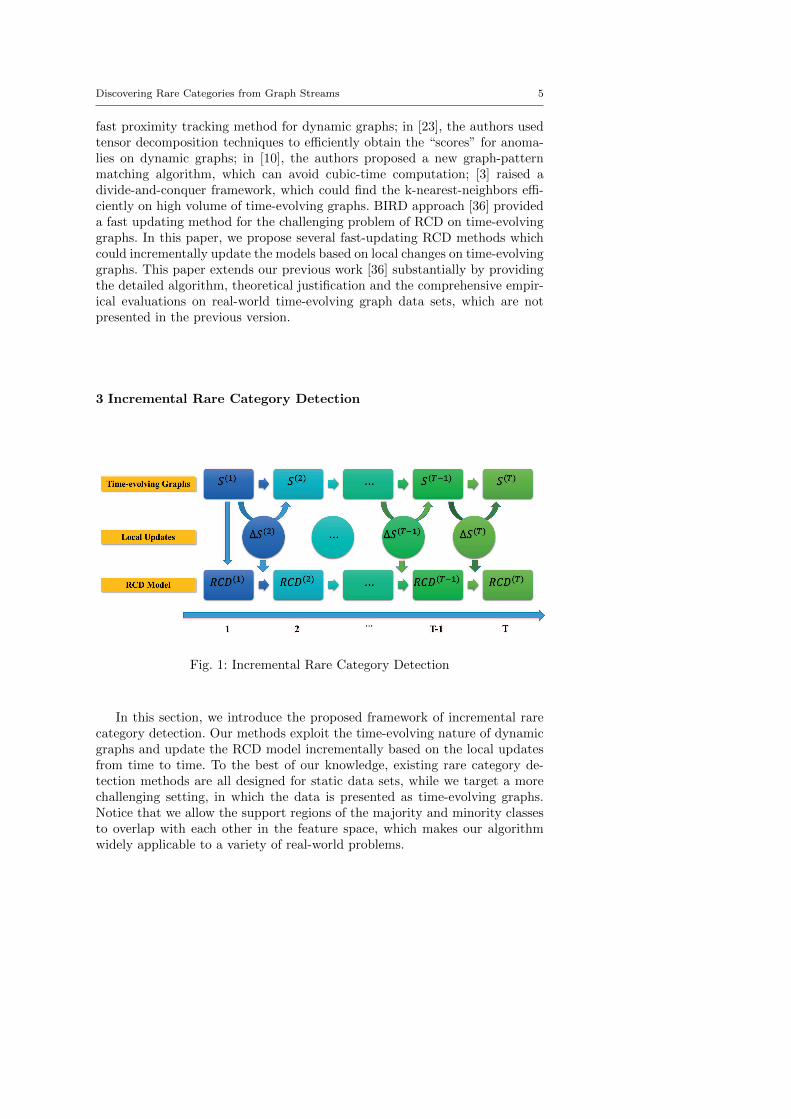
Fig. 1: Incremental Rare Category Detection
In this section, we introduce the proposed framework of incremental rarecategory detection. Our methods exploit the time-evolving nature of dynamicgraphs and update the RCD model incrementally based on the local updatesfrom time to time. To the best of our knowledge, existing rare category de-tection methods are all designed for static data sets, while we target a morechallenging setting, in which the data is presented as time-evolving graphs.Notice that we allow the support regions of the majority and minority classesto overlap with each other in the feature space, which makes our algorithmwidely applicable to a variety of real-world problems.

6 Dawei Zhou et al.
3.1 Notation
Suppose we are given a series of time-evolving graphs {S(1), . . . , S(T )}, whichare shown in Fig. 1. For any time step t = 1, . . . , T , the vertices in S(t) are
identical and only edges change over time. We assume y(t)i = 1 corresponds to
the majority class with prior p(t)1 , and the remaining classes are the minority
classes with priors p(t)c at time step t. We use ∆S(t) to denote the new edges
and updated weights that appear at time step t. Specifically, we have ∆S(t) =S(t) − S(t−1).
In the following part of this paper, we use the convention in Matlab torepresent matrix elements, e.g., S(t)(i, j) is the element at ith row and the jth
column of matrix S(t), and S(t)(:, j) is the jth column of matrix S(t), etc. Themain symbols we used in this paper are listed in Table 1.
Table 1: Symbols.
Symbol Descriptionn number of nodes
m(t) number of updated edgesxi ith nodes in data sett time stepC number of classes
p(t)c proportion of classes cα constraint parameterI identity matrix
S(t) n× n original aggregated adjacency matrix at time t
∆S(t) n× n updating matrix for S(t−1)
M(t) normalized n× n aggregated adjacency matrix at time t
∆M(t) n× n updating matrix for M(t−1)
NN(t) n× n neighbor information matrix at time step t
A(t) n× n global similarity matrix at time step t
3.2 Static Rare Category Detection
In static RCD, we repeatedly select examples to be labeled by the oracle untilall the minority classes in a static data set are discovered. One approach forstatic RCD is to make use of the manifold structure for identifying rare cate-gory examples. In [16], authors developed a graph-based RCD method namedGRADE. In GRADE algorithm, they first construct a pair-wise similarity ma-trix W ′ and its corresponding diagonal matrix D, whose elements are the rowsums of W ′. Then, they calculate the normalized matrix W as follows.
W = D−1/2W ′D−1/2
Discovering Rare Categories from Graph Streams 7
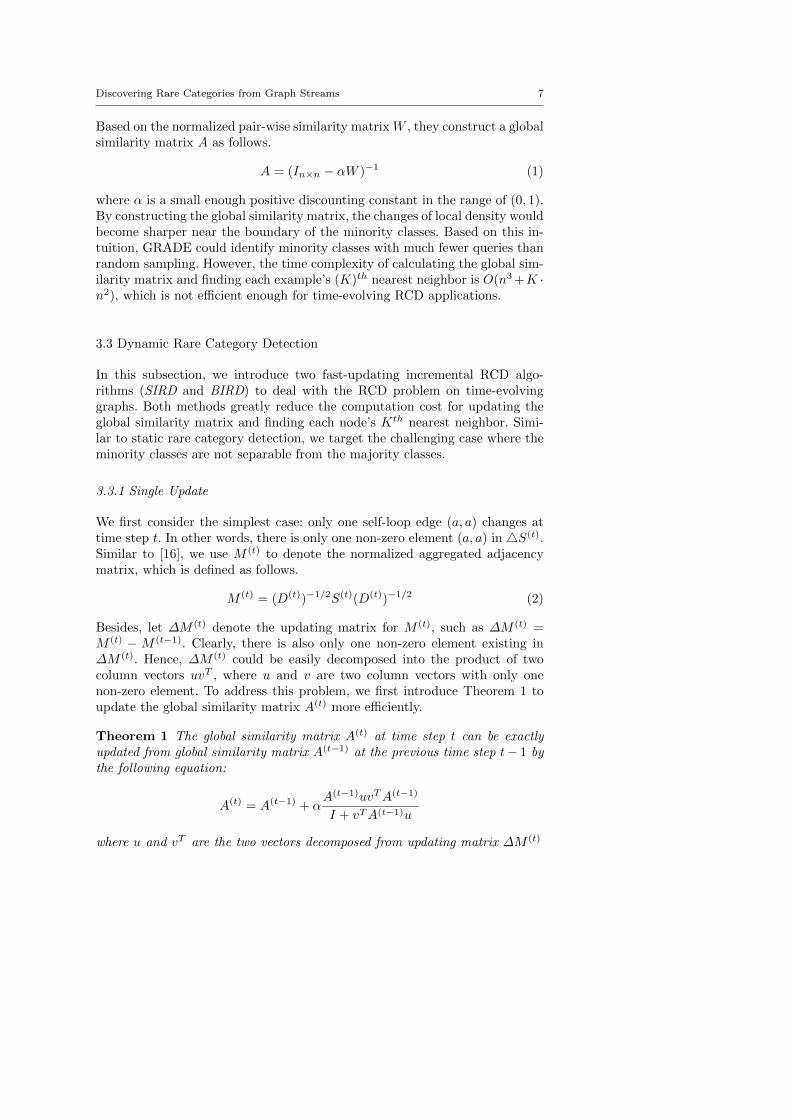
Based on the normalized pair-wise similarity matrix W , they construct a globalsimilarity matrix A as follows.
A = (In×n − αW )−1 (1)
where α is a small enough positive discounting constant in the range of (0, 1).By constructing the global similarity matrix, the changes of local density wouldbecome sharper near the boundary of the minority classes. Based on this in-tuition, GRADE could identify minority classes with much fewer queries thanrandom sampling. However, the time complexity of calculating the global sim-ilarity matrix and finding each example’s (K)th nearest neighbor is O(n3 +K ·n2), which is not efficient enough for time-evolving RCD applications.
3.3 Dynamic Rare Category Detection
In this subsection, we introduce two fast-updating incremental RCD algo-rithms (SIRD and BIRD) to deal with the RCD problem on time-evolvinggraphs. Both methods greatly reduce the computation cost for updating theglobal similarity matrix and finding each node’s Kth nearest neighbor. Simi-lar to static rare category detection, we target the challenging case where theminority classes are not separable from the majority classes.
3.3.1 Single Update
We first consider the simplest case: only one self-loop edge (a, a) changes attime step t. In other words, there is only one non-zero element (a, a) in 4S(t).Similar to [16], we use M (t) to denote the normalized aggregated adjacencymatrix, which is defined as follows.
M (t) = (D(t))−1/2S(t)(D(t))−1/2 (2)
Besides, let ∆M (t) denote the updating matrix for M (t), such as ∆M (t) =M (t) − M (t−1). Clearly, there is also only one non-zero element existing in∆M (t). Hence, ∆M (t) could be easily decomposed into the product of twocolumn vectors uvT , where u and v are two column vectors with only onenon-zero element. To address this problem, we first introduce Theorem 1 toupdate the global similarity matrix A(t) more efficiently.
Theorem 1 The global similarity matrix A(t) at time step t can be exactlyupdated from global similarity matrix A(t−1) at the previous time step t− 1 bythe following equation:
A(t) = A(t−1) + αA(t−1)uvTA(t−1)
I + vTA(t−1)u
where u and vT are the two vectors decomposed from updating matrix ∆M (t)
8 Dawei Zhou et al.
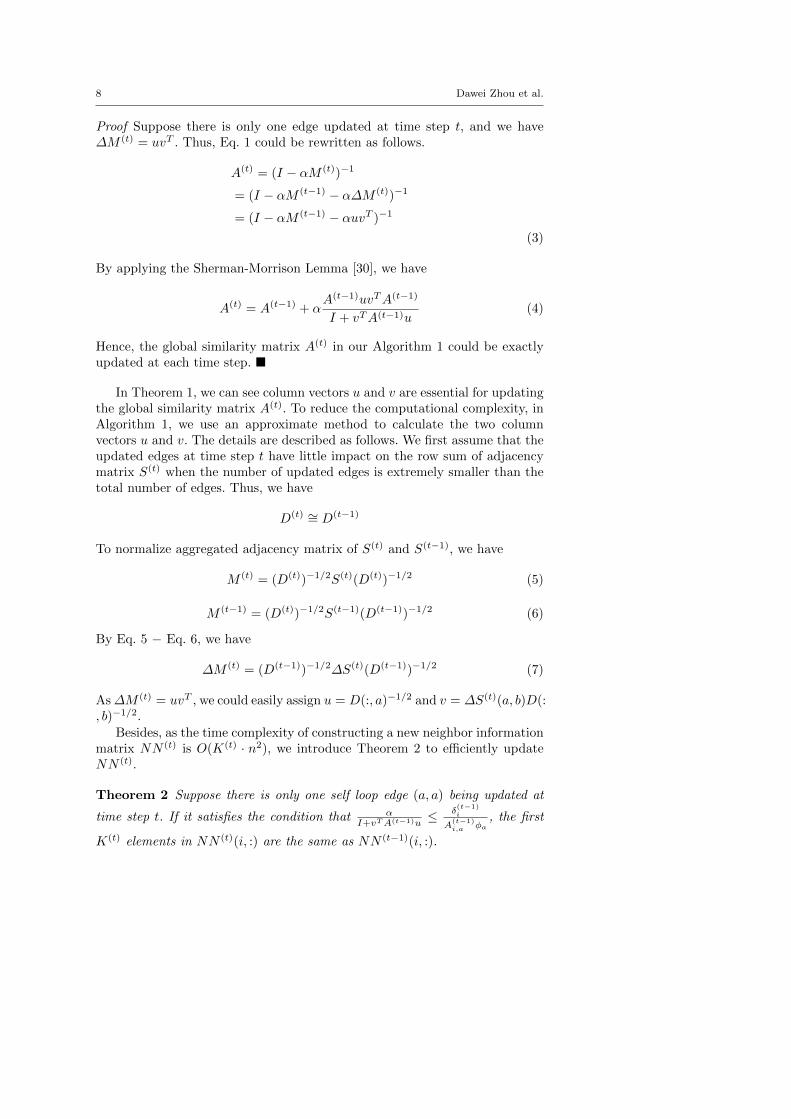
Proof Suppose there is only one edge updated at time step t, and we have∆M (t) = uvT . Thus, Eq. 1 could be rewritten as follows.
A(t) = (I − αM (t))−1
= (I − αM (t−1) − α∆M (t))−1
= (I − αM (t−1) − αuvT )−1
(3)
By applying the Sherman-Morrison Lemma [30], we have
A(t) = A(t−1) + αA(t−1)uvTA(t−1)
I + vTA(t−1)u(4)
Hence, the global similarity matrix A(t) in our Algorithm 1 could be exactlyupdated at each time step. �
In Theorem 1, we can see column vectors u and v are essential for updatingthe global similarity matrix A(t). To reduce the computational complexity, inAlgorithm 1, we use an approximate method to calculate the two columnvectors u and v. The details are described as follows. We first assume that theupdated edges at time step t have little impact on the row sum of adjacencymatrix S(t) when the number of updated edges is extremely smaller than thetotal number of edges. Thus, we have
D(t) ∼= D(t−1)
To normalize aggregated adjacency matrix of S(t) and S(t−1), we have
M (t) = (D(t))−1/2S(t)(D(t))−1/2 (5)
M (t−1) = (D(t))−1/2S(t−1)(D(t−1))−1/2 (6)
By Eq. 5 − Eq. 6, we have
∆M (t) = (D(t−1))−1/2∆S(t)(D(t−1))−1/2 (7)
As∆M (t) = uvT , we could easily assign u = D(:, a)−1/2 and v = ∆S(t)(a, b)D(:, b)−1/2.
Besides, as the time complexity of constructing a new neighbor informationmatrix NN (t) is O(K(t) · n2), we introduce Theorem 2 to efficiently updateNN (t).
Theorem 2 Suppose there is only one self loop edge (a, a) being updated at
time step t. If it satisfies the condition that αI+vTA(t−1)u
≤ δ(t−1)i
A(t−1)i,a φa
, the first
K(t) elements in NN (t)(i, :) are the same as NN (t−1)(i, :).
Discovering Rare Categories from Graph Streams 9
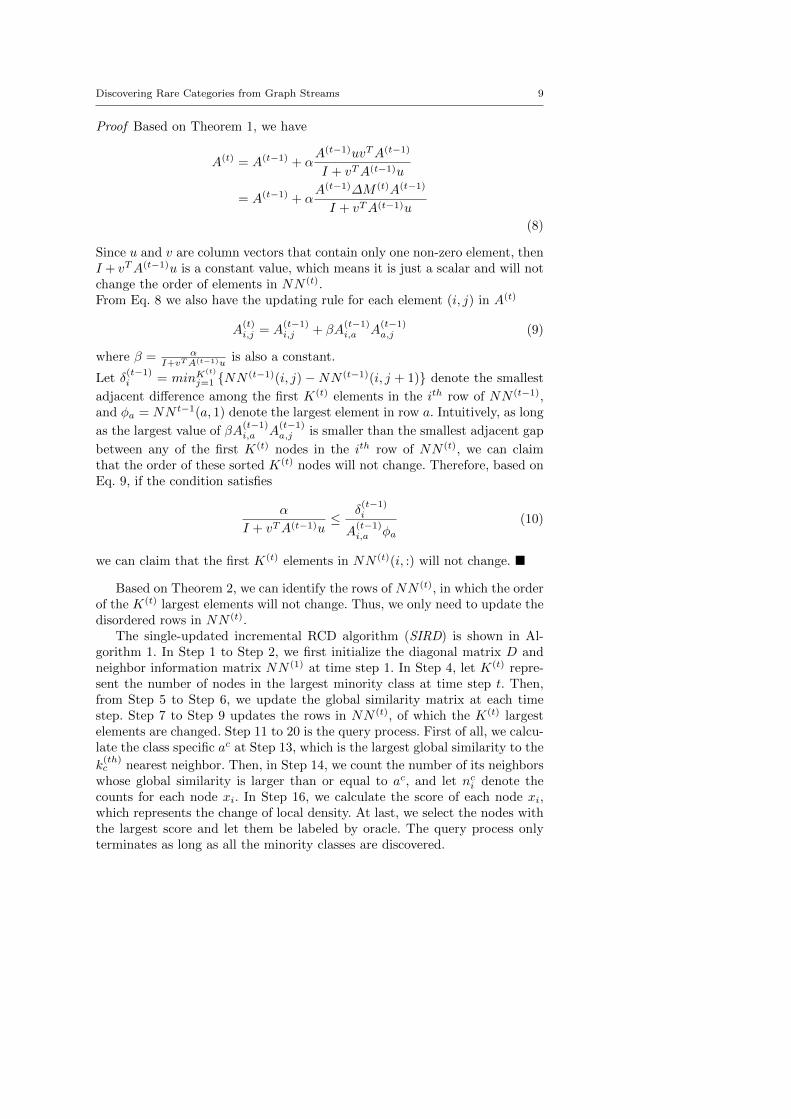
Proof Based on Theorem 1, we have
A(t) = A(t−1) + αA(t−1)uvTA(t−1)
I + vTA(t−1)u
= A(t−1) + αA(t−1)∆M (t)A(t−1)
I + vTA(t−1)u
(8)
Since u and v are column vectors that contain only one non-zero element, thenI + vTA(t−1)u is a constant value, which means it is just a scalar and will notchange the order of elements in NN (t).From Eq. 8 we also have the updating rule for each element (i, j) in A(t)
A(t)i,j = A
(t−1)i,j + βA
(t−1)i,a A
(t−1)a,j (9)
where β = αI+vTA(t−1)u
is also a constant.
Let δ(t−1)i = minK
(t)
j=1 {NN (t−1)(i, j) −NN (t−1)(i, j + 1)} denote the smallest
adjacent difference among the first K(t) elements in the ith row of NN (t−1),and φa = NN t−1(a, 1) denote the largest element in row a. Intuitively, as long
as the largest value of βA(t−1)i,a A
(t−1)a,j is smaller than the smallest adjacent gap
between any of the first K(t) nodes in the ith row of NN (t), we can claimthat the order of these sorted K(t) nodes will not change. Therefore, based onEq. 9, if the condition satisfies
α
I + vTA(t−1)u≤ δ
(t−1)i
A(t−1)i,a φa
(10)
we can claim that the first K(t) elements in NN (t)(i, :) will not change. �
Based on Theorem 2, we can identify the rows of NN (t), in which the orderof the K(t) largest elements will not change. Thus, we only need to update thedisordered rows in NN (t).
The single-updated incremental RCD algorithm (SIRD) is shown in Al-gorithm 1. In Step 1 to Step 2, we first initialize the diagonal matrix D andneighbor information matrix NN (1) at time step 1. In Step 4, let K(t) repre-sent the number of nodes in the largest minority class at time step t. Then,from Step 5 to Step 6, we update the global similarity matrix at each timestep. Step 7 to Step 9 updates the rows in NN (t), of which the K(t) largestelements are changed. Step 11 to 20 is the query process. First of all, we calcu-late the class specific ac at Step 13, which is the largest global similarity to the
k(th)c nearest neighbor. Then, in Step 14, we count the number of its neighbors
whose global similarity is larger than or equal to ac, and let nci denote thecounts for each node xi. In Step 16, we calculate the score of each node xi,which represents the change of local density. At last, we select the nodes withthe largest score and let them be labeled by oracle. The query process onlyterminates as long as all the minority classes are discovered.

10 Dawei Zhou et al.
The efficiency of the updating process for Algorithm 1 is given by thefollowing lemma.
Lemma 1 The computational cost of the updating process at each time stepin Algorithm 1 is O(n2 + l ·K(t) · n).
Proof As described before, the computational cost for normalization and de-composition process is O(n). Then, in Step 6, compared to the straightforwardcomputation, i.e., A(t−1) = (I−αM (t))−1, we reduce the time complexity fromO(n3) to O(n2) by avoiding the matrix inverse computation. Furthermore,from Step 7 to Step 9, we simplify the resorting process by only updating therows, in which the top K(t) elements are disordered. Suppose l is the totalnumber of rows in NN (t), which does not satisfy Eq. 10, then the computa-tional cost is reduced from O(K(t) · n2) to O(l ·K(t) · n). By leveraging eachpart, the computational cost of the updating process is O(n2 + l ·K(t) · n). �
ALGORITHM 1: SIRD Algorithm
Input: M(1), A(1), ∆S(2), . . . ,∆S(T ), p(t)c , α.
Output: The set I of labeled nodes1: Construct the n× n diagonal matrix D, where Dii =
∑n(j=1) S
(1), i = 1, . . . , n.
2: Sort row i of A(1) decreasingly and save into NN(1)(i, :), where i = 1, . . . , n.3: for t=2:T do4: Let K(t) = maxC
c=2 n× p(t)c .
5: Let column vector u = D(:, a)−1/2, and column vector v = ∆S(t)(a, a)D(:, a)−1/2,where ∆S(t)(a, a) is the non-zero element in ∆S(t).
6: Update the global similarity matrix as follows.
A(t) = A(t−1) + αA(t−1)uvTA(t−1)
I + vTA(t−1)u
7: for i=1:n do8: Based on Theorem 2, identify whether the first K(t) elements of NN(t) (i,:) are
changed. If true, update the first K(t) elements in NN(t)(i, :); otherwise, letNN(t)(i, :) = NN(t−1)(i, :).
9: end for10: end for11: for c = 2:C do12: Let kc = n× p(T )
c
13: Find the first kc elements in each row of NN(T ). Set ac to be the largest value ofthem.
14: Let KNNc(xi, ac) = {x|NN(T )(i, j) > ac}, and nc
i = |KNNc|, where i = 1, . . . , nand j = 1, . . . , n.
15: for index = 1: n do16: For each node xi has been labeled yi, if A(T ) > ayi , scorej = −∞; else, let
scorei = maxA(T )(i,j)> ac
index(nc
i − ncj)
17: Select the nodes x with the largest score to labeling oracle.18: If the label of x is exact class c, break; else, mark the class that x belongs to as
discovered.19: end for20: end for

Discovering Rare Categories from Graph Streams 11
3.3.2 Batch Update
In most real world applications, we always observe that a batch of edges changeat the same period. Specifically, the updated aggregated adjacency matrix∆M (t) may have more than one non-zero element. Hence, ∆M (t) cannot bedecomposed into two column vectors, and Theorem 2 could not be applied inthis condition. In this part, we introduce Theorem 3 to help us update theneighbor information matrix NN (t) when a batch of edges are changed.
Theorem 3 Suppose there are m edges {(a1, b1), · · · , (am, bm)} being updatedat time step t. The first K(t) elements in NN (t)(i, :) are the same as NN (t−1)(i, :), if it satisfies the condition that
α
I + V TA(t−1)U≤ mini=1,...,m
{Ti}
where Ti = min{ δ(t−1)i
A(t−1)
i,ai φbi
,δ(t−1)i
A(t−1)
i,biφai
}.
Proof Since the aggregated adjacency matrix M (t) is a symmetric matrix,then, each element (a, b), where a 6= b, has a symmetrical element (b, a) inM (t).When the two edges (a, b) and (b, a) are updated at time step t, we have
∆M (t) = ∆M(t)1 +∆M
(t)2 , where ∆M
(t)1 has only one non-zero element (a, b),
and ∆M(t)2 has only one non-zero element (b, a). Similar to Eq. 8, we have an
approximate updating rule as follows.
A(t) ∼= A(t−1) + αA(t−1)∆M
(t)1 A(t−1)
I + (v(1))TA(t−1)u(1)
+ αA(t−1)∆M
(t)2 A(t−1)
I + (u(1))TA(t−1)v(1)
(11)
where∆M(t)1 = u(1)(v(1))T ,∆M
(t)2 = v(1)(u(1))T and u(1), v(1) are two column
vectors.Besides, we also have
A(t) = A(t−1) + β(A(t−1)∆M(t)1 A(t−1) +A(t−1)∆M
(t)2 A(t−1))
where β = αI+(v(1))TA(t−1)u(1) , and β is a constant.
Therefore, A(t)i,j = A
(t−1)i,j + βA
(t−1)i,a A
(t−1)b,j + βA
(t−1)i,b A
(t−1)a,j .
Based on Theorem 2, we can claim that the largest K(t) elements in NN (t)(i, :)will not change, if it satisfies
α
I + V TA(t−1)U≤ T1 (12)

12 Dawei Zhou et al.
where T1 = min{ δ(t−1)i
A(t−1)
i,a1 φb1
,δ(t−1)i
A(t−1)
i,b1φa1
}.
Similarly, when there are m(t) pairs of edges being updated at time step t, wecan claim that if it satisfies
α
I + V TA(t−1)U≤
m(t)
minm=1{Tm} (13)
where Tm = min{ δ(t−1)i
A(t−1)i,ac φbc
,δ(t−1)i
A(t−1)i,bc
φac}, then the firstK(t) elements inNN (t)(i, :
) will not change. �
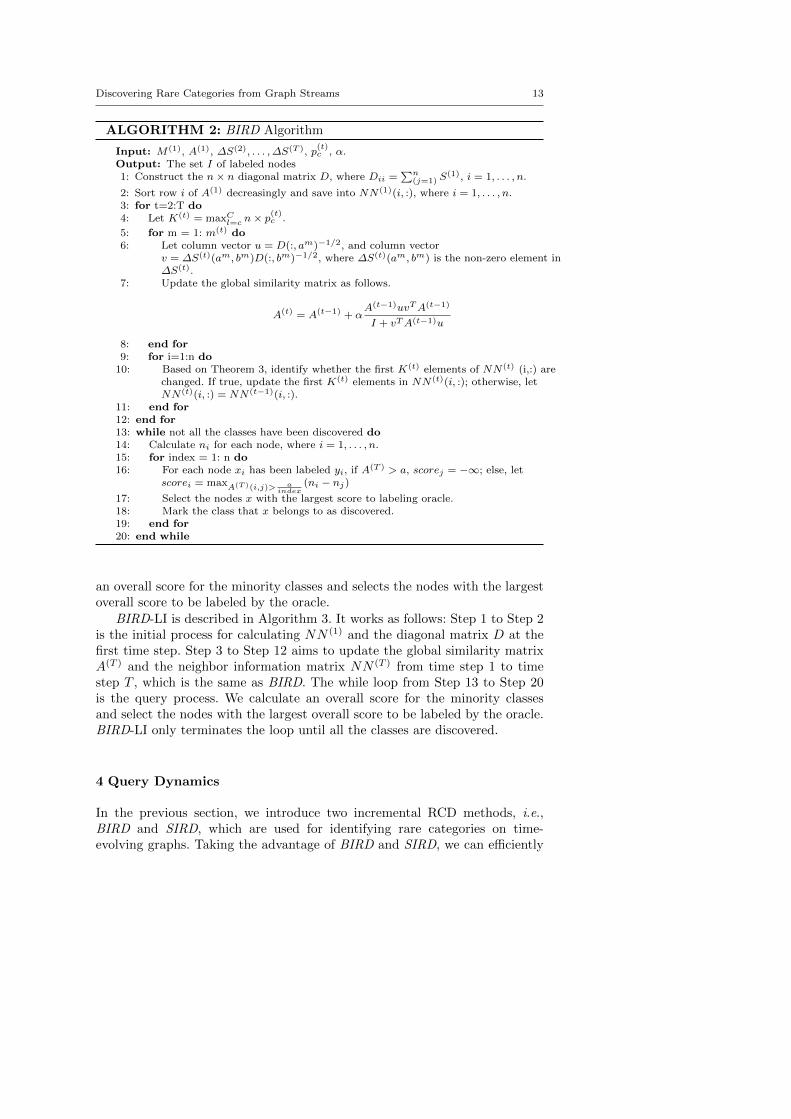
The Batch-update Incremental Rare Category Detection (BIRD) algorithmis shown in Algorithm 2. Step 1 and Step 2 are the initialization step. Step 3to Step 12 updates the global similarity matrix A(t) and the neighbor infor-mation matrix NN (t). Different from Algorithm 1, Step 5 to Step 8 iterativelyupdates the global similarity matrix A(t) based on m(t) changed edges. An-other difference is that, in Step 10, T is the minimum value of the thresholdscalculated from m(t) updated edges. At last, Step 13 to Step 20 is the queryprocess, which is the same as what we have described in Algorithm 1.
The efficiency of batch-edges updating in Algorithm 2 is proved by thefollowing lemma.
Lemma 2 In Algorithm 2, the computational cost of the updating process ateach time step is O(m(t)n2 + l ·K(t) · n).
Proof Different from Algorithm 1, in Algorithm 2, we have m(t) updated edgesat time step t. We need to update the global similarity matrix A(t) for m(t)
times. Thus, the computation cost of updating the global similarity matrixis O(m(t)n2). Let l be the number of rows in NN (t), which do not satisfyequation 13. For updating these rows in NN (t), the computational complexityis O(l ·K(t) · n). Thus, in total, the computation cost of updating process ateach time step is O(m(t)n2 + l ·K(t) · n). �
3.4 BIRD with Less Information
In many applications, it may be difficult to obtain the exact priors of all theminority classes. In this subsection, we introduce BIRD-LI, a modified versionof BIRD, which requires only an upper bound prior p(t) for all the minorityclasses existing at time step t. To be specific, BIRD-LI calculates NN (1) anddiagonal matrix D at the first time step, which is the same as BIRD. Then, theglobal similarity matrix A(t) and the neighbor information matrix NN (t) couldbe updated from the first time step to the time step T . The only differencebetween BIRD and BIRD-LI is that the size of the minority class K(t) iscalculated based on an estimated upper bound prior instead of the exact onesfor all the minority classes. After the updating process, BIRD-LI calculates
Discovering Rare Categories from Graph Streams 13
ALGORITHM 2: BIRD Algorithm
Input: M(1), A(1), ∆S(2), . . . ,∆S(T ), p(t)c , α.
Output: The set I of labeled nodes1: Construct the n× n diagonal matrix D, where Dii =
∑n(j=1) S
(1), i = 1, . . . , n.
2: Sort row i of A(1) decreasingly and save into NN(1)(i, :), where i = 1, . . . , n.3: for t=2:T do4: Let K(t) = maxC
l=c n× p(t)c .
5: for m = 1: m(t) do6: Let column vector u = D(:, am)−1/2, and column vector
v = ∆S(t)(am, bm)D(:, bm)−1/2, where ∆S(t)(am, bm) is the non-zero element in∆S(t).
7: Update the global similarity matrix as follows.
A(t) = A(t−1) + αA(t−1)uvTA(t−1)
I + vTA(t−1)u
8: end for9: for i=1:n do
10: Based on Theorem 3, identify whether the first K(t) elements of NN(t) (i,:) arechanged. If true, update the first K(t) elements in NN(t)(i, :); otherwise, letNN(t)(i, :) = NN(t−1)(i, :).
11: end for12: end for13: while not all the classes have been discovered do14: Calculate ni for each node, where i = 1, . . . , n.15: for index = 1: n do16: For each node xi has been labeled yi, if A(T ) > a, scorej = −∞; else, let
scorei = maxA(T )(i,j)> aindex
(ni − nj)
17: Select the nodes x with the largest score to labeling oracle.18: Mark the class that x belongs to as discovered.19: end for20: end while
an overall score for the minority classes and selects the nodes with the largestoverall score to be labeled by the oracle.
BIRD-LI is described in Algorithm 3. It works as follows: Step 1 to Step 2is the initial process for calculating NN (1) and the diagonal matrix D at thefirst time step. Step 3 to Step 12 aims to update the global similarity matrixA(T ) and the neighbor information matrix NN (T ) from time step 1 to timestep T , which is the same as BIRD. The while loop from Step 13 to Step 20is the query process. We calculate an overall score for the minority classesand select the nodes with the largest overall score to be labeled by the oracle.BIRD-LI only terminates the loop until all the classes are discovered.
4 Query Dynamics
In the previous section, we introduce two incremental RCD methods, i.e.,BIRD and SIRD, which are used for identifying rare categories on time-evolving graphs. Taking the advantage of BIRD and SIRD, we can efficiently

14 Dawei Zhou et al.
ALGORITHM 3: BIRD-LI Algorithm
Input: M(1), A(1), ∆S(2), . . . ,∆S(T ), p(t), α.Output: The set I of labeled nodes and the L of their labels1: Construct the n× n diagonal matrix D, where Dii =
∑n(j=1) S
(1), i = 1, . . . , n.
2: Sort row i of A(1) decreasingly and save into NN(t)(i, :), where i = 1, . . . , n.3: for t=2:T do4: Let K(t) = n× p(t).5: for m = 1: m(t) do6: Let column vector u = D(:, am)−1/2, and column vector
v = ∆S(t)(am, bm)D(:, bm)−1/2, where ∆S(t)(am, bm) is a non-zero element in∆S(t).
7: Update the global similarity matrix as follows.
A(t) = A(t−1) + αA(t−1)uvTA(t−1)
I + vTA(t−1)u
where u and vT are the two vectors decomposed from normalized updatingmatrix ∆M(t).
8: end for9: for i=1:n do
10: Based on Equation 13, identify whether the first K(t) elements of NN(t) (i,:) arechanged. If true, update the first K(t) elements in NN(t)(i, :); otherwise, letNN(t)(i, :) = NN(t−1)(i, :).
11: end for12: end for13: while not all the classes have been discovered do14: Calculate ni for each node, where i = 1, . . . , n15: for index = 1: n do16: For each node xi has been labeled yi, if A(T ) > a, scorej = −∞; else, let
scorei = maxA(T )(i,j)> aindex
(ni − nj)
17: Select the nodes x with the largest score to labeling oracle.18: Mark the class that x belongs to as discovered.19: end for20: end while
update the initial RCD model at time step 0 to any future time step T . How-ever, in many real word applications, we may not want to make queries tooracle at each time step or we may only be allowed with a limited number ofqueries. In these two cases, we introduce the following two open problems: (1)query locating (QL): how to find the optimal time step T to discover rare cate-gories; (2) query distribution (QD): how to allocate limited number of queriesinto different time steps.
4.1 Query Locating
First of all, we introduce the query locating problem. In real world applications,it could be the case that we are given a series of unlabeled time-evolving graphsS(1), S(2), . . . , S(T ), and we need to select an optimal time step Topt, so thatwe can identify the minority classes with as less queries as possible (ALAP)and as early as possible (AEAP).

Discovering Rare Categories from Graph Streams 15
Before presenting our methods, let us introduce the two main factors thatmay affect the required number of queries in rare category detection. The firstfactor is P (y = 2|xi), which is the probability that example xi belongs to theminority class given the features of xi. A considerable number of works havealready studied it before, such as MUVIR [35], GRADE [16] and NNDM [15].Another factor is the density Di at xi, the definition of which is introducedin Theorem 4. When the density Di at example xi is high, it means there aremany other examples close or similar to example xi. Suppose there are twonodes xi and xj in graph G, where P (y = 2|xi) = P (y = 2|xj) and Di > Dj .Since the density at node xi is larger than the density at node xj , there isa higher probability that multiple classes are overlapped in the neighborhoodof xi. To some extent, higher density Di implies higher probability of mis-classifying xi. Thus, the value of P (y = 2|xi) is negatively correlated with thenumber of required queries, and the value of density Di is positively corre-lated with the number of required labels. For the second factor, we introducethe following theorem to estimate local density based on the global similaritymatrix constructed before.
Theorem 4 For each example xi, the density of xi is positively correlated
with D(t)i at time step t, where D
(t)i = Σn
j=1A(t)i,j , i = 1, · · · , n.
Proof Notice that A(t)(i, j) represents the global similarity between xi and xj .
Thus, D(t)i = Σn
j=1A(t)i,j is the aggregated global similarity between example xi
and all the existing examples on graph. If the density of example xi is high,then it is always true that there are lots of examples which are similar or close
to xi. In other words, the density D(t)i should be large. Similarly, when the
density of xi is low, the value of D(t)i should be small. In conclusion, for any
existing example xi in the graph, its density is positively correlated with D(t)i .
�
We let score(t) = P (y = 2|x(t)i ), which could be obtained using existingtechniques such as MUVIR [35] or GRADE [16]. Under this circumstance, wepropose to assign the hardness of identifying the minority classes at time stept as follows.
I(t) =
{kc max
i=1,...,kc
score(t)i
D(t)i
}−1(14)
where kc is the number of examples in the minority class c. In Fig. 2, the leftfigure shows the exact number of queries needed to identify rare categoriesfrom a series of time-evolving graphs. The right figure shows the value of I(t)
calculated by Eq. 14. We can see these two curves are highly correlated.Let RS(t) denote the number of required queries by random sampling at
time step t. Simultaneously, let C = RS(1)−RS(T )
T . Intuitively, we could achieveoptimal solution Topt, when the difference between the “exact” saved number ofqueries and the estimated saved number of queries, i.e., C ∗Topt, is maximized.

16 Dawei Zhou et al.
Fig. 2: Correlation
The formulation is shown as follows.
maxt=1,...,T
I(1) − I(t)
I(1) − I(T )· (RS(1) −RS(T ))− C · t (15)
4.2 Query Distribution
In this subsection, we discuss a more general problem: Query Distribution. Inreal-world applications, it could be the case that the updated graphs come asstreams, and we need to allocate our query budget among multiple time steps.Hence, we need a method to allocate the queries properly among different timesteps and enable us to find the minority class examples with the minimumquery budget and time.
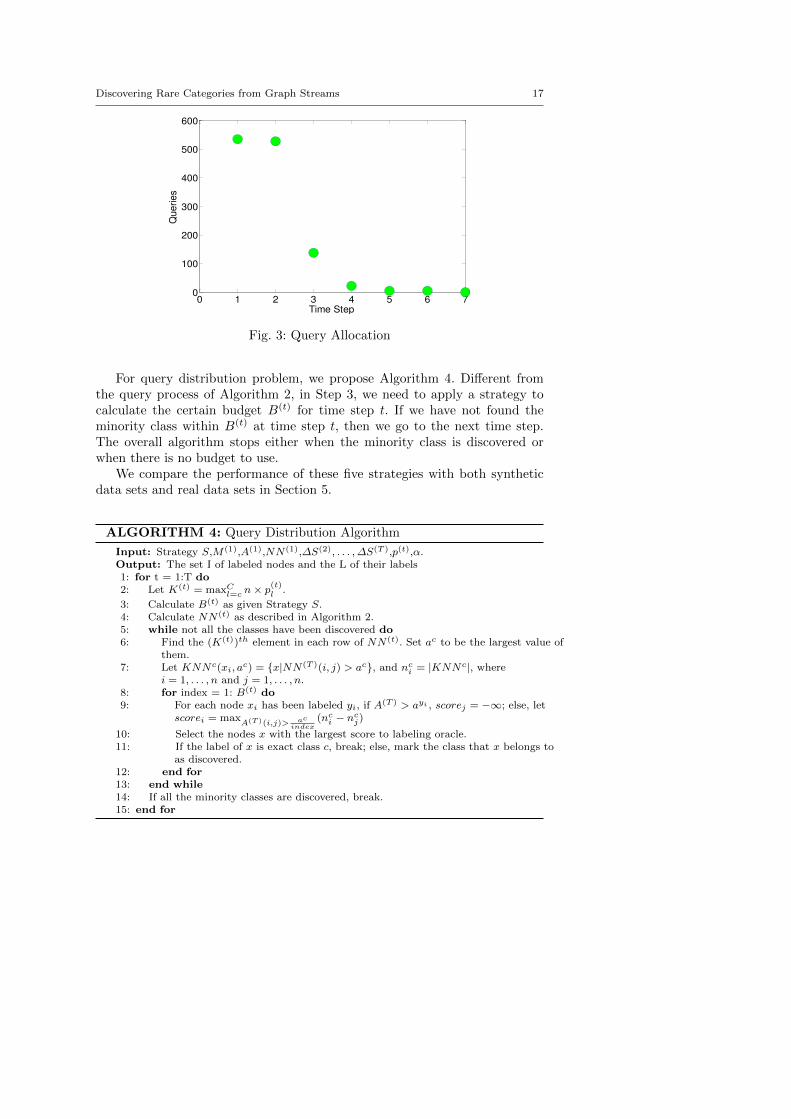
To further explore this problem, we generate a synthetic data set containingtwo classes, in which the initial proportion of the minority class equals to 0.1%.We increase the proportion of the minority class by 1% in each time step.In Fig. 3, each point (Q;T ) represents the minimum required budget Q foridentifying the minority class by time step T , and the budget is evenly allocatedfrom time step 1 to time step T . From this figure, we have 3 observations: (i)if we need to finish the task by time step 1, then the largest number of queriesis required; (ii) if we only need to finish the task by the last time step, thesmallest number of queries is required. (iii) the point at time step 3 is likelyto hold a good trade-off, which has a relatively low querying number and earlydetection time.
To further study the query dynamics problem, we propose 5 potentialstrategies for the query distribution problem:
– S1. Allocate all the budget at the first time step.– S2. Allocate all the budget at the last time step.– S3. Allocate all the budget into time step Topt.– S4. Allocate the query budget evenly among different time steps.– S5. Allocate the query budget into different time steps following exponen-
tial distribution, such as e−αt, where α > 0.
Discovering Rare Categories from Graph Streams 17
0 1 2 3 4 5 6 70
100
200
300
400
500
600
Time Step
Queries
Fig. 3: Query Allocation
For query distribution problem, we propose Algorithm 4. Different fromthe query process of Algorithm 2, in Step 3, we need to apply a strategy tocalculate the certain budget B(t) for time step t. If we have not found theminority class within B(t) at time step t, then we go to the next time step.The overall algorithm stops either when the minority class is discovered orwhen there is no budget to use.
We compare the performance of these five strategies with both syntheticdata sets and real data sets in Section 5.
ALGORITHM 4: Query Distribution Algorithm
Input: Strategy S,M(1),A(1),NN(1),∆S(2), . . . ,∆S(T ),p(t),α.Output: The set I of labeled nodes and the L of their labels1: for t = 1:T do2: Let K(t) = maxC
l=c n× p(t)l .
3: Calculate B(t) as given Strategy S.4: Calculate NN(t) as described in Algorithm 2.5: while not all the classes have been discovered do6: Find the (K(t))th element in each row of NN(t). Set ac to be the largest value of
them.7: Let KNNc(xi, a
c) = {x|NN(T )(i, j) > ac}, and nci = |KNNc|, where
i = 1, . . . , n and j = 1, . . . , n.8: for index = 1: B(t) do9: For each node xi has been labeled yi, if A(T ) > ayi , scorej = −∞; else, let
scorei = maxA(T )(i,j)> ac
index(nc
i − ncj)
10: Select the nodes x with the largest score to labeling oracle.11: If the label of x is exact class c, break; else, mark the class that x belongs to
as discovered.12: end for13: end while14: If all the minority classes are discovered, break.15: end for

18 Dawei Zhou et al.
5 Experiments
The analysis in Section 3 and Section 4 shows the advantage of our model inrare category detection on time-evolving graphs. In this section, we aim to em-pirically verify the effectiveness and the efficiency of the proposed algorithmson both synthetic data sets and real data sets.
5.1 Data Sets and Setup
Six time-evolving graph data sets are used for testing our proposed algorithms.Among these 6 data sets, there is 1 synthetic data set, 3 semi-real data setsand 2 real data sets. In Table 2, we list several statistics of each data set.
Table 2: Statistics of Different Data Sets.
Name Instance Time Steps Number of ClassesSynthetic Data 5,000 6 2Abalone 4,177 6 20Adult 48,842 6 2Statlog 58,000 6 6Epinion 5,665 16 24Twitter 16,149 5 6
The synthetic data set contains 5,000 instances, and we assume the pro-portion of the minority class is increasing over time. Hence, to generate thetime-evolving graphs in later time steps, we let the proportion of a certainminority class increase by 1% and simultaneously let the proportion of themajority class decrease by 1% at each time step. Meanwhile, we generate ad-ditional 6 time-evolving graphs for 6 more time steps.
The Abalone data set comes from a biology study. In this data set, we needto predict the age of abalone based on multiple features. The age varies from1 to 29, which roughly forms a normal distribution. Specifically, there are veryfew examples lying in the two extreme sides of the distribution. We separatethe Abalone data set into 5 classes, i.e., one majority class and 4 minorityclasses. The proportion of the majority class is 56.93%, and the proportionof the smallest class is 0.4%. Besides, we choose the minority class with thesmallest prior to evolve over time.
The Adult data set comes from a demographic census, which aims to pre-dict whether the income of people exceeds $50K per year or not. In Adult dataset, there are 48,842 examples containing one majority class and one minorityclass. The majority class is the population of income below $50K, and the mi-nority class is the population of income above $50K. In this data set, around24% of examples belong to the minority class. Since we stand on the problemof the rare category detection, we keep the majority class the same and only

Discovering Rare Categories from Graph Streams 19
take 500 examples from the minority class. In this way, we can generate 24data sets with the minority priors of 1.3%. Notice that all the experimentalresults for the Adult data set are calculated from the average values of the 24sub-data sets.
The Statlog data set comes from a shuttle schedule database, which consistsof 58,000 examples and 7 classes. However, we only include the 6 largest classesin our evaluation, because the smallest class only contains 13 examples. Afterthis modification, the priors of the 5 minority classes vary from 0.04% to15%. Same as before, we incrementally increase the proportion of the smallestminority class by 1% in each time step.
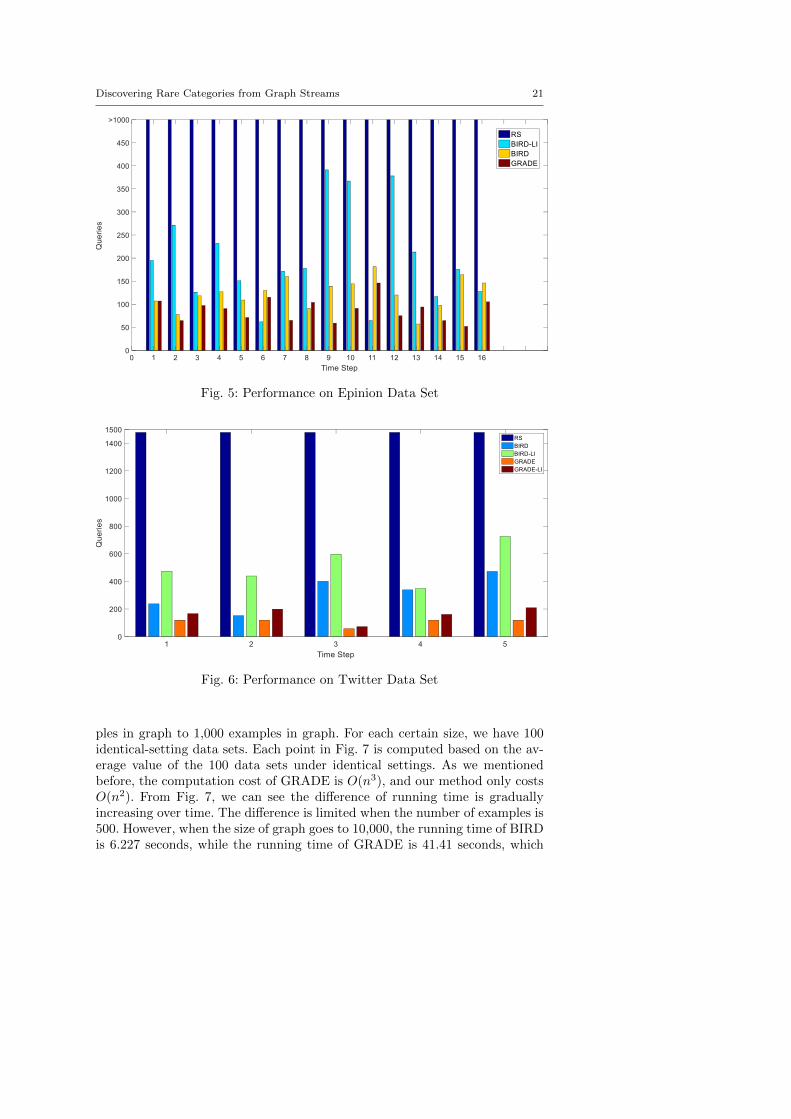
The Epinion data set is a collection of about 5,665 instances and 10,382features over 16 time steps crawled from Epinion.com. Epinions is a productreview site, where users can share their reviews about products. Users them-selves can also build trust networks to seek advice from others. In this dataset, each product is an instance, and the features for each product are formedby the bag-of-words model upon its reviews. In addition, the smallest class inEpinion only consists 0.03% vertices while the proportion of the largest classis 17.56%.
The Twitter data set is crawled from Twitter streaming API based on aset of terrorism related keywords, such as shoot, kidnap, blast and etc.. Weinclude 16,149 English-speaking twitter users from 6 countries and around 10millions tweets from 4/25/2015 to 5/5/2015. Then, we extract 209 featuresbased on users’ profiles, sentiments analysis, topic model analysis and users’ego-network analysis. In this data set, there are 56% of users from Turkey,0.09% from Syria, 0.3% from Iraq, 1.3% from Iran, 36% from Saudi Arabiaand 5.8% from Yemen. We separate the users into 6 classes based on theirnationalities and generate a time-evolving graph in each 2-day interval.
5.2 Performance Evaluation
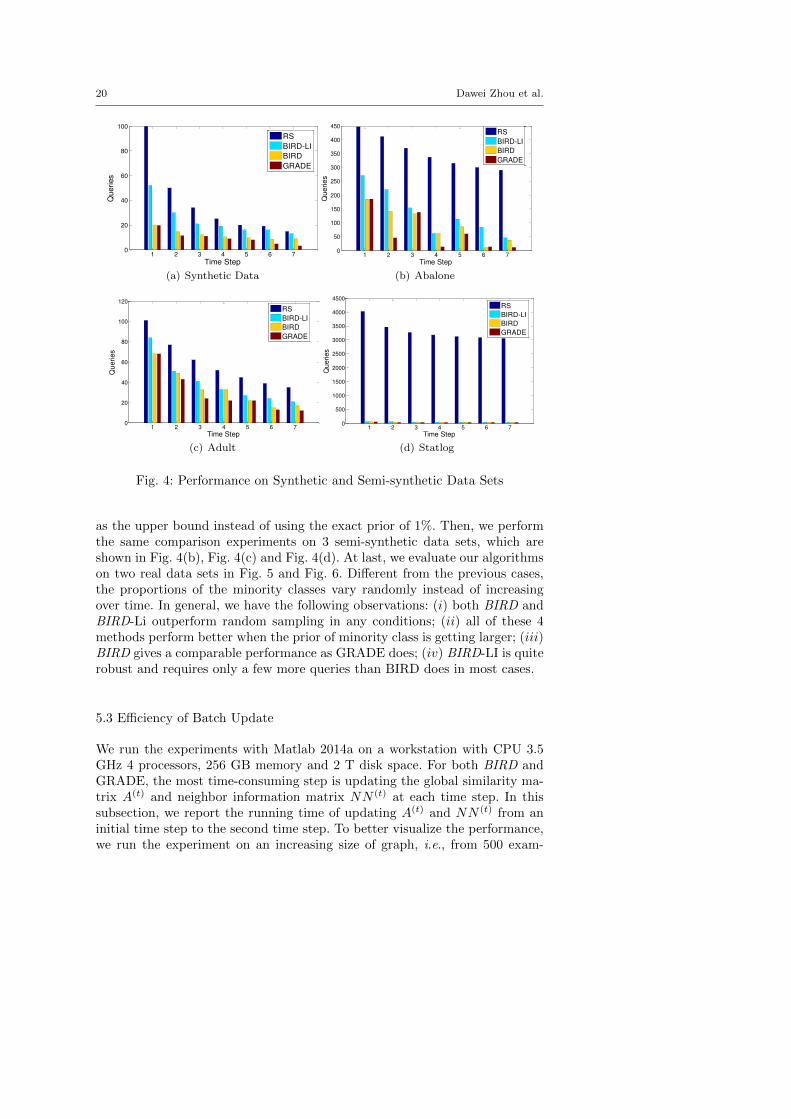
First of all, we demonstrate the effectiveness upon 1,000 synthetic data setsand 3 semi-synthetic data sets. We generate 1,000 synthetic data sets, andeach of them contains 5,000 examples belonging to two classes. Besides, weinitialize the priors of the minority classes as 1% and increase these priorsby 1% at each time step. We also make use of 3 real data sets which meetthe scenario of rare category detection. The details of these 3 real data setsare summarized in Table 2. Then, we synthesize additional 6 time-evolvinggraphs from time step 2 to time step 7. For these time-evolving graphs, we letthe proportion of a certain minority class increase by 1% and simultaneouslylet the proportion of the majority class decrease by 1% at each time step.Fig. 4(a) shows the comparison results of 4 different methods: random sampling(RS), BIRD, BIRD-LI and GRADE. Notice that BIRD and BIRD-LI performthe query process upon the approximate aggregated adjacency matrix, whileGRADE is performed on the exact adjacency matrix at each time step. Besides,we provide BIRD-LI with a much looser prior upper bound, e.g., we input 5%
20 Dawei Zhou et al.
1 2 3 4 5 6 70
20
40
60
80
100
Time Step
Qu
eries
RS
BIRD-LI
BIRD
GRADE
(a) Synthetic Data
1 2 3 4 5 6 70
50
100
150
200
250
300
350
400
450
Time Step
Queries
RS
BIRD-LI
BIRD
GRADE
(b) Abalone
1 2 3 4 5 6 70
20
40
60
80
100
120
Time Step
Qu
erie
s
RS
BIRD-LI
BIRD
GRADE
(c) Adult
1 2 3 4 5 6 70
500
1000
1500
2000
2500
3000
3500
4000
4500
Queries
Time Step
RS
BIRD-LI
BIRD
GRADE
(d) Statlog
Fig. 4: Performance on Synthetic and Semi-synthetic Data Sets
as the upper bound instead of using the exact prior of 1%. Then, we performthe same comparison experiments on 3 semi-synthetic data sets, which areshown in Fig. 4(b), Fig. 4(c) and Fig. 4(d). At last, we evaluate our algorithmson two real data sets in Fig. 5 and Fig. 6. Different from the previous cases,the proportions of the minority classes vary randomly instead of increasingover time. In general, we have the following observations: (i) both BIRD andBIRD-Li outperform random sampling in any conditions; (ii) all of these 4methods perform better when the prior of minority class is getting larger; (iii)BIRD gives a comparable performance as GRADE does; (iv) BIRD-LI is quiterobust and requires only a few more queries than BIRD does in most cases.
5.3 Efficiency of Batch Update
We run the experiments with Matlab 2014a on a workstation with CPU 3.5GHz 4 processors, 256 GB memory and 2 T disk space. For both BIRD andGRADE, the most time-consuming step is updating the global similarity ma-trix A(t) and neighbor information matrix NN (t) at each time step. In thissubsection, we report the running time of updating A(t) and NN (t) from aninitial time step to the second time step. To better visualize the performance,we run the experiment on an increasing size of graph, i.e., from 500 exam-
Discovering Rare Categories from Graph Streams 21
Fig. 5: Performance on Epinion Data Set
Fig. 6: Performance on Twitter Data Set
ples in graph to 1,000 examples in graph. For each certain size, we have 100identical-setting data sets. Each point in Fig. 7 is computed based on the av-erage value of the 100 data sets under identical settings. As we mentionedbefore, the computation cost of GRADE is O(n3), and our method only costsO(n2). From Fig. 7, we can see the difference of running time is graduallyincreasing over time. The difference is limited when the number of examples is500. However, when the size of graph goes to 10,000, the running time of BIRDis 6.227 seconds, while the running time of GRADE is 41.41 seconds, which

22 Dawei Zhou et al.
is 7 times of BIRD. Moreover, the difference would be even more significantwhen we run algorithms on a series of time steps.
Runnin
g Tim
e
Number of Nodes in Graphs
Fig. 7: Efficiency
5.4 Query Dynamics
In this subsection, we show the performance of query locating and query dis-tribution. In Fig. 8, we apply the query locating methods on 3 real data sets.As the proportion is increasing over time, the labeling request is decreasing ingeneral. Besides, we also observe that Topt is always located at the left bottomof each graph, which meets our ALAP and AEAP intuitions.
Furthermore, by applying Algorithm 4, we perform the results of 5 differentstrategies on one binary-class synthetic data set and one binary-class real dataset, i.e., Adult. In both Fig. 9(a) and F.g 9(b), we observe that Strategy S1is always located at the left top of the figure, which holds the time optimal;Strategy S2 is always located at the right bottom of the figure, which holdsthe budget optimal; Strategy S3 is always located at the left bottom of thefigure, which considers both the time and the budget factors. All of these 3observations are consistent with our intuitions.
Besides, we also find two interesting observations. The first one is that,in Fig. 9(a), Strategy S4 performs slightly better than Strategy S5, whileStrategy S5 outperforms Strategy S4 in Fig. 9(b). The reason is as follows.Strategy S5 always allocates most of the budget at the earliest few time steps,which is why Strategy S5 could identify minority class examples at time step1 in Fig. 9(b). But, if Strategy S5 cannot discover the minority class at thebeginning, it will finish the task later than Strategy S4, which is why S5performs worse than S4 in Fig. 9(a). Strategy S4 allocates its budget evenly

Discovering Rare Categories from Graph Streams 23
0 2 4 6 80
50
100
150
200
Time Step
Queries
(a) Abalone
0 2 4 6 80
20
40
60
80
Time Step
Queries
(b) Adult
0 2 4 6 830
35
40
45
50
Time Step
Queries
(c) Statlog
Fig. 8: Query Locating
among each time steps. However, when the task is relatively tough at thebeginning few time steps and relatively easy at the end, Strategy S4 mayfail. This is what is happening in Fig. 9(b). Another interesting observationis that, in Fig. 9(b), Strategy S3 only queries 27 examples at time step 3 fordiscovering the minority class, while Strategy S4 needs 39 labeling requests.Since the graph is evolving over time, Strategy S4 may automatically skipsome minority-class examples when these examples are pretty similar to theprevious labeled examples, which is the reason why Strategy S4 requires morequeries.
6 Conclusion
In this paper, we mainly focus on the problem of efficiently and incremen-tally identifying under-represented rare category examples from time-evolvinggraphs. We propose two fast incremental updating algorithms, i.e., BIRD andSIRD, as well as a generalized version of BIRD named BIRD-LI to handlethe problems where the exact priors of the minority classes are unknown. Fur-thermore, based on our algorithms, we introduce five strategies to deal withthe novel problem – query distribution. To the best of our knowledge, thisis the first attempt in rare category detection under these dynamic settings.

24 Dawei Zhou et al.
0 2 4 6 80
20
40
60
80
Time Step
Queries
S1
S2
S3
S4
S5
(a) Synthetic Data Set
0 2 4 6 80
10
20
30
40
Time Step
Queries
S1
S2
S3S4
S5
(b) Real Data Set(Adult)
Fig. 9: Query Distribution
The comparison experiments with state-of-the-art methods demonstrate theeffectiveness and the efficiency of the proposed algorithms.
Acknowledgment
This work is supported by NSF research grant IIS-1552654, and an IBM Fac-ulty Award. The views and conclusions are those of the authors and shouldnot be interpreted as representing the official policies of the funding agenciesor the U.S. Government.
References
1. Aggarwal CC, Philip SY (2010) On clustering massive text and categoricaldata streams. Knowledge and Information Systems 24(2):171–196
2. Akoglu L, McGlohon M, Faloutsos C (2010) Oddball: Spotting anomaliesin weighted graphs. In: Pacific-Asia Conference on Knowledge Discoveryand Data Mining, Springer, pp 410–421
3. Akoglu L, Khandekar R, Kumar V, Parthasarathy S, Rajan D, Wu KL(2014) Fast nearest neighbor search on large time-evolving graphs. In:Joint European Conference on Machine Learning and Knowledge Discov-ery in Databases, Springer, pp 17–33
4. Backstrom L, Huttenlocher D, Kleinberg J, Lan X (2006) Group forma-tion in large social networks: membership, growth, and evolution. In: ACMSIGKDD International Conference on Knowledge Discovery and DataMining, ACM, pp 44–54
5. Berlingerio M, Koutra D, Eliassi-Rad T, Faloutsos C (2012) Netsim-ile: a scalable approach to size-independent network similarity. In: arXivpreprint arXiv:1209.2684
6. Bettencourt LM, Hagberg AA, Larkey LB (2007) Separating the wheatfrom the chaff: practical anomaly detection schemes in ecological applica-
Discovering Rare Categories from Graph Streams 25
tions of distributed sensor networks. In: Distributed Computing in SensorSystems, Springer, pp 223–239
7. Dasgupta S, Hsu D (2008) Hierarchical sampling for active learning. In:International Conference on Machine Learning, ACM, pp 208–215
8. Davis M, Liu W, Miller P, Redpath G (2011) Detecting anomalies ingraphs with numeric labels. In: ACM International Conference on Infor-mation and Knowledge Management, ACM, pp 1197–1202
9. Eberle W, Graves J, Holder L (2010) Insider threat detection using agraph-based approach. Journal of Applied Security Research 6(1):32–81
10. Fan W, Wang X, Wu Y (2013) Incremental graph pattern matching. ACMTransactions on Database Systems 38(3):18
11. Franke C, Gertz M (2008) Detection and exploration of outlier regions insensor data streams. In: IEEE International Conference on Data MiningWorkshops, IEEE, pp 375–384
12. Gao J, Liang F, Fan W, Wang C, Sun Y, Han J (2010) On communityoutliers and their efficient detection in information networks. In: ACMSIGKDD International Conference on Knowledge Discovery and DataMining, ACM, pp 813–822
13. Gupta M, Gao J, Aggarwal C, Han J (2014) Outlier detection for temporaldata. Synthesis Lectures on Data Mining and Knowledge Discovery 5(1):1–129
14. Gupte M, Eliassi-Rad T (2012) Measuring tie strength in implicit socialnetworks. In: Annual ACM Web Science Conference, ACM, pp 109–118
15. He J, Carbonell JG (2007) Nearest-neighbor-based active learning for rarecategory detection. In: Advances in Neural Information Processing Sys-tems, pp 633–640
16. He J, Liu Y, Lawrence R (2008) Graph-based rare category detection. In:IEEE International Conference on Data Mining, IEEE, pp 833–838
17. He J, Tong H, Carbonell J (2010) Rare category characterization. In: IEEEInternational Conference on Data Mining, IEEE, pp 226–235
18. Henderson K, Eliassi-Rad T, Faloutsos C, Akoglu L, Li L, Maruhashi K,Prakash BA, Tong H (2010) Metric forensics: a multi-level approach formining volatile graphs. In: ACM SIGKDD International Conference onKnowledge Discovery and Data Mining, ACM, pp 163–172
19. Hill DJ, Minsker BS, Amir E (2007) Real-time bayesian anomaly detectionfor environmental sensor data. In: Congress-International Association forHydraulic Research, Citeseer, vol 32, p 503
20. Kang U, McGlohon M, Akoglu L, Faloutsos C (2010) Patterns on theconnected components of terabyte-scale graphs. In: IEEE InternationalConference on Data Mining, IEEE, pp 875–880
21. Kang U, Tsourakakis CE, Appel AP, Faloutsos C, Leskovec J (2011) Hadi:Mining radii of large graphs. ACM Transactions on Knowledge Discoveryfrom Data 5(2):8
22. Koutra D, Ke TY, Kang U, Chau DHP, Pao HKK, Faloutsos C (2011)Unifying guilt-by-association approaches: Theorems and fast algorithms.In: Joint European Conference on Machine Learning and Knowledge Dis-

26 Dawei Zhou et al.
covery in Databases, Springer, pp 245–26023. Koutra D, Papalexakis EE, Faloutsos C (2012) Tensorsplat: Spotting la-
tent anomalies in time. In: Panhellenic Conference on Informatics, IEEE,pp 144–149
24. Kumar R, Mahdian M, McGlohon M (2010) Dynamics of conversations.In: ACM SIGKDD International Conference on Knowledge Discovery andData Mining, ACM, pp 553–562
25. Leskovec J, Kleinberg J, Faloutsos C (2005) Graphs over time: densi-fication laws, shrinking diameters and possible explanations. In: ACMSIGKDD International Conference on Knowledge Discovery and DataMining, ACM, pp 177–187
26. Liu Z, Chiew K, He Q, Huang H, Huang B (2014) Prior-free rare cate-gory detection: More effective and efficient solutions. Expert Systems withApplications 41(17):7691–7706
27. Muller E, Sanchez PI, Mulle Y, Bohm K (2013) Ranking outlier nodesin subspaces of attributed graphs. In: IEEE International Conference onData Engineering Workshops, IEEE, pp 216–222
28. Pelleg D, Moore AW (2004) Active learning for anomaly and rare-categorydetection. In: Advances in Neural Information Processing Systems, pp1073–1080
29. Phua C, Lee V, Smith K, Gayler R (2010) A comprehensive survey of datamining-based fraud detection research. arXiv preprint arXiv:10096119
30. Sherman J, Morrison WJ (1950) Adjustment of an inverse matrix corre-sponding to a change in one element of a given matrix. The Annals ofMathematical Statistics 21(1):124–127
31. Sricharan K, Das K (2014) Localizing anomalous changes in time-evolvinggraphs. In: ACM SIGMOD International Conference on Management ofData, ACM, pp 1347–1358
32. Tong H, Papadimitriou S, Philip SY, Faloutsos C (2008) Proximity track-ing on time-evolving bipartite graphs. In: SIAM International Conferencein Data Mining, pp 704–715
33. Yamanishi K, Takeuchi Ji (2002) A unifying framework for detecting out-liers and change points from non-stationary time series data. In: ACMSIGKDD International Conference on Knowledge Discovery and DataMining, ACM, pp 676–681
34. Yamanishi K, Takeuchi JI, Williams G, Milne P (2004) On-line unsu-pervised outlier detection using finite mixtures with discounting learningalgorithms. Data Mining and Knowledge Discovery 8(3):275–300
35. Zhou D, He J, Candan K, Davulcu H (2015) Muvir: Multi-view rare cate-gory detection. In: International Joint Conference on Artificial Intelligence,pp 4098–4104
36. Zhou D, Wang K, Cao N, He J (2015) Rare category detection on time-evolving graphs. In: IEEE International Conference on Data Mining,IEEE, pp 1135–1140
Related Documents