Disclosures and legal compliance This section contains the department’s audited Financial Statements and Key Performance Indicators for the year ending 30 June 2013. The section also provides details on required disclosures and legal compliance obligations, including financial and performance management, accountability, governance and annual reporting required under specific legislation administered by the department. Department of Commerce | Annual Report 2012-13 57 Audit Opinion 58 Financial Statements 61 Performance Indicator Report 125 Ministerial directives 140 Other financial disclosures 140 Governance disclosures 141 Other legal requirements 143 Government policy requirements 174

Welcome message from author
This document is posted to help you gain knowledge. Please leave a comment to let me know what you think about it! Share it to your friends and learn new things together.
Transcript

Disclosures and legal
complianceThis section contains the department’s audited
Financial Statements and Key Performance Indicators for the year ending 30 June 2013.
The section also provides details on required disclosures and legal compliance obligations, including
financial and performance management, accountability, governance and annual reporting required under
specific legislation administered by the department.
Department of Commerce | Annual Report 2012-13 57
Audit Opinion 58
Financial Statements 61
Performance Indicator Report 125
Ministerial directives 140
Other financial disclosures 140
Governance disclosures 141
Other legal requirements 143
Government policy requirements 174

Independent Auditor’s ReportTo the Parliament of Western Australia
Department of CommerceReport on the Financial StatementsI have audited the accounts and financial statements of the Department of Commerce.
The financial statements comprise the Statement of Financial Position as at 30 June 2013, the Statement of Comprehensive Income, Statement of Changes in Equity, Statement of Cash Flows, Schedule of Income and Expenses by Service, Schedule of Assets and Liabilities by Service, and Summary of Consolidated Account Appropriations and Income Estimates for the year then ended, and Notes comprising a summary of significant accounting policies and other explanatory information, including Administered transactions and balances.
Director General’s Responsibility for the Financial Statements The Director General is responsible for keeping proper accounts, and the preparation and fair presentation of the financial statements in accordance with Australian Accounting Standards and the Treasurer’s Instructions, and for such internal control as the Director General determines is necessary to enable the preparation of financial statements that are free from material misstatement, whether due to fraud or error.
Auditor’s Responsibility As required by the Auditor General Act 2006, my responsibility is to express an opinion on the financial statements based on my audit. The audit was conducted in accordance with Australian Auditing Standards. Those Standards require compliance with relevant ethical requirements relating to audit engagements and that the audit be planned and performed to obtain reasonable assurance about whether the financial statements are free from material misstatement.
Audit Opinion
Department of Commerce | Annual Report 2012-1358

An audit involves performing procedures to obtain audit evidence about the amounts and disclosures in the financial statements. The procedures selected depend on the auditor’s judgement, including the assessment of the risks of material misstatement of the financial statements, whether due to fraud or error. In making those risk assessments, the auditor considers internal control relevant to the Department’s preparation and fair presentation of the financial statements in order to design audit procedures that are appropriate in the circumstances. An audit also includes evaluating the appropriateness of the accounting policies used and the reasonableness of accounting estimates made by the Director General, as well as evaluating the overall presentation of the financial statements.
I believe that the audit evidence obtained is sufficient and appropriate to provide a basis for my audit opinion.
OpinionIn my opinion, the financial statements are based on proper accounts and present fairly, in all material respects, the financial position of the Department of Commerce at 30 June 2013 and its financial performance and cash flows for the year then ended. They are in accordance with Australian Accounting Standards and the Treasurer’s Instructions.
Report on ControlsI have audited the controls exercised by the Department of Commerce during the year ended 30 June 2013.
Controls exercised by the Department of Commerce are those policies and procedures established by the Director General to ensure that the receipt, expenditure and investment of money, the acquisition and disposal of property, and the incurring of liabilities have been in accordance with legislative provisions.
Director General’s Responsibility for Controls The Director General is responsible for maintaining an adequate system of internal control to ensure that the receipt, expenditure and investment of money, the acquisition and disposal of public and other property, and the incurring of liabilities are in accordance with the Financial Management Act 2006 and the Treasurer’s Instructions, and other relevant written law.
Auditor’s Responsibility As required by the Auditor General Act 2006, my responsibility is to express an opinion on the controls exercised by the Department of Commerce based on my audit conducted in accordance with Australian Auditing and Assurance Standards.
An audit involves performing procedures to obtain audit evidence about the adequacy of controls to ensure that the Department complies with the legislative provisions. The procedures selected depend on the auditor’s judgement and include an evaluation of the design and implementation of relevant controls.
I believe that the audit evidence obtained is sufficient and appropriate to provide a basis for my audit opinion.
OpinionIn my opinion, the controls exercised by the Department of Commerce are sufficiently adequate to provide reasonable assurance that the receipt, expenditure and investment of money, the acquisition and disposal of property, and the incurring of liabilities have been in accordance with legislative provisions during the year ended 30 June 2013.
Report on the Key Performance IndicatorsI have audited the key performance indicators of the Department of Commerce for the year ended 30 June 2013.
The key performance indicators are the key effectiveness indicators and the key efficiency indicators that provide information on outcome achievement and service provision.
Director General’s Responsibility for the Key Performance Indicators The Director General is responsible for the preparation and fair presentation of the key performance indicators in accordance with the Financial Management Act 2006 and the Treasurer’s Instructions and for such controls as the Director General determines necessary to ensure that the key performance indicators fairly represent indicated performance.
Department of Commerce | Annual Report 2012-13 59

Auditor’s Responsibility As required by the Auditor General Act 2006, my responsibility is to express an opinion on the key performance indicators based on my audit conducted in accordance with Australian Auditing and Assurance Standards.
An audit involves performing procedures to obtain audit evidence about the key performance indicators. The procedures selected depend on the auditor’s judgement, including the assessment of the risks of material misstatement of the key performance indicators. In making these risk assessments the auditor considers internal control relevant to the Director General’s preparation and fair presentation of the key performance indicators in order to design audit procedures that are appropriate in the circumstances. An audit also includes evaluating the relevance and appropriateness of the key performance indicators for measuring the extent of outcome achievement and service provision.
I believe that the audit evidence obtained is sufficient and appropriate to provide a basis for my audit opinion.
OpinionIn my opinion, the key performance indicators of the Department of Commerce are relevant and appropriate to assist users to assess the Department’s performance and fairly represent indicated performance for the year ended 30 June 2013.
IndependenceIn conducting this audit, I have complied with the independence requirements of the Auditor General Act 2006 and Australian Auditing and Assurance Standards, and other relevant ethical requirements.
Matters Relating to the Electronic Publication of the Audited Financial Statements and Key Performance Indicators
This auditor’s report relates to the financial statements and key performance indicators of the Department of Commerce for the year ended 30 June 2013 included on the Department’s website. The Department’s management is responsible for the integrity of the Department’s website. This audit does not provide assurance on the integrity of the Department’s website. The auditor’s report refers only to the financial statements and key performance indicators described above. It does not provide an opinion on any other information which may have been hyperlinked to/from these financial statements or key performance indicators. If users of the financial statements and key performance indicators are concerned with the inherent risks arising from publication on a website, they are advised to refer to the hard copy of the audited financial statements and key performance indicators to confirm the information contained in this website version of the financial statements and key performance indicators.
Colin Murphy Auditor General for Western Australia Perth, Western Australia 18 September 2013
Department of Commerce | Annual Report 2012-1360

FinancialStatements
Certification of Financial Statements for the year ended 30 June 2013
The accompanying financial statements of the Department of Commerce have been prepared in compliance with the
provisions of the Financial Management Act 2006 from proper accounts and records to present fairly the financial
transactions for the financial year ending 30 June 2013 and the financial position as at 30 June 2013.
At the date of signing we are not aware of any circumstances which would render the particulars included
in the financial statements misleading or inaccurate.
Brian Bradley Accountable Authority 17 September 2013
David Goodwin Chief Finance Officer 17 September 2013
Department of Commerce | Annual Report 2012-13 61

Statement of Comprehensive IncomeFor the year ended 30 June 2013
2013 2012Note $’000 $’000
COST OF SERVICESExpenses
Employee benefits expense 4 95,949 88,055Supplies and services 5 44,548 40,405Depreciation and amortisation expense 6 2,733 2,456Finance costs 7 31 36Accommodation expenses 8 15,112 14,706Grants and subsidies 9 50,606 61,086Revaluation decrements expense 14 389 8,819Loss on disposal of non-current assets 15 - 79Other expenses 10 382 85
Total cost of services 209,750 215,727IncomeRevenue
User charges and fees 11 53,338 38,843Sales 11 38 53Commonwealth grants and contributions 12 2,075 3,879Other revenue 13 30,956 40,702Total revenue 86,407 83,477
GainsOther gains 15a 204 - Total gains 204 -
Total income other than income from State Government 86,611 83,477NET COST OF SERVICES 123,139 132,250INCOME FROM STATE GOVERNMENT 16
Service appropriation 105,929 142,731Initial recognition of assets not previously recognised - 138,385Services received free of charge 1,092 1,177Royalties for Regions Fund 18,727 7,889
Total income from State Government 125,748 290,182SURPLUS FOR THE PERIOD 2,608 157,932OTHER COMPREHENSIVE INCOME 29
Items not reclassified subsequently to profit or lossChanges in asset revaluation surplus 449 1,706
Total other comprehensive income 449 1,706TOTAL COMPREHENSIVE INCOME FOR THE PERIOD 3,057 159,638
Refer to the ‘Schedule of Income and Expenses by Service’.
The Statement of Comprehensive Income should be read in conjunction with the accompanying notes.
Department of Commerce | Annual Report 2012-1362

Statement of Financial PositionAs at 30 June 2013
Refer to the ‘Schedule of Assets and Liabilities by Service’.
The Statement of Financial Position should be read in conjunction with the accompanying notes.
2013 2012Note $’000 $’000
ASSETSCurrent Assets
Cash and cash equivalents 30 23,573 13,311Restricted cash and cash equivalents 17 182,049 175,445Receivables 18 11,668 19,797Amounts receivable for services 19 2,200 3,234Non-current assets classified as held for sale 21a 1,750 2,139Other current assets 20 67 1,598Total Current Assets 221,308 215,523
Non-Current AssetsRestricted cash and cash equivalents 17 2,449 2,099Receivables 18 9,529 9,335Amounts receivable for services 19 5,789 6,746Property, plant and equipment 21 40,424 40,782Intangible assets 22 8,893 8,918
Total Non-Current Assets 67,084 67,881TOTAL ASSETS 288,392 283,404LIABILITIESCurrent Liabilities
Payables 24 6,595 14,761Unearned revenues 27 6,531 4,292Provisions 26 22,399 20,638Other current liabilities 28 3,497 1,381
Total Current Liabilities 39,022 41,071Non-Current Liabilities
Payables 24 782 1,010Unearned revenues 27 8,640 5,420Borrowings 25 771 771Provisions 26 4,961 4,708
Total Non-Current Liabilities 15,154 11,909TOTAL LIABILITIES 54,176 52,980NET ASSETS 234,216 230,424EQUITY 29
Contributed equity 77,649 76,913Reserves 5,962 5,513Accumulated surplus 150,606 147,997
TOTAL EQUITY 234,216 230,424TOTAL EQUITY & LIABILITY 288,392 283,404
Department of Commerce | Annual Report 2012-13 63

Statement of Changes in EquityFor the year ended 30 June 2013
Contributed equity Reserves
Accumulated surplus Total equity
Note $’000 $’000 $’000 $’000Balance at 1 July 2011 29 75,022 3,807 (9,935) 68,894
Surplus - - 157,932 157,932 Other Comprehensive income - 1,706 - 1,706
Total comprehensive income for the period - 1,706 157,932 159,638 Transactions with owners in their capacity as owners:
Capital appropriations 1,888 - - 1,888 Distribution to owners 3 - - 3
Total 1,891 - - 1,891 Balance at 30 June 2012 76,913 5,513 147,997 230,424 Balance at 1 July 2012 76,913 5,513 147,997 230,424
Surplus - - 2,608 2,608 Other Comprehensive income - 449 - 449
Total comprehensive income for the period - 449 2,608 3,057 Transactions with owners in their capacity as owners:
Capital appropriations 2,956 - - 2,956 Distribution to owners (2,220) - - (2,220)
Total 736 - - 736 Balance at 30 June 2013 77,649 5,962 150,605 234,216
The Statement of Changes in Equity should be read in conjunction with the accompanying notes.
Department of Commerce | Annual Report 2012-1364

Statement of Cash FlowsFor the year ended 30 June 2013
2013 2012Note $’000 $’000
CASH FLOWS FROM STATE GOVERNMENTService appropriation 105,720 141,508Initial recognition of assets not previously recognised - 138,385Capital appropriations 2,956 1,888Holding account drawdowns 2,200 3,234Royalties for Regions Fund 18,727 7,889Cash transferred from other State Government agency - 3
Net cash provided by/(used in) State Government 129,603 292,907Utilised as follows:CASH FLOWS FROM OPERATING ACTIVITIESPayments
Employee benefits (93,936) (85,017)Supplies and services (51,510) (39,136)Finance costs (31) (36)Accommodation (15,112) (14,706)Grants and subsidies (50,606) (63,862)GST payments on purchases (5,083) (6,435)Other payments (382) (85)
ReceiptsUser charges and fees 69,296 36,631Sale of goods and services 38 53Commonwealth grants and contributions 2,075 3,879GST receipts on sales 522 508
GST receipts from taxation authority 3,367 3,327Other receipts 30,956 40,702
Net cash provided by/(used in) operating activities 30 (110,408) (124,176)CASH FLOWS FROM INVESTING ACTIVITIES
PaymentsPurchase of non-current physical assets (1,978) (3,149)
ReceiptsProceeds from sale of non-current physical assets - -
Net cash provided by/(used in) investing activities (1,978) (3,149)Net increase in cash and cash equivalents 17,217 165,581Cash and cash equivalents at the beginning of the period 190,854 25,273CASH AND CASH EQUIVALENTS AT THE END OF THE PERIOD 30 208,071 190,854
The Statement of Cash Flows should be read in conjunction with the accompanying notes.
Department of Commerce | Annual Report 2012-13 65
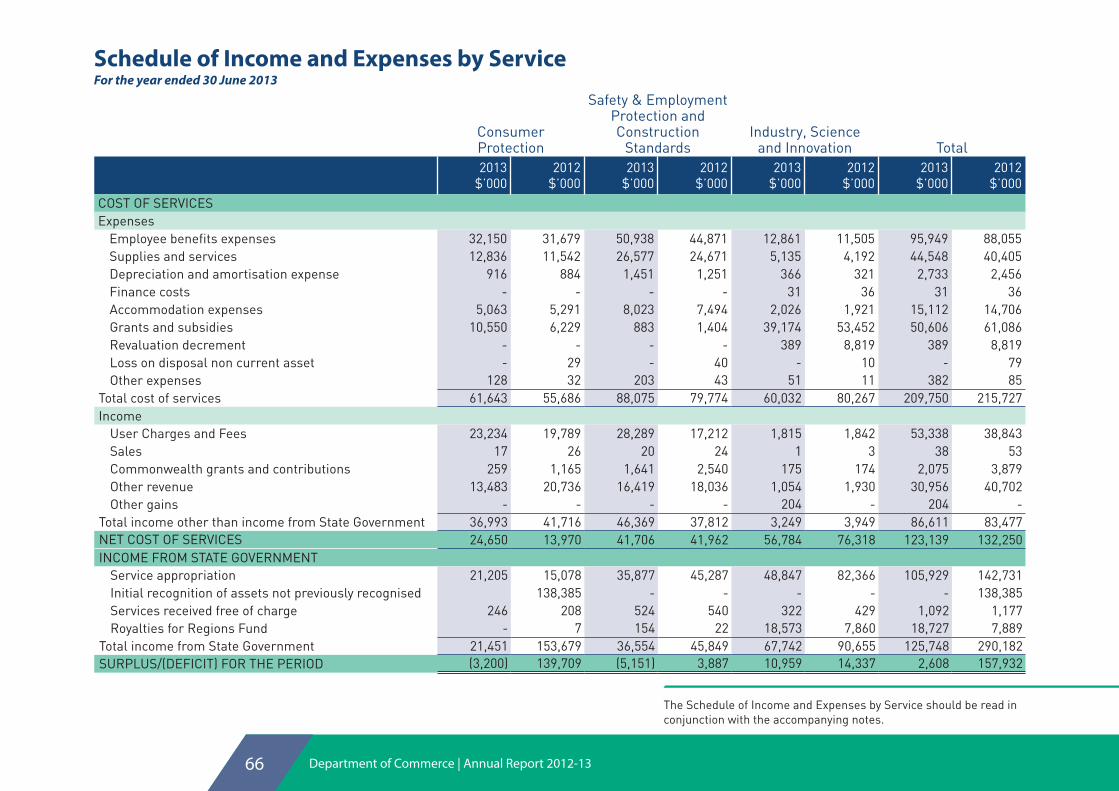
Schedule of Income and Expenses by ServiceFor the year ended 30 June 2013
Consumer Protection
Safety & Employment Protection and Construction
StandardsIndustry, Science
and Innovation Total2013
$’0002012
$’0002013
$’0002012
$’0002013
$’0002012
$’0002013
$’0002012
$’000COST OF SERVICESExpenses
Employee benefits expenses 32,150 31,679 50,938 44,871 12,861 11,505 95,949 88,055 Supplies and services 12,836 11,542 26,577 24,671 5,135 4,192 44,548 40,405 Depreciation and amortisation expense 916 884 1,451 1,251 366 321 2,733 2,456 Finance costs - - - - 31 36 31 36 Accommodation expenses 5,063 5,291 8,023 7,494 2,026 1,921 15,112 14,706 Grants and subsidies 10,550 6,229 883 1,404 39,174 53,452 50,606 61,086 Revaluation decrement - - - - 389 8,819 389 8,819 Loss on disposal non current asset - 29 - 40 - 10 - 79 Other expenses 128 32 203 43 51 11 382 85
Total cost of services 61,643 55,686 88,075 79,774 60,032 80,267 209,750 215,727 Income
User Charges and Fees 23,234 19,789 28,289 17,212 1,815 1,842 53,338 38,843 Sales 17 26 20 24 1 3 38 53 Commonwealth grants and contributions 259 1,165 1,641 2,540 175 174 2,075 3,879 Other revenue 13,483 20,736 16,419 18,036 1,054 1,930 30,956 40,702 Other gains - - - - 204 - 204 -
Total income other than income from State Government 36,993 41,716 46,369 37,812 3,249 3,949 86,611 83,477 NET COST OF SERVICES 24,650 13,970 41,706 41,962 56,784 76,318 123,139 132,250 INCOME FROM STATE GOVERNMENT
Service appropriation 21,205 15,078 35,877 45,287 48,847 82,366 105,929 142,731 Initial recognition of assets not previously recognised 138,385 - - - - - 138,385 Services received free of charge 246 208 524 540 322 429 1,092 1,177 Royalties for Regions Fund - 7 154 22 18,573 7,860 18,727 7,889
Total income from State Government 21,451 153,679 36,554 45,849 67,742 90,655 125,748 290,182 SURPLUS/(DEFICIT) FOR THE PERIOD (3,200) 139,709 (5,151) 3,887 10,959 14,337 2,608 157,932
The Schedule of Income and Expenses by Service should be read in conjunction with the accompanying notes.
Department of Commerce | Annual Report 2012-1366

Schedule of Assets and Liabilities by ServiceAs at 30 June 2013
Consumer Protection
Safety & Employment Protection and Construction
StandardsIndustry, Science
and InnovationGeneral - Not
Attributed Total2013
$’0002012
$’0002013
$’0002012
$’0002013
$’0002012
$’0002013
$’0002012
$’0002013
$’0002012
$’000AssetsCurrent assets 170,328 169,371 25,479 23,699 9,069 2,501 16,433 19,952 221,308 215,523
Non-current assets 3,342 8,824 4,776 8,039 47,396 45,654 11,570 5,364 67,084 67,881 Total assets 173,670 178,194 30,255 31,738 56,465 48,155 28,003 25,315 288,392 283,404
LiabilitiesCurrent liabilities 11,381 11,376 18,024 16,855 8,702 3,641 916 9,199 39,022 41,071 Non-current liabilities 3,540 4,299 9,029 6,042 2,181 1,262 404 307 15,154 11,909
Total liabilities 14,921 15,675 27,053 22,897 10,883 4,903 1,320 9,506 54,176 52,980 NET ASSETS 158,749 162,519 3,203 8,841 45,582 43,253 26,683 15,809 234,216 230,424
The Schedule of Assets and Liabilities by Service should be read in conjunction with the accompanying notes.
The assets and liabilities classified as ‘General Not Attributed’ are applied across multiple services and therefore it is not possible to attribute to any individual service.
Department of Commerce | Annual Report 2012-13 67

2013Estimate
2013Actual Variance
2013Actual
2012Actual Variance
$’000 $’000 $’000 $’000 $’000 $’000DELIVERY OF SERVICESItem 64 Net amount appropriated to deliver services 111,395 105,033 (6,362) 105,033 141,985 (36,952)Section 25 transfer of service appropriationAmount Authorised by Other Statutes- Salaries and Allowances Act 1975 768 896 128 896 746 150 Total appropriations provided to deliver services 112,163 105,929 (6,234) 105,929 142,731 (36,802)CAPITALItem 138 Capital Appropriation 1,000 2,956 1,956 2,956 1,888 1,068 Section 25 transfer of capital appropriationTotal capital appropriations 1,000 2,956 1,956 2,956 1,888 1,068 GRAND TOTAL 113,163 108,885 (4,278) 108,885 144,619 (35,734)Details of Expenses by ServiceConsumer Protection 59,306 61,643 2,337 61,643 55,686 5,957 Safety & Employment Protection & Construction Standards 86,437 88,075 1,638 88,075 79,774 8,301 Industry, Science & Innovation 70,611 60,032 (10,579) 60,032 80,267 (20,235)Total Cost of Services 216,354 209,750 (6,604) 209,750 215,727 (5,977)Less Total Income (81,287) (86,611) (5,324) (86,611) (83,477) (3,134)Net Cost of Services 135,067 123,139 (11,928) 123,139 132,250 (9,111)Adjustments (a) (22,904) (17,210) 5,694 (17,210) 10,481 (27,691)Total appropriations provided to deliver services 112,163 105,929 (6,234) 105,929 142,731 (36,802)Capital ExpenditurePurchase of non-current physical assets 4,861 1,978 (2,883) 1,978 3,149 (1,171)Capital appropriations 4,861 1,978 (2,883) 1,978 3,149 (1,171)Details of Income EstimatesIncome disclosed as Administered Income 9,729 14,381 4,652 14,381 23,494 (9,113)Total income estimates 9,729 14,381 4,652 14,381 23,494 (9,113)
(a) Adjustments comprise movements in cash balances and other accrual items such as receivables, payables and superannuation.
Note 34 Explanatory statement provides details of any significant variations between estimate and actual results for 2013 and between the actual results for 2012 and 2013.
Summary of Consolidated Account Appropriations and Income EstimatesFor the year ended 30 June 2013
Department of Commerce | Annual Report 2012-1368

1. Australian Accounting StandardsGeneralThe Department’s financial statements for the year ended 30 June 2013 have been prepared in accordance with Australian Accounting Standards. The term ‘Australian Accounting Standards’ includes Standards and Interpretations issued by the Australian Accounting Standard Board (AASB).
The Department has adopted any applicable new and revised Australian Accounting Standards from their operative dates.
Early adoption of standardsThe Department cannot early adopt an Australian Accounting Standard unless specifically permitted by TI 1101 Application of Australian Accounting Standards and Other Pronouncements. There has been no early adoption of Australian Accounting Standards that have been issued or amended (but not operative) by the Department for the annual reporting period ended 30 June 2013.
2. Summary of signi�cant accounting policies(a) General Statement
The Department is a not-for profit reporting entity that prepares general purpose financial statements in accordance with Australian Accounting Standards, the Framework, Statements of Accounting Concepts and other authoritative pronouncements of the AASB as applied by the Treasurer’s instructions. Several of these are modified by the Treasurer’s instruction to vary application, disclosure, format and wording.
The Financial Management Act and the Treasurer’s Instructions impose legislative provisions that govern the preparation of financial statements and take precedence over Australian Accounting Standards, the Framework, Statements of Accounting Concepts and other authoritative pronouncements of the AASB.
Where modification is required and has had a material or significant financial effect upon the reported results, details of that modification and the resulting financial effect are disclosed in the notes to the financial statements.
(b) Basis of PreparationThe financial statements have been prepared on the accrual basis of accounting using the historical cost convention, except for land and buildings which have been measured at fair value.
The accounting policies adopted in the preparation of the financial statements have been consistently applied throughout all periods presented unless otherwise stated.
The financial statements are presented in Australian dollars and all values are rounded to the nearest thousand dollars ($’000).
Note 2(w) ‘Judgements made by management in applying accounting policies’ discloses judgements that have been made in the process of applying the Department’s accounting policies resulting in the most significant effect on amounts recognised in the financial statements.
Note 2(x) ‘Key sources of estimation uncertainty’ discloses key assumptions made concerning the future, and other key sources of estimation uncertainty at the end of the reporting period, that have a significant risk of causing a material adjustment to the carrying amounts of assets and liabilities within the next financial year.
(c) Reporting EntityThe reporting entity comprises the Department of Commerce.
MissionThe Department’s mission is to create a contemporary, diversified economy that provides for the growth, safety and protection of the community by promoting innovation and science, enhancing capacity, and ensuring a world class regulatory environment.
Notes to the Financial StatementsFor the year ended 30 June 2013
Department of Commerce | Annual Report 2012-13 69
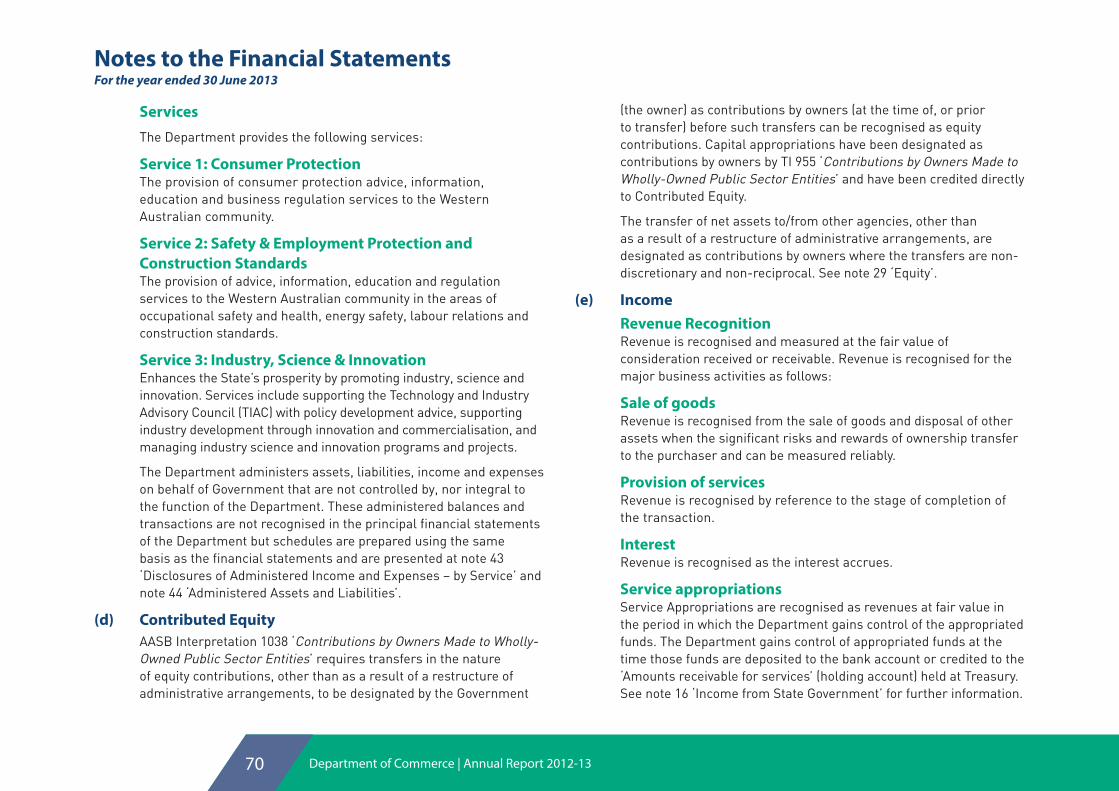
Services
The Department provides the following services:
Service 1: Consumer ProtectionThe provision of consumer protection advice, information, education and business regulation services to the Western Australian community.
Service 2: Safety & Employment Protection and Construction StandardsThe provision of advice, information, education and regulation services to the Western Australian community in the areas of occupational safety and health, energy safety, labour relations and construction standards.
Service 3: Industry, Science & InnovationEnhances the State’s prosperity by promoting industry, science and innovation. Services include supporting the Technology and Industry Advisory Council (TIAC) with policy development advice, supporting industry development through innovation and commercialisation, and managing industry science and innovation programs and projects.
The Department administers assets, liabilities, income and expenses on behalf of Government that are not controlled by, nor integral to the function of the Department. These administered balances and transactions are not recognised in the principal financial statements of the Department but schedules are prepared using the same basis as the financial statements and are presented at note 43 ‘Disclosures of Administered Income and Expenses – by Service’ and note 44 ‘Administered Assets and Liabilities’.
(d) Contributed EquityAASB Interpretation 1038 ‘Contributions by Owners Made to Wholly-Owned Public Sector Entities’ requires transfers in the nature of equity contributions, other than as a result of a restructure of administrative arrangements, to be designated by the Government
(the owner) as contributions by owners (at the time of, or prior to transfer) before such transfers can be recognised as equity contributions. Capital appropriations have been designated as contributions by owners by TI 955 ‘Contributions by Owners Made to Wholly-Owned Public Sector Entities’ and have been credited directly to Contributed Equity.
The transfer of net assets to/from other agencies, other than as a result of a restructure of administrative arrangements, are designated as contributions by owners where the transfers are non-discretionary and non-reciprocal. See note 29 ‘Equity’.
(e) IncomeRevenue RecognitionRevenue is recognised and measured at the fair value of consideration received or receivable. Revenue is recognised for the major business activities as follows:
Sale of goodsRevenue is recognised from the sale of goods and disposal of other assets when the significant risks and rewards of ownership transfer to the purchaser and can be measured reliably.
Provision of servicesRevenue is recognised by reference to the stage of completion of the transaction.
InterestRevenue is recognised as the interest accrues.
Service appropriationsService Appropriations are recognised as revenues at fair value in the period in which the Department gains control of the appropriated funds. The Department gains control of appropriated funds at the time those funds are deposited to the bank account or credited to the ‘Amounts receivable for services’ (holding account) held at Treasury. See note 16 ‘Income from State Government’ for further information.
Notes to the Financial StatementsFor the year ended 30 June 2013
Department of Commerce | Annual Report 2012-1370

Net Appropriation DeterminationThe Treasurer may make a determination providing for prescribed receipts to be retained for services under the control of the Department. In accordance with the determination specified in the 2012-2013 Budget Statements, the Department retained $86.407 million in 2013 ($83.477 million in 2012) from the following:
• Proceeds from fees and charges.
• Sale of goods.
• Commonwealth specific purpose grants and contributions.
• Other departmental revenue.
Grants, donations, gifts and other non-reciprocal contributionsRevenue is recognised at fair value when the Department obtains control over the assets comprising the contributions, usually when cash is received.
Other non-reciprocal contributions that are not contributions by owners are recognised at their fair value. Contributions of services are only recognised when a fair value can be reliably determined and the services would be purchased if not donated.
Royalties for Regions funds are recognised as revenue at fair value in the period in which the Department obtains control over the funds. The Department obtains control of the funds at the time the funds are deposited into the Department’s bank account.
GainsRealised or unrealised gains are usually recognised on a net basis. These include gains arising on the disposal of non current assets and some revaluations of non-current assets.
(f) Borrowing CostsAll borrowing costs are expensed when incurred.
All loans payable are initially recognised at cost being the fair value of the net proceeds received. Subsequent measurement is at amortised cost using the effective interest rate method.
(g) Property, plant and equipmentCapitalisation/Expensing of assetsItems of land are capitalised irrespective of value. All other property, plant and equipment are recognised as assets when their cost or fair value exceeds $5,000. The cost of utilising assets is expensed (depreciated) over their useful lives. Items of property, plant and equipment costing less than $5,000 are immediately expensed directly to the Statement of Comprehensive Income (other than where they form part of a group of similar items which are significant in total).
Initial recognition and measurementAll items of property, plant and equipment are initially recognised at cost.
For items of property, plant and equipment acquired at no cost or for nominal cost, the cost is the fair value at the date of acquisition.
Subsequent measurementSubsequent to initial recognition as an asset, the Department uses the revaluation model for the measurement of land and buildings and the cost model for all property, plant and equipment. Land and buildings are carried at fair value less accumulated depreciation on buildings and accumulated impairment losses. All other items of property, plant and equipment are stated at historical cost less accumulated depreciation and accumulated impairment losses.
Where market-based evidence is available, the fair value of land and buildings is determined on the basis of current market buying values determined by reference to recent market transactions. When
Notes to the Financial StatementsFor the year ended 30 June 2013
Department of Commerce | Annual Report 2012-13 71

buildings are revalued by reference to recent market transactions, the accumulated depreciation is eliminated against the gross carrying amount of the asset and the net amount restated to the revalued amount.
When market-based evidence is not available, the fair value of land and buildings is determined on the basis of existing use. This normally applies where buildings are specialised or where land use is restricted. Fair value for existing use building assets is determined by reference to the cost of replacing the remaining future economic benefits embodied in the asset, ie the depreciated replacement cost. Where the fair value of buildings is dependent on using the depreciated replacement cost basis, the gross carrying amount and the accumulated depreciation are restated proportionally.
Independent valuations of land and buildings are provided annually by the Western Australian Land Information Authority (Valuation Services) and recognised annually to ensure that the carrying amount does not differ materially from the asset’s fair value at the end of the reporting period.
The most significant assumptions in estimating fair value are made in assessing whether to apply the existing use basis to assets and in determining estimated useful life. Professional judgement by the valuer is required where the evidence does not provide a clear distinction between market type assets and existing use assets.
Refer to note 21 ‘Property, plant and equipment’ for further information on revaluations.
De-recognition
Upon disposal or de-recognition of an item of property, plant and equipment, any revaluation surplus relating to that asset is retained in the asset revaluation surplus.
Asset Revaluation Surplus
The asset revaluation surplus is used to record increments and decrements on the revaluation of non-current assets as described in note 21 ‘Property, plant and equipment’.
However, a net revaluation movement in respect of a class of assets in property, plant and equipment is recognised in the “Result for the period” to the extent that it reverses a net revaluation decrement of the same class of assets previously expensed in the “Result for the period”. Also, a net revaluation decrement, in respect of a class of assets, is expensed in the “Result for the period” to the extent that there is no credit balance in the asset revaluation surplus for that same class of assets.
DepreciationAll non-current assets having a limited useful life are systematically depreciated over their estimated useful lives in a manner that reflects the consumption of their future economic benefits.
Land is not depreciated. Depreciation on other assets is calculated using the straight-line method, using rates that are reviewed annually. Estimated useful lives for each class of depreciable asset are:
Class of Asset Years
Buildings 40
Property Infrastructure 5 to 15
Computer hardware 3
Computer software (a) 3
Furniture and fittings 10
Office equipment 5
Motor vehicles 5
Plant & Machinery 10
(a) Software that is integral to the operation of related hardware.
Notes to the Financial StatementsFor the year ended 30 June 2013
Department of Commerce | Annual Report 2012-1372

(h) Intangible AssetsCapitalisation/Expensing of assets Acquisitions of intangible assets over $5,000 and internally developed intangible assets costing $100,000 or more are capitalised. The cost of utilising the assets is expensed (amortised) over their useful life. Costs incurred below these thresholds are immediately expensed directly to the Statement of Comprehensive Income.
All acquired and internally developed intangible assets are initially recognised at cost. For assets acquired at no cost or for nominal cost, the cost is their fair value at the date of acquisition.
The cost model is applied for subsequent measurement requiring the asset to be carried at cost less any accumulated amortisation and accumulated impairment losses.
Amortisation of intangible assets with finite useful lives is calculated for the period of the expected benefit (estimated useful life which is reviewed annually) on the straight-line basis. All intangible assets controlled by the Department have a finite useful life and zero residual value.
Intangible assets held by the Department are amortised on a straight-line basis using rates that are reviewed annually.
The expected useful lives for intangible software assets are:
Internally developed systems 5-8 years
All other intangible software assets 3 years
Computer SoftwareSoftware that is an integral part of the related hardware is treated as property, plant and equipment. Software that is not an integral part of the related hardware is treated as an intangible asset. Software costing less than $5,000 is expensed in the year of acquisition.
Systems DevelopmentFor system developments, research costs are expensed as incurred. Development costs incurred on an individual project are carried forward when their future recoverability can reasonably be regarded as assured and where the total capitalised costs are likely to exceed $100,000. Other development expenditures are expensed as incurred.
Web site costsWeb site costs are expensed when they are incurred unless the cost exceeds $100,000. In this instance they are capitalised and amortised over their useful life.
(i) Impairment of AssetsProperty, plant and equipment and intangible assets are tested, when appropriate, for any indication of impairment at the end of each reporting period. Where there is an indication of impairment, the recoverable amount is estimated. Where the recoverable amount is less than the carrying amount, the asset is considered impaired and is written down to the recoverable amount and an impairment loss is recognised. Where an asset measured at cost is written down to recoverable amount, an impairment loss is recognised in profit and loss. Where a previously revalued asset is written down to recoverable amount, the loss is recognised as a revaluation decrement in other comprehensive income. As the Department is a not for profit entity, unless an asset has been identified as a surplus asset, the recoverable amount is the higher of an asset’s fair value less costs to sell and depreciated replacement cost.
The risk of impairment is generally limited to circumstances where an asset’s depreciation is materially understated, where the replacement cost is falling or where there is a significant change in useful life. Each relevant class of assets is reviewed annually to verify that the accumulated depreciation/amortisation reflects the level of consumption or expiration of asset’s future
Notes to the Financial StatementsFor the year ended 30 June 2013
Department of Commerce | Annual Report 2012-13 73

economic benefits and to evaluate any impairment risk from falling replacement costs.
Intangible assets not yet available for use are tested for impairment at the end of each reporting period irrespective of whether there is any indication of impairment.
The recoverable amount of assets identified as surplus assets is the higher of fair value less costs to sell and the present value of future cash flows expected to be derived from the asset. Surplus assets carried at fair value have no risk of material impairment where fair value is determined by reference to market-based evidence. Where fair value is determined by reference to depreciated replacement cost, surplus assets are at risk of impairment and the recoverable amount is measured. Surplus assets at cost are tested for indications of impairment at the end of the reporting period.
See note 23 ‘Impairment of assets’ for the outcome of impairment reviews and testing.
See note 2(p) ‘Receivables’ and note 18 ‘Receivables’ for impairment of receivables.
(j) Non Current Assets (or Disposal Groups) classi�ed as held for saleThe Department holds one non-current assets classified as held for sale during the year.
(k) LeasesThe Department does not have any finance leases.
The Department holds operating leases for head office and a number of branch office accommodations. Lease payments are expensed on a straight-line basis over the lease term as this represents the pattern of benefits derived from the leased properties.
(l) Financial InstrumentsIn addition to cash the Department has two categories of financial instruments:
• Loans and receivables; and
• Financial liabilities measured at amortised cost.
Financial instruments have been disaggregated into the following classes:
Financial Assets
• Cash and cash equivalents
• Restricted cash and cash equivalents
• Receivables
• Amounts receivable for services
Financial Liabilities
• Payables
• W.A. LandCorp Borrowings
Initial recognition and measurement of financial instruments is at fair value which normally equates to the transaction cost or the face value. Subsequent measurement is at amortised cost using the effective interest method.
The fair value of short-term receivables and payables is the transaction cost or the face value because there is no interest rate applicable and subsequent measurement is not required as the effect of discounting is not material.
(m) Cash and Cash EquivalentsFor the purpose of the Statement of Cash Flows, cash and cash equivalent (and restricted cash and cash equivalent) assets comprise cash on hand and short-term deposits with original maturities of three months or less that are readily convertible to a known amount of cash and which are subject to insignificant risk of changes in value.
Notes to the Financial StatementsFor the year ended 30 June 2013
Department of Commerce | Annual Report 2012-1374

(n) Accrued SalariesAccrued salaries (refer note 24 ‘Payables’) represent the amount due to staff but unpaid at the end of the financial year, as the pay date for the last pay period for that financial year does not coincide with the end of the financial year. Accrued salaries are settled within a fortnight of the financial year end. The Department considers the carrying amount of accrued salaries to be equivalent to the net fair value.
The accrued salaries suspense account (see note 17 ‘Restricted cash and cash equivalents’) consists of amounts paid annually into a suspense account over a period of 10 financial years to largely meet the additional cash outflow in each eleventh year when 27 pay days occur instead of the normal 26. No interest is received on this account.
(o) Amounts Receivable for Services (Holding Account)The Department receives funding on an accrual basis that recognises the full annual cash and non cash cost of services. The appropriations are paid partly in cash and partly as an asset (Holding Account receivable) that is accessible on the emergence of the cash funding requirement to cover items such as leave entitlements and asset replacement.
See also note 16 ‘Income from State Government’ and note 19 ‘Amounts receivable for services (Holding Account)’.
(p) ReceivablesReceivables are recognised and carried at original invoice amount less an allowance for uncollectible amounts (ie impairment). The collectability of receivables is reviewed on an ongoing basis and any receivables identified as uncollectible are written off against the allowance account. The allowance for uncollectible amounts (doubtful debts) is raised when there is objective evidence that the Department will not be able to collect the debts. The carrying amount is equivalent to fair value, as it is due for settlement within 30 days. See note 18 ‘Receivables’.
(q) PayablesPayables are recognised at the amounts payable when the Department becomes obliged to make future payments as a result of a purchase of assets or services. The carrying amount is equivalent to fair value, as they are generally settled within 30 days. See note 2(l) ‘Financial Instruments’ and note 24 ‘Payables’.
(r) ProvisionsProvisions are liabilities of uncertain timing or amount and are recognised where there is a present legal or constructive obligation as a result of a past event and when the outflow of resources embodying economic benefits is probable and a reliable estimate can be made of the amount of the obligation. Provisions are reviewed at the end of each reporting period. See note 26 ‘Provisions’.
(i) Provisions - Employee Bene�tsAnnual Leave and Long Service LeaveProvisions - employee benefits All annual leave and long service leave provisions are in respect of employees’ services up to the end of the reporting period.
Annual leaveThe liability for annual leave expected to be settled within 12 months after the end of the reporting period is recognised and measured at the undiscounted amounts expected to be paid when the liability is settled.
Annual leave not expected to be settled within 12 months after the reporting period is recognised and measured at the present value of amounts expected to be paid when the liabilities are settled using the remuneration rate expected to apply at the time of settlement.
When assessing expected future payments consideration is given to expected future wage and salary levels including
Notes to the Financial StatementsFor the year ended 30 June 2013
Department of Commerce | Annual Report 2012-13 75
non-salary components such as employer superannuation contributions, as well as the experience of employee departures and periods of service. The expected future payments are discounted using market yields at the end of the reporting period on national government bonds with terms to maturity that match, as closely as possible, the estimated future cash outflows.
The provision for annual leave is classified as a current liability as the Department does not have an unconditional right to the defer settlement of the liability for at least 12 months after the reporting period.
Long service leaveThe liability for long service leave expected to be settled within 12 months after the reporting period is recognised and measured at the undiscounted amounts expected to be paid when the liability is settled.
Long service leave not expected to be settled within 12 months after the end of the reporting period is recognised and measured at the present value of amounts expected to be paid when the liabilities are settled using the remuneration rate expected to apply at the time of settlement.
When assessing expected future payments consideration is given to expected future wage and salary levels including non-salary components such as employer superannuation contributions, as well as the experience of employee departures and periods of service. The expected future payments are discounted using market yields at the end of the reporting period on national government bonds with terms to maturity that match, as closely as possible, the estimated future cash outflows.
Unconditional long service leave provisions are classified as current liabilities as the Department does not have an
unconditional right to defer settlement of the liability for at least 12 months after the reporting period. Pre-conditional and conditional long service leave provisions are classified as non-current liabilities because the Department has an unconditional right to defer the settlement of the liability until the employee has completed the requisite years of service.
Deferred leaveThe provision for deferred leave relates to Public Service employees who have entered into an agreement to self-fund an additional 12 months leave in the fifth year of the agreement. The provision recognises the value of salary set aside for employees to be used in the fifth year. This liability is measured on the same basis as annual leave. Deferred leave is reported as a current provision as employees can leave the scheme at their discretion at any time.
Purchased leaveThe provision for purchased leave relates to Public Service employees who have entered into an agreement to self-fund up to an additional 10 weeks leave per calendar year. The provision recognises the value of salary set aside for employees and is measured at the undiscounted amounts expected to be paid when the liabilities are settled.
SuperannuationThe Government Employees Superannuation Board (GESB) administers public sector superannuation arrangements in Western Australia in accordance with legislative requirements. Eligibility criteria for membership in particular schemes for public section employees vary according to commencement and implementation dates.
Eligible employees contribute to the Pension Scheme, a defined benefit pension scheme closed to new members since 1987, or the Gold State Superannuation Scheme
Notes to the Financial StatementsFor the year ended 30 June 2013
Department of Commerce | Annual Report 2012-1376

(GSS), a defined benefit lump sum scheme closed to new members since 1995.
The GSS is a defined benefit scheme for the purposes of employees and whole-of-government reporting. However, it is a defined contribution plan for agency purposes, because the concurrent contributions (defined contributions) made by the Department to GESB extinguishes the agency’s obligations to the related superannuation liability.
The Department has no liabilities under the Pension or the GSS. The liabilities for the unfunded Pension Scheme and the unfunded GSS transfer benefits attributable to members who transferred from the Pension Scheme are assumed by the Treasurer. All other GSS obligations are funded by concurrent contributions made by the Department to the GESB.
Employees commencing employment prior to 16 April 2007 who were not members of either the Pension or the GSS became non-contributory members of the West State Superannuation Scheme (WSS). Employees commencing employment on or after 16 April 2007 became members of the GESB Super Scheme (GESBS). From 30 March 2012, existing members of the WSS or GESBS and new employees became able to choose their preferred superannuation fund. The Department makes concurrent contributions to GESB or other funds on behalf of employees in compliance with the Commonwealth Government’s Superannuation Guarantee (Administration) Act 1992. Contributions to these accumulation schemes extinguish the Department’s liability for superannuation charges in respect of employees who are not members of the Pension Scheme or GSS.
The GESB makes all benefit payments in respect of the Pension and GSS, and is recouped from the Treasurer for the employer’s share.
See also note 2(s) ‘Superannuation Expense’.
(ii) Provisions - OtherEmployment on-costs Employment on-costs, including workers’ compensation insurance, are not employee benefits and are recognised separately as liabilities and expenses when the employment to which they relate has occurred. Employment on-costs are included as part of ‘Other expenses’ and are not included as part of the Department’s ‘Employee benefits expense’. The related liability is included in Employment on-costs provision (see note 10 ‘Other expenses’ and note 26 ‘Provisions’).
(s) Superannuation ExpenseThe superannuation expense in the Statement of Comprehensive Income comprises of employer contributions paid to the GSS (concurrent contributions), the WSS, the GESBS or other superannuation funds. The employer contribution paid to the GESB in respect of the GSS is paid back into the Consolidated Account by the GESB.
(t) Assets and Services received free of charge or for nominal costAssets and services received free of charge or for nominal cost that can be reliably measured are recognised as income at fair value. Where the resource received represents a service that the Department would otherwise pay for, a corresponding expense is recognised. Receipts of assets are recognised in the Statement of Financial Position. Assets or services received from other State Government agencies are separately disclosed under Income from State Government in the Statement of Comprehensive Income.
(u) Comparative FiguresComparative figures are, where appropriate, reclassified to be comparable with the figures presented in the current financial year.
Notes to the Financial StatementsFor the year ended 30 June 2013
Department of Commerce | Annual Report 2012-13 77

(v) Loans converted to grantsThe Department’s range of assistance to industry includes loans, which are incrementally convertible to grants at prescribed intervals upon the recipients meeting performance milestones. The loans are recognised as loans receivable and a waiver of the loan is recognised for the conversion of the loans to grants at the time of conversion.
(w) Judgements made by management in applying accounting policiesThe preparation of financial statements requires management to make judgements about the application of accounting policies that have a significant effect on the amounts recognised in the financial statements. The department evaluates these judgements regularly.
Operating lease commitmentsThe Department holds operating leases for head office and a number of branch office accommodations. Some of these leases relate to buildings of a temporary nature and it has been determined that the lessor retains substantially all the risks and rewards incidental to ownership. Hence, these leases have been classified as operating leases.
(x) Key sources of estimation uncertaintyKey estimates and assumptions concerning the future are based on historical experience and various other factors that have a significant risk of causing a material adjustment to the carrying amount of assets and liabilities within the next financial year.
Long Service Leave
Several estimations and assumptions used in calculating the Department’s long service leave provision include expected future salary rates, discount rates, employee retention rates and expected future payments. Changes in these estimations and assumptions may impact on the carrying amount of the long service leave provision.
3. Disclosure of changes in accounting policy and estimatesInitial application of an Australian Accounting Standard
The Department has applied the following Australian Accounting Standards effective for annual reporting periods beginning on or after 1 July 2012 that impacted on the Department.
AASB 2011-9 Amendments to Australian Accounting Standards – Presentation of Items of Other Comprehensive Income [AASB 1, 5, 7, 101, 112, 120, 121, 132, 133, 134, 1039 & 1049]
This Standard requires to group items presented in other comprehensive income on the basis of whether they are potentially re classifiable to profit or loss subsequently (reclassification adjustments). There is no financial impact.
Future impact of Australian Accounting Standards not yet operativeThe Department cannot early adopt an Australian Accounting Standard unless specifically permitted by TI 1101 Application of Australian Accounting Standards and Other Pronouncements. Consequently, the Department has not applied early any following Australian Accounting Standards that have been issued that may impact the Department. Where applicable, the Department plans to apply these Australian Accounting Standards from their application date.
Notes to the Financial StatementsFor the year ended 30 June 2013
Department of Commerce | Annual Report 2012-1378

Notes to the Financial StatementsFor the year ended 30 June 2013
Title
Operative for reporting periods beginning on/after
AASB 9 Financial Instruments
This Standard supersedes AASB 139 Financial Instruments: Recognition and Measurement, introducing number of changes to accounting treatments.
AASB 2012-6 Amendments to Australian Accounting Standards – Mandatory Effective Date of AASB 9 and Transition Disclosures amended the mandatory application date of this Standard to 1 January 2015. The Department has not yet determined the application or the potential impact of the Standard.
1 Jan 2015
AASB 10 Consolidated Financial Statements
This Standard supersedes AASB 127 Consolidated and Separate Financial Statements and Int 112 Consolidation – Special Purpose Entities, introducing a number of changes to accounting treatments.
Mandatory application of this Standard was deferred by one year for not-for-profit entities by AASB 2012-10 Amendments to Australian Accounting Standards – Transition guidance and Other Amendments. The Department has not yet determined the application or the potential impact of the Standard.
1 Jan 2014
AASB 11 Joint Arrangements
This Standard supersedes AASB 131 Interests in Joint Ventures, introducing a number of changes to accounting treatments.
Mandatory application of this Standard was deferred by one year for not-for-profit entities by AASB 2012-10. The Department has not yet determined the application or the potential impact of the Standard.
1 Jan 2014
Title
Operative for reporting periods beginning on/after
AASB 12 Disclosure of Interests in Other Entities
This Standard supersedes disclosure requirements under AASB 127 Consolidated and Separate Financial Statements and AASB 131 Interests in Joint Ventures.
Mandatory application of this Standard was deferred by one year for not-for-profit entities by AASB 2012-10. The Department has not yet determined the application or the potential impact of the Standard.
1 Jan 2014
AASB 13 Fair Value Measurement
This Standard defines fair value, sets out a framework for measuring fair value and requires disclosures about fair value measurements. There is no financial impact.
1 Jan 2013
AASB 119 Employees Benefits
This Standard supersedes AASB 119 (October 2010), making changes to the recognition, presentation and disclosure requirements.
The Department does not have any defined benefit plans, and therefore the financial impact will be limited to the effect of discounting annual leave and long service leave liabilities that were previously measured at the undiscounted amounts.
1 Jan 2013
AASB 127 Separate Financial Statements
This Standard supersedes AASB 127 Consolidated and Separate Financial Statements, introducing a number of changes to accounting treatments.
Mandatory application of this Standard was deferred by one year for not-for-profit entities by AASB 2012-10. The Department has not yet determined the application or the potential impact of the Standard.
1 Jan 2014
Department of Commerce | Annual Report 2012-13 79

Title
Operative for reporting periods beginning on/after
AASB 128 Investments in Associates and Joint Ventures
This Standard supersedes AASB 128 Investments in Associates, introducing a number of changes to accounting treatments.
Mandatory application of this Standard was deferred by one year for not-for-profit entities by AASB 2012-10. The Department has not yet determined the application or the potential impact of the Standard.
1 Jan 2014
AASB 1053 Application of Tiers of Australian Accounting Standards
This Standard establishes a differential financial reporting framework consisting of two tiers of reporting requirements for preparing general purpose financial statements. There is no financial impact.
1 Jul 2013
AASB 1055 Budgetary Reporting
This Standard specifies the nature of budgetary disclosures, the circumstances in which they are to be included in the general purpose financial statements of not-for-profit entities within the GGS. The Department will be required to disclose additional budgetary information and explanations of major variances between actual and budgeted amounts, though there is no financial impact.
1 Jul 2014
Title
Operative for reporting periods beginning on/after
AASB 2010-2 Amendments to Australian Accounting Standards arising from Reduced Disclosure Requirements [AASB 1, 2, 3, 5, 7, 8, 101, 102, 107, 108, 110, 111, 112, 116, 117, 119, 121, 123, 124, 127, 128, 131, 133, 134, 136, 137, 138, 140, 141, 1050 & 1052 and Int 2, 4, 5, 15, 17, 127, 129 & 1052]
This Standard makes amendments to Australian Accounting Standards and Interpretations to introduce reduced disclosure requirements for certain types of entities. There is no financial impact.
1 Jul 2013
AASB 2010-7 Amendments to Australian Accounting Standards arising from AASB 9 (December 2010) [AASB 1, 3, 4, 5, 7, 101, 102, 108, 112, 118, 120, 121, 127, 128, 131, 132, 136, 137, 139, 1023 & 1038 and Int 2, 5, 10, 12, 19 & 127]
This Standard makes consequential amendments to other Australian Accounting Standards and Interpretations as a result of issuing AASB 9 in December 2010.
AASB 2012-6 amended the mandatory application date of this Standard to 1 January 2015. The Department has not yet determined the application or the potential impact of the Standard.
1 Jan 2015
Notes to the Financial StatementsFor the year ended 30 June 2013
Department of Commerce | Annual Report 2012-1380
Title
Operative for reporting periods beginning on/after
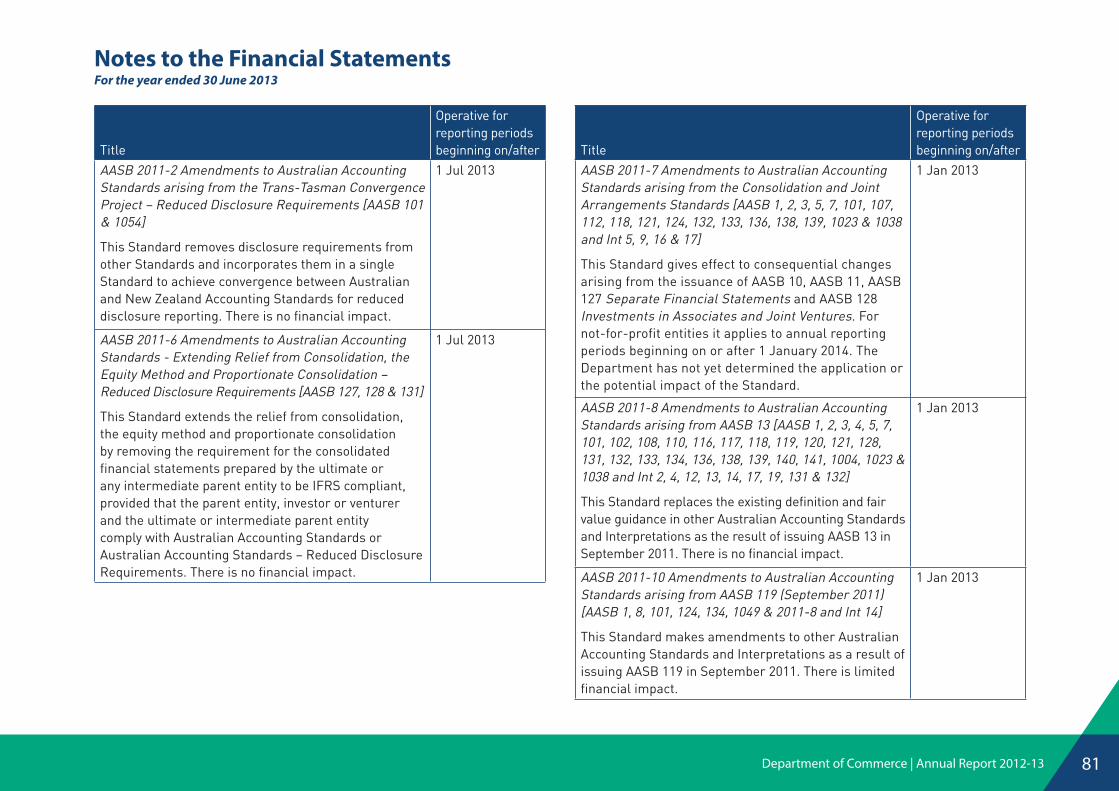
AASB 2011-2 Amendments to Australian Accounting Standards arising from the Trans-Tasman Convergence Project – Reduced Disclosure Requirements [AASB 101 & 1054]
This Standard removes disclosure requirements from other Standards and incorporates them in a single Standard to achieve convergence between Australian and New Zealand Accounting Standards for reduced disclosure reporting. There is no financial impact.
1 Jul 2013
AASB 2011-6 Amendments to Australian Accounting Standards - Extending Relief from Consolidation, the Equity Method and Proportionate Consolidation – Reduced Disclosure Requirements [AASB 127, 128 & 131]
This Standard extends the relief from consolidation, the equity method and proportionate consolidation by removing the requirement for the consolidated financial statements prepared by the ultimate or any intermediate parent entity to be IFRS compliant, provided that the parent entity, investor or venturer and the ultimate or intermediate parent entity comply with Australian Accounting Standards or Australian Accounting Standards – Reduced Disclosure Requirements. There is no financial impact.
1 Jul 2013
Title
Operative for reporting periods beginning on/after
AASB 2011-7 Amendments to Australian Accounting Standards arising from the Consolidation and Joint Arrangements Standards [AASB 1, 2, 3, 5, 7, 101, 107, 112, 118, 121, 124, 132, 133, 136, 138, 139, 1023 & 1038 and Int 5, 9, 16 & 17]
This Standard gives effect to consequential changes arising from the issuance of AASB 10, AASB 11, AASB 127 Separate Financial Statements and AASB 128 Investments in Associates and Joint Ventures. For not-for-profit entities it applies to annual reporting periods beginning on or after 1 January 2014. The Department has not yet determined the application or the potential impact of the Standard.
1 Jan 2013
AASB 2011-8 Amendments to Australian Accounting Standards arising from AASB 13 [AASB 1, 2, 3, 4, 5, 7, 101, 102, 108, 110, 116, 117, 118, 119, 120, 121, 128, 131, 132, 133, 134, 136, 138, 139, 140, 141, 1004, 1023 & 1038 and Int 2, 4, 12, 13, 14, 17, 19, 131 & 132]
This Standard replaces the existing definition and fair value guidance in other Australian Accounting Standards and Interpretations as the result of issuing AASB 13 in September 2011. There is no financial impact.
1 Jan 2013
AASB 2011-10 Amendments to Australian Accounting Standards arising from AASB 119 (September 2011) [AASB 1, 8, 101, 124, 134, 1049 & 2011-8 and Int 14]
This Standard makes amendments to other Australian Accounting Standards and Interpretations as a result of issuing AASB 119 in September 2011. There is limited financial impact.
1 Jan 2013
Notes to the Financial StatementsFor the year ended 30 June 2013
Department of Commerce | Annual Report 2012-13 81

Notes to the Financial StatementsFor the year ended 30 June 2013
Title
Operative for reporting periods beginning on/after
AASB 2011-11 Amendments to AASB 119 (September 2011) arising from Reduced Disclosure Requirements
This Standard gives effect to Australian Accounting Standards – Reduced Disclosure Requirements for AASB 119 (September 2011). There is no financial impact.
1 Jul 2013
AASB 2012-1 Amendments to Australian Accounting Standards - Fair Value Measurement - Reduced Disclosure Requirements [AASB 3, 7, 13, 140 & 141]
This Standard establishes and amends reduced disclosure requirements for additional and amended disclosures arising from AASB 13 and the consequential amendments implemented through AASB 2011-8. There is no financial impact.
1 Jul 2013
AASB 2012-2 Amendments to Australian Accounting Standards - Disclosures – Offsetting Financial Assets and Financial Liabilities [AASB 7 & 132]
This Standard amends the required disclosures in AASB 7 to include information that will enable users of an entity’s financial statements to evaluate the effect or potential effect of netting arrangements, including rights of set-off associated with the entity’s recognised financial assets and recognised financial liabilities, on the entity’s financial position. There is no financial impact.
1 Jan 2013
Title
Operative for reporting periods beginning on/after
AASB 2012-3 Amendments to Australian Accounting Standards - Offsetting Financial Assets and Financial Liabilities [AASB 132]
This Standard adds application guidance to AASB 132 to address inconsistencies identified in applying some of the offsetting criteria, including clarifying the meaning of “currently has a legally enforceable right of set-off” and that some gross settlement systems may be considered equivalent to net settlement. There is no financial impact.
1 Jan 2014
AASB 2012-5 Amendments to Australian Accounting Standards arising from Annual Improvements 2009-11 Cycle [AASB 1, 101, 116, 132 & 134 and Int 2]
This Standard makes amendments to the Australian Accounting Standards and Interpretations as a consequence of the annual improvements process. There is no financial impact.
1 Jan 2013
AASB 2012-6 Amendments to Australian Accounting Standards - Mandatory Effective Date of AASB 9 and Transition Disclosures [AASB 9, 2009-11, 2010-7, 2011-7 & 2011-8]
This Standard amends the mandatory effective date of AASB 9 Financial Instruments to 1 January 2015. Further amendments are also made to consequential amendments arising from AASB 9 that will now apply from 1 January 2015 and to consequential amendments arising out of the Standards that will still apply from 1 January 2013. There is no financial impact.
1 Jan 2013
Department of Commerce | Annual Report 2012-1382

Notes to the Financial StatementsFor the year ended 30 June 2013
Title
Operative for reporting periods beginning on/after
AASB 2012-7 Amendments to Australian Accounting Standards arising from Reduced Disclosure Requirements [AASB 7, 12, 101 & 127]
This Standard adds to or amends the Australian Accounting Standards to provide further information regarding the differential reporting framework and the two tiers of reporting requirements for preparing general financial statement. There is no financial impact.
1 Jul 2013
AASB 2012-10 Amendments to Australian Accounting Standards - Transition Guidance and Other Amendments [AASB 1, 5, 7, 8, 10, 11, 12, 13, 101, 102, 108, 112, 118, 119, 127, 128, 132, 133, 134, 137, 1023, 1038, 1039, 1049, & 2011-7 and Int 12]
This Standard makes amendments to AASB 10 and related Standards to revise the transition guidance relevant to the initial application of those Standards, and to clarify the circumstances in which adjustments to an entity’s previous accounting for its involvement with other entities are required and the timing of such adjustments.
The Standard was issued in December 2012. The Department has not yet determined the application or the potential impact of the Standard.
1 Jan 2013
Title
Operative for reporting periods beginning on/after
AASB 2012-11 Amendments to Australian Accounting Standards - Reduced Disclosure Requirements and Other Amendments [AASB 1, 2, 8, 10, 107, 128, 133, 134 & 2011-4]
This Standard makes various editorial corrections to Australian Accounting Standards – Reduced Disclosure Requirements (Tier 2). These corrections ensure that the Standards reflect decisions of the AASB regarding the Tier 2 requirements.
This Standard also extends the relief from consolidation and the equity method (in the new Consolidation and Joint Arrangements Standards) to entities complying with Australian Accounting Standards – Reduced Disclosure Requirements. There is no financial impact.
1 Jul 2013
Changes in Accounting EstimatesThere were no changes in accounting estimates for the financial year.
Department of Commerce | Annual Report 2012-13 83

2013 2012$’000 $’000
4. Employee benefits expenseWages and salaries (a) 75,653 67,534Superannuation - defined contribution plans (b) 8,151 7,800Long service leave 3,094 3,261Annual leave 6,905 7,080Other related expenses 2,146 2,380
95,949 88,055
(a) Includes the value of the fringe benefit to the employee plus the fringe benefit tax component.
(b) Defined contribution plans include West State, Gold State, GESB and other eligible funds.
Employment on-costs such as workers’ compensation insurance are included at Note 10 ‘Other expenses’. The employment on-costs liability is included at Note 26 ‘Provisions’.
5. Supplies and servicesCommunications 1,249 1,405 Consultants and contractors 29,305 25,592 Consumables 4,325 4,142 Materials 1,788 1,545 Insurance 882 593 Motor vehicles 1,397 1,688 Maintenance 506 522 Travel 782 946 Other 4,315 3,972
44,548 40,405
Notes to the Financial StatementsFor the year ended 30 June 2013
Department of Commerce | Annual Report 2012-1384

2013 2012$’000 $’000
6. Depreciation and amortisation expenseDepreciation
Computer Hardware and Communications 402 430Furniture and Fittings 703 824Office Equipment 79 87Buildings 122 105Plant & Machinery 1 -Total Depreciation 1,307 1,446
AmortisationIntangible assets 1,426 1,010Total amortisation 1,426 1,010Total depreciation and amortisation 2,733 2,456
7. Finance costsInterest expense 31 36
31 36
8. Accommodation expensesLease rentals 13,826 13,941Repairs and maintenance 524 125Cleaning 340 253Services received free of charge 422 387
15,112 14,706
9. Grants and subsidiesRecurrent
FarmSafe WA 70 70Asbestos Diseases Society 100 100Employment Law Centre 356 207Science and Innovation 39,174 53,453Property Industry Grants 10,509 6,229Building Commission 357 1,027Miscellaneous - contributions to Commonwealth 41 -
50,606 61,086
Notes to the Financial StatementsFor the year ended 30 June 2013
Department of Commerce | Annual Report 2012-13 85

Notes to the Financial StatementsFor the year ended 30 June 2013
2013 2012$’000 $’000
10. Other expensesOther expenses (a) 382 85Total other expenses 382 85
(a) Includes workers’ compensation insurance and other employment on-costs. The on-costs liability associated with the recognition of annual and long service leave liability is included at note 26 ‘Provisions’. Superannuation contributions accrued as part of the provision for leave are employee benefits and are not included in employment on-costs.
11. User charges and fees & salesUser charges and fees 53,338 38,843Sales 38 53The user charges and fees arise from the department's services in the following areas:
Rental Accommodation Account 11,099 4,890Business Names 1 851Register of Encumbered Vehicles - 639WorkSafe 7,787 6,749Energy Safety 11,512 11,119Motor Vehicle Repairers 1,446 2,088Consumer Protection 1,632 1,411Building Commission 19,721 11,023Other 139 72
Total User Charges and Fees 53,338 38,843Sales
Sales - general 16 27Sales - publications 23 26
Total Sales 38 53
Department of Commerce | Annual Report 2012-1386

Notes to the Financial StatementsFor the year ended 30 June 2013
2013 2012$’000 $’000
12. Commonwealth grants and contributionsCommonwealth funding received during the year 2,075 3,879
2,075 3,879Commonwealth funding received and (expenditure incurred):
National Partnership Program - Coalition of Australian Governments (COAG) Reforms - Funding 768 2,474 Expenditure (1,334) (1,174 )Implementation Fair Work System - Funding 100 282 Expenditure (156) (282 )Industry, Science & Innovation - Funding 157 133 Expenditure (157) (133 )Safe Work Australia - Funding 1,050 990 Expenditure (1,003) (959 )
13. Other revenueMiscellaneous revenue for various recoups, contributions, interest, refunds etc. 30,956 40,702
30,956 40,702Other revenue main comprises of revenue received from:
Agents Trust Account income 16,346 20,198 Interest received 5,121 6,843 Gas Rectification 3,800 9,118
14. Revaluation decrementsRevaluation decrements 389 8,819
389 8,819The 2013 amount represents the revaluation of the premises being held for sale and the 2012 amount results from the asset revaluation of building assets transferred from Work in Progress. 15. Net gain/(loss) on disposal of non-current assets
Costs of Disposal of Non-Current AssetsBuildings - 104
- 104Proceeds from Disposal of Non-Current Assets
Buildings - 25- 25
Net gain/(loss) - (79)See also Note 21 ‘Property, plant and equipment’.
Department of Commerce | Annual Report 2012-13 87

Notes to the Financial StatementsFor the year ended 30 June 2013
2013 2012$’000 $’000
15a. Other gainsRevaluation gain - buildings 204 -
204 -
The 2012-13 gain represent a revaluation increase to buildings (excl buildings held for sale), being offset against a revaluation decrease in 2011-12 of $8,819,000 (AASB116.Aus39.1)
16. Income from State GovernmentAppropriation received during the year:Service appropriations (a) 105,929 142,731
105,929 142,731Initial recognition of assets in 2012/13: NIL (2011/12: $138,385m)
Contribution - former Builders Registration Board - 137Contribution - former Painters Registration Board - 289Contribution - former Real Estate & Business Agents Board - 88,029Contribution - former Settlement Agents Supervisory Board - 49,930
- 138,385Services received free of charge from other State government agencies during the period: (b)
Department of Finance - Building Management and Works 422 387State Solicitor's Office 453 597Department of Finance (Procurement) 203 193 Western Australian Land Information Authority (Landgate) 14 -
1,092 1,177Royalties for Regions Fund: (c)
Regional Community Services Account 727 78Regional Infrastructure and Headworks Account 18,000 7,811
18,727 7,889 125,748 290,182
(a) Service appropriations fund the net cost of services delivered. Appropriation revenue comprises a cash component and a receivable (asset). The receivable (holding account) comprises the depreciation expense for the year and any agreed increases in leave liability during the year.
(b) Where assets or services have been received free of charge or for nominal cost, the Department recognises revenues equivalent to the fair value of the assets and/or fair value of those services that can be reliably measured and which would have been purchased if not donated, and those fair values shall be recognised as assets or expenses, as applicable. Where the contributions of assets or services are in the nature of contributions by owners, the Department makes an adjustments directly to equity.
(c) This is a sub-fund within the over-arching ‘Royalties for Regions Fund’. The recurrent funds are committed to projects and programs in WA regional areas.
Department of Commerce | Annual Report 2012-1388

Notes to the Financial StatementsFor the year ended 30 June 2013
2013 2012$’000 $’000
17. Restricted cash and cash equivalentsCurrent (a)
Consumer Credit Act (WA) 140 353 Departmental Receipts in Suspense 405 415 SafetyLine Institute 580 745 Indian Ocean Territories - Commonwealth Government 99 142 Motor Vehicle Repairers (MVR) Industry Education and Research Account 64 54 Motor Vehicle Repairers (MVR) Industry Compensation Account 68 54 Co-operatives Companies Liquidation 11 10 Energy Safety 12,525 12,295 Gas Producers Contribution Account 1,145 3,514 Real Estate - Education and General Purpose Account 33,826 34,967 Real Estate - Fidelity Guarantee Account 43,446 43,764 Real Estate - Home Buyers Assistance Account 14,294 14,967 Real Estate and Business Agents Supervisory Board Trust Account 227 219 Settlement Agents - Education and General Purpose Account 21,862 20,449 Settlements Agents - Fidelity Guarantee Account 35,715 33,539 Building Services Account 6,986 5,809
171,393 171,296 Royalties for Regions Fund 7,122 214
7,122 214 Commonwealth funding 3,534 3,935
3,534 3,935 Total current 182,049 175,445 Non-Current
Accrued salaries suspense account (b) 2,449 2,099 Total Non-current 2,449 2,099 Total restricted cash and cash equivalents 184,498 177,544
(a) Refer to Note 40 ‘Special Purpose Accounts and Restricted Cash Accounts’ for explanation of nature of restriction.
(b) Amount held in the suspense account is only to be used for the purpose of meeting the 27th pay in a financial year that occurs every 11 years.
Department of Commerce | Annual Report 2012-13 89

Notes to the Financial StatementsFor the year ended 30 June 2013
2013 2012$’000 $’000
18. ReceivablesCurrent
Trade debtors 1,077 4,651 (b) Allowance for impairment of receivables (11) (11)GST receivables 1,716 3,780 (b) Accrued Income 8,472 11,032 Sub total current 11,254 19,451 Loans receivables (a) 415 346
Total current 11,668 19,797 Non Current
Loans receivables (a) 9,529 9,335Total non current 9,529 9,335Total receivables 21,197 29,132
(a) The carrying amount of loans receivable approximates their fair value.
(b) Trade Debtors for 2012 has been restated to include GST; GST Receivables for 2012 has also been restated to include GST associated with Trade Debtors and Accrued Expenses.
Reconciliation of changes in the allowance for impairment of receivables:Balance at start of period 11 11Doubtful debts expense - -Amounts written off during the period - -Amount recovered during the period - -Balance at the end of the period 11 11
The Department does not hold any collateral as security or other credit enhancements relating to receivables.
Department of Commerce | Annual Report 2012-1390

Notes to the Financial StatementsFor the year ended 30 June 2013
2013 2012$’000 $’000
19. Amounts receivable for services (Holding Account)Current 2,200 3,234 Non-Current 5,789 6,746
Total amounts receivable for services 7,989 9,980
Represents the non-cash component of service appropriations. See Note 2(o) ‘Amounts Receivable for Services (Holding Account)’. It is restricted in that it can only be used for asset replacement or payment of leave liability. 20. Other assets
CurrentPrepayments - 1,590 Miscellaneous assets such as credit card and travel clearing accounts etc. 67 8
67 1,598
Department of Commerce | Annual Report 2012-13 91

Notes to the Financial StatementsFor the year ended 30 June 2013
2013 2012$’000 $’000
21. Property, plant and equipmentLand (a)
At fair value 31,062 30,820 31,062 30,820
Buildings (a)At fair value 4,681 4,599
4,681 4,599 Plant & Machinery
At cost 18 - Accumulated depreciation (1) -
17 - Fixed Asset under Construction
Construction costs 67 - 67 -
Computer hardware and CommunicationsAt cost 4,348 4,101 Accumulated depreciation (3,646) (3,366)
702 735 Furniture and fittings
At cost 9,626 9,626 Accumulated depreciation (5,945) (5,241)
3,681 4,385 Office equipment
At cost 888 839 Accumulated depreciation (675) (596)
213 243 Total
At cost/fair value 50,690 49,985 Accumulated depreciation (10,266) (9,203)
Total Property, plant and equipment 40,424 40,782
(a) Land and buildings were revalued as at 1 July 2012 by the Western Australian Land Information Authority (Valuation Services). The valuations were performed during the year ended 30 June 2013 and recognised at 30 June 2013. In undertaking the revaluation, fair value was determined by reference to market values, where appropriate, or depreciated replacement cost basis (land $31,061,934; buildings $4,681,164). See note 2(g) ‘Property, plant and equipment’
Department of Commerce | Annual Report 2012-1392

Notes to the Financial StatementsFor the year ended 30 June 2013
2013 2012$’000 $’000
21. Property, plant and equipment (cont.)ReconciliationsReconciliations of the carrying amounts of property, plant and equipment at the beginning and end of the reporting period are set out below.
LandCarrying amount at start of period 30,820 19,537 Addition - 9,577 Revaluation 448 1,706 Transfer to other entities (a) (206) - Carrying amount at end of period 31,062 30,820
BuildingsCarrying amount at start of period 4,599 3,120 Addition - 10,402 Revaluation 204 (8,819)Depreciation (122) (105)Carrying amount at end of period 4,681 4,599
Plant & MachineryCarrying amount at start of period - 6 Addition 18 - Disposal - (6)Depreciation (1) - Carrying amount at end of period 17 -
Fixed Assets under ConstructionCarrying amount at start of period - 20,246 Additions 67 - Disposal - (20,246)Carrying amount at end of period 67 -
Computer hardware and CommunicationsCarrying amount at start of period 735 786 Additions 369 379 Depreciation (402) (430)Carrying amount at end of period 702 735
Department of Commerce | Annual Report 2012-13 93

Notes to the Financial StatementsFor the year ended 30 June 2013
2013 2012$’000 $’000
21. Property, plant and equipment (cont.)ReconciliationsFurniture and fittings
Carrying amount at start of period 4,385 5,093 Additions - 177 Disposals - (62)Depreciation (703) (823)Carrying amount at end of period 3,681 4,385
Office equipmentCarrying amount at start of period 243 136 Additions 49 199 Disposals - (5)Depreciation (79) (87)Carrying amount at end of period 213 243
Total - Property, plant and equipmentCarrying amount at start of period 40,782 48,924 Additions 503 20,734 Disposals - (20,319)Revaluation 652 (7,112)Transfer to other entities (a) (206) - Depreciation (1,307) (1,445)Carrying amount at end of period 40,424 40,782
(a) Transfer of land to the Department of Regional Development and Lands
21a. Non current assets classified as held for sale (Buildings)Buildings 2,139 2,139 Less write-down from cost to fair value less selling costs (a) (389) -
1,750 2,139
(a) Disclosed as Revaluation Decrement (Note 14).
The amount represents the value of Units 4-6 at 18 Harvest Terrace following the transfer of the Builders’ Registration Board to the Department on 29 August 2011. The units are surplus to the Department’s requirements and are being disposed by way of the Department of Regional Development and Lands by the Property Asset Clearing House. Due to the fluctuation in the property market, the market value has reduced.
Department of Commerce | Annual Report 2012-1394

2013 2012$’000 $’000
22. Intangible assetsComputer software
At cost 11,114 7,097 Accumulated amortisation (3,295) (2,107)
7,818 4,990 Software development in progress
At cost 1,075 3,928 1,075 3,928
TotalAt cost 12,188 11,025 Accumulated amortisation (3,295) (2,107)Total Intangible assets 8,893 8,918
ReconciliationsComputer software
Carrying amount at start of period 4,990 4,031 Additions - 91 Transfer - completed software 4,254 1,878 Amortisation expense (1,426) (1,010)Carrying amount at end of period 7,818 4,990
Software development in progressCarrying amount at start of period 3,928 3,163 Additions 1,475 2,643 Transfer - completed software (4,254) (1,878)Reclassification (74) - Carrying amount at end of period 1,075 3,928
Total - Intangibles assetsCarrying amount at start of period 8,918 7,194 Additions 1,475 2,734 Reclassification (74) - Amortisation (1,426) (1,010)Carrying amount at end of period 8,893 8,918
Notes to the Financial StatementsFor the year ended 30 June 2013
Department of Commerce | Annual Report 2012-13 95

Notes to the Financial StatementsFor the year ended 30 June 2013
23. Impairment of assets
There were no indications of impairment of property, plant and equipment and intangible assets as at 30 June 2013. The Department held no goodwill or intangible assets with an indefinite useful life during the reporting period. At the end of the reporting period, there were no intangible assets not yet available for use. All surplus assets as at 30 June 2013 have either been classified as assets held for sale or written off.
2013 2012$’000 $’000
24. Payables Current
Trade payables 1,814 2,748 Accrued expenses 2,340 10,213 (c) Accrued salaries (a) 2,441 1,800
6,595 14,761 Non-current (b)
Trust Account - Consumer Credit Act (WA) 140 353 Trust Account - Sundry trust monies 405 415 Trust Account - Building Services Dispute Remedy Orders - 11 Trust Account - Real Estate and Business Agents Supervisory Board 226 219 Co-operatives - Companies Liquidation account 11 10
782 1,010
Refer to Note 35 ‘Financial Instruments’ and Note 2(r) Payables’.
(a) Amount owing for 2013, 6 working days $2,440,683, as last pay falls on 20 June 2013. Amount owing for 2012 was $1,800,028. Accrued salaries are settled within a few working days of the financial year end. The carrying amount of accrued salaries is equivalent to the net fair value.
(b) Refer to Note 40 ‘Special Purpose Accounts and Restricted Cash Accounts’ for the nature of these payables.
(c) Accrued Expenses for 2012 has been restated to include GST.
Department of Commerce | Annual Report 2012-1396

Notes to the Financial StatementsFor the year ended 30 June 2013
2013 2012$’000 $’000
25. BorrowingsNon-current
WA LandCorp (Enterprise Units Development Agreement) 771 771 771 771
Amount of loan facility owed by the Department of Commerce to LandCorp as at 30 June 2013.
26. ProvisionsCurrent
Employee benefits provisionAnnual leave (a) 8,213 8,163 Long service leave (b) 13,671 12,268 Deferred salary scheme (c) 176 108 Purchased leave (d) 188 -
Other provisionsEmployment on-costs (e) 151 99
Total current provisions 22,399 20,638 Non-current
Employee benefits provisionLong service leave (b) 4,927 4,685
Other provisionsEmployment on-costs (e) 34 23
Total non-current provisions 4,961 4,708
(a) Annual leave liabilities have been classified as current as there is no unconditional right to defer settlement for at least 12 months after the reporting period. Assessments indicate that actual settlement of the liabilities will occur as follows:
Within 12 months of the end of the reporting period 5,781 5,257 More than 12 months after the reporting period 2,432 2,906
8,213 8,163
(b) Long service leave liabilities have been classified as current where there is no unconditional right to defer settlement for at least 12 months after the end of the reporting period. Assessments indicate that actual settlement of the liabilities will occur as follows:
Within 12 months of the end of the reporting period 5,347 4,968 More than 12 months after the reporting period 13,251 11,985
18,598 16,953
Department of Commerce | Annual Report 2012-13 97

(c) Deferred salary scheme liabilities have been classified as current where there is no unconditional right to defer settlement for at least 12 months after the end of the reporting period. Actual settlement of the liabilities is expected to occur as follows:
2013 2012$’000 $’000
Within 12 months of the end of the reporting period - - More than 12 months after the reporting period 176 108
176 108
(d) Purchased leave liabilities have been classified as current where there is no unconditional right to defer settlement for at least 12 months after the end of the reporting period. Actual settlement of the liabilities is expected to occur as follows:
Within 12 months of the end of the reporting period 188 - More than 12 months after the reporting period - -
188 -
(e) The settlement of annual and long service leave liabilities gives rise to the payment of employment on-costs including workers’ compensation insurance. The provision is the present value of expected future payments.
Movements in Other Provisions
Movements in each class of provisions during the financial year, other than employee benefits, are set out below. Employment on-cost provision
Carrying amount at start of period 122 86 Additional/(reversals of) provisions recognised 63 36 Carrying amount at end of period 185 122
27. Unearned revenuesCurrent
Unearned revenue (a) 6,531 4,292 6,531 4,292
Non-CurrentUnearned revenue (a) 8,640 5,420
8,640 5,420
(a) Unearned revenues are revenue received in advance for Plumbers’ compliance certificates, and multiple year licences for Energy Safety, Motor Vehicle Repairers, Plumbers, Real Estate, Settlement Agents, Painters, Builders and Building Surveyors. This revenue will be recognised from 2013/14 and subsequent years.
Notes to the Financial StatementsFor the year ended 30 June 2013
Department of Commerce | Annual Report 2012-1398

Notes to the Financial StatementsFor the year ended 30 June 2013
2013 2012$’000 $’000
28. Other liabilitiesCurrent
Miscellaneous liabilities such as stale & returned cheques, refunds etc. 3,497 1,381 3,497 1,381
29. EquityThe Government holds the equity interest in the Department on behalf of the community. Equity represents the residual interest in the net assets of the Department. The asset revaluation surplus represents that portion of equity resulting from the revaluation of non-current assets.
Contributed equityBalance at the start of the period 76,913 75,022
Contributions by ownersCapital appropriation (b) 2,956 1,888
Total contributions by owners 79,869 76,910Distributions to owners
Transfer of net assets to other agencies: (a) (c) Department of Mines and Petroleum - 3 Department of Treasury (2,014) - Department of Regional Development and Lands (206) -
Total distributions to owners (2,220) 3 Balance at the end of period 77,649 76,913
(a) AASB 1004 ‘Contributions’ requires transfers of net assets as a result of a restructure of administrative arrangements are to be accounted for as contributions by owners and distributions to owners.
(b) TI 955 ‘Contributions by Owners Made to Wholly Owned Public Sector Entities’ designates capital appropriations as contributions by owners in accordance with AASB Interpretation 1038 ‘Contributions by Owners Made to Wholly-Owned Public Sector Entities’.
(c) TI 955 designates non-discretionary and non-reciprocal transfers of net assets between state government agencies as contributions by owners in accordance with AASB Interpretation 1038. Where the transferee agency accounts for a non-discretionary and non-reciprocal transfer of net assets as a contribution by owners, the transferor agency accounts for the transfer as a distribution to owners.
Department of Commerce | Annual Report 2012-13 99

Notes to the Financial StatementsFor the year ended 30 June 2013
2013 2012$’000 $’000
ReservesAsset revaluation surplus:
Balance at the start of period 5,513 3,807 Net revaluation increments
Land 449 1,706 Buildings - - Balance at end of period 5,962 5,513
Accumulated surplusBalance at start of period 147,997 (9,935)Result for the period 2,608 157,932
Balance at end of period 150,605 147,997 Total Equity at end of period 234,216 230,424
Department of Commerce | Annual Report 2012-13100

2013 2012$’000 $’000
30. Notes to the Statement of Cash FlowsReconciliation of cash
Cash at the end of the financial year as shown in the Statement of Cash Flows is reconciled to the related items in the Statement of Financial Position as follows:
Cash and cash equivalents 23,573 13,311 Restricted cash and cash equivalents (refer to note 17) 184,498 177,544
208,071 190,856 Reconciliation of net cost of services to net cash flows provided by/(used in) operating activities
Net cost of services (123,139) (132,250)Non-cash items:
Depreciation and amortisation expense (note 6) 2,733 2,456 Services received free of charge (note 16) 1,092 1,177 Net revaluation decrement 184 8,819 Net (gain)/loss on sale of property, plant and equipment (note 15) - 79
(Increase)/decrease in assets:Current receivables (a) 10,498 (442)Other current assets 1,530 (1,408)Write down of non-current assets classified as held for sale - (2,139)Reclassification of assets - intangibles 75 -
Increase/(decrease) in liabilities:Current payables (a) (8,166) (1,252)Current unearned revenue 2,239 (2,025)Current provisions 1,761 2,603 Other current liabilities - - Non-current payables (228) 182 Non-current unearned revenue 3,220 2,394 Non-current provisions 253 435 Other liabilities (1,265) (203)
Net GST receipts/(payments) (b) (1,195) (2,600)Net cash (used in) operating activities (110,408) (124,176)
(a) Note that the Australian Taxation Office (ATO) receivable/payable in respect of GST and the receivable/payable in respect of the sale/purchase of non-current assets are not included in these items as they do not form part of the reconciling items.
(b) This is the net GST paid/received, ie Cash transactions.
Notes to the Financial StatementsFor the year ended 30 June 2013
Department of Commerce | Annual Report 2012-13 101

Notes to the Financial StatementsFor the year ended 30 June 2013
2013 2012$’000 $’000
31. Commitments Non cancellable operating lease commitments
The Department has a number of property leases for its operations both within the metropolitan area and country regions. The leases have various terms and conditions and expiry dates including rent reviews. Also included is the fleet motor vehicle lease costs.
Commitments for minimum lease payments are payable as follows:Within 1 year 16,609 16,067 Later than 1 year and not later than 5 years 12,850 19,987 Later than 5 years - -
29,459 36,054
The property leases are non-cancellable leases with various terms, with rent payable monthly in advance. Contingent rent provisions within the lease agreements require that the minimum lease payments shall be increased by the lower of CPI or 4 per cent per annum. An option exists to renew the leases at the end of the various terms for additional terms.
The commitments below are inclusive of GST.
Capital expenditure commitments
Capital expenditure commitments, being contracted capital expenditure additional to the amounts reported in the financial statements, are payable as follows:Within 1 year 31 27 Later than 1 year and not later than 5 years - - Later than 5 years - -
31 27
Other expenditure commitments
Other expenditure commitments for day to day operations contracted for at the end of the reporting period but not recognised as liabilities, are payable as follows:Within 1 year (a) 8,760 33,154 Later than 1 year and not later than 5 years - - Later than 5 years - -
8,760 33,154
(a) The main reason for the 2012 commitments amount was due to commitments relating to the gas rectification program, roll out from Shared Services and the SKA project.
Department of Commerce | Annual Report 2012-13102

Notes to the Financial StatementsFor the year ended 30 June 2013
32. Contingent Liabilities and Contingent Assets
Contingent Liabilities As at balance date an employment matter by a former employee was being dealt with by the State Solicitor Office. This matter was resolved in July 2013.
Industry & Technology Development Act As the responsible Minister under the Industry & Technology Development Act of 1998 (ITD Act), the Minister for Commerce (or his predecessors) is a signatory to seven Investment Security Guarantees (ISGs). ISGs are signed by our Minister, General Manager of the Forest Products Commission (FPC) and timber processors. Under the ISGs, our Minister is liable to pay compensation under certain circumstances where the Forest Products Commission is unable to supply contracted amounts of timber. The total contingent liability for these seven ISGs at 30 June 2013 was $62.1m. A potential claim of up to $20 million may occur against the ISGs during the 2013-2014 financial year due to a contract breach between FPC and one of the timber processors who holds an associated ISG. Contingent on future discussions this potential liability may be reduced.
Fidelity Guarantee Account (FGA) Claims A total of 46 claims against the Fidelity Guarantee Accounts with a total value of $8,766,335 consisting of:
(a) 45 claims against the Real Estate Agents FGA with a total value of $8,765,284
(b) 1 claim against the Settlement Agents FGA with a total value of $1,051
One disallowed claim against the Real Estate Agents FGA is under review of the State Administrative Tribunal - total value of $196,600.
These figures do not include legal costs or any interest claims. Reasonable legal costs are claimable. Claims for interest are currently not allowable, but are the subject of review proceedings in the Supreme Court after the State Administrative Tribunal decided that interest wasn’t allowable. If interest is allowable, there is potentially an undetermined liability.
There are also 15 notices of intention to claim (with a value of approximately $1.1 million excluding legal and interest claims).
Contingent Liabilities - Administered There are a number of home indemnity insurance claims that have been lodged for a total of $516,326.
Contingent Assets There is a possibility the department will receive reimbursement of a salary overpayment to a former employee totalling $73,400. The matter is currently with the State Solicitor’s Office.
33. Events occurring after the end of the reporting period
As part of Machinery of Government changes, the science aspects of the Industry, Science and Innovation Division has since been transferred to the Department of Premier and Cabinet effective from 1 July 2013. The division has subsequently been renamed the Industry and Innovation division.
The employment matter referred to in the contingent liabilities was resolved after balance date in July 2013.
Department of Commerce | Annual Report 2012-13 103

34. Explanatory statement
Significant variations between estimates and actual results for income and expense as presented in the financial statement titled ‘Summary of Consolidated Account Appropriations and Income Estimates’ are shown below. Significant variations are considered to be those greater than 10 per cent or $5 million.
Total appropriations provided to deliver servicesSignificant variances between estimate and actual for 2013
Although there was no significant variance in the total appropriation, there were significant offsetting variances in the following service expenditure:
2013Estimate
2013Actual Variance
$’000 $’000 $’000Total appropriation provided to deliver services for the year 112,163 105,929 (6,234)Total income 81,287 86,611 5,324
Total appropriation provided to deliver services for the year The variation is mainly due to corrective measures, procurement savings and re-profiling of grants funding.
Total income The variation is mainly due to funding from the Commonwealth for COAG reforms, funding for Safe Work Australia, income from the Building Commission (Builders and Painters Registrations) and recoup of administration costs relating to the Rental Accommodation Account.
Significant variances between actual results for 2013 and 2012
2013Actual
2012Actual Variance
$’000 $’000 $’000Total appropriation provided to deliver services for the year 105,929 142,731 (36,802)Total income 86,611 83,477 3,134
Total appropriation provided to deliver services for the year The variation is mainly due to a significant injection of funding for the grants program occurring as a one-off in 2011-12 that was not ongoing.
Total income No significant variation in income.
Notes to the Financial StatementsFor the year ended 30 June 2013
Department of Commerce | Annual Report 2012-13104

34. Explanatory statement (cont.)
Service expenditureSignificant variances between estimate and actual for 2013
2013Estimate
2013Actual Variance
$’000 $’000 $’000Consumer Protection 59,306 61,643 2,337 Safety & Employment Protection & Construction Standards 86,437 88,075 1,638 Industry, Science & Innovation (a) 70,611 60,032 (10,579)
(a) The variation is mainly due to the re-profiling of grants expenditure for various programs to the outyears.
Significant variances between actual results for 2013 and 2012
2013Actual
2012Actual Variance
$’000 $’000 $’000Consumer Protection (a) 61,643 55,686 5,957 Safety & Employment Protection & Construction Standards (b) 88,075 79,774 8,301 Industry Science & Innovation (c) 60,032 80,267 (20,235)
(a) The variation is mainly due to increased expenditure in the areas of Property Industry payments in the areas of home buyers grants, training subsidies and Fidelity claims.
(b) The variation is mainly due to the Building Commission being part of Commerce for a full year as it only commenced during 2011-12 and also increased operating expenditure across the whole service.
(c) The variation is mainly due to a significant injection of funding for the grants program occurring as a one-off in 2011-12 that was not ongoing and the re-profiling of grants expenditure in 2012-13 to the outyears.
Notes to the Financial StatementsFor the year ended 30 June 2013
Department of Commerce | Annual Report 2012-13 105

34. Explanatory statement (cont.)
Capital contributionSignificant variances between estimate and actual for 2013
2013Estimate
2013Actual Variance
$’000 $’000 $’000Capital contribution 4,861 1,978 (2,883)
The variation is mainly due to the reprioritisation of resources to the rollout from Shared Services project therefore delaying the expenditure on the remaining capital projects.
Significant variances between actual results for 2013 and 2012
2013Actual
2012Actual Variance
$’000 $’000 $’000Capital contribution 1,978 3,149 (1,171)
The variation is mainly due to the reprioritisation of resources to the rollout from Shared Services project therefore delaying the expenditure on the remaining capital projects.
Total administered transactionsAdministered IncomeSignificant variances between estimate and actual for 2013
2013Estimate
2013Actual Variance
$’000 $’000 $’000Administered income 9,729 14,381 4,652
The variation is mainly due to greater amount of interest received than anticipated for the Rental Accommodation Account.
Significant variances between actual results for 2013 and 2012
2013Actual
2012Actual Variance
$’000 $’000 $’000Administered income 14,381 23,494 (9,113)
The variation is mainly due to the Business Names function being transferred to the Commonwealth.
Notes to the Financial StatementsFor the year ended 30 June 2013
Department of Commerce | Annual Report 2012-13106

Notes to the Financial StatementsFor the year ended 30 June 2013
35. Financial instruments
(a) Financial Risk Management Objectives and Policies
Credit risk Credit risk arises when there is the possibility of the Department’s receivables defaulting on their contractual obligations resulting in financial loss to the Department.
The maximum exposure to credit risk at the end of the reporting period in relation to each class of recognised financial assets is the gross carrying amount of those assets inclusive of any provisions for impairment, as shown in the table at Note 35(c) ‘Financial instruments disclosures’ and note 18 ‘Receivables’.
Credit risk associated with the Department’s financial assets is mainly comprised of receivables that are in the nature of loans to third parties. For receivables other than government, the Department trades only with recognised, creditworthy third parties. The Department has policies in place to ensure that sales of products, services and loans are made to customers with an appropriate credit history. In addition, receivable balances are monitored on an ongoing basis with the result that the Department’s exposure to bad debts is minimal. There are no significant concentrations of credit risk other than a loan receivable $13 million to a company with annual repayments maturing 2024 (2012: $13.4 million).
Allowance for impairment of financial assets is calculated based on objective evidence such as observable data in client credit ratings. For financial assets that are either past due or impaired, refer to Note 35(c).
Liquidity risk The Department is exposed to liquidity risk through its trading in the normal course of business. Liquidity risk arises when the Department is unable to meet its financial obligations as they fall due. The Department has appropriate procedures to manage cash flows including drawdowns of appropriations by monitoring forecast cash flows to ensure that sufficient funds are available to meet its commitments.
Market risk The Department does not trade in foreign currency and is not materially exposed to other price risks (for example, equity securities or commodity prices changes). The Department’s exposure to market risk for changes in interest rates relates primarily to the long term debt obligations. The Department’s borrowings are through LandCorp and have variable rates. Other than as detailed in the Interest rate sensitivity analysis table at Note 35(c), the Department is not exposed to interest rate risk because all cash and cash equivalents and restricted cash are non-interest bearing.
Department of Commerce | Annual Report 2012-13 107

Notes to the Financial StatementsFor the year ended 30 June 2013
(b) Categories of Financial Instruments
In addition to cash and cash equivalents, the carrying amounts of each of the following categories of financial assets and financial liabilities at the end of the reporting period are as follows
2013 2012$’000 $’000
Financial AssetsCash and cash equivalents 23,573 13,311 Restricted cash and cash equivalents 184,498 177,544 Loans and Receivables (a) 19,481 25,352 Amount receivable for services 7,989 9,980
Financial LiabilitiesFinancial liabilities measured at amortised cost 8,148 16,542
(a) The amount of receivables excludes GST recoverable from the ATO (statutory receivable).
Department of Commerce | Annual Report 2012-13108

Notes to the Financial StatementsFor the year ended 30 June 2013
(c) Financial Instrument Disclosures
Credit Risk
The following table details the Department’s maximum exposure to credit risk and the ageing analysis of financial statements. The Department’s maximum exposure to credit risk at the end of the reporting period is the carrying amount of financial assets as shown below. The table discloses the ageing of financial assets that are past due but not impaired and impaired financial assets. The table is based on information provided to senior management of the Department.
The Department does not hold collateral as security or other credit enhancement relating to the financial assets it holds.
Aged analysis of financial assets
Financial Assets
Carrying Amount
$’000
Not past due and not
impaired
$’000
Past due but not impairedImpaired financial
assets
$’000
Up to 1 month
$’000
1 to 3 months
$’000
3 months to 1 year
$’000
1 to 5 years
$’000
More than 5 years
$’0002013Cash and cash equivalents 23,573 23,573 - - - - - - Restricted cash and cash equivalents 184,498 184,498 - - - - - - Receivables (a) 9,537 8,855 176 67 341 77 22 - Loans receivable 9,944 9,944 - - - - - - Amounts receivable for services 7,989 7,989 - - - - - -
235,541 234,859 176 67 341 77 22 - 2012Cash and cash equivalents 13,311 13,311 - - - - - - Restricted cash and cash equivalents 177,544 177,544 - - - - - - Receivables (a) 15,671 11,554 247 107 3,681 82 - - Loans receivable 9,681 9,681 - - - - - - Amounts receivable for services 9,980 9,980 - - - - - -
226,187 222,070 247 107 3,681 82 - -
(a) The amount of receivables excludes the GST recoverable from the ATO (statutory receivable).
Department of Commerce | Annual Report 2012-13 109

Notes to the Financial StatementsFor the year ended 30 June 2013
Liquidity Risk and interest rate exposure
The following table details the Department’s interest rate exposure and the contractual maturity analysis of financial assets and financial liabilities. The maturity analysis section includes interest and principal cash flows. The interest rate exposure section analysis only the carrying amounts of each item.
Interest rate exposure and maturity analysis of financial assets and financial liabilities
Interest rate exposure Maturity dates
Weighted Average Effective Interest
Rate
%
Carrying Amount
$’000
Fixed interest
rate
$’000
Variable interest
rate
$’000
Non-interest bearing
$’000
Nominal Amount
$’000
Up to 1 months
$’000
1 to 3 months
$’000
3 months to 1 year
$’000
1 to 5 years
$’000
More than
5 years
$’0002013
Financial AssetsCash and cash equivalents - 23,573 - - 23,573 23,573 23,573 - - - -
Restricted cash and cash equivalents 3.40% 184,498 - 149,370 35,128 184,498 184,498 - - - -
Receivables (a) - 9,537 - - 9,537 9,537 9,537 - - - - Loans receivable - 9,944 - - 9,944 9,944 - - - 2,000 7,944 Amounts receivable for services
- 7,989 - - 7,989 7,989 - 2,000 200 5,789 -
235,541 - 149,370 86,171 235,541 217,609 2,000 200 7,789 7,944 Financial LiabilitiesPayables - 7,377 - - 7,377 7,377 7,377 - - - - Borrowings 4.04% 771 - 771 - 771 - - - - 771
8,148 - 771 7,377 8,148 7,377 - - - 771
(a) The amount of receivables excludes the GST recoverable from the ATO (statutory receivable).
Department of Commerce | Annual Report 2012-13110

Notes to the Financial StatementsFor the year ended 30 June 2013
Interest rate exposure and maturity analysis of financial assets and financial liabilities
Interest rate exposure Maturity dates
Weighted Average Effective Interest
Rate
%
Carrying Amount
$’000
Fixed interest
rate
$’000
Variable interest
rate
$’000
Non-interest bearing
$’000
Nominal Amount
$’000
Up to 1 months
$’000
1 to 3 months
$’000
3 months to 1 year
$’000
1 to 5 years
$’000
More than
5 years
$’0002012
Financial AssetsCash and cash equivalents (b) - 13,311 - - 13,311 13,311 13,311 - - - -
Restricted cash and cash equivalent (b) 4.74% 177,544 - 147,906 29,638 177,544 177,544 - - - -
Receivables (a) - 15,671 - - 15,671 15,671 15,671 - - - - Loans receivable - 9,681 - - 9,681 9,681 - - - 2,000 7,681 Amounts receivable for services
- 9,980 - - 9,980 9,980 - 400 2,834 6,746 -
226,187 - 147,906 78,281 226,187 206,526 400 2,834 8,746 7,681 Financial LiabilitiesPayables - 15,771 - - 15,771 15,771 15,771 - - - - Borrowings 4.67% 771 - 771 - 771 - - - - 771
16,542 - 771 15,771 16,542 15,771 - - - 771
(a) The amount of receivables excludes the GST recoverable from the ATO (statutory receivable).
(b) $5,780,000 has been reclassified from Cash (variable interest rate) to Restricted cash (variable interest rate).
Department of Commerce | Annual Report 2012-13 111

Notes to the Financial StatementsFor the year ended 30 June 2013
Interest rate sensitivity analysis
The following table represents a summary of the interest rate sensitivity of the Department’s financial assets and liabilities at the end of the reporting period on the surplus for the period and equity for a 1 per cent change in interest rates. It is assumed that the change in interest rates is held constant throughout the reporting period.
Carrying Amount
$’000
-100 basis points +100 basis points
Surplus
$’000
Equity
$’000
Surplus
$’000
Equity
$’0002013Financial AssetsRestricted cash and cash equivalents 149,370 (1,494) (1,494) 1,494 1,494 Financial LiabilitiesBorrowings 771 8 8 (8) (8)Total increase/(decrease) (1,486) (1,486) 1,486 1,486
Carrying Amount
$’000
-100 basis points +100 basis points
Surplus
$’000
Equity
$’000
Surplus
$’000
Equity
$’0002012Financial AssetsRestricted cash and cash equivalents 147,906 (1,479) (1,479) 1,479 1,479 Financial LiabilitiesBorrowings 771 8 8 (8) (8)Total increase/(decrease) (1,471) (1,471) 1,471 1,471
Fair Values
All financial assets and liabilities recognised in the Statement of Financial Position, whether they are carried at cost or fair value, are recognised at amounts that represent a reasonable approximation of fair value unless otherwise stated in the applicable notes.
Department of Commerce | Annual Report 2012-13112

Notes to the Financial StatementsFor the year ended 30 June 2013
36. Remuneration of Senior Officers
The number of senior officers, whose total of fees, salaries, superannuation, non-monetary benefits and other benefits for the financial year, fall within the following bands are:
$ 2013 2012110,001 - 120,000 - 1 130,001 - 140,000 - 1 140,001 - 150,000 - 2 150,001 - 160,000 2 1 160,001 - 170,000 - 1 170,001 - 180,000 1 2 180,001 - 190,000 - 1 190,001 - 200,000 1 - 200,001 - 210,000 - 1 210,001 - 220,000 - 1 220,001 - 230,000 2 - 230,001 - 240,000 - 1 2013 2012 240,001 - 250,000 1 1 $’000 $’000 250,001 - 260,000 1 - Base remuneration and superannuation 1,857 2,245 260,001 - 270,000 1 - Annual leave and long service leave accruals 85 11 350,001 - 360000 - 1 Other benefits 327 416 370,001 - 380000 1 - Total remuneration of senior officers 2,269 2,671
The reason for the decrease in the number of Senior Officers is mainly due to a combination of officers leaving Commerce and a change in roles of officers, therefore not meeting the definition of Senior Officer.
The total remuneration includes the superannuation expense incurred by the Department in respect of senior officers.
$’000 $’00037. Remuneration of auditor
Remuneration paid or payable to the Auditor General in respect of the audit for the current financial year is as follows:Auditing of financial statements, controls and key performance indicators 159 147
38. Related bodies
The Department has no related bodies.
Department of Commerce | Annual Report 2012-13 113

2013 2012$’000 $’000
39. Affiliated bodiesWestern Australian Technology and Industry Advisory Council (TIAC).
The Technology and Industry Advisory Council (TIAC), which was established by the Technology Development Amendment Act 1987 and continued under the Industry Technology Development Act 1988, was totally funded by the Department.
Western Australian Industry and Technology Development Account (a)Balance at the start of period 6,416 300 Receipts 37,148 51,100 Payments (35,981) (44,984)Balance at the end of the period 7,582 6,416
(a) Records funds received and expenditure charged in accordance with the Industry and Technology Development Act 1998 (ITDA)
Notes to the Financial StatementsFor the year ended 30 June 2013
Department of Commerce | Annual Report 2012-13114

2013 2012$’000 $’000
40. Special Purpose Accounts and Restricted Cash Accounts
Summary DetailsSpecial Purpose Accounts section 16(1)(c) of FMA
Consumer Credit Act (WA) 140 353 Departmental Receipts in Suspense 405 415
545 768 Restricted Cash Accounts
SafetyLine Institute 580 745 Indian Ocean Territories - Commonwealth Government 99 142 Motor Vehicle Repairer's (MVR) Industry Education & Research Acct 64 54 Motor Vehicle Repairer's (MVR) Industry Compensation Account 68 54 Co-operatives Companies Liquidation 11 10 Energy Safety Restricted Cash 12,525 12,295 Gas Producers Contribution Account 1,145 3,514 Royalties for Regions 7,122 215 Commonwealth funding 3,534 3,935 Real Estate - Education and General Purpose Account 33,826 34,967 Real Estate - Fidelity Guarantee Account 43,446 43,764 Real Estate - Home Buyers Assistance Account 14,294 14,967 Real Estate and Business Agents Supervisory Board Trust Account 227 219 Settlement Agents - Education and General Purpose Account 21,862 20,449 Settlement Agents - Fidelity Guarantee Account 35,715 33,539 Building Services Account 6,986 5,809
181,504 174,677 Detailed BreakdownSpecial Purpose Accounts
Consumer Credit Act (WA)Holds funds pending distribution in accordance with the Consumer Credit (WA) Act 1996 or court direction.
Balance at the start of period 353 573Receipts - - Payments (213) (220)Balance at the end of period 140 353
Notes to the Financial StatementsFor the year ended 30 June 2013
Department of Commerce | Annual Report 2012-13 115

2013 2012$’000 $’000
40. Special Purpose Accounts and Restricted Cash Accounts (cont.)Departmental Receipts in SuspenseHolds funds pending identification of the purpose for which the monies were received.
Balance at the start of period 415 245Receipts 30 513 Payments (40) (343)Balance at the end of period 405 415
Restricted Cash AccountsSafetyLine InstituteThe fund was created under the State Trading Concerns Act 1916 and controls income received in respect of the provisions of copyright materials and a relevant trade mark advertising opportunities or similar arrangements.
Balance at the start of period 745 541Receipts 396 266Payments (561) (63)Balance at the end of period 580 745
Indian Ocean TerritoriesThe Department of Commerce has a service delivery agreement with the Commonwealth Government to undertake to provide its normal service to the Christmas and Cocos Islands.
Balance at the start of period 142 14Receipts - Commonwealth 278 469 Payment (321) (340)Balance at the end of period 99 142
MVR Industry Education & Research AccountHolds funds used for the Motor Vehicle Repairers Industry in accordance with the Motor Vehicle Repairers Act 2003.
Balance at the start of period 54 38Receipts 15 16 Payments (4) - Balance at the end of period 64 54
MVR Industry Compensation AccountHolds funds used for the Motor Vehicle Repairers Industry in accordance with the Motor Vehicle Repairers Act 2003.
Balance at the start of period 54 38Receipts 15 16 Payments (1) - Balance at the end of period 68 54
Notes to the Financial StatementsFor the year ended 30 June 2013
Department of Commerce | Annual Report 2012-13116

2013 2012$’000 $’000
40. Special Purpose Accounts and Restricted Cash Accounts (cont.)Co-operatives Companies LiquidationHolds unclaimed funds pending redistribution in accordance with the Companies (Co-operative) Act 1943 Section 290(1).
Balance at the start of period 10 10Receipts 1 - Payments - - Balance at the end of period 11 10
Energy Safety Restricted CashHolds funds used for the operation of the EnergySafety Division of the Department of Commerce in accordance with the Energy Safety Act 2006.
Balance at the start of period 12,295 10,824Receipts 15,236 20,856Payments (15,005) (19,385)Balance at the end of period 12,525 12,295
Gas Producers Contribution AccountHolds funds used for the gas rectification program in accordance with section 23 of the Gas Supply (Gas Quality Specifications) Act 2009.
Balance at the start of period 3,514 2,989Receipts 5,070 12,788Payments (7,439) (12,263)Balance at the end of period 1,145 3,514
Royalties for RegionsThis is a sub-fund within the over-arching ‘Royalties for Regions Fund’. The recurrent funds are committed to projects and programs in Western Australia regional areas.
Balance at the start of period 215 823 Adjustment to opening balance 103 -Receipts 18,727 7,889Payments (11,923) (8,497)Balance at the end of period 7,122 215
Notes to the Financial StatementsFor the year ended 30 June 2013
Department of Commerce | Annual Report 2012-13 117

2013 2012$’000 $’000
40. Special Purpose Accounts and Restricted Cash Accounts (cont.)Commonwealth fundingHolds funds provided by the Commonwealth that are committed to various projects.
Balance at the start of period 3,935 2,591 Adjustment to opening balance 31 -Receipts 2,075 3,879Payments (2,507) (2,534)Balance at the end of period 3,534 3,935
Real Estate - Education and General Purpose AccountHolds funds used for the operation of the Education and General Purpose Account in accordance with the Real Estate and Business Agents Act 1978.
Balance at the start of period 34,967 - Receipts 11,737 48,316Payments (12,877) (13,349)Balance at the end of period 33,826 34,967
Real Estate - Fidelity Guarantee AccountHolds funds used for the operation of the Fidelity Guarantee Account in accordance with the Real Estate and Business Agents Act 1978.
Balance at the start of period 43,764 - Receipts 3,853 45,166Payments (4,172) (1,402)Balance at the end of period 43,446 43,764
Real Estate - Home Buyers Assistance AccountHolds funds used for the operation of the Home Buyers Assistance Account in accordance with the Real Estate and Business Agents Act 1978.
Balance at the start of period 14,967 - Receipts 5,622 22,148Payments (6,295) (7,181)Balance at the end of period 14,294 14,967
Notes to the Financial StatementsFor the year ended 30 June 2013
Department of Commerce | Annual Report 2012-13118

Notes to the Financial StatementsFor the year ended 30 June 2013
2013 2012$’000 $’000
40. Special Purpose Accounts and Restricted Cash Accounts (cont.)Real Estate and Business Agents Supervisory Board Trust AccountHolds funds as a result of legal proceedings and liquidations of agencies in accordance with the Trust Statement.
Balance at the start of period 219 - Receipts 8 392Payments - (173)Balance at the end of period 227 219
Settlement Agents - Education and General Purpose AccountHolds funds used for the operation of the Education and General Purpose Account in accordance with the Settlement Agents Act 1981.
Balance at the start of period 20,449 - Receipts 2,789 22,723Payments (1,377) (2,274)Balance at the end of period 21,862 20,449
Settlement Agents - Fidelity Guarantee AccountHolds funds used for the operation of the Fidelity Guarantee Account in accordance with the Settlement Agents Act 1981
Balance at the start of period 33,539 - Receipts 3,151 34,787Payments (975) (1,248)Balance at the end of period 35,715 33,539
Building Services AccountHolds funds used for the operation of the Building Commission division of the Department of Commerce in accordance with the building services Acts.
Balance at the start of period 5,809 - Receipts 30,592 33,774Payments (29,415) (27,965)Balance at the end of period 6,986 5,809
Department of Commerce | Annual Report 2012-13 119

2013 2012$’000 $’000
41. Supplementary financial informationWrite-offs
During the financial year ending 30 June 2013, $7,713.35 (2012: $ 31,197.85) of debts due to the State were written off. The debtors written off were mainly in the areas of associations and business names comprising of individual amounts that would be considered as uneconomical to pursue in the period 2012 to 2013 . The amounts were written off under the authority of: The Accountable Authority 8 31Losses through Theft, Defaults and Other CausesLosses of public moneys and, public and other property through theft or default 11 1Amounts recovered (6) (1)Claims pending 5 -Gifts of Public PropertyThe Department received no gifts of public property. - - Acts of GraceAct of grace payments made. 4 11
42. Administered Income and ExpensesExpenses
Employee benefits expense - 6 Supplies and services 15,560 4,875 Finance costs - 34 Grants and subsidies 3,420 3,146 Receipts paid into consolidated account 1,818 7,762 Other expenses 30 4 Total administered expenses 20,827 15,827
RevenueUser charges and fees 1,880 7,767 Interest revenue 12,018 14,376 Other revenue 483 1,351 Total administered revenue 14,381 23,494
Notes to the Financial StatementsFor the year ended 30 June 2013
Department of Commerce | Annual Report 2012-13120

43. Disclosure of administered income and expenses by service
Consumer Protection
Safety & Employment Protection & Construction
StandardsIndustry Science &
Innovation Total2013
$’0002012
$’0002013
$’0002012
$’0002013
$’0002012
$’0002013
$’0002012
$’000COST OF SERVICESExpenses
Employee benefits expenses - 6 - - - - - 6 Supplies and services 15,560 4,860 - - - 15 15,560 4,875 Finance costs - - - - - 34 - 34 Grants and subsidies 3,420 3,146 - - - - 3,420 3,146 Receipts paid into Consolidated account 1,566 6,589 252 1,173 - - 1,818 7,762 Other expenses 13 4 - 17 - 30 4 Total administered expenses 20,558 14,605 252 1,173 17 49 20,827 15,827
Income
For transfer:Regulatory fees 1,566 6,594 315 1,173 - - 1,880 7,767 Interest revenue 11,823 14,175 - - 195 201 12,018 14,376 Other - 883 - - 483 468 483 1,351 Total administered income 13,388 21,652 315 1,173 678 669 14,381 23,494
Notes to the Financial StatementsFor the year ended 30 June 2013
Department of Commerce | Annual Report 2012-13 121

Payments of fees and charges to the Consolidated Account.
The Department of Commerce is responsible for the collection of certain fees and fines. These are not classified as controlled revenue and expenses and are credited to the Consolidated Account.
2013 2012Collections made during the year: $’000 $’000Business Names Registrations - 4,759 Other Registration Fees 195 146 Employment Agents 187 337 Finance Brokers - 1 Land Valuers 113 130 Motor Vehicle Dealers 829 939 Travel Agents 237 131 Plumbers - 6 Other 320 1,319 Total 1,880 7,767
Notes to the Financial StatementsFor the year ended 30 June 2013
Department of Commerce | Annual Report 2012-13122

Notes to the Financial StatementsFor the year ended 30 June 2013
2013 2012$’000 $’000
44. Administered Assets and LiabilitiesASSETS
Current AssetsCash and cash equivalents 3,699 3,256Restricted cash and cash equivalents 325,109 277,532Receivables 4,630 1,804
Total Current Assets 333,438 282,592Non-Current Assets
Receivables 11,496 11,381Total Non-Current Assets 11,496 11,381
TOTAL ADMINISTERED ASSETS 344,934 293,973LIABILITIESCurrent Liabilities
Payables 8,710 10,663Other current liabilities 305,572 249,151Total Current Liabilities 314,282 259,814
TOTAL ADMINISTERED LIABILITIES 314,282 259,814
The administered assets, liabilities, expenses and income are those which the Government requires the Department to administer on its behalf.
Department of Commerce | Annual Report 2012-13 123

2013 2012$’000 $’000
44. Administered Assets and Liabilities (cont.)Special Purpose Accounts section 16(1)(b) of FMA (Administered)
Rental Accommodation Account 325,109 277,532 Regional Headworks Development Scheme - -
325,109 277,532 Administered
Rental Accommodation AccountHolds rental security bonds and the interest income in accordance with clause 3(1) of schedule 1 of the Residential Tenancies Act.
Balance at start of period 277,532 227,715Receipts:
Bonds received 165,491 139,148Interest received 12,226 14,055Other (218) 1,609
Total receipts 177,500 154,812Payments:Bonds disbursed (108,116) (83,948)Administration costs (15,747) (10,044)Grants (3,420) (3,146)Other (2,640) (7,857)
Total Payments (129,923) (104,995)Balance at the end of period 325,109 277,532Regional Headworks Development SchemeHolds funds appropriated for the purpose of providing assistance under the Regional Headworks Development Scheme (RHDS). The RHDS was transferred from the Department of Mines and Petroleum on 1 January 2009.Balance at the start of period - 1,391Receipts - - Payments - (1,391)Balance at the end of period - -
Notes to the Financial StatementsFor the year ended 30 June 2013
Department of Commerce | Annual Report 2012-13124

Key Performance
Indicators
Certification of Key Performance Indicators for the year ended 30 June 2013I hereby certify that the key performance indicators are based on proper records, are relevant and appropriate
for assisting users to assess the Department of Commerce’s performance, and fairly represent the
performance of the Department of Commerce for the financial year ended 30 June 2013.
Brian Bradley Accountable Authority 17 September 2013
Department of Commerce | Annual Report 2012-13 125

The linkage of the Department of Commerce’s desired outcome and services to the community and the Government Goals is demonstrated in Figure 3:
GOVERNMENT’S GOALSAGENCY LEVEL GOVERNMENT DESIRED OUTCOME
SERVICES
Outcomes-Based Service Delivery Greater focus on achieving results in key service delivery areas for the benefit of all Western Australians.
Outcome 1 A fair trading environment that protects consumers and traders in Western Australia.
Service 1: Consumer Protection
Social and Environmental Responsibility Ensuring that economic activity is managed in a socially and environmentally responsible manner for the long-term benefit of the State.
Outcome 2 A community with workplaces operated in a safe and fair manner and where buildings are safe and efficient.
Service 2: Safety and Employment Protection and Construction Standards
Financial and Economic Responsibility Responsibly managing the State’s finances through the efficient and effective delivery of services, encouraging economic activity and reducing regulatory burdens on the private sector.
Outcome 3 Enhancement of the State’s economic sustainability and prosperity.
Service 3: Industry, Science and Innovation
Key e�ectiveness indicatorsFour key performance indicators of effectiveness adopted by the department measure the extent to which its three outcomes are achieved. Each of the department’s operational divisions has underpinning measures contributing to the results reported for these effectiveness indicators.
Outcome oneA fair trading environment that protects consumers and traders in Western Australia.
Key e�ectiveness indicator oneThe extent to which traders comply with regulatory requirements.
Key Performance Indicators
Department of Commerce | Annual Report 2012-13126

ResultTable 8: Key effectiveness indicator oneNotes:
(1) The 2008-09 to 2010-11 results had been recast for comparison purposes as previously data had included both inspections undertaken by the Plumbers’ Licensing Board (part of the Building Commission Division) and those undertaken by the Consumer Protection Division. Past results had been adjusted to include only inspections undertaken by the Consumer Protection Division.
(2) Since 2010-11 the methodology for this indicator was reviewed and additional categories of proactive inspections have been included.
(3) The target is derived from the ‘2012-13 Budget Target’ figure published in the department’s 2012-13 Budget Statements and is the percentage of total compliance over total inspections.
The department’s effectiveness in relation to the extent to which consumers are protected and businesses operate fairly is assessed in terms of the proportion of traders that comply with regulatory requirements. The extent to which breaches of a significant nature were identified is the basis for monitoring and reporting compliance. The extent of compliance is ascertained by assessing businesses against criteria established by the department, in particular priority areas regarding compliance with consumer protection legislation. During the course of inspections, inspectors verify traders’ compliance against a list of regulatory requirements. Only those areas for which the Consumer Protection Division is directly responsible are used to ascertain the extent of compliance within the community. During 2012-13, 28,751 consumer protection routine and proactive inspections as compared to 29,991 in 2011-12 were undertaken to provide the result reported. Of these inspections, 97 per cent of traders were found to be compliant with the regulatory requirements.
Num
ber
Financial Year
Number inspections
Number compliant
Result
Target
25,000
20,000
15,000
10,000
5,000
02008-09(1) 2009-10(1) 2010-11(1)(2) 2011-12(2) 2012-13 Target
2012-13(3)
35,000
30,000
18,110 17,603
20,066 19,287
30,23728,871
29,99128,589 27,85128,751
97+P97% 96+P96% 95+P95% 95+P95% 97+P97% 93+P93%
Department of Commerce | Annual Report 2012-13 127

Key e�ectiveness indicator two
The extent of consumer confidence in Western Australia’s trading environment.
ResultTable 9: Key effectiveness indicator two
Note:
(1) The target is derived from the ‘2012-13 Budget Target’ figure published in the department’s 2012-13 Budget Statements and is the average of the two underpinning measures.
The extent of consumer confidence is measured by the extent to which consumers believe businesses generally act fairly to them and the extent to which they believe they are well informed about their rights and responsibilities.
Results reported have been determined by an independent survey, which has been conducted for the last 15 years. A total of 415 surveys were completed, which was a response rate of 14 per cent achieving a maximum standard error ratio of +/-4.9 per cent at the 95 per cent confidence level. Response rates have over the last few years fallen due to a higher refusal rate and the need for the survey process to reject otherwise willing participants in order to achieve adequate cell sizes of young people to facilitate reliable weighting of the final data set. In 2012-13 a total of 2,954 calls were made to achieve 415 completed surveys. All respondents were aged 18 years or over and respondents were located in both the Perth metropolitan area and regional Western Australia, and despite the low response rate, the respondents are considered representative of the consumer population.
Eighty per cent of total respondents believed that businesses acted fairly towards consumers in 2012-13. This result is comparable to past years’ results. In 2012-13 the proportion of respondents who were either ‘reasonably’ or ‘well’ aware of their rights and responsibilities as a consumer was 71 per cent, which is comparable to past years’ results and an increase in awareness of the rights and responsibilities of consumer compared to 2008-09 and 2009-10 results.
Per
cen
t
Financial Year
The extent to which consumers believe businessesgenerally act fairly towards consumers.
The extent to which consumers believe they are wellinformed about their rights and responsibilities.
100
80
60
40
20
02008-09 2009-10 2010-11 2011-12 2012-13 Target
2012-13(1)
77.0
64.0
75.0
60.0
75.071.0
79.072.0
80.0
71.075.0
Result
Target71+P71% 68+P68% 73+P73% 76+P75.5% 76+P75.5% 75+P75%
Department of Commerce | Annual Report 2012-13128

Outcome twoA community with workplaces operated in a safe and fair manner and where buildings are safe and efficient.
Key e�ectiveness indicator threeThe extent of compliance with safety and employment protection regulatory requirements and construction standards.
Result
Table 10: Key effectiveness indicator three
Underpinning Measures 2008-09Actual
2009-10Actual
2010-11Actual
2011-12Actual
2012-13Target
2012-13Actual
The extent to which employers comply with the requirements of labour relations laws.
No. elements 885 902 670 324 467
No. compliant 624 679 526 248 303
The extent to which workplaces meet occupational safety and health criteria in priority areas (to indicate that workplaces are operated in a safe and healthy manner).
No. elements/ No. Priority Inspection Reports
11,904(2) 15,285 15,167 10,742 15,481
No. compliant 9,141(2) 10,683 10,583 7,275 10,570The extent to which electricity and gas suppliers comply with approved inspection practices.
No. elements 11(3) 83(4) 88(5) 196(6) 102(7)
No. compliant 4(3) 44(4) 70(5) 110(6) 93(7)
The extent to compliance with construction standards.(8)
No. elements - - - 71,469(9) 82,503(10)
No. compliant - - - 70,386(9) 81,584(10)
Total assessments contributing to result 12,800 16,270 15,925 82,731 98,553
Total occasions of compliance found 9,769 11,406 11,179 78,019 92,550
Result(1)
Notes:
(1) The target is derived from the ‘2012-13 Budget Target’ figure published in the department’s 2012-13 Budget Statements and is the percentage of compliance of all underpinning measures.
(2) The system of recording changed on 15 August 2008 as a consequence the results for 2008-09 covered the period only 15 August 2008 to 30 June 2009.
(3) During 2008-09 resources were allocated to assist gas network operators to develop acceptable inspection plans, which impacted the number of gas audits undertaken. Audits of electricity suppliers were ongoing at the end of 2008-09 and therefore the results represent audits conducted for gas suppliers only.
76+P76% 70+P70% 70+P70% 94+P94% 95+P95% 94+P94%
Result
Target
Department of Commerce | Annual Report 2012-13 129

(4) During 2009-10 there were 34 electricity and 49 gas elements and the number of compliant consisted of three electricity and 41 gas.
(5) The number of elements for 2010-11 consists of gas inspections only as during 2010-11 no audits were conducted of electricity network operator inspection systems as three of the network operators made and implemented change to improve compliance. This enabled the EnergySafety Division to conduct audits of other areas of electricity network operators’ activities.
(6) During 2011-12 there were 134 electricity and 62 gas elements and the number of compliant consisted of 65 electricity and 45 gas.
(7) During 2012-13 there were 36 electricity and 66 gas elements and the number of compliant consisted of 34 electricity and 59 gas.
(8) With a change to the Outcome Based Management (OBM) framework an underpinning measure was introduced in 2011-12 relating to the Building Commission Division.
(9) During 2011-12 there were 49,978 plumbing approvals and 21,491 building approvals. Non-compliance consisted of 241 plumbing notices issued and 842 building orders made by permit authorities and reported to the Building Commission Division.
(10) During 2012-13 there were 55,251 plumbing approvals and 27,252 building approvals. Non-compliance consisted of 110 plumbing notices issued and 809 building orders made by permit authorities and reported to the Building Commission Division.
This effectiveness indicator has four underpinning measures (Table 10).
The first being, the department’s effectiveness regarding the extent to which employers comply with the requirements of the labour relations legislation. This is assessed in terms of the degree to which workplaces meet set criteria for priority areas. The five key elements assessed include payment of appropriate ordinary time rates; providing employees with annual leave and sick leave entitlements; recording start and finishing times; recording total hours worked; and recording employment under correct status. During 2012-13, the department finalised a total of 396 investigations and inspections. There were 364 complaints by individual employees alleging that their employer had failed to pay appropriate entitlements under State industrial laws, awards and agreements. As part of its investigative process, the department reviewed the time and wage records for 80 employment matters. Industrial inspectors assessed the employers for the five key elements, resulting in a total of 467 elements being checked and of these 303, or 65 per cent were found to be compliant.
The second, measures the department’s effectiveness in ensuring workplaces operate in a safe and healthy manner. This is assessed in terms of the extent to which workplaces meet occupational safety and health criteria in priority areas. During the course of investigations inspectors complete Priority Inspection Reports (PIRs). These PIRs contain a checklist of elements constituting the minimum requirements for inspectors to assess when the workplace being visited falls within one of the priority areas. All investigations for PIRs were conducted using a standard format introduced during 2000-01. The checklist of elements, used as the assessment tool, is not a full compliance check, but represents the key elements established for the relevant priority area.
For the third underpinning measure, the EnergySafety Division conducts regular compliance audits on various elements of approved inspection plans to ensure that electricity and gas network operators and Liquefied Petroleum Gas (LPG) suppliers comply with their inspection obligations. Electricity and gas network operators and LPG suppliers are required to conduct targeted inspections of electrical installing and gasfitting work in accordance with an inspection plan, to ensure that the work by licensed industry operatives has been completed to the required standard and the installations are safe.
In 2011-12 a fourth measure was introduced and relates to the compliance with construction standards. The number of elements is based on plumbing and building approvals and non-compliance is based on the number of plumbing notices issued and the number of building orders made by permit authorities and reported to the Building Commission Division.
The overall 2012-13 result for the extent of compliance with safety and employment protection regulatory requirements and construction standards of 94 per cent is comparable to both the 2011-12 result and the target of 95 per cent.
Department of Commerce | Annual Report 2012-13130

Outcome threeEnhancement of the State’s economic sustainability and prosperity.
Key e�ectiveness indicator fourIndex of funding leverage obtained for Western Australia from science and innovation research grants.
ResultTable 11: Key effectiveness indicator four
Notes:
(1) The target is derived from the ‘2012-13 Budget Target’ figure published in the department’s 2012-13 Budget Statements.
The department contributes to the enhancement of the State’s economic sustainability and prosperity by leveraging additional research funding to assist industry to become more competitive. This key effectiveness indicator reports the ratio of dollars provided by the Commonwealth and other sources (such as industry, universities, etc.) against every dollar provided by the State in the form of grants to Centres of Excellence. The indicator relates to concluded grants for Centres of Excellence established since 2000. The 2012-13 result of 10.5:1 is greater than the target of 6.7:1 published in the 2012-13 Budget Statements. The target figure is calculated from the Centres’ individual estimates and actual results can sometimes be higher than expected due to the success of a number of Centres of Excellence in attracting a higher ratio of leverage funds than originally anticipated. The 2012-13 result is however comparable to the past two years’ results.
Key e�ciency indicatorsEfficiency performance indicators have been formulated for each of the department’s service areas: Consumer Protection, Safety and Employment Protection and Construction Standards; and Industry, Science and Innovation. Each of these service areas is supported by a number of programs, which in turn are comprised of various underpinning activities carried out within the department.
Each indicator shows the average cost per program. The indicators are calculated based on the department’s cost allocation model to reflect the full cost, including overheads, of conducting the department’s activities. The amount of the department’s expenditure attributed to the provision of each program is determined by the amount of staff time allocated to undertaking projects and tasks associated with that program. The total cost of the program is then divided by the quantity of activities achieved. Efficiency indicators exclude grants paid to external parties.
Inde
x of
fund
ing
leve
rage
Financial Year
Index of funding leverage obtained for Western Australia from science and innovation research grants
10
8
6
4
2
02008-09 2009-10 2010-11 2011-12 2012-13 Target
2012-13(1)
12
6.8:1
10.4:111.2:1
10.5:1
7.4:16.7:1
Department of Commerce | Annual Report 2012-13 131

Service 1: Consumer ProtectionThe provision of consumer protection advice, information, education and business regulation services to the Western Australian community.
Key e�ciency indicator oneAverage cost per client contact to provide information and advice.
DescriptorThe Consumer Protection Division responds to enquiries from members of the public and provides them with customised information or education. Responses are usually on a one-to-one basis and of a short duration. The response can be a result of telephone, front counter, email or letter enquiry, or an enquiry for FuelWatch price information.
The division delivers non-customised and mass produced services that provides members of the public with information and raises awareness within the community. Many of these activities are automated and include online visitors to the department’s website and the delivery of mass produced services including publication distribution and visitor attendance at shows, expos or seminars. A key element of the department’s role is also to provide more tailored advice and assistance to the community in relation to specific matters, typically on a one-to-one basis.
ResultTable 12: Key efficiency indicator one
Notes:
(1) The 2008-09 and 2009-10 results were in the previous OBM framework (where the Building Commission Division contributed to the Consumer Protection Service). They were not recast and as such are not directly comparable to other years’ results as they are in a different OBM framework.
Table 12 illustrates the average cost per client contact to provide information and advice. During 2012-13 the Consumer Protection Division undertook 6,019,858 activities to provide information and advice services which is less than the 7,190,514 in 2011-12 and the estimated 6,610,680. Despite an increase in the total functional telephone calls and telephone advice line calls answered, the majority of the decrease in client contacts was attributed to a lower than expected number of on-line visitors to the FuelWatch website. A new web analytics application, which is compatible with Windows 7, was implemented in November 2012. This application is used to determine
Ave
rage
cos
t $
Financial Year
Average cost per client contact to provide information and advice
$2.50
$2.00
$1.50
$1.00
$0.50
0 2012-13 Target
2012-13
$3.00
2.692.59
2.34 2.36
2.74 2.57
2008-09(1) 2009-10(1) 2010-11 2011-12
Department of Commerce | Annual Report 2012-13132

the number of online visitors to the FuelWatch website. The new application operates differently to the previous application and therefore the number of online visitors to the FuelWatch website for 2011-12 and expected number for 2012-13 are not comparable to the actuals for 2012-13. The lower than expected provision of information and advice (8.9 per cent), coupled with an increase (5.4 per cent) in expected expenditure for this indicator led to the result of $2.74 being significantly more (15.8 per cent) than the target of $2.36 published in the department’s 2012-13 Budget Statements.
Key e�ciency indicator twoAverage cost per policy project.
DescriptorMajor policy projects are aimed at enhancing the regulatory environment and usually involve significant duration, complexity and public consultation. Major policy projects include: Cabinet submissions to print a new Bill; the introduction of new mandatory codes; amendments to an existing Act or mandatory code to implement a Government policy change which requires consultation with parties external to the agency; or new Government policy that requires extensive consultation with parties external to the agency.
Other policy projects which are of notable duration, moderate complexity and aimed at enhancing the regulatory environment or developing a new policy position are also included. These policy projects produce: new or amended subsidiary legislation (such as a Regulation or Order); voluntary codes, guidance notes or equivalent; briefing notes or policy submissions to a Minister or other external bodies; Cabinet submissions; or new or significant amendments to Government policy.
Result
Table 13: Key efficiency indicator two
Notes:
(1) The 2008-09 and 2009-10 results were in the previous OBM framework (where the Building Commission Division contributed to the Consumer Protection Service). They were not recast and as such are not directly comparable to other years’ results as they are in a different OBM framework.
(2) The 2010-11 result is significantly lower than other years due to the greater than usual number of policy projects completed, largely due to the 15 projects completed relating to consequential regulations which took effect from 1 July 2011 flowing from the “repeal” of the Fair Trading Act 1987, Door to Door Trading Act 1987 and Consumer Affairs Act 1971; the abolition of the Land Valuers Licensing Board, Motor Vehicle Industry Board, Real Estate and Business Agents Supervisory Board and Settlement Agents Supervisory Board; and the creation of the Consumer Advisory Committee, Motor Vehicle Industry Advisory Committee and Property Industry Advisory Committee.
Ave
rage
cos
t $
Financial Year
Average cost per policy project
$250,000
$200,000
$150,000
$100,000
$50,000
0 2012-13 Target
2012-13
$300,000
$350,000
209,387
306,760
161,693
305,753
179,884
229,108
2008-09(1) 2009-10(1) 2010-11(2) 2011-12
Department of Commerce | Annual Report 2012-13 133
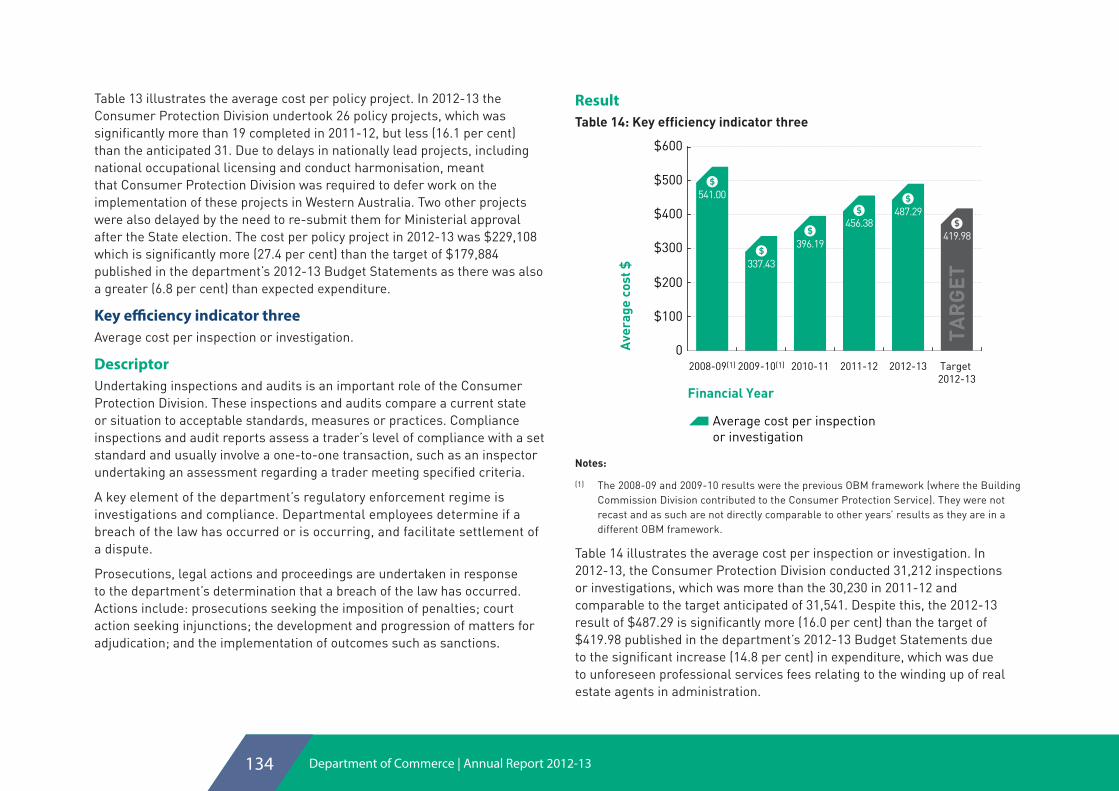
Table 13 illustrates the average cost per policy project. In 2012-13 the Consumer Protection Division undertook 26 policy projects, which was significantly more than 19 completed in 2011-12, but less (16.1 per cent) than the anticipated 31. Due to delays in nationally lead projects, including national occupational licensing and conduct harmonisation, meant that Consumer Protection Division was required to defer work on the implementation of these projects in Western Australia. Two other projects were also delayed by the need to re-submit them for Ministerial approval after the State election. The cost per policy project in 2012-13 was $229,108 which is significantly more (27.4 per cent) than the target of $179,884 published in the department’s 2012-13 Budget Statements as there was also a greater (6.8 per cent) than expected expenditure.
Key e�ciency indicator threeAverage cost per inspection or investigation.
DescriptorUndertaking inspections and audits is an important role of the Consumer Protection Division. These inspections and audits compare a current state or situation to acceptable standards, measures or practices. Compliance inspections and audit reports assess a trader’s level of compliance with a set standard and usually involve a one-to-one transaction, such as an inspector undertaking an assessment regarding a trader meeting specified criteria.
A key element of the department’s regulatory enforcement regime is investigations and compliance. Departmental employees determine if a breach of the law has occurred or is occurring, and facilitate settlement of a dispute.
Prosecutions, legal actions and proceedings are undertaken in response to the department’s determination that a breach of the law has occurred. Actions include: prosecutions seeking the imposition of penalties; court action seeking injunctions; the development and progression of matters for adjudication; and the implementation of outcomes such as sanctions.
ResultTable 14: Key efficiency indicator three
Notes:
(1) The 2008-09 and 2009-10 results were the previous OBM framework (where the Building Commission Division contributed to the Consumer Protection Service). They were not recast and as such are not directly comparable to other years’ results as they are in a different OBM framework.
Table 14 illustrates the average cost per inspection or investigation. In 2012-13, the Consumer Protection Division conducted 31,212 inspections or investigations, which was more than the 30,230 in 2011-12 and comparable to the target anticipated of 31,541. Despite this, the 2012-13 result of $487.29 is significantly more (16.0 per cent) than the target of $419.98 published in the department’s 2012-13 Budget Statements due to the significant increase (14.8 per cent) in expenditure, which was due to unforeseen professional services fees relating to the winding up of real estate agents in administration.
Ave
rage
cos
t $
Financial Year
Average cost per inspection or investigation
$500
$400
$300
$200
$100
0 2012-13 Target
2012-13
$600
541.00
337.43
396.19
456.38487.29
419.98
2008-09(1) 2009-10(1) 2010-11 2011-12
Department of Commerce | Annual Report 2012-13134
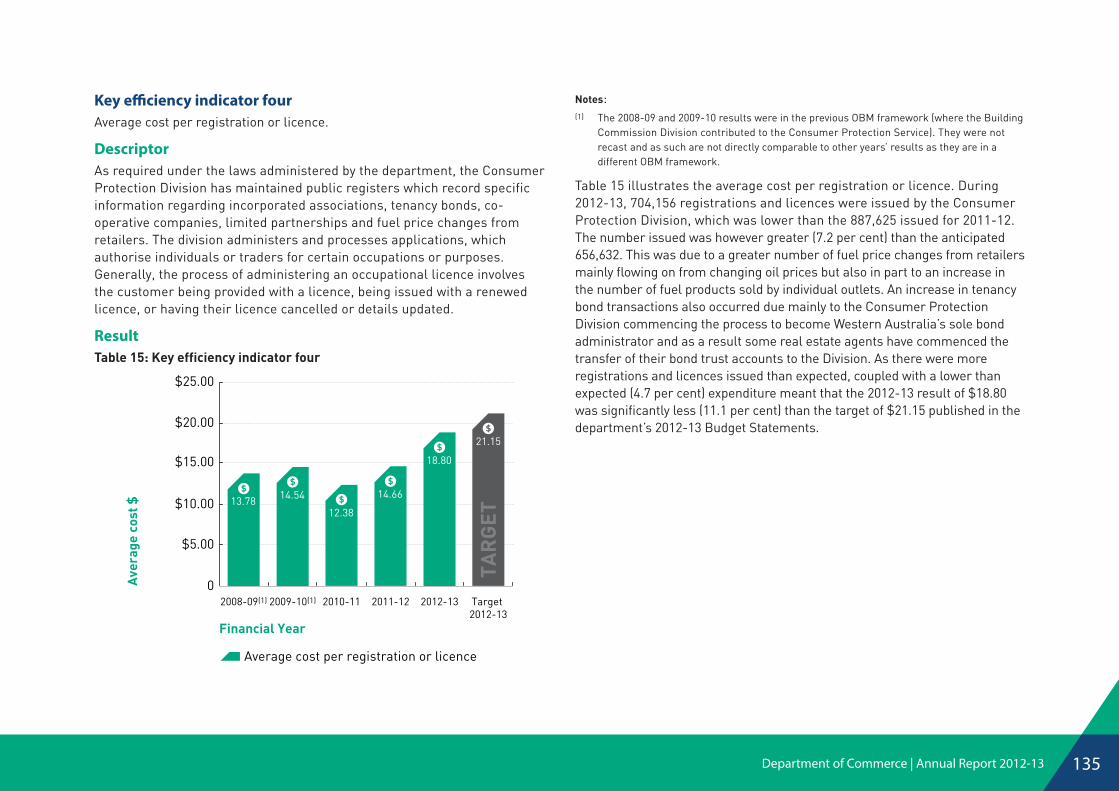
Key e�ciency indicator fourAverage cost per registration or licence.
DescriptorAs required under the laws administered by the department, the Consumer Protection Division has maintained public registers which record specific information regarding incorporated associations, tenancy bonds, co-operative companies, limited partnerships and fuel price changes from retailers. The division administers and processes applications, which authorise individuals or traders for certain occupations or purposes. Generally, the process of administering an occupational licence involves the customer being provided with a licence, being issued with a renewed licence, or having their licence cancelled or details updated.
ResultTable 15: Key efficiency indicator four
Notes:(1) The 2008-09 and 2009-10 results were in the previous OBM framework (where the Building
Commission Division contributed to the Consumer Protection Service). They were not recast and as such are not directly comparable to other years’ results as they are in a different OBM framework.
Table 15 illustrates the average cost per registration or licence. During 2012-13, 704,156 registrations and licences were issued by the Consumer Protection Division, which was lower than the 887,625 issued for 2011-12. The number issued was however greater (7.2 per cent) than the anticipated 656,632. This was due to a greater number of fuel price changes from retailers mainly flowing on from changing oil prices but also in part to an increase in the number of fuel products sold by individual outlets. An increase in tenancy bond transactions also occurred due mainly to the Consumer Protection Division commencing the process to become Western Australia’s sole bond administrator and as a result some real estate agents have commenced the transfer of their bond trust accounts to the Division. As there were more registrations and licences issued than expected, coupled with a lower than expected (4.7 per cent) expenditure meant that the 2012-13 result of $18.80 was significantly less (11.1 per cent) than the target of $21.15 published in the department’s 2012-13 Budget Statements.
Ave
rage
cos
t $
Financial Year
Average cost per registration or licence
$25.00
$20.00
$15.00
$10.00
$5.00
0 2012-13 Target
2012-13
13.78 14.54
12.38
14.66
21.15
18.80
2008-09(1) 2009-10(1) 2010-11 2011-12
Department of Commerce | Annual Report 2012-13 135

Service 2: Safety and Employment Protection and Construction StandardsThe provision of advice, information, education and regulation services to the Western Australian community in the areas of: occupational safety and health; energy safety; labour relations; and construction standards.
Key e�ciency indicator �veAverage cost per client contact to provide information or advice.
DescriptorThe safety and employment and construction standards divisions (EnergySafety Division, Labour Relations Division, WorkSafe Division and Building Commission Division) respond to enquiries from industry and members of the public and provide them with customised information or education. Responses vary from routine to complex technical enquiries and can be a result of telephone, in person or front counter, email or letter enquiry.
Information delivered may be non-customised and mass produced and provide members of the public with information and raise awareness within the community. Many of these activities are automated and include online visitors to the department’s websites and the delivery of mass produced services including publication distribution and visitor attendance at presentations, road shows, expos or seminars. This indicator also reflects the Labour Relations Division’s responsibilities in providing tailored advice and assistance to public sector agencies in relation to industrial disputes, policies and industrial agreements.
Result
Table 16: Key efficiency indicator five
Notes:
(1) The 2008-09 and 2009-10 results were in the previous OBM framework (where the Building Commission Division contributed to the Consumer Protection Service). They were not recast and as such are not directly comparable to other years’ results as they are in a different OBM framework.
Table 16 illustrates the average cost per client contact to provide information and advice by the safety and employment protection and construction standards divisions. In 2012-13 the divisions undertook 3,555,626 activities to provide information and education services, a significant increase compared to 3,166,531 in 2011-12 and a significant increase (18.7 per cent) from the anticipated 2,994,606. The 2012-13 result of $6.44 is significantly less (18.2 per cent) than the target of $7.88 published in the department’s 2012-13 Budget Statements due to both the significantly greater amount
Ave
rage
cos
t $
Financial Year
Average cost per client contact to provide information and advice
$5.00
$4.00
$3.00
$2.00
$1.00
0 2012-13 Target
2012-13
$6.00
$7.00
$8.00
5.144.81
7.71
6.17
7.88
6.44
2008-09(1) 2009-10(1) 2010-11 2011-12
Department of Commerce | Annual Report 2012-13136

of information and advice provided which was mainly due to an increase in online visitors and a decrease (2.9 per cent) in expenditure.
Key e�ciency indicator sixAverage cost per hour of policy advice.
DescriptorThis indicator reflects the development and amendment of labour relations policy, legislation and regulations; preparation of submissions on behalf of the Minister and Government to State and federal industrial tribunals, Senate Inquiries, etc. in relation to the regulatory framework; provision of policy advice to the Minister on labour relations and labour market trends; and policy support to the Minister.
ResultTable 17: Key efficiency indicator six
Notes:
(1) The 2008-09 and 2009-10 results were in the previous OBM framework (where the Building Commission Division contributed to the Consumer Protection Service). They were not recast and as such are not directly comparable to other years’ results as they are in a different OBM framework.
Table 17 illustrates the average cost per hour of policy advice provided by the Labour Relations Division. In 2012-13 the Labour Relations Division undertook 15,535 hours of policy advice which is comparable to 15,464 in 2011-12 and more (6.0 per cent) than the anticipated 14,650 hours. The expenditure relating to this indicator significantly increased (24.1 per cent) compared to the expected expenditure. This was mainly due to a correction of allocation of expenditure to direct costs within the Labour Relations Division which had been incorrectly allocated to indirect costs in past years and in the target. As a consequence the 2012-13 result of $195.70 is significantly greater (17.1 per cent) than the target of $167.17 published in the department’s 2012-13 Budget Statements.
Key e�ciency indicator sevenAverage cost per inspection or investigation.
DescriptorUndertaking inspections, investigations and audits is an important role for the safety and employment protection and construction standard divisions. Inspections, investigations and audits compare a current state or situation to acceptable standards, measures or practices to check compliance. These are conducted on a regular basis or can be a result of a complaint, and can involve a site visit or be complex in nature.
A key element of the safety and employment and construction standards divisions’ regulatory enforcement regime is to determine if a breach of the law has occurred or is occurring, and facilitate a settlement of a dispute. Investigations and conciliations undertaken by the Labour Relations Division and the Building Commission Division are to resolve issues without referral to formal redress procedures. Prosecutions, legal actions and proceedings are undertaken in response to the safety and employment protection and construction standards divisions’ determination that a breach of the law has occurred. Actions include prosecutions seeking the imposition of penalties or court action seeking injunctions.
Ave
rage
cos
t $
Financial Year
Average cost per hour of policy advice
$250
$200
$150
$100
$50
0 2012-13 Target
2012-13
$300
107.00
260.39
183.68 180.92195.70
2008-09(1) 2009-10(1) 2010-11 2011-12
167.17
Department of Commerce | Annual Report 2012-13 137

ResultTable 18: Key efficiency indicator seven
Notes:
(1) The 2008-09 and 2009-10 results were in the previous OBM framework (where the Building Commission Division contributed to the Consumer Protection Service). They were not recast and as such are not directly comparable to other years’ results as they are in a different OBM framework.
Table 18 illustrates the average cost per inspection or investigation. In 2012-13, the safety and employment protection and construction standards divisions conducted 34,884 inspections or investigations, which is more than the 32,098 in 2011-12, and comparable to the expected number of inspections or investigations of 33,315. The 2012-13 result of $1,202.29 is comparable to the target of $1,296.29 published in the department’s 2012-13 Budget Statements.
Key e�ciency indicator eight
Average cost per registration or licence.
DescriptorThe EnergySafety Division, Building Commission Division and WorkSafe Division administer and process applications, which authorise individuals or employers for certain occupations or purposes. Generally, the processing of the application for a licence results in the customer being provided with a licence (frequently with conditions attached), being issued with a renewed licence, or having their licence refused or cancelled or details updated.
ResultTable 19: Key efficiency indicator eight
Notes:
(1) The 2008-09 and 2009-10 results were in the previous OBM framework (where the Building Commission Division contributed to the Consumer Protection Service). They were not
Ave
rage
cos
t $Financial Year
Average cost per registration or licence
$100
$80
$60
$40
$20
0 2012-13 Target
2012-13
$120
$140
66.5175.82
120.44
103.21
115.95 114.94
2008-09(1) 2009-10(1) 2010-11 2011-12
Ave
rage
cos
t $
Financial Year
Average cost per inspection or investigation
$1,000
$800
$600
$400
$200
0 2012-13 Target
2012-13
$1,200
$1,400
854.00898.74
967.99
1,166.50 1,202.291,296.29
2008-09(1) 2009-10(1) 2010-11 2011-12
Department of Commerce | Annual Report 2012-13138

recast and as such are not directly comparable to other years’ results as they are in a different OBM framework.
Table 19 shows the average cost per registration or licence issued to the community for the EnergySafety Division, Building Commission Division and WorkSafe Division. During 2012-13, 117,267 registrations or licences were issued which is significantly more than both the 99,824 in 2011-12 and the 88,850 anticipated (32.0 per cent) due to a larger than expected number of High Risk Work Licences being issued by WorkSafe Division during 2012-13, as a consequence of the increase in economic activity. The 2012-13 result of $115.95 is comparable however to the target of $114.94 published in the department’s 2012-13 Budget Statements due to a similar increase (33.1 per cent) in expenditure, which was due to the conservative target set for expenditure relating to the merge of the Builders’ Registration Board and the Painters’ Registration Board into the Building Commission Division.
Service 3: Industry, Science and InnovationEnhances the State’s prosperity by promoting industry, science and innovation. Services include:
• supporting the Technology and Industry Advisory Council with policy development advice;
• supporting industry development through innovation and commercialisation; and
• managing industry, science and innovation programs and projects.
Key e�ciency indicator nineAverage cost per industry, science and innovation project managed.
DescriptorThis key efficiency indicator illustrates the average cost per industry, science and innovation project managed. This includes projects in: Centres of Excellence; science initiatives; specific purpose funding; policy; marine and defence; digital economy; innovation and commercialisation programs; Technology Parks, industry participation; and other.
ResultTable 20: Key efficiency indicator nine
Notes:
(1) The 2008-09 and 2009-10 results were in the previous OBM framework (where the Building Commission Division contributed to the Consumer Protection Service, which also impacted the overhead allocation for this Service).They were not recast and as such are not directly comparable to other years’ results as they are in a different OBM framework.
Table 20 shows the average cost per industry, science and innovation project managed. During 2012-13, 86 projects were managed, which is more than the 80 projects managed in 2011-12 and comparable to the target set of 88. The 2012-13 result of $238,924 is significantly higher (11.8 per cent) than the target of $213,675 published in the department’s 2012-13 Budget Statements, due to the slight decrease (2.3 per cent) in the number of projects coupled with an increase (9.3 per cent) in expenditure, as during 2012-13 a revaluation of the Australian Marine Complex took place which was not taken into consideration when setting the target.
Ave
rage
cos
t $
Financial Year
Average cost per industry, science and innovation project managed
$250,000
$200,000
$150,000
$100,000
$50,000
0 2012-13 Target
2012-13
$300,000
$350,000
210,642
174,251
219,119
334,807
213,675
238,924
2008-09(1) 2009-10(1) 2010-11 2011-12
Department of Commerce | Annual Report 2012-13 139

Ministerial directivesTreasurer’s instruction 903(12) requires the department to disclose information on any Ministerial directives relevant to the setting and achievement of desired outcomes or operational objectives, investment activities and financing activities. There were no directives issued by the responsible Ministers during 2012-13.
Other �nancial disclosuresPricing policies for servicesStatutory fees are charged to the public for various licensing and other services provided by the Department of Commerce and are reviewed annually in accordance with government policy.
The fee changes for 2012-13 were published in the Government Gazette on 15 June 2012 and came into effect on 1 July 2012. Details regarding the fees are available on the department’s website.
Capital works projectsThe capital works program provides essential infrastructure support for the department to implement a range of projects that assist it in the delivery of its services. Table 21 identifies the capital works projects that remain ongoing at the end of the financial year and Table 22 identifies the projects completed or discontinued during the year.
Table 21: Capital works projects ongoing
Project titleEstimated
total cost ($)Estimated cost to complete ($)
Planned year of completion
Asset replacement(a) 12,343,000 11,589,235 2016-17
Bentley Technology Park(b) 9,619,000 3,126,395 2014-15Business systems development and enhancements(a)
2,884,000 389,356 2015-16
Customer Focus Service Delivery
2,987,000 1,566,122 2013-14
Project titleEstimated
total cost ($)Estimated cost to complete ($)
Planned year of completion
Marine Industry Technology Park
559,000 460,694 2013-14
Service improvement 911,000 698,001 2013-14Southern Precinct 1,865,000 1,423,135 2013-14System stabilisation(a) 6,045,000 674,349 2014-15
Table 22: Capital works completed or placed on hold during 2012-13
Project title Cost ($)Estimated
total cost ($)Estimated
total cost ($)
Decommissioning of Office of Shared Services
1,913,855
COAG information technology initiatives(c)
1,079,640 1,074,033
Explanations of variances in capital works program total cost provided in Table 21 from total cost reported in the department’s 2011-12 Annual Report are as follows:
(a) The total estimated costs vary as a result of the redefinition of the Asset Replacement, Business systems development and enhancements and System stabilisation projects during the 2012-13 financial year.
(b) The Bentley Technology Park project recommenced during 2012-13. The review and finalisation of the Technology Precinct Structure Plan was cleared to progress through the Department of Planning (DoP), with funding provided through the Department of Commerce in late 2010-11. However due to resourcing constraints within DoP, a suitably skilled project leader was engaged only in late 2011-12 with the project really only resuming in DoP in early 2012-13.
(c) The COAG information technology initiatives project is on hold pending a decision on the State’s level of participation in the National Licensing initiative.
Department of Commerce | Annual Report 2012-13140

Governance disclosuresDisclosure of contracts by senior o�cersIn accordance with the Treasurer’s instruction 903 (14(iii)), senior officers of the department are required to disclose particulars, other than normal contracts of employment of service, of any interest in any existing or proposed contract which a senior officer, or a firm of which a senior officer is a member, or an entity in which a senior officer has a substantial financial interest, has made with the agency or any subsidiary body, related body or affiliated body of the agency.
For 2012-13, other than normal contracts of employment of service, no senior officers, or firms of which senior officers are members, or entities in which senior officers have substantial interests, had any interests in existing or proposed contracts with the department and senior officers.
In accordance with the Treasurer’s instruction 903 (14(ii)), senior officers of the department are required to disclose the particulars of any shares in any subsidiary body of the agency held as a nominee or held beneficially. In 2012-13, no senior officers held shares in any subsidiary body of the agency held as a nominee or held beneficially.
Governance frameworkThe department operates under a governance structure in which authority and accountability are shared between the Director General and the divisions. While the Director General is ultimately accountable for the full range of the department’s activities, the divisions, through the relevant Executive Director, have considerable autonomy in day-to-day decision-making, allocation of resources and determination of priorities within the divisions.
The Corporate Charter maintained by the department sets out the governance principles under which it operates and establishes the limits of divisional autonomy in the key areas of:
• accountability and decision-making;
• role and operation of Corporate Executive;
• strategic planning and reporting;
• financial and human resource management; and
• ministerial communication and correspondence.
The Corporate Charter also provides procedures for managing:
• internal committees;
• Corporate Executive submissions; and
• policy development.
Internal auditThe Department’s internal audit function assists management to effectively discharge their responsibilities by providing independent analysis, appraisals, advice and recommendations concerning departmental functions, activities and systems. These appraisals and advice are provided to the Director General, Executive Directors, directors and managers to promote and achieve sound management and control over the activities of the department and to promote efficient and effective operations. These appraisals include:
• comprehensive audits of the department’s management information systems, controls systems and activities;
• assessment of compliance with legislative requirements, regulations, departmental and government policies;
• assessments of controls over accounting and financial records to ensure public property, money and resources are properly safeguarded;
• management orientated appraisals of the department’s operations and activities;
• undertaking special investigations into suspected or alleged of breaches of legislation, policies the department’s Code of Conduct or alleged misconduct; and
• following up and reporting on audit recommendations made.
An annual risk based audit plan is developed covering the department’s functions and operations. This plan is endorsed by the department’s Internal Audit Committee. All internal audit work is undertaken in-house except for IT audits.
Department of Commerce | Annual Report 2012-13 141

During 2012-13, the Internal Audit Branch provided advice on proposed processes and controls in the new Human Resources Payroll System and the new financial accounting system when the department rolled out of the Office of Shared Services. Audits were undertaken prior to the new systems going live as well as post implementation reviews. Audits of the new Tenancy Bonds System and several comprehensive licensing audits within the Building Commission Division were also undertaken covering builders, painters, adjudicators and building surveyors.
Internal Audit maintains an electronic database that captures and records all audit recommendations (internal and external) made to monitor and manage audit recommendations. The system enables officers with responsibility for actioning items to view, update and request to clear audit issues at any time. The system also produces detailed and summary reports of the audit recommendations, those overdue, and those actioned and cleared.
Risk and business continuity managementThe department continues to implement the policy, process and procedures outlined in its risk management framework, ensuring that operational areas identify and assess key risks and develop, implement and monitor risk treatment plans in accordance with the Australian and New Zealand Standard for risk management (AS/NZS 31000:2009).
The department’s business continuity plans have been developed to ensure functionality is restored to its vital business functions should a critical incident or disaster occur and have been developed in line with the Western Australian Government Business Continuity Management Guidelines. These continuity plans are supported by recovery procedures for critical information technology systems and applications and to protect department employees and customers in the event of a critical incident.
Achievements over the last 12 months include the:
• review of risk management application’s (Riskbase) alignment with departmental requirements.
• establishment of key contacts for risk management and business continuity processes in each division within the department.
Department of Commerce | Annual Report 2012-13142

• review of divisional Business Continuity plans, templates and processes to ensure that the plans are current and accurate.
• review of current risks within Riskbase to re-focus on significant risks while archiving and reducing redundant risks and normalise the risk management process at divisional level.
• establishment of regular risk management reporting to Corporate Executive to meet corporate governance requirements and align with best practice in reporting and monitoring significant departmental risks.
Other legal requirementsAdvertisingIn accordance with section 175ZE of the Electoral Act 1907 the department’s 2012-13 expenditure in relation to payments made to advertising agencies, direct mail organisations , market research organisations, polling organisations and media advertising organisations is detailed in the below table.
Table 23: Total expenditure for 2012-13
Expenditure category and organisations Total cost
Advertising Agencies $70,844
Adcorp Australia Limited $63,344
The West Australian $7,500
Media Advertising $1,500
The West Australian $1,500
Media Advertising organisations $403,461
Comada Pty Ltd $803
Mitchell and Partners Australia Pty Ltd $397,835
Mitchell Communication Group $973
West TV Limited $3,850
Market Research Organisations $8,223
Painted Dog Research Pty Ltd $8,223
Grand Total $484,028
Compliance with public sector standardsIn accordance with section 31(1) of the Public Sector Management Act 1994, I confirm:
1. In the administration of the Department of Commerce, I have complied with the Public Sector Standards in Human Resource Management, the Western Australian Public Sector Code of Ethics and the department’s Code of Conduct.
2. I have put in place procedures designed to ensure such compliance and conducted appropriate internal assessments to satisfy myself that the statement made above (in number one) is correct.
3. The applications made for breach of standards review and the corresponding outcomes for the reporting period are detailed in the following table:
Table 24: Applications for breach of standard and corresponding outcomes for 2012-13
Number
Number lodged 6
Number of breaches found (including details of multiple breaches per application) Nil
Number still under review Nil
Brian Bradley Accountable Authority 18 September 2013
Department of Commerce | Annual Report 2012-13 143

Table 25 below provides details on activities undertaken by the department relating to ensuring compliance with Public Sector Standards and ethical codes in 2012-13. This information has also been provided to the Office of the Public Sector Standards Commissioner for inclusion in the Commissioner’s Annual Compliance Report. Human resources policies and ethical codes in relation to these standards and codes are available to all employees through the department’s intranet site and online induction package.
Table 25: Activities relating to monitoring compliance with Public Sector Standards and ethical codes for 2012-13
Significant action taken to monitor and ensure compliance
Public Sector Standards
• Provided information to new employees as part of the induction program.
• Published news articles on Comm.News, the department’s intranet news service.
• Undertook internal audits and reviews.
Western Australian Public Sector Code of Ethics
• Set target for employee completion of Accountable and Ethical Decision Making training in the performance agreements for the Director General and Executive Directors.
• Ensured Executive Directors affirmed their commitment to the Western Australian Public Sector Code of Ethics as part of their performance agreement with the Director General.
• Provided information to new employees as part of the induction program.
Code of Conduct
• Provided information to new employees as part of the induction program.
• Ensured employees affirmed their commitment to the department’s Code of Conduct as part of the performance review and development system.
Disability access and inclusion outcomes
The Department of Commerce is committed to improving access and equity for all its customer groups and ensuring that people who have a disability are included, and participate, in shaping the range of services and initiatives of the department. The Disability Services Act 1993 requires that public authorities develop and implement a Disability Access and Inclusion Plan to achieve the six access and inclusion outcomes specified by the Disability Services Commission and report on these achievements.
The department’s Disability Access and Inclusion Plan 2012-16 details the department’s overarching strategies and tasks aimed at implementing improvements to access and inclusion across seven outcome areas and is compliant with legislative requirements.
Department of Commerce | Annual Report 2012-13144

Table 26 below provides a summary of how the department improved access to its services, buildings and information in accordance with the Disability Access and Inclusion Plan’s annual implementation plan.
Table 26: Disability access and inclusion outcomes for 2012-13Outcome 1 - People with disabilities have the same opportunities as other people to access the services of, and any events organised by, the relevant public authority.
• Continue to ensure agents and contractors conduct their business in a manner consistently with the legislation, the department’s Disability Access and Inclusion Plan, relevant standards and Government guidelines. The department collects and reports annually to the Disability Services Commission on contractor’s compliance with the Disability Access and Inclusion Plan.
Outcome 2 - People with disabilities have the same opportunities as other people to access the buildings and other facilities of the relevant public authority.
• Continue to ensure all new leases or renewal of existing leases take into account the needs of people with disabilities.
• A ‘building audit’ review of the Consumer Protection Division Osborne Park office was conducted and recommendations made for access improvements made to the building manager.
Outcome 3 - People with disabilities receive information from the relevant public authority in a format that will enable them to access the information as readily as other people are able to access it.
• All divisions ensure that public information is available in alternative formats upon request and that publications advertise this availability.
• Contact details to discuss access issues are available on the department’s website.
• The accessibility of the Department of Commerce website is under review.
Outcome 4 - People with disabilities receive the same level and quality of service from the staff of the relevant public authority.
• The induction of new staff includes an information sheet on the Disability Access and Inclusion Plan.
• Online induction module includes the Disability Access and Inclusion Plan.
• Carer Awareness Sessions were held for staff to raise awareness about the different needs of staff and customers who are carers.
Outcome 5 - People with disabilities have the same opportunities as other people to make complaints to the relevant public authority.
• Feedback from customers with disabilities is invited via contact details on our website.
• The Department of Commerce website advises of disability advocacy services.
Outcome 6 - People with disabilities have the same opportunities as other people to participate in any public consultation by the relevant public authority.
• Continue to seek direct comment through periodical targeted consultation on a required basis.
• Information in other formats to be made available on a required basis for targeted consultations.
Outcome 7 - People with disabilities have the same opportunities as other people to access employment with the Department of Commerce.
• Continue to ensure application packs and employment advertising is accessible to people with disabilities.
• Continue to ensure recruitment practices do not unintentionally exclude participation from people with disabilities.
Department of Commerce | Annual Report 2012-13 145

Recordkeeping plansAs specified under Section 19 of the State Records Act 2000, the Department of Commerce has an approved Recordkeeping Plan (RKP). Amendments to the RKP 2012 were approved by the State Records Commission on 30 August 2012 and were a result of functional changes to the Agency. The RKP is available to all staff via the department’s intranet.
Recordkeeping system
The department’s information management systems are a combination of business-specific information systems, and an electronic document and records management system in the form of Objective EDRMS. Together these systems are repositories for recorded information related to business transactions and activities across the department.
Evaluation of the efficiency and effectiveness of the recordkeeping systems
At the system level, qualitative and quantitative checks of Objective EDRMS are conducted on a regular basis. Monthly statistics analyse system usage and availability, storage levels and demand. Quarterly health checks, conducted by the software provider, are used for analysis, tuning and preventative activities designed to keep the underlying infrastructure working at optimal levels.
At the operational level, reporting tools are linked to key performance indicators. These and other indicators show a significant increase in the number of records captured, and usage rates at the user and agency level.
Digitisation strategy
In 2012, the Corporate Executive endorsed the Commerce Digitisation Strategy and the move to digital records management. A year after the introduction of the strategy, three million electronic records had been registered in Objective. In January 2013, this had increased by 60 per cent to five million. At the end of June 2013, there were six million.
Back-scanning projects, virtualisation and automation of paper-based business processes, use of virtual files as a default, and expansion of the
digital mail room project have contributed to a registration rate increase of 20 per cent in the last five months.
Training program
The IT training team has conducted a review of the Objective EDRMS training program. As a result, the range of online training courses has been expanded to support skills development in the area of digital records management and use of the EDRMS Application. In response to user feedback, a series of customised training sessions were developed and delivered on-site to metropolitan staff.
Mandatory recordkeeping training is scheduled weekly for all new staff. The Objective workshop includes a session on recordkeeping roles, responsibilities and obligations. ELearning tools which complement the workshop are made available on the Commerce intranet, along with published policies, standards and procedures.
Education and awareness
The presentation, delivered to regional customer service offices and inspectors at the twice-yearly conferences in Perth, focused on disaster response training using the checklists in the Records Disaster Management Plan.
News items, presentations, emails, induction handouts and the Corporate Information: Recordkeeping Essentials booklets are used to promote best practice recordkeeping. Multiple postings on the intranet news page kept the focus on the departmental Digitisation Strategy, Objective software tools and enhancements, best practice in records management and the transition to digital records management.
International Labour Organisation Convention 81: Labour InspectionsAustralia is a member nation of the International Labour Organisation. The International Labour Organisation is the peak international organisation responsible for setting international labour standards
Department of Commerce | Annual Report 2012-13146

through the development and monitoring of International Conventions and Recommendations. The Australian Government ratified International Labour Organisation Convention 81 - Labour inspections on 24 June 1975. Article 21 of Convention 81 requires certain information to be published in annual reports for each of the central inspection authorities.
In Western Australia, the Department of Commerce is the ‘central authority’ responsible for conducting labour inspections for workplace safety, and wages and conditions of employment. The reporting in this section relates to the inspection services delivered by the Labour Relations Division and the WorkSafe Division for 2012-13.
Article 21 of Convention 81 requires the department to report on a number of matters namely:
(d) Laws and regulations relevant to the work of the inspection service Legislation administered by the department is provided in the Overview section of this report. Changes to written laws during 2012-13, relevant to the work of the inspection service, are provided in Appendix 2: Changes to written laws (Table 45). The Significant Issues and Trends section of this report also provides information on issues and trends impacting the department and the inspection environment.
(e) Staff of the labour inspection service The department currently employs 18 industrial inspectors in the Labour Relations Division. The WorkSafe Division has a FTE complement of 103 inspectorate positions.
(f) Statistics of workplaces liable to inspection and the number of workers employed There were a total of 221,918 businesses operating in the 2011-12 financial year liable for inspection by Western Australia’s workplace inspectors according to the Australian Bureau of Statistics - Counts of Australian Businesses, including Entries and Exits (June 2008 to June 2012) 8165.0. These businesses employed an estimated 1.270 million employees during 2011-12 rising to an estimated 1.314 million in 2012-13
(figures are rounded) according to the Australian Bureau of Statistics Labour Force Australia, Quarterly (May 2013) 6291.0.55.003 (table 5).
(g) Statistics of inspections visits During 2012-13, the Labour Relations Division undertook 146 inspection visits and the WorkSafe Division undertook 8,794 physical workplace visits including repeat visits.
(h) Statistics of violations and penalties imposed Information on the number of violations and penalties imposed is provided in Appendix 3: Prosecutions section of this report. Details of prosecutions for the Labour Relations Division are published in Table 59 and prosecutions for the WorkSafe Division are published in Table 60. Details of improvement and prohibition notices for the WorkSafe Division are published in Tables 62 to 64. Of the 60 employers inspected by the Labour Relations Division, 246 separate breaches of awards, agreements or legislation were identified and as a result two prosecutions were undertaken and one penalty imposed.
(i) Statistics of industrial accidents and occupational diseases The lost time injury and disease (LTI/D) frequency rate is the principal measure of safety performance in Western Australia, and is also used to monitor performance against national targets. The frequency rate is calculated using the formula: Number of LTI/D divided by number of hours worked multiplied by 1,000,000. A lost time work-related injury or disease is counted where there is at least one complete day or shift off work. Information on work-related injury or disease frequency rates for Western Australia is provided in the Agency Performance (Operational Highlights) section of this report. Information on disease groups that are being monitored at a national level are contained in the Safe Work Australia publication, Occupational Disease Indicators. A copy of the publication can be accessed on the Safe Work Australia website.
Department of Commerce | Annual Report 2012-13 147

Agency speci�c reportingConstruction Contracts Act 2004The Construction Contracts Act 2004 provides for a rapid independent adjudication to resolve payment disputes associated with construction contracts, whether they are written or verbal. A decision is made on the information available and can be enforced as if it was an order of the court. This process does not inhibit parties from seeking other legal remedies but this process cannot be used if the dispute is the subject of an order, judgement or other finding dealing with the matter.
Credit (Administration) Act 1984The Credit (Administration) Act 1984 (the CA Act) sets out a licensing regime for individuals providing credit regulated in Western Australia by the Credit Act 1984 or Consumer Credit (Western Australia) Code (the Code). The Commissioner for Consumer Protection (the Commissioner) was the responsible licensing authority under this Act.
On 1 July 2010 responsibility for regulation of credit was transferred to the Commonwealth Government, specifically the Australian Securities and Investment Commission (ASIC). From 1 July 2010 the department’s responsibilities in relation to credit regulation ceased other than to conclude one matter on foot before the Courts. This matter was concluded in 2011-12.
Since 1 July 2010, credit providers have been licensed by ASIC. Section 60(2) of the CA Act requires the Commissioner to report on a number of prescribed matters but as these matters now fall under the responsibility of the Commonwealth Government there are no matters to report.
Debt Collectors Licensing Act 1964
The Debt Collectors Licensing Act 1964 (the DCL Act) sets out a licensing regime for debt collectors and prescribes procedures for the handling of trust account money. The Commissioner for Consumer Protection (the Commissioner) is the responsible licensing authority under the DCL Act.
As at 30 June 2013, there were 77 licensed debt collectors operating in Western Australia. Over the course of the year, 13 licences expired or were surrendered, 13 new licences were granted and 65 licences were renewed.
Department of Commerce | Annual Report 2012-13148

Three investigations were closed this financial year. Of these investigations, two did not detect an offence and one debt collector was provided with an administrative warning.
Where a complaint is received about the conduct of a debt collector that cannot be treated as a breach of the DCL Act, it may be dealt with as a potential breach of other legislation including the Fair Trading Act 2010 and the Australian Consumer Law (WA).
On occasions when a serious breach of these Acts is established, the Commissioner is empowered to make an allegation to the State Administrative Tribunal that a licensee is not a fit and proper person to hold a licence under the DCL Act; no issues of this nature have arisen during the past financial year.
Section 12A of the DCL Act requires the Commissioner to report on a number of matters namely:
(a) the number, nature and outcome of –
(i) investigations and inquiries undertaken by, or at the direction of, the Commissioner for the purposes of this Act;
Table 27: Debt Collectors Licensing Act 1964: Investigation summary for 2012-13
Licensing issues
relating directly to the
DCL Act
Conduct issues
Conciliations generally
concerning confirmation of whether debt
owed
Total
Number ongoing as at 1 July 2012
2 1 1 4
Number commenced 0 1 6 7
Number concluded 2 1 7 10
Number ongoing as at 30 June 2013
0 1 0 1
Of the 10 matters concluded in 2012-13, the following outcomes were recorded:
• one agreement was reached;
• eight resulted in no action being taken including complaints lapsed or withdrawn; and
• one administrative warning was issued.
(ii) matters that have been brought before the State Administrative Tribunal under this Act; There were no matters brought before the State Administrative Tribunal.
(b) the number and nature of matters referred to in paragraph (a) that are outstanding; One matter in paragraph (a) is outstanding. This is an investigation concerning a possible breach of s29(1) of the Australian Consumer Law (WA), misrepresenting the need for a service.
(c) any trends or special problems that may have emerged; There were no significant trends that were identified this financial year. Matters investigated related to alleged unlicensed activity and issues with the management of trust accounts.
(d) forecasts of the workload of the Commissioner in performing functions under this Act in the year after the year to which the report relates; and There are no known significant issues that will affect a change in workload in this area of activity.
(e) any proposals for improving the performance of the Commissioner’s functions under this Act. The department is awaiting progress of national consumer credit reform on the future of debt collector licensing and management in Australia.
Department of Commerce | Annual Report 2012-13 149

Electricity Act 1945Section 33 of the Electricity Act 1945 requires the Director of Energy Safety (the Director) to report on a number of matters, namely:
(a) in relation to the discipline of electrical licensees, the number, nature, and outcome, of the:
(i) investigations and inquiries undertaken under this Act by, or at the direction of, the Director; and
Table 28: The following numbers of investigations were concluded in 2012-13
Nature Number
Breach Investigations 557
Network Operator Incidents * 303
Network Operator - Fires 8
Electrical Accident - Fire * 10
Electrical Accident - Injury 37
Report of Electrical Shock 6
Total 921
Investigations outcome Number
Formal Warning 150
Infringement 7
Prosecution 66
Lapsed Prosecutions 112Note: Compliance actions may take more than one year to complete. Some prosecutions
recorded above may relate to investigations carried out in an earlier year.
(ii) matters undertaken by the Director that have been brought before the State Administrative Tribunal under this Act by the Director;
There were no such matters.
Department of Commerce | Annual Report 2012-13150

(b) the number and nature of matters referred to in paragraph (a) that are outstanding;
Table 29: Number and nature of matters
Nature Number
Breach Investigations 197
Network Operator Incidents * 59
Network Operator - Fires 3
Electrical Accident - Fire * 2
Electrical Accident - Injury 14
Report of Electrical Shock 0
Total 275*Excludes Network Operator fires.
(c) any trends or special problems that may have emerged; Network operators have not previously reported the number and nature of public safety-related incidents caused by their network assets. The principal incidents of concern include: wooden power poles falling, overhead conductors falling, pole-top fires, conductors clashing and incorrect connections to customer premises causing polarity reversal. During the year, the Director has assisted Western Power to prepare a quarterly public safety report recording such incidents. The report format and content are nearing completion and it is expected to be published on Western Power’s website.
(d) forecasts of the workload of the Director in performing functions under this Act in the year after the year to which the report relates; and For several years the Director has been unable to adequately investigate the number of electrical safety incidents caused by electricians failing to comply with standards and regulations applicable to their work. The upward trend of such incidents continues and an investigation backlog is steadily growing. Some electrical contractors and electricians committing serious breaches of regulations are not prosecuted because
the resources available to the Director are insufficient to complete investigations within the two year statutory limitations period. Since the creation of Western Power Corporation in 2006, the Director has been required to commit an increasing proportion of his inspection and investigation resources to network-related safety incidents, mentioned in (c). The investigations and any resultant prosecutions tend to be complex and heavily consume inspection resources, therefore the Director has been unable to adequately investigate a number of electrical safety incidents caused by electricians failing to comply with standards and regulations applicable to their work. The number of outstanding investigations shown in (b) is a concern and will be addressed in development of future business plans.
(e) any proposals for improving the performance of the Director’s functions under this Act. The high demand for electricians in the resources sector during the mining and petroleum construction boom hampered attempts to recruit suitable candidates as electrical inspectors. The remuneration offered was not attractive compared with private sector rates of pay. However, as the intensity of the boom has declined over the past six to twelve months, there has been greater interest from experienced electricians and electrical contractors in joining EnergySafety Division. This should enable the filling of some vacancies. However, it is unlikely to be sufficient to deal with the investigation backlog or to prevent its growth. The proportion of new electrical installations found, upon inspection, to have defects is not diminishing, despite efforts to inform electricians about their responsibilities through, among other means, EnergySafety Division’s quarterly ‘Energy Bulletin’. Licensing functions will alter significantly if the Government decides to adopt the National Occupational Licensing System. Legislation changes will be required and new administrative processes will have to be developed requiring, among other things, major changes to IT systems.
Department of Commerce | Annual Report 2012-13 151

Employment Agents Act 1976The Department of Commerce administers a range of functions under the Employment Agents Act 1976 (the EA Act) including the granting and renewal of licences, compliance activities and a range of education and advisory services. The Consumer Protection Division undertakes the conciliation of disputes involving employment agents and consumers. As at 30 June 2013, there were 689 licensed employment agents operating in Western Australia. Over the course of the year, 30 licences expired and an additional 14 were surrendered, 158 licences were renewed and 93 new licences were granted.
Section 10A of the EA Act requires the Commissioner for Consumer Protection (the Commissioner) to report on a number of matters namely:
(a) the number, nature and outcome of –
(i) investigations and inquiries undertaken by, or at the direction of, the Commissioner for the purposes of this Act; During 2012-13, the department completed 10 investigations related to employment licence holders, unlicensed activities or conduct issues. Seven investigations were regarding alleged unlicensed activity. Of these investigations, two employment agents were issued with an administrative warning, two applied for and were granted a licence and three were provided with information and advice. One investigation file was opened due to alleged misleading conduct. This was referred to another consumer protection agency in a different state. One investigation file related to the scale of fees not being displayed. The employment agent was issued with an administrative warning. There was no offence detected for the one remaining matter.
Department of Commerce | Annual Report 2012-13152

Table 30: Employment Agents Act 1976: Investigations and inquiries in 2012-13
Employment agent licence
holder or unlicensed
activity
Conduct issues Conciliations Total
Number ongoing as at 1 July 2012
5 1 0 6
Number commenced 4 2 7 13
Number concluded 8 2 7 17
Number ongoing as at 30 June 2013
1 1 0 2
Of the 17 matters concluded in 2012-13, the following outcomes were recorded:
• Two agreements were reached;
• Four were provided with education or advice;
• Eight resulted in no action being taken including complaints lapsed or withdrawn or no offence being detected; and
• Three administrative warnings were issued.
(ii) matters that have been brought before the State Administrative Tribunal under this Act; There were no matters brought before the State Administrative Tribunal under this Act.
(b) the number and nature of matters referred to in paragraph (a) that are outstanding;
There is currently one investigation matter and one compliance matter outstanding. The investigation matter relates to alleged misleading conduct and the compliance matter is due to alleged unlicensed activities.
(c) any trends or special problems that may have emerged; During 2011-12, the main allegations were concerning unlicensed agents and agents not displaying their schedule of fees. This financial year, unlicensed activity was again the main issue however there were also two instances of alleged misleading conduct.
(d) forecasts of the workload of the Commissioner in performing functions under this Act in the year after the year to which the report relates; and No significant issues or trends have been identified that might lead to a change in the workload during 2013-14.
(e) any proposals for improving the performance of the Commissioner’s functions under this Act. The Consumer Protection Division will continue with its proactive program.
Department of Commerce | Annual Report 2012-13 153

Gas Standards Act 1972Section 13CA of the Gas Standards Act 1972 requires the Director of Energy Safety (the Director) to report on a number of matters, namely:
(a) in relation to the discipline of holders of gasfitting permits and authorisations, the number, nature, and outcome, of the -
(i) investigations and inquiries undertaken under this Act by, or at the direction of, the Director.
Table 31: The following investigations were concluded in 2012-13
Nature Number
Breach Investigations 614
Incident Investigation 46
Accident injury - Public 10
Accident injury - Worker 4
Fatal 1
Total 675
Investigations outcome Number
Formal warning 103
Infringement 71
Prosecution 5
Lapsed prosecutions Nil
Appeals (Notice of Defects) 5
Cancelled (Notice of Defects) 24
Verbal Warning 348
No Further Action 68
(ii) matters undertaken by the Director and referred to the State Administrative Tribunal under this Act by the Director;
Department of Commerce | Annual Report 2012-13154

There were no such matters.
(b) the number and nature of matters referred to in paragraph (a) that are outstanding;
Table 32: Number and nature of matters
Nature Number
Breach investigation 4
Incident investigation (fatal) 0
Accident injury - Public 0
Accident injury - Worker 0
Fatal 0
Total 4
(c) any trends or special problems that may have emerged;
(i) A small number of gas fitters continue to fail to submit Notices of Completion upon the completion of gasfitting work, which is reflected in the numbers of infringements and warnings issued.
(ii) There is concern at the lack of core training competencies demonstrated by apprentices. Skill levels of apprentices having completed a shortened apprenticeship have declined over the past several years. The EnergySafety Division has audited the Registered Training Organisations addressing the national Core Competencies relating to gasfitting. Feedback has been positive.
(iii) Commissioning and servicing of basic gas appliances does not appear to be tested during the apprenticeship period and without these fundamental skills being taught, EnergySafety Division will continue to receive reports of non-compliance and incorrect installations. One RTO has addressed this issue by completing a servicing course. Gas appliance manufacturers are keen to promote appliance servicing courses and are looking to partner with RTOs.
(iv) There is evidence to suggest that few apprentices have the necessary restricted gasfitting permit, resulting in apprentices undertaking gasfitting work that is a breach of the regulations. EnergySafety now provides safety orientated presentations to all gasfitting apprentices at all relevant colleges. Since the inception of this, there has been a noted increase in the numbers of apprentices obtaining restricted gasfitting permits.
(v) Gas fitters who obtain a gasfitting permit under mutual recognition are not required to demonstrate knowledge of the Western Australian gas legislation. This has resulted in significant numbers of gas fitters being issued a Notice of Defect for not submitting a Notice of Completion after completing gasfitting work.
(d) forecasts of the workload of the Director in performing functions under this Act in the year after the year to which the report relates relating to licensing discipline matters; and One serious gas supply event and another major investigation into a discipline matter has consumed the majority of inspection resources in the gas directorate, resulting in the inability of the Director to have a significant presence in major regions of the State. As the investigations draw to a conclusion, it will release resources to undertake this vital work.
(e) any proposals for improving the performance of the Director’s functions under this Act. EnergySafety will explore the possibility of the Director being able to suspend or cancel a gasfitting permit where evidence suggests a person is not competent. This may lead to a requirement for retraining and further assessment of competence to be undertaken prior to regaining the permit.
Department of Commerce | Annual Report 2012-13 155

Land Valuers Licensing Act 1978The department administers a range of functions under the Land Valuers Licensing Act 1978 (the LV Act) including the granting and renewal of licences, compliance activities and a range of education and advisory services. As at 30 June 2013, there were 799 licensed land valuers in Western Australia. Over the course of the year, 23 licences expired, 92 licences were renewed and 58 new licences were granted.
Section 31 of the LV Act requires the Chief Executive Officer of the department to report on a number of matters namely:
(a) The number, nature and outcome of:
(i) investigations and inquiries undertaken by, or at the direction of, the Commissioner for the purposes of this Act; During the year, four complaints were received mostly relating to valuation practices. Investigations focused on valuers’ application of proper practices and principles of valuation rather than the actual valuation figure.
Table 33: Land Valuers Licensing Act 1978: Investigations and inquiries in 2012-13
Issues concerning valuation practices
Issues relating to fees and charges
Licensing issues Total
Number ongoing as at 1 July 2012
3 0 0 3
Number commenced 3 0 1 4
Number concluded 4 0 0 4
Number ongoing as at 30 June 2013
2 0 1 3
Department of Commerce | Annual Report 2012-13156

Of the four matters concluded during the year: one resulted in an education or advice letter, two resulted in no action being taken as a result of no offence being detected or other reasons and one complaint was not within the department’s jurisdiction.
The department continued a proactive compliance program introduced in 2011-12 for licensed land valuers. The proactive compliance program aims to assist land valuers in complying with legislative requirements, identify and rectify areas of risk, and provide general advice to licensees on complying with legislative requirements. This financial year, the department visited 44 valuers. Some common issues identified on proactive visits included land valuers not obtaining title searches for residential properties, and not clarifying client instructions as to the basis of the valuation.
(ii) matters that have been brought before the State Administrative Tribunal under this Act; No matters were brought before the State Administrative Tribunal under this Act. However, Consumer Protection Division took disciplinary action against a sales representative under the Real Estate and Business Agents Act 1978 after he submitted an application which contained forged signatures. The sales representative was disqualified from holding registration as a real estate sales representative for two years and fined $1,000 by the State Administrative Tribunal. In a subsequent Order, the State Administrative Tribunal disqualified him from holding a land valuer’s licence for one year on the basis that he was not a fit and proper person to hold such a licence.
(b) the number and nature of matters referred to in paragraph (a) that are outstanding; There were three complaints outstanding at 30 June 2013 in relation to issues concerning valuation practices and advertising and marketing.
(c) any trends or special problems that may have emerged; There were no specific trends or special problems that have emerged in the land valuation industry however any common issues identified on
proactive visits are being addressed in newsletters and e-bulletins to industry. Department officers are also addressing these issues at risk management training sessions run by the Property Institute of Australia. A common issue of not obtaining title searches for residential properties and a land valuer’s obligation to determine and verify pertinent facts through a Certificate of Title has been addressed during proactive visits and will be addressed in a future newsletter article highlighting obligations under the Code of Conduct and Fair Trading Act 2010.
(d) forecasts of the workload of the Commissioner in performing functions under this Act in the year after the year to which the report relates; and The Commissioner will continue to conduct the licensing of land valuers and related compliance matters. The proactive compliance program will continue, with an aim to visit all land valuers every three years. The department will continue to use newsletters and e-bulletins to communicate updates to the industry.
(e) any proposals for improving the performance of the Commissioner’s functions under this Act. The department commenced a broad review of the Code of Conduct and welcomed submissions on potential amendments to the Code. In May 2013 a Consultation Regulatory Impact Statement - Property Industry Codes of Conduct Discussion Paper was released. The review is examining the overall effectiveness of the current Code to ensure consistency with the Australian Consumer Law, support red tape reduction and ensure principles of best practice regulation to make the Code relevant and appropriate for the current market but not be overly prescriptive.
Department of Commerce | Annual Report 2012-13 157

Motor Vehicle Dealers Act 1973The department administers a range of functions under the Motor Vehicle Dealers Act 1973 (the MVD Act) including the granting and renewal of licences, compliance activities and a range of education and advisory services.
Section 51 of the MVD Act requires the Chief Executive Officer of the department to report on a number of matters namely:
(a) the number, nature and outcome of:
(i) investigations and inquiries undertaken by, or at the direction of, the Commissioner for the purposes of this Act;
Table 34: Motor Vehicle Dealers Act 1973: Investigations and inquiries in 2012-13
Issues concerning unlicensed activities
General breaches Conciliation Total
Number ongoing as at 1 July 2012
43 27 92 162
Number commenced 63 59 936 1,058
Number concluded 78 72 937 1,087
Number ongoing as at 30 June 2013
28 14 91 133
Note: Conciliations are conducted at the direction of the Commissioner for Consumer Protection, under the Fair Trading Act 2010. Data reported relates to conciliations involving licensed motor vehicle dealers only.
Department of Commerce | Annual Report 2012-13158

Table 35: The outcomes for the matters concluded were as follows:
Compliance and Investigations Number
Corrective/educational advice 44
Administrative warning 41
Prosecution action approved/brief completed 9
Licence granted 3
Complaint referred 1
Agreement reached to settle 1
Fine/penalty 1
Remedial action or undertaking completed 1
No action taken due to insufficient evidence, no offence detected, not in public interest or other reasons 49
TOTAL: 150
Conciliations Number
Agreement reached between parties to settle the matter, no case to answer or education or advice given
457
No conciliated result, referral to the Magistrates Court 284
Referral to an alternate agency or dispute resolution service 67
Other 129
TOTAL: 937
(ii) matters that have been brought before the State Administrative Tribunal by the Commissioner; There were no matters brought before the State Administrative Tribunal by the Commissioner.
(b) the number and nature of matters referred to in paragraph (a) that are outstanding;
Most of the 91 conciliation matters ongoing as at 30 June 2013 related to disputes regarding vehicle purchase contracts and warranties, closely followed by complaints regarding overcharging, and the provision of unsatisfactory products and/or services. Of the 42 compliance and investigation matters ongoing as at 30 June 2013, 28 related to investigations of unlicensed activities. The remaining 14 matters concerned general breaches such as misleading conduct, incorrect pricing and trust accounting issues.
(c) any trends or special problems that may have emerged; During 2012-13 there was an increase in calls and complaints concerning faulty engines and transmissions of Volkswagen (VW) motor vehicles. A number of faults have been recorded Australia-wide resulting in VW Australia carrying out repairs under the manufacturer’s warranty. However, VW Australia have stated that, whilst they will honour a two year warranty on any vehicles where the engine and/or transmission has been repaired, they will refuse any claims for subsequent failure outside this, or the original, warranty period. A recall was announced by VW Australia in June 2013 to address transmission problems; however this does not address the serious problems being experienced due to engine failure. This matter is being monitored by the Australian Competition and Consumer Commission and the department. During 2012-13 the department continued its motor vehicle dealer proactive compliance program. Changes were made to the program in order to address a potential risk identified in the transitional provisions of the MVD Act during the transfer of functions from the Motor Vehicle Industry Board to the Commissioner for Consumer Protection. It was identified that proactive officers were no longer ‘authorised persons’ under the MVD Act, and therefore unable to issue infringement notices. Without this authorisation officers were also no longer able to attend the premises of motor vehicle dealers to inspect the register, and any vehicles displayed for sale, without it being on a voluntary basis.
Department of Commerce | Annual Report 2012-13 159

As such, a procedure was introduced whereby proactive officers make appointments with licensees prior to the visit. These procedures are likely to be in place until the legislation can be amended. Changes to the Motor Vehicle Dealers Prescribed Vehicle Regulations 1974, introduced in October 2012, also saw a revision of the vehicles included under the definition of ‘vehicle’ in accordance with the Act. The main amendments included the change in definition of the term ‘caravan’ to include ‘camper trailers’, as well as the replacement of the term ‘motor wagon’ with ‘goods vehicle’.
(d) forecasts of the workload of the Commissioner in the year after the year to which the report relates; and The introduction of the online complaint form led to a marked increase in the lodgement of conciliations during the latter half of the financial year. This trend has maintained at a steady level and is expected to continue in 2013-14.
(e) any proposals for improving the performance of the Commissioner’s functions. It is intended that a review of the MVD Act will commence in 2013-14.
Department of Commerce | Annual Report 2012-13160

Real Estate and Business Agents Act 1978The department administers a range of functions under the Real Estate and Business Agents Act 1978 (the RE Act) including the granting and renewal of licences, compliance activities and a range of education and advisory services. As at 30 June 2013, there were 4,383 licensed real estate and business agents who held a current triennial certificate and 8,490 sales representatives registered in Western Australia.
Over the course of the year, 185 triennial certificates expired and an additional 26 were surrendered, 1,479 triennial certificates were renewed and 325 new licences were granted. During this same time, 1,279 sales registrations expired and an additional 21 were surrendered, 1,509 registrations were renewed and 1,423 new registrations were granted. Section 135 of the RE Act requires the Chief Executive Officer of the department to report on a number of matters namely:
(a) the number, nature and outcome of:
(i) investigations and inquiries undertaken by, or at the direction of, the Commissioner; The department examined a range of general compliance issues during the year, as well as financial compliance issues. Matters investigated included alleged trust account breaches, claims about unlicensed or unregistered activity, advertising and marketing, fitness to hold a licence or registration, property management fees and charges, professional conduct and late bond lodgements.
Table 36: Real Estate and Business Agents Act 1978: Investigations and inquiries in 2012-13
General compliance
issues
Financial compliance
issuesConciliations Total
Number ongoing as at 1 July 2012
217 29 10 256
Number commenced 577 268 188 1,033
Number concluded 578 253 173 1,004
Number ongoing as at 30 June 2013
216 44 25 285
Of the 831 compliance matters concluded during the year, the following outcomes were recorded: 468 complaints resulted in no action due to there being no offence or other reasons; 225 education or advice letters were sent; 80 warning letters were issued; 26 matters were referred to another agency; three complaints related to briefs for disciplinary proceedings before the State Administrative Tribunal; 10 complaints related to briefs for prosecution; seven complainants were advised to seek civil resolution; one complaint was transferred to conciliation; and 11 complaints were withdrawn or lapsed.
During the financial year, the Commissioner took action in the Magistrates Court against four real estate agents for lodging bonds outside of the timeframe prescribed by the Residential Tenancies Act 1987. All four agents received fines and were ordered to pay the department’s costs. Where any other prosecution matters have been finalised, the outcomes are detailed in Appendix 3: Prosecutions.
The department continued its proactive compliance program that aims to assist agents in complying with legislative requirements, to identify and rectify areas of risk, and provide advice and support to agents in an effort to
Department of Commerce | Annual Report 2012-13 161

avert operational problems. The program encourages high levels of industry best practice. This financial year, the department completed 635 proactive visits, with no major systemic issues identified. Some of the more common issues proactive officers provided guidance on during the year included process for dealing with unclaimed monies, process for identifying clients who are a priority limited entity, trust accounts not being reconciled at the end of the month, late renewals of triennial certificate and registrations, poorly written contractual conditions and late bond lodgements. Proactive officers also provided education to agents and property managers regarding upcoming changes to the Residential Tenancies Act 1987 that came into effect on 1 July 2013.
The department also administers the Real Estate and Business Agents Fidelity Guarantee Account (REBA Fidelity Account). The purpose of the REBA Fidelity Account is to provide financial reimbursement to people who suffer pecuniary loss or loss of property through any defalcation by a licensee who holds a triennial certificate, in the course of the business of that licensee. This also includes the actions of the licensee’s employees.
During the year, 11 new claims were lodged against the REBA Fidelity Account and 33 claims were finalised. 28 of these claims were allowed or partially allowed, two were disallowed and three were withdrawn. The 28 claims allowed a total value of $1,774,744.60 to be reimbursed and $20,305.74 reimbursed for legal costs. At 30 June 2013, there were 45 claims outstanding against the account with a total provisional value of $8,765,284.59, which does not include legal costs or claims for interest.
Of the 173 conciliations concluded during the year, the following outcomes were recorded: 57 resulted in agreement between parties to settle the matter; three were referred to another agency or dispute resolution service; 21 complaints lapsed or were withdrawn and 92 complaints were unable to be conciliated due to a variety of reasons such as an inability to reach an agreement due to differing views between parties or an inability to contact one of the parties involved. As the nature of disputes is ultimately a civil matter, where a resolution could not be reached through conciliation, the complainants were advised of the option of taking their complaint to the Magistrates Court.
Department of Commerce | Annual Report 2012-13162
(ii) matters that have been brought before the State Administrative Tribunal under this Act; This financial year, there were 11 matters before the State Administrative Tribunal under the RE Act. Nine of these matters were finalised. The department took disciplinary action under the RE Act for various matters such as contravening the Code of Conduct by dishonestly keeping clients’ money intended for property advertising or repairs and failing to disclose to a buyer that there was ongoing legal action that directly involved the unit strata company. A real estate salesman and land valuer was also disqualified and fined, after submitting an application with Consumer Protection Division which contained forged signatures.
(iii) matters that have been dealt with through the conciliation process under this Act; The department dealt with a range of matters in conciliation during the year, including disputes about obtaining and providing information, giving inadequate/incorrect advice or failing to ascertain pertinent facts; and property management related complaints in relation to fees and charges, bond matters, failure to inspect and contractual disputes.
(b) the number and nature of matters referred to in paragraph (a) that are outstanding; As at 30 June 2013, there were 260 compliance matters outstanding. These matters concern issues such as unlicensed or unregistered activity, advertising and marketing, misleading or deceptive conduct, and audit and trust account matters. As at 30 June 2013, there were seven matters before the State Administrative Tribunal under the RE Act that have not been finalised, as detailed in Appendix 3: Prosecutions. The majority of the 25 conciliations outstanding at 30 June 2013 were regarding property management.
(c) any trends or special problems that may have emerged; The property industry continued to be targeted by people attempting
to fraudulently sell property in Western Australia. In October 2012 and February 2013 Consumer Protection Division alerted the industry about recent attempts that re-emphasised the need for real estate agents, sales representatives and property managers to follow the Client Identification Guidance Notes issued by the Commissioner for Consumer Protection in November 2011. Scammers clearly continue to target the property management sections of agencies in an attempt to perpetrate the frauds. Along with keeping the industry alert through e-bulletins and newsletter articles, proactive officers continue to check that agents have the necessary processes in place to ensure agents are complying with the identification verification measures now in place and property management sections of agencies have adequate procedures to verify the owner’s details. This financial year the department has had an increased focus on unlicensed and unregistered activity in the real estate industry and has completed investigations into 79 complaints about potential unlicensed or unregistered activity as compared to 26 complaints in 2011-12. Aspects of unlicensed activity are also evident in several purchase option/mediated vendor finance schemes that Consumer Protection Division has examined. The department has filed two separate civil pecuniary proceedings in the Supreme Court against five entities, alleging unlicensed real estate transactions under s26 of the RE Act and false or misleading statements pursuant to s30(1) of the Australian Consumer Law relating to the purchase/sale of residences using a ‘purchase option/mediated vendor finance’ scheme. Interim injunctions have been granted restricting the actions of the entities until the matters are fully heard. In May 2013 the Commissioner urged potential investors who may be lured into attending so-called ‘free’ property investment and wealth creation seminars to carefully consider what’s being offered before signing any contracts. The department has also utilised the powers under s219 of the Australian Consumer Law to require a national promoter and spruiker of a ‘purchase option/mediated vendor finance’ scheme to substantiate the material advertised online and the material taught and offered for purchase at seminars around Australia.
Department of Commerce | Annual Report 2012-13 163
(d) forecasts of the workload of the Commissioner in the year after the year to which the report relates; and The Commissioner will continue to manage the licensing of real estate and business agents and sales representatives, related compliance matters and the provision of education and advisory support to industry and consumers. A quarterly newsletter for real estate agents, and regular e-bulletins are produced, keeping agents and other interested industry participants informed on issues relevant to the real estate industry. Significant amendments to the Residential Tenancies Act 1987 that came into effect on 1 July 2013 are likely to result in an increase in enquiries and potential complaints in 2013-14. The department will continue to educate the real estate industry and highlight any matters that require clarification online and in future e-bulletins and newsletters.
(e) any proposals for improving the operation of the Commissioner. The department commenced a broad review of the Code of Conduct and welcomed submissions on potential amendments to the Code. In May 2013 a Consultation Regulatory Impact Statement - Property Industry Codes of Conduct Discussion Paper was released. The review is examining the overall effectiveness of the current Code to ensure consistency with the Australian Consumer Law, support red tape reduction and ensure principles of best practice regulation to make the Code relevant and appropriate for the current market but not be overly prescriptive. The department also plans to utilise infringement notices as an alternative compliance method for potential offences under the RE Act and the Residential Tenancies Act 1987.
Department of Commerce | Annual Report 2012-13164

Retirement Villages Act 1992The Retirement Villages Act 1992 (the RV Act) was established to regulate retirement villages and the rights of residents in such villages. The Commissioner for Consumer Protection is responsible for several functions under this Act, including compliance activities and the conciliation of disputes between residents and retirement village owners.
In 2012-13 the department has been developing regulations, in consultation with key stakeholders, to support the commencement of the Retirement Villages Amendment Act 2012 (the Amendment Act), which passed through the Parliament in October 2012. The Amendment Act and its supporting regulations are intended to commence in early 2014, to improve practices relating to the informational, contractual and financial wellbeing of retirement village residents and provide early remedies to some of the major issues facing retirement village residents.
Consumer Protection Division also released a Discussion Paper on 13 June 2013, which outlines proposed changes to the Code of Practice that regulates retirement villages in Western Australia. The proposed changes are aimed at accommodating the Amendment Act and its regulations, and implementing further recommendations of the statutory review of the legislation, which was tabled in the Parliament in November 2010. The Code is a vital component of the laws ensuring good management practices in the retirement village industry – it defines the rights and obligations of retirement village residents and operators in relation to contracts, consultation, dispute resolution and operational and financial management. A second major phase of amendments to the RV Act is intended to progress in 2014, to implement the remaining statutory review recommendations that require legislative change.
This financial year, the department conciliated or investigated 42 complaints relating to retirement villages. These complaints reflected a diverse range of matters including issues about fees, rates and charges, dispute resolution processes, the meaning of contract terms, disclosure and provision of information, construction of facilities and maintenance, marketing, sale of units, and budget expenditures.
The department has continued with the retirement village proactive compliance program which commenced in 2008, to encourage retirement village operators to comply with the requirements set out in the RV Act. The aim of this program is to provide assistance to retirement villages where issues of non-compliance are identified. As part of the program proactive compliance officers also meet with representatives of village residents committees and discuss any issues that the residents may have with village management. This financial year Consumer Protection Division visited 89 retirement villages, with no major issues or trends identified. Proactive officers provided guidance on rectifying issues such as the formation of residents’ committees and complex terms in contracts.
During May and June 2013, several departmental officers spoke at public seminars arranged by the Western Australian Retirement Villages Residents Association Incorporated (WARVRA). Officers provided information about some of the proposed changes in retirement village legislation, retirement village budgets and how to resolve disputes. Retirement village residents were also able to ask senior departmental officers questions regarding any specific concerns they had with their village. The Consumer Protection Division also operates the Seniors’ Housing Centre in partnership with the Council on the Ageing Western Australia providing a range of free advice and information to consumers on their retirement housing options.
Department of Commerce | Annual Report 2012-13 165

Settlement Agents Act 1981The department administers a range of functions under the Settlement Agents Act 1981 (the SA Act) including the granting and renewal of licences, compliance activities and a range of education and advisory services. As at 30 June 2013, there were 762 licensed settlement agents who held a current triennial certificate in Western Australia. Over the course of the year, 29 triennial certificates expired and an additional 17 were surrendered, 272 triennial certificates were renewed and 25 new licences were granted.
Section 112 of the SA Act requires the Chief Executive Officer of the department to report on a number of matters namely:
(a) the number, nature and outcome of:
(i) investigations and inquiries undertaken by, or at the direction of, the Commissioner; The department examined a range of general and financial compliance issues. Matters investigated included alleged audit and trust account breaches and claims about professional conduct, failing to act in accordance with instructions, failing to act in best interest of a principal and unlicensed activity.
Table 37: Settlement Agents Act 1981: Investigations and inquiries in 2012-13
General compliance
issues
Financial compliance
issuesTotal
Number ongoing as at 1 July 2012 20 2 22
Number commenced 47 42 89
Number concluded 52 44 96
Number ongoing as at 30 June 2013 15 0 15
Of the 96 compliance matters concluded during the year, the following outcomes were recorded: 68 complaints resulted in no action due to no offence being detected or other reasons, 10 education or advice letters were sent, four
Department of Commerce | Annual Report 2012-13166

warning letters were issued, four complaints were referred to another agency, seven complaints related to briefs for disciplinary proceedings or prosecution action and three complainants were advised to seek civil resolution.
The department continued its proactive compliance program that aims to assist agents in complying with legislative requirements, to identify and rectify areas of risk and provide advice and support to agents in an effort to avert operational problems. The program encourages high levels of industry best practice. This financial year the department completed 49 proactive visits. Some of the more common issues identified included agencies not conducting searches as soon as practicable after receiving instructions to act, or prior to a deal settling when acting for the buyer; agencies not ensuring correct procedures for completing Form 1 Appointment to Act, and client elections not being clearly made; and agency correspondence and documents failing to state “Licensed Settlement Agent” and the required name of the triennial certificate holder, registered business name and business address.
The department also administers the Settlement Agents Fidelity Guarantee Account (SA Fidelity Account). The purpose of the SA Fidelity Account is to provide financial reimbursement to people who suffer pecuniary loss or loss of property through any defalcation by a licensee who holds a triennial certificate, in the course of the business of that licensee. This also includes the actions of the licensee’s employees.
During the year, no new claims were lodged against the SA Fidelity Account. Twenty-two claims were finalised. All of these claims were allowed with a total value of $959,380.95 reimbursed and $20,581.70 reimbursed for legal costs. There were no claims disallowed (not including legal costs or claims for interest). As at 30 June 2013, there was one claim outstanding against the account with a total provisional value of $1,051.55.
(ii) matters that have been brought before the State Administrative Tribunal under this Act; This financial year, one matter brought before the State Administrative Tribunal under the SA Act was finalised. In July 2012 the State Administrative Tribunal found an Embleton settlement agent to have mishandled funds received from a client. The agent
was fined $3,000 and her licence has been put on hold for two years. Consumer Protection Division took disciplinary action against Deanne Jean Tabone, operating as DT Property Settlements, when she failed to immediately deposit funds from the settlement of a property into a proper trust account in February 2010. There were three other matters relating to the SA Act brought before the Magistrates Court. As at 30 June 2013 one matter was not finalised yet and two settlement agents were convicted and fined as outlined below. In April 2013 a Karrinyup settlement agent who represented that she was a licensed settlement agent after her triennial certificate had lapsed was fined $4,000 by the Perth Magistrates Court. Michelle Louise Owen, trading as Swan River Conveyancing, pleaded guilty on 8 April 2013 to 11 charges relating to misrepresentations made during the settlement of three properties in Wembley Downs, East Fremantle and Balga. The agent repaid all consumers involved in the three transactions, which the Magistrate took into consideration, along with the agent’s unblemished record and personal circumstances. In June 2013, a Ballajura settlement agent, who has surrendered her licence, was fined $8,000 by the Midland Magistrates Court over the misuse of trust account funds. Natalie Jane Briggs, trading as Frontline Settlements, pleaded guilty on 20 June 2013 to 13 charges related to failures to comply with the SA Act and the agency’s inability to finalise the financial settlement of four property transactions due to the agent’s misuse of her clients’ trust money. The investigation found that vendors in the settlement of one property in 2011 were owed $49,085.86 by the agency. They were later compensated by the Settlement Agents Fidelity Guarantee Account. It also found that Ms Briggs misappropriated $36,790 lent to her by a mortgage broker. The broker was not eligible to be compensated by the Settlement Agents Fidelity Guarantee Account as the transaction was not in the course of a real estate settlement. The nature and outcome of all matters are provided in Appendix 3: Prosecutions.
Department of Commerce | Annual Report 2012-13 167

(b) the number and nature of matters referred to in paragraph (a) that are outstanding; As at 30 June 2013 there were 15 general compliance matters and no financial compliance matters outstanding. The outstanding matters relate to general breaches of legislation, unauthorised payment of monies, professional conduct, failing to act in best interest of a principal, unjust fees and unlicensed activity. As at 30 June 2013, there was one matter before the State Administrative Tribunal under the SA Act that has not been finalised, as detailed in Appendix 3: Prosecutions.
(c) any trends or special problems that may have emerged; The property industry continued to be targeted by people attempting to fraudulently sell property in Western Australia. On three occasions scammers attempted to fraudulently sell properties. In October 2012 and February 2013 Consumer Protection Division alerted the industry about recent attempts that highlighted the need for settlement agents to follow the Client Identification Guidance Notes issued by the Commissioner for Consumer Protection in November 2011. In January 2013 a six-month transitional implementation period for the Western Australian Registrar and Commissioner of Titles Joint Practice: Verification of Identity (the Practice) ended and from 2 January 2013 Landgate requires that settlement agents follow the Practice guidelines. Along with keeping the industry alert through e-bulletins and newsletter articles, proactive officers continue to check that agents have the necessary processes in place to ensure agents are complying with the identification verification measures now in place.
(d) forecasts of the workload of the Commissioner in the year after the year to which the report relates; and The Commissioner will continue to manage the licensing of real estate settlement and business settlement agents, related compliance matters and education and advisory support to industry and consumers.
(e) any proposals for improving the operation of the Commissioner. The department commenced a broad review of the Code of Conduct
Department of Commerce | Annual Report 2012-13168

and welcomed submissions on potential amendments to the Code. In May 2013 a Consultation Regulatory Impact Statement - Property Industry Codes of Conduct Discussion Paper was released. The review is examining the overall effectiveness of the current Code to ensure consistency with the Australian Consumer Law, support red tape reduction and ensure principles of best practice regulation to make the Code relevant and appropriate for the current market but not be overly prescriptive. The department also plans to utilise infringement notices as an alternative compliance method for potential offences under the SA Act.
Travel Agents Act 1985The department administers a range of functions under the Travel Agents Act 1985 (the TA Act) including the granting and renewal of licences, compliance activities and a range of education and advisory services. The department also undertakes the conciliation of disputes involving travel agents and consumers.
As at 30 June 2013, there were 340 licensed travel agents operating in Western Australia. Over the course of the year, 22 licences were surrendered, 132 licences were renewed and one new licence was granted.
Section 58 of the TA Act requires the Commissioner for Consumer Protection (the Commissioner) to report on a number of matters namely:
(a) the number, nature and outcome of –
(i) investigations and inquiries undertaken by, or at the direction of, the Commissioner for the purposes of this Act; The department dealt with a number of disputes against travel agents in the past 12 months. These matters were conciliated between the parties as they represented contractual disputes. Allegations that indicated a breach of legislation may have occurred were categorised as investigations.
There were 22 investigations closed in the 2012-13 financial year. Of the 22 investigations, nine examined alleged unlicensed trading. Five accepted corrective advice, one was issued an administrative warning, one did not detect an offence, one was granted a licence and one had no action when found to be outside the statute of limitations period. Five complaints were opened due to the travel agent not providing the Commissioner with information concerning a change in particulars. In two instances education and advice were provided. Two administrative warnings were issued and one investigation did not detect an offence. Three investigations were commenced due to alleged misrepresentations of price. All three complaints resulted in education and advice being provided. One investigation file was opened due to the liquidation of a travel agent. This file was closed after a media release was issued and consumers were directed to lodge a claim with the Travel Compensation Fund. One further investigation included allegations of operating as a pyramid scheme. This was not found to be the case but resulted in the provision of education and advice to the trader. Three investigations did not detect a breach.
Department of Commerce | Annual Report 2012-13 169

Table 38: Travel Agents Act 1985: Investigations and inquiries in 2012-13
Travel agents
and tour operator services
Airlines, tour
coach, cruise ships, ferry
or train services
Holder of travel
agent licence or unlicensed
activity
Conciliations Total
Number ongoing as at 1 July 2012
2 2 2 22 28
Number commenced 4 2 16 222 244
Number concluded 5 3 14 230 252
Number ongoing as at 30 June 2013
1 1 4 14 20
Allegations of unlicensed activity are closely examined prior to formal investigation and in many cases matters are clarified with the trader to ensure compliance with the licensing requirements. This process significantly reduced the number of formal investigations required.
The department undertakes a proactive compliance program to provide information to travel agents about compliance with the TA Act resulting in improved practices throughout the industry. In 2012-13, 160 travel agents were visited including those with newly granted licences. Of those visited, 136 were fully compliant with the TA Act while 24 agents were non-compliant to varying degrees.
The areas of non-compliance were administrative matters under the legislation and were not considered to be serious or systemic breaches of the TA Act. In most instances compliance with the legislation was achieved quickly and related to issues such as:
Department of Commerce | Annual Report 2012-13170

• business name certificate not on display;
• travel agent licence certificate not on display;
• ‘Licensed Travel Agent’ sticker not displayed;
• nominated manager not in attendance;
• failure to notify of a new manager within 14 days; and
• failure to notify a change of licence particulars within 14 days.
(ii) matters that have been brought before the State Administrative Tribunal under this Act; There were no matters brought before the State Administrative Tribunal.
(b) the number and nature of matters referred to in paragraph (a) that are outstanding; There are currently five investigation matters outstanding as at 30 June 2013. These relate to three instances of alleged unlicensed activities, one instance of alleged misrepresentations about price and one instance of alleged misrepresentations about the uses or benefits of a good or service.
(c) any trends or special problems that may have emerged; In the past financial year two licensed travel agents closed their business due to financial failure. Significant numbers of consumers were affected in Western Australia as a result of Travelworld Carnarvon and Classic International Cruises Pty Ltd being placed into financial administration. Consumer Protection Division received 260 calls about Classic International Cruises Pty Ltd regarding closure. There were no specific telephone enquiries about Travelworld Carnarvon due to the intervention of an allied travel agent that took over coordination of customers’ needs. Media releases were issued in both instances of closure and consumers were directed to lodge claims with the Travel Compensation Fund.
(d) forecasts of the workload of the Commissioner in performing functions under this Act in the year after the year to which the report relates; and It is anticipated that in the next 12 months there will be significant policy decisions taken by Government about the future licensing regime for travel agents. Government is currently considering a range of options following a decision of a majority of consumer protection Ministers nationally to discontinue the cooperative licensing regime and to wind up the Travel Compensation Fund.
(e) any proposals for improving the performance of the Commissioner’s functions under this Act. There are no proposals.
Department of Commerce | Annual Report 2012-13 171
Water Services Licensing Act 1995Part 5A of the Water Services Licensing Act 1995 (the WSL Act) establishes the Plumbers’ Licensing Board (the Board) to regulate the plumbing trade that serves the Western Australian community. The Board forms part of the Building Commission Division.
At the end of the year, there were 7,034 plumbers licensed by the Board to carry out water supply, sanitary and drainage plumbing work for residential, commercial and industrial purposes and for other sectors of the economy. This specialised workforce comprised 3,147 licensed plumbing contractors, 3,788 licensed tradespersons, who work under the general direction and control of the licensed plumbing contractors, and 99 restricted plumbing permit holders who replace certain hot water units.
Section 59H(2) of the WSL Act requires the department’s Annual Report to include details of:
(a) the number, nature, and outcome, of:
(i) investigations and inquiries undertaken by, or at the direction of, the Board into licensing under this Act;
Table 39: Water Services Licensing Act 1995: Compliance investigations and complaints in 2012-13
Alleged unsatisfactory workmanship
Alleged unlicensed plumbing
Other regulation breaches
Total
Ongoing matters as at 1 July 2012
0 16 25 41
Matters commenced 2 12 16 30
Matters concluded 2 25 37 64
Ongoing matters as at 30 June 2013
0 3 4 7
Department of Commerce | Annual Report 2012-13172

(ii) matters that have been brought before the State Administrative Tribunal under this Act; There were no cases brought before the State Administrative Tribunal in 2012-13.
(b) the number and nature of matters referred to in paragraph (a) that are outstanding; three unlicensed matters and four ‘other’ matters that may result in disciplinary action.
(c) any trends or special problems that may have emerged No trends or special problems have emerged for 2012-13.
(d) forecasts of the workload of the Board in the year after the year to which the report relates; and The workload for 2013-14 is expected to rise steadily in line with urban development and overall economy of Western Australia.
(e) any proposals for improving the operation of the Board. The Building Commission Division has substantially implemented the Office of Auditor Generals Public Sector Performance Report 2012. Changes to Regulations are proposed to modernise the powers given to compliance inspectors and investigators. A new plumbing compliance strategy was presented to the board which will provide a more effective program to ensure the licensing system works as it is intended to. An independent Review of Plumbing Regulation in Western Australia has been commissioned and is due in 2013-14.
Department of Commerce | Annual Report 2012-13 173

Government policy requirementsReconciliation Action PlanThe Department of Commerce is committed to maintaining positive relationships with Aboriginal communities through the strategies outlined in the department’s Reconciliation Action Plan. These strategies address Reconciliation Australia’s key focus areas: Relationships, Respect and Opportunities through the development of initiatives for the education of employees and customers, and liaison with Aboriginal support groups.
Table 40 provides a summary of the key activities undertaken during 2012-13 in support of the department’s Reconciliation Action Plan.
Table 40: Reconciliation Action Plan outcomes for 2012-13
Area of Focus: Relationships
• Education, consultation and promotion initiatives targeting regional Aboriginal communities continued in 2012-13 as part of divisional operations.
• Community Education Officers from Consumer Protection Division maintained contact throughout the year with metropolitan and regional Aboriginal community groups.
Area of Focus: Respect
• Performing a formal ‘Welcome to Country’ at significant departmental events.
• Promotion and celebration of Reconciliation Week and NAIDOC Week through internal department events.
• The ‘Ways of Working Workshops’ were attended by approximately 60 key staff. The six workshops held over two weeks provided a forum for open communication to explore ways of working together collaboratively between all cultures within the department.
Area of Focus: Opportunities
• The department appointed an Aboriginal Strategy Coordinator to develop a strategy and action plan to improve aboriginal employment outcomes at the department.
• Continued implementation of the department’s Equity and Diversity Plan, which contains strategies to improve employment outcomes for Aboriginal and Torres Strait Islanders.
• The department hosted five Aboriginal Trainees from the Public Sector Commission’s Aboriginal Traineeship Program.
Substantive equalitySubstantive equality seeks to eliminate systemic direct and indirect discrimination in the delivery of public sector services to ethnic and aboriginal communities, and to promote sensitivity to the needs of these client groups.
Department of Commerce | Annual Report 2012-13174

In accordance with the Equal Opportunity Act 1984 and the Public Sector Commissioner’s Circular 2009-23: Implementation of the Policy Framework for Substantive Equality, the department is committed to ensuring substantive equality is reflected appropriately in divisional operations, strategies and policies.
The department’s Substantive Equality Committee is responsible for monitoring both the Reconciliation Action Plan and the Policy Framework for Substantive Equality to assess client needs. The Committee has placed emphasis on enhancing service delivery to Aboriginal and other culturally diverse client groups by the provision of specific information and education resources to ensure equal outcomes.
Substantive Equality strategies for Aboriginal communities are reported in the Reconciliation Action Plan section of this report. Achievements for other Culturally and Linguistically Diverse (CaLD) groups during 2012-13 included:
• a Needs and Impact Assessment of the existing Residential Tenancies advice service is being conducted to assess the impact on, and experience of, CaLD groups when utilising the service; and
• other divisional services have been identified for future Needs and Impact Assessments.
The department was also represented on a number of cross government networks and committees including the:
• Implementation Committee on Settlement Issues for African Humanitarian Entrants (Office of Multicultural Interests);
• National Indigenous Consumer Strategy Implementation Reference Group; and
• Western Australian CaLD Across Government Network.
Progress against the Policy Framework continues through the review of current policies and projects and maintaining effective communication networks with relevant Indigenous community organisations.
Occupational safety, health and injury managementIn accordance with the Public Sector Commissioner’s Circular 2012-05: Code of Practice: Occupational Safety and Health in the Western Australian Public Sector (the Circular), the department complies with the requirements of the Occupational Safety and Health Act 1984, the Workers’ Compensation and Injury Management Act 1981 and the Code of Practice: Occupational Safety and Health in the Western Australian Public Sector.
Department’s commitmentThe department recognises the value of its employees and is committed to providing a safe and healthy work environment focussed on the prevention of injury and illness. The department recognises that effective occupational safety, health (OSH) and injury management systems and practices rely upon the active participation and cooperation of both management and employees.
The department also recognises the vital role that senior managements’ commitment to effective OSH and injury management processes plays in the development of a strong safety and injury management culture aimed at best protecting the health and safety of its employees. The department’s OSH commitment is designed to raise awareness of safety and health obligations and to promote safer work practices.
Consultation mechanismsBoth management and employees are committed to improved and effective health and safety consultation within the workplace. Consultation provides employees with an opportunity to participate fully in decisions which impact on their working lives. The department maintains an Occupational Safety and Health Committee (the Committee) which is made up of employee safety and health representatives and management representatives. The Committee meets regularly and facilitates effective and efficient consultation and co-operation between employers and employees aimed at maintaining a safe working environment.
In 2012-13 the Committee met every six weeks to discuss matters relating to workplace matters that affect the health and welfare of employees. The
Department of Commerce | Annual Report 2012-13 175

department’s executive, safety and health representatives and employees are committed to the goal of a workplace that is free of work related injuries and disease and to achieve a standard of excellence in OSH management.
During the year the Committee discussed and resolved issues raised by employees, reviewed accident and incident forms to ensure that hazards were addressed to eliminate or reduce potential issues, and discussed injury trends and identified preventative measures that promote a safe working environment.
Further, information regarding the department’s OSH and injury management systems are available to employees on a dedicated ‘OSH Toolkit’ page found on the department’s intranet site. Additionally, information is communicated as part of OSH training for employees, managers and supervisors and through the OSH Committee.
Injury managementIn the event that a workplace injury occurs, the department has an established injury management system, which details the steps taken to assist injured employees to return to work as soon as medically appropriate. The system ensures that injury management intervention occurs promptly and effectively, so that injured employees can remain at work or return to work at the earliest appropriate time.
The department’s injury management system is compliant with the requirements of the Workers’ Compensation and Injury Management Act 1981 and the Workers’ Compensation Code of Practice (Injury Management) 2005 and ensures the establishment of an official return to work program for any employee of the department injured while at work for when they are able to return to work in either a partial or total capacity.
Our performanceThe department’s performance against targets contained in the Circular is outlined in the table below.
Table 41: Occupational safety, health and injury management performance
MeasureActual Results Results against Target
2010-11 2011-12 2012-13 Target Result
Number of fatalities 0 0 0 0 (zero) Target achieved
Lost time injury and/or disease incidence rate 0.56 0.42 0.107 0 or 10% reduction Target achieved
Lost time injury and/or disease severity rate 20.00 25.00 0 0 or 10% reduction Target achieved
Percentage of injured workers returned to work:
(i) within 13 weeksN/A% 80% 100% Actual percentage
result Target achieved
(ii) within 26 weeks 100% 100% 100% Target achieved
Percentage of managers trained in occupational safety, health and injury management responsibilities 80% 96% 100% Greater than or
equal to 80% Target achieved
Department of Commerce | Annual Report 2012-13176
Further to undertaking an internal review and formal consultation, the department’s occupational safety and health management system (OSHMS) was updated in June 2012.
In September 2012, the OSHMS was internally audited against the WorkSafe Plan to assist identify gaps and areas for improvement. Further to this a two year improvement plan was developed with the aim of consolidating improvements made in previous years and to also:
• excel in OSH management;
• implement measures that will enable the department to meet its OSH legislative requirements;
• integrate safety and health into business activities;
• provide direction for the department by defining objectives, strategies, resources, timeframes and measures;
• monitor progress and outcomes on a quarterly basis; and
• demonstrate commitment to the objectives of OSH Improvement Plan by allocating sufficient resources (human, physical and financial).
To date 48 per cent of the agreed actions from the OSH Improvement Plan have been completed within the 2012-13 year, with the remainder of the agreed actions anticipated to be completed within the 2013-14 year.
The department provides OSH training to employees in accordance with the Occupational Safety and Health Act 1984. The OSH Induction is mandatory to all new employees within four weeks of commencement. This training covers ergonomics, manual handling, bullying, hazard identification and risk assessment, legislative requirements, OSH committee, duty of care and the functions of a safety and health representative.
The OSH and injury management training is provided to all managers and supervisors. This training covers the requirements of managers and supervisors set by their legal obligations for OSH and Injury Management in addition to the management of workplace hazards and risks, development of return to work programs and common issues that may impact a person’s fitness for work. Attendance to this training is reported as a key performance indicator for each division and is mandatory for all
managers and supervisors, with refresher training undertaken every three years.
Additional activities undertaken in 2012-13 include the:
• development of an OSH communications plan which demonstrates a planned and systematic approach to promoting key OSH information and messages to all staff;
• delivery of a training needs analysis survey which identified the training needs of staff;
• establishment of dedicated OSH and Wellbeing noticeboards at each work site, which provides a sound platform for the promotion of essential and important information;
• development of an OSH policy statement which captures safety as a core value of the department and consolidates the principles and objectives of the OSHMS;
• development of a personal letter from the Director General to all new employees which reinforces the importance of the OSH induction and encourages all new employees to integrate safety and health into all work related tasks;
• development of a comprehensive document register which facilitates continual improvement by stipulating review dates for all existing documents and also identifying documents required for future development;
• establishment of additional databases which align with the OSHMS and assist maintain compliance with OSH legislative requirements; and
• development of positive key performance indicators which effectively measure the safety and health performance of the department.
Department of Commerce | Annual Report 2012-13 177

Customer feedbackThe department is committed to understanding and striving to exceed our customer service standards by encouraging customer feedback to improve our services. Customers can provide feedback in a number of ways including via the internet, by telephone, by informing our counter service employees, or by written communication to the department. The feedback recorded is used to understand our customer expectations, determine the extent to which we can deliver on these expectations, address systemic shortfalls which will improve our service delivery, streamline our processes and acknowledge the good efforts of our employees.
The department’s Customer Service Charter reflects our operations and delivery services to customers. The Charter specifies how employees are expected to conduct themselves and details the standards we endeavour to meet. The Charter is available on the department’s website. The department has a Customer Service Policy as required by the Public Sector Commissioner’s Circular 2009-27: Complaints management. The department’s performance in relation to customer feedback is monitored by the Corporate Executive.
Whole of government Public Sector Safety and Injury Management InitiativeThe Public Sector Safety and Injury Management Initiative provides a whole of government approach to workplace safety and injury management. The initiative supports a commitment by all Australian jurisdictions to the achievement of the National Occupational Health and Safety Strategy 2002-2012, in particular Priority Five, which is to strengthen the capacity of government to influence occupational health and safety outcomes.
The initiative is an example of how the public sector can work together to develop a culture that advocates and supports a workplace free of work-related injuries and diseases. The initiative is designed to promote the Western Australian public sector as a leader in safety, health and injury management by fostering a coordinated approach across public sector agencies. The Department of Commerce is the lead agency responsible for the initiative. A steering committee was established to foster senior
management commitment and provide guidance to public sector agencies. The steering committee has senior officers from the Department of Commerce, the Public Sector Commission, RiskCover, WorkCover WA and a UnionsWA nominee.
The key activity of the initiative includes identifying and developing strategic initiatives to assist agencies to improve safety and injury management performance and thereby reduce workers’ compensation costs. The initiative also promotes best practice safety, health and injury management across the public sector through the Code of Practice: Occupational Safety and Health in the Western Australian Public Sector and the Public Sector Commissioner’s Circular 2012-05: Code of Practice: Occupational Safety and Health in the Western Australian Public Sector (the Circular).
Key activities undertaken by the department in support of the initiative in 2012-13 included, the initiation of an Office of the Auditor General audit of public sector agency injury management performance which examined the injury management performance of eight public sector agencies; the updating of the Public Sector Commissioner’s Circular 2009-11, Code of Practice: Occupational Safety and Health in the Western Australian Public Sector to reflect the new Australian Work Health and Safety Strategy 2012-2022 , reviewed the level of compliance with Public Sector Commissioner’s Circular 2009-11 and improved the level of disclosure by agencies in reporting on safety, health and injury management performance in annual reports and the facilitation of two Public Sector occupational safety and health practitioner network sessions on contemporary occupational safety, health and injury management issues.
Department of Commerce | Annual Report 2012-13178
Related Documents