저작자표시-비영리-변경금지 2.0 대한민국 이용자는 아래의 조건을 따르는 경우에 한하여 자유롭게 l 이 저작물을 복제, 배포, 전송, 전시, 공연 및 방송할 수 있습니다. 다음과 같은 조건을 따라야 합니다: l 귀하는, 이 저작물의 재이용이나 배포의 경우, 이 저작물에 적용된 이용허락조건 을 명확하게 나타내어야 합니다. l 저작권자로부터 별도의 허가를 받으면 이러한 조건들은 적용되지 않습니다. 저작권법에 따른 이용자의 권리는 위의 내용에 의하여 영향을 받지 않습니다. 이것은 이용허락규약 ( Legal Code) 을 이해하기 쉽게 요약한 것입니다. Disclaimer 저작자표시. 귀하는 원저작자를 표시하여야 합니다. 비영리. 귀하는 이 저작물을 영리 목적으로 이용할 수 없습니다. 변경금지. 귀하는 이 저작물을 개작, 변형 또는 가공할 수 없습니다.

Welcome message from author
This document is posted to help you gain knowledge. Please leave a comment to let me know what you think about it! Share it to your friends and learn new things together.
Transcript

저 시-비 리- 경 지 2.0 한민
는 아래 조건 르는 경 에 한하여 게
l 저 물 복제, 포, 전송, 전시, 공연 송할 수 습니다.
다 과 같 조건 라야 합니다:
l 하는, 저 물 나 포 경 , 저 물에 적 된 허락조건 명확하게 나타내어야 합니다.
l 저 터 허가를 면 러한 조건들 적 되지 않습니다.
저 에 른 리는 내 에 하여 향 지 않습니다.
것 허락규약(Legal Code) 해하 쉽게 약한 것 니다.
Disclaimer
저 시. 하는 원저 를 시하여야 합니다.
비 리. 하는 저 물 리 목적 할 수 없습니다.
경 지. 하는 저 물 개 , 형 또는 가공할 수 없습니다.

1
공학박사학위논문
Modeling, Simulation, and Design Procedure Development
of Micro-channel FT Reactor using Computational Fluid
Dynamics
모델링, 시뮬레이션 및 설계 절차 전산 유체 역학을 이용한
마이크로 채널 FT 원자로 개발
2017년 8월
서울대학교 대학원
화학생물공학부
크리스나다스

i
Abstract
Modeling, Simulation, and Design Procedure
Development of Micro-channel FT Reactor
using Computational Fluid Dynamics
Krishnadash S. Kshetrimayum
School of Chemical & Biological Engineering
The Graduate School of Seoul National University
Fischer ̶ Tropsch (FT) synthesis is the main step in Gas-to-Liquid (GTL), coal-to-
liquid (CTL) and biomass-to-liquid (BTL) processes. In GTL, natural gas is used as
feedstock to produce syn-gas (a mixture of carbon-monoxide-CO and hydrogen-H2)
needed for FT reaction where the reaction then produce hydrocarbon fuels (Fischer
and Tropsch). In CTL and BTL, syngas is produced from coal and biomass through
coal and biomass gasification. GTL is particularly of interest to oil and gas industry
today, partly due to volatile fuel price, and partly due to environmental restrictions
on flaring offshore stranded and associated gas, and the quest for monetizing these
unusual resources. Commercial reactors in GTL are generally classified as high-
temperature FT (593 ̶ 623 K) and low-temperature FT (493 ̶ 523 K) reactors
depending on the product specifications and operating requirements. The reaction is

ii
characterized by high exothermicity (heat of reaction = 165 kJ/mol CO reacted) with
both product selectivity and catalyst deactivation showing high sensitivity to
temperature. This demands adequate heat removal and temperature control of the FT
reactors for high reactor yield
Low-Temperature FT synthesis in commercial GTL plants use conventional fixed
bed and slurry bubble column reactors. However, fixed bed reactor has associated
problem of high pressure drop and diffusion limitations, in addition to insufficient
heat removal capacity. And, slurry bubble column has a major issue regarding liquid
products-catalyst separation. In the recent years, microchannel reactors have
attracted attention among researchers, as they are said to shorten the diffusion
distance, and lower heat and mass transfer resistance, thus making it as an emerging
technology for FT synthesis applications. Reduced mass and heat transfer distances
provides enhanced process intensification, making it suitable for highly active FT
catalyst. Moreover, many applications such as offshore and remote production
facilities require compact and modular conversion technology. And, microchannel
reactor blocks are considered to be highly integrated, compact, portable and safe
technology making it ideal for those applications. Additionally, small-scale sources
for syngas like municipal waste and biomass waste can utilize microchannel
technology to produce liquid fuels. However, the high exothermic nature of FT
reaction and short residence time of microchannel reactor demands an active coolant
having high heat removal capacity, for instance, saturated water.
A microchannel reactor block, with reaction and coolant channel planes arranged
in alternate manner and cross flow configuration was considered for Fischer ̶ Tropsch
(FT) synthesis. Since past few years, using Computational Fluid Dynamics (CFD)
tool to study microreactor or microchannel reactor simulation to either supplement

iii
or even replace expensive and difficult experiments have become a common trend.
CFD simulation of heat transfer in the microchannel block was carried out to see the
effect of wall boiling condition in coolant channel on reactor temperature. First,
reaction inside a catalyst packed representative single channel was simulated to
obtain typical heat generation profile along the channel length considering different
operating conditions (GHSV 5000 hr-1; 30,000 hr-1; catalyst loading or activity 60 %
- 300 %, where 100 % loading equals 1060 kg/m3 of Cobalt based catalyst from
Oxford Catalyst Ltd. and corresponding catalyst activity as 100%). Validity of single
channel reaction model was checked by simulating an experimental single channel
reactor model and comparing model prediction with the experimental data. Heat
generation profiles of practical interest were then imported into multichannel block
as time constant heat source input to carry out heat transfer simulation. Cooling oil
(Merlotherm SHTM), subcooled water and saturated water (saturated at the reactor
operating condition) were chosen as coolants. In one simulated case, temperature
difference between hottest spot and coldest spot was found to be 32 K, 17 K and 12
K for cooling oil, subcooled water and saturated water, respectively, indicating
highest heat transfer across channel wall for saturated water. Saturated water flow
rate of 3 - 6 g/min per channel predicted high wall heat flux above 8900 W/m2-K. At
intensified process condition (GHSV 30,000 hr-1; catalyst loading 300 %), mean FT
temperature obtained was 510 K for saturated water and 519 K for subcooled water.
Different candidate design of coolant and process channels geometry are
evaluated to get insight into the effect of channel geometry on reactor heat transfer
performance. A modified reactor block with an additional coolant layer gave
improved thermal performance predicting noticeable heat transfer enhancement
under wall boiling condition even at very low exit vapor fraction. Accordingly

iv
modified reactor block is tested for intensified process condition (GHSV = 30,000
hr-1 and super active catalyst condition).
Strong correlation exists between temperature, reaction conversion and product
selectivity. For low temperature FT synthesis, it is preferred to maintain reaction
channel temperature below 523K. Based on the predicted result, temperature of 517
K could be an optimum value. However, in general, as the intrinsic activity of the
catalyst declines, reactor is operated at slightly higher temperature to achieve the
same level of CO conversion. From studying effect of syngas ratio and reactor
operating pressure, syngas ratio of 2 and operating pressure of 20 – 22 bar predicts
more desired product selectivity compared to other set of values.
Method of catalyst bed zone division and loading different % of catalyst in
different zone is evaluated. Study indicates noticeable advantage of the method. Also,
the method can be optimized to obtain optimum number of zone division, zone
length and strategic loading % in each zone. Further, on evaluating heat transfer
performance of cross-current flow and co-current flow configuration of syngas and
coolant flows, there is clear indication that co-current configuration gives better heat
transfer performance compared to cross-current flow configuration in microchannel
reactor block operation. A systematic microchannel FT reactor design procedure is
also formulated for future microchannel reactor simulation and design process.
Keywords: Computational Fluid Dynamics, Gas-to-Liquid, Microchannel modeling,
Reactor block, Fischer-Tropsch synthesis, Wall boiling, Heat transfer coolants,
Reactor configuration, Catalyst zone division, Design procedure
Student ID: 2011-30282

v
Contents
Abstract ..................................................................................................................... i
Contents ..................................................................................................................... v
List of Figures ........................................................................................................ vii
List of Tables ......................................................................................................... xiv
CHAPTER 1 : Introduction ....................................................................................... 1
1.1. Research motivation ................................................................................ 1
1.2. Research objectives ................................................................................. 5
1.3. Outline of the thesis ................................................................................ 6
CHAPTER 2 : CFD Modeling of Microchannel FT Reactor .................................... 7
2.1. Introduction ............................................................................................. 7
2.2. FT Reaction Kinetics ............................................................................... 9
2.3. Microchannel reactor modeling ............................................................ 10
2.3.1 FT reaction channel ..................................................................... 12
2.3.2 Coolant channel ........................................................................... 14
2.3.3 Reactor solid walls ...................................................................... 16
2.4. Reactor geometry, simulation conditions and settings .......................... 16
2.4.1 Single channel model .................................................................. 16
2.4.2 Multichannel model ..................................................................... 17
2.4.3 Simulation conditions and settings .............................................. 20
2.5. Simulation of Velocys’ single channel experiment ............................... 23

vi
2.5.1 Heat generation in single channel ................................................... 26
2.6. Heat transfer simulation of multichannel model ................................... 27
2.7. Conclusion............................................................................................. 32
CHAPTER 3 : Detail Study of FT Synthesis in Microchannel Reactor .................. 34
3.1 Introduction ........................................................................................... 34
3.2 Microchannel FT reaction characteristics ............................................. 35
3.2.1 FT kinetics .................................................................................... 36
3.2.2 Effect of channel geometry .......................................................... 39
3.2.3 Effect of operating conditions ...................................................... 49
3.3. Strategies for heat exothermic heat removal ............................................ 53
3.3.1 Wall boiling coolant and heat transfer enhancement .................... 53
3.3.2 Catalyst zone division and discrete dilution ................................. 70
3.3.3 Nano-fluid as coolant ................................................................... 76
3.4 Process intensification ......................................................................... 779
3.5 Modified reactor block .......................................................................... 83
3.6 Reactor configuration ............................................................................ 88
3.7 Additional comments ............................................................................ 92
3.7.1 Modeling conventional FT reactors ............................................. 92
3.7.2 FT product distribution ................................................................. 93
3.8 Conclusion .............................................................................................. 94
CHAPTER 4 : Microchannel Design Procedure Development............................... 98

vii
4.1 Introduction ........................................................................................... 98
4.2 Design procedure .................................................................................. 98
4.3 Final design and reactor operation data (from KOGAS) .................... 106
4.4 Conclusion........................................................................................... 111
CHAPTER 5 : Concluding Remarks ..................................................................... 112
5.1. Conclusions ......................................................................................... 112
5.2. Future works ........................................................................................ 116
Nomenclature ........................................................................................................ 117
Literature cited ...................................................................................................... 120
Abstract in Korean (요 약) ................................................................................... 128
List of Figures
Figure 2.1. Schematic of the single channel and multichannel reactor models
considered. Single Channel-A model has one reaction channel sandwiched between
two coolant channels. Single Channel-B model has one reaction channel with wall
cooled at top and bottom. Microchannel reactor block model has 40 reaction
channels and 40 coolant channels in cross-flow configuration ............................... 19
Figure 2.2. Mole fraction of CO (a), mole fraction of CH4 (b) heat generation [J/s]
(c) Temperature contour [K] (d) in reaction channel from FT reaction in Singel
Channel-A (Velocys experiment-short channel. Channel thickness: 1 mm; channel
width: 8 mm ; catalyst zone: 38 mm at the center).. ................................................ 25
Figure 2.3. Heat generation profile from FT reaction simulation in Single Channel-

viii
B for different catalyst loading [GHSV = 5000 hr-1; H2/CO = 2]. 120 % loading
corresponds to catalyst activity 1.2 times of the present catalyst ............................ 26
Figure 2.4. Schematic showing strategy for heat transfer simulation in
multichannel reactor model ..................................................................................... 28
Figure 2.5. Temperature [K] profile inside FT reaction channel: Comparison
between model prediction between model with reaction and heat transfer coupled
(Model 1), model with reaction and heat transfer decoupled and considering syngas
flow (Model 2), and decoupled model considering no syngas flow (Model 3). ...... 29
Figure 2.6. (a) 3D Temperature [K] contour on microchannel reactor block with
saturated water as coolant (flow rate = 5.4 g/min), and (b) Heat flux distribution
over reaction channel (GHSV = 5000 hr-1; catalyst loading 120 %). ...................... 30
Figure 2.7. Qualitative comparison of temperature contour from (a)Velocys’s pilot
scale operation data with (b) simulation result. ....................................................... 31
Figure 3.1. Mole fraction from (a) Kinetics-I (Fe-based catalyst of Marvast et al,
2005) and (b) Kinetics –II ( Co-based catalyst of Velocys US Patent 2012/0132290
A1 ). ......................................................................................................................... 37
Figure 3.2. Temperature profile from a single channel model using (a) kinetics –I
and (b) kinetics-II. ................................................................................................... 38
Figure 3.3. Multichannel micro reactor design with different thickness between
coolant and process channel plane (a – c), different coolant channel cross section (d
– e) and different thickness between two coolant channels (h – j).. ........................ 40
Figure 3.4. Total surface heat flux to the coolant channel along the channel length
for different thickness between coolant channel layer and process channel layer
after 5 sec simulation time.. ..................................................................................... 42

ix
Figure 3.5. Total surface heat flux to the coolant channel along the channel length
for different coolant channel cross section types at 7 sec simulation time [same
mass flow rate differing inlet velocities]. Coolant inlet velocity differs in order to
maintain same coolant mass flow rate.. ................................................................... 43
Figure 3.6. Lateral (or radial) temperature profile for 2 mm, 3mm and 5 mm
channel height and channel length of 200 mm.. ...................................................... 48
Figure 3.7. Lateral (or radial) temperature distribution along the channel length for
2 mm channel height and channel length of 200 mm.. ............................................ 49
Figure 3.8. CO Conversion (conv.), CH4 and C5+ selectivity (sel.) from FT
reaction simulation with Single-Channel-B at different channel temperature
[Process condition: GHSV = 5000 hr-1; catalyst loading =120 %]......................... 51
Figure 3.9. Effect of syngas ratio on CO conversion and CH4 selectivity [Process
condition: GHSV = 5000 hr-1; catalyst loading =120 %].. ..................................... 52
Figure 3.10. Effect of operating pressure on CO conversion and CH4 selectivity
[Process condition: GHSV = 5000 hr-1; catalyst loading =120 %]......................... 52
Figure 3.11. Schematic of heat transfer in microchannel reactor system (a) for wall
boiling condition, (b) non-evaporative coolant.. ..................................................... 53
Figure 3.12. Schematic of mechanistic wall boiling model of saturated coolant
( Kurual and Podowski, 1991).. ............................................................................... 54
Figure 3.13. 3D Temperature [K] contour on microchannel reactor block for
cooling oil (a), subcooled water (b) and saturated water (c) as coolants with flow
rate = 5.4 g/min per channel (GHSV = 5000 hr-1; catalyst loading 120 %). +ve X
direction: coolant flow; +ve Y direction: syngas flow. ........................................... 57
Figure 3.14(a). 3D Heat flux [W/m2] contour on coolant channels for oil as

x
coolant with flow rate = 5.4 g/min per channel (GHSV = 5000 hr-1; catalyst
loading 120 %). +ve X direction: coolant flow; +ve Y direction: syngas flow. ...... 59
Figure 3.14(b). 3D Heat flux [W/m2] contour on coolant channels for subcooled
water as coolant with flow rate = 5.4 g/min per channel (GHSV = 5000 hr-1;
catalyst loading 120 %). +ve X direction: coolant flow; +ve Y direction: syngas
flow.......................................................................................................................... 60
Figure 3.14(c). 3D Heat flux [W/m2] contour on coolant channels for saturated
water as coolant with flow rate = 5.4 g/min per channel (GHSV = 5000 hr-1;
catalyst loading 120 %). +ve X direction: coolant flow; +ve Y direction: syngas
flow.......................................................................................................................... 61
Figure 3.15(a). 3D Temperature [K] contour on reaction channels of microchannel
reactor block for wall boiling coolant flow (GHSV = 5000 hr-1; catalyst loading
120 %; saturated water flow rate = 5.4 g/min per channel). +ve X direction: coolant
flow; +ve Y direction: syngas flow. ........................................................................ 63
Figure 3.15(b). 3D Temperature [K] contour on coolant channels of microchannel
reactor block for wall boiling coolant flow (GHSV = 5000 hr-1; catalyst loading
120 %; saturated water flow rate = 5.4 g/min per channel). +ve X direction: coolant
flow; +ve Y direction: syngas flow. ........................................................................ 64
Figure 3.16. Liquid volume fraction in wall boiling coolant channel for 0.02 m/s
inlet velocity. ........................................................................................................... 67
Figure 3.17. Liquid volume fraction in wall boiling coolant channel for 0.09 m/s
inlet velocity. ........................................................................................................... 67
Figure 3.18. Effect of saturated water flow rate on vapor fraction and mean FT
channel temperature (GHSV = 5000 hr-1; catalyst loading 120 %). ....................... 68

xi
Figure 3.19. Effect of saturated water flow rate on average heat flux through
coolant channels (GHSV = 5000 hr-1; catalyst loading 120 %). ............................ 69
Figure 3.20. Schematic showing catalyst bed zone division. ................................. 70
Figure 3.21. Heat generation profile for different catalyst loading method (a)
uniform loading (50 % catalyst loading ), (b) catalyst zone division and non-
uniform loading (1st zone 30 %, 2nd zone 40% and 3rd 50 %). ............................. 72
Figure 3.22. Reaction rates for C5+ product formation at different catalyst zones
with 30%, 40 % and 50 % catalyst loading. ............................................................ 73
Figure 3.23. Heat generation and temperature profile showing effect of different
catalyst loading strategy in divided zones. (a) Heat generation profile for strategy –
I (1st zone 30 %, 2nd zone 40% and 3rd 50 %). (b) Heat generation profile for
strategy –II (1st zone 30 %, 2nd zone 50% and 3rd 60 %). (c) Temperature profile for
strategy-I and (d) temperature profile for strategy-II. ............................................. 74
Figure 3.24. Temperature profile showing effect of different catalyst loading
strategy in divided zones. (a) showing difference between 2 and 3 zone division,
(b) showing effect of zone length ............................................................................ 75
Figure 3.26. Reactor temperature contour showing enhancement in heat removal
for (a) nanofluid as coolant (ΔTmax = 12 oC) compared to (b) Oil as coolant (ΔTmax
= 15 oC). .................................................................................................................. 78
Figure 3.27. Heat generation profile from FT reaction simulation in single-
channel-B for different catalyst loading [GHSV = 30000; H2/CO = 2]. 220%
catalyst loading corresponds to catalyst activity of 2.2 times the activity of the
present catalyst. ....................................................................................................... 80

xii
Figure 3.28. 3D Temperature contour (in Kelvin) on reaction channels for (a)
subcooled water as coolant and (b) saturated as coolant (wall boiling condition) for
intensified process condition (GHSV = 30000 hr-1; Catalyst loading 300 %).
Coolant flow rate = 13.2 g/min per channel. %); +ve X direction: coolant flow; +ve
Y direction: syngas flow. ......................................................................................... 81
Figure 3.29(a). Simulation result for geometry with an additional coolant layer. 3D
Temperature [K] contour on reaction channels of microchannel reactor block for
wall boiling coolant flow (GHSV = 5000 hr-1; catalyst loading 120 %; saturated
water flow rate = 5.4 g/min per channel). +ve X direction: coolant flow; +ve Y
direction: syngas flow. ............................................................................................ 85
Figure 3.29(b). Simulation result for geometry with an additional coolant layer. 3D
Temperature [K] contour on reaction channels of microchannel reactor block for
subcooled water as coolant (GHSV = 5000 hr-1; catalyst loading 120 %; subcooled
water flow rate = 5.4 g/min per channel). +ve X direction: coolant flow; +ve Y
direction: syngas flow. ............................................................................................ 86
Figure 3.30. Temperature contour of modified reactor at intensified process
condition (GHSV = 30000 hr-1 and catalyst activity 300 %). 300 % catalyst
loading implies catalyst activity of 3 times the present catalyst activity, a situation
of super active catalyst). .......................................................................................... 87
Figure 3.31. Temperature contour from co-current configuration for same
operating conditions (GHSV = 5000 hr-1; catalyst loading 120 %; saturated water
flow rate = 5.4 g/min per channel). (Syngas and coolant in +Y-axis direction). ... 89
Figure 3.32. Temperature contour from co-current configuration for intensified
xiii
operating conditions (GHSV = 30,000 hr-1; catalyst loading 300 %; saturated water
flow rate = 12 g/min per channel). (Syngas and coolant in +Y-axis direction). ...... 90
Figure 3.33. Heat flux profile along reaction channel length for (a) co-current
configuration (b) for cross current configuration. ................................................... 91
Figure 3.34. Typical flow profile FT synthesis in conventional reactors (a)
fluidized bed reactor, (b) single pass of multitubular fixed bed reactor. ................. 92
Figure 3.35. Chain growth probability a function of temperature. ......................... 94
Figure 4.1. Microchannel block (modular) reactor design procedure. Division of
design procedure into 4 stages (stage – I to IV) comprising single channel design,
multichannel reactor block design, geometry and operation optimization, and
reactor fabrication and pilot plant demonstration. ................................................... 99
Figure 4.2. Final microchannel block (modular) reactor design. (a) Process channel
side, (b) Coolant channel side, (c) Side view showing process channel and coolant
channel layers along with guide bars and support plates....................................... 106
Figure 4.3. Final microchannel block (modular) reactor design. (a) configuration
showing cross-cocurrent-cross flow of syn-gas and coolant, (b) fabricated
multichannel reactor block. ................................................................................... 107
Figure 4.4. Reactor temperature of the microchannel FT reactor and multitubular
fixed bed FT reactor as given by thermocouples installed inside the reactors [data
from KOGAS]. ...................................................................................................... 108
Figure 4.5. Predicted reactor temperature profile from single pass model of
multitubular fixed bed FT reactor. ......................................................................... 109
Figure 4.6. CO conversion and CH4 selectivity of compact GTL pilot plant with

xiv
microchannel FT reactor in the FT reaction section [data from KOGAS]. ........... 111
List of Tables
Table 2.1. (a) Reaction Scheme and (b) Kinetic Parameters for Co-based Fischer–
Tropsch Catalyst from Velocys Inc. Patent (US 2012/0132290) ............................ 10
Table 2.2. (a) Reaction Scheme and (b) Kinetic Parameters for Fe based Fischer–
Tropsch Catalyst from Marvast et al ....................................................................... 11
Table 2.3. Simulation conditions for single channel and multichannel FT reactors
................................................................................................................................. 21
Table 2.4. Simulation parameters of single channel and multichannel models ...... 22
Table 3.1. Materials considered for the simulation ................................................ 41
Table 3.2. Effect channel layer thickness ............................................................... 42
Table 3.3. Effect of different coolant channel cross section types [same mass flow
rates differing inlet velocities] ................................................................................. 44
Table 3.4. Effect of different coolant channel cross section types [different mass
flow rates keeping same inlet velocities]................................................................. 44
Table 3.5. Effect of different coolant channel cross section types [same mass flow
rates, same inlet velocities] ..................................................................................... 45
Table 3.6. Effect of wall thickness between coolants [same mass flow rates,
different inlet velocities] after 7 sec simulation ...................................................... 45

xv
Table 3.7. Physical properties of candidate coolant medium ................................. 62
Table 3.8. Materials considered for the simulation ................................................ 77
Table 4.1. Reactor geometry design variables and feasible design range,
microchannel reactor block type FT reactor .......................................................... 105
Table 4.2. Reactor model parameters and simulation conditions ......................... 105

1
CHAPTER 1 : Introduction
1.1. Research motivation
Fischer ̶ Tropsch (FT) synthesis is the main step in Gas-to-Liquid (GTL), coal-to-
liquid (CTL) and biomass-to-liquid (BTL) processes1. In GTL, natural gas is used as
feedstock to produce syn-gas (a mixture of carbon-monoxide-CO and hydrogen-H2)
needed for FT reaction where the reaction then produce hydrocarbon fuels2. In CTL
and BTL, syn-gas is produced from coal and biomass through coal and biomass
gasification Traditionally, GTL process was of interest to oil and gas industry, due to
rising fuel price and diminishing crude oil reserve while natural gas resource was
available in abundant, proved reserves over 150 trillion cubic meter as of 20053. But
with the decline in crude oil price, the interest on GTL process is mainly due to
environmental restrictions on flaring associated gas and offshore stranded gas, and
the quest for monetizing small-to-mid size gas resources which otherwise would be
lost to flaring or lost unrecovered.
PetroSA in South Africa has a GTL plant that used Sasol’s technology and under
operation since 1991 with a capacity around 45,000 BPD. Commissioned in 1993,
Shell has their first commercial GTL plant in Bintulu, Malaysia, and their world’s
largest GTL plant, Pearl GTL (capacity over 140,000 BPD), opened at Qatar in 2011.
Another commercial GTL under operation since 2007 at Qatar is Oryx GTL plant
which is jointly owned by Qatar Petroleum and Sasol4.
Commercial reactors in GTL are generally classified as high-temperature FT (593 ̶
623 K) and low-temperature FT (493 ̶ 523 K) reactors5 depending on the product
specifications and operating requirements. The reaction is sometimes represented by

2
a general model as the following: nCO + (2n+1)H2 ̶ > CnH2n+2 + nH2O and is
characterized by high exothermicity (heat of reaction = 165 kJ/mol CO reacted) with
both product selectivity and catalyst deactivation showing high sensitivity to
temperature. This demands adequate heat removal and temperature control of the FT
reactors for high reactor yield6.
Low-Temperature FT synthesis in commercial GTL plants use conventional
fixed bed and slurry bubble column reactors7. However, fixed bed reactor has
associated problem of high pressure drop and diffusion limitations, in addition to
insufficient heat removal capacity. And, slurry bubble column has a major issue
regarding liquid products-catalyst separation. In the recent years, microchannel
reactors have attracted attention among researchers, as they are said to shorten the
diffusion distance, and lower heat and mass transfer resistance, thus making it as an
emerging technology for FT synthesis applications 8-10. Reduced mass and heat
transfer distances provides enhanced process intensification, making it suitable for
highly active FT catalyst. Moreover, many applications such as offshore and remote
production facilities require compact and modular conversion technology.
Conventional reactors are usually designed for high production capacity (over
30,000 BPD) to achieve the economics of scale11 and scaling down the process to
small or mid-scale capacity is considered impractical. Accordingly, a new type of
reactor that is compact and which can be easily integrated to compact GTL process
with small production capacity (1 to 1,000 BPD range) and which can stably operate
under effect of sea waves have to be developed for FT synthesis application in
offshore facilities and stranded gas resources. In the recent years, microchannel
reactors have attracted attention among researchers of small scale GTL process as

3
they can provide methods for process intensification (enabling them to increase the
reaction rates 10 to 1,000 times faster compared to conventional reactors) with their
short diffusional distance, and lower heat and mass transfer resistance6,9,10,12,13. And
microchannel reactor blocks are considered highly integrated, compact and modular
in nature, allowing them to be portable and safe for applications in offshore and
remote production facilities. The overall capital costs associated with FT
microchannel reactors are said to be relatively low compared to conventional reactor
systems11. Additionally, the small-scale sources for syn-gas like municipal waste and
biomass waste can utilize microchannel technology to produce liquid fuels6. Few
companies like compact GTL, Velocys Inc have developed small scale GTL
technology that use microchannel reactor for FT synthesis unit. ENVIA Energy has
a GTL plant built at Oklahoma City that use Velocys’ novel modular microchannel
reactor14. In this thesis, detail study of microchannel reactor for FT synthesis is
conducted with the aim to develop an in-house small scale compact GTL technology
and mainly targeting for remote stranded gas resources and offshore applications.
Heat removal is a typical challenge for all FT reactors. In microchannel reactor,
the short residence time together with highly exothermic reaction in presence of
active catalyst demands an active coolant having high heat removal capacity, for
instance, saturated water. Saturated water, when used as a coolant, will undergo wall
boiling due to the superheated channel walls of microchannel reactor, whereby the
saturated water gets converted to steam. In industrial applications like thermal
hydraulic flow in nuclear reactors where high heat transfer co-efficient is needed,
wall boiling or pool boiling condition is often exploited to meet high heat transfer
requirement 15. Such evaporative cooling, despite having high potential for heat

4
removal, reported cases of applications as coolant in Fishcer-Tropsch synthesis
experiments are rare. This may be, partly due to lack of understanding of wall boiling
condition in small size channels as those of microchannels, and partly due to
difficulty in getting saturated water suply at the operation facilities. Deshmukh et al.6
in their scale up study of a pilot scale microchannel reactor with 276 process channels
and 132 coolant channels arranged in cross-flow configuration, used saturated water
as coolant to exploit wall boiling condition to meet enhanced level of heat removal.
Tonkovich et al.16 demonstrated the suitability of employing partial boiling coolant
to control temperature of their inventive all welded FT reactor.
Several works exit in literature that used Computational Fluid Dynamics (CFD)
tool to study microreactor or microchannel reactor to either supplement or even
replace expensive and difficult experiments have become a common trend.
Arzamendi et al.1 studied the buoyancy effect on the thermal behavior of a
microchannel reactor block through CFD simulation considering partial boiling of
coolant and wall coated catalytic reaction zone. Gumuslu and Avci17 considered 2D
simulation model to represent a unit cell of a parrallely arranged microchannels with
wall coated catalytic channels and coolant channels arranged in alternate fashion.
They carried out CFD simulation to study effect of various geometrical and operating
parameters on reaction temperature, and used steam as coolant indicating that the
reactor in concern was for high-temperature FT synthesis. An et. al.18 used CFD tool
to study effect of various configurations of micro-reactor in their square cross-
section micro-reactor performance study. Shin et al.19, 20 presented experimental and
CFD simulation study of catalytic bed modular microchannel reactor. But they
considered much larger channels (40 mm wide and 140 mm long) stacked up to form
plate heat exchanger configuration and using silicon oil as coolant. Channels of

5
lower width and height are preferred for high level of process intensification. Na et
al.21 studied the geometric effect of coolant channels on thermal performance of
microchannel reactor using CFD simulation. Recently, Shin et al.22 showed the
effectiveness of micro-scale cross current cooling channel in thermal control of their
modular reactor for FT synthesis through CFD simulation. Giovanni et al.23
presented through their CFD simulation study influence of tube diameter on Fischer-
Tropsch selectivity and thermal behavior, considering catalytic milli-fixed bed
reactor. Park et al.24 proposed cell decomposition model to simulate large scale
microchannel reactor to avoid intensive CFD computation. However, in the light of
numerous works available in literature on detail study of FT synthesis in
microchannel, effect of coolant type and wall boiling condition in coolant channels
on reactor temperature have not been evaluated quantitatively. In wall boiling
condition, part of the heat from exothermic FT reaction is used to generate vapour,
thereby enabling heat removal without changing much the coolant temperature. This
is essential to maintain near isothermal condition throughout the block reactor.
Additionally, it is of interest to evaluate different reactor flow configurations and
investigate possible methods for heat removal and better control of reactor
temperature.
1.2. Research objectives
This thesis attempts to address the challenges on microchannel reactor modeling,
simulation, and design procedure development for FT synthesis mainly using CFD
technique. A number of single channel and multichannel reactor models are
considered for this purpose. Reaction conversion, selectivity, heat generation and
temperature profiles in a reaction channel are analyzed. Different coolant types and

6
effect of wall boiling condition are evaluated. First, FT reaction inside a catalyst
packed single channel was simulated and heat generation profile was obtained which
is then imported into a multichannel reactor block model to carry out heat transfer
simulation. Further, we explore the effect of flow rate of wall boiling coolant,
saturated water in this case, on reactor thermal behaviour. Based on the simulation
analysis, reactor design modifications are made. Heat removal under intensified
process condition, different reactor flow configuration, effect of channel geometry
and operating variables are examined in detail to get better insights on reaction
characteristics and microchannel FT reactor. The work also aims to formulate a
computer aided systematic design procedure development of microchannel FT
reactor for future applications in similar design process.
1.3. Outline of the thesis
This thesis is organized as following; Chapter 1 introduces the thesis topic and also
presents the research motivation, relevant literature and objectives of this study.
Chapter 2 describes CFD modeling of microchannel reactor for FT synthesis. It
includes model development of both single and multichannel types of microchannel
reactors, model validation with experimental data from literature and different case
simulations for further investigation on the reactor behavior. Chapter 3 presents the
detail study on FT synthesis in microchannel reactor considering various aspects like
channel geometry, reactor operating variables, wall boiling phenomena in coolant
channels, different reactor configurations etc. In Chapter 4, we formulate design
procedure for microchannel FT reactor providing a design flow chart consisting
various stages of the design process. Finally, Chapter 5 concludes the thesis based
on the finding of the present research and briefly presents the way forward.

7
CHAPTER 2 : CFD Modeling of Microchannel FT
Reactor
2.1. Introduction
Modeling of Fischer-Tropsch synthesis in microchannel reactor has been a great
challenge as the reaction system involves interaction of three phases—reactants
syngas (mixture of CO and H2) in gas phase, wax product in thick liquid and catalyst
in solid phase. Since past few years, Computational Fluid Dynamics (CFD) has
become a common tool to model and carry out simulations to either supplement or
even replace expensive and difficult experiments have become a common trend.
Several works exist in literature on single and multichannel FT reactor experiments,
simulation and optimization. For instance, Arzamendi et al 1 carried out heat transfer
simulation using CFD model of microchannel reactor block to study the effect of
buoyancy on reactor temperature considering partial boiling coolant in the coolant
channels. Gumuslu and Avci 17 considered 2D model to simulate a unit cell of parallel
arranged microchannels with catalyst coated on the channel walls and conducted
parametric study to see effect of various geometrical and operating parameters on
reactor temperature. Shin et al. 19,20 presented experimental and CFD simulation
study of catalytic bed modular microchannel reactor with larger channel width
(around 20 mm) and smaller channel height (around 1.6 mm) stacked up to form
plate heat exchanger. They also showed the effectiveness of micro-scale cross current
cooling channel for thermal control of their modular FT reactor through CFD
simulation. Channels of lower width and height are expected to provide high level

8
of process intensification. Na et al. 21 studied the geometric effect of coolant channels
on thermal performance of microchannel reactor using CFD simulation.
Kshetrimayum et. al.25-27 developed CFD models of both single channel and
multichannel reactor block to conduct FT reaction and heat transfer analysis to
investigate reaction runaway situations. They also evaluated effect of coolant type
and wall boiling condition on the three-dimensional reactor temperature profile.
Giovanni et al. 23 presented through their CFD simulation study influence of tube
diameter on FT selectivity and thermal behavior, considering catalytic milli-fixed
bed reactor. They showed that tube of inner diameter less than 2.75 mm can achieve
high heat removal capacity for a wide range of syn-gas flow rate. Recently, Na et al
28 presented a multi-objective optimization of discrete catalyst loading method to
obtain optimal catalyst loading that would maximize reactor performance using CFD
and genetic algorithm.
This chapter mainly described the CFD modelling of microchannel reactors of
various types considering the two dominating physical phenomena—reaction and
heat transfer. First, we briefly discuss FT reaction kinetics, then modelling of catalyst
packed bed reaction channel, coolant channel of both single phase and two phase
flow, and heat transfer through the wall are described. Various models of both single
channel and multichannel models developed to carry out simulations for specific
purposes. Single channel model is used to mainly carry out reaction analysis while
multichannel reactor in block form is used to study over all thermal performance of
a typical multichannel reactor. Validations of both single channel model and
multichannel model are also presented.

9
2.2. FT Reaction Kinetics
FT reaction involves complex interaction of reactants (CO and H2), catalyst surface
and even intermediate radicals, and are sometimes represented by complex
mechanistic reaction scheme describing each elementary steps involved30,31. In some
cases32-34, the reaction is modeled by one stop global reaction model. In yet other
cases, a set of reaction is used to describe the reactant consumption and a range of
product formation16,35. This study concerns low-temperature FT synthesis using
active catalyst as that of Cobalt based catalyst. Accordingly, reaction scheme and
kinetic data obtained by Tonkovich et al.16 of Velocys using their cobalt based active
catalyst as given in Table 2.1 is used for carrying out reaction analysis. For
comparison of this Co- based kinetics used for low temperature FT synthesis to that
of Fe-based catalyst mainly used for high temperature FT synthesis, reaction scheme
and kinetic data of Marvast et al35 that used Fe-based catalyst is considered, shown
in Table 2.2.

10
Table 2.1. (a) Reaction Scheme and (b) Kinetic Parameters for Co-based Fischer–
Tropsch Catalyst from Velocys Inc. Patent (US 2012/0132290)16
(a) Reactions and rate expressions
ID Reaction Reaction rate expressiona
1 3H2 + 𝐶𝑂 → 𝐻2𝑂 + 𝐶𝐻4 rCH4= 𝑘1 exp(−𝐸1/𝑅𝑇) 𝐶𝐻2
2 5H2 + 2𝐶𝑂 → 2𝐻2𝑂 + 𝐶2𝐻6 rC2H6= 𝑘2 exp(−𝐸2/𝑅𝑇) 𝐶𝐻2
3 7H2 + 3𝐶𝑂 → 3𝐻2𝑂 + 𝐶3𝐻8 rC3H8= 𝑘3 exp(−𝐸3/𝑅𝑇) 𝐶𝐻2
4 9H2 + 4𝐶𝑂 → 4𝐻2𝑂 + 𝐶4𝐻10 rC4H10= 𝑘4 exp(−𝐸4/𝑅𝑇) 𝐶𝐻2
5 H2𝑂 + 𝐶𝑂 → 𝐻2 + 𝐶𝑂2 r𝐶𝑂2= 𝑘5 exp(−𝐸5/𝑅𝑇) 𝐶𝐶𝑂𝐶𝐻2𝑂
6 29H2 + 14𝐶𝑂 → 14𝐻2𝑂 + 𝐶14𝐻30 r𝐶14𝐻30 =
𝑘6 exp(−𝐸6/𝑅𝑇) 𝐶𝐻2𝐶𝐶𝑂
[1 + 𝑘𝑎𝑑 exp(−𝐸𝑎𝑑/𝑅𝑇) 𝐶𝐶𝑂]2
aConcentrations in kmol/m3.
(b) Kinetic parameters
ID ki [rate in kmol/(kg-cat s)] Ei (J/kmol)
1 2.509 × 10⁹ 1.30 × 10⁸
2 3.469 × 10⁷ 1.25 × 10⁸
3 1.480 × 10⁷ 1.20 × 10⁸
4 1.264 × 10⁷ 1.20 × 10⁸
5 2.470 × 10⁷ 1.20 × 10⁸
6 3.165 × 10⁴ 8.0 × 10⁷
kad = 63.5 Ead = 8.0 × 10⁷

11
Table 2.2. (a) Reaction Scheme and (b) Kinetic Parameters for Fe based Fischer–
Tropsch Catalyst from Marvast et al35.
(a) Reactions and rate expressions
ID Reaction Reaction rate expressiona
1 3H2 + 𝐶𝑂 → 𝐻2𝑂 + 𝐶𝐻4 rCH4= 𝑘1 exp(−𝐸1/𝑅𝑇) 𝑃𝐶𝑂
𝑚 × 𝑃𝐻2
𝑛
2 4H2 + 2𝐶𝑂 → 2𝐻2𝑂 + 𝐶2𝐻4 rC2H4= 𝑘2 exp(−𝐸2/𝑅𝑇) 𝑃𝐶𝑂
𝑚 × 𝑃𝐻2
𝑛
3 5H2 + 2𝐶𝑂 → 2𝐻2𝑂 + 𝐶2𝐻6 rC2H6= 𝑘3 exp(−𝐸3/𝑅𝑇) 𝑃𝐶𝑂
𝑚 × 𝑃𝐻2
𝑛
4 7H2 + 3𝐶𝑂 → 3𝐻2𝑂 + 𝐶3𝐻8 rC3H8= 𝑘4 exp(−𝐸4/𝑅𝑇) 𝑃𝐶𝑂
𝑚 × 𝑃𝐻2
𝑛
5 9H2 + 4𝐶𝑂 → 4𝐻2𝑂 + 𝑛_𝐶4𝐻10 rn_C4H10= 𝑘5 exp(−𝐸5/𝑅𝑇) 𝑃𝐶𝑂
𝑚 × 𝑃𝐻2
𝑛
6 9H2 + 4𝐶𝑂 → 4𝐻2𝑂 + 𝑖_𝐶4𝐻10 ri_C4H10= 𝑘6 exp(−𝐸6/𝑅𝑇) 𝑃𝐶𝑂
𝑚 × 𝑃𝐻2
𝑛
7 18.05H2 + 8.96𝐶𝑂 → 8.96𝐻2𝑂 + 𝐶8.96𝐻18.18 rC8.96H18.18= 𝑘7 exp(−𝐸7/𝑅𝑇) 𝑃𝐶𝑂
𝑚 × 𝑃𝐻2
𝑛
8 H2𝑂 + 𝐶𝑂 → 𝐻2 + 𝐶𝑂2 r𝐶𝑂2= 𝑘8 exp(−𝐸8/𝑅𝑇) 𝑃𝐶𝑂
𝑚 × 𝑃𝐻2
𝑛
aRate in mol / hr g-cat.
(b) Kinetic parameters
ID ki
[mol/hr g-cat ]
m
n
Ei
(J/kmol)
1 142583.8 -1.0889 1.5662 83423.9
2 51.556 0.7622 0.0728 65018
3 24.717 -0.5645 1.3155 49782
4 0.4632 0.4051 0.6635 34885.5
5 0.00474 0.4728 1.1389 27728.9
6 0.00832 0.8204 0.5026 25730.1
7 0.02316 0.5850 0.5982 23564.3
8 410.667 0.5742 0.710 58826.3

12
2.3 Microchannel reactor modeling
2.3.1 FT reaction channel
Reaction channels are assumed to be filled with catalyst and inert support, and
modeled as pack bed reactor with void fraction determined by the catalyst and inert
material loading. The mass and momentum inside a reaction channel are described
by Navier-Stoke equation with source term for porous media in the momentum
equation, as given below.
Continuity equation: ( ) 0vt
(2.1)
Momentum equation: ( ( ))i
v v v p St
(2.2)
where ρ represents mixture density, �⃗� is velocity vector, p is the static pressure
and iS is the source term for porous media and modelled as sum of viscous loss
term and inertial loss term as in eqn (2.3).
Source term for porous media:
3 3
1 1
1| |
2i ij j ij j
j ji
S D v C v v
(2.3)
μ is the viscosity of mixture and |v| is the magnitude of the velocity. Inverse of
ijD is known by the term permeability and
ijC as inertial resistance factor36 and
are prescribed matrices. The source act as momentum sink and contributes to
pressure drop inside porous reaction channel as a function of reaction species

13
superficial velocity. And, species transport equation is described as below:
Species transport: ( )( )i i i i
v Jt
Y Y R
(2.4)
where, iR is the source term from FT reaction, i
Y , the mass fraction of specie "i"
and i
J , the diffusive mass flux for specie "i" from Maxwell-Stefan equations37
for multicomponent diffusion. Heat is continuously generated in the reaction
channels as the syn-gas (CO + H2) undergoes catalytic conversion to various
hydrocarbon products. The energy equation inside the reaction channel is described
by that of porous media, as in eqn (2.5).
Energy equation:
(1 ) ( ) ( )f f s s f f eff i i
i
h
f
E E v E p k T h J vt
S
(2.5)
Where f
E and s
E are the energy for fluid and solid parts; and eff
k are the
porosity and effective thermal conductivity inside the reaction channel; i
h is the
enthalpy of specie 'i'; and h
fS is heat source term which in present study is the heat
generation due to exothermic FT reaction. Second term of right hand side comes
from enthalpy transport of multicomponent species diffusion. Presence of FT
product liquid may change the value of eff
k . However, in the present study, to avoid
over estimation, all fluid species are assumed to be in gas phase and eff
k is calculated
as volume average of thermal conductivities of materials inside reaction channel, as
(1 )eff f s
k k k where f
k is the thermal conductivity of fluid phase, and s
k

14
the thermal conductivity of solid phase catalyst and inert support material. Due to
millimeter scale of microchannel reactor, fluid phase is considered to be in laminar
regime and turbulence contribution inside reaction channel is ignored. The
assumption is that as the channel size decrease, the catalyst loading will approach
uniformity and that heat transfer limit between catalyst surfaces to support material
will not limit the heat transfer to wall.
2.3.2 Coolant channel
In coolant channels, flow can be single phase liquid, in case of cooling oil and
subcooled water. Whereas, it is two-phase due to wall boiling condition in case of
saturated water. Consequently, laminar flow is assumed for cooling oil and
subcooled water, and turbulence flow for saturated water under wall boiling
condition. Heat is transported from the heated wall to coolant fluid. Coolant fluid in
case of wall boiling, comprises of two phases: subcooled liquid and vapour. Flow
can be modelled by Eulerain-Eulerian multiphase framework with interpenetrating
continua with liquid as continuous phase and vapor as discrete phase, as reviewed in
detail by Ishii38, Drew and Passman39, and Yeoh and Tu40 and not presented here for
brevity.
Heat flux from the heated wall to the coolant is described by mechanistic model
of Kurul and Podowski41,42 which is a summation of heat flux due to different
mechanisms. In the region where liquid is contact with heated wall, heat transfer is
same as that of single phase flow, called convective heat transfer. In the region where
bubbles suddenly form and grow, heat is taken up by vapour generation, called
evaporative heat transfer. And heat transfer due to the liquid replacing the bubble
sites due to recirculation is called quenching heat transfer. Accordingly, the total

15
wall heat flux is defined as sum of three parts:
Mechanistic wall heat flux: tot C Q EQ Q Q Q (2.6)
Where C
Q , QQ and
EQ represent the heat flux component due to convection,
quenching and evaporation, respectively.
Detail models of the component heat flux, corresponding heat transfer co-
efficient correlations including closing parameters: bubble diameter at detachment,
nucleation site density, bubble influence area and bubble detachment frequency are
reviewed in Krepper and Rzehak10. Mass transfer from the liquid phase to vapour is
accounted by the rate of evaporation which is a function of bubble diameter at
detachment, nucleation site density and bubble detachment frequency. Since
temperature difference between liquid phase and vapour phase are expected to be
small, heat transfer between the two phases is assumed to be negligible as compared
to the heat transfer from the channel wall.
For single-phase coolant flow as is the case with subcooled oil and subcooled
water, convective heat transfer is assumed to be the only means of heat removal and
only the first term in eqn (2.6) will remain. The validity of continuum model and
Navier -Stokes equations at such small scale was shown by Arzamendi et al.1,
through Knudsen number which says that if Knudsen number, kn=√((π ×
γ)/2)×Ma/Re where Ma is the Mach number, Re the Reynolds number and γ, the
specific heat ratio (Cp/Cv) , is much lesser than characteristic length of the system,
the assumption is valid. In the present study, Knudsen number was calculated to be
order of 1×10⁻⁶ which is much less than characteristic length scale of millimetre used
in our microchannel reactors.

16
2.3.3 Reactor solid walls
In the solid zone, the conduction heat flux through solid is defined as in eqn (2.7)
with local temperature in reaction and coolant channels as the thermal boundary
conditions. It is assumed that no heat is lost from reactor walls to the ambient air.
Heat conduction in solid wall zone: w a l lTq k (2.7)
where w all
k is the material conductivity of solid wall zone.
2.4 Reactor geometry, simulation conditions and settings
Both single channel reactor and multichannel reactor geometry models are
considered in the present study. Single channel model is used to simulate FT reaction
in catalytic packed channel and to obtain resulting reactant conversion, product
selectivity, heat generation and temperature profile inside the channel. In
multichannel model, heat transfer simulation is carried out with FT reaction heat
generation implemented as time constant heat source in reaction channels and
coolants flowing in coolant channels in cross flow configuration. Detail geometry of
the reactor models considered are described in the following subsections.
2.4.1 Single channel model
Two single channel reactor models (single channel-A and single channel-B), see
figure 1(a) & (b), were considered for two purposes; single channel-A to validate
simulation model predictions with Velocys' experiment6, and single channel-B for
carrying out FT reaction simulation in a representative reaction channel of
multichannel reactor block. Single channel model-A has reaction channel width 8
mm, height 1 mm and channel length 70 mm, and two coolant channels of same

17
dimensions on either sides. This single channel reactor has 38 mm long catalyst bed
situated at the center with the region upstream and downstream of the catalyst bed
filled with SiC as inert beds. Single channel model-B has channel width 1 mm, height
1 mm and channel length 21 mm and with no coolant channels. Heat removal in this
case is faciliated by temperature as thermal boundary condition at the wall. Both the
single channel geometries were meshed with fine grids of 0.0001 m and below,
resulting to 0.86 million cells for single channel-A and 0.21 million cells for single-
channel-B.
2.4.2 Multichannel model
Deshmukh et al.6 and Almeida et al.12 demonstrated the feasibility of using
microchannel block in cross-flow configuration for commercial FT synthesis. In our
present simulation study too, we considered a multichannel block reactor, adapted
from Arzamendi et al.1, as shown in Figure 2.1(c). It has dimensions: 21 mm x 21
mm x 17 mm, with four process channel planes and four coolant channel planes
stacked up in alternate manner. Each channel planes has 10 parallel channels of 1
mm x 1 mm x 17 mm with gap between adjacent channels as 1 mm along lateral
sides, and 1mm along stack height. This gives altogether 80 microchannels in the
block with 40 each for FT reaction and coolant flow and arranged in cross flow
configuration. Reactor material is assumed to be of stainless steel, SS304. Since heat
transfer study is the focus here, reaction channels are considered as solid zone but
with time constant heat source as obtained from FT reaction simulation in single
channel. Hence, CFD model for reactor block consist of two types of solid zones-
one for reaction channels and other for reactor body; and one fluid zone for coolant
flow. It is assumed that in all reaction channels of the block reactor, reaction rates

18
are identical and accordingly heat generation rates are identical too. Therefore,
reaction channels in this block reactor model are zones for time constant heat source.
Coolant channels are zones for heat sink. Zones are meshed with tetrahedral and
hexagonal elements with cell count of 2.2 million to ensure fine mesh quality and
denser grid in fluid zones.
Reaction channel (cross section: 8 mm x 1mm)
Coolant channel (cross section: 8 mm x 1 mm)
Catalyst packed bed
(a) Single Channel-A
Catalyst packed bed (cross section: 1mm x 1mm)
Wall cooled at top and bottom

19
(b) Single Channel - B
Reaction channel (cross section: 1 mm x 1mm)
Coolant channel (cross section: 1mm x 1 mm)
Reactor body
(c) Microchannel reactor block with 40 reaction channels and 40 coolant channels
(Adapted from Arzamendi et al., 2010)
Figure 2.1. Schematic of the single channel and multichannel reactor models
considered. Single Channel-A model has one reaction channel sandwiched between
two coolant channels. Single Channel-B model has one reaction channel with wall
cooled at top and bottom. Microchannel reactor block model has 40 reaction
channels and 40 coolant channels in cross-flow configuration.

20
2.4.3 Simulation conditions and settings
Simulation was carried out using commercial CFD software ANSYS FLUENT 14.5
An et al.18 satisfactorily simulated micro-reactor for various configurations using the
software tool to demonstrate the applicability. For Single Channel-A, conditions
similar to that of Velocys's experiment (Deshmukh et al.6, Tonkovich et al.16) was
used; syngas flow rate of 12400 h-1 GHSV (Gas Hourly Space Velocity) at inlet
temperature of 503 K and operating pressure of 25 bar with catalyst loading, 1060
kg/m3 (Cobalt based catalyst from Oxford Catalyst Ltd.). Since the main interest with
single channel model was to obtain heat generation profile under different operating
conditions, syngas flow rate of 5000 h-1 GHSV with catalyst loading varying from
60 to 120 % were considered, as given in Table 2.3. Syngas ratio (H2/CO) was kept
constant at 2 for all reaction simulations. Reaction scheme containing 6 equations
and corresponding kinetic parameters for low temperature FT synthesis given in
Tonkovich et al.16 was used. Bed parameters for the porous media are given in table
2(a). Thermo-physical properties of species: CO, H2, CH4, C2H6, C3H8, C4H10, H2O,
CO2, and inert N2 were used as they are in FLUENT 14.5 inbuilt library after
verification with Perry's Handbook43. Properties of C14H30 which is not present in the
library was taken from same source in Perry's Hanbook43.

21
Table 2.3. Simulation conditions for single channel and multichannel FT reactors.
Reactor model GHSV(hr-1) Catalyst
loading (%)
Coolant type
Single channel - A 12,400 100 Subcooled water
Single channel - B 5000 60 - 120 Subcooled water
30,000 220 - 300 Subcooled water
Multichannel 5000 120 Subcooledwater,
Cooling oil
(Merlotherm SH),
Saturated water
30,000 300 Subcooledwater,
Saturated water
100 % Catalyst loading = 1060 kg/m3

22
Table 2.4. Simulation parameters of single channel and multichannel models.
(a) Bed parameters Values
Gas mixture viscosity (kg/m-s) 0.001
Gas mixture conductivity (J/s-m-K) 0.104
Porosity 0.4
Catalyst density @ 100% loading 1060
Permiability (1/m2) 1.46x10⁸
Intertial resistance (1/m) 1.37x10⁴
(b) Properties Density Heat capacity Conductivity Viscosities
kg/m3 J/Kg-K J/s-m-K kg/m-s
Catalyst support material 3210 473 20.4 -
Cooling oil(Marlotherm SH) 936 1967 0.0974 1x10⁻³
Subcooled water 998.2 4182 0.6 1x10⁻³
Water vapor 1.55 2014 0.0261 1x10⁻⁵
Solid Wall(SS304) 8000 500 20.1 -
Heat generation profile obtained from FT reaction simulation in single channel
model was implemented as time constant heat source into multichannel reactor block
CFD model using User Defined Function (UDF). Simulation settings for heat
transfer simulation in multichannel reactor block are as follows: Laminar for single
phase coolant; SST-k Omega turbulent model for turbulence in multiphase; SIMPLE
algorithm for pressure velocity coupling; second order discretization for momentum

23
and energy equation; RPI boiling model (Kurul and Podowski41, 42) for wall boiling.
Fincher44 tested the capability of RPI boiling model implemented in commercial
CFD software ANSYS FLUENT 14.5 in predicting experimental results and the
predictions were found to be well in agreement. Reactor body is assumed to be made
of stainless steel, SS304. Thermo-physical properties of different coolant materials,
catalyst support material and solid reactor materials are given in table 2(b).
Saturation temperature for wall boiling model was set as 500 K, which is the
saturation temperature of water at operating pressure of 25 bar. Simulations were
carried out on a workstation with 24 core Intel Xeon CPU and 16 GB RAM as
unsteady state simulation and results were collected when reactor temperature has
become static over several 100 time steps for all cases.
2.5 Simulation of Velocys’ single channel experiment
Velocys' experiment (Deshmukh et al.6,Tonkovich et al.16) with a short single channel,
modelled as Single Channel-A in our study, was simulated to validate single channel
FT reaction model. Figure 2.2 shows mole fraction of CO and CH4, heat generation
due to exothermic reaction in the catalyst packed region, and temperature contour
for the reaction channel obtained from simulation. As expected, reaction is higher
near the inlet and gradually decreases along the channel length as can be understood
from CO conversion profile and selectivity to CH4 along channel length, see inset
plot in Figure 2.2(a) and (b). Accordingly, heat generation and temperature profile
are higher near the inlet and decreases along the channel length, as can be seen from
Figure 2.2(c) and (d). As expected, reaction and hence heat generation occurs only
in the catalyst packed region. To minimize temperature change along channel length,
subcooled water flow rate of 89.85 g/min was set in each of the two coolant channels.

24
Changing kinetic parameters in proportion to change in catalyst loading results in
different conversion and selectivity. At catalyst loading of 1060 kg/m3 CO
conversion of 60.02% was achieved with selectivity for CH4 and C5+ (modeled as
C14H30 here) as 8.38% and 87.41% respectively. Other products: C2H6, C3H8, C4H10,
and CO2, altogether have selectivity below 5%. When the catalyst loading was
increased 1.2 times, CO conversion increased to 74.60 % while the selectivity for
CH4 and C14H30 increased to 11.18% and 85.26% respectively. These values are in
reasonable agreement with the experimental results of Deshmukh et al.6 where CO
conversion of 73.6 % with selectivity for CH4, C2-C4and C5+ as 8.0 %, 3.6% and
88.2 % respectively, were obtained. Small difference in the results can be attributed
to lower reactor temperature in experiment, as it loses heat to ambient air. In fact,
when 0.1 W/m2-K ambient heat transfer coefficient, a value from
literature14considered reasonable for such applications, was applied to the reactor
walls, reactor temperature lowers by 1.5 oC. Correspondingly, CO conversion
decreases by 2.2%, and selectivity for CH4 and C14H30 decreases by 1.0% and
increases by 1.1% respectively.

25
Figure 2.2. Mole fraction of CO (a), mole fraction of CH4 (b) heat generation [J/s] (c) Temperature contour
[K] (d) in reaction channel from FT reaction in Singel Channel-A (Velocys experiment-short channel.
Channel thickness: 1 mm; channel width: 8 mm ; catalyst zone: 38 mm at the center).
0.02 0.040
5
10
Channel length(m)
CH
4 S
ele
ctivity (
%)
Syngas IN
0.02 0.040
30
60
Channel length(m)
CO
Con
vers
ion (
%)
FT product OUT
(a)
Syngas IN
(b)
FT product OUT
Catalyst bed
Syngas IN
(c)
FT product OUT
Coolant channel
(not shown here)
Coolant channel
(not shown here)
(d)
Syngas IN
FT product OUT

26
2.5.1 Heat generation in single channel
Single Channel-B represents a unit reaction channel in multichannel block model.
FT reaction simulation was carried out in Single Channel-B to obtain conversion,
selectivity and corresponding heat generation profile. Same reaction model settings
and parameters were applied as in simulation of Velocys' experiment4,16. Process
conditions were, however, changed. First, syngas flow rate of 5000 h-1 GHSV with
syngas ratio (H2/CO) of 2 at 523K was checked for catalyst loading of 60 %, 80 %,
100 % and 120 %, where 100 % corresponds to 1060 kg/m3 of Co-based active
catalyst developed by Oxford Catalyst (Tonkovich et al.11).
Figure 2.3. Heat generation profile from FT reaction simulation in Single Channel-
B for different catalyst loading [GHSV = 5000 hr-1; H2/CO = 2]. 120 % loading
corresponds to catalyst activity 1.2 times of the present catalyst.
0.00 0.01 0.020
4x10⁻⁵
8x10⁻⁵
1x10⁻⁴
74% X
81% X
86% X
Hea
t g
en
era
tion
[kJ/s
]
Channel length(m)
60 % loading
80 % loading
100 % loading
120 % loading
90% X

27
Alternatively, we can assume these loading percentages as the level of activity of
catalyst and hence can be understand as 0.6, 0.8, 1 and 1.2 times the activity of
reference catalyst. Since Single Channel-B does not have adjacent coolant channels,
a pair of opposite walls are maintained at syngas inlet temperature, 523K in this case.
The other pair of opposite walls have zero heat flux as thermal boundary condition.
Reactor operating pressure was set as 25 bar. As expected, CO conversion and heat
generation are higher for higher catalyst loading, as can be understood from heat
generation profiles in Figure 2.3. However, towards the end of catalyst bed, heat
generation for higher catalyst loading is slightly lower than that of lesser catalyst
loading as the reactant concentration has depleted more and reaction rate decreased
slightly more in the former compared to the latter. On comparing heat generation
rates between 60 % loading and 120 % loading (0.6 and 1.2 times activity), heat
generation rate increases almost in proportion to the catalyst loading or catalyst
activity, indicating that active cooling method is required for FT synthesis that uses
high active catalyst.
2.6 Heat transfer simulation of multichannel model
To reduce computational load with 3D simulation of FT reaction and heat transfer
in multichannel, reaction and heat transfer phenomena were decoupled and
simulations were carried out separately, as shown by the schematic in Figure 2.4.
To examine the validity of decoupling approach, three single channel model were
considered: FT reaction and heat transfer coupled (Model 1), FT reaction and heat
transfer decoupled with syngas flow (Model 2), and FT reaction and heat transfer
decoupled with no syngas flow (Model 3). In Model 2 and Model 3, heat
generation rate obtained from Model 1 was implemented as heat source in reaction

28
Figure 2.4. Schematic showing strategy for heat transfer simulation in
multichannel reactor model.
channel using UDF. Heat transfer simulation on Model 2 and Model 3 gave
temperature profiles comparable to that of Model 1, although with small difference
along the channel length, less than 1 K, see Figure 2.5. Advection heat transfer along
channel length and its effect on reaction rate in Model 1 may have attributed to the
small difference in temperature profile along channel length. Nevertheless, the
reasonable agreement in temperature profiles between the three models considered,
makes the decoupling approach attractive for heat transfer simulation with a large
multichannel reactor where problem simplification is generally demanded. We
therefore, applied similar approach to simulate heat transfer in our microchannel
reactor block for FT synthesis. The approach is particularly useful when a more
complex physics is to be accounted on the coolant side, as is the case with wall
boiling condition in present study.
Single Channel Reaction & Heat TransferSimulation
Heat GenerationProfile
Multichannel Heat Transfer Simulation

29
Figure 2.5. Temperature [K] profile inside FT reaction channel: Comparison
between model prediction between model with reaction and heat transfer coupled
(Model 1), model with reaction and heat transfer decoupled and considering syngas
flow (Model 2), and decoupled model considering no syngas flow (Model 3).
Heat generation profile corresponding to process condition of 5000 hr-1 GHSV
and 120 % catalyst loading was considered for microchannel reactor block. Cooling
oil (Merlotherm SHTM), subcooled water and saturated water at inlet temperature of
498 K was considered as coolant medium. Both cooling oil and subcooled water
behaves as single phase coolants, whereas, saturated water undergoes phase change
due to wall boiling once channel wall temperature rises above saturation temperature,
500 K in this case. Please note that we assumed coolant stream in case of subcooled
water to be slightly over pressurized to kept it from becoming saturated. In case of
saturated water as coolant, latent heat of vaporization due to wall boiling condition
is expected to provide additional higher heat removal as compared to that of single
phase coolants.
0.00 0.02 0.04 0.06502
504
506
508
510 F
T c
ha
nn
el te
mp
era
ture
[K
]
Channel length(m)
Model 1
Model 2
Model 3

30
(a)
48
(b)
Figure 2.6. (a) 3D Temperature [K] contour on microchannel reactor block with
saturated water as coolant (flow rate = 5.4 g/min), and (b) Heat flux distribution
over reaction channel (GHSV = 5000 hr-1; catalyst loading 120 %)
Syngas inCoolant in
31
(a)
(b)
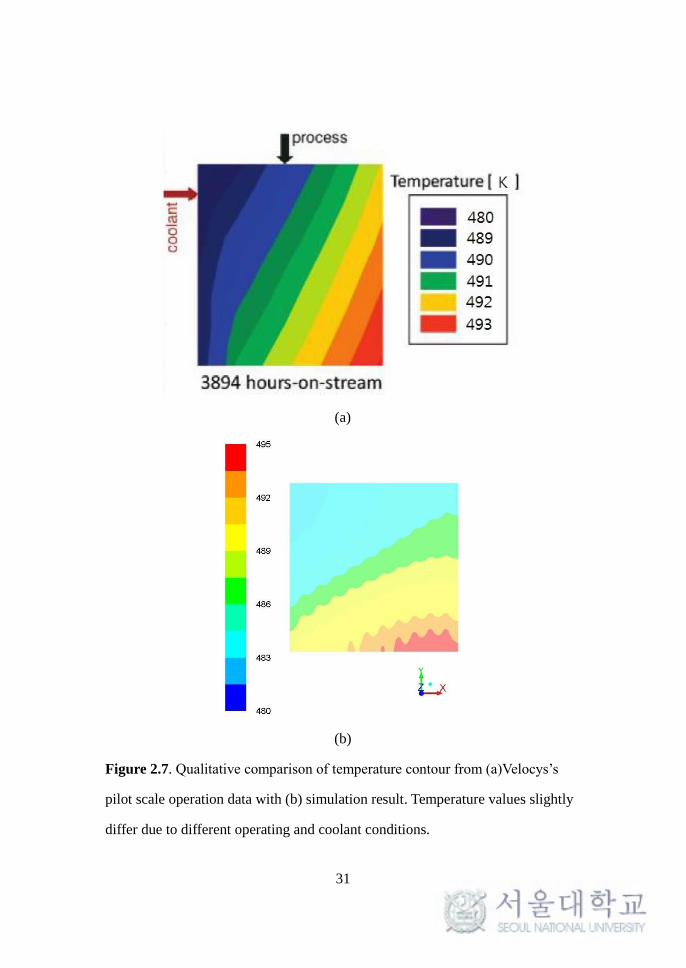
Figure 2.7. Qualitative comparison of temperature contour from (a)Velocys’s
pilot scale operation data with (b) simulation result. Temperature values slightly
differ due to different operating and coolant conditions.

32
Figure 2.6 (a) shows the 3D temperature profile of the simulated microchannel
reactor block. As expected temperature is higher near the syngas inlet region and
decreases along the channel length. Maximum temperature is seen at the corner
furthest away from coolant inlet and region above the process channel layer not
flanked by coolant channel layers on both side. For the coolant channel layer, the
channels near the syngas inlet region has higher temperature compared to the
channels at exit region of FT product. Over all, the maximum temperature difference
between the hottest region and the coldest region is below 15 oC, which is the desired
ΔTmax for normal operation of low temperature FT synthesis. Figure 2.6 (b) shows
heat flux distribution over the lateral surface and along one of the process channel.
This profile indicates that most of the heat transfer occurs in the first half of the
catalyst packed process channel. Figure 2.7 (a) and (b) shows the qualitative
comparison of temperature contour for process channel plane of the simulated
microchannel reactor block with that of thermocouple data obtained from pilot scale
reactor of Velocys. Because of the difference in process and coolant conditions, both
qualitative comparison is possible.
2.7 Conclusion
In this chapter, we presented our CFD modeling and simulation of FT synthesis in a
catalyst packed microchannel reactor considering both single channel and
multichannel reactor models. Simulation of Velocys' experiment ((Deshmukh et
al.6,Tonkovich et al.16) with short single channel reactor validated our single channel
model. At catalyst loading of 1060 kg/m3 CO conversion of 60.02% was achieved

33
with selectivity for CH4 and C5+ (modeled as C14H30 here) as 8.38% and 87.41%
respectively. When the catalyst loading was increased 1.2 times, CO conversion
increased to 74.60 % while the selectivity for CH4 and C14H30 increased to 11.18%
and 85.26% respectively. Temperature effect on CO conversion and selectivity for
CH4 and C5+ revealed necessity for maintaining reaction channel temperature below
523 K, for low-temperature FT synthesis.
On comparing heat generation rates between 60 % loading and 120 % loading
(0.6 and 1.2 times activity), heat generation rate increases almost in proportion to the
catalyst loading or catalyst activity, indicating that active cooling method is required
for FT synthesis that uses high active catalyst.
Heat transfer simulation in a complex microchannel reactor block can be conducted
by decoupling reaction and heat transfer. Comparing a decoupled model with that of
reaction and heat transfer coupled model shows less than 1oC difference in
temperature profile along the channel length. Thermal profile for the simulated
microchannel reactor block is also qualitatively compared with temperature data of
Velocys’ pilot plant operation. Overall, based on the validation of the single channel
reactor with Velocys single channel operation data and qualitative comparison with
multichannel reactor operation data, it can be understood that the various
microchannel reactor models developed using CFD tools can be used to conduct
detail study of FT synthesis.

34
CHAPTER 3 : Detail Study of FT Synthesis in
Microchannel Reactor
3.1 Introduction
In the recent years, microchannel reactors have attracted attention among researchers
of small scale GTL process as they can provide methods for process intensification
(enabling them to increase the reaction rates 10 to 1,000 times faster compared to
conventional reactors) with their short diffusional distance, and lower heat and mass
transfer resistance6,9,10,12,13. And microchannel reactor blocks are considered highly
integrated, compact and modular in nature, allowing them to be portable and safe for
applications in offshore and remote production facilities. The overall capital costs
associated with FT microchannel reactors are said to be relatively low compared to
conventional reactor systems12. Additionally, the small-scale sources for syn-gas like
municipal waste and biomass waste can utilize microchannel technology to produce
liquid fuels6. Few companies like compact GTL, Velocys Inc have developed small
scale GTL technology that use microchannel reactor for FT synthesis unit. ENVIA
Energy has a GTL plant built at Oklahoma City that use Velocys’ novel modular
microchannel reactor 14. Detail study of FT synthesis in microchannel reactor was
conducted with the aim to develop an in-house small scale compact GTL technology
and mainly targeting for remote stranded gas resources and offshore applications.
Design of microchannel reactor for a highly exothermic reaction like FT
synthesis has remained as a big challenge. A number of design decisions are to be
made before coming up with a final design. Additionally, various kind of issues may

35
arise at the time of reactor operation. To address all the possible issues during a
design process and later during reaction operation, a detail study of FT synthesis in
microchannel reactor is conducted through various simulation experiments. First,
characteristics of FT reaction in microchannel reactor is discussed followed by
strategies for exothermic heat removal, discussion on process intensification,
modified reactor block, comparison of reactor flow configuration and comments on
FT product distribution.
3.2 Microchannel FT reaction characteristics
FT reaction is characterized by high exothermicity (heat of reaction = 165 kJ/mol
CO reacted) with both product selectivity and catalyst deactivation showing high
sensitivity to temperature. Accordingly, it is necessary to understand the effect of
operating conditions likes temperature, pressure and syn-gas ratio (H2/CO) on CO
conversion, CH4 selectivity and C5+ selectivity (the desired product in low
temperature FT synthesis). In high-temperature FT synthesis, reactor is operated well
above low-temperature FT synthesis, between 593 ̶623 K and Iron-based catalyst
are generally used and product distribution is mainly oriented to gasoline. Of three
main operating variables (temperature, pressure and H2/CO), temperature control
possess the biggest challenge as both operating pressure and H2/CO can be set to a
desired value and maintained for the entire duration of reactor operation without
much fluctuation. On the other hand, reactor temperature is a function of the
instantaneous rate of reaction and subsequent heat generation inside the reaction
channel. Therefore adequate heat removal and temperature control of the FT reactors
is demanded for high reactor yield and operational safety. If the reactor does not have

36
sufficient cooling system, just within 1 hour after the start of reactor operation,
temperature can shot up to a high value and reaction runaway can happen. In general,
understanding of the reaction kinetics, effect of reactor geometry design variables
and operating conditions on reactor performance are necessary in most reactor design
problem. Therefore, in this section, we present study on FT reaction characteristics
considering two type of reaction kinetics (kinetics-I and kinetics –II), effect of
channel geometry and effect of operating variables on reactor performance.
3.2.1 FT kinetics
In FT reaction, CO and H2 are the reactants and hydrocarbon with wide range of
carbon content are the products. Therefore, depending on the desired product
distribution, reactor can be operated at high temperature FT synthesis mode or at low
temperature FT synthesis mode. Two reaction kinetics are considered to understand
the characteristics of FT reaction in this study: kinetics-I (Fe-based catalyst of
Marvast et al35 and kinetics –II (Co-based catalyst of Velocys US Patent
2012/0132290 A1)16. Reaction scheme and corresponding kinetic data are given in
section 2.2 of previous chapter. Both kinetics –I and II were implemented in the
single channel CFD model of catalyst packed channel of 1 mm × 1 mm × 21 mm
dimension.
Figure 3.1 (a) and (b) shows mole fraction from Fe-based catalyst and Co-based
catalyst. It can be understood that product is well distributed over CH4 to C5+ with
highest mole fraction for CH4 and least for the C5+. Generally, according to
experimental data for almost every mole of CO converted, a mole of H2O is

37
(a)
(b)
Figure 3.1 Mole fraction from (a) Kinetics-I (Fe-based catalyst of Marvast et al35
and (b) Kinetics –II ( Co-based catalyst of Velocys US Patent 2012/0132290 A1)16
0.00 0.05 0.10 0.15 0.200.0
0.2
0.4
0.6
Channel length(m)
Mole
fra
ctio
n H2 CO CO2 H2O
CH4 C2H4 C2H6 C3H8
C4H10-01 C4H10-03 C9H20-01
0.000 0.005 0.010 0.015 0.0200.0
0.2
0.4
0.6
0.8
Channel length(m)
Mole
fra
ctio
n
H2 CO CO2
H2O CH4 C2H6
C3H8 C4H10-01 C5+

38
(a)
(b)
Figure 3.2 Temperature profile from a single channel model using (a) kinetics –I
and (b) kinetics-II

39
produced. This is predicted from both the reaction kinetics. However, in comparing
the two kinetics, kinetics-I predict much higher mole fraction of CH4. This outcome
is not preferred in FT synthesis as CH4 itself (in case of natural gas to liquid process)
is the feed material for syngas (CO & H2) production. Also, from Figure 3.2 (a) and
(b), it can be seen that kinetics-I predicts excessively high temperature at the inlet
region as against the uniform temperature profile predicted by kinetics –II for the
same reactor model and with similar operating conditions. This indicates that
kinetics-I is not completely reliable or not robust and hence not applicable in case of
microchannel reactor model. Nevertheless, since the demand for gasoline is
beginning to shrink, clean liquid syn-crude or wax is the desired product, low-
temperature FT synthesis (493 ̶ 523 K) using cobalt based catalyst is desired
operation type. Accordingly, reaction kinetic data of Velocys cobalt catalyst16 is used
in the rest of the simulation study.
3.2.2 Effect of channel geometry
This section is divided into two parts – Part A for effect of coolant channel
dimensions and Part B for effect of process channel dimensions. This section
summarizes the CFD simulation study to evaluate heat transfer performance of few
(3 to 4) microchannel design candidates. The candidates vary in terms of the channel
geometrical parameters like channel height, width, channel cross sectional aspect
ratio, wall thickness between channels, etc. Separate studies were carried out to
determine the best candidate out of the chosen candidates for (Part A) coolant
channel and (Part B) process channel.

40
(a) 0.5 mm thickness (b) 1 mm thickness (c) 2 mm thickness
(d) 1 mm x 1 mm (e) 1 mm x 2 mm
(f) 1 mm x 1 mm (g) 1 mm x 2 mm
(h) 0.5 mm thickness (i) 1 mm thickness (j) 1.5 mm thickness
Figure 3.3. Multichannel micro reactor design with different thickness between coolant and process
channel plane (a – c), different coolant channel cross section (d – e) and different thickness between
two coolant channels (h – j).

41
Part A: Coolant channel design evaluation
A compact microchannel reactor design with two layers of microchannels, each for
a coolant channel layer and a process channel layer was considered for the present
study. The same microchannel reactor is modified to create a number of reactor
design that varies coolant channel width, height, thickness between coolant channel
and process channel layer, thickness between two coolant channels etc, as shown in
Figure 3.3.
Assumption:
Process channel:
Considered as heat generation region(a heat generation profile as calculated
from ASPEN model with reaction kinetics considered) with heat flow only
and no fluid flow
Coolant Channel:
Fluid flow with no phase change and only sensible heating
Channel Walls:
No heat loss from any exterior wall to the surrounding. Meaning, the
generated heat is taken up only by the coolant by way of conduction through the
contact walls.
Material considered for the simulation
Table 3.1. Materials considered for the simulation
Coolant Liquid water
Process channel Nickel (material property close to catalyst)
Wall Steel

42
Figure 3.4. Total surface heat flux to the coolant channel along the channel length
for different thickness between coolant channel layer and process channel layer after
5 sec simulation time.
Table 3.2. Effect of channel layer thickness
Channel layer thickness
0.5 mm 1 mm 2 mm
Average surface heat flux 34579.72 27169.72 23359.90
% Effect on heat flux 48.03 16.31 0
Effect of thickness between process channel layer and coolant channel layer on
heat transfer performance is first investigated. From heat transfer perspective, lesser
thickness allows higher heat flux, as evident from the heat flux comparison between
multi-channel design of different layer thickness. Therefore, 0.5 mm thickness
0.024 0.028 0.032 0.036 0.040
0.0
2.0x10⁴
4.0x10⁴
6.0x10⁴
8.0x10⁴
1.0x10⁵
1.2x10⁵
1.4x10⁵
0.5 mm thickness
1 mm thickness
2 mm thickness
To
tal S
urf
ac
e H
ea
t fl
ux
(W/m
2)
Coolant channel length(m)

43
allows higher heat flux as compared to 1 mm and 2 mm thickness.
Four designs of coolant channel cross sections were considered as given in Figure
3.3 (d –g).
Figure 3.5. Total surface heat flux to the coolant channel along the channel length
for different coolant channel cross section types at 7 sec simulation time [same mass
flow rate differing inlet velocities]. Coolant inlet velocity differs in order to maintain
same coolant mass flow rate.
0.024 0.028 0.032 0.036 0.040
0.0
5.0x10⁴
1.0x10⁵
1.5x10⁵
2.0x10⁵
To
tal S
urf
ac
e H
ea
t fl
ux
(W/m
2)
Coolant channel length(m)
Coolant cross section types
1 mm x 2 mm, inlet velocity = 0.045 m/s
2 mm x 2 mm, inlet velocity = 0.0225 m/s
1 mm x 1 mm , inlet velocity = 0.09 m/s

44
Table 3.3. Effect of different coolant channel cross section types [same mass flow
rates differing inlet velocities]
Coolant Channel cross section type
[same mass flow rates]
1 mm x 1mm 1 mm x 2mm 2 mm x 2mm
Inlet velocity [m/s] 0.09 0.045 0.0225
Average surface heat
flux[ W/ m2] 40911.32 21891.43 21217.36
% Effect on heat flux 92.82 3.17 0
For coolant with same mass flow rates differing in velocities, 1 mm x 1 mm channel
type allows higher heat flux as compared to that of 1 mm x 2 mm and 2 mm x 2 mm
channel types.
Table 3.4. Effect of different coolant channel cross section types [different mass
flow rates keeping same inlet velocities]
Coolant Channel cross section type [same inlet velocities, 0. 09 m/s]
1 mm x 1mm 1 mm x 2mm 2 mm x 1mm 2 mm x 2 mm
Average surface
heat flux[ W/ m2] 34579.72 20194.52 23880.62 21790.48
% Effect on heat
flux 71.23 0 18.25 7.9

45
For same coolant velocities differing in mass flow rates also 1 mm x 1 mm channel
type allows higher heat flux as compared to that of 1mm x 2 mm, 2 mm x 1 mm and
2 mm x 2 mm channel types.
Table 3.5. Effect of different coolant channel cross section types/orientation [same
mass flow rates, same inlet velocities]
Coolant Channel orientation
1 mm x 2mm 2 mm x 1mm
Average surface heat flux [ W/ m2] 21217.36 23572.40
% Effect on heat flux 0 11.10
Table 3.6. Effect of wall thickness between coolants [same mass flow rates, different
inlet velocities] after 7 sec simulation.
Coolant channel wall thickness
(7 second simulation)
0.5 mm 1 mm 1.5 mm
Average surface heat flux[ W/ m2] 41919.08 40927.36 31305.35
% Effect of 1 mm over 2 mm on heat
flux 33.90 30.73 0
Table 3.2 – 3.6 summarize the simulation analysis considering microchannel reactor
geometry design. If the coolant channel is oriented in such a way that surface area of
the wall facing the process channel layer is higher, it ensures higher heat flux. This

46
is evident from the heat flux comparison between coolant channel orientation of 1
mm x 2 mm and 2 mm x 1 mm. 2 mm x 1 mm orientation (more surface area in
contact with the process channel layer) allows 11.1 % increase in the average heat
flux.
On comparing the heat flux for design with 1.5 mm and 0.5 mm wall thickness,
the later has 5.26 % increment over the former implying that effect of coolant
velocity slightly dominates when the heat transfer surface areas are not significantly
different. There are 8 coolant channels with 1 mm wall thickness and 7 coolant
arrangement with 1.5 mm coolant thickness. And as the total coolant flow rate is
fixed, the coolant velocities for 1 mm and 1.5 mm thickness are 0.09 m/s and 0.102
m/s respectively.
Simulation analysis on effect of wall thickness indicates that lesser thickness
allows higher heat flux. 0.5 mm wall thickness allows higher heat flux as compared
to 1 mm and 2 mm thickness. Therefore 0.5 mm wall thickness may be more suitable
for the compact GTL reactor design. For same mass flow rates differing in velocities,
1 mm x 1 mm channel type allows higher heat flux as compared to that of 1mm x 2
mm and 2 mm x 2 mm channel types. Coolant channel oriented in such a way that
surface area of the wall facing the process channel layer is higher, ensures higher
heat flux. This is evident from the heat flux comparison between coolant channel
orientation of 1 mm x 2 mm and 2 mm x 1 mm.2 mm x 1 mm orientation (more
surface area in contact with the process channel layer) allows 11.1 % increase in the
average heat flux as compared to 1 mm x 2 mm. Reducing the coolant channel height
to 1 mm from 2 mm has an effect of 12.51 % increase in average heat flux (for
coolant channel base width as 2 mm) and 71.23 % increase in average heat flux for
(coolant channel base width as 1 mm).

47
Coolant wall thickness (from study of 0.5 mm, 1mm and 1.5 mm thickness) has
an effect in a way that how many coolant channels can be lined up within a fixed
length (constrained by process channel length), and hence the consequence on the
heat flux rate. However, rate of heat flux is found to be dominated by the coolant
velocities in the coolant channels. This is evident from the heat flux comparison for
0.5 mm, 1 mm and 1.5 mm wall thickness between the coolant channels. For the
fixed mass flow rate of the coolant by varying velocities, 1 mm and 1.5 wall
thickness showed higher heat flux as compared to 0.5 wall thickness. This is because
the coolant velocities are higher in channels with wall thickness 1 mm and 1.5 mm
than that of 0.5 mm thickness.
Part B: Process channel design evaluation
In this part of the report, simulation study to compare heat transfer quantities like
heat flux, and lateral temperature profile of candidate channel heights of 2 mm, 3
mm and 5 mm is presented. It is generally expected that shorter channel height of
process channel will be more efficient in term of heat removal. This aspect is
investigated quantitatively in section part. Also as the channel size decrease, the
catalyst loading will approach uniformity and lead to uniform rate of reaction any
cross section area, thereby resulting to near uniform radial temperature.
Figure 3.6 shows Lateral (or radial) temperature profile for 2 mm, 3 mm and 5 mm
channel height and considering same channel length of 200 mm. Although the
temperature difference is very less (less than 1 oC), shorter channel height predicts
much uniform radial temperature.

48
Figure 3.6. Lateral (or radial) temperature profile for 2 mm, 3mm and 5 mm channel
height and channel length of 200 mm
0 1 2 3 4 5498.1
498.2
498.3
498.4
498.5
498.6
Late
ral
tem
pera
ture
pro
file
[K
]
Channel height [mm]
Channel height
2 mm
3 mm
5 mm

49
Figure 3.7 Lateral (or radial) temperature distribution along the channel length for
2 mm channel height and channel length of 200 mm
Figure 3.7 shows radial temperature distribution along the channel length for 2
mm channel height. Simulation predicts less than 1 oC temperature difference along
the channel length for process channel height of 2 mm. This indicates that shorter
channel height is preferred as against higher channel height for efficient heat removal
from process channel in microchannel reactor.
3.2.3 Effect of operating conditions
To understand the importance of maintaining reactor temperature at particular value,
effect of reactor temperature on CO conversion, CH4 selectivity and C5+ selectivity
0.0 0.5 1.0 1.5 2.0
498.150
498.152
498.154
498.156
498.158
498.160
498.162
Late
ral
tem
pera
ture
pro
file
[K
]
Channel height [mm]
Location along channel length
10 mm
100 mm
150 mm

50
were re-examined. This was facilitated by setting different temperatures as the wall
thermal boundary condition on a pair of the opposite walls of Single Channel-B
shown in Figure 2.1 of Chapter 2. Due to the short heat transfer distance with 1 mm
x 1 mm cross sectional channel, temperature at reactor internal was almost equivalent
to that of wall temperature. Simulation results in Figure 3.8 shows that increase in
channel temperature leads to increase in both CO conversion and undesired product
- CH4 selectivity, while selectivity for desired product - C5+ decreases. For example,
when syngas flow rate was 5000 hr-1 GHSV and catalyst loading as 120 %, reactor
temperature maintained at 523 K gives CO conversion of 86.6%, with selectivity for
CH4 and C5+ as 19.5 % and 74.9% respectively. But when the reactor temperature
was reduced to 508K, CO conversion was reduced to 69.2% while selectivity for
CH4 decreases to around 12.6% and selectivity for C5+ increases to around 83.2%.
Similar trend was observed by Myrstad et al.9, Tonkovich et al.16 and Ying et al.45 in
their experiments. This indicates that for a desired reaction conversion and product
selectivity, it is necessary to maintain reaction channel temperature below a
particular value, say 523K in this case. Generally, as the intrinsic activity of the
catalyst decline, reactor is operated at slightly higher temperature to achieve the same
level of CO conversion.
On simulating different syngas ratio with the same reactor model, result
indicates higher CH4 selectivity and lower C5+ selectivity for syngas ratio of 1.5
compared to syngas ratio of 2, as shown in Figure 3.9. Also at higher syngas ratio of
2.5, CH4 selectivity is high (above 25 %). This is expected as higher syngas ratio
promotes methanation reaction and lower syngas ratio promotes carbon formation
through Boudouard reaction. In most microchannel FT synthesis, syngas ratio of 2
is considered optimum stoichiometric ratio. This is indicated from our simulation

51
analysis where syngas ratio of 2 gives optimum CH4 and C5+ selectivity.
On studying the effect of operating pressure on CO conversion, CH4 and C5+
selectivity, the result indicates CO conversion above 8)% for the range of simulated
conditions (operating from 18 bar to 26 bar), but with undesired CH4 and C5+
selectivity for 18 bar and 26 bar. On the other hand, at operating pressure of 22 bar
highest C5+ selectivity is predicted. This result indicates that operating pressure of
20 bar to 22 bar could be optimum operating range.
Figure 3.8. CO Conversion (conv.), CH4 and C5+ selectivity (sel.) from FT reaction
simulation with Single-Channel-B at different channel temperature [Process
condition: GHSV = 5000 hr-1; catalyst loading =120 %]
480 495 510 5250
20
40
60
80
100
Temperature (K)
CO
Co
nvers
ion (
%)
CO conv.
CH4 sel.
C5+
sel.
0
20
40
60
80
100
CH
4 , C5
+ Se
lectiv
ity (%
)

52
Figure 3.9. Effect of syngas ratio on CO conversion and CH4 selectivity.
Figure 3.10. Effect of operating pressure on CO conversion and CH4 selectivity
[Process condition: GHSV = 5000 hr-1; catalyst loading =120 %].
1.5 2.0 2.5
0
20
40
60
80
100
% C
onve
rsio
n, S
elec
tivity
H2/CO
XCO
CH4 Sel
18 20 22 24 26
0
20
40
60
80
100
Operating Pressure (bar)
% C
onve
rsio
n, S
elec
tivity
XCO
CH4 Sel
C5+ Sel

53
3.3. Strategies for heat exothermic heat removal
In this section, we present our investigation on common strategy used at industrial
and lab-scale to adequately remove exothermic heat from a typical microchannel
reactor block. Multichannel reactor model developed using CFD tool and described
in the previous chapter is coupled with wall boiling phenomena in coolant channels
to quantify effect of wall boiling condition on heat transfer enhancement and
comparison of wall boiling coolant to that of common single phase coolant – water
and heating oil.
3.3.1 Wall boiling coolant and heat transfer enhancement
Figure 3.11. Schematic of heat transfer in microchannel reactor system (a) for wall
boiling condition, (b) non-evaporative coolant.
In coolant channels, flow is single phase liquid, in case of cooling oil and
subcooled water. Whereas, it is two-phase flow in case of saturated water due to wall
boiling condition. Consequently, laminar flow is assumed for cooling oil and

54
subcooled water, and turbulence flow for saturated water under wall boiling
condition. Relevant conservation equations for phase continuity, momentum and
energy transfer are applied. Source term in continuity equation and buoyancy effect
in momentum equation are also considered in case of two-phase wall boiling flow.
Eulerain-Eulerian multiphase framework with interpenetrating continua, reviewed in
detail by (Ishii38; Drew and Passman39; Yeoh and Tu40), was applied to model two-
phase wall boiling flow with liquid as continuous phase and vapor as discrete phase.
Figure 3.12. Schematic of mechanistic wall boiling model of saturated coolant
( Kurual and Podowski, 1991)41
Heat flux from the heated wall to the coolant is described by mechanistic model
of Kurul and Podowski41,42 which is a summation of heat fluxes due to different
mechanisms, as described in Figure 3.12. In the region where liquid is in contact

55
with heated wall, heat transfer is same as that of single phase flow, called convective
heat transfer. In the region where bubbles suddenly form and grow, heat is taken up
by vapor generation, called evaporative heat transfer. And heat transfer due to
recirculation and the liquid replacing the bubble sites is called quenching heat
transfer. Accordingly, the total wall heat flux is defined as sum of the three parts:
Mechanistic wall heat flux: tot C Q E
Q Q Q Q
(3.1)
Where C
Q , Q
Q and E
Q represent the heat flux component due to convection,
quenching and evaporation, respectively. Detail models of the component heat fluxes,
corresponding heat transfer co-efficient correlations including closing parameters:
bubble diameter at detachment, nucleation site density, and bubble influence area
and bubble detachment frequency are reviewed in Krepper and Rzehak15. Mass
transfer from the liquid phase to vapor is accounted by the rate of evaporation which
is a function of bubble diameter at detachment, nucleation site density and bubble
detachment frequency. Since temperature difference between liquid phase and vapor
phase are expected to be small, heat transfer between the two phases is assumed to
be negligible as compared to the heat transfer from the channel wall.
For single-phase coolant flow as is the case with subcooled oil and subcooled
water, convective heat transfer is assumed to be the only means of heat removal and
only the first term in eq. (3.1) will remain.
Figure 3.13 shows the temperature contour of reactor block when same value of
flow rates (5.4 g/min) was applied for all three coolant types. ∆Tmax , defined as

56
temperature difference between hottest spot and coldest spot in the reactor (coldest
spot is equal to coolant inlet temperature which is 498 K in the present case) is
highest in case of cooling oil as coolant (∆Tmax = 32 K) and least for saturated
water as coolant (∆Tmax = 12 K) with that of subcooled water lying in
between(∆Tmax = 17 K). The result implies that subcooled water has higher cooling
capacity than cooling oil. And saturated water has higher cooling capacity than
subcooled water with relative difference varying over extend of wall boiling.
On comparing computed heat fluxes through coolant channels, see Figure 3.14(a)
-(c), higher heat flux was obtained in case of saturated water compared to subcooled
water and cooling oil. However, in all three cases, coolant channels adjacent to the
reaction channel inlets have higher heat fluxes compared to other coolant channels
on the same plane. This is expected as reaction rates and hence heat generation rate
are much higher at the channel inlet region. Similar trend was reported by Tonkovich
et al.16. Computed average heat transfer co-efficient (ℎ) and heat flux (Q̇) through
the channels for three coolants cases are given in Table 3.7. Lower heat flux was
achieved with cooling oil, 8783.4 W/m2 as compared to subcooled water, 8850.1
W/m2 and saturated water, 8952.9 W/m2.

57
Figure 3.13. 3D Temperature [K] contour on microchannel reactor block for cooling oil (a), subcooled
water (b) and saturated water (c) as coolants with flow rate = 5.4 g/min per channel (GHSV = 5000
hr-1; catalyst loading 120 %). +ve X direction: coolant flow; +ve Y direction: syngas flow
(a) (b)
(c)

58
Higher heat flux in subcooled water and saturated as compared to that of cooling
oil is primarily due to higher thermal conductivity of the former two. However,
between subcooled water and saturated water, wall boiling condition in case of
saturated water provided additional heat removal capacity. Degree of additional heat
removal capacity (or heat transfer enhancement) would however depend on extend
of boiling along the coolant channels. With average exit vapor fraction of 0.13,
enhancement in wall heat flux was nearly 3 W/m2. By allowing slightly higher exit
vapor fraction, more enhancement in heat transfer is expected as more fraction of
coolant will get vaporized in coolant channels.

59
Figure 3.14(a). 3D Heat flux [W/m2] contour on coolant channels for oil as coolant
with flow rate = 5.4 g/min per channel (GHSV = 5000 hr-1; catalyst loading
120 %). +ve X direction: coolant flow; +ve Y direction: syngas flow

60
Figure 3.14(b). 3D Heat flux [W/m2] contour on coolant channels for subcooled
water as coolant with flow rate = 5.4 g/min per channel (GHSV = 5000 hr-1;
catalyst loading 120 %). +ve X direction: coolant flow; +ve Y direction: syngas
flow

61
Figure 3.14(c). 3D Heat flux [W/m2] contour on coolant channels for saturated
water as coolant with flow rate = 5.4 g/min per channel (GHSV = 5000 hr-1;
catalyst loading 120 %). +ve X direction: coolant flow; +ve Y direction: syngas
flow

62
Table 3.7. Heat flux & heat transfer coefficients for GHSV 5000 hr-1 & catalyst
loading 120 % (100% catalyst loading = 1060 kg/m3).
Parameters
Cooling
oil
Subcooled
water
Saturated
water
coolanth ( W/m2-K) 39.6 41.2 41.9
coo lan tQ (W/m2) 8783.4 8850.1 8952.9
processh (W/ m2-K) 38.4 40.9 41.3
processQ (W/m2) 8881.6 8885.3 8887.7
ΔT (K) 32 17 12
Avg. exit vapour fraction - - 0.13

63
Figure 3.15(a). 3D Temperature [K] contour on reaction channels of microchannel
reactor block for wall boiling coolant flow (GHSV = 5000 hr-1; catalyst loading
120 %; saturated water flow rate = 5.4 g/min per channel). +ve X direction: coolant
flow; +ve Y direction: syngas flow

64
Figure 3.15(b). 3D Temperature [K] contour on coolant channels of microchannel
reactor block for wall boiling coolant flow (GHSV = 5000 hr-1; catalyst loading
120 %; saturated water flow rate = 5.4 g/min per channel). +ve X direction: coolant
flow; +ve Y direction: syngas flow
Temperature range of 483 to 513 K is generally desired to maximize the middle
distillate for low temperature FT synthesis (Arzamendi et al.1). In this present case
of syngas flow rate of 5000 hr-1 GHSV, catalyst loading 120 % and H2/CO as 2,

65
saturated water flow rate range of 3 g/min to 9 g/min can be considered an adjustable
range. When saturated water flow rate was 5.4 g/min in each coolant channel, ∆Tmax
(defined as temperature difference between hottest spot and coldest spot in the
reactor) was less than 15 K. Temperature in all three reaction channel planes were
predicted between 498 K and 508 K, see Figure 3.15(a), expect for one reaction
channel plane which has only one coolant channel plane at below to remove heat.
Intuitively, it can be commented that if a coolant channel plane is added on the other
side (at above), then this reaction channel plane will probably have its hottest spot
(also called as peak temperature) not exceeding 508 K. As far as coolant channel
planes are concern, temperature is nearly isothermal in most of the region, except for
the regions near reaction channel inlet and hottest spot, as seen in Figure 3.15(b).
This is expected with saturated water as coolant as some of the heat is removed
through evaporative heat flux ( )E
Q and quenching heat flux ( )Q
Q in addition to
convective heat flux ( )C
Q .
For a particular process condition, reactor temperature can be controlled at a
value within a desired range by adjustable coolant flow rate, saturated water flow
rate in this case. Simulations were carried out to see effect of saturated water flow
rate on reactor temperature of the multichannel block model. Figure 3.16 and figure
3.17 illustrates the saturated water volume fraction profile along coolant channel
length for two different coolant inlets, 0.02 m/s and 0.09 m/s. As expected, with
higher coolant inlet, higher exit liquid volume or lower vapor fraction is obtained.
From Figure 3.18, it is understood that both average exit vapor fraction and mean FT
temperature can be strong function of saturated water flow rate. Average exit vapor

66
fraction is the average of vapor fraction by mass at the exit of all 40 coolant channels.
Mean FT temperature is the mean temperature of all 40 reaction channels. For
saturated water flow rate of 1 g/min, vapour fraction was around 0.4 and the value
decreases to 0.2 when the saturated water flow rate was increased to 5.5 g/min. The
values of coolant flow rate given here are per channel basis. At around saturated
water flow rate of 3 g/min, mean FT temperature is around 510 K and the value
decreases as we increase the coolant flow rate. But the decrease in temperature slows
down for flow rates above 6 g/min, and eventually tends to settle down to the
saturated temperature, 500 K in this case. On the other side, if the coolant flow rate
is lower than a particular value, coolant flow under wall boiling condition will be
predominantly vapor and local dry out can occur inside coolant channel, in addition
to the insufficient cooling of reaction channels. Local dry out inside coolant channels
is highly undesired as it can lead to drastic reduction in heat transfer and subsequent
over heating of the spot resulting into possible thermal runaway. Therefore, a range
of adjustable saturated water flow rate should be sought for a particular process
condition to maintain reactor temperature to a desired value and still prevent risky
condition of local dry out.

67
Figure 3.16. Liquid volume fraction in wall boiling coolant channel for 0.02 m/s
inlet velocity
Figure 3.17. Liquid volume fraction in wall boiling coolant channel for 0.09 m/inlet
velocity.

68
Figure 3.18. Effect of saturated water flow rate on vapor fraction and mean FT
channel temperature (GHSV = 5000 hr-1; catalyst loading 120 %)
Figure 3.19. Effect of saturated water flow rate on average heat flux through
coolant channels (GHSV = 5000 hr-1; catalyst loading 120 %).
0 2 4 6 8 100.0
0.2
0.4
0.6
0.8
1.0
Vap. frac
Mean FT temp
Coolant flow rate (g/min)
Vap
our
fra
ctio
n
500
504
508
512
516 Me
an
FT
tem
pe
ratu
re (K
)
0 2 4 6 8 100
2x10³
4x10³
6x10³
8x10³
Avera
ge
Hea
t flux
(W/m
2)
Coolant flow rate (g/min)
Qtot
QC
QE

69
To explain the effect of saturated water flow rate on average vapor fraction and
mean FT temperature, we need to look at the trends for component heat fluxes over
saturated water flow rates considered. In Figure 3.19, it is seen that 𝑄𝐸 increases for
saturated wate flow rates until around 1.2 g/min and then goes on to decrease slightly
as the coolant flow rate is increased. This is because, at lower saturated water flow
rates and up to a value, extend of boiling is higher, but decreases as flow rate
increases beyond that value. While Q
Q also follows nearly the same trend, C
Q
on other hand, increases as the coolant flow rate increases, which is expected. It is
interesting to note that between a range of saturated water flow rate, 3 g/min to 9
g/min here, the total heat flux values are almost constant and at their highest limit.
This gives an idea for adjustable range of saturated water flow rate.
It may be commented that for laboratory scale single channel Fischer-Tropsch
reaction, higher cooling capacity coolants like saturated water may not be necessary
and the generated heat can be removed by lower rank coolant like heating oil-
Marlotherm SH (Deshmukh et al.6). For laboratory scale operation, getting saturated
water supply may either be not economical or difficult to get. Also, high-temperature
FT synthesis require less cooling load compared to low-temperature FT synthesis.
This is evident from the work of Gumuslu and Avci17 where they used steam to
remove heat from their microchannel FT reaction channels. In low temperature FT,
temperature between 493 and 523 K is preferred as the desired product is middle
distillate and any increase in temperature beyond this range will not favor chain
growth.

70
3.3.2 Catalyst zone division and discrete dilution
Use of highly active modern Iron and Cobalt based catalyst, coupled with high heat
generation (165 kJ/ mol CO) of FT synthesis have resulted to the problem of high
temperature gradient along the channel length. One method to address the problem
is to use highly effective commercially available thermal fluids such as MelothermTM ,
and saturated water as coolants, as explored by Deshmuk et al6 and Tonkovich et al16
in their experimental study, and simulation study in the previous section. However,
thermal fluids can be expensive, and saturated water can be difficult to handle in
actual operations compared to those of cheaper and single phase coolant like
subcooled water. Another method to avoid high thermal gradient and maintain a
minimum thermal gradient along the channel is to divide the whole reactor length
into a number of discrete zones and load different amount of catalyst in each zone, a
method hereby called as method of discrete dilution. Figure 3.20 shows the
schematic of catalyst zone division and application of different % catalyst loading to
each zone.
Figure 3.20. Schematic showing catalyst bed zone division
The method of catalyst dilution to control reaction rates and prevent excessively

71
high temperature peak inside reactors have been considered in existing works on
catalyst packed tubular reactor46-49 for other highly exothermic reactions. For
instance, Hwang and Smith50 employed combined effect of catalyst dilution and
feed-stream distribution to achieve optimal control of temperature profile inside their
multi-bed multi-tubular reactors for nitrobenzene hydrogenation and ethylene
oxidation.
Simulation was conducted with different catalyst loading considering validated
Velocys short single channel model (Single channel A described in Table 2.1 of
chapter 2). In the first simulation case, catalyst bed zone was divided into three
different zones and loaded with 30% for the zone closest to inlet region, 40% for the
middle zone and 50% for the remaining zone. Figure 3.21 shows the comparison of
heat generation profile for discrete catalyst loading with that of uniform catalyst
loading. As expected, the simulation predicted lower heat generation in the zone
closest to syngas inlet compared to that of uniform loading all throughout the channel
length. Therefore the simulation indicates that discrete catalyst dilution is a feasible
strategy for distributing the heat generation evenly along the channel length. This
further will remove the challenge to maintain uniform temperature profile along the
reaction channel. This strategic loading can also help in easer flow of the FT product
down the channel, especially for C5+ product components like wax, if most of the
C5+ products are formed in the second half of the catalyst packed region, as shown
in Figure 3.22.

72
Figure 3.21. Heat generation profile for different catalyst loading method (a)
uniform loading (50 % catalyst loading ), (b) catalyst zone division and non-uniform
loading (1st zone 30 %, 2nd zone 40% and 3rd 50 %)

73
Figure 3.22. Reaction rates for C5+ product formation at different catalyst zones
with 30%, 40 % and 50 % catalyst loading.
However, a non-optimized method of discrete dilution would not necessarily
guarantee an optimal reactor performance. On the other hand, an optimal number of
discrete zones, zone length and % loading is expected to prevent abnormally high
FT reactions and consequently undesirably high heat generation at any region inside
the reaction channel. On that regard, different cases with different number of catalyst
zone division, different zone length and different % loadings are considered. Figure
3.23 shows the heat generation and temperature profile for strategy –I (1st zone 30 %,
2nd zone 40% and 3rd 50 %) and strategy –II (1st zone 30 %, 2nd zone 50% and 3rd
60 %).

74
Figure 3.23. Heat generation and temperature profile showing effect of different catalyst loading strategy
in divided zones. (a) Heat generation profile for strategy –I (1st zone 30 %, 2nd zone 40% and 3rd 50 %). (b)
Heat generation profile for strategy –II (1st zone 30 %, 2nd zone 50% and 3rd 60 %). (c) Temperature profile
for strategy-I and (d) temperature profile for strategy-II.

75
Figure 3.24. Temperature profile showing effect of different catalyst loading strategy in divided zones. (a)
showing difference between 2 and 3 zone division, (b) showing effect of zone length.
0.00 0.02 0.04 0.06 0.08500
505
510
515
520
bed zones
bed zones
(a) (a)
Reacto
r T
em
pera
ture
(K
)
Channel length(m)
2 catalyst bed zones
3 catalyst bed zonesT = 1K
0.00 0.02 0.04 0.06 0.08500
505
510
515
520
Longer 1st
zone
Shorter 1st
zonePre-heating
(b)
Shorter 1st
zone catalyst bed
Longer 1st zone catalyst bed
Reacto
r T
em
pera
ture
(K
)
Channel length(m)

76
Temperature profile in Figure 3.23 indicates slightly better result in terms of ΔTmax
for strategy –I compared to strategy –II. Effect of different number of zones (between
2 zone division and 3 zone division) and different zone length is illustrated in Figure
3.24. It can be clearly seen that 3 zone division is better than 2 zone division in terms
of ΔTmax and having longer 1st zone length is better than having shorter 1st zone.
3.3.3 Nano-fluid as coolant
Nanofluids are thermal fluids with nanoparticles added in it to increase the thermal
conductivity of the thermal fluids. The thermophyscial properties can vary
depending on the type of nanoparticle, base fluid, particle volume fraction and
particle size. Nanofluids are usually used for heat transfer enhancement in
microchannel heat sinks by Hung et al51. It was first proposed by Choi et al52 while
working at Argonne National Laboratory, USA as a means to raise thermal
conductivity of coolant and allow improved heat transfer performance.
In the present study, alumina water nanofluid with property given in Table 3.8 is
considered for comparison of simulation prediction with that of Melotherm Oil as
coolant. As shown in the temperature contour on Figure 3.23, a small heat transfer
enhancement (ΔTmax decrease of 3 oC) is able to achieve by using nanofluid (alumina
water in this case) compared to using melotherm Oil. However, the relative price of
the two coolant may offset the benefit in heat transfer enhancement. In that case,
operating cost calculation can be conducted, which is not covered in the present work.
On the other hand, thermal performance of other nanofluids like SiO2-H2O, CuO-
H2O can also be investigated.

77
Table 3.8. Physical properties of candidate coolant medium.
Properties Water
(Base
fluid)
Oil Nanofluid
(alumina water)
2.5% vol 5% vol
Density (kg/m3) 998.2 936 1072.5 1140.79
Heat capacity (J/kg-K) 4182 1967 3865.79 3590.55
Thermal conductivity (W/m-K) 0.613 0.0974 0.658 0.706
Viscosity (Ns/m2) 0.00088 0.001003 0.001066 0.001128

78
(a)
(b)
Figure 3.26. Reactor temperature contour showing enhancement in heat removal
for (a) nanofluid as coolant (ΔTmax = 12 oC) compared to (b) Oil as coolant
(ΔTmax = 15 oC).

79
3.4 Process intensification
Performance in terms of temperature control under intensified process condition (30,
000 hr-1 GHSV, catalyst loading 300 %) is tested for subcooled water and saturated
water as coolant. This process condition is well above those used in commercial
slurry and fixed bed reactor (Cao et al.10) indicating the feasibility for process
intensification with microchannel teachnology, combined with cobalt based active
catalyst produced by Oxford Catalysts53 that can produce high CO conversion even
with contact time as low as 0.029 s.
Figure 3.27 shows the predicted heat generation profile from single channel
simulation at intensified condition. It may be mentioned here that catalyst loading
above 100 % simply means catalyst activity above activity of the present Co-based
catalyst of Velocys. As can be seen from the simulation predictions, heat generation
rate scales up in equal proportion as the rate of reaction and hence coolants that active
cooling means is needed. Therefore, cooling oil was not tested with the intensified
condition as cooling oil was found to have much lower cooling capacity compared
to other two coolants even at lower process condition (5, 000 hr-1 GHSV, catalyst
loading 120 %).

80
Figure 3.27. Heat generation profile from FT reaction simulation in single-channel-
B for different catalyst loading [GHSV = 30000; H2/CO = 2]. 220% catalyst loading
corresponds to catalyst activity of 2.2 times the activity of the present catalyst.
As can be seen from Figure 3.28, at high value of coolant flow rate of 13.2 g/min
per channel, cooling capacity for saturated water is much higher as compared to that
of subcooled water. With saturated water, the mean FT temperature was 510 K,
whereas in the case of subcooled water, it was 519 K. This tells us that at intensified
process condition, subcooled water cannot sufficiently remove the generated heat
from FT reaction in reaction channels, whereas saturated water through its wall
boiling condition is able to sufficiently cool the reaction channels below a desired
temperature of 513 K. Computed average heat flux through coolant channels was
39101 W/m2 and 39095 W/m2 for saturated water and for subcooled, respectively.
0.00 0.01 0.02
1x10⁻⁴
2x10⁻⁴
3x10⁻⁴
60% X
67% X
65% X
70% X
Channel length(m)
Hea
t g
en
era
tion
[kJ/s
] 220 % loading
260 % loading
280 % loading
300 % loading

81
Figure 3.28. 3D Temperature contour (in Kelvin) on reaction channels for (a) subcooled water as
coolant and (b) saturated as coolant (wall boiling condition) for intensified process condition (GHSV =
30000 hr-1; Catalyst loading 300 %). Coolant flow rate = 13.2 g/min per channel. %); +ve X direction:
coolant flow; +ve Y direction: syngas flow

82
Just 6 W/m2 difference resulted to 9K indicating that heat flux is an important
parameter in thermal performance of microchannel reactor.
This lead us to the reasoning that if effective thermal conductivity and heat
transfer co-efficient on reaction channel side is high, the reactor may give better
thermal control. In a catalyst filled reaction channel, effective thermal conductivity
can be increased by using catalyst support having high thermal conductivity, for
example β −SiC which has a thermal conductivity of 106 W/m-K (Zhu et al.54).
However, results for heat transfer simulation with catalyst support having different
conductivities is not discussed here. Also, from temperature contour of reactor block,
it is clear that hot spot is located at the corner of top most reaction channel plane (e.g.
channel plane at -ve most Z in Figure 3.28) where the reaction channel plane does
not have two coolant channel planes on either of the adjacent sides. Therefore, it
becomes an obvious reasoning that if a coolant channel plane is added on top of the
reaction channel plane (located at -ve most Z), hot spot can be prevented
significantly. Correctness of this idea will be checked and presented in one of the
following section.
Simulation analysis with intensified process condition (Cao et al.10) showed
effective conductivity of reaction channel to have strong effect on reactor thermal
performance. Consequently, for such applications, to obtain high effective
conductivity of reaction channel, catalyst support having high thermal conductivity,
for example β −SiC which has a thermal conductivity of 106 W/m-K (Zhu et al.54)
may be preferred.

83
3.5 Modified reactor block
With an attempt to prevent forming hot spot, as seen in temperature contour of base
case reactor block, reactor geometry was modified by adding an additional coolant
channel plane to make reactor block of 4 reaction channel planes and 5 coolant
channel planes. As seen in Figure 3.29(a), temperature contour on modified reactor
block considering same process condition (5000 hr-1 GHSV, catalyst loading 120 %)
and saturated water as coolant showed significant reduction in the temperature of hot
spot. Except for the syn-gas inlet region, where the reaction rate is highest and
temperature peak is 505 K (∆Tmax = 7 K), rest of the region along channel length
has temperature between 498 K and 502 K. However, due to an additional coolant
plane, the average exit vapor fraction in this case has also lowered, from 0.13 % in
base case reactor block to 0.06 % in the modified reactor block. Similar significant
improvement are expected with the cooling oil and subcooled water. In fact, as seen
in Figure 3.29(b), with subcooled water as coolant, the peak temperature has
decreased from 515 K to around 509 K (∆Tmax = 11 K). Therefore, it can be
concluded that modified reactor block gives better thermal performance than the base
case reactor block. Additionally, as can be understood from the values of ∆Tmax ,
when saturated water was used as coolant, even at exit vapor fraction less than 0.1%,
the modified geometry predicted noticeably smaller temperature gradient (5 K less)
than the single phase subcooled water. With cooling oil the difference is expected to
be significant.
It may be commented that for laboratory scale single channel FT reaction,
coolants with higher rank in cooling capacity like saturated water may not be

84
necessary and the generated heat can be sufficiently removed by lower rank coolant
like heating oil- Marlotherm SH (Deshmukh et al.655). For laboratory scale operation,
getting saturated water supply may either be not economical or difficult to get. Also,
lower rank coolants may be able to cool the reaction channels sufficiently in case of
high-temperature FT synthesis, even for multichannel FT reactor, as was explored
by Gumuslu and Avci12 in their simulation study. In low temperature FT synthesis,
active cooling methods would generally be necessary to maintain reactor
temperature between 493 and 523 K to maximize middle distillate among FT
products. Song et al.55, from their experimental work, proposed a correlation for
chain-growth probability as a function of temperature and H2/CO ratio. At the
maintained FT channel temperature range in present study, 500 K - 510 K, the value
of chain-growth probability was calculated to be between 0.77 and 0.82 for H2/CO
molar ratio of 2. This value falls under the desired growth-probability of FT synthesis.
Finally, thermal runway can cause the reactor material to melt and get damaged
partially or fully. Therefore, material that can withstand high thermal stress, like SUS
304 may be preferred for reactor block. Also, conditions for thermal critical heat flux
and partial dry out in microchannel cooling with wall boiling condition may be
studied in detail to get insights of the risky scenario.

85
Figure 3.29 (a). Simulation result for geometry with an additional coolant layer.
3D Temperature [K] contour on reaction channels of microchannel reactor block
for wall boiling coolant flow (GHSV = 5000 hr-1; catalyst loading 120 %;
saturated water flow rate = 5.4 g/min per channel). +ve X direction: coolant
flow; +ve Y direction: syngas flow

86
Figure 3.29(b). Simulation result for geometry with an additional coolant layer. 3D
Temperature [K] contour on reaction channels of microchannel reactor block for
subcooled water as coolant (GHSV = 5000 hr-1; catalyst loading 120 %; subcooled
water flow rate = 5.4 g/min per channel). +ve X direction: coolant flow; +ve Y
direction: syngas flow

87
Figure 3.30. Temperature contour of modified reactor at intensified process
condition (GHSV = 30000 hr-1 and catalyst activity 300 %). 300 % catalyst loading
implies catalyst activity of 3 times the present catalyst activity, a situation of super
active catalyst).
Temperature contour in Figure 3.30 indicates that with the modified
microchannel reactor block, adequate heat removal and thermal control is possible
even when reactor is operated with intensified process condition (GHSV = 30000 hr-
1 and catalyst activity 300 %). 300 % catalyst loading implies catalyst activity of 3
times the present catalyst activity, a situation of super active catalyst). By increasing
the coolant flow rate ΔTmax can be brought down to below difference of 23 oC,
although not shown here.

88
3.6 Reactor configuration
Another important aspect of microchannel reactor operation is the flow configuration
of syngas and coolant flows. As understood from the FT reaction characteristics in
Section 3.2, reaction rates are higher near the inlet region compared to rest of the
catalyst packed region (unless discrete catalyst loading strategy is applied), reactor
may give better heat transfer performance if we configure the reactor in such a way
that more heat in removed near the syngas inlet region. This would be possible if we
configure the flow in concurrent mode.
Figure 3.31 shows the temperature contour from co-current configuration for
same operating conditions (GHSV = 5000 hr-1; catalyst loading 120 %; saturated
water flow rate = 5.4 g/min per channel). Compared to cross flow configuration with
ΔTmax of 12 oC, described in previous section, concurrent configuration predicts
ΔTmax of 6 oC. This clearly indicates that concurrent configuration gives better heat
transfer performance compared to cross flow configuration in microchannel reactor
block operation.
Figure 3.32 shows similar predicted temperature contour at intensified operating
conditions (GHSV = 30,000 hr-1; catalyst loading 300 %) and when wall boiling
condition was applied using saturated water as coolant. As can be seen in the figure,
∆Tmax achieved was around 13 K is well within acceptable value. This mean an
advantage of 10 K ∆Tmax decrease in changing from cross-flow configuration to c-
current flow configuration, see Figure 3.30 for comparison. This better outcome of
concurrent configuration is also explained by the higher heat flux near the inlet
region in case of concurrent configuration compared to cross flow configuration, as
illustrated in Figure 3.33 by comparing heat flux profile along reaction channel

89
length for the two cases.
However, in actual design of a microchannel reactor block, if both coolant and
syngas distributor face the same side of the reactor block, then positioning of the
respective distributor would prove to be a major challenge . Therefore, coolant can
be allowed to enter cross and flow in concurrent mode in the reaction region and exit
cross the reaction channels. This way, syngas distributor and coolant distributor to
the microchannel reactor block can be positioned on the different faces of the reactor.
Figure 3.31 Temperature contour from co-current configuration for same operating
conditions (GHSV = 5000 hr-1; catalyst loading 120 %; saturated water flow rate =
5.4 g/min per channel). (Syngas and coolant in +Y-axis direction)

90
Figure 3.32 Temperature contour from co-current configuration for intensified
operating conditions (GHSV = 30,000 hr-1; catalyst loading 300 %; saturated water
flow rate = 12 g/min per channel). (Syngas and coolant in +Y-axis direction)

91
Figure 3.33. Heat flux profile along reaction channel length for (a) co-current
configuration (b) for cross current configuration

92
3.7 Additional comments
A number of additional comments can be made with regard to detail study of
microchannel reactor for FT synthesis. However in this work, for brevity, further
comments are limited two important aspects – modeling conventional FT reactors
and FT product distribution.
3.7.1 Modeling conventional FT reactors
Figure 3.34. Typical flow profile FT synthesis in conventional reactors (a) fluidized
bed reactor, (b) single pass of multitubular fixed bed reactor

93
Figure 3.34 illustrates simulated flow profile of syngas-FT product-catalyst
system for typical FT synthesis in fluidized bed reactor and temperature profile for
single pass model of fixed-bed multitubular reactor. By tradition at commercial scale
operation, fluidized bed reactor is mainly used for gasoline production (high
temperature FT synthesis) while slurry bubble column and multitubular fixed bed
reactors are preferred for waxy distillate production (low temperature FT synthesis).
This is because, waxy distillate would create problems in the fluidization. However
multitubular fixed bed reactors are proving to be failure in term of thermal
performance if active Co-based catalyst is used for the FT reaction. Both fluidized
bed reactor type and slurry column reactor type, on the other hand, require internal
cooling coil to remove the exothermic heat. Complete reactor modeling of
conventional FT reactor would be far more complex than modeling microchannel FT
reactor.
3.7.2 FT product distribution
Song et al.55, from their experimental work, proposed a correlation for chain-growth
probability as a function of temperature and H2/CO ratio, as given below.
2
(1 0.0039( 533))
H
CO
CO
ya b T
y y
3.
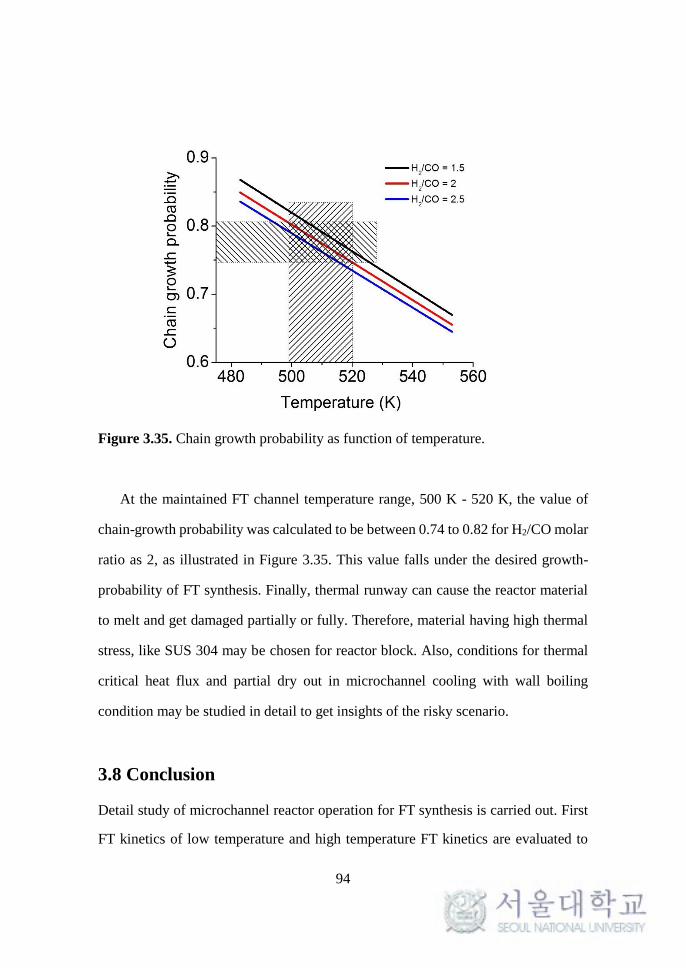
94
Figure 3.35. Chain growth probability as function of temperature.
At the maintained FT channel temperature range, 500 K - 520 K, the value of
chain-growth probability was calculated to be between 0.74 to 0.82 for H2/CO molar
ratio as 2, as illustrated in Figure 3.35. This value falls under the desired growth-
probability of FT synthesis. Finally, thermal runway can cause the reactor material
to melt and get damaged partially or fully. Therefore, material having high thermal
stress, like SUS 304 may be chosen for reactor block. Also, conditions for thermal
critical heat flux and partial dry out in microchannel cooling with wall boiling
condition may be studied in detail to get insights of the risky scenario.
3.8 Conclusion
Detail study of microchannel reactor operation for FT synthesis is carried out. First
FT kinetics of low temperature and high temperature FT kinetics are evaluated to

95
find the more reliable and robust kinetic model. Reaction scheme and kinetic data of
Velocys16 is found to be more reliable than that of Marvast et al35. Effect of coolant
channel and process channel geometry on heat removal efficiency is studied to
evaluate different candidate design. On comparing the heat flux for design with 1.5
mm and 0.5 mm wall thickness, the later has 5.26 % increment over the former.
Coolant channel oriented in such a way that surface area of the wall facing the
process channel layer is higher, ensures higher heat flux. This is evident from the
heat flux comparison between coolant channel orientation of 1 mm x 2 mm and 2
mm x 1 mm.2 mm x 1 mm orientation (more surface area in contact with the process
channel layer) allows 11.1 % increase in the average heat flux as compared to 1 mm
x 2 mm. Reducing the coolant channel height to 1 mm from 2 mm has an effect of
12.51 % increase in average heat flux (for coolant channel base width as 2 mm) and
71.23 % increase in average heat flux for (coolant channel base width as 1 mm). For
the fixed mass flow rate of the coolant by varying velocities, 1 mm and 1.5 wall
thickness showed higher heat flux as compared to 0.5 wall thickness. This is because
the coolant velocities are higher in channels with wall thickness 1 mm and 1.5 mm
than that of 0.5 mm thickness.
From the study of effect of temperature on reactor performance, it is found that
for a desired reaction conversion and product selectivity, it is necessary to maintain
reaction channel temperature below a particular value, say 523K in this case. Based
on the predicted result, temperature of 517 K could be an optimum value. However,
in general, as the intrinsic activity of the catalyst decline, reactor is operated at
slightly higher temperature to achieve the same level of CO conversion. From
studying effect of syngas ration and reactor operating pressure, syngas ratio of 2 and
operating pressure of 20 – 22 bar predicts more desired product selectivity compared

96
to other set of values.
Wall boiling phenomena in the coolant side microchannel reactor is discussed in
detail. Heat transfer simulations on multichannel block reactor predicted much
higher cooling capacity of subcooled water compared to that of cooling oil, ∆Tmax =
32 K for subcooled water and 17 K for cooling oil at a process condition of GHSV
5000 hr-1and catalyst loading 120 %. Wall boiling condition in saturated water
provided heat transfer enhancement compared to that of subcooled water, ∆Tmax =
12 K for saturated water, with degree of enhancement depending on the fraction of
saturated water vaporized. Therefore, it can be concluded that saturated water
provides an effective means of removing heat from the exothermic FT reaction.
However, saturated water flow rate above local dry out condition should be used for
reactor safety.
A modified reactor block with improved thermal performance predicted
noticeable heat transfer enhancement due to wall boiling even at very low exit vapor
fraction. Accordingly modified reactor block is tested for intensified process
condition (GHSV = 30,000 hr-1 and super active catalyst condition). Simulation
predicts much improves heat transfer performance of the modified reactor as against
the original reactor, decrease in ∆Tmax from 47 K (without additional coolant layer
on top) to 23 K (with additional coolant layer on top).
Method of catalyst bed zone division and loading different % of catalyst in
different zone is evaluated. Study indicates noticeable advantage of the method when
applied to 2 zones and 3 zones division cases, and longer 1st zone and shorter 1st
zone cases. Between 2 zones and 3 zones division cases, the latter shows more
uniform temperature profile (temperature difference less of 1 K) compared to the

97
former under same condition of CO conversion. And between longer and shorter 1st
zone cases with both under 3 zone division, longer 1st zone case gave slight
advantage in terms of uniform temperature profile. Also, the method can be
optimized to optimum number of zone division, zone length and strategic loading %
in each zone.
Further, evaluating heat transfer performance of cross flow and concurrent flow
configuration of syngas and coolant flow, there is clear indication that concurrent
configuration gives better heat transfer performance compared to cross flow
configuration in microchannel reactor block operation. Decrease in ∆Tmax from 23
K to 13 K was achieved in changing reactor flow configuration from cross-flow
configuration to co-current flow configuration.

98
CHAPTER 4 : Microchannel Design Procedure
Development
4.1 Introduction
A rigorous and systematic design procedure was adopted to achieve a design that can
guarantee maximum productivity and safety of the highly exothermic FT reactor.
Geometry details of single channels (both process and coolant channels), and
multichannel reactor block comprises the main design variables. Feasible range of
each design variables along with the range of each reactor operating
parameter/condition are collected from literature to help in the design process.
4.2 Design procedure
The whole design activity and operation starting from deciding single channel
dimensions to the end step of pilot plant demonstration is divided into four stages—
single channel reactor design (Stage-I), multichannel block reactor design (Stage-II),
design and operation optimization (Stage-III), and fabrication and pilot plant
demonstration (Stage-IV). For the purpose of formulating a systematic design
procedure and determining feasible values of reactor design variables, various types
of knowledge from our previous works21-28,56-59 were used. The systematic design
procedure followed to achieve the final design specifications of the microchannel
block reactor used in the present pilot scale experiment is shown in Figure 4.1. Table
4.1 and 4.2, details information on main reactor design variables, model parameters

99
and simulations conditions based on the results from our previous study and
information collected from literature.
Figure. 4.1. Microchannel block (modular) reactor design procedure. Division of
design procedure into 4 stages (stage – I to IV) comprising single channel design,
multichannel reactor block design, geometry and operation optimization, and reactor
fabrication and pilot plant demonstration.
In single channel design stage, single channel geometry variables --channel
width (Lp), height (Hp) and length (Wp), are preliminary defined for FT synthesis

100
reactor model development and simulation analysis. Details of reaction kinetics,
physical and thermodynamic parameters are defined at this stage. Catalyst loading %,
reactor operating temperature and pressure, syn-gas feed and channel wall boundary
conditions are also defined to develop rigorous simulation models of single channels
in multiple platforms – ASPEN, MATLAB and CFD tool-ANYS FLUENT for
different analysis. For instance, CFD models of exothermic FT reaction on the
surface of spherical Co-based catalyst was developed by Lee et al56 considering
different single channel geometry (varying Wp and Hp) to study thermal effects of
process channel geometry. The study found that varying Hp has more effect on heat
removal capacity compared to varying Wp with higher heat removal capacity at lower
Hp. For instance, decreasing the value of Hp from 4 mm to 2 mm, leads to increase
in heat flux three fold while the value remain nearly the same for decrease in Wp
from 5 mm to 2 mm. Accordingly, it was concluded that process channel geometry
with smaller Hp (1 to 2 mm) and larger Wp (4 to 5 mm) would be an effective
geometry from the point of heat transfer. Then, ASPEN model of detail FT reaction
kinetics (Velocys Kinetics16) was studied to investigate the reaction profile and hence
the FT product components profile along the channel length25,26. It was found that
reaction rate was much faster (3 to 4 order higher) near the inlet region as compared
to the middle region, which was expected. To further investigate single channel
reactor, CFD models of FT reaction in a catalyst packed single channel was
developed by Kshetrimayum et al27 considering 1 mm × 1 mm × 21 mm and 1 mm
× 3 mm × 16.7 mm sized channels and performance parameters (CO conversion,
CH4 selectivity and three-dimensional temperature profile) of these single channel

101
models were evaluated through simulation study. Both 1 mm and 3 mm width
channels gave CO conversion above 80 %, hence it was concluded that by widening
the channel dimension to 2 to 3 times that of channel height in channel cross section
dimensions, shortening the channel length is possible. Results from CFD simulation
of single channel model also showed that most heat is generated near the inlet region
of the reaction channel. Accordingly, it was proposed based on the results of
simulation study combining CFD tool and MATLAB that discrete dilution method
of catalyst loading be applied to distribute the heat generation evenly along the
channel length28. Reactor performance was evaluated based on CO conversion, CH4
selectivity, C5+ selectivity and temperature profile along the channel length.
Additional single channel models were also considered and process of simulation
and performance evaluation was iterated until a channel geometry of Hp = 2 mm,
Wp= 4 mm and Lp = 120 mm that meet performance criteria was chosen as a candidate
process channel design. However, due to ease of fabrication, for single channel
experiments, a channel of 100 mm length with circular cross section of 3 mm
diameter was used. Single channel experiments were conducted for two main
purpose, one to find out KOGAS catalyst performance of FT reaction and to develop
FT kinetic models, and another to observe the thermal behavior of a single channel
reactor. Accordingly, in the two experiments, the catalyst loading length was kept
different, with only 6 mm for the first experiment and 25 mm for the second
experiment. Details of the experiments and performance results are described in Park
et al57. Bases on the performance of single channel reactor, design variables are
updated to obtain the best candidate single channel design.
In the stage-II of the design procedure, single channel geometry obtained from

102
stage-I of the design activity is then used as a basis to extend the reactor design to
multichannel block reactor design by defining multichannel geometry variables—
coolant channel length (Lc), width (Wc) and height (Hc), number of channels in a
microchannel layer (nc), number of microchannel layers (nl), channel wall or fin
thickness (tfin), channel layer support thickness (tlayer) flow-configurations (Fconf) etc.
The multichannel block reactor design is then analyzed by developing rigorous
multichannel FT synthesis simulation model and reactor performances were
evaluated. For instance, a multichannel CFD model of 2 process channel layers
interleaved between 3 coolant channel layers was developed to study effect of
coolant channel geometry-- Lc, Wc and Hc, and channel wall or fin thickness, tfin on
the wall heat flux and reactor temperature . Process channel geometry in this case
was kept constant at 3 mm × 3 mm. The study found that lower values of channel
geometry set (Lc=, Wc= 0.6 mm, Hc=0.5 mm and tfin = 0.646 mm ) result to higher
wall heat flux compared to larger values of channel geometry set (Lc=, Wc=2.2 mm,
Hc= 2.0 mm and tfin = 2.6 mm). In another CFD model of multichannel block reactor
(21 mm × 21 mm × 17 mm) consisting of 4 process channel layers and 4 coolant
channel layers, heat transfer simulation was conducted by Kshetrimayum et al27 to
evaluate the effect of different types of coolant and heat removal enhancement of
wall boiling coolant. The same study also showed the process intensification of
microchannel reactor by simulating more intensified condition of FT synthesis
(GHSV of 30000 hr-1). Because, the goal of study with each multichannel models
developed is different and where the effect of process channel geometry is not of
interest, dimensions of process channel are made small to reduce computational load
in CFD simulation. In a different approach to simulate multichannel block reactor in

103
a much reduced calculation time, unlike those of CFD models which usually take
much longer calculation time, reactor decomposition and cell coupling method was
applied to develop simulation model of large scale microchannel reactor block24. The
multichannel model developed in this approach could handle as many as 5800
process channels, 7500 cooling channels, and 130 channel layers considering process
channel geometry achieved in stage-I of design procedure. Effects of both geometry
and operating variables such as catalyst loading ratio, coolant flow rate, and channel
layout were examined. In a separate study by Park et al57 using 3D model of
decomposition and cell coupling approach, different reactor configurations of
coolant side – cross-counter-cross, cross-cocurrent-cross and full cross current was
evaluated. The study found that cross-cocurrent-cross configuration was the most
effect configuration in terms of thermal control of reaction channels. Multiple block
reactor designs were than evaluated by iterating the design process (adjusting the
design variables) to find the most promising multichannel block reactor design.
The output design from multichannel design stage is then passed through
rigorous optimization process to obtain a set of optimized geometry design variables
as well as optimized operating conditions. Uniform flow distribution at the inlet of
process channel and coolant channels sides are necessary to achieve reactor
operation at its optimum flow conditions. While a uniform flow distribution is easily
achievable at the syn-gas channel side, coolant being in liquid phase, flow distributor
design needs to be optimized to achieve uniform flow distribution for the coolant
side. In the first optimization task conducted, CFD and neural network technique
were used by Jung et al58 to optimize coolant flow guiding fin in a U-type coolant
layer manifold (manifold for cross-cocurrent cross configuration) for a large-scale

104
microchannel block reactor. Robustness of the manifold design was shown by
predicting uniform flow distribution over a wide range of flow conditions (500 ≤
ReGF ≤10800). And in another optimization work, multi-objective optimization
using CFD and genetic algorithm was carried out by Na et al28 to find the optimum
discrete dilution method (number of catalyst packed discrete zones and respective %
loadings). Minimum ΔT and maximum C5+ selectivity were chosen as objectives in
the optimization process.
Finally, a rigorous multi-objective optimization was carried out by Jung et al58 to
optimize reactor channel geometry and over all block reactor dimensions by using
multichannel FT reactor block model of reactor decomposition and cell-coupling
approach and a surrogate model of the same FT reactor block model. Details
(although not complete, due to confidentiality) of final multichannel block reactor
design achieved based on the design procedure adopted is given in Fig 4. The single
module of multichannel reactor block design consist of 528 process channels in total
with Wp = 10 mm, Hp = 5 mm and Lp = 460 mm, and expected to produce FT product
upto 0.5 BPD. By adding another module of the same design 1BPD capacity is
expected to achieve. .Various cases of operating conditions were considered to find
the best set of operating conditions for stable operation and maximum reactor
performance.
The final design of multichannel block reactor achieved through stage-I, stage-
II and stage-III of the design procedure was sent for fabrication at a third party
fabrication facility (InnowillTM). Details on the method and material used for
fabrication are not given here for brevity. The fabricated reactor, shown in Figure 5
is then brought to KOGAS site for pilot plant experimentation/demonstration.

105
Table 4.1. Reactor geometry design variables and feasible design range,
microchannel reactor block type FT reactor.
Design variables Feasible design range References
Process channel
Length, Lp (mm) 20 – 600 1, 21, 56, 59
Width, Wp (mm) 0.5 -10 1, 21, 56, 59
Height, Hp (mm) 0.5 – 10 1, 21, 56,59
Coolant channel
Length Lc (mm) 20 – 600 1, 6, 24, 56, 59
Wc (mm) 0.5 – 5 1, 6, 24, 56, 59
Hc (mm) 0.5 – 5 1, 6, 24, 56, 59
Fin thickness, tfin (mm) 0.1 – 2 1, 26, 58
Layer support thickness, tlayer (mm) 1 – 3 25, 26, 27
Number of channels per layer, nc adjustable 25, 26, 27
Number of channel layers, nl adjustable 25, 26, 27
Flow configurations, Fcong
cross flow, contour
flow, cross co-current-
cross flow
1, 57
Table 4.2. Reactor model parameters and simulation conditions
Simulation parameters Feasible operating range
FT reaction kinetics Lumped, detail model
Catalyst
Type/activity Fe-based, Co-based
Support Al2O3, SiO2
Loading type Filled, wall coating
Syn-gas conditions
GHSV (hr-1) 2500 – 40,000
Syn-gas ratio 1.5 – 2.5
Inert gas dilution (%) 0 – 25
Inlet temperature (oC) 200 – 260
Coolant conditions
Coolant type Single phase, Wall boiling (Two phase)
Inlet temperature (oC) 190 - 220
Flow rate (L/min) 200-1500

106
4.3 Final design and reactor operation data (from KOGAS)
Figure 4.2. Final microchannel block (modular) reactor design. (a) Process channel
side, (b) Coolant channel side, (c) Side view showing process channel and coolant
channel layers along with guide bars and support plates.

107
Figure 4.3. Final microchannel block (modular) reactor design. (a) configuration
showing cross-cocurrent-cross flow of syn-gas and coolant, (b) fabricated
multichannel reactor block.
The pilot plant operation started with initial checks of all the process units and
control systems. Utility systems, raw materials, catalyst packing, catalyst reduction,
compressor, pump, heat, level test, pressure safety valve, controller, drum, and
refrigerator were checked in detail. Finally leak test for feed line, N2 header to T-7,
T-7 to CO2 separation section, and CO2 separation section to T-11 were performed.
For reducing the catalyst packed in the microchannel FT reactor, the reactor catalyst
bed was heated to 300 °C using H2 flow. Thereafter, hydrogen was flown at a flow
rate of 25 LPM for 57 hours. The reactor temperature was maintained at 220 oC for
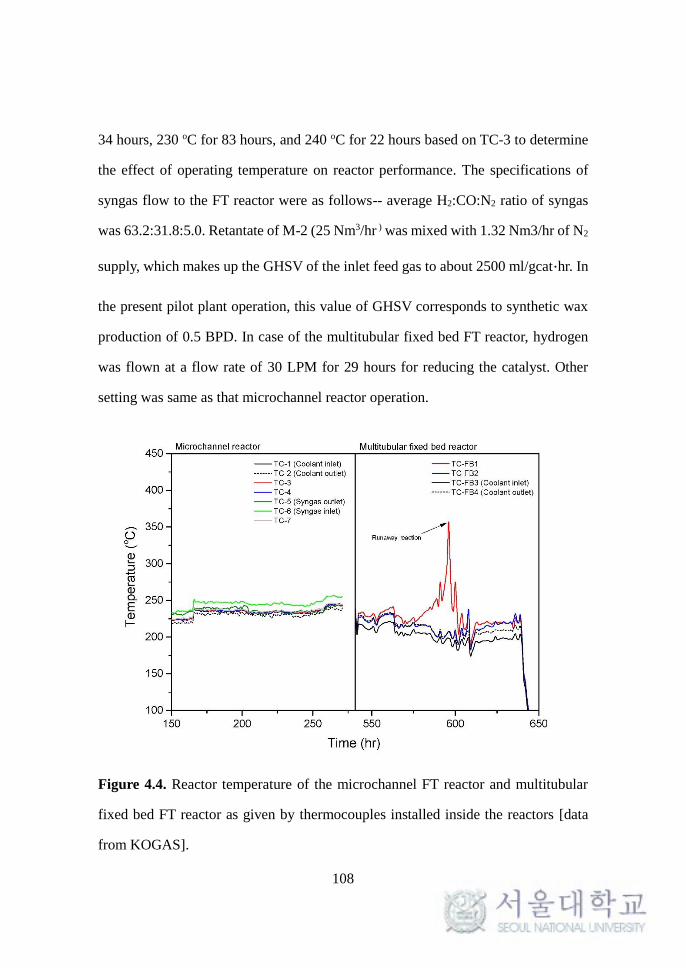
108
34 hours, 230 oC for 83 hours, and 240 oC for 22 hours based on TC-3 to determine
the effect of operating temperature on reactor performance. The specifications of
syngas flow to the FT reactor were as follows-- average H2:CO:N2 ratio of syngas
was 63.2:31.8:5.0. Retantate of M-2 (25 Nm3/hr ) was mixed with 1.32 Nm3/hr of N2
supply, which makes up the GHSV of the inlet feed gas to about 2500 ml/gcat∙hr. In
the present pilot plant operation, this value of GHSV corresponds to synthetic wax
production of 0.5 BPD. In case of the multitubular fixed bed FT reactor, hydrogen
was flown at a flow rate of 30 LPM for 29 hours for reducing the catalyst. Other
setting was same as that microchannel reactor operation.
Figure 4.4. Reactor temperature of the microchannel FT reactor and multitubular
fixed bed FT reactor as given by thermocouples installed inside the reactors [data
from KOGAS].

109
Figure 4.5. Predicted reactor temperature profile from single pass model of
multitubular fixed bed FT reactor.
As illustrated in Figure 4.4, temperature data from thermocouples installed inside
both 0.5BPD modular microchannel and packed bed type FT reactors operated in
parallel showed stable temperature control for microchannel FT reactor for the entire
plant operation up to 270 hr, while the multitubular fixed bed type FT reactor
operation failed due to reaction runaway. The failure of multitbular fixed bed reactor
in controlling reactor temperature is also supported from the prediction from
simulated model of single pass tube model, illustrated in Figure 4.5 where sharp
temperature rise is seen near the inlet region. A microchannel reactor under same

110
operating conditions predicted uniform temperature profile along the channel length,
as described in section 3.2 of chapter 3.
From the modular microchannel FT reactor operation, although undesirably high
value of CH4 selectivity (50.13 %) was obtained from the plant operation, high CO
conversion of 83%, illustrated in Figure 4.6, and stable temperature control at 220
oC, 230 oC and at 240 oC during the entire pilot plant operation (140 hr to 270 hr )
demonstrated the appreciable performance novel microchannel FT reactor designed
in due course of this thesis work. Reasons for undesirably high value of CH4
selectivity are mostly reactor operation related rather than the design related.
Accordingly, following practices are recommended to achieve appreciable CO
conversion with low CH4 selectivity: reducing the catalyst with syngas, increasing
the reduction temperature above 300 oC, producing the catalyst with IWI method,
and operating with moderate value (below 80 %) of CO conversion. Further, the
compact GTL process described, the systematic modular microchannel reactor
design procedure and pilot plant operation data presented in the this chapter may
serve as a general guideline in similar future works on pilot scale reactor model
development, design and operation.

111
Figure 4.6. CO conversion and CH4 selectivity of compact GTL pilot plant with
microchannel FT reactor in the FT reaction section [data from KOGAS].
4.4 Conclusion
The whole reactor design process starting from single channel reactor design,
multichannel block reactor design, design and operation optimization, and
fabrication and pilot plant demonstration is described with aim to formulate a design
procedure framework for potential use in future similar reactor design process.
Feasible design and operating range are summarized. Few details on final design
specifications are given through illustration. Pilot plant operation data from KOGAS
in presented to serve as design validation in general.

112
CHAPTER 5 : Concluding Remarks
5.1 Conclusions
Modeling, simulation, and design procedure development of microchannel reactor
for FT synthesis is addressed in this thesis mainly using CFD technique. CFD
modeling and simulation of FT synthesis in a catalyst packed microchannel reactor
considering both single channel and multichannel reactor models is presented.
Simulation of Velocys' experiment (Deshmukh et al.6,Tonkovich et al.16) with short
single channel reactor validated our single channel model. At catalyst loading of
1060 kg/m3 CO conversion of 60.02% was achieved with selectivity for CH4 and C5+
(modeled as C14H30 here) as 8.38% and 87.41% respectively. When the catalyst
loading was increased 1.2 times, CO conversion increased to 74.60 % while the
selectivity for CH4 and C14H30 increased to 11.18% and 85.26% respectively.
Temperature effect on CO conversion and selectivity for CH4 and C5+ revealed
necessity for maintaining reaction channel temperature below 523 K, for low-
temperature FT synthesis.
Heat transfer simulation in a complex microchannel reactor block can be
conducted by decoupling reaction and heat transfer. Comparing a decoupled model
with that of reaction and heat transfer coupled model shows less than 1 oC difference
in temperature profile along the channel length. Thermal profile for the simulated
microchannel reactor block is also qualitatively compared with temperature data of
Velocys’ pilot plant operation6. Overall, based on the validation of the single channel

113
reactor with Velocys single channel operation data6 and qualitative comparison with
multichannel reactor operation data, it can be understood that the various
microchannel reactor models developed using CFD tools can be used to conduct
detail study of FT synthesis.
Detail study of microchannel reactor operation for FT synthesis is carried out.
First FT kinetics of low temperature and high temperature FT kinetics are evaluated
to find the more reliable and robust kinetic model. Reaction scheme and kinetic data
of Velocys16 is found to be more reliable than that of Marvast et al35.
Effect of coolant channel and process channel geometry on heat removal
efficiency is studied to evaluate different candidate design. On comparing the heat
flux for design with 1.5 mm and 0.5 mm wall thickness, the later has 5.26 %
increment over the former. Coolant channel oriented in such a way that surface area
of the wall facing the process channel layer is higher, ensures higher heat flux. This
is evident from the heat flux comparison between coolant channel orientation of 1
mm x 2 mm and 2 mm x 1 mm.2 mm x 1 mm orientation (more surface area in
contact with the process channel layer) allows 11.1 % increase in the average heat
flux as compared to 1 mm x 2 mm. Reducing the coolant channel height to 1 mm
from 2 mm has an effect of 12.51 % increase in average heat flux (for coolant channel
base width as 2 mm) and 71.23 % increase in average heat flux for (coolant channel
base width as 1 mm). For the fixed mass flow rate of the coolant by varying velocities,
1 mm and 1.5 wall thickness showed higher heat flux as compared to 0.5 wall
thickness. This is because the coolant velocities are higher in channels with wall
thickness 1 mm and 1.5 mm than that of 0.5 mm thickness.
From the study of effect of temperature on reactor performance, it is found that
for a desired reaction conversion and product selectivity, it is necessary to maintain

114
reaction channel temperature below a particular value, say 523 K in this case. Based
on the predicted result, temperature of 517 K could be an optimum value. However,
in general, as the intrinsic activity of the catalyst decline, reactor is operated at
slightly higher temperature to achieve the same level of CO conversion. From
studying effect of syngas ratio and reactor operating pressure, syngas ratio of 2 and
operating pressure of 20 – 22 bar predicts more desired product selectivity compared
to other set of values.
Wall boiling phenomena in the coolant side microchannel reactor is discussed in
detail. Heat transfer simulations on multichannel block reactor predicted much
higher cooling capacity of subcooled water compared to that of cooling oil, ∆Tmax =
32 K for subcooled water and 17 K for cooling oil at a process condition of GHSV
5000 hr-1and catalyst loading 120 %. Wall boiling condition in saturated water
provided heat transfer enhancement compared to that of subcooled water, ∆Tmax =
12 K for saturated water, with degree of enhancement depending on the fraction of
saturated water vaporized. Therefore, it can be concluded that saturated water
provides an effective means of removing heat from the exothermic FT reaction.
However, saturated water flow rate above local dry out condition should be used for
reactor safety.
A modified reactor block with additional coolant layer on top is tested for
intensified process condition (GHSV = 30,000 hr-1 and super active catalyst
condition). Simulation predicts decrease in ∆Tmax from 47 K (without additional
coolant layer on top) to 23 K (with additional coolant layer on top).
Study indicates noticeable advantage of dividing the catalyst bed zone and
applying strategic catalyst loading%. Between 2 zones and 3 zones division cases,

115
the latter shows more uniform temperature profile (temperature difference less of 1
K) compared to the former under same condition of CO conversion. And between
longer and shorter 1st zone cases with both under 3 zone division, longer 1st zone
case gave slight advantage in terms of uniform temperature profile. Also, the method
can be optimized to optimum number of zone division, zone length and strategic
loading % in each zone.
Further, evaluating heat transfer performance of cross flow and concurrent flow
configuration of syngas and coolant flow, there is clear indication that concurrent
configuration gives better heat transfer performance compared to cross flow
configuration. Decrease in ∆Tmax from 23 K to 13 K was achieved in changing
reactor flow configuration from cross-flow configuration to co-current flow
configuration in microchannel reactor block operation.
The whole reactor design process starting from single channel reactor design,
multichannel block reactor design, design and operation optimization, and
fabrication and pilot plant demonstration is described with aim to formulate a design
procedure framework for potential use in future similar reactor design process.
Feasible design and operating range are summarized. Few details on final design
specifications are given through illustration. Pilot plant operation data from KOGAS
in presented to serve as design validation.
The systematic CFD modeling and simulation analysis presented in this thesis
adopted in our present study, can in general, be used to study microchannel reactor
design and operation for other exothermic and/or endothermic reactions.

116
5.2 Future works
Some authors like Avci et al and Arzamendi et al described microchannel reactor
with catalyst coated on the channel wall. However, catalyst packed microchannels
are expected to give a number of advantages relative to the wall coated microchannel
reactors, such as higher catalyst inventory, use of proven efficient Fischer –Tropsch
catalyst, easier reactor loading and possible catalyst replacement. Coated
microchannel reactors may require specially designed catalyst. Also, coating
(deposition) on the reactor wall can be challenging. However simulation test for
comparison of reactor performance between catalyst packed microchannel reactors
and wall coated microchannel reactors was not conducted in this thesis work. This
aspect of study might give additional insight to microchannel reactor characteristics.
As understood from Chapter 3, reactor operating variables like temperature,
pressure, syngas ratio, syngas flow rate etc. affects the reactor performance and
productivity. Additionally, same reactor may be desired to operate with conditions
targeted to produce different product distribution at different times. For instance the
same reactor originally designed for low temperature FT synthesis may be opted for
higher temperature FT synthesis due to practical constraints of designing an
altogether separate reactor. In that case, a set of optimum values will have to be
sought for. Therefore, given a particular reactor design, seeking optimum set of
operating variables for low temperature and high temperature Ft synthesis can be
interesting.
Another interesting future work would be to convert CFD models of present
microchannel reactor to Reduced Order Models (ROM) without any loss of
generality, and include it in process flow sheet level optimization.

117
Nomenclature
Abbreviations
BTL – Biomass-to-liquid
CFD – Computational fluid dynamics
CTL – Coal-to-liquid
FT – Fischer–Tropsch
GTL – Gas to liquid
GHSV – Gas hourly space velocity
LPM – Liter per minute
IWI – Gas hourly space velocity
SIMPLE – Semi-implicit method for pressure-linked equations
SST – Shear stress transport
TC – Temperature control
Latin letters
v – Velocity vector (m/s)
jv – Velocity component in x, y and z directions (m/s)
p – Pressure (bar)
Si – Momentum source term in porous media for i-th (x, y or z) momentum
equation
µ – Viscosity (kg/m-s)

118
Dij – Inverse of permeability factor in porous media and entries in matrix D (1/m2)
Cij – Inverse of inertial resistance factor in porous media, entries in matrix C (1/m)
Yi – Mass fraction of species 'i'
Ji – Diffusive mass flux of species 'i' (mol/m2-s)
Ef – Energy for fluid part in porous media (J)
Es – Energy for solid part in porous media (J)
keff – Effective thermal conductivity of porous media (W/m-K)
kwall – Thermal conductivity of solid wall material (W/m-K)
kf– Thermal conductivity of fluid phase (W/m-K)
ks – Thermal conductivity of solid phase catalyst and catalyst support (W/m-K)
hi – Enthalpy of specie 'i' (J/mol)
h
fS – Fluid enthalpy source term (J/molCO)
Qc – Convective heat flux (W/m2)
QQ – Quenching heat flux (W/m2)
QE – Evaporative heat flux (W/m2)
q –Heat flux through wall solid (W/m2)
kn – Knudsen number
Ma – Mach number
Re – Reynolds number
T – Temperature (K)
∆𝑇𝑚𝑎𝑥 – Temperature difference between the hottest spot and coldest spot in the

119
reactor
C2 , C4 and C5+ – Hydrocarbon compounds
Lp– Process channel length (mm)
Hp– Process channel height (mm)
Wp– Process channel width (mm)
Lc– Coolant channel length (mm)
Hc– Coolant channel height (mm)
Wc– Coolant channel width (mm)
tfin– Fin (wall between channels) thickness (mm)
tlayer– Thickness of support plate (mm)
nc– Number of process channels per layer
nl– Number of process channel layers
Fconfi– Flow configuration between process and coolant channels
XCO – CO conversion
Greek Letters
– Fluid density (kg/m3)
f
– Density for fluid part in porous media (kg/m3)
s
– Density for solid part in porous media (kg/m3)
𝛾 – Specific heat ratio (cp /cp )
– Porosity inside reaction channel

120
Literature cited
(1) Arzamendi, G.; Diéguez, P.; Montes, M.; Odriozola, J.; Sousa-Aguiar, E. F.;
Gandía, L., Computational fluid dynamics study of heat transfer in a microchannel
reactor for low-temperature Fischer–Tropsch synthesis. Chem. Eng. J. 2010, 160,
915-922.
(2) Franz, F.; Hans, T., Process for the production of paraffin-hydrocarbons with
more than one carbon atom. US Patent 1746464, 1930.
(3) Petroleum, B., BP statistical review of world energy. In London: British
Petroleum: 2012.
(4) White, B., Can gas-to-liquids technology get traction? Alaska Natural Gas
Transportation Projects, Office of the Federal Coordinator, 2012.
(5) Steynberg, A.; Dry, M.; Davis, B.; Breman, B., Fischer-Tropsch reactors. Stud.
Surf. Sci. Catal. 2004, 152, 64-195.
(6) Deshmukh, S. R.; Tonkovich, A. L. Y.; Jarosch, K. T.; Schrader, L.; Fitzgerald, S.
P.; Kilanowski, D. R.; Lerou, J. J.; Mazanec, T. J., Scale-up of microchannel reactors
for Fischer− Tropsch synthesis. Ind. & Eng. Chem. Res. 2010, 49, 10883-10888.
(7) Chambrey, S.; Fongarland, P.; Karaca, H.; Piché, S.; Griboval-Constant, A.;
Schweich, D.; Luck, F.; Savin, S.; Khodakov, A., Fischer–Tropsch synthesis in milli-
fixed bed reactor: Comparison with centimetric fixed bed and slurry stirred tank
reactors. Catal. Today 2011, 171, 201-206.

121
(8) Karim, A.; Bravo, J.; Gorm, D.; Conant, T.; Datye, A., Comparison of wall-
coated and packed-bed reactors for steam reforming of methanol. Catal. Today 2005,
110, 86-91.
(9) Myrstad, R.; Eri, S.; Pfeifer, P.; Rytter, E.; Holmen, A., Fischer–Tropsch
synthesis in a microstructured reactor. Catal. Today 2009, 147, S301-S304.
(10) Cao, C.; Hu, J.; Li, S.; Wilcox, W.; Wang, Y., Intensified Fischer–Tropsch
synthesis process with microchannel catalytic reactors. Catal. Today 2009, 140, 149-
156.
(11) Lipski, R., Smaller-scale GTL enters the mainstream. In Velocys: 2012.
(12) Almeida, L. C.; Sanz, O.; D’olhaberriague, J.; Yunes, S.; Montes, M.,
Microchannel reactor for Fischer–Tropsch synthesis: Adaptation of a commercial
unit for testing microchannel blocks. Fuel, 2013, 110, 171-177.
(13) Holmen, A.; Venvik, H. J.; Myrstad, R.; Zhu, J.; Chen, D., Monolithic,
microchannel and carbon nanofibers/carbon felt reactors for syngas conversion by
Fischer-Tropsch synthesis. Catal. Today 2013, 216, 150-157.
(14) Harris, R. A., Commercializing and deploying microchannel FT reactors for
smaller scale GTL facilities. AIChE Process Development Symposium Houston (USA)
2015.
(15) Krepper, E.; Rzehak, R., CFD for subcooled flow boiling: Simulation of
DEBORA experiments. Nucl. Eng. and Des. 2011, 241, 3851-3866.
(16) Tonkovich, A. L.; Yuschak, T.; Neagle, P. W.; Marco, J. L.; Marco, J. D.;
Marchiando, M. A.; Keyes, L. W.; Deshmukh, S.; Luzenski, R. J., Laminated, Leak-

122
Resistant Chemical Processors; Methods of Making, and Methods of Operating. US
Patent 0132290, 2011.
(17) Gumuslu, G.; Avci, A. K., Parametric analysis of Fischer-tropsch synthesis in a
catalytic microchannel reactor. AIChE J. 2012, 58, 227-235.
(18) An, H.; Li, A.; Sasmito, A. P.; Kurnia, J. C.; Jangam, S. V.; Mujumdar, A. S.,
Computational fluid dynamics (CFD) analysis of micro-reactor performance: Effect
of various configurations. Chem. Eng. Sci. 2012, 75, 85-95.
(19) Shin, M.-S.; Park, N.; Park, M.-J.; Jun, K.-W.; Ha, K.-S., Computational fluid
dynamics model of a modular multichannel reactor for Fischer–Tropsch synthesis:
Maximum utilization of catalytic bed by microchannel heat exchangers. Chem. Eng.
J. 2013, 234, 23-32.
(20) Shin, M.-S.; Park, N.; Park, M.-J.; Cheon, J.-Y.; Kang, J. K.; Jun, K.-W.; Ha,
K.-S., Modeling a channel-type reactor with a plate heat exchanger for cobalt-based
Fischer–Tropsch synthesis. Fuel. Process. Technol. 2014, 118, 235-243.
(21) Na, J., Jung, I., Kshetrimayum, K.S., Park, S., Park, C., Han, C., Computational
Fluid Dynamics Study of Channel Geometric Effect for Fischer ̶ Tropsch
Microchannel Reactor. Korean Chem. Eng. Res. 2014, 52, 826-833.
(22) Shin, D.-Y.; Ha, K.-S.; Park, M.-J.; Kwak, G.; Lee, Y.-J.; Jun, K.-W., CFD
modeling of a modular reactor for the Fischer–Tropsch synthesis: Effectiveness of a
micro-scale cross-current cooling channel. Fuel 2015, 158, 826-834.
(23) Chabot, G.; Guilet, R.; Cognet, P.; Gourdon, C., A mathematical modeling of
catalytic milli-fixed bed reactor for Fischer–Tropsch synthesis: Influence of tube

123
diameter on Fischer Tropsch selectivity and thermal behavior. Chem. Eng. Sci. 2015,
127, 72-83.
(24) Park, S.; Jung, I.; Lee, U.; Na, J.; Kshetrimayum, K. S.; Lee, Y.; Lee, C.-J.; Han,
C., Design and modeling of large-scale cross-current multichannel Fischer–Tropsch
reactor using channel decomposition and cell-coupling method. Chem. Eng. Sci.
2015, 134, 448-456.
(25) Kshetrimayum, K. S.; Seongho, P.; Ikhwan, J.; Jonggeol, N.; Chonghun, H.,
Simulation Study of Heat Transfer Enhancement due to Wall Boiling Condition in a
Microchannel Reactor Block for Fischer-Tropsch Synthesis. In Computer Aided
Chem. Eng., 2015; Vol. 37, pp 1355-1360.
(26) Kshetrimayum, K. S.; Park, C.; Jung, I.; Park, S.; Na, J.; Han, C.,CFD
simulation of heat transfer in a microchannel reactor for fischer-tropsch synthesis
process, Process Development Division, AIChE Annual Meeting, 2013; pp 258-260.
(27) Kshetrimayum, K. S.; Jung, I.; Na, J.; Park, S.; Lee, Y.; Park, S.; Lee, C.-J.; Han,
C., CFD Simulation of Microchannel Reactor Block for Fischer–Tropsch Synthesis:
Effect of Coolant Type and Wall Boiling Condition on Reactor Temperature. Ind. &
Eng. Chem. Res. 2016, 55, (3), 543-554.
(28) Na, J.; Kshetrimayum, K. S.; Lee, U.; Han, C., Multi-objective optimization of
microchannel reactor for Fischer-Tropsch synthesis using computational fluid
dynamics and genetic algorithm. Chem. Eng. Sci., 2017, 313, 1521-1534.
(30) Visconti, C. G.; Tronconi, E.; Lietti, L.; Forzatti, P.; Rossini, S.; Zennaro, R.,
Detailed Kinetics of the Fischer–Tropsch Synthesis on Cobalt Catalysts Based on H-

124
Assisted CO Activation. Top. Catal. 2011, 54, 786-800.
(31) Lu, F.; Zhang, H.; Ying, W.; Fang, D., The Reaction Kinetics of a Fischer-
Tropsch Synthesis Over a Commercial Eggshell Co/SiO2Catalyst. Petrol Sci. and
Technol. 2010, 28, 1834-1845.
(32) Eliason, S.; Bartholomew, C., Reaction and deactivation kinetics for Fischer–
Tropsch synthesis on unpromoted and potassium-promoted iron catalysts. Appl.
Catal. A- Gen. 1999, 186, 229-243.
(33) Iglesia, E.; Reyes, S. C.; Madon, R. J.; Soled, S. L., Selectivity Control and
Catalyst Design in the Fischer-Tropsch. Adv. Catal. 1993, 39, 221.
(34) Yates, I. C.; Satterfield, C. N., Intrinsic kinetics of the Fischer-Tropsch synthesis
on a cobalt catalyst. Energy Fuel. 1991, 5, 168-173.
(35) Marvast, M. A.; Sohrabi, M.; Zarrinpashne, S.; Baghmisheh, G., Fischer‐
Tropsch Synthesis: Modeling and Performance Study for Fe‐HZSM5 Bifunctional
Catalyst. Chem. Eng. Technol. 2005, 28, 78-86.
(36) Bachelor, G., An introduction to fluid mechanics. In Cambridge University
Press, Cambridge, UK: 1967.
(37) Merk, H., The macroscopic equations for simultaneous heat and mass transfer
in isotropic, continuous and closed systems. Appl. Sci. Res. 1959, A8, 73-99
(38) Ishii, M., Thermo-fluid dynamic theory of two-phase flow. NASA STI/Recon
Tech. Report A 1975, 75, 29657.
(39) Drew, D. A.; Passman, S. L., Theory of multicomponent fluids. Springer

125
Science & Business Media: 2006; Vol. 135.
(40) Yeoh, G. H.; Tu, J., Computational techniques for multiphase flows. Elsevier:
2009.
(41) Kurul, N.; Podowski, M. Z. In Multidimensional effects in forced convection
subcooled boiling, Proceedings of the Ninth International Heat Transfer Conference,
1990; pp 19-24.
(42) Kurul, N.; Podowski, M., On the modeling of multidimensional effects in
boiling channels, ANS Proceeding of the 27th National Heat Transfer Conference,
1991.
(43) Perry, R. H.; Green, D. W.; O, M.J., Perry's chemical engineers' handbook. 7th
ed., Mc Graw-Hills Inc., New York, 1999.
(44) Fincher, S. N., Numerical Simulations of Boiling in Dielectric Fluid Immersion
Cooling Scenarios of High Power Electronics. Auburn University, 2014.
(45) Ying, X.; Zhang, L.; Xu, H.; Ren, Y.; Xuan, J., An Experimental Study on a
Microchannel Reactor for Fischer-tropsch Synthesis. Energy Procedia 2014, 61,
1394-1397.
(46) D. Danziger, D. Popović, G. Schulz-Ekloff, Simulation of temperature peak
attenuation by catalyst dilution in a tubular packed-bed reactor, The Canadian J. of
Chem. Eng., 1983, Vol.61, 126-128.
(47) A. Caldwell, C. PH, Catalyst Dilution-A Means of Temperature Control in
Packed Tubular Reactors, British Chem. Eng., 1969, Vol.14, 470-&.
(48) M.M.J. Quina, R.M. Quinta Ferreira, Thermal Runaway Conditions of a

126
Partially Diluted Catalytic Reactor, Ind. & Eng. Chem. Res.,1999, Vol.38, 4615-4623.
(49) M.M.J. Quina, R.M.Q. Ferreira, Start-up and wrong-way behavior in a tubular
reactor: dilution effect of the catalytic bed, Chem. Eng. Sci., 2000,55, 3885-3897.
(50) S. Hwang, R. Smith, Heterogeneous catalytic reactor design with optimum
temperature profile I: application of catalyst dilution and side-stream distribution,
Chem. Eng. Sci., 2004, Vol.59, 4229-4243.
(51) T. C. Hungg, W. M. Yan, X.D. Wang, C. Y. Chang, Heat transfer enhancement
in microchannel heat sinks using nanofluids, International J. of Heat and Mass
Transfer, 2012, Vol. 55, 2559-2570.
(52) S. U. S Choi, Enhancing thermal conductivity of fluids with nanoparticles,
ASME FED231, 1995, pp 99 - 103,
(53) Tonkovich, A. L. Y.; Litt, R. D.; Werner, T. M.; Yang, B., Integrated
microchannel synthesis and separation. US Patent 8497308, 2012.
(54) Zhu, X.; Lu, X.; Liu, X.; Hildebrandt, D.; Glasser, D., Heat transfer study with
and without Fischer-Tropsch reaction in a fixed bed reactor with TiO 2, SiO 2, and
SiC supported cobalt catalysts. Chem. Eng. J.l 2014, 247, 75-84.
(55) Song, H.-S.; Ramkrishna, D.; Trinh, S.; Wright, H., Operating strategies for
Fischer-Tropsch reactors: A model-directed study. Korean J. Chem. Eng. 2004, 21,
308-317.
(56) Lee, Y.; Jung, I.; Na, J.; Park, S.; Kshetrimayum, K. S.; Han, C., Analysis on
Thermal Effects of Process Channel Geometry for Microchannel Fischer-Tropsch
Reactor Using Computational Fluid Dynamics. Korean Chem. Eng. Res. 2015, 53,

127
(6), 818-823.
(57) Park, S.; Jung, I.; Lee, Y.; Kshetrimayum, K. S.; Na, J.; Park, S.; Shin, S.; Ha,
D.; Lee, Y.; Chung, J.; Lee, C.-J.; Han, C., Design of microchannel Fischer–Tropsch
reactor using cell-coupling method: Effect of flow configurations and distribution.
Chem. Eng. Sci., 2016, Vol.143, 63-75.
(58) Jung, I.; Kshetrimayum, K. S.; Park, S.; Na, J.; Lee, Y.; An, J.; Park, S.; Lee,
C.-J.; Han, C., Computational Fluid Dynamics Based Optimal Design of Guiding
Channel Geometry in U-Type Coolant Layer Manifold of Large-Scale Microchannel
Fischer–Tropsch Reactor. Ind. & Eng. Chem. Res., 2016, 55, (2), 505-515.
(59) Jung, I.; Na, J.; Park, S.; Jeon, J.; Mo, Y.-G.; Yi, J.-Y.; Chung, J.-T.; Han, C.,
Optimal design of a large scale Fischer-Tropsch microchannel reactor module using
a cell-coupling method. Fuel Process. Technol., 2017, 159, 448-459

128
Abstract in Korean (요 약)
Gas-to-Liquid (GTL), coal-to-liquid (CTL) 그리고 biomass-to-liquid (BTL)
공정에서 피셔-트롭시 반응은 주요 과정에 속한다. GTL공정에서 탄화수
소 연료를 생산하는 FT 반응에 필요한 syn-gas(이산화탄소와 수소의 화
합물)를 생산하기 위해 천연가스를 feedstock으로 사용한다. CTL과 BTL에
서 syngas는 연료와 바이오메스 기화로부터 생산된다. GTL은 불안정한
연료가격, offshore GTL에서 수반가스의 flaring로 인한 환경 규제들 그리
고 이런 자원들을 화폐화 시키는 것에 대한 의문들로 인해 oil과 gas 산
업에서 오늘날 주목을 받고 있다. GTL에서 산업화된 반응기로는 생산 조
건과 운전 조건에 따라서 고온 FT (593-623 K)와 저온 FT (493-523 K)로
분류된다. 반응은 생산물 선택성과 촉매 비활성화가 온도에 매우 민감하
면서 높은 발열 반응(반응열 = 165 KJ/mol 반응한CO)으로 특징지어진다.
이는 높은 수득률을 얻기 위해서는 적절한 열 제거와 온도 제어가 필수
적임을 의미한다.
상업화 GTL 플랜트에서의 저온 FT 반응은 전통적인 fixed bed와 slurry
bubble column 반응기를 사용한다. 그러나, fixed bed 반응기는 높은 압
력강하와 확산 한계 그리고 불충분한 열 제거 용량 때문에 한계가 있다.
그리고 slurry bubble column의 경우에는 액상 생성물과 촉매와의 분리
가 주요 문제점이다. 오늘날에, 연구자들 사이에서 마이크로채널 반응기

129
가 주목받고 있다. 이 반응기는 확산 거리를 줄여줄 수 있고, 열 전달 저
항 및 물질 전달 저항을 줄여줄 수 있기 때문에 FT 반응에 적합한 기술
로 여겨지고 있다. 열 전달 거리와 물질 전달 거리를 줄여주는 것은 공
정을 집적화 할 수 있게 만들어 주며 이는 매우 활성도가 높은 FT 촉매
에 적합하다. 그러므로, offshore와 원격 생산 시설 등에 이러한 소형,
모듈 전환 기술이 필요하다. 그리고, 마이크로채널 반응기 블록들은 매우
집적화되있고 운반이 쉬우며 안전한 기술이기 때문에 활용 시에 안전하
다. syngas를 생산하는데 사용되는 생활 쓰레기 혹은 바이오메스 같은
작은 스케일의 에너지원에도 마이크로채널 반응기 기술을 적용할 수 있
다. 그러나 FT 반응의 높은 발열과 짧은 체류량은 열 제거를 위한
saturated water와 같은 효율적인 냉각 물질을 필요로 한다.
피셔-트롭시 반응을 위해 마이크로 채널 블록에서는 반응 채널과 냉각
채널이 십자 모양으로 흐르게 배열되었다. 몇 년 전 이래로, 비싸고 어려
운 실험을 대체하기 위해서 마이크로 반응기 혹은 마이크로채널 반응기
모사하는 전산유체역학(CFD) 기술이 트랜드가 되었다. 마이크로채널 블
록에서 열전달을 CFD로 모사하는 것은 반응기 온도에서 냉각 채널 속의
wall boiling 조건이 미치는 영향을 보여주었다. 첫째로, 여러 운전 조건
을 고려할 때 채널 길이에 따라서 열 생성 프로파일을 얻기 위해서 촉매
가 가득찬 싱글채널에서의 반응이 모사되었다(GHSV 5000 hr-1; 30,000 hr-

130
1; chrao 로딩 혹은 활성도 60 % - 300 %, 여기서 100 % 로딩은 1060
kg/m3이고 Oxford Catalyst Ltd 에서 개발한 코발트 베이스 촉매이며 촉
매 활성도는 100으로 여겨진다.) 싱글채널 반응 모델은 실험에서의 싱글
채널 반응 모델을 모사하고 이 모델 예측 값을 실제 실험 데이터와 비교
함으로써 입증되었다. 열 생성 프로파일을 열 전달 모사를 위하여 멀티
채널 블록으로 시간 당 일정하게 넣어주었다. 냉각 오일 (Merlotherm
SHTM), subcooled water와 saturated water (반응 운전 조건에서 포화된)이
냉각 물질로 선택되었다. 이 연구는 냉각 오일의 경우에 최소한
saturated water과 채널 벽 사이에 가장 열전달을 잘하는 것을 밝혔다.
한 가지 경우에서 가장 온도가 높은 부분과 낮은 부분의 차이는 냉각 오
일, subcooled water그리고 saturated water 각각에 따라서 32K, 17K, 그
리고 12K였다. 채널 당 3 – 6g/min으로 흐르는 saturated water는 벽으로
8900 W/m2-K 를 넘는 높은 열 유량을 보낸다. 특정 운전 조건에서는
(GHSV 30,000 hr-1; 촉매 로딩 300 %), 평균 FT 온도는 saturated water에
대해서 510K 그리고 subcooled water에 대해서 519K 이다.
반응기 열 전달 효율 측면에서 채널의 구조를 고려하면서 냉각 채널과
반응 채널의 여러 후보군을 평가하였다. 냉각 채널 층을 추가한 반응기
블록은 매우 낮은 vapor fraction의 배출과 wall boiling이 일어나는 조건
에서 두드러질 만한 열 교환 성능의 향상을 보여준다. 특정 운전 조건

131
(GHSV = 30,000 hr-1 그리고 활성도 높은 촉매 조건)에서 변형된 반응 블
록에서 실행한 결과에 따르면 온도, 반응 전환율 그리고 생산 선택성간
의 강한 상관관계를 보여준다. 저온 FT반응의 경우에 523K아래에서 주
요 반응이 일어난다. 예측 결과에 따르면 517K가 최적 값이다. 그러나,
일반적으로 촉매의 활성도 감소에 따라서, 같은 CO 전환율을 얻기 위해
서 반응기는 좀더 높은 온도에서 운전된다. Syngas 비율과 반응 운전 압
력의 효과에 대한 연구에 따르면, syngas비율은 2, 그리고 운전 압력은
20 – 22bar가 다른 값에 비하여 적절한 생성물 선택성을 보여준다.
촉매층 존의 분리와 각각의 존에 다른 %의 로딩 방법에 대해서 평가
하였다. 연구를 통해서 이 방법의 이점을 알 수 있었다. 또한, 이 방법론
을 통해서 최적의 존 배분, 존의 길이와 각각의 존에 대해서 전략적인
로딩 비율을 이끌어 냈다. 또한, syngas와 냉각 흐름의 교차 흐름과 같은
방향으로 흐르는 경우에 대해서 열 전달 성능을 평가해봤을 때 같은 방
향으로 흐를 경우에 교차 흐름보다 마이크로채널 반응기 블록 운전에 더
효율적이라는 결과가 도출되었다. 미래의 마이크로채널 반응기 모사와
디자인 공정을 위한 규격화된 디자인 절차 또한 제안하였다.
학번: 2011-30282
성명: 크리스나다스
Related Documents


