저작자표시-비영리-변경금지 2.0 대한민국 이용자는 아래의 조건을 따르는 경우에 한하여 자유롭게 l 이 저작물을 복제, 배포, 전송, 전시, 공연 및 방송할 수 있습니다. 다음과 같은 조건을 따라야 합니다: l 귀하는, 이 저작물의 재이용이나 배포의 경우, 이 저작물에 적용된 이용허락조건 을 명확하게 나타내어야 합니다. l 저작권자로부터 별도의 허가를 받으면 이러한 조건들은 적용되지 않습니다. 저작권법에 따른 이용자의 권리는 위의 내용에 의하여 영향을 받지 않습니다. 이것은 이용허락규약 ( Legal Code) 을 이해하기 쉽게 요약한 것입니다. Disclaimer 저작자표시. 귀하는 원저작자를 표시하여야 합니다. 비영리. 귀하는 이 저작물을 영리 목적으로 이용할 수 없습니다. 변경금지. 귀하는 이 저작물을 개작, 변형 또는 가공할 수 없습니다.

Welcome message from author
This document is posted to help you gain knowledge. Please leave a comment to let me know what you think about it! Share it to your friends and learn new things together.
Transcript

저 시-비 리- 경 지 2.0 한민
는 아래 조건 르는 경 에 한하여 게
l 저 물 복제, 포, 전송, 전시, 공연 송할 수 습니다.
다 과 같 조건 라야 합니다:
l 하는, 저 물 나 포 경 , 저 물에 적 된 허락조건 명확하게 나타내어야 합니다.
l 저 터 허가를 면 러한 조건들 적 되지 않습니다.
저 에 른 리는 내 에 하여 향 지 않습니다.
것 허락규약(Legal Code) 해하 쉽게 약한 것 니다.
Disclaimer
저 시. 하는 원저 를 시하여야 합니다.
비 리. 하는 저 물 리 목적 할 수 없습니다.
경 지. 하는 저 물 개 , 형 또는 가공할 수 없습니다.

공학석사 학위논문
Optimal Layout Method of an
Offshore Plant Topside Based on
Expert System
전문가 시스템 기반 해양 플랜트 상부의 최적
배치 방법
2016년 2월
서울대학교 대학원
조선해양공학과
김 성 균

i
Abstract
Optimal Layout Method of an Offshore Plant
Topside Based on the Expert System
In an offshore plant, many modules and equipment are placed on the limited space
called topside, so that the space should be used efficiently. Furthermore, a sufficient
space between equipment should be provided for the operability, maintainability,
and safety. To guarantee suitable arrangement design, there are many requirements
to be considered such as international codes and standards, including owners’ own
requirements. Also, the arrangement design of an offshore plant topside tends to rely
on experts’ knowledge and experiences. In this study, an arrangement method of
offshore plant topside based on the expert system and the optimization technique
was proposed to obtain the optimal layout which satisfies many requirements as
mentioned above. Proposed method consists of four component. First, an expert
system that can systematically computerize experts’ knowledge and experiences, and
can evaluate the feasibility of alternatives for the arrangement design of the offshore
plant topside was proposed by expanding the previous study of authors for the
arrangement design of a submarine. Second, an arrangement template model (ATM)
was proposed to store various data on the arrangement design of the offshore plant
topside. Third, an optimization method that can yield a better arrangement design
was proposed by formulating a topside arrangement problem as optimization
problem. Forth, user interface was developed for expert system and optimization. To
evaluate the applicability of the proposed arrangement method, a prototype program
was also developed here. Finally, this program was applied to a problem of a large
FPSO topside. The results showed that the proposed method can be used to obtain

ii
the optimal arrangement of offshore plant topside.
Keywords: Arrangement design; offshore plant topside; Expert system;
Optimization, Arrangement evaluation model
Student number: 2014-20646

i
Contents
Abstract .......................................................................... i
Introduction .............................................................. 1
1.1. Arrangement design of offshore plant topside ................................. 1
1.2. Research background .................................................................................. 3
1.3. Related works ................................................................................................. 5
1.4. Target of this study ...................................................................................... 9
1.5. Summary of this study ............................................................................. 11
1.5.1. Overview .............................................................................................................................11 1.5.1. Arrangement template model (ATM) .......................................................................11 1.5.2. Arrangement evaluatiom model (AEM) ..................................................................12 1.5.3. Arrangement optimization model (AOM) ..............................................................12 1.5.4. User interface ....................................................................................................................13
Arrangement template model (ATM) for the arrangement design of an offshore plant topside . 14
Arrangement evaluation model (AEM) for the arrangment design of offshore plant topside ........ 17
3.1. Representation of object information ................................................ 19
3.2. Representation of relation information ............................................. 23
3.3. Arrangement evaluation ......................................................................... 28
3.4. Weight factor for the rules ..................................................................... 32
Arrangement optimization model (AOM) for the arrangement design of an offshore plant topside . 34
4.1. Optimization of the module arrangement ....................................... 36

ii
4.1.1. Input data ...........................................................................................................................36 4.1.2. Design variables ...............................................................................................................38 4.1.3. Objective functions .........................................................................................................38
4.2. Optimization of the equipment arrangement in the module ... 40
4.2.1. Input data ...........................................................................................................................40 4.2.2. Design variables ...............................................................................................................41 4.2.3. Objective functions .........................................................................................................43 4.2.4. Constraints .........................................................................................................................48
User interface ........................................................ 51
5.1. Configuration of user interface ............................................................ 51
5.2. Tool for expert system ............................................................................. 52
5.3. Tool for optimization ................................................................................ 53
Applications ........................................................... 54
6.1. Optimal module layout ........................................................................... 54
6.1.1. Experts’ knowledges for application ........................................................................55 6.1.2. Result ....................................................................................................................................57 6.1.3. Case study ..........................................................................................................................59
6.2. Optimal equipment layout in water injection module ................. 60
6.2.1. Input data ...........................................................................................................................60 6.2.2. Experts’ knowledges for application ........................................................................62 6.2.3. Result ....................................................................................................................................63 6.2.4. Case study ..........................................................................................................................65
6.3. Optimal equipement layout in separation module ....................... 69
6.3.1. Input data ...........................................................................................................................69 6.3.2. Experts’ knowledges for application ........................................................................70 6.3.3. Result ....................................................................................................................................70
6.4. Optimal equipment layout in oil cooling module ......................... 72
6.4.1. Input data ...........................................................................................................................72 6.4.2. Experts’ knowldeges for application ........................................................................73 6.4.3. Result ....................................................................................................................................74
6.5. Optimal equipment layout in oil exporting module ..................... 76
6.5.1. Input data ...........................................................................................................................76

iii
6.5.2. Experts’ knowledges for application ........................................................................77 6.5.3. Result ....................................................................................................................................77
6.6. Optimal equipment layout in gas compression module ............ 79
6.6.1. Input data ...........................................................................................................................79 6.6.2. Experts’ knowledge for application ..........................................................................81 6.6.3. Result ....................................................................................................................................83
Conclusions and future works ............................. 85
References .................................................................. 86
APPENDICES............................................................... 88
A. Oil and gas production process ........................... 89
A.1. Overall process flow ................................................................................. 89
A.2. Oil production system ............................................................................. 91
A.3. Gas production system ........................................................................... 93
A.4.Produced water system ............................................................................ 95
B. International code and standard ......................... 96
B.1. API RP 14J .................................................................................................... 96
B.1.1 General .................................................................................................................................96 B.1.2. Separation of fuel and ignition sources ..................................................................97 B.1.3. Adequate ventilation ......................................................................................................97 B.1.4. Platform equipment arrangement ............................................................................97
B.2. NORSOK Standard, L-002 ..................................................................... 102
B.2.1. General ............................................................................................................................. 102 B.2.2. Miscellaneous requirements .................................................................................... 103
B.3. NORSOK Standard, P-100 .................................................................... 104
B.3.1. Crude handling (system 21) ..................................................................................... 104 B.3.2. Ga compression (system 23, 26 & 27) .................................................................. 104 B.3.3. Water injection system (system 29) ....................................................................... 104 B.3.4. Cooling medium (system 40) ................................................................................... 105 B.3.5. Heating medium (system 41) ................................................................................... 105

iv
B.3.6. Chemical injection (system 42) ............................................................................... 105 B.3.7. Flare system ( system 43) .......................................................................................... 105 B.3.8. Oil water treatment (system 44) ............................................................................. 106 B.3.9. Diesel oil (system 62) .................................................................................................. 106 B.3.10. Compressed air (system 63) ................................................................................... 106
B.4. NORSOK Standard, S-001 .................................................................... 107
B.4.1. Riser flow line area ....................................................................................................... 107 B.4.2. Process area .................................................................................................................... 107 B.4.3. Piping ................................................................................................................................ 108 B.4.4. Lifting and laydown ..................................................................................................... 108
국문 초록 .................................................................. 109

v
Figures
Figure 1-1 Example of the arrangement an FPSO (Salzgitter Mannesmann Stainless Tubes, 2015) .......................................................................................................... 2
Figure 1-2 Configuration of the proposed arrangement method of an offshore plant topside based on the expert system and optimization technique ......................... 11
Figure 2-1 Arrangement template model (ATM) expressed by using UML ........... 16
Figure 3-1 Configuration of the arrangement evaluation model ............................. 18
Figure 3-2 Configuration of the object information ................................................ 19
Figure 3-3 Examples of the object information....................................................... 22
Figure 3-4 Configuration of the relation information ............................................. 23
Figure 3-5 Example of the relation information of using the "GroupWith" and “ConnectionTo” type ........................................................................................... 26
Figure 3-6 Example of the relation information of using the “DistanceFrom” and “LevelDifference” ............................................................................................... 27
Figure 3-7 Example of the converting procedure of the object information to rules ............................................................................................................................. 30
Figure 3-8 Example of the converting procedure for the relation information to rules ..................................................................................................................... 31
Figure 3-9 Example: effects of the weight factor .................................................... 33
Figure 4-1 Configuration of the two stages optimization problem for the arrangement design of the FPSO topside ............................................................ 35
Figure 4-2 Representation of the positions of each module .................................... 38
Figure 4-3 Design variable for equipment arrangement ......................................... 42
Figure 4-4 Calculation procedure of the probability of the damage. Pij (Park, 2011) ............................................................................................................................. 45
Figure 4-5 Empty volume of the kth deck ................................................................ 47
Figure 4-6 Passage constraints: limits of the passage location ............................... 50
Figure 5-1 Screenshot of the prototype program ..................................................... 51
Figure 5-2 Screenshot of the prototype program: tool for the object and relation information .......................................................................................................... 52
Figure 5-3 Screenshot of the prototype program: tool for the expert system .......... 52
Figure 5-4 Screenshot of the prototype program: tool for the optimization ............ 53
Figure 6-1 Optimal module arrangement ................................................................ 58
Figure 6-2 Case study: effect of the rule to the module arrangement ..................... 59
Figure 6-3 Flow diagram; Water injection system .................................................. 61

vi
Figure 6-4 Constraints for “Deaeration tower” as multi-deck equipment ............... 62
Figure 6-5 Visualization of the optimal equipment arrangement in “Water injection” module ................................................................................................ 65
Figure 6-6 Case study: effect of the rule to the equipment arrangement in “Water injection” module ................................................................................................ 66
Figure 6-7 Visualization of the optimal result including the internal transverse passages ............................................................................................................... 68
Figure 6-8 Flow diagram; Separation module ......................................................... 69
Figure 6-9 Visualization of optimal result; Separation module ............................... 71
Figure 6-10 Flow diagram; Oil cooling module ...................................................... 72
Figure 6-11 Visualization of optimal result; Oil cooling module ............................ 75
Figure 6-12 Flow diagram; Oil exporting module .................................................. 76
Figure 6-13 Visualization of optimal result; Oil exporting module ........................ 78
Figure 6-14 Flow diagram; Gas compression module ............................................ 80
Figure 6-15 Visualization of optimal result; Gas compression module .................. 84
Figure A-1 Overall process flow (Angus Mather, 2009) ......................................... 89
Figure A-2 Process flow of oil production system .................................................. 91
Figure A-3 Incremental liquid recovery versus number of separator stages (Ken Arnold et at., 2008).............................................................................................. 92
Figure A-4 Process flow of gas production system ................................................. 93
Figure A-5 process flow of produced water system ................................................ 95
Figure B-1 Fuel and ignition sources ...................................................................... 98
vii
Tables
Table 1-1 Summary of related works ........................................................................ 8
Table 2-1 Properties of the topside class ................................................................. 15
Table 2-2 Properties of the module class ................................................................. 15
Table 2-3 Properties of the deck class ..................................................................... 15
Table 2-4 Properties of the equipment class ............................................................ 16
Table 2-5 Properties of the passage class ................................................................ 16
Table 3-1 Properties of the object information ........................................................ 21
Table 3-2 Description of attributes of the object information ................................. 21
Table 3-3 Data type and properties of the target value according to the attributes . 21
Table 3-4 Properties of the relation information ..................................................... 24
Table 3-5 Description of relation types of the relation information ........................ 24
Table 3-6 Data type and properties of the target value according to the relation type ............................................................................................................................. 25
Table 4-1 Input data for the module arrangement ................................................... 37
Table 4-2 Objective functions for the optimization of the module arrangement ..... 39
Table 4-3 Input data for the equipment arrangement .............................................. 41
Table 4-4 Design variables for the equipment arrangement .................................... 42
Table 6-1 Module list of the example FPSO topside ............................................... 54
Table 6-2 Object list for the module arrangement ................................................... 56
Table 6-3 Relation list for the module arrangement ................................................ 56
Table 6-4 Comparison of the objective functions with the manual design ............. 58
Table 6-5 Equipment list; Water injection module .................................................. 61
Table 6-6 Object list for the equipment arrangement in “Water injection” module 63
Table 6-7 Relation list of the equipment arrangement in “Water injection” module ............................................................................................................................. 63
Table 6-8 Comparison of the objective functions with the manual design ............. 64
Table 6-9 Result of the optimal equipment arrangement ........................................ 64
Table 6-10 Additional object information ............................................................... 66
Table 6-11 Comparison: with internal passage vs without internal passage ........... 67
Table 6-12 Result of the optimal equipment arrangement with internal passages .. 68
Table 6-13 Equipment list; Separation module ....................................................... 69

viii
Table 6-14 Object list for equipment arrangement; Separation module .................. 70
Table 6-15 Objective functions and optimum values; Separation module .............. 70
Table 6-16 Result of optimal equipment arrangement; Separation module ............ 71
Table 6-17 Equipment list; Oil cooling module ...................................................... 72
Table 6-18 Object list for equipment arrangement; Oil cooling module ................. 73
Table 6-19 Relation list for equipment arrangement; Oil cooling module .............. 74
Table 6-20 Objective functions and optimum values; Oil cooling module ............. 74
Table 6-21 Result of optimal equipment arrangement; Oil cooling module ........... 74
Table 6-22 Equipment list; Oil exporting module ................................................... 76
Table 6-23 Object list for equipment arrangement; Oil exporting module ............. 77
Table 6-24 Objective functions and optimum values; Oil exporting module .......... 77
Table 6-25 Result of optimal equipment arrangement; Oil exporting module ........ 78
Table 6-26 Equipment list; Gas compression module ............................................. 80
Table 6-27 Object list for equipment arrangement; Gas compression module ....... 82
Table 6-28 Objective functions and optimum values; Gas compression module .... 83
Table 6-29 Result of optimal equipment arrangement; Gas compression module .. 83

1
Introduction
1.1. Arrangement design of offshore plant topside
An offshore plant is a large facility which produces oil and gas from offshore oil
and fields. The offshore plant has the limited space called topside, as compared with
an onshore plant. Many modules and equipment are placed on the topside. Thus, the
space should be used more efficiently and compactly. Furthermore, a sufficient space
should be provided for convenient operation and easy maintenance of the modules
and equipment. In addition, the safety is a critical issue as accidents would result in
significant losses of human lives and properties, and cause huge environmental
impact. As a result, an arrangement design of the offshore plant topside is one of key
processes of engineering activities for constructing the offshore plant in order to
achieve the operability, maintainability, and safety.
Among various types of the offshore plant, an FPSO (Floating, Production,
Storage, and Offloading unit) is a representative type which produces oil and gas in
deep water. It is made up of two parts: topside and hull. The topside, like chemical
plants, produces and offloads crude oil and gas, and the hull, like big tanks, stores
the produced oil (Hwang et al., 2010). In the FPSO topside, various modules and
equipment are installed in order to separate oil, gas, and water from well fluid, to
produce oil and gas, to store them in internal tanks of the hull, and to offload them
on other ships. Here, a module (e.g., separator, living quarter, flare tower, etc.) can
be regarded as a system or a group of equipment which performs a specific function
such as separation, accommodation, gas combustion, and so on. And the module
includes several equipment. In the module, the equipment are located on several
decks, that is, multiple decks, in order to use the limited space efficiently and

2
compactly. That is, the FPSO topside includes several modules having specific
functions. In the module, many equipment are installed on multiple decks. Each
module is constructed individually and integrated with the FPSO hull in the shipyard.
Thus, the arrangement design of the FPSO topside can be divided into two stages
(Ku et al., 2014). The first stage is the module arrangement. For example,
considering the prevailing wind direction, a living quarter should be arranged
upwind, and a flare tower should be arranged as far as possible to the living quarter.
Utility service modules such as a water injection module and an electric power
generation module should be arranged between the living quarter and hazardous
modules to serve as a barrier. The second stage is the equipment arrangement in the
module. At this time, a process flow should be considered to reduce the piping length
among equipment. Moreover, a space for operation and maintenance around the
equipment should be considered. Figure 1-1shows an example of the arrangement of
an FPSO topside (Salzgitter Mannesmann Stainless Tubes, 2015).
Figure 1-1 Example of the arrangement an FPSO (Salzgitter Mannesmann Stainless Tubes,
2015)

3
1.2. Research background
There are many international codes and standards providing the general guidance
and criteria for the arrangement design of an offshore plant topside. And owners
have their own requirements based on their operational philosophy and site
characteristics of the offshore plant. Consequently, the arrangement design should
satisfy the international codes and standards, and the owners’ requirements without
their omissions. Meanwhile, the arrangement design mainly depends on experts’
own knowledge and experiences. Delay in design can occur when there are missing
considerations or when experts are absent. Therefore, experts’ knowledge and
experiences is also required to be reflected in arrangement design properly.
At this time, there are many design methods and tools available to support a
designer. Some of them are now available as commercial computer programs
(Edwards, 2003). However, design of a product is no longer considered as a problem
solving procedure. With the initiation of technology and competent programs for
computation, it has become more of a decision making process that involves precise
assessment of design alternatives (Ipek et al., 2012). Thus, an expert system can be
one of the alternative solutions to such problem or process. There are several
researches adopting the expert system to an arrangement problem. The expert system
is a branch of the applied artificial intelligence. The basic idea behind the system is
simplifying that expertise, which is the vast body of task-specific knowledge, is
transferred from a human to computer. This knowledge is then stored in the computer
and a designer call upon the computer for specific advice as needed (Liao, 2005). If
the expert system is well developed and is applied in the stage of arrangement design,
it can be used to evaluate the feasibility of an arrangement design alternative instead
of relying on experts for each design alternative. Thus, an expert system that can
systematically computerize experts’ knowledge, and can evaluate the feasibility of

4
alternatives for the arrangement design of an offshore plant topside was developed,
and it is consolidated in optimization technique to derive the optimal layout of an
offshore plant topside.

5
1.3. Related works
Arrangement design method has been proposed by several authors. And the
expert system has been adopted for various fields of research. In this section, a
summary of the past studies, related to the arrangement design in the fields including
naval architecture and ocean engineering, is described.
In the field of the ship design, Byun (1998) proposed a rule-based expert system
based on a knowledge base for supporting initial ship design such as compartment
design at the initial design stage. He constructed a knowledge base for deciding
principal dimensions of a ship to obtain the maximum volume of cargo that can be
carried by a ship as per the owner’s requirements and the pertinent international
regulations. In addition, he constructed a knowledge base for determining the
arrangement of compartments. Shin et al. (2002) proposed an expert system for the
arrangement design of machinery in a ship. They made rules for the arrangement
design of the machinery, from the relation between the equipment to the owner’s
requirements, the insights of the designer, etc. When evaluating the rules for coming
up with design alternatives, they also considered fuzzy rules. Finally, they developed
a new algorithm for the arrangement design of the machinery using the expert system.
Helvacioglu and Insel (2005) proposed a multistage expert system for the
arrangement design of compartments of a container ship. With the expert system,
they divided a container ship into several large blocks called function groups, and
initially arranged them to determine the compartment arrangement. By considering
more detailed data, they derived the final arrangement of the compartments of the
container ship. They used heuristic knowledge and rules for the container ship in the
expert system. Chung et al. (2011) proposed an optimization method of
compartments in the pressure hull of a submarine with a rule-based expert system.
The rule-based expert system was adopted to evaluate alternatives for the

6
arrangement design of the submarine. The evaluation values called feasibility indices
for the alternatives obtained from the expert system were used as an objective
function for optimization. If a certain alternative violates a rule, a positive penalty is
added to the value of the objective function of the alternative. Shin (2013) proposed
a method for the arrangement design of a naval ship by considering its survivability
at the initial design stage. The SLP (Systematic Layout Planning) method was used
for analyzing the relation between the equipment in the naval ship. Then an
arrangement method for generating alternatives and evaluating the feasibility of
them was proposed. The SLP method differs from the expert system in that the
method decides the arrangement using the relation matrix between the equipment,
but as such matrix is made by an expert, it is somewhat similar to the expert system.
We proposed an expert system based on an arrangement evaluation model (AEM)
for the arrangement design of a submarine in the previous study (Kim et al., 2015).
The AEM was proposed as an expansion of the rule-based expert system. In addition,
an arrangement template model (ATM) for the submarine was proposed to store the
arrangement data of the submarine.
In field of the onshore and offshore plant design, Patisatizis et al. (2002) proposed
an optimal layout method for multi-floor process plant. Arrangement method for
multi-floor process plant was formulated as optimization problem. It applied to the
five-unit instant coffee process and ethylene oxide plant. Park et al. (2011) proposed
an optimal layout method with consideration of the safety distance based on the TNT
equivalency method. Physical explosion of the pressurized vessel was considered.
Proposed method was applied to the ethylene oxide plant and benzene production
plant. Ku et al. (2014) proposed an optimal arrangement method for a generic
liquefaction system of an LNG FPSO. An arrangement problem was formulated
mathematically as a constrained optimization problem, than it was applied to the
liquefaction system of the LNG FPSO and solved with the genetic algorithm. Jeong

7
et al. (2015) proposed an optimal arrangement method of an FPSO topside.
Optimization problems for the module arrangement and the equipment arrangement
were formulated and then solved with the genetic algorithm. Above studies proposed
the optimal arrangement method of the offshore plant topside which regards various
arrangement considerations such as experts’ knowledge as constraints during
optimization process. However, it is difficult to reflect additional considerations or
changes on the existing problems flexibly and efficiently without the modification
of the optimization problems. Dan et al. (2015) performed the layout optimization of
LNG-liquefaction process on LNG-FPSO preventing domino effects. Considering
the jet fire, vapor cloud explosion (VCE) and physical explosion, safety distance was
calculated, then it was reflected in non-overlapping constraints. Also protection
devices such as water curtain was considered in mathematical formulation of the
optimization. However, various requirement for arrangement design was not
reflected into the layout optimization efficiently.
In the fields of other design, Park (2009) proposed a framework for representing
experts’ knowledge called SLEM (Spatial Layout Evaluation Model) using the
requirement of space (area, position, etc.) and the relation between the spaces
(adjacency, level difference, etc.). Then he evaluated the given arrangement for a
building using the proposed framework. Such method, however, could evaluate the
building special section only. Thus, it has limitation to evaluate the arrangement of
an interior or equipment in the building.
Table 1-1 shows a summary of the related works and a comparison of such works
with this study. In the table, the application target and evaluation method of each
research were organized.

8
Table 1-1 Summary of related works
Research Target of application Template
model Expert system
Optimization
Problem type
Byun (1998) Ship compartments X O X 2D Patisiatizis et al. (2002)
Instant coffee process Ethylene oxide plant X X O 3D
Shin et al. (2002) Ship machinery X O X 3D
Helvacioglu & Insel (2005)
Ship compartments X O X 2D
Park (2009) Building sections X O X 3D Chung et al. (2011) Submarine X O O 2D
Part et al. (2011)
Ethylene oxide plant Benzene production plant
X X O 3D
Shin et al. (2013) Naval ship X O X 3D
Ku et al. (2014) LNG FPSO topside X X O 3D
Jeong et al. (2015) FPSO topside X X O 3D
Dan et al. (2015) LNG FPSO topside X X O 3D
Kim et al. (2015) Submarine O O X 3D
This study FPSO topside O O O 3D

9
1.4. Target of this study
Among the various type of the offshore plant, this study proposed the
arrangement method of FPSO. Through the literature survey of the prior section, it
can be seen that most of the relevant researches have focused on the expert system
or optimization individually. In this study, the expert system and optimization were
combined to derive the optimal arrangement design satisfying the various layout
requirements. First, as a data structure, arrangement template model (ATM) was
newly proposed to store the arrangement information. Second, and expert system for
arrangement design of offshore plant topside was developed. An expert system for a
three-dimensional arrangement design for an offshore plant topside has not been
studied yet. A rule-based expert system, a kind of the expert system, is defined as
one, which contains information obtained from experts, and represents that
information in the form of rules, such as IF-THEN phrases (Liao, 2005). As
mentioned earlier, we proposed the AEM that can systematically computerize
experts’ knowledge for the arrangement design of a submarine by extending the
existing rule-based expert system in the previous study (Kim et al., 2015). In this
study, the AEM for the arrangement design of an offshore plant topside was
proposed to evaluate the feasibility of the arrangement alternatives. Third,
arrangement problem of the FPSO topside, was formulated as optimization problem.
The feasibility from the expert system was used as one of objective functions in
optimization stage.
The reminder of this paper is organized as follows. Section 2 describes the
arrangement template model (ATM) for offshore plant topside proposed in this study.
Section 3 describes the expert system for arrangement design of the offshore plant
topside, based on the arrangement evaluation model (AEM). Section 4 describes the
arrangement optimization model (AOM). In this study, arrangement design of the

10
offshore plant topside is formulated as optimization problems. Section 5 describes
the user interface developed in this study. In Section 6, the application of the
proposed arrangement method to an FPSO is presented with discussion the
application results. The last section mentions the results of this study and briefly
discusses the next study. Additionally, process flow of the FPSO topside is attached
as appendix A. Arrangement requirement recommended by various international
codes and standards are summarized in appendix B.

11
1.5. Summary of this study
1.5.1. Overview
In this paper, arrangement design method of an offshore plant topside based on
the expert system and the optimization technique was proposed. Figure 1-2 shows
the configuration of the proposed method. As shown in this figure, the proposed
method consists of four components: the arrangement template model, the expert
system module, the optimization module, and the user interface.
Figure 1-2 Configuration of the proposed arrangement method of an offshore plant topside
based on the expert system and optimization technique
1.5.1. Arrangement template model (ATM)
A data structure that can store the arrangement data is required to perform the
arrangement design of the offshore plant topside. In this study, the ATM, that is, the
data structure for the arrangement design of the offshore plant topside was defined
hierarchically by using UML (Unified Modeling Language) in order to store various

12
data related to the arrangement design of the offshore plant topside such as topside,
modules, equipment, decks, passages, and so on.
1.5.2. Arrangement evaluatiom model (AEM)
The AEM can be regarded as a general rule-based expert system. Thus, it includes
some components of the rule-based expert system such as a knowledge base, a
database, and an inference engine, and so on. One of the difference between the AEM
and the general rule-based expert system is that the knowledge base and the database
are integrated with management as two lists called object and relation lists (Kim et
al., 2015). In this study, AEM is used to evaluate the feasibility of alternatives for
the arrangement design of the offshore plant topside. With the AEM, a designer can
easily express various rules about the arrangement design of the offshore plant
topside, and evaluate the feasibility of the given design alternative.
1.5.3. Arrangement optimization model (AOM)
In this study, optimization technique was used to derive the arrangement design
of an offshore plant topside. Thus, optimization module was developed. It includes
the mathematical formulation of optimization problems and an optimization
algorithm for solving the formulated problems. As described in section 1.1, the
arrangement design of the FPSO topside can be divided into two stages. Thus, the
arrangement design of the FPSO topside was formulated as two stages optimization
problems. First stage is the module arrangement. Module arrangement problem was
formulated as optimization problem considering the antagonism and affinities
between each module. Also weight distribution was considered. Second stage is the

13
equipment arrangement in each module. Process flow, possibility of the physical
explosion and ventilation were considered to formulate the equipment arrangement
problem as optimization problem.
Optimization module uses the dimension and location information of modules
and equipment stored in ATM. Various requirement for the arrangement design of
the offshore plant topside can be expressed as rules in the expert system. Expert
system returns the feasibility index to optimization module. Optimization module
uses the feasibility index as one of the objective functions.
1.5.4. User interface
A user interface is also needed for a designer to use above components flexibly.
In this study, the user interface which consists of two components was developed
and then used to evaluate the arrangement design of the offshore plant topside; tool
for expert system, and 3D visualization panel. The first component is used to create,
edit, and operate experts’ rules. And the second component is used to investigate and
visualize the arrangement result of the offshore plant topside.

14
Arrangement template model (ATM) for the
arrangement design of an offshore plant
topside
As mentioned earlier, an offshore plant like an FPSO consists of two parts:
topside and hull. The topside, like chemical plants, produces and offloads crude oil
and gas, and the hull, like big tanks, stores the produced oil (Hwang et al., 2010). In
the aspects of the production of oil and gas and the difficulty of the arrangement
design, the topside is more important than the hull. Thus, this study focused on the
arrangement design of the topside. As shown in Figure 2-1, the topside includes
several modules having specific functions. In the module, many equipment are
installed on multiple decks for the efficient, compact use of the topside.
The overall procedure for the arrangement design of the topside is as follows.
First, the topside is defined, and it is divided into several modules. For the efficient
arrangement of equipment and passages in the module, the module is further divided
into several regions through the use of multiple decks. Finally, the equipment and
passages are defined and arranged to the decks.
To store the arrangement data such as those pertaining to the topside, modules,
decks, equipment, and passages, a space for them called the arrangement template
model (ATM) was defined hierarchically in this study. This space is a kind of a data
structure, which is necessary for most computer programs. To define the model, the
UML was used in this study. The UML is a language for specifying, visualizing,
constructing, and documenting the products of software systems, as well as for
business modeling (Rumbaugh et al., 2000). Figure 2-1 shows the ATM represented
in the form of a class diagram of the UML.

15
Topside class has the list of the module arranged in topside. In the module class,
name, size such as the length, width and height, COG, deck and equipment list
installed in each module are stored. In the deck class, length, width, height and list
of equipment installed in each deck are stored. In equipment and passage class,
length, width, height and COG are stored. Properties of each class are summarized
from Table 2-1 to Table 2-5.
Table 2-1 Properties of the topside class
Topside Properties Data type Modules List<module>
Table 2-2 Properties of the module class
Module Properties Data type
Name String Length Double Width Double Height Double COG Point Decks List<deck>
Equipment List<equipment>
Table 2-3 Properties of the deck class
Deck
Properties Data type
Name String
Length Double
Width Double
Zpos Double
COG Point
Equipment List<equipment>

16
Table 2-4 Properties of the equipment class
Equipment Properties Data type
Name String Length Double Width Double Height Double COG Point
Weight Double Equipment type enum
Table 2-5 Properties of the passage class
Passage Properties Data type
Name String Length Double Width Double Height Double COG Point
Figure 2-1 Arrangement template model (ATM) expressed by using UML

17
Arrangement evaluation model (AEM) for the
arrangment design of offshore plant topside
The configuration of the rule-based expert system and the AEM are represented
in Figure 3-1. In the rule-based expert system, a rule is defined as the “IF-THEN”
phase, and stored in a knowledge base. An inference engine compares the “IF” phase
of the rule in the knowledge base with the fact in a data base (called pattern matching).
If the “IF” part of the rule is same as the “Fact” in the database, then the “THEN”
part of the rule in the knowledge base are stored in the data base as a new fact.
The knowledge base, the data base, and the inference engine are consolidated as
the AEM in this study. Rules derived from experts’ knowledge or experiences are
expressed as object information and relation information. The experts’ knowledge
about property requirements for a specific object are expressed as the object
information. And the experts’ knowledge about the relation between specific objects
are expressed as the relation information. The object and relation information are
defined as combination of the several properties. A group of the object and relation
information are named as an object list and a relation list, respectively. Thus, it can
be seen that the AEM is based on the object and relation lists.
The AEM converts the object and relation information in the object and relation
lists as rules of IF-THEN phrases. In this meaning, the AEM can be a kind of the
rule-based expert system. Referring to the converted rules of IF-THEN phrases, a
feasibility index of the given alternative for the arrangement design can be evaluated.
The feasibility index is a certain value quantitatively scoring the compliance with
the rules in the object and relation information. In this study, the AEM for the
arrangement design of an offshore plant topside was proposed. With this model and
the object and relation lists, various rules about the arrangement design of the

18
offshore plant topside can be easily expressed, and the feasibility of the given design
alternative can be evaluated.
As shown in Figure 3-1, the AEM corresponds to the knowledge base, database,
and inference engine of the rule-based expert system. Thus, a designer does not have
to consider the complicated inference process when making the rules for the
arrangement design with the use of the AEM. In this sense, the AEM can be regarded
as an extended, advanced version of the rule-based expert system for use in the
arrangement design of an offshore plant topside.
Figure 3-1 Configuration of the arrangement evaluation model

19
3.1. Representation of object information
The object information can express experts’ knowledge about requirements for a
specific object in the offshore plant topside such as a module, equipment, and so on.
If an expert possesses the knowledge that “the separator should be arranged along
the longitudinal direction of the offshore plant,” it can be represented as one
objective information. The keywords in the knowledge are the target object (e.g.,
“separator”), the attribute (e.g., “orientation”), and the target value (e.g., “1_EXT”).
Adding an ID (e.g., “E001”) to each distinct rule, one object information can be
represented with four properties: the ID, target object, attribute, and target value.
Here, the target value is used to give a certain value to the object. Again, the target
value can be defined with three sub-key words: standard value (e.g., “1”), boundary
type (e.g., “EXT” for exact), and unit type (e.g., none for this example). An example
of object information is shown in Figure 3-2. The set of object information for all
the objects defined in the domain is called an object list in this study.
Figure 3-2 Configuration of the object information
To use four properties (ID, target object, attribute, and target value) in the AEM,
they have to be specified by a suitable data type for them, as shown in Table 3-1.
The ID and target object can be expressed by a string type to distinct the target object
for the object information. The attribute represents properties of the target object,
and it can be certain words like “Order”, “Orientation”, “COG.x”, “COG.y”,
“COG.z”, “Volume”, “Area”, and so on. Using an enumerator composed of those
kinds of words, we can express the attribute. The description of attributes of the

20
object information is listed in Table 3-2. And the target value can be expressed by a
new type which is called metric type. In this study, the metric type is used to
represent the target value for the object information and the relation information.
As mentioned earlier, the metric type is composed of three sub-key words;
standard value, boundary type, and unit type. The standard value is used to specify a
certain value for the target value, and it can be expressed by double or integer of data
type.
The boundary type represents the limit of the target value, and it can be certain
words like “EXT” for exact value, “MAX” for maximum value, “MIN” for minimum
value, and “PRO” for proposed value. Using an enumerator composed of those kinds
of words, we can express the boundary type.
The unit type is a unit of the standard value. And it also can be expressed by using
an enumerator. In this study, SI unit is used, thus m, m2, m3 and so on are included
in the unit type. Of course, for a specific target value having no dimension, the unit
can be none. The data type and properties of the target value according to the
attributes are listed in
Table 3-3. By using the metric type, various knowledge can be defined.
For example, if one object information has specific metric type (“1_EXT”) for
the attribute (“Orientation”), it means the target object must have exact orientation
along the longitudinal direction of the offshore plant. As with the above, the various
criteria about one object’s requirements such as the order (means location),
orientation, COG position, and so on can be represented using the metric type.

21
Table 3-1 Properties of the object information
Properties Data type Description
ID String ID Target object String Module, deck, equipment, passage
Attribute Enumerator type
Properties of the target object: Order (means location), Orientation, COG.x, COG.y, COG.z, Volume, Area, …
Target value Metric type
Designated value of the property of the target object - Standard value: certain value for the target value - Boundary type: EXT (exact), MAX (maximum), MIN (minimum), PRO (proposed) - Unit type: unit of the target value (none, m, m2, m3, …)
Table 3-2 Description of attributes of the object information
Attributes Description
Order Designated order for the object’s location (generally, for modules) Orientation Binary value representing the orientation of object (generally, for
equipment) (1: if the object is parallel to the longitudinal direction of the offshore plant, 0: otherwise)
COG position Coordinates of the center of gravitation of the object
Table 3-3 Data type and properties of the target value according to the attributes
Target value Data type
Properties according to the attributes
Order Orientation COG.x, COG.y, COG.z
Standard value
Double or integer
0, 1, …, n-1 (n: total number of modules)
Binary value Real value
Boundary type
Enumerator type
EXT, MAX, MIN EXT EXT, MAX, MIN,
PRO
Unit Enumerator type None None meter (M)
Figure 3-3 shows examples of representing rules as the object information. For
example, the “Living quarter” should be placed upwind direction of the offshore
plant topside to minimize the effects of the hydrocarbon release. This knowledge can
be represented as the object information: (E002, Living quarter, Order, 0_EXT). As

22
another example, the “Pig launcher” should be face outboard of the offshore plant to
minimize the possibility of any projectiles hitting personnel or other equipment (API,
2001). This knowledge can be represented as the object information: (E003, Pig
launcher, Orientation, 0_EXT). If a certain equipment (“Equipment 1”) needs to be
arranged in a mezzanine deck (e.g., z=44m), it can be expressed by defining the
object information using the “COG.z” attribute: (E004, Equipment 1, COG.z,
47_PRO_M). If another equipment (“Equipment 2”) is required to be arranged in a
process deck (e.g., z=38m), it can be expressed as the object information: (E005,
Equipment 2, COG.z, 44_MAX_M).
Figure 3-3 Examples of the object information
23
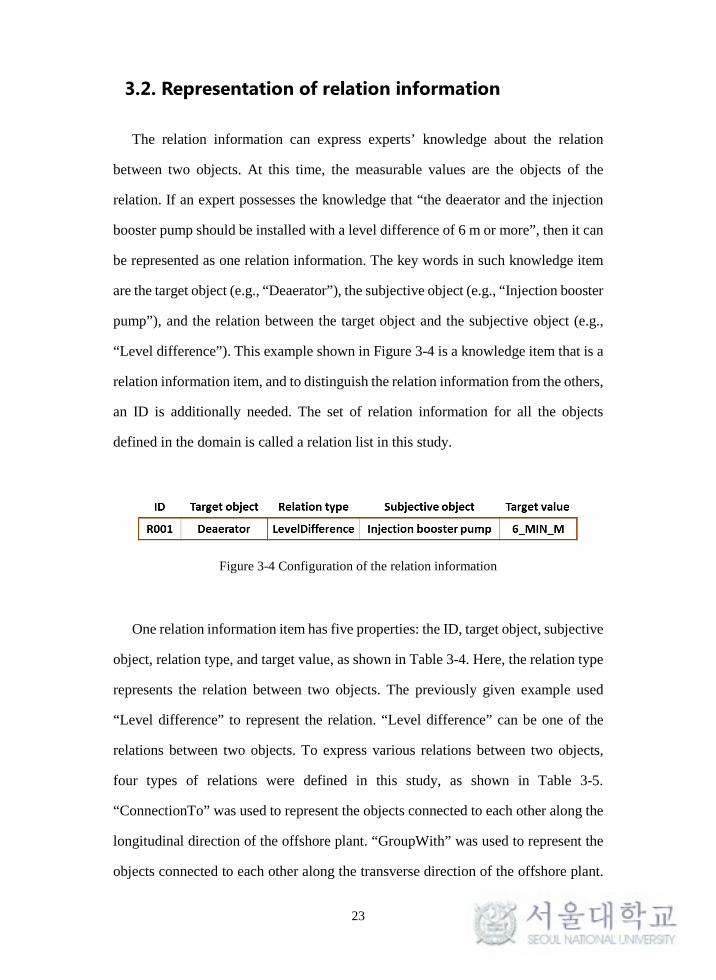
3.2. Representation of relation information
The relation information can express experts’ knowledge about the relation
between two objects. At this time, the measurable values are the objects of the
relation. If an expert possesses the knowledge that “the deaerator and the injection
booster pump should be installed with a level difference of 6 m or more”, then it can
be represented as one relation information. The key words in such knowledge item
are the target object (e.g., “Deaerator”), the subjective object (e.g., “Injection booster
pump”), and the relation between the target object and the subjective object (e.g.,
“Level difference”). This example shown in Figure 3-4 is a knowledge item that is a
relation information item, and to distinguish the relation information from the others,
an ID is additionally needed. The set of relation information for all the objects
defined in the domain is called a relation list in this study.
Figure 3-4 Configuration of the relation information
One relation information item has five properties: the ID, target object, subjective
object, relation type, and target value, as shown in Table 3-4. Here, the relation type
represents the relation between two objects. The previously given example used
“Level difference” to represent the relation. “Level difference” can be one of the
relations between two objects. To express various relations between two objects,
four types of relations were defined in this study, as shown in Table 3-5.
“ConnectionTo” was used to represent the objects connected to each other along the
longitudinal direction of the offshore plant. “GroupWith” was used to represent the
objects connected to each other along the transverse direction of the offshore plant.

24
“DistanceFrom” was used to represent the distance between two objects. Finally,
“LevelDifference” was used to represent the vertical distance, that is, the level
difference between two objects.
Table 3-4 Properties of the relation information
Properties Data type Description
ID String ID Target object String Module, deck, equipment, passage
Relation type Enumerator type
Relation type for the target object and the subjective object: ConnectionTo, GroupWith, DistanceFrom, LevelDifference
Subjective object String Module, deck, equipment, passage
Target value Metric type
Designated value of the property of the target object - Standard value: certain value for the target value - Boundary type: EXT (exact), MAX (maximum), MIN (minimum), PRO (proposed) - Unit type: unit of the target value (none, m, m2, m3, …)
Table 3-5 Description of relation types of the relation information
Attributes Description
ConnectionTo Physical connection between two objects (generally, for modules) (1: if the two objects are arranged longitudinally next to each other, 0: otherwise)
GroupWith
Symmetric connection between two objects (generally, for modules) (1: if the two objects are arranged transversely and symmetrically, 0: otherwise)
DistanceFrom Rectilinear distance between two objects LevelDifference Difference of vertical distance between two objects
To use five properties of the relation information in the AEM, they have to be
specified by a suitable data type for them, as shown in Table 5. The ID, the target
object, and the subjective object can be expressed by a string type to distinct the
target and subjective objects for the relation information. The relation type can be

25
represented using an enumerator to express four types of relations. And the target
value can be represented by the metric type as mentioned above. The data type and
properties of the target value according to the relation types are listed in Table 3-6.
Table 3-6 Data type and properties of the target value according to the relation type
Target value Data type
Properties according to the relation types ConnectionTo GroupWith DistanceFrom LevelDifference
Standard value
Double or integer Binary value Binary value Real value Real value
Boundary type
Enumerator type EXT EXT EXT, MAX,
MIN, PRO EXT, MAX, MIN, PRO
Unit type Enumerator type None None meter (m) meter (m)
As explained earlier, the relation information includes four relation types;
“ConnectionTo”, “GroupWith”, “DistanceFrom”, and “LevelDifference”. The
“ConnectionTo” type represents physical connection of two objects; the target object
and the subjective object. If the two objects are arranged longitudinally next to each
other, the value for the relation is assigned as “1”. If two objects are not arranged,
then the value is assigned as “0”. Using the “ConnectioTo” type, the physical
connectivity of two objects along the longitudinal direction of the offshore plant can
be expressed by experts. The “GroupWith” type represents symmetric connection of
two objects. If the two objects are arranged symmetrically and transversely (port and
starboard side), the value for the relation is assigned as “1”. If two objects are not
arranged, then the value is assigned as “0”. Using the “GroupWith” type, the
symmetrical connectivity of two objects along the transverse direction of the
offshore plant can be expressed by experts. The “DistanceFrom” type represents
physical distance between the target object and the subjective object. The shortest
route from the target object to the subjective object is selected to calculate the value
for the relation; the distance between two objects. Thus, the minimum distance
between the target object and the subjective object can be calculated by using
“DistanceFrom” keyword. The “LevelDifference” type represents the difference of

26
vertical distance between the target object and the subjective object. Using the
“LevelDifference” type, a certain criteria for the vertical distance between two
objects can be expressed by the experts.
An example of the relation information of using the “ConnectionTo” and
“GroupWith” types is shown in Figure 3-5. In the arrangement design of the offshore
plant topside, the “Laydown A” module and the “Utility” module are arranged
longitudinally next to each other. This knowledge can be represented as the relation
information: (R001, Laydown A, ConnectionTo, Utility, 1_EXT). In addition, the
“Laydown A” and “Laydown B” modules are arranged symmetrically; port and
starboard side. And thus this knowledge can be represented as the relation
information: (R002, Laydown A, GroupWith, Laydown B, 1_EXT).
Figure 3-5 Example of the relation information of using the "GroupWith" and
“ConnectionTo” type
An example of the relation information of using the “DistanceFrom” and
“LevelDifference” types is represented in Figure 3-6. If a certain equipment
(“Equipment 1”) is proposed to be arranged from another equipment (“Equipment
2”) with a distance of 20m, it can be expressed by defining the relation information
using the “DistanceFrom” keyword: (R003, Equipment 1, DistanceFrom, Equipment

27
2, 20_PRO_M). When applying this rule to the given alternative for the arrangement
design, the distance between the “Equipment 1” and “Equipment 2” can be
calculated from their rectilinear distance as |x1-x2|+|y1-y2|+|z1-z2|. In addition, if a
certain equipment (“Equipment 1”) needs to be arranged vertically from another
equipment (“Equipment 3”) with a minimum distance of 15m, it can be expressed
by defining the relation information using the “LevelDifference” keyword: (R004,
Equipment 1, LevelDifference, Equipment 3, 15_MIN_M). At this time, the vertical
distance between the “Equipment 1” and “Equipment 3” can be calculated as (z1-z3).
Figure 3-6 Example of the relation information of using the “DistanceFrom” and
“LevelDifference”

28
3.3. Arrangement evaluation
The body of the knowledge of experts about the arrangement design of an
offshore plant topside is expressed with two lists: the object and relation lists. Based
on these lists, rules are made, and arrangement design alternatives are evaluated
based on such rules. As described in prior sections, specific requirements on objects
to be arranged to an offshore plant topside can be expressed by the object and relation
information. The requirements on the location, orientation, COG position of the
objects can be defined by the object information. The requirements on the connection
and distance between the objects can be defined by the relation information. The
object and relation information are converted a set of IF-THEN rules, which are then
used to evaluate the feasibility of the alternatives. The object or relation information
can be defined differently from one another using some boundary types for the target
value, such as “EXT” for exact value, “MAX” for maximum value, “MIN” for
minimum value, and “PRO” for proposed value. As for the boundary type “EXT,” if
it is used, the rule is “the value of the object should be exactly the same as the target
value.” Therefore, if the value of the object is the same as the target value, the index
for this rule is evaluated as “100” points, and if it is different, the index becomes “0”
point. If the boundary type “MAX” is used for the target value of a certain object
information, the rule is “the value of the object should be lower than the maximum
value.” Therefore, if the value of the object is lower than the maximum value, the
feasibility index for this rule is evaluated as “100” points, and if the value is higher
than the maximum value, the feasibility index for this rule is evaluated as “0” point.
The boundary type “MIN” is similar to “MAX.” If the boundary type “PRO” is used,
the linear-fit function evaluates the feasibility index of the object or relation
information. Thus if the value of the object is the same as the target value, the index
for the rule is evaluated as “100” points. The larger the difference between the value
and the target value is, the lesser the index for the rule according to the linear-fit

29
function is. More details can be found in the previous study of the authors (Kim et
al., 2015).
The example described in Figure 3-2 can be converted to the set of rules of IF-
THEN phrases, as shown in Figure 3-7. As shown in this figure, an appropriate rule
(“Rule 2” in this example) which was already made and corresponds to the attribute
in the object information is selected and executed. Again, an appropriate rule (“Rule
3”) which was already made and corresponds to the boundary type is selected and
executed. With the target object and the target value, appropriate rules (“Rule 6” and
“Rule 7”) are automatically selected and converted, the rules are executed to
calculate the feasibility index of this object information (ID of “E001”) for the given
design alternative. At this time, the feasibility index can be calculated by comparing
the orientation of the target object (“Separator”) for the given design alternative and
the standard value (=1, the target object must have exact orientation along the
longitudinal direction of the offshore plant) in the target value.

30
Figure 3-7 Example of the converting procedure of the object information to rules
Similarly, the example described in Figure 3-4 can also be converted to the set of
rules of IF-THEN phrases, as shown in Figure 3-8. As shown in this figure, an
appropriate rule (“Rule 2” in this example) which was already made and corresponds
to the relation type in the relation information is selected and executed. Again, an
appropriate rule (“Rule 5”) which was already made and corresponds to the boundary
type is selected and executed. With the target object, the subjective object, and the
target value, appropriate rules (“Rule 6” and “Rule 7”) are automatically selected
and converted, the rules are executed to calculate the feasibility index of this relation
information (ID of “R001”) for the given design alternative. At this time, the
difference of vertical distance between the target object (“Deaerator”) and the
subjective object (“Injection booster pump”) should be calculated and a distance
calculation module based on the rectilinear method as an external module can be
used for this purpose. In the case of other relation types such as “ConnectionTo”,

31
“GroupWith”, and “DistanceFrom”, a suitable module for the connection or distance
calculation can be used.
The object list and the relation list are, as mentioned above, automatically
converted to the set of rules of IF-THEN” phrases. Then, according to the boundary
type, the relation type, and the attribute in the object and relation information, an
appropriate procedure is performed to calculate the feasibility indices for the object
and the relation information included in the object and the relation lists.
Figure 3-8 Example of the converting procedure for the relation information to rules
32
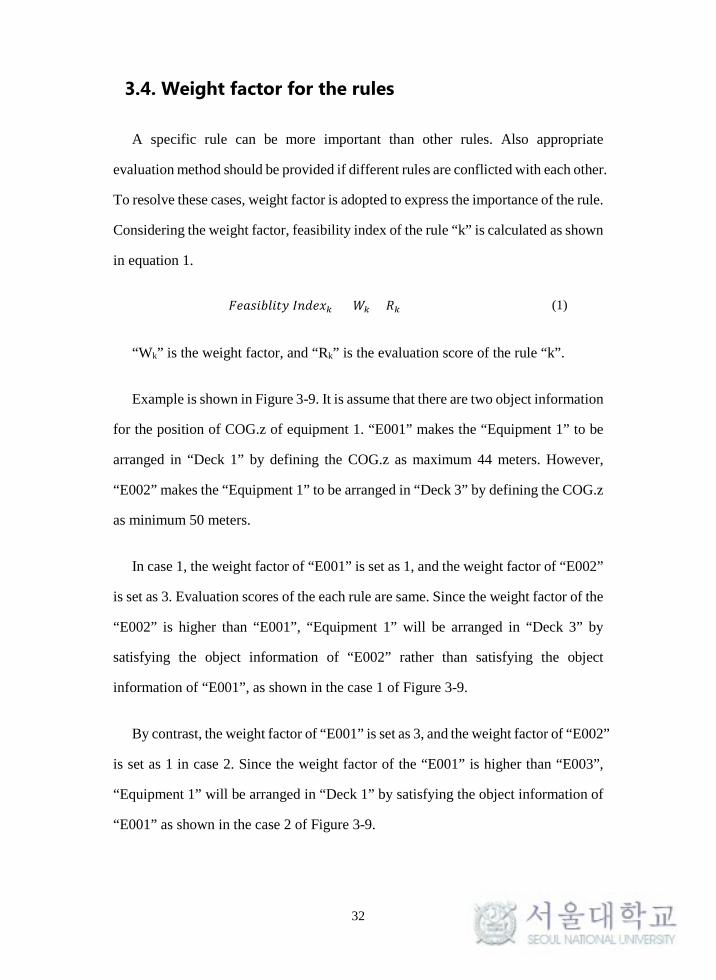
3.4. Weight factor for the rules
A specific rule can be more important than other rules. Also appropriate
evaluation method should be provided if different rules are conflicted with each other.
To resolve these cases, weight factor is adopted to express the importance of the rule.
Considering the weight factor, feasibility index of the rule “k” is calculated as shown
in equation 1.
𝐹𝐹𝐹𝐹𝐹𝐹𝐹𝐹𝐹𝐹𝐹𝐹𝐹𝐹𝐹𝐹𝐹𝐹𝐹𝐹 𝐼𝐼𝐼𝐼𝐼𝐼𝐹𝐹𝐼𝐼𝑘𝑘 = 𝑊𝑊𝑘𝑘 × 𝑅𝑅𝑘𝑘 (1)
“Wk” is the weight factor, and “Rk” is the evaluation score of the rule “k”.
Example is shown in Figure 3-9. It is assume that there are two object information
for the position of COG.z of equipment 1. “E001” makes the “Equipment 1” to be
arranged in “Deck 1” by defining the COG.z as maximum 44 meters. However,
“E002” makes the “Equipment 1” to be arranged in “Deck 3” by defining the COG.z
as minimum 50 meters.
In case 1, the weight factor of “E001” is set as 1, and the weight factor of “E002”
is set as 3. Evaluation scores of the each rule are same. Since the weight factor of the
“E002” is higher than “E001”, “Equipment 1” will be arranged in “Deck 3” by
satisfying the object information of “E002” rather than satisfying the object
information of “E001”, as shown in the case 1 of Figure 3-9.
By contrast, the weight factor of “E001” is set as 3, and the weight factor of “E002”
is set as 1 in case 2. Since the weight factor of the “E001” is higher than “E003”,
“Equipment 1” will be arranged in “Deck 1” by satisfying the object information of
“E001” as shown in the case 2 of Figure 3-9.

33
Figure 3-9 Example: effects of the weight factor

34
Arrangement optimization model (AOM) for
the arrangement design of an offshore plant
topside
This section describes an optimization method for the arrangement design of an
offshore plant topside. As mentioned earlier, the arrangement design of the FPSO
topside can be divided into two stages (Ku et al., 2014). Thus, in this study, the
arrangement method of the FPSO topside, was formulated as two stages optimization
problem. Configuration of the optimization procedure is shown in Figure 4-1. First
stage is the module arrangement. In this stage, the arrangement sequence of the
modules is determined by minimizing the adjacency index and weight distribution
index against y axis. Second stage is the equipment arrangement in each module. In
this stage, the optimal location of the equipment such as the x, y coordinate,
orientation information and installed deck information is determined by minimizing
the installation cost, piping cost, damage cost and ventilation cost. Several
constraints are used for equipment arrangement. Firstly, duplication-free constraints
are used. Secondly, orientation constraints are used. According to the binary variable
for equipment orientation, length and width of the equipment are determined. Thirdly,
non-overlapping constraints are used. In these constraint, operating spaces around
each equipment are considered. Fourthly, boundary constraints are used to arrange
the equipment inside the deck area. Passages around the perimeter of the deck are
reflected in these constraints. Fifthly, passage constraints are used. It sets the limits
of location of internal passage.
As described in section 2.3, various requirements for the arrangement design of
the offshore plant topside such as experts’ knowledge, international code and
standards are defined as form of the object and relation information in AEM.

35
Comparing the defined rule and arrangement information, AEM returns the
feasibility index. In both stages, the feasibility index from the expert system is used
as one of the objective functions. Genetic algorithm was used for the optimization.
Figure 4-1 Configuration of the two stages optimization problem for the arrangement
design of the FPSO topside

36
4.1. Optimization of the module arrangement
First stage is the module arrangement. Environmental condition such as the
prevailing wind direction, process flow, riser location from the subsea and others
should be considered. For example, as mentioned in section 1.1, the living quarter
should be arranged upwind considering the prevailing wind direction. Flare tower
should be arranged as far as possible to the living quarter. And utility areas such as
the water injection module, utility module etc. should be arranged between the living
quarter and hydro carbon processing modules to serve as a barrier when fire or
explosion is occurred. In this study, the module arrangement design is formulated as
optimization problem.
4.1.1. Input data
Input data for the module arrangement is summarized in Table 4-1. Total number
of the module in FPSO topside and id of the each module are needed. Module
information such as width, length and weight of the module are also required. Lastly,
adjacency coefficient between each module is required. Adjacency coefficient is the
constant number which quantitatively represents the degree of the closeness between
each module. It can be calculated from the antagonism and affinities as shown in
equation 2.
( )ij engineering manningq Affinity Affinity Antagonism= + − (2)
In equation 1, antagonism is the characteristics which preclude a module being
safely located near another specific module mutually protected like fire or blast
barriers Affinities are the characteristics which make it particularly advantageous to
located one module close to another specific module. There are two affinities. One

37
is the engineering affinity, and another is the manning affinity. Engineering affinity
is related with the process flow. If one module is connected to another specific
module by the process flow, it is advantageous to locate these function groups close
to each other. Manning affinity is related with the movement of staff or material
between the modules. If it is anticipated to have frequent movement of staff or
material between the specific function groups, it is advantageous to located these
function groups close to each other.
Table 4-1 Input data for the module arrangement
Input data
Total module number and ID of each module
Width and length of the module di, li
Module weight wi
Adjacency coefficient between each module qij

38
4.1.2. Design variables
In this stage, design variable is the arrangement sequence of the module
arrangement. The locations of the each module can be represented as an array of the
module “id” (encoding). After optimization, the array is converted to the module
arrangement (decoding).
Figure 4-2 Representation of the positions of each module
4.1.3. Objective functions
Objective functions for the optimization of the module arrangement are
summarized in Table 4-2. First objective function of this stage is to maximize the
feasibility index from the expert system. Feasibility index is returned from the expert
system based on the defined object and relation information.
Second objective function is to minimize the adjacency index. The adjacency
index is calculated from the adjacency coefficient (qij) and distance (dij). The
adjacent coefficient, “qij”, is a constant which represents the antagonism and
affinities between the modules. Antagonism is the characteristics which preclude a

39
function group being safely located near another specific function group mutually
protected like fire or blast barriers. Affinities are the characteristics which make it
particularly advantageous to located one function group close to another specific
function group. There are two affinities. First is the engineering affinity. It is related
with the process flow. If one module is connected to another specific module, it is
advantageous to locate these modules close to each other. Second is the manning
affinity. It is related with the movement of staff or material between the modules. If
it is anticipated to have frequent movement of staff or material between the specific
modules, it is advantageous to locate these modules close to each other.
Third objective function is to minimize the weight distribution index which
makes the FPSO more stable. The weight distribution index is the coordinate of the
y-axis of the center of the FPSO.
Table 4-2 Objective functions for the optimization of the module arrangement
Objective functions
Feasibility index from the expert system Maximize
𝐹𝐹1 = ∑𝑊𝑊𝑘𝑘𝑅𝑅𝑘𝑘 (Wk: weight factor for kth rule, Rk: evaluation score for kth rule)
Adjacency index Minimize 𝐹𝐹2 = ∑ ∑ (𝑞𝑞𝑖𝑖𝑖𝑖 ∙ 𝐼𝐼𝑖𝑖𝑖𝑖)𝑛𝑛𝑖𝑖=𝑖𝑖+1
𝑁𝑁−1𝑖𝑖=1
Weight distribution index Minimize 𝐹𝐹3 = |∑ (𝑤𝑤𝑖𝑖 ∙ 𝐹𝐹𝑖𝑖)𝑁𝑁𝑖𝑖=1 ∑ 𝑤𝑤𝑖𝑖𝑁𝑁
𝑖𝑖=1⁄ |

40
4.2. Optimization of the equipment arrangement in
the module
After the module arrangement, second stage is the optimization of equipment
arrangement in each module. Equipment are arranged in each module considering
the various considerations and requirements. Firstly, equipment are arranged
considering the process flow. It will be beneficial if equipment which are connected
by pipe are arranged close to each other. Secondly, considering the safety, hazardous
equipment are required to be arranged to other equipment as far as practical. It will
decrease the possibility of other equipment to be damaged due to the hazardous event
of the potential hazardous equipment. Thirdly, access spaces should be provided
around each equipment for operability and maintainability. Also passages around the
perimeter of the each deck and internal passages should be provided. Lastly,
ventilation should be considered for efficient dispersion of the leaked gases. If the
leaked gases are accumulated in deck spaces, it will increase the probability of fire
and explosion. In open areas like the topside, natural ventilation should be stimulated.
In closed areas like hull machinery spaces, forced ventilation should be considered.
4.2.1. Input data
Input data for the equipment arrangement are summarized in Table 4-3. Firstly,
equipment information such as the total number of equipment in the module and
equipment size should be provided. Secondly, deck information such as the total
number of the deck and deck height is needed. Thirdly, piping connection
information is required to calculate the piping cost. Lastly, cost parameters (PCij, LC,
ECi, VC) are needed to convert the related arrangement factors to the cost. Also,
historical data such as the accident frequency of the hazardous equipment is required.

41
Table 4-3 Input data for the equipment arrangement
Parameters
ai, bi, hi Dimensions of equipment
NF Total number of the deck
H Deck height
fij Piping connection information between the equipment i and j (1; if equipment i and j are connected with pipe, 0; otherwise)
PCij Piping connection cost
LC Land cost
ECi Equipment purchase cost of equipment i
fri Probability of the potential physical explosion of equipment i (from the historical data)
VC Coefficient of the ventilation cost
4.2.2. Design variables
Real variables and binary variables are used as design variables. Design variables
are summarized in Table 4-4.
“Xi”, “Yi”, “Xmax” and “Ymax” are real variables. “Xi” and “Yi” represent the
coordinate of the equipment center. “Xmax” and “Ymax” represent the installation area
of equipment in deck.
“Oi” and “Vik” are the binary variables. “Oi” represents the orientation of the
equipment. If equipment is parallel to the FPSO direction, “Oi” is 1, otherwise 0.
“Vik” represents the allocated deck. If equipment “i” is installed in deck “k”, “Vik” is
1, otherwise 0. “Eij” is the binary variable for non-overlapping constraints. It
determines which non-overlapping constraints are active. If the non-overlapping
constraint for x coordinate is activated, the non-overlapping constraints for y
coordinate is deactivated. It is mathematically formulated.

42
Table 4-4 Design variables for the equipment arrangement
Continuous variables
xi, yi Position of the equipment i
Xmax, Ymax Dimension of the deck area
Binary variables Oi 1; if length of equipment I is equal to ai, 0; otherwise
Vik 1; if equipment i is located in kth deck, 0; otherwise
Eij Binary variable for the non-overlapping constraints
Figure 4-3 Design variable for equipment arrangement

43
4.2.3. Objective functions
For the optimization of the equipment arrangement, five objective functions are
formulated considering the safety, operability and maintainability They are
mathematically formulated as bellows.
1) Feasibility index from the expert system
First objective function is to maximize the feasibility index from the expert
system. As same as the module arrangement stage, feasibility index is returned from
the expert system based on the object and relation lists.
Maximize 1 ( )k kF W R= •∑ (3)
“Wk” is the weight factor, and “Rk” is the evaluation score of the rule “k”.
2) Installation cost
Second objective function is to minimize the installation cost. Installation cost is
the land cost which equipment are arranged. It is formulated as equation 4.
2Minimize F LC FA= ⋅ (4)
“FA” is the total installation area in the deck. It is calculated as shown in equation
5. “LC” is the cost parameter.
max maxFA X Y= ⋅ (5)

44
3) Piping cost
Third objective function is to minimize the piping cost. Piping cost is calculated
only in two equipment are connected by pipe (e.g. fij = 1”). It is formulated as
equation 6.
1
31 2/ 1ij
n n
ij iji j f
Minimize F PC TD−
= = =
= ⋅∑ ∑ (6)
“PCij” is the cost parameter of the piping from equipment i to j. “TDij” is the total
rectilinear distance as shown in equation 7.
ij i j i j ijTD X X Y Y U= − + − + (7)
In equation 7, “Uij” is the vertical distance, and it is calculated as shown in
equation 8.
1( )
NF
ij ik jkk
U H k V V=
= −∑ (8)
4) Damage cost considering the physical explosion
In this study, physical explosion of the pressurized vessel is considered to
calculate the safe distance from the hazardous equipment. Physical explosion can
occur due to events like a failure of pressure relief equipment, reduction in vessel
strength or an internal runaway reaction. In general, physical explosions are expected
to cause less damage than other outcomes sine they do not result in fire.
Consequently, it ca be used as the minimum guideline for setting a safety distance in
the plant layouts (Park et al. 2011). The damage cost is formulated as equation 9.

45
41
( )n
i i ij ji j i
Minimize F fr EC p EC= ≠
= ⋅ + ⋅∑∑ (9)
“fri” is the accident frequency of the hazardous equipment. It can be obtained
from the historical data. “EC” is the equipment cost. “Pij” is the probability of
damage of the equipment j when the equipment i is exploded. It is affected by the
explosion energy of the hazarous equipment and the distace from it. Calculation
procedure of the “Pij” is summarized in Figure 4-4.
Figure 4-4 Calculation procedure of the probability of the damage. Pij (Park, 2011)
First step is to calculate the energy of explosion. There are several methods which
are used for calculation of a TNT equivaelcy method. In this study, the following
equation is used.
𝑾𝑾 = (1.39 × 10⁻⁶) ∙ 𝑉𝑉 ∙ �𝑃𝑃1𝑃𝑃0� ∙ 𝑅𝑅𝑔𝑔 ∙ 𝑇𝑇𝑜𝑜 ∙ 𝐹𝐹𝐼𝐼 �
𝑃𝑃1𝑃𝑃2� (10)
In equation 10, “W” is the engergy (lb TNT). “V” is the volume of the compressed
gas (ft3). “P1” is the initial pressure of the compressed gas (psia). “P2” is the final
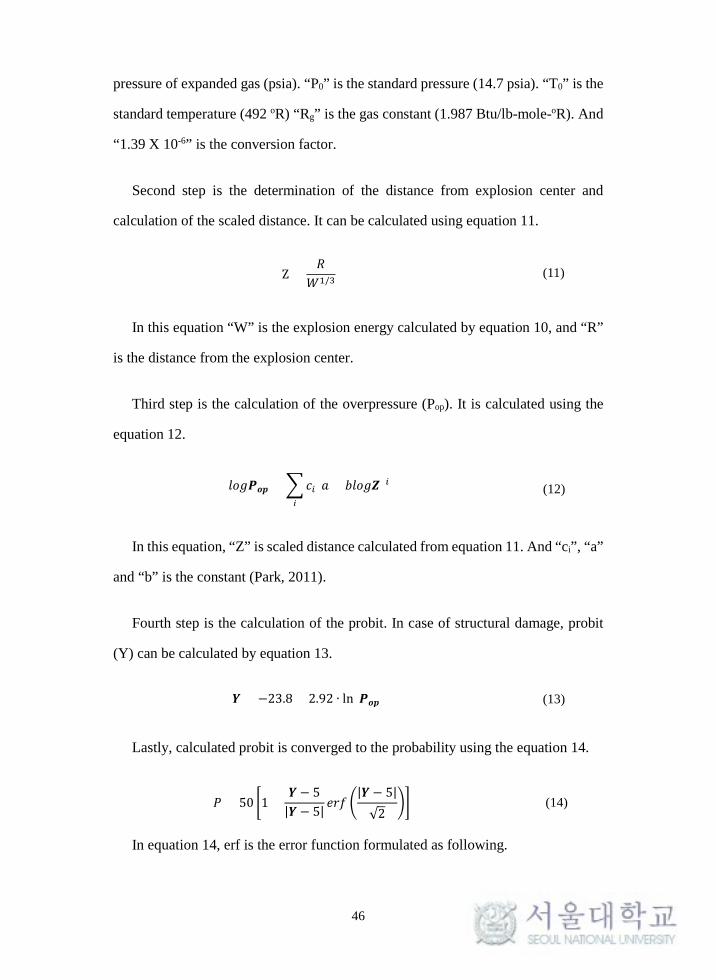
46
pressure of expanded gas (psia). “P0” is the standard pressure (14.7 psia). “T0” is the
standard temperature (492 oR) “Rg” is the gas constant (1.987 Btu/lb-mole-oR). And
“1.39 X 10⁻⁶” is the conversion factor.
Second step is the determination of the distance from explosion center and
calculation of the scaled distance. It can be calculated using equation 11.
Z =𝑅𝑅
𝑊𝑊1/3 (11)
In this equation “W” is the explosion energy calculated by equation 10, and “R”
is the distance from the explosion center.
Third step is the calculation of the overpressure (Pop). It is calculated using the
equation 12.
𝐹𝐹𝑙𝑙𝑙𝑙𝑷𝑷𝒐𝒐𝒐𝒐 = �𝑐𝑐𝑖𝑖(𝐹𝐹 + 𝐹𝐹𝐹𝐹𝑙𝑙𝑙𝑙𝒁𝒁)𝑖𝑖
𝑖𝑖
(12)
In this equation, “Z” is scaled distance calculated from equation 11. And “ci”, “a”
and “b” is the constant (Park, 2011).
Fourth step is the calculation of the probit. In case of structural damage, probit
(Y) can be calculated by equation 13.
𝒀𝒀 = −23.8 + 2.92 ∙ ln (𝑷𝑷𝒐𝒐𝒐𝒐) (13)
Lastly, calculated probit is converged to the probability using the equation 14.
𝑃𝑃 = 50 �1 +𝒀𝒀 − 5
|𝒀𝒀 − 5| 𝐹𝐹𝑒𝑒𝑒𝑒 �|𝒀𝒀 − 5|
√2�� (14)
In equation 14, erf is the error function formulated as following.
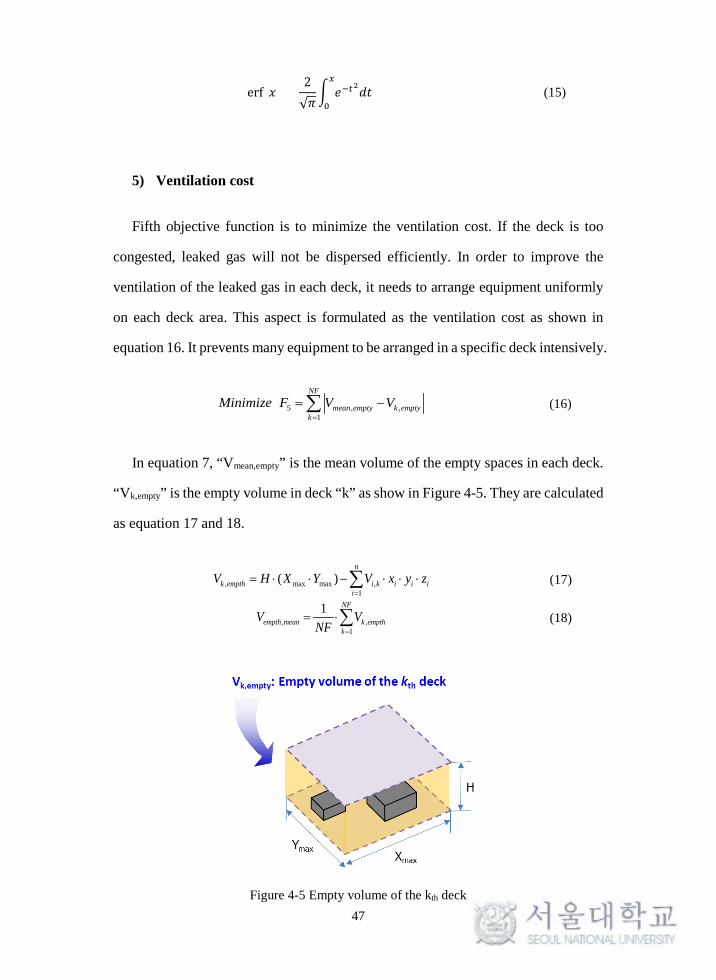
47
erf(𝐼𝐼) =2√𝜋𝜋
� 𝐹𝐹−𝑡𝑡2𝐼𝐼𝐹𝐹𝑥𝑥
0 (15)
5) Ventilation cost
Fifth objective function is to minimize the ventilation cost. If the deck is too
congested, leaked gas will not be dispersed efficiently. In order to improve the
ventilation of the leaked gas in each deck, it needs to arrange equipment uniformly
on each deck area. This aspect is formulated as the ventilation cost as shown in
equation 16. It prevents many equipment to be arranged in a specific deck intensively.
5 , ,1
NF
mean empty k emptyk
Minimize F V V=
= −∑ (16)
In equation 7, “Vmean,empty” is the mean volume of the empty spaces in each deck.
“Vk,empty” is the empty volume in deck “k” as show in Figure 4-5. They are calculated
as equation 17 and 18.
, max max ,1
( )n
k empth i k i i ii
V H X Y V x y z=
= ⋅ ⋅ − ⋅ ⋅ ⋅∑ (17)
, ,1
1 NF
empth mean k empthk
V VNF =
= ⋅∑ (18)
Figure 4-5 Empty volume of the kth deck

48
4.2.4. Constraints
When arranging the equipment, each equipment should be arranged at once. And
equipment should not be overlapped. Passages around the perimeter of the deck and
spaces around the equipment should be considered for operability. These aspects are
formulated as constraints.
1) Duplication-free constraints
The equipment should be arranged at once. It is formulated as duplication-free
constraints as shown in equation (19.
,1
1NF
i kk
V=
=∑ (19)
2) Equipment orientation constraints
The length and depth of equipment are determined respectively by the binary
variable for orientation, “Oi”.
(1 )i i i i il a O b O= ⋅ + ⋅ − (20)
i i i id a b l= + − (21)
3) Non-overlapping constraints
The equipment should not be overlapped to other equipment. Also operation
spaces should be provided around each equipment. This aspect is formulated as
shown in equation 23 and 24.

49
( )
1(1 )2
i ji j ij ij
l lx x M Z E ε
+− + ⋅ − + − ≥ (23)
( )1(2 )
2i j
i j ij ij
d dy y M Z E ε
+− + ⋅ − − − ≥ (24)
“M” is a big scalar value. “Ɛ1” is the operation space around the equipment. And
“Eij” is binary variable for non-overlapping constraints. “Zij” is the binary variable. If
equipment “i” and “j” is located in the same deck, “Zij” is 1. Otherwise “Zij” is 0. It can be
determined using from equation 25 to 27. Non-overlapping constraints formulated as
equation 23 and 24 are activated only if “Zij” is 1. In case “Zij” is 1, equation 23 and 24 are
activated selectively by the binary variable for non-overlapping constraints, “Eij”. If “Eij”
is 1, equation 23 is always satisfied, and equation 24 is activated. In contrast, if “Eij” is 0,
equation 24 is always satisfied, and equation 23 is activated.
1ij ik jkZ V V≥ + − (25)
1ij ik jkZ V V≤ − + (26) 1ij ik jkZ V V≤ + − (27)
4) Boundary constraints
Equipment should be arranged within the deck area, “Xmax” and “Ymax”. Also
passages should be provided around the perimeter of the deck area. This aspects are
formulated as boundary constraints as shown in from equation 28 to 31.
22i
ilx ε− ≥ (28)
22i
idy ε− ≥ (29)
max 2( )2i
ilX x ε− + ≥ (30)
max 2( )2
ii
dY y ε− + ≥ (31)

50
5) Passage constraints
In addition to the passages around the perimeter of the deck area, internal passage
is required in each the deck for operability and safety. Internal passage is used as a
primary escape route. Also it will be beneficial if internal passage is arranged in the
center area of the deck. Therefore, constraints which sets the boundary of the location
of internal passage are formulated as equation 32. This equation is only available for
passages.
0.25𝑋𝑋𝑚𝑚𝑚𝑚𝑥𝑥 < 𝐼𝐼𝑖𝑖 < 0.75𝑋𝑋𝑚𝑚𝑚𝑚𝑥𝑥 (32)
Figure 4-6 Passage constraints: limits of the passage location

51
User interface
5.1. Configuration of user interface
In this study, a prototype program was developed based on the proposed method,
which consists of the arrangement template model, the expert system module, the
optimization module, and the user interface. Figure 5-1 shows the screenshot of the
prototype program developed in this study. On the top, menu bar was provided.
Menu for optimization, expert system and visualization can be selected. On the left,
tree view and property view were provided. Hierarchy structures of the topside are
shown in tree view. In property view, properties of the selected item in tree view are
displayed. On the center, windows of the 3d views and expert system were provided.
Total view of the FPSO is visualized in 3d view. Also the view of the each module
and deck can be visualized in separated small 3d view.
Figure 5-1 Screenshot of the prototype program

52
5.2. Tool for expert system
Object and relation information can be defined through the windows for the
object and relation information as shown in Figure 5-2. Properties and weight factor
of the object and relation information can be defined. Defined object and relation
information are displayed in Object list and relation list in Figure 5-3.
Figure 5-2 Screenshot of the prototype program: tool for the object and relation information
Figure 5-3 Screenshot of the prototype program: tool for the expert system

53
5.3. Tool for optimization
Tool for optimization was also developed. Menu for the module and equipment
arrangement are provided on the top. Also values of the objective function and
constraints are displayed in the report view. The value of the objective function is
displayed by sky-blue color. Violation value of the constraints is displayed by red
color. To satisfy the all constraints, the violation value of the constraints should be
0.
As the optimization algorithm, NSGAII was used. To implement the NAGAII
algorithm, open source library by Jmetal.Net (http://jmetal.sourceforge.net/) was
used.
Figure 5-4 Screenshot of the prototype program: tool for the optimization

54
Applications
To verify the applicability of the proposed method and prototype program, they
were applied to the arrangement design of the FPSO topside. Module arrangement
and equipment arrangement in the module were performed.
6.1. Optimal module layout
The example FPSO is a large FPSO having a storage capacity of 2.0 MMbbl of
oil, and there are eighteen modules in the topside. Optimal module arrangement was
conducted as the first stage of the arrangement design of the FPSO topside. Table
6-1 shows a list of modules arranged to the topside.
As objective functions, feasibility index from the expert system, adjacency index
and weight distribution index were used as described in section 4.1. Adjacency
coefficient was reasonably assumed based on the experts’ knowledge.
Table 6-1 Module list of the example FPSO topside
No. Module name Module ID (Abbreviation) Weight (ton)
1 Separation SE 2,600 2 Oil cooling OC 1,510 3 Oil export OE 1,270 4 Gas compression A GC_A 2,050 5 Gas compression B GC_B 2,050 6 LP gas compression LP 1,130 7 Methanol injection A MI_A 1,210 8 Methanol injection B MI_B 800 9 Electric power generation A PG_A 1,800 10 Electric power generation B PG_B 1,800 11 Utility UT 1,470 12 Water injection WI 1,920

55
No. Module name Module ID (Abbreviation) Weight (ton)
13 Laydown A LA_A 500 14 Laydown B LA_B 500 15 Living quarter LQ 1,000 16 Flare tower FT 1,000 17 Future FU 2,600 18 Flare knot-out drum area K.O 500
6.1.1. Experts’ knowledges for application
To activate the expert system, experts’ knowledge is needed. It is not easy,
however, to accumulate experts’ knowledge about the arrangement design of an
FPSO topside. In this study, various requirements for the example were established
by investigating international codes and standards (API, 2001; Standards Norway,
2001; Standards Norway, 2008), experts’ knowledge, and data of the reference
project.
The object and relation lists for the module arrangement are summarized in Table
6-2 and Table 6-3, respectively. For example, according to the international codes
and standards, the location of a living quarter should be taken into account the
direction of the prevailing winds so as to protect personnel from hydrocarbon vapors,
external fires, explosions, and noise (API, 2001). And a flare tower should be
arranged at the hazardous end of the offshore plant, as far as possible from the living
quarter and the helideck (Standards Norway, 2001). Considering these international
codes and standards, the “Living quarter” is forced to be arranged upwind and the
“Flare tower” is forced to be arranged as far as possible against the “Living quarter.”
These rules can be expressed as the object information of “E001” and “E002” in
Table 6-2. According to the reference project, “Laydown A and B”, “Electric power
generation A and B”, and the “Separation” and a “Future module” are forced to be

56
arranged symmetrically; port and starboard side. These rules can be expressed as the
relation information of “R001”, “R002”, and “R003” in Table 10. The utility area
should serve as a barrier between the hazardous areas and the living quarter
(Standards Norway, 2008). This rule is expressed proposing the distance between
the “Living quarter” and utility service modules by 30 meters. Thus, these rules were
expressed as the relation information of from “R004” to “R009.” According to the
experts’ knowledges, separation is the first processing function to the well fluid from
the riser. Thus, it is beneficial to locate the “Separation” near to the riser. This rule
is expressed proposing the maximum distance between the “Separation” and riser by
30 meters. On the other hand, oil exporting is required to have the reasonable
distance from the riser considering the safety. This rule is expressed proposing the
minimum distance between the “Oil exporting” and riser by 60 meters. Thus, these
rules were expressed as the relation information of “R010” and “R011.
Table 6-2 Object list for the module arrangement
ID Target object Attribute Target value E001 Living quarter Order 0_EXT E002 Flare tower Order 9_EXT
Table 6-3 Relation list for the module arrangement
ID Target object Relation type Subjective object Target value R001 Laydown A GroupWith Laydown B 1_EXT
R002 Electric power generation A GroupWith Electric power generation B 1_EXT
R003 Separator GroupWith Future module 1_EXT
R004 Living quarter DistanceFrom Laydown A 30_PRO_M
R005 Living quarter DistanceFrom Laydown B 30_PRO_M
R006 Living quarter DistanceFrom Electric power generation A 30_PRO_M
R007 Living quarter DistanceFrom Electric power generation B 30_PRO_M
R008 Living quarter DistanceFrom Utility 30_PRO_M
R009 Living quarter DistanceFrom Water injection 30_PRO_M
R010 Separation DistanceFrom Riser 30_MAX_M
R011 Oil exporting DistanceFrom Riser 60_MIN_M

57
6.1.2. Result
Optimization result is shown in Figure 6-1. Comparisons of objective functions
between the manual design and optimal result are summarized in Table 6-4.
Feasibility index of the optimal result was same as manual design since the rules
mainly comes from the manual design. Meanwhile, adjacency index and weight
distribution index were reduced comparing with the manual design based on the
defined adjacency index and weight.
Optimal result of the module arrangement in Figure 6-1 complied with the
defined rules in the expert system. According the object information of “E001” and
“E002”, the “Living quarter” was arranged at first location, and the “Flare tower”
was arranged opposite to the “Living quarter”. According to the relation information
of “R001”, “R002” and “R003”, “Laydown A and B”, “Electric power generation A
and B”, “Separation” and “Future” are arranged symmetrically port and starboard.
And “Laydown A and B”, “Electric power generation A and B”, “Water injection”
and “Utility” modules were arranged close to the “Living quarter”.
Secondly, adjacency index of the optimal result was decreased comparing with
the manual design. It can be thought that modules which have the high value of the
adjacency coefficient had been arranged close to each other, based on assumed
adjacency coefficient.
Thirdly, weight distribution to y axis was significantly improved comparing with
the manual design. Several reasons can be supposed. It is possible that weight data
used in this study are not same as real weight data. Difference of the weight
distribution can be came from the discrepancy of the weight data. Also weight
distribution in x axis was not considered in this study. It can make the big difference
between the manual design and optimal design.

58
Table 6-4 Comparison of the objective functions with the manual design
Objective function Manual Optimization Ratio
Feasibility index from expert system
Maximize 1,506 1,506 1
Adjacency index Minimize 35,070 33,020 0.94
Weight distribution index Minimize 0.97 0.008 0.008
Figure 6-1 Optimal module arrangement

59
6.1.3. Case study
Effects of the rules to the module arrangement design was investigated by
modifying the relation information of “R011”. According the relation information of
“R010”and “R011” in Table 6-3, “Separation” was arranged within the distance of
the 30 meters. “Oil exporting” was arranged outside of the distance of 60 meters as
shown in case 1 of Figure 6-2. The minimum distance from the “Oil exporting” to
the riser was modified from 60 meters to 90 meters. As shown in case 2 of Figure
6-2, “Oil exporting” is arranged outside of the distance of 90m according the
modified relation information. It is verified that rules in expert system is reflected
correctly to the module arrangement design.
Figure 6-2 Case study: effect of the rule to the module arrangement

60
6.2. Optimal equipment layout in water injection
module
After arrangement of the modules, equipment arrangement in “Water injection”
module was performed.
6.2.1. Input data
In water injection module, there are three decks and deck height is 6m.
Equipment installed in water injection module are listed in Table 6-5.
Flow diagram of the water injection system is shown in Figure 6-3. Seawater is
lifted by the “Seawater lift pump”. In general, multi-stage, centrifugal submergible
pumps are installed in separate caisson that provide seawater to the system. The
pump suctions are usually dosed with sodium hypochlorite solution, or something
similar, to combat marine growth and discourage microbiological activity. Water
injection system contains two filtration system. First is “Coarse filtration”. It
removes 98 percentages of the suspended solids of size greater than 80 microns.
Second is “Fine filtration”. It removes 98 percentages of solids impurities above 2
microns. Dissolve oxygen in the seawater makes corrosion in pipe. Therefore, it is
required to remove the oxygen to prevent the corrosion. “Deaeration tower” removes
the oxygens in the seawater. “Deaeration tower” may utilize stripping gas (fuel gas)
or evacuation to encourage the release of dissolved oxygen, and the injection of an
oxygen scavenger such as ammonium bisulphate (NH4 HSO3) into the base of the
vessel improves the process. There are also proprietary de-oxygenating systems on
the market, such as those supplied by Minox. Efficient deaeration can reduce the
oxygen content of seawater from 10 parts per million to less than 30 parts per billion
(Angus Mather, 2009). Also “Vacuum pump package” can be used to create the
necessary vacuum so that seawater boils. Then, the oxygen will be liberated and

61
removed by means of the vacuum pump.
“Deaeration tower” is the vertical tower which height exceeds the deck height. It
is installed across two or more decks. In this example, it is assumed that “Deaeration
tower” is installed in mezzanine deck, so that “Deaeration tower” is divided into two
equipment, “Deaeration tower 1” and “Deaeration tower 2” as shown in Figure 6-4.
Thus, constraints for multi-deck equipment are used. As objective functions,
feasibility index, installation cost, piping cost and ventilation cost were used.
Damage cost was not used since an equipment which has a potential hazard of
physical explosion is not arranged in “Water injection” module.
Table 6-5 Equipment list; Water injection module
No. Equipment A(m) B(m) H(m)
1 wash water pump 2.8 3.48 1.2 2 water injection booster pump 3.2 6.8 1.4 3 water injection pump 9 12.8 4.1 4 seawater booster pump 3.2 5.9 1.6 5 seawater fine filtration package 15 9 6.7 6 air scour blower skid 4 3 2.7 7 vacuum pumps package 4.25 3.5 2.44 8 piping area 15 15 2 9 deaeration tower 1 3.8 3.8 6
10 deaeration tower 2 3.8 3.8 16.5
Figure 6-3 Flow diagram; Water injection system

62
Figure 6-4 Constraints for “Deaeration tower” as multi-deck equipment
6.2.2. Experts’ knowledges for application
The object and relation lists for the equipment arrangement in the “Water
injection” module are summarized in Table 6-6 and Table 6-7. According to the
reference project, “Deaeration tower 1” and “Piping area” are forced to be arranged
in mezzanine deck (e.g., z=44m). “Seawater filtration package” is forced to be
arranged in upper deck (e.g., z=50m). These rules can be expressed by object
information from “E001” to “E003”. In addition, towers and tall vessels such as the
“Deaerator tower 1” should also be arranged in the module as near as possible to the
FPSO hull centerline to reduce the effect of sea stat conditions on equipment
performance and support structure (Roobaert et al., 2012). This rule can be expressed
as the object information of “E004”.
Booster pumps should be located at the lowest elevation of the system to achieve
the NPSHr (Net Positive Suction Head required) (Standard Norway, 2001). NPSHr

63
is determined by pump inlet design. If NPSHr is not provided, cavitation will be
occurred. It makes the vibration and noise. Also hydraulic performance of the pumps
will be dropped, and mechanical damage to the pump impeller can be occurred. To
obtain the NPSHr from the “Deaeration tower”, “Wash water pump” and “Water
injection booster pump” are forced to be arranged minimum 6 meters below the
“Deaeration tower” by relation information of “R001” and “R002”.
Table 6-6 Object list for the equipment arrangement in “Water injection” module
ID Target object Attribute Target value
E001 Deaeration tower 1 COG.z 47_PRO_M
E002 Piping area COG.z 47_PRO_M
E003 Seawater fine filtration package
COG.z 52_PRO_M
E004 Deaeration tower 1 COG.y 0_PRO_M
Table 6-7 Relation list of the equipment arrangement in “Water injection” module
ID Target object Relation type Subjective object Target value
R001 Deaeration tower 1 LevelDifference Wash water pump 6_MIN_M
R002 Deaeration tower 2 LevelDifference Water injection booster pump 6_MIN_M
6.2.3. Result
Optimization result is shown in Figure 6-5. Comparisons of objective functions
between the manual design and optimal result are summarized in Table 6-8. As
shown in this table, objective functions were improved comparing with the manual
design.
Optimal result shown in Figure 6-5 complied with the defined rules in the expert

64
system. According the object information from “E001” to “E003”, “Piping area” and
“Deaeration tower” were arranged in mezzanine deck, and “Seawater filtration
package” was arranged in upper deck. Also, according the to the object information
of the “E004”, “Deaeration tower” was arranged near the center of the module in y
axis. According the relation information of “R001” and “R002”, “Wash water pump”
and “Water injection booster pump” were arranged below the “Deaeration tower”.
Also, equipment connected by piping were arranged closely to minimize the piping
cost.
Table 6-8 Comparison of the objective functions with the manual design
Objective function Manual Optimization Ratio
Feasibility index from expert system
Maximize 643 791 1.23
Installation cost Minimize 750 555 0.74
Piping cost Minimize 77 40 0.52
Ventilation cost Minimize 894 890 0.99
Table 6-9 Result of the optimal equipment arrangement
No. Name x y z Oi Zi,1 Zi,2 Zi,3
1 wash water pump 22.66 3.49 38.6 1 1 0 0
2 water injection booster pump
7.74 5.95 38.7 1 1 0 0
3 water injection pump 15.08 8.04 40.05 1 1 0 0
4 seawater booster pump 9.86 11.49 50.8 1 0 0 1
5 seawater fine filtration package
20.50 11.60 53.35 1 0 0 1
6 air scour blower skid 20.45 11.60 45.35 0 0 1 0
7 vacuum pumps package 15.47 3.66 51.22 0 0 0 1
8 piping area 9.10 9.48 45 1 0 1 0
9 deaeration tower 1 20.56 3.49 47 1 0 1 0
10 deaeration tower 2 20.56 3.49 58.25 1 0 0 1

65
Figure 6-5 Visualization of the optimal equipment arrangement in “Water injection” module
6.2.4. Case study
1) Effect of the rules in equipment arrangement
Effect of the rules to the arrangement design was investigated by adding the
object information shown in Table 6-10. By adding the object information of “E005”,
“Deaeration tower” is proposed to be arranged near the origin of the module. The
optimization result is shown in Figure 6-6. It can be found that “Deaeration tower”
was arranged near the origin of the module comparing with arrangement design in
Figure 6-5. As a result, experts’ intention or knowledge can be reflected in the

66
equipment arrangement design effectively and efficiently by defining the rules as
object and relation information.
Table 6-10 Additional object information
ID Target object Attribute Target value
E005 Deaeration tower 1 COG.x 0_PRO_M
Figure 6-6 Case study: effect of the rule to the equipment arrangement in “Water injection”
module

67
2) Equipment arrangement including the internal passage
In this case study, internal transverse passages are arranged in each deck. As
mentioned, in general, internal passage should be provided for operability and safety.
It can be used as main access route and primary escape route in emergency situation.
Also it will be no meaning if the internal passage is arranged close to the edge of the
deck. To prevent it, the passage constraint in equation 24 is used. Optimization result
is shown in Figure 6-7. Comparing the optimal result without passages shown in
Figure 6-6, feasibility index from the expert system was same. Meanwhile, total deck
are was widen due to the internal passages, so that installation cost was increased.
Consequently, since the distances between equipment are increased, total piping cost
was also increased. However, it is clear that operability will be improved due to the
additional wide passage in the middle area of the each deck. Also safety can be
further improved, because internal passage can be escape routes in emergency
situations.
Table 6-11 Comparison: with internal passage vs without internal passage
Objective function
Optimization
Ratio w/o passage w/ passage
Feasibility index from expert system Maximize 791 791 1
Installation cost Minimize 555 685 1.23
Piping cost Minimize 40 66 1.5
Ventilation cost Minimize 890 894 1.004

68
Table 6-12 Result of the optimal equipment arrangement with internal passages
No. Name x y z Oi Zi,1 Zi,2 Zi,3 1 wash water pump 22.66 3.49 38.6 1 1 0 0 2 water injection booster
pump 7.74 5.95 38.7 1 1 0 0
3 water injection pump 15.08 8.04 40.05 1 1 0 0 4 seawater booster pump 9.86 11.49 50.8 1 0 0 1 5 seawater fine filtration
package 20.50 11.60 53.35 1 0 0 1
6 air scour blower skid 20.45 11.60 45.35 0 0 1 0 7 vacuum pumps package 15.47 3.66 51.22 0 0 0 1 8 piping area 9.10 9.48 45 1 0 1 0 9 deaeration tower 1 20.56 3.49 47 1 0 1 0
10 deaeration tower 2 20.56 3.49 58.25 1 0 0 1 11 Internal passage 1 8.01 11.74 39.1 0 1 0 0 12 Internal passage 2 9.11 11.74 45.1 0 0 1 0 13 Internal passage 3 8.82 11.74 51.1 0 0 0 1
Figure 6-7 Visualization of the optimal result including the internal transverse passages

69
6.3. Optimal equipement layout in separation module
6.3.1. Input data
Equipment arrangement in “Separation” module was performed. Equipment list
is summarized in Table 6-13. Flow diagram in “Separation” module is shown in
Figure 6-8. First equipment well fluid met is the 1st separator. In separator, oil, water
and gas are separated by gravity. To improve the separation efficiency, and to make
the separator smaller, various internals are installed inside separator. Before the 1st
separator, pig launcher and receiver is arranged. It
Table 6-13 Equipment list; Separation module
No. Equipment a (m)
b (m)
h (m)
1 Pig launcher/receiver A 12.2 1 1 2 Pig launcher/receiver B 12.2 1 1 3 Pig launcher/receiver C 12.2 1 1 4 Pig launcher/receiver D 12.2 1 1 5 Separator A 16.1 4.6 4.6 6 Separator B 16.1 4.6 4.6 7 Piping space 15 15 2
Figure 6-8 Flow diagram; Separation module

70
6.3.2. Experts’ knowledges for application
Object information used in this application are summarized in Table 6-14. Pig
launcher and receiver doors should face outboard of the platform to minimize the
possibility of any projectiles hitting personnel or other equipment (API RP 14J,
2001). This requirements are expressed as object information from “E001” to
“E004”.
Table 6-14 Object list for equipment arrangement; Separation module
ID Target object Attribute Target value
E001 Pig launcher/receiver A Orientation 0_EXT
E002 Pig launcher/receiver B Orientation 0_EXT
E003 Pig launcher/receiver C Orientation 0_EXT
E004 Pig launcher/receiver D Orientation 0_EXT
E005 Separator A & BB Orientation 1_EXT
E006 Separator A & B COG.z 50_MIN_M
6.3.3. Result
Objective functions used in this application and its values are listed in Table 6-15.
Optimization location of the equipment are summarized in Table 6-16.
Table 6-15 Objective functions and optimum values; Separation module
Objective functions Value Feasibility index Maximize 𝐹𝐹1 = ∑𝑊𝑊𝑘𝑘𝑅𝑅𝑘𝑘 900
Installation cost Minimize 𝐹𝐹2 = 𝐿𝐿𝐿𝐿 ∙ 𝐹𝐹𝐹𝐹 537
Piping cost Minimize 𝐹𝐹3 = ∑ ∑ 𝑃𝑃𝐿𝐿𝑖𝑖𝑖𝑖 ∙ 𝑇𝑇𝑇𝑇𝑖𝑖𝑖𝑖𝑛𝑛𝑖𝑖=2/𝑓𝑓𝑖𝑖𝑖𝑖=1
𝑛𝑛−1𝑖𝑖=1 20
Ventilation cost Minimize 𝐹𝐹3 = ∑ (𝑉𝑉𝑚𝑚𝑚𝑚𝑚𝑚𝑛𝑛,𝑚𝑚𝑚𝑚𝑒𝑒𝑡𝑡𝑒𝑒 + 𝑉𝑉𝑘𝑘,𝑚𝑚𝑚𝑚𝑒𝑒𝑡𝑡𝑒𝑒)𝑁𝑁𝑁𝑁𝑘𝑘=1 689

71
Table 6-16 Result of optimal equipment arrangement; Separation module
No. Name x y z Oi Zi,1 Zi,2 Zi,3
1 Pig launcher/receiver A 18.75 13.00 44.5 0 0 1 0
2 Pig launcher/receiver B 16.55 13.00 44.5 0 0 1 0
3 Pig launcher/receiver C 14.13 7.60 44.5 0 0 1 0
4 Pig launcher/receiver D 11.92 7.60 44.5 0 0 1 0
5 Separator A 16.56 13.28 52.3 1 0 0 1
6 Separator B 13.39 4.48 52.3 1 0 0 1 7 Piping space 11.08 10.24 39 1 1 0 0
Optimal result in Table 6-16 is visualized in Figure 6-9. It can be found that pig
launcher & receivers were arranged transversely to the module direction, according
the defined object information from “E001” to “E004”. Other object information
were also satisfied.
Figure 6-9 Visualization of optimal result; Separation module

72
6.4. Optimal equipment layout in oil cooling module
After separation, oil is cooled and stored in hull cargo tank. In this application,
equipment arrangement in “Oil cooling” module was performed.
6.4.1. Input data
Equipment arranged in “Oil cooling” module are summarized in Table 6-17. Flow
diagram in “Oil cooling” module is shown in Figure 6-10. Oil from the 1st separator
is heated by crude oil heater to vaporize the light hydro carbon in 2nd separator. In
2nd separator, oil, water and gas is separated by gravity. Operating pressure is lower
than 1st separator. Separated oil is cooled by crude oil cooler, and stored in hull cargo
tank.
Table 6-17 Equipment list; Oil cooling module
No. Equipment a (m)
b (m)
h (m)
1 2nd stage separator 15.4 4.6 4.6 2 Crude oil heater 7.73 2.39 1.19 3 Wash water heater 5.2 0.83 0.83 4 Crude oil cooler 12.56 4.7 1.1 5 Crude oil transfer pump 3.2 2.6 1.5 6 Piping space 15 15 2
Figure 6-10 Flow diagram; Oil cooling module

73
6.4.2. Experts’ knowldeges for application
Object and relation information used in this application are summarized in Table
6-18 and Table 6-19. Crude oil heater, wash water heater and crude oil cooler are the
shell and tube heat exchanger. It is beneficial to arrange the shell and tube heat
exchanger in transverse direction for easy maintenance of the tube bundle. Because
the removal of the tube bundle requires wide spaces, and it is transferred through the
main walk ways in center pipe rack. Therefore, orientation of them are forced to the
transverse direction by defining the object information from “E003” to “E005”. Also,
crude oil transfer pump transfers crude oil from the 2nd separator. In crude handling
system, pumps should be located as low as possible to secure sufficient NPSHa (Net
Positive Suction Head Available) (Standard Norway, 2001). These rules are defined
by relation information of “R001”. Wash water heater and crude oil cooler are
arranged on the downstream of the 2nd separator. To avoid the additional pumping
power to the wash water heater and crude oil cooler, they are required to be arranged
lower than 2nd separator. This requirements are defined by relation information of
“R002” and “R003”.
Table 6-18 Object list for equipment arrangement; Oil cooling module
ID Target object Attribute Target value
E001 2nd separator COG.z 50_MIN_M
E002 Piping space COG.z 47_PRO_M
E003 Crude oil heater Orientation 0_EXT
E004 Wash water heater Orientation 0_EXT
E005 Crude oil cooler Orientation 0_EXT
E006 2nd separator Orientation 1_EXT

74
Table 6-19 Relation list for equipment arrangement; Oil cooling module
ID Target object Relation type Subjective object Target value
R001 2nd separator LevelDifference Crude oil transfer pump 6_MIN_M
R002 2nd separator LevelDifference Wash water heater 6_MIN_M
R003 2nd separator LevelDifference Crude oil cooler 6_MIN_M
6.4.3. Result
Objective functions used in this application and its values are listed in Table 6-20.
Optimization location of the equipment are summarized in Table 6-21. Optimal
result is visualized in Figure 6-11. It is shown that crude oil cooler, wash water pump
and crude oil heater are arranged below the 2nd separator according to the relation
information from “R001” to “R003. Also they are arranged transversely, according
to the object information from “E003” to “E005.
Table 6-20 Objective functions and optimum values; Oil cooling module
Objective functions Value
Feasibility index Maximize 𝐹𝐹1 = ∑𝑊𝑊𝑘𝑘𝑅𝑅𝑘𝑘 900
Installation cost Minimize 𝐹𝐹2 = 𝐿𝐿𝐿𝐿 ∙ 𝐹𝐹𝐹𝐹 487
Piping cost Minimize 𝐹𝐹3 = ∑ ∑ 𝑃𝑃𝐿𝐿𝑖𝑖𝑖𝑖 ∙ 𝑇𝑇𝑇𝑇𝑖𝑖𝑖𝑖𝑛𝑛𝑖𝑖=2/𝑓𝑓𝑖𝑖𝑖𝑖=1
𝑛𝑛−1𝑖𝑖=1 37
Ventilation cost Minimize 𝐹𝐹3 = ∑ (𝑉𝑉𝑚𝑚𝑚𝑚𝑚𝑚𝑛𝑛,𝑚𝑚𝑚𝑚𝑒𝑒𝑡𝑡𝑒𝑒 + 𝑉𝑉𝑘𝑘,𝑚𝑚𝑚𝑚𝑒𝑒𝑡𝑡𝑒𝑒)𝑁𝑁𝑁𝑁𝑘𝑘=1 378
Table 6-21 Result of optimal equipment arrangement; Oil cooling module
No. Name x y z Oi Zi,1 Zi,2 Zi,3
1 2nd stage separator 14.51 12.82 52.3 1 0 0 1
2 Crude oil heater 14.55 6.75 44.60 0 0 1 0
3 Wash water heater 19.17 12.82 44.42 0 0 1 0
4 Crude oil cooler 9.81 12.77 44.55 0 0 1 0
5 Crude oil transfer pump 14.96 13.12 44.75 1 0 1 0
6 Piping space 10.14 9.62 39 1 1 0 0

75
Figure 6-11 Visualization of optimal result; Oil cooling module

76
6.5. Optimal equipment layout in oil exporting
module
Crude oil in cargo tank is transferred to onshore by shuttle tanker. To do this, oil
should be exporting to the shuttle tanker. In this application, equipment arrangement
in “Oil exporting” module is performed.
6.5.1. Input data
Equipment in “Oil exporting” module are summarized in Table 6-22. And flow
diagram is shown in Figure 6-12. Oil is exporting by the crude oil offloading pump.
Before offloading, crude oil passes the metering package. In metering package,
characteristic of the oil is examined, and total quantities of the exported oil is
measured to calculate the total price. Pressure surge vessel is arranged to prevent the
overpressure in exporting line.
Table 6-22 Equipment list; Oil exporting module
No. Equipment a (m)
b (m)
h (m)
1 Crude oil offloading pump 6.4 12.9 2.8 2 Pressure surge vessel 1 2 2 6 3 Pressure surge vessel 2 2 2 2 4 Crude oil metering package 18.5 6.5 8.2 5 Piping space 1 15 15 2 6 Piping space 2 10 15 2
Figure 6-12 Flow diagram; Oil exporting module

77
6.5.2. Experts’ knowledges for application
Object information used in this module are summarized in Table 6-23. Pressure
surge vessel is forced to be arranged in mezzanine deck by defining the object
information of “E003”. Also it is vertical tower. Tower should be located to the hull
centerline as near as possible to reduce the effect of sea state conditions (Roobaert
et al., 2012). This requirement is defined as object information of “E007).
Table 6-23 Object list for equipment arrangement; Oil exporting module
ID Target object Attribute Target value
E001 Piping space 1 COG.z 47_PRO_M
E002 Piping space 2 COG.z 50_MIN_M
E003 Pressure surge vessel 1 COG.z 47_PRO_M
E004 Crude oil metering package COG.z 50_MIN_M
E005 Offloading Pump COG.z 44_MAX_M
E006 Offloading pump Orientation 1_EXT
E007 Pressure surge vessel 1 COG.y 0_PRO_M
6.5.3. Result
Objective functions used in this application and its values are listed in Table 6-24.
Optimization location of the equipment are summarized in Table 6-25.
Table 6-24 Objective functions and optimum values; Oil exporting module
Objective functions Value
Feasibility index Maximize 𝐹𝐹1 = ∑𝑊𝑊𝑘𝑘𝑅𝑅𝑘𝑘 894
Installation cost Minimize 𝐹𝐹2 = 𝐿𝐿𝐿𝐿 ∙ 𝐹𝐹𝐹𝐹 517
Piping cost Minimize 𝐹𝐹3 = ∑ ∑ 𝑃𝑃𝐿𝐿𝑖𝑖𝑖𝑖 ∙ 𝑇𝑇𝑇𝑇𝑖𝑖𝑖𝑖𝑛𝑛𝑖𝑖=2/𝑓𝑓𝑖𝑖𝑖𝑖=1
𝑛𝑛−1𝑖𝑖=1 12
Ventilation cost Minimize 𝐹𝐹3 = ∑ (𝑉𝑉𝑚𝑚𝑚𝑚𝑚𝑚𝑛𝑛,𝑚𝑚𝑚𝑚𝑒𝑒𝑡𝑡𝑒𝑒 + 𝑉𝑉𝑘𝑘,𝑚𝑚𝑚𝑚𝑒𝑒𝑡𝑡𝑒𝑒)𝑁𝑁𝑁𝑁𝑘𝑘=1 1255

78
Table 6-25 Result of optimal equipment arrangement; Oil exporting module
No. Name x y z Oi Zi,1 Zi,2 Zi,3 1 Crude oil offloading pump 11.55 18.42 39.4 0 1 0 0 2 Pressure surge vessel 1 3.06 2.5 47 1 0 1 0 3 Pressure surge vessel 2 3.06 2.5 51 1 0 0 1 4 Crude oil metering package 11.55 18.42 54.1 1 0 0 1 5 Piping space 1 12.47 13.35 45 1 0 1 0 6 Piping space 2 13.19 6.52 51 0 0 0 1
Optimal result is visualized in Figure 6-13. Object information were satisfied.
Figure 6-13 Visualization of optimal result; Oil exporting module

79
6.6. Optimal equipment layout in gas compression
module
Separated gas from the separator is used for gas lift or rejection to the reservoir.
In case of gas lift, gas is injected into the production tubing or bottom of the riser to
improve the oil production rate by decreasing the static pressure in production tubing
or riser. Or gas is reinjected to the well to enhance the oil production by increasing
the reservoir pressure. In this application, equipment arrangement in “Gas
compression” module is performed.
6.6.1. Input data
Equipment in “Gas compression” module are summarized in Table 6-26. Flow
diagram in this module is shown in Figure 6-14.
Three-stage compressor is arranged in this module. Liquid in compressed gas
can damage the compressor blade, so that liquid droplet in gas should be removed
before compressing. To achieve this, cooler and scrubber are arranged before each
compression stage. Gas is cooled by shell and tube heat exchanger. Liquid droplet in
cooled gas is removed in scrubber.
In general, glycol dehydration package is used to remove the water in gas. In this
application, it is arranged after first compression. Glycol dehydration is a liquid
desiccant system. Glycol absorbs the water from the gas in glycol contactor. Gas
flows upward in the contactor, while lean glycol solution flow down to the contactor,
then lean glycol becomes the rich glycol. Rich glycol is regenerated in generation
package. In regeneration package, rich glycol is heated. Then, water is vaporized,
and rich glycol becomes lean glycol. It is called as regeneration. Regenerated lean
glycol is reinjected into the glycol contactor.

80
Table 6-26 Equipment list; Gas compression module
No. Equipment a (m)
b (m)
h (m)
1 MP/HP Gas compressor A1 21.8 5.8 5 2 MP/HP Gas compressor A2 21.8 5.8 5 3 Glycol contactor 2 2 10.7 4 Glycol contactor inlet filter coalescer 1 1 4.8 5 Glycol contactor inlet scrubber 1.8 1.8 3.34 6 MP Compressor suction scrubber 2 2 3.42 7 HP1 Compressor suction scrubber 1.3 1.3 3.3 8 HP2 Compressor suction scrubber 1.2 1.2 3.2 9 Glycol regeneration package 11 6.1 16.6
10 Glycol contactor inlet cooler 7.3 2.2 2 11 Gas lift heater 5.3 1.5 2 12 MP Compressor suction cooler 8.6 1.5 2 13 HP2 Compressor suction cooler 8.5 1 2 14 HP2 Compressor discharge cooler 6.2 1 2
Figure 6-14 Flow diagram; Gas compression module

81
6.6.2. Experts’ knowledge for application
Object information used in this application are summarized in Table 6-27. Heavy
item should be arranged on the lower level to reduce the effect on the FPSO’s center
of gravity (Roobaert et al., 2012). Gas compressor is heaviest item in this module.
Therefore, gas compressor is forced to be arranged in lowest deck by defining the
object information of “E001”.
Scrubber is the tall tower. To reduce the effect of the motion of FPSO, they are
also required to be arranged on the lowest deck by defining the object information
from “E002” to “E005”. Additionally, scrubbers are required to be arranged close to
the ship center to reduce the effect of the ship motion. This requirement is expressed
by object information from “E014” to “E017”.
Shell and tube heat exchanger is preferred to be arranged transversely considering
the removal spaces of tube bundle and transportation route of tube bundle through
the center pipe rack of FPSO. These requirement are expressed by object information
from “E006” to “E010”.
On the other hand, the shaft of rotating equipment should be orientated parallel
to the longitudinal axis of the FPSO hull (Roobaert et al., 2012). Compressor is the
biggest rotating machinery in this module. Therefore, it is forced to be arranged
parallel to the FPSO’s direction by defining the object information of “E009” and
“E010”.

82
Table 6-27 Object list for equipment arrangement; Gas compression module
ID Target object Attribute Target value
E001 MP/HP Gas compressor A1 COG.z 44_MAX_M
E002 Glycol contactor inlet scrubber COG.z 44_MAX_M
E003 MP Compressor suction scrubber COG.z 44_MAX_M
E004 HP1 Compressor suction scrubber COG.z 44_MAX_M
E005 HP2 Compressor suction scrubber COG.z 44_MAX_M
E006 Glycol contactor inlet cooler Orientation 0_EXT
E007 Gas lift heater Orientation 0_EXT
E008 MP Compressor suction cooler Orientation 0_EXT
E009 HP2 Compressor suction cooler Orientation 0_EXT
E010 HP2 Compressor discharge cooler Orientation 0_EXT
E011 MP/HP Compressor A1 Orientation 1_EXT
E012 MP/HP Compressor A2 Orientation 1_EXT
E013 MP/HP Compressor A1 COG.y 30_PRO_M
E014 Glycol contactor inlet scrubber COG.y 0_PRO_M
E015 MP Compressor suction scrubber COG.y 0_PRO_M
E016 HP1 Compressor suction scrubber COG.y 0_PRO_M
E017 HP2 Compressor suction scrubber COG.y 0_PRO_M
E018 Glycol contactor COG.y 0_PRO_M
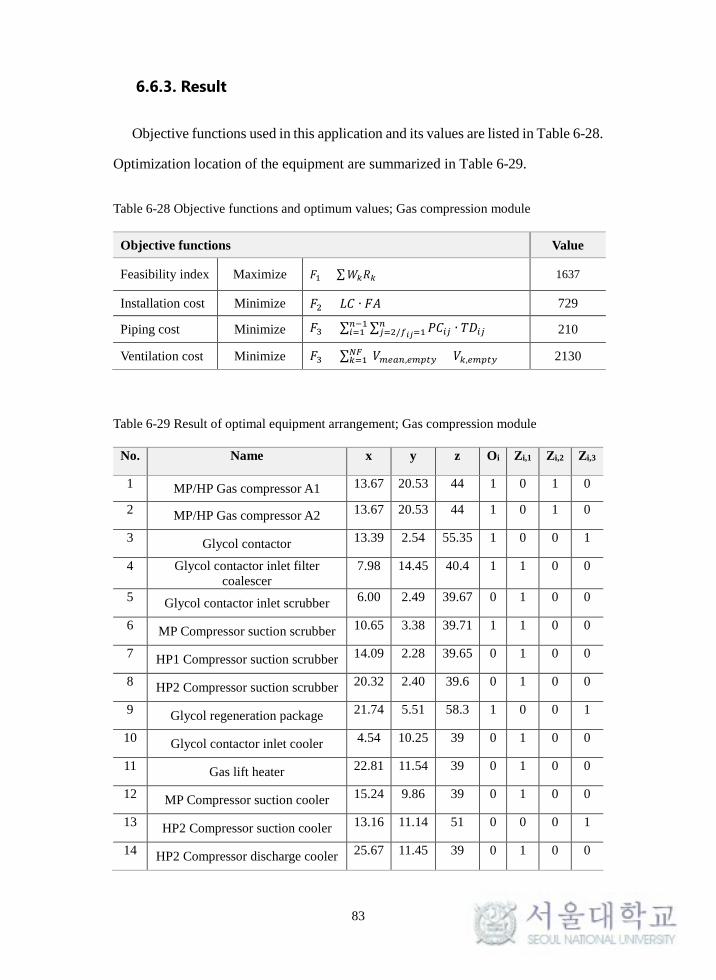
83
6.6.3. Result
Objective functions used in this application and its values are listed in Table 6-28.
Optimization location of the equipment are summarized in Table 6-29.
Table 6-28 Objective functions and optimum values; Gas compression module
Objective functions Value
Feasibility index Maximize 𝐹𝐹1 = ∑𝑊𝑊𝑘𝑘𝑅𝑅𝑘𝑘 1637
Installation cost Minimize 𝐹𝐹2 = 𝐿𝐿𝐿𝐿 ∙ 𝐹𝐹𝐹𝐹 729
Piping cost Minimize 𝐹𝐹3 = ∑ ∑ 𝑃𝑃𝐿𝐿𝑖𝑖𝑖𝑖 ∙ 𝑇𝑇𝑇𝑇𝑖𝑖𝑖𝑖𝑛𝑛𝑖𝑖=2/𝑓𝑓𝑖𝑖𝑖𝑖=1
𝑛𝑛−1𝑖𝑖=1 210
Ventilation cost Minimize 𝐹𝐹3 = ∑ (𝑉𝑉𝑚𝑚𝑚𝑚𝑚𝑚𝑛𝑛,𝑚𝑚𝑚𝑚𝑒𝑒𝑡𝑡𝑒𝑒 + 𝑉𝑉𝑘𝑘,𝑚𝑚𝑚𝑚𝑒𝑒𝑡𝑡𝑒𝑒)𝑁𝑁𝑁𝑁𝑘𝑘=1 2130
Table 6-29 Result of optimal equipment arrangement; Gas compression module
No. Name x y z Oi Zi,1 Zi,2 Zi,3
1 MP/HP Gas compressor A1 13.67 20.53 44 1 0 1 0
2 MP/HP Gas compressor A2 13.67 20.53 44 1 0 1 0
3 Glycol contactor 13.39 2.54 55.35 1 0 0 1
4 Glycol contactor inlet filter coalescer
7.98 14.45 40.4 1 1 0 0
5 Glycol contactor inlet scrubber 6.00 2.49 39.67 0 1 0 0
6 MP Compressor suction scrubber 10.65 3.38 39.71 1 1 0 0
7 HP1 Compressor suction scrubber 14.09 2.28 39.65 0 1 0 0
8 HP2 Compressor suction scrubber 20.32 2.40 39.6 0 1 0 0
9 Glycol regeneration package 21.74 5.51 58.3 1 0 0 1
10 Glycol contactor inlet cooler 4.54 10.25 39 0 1 0 0
11 Gas lift heater 22.81 11.54 39 0 1 0 0
12 MP Compressor suction cooler 15.24 9.86 39 0 1 0 0
13 HP2 Compressor suction cooler 13.16 11.14 51 0 0 0 1
14 HP2 Compressor discharge cooler 25.67 11.45 39 0 1 0 0

84
Optimal result is visualized in Figure 6-15. Shell and tube heat exchangers were
arranged transversely according to the defined object information. It can be also
found that all scrubber were arranged close to the ship center. Other defined object
information were also satisfied.
Figure 6-15 Visualization of optimal result; Gas compression module

85
Conclusions and future works
In this study, arrangement method of an offshore plant topside was proposed
based on the expert system and the optimization technique. Firstly, arrangement
template model (ATM) for the arrangement design of the offshore plant topside was
defined. Secondly, expert system based on the arrangement evaluation model (AEM)
was developed for arrangement design of the offshore plant topside. Desinger can
define their own knowledges, international code and standard easily as rules in the
expert system. Thirdly, an optimization method for the arrangement design of the
offshore plant topside was proposed. Operability, maintainability and safety were
considered to formulate the arrangement problem as optimization problem. Physical
explosion was considered for safety. Operation spaces around each equipment,
passages around the perimeter of the deck are considered. Additionally, internal
transverse passage was considered in equipment arrangement. As shown in the case
study in equipment arrangement in “Water injection” module, installation cost,
piping cost can be slightly increased by considering the internal passage. However,
it can be thought that safety and operability are increased by providing the internal
passage. Prototype program was developed based on the proposed method. To
evaluate the applicability of the proposed method and the prototype program, they
were applied to the topside of the example FPSO. The optimal results and case study
showed that proposed method can be used as new tool for the arrangement design of
the FPSO topside.
In the future, expert system will be improved to represent various knowledges as
rules. Also mathematical formulation of the optimization problem will be refined to
obtain more realistic arrangement design.

86
References Hwang, J. K., Roh, M. I. & Lee, K. Y., 2010. “Detailed design and construction of
the hull of a floating, production, storage and off-loading (FPSO) unit”, Ships
and Offshore Structures, 5(2), 93-104.
Ku, N. K., Hwang, J. H., Lee, J. C., Roh, M. I. & Lee, K., Y., 2014. “Optimal module
layout for a generic offshore LNG liquefaction process of LNG-FPSO”, Ships
and Offshore Structures, 9(3), 311-332.
Salzgitter Mannesmann Stainless Tubes, 2015. “FPSO tubes and pipes”,
http://www.smst-tubes.com/english/applications/oil-und-gas-offshore/fpso/fpso-
tubes-and-pipes.html.
Edwards, K. L., 2003. “Designing of engineering components for optimal materials
and manufacturing process utilization”, Materials and Design, 24, 355-366.
Ipek, M. & Selvi, I. H. & Findik, F. & Torkul, O. & Cedimoglu, I. H., 2012. “An
expert system based material selection approach to manufacturing”, Materials
and Design, 47, 331-340.
Liao, S. H., 2005. “Expert system methodologies and applications – a decade review
from 1995 to 2440”, Expert Systems with Application, 28, 93-103.
Byun, Y.C., 1998. A study on determination of ship main dimension and
compartments arrangement supporting expert system, Master Thesis, Seoul
National University.
Shin, S.C. & Kim, S.Y. & Park, J.K., 2002. “Evaluation of engine room machinery
arrangement using Fuzzy modeling”, Journal of Fuzzy Logic and Intelligent
Systems, 12(2), 157-163.
Helvacioglu, S. & Insel, M., 2005. “A reasoning method for a ship design expert
system”, Expert System, 22(2), 72-77.
Chung, B. Y., Kim, S. Y., Shin, S. C., Koo, Y. H., & Kraus, A., 2011. “Optimization
of compartments arrangement of submarine pressure hull with knowledge based
system”, International Journal of the Society of Naval Architects of Korea, 3(4),
254-262.
Shin, J.H., 2013. A study on the spatial arrangement of naval ships considering
survivability. Master Thesis, Seoul, South Korea: Seoul National University.
Kim, K. S., Roh, M. I. & Ha, S., 2015. “Expert system based on the arrangement

87
evaluation model for the arrangement design of submarine”, Expert System with
Application, 42, 8731-8744.
Patsiatzis, D. I. & Papageorgiou, L. G., 2002. “Optimal multi-floor process plant
layout”, Computers and Chemical Engineering, 26, 575-583.
Par, K. T., Koo, J. M., Shin, D. I., Lee, C. J. & Yoon, E. S., 2011. “Optimal multi-
floor plant layout with consideration of safety distance based on mathematical
programming and modified consequence analysis”, Korean Journal of Chemical
Engineering, 28(4), 1009-1018.
Jeong, S. Y., Roh, M. I., & Shin, H. K., 2015. “Multi-floor layout model for topside
of floating offshore plant using the optimization technique”, International Journal
of the Society of Naval Architects of Korea, 52(1), 77-87.
Dan, S. K., Shin, K. I. & Yoon, E. S., 2015. “Layout optimization of LNG-
liquefaction process on LNG-FPSO preventing domino effects”, Journal of
Chemical Engineering of Japan, 48(8), 645-655.
Park, Y.S., 2009. Development of the spatial layout evaluation model (SLEM) in
terms of space program validation, Doctoral Thesis, Seoul National University.
Rumbaugh, J. & Jacobson, I. & Booch, G., 2000. The modeling language reference
manual, Massachusetts: Addison Wesley Longman Inc.
American Petroleum Institutue (API), 2001. Recommended practice for design and
hazardd analysis for offshore production facilities. API Recommended Practice
14J.
Standards Norway, 2001. Process systems. Norsok Standard P-100.
Standards Norway, 2008. Technical safety. Norsok Standard S-001.
Angus Mather, 2009. FPSO handbook. Witherby seamanship international Ltd.
Roobaert, N., Campo. J., Newman, H. & Phillips, A., 2012. How best practices
optimize topsides design. Offshore Engineer, 2012(1), 44-47. Ken Arnold, Maurice Stewart, 2008. Surface production operations volume 1. Golf
professional publishing.

88
APPENDICES

89
A. Oil and gas production process
A.1. Overall process flow
Typical process flow of the FPSO topside is shown in Figure A-1.
Figure A-1 Overall process flow (Angus Mather, 2009)
90
Well fluid from the reservoir is separated into the oil, water and gas in FPSO
topside. Consequently, process system in FPSO topside can be divided into three
process system; oil production system, gas production system and produce water
system. Furthermore, utility system is existed to provide the necessary utilities
(cooling/heating medium, potable water, nitrogen etc.) for the production system or
others. Utility system is not included in this section.
In oil production system, oil, gas and water are separated from the well fluid. Oil
should be meet the defined specification for sales. Gas is used for gas lift or
reinjection into the reservoir. It can be exported by pipe line for sales. Also small
amount of the gas is used as fuel gas for equipment in FPSO. Separated water from
the separator should be treated for overboard discharge or reinjection into the
reservoir. Oil droplet in the water is further separated in produced water system.
Then, produced water can be discharged overboard.

91
A.2. Oil production system
Process flow of the oil production system is shown in Figure A-2.
Figure A-2 Process flow of oil production system

92
Before the production separator, heater exchanger can be used to heat the oil from
the well to lower the viscosity and assist with the separation process (Angus Mater,
2009). In general, three phase separator is used, and it separates the oil, gas and water
from the well fluid. Multi-stage separation is used to maximize liquid production and
minimize compression horsepower (Ken Arnold et at., 2008). Liquid recovery versus
number of separator stages is shown in Figure A-3.
Figure A-3 Incremental liquid recovery versus number of separator stages (Ken Arnold et
at., 2008)
Separated oil is transferred to the degassing separator. It is two phase separator
to remove any remaining gas from the oil. Then, oil is transferred to the bulk oil
treater to remove the water droplet from the oil. After removing the last water droplet,
oil is flashed down to almost atmospheric pressure to release any remaining gas in
degassing tank (Angus Mather, 2009). Lastly, separated oil is cooled down by heat
exchanger and stored in hull cargo tank.

93
A.3. Gas production system
Gas production system is shown in Figure A-4.
Figure A-4 Process flow of gas production system

94
Gas is compressed for export, gas lift and gas injection or to use as fuel gas. When
gas in compressed, liquid droplet can be made. It will damage the compressor blade.
Therefore, liquid droplet should be removed before compressing. Meanwhile, if the
gas is exported by a subsea pipeline, it must be compressed to a pressure in excess
of 1,440 psig (96 barg), and up to 6,000 psig (420 barg) if it is reinjected into the
reservoir for enhanced oil recovery Angus Mather, 2009). This pressure can be reach
at once, hence multi-stage compression is used. Consequently, cooler and scrubber
are arranged before each compression stage to remove the liquid droplet in gas phase.
Also dehydration unit is used to remove the water droplet in gas to prevent the
hydrate in pipeline. Glycol dehydration unit is frequently used. Glycol dehydration
is a liquid desiccant for the removal of water from the gas. Dehydration is took effect
in glycol contactor. Wet gas enters from bottom of the contactor. On the other hand,
lean glycol enters from top of the contactor. As gas flows upward and lean glycol
flow downward in the contactor, glycol absorbs the water in wet gas and becomes
rich glycol. Dried gas leaves the contractor on the top, and rich glycol leaves the
contactor on the bottom. Rich glycol is sent to the regeneration package.

95
A.4.Produced water system
Figure A-5 process flow of produced water system

96
B. International code and standard
This section summarizes the layout requirement recommended or required by
various international codes and standards.
B.1. API RP 14J
The title of the API RP 14J is “Recommended practice for design and hazards
analysis for offshore production facilities”. It is widely accepted as the design code
for the layout design of an offshore plant topside. From the layout design point of
view, API RP 14J is summarized as bellows.
B.1.1 General
If, through good design, it were possible to break each of chains leading to a
hazardous possible to break each of the chains leading to a hazardous situation, then
that hazard could be eliminated. Unfortunately, even the best design can only reduce
the probability of a chain occurring and cannot ensure that the chain will always be
broken. The goal of a safe facility design is to reduce the risk of each of the identified
hazards to a reasonable level.
Main principles for safe facilities design and operation are;
1) Minimizing the likelihood of uncontrollable releases of hydrocarbons and other hazardous materials.
2) Minimizing the chances of ignition.
3) Preventing fire escalation and equipment damage.
4) Providing for personnel protection and escape

97
B.1.2. Separation of fuel and ignition sources
Protection against hydrocarbon ignition can be provided by locating potential
ignition sources away from equipment containing hydrocarbons.
B.1.3. Adequate ventilation
The accumulation of combustible gases in the atmosphere on offshore platforms
could create a threat to safety. Adequate ventilation is defined by API RP 500 as
ventilation (natural or artificial) that is sufficient to prevent the accumulation of
significant quantities of vapor-air mixtures in concentrations above 25 percent of
their lower flammable limit.
B.1.4. Platform equipment arrangement
A general rule for equipment layout planning is to keep potential fuel sources
(any combustible material) as far from ignition sources as practical. The primary
goals of this separation of equipment are to prevent hydrocarbon ignition and fire
escalation. Vertical as well as horizontal spacing between fuel and ignition sources
should be considered in equipment layout.

98
Figure B-1 Fuel and ignition sources
1) Wind direction
Equipment arrangement should take advantage of the prevailing winds to
minimize the chance that escaping or vented hydrocarbon vapors will be carried
toward potential ignition sources on the platform.
2) Firewalls and barrier walls
If the necessary physical space to satisfy this need is unavailable, fire walls or
barrier walls may be considered. Fire walls and barrier walls have the disadvantage
of restricting natural ventilation and hampering escape. For these reasons, they
should be used only where it is impractical to adequately separate fuel from sources
of ignition.

99
3) Process flow
Equipment areas are sometimes initially located so as to streamline the process
flow and to simplify piping systems. Simplifying piping contributes to safety by
minimizing the potential for operator error. Reducing the length of piping reduce the
potential for leaks.
4) Maintenance of equipment
Sufficient space should be considered for easy access to each piece of equipment
to provide room for operating personnel, for inspection and maintenance and for
painting.
5) Wellhead areas
Wellhead areas should be located where they will be accessible to the drilling rig
and remedial equipment, and where adequate structural support can be provided.
Wellhead should be separated or protected from sources of ignition, other large
inventories or fuel, machinery and dropped objects.
6) Unfired process areas
Equipment located in this area may be a potential source of fuel and should be
protected from ignition sources. Unfired process equipment should not be placed
directly above or below ignition sources without special protection.
7) Hydrocarbon storage tank
Hydrocarbon storage tanks should be separated from wellheads, pipeline risers
and potential ignition sources, and should not be located directly under the control

100
room or living quarters.
8) Fire process area
Equipment located in the fired process area can be considered a potential source
of ignition. If fired vessels are located on the same structure with other process
equipment, the potential ignition hazard should be lessened by installing the safety
devices discussed in API RP 14C. In addition, the use of barrier walls to separate the
fired equipment from sources of fuel should be considered.
9) Machinery area
Machinery may be classified as potential ignition sources although some source
of fuel may also be present. The machinery area should be remotely located or
otherwise protected from other sources of fuel like wellheads, unfired process
equipment, risers and hydrocarbon storage tanks.
10) Living quarters areas
The location of living quarters should take into account the direction of the
prevailing winds, so as to protect personnel from hydrocarbon vapors, external fires,
explosions and noise. Living quarters should be isolated from fuel sources to the
greatest extent practicable, because they contain multiple sources of ignition. The
potential for the entry of gas or smoke into the quarters should be minimized. In
addition to the smoke detection, the same general considerations for ventilation, gas
detection and fire detection also apply to living quarters.

101
11) Pipelines and risers
Riser areas may be potentially hazardous due to possible uncontrolled flows of
hydrocarbons from incoming or departing pipelines in an emergency. Riser should
be protected or separated from ignition sources, boats and falling objects. Risers
should not be placed adjacent to or under living quarters unless appropriate
mitigation methods have been implemented. Pig launcher and receiver areas should
be located away from potential ignition sources, highly traveled personnel routes,
and material handling areas such as crane aprons or overhead storage rack to the
extent practical. Launcher or receiver doors should face outboard of the platform to
minimize the possibility of any projectiles hitting personnel or other equipment.
12) Flares and vents
Emergency relief and routine release from a pressurized component or tank vent
are potential fuel sources that should be removed from areas where ignition sources
may exist.

102
B.2. NORSOK Standard, L-002
The title of the NORSOK standard L-002 is “Piping system layout, design and
structural analysis”. It specifies the layout requirement of the offshore plant topside.
It is summarized from the layout point of view.
B.2.1. General
The layout shall be developed with the following aims:
1) Ensure that the arrangement and functionality provided by the layout
satisfies all safety, operations, and maintenance requirements with minimum
impact on space, weight and cost;
2) The location and spacing of equipment, piping and structures shall take into
consideration ventilation aspects in order to avoid accumulation of possible
gas and vapour releases and to reduce explosion pressure;
3) Deck elevation in different areas of the installation shall to the extent
possible correspond in order to ease material handling and operation;
4) Equipment and systems shall be arranged such that the amount onshore
completion is maximized and offshore work minimized;
5) All equipment shall be to the extent possible be positioned to satisfy both the
process flow sequence and gravitational requirements;
6) All piping and tubing shall be arranged to facilitate supporting, and shall be
planned for ease of removal of equipment for inspection and servicing;
7) Space shall be allocated at an early stage of primary and secondary escape

103
routes, access ways, main pipe/cable racks/trunks and main ductwork as well
as main penetration areas.
B.2.2. Miscellaneous requirements
The flare tip shall be preferably be located over open sea. Cost implications to be
presented before final decision in taken. Heat resistant panels for protection of carry-
over shall be installed under the flare-tip.
1) Provisions for loading and unloading of liquids and dry bulk shall, if
possible, be installed on two sides.
2) Operation and replacement of hoses shall be possible by means of the main
cranes. Hose reels shall be used for all loading hoses to provide a safe
working environment for the operators.
3) Deck area with sufficient load capacity shall be allocated for temporary
equipment, e.g. pull-in winches, coiled tubing, containers, testing
equipment etc.
4) All workshops (e.g. electrical, instrument, mechanical, welding, insulation,
paint) and laboratories, shall be located close to each other, and all
unnecessary traffic through any of the rooms shall be avoided.
5) Over pressurized ventilated rooms (e.g. local electrical room) in or close to
classified areas shall be avoided.
6) In cases where two or more process trains are required, both piping
symmetry and easy segregation of the equipment and piping shall be
aimed at.

104
B.3. NORSOK Standard, P-100
The title of the NORSOK standard P-100 is “Process systems”. It specifies not
only the process design requirement, but also the layout requirements. The layout
requirements in NORSOK P-100 are summarized.
B.3.1. Crude handling (system 21)
Space for transportation and handing of pigs to/from pig launchers shall be
provided. Pumps should be located as low as possible to secure sufficient NPSHA
(Net Positive Suction Head Available).
B.3.2. Ga compression (system 23, 26 & 27)
Coolers and compressors should be elevated above scrubbers. Lines shall slope
towards scrubber. Anti-surge line should be slopped with the anti-surge valve at the
highest point. When methanol injection is required upstream the cooler, the main
piping shall slop from injection point towards the cooler.
B.3.3. Water injection system (system 29)
Booster pumps should be located at the lowest elevation of the system to achieve
the NPSHR (Net Positive Suction Head Required).
105
B.3.4. Cooling medium (system 40)
Cooling medium coolers shall be located at low elevation to reduce sweater
pumping. Expansion tank shall be located at the highest point in the circulation loop.
B.3.5. Heating medium (system 41)
The heating medium expansion tank shall be located at the highest point in the
heating medium system. Heating medium pumps to be located below the expansion
tank, and with sufficient height to ensure adequate net positive suction head.
B.3.6. Chemical injection (system 42)
Chemical injection unit and storage tanks is usually be installed in sheltered,
unheated areas. Where loading is done by tote tanks, the fill area is recommended at
a high elevation with gravity feed to storage tanks.
B.3.7. Flare system ( system 43)
Flare stack to be located at the hazardous end of the platform, as far as possible
from living quarters and the helideck and with due regard to the location of a drilling
derrick and platform cranes.

106
B.3.8. Oil water treatment (system 44)
All equipment shall be located in hazardous areas. The reclaimed oil sump shall
be located at lowest possible elevation to ensure gravity draining from the sources.
B.3.9. Diesel oil (system 62)
Treated diesel can be stored in crane pedestals. For fixed installations treated
diesel should be located at the highest elevation of the system, and consumers to be
supplied by gravity feed.
B.3.10. Compressed air (system 63)
Inlet air should be tanked from safe location. Low point drains should be provided
to remove any moisture accumulating in the distribution headers.

107
B.4. NORSOK Standard, S-001
The title of the NORSOK standard S-001 is “Technical safety”. This document
describes the safety requirement for offshore plant. Related requirements for the
layout design are summarized.
B.4.1. Riser flow line area
1) Hydrocarbon risers and conductors shall be designed and located or
protected to minimize the likelihood of damage, including damage due to
ship impact and dropped objects.
2) Pig launchers and receivers shall be located in open naturally ventilated areas
at the periphery of the platform facing sear, and with hatches directed away
from equipment and structures.
3) Topsides riser ESD valves should be located as low down the riser as
practicable, so as to minimize the likelihood of damage below the ESD
valves causing release of pipeline/riser inventories.
B.4.2. Process area
1) Equipment and piping containing high-pressure gas should be located in the
upper decks above the module support frame or main hull.
2) Liquid vessels should be located lower than gas equipment.
3) Low-pressure equipment containing large amount of liquid should be
located and arranged so that exposure to jet fires is minimized.

108
B.4.3. Piping
1) Routing of piping containing hydrocarbon to or through the utility area shall
be avoided except for fuel lines to utility systems. On FPSO, crude lines to
aft offloading systems are accepted provided they are located at platform
periphery and contain no leak sources.
2) Routing of hydrocarbon piping is no allowed in the LQ areas.
3) Routing of piping containing any liquid or hydrocarbon gas is not allowed
through electrical room, instrument room and control room.
4) Routing of hydrocarbon piping within areas where emergency equipment is
located shall be limited to diesel fuel supply lines for emergency equipment
themselves.
B.4.4. Lifting and laydown
1) Crane coverage and lay down areas shall be arranged to promote safe crane
operations with free visibility from crane cabin to minimize the risk of
dropped objects.
2) Within defined lifting zones equipment, or piping, containing hydrocarbons,
flammable or toxic gas/liquid shall be protected from dropped objects.

109
국문 초록
전문가 시스템 기반 해양 플랜트 상부의 최적
배치 방법
해양 플랜트 상부(topside)의 배치 설계를 위해서는 선주 요구 조건
(설치 해역의 주풍향 등), 공정 흐름 등과 같은 일반적인 고려 사항 및
국제 규정, 선급 규정, 발주처 자체 규정, 유사 프로젝트 데이터, 전문가의
지식 등을 고려하여야 한다. 또한, 상대적으로 넓은 배치 공간을 가지는
육상 플랜트에 비해, 해양 플랜트는 협소한 배치 공간을 가진다 앞서
언급한 것과 같이 작업성, 유지 보수성 등을 포함한 다양한 요구 사항을
만족하고, 한정된 공간 내에 모든 장비를 배치하기 위해서는 효율적인
최적 배치 방법이 필요하다. 또한, 해양 플랜트에서의 사고는 인명 및 환경,
비용적인 측면에서 큰 피해를 야기 시키므로, 폭발과 같은 안전에 위협이
되는 요소도 필히 고려하여 최적의 배치 설계를 수행해야 한다.
본 연구에서는 전문가 시스템 기반의 해양 플랜트 상부의 최적 배치
방법을 제안하고, 이를 FPSO 의 상부 배치 예제에 적용하여 그 효용성을
검증하였다. 해양 플랜트 상부 배치 시, 작업성, 유지 보수성, 공정 흐름 및

110
폭발 위험성 등의 안전성을 고려한 최적 배치를 수행하되, 국제 규정, 선급
규정, 전문가의 지식 등은 전문가 시스템의 규칙으로 표현하여, 최적 배치
과정에 반영하였다.
Keywords: 배치설계, 최적화, 전문가 시스템, 해양플랜트
Student number: 2014-20646
Related Documents